Embed Size (px)
Citation preview

Water Supply Outlook
California Nevada River Forecast Center NOAA National Weather Service Sacramento, California
May 22000011
DEFINITIONS: Acre-Feet: The volume equal to one acre covered one foot deep (43,560 cubic feet). Forecast Period: Generally, April 1st through July 31st, unless otherwise noted. April-High Forecast Period: For the Lake Tahoe Stage Rise, the period from April 1st to the highest recorded lake stage level. April 1st Average: The April 1st snowpack average is used as a reference point because it is normally the end of the winter snowfall season and the beginning of the spring runoff season. Residual Period: The forecast period from the first of the current month through September 30th. Probability Forecasts: Precipitation and snowfall accumulation of known probability as determined by analysis of past records are utilized in the preparation of probability runoff forecasts. The forecasts include an evaluation of the standard error of the prediction model. The forecasts are presented at three levels of probability as follows:
• Most Probable Volume: Given the current hydrometeorological conditions to date, this is the best estimate of what the actual runoff volume will be this season.
• Most Probable Volume (% Normal): Most probable volume in percent of the 1961-1990 average.
• Reasonable Maximum Volume: Given current hydrometeorological conditions, the seasonal runoff that has a 10 percent chance of being exceeded.
• Reasonable Minimum Volume: Given current hydrometeorological conditions, the seasonal runoff that has a 90 percent chance of being exceeded.
SNOTEL: Acronym for SNOw TELemetry. This is a automated snow measurement system operated by the USDA - Natural Resources Conservation Service. These sites use meteor burst communications technology to transmit hydrometeorological information such as snow water equivalent from snow pillows, accumulated precipitation and maximum, minimum and average air temperature. Water equivalent: The depth of water that would result from melting the snowpack at a point. Water Year: The period from October 1st through September 30th.

General Outlook
May 1, 2001
California benefitted from a series of April storms that brought above normal monthly precipitation to several regions in the state. Stormy periods between April 6th-8th and 19th-21st brought some minor accumulations to the snowpack, especially in the central and southern Sierra Nevada. A period of well above normal temperatures followed near the end of April resulting in an accelerated melting of the snowpack. Monthly precipitation ranged from 175 percent in the Tulare Lake basin, 135 percent in the San Joaquin basin, tapering off to only 5 percent in the southeast California deserts. The statewide average was 95 percent, which brought the seasonal average to about 77 percent of normal.
The Sierra Nevada snowpack on May 1st ranged from 50 percent of average in the north to 60 percent in the south. In eastern California and northern Nevada, the snowpack was measured at about 60 percent of average in the Carson-Walker basins, 40 percent of average in the Tahoe-Truckee basins, and 55 percent in the Humboldt basin. The 25 percent of average snowpack in the Upper Klamath of southern Oregon ranks among the lowest of its historical record.
Runoff amounted to about 55 percent of the monthly average, a decrease of about 12 percent from last month. The seasonal average now stands at 46 percent.
The statewide reservoir storage is about 98 percent of the montly average, or about 71 percent of capacity. It was 116 percent of monthly average at this same time last year.
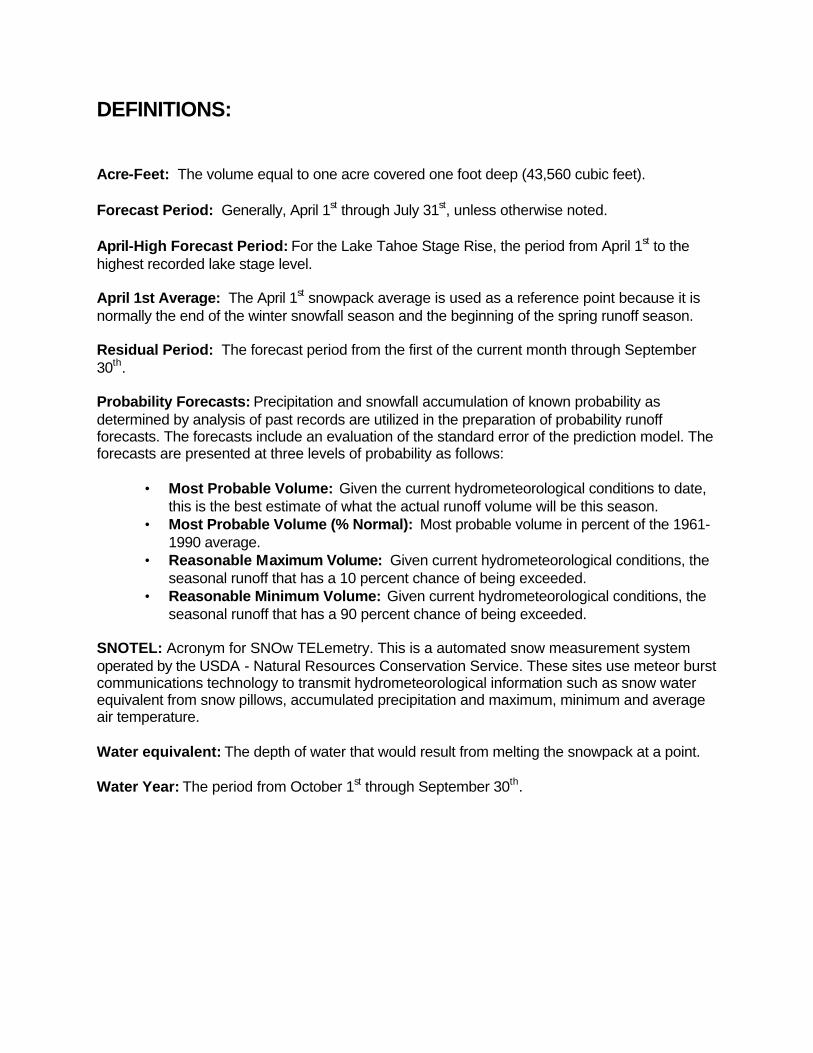
The spring and summer runoff for California is expected to be below to much below average this year, due primarily to the rather dismal start of the precipitation season and the below normal snowpack. April-July forecasts for California watersheds remain much below average, ranging from 65 percent for the McCloud River above Lake Shasta to 41 percent in the Cosumnes River basin. Streamflow forecasts remain much below average along the Sierra Nevada east slopes and the Humboldt basin. Extremely dry conditions still exist in the Upper Klamath basin, where the March-September forecast is expected to remain much below average.
Please note: This will be the last Water Supply Outlook issued for the water year 2001. The Water Supply Outlook is available on the World Wide Web at http://www.wrh.noaa.gov/cnrfc.
Pit R.abv Shasta
McCloud R.abv Shasta
Sacramento R.abv Shasta
Sacramento R.Shasta Lk. nr Redding
Lake OrovilleReservoir Inflow
Folsom ReservoirInflow
Sacramento R.nr Red Bluff
NF Feathernr Prattville
NF Feathernr Big Bar
MF American R.nr Auburn
Silver Creekat Union Valley
Silver Creekblo Camino Div. Dam
Sacramento
NF Yuba R.blo Goodyears Bar
SF Yuba R.at Langs Crossing
Lake Shasta
To Delta

Trinity Lake
Trinity R
Upper Klamath
Lake
Williamson R blo Sprague R
Sprague R nr Chiloquin
Klamath R Upper Lake Inflow
Trinity Lake Inflow

Water Supply Forecasts Most Most Reas Reas. 30 Prob. Prob. Max. Min. Year Vol. Vol. Vol. Vol. Avg. KAF %Nrml KAF KAF KAF ____________________________________________________________________________________ COASTAL BASINS Williamson River Sprague, blo Mar-Sep 230 46 325 134 504 Sprague River Chiloquin, nr Mar-Sep 88 30 180 35 292 Upper Klamath Falls River Inflow Mar-Sep 320 45 465 175 706 Trinity River Trinity Lake Inflow Apr-Jul 420 68 515 325 615 SACRAMENTO RIVER BASIN SACRAMENTO RIVER ABOVE BEND BRIDGE Pit River Montgomery Ck, nr Apr-Jul 720 68 845 580 1054 Mccloud River Shasta Lk, abv Apr-Jul 300 77 385 215 390 Sacramento River Delta Apr-Jul 215 77 305 125 279 Shasta Lake, Redding, nr Apr-Jul 1300 74 1700 900 1759 Bend Bridge, abv, Red Bluff Apr-Jul 1620 67 2290 1300 2411 FEATHER RIVER ABOVE OROVILLE RESERVOIR NF Feather River Prattville, nr Apr-Jul 165 50 235 140 333 Big Bar Apr-Jul 500 52 740 380 962 Feather River Oroville Reservoir Inflow Apr-Jul 820 47 1300 700 1746
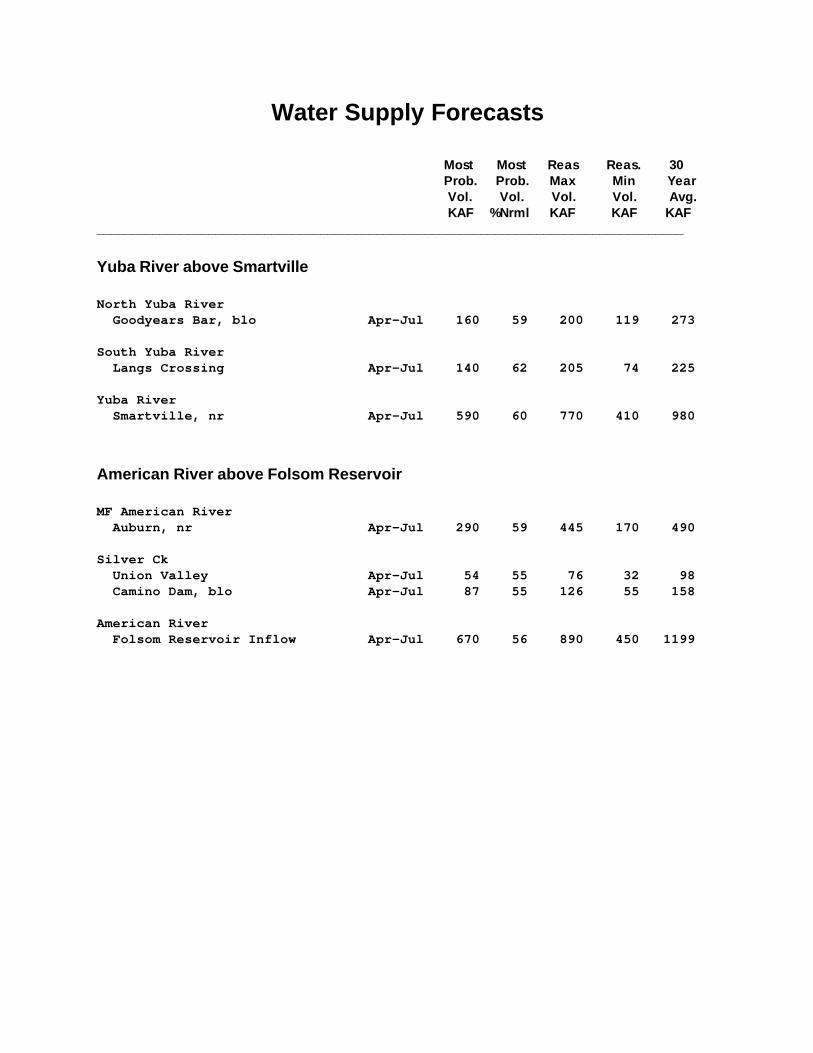
Water Supply Forecasts
Most Most Reas Reas. 30 Prob. Prob. Max Min Year Vol. Vol. Vol. Vol. Avg. KAF %Nrml KAF KAF KAF ____________________________________________________________________________________ Yuba River above Smartville North Yuba River Goodyears Bar, blo Apr-Jul 160 59 200 119 273 South Yuba River Langs Crossing Apr-Jul 140 62 205 74 225 Yuba River Smartville, nr Apr-Jul 590 60 770 410 980 American River above Folsom Reservoir MF American River Auburn, nr Apr-Jul 290 59 445 170 490 Silver Ck Union Valley Apr-Jul 54 55 76 32 98 Camino Dam, blo Apr-Jul 87 55 126 55 158 American River Folsom Reservoir Inflow Apr-Jul 670 56 890 450 1199

Sacramento/Trinity/Klamath River Basins
Seasonal Basin PrecipitationOctober 1 to Date
6864
55
70
5451
0
10
20
30
40
50
60
70
80
American Yuba Feather Upper Sac Trinity Klamath
Per
cen
t of A
vera
ge
Seasonal Basin SnowpackWater Content in % of April 1 Average
22
40
8065
40
110
150
190
220
190
45
70
90100
80
1025
3520
0
50
100
150
200
250
1-Jan 1-Feb 1-Mar 1-Apr 1-May
Per
cen
t of A
vera
ge
Observed Maximum Average Minimum

Sacramento/Trinity/Klamath River Basins
Basin Reservoir StorageContents of Major Reservoirs in % of Average
91
104
75
10097
101
0
20
40
60
80
100
120
American Yuba Feather Upper Sac Trinity Klamath
Per
cen
t of A
vera
ge
Seasonal Basin RunoffOctober 1 to Date
4340
45
65
5357
0
10
20
30
40
50
60
70
American Yuba Feather Upper Sac Trinity Klamath
Per
cen
t of A
vera
ge
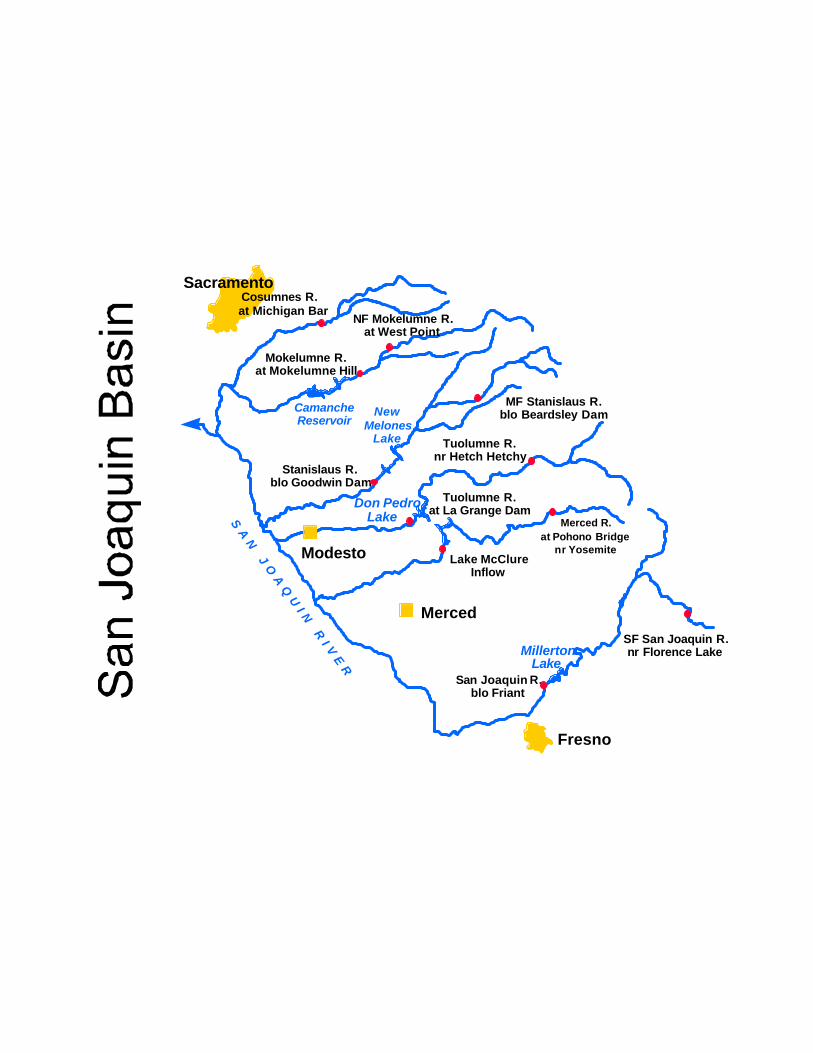
Modesto
SacramentoCosumnes R.at Michigan Bar
NF Mokelumne R.at West Point
Mokelumne R.at Mokelumne Hill
MF Stanislaus R.blo Beardsley Dam
Stanislaus R.blo Goodwin Dam
Tuolumne R.nr Hetch Hetchy
Merced R.at Pohono Bridge
nr YosemiteLake McClure
Inflow
San Joaquin R.blo Friant
SF San Joaquin R.nr Florence Lake
Tuolumne R.at La Grange Dam
Fresno
Merced
Don PedroLake
MillertonLake
NewMelones
Lake
CamancheReservoir
S A N J O A Q U I N R I V E R
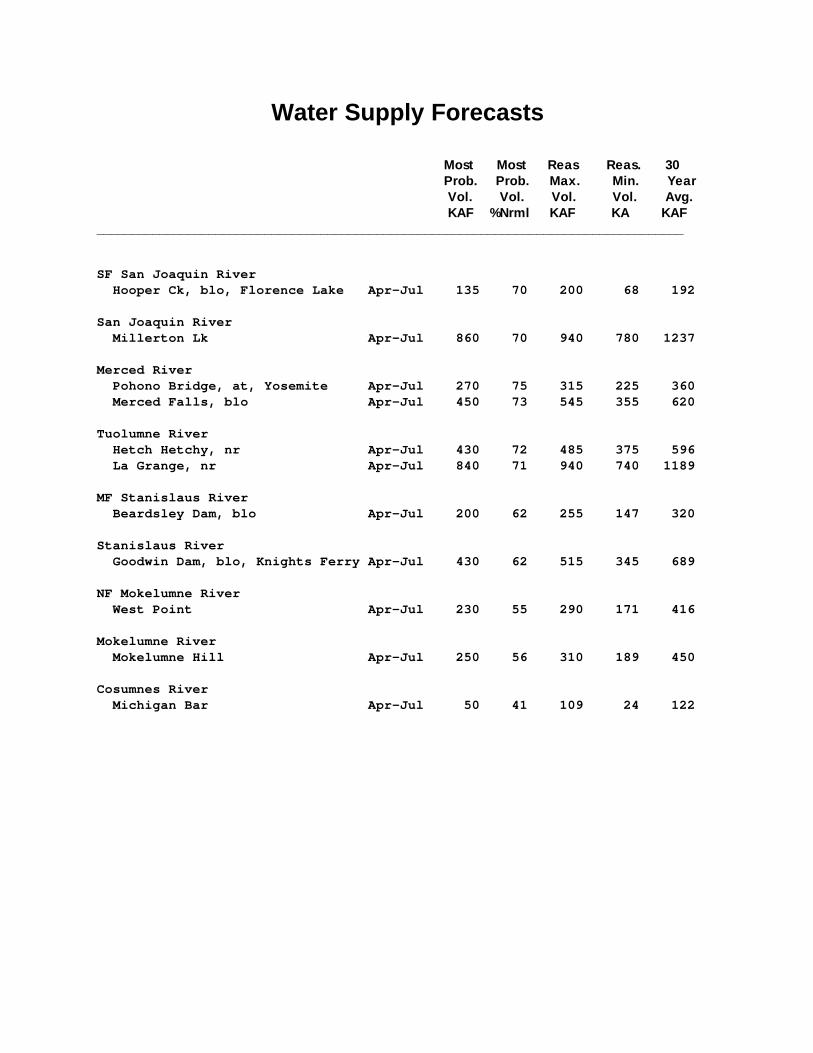
Water Supply Forecasts
Most Most Reas Reas. 30 Prob. Prob. Max. Min. Year Vol. Vol. Vol. Vol. Avg. KAF %Nrml KAF KA KAF ____________________________________________________________________________________ SF San Joaquin River Hooper Ck, blo, Florence Lake Apr-Jul 135 70 200 68 192 San Joaquin River Millerton Lk Apr-Jul 860 70 940 780 1237 Merced River Pohono Bridge, at, Yosemite Apr-Jul 270 75 315 225 360 Merced Falls, blo Apr-Jul 450 73 545 355 620 Tuolumne River Hetch Hetchy, nr Apr-Jul 430 72 485 375 596 La Grange, nr Apr-Jul 840 71 940 740 1189 MF Stanislaus River Beardsley Dam, blo Apr-Jul 200 62 255 147 320 Stanislaus River Goodwin Dam, blo, Knights Ferry Apr-Jul 430 62 515 345 689 NF Mokelumne River West Point Apr-Jul 230 55 290 171 416 Mokelumne River Mokelumne Hill Apr-Jul 250 56 310 189 450 Cosumnes River Michigan Bar Apr-Jul 50 41 109 24 122

San Joaquin Basin
Seasonal Basin PrecipitationOctober 1 to Date
85
81 81
74
83
68
70
72
74
76
78
80
82
84
86
San Joaquin Merced Tuolumne Stanislaus Mokelumne
Per
cen
t of A
vera
ge
Seasonal Basin SnowpackWater Content in % of April 1 Average
16
41
70 6752
120
170
210
230
210
40
65
90100
70
515
30 30
0
50
100
150
200
250
1-Jan 1-Feb 1-Mar 1-Apr 1-May
Per
cen
t of A
vera
ge
Observed Maximum Average Minimum
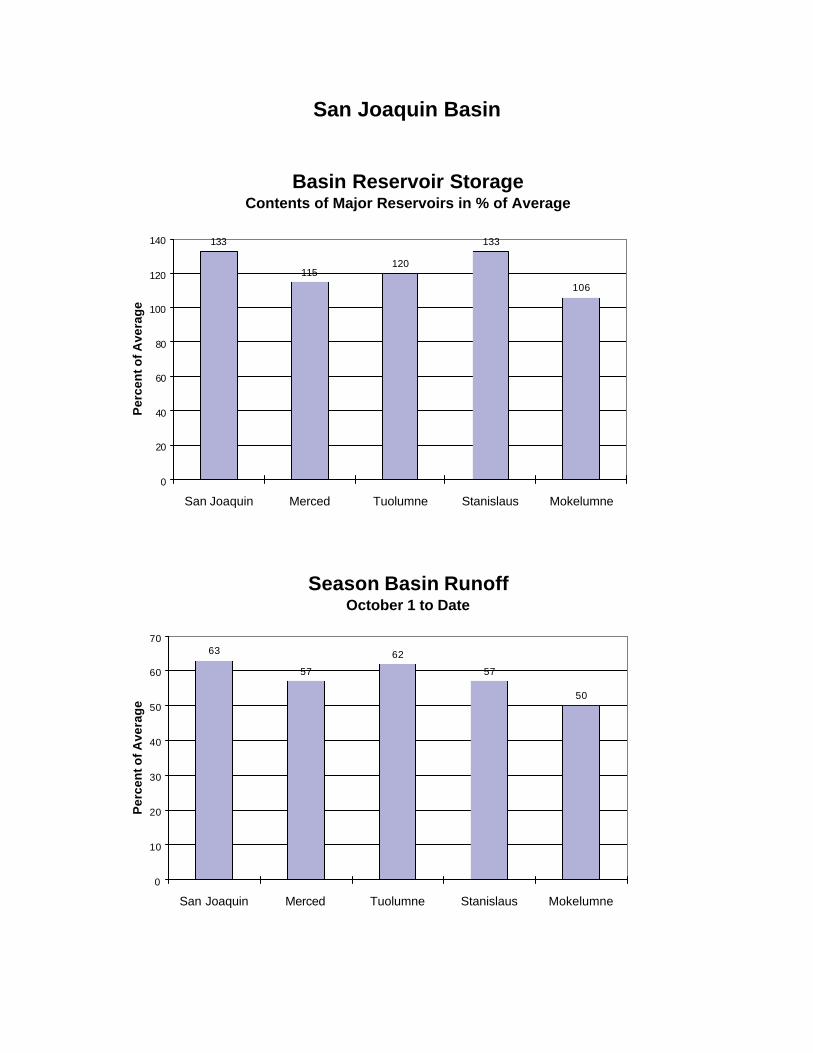
San Joaquin Basin
Basin Reservoir StorageContents of Major Reservoirs in % of Average
133
115120
133
106
0
20
40
60
80
100
120
140
San Joaquin Merced Tuolumne Stanislaus Mokelumne
Per
cen
t of A
vera
ge
Season Basin RunoffOctober 1 to Date
63
57
62
57
50
0
10
20
30
40
50
60
70
San Joaquin Merced Tuolumne Stanislaus Mokelumne
Per
cen
t of A
vera
ge

Bakersfield
Kern R.nr Bakersfield
Kern R.blo Isabella Dam
Kern R.nr Kernville
Tule R.blo Success Dam
Kaweah R.Terminus Resevoir
Inflow
Kings R.blo Pine Flat Dam
NF Kings R.nr Cliff Camp
Visalia

Water Supply Forecasts
Most Most Reas Reas. 30 Prob. Prob. Max. Min. Year Vol. Vol. Vol. Vol. Avg. KAF %Nrml KAF KAF KAF ____________________________________________________________________________________ Kern River Kernville, nr Apr-Jul 240 60 315 164 398 Isabella Dam, blo Apr-Jul 270 56 405 137 484 Bakersfield, nr Apr-Jul 280 56 420 132 499 Tule River Success Dam Apr-Jul 35 54 59 10 65 Kaweah River Terminus Dam Apr-Jul 185 64 235 137 290 NF Kings River Cliff Camp, nr Apr-Jul 170 70 210 131 243 Kings River Pine Flat Dam, blo Apr-Jul 840 68 950 730 1230
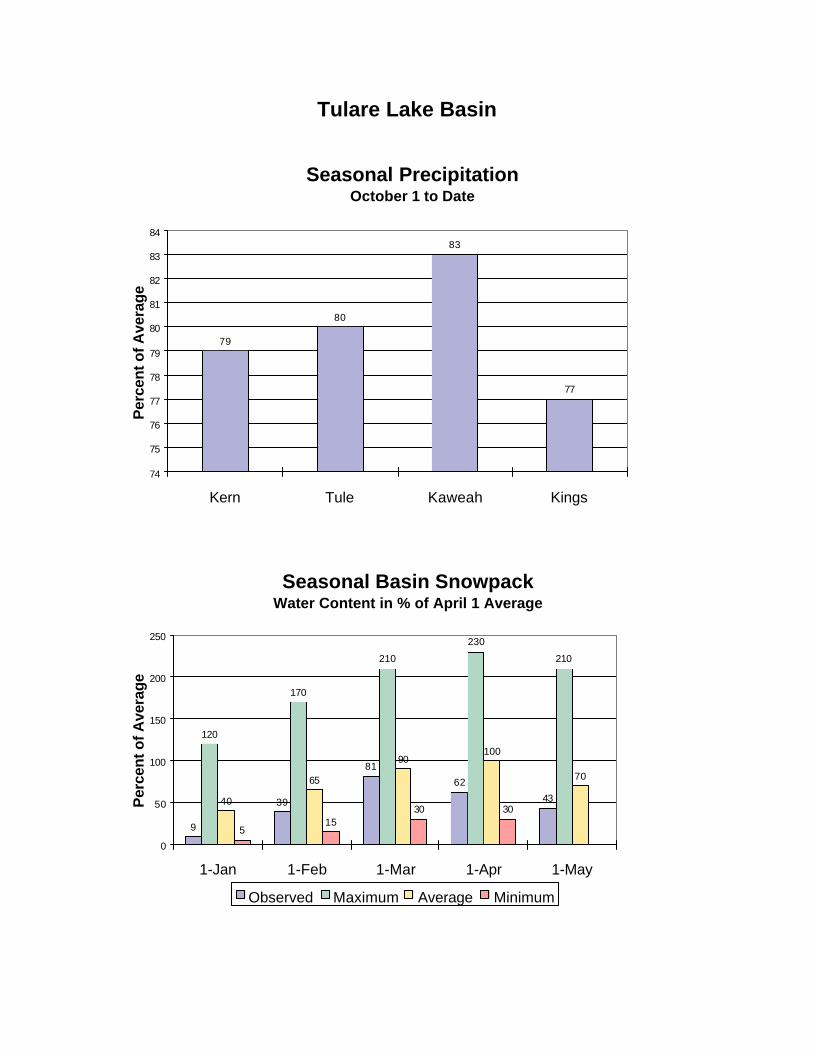
Tulare Lake Basin
Seasonal PrecipitationOctober 1 to Date
79
80
83
77
74
75
76
77
78
79
80
81
82
83
84
Kern Tule Kaweah Kings
Per
cent
of A
vera
ge
Seasonal Basin SnowpackWater Content in % of April 1 Average
9
39
81
62
43
120
170
210
230
210
40
65
90100
70
515
30 30
0
50
100
150
200
250
1-Jan 1-Feb 1-Mar 1-Apr 1-May
Per
cent
of A
vera
ge
Observed Maximum Average Minimum
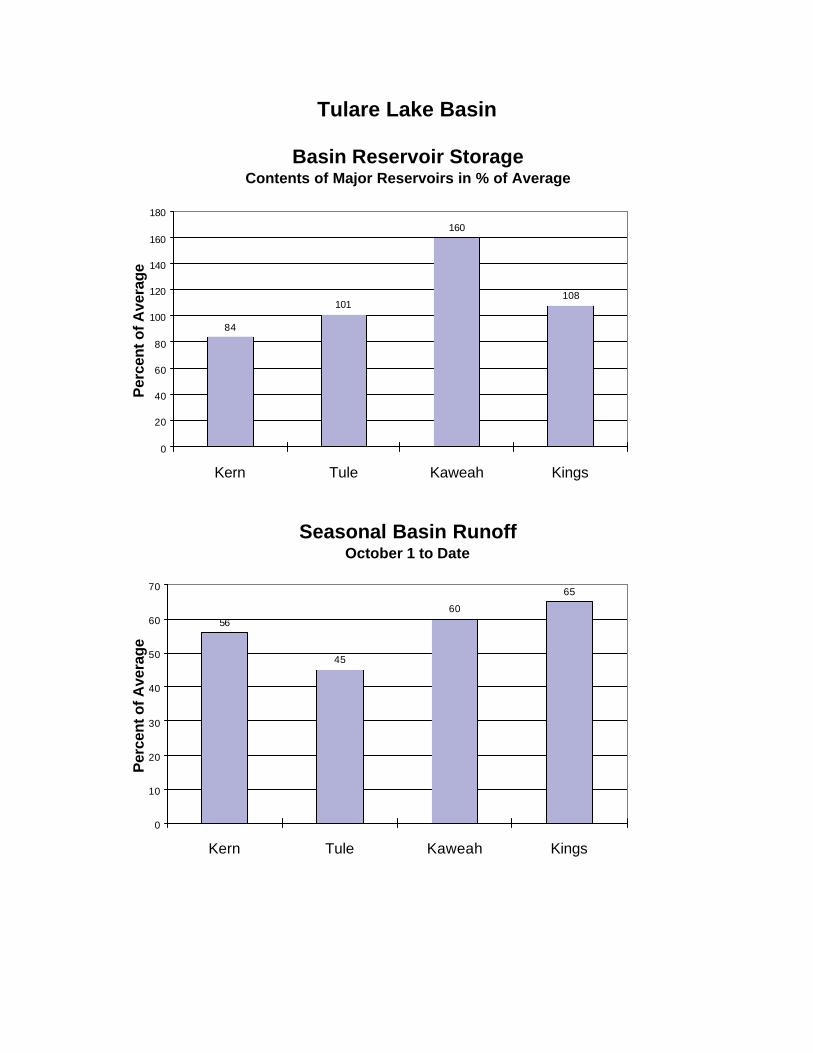
Tulare Lake Basin
Basin Reservoir StorageContents of Major Reservoirs in % of Average
84
101
160
108
0
20
40
60
80
100
120
140
160
180
Kern Tule Kaweah Kings
Per
cent
of A
vera
ge
Seasonal Basin RunoffOctober 1 to Date
56
45
65
60
0
10
20
30
40
50
60
70
Kern Tule Kaweah Kings
Per
cent
of A
vera
ge
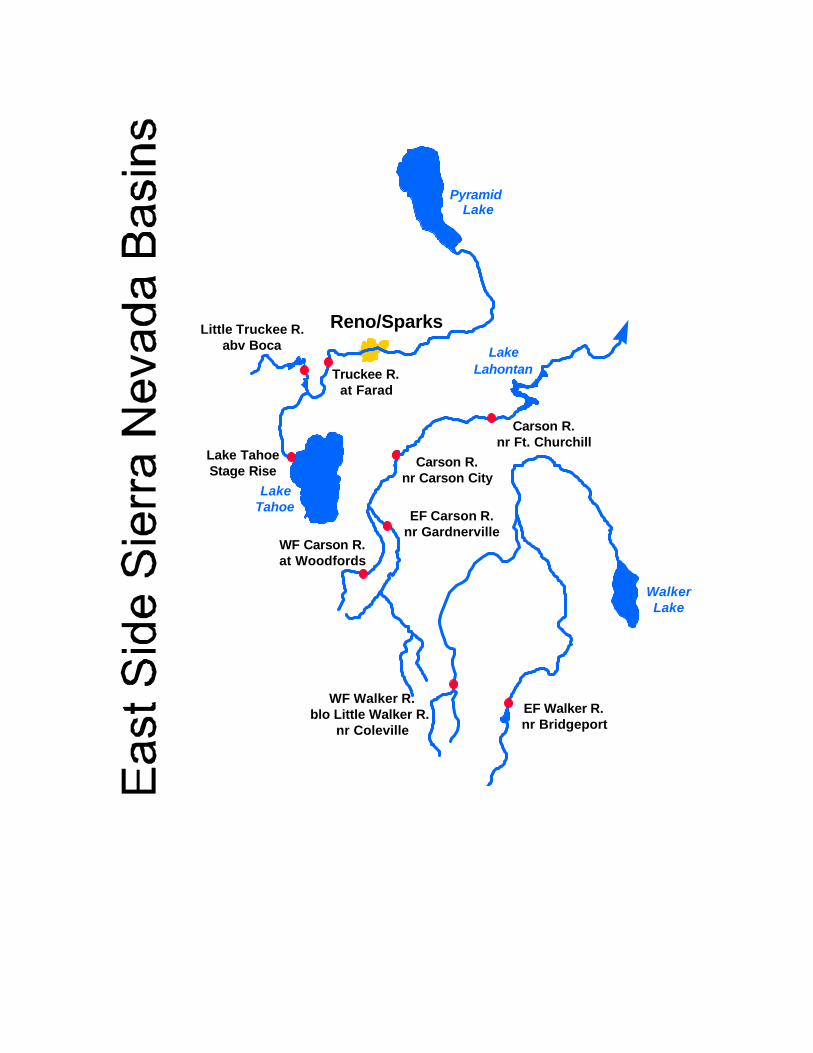
Reno/Sparks
Pyramid Lake
WalkerLake
Lake TahoeStage Rise
Lake Lahontan
Little Truckee R.abv Boca
Truckee R.at Farad
EF Carson R.nr Gardnerville
WF Carson R.at Woodfords
LakeTahoe
Carson R.nr Carson City
Carson R.nr Ft. Churchill
EF Walker R.nr Bridgeport
WF Walker R.blo Little Walker R.
nr Coleville

Water Supply Forecasts Most Most Reas Reas. 30 Prob. Prob. Max Min Year Vol. Vol. Vol. Vol. Avg. KAF %Nrml KAF KAF KAF ____________________________________________________________________________________ Truckee River Truckee River Lake Tahoe Stage Rise Apr-High 0.4 29 0.6 0.2 1.4 Farad Apr-Jul 75 29 105 55 263 Carson River EF Carson River Gardnerville, nr Apr-Jul 80 43 97 63 186 WF Carson River Woodfords Apr-Jul 22 41 28 18 54 Carson River Carson City, nr Apr-Jul 50 27 80 20 182 Fort Churchill, nr Apr-Jul 30 18 64 10 167 Walker River East Walker River Bridgeport, nr Apr-Aug 27 36 43 11 74 West Walker River Ltl Walker, blo, Coleville Apr-Jul 80 54 91 69 147

East Side Sierra Nevada Basins
Seasonal Basin PrecipitationOctober 1 to Date
6570 70
56
0
10
20
30
40
50
60
70
80
Truckee Carson East Walker West Walker
Per
cen
t of A
vera
ge
Basin Snowpack% of Average SWE to Date
45 47
58
40 40
32
45
62
56
63
0
10
20
30
40
50
60
70
1-Jan 1-Feb 1-Mar 1-Apr 1-May
Per
cen
t of A
vera
ge
Truckee-Tahoe Carson-Walker
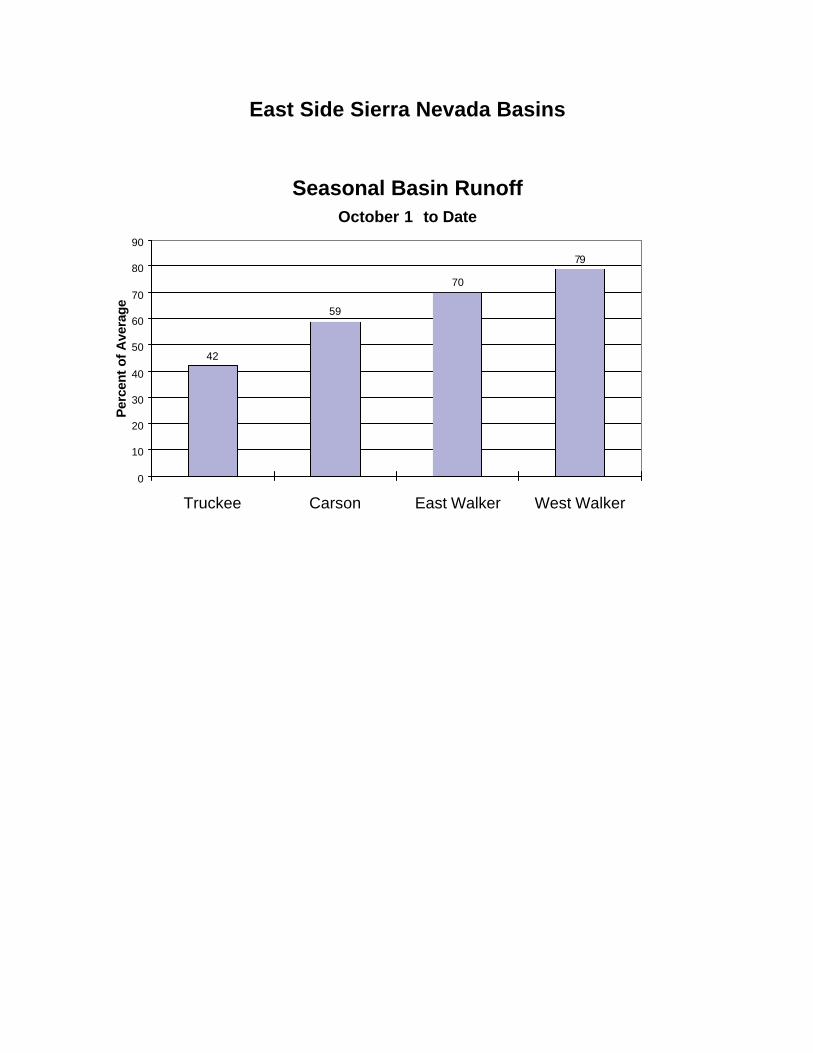
East Side Sierra Nevada Basins
Seasonal Basin RunoffOctober 1 to Date
42
59
70
79
0
10
20
30
40
50
60
70
80
90
Truckee Carson East Walker West Walker
Per
cent
of
Ave
rage

Humboldt River Basin
Winnemucca
Martin Creeknr Paradise Valley
Humboldt R.at Comus
Humboldt R.at PalisadeTo Rye Patch
ReservoirSF Humboldt R.abv Dixie Creek
nr Elko
NF Humboldt R.at Devil’s Gate
nr Halleck
Elko
Water Supply Forecasts
Most Most Reas Reas. 30 Prob. Prob. Max Min Year Vol. Vol. Vol. Vol. Avg. KAF %Nrml KAF KAF KAF ____________________________________________________________________________________ NF Humboldt River Devils Gate, at, Halleck, nr Apr-Jul 12 35 26 5 34 SF Humboldt River Dixie Ck, abv, Elko, nr Apr-Jul 36 53 63 12 68 Humboldt River Palisade Apr-Jul 85 35 199 25 245 Comus Apr-Jul 50 24 194 20 209 Martin Ck Paradise Valley, nr Apr-Jul 6 33 11.4 3.5 18

Humboldt River Basin
Seasonal Basin PrecipitationOctober 1 to Date
89
76
92
113
0
20
40
60
80
100
120
Martin Creek SF Humboldt NF Humboldt Humboldt
Per
cen
t of A
vera
ge
Basin Snowpack% of Average SWE to Date
70
81
73
60
54
0
10
20
30
40
50
60
70
80
90
1-Jan 1-Feb 1-Mar 1-Apr 1-May
Per
cen
t of A
vera
ge