Embed Size (px)
Citation preview

Water Subsidy Policies: A Comparison of theChilean and Colombian Schemes
Andres Gomez-Lobo and Dante Contreras
Analysis of two water subsidy schemes—a means-tested subsidy in Chile and a geo-graphically targeted subsidy in Colombia—shows that the means-tested system is betterable to identify poor households than the geographically targeted scheme. However,the overall distributive impact of both schemes is quite similar, at least for the threelowest income deciles, because the amount of benefits per household in the geographic-ally targeted Colombian scheme are differentiated by the socioeconomic classificationof household. Despite the relative merits of the Chilean means-tested scheme, targetingerrors are still quite large. More than 60 percent of subsidies accrue to households thatare above the third decile of the income distribution. If the policy objective in Chile isto benefit a significant proportion of households in the lowest income deciles, theneither the targeting mechanism must be improved or the number of subsidies has toincrease to take into account these targeting imperfections. In Colombia almost allhouseholds receive some kind of benefit, implying an unnecessarily high fiscal cost. Animprovement in the targeting mechanism could lower this cost without jeopardizingbenefits to lower-income households. Some suggestions for additional research and forimproving both schemes are discussed.
In recent years many countries have undertaken important reforms of theirelectricity, gas, water, and telecommunications industries to increase productiveand allocative efficiency and promote higher levels of investment. However, thereforms have sometimes created new social and distributive concerns. Forexample, the need to guarantee the financial viability of firms usually entailsan increase in household utility bills. Reforms usually aim to improve thecommercial efficiency of providers, which, if successful, reduces the level ofnonpayment by certain groups of customers. Reforms normally include an end
Andres Gomez-Lobo is Assistant Professor, Department of Economics, at the University of Chile;
his e-mail address is [email protected]. Dante Contreras is Associate Professor, Department of
Economics, at the University of Chile; his e-mail address is [email protected]. The authors thank
Jose Luis Lima and Victor Macias for their very able research assistance. They are also indebted to
Francisco Socias from Chile’s Ministry of Social Planning and Elena Peralta from Chile’s Ministry of the
Interior for information provided during several interviews. The authors also thank Antonio Estache and
Vivien Foster, three anonymous referees, and especially Francois Bourguignon for comments on an earlier
draft of this article. Financial support for this study from the World Bank Institute is gratefully acknow-
ledged. This project forms part of the efforts of the World Bank Institute to research the relation between
poverty and utility services in Latin America.
THE WORLD BANK ECONOMIC REVIEW, VOL. 17, NO. 3 391–407
� The International Bank for Reconstruction and Development / THE WORLD BANK 2003
All rights reserved DOI: 10.1093/wber/lhg028
391
Pub
lic D
iscl
osur
e A
utho
rized
Pub
lic D
iscl
osur
e A
utho
rized
Pub
lic D
iscl
osur
e A
utho
rized
Pub
lic D
iscl
osur
e A
utho
rized
Pub
lic D
iscl
osur
e A
utho
rized
Pub
lic D
iscl
osur
e A
utho
rized
Pub
lic D
iscl
osur
e A
utho
rized
Pub
lic D
iscl
osur
e A
utho
rized

to cross-subsidies. All of these policies, although recommended from an eco-nomic point of view, may increase the financial burden on poorer households.1
Conventional wisdom indicates that such social and distributive effectsshould be tackled through the general tax and benefits system and not throughsectoral reform programs. However, there are several reasons why this may notalways be a wise strategy in developing economies. First, policymakers may beconcerned that all households consume a minimum level of utility services aswell as with the income effects of utility bills. This is especially so in the case ofwater and sanitation services, which involve public health issues. Second, manycountries have no established welfare system capable of providing an incomesupplement to poorer households to compensate for rising utility prices. Finally,ignoring social issues in utility industries may introduce distortions in regulatorydecisionmaking that, among other effects, may increase the risks faced bypotential private operators in these industries.2
Thus, in developing economies general welfare payments that increase totaldisposable household income may not always be a good or viable policy sub-stitute for programs designed to allow poor households to access and consumespecific utility services. In these cases, welfare policies specifically designed forthese industries may be warranted. However, there are several risks associatedwith such a sectoral approach. Perhaps the most important is that such subsidiesmay be poorly targeted.3 Informal subsidies benefiting mainly middle-classcustomers abound in utility industries throughout the developing world. There-fore, if a utility service is to be subsidized, the distributive effects of such ascheme need careful attention.
This article analyzes the distributive effects of two subsidy programs forwater utility services applied in developing economies: a program introducedin Chile in the early 1990s and one adopted in Colombia after 1994. Bothprovide explicit subsidies targeted to vulnerable households, and both wereintroduced as part of wider sectoral reforms.
There are several reasons why these two programs are of interest to policy-makers. First, they constitute two of the few examples in the developing worldof formal subsidies for utility services. Both programs are national in coverage,benefit customers from different regional operators, and are grounded in anexplicit legal and regulatory framework. Moreover, both programs tried totarget benefits to poor people. As such, these schemes offer an interestingcontrast to the informal and universal subsidies more commonly encountered
1. Estache, Foster, and Wodon (2002) present a comprehensive analysis of the potential links
between infrastructure reforms and poverty.
2. In extreme cases, neglect of social considerations may lead to civil unrest—as in Cochabamba’s
(Bolivia) water concession process a few years ago—or the termination of existing concession contracts,
as was the case of the water concession in Tucuman, Argentina, in the 1990s.
3. This will be the case, for example, when a significant proportion of poor households is not
connected to a utility service whose consumption is being subsidized.
392 THE WORLD BANK ECONOMIC REV I EW, VOL . 17 , NO . 3

in many utility industries.4 The Chilean and Colombian experiences are oftentouted as examples of best practice in the design of subsidy schemes in infrastruc-ture services.5 However, so far little empirical analysis has been undertaken toevaluate the results of these programs. This article is a first step in that direction.
Second, the Chilean and Colombian schemes use different targeting mechan-isms. Chile uses individual means testing of households to determine eligibility,whereas Colombia uses a geographical targeting system. Because both targetingmechanisms are valid design options, policymakers may be interested in know-ing how each type of scheme performs in particular applications.
Relative concentration curves typical of distributional analysis are used to showthat these two very different targeting schemes have comparable results in terms ofreaching poor households, at least for monetary transfers. However, if the numberof beneficiaries rather than monetary transfers are used in the concentration curveanalysis, the Chilean means-tested scheme performs better than the Colombiangeographically targeted scheme. Therefore, there is some evidence that a means-tested subsidy, as applied in Chile, is better able to identify poorer households thana geographically targeted subsidy. However, because the Colombian system ismore generous to comparably poor households than the Chilean system, theoverall effect on poverty incidence is similar in both schemes.
An interesting contribution of this article is the use of an absolute beneficiaryconcentration curve to further analyze the targeting properties of these sub-sidies. With this curve it is straightforward to evaluate both the errors ofexclusion (eligible households that do not receive a benefit) and the errors ofinclusion (noneligible households that receive a benefit) associated with eachprogram. The Colombian scheme provides benefits to almost all poor house-holds but at a high fiscal cost because the program gives some benefits to almostall households in the country. The Chilean program, which is much smaller andtargeted to a narrower group of households, misses many deserving householdsbecause of targeting errors.
The next two sections provide a brief overview of the main features of eachsubsidy scheme. This is followed by a comparison of the targeting properties ofeach subsidy using relative and absolute concentration curve analysis of thetotal monetary transfers and the total number of beneficiaries. Some policyimplications are also drawn from the analysis.
4. These subsidies usually take the form of direct transfers from local or national governments to loss-
making public utilities. According to the World Bank (1994), the average ratio of revenues to costs for
public utilities across the world was 0.8 for gas, 0.6 for electricity, 0.3 for water, and 1.6 for telecom-
munications. Thus, except for the telecommunications sector, informal universal subsidies of question-
able distributional impact were very common, at least at the beginning of the past decade.
5. The Chilean water subsidy was positively reviewed in a recent book on the design of subsidies for
public services (Brook and Smith 2001). Both experiences are presented as best practice in a popular
training course for regulators at the University of Florida and sponsored by the World Bank. The Latin
American version of this course, undertaken by the Centre for the Economic Study of Regulation in
Buenos Aires, also presents these experiences as best practice in this field.
Gomez-Lobo and Contreras 393

I . TH E CH I L E A N WA T E R SU B S I D Y SC H E M E
The water consumption subsidy in Chile is one of the few means-tested subsidies(households are individually screened for eligibility based on their socioeco-nomic circumstances) applied in the utility industry of a developing country.The subsidy scheme, which became operational in 1990, was designed tocounter the adverse social impacts of rising water charges.6
The subsidy program is administered by the Ministry of Social Planning alongwith municipal governments. The ministry determines the number of subsidiesthat will be offered to each region the following fiscal year and the value of eachsubsidy by region. Municipalities are responsible for administering the subsidies.
The subsidy program gives eligible households the right to consume water at alower price (expressed as a percentage of the full tariff) up to a certain limit.7 Beyondthis limit additional consumption is charged at the full tariff. Thus for eligiblehouseholds the subsidy operates like a rising block tariff structure that subsidizesthe first block of consumption. The Ministry of Social Planning determines theconsumption ceiling that the subsidy will cover (currently 15 m3 per month in allregions) and the percentage discount for this first block (which varies by region).
The number and value of each subsidy by region are determined yearly, andthe aggregate projected expenditure of the program is included in the nationalbudget each fiscal year. The subsidy is funded entirely from general tax reven-ues, and the water regulator—responsible for setting tariffs—is not involved indetermining subsidy levels or in the operational aspects of the scheme. Thusthere is complete separation between the welfare policies applied in the watersector and the economic regulation of the industry.8
To be eligible for a subsidy, a household must apply for the benefit at itsmunicipality.9 Eligibility is then determined by socioeconomic need, based onthe Communal Social Assistance Committees (CAS) point score. The CAS score isthe main instrument used in the Chilean welfare system to gauge the socio-economic condition of households. A household’s CAS score is based on informa-tion gathered during a personal interview conducted at the household’sdwelling. The interview consists of 50 questions divided in nine sections: generalinformation, environmental conditions, overcrowding conditions, health condi-tions, identification of family members, occupation and earning, monetarysubsidies, education, and wealth. Personal interviews are conducted at thehousehold’s dwelling so that the interviewer can verify some of the answers,
6. Between 1989 and 1998 water charges more than doubled for each of the 13 regional water
companies—and more than tripled in some regions, such as the water-scarce northern regions.
7. By law the percentage of the bill that the subsidy will cover can vary between 20 percent and
85 percent.
8. However, there is some dependence in the other direction. A tariff revision process will have a
direct impact on the design and projected budget of the subsidy program in the following years.
9. To qualify for a subsidy, a client cannot have arrears with the service provider.
394 THE WORLD BANK ECONOMIC REV I EW, VOL . 17 , NO . 3

such as the size and materials of the dwelling and durable goods ownership, keyvariables in the CAS score calculation.
A household’s CAS score is valid for two years. Although this lowers theadministrative costs of the welfare system in general, it also reduces the effi-ciency of the CAS score as a targeting instrument because a household’s socio-economic condition may change in the course of two years.
The municipalities must award water subsidies (as well as other public subsidies)based on the ranking of CAS scores of all new applicants and current beneficiaries.The total number of subsidies awarded is capped by the total number assignedannually to the region by the Ministry of Social Planning and later distributed toeach municipality by the regional governor. If all subsidies have already beenassigned and a new applicant has a lower CAS score than the best-off currentbeneficiary, the mayor must redistribute benefits in favor of the new applicant.
Once a household is awarded a subsidy, the service provider is notified andthe client’s subsequent monthly water bills will be net of the subsidy. Once amonth water companies bill municipalities in their service area to recover thesubsidies given to beneficiary households in the last billing period.
Data on the number of assigned subsidies by region, the percentage of con-nected households covered, and the average value of subsidies in 1998 show thatnearly a third of households are subsidized in some regions (table 1). The absolutemonthly value of the subsidy is highest in the northern regions (I to III), where
TA B L E 1. Number and Value of Assigned Water Subsidies by Regionin 1998, Chile
Number of Share of regional Average value per
Region assigned subsidies households covereda (%) subsidyb (US$/month)
I 18,836 20.7 15.74II 24,576 22.9 17.94III 16,869 28.3 13.41IV 21,793 17.9 9.14V 63,034 17.3 6.36VI 17,108 10.7 5.95VII 28,380 16.3 7.45VIII 68,314 17.9 7.10IX 36,637 25.1 9.20X 31,277 17.7 8.11XI 6,002 29.9 11.71XII 6,013 14.9 8.24Metropolitan 105,114 7.0 4.28National 443,953 13.3 9.59
aCalculated as the ratio of the number in the first column to the total number of householdswith shared or own water connections in each region estimated using the expansion factors of theCASEN survey data.
bCalculated using data from Mideplan (1999) deflated by the average exchange rate from theCentral Bank of Chile for that year.
Source: Mideplan 1999 and CASEN 1998.
Gomez-Lobo and Contreras 395
production costs are high. The national average benefit is close to US$10 perbeneficiary household per month.
The aggregate budget for the subsidy reached $42.5 million in 2000. As Serra(2000) points out, the cost of the subsidy is well below the cost of the universalsubsidy given to loss-making providers before the reform. In 1998 water andsewerage companies had net profits of $107 million, more than twice the cost ofthe subsidy scheme (not considering administrative costs).
One important point to make is that subsidies are normally awarded to a familyfor a three-year period (although benefits accrue to the household monthly). Thismeans that a large fraction of the budget for a given year is already determined bythe number of ongoing subsidies that were distributed in previous years.
I I . TH E CO L O M B I A N WA T E R SU B S I D Y SC H E M E
Unlike Chile, Colombia has opted for a scheme based on cross-subsidiesbetween different clients, although in practice benefits are mostly funded fromgeneral tax revenues.10 Colombia is not unique in the use of cross-subsidies.These subsidies are ubiquitous in water tariffs across the world. What makes theColombian system interesting is that the cross-subsidies are explicitly laid out inthe Public Residential Services Law of 1994, and a geographic targeting systemis used to determine whether a client pays a surcharge or receives a subsidy fromthe tariff structure. The objective of the 1994 reform was to unify criteria for theapplication of cross-subsidies across utility industries and to guarantee consis-tent application of the scheme across the country. Another motivation for thereform was to reduce the magnitude of cross-subsidies, which had grown toextremely inefficient levels in some cases.
In each municipality dwellings are classified into six socioeconomic cate-gories. Households are eligible to receive a subsidy of up to 50 percent of theaverage service cost if they live in dwellings classified as level 1 (low-low) and ofup to 40 percent if they live in dwellings classified as 2 (low). Households livingin level 3 dwellings (medium-low) may also receive a subsidy of up to 15 percentof the average service cost. The decision on whether to grant a subsidy to thismiddle group is up to the regulatory commission in each case.
Subsidies are funded through a variety of sources. First, a surcharge can beapplied to clients in dwellings classified as 5 or 6 and to industrial and com-mercial customers.11 These surcharges are capped at a maximum of 20 percentof the water and sewage bill. When these surcharges are not sufficient to fundthe subsidies to the first three socioeconomic groups, the difference can befinanced by transfers from the national and provincial budgets.
10. In cross-subsidy schemes, some clients pay a tariff greater than the cost they impose on the service
provider to finance lower tariffs for other clients.
11. Hospitals, schools, and other nonprofit organizations are exempt from paying surcharges or
receiving subsidies. These clients must pay the full tariff.
396 THE WORLD BANK ECONOMIC REV I EW, VOL . 17 , NO . 3

Data on the tariffs for each group as a proportion of the cost-recovery tariff forthe 15 water companies for which information was available at the end of 1997indicate that despite the residential services law there was still an element ofuniversal subsidy in water charges (table 2). Even consumers living in dwellingsclassified in groups 5 and 6 received a subsidy in some regions, although onaverage across regions consumers in the highest socioeconomic classification paida surcharge. It is also apparent that for most of the water companies the subsidiesaccruing to the first three groups are higher than the 50 percent, 40 percent, and15 percent reduction allowed in the law. Thus actual tariffs did not conform tothe surcharge and subsidy limits imposed by the residential services law. This isexplained by the fact that there was an initial five-year transition period forimplementing the new limits, and in 1997 this transition was still incomplete.12
The municipalities are responsible for classifying dwellings according to thesix socioeconomic categories, following the guidelines and methodology pro-vided by the National Planning Department. The basic classification unit is ageographic area with homogeneous characteristics according to criteria set bythe National Planning Department. All dwellings within this unit are classifiedin one socioeconomic group, although particular dwellings that have differentcharacteristics within the unit can be individually classified in another group. Adwelling’s category is the same for all utility services. Individuals can request arevision of their dwelling’s classification.
A municipality can hire public or private institutions to undertake the classifica-tion study on its behalf. It can also count on the technical assistance of nationaland regional entities. Municipalities within a larger metropolitan area canalso undertake the classification jointly. Finally, the same classification used by
TA B L E 2. Tariffs Paid as a Proportion of the Cost-Recovery Tarifffor 15 Companies, by Socioeconomic Classification of Dwellings,December 1997, Colombia (percent)
Socioeconomic classification
1 2 3 4 5 6
Range of tariffs paid (low-low) (low) (medium-low) (medium) (medium-high) (high)
Minimum 13 27 41 44 60 75Average 35 48 57 74 87 114Maximum 92 94 91 109 117 150
Note: Data were available for companies in Bogota, Cali, Medellin, Barranquilla, Cartagena,Bucaramanga, Pereira, Manizales, Pasto, Armenia, Valledupar, Popayan, Girardot, Magangue,and Santa Rosa.
Source: Sanchez Torres and Nunez Mendez 1999, based on data from Unidad de PolıticaRegional y Urbana, Departamento Nacional de Planeacion.
12. To date, tariffs have not been fully adjusted to meet the surcharge and subsidy limits, and the
transition period for meeting these limits has been extended for another five years.
Gomez-Lobo and Contreras 397
municipalities to differentiate property taxes can be used for differentiatingutility charges.
II I . CO M P A R I S O N O F T H E DI S T R I B U T I O N A L IM P A C T S O F T H E CH I L E A N
A N D CO L O M B I A N WA T E R SU B S I D I E S
This section evaluates the targeting results of the two subsidy programs usingthe traditional tools of distributional analysis (see the appendix for some dataissues and sources). However, besides the distributional impact, there are othercomplementary issues that should be considered when making an overall eva-luation of a particular subsidy scheme. The administrative costs of a program,the relative efficiency of the funding mechanism used, and the possible distor-tions generated in other markets are also relevant. In this article, however, thefocus is exclusively on the distributional impact of these subsidies.13
Estimating the Distributional Impact of the Chilean Program
There are two difficulties in estimating the distributional impacts of the Chileansubsidy. First, determining the target population is difficult because the aim ofthe program is to benefit poor households that without the subsidy would spendmore than 5 percent of their income on water and sewage services. Therefore,the target population will be a function of water tariffs as well as householdincome and will be different for each region. In some regions close to 30 percentof households are eligible for the subsidy, whereas in other regions the share ismuch lower (see table 1). Because the total number of subsidies for each regionis further differentiated among municipalities, a poor household in a munici-pality with low tariff rates might not receive a subsidy, and a relatively better-off household in another municipality with higher water charges does receivea subsidy. This should not constitute a targeting error in light of the declaredobjectives of the subsidy. However, extensive work for this study reveals thatanalysis at the regional or local level does not improve the targeting resultscompared to a national income stratification (results available on request).
The second difficulty relates to the fact that the survey data used, the 1998Chilean National Characterization Survey (CASEN), is able to identify only221,821 households that receive the subsidy, whereas Ministry of Social Plan-ning records show 443,953 beneficiary households (see appendix for moreinformation on the survey). If the raw survey data are used, there may beimportant biases in the estimated distributional impacts. To control for this,the missing subsidies were distributed across deciles according to the propor-tions recorded in the survey. This is the only reasonable option because itassumes that the underreporting of water subsidies was random. Conversations
13. A wider assessment of the two subsidy programs discussed here is provided in Gomez-Lobo and
Contreras (2000).
398 THE WORLD BANK ECONOMIC REV I EW, VOL . 17 , NO . 3
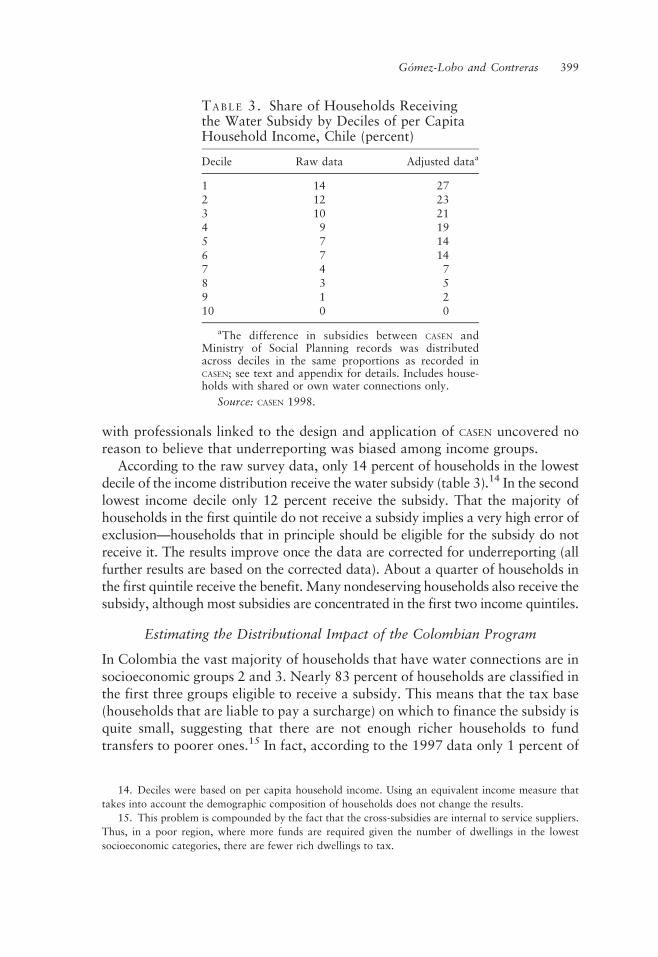
with professionals linked to the design and application of CASEN uncovered noreason to believe that underreporting was biased among income groups.
According to the raw survey data, only 14 percent of households in the lowestdecile of the income distribution receive the water subsidy (table 3).14 In the secondlowest income decile only 12 percent receive the subsidy. That the majority ofhouseholds in the first quintile do not receive a subsidy implies a very high error ofexclusion—households that in principle should be eligible for the subsidy do notreceive it. The results improve once the data are corrected for underreporting (allfurther results are based on the corrected data). About a quarter of households inthe first quintile receive the benefit. Many nondeserving households also receive thesubsidy, although most subsidies are concentrated in the first two income quintiles.
Estimating the Distributional Impact of the Colombian Program
In Colombia the vast majority of households that have water connections are insocioeconomic groups 2 and 3. Nearly 83 percent of households are classified inthe first three groups eligible to receive a subsidy. This means that the tax base(households that are liable to pay a surcharge) on which to finance the subsidy isquite small, suggesting that there are not enough richer households to fundtransfers to poorer ones.15 In fact, according to the 1997 data only 1 percent of
TA B L E 3. Share of Households Receivingthe Water Subsidy by Deciles of per CapitaHousehold Income, Chile (percent)
Decile Raw data Adjusted dataa
1 14 272 12 233 10 214 9 195 7 146 7 147 4 78 3 59 1 210 0 0
aThe difference in subsidies between CASEN andMinistry of Social Planning records was distributedacross deciles in the same proportions as recorded inCASEN; see text and appendix for details. Includes house-holds with shared or own water connections only.
Source: CASEN 1998.
14. Deciles were based on per capita household income. Using an equivalent income measure that
takes into account the demographic composition of households does not change the results.
15. This problem is compounded by the fact that the cross-subsidies are internal to service suppliers.
Thus, in a poor region, where more funds are required given the number of dwellings in the lowest
socioeconomic categories, there are fewer rich dwellings to tax.
Gomez-Lobo and Contreras 399

distributed benefits were funded through negative transfers from people living indwellings classified in groups 5 and 6.
The classification system shows some correlation with poverty (table 4), butthe correlation is quite imperfect, a result consistent with earlier work on thedistributional effects of residential utility service subsidies in Colombia (seeVelez Echavarrıa 1993; Sanchez Torres and Nunez Mendez 1999). Most house-holds in the poorest five income deciles live in dwellings classified in socio-economic groups 1 to 3.16 However, errors of inclusion are large. More than75 percent of households in income deciles 6 to 9 fall into one of the threelowest socioeconomic groups. Only for the richest decile are most householdsclassified in the highest three socioeconomic groups, but even in this case lessthan 32 percent of households are classified in the top two categories, makingthem liable to pay surcharges.
Relative Concentration Curves
Examination of the relative concentration curves for monetary transfers andtotal number of beneficiaries permits a more detailed comparison of the dis-tributional impacts of the Chilean and Colombian water subsidy schemes.
The relative monetary transfer distribution curves for each country show thepercentage of total monetary transfers that accrue to households that are at orbelow a certain range of the income distribution (figure 1). The horizontal axismeasures centiles of income distribution, from poorest to richest, and the
TA B L E 4. Distribution of Socioeconomic Classification by Deciles ofHousehold per Capita Income, Colombia (percent)
Socioeconomic classification
1 2 3 4 5 6
Decile (low-low) (low) (medium-low) (medium) (medium-high) (high) Total
1 18.8 47.3 31.4 1.6 0.7 0.3 100.02 15.3 45.6 33.8 2.5 2.0 0.8 100.03 16.2 38.7 39.2 2.8 2.0 1.1 100.04 14.5 40.4 38.4 4.5 1.7 0.5 100.05 8.8 43.4 40.4 5.3 1.7 0.4 100.06 7.9 32.5 49.6 6.5 2.7 0.8 100.07 5.7 30.9 44.5 13.1 4.7 1.1 100.08 1.4 27.0 44.4 20.1 6.5 0.6 100.09 0.5 20.5 46.5 16.4 11.8 4.4 100.0
10 1.2 8.6 31.7 26.6 23.1 8.7 100.0
Source: ENCV 1997. Observations with zero income were dropped.
16. Income was defined as primary income plus rental values of any dwelling owned by the house-
hold. Secondary income, such as lottery money, loans, property sales, and other infrequent revenues,
were not considered.
400 THE WORLD BANK ECONOMIC REV I EW, VOL . 17 , NO . 3

vertical axis measures the accumulated percentage of total transfers.17 The higherand more concave the curve, the better the targeting property of the subsidy. Up tothe 30th income centile (the third income decile) the effects of monetary transfersare almost identical in both countries. Roughly the same percentage of transfers,close to 45 percent, accrue to the poorest 30 percent of households. Above thethird income decile, however, the Chilean scheme performs better, transferringmore income to middle-income groups rather than to higher income groups.
The relative concentration curves with respect to the number of beneficiaries isanother source of information on the targeting performance of each subsidyscheme (figure 2). Again, the horizontal axis measures the centiles of the incomedistribution and the vertical axis is the accumulated percentage of the total numberof beneficiaries. For a given point in the income distribution the graph shows thepercentage of beneficiaries that have incomes at or below that point. Once again,the higher and more concave the curve, the better the targeting property of thesubsidy. Although in Chile close to 45 percent of beneficiaries have incomes in thefirst three deciles of the distribution, in Colombia only 30 percent do.
The beneficiary concentration curve suggests that the Chilean means-testedsubsidy scheme is more efficient in identifying poor households. Indeed, the
Cum
ulat
ive
mon
etar
y tr
ansf
ers
(Per
cent
)
Centiles of per capita income
- Chile + Colombia
10 20 30 40 50 60 70 80 90 100
0
10
20
30
40
50
60
70
80
90
100
FI G U R E 1. Cumulative Monetary Transfer Curve per Centile ofper Capita Income
Source: Authors’ computations based on CASEN 1998 and ENCV 1997.
17. The surcharges (negative transfers) for higher income categories are omitted as they are consid-
ered part of the funding mechanism of the subsidy. This issue is discussed later.
Gomez-Lobo and Contreras 401

Chilean concentration curve lies above the Colombian curve at each centile ofper capita income. This result suggests that the means-tested subsidy performsbetter than the geographic system in identifying needy households, confirmingexpectations about the relative efficiency of means-tested benefits. However,because the Colombian scheme is more progressive, providing larger transfers tothe poorest households, the overall poverty impact of both programs is verysimilar, at least for the poorest 30 percent of households. Thus in the overallpoverty impact of the scheme, the differentiation of benefits among differentsocioeconomic categories in Colombia compensates somewhat for the failure ofthe geographical targeting system in identifying the poor.
Thus a program that combines the targeting properties of a means-tested subsidy,as in Chile, with the progressiveness of monetary transfers per household, as in theColombian scheme, would have a greater impact on poverty than either program asthey are currently designed. In Chile this change could easily be accomplished bycalibrating the amount of the water subsidy to each household’s CAS score.
The Colombian scheme also has the potential to be made more progressive.Tightening the classification of dwellings to make the subsidy more targeted (bytransferring more dwellings to the two highest classifications) would increasethe tiny fraction of benefits (1 percent) funded by households in these twogroups, improving not only the distributional effects of the scheme by focusingresources on more needy households but also the progressivity of the scheme bytaxing higher income households.
Cum
ulat
ive
perc
enta
ge o
f ben
efic
iarie
s
Centiles of per capita income
- Chile + Colombia
10 20 30 40 50 60 70 80 90 100
0
10
20
30
40
50
60
70
80
90
100
FI G U R E 2. Cumulative Number of Beneficiaries per Centileof per Capita Income
Source: Authors’ computations based on CASEN 1998 and ENCV 1997.
402 THE WORLD BANK ECONOMIC REV I EW, VOL . 17 , NO . 3
The extent of the errors of inclusion that occur in both countries is strikingwhen the target population is assumed to be the first few deciles of the incomedistribution (see figure 2). Although the Colombian scheme has no explicitlydeclared targeting objective, the Chilean subsidy law defines beneficiary house-holds as households in the first two income deciles. Yet close to 70 percent ofbeneficiaries are not in this group.
What these relative concentration figures do not capture is the extent oferrors of exclusion (already discussed). The relative concentration curves (fig-ures 1 and 2) show the relative targeting properties of both schemes, whereaserrors of exclusion depend on the scale of each program. In other words, giventhe total number of subsidies offered in Chile and Colombia, the Chilean systemdoes a better job of giving the subsidies to poorer households (see figure 2).However, the Colombian scheme covers a much larger share of the population,covering close to 95 percent of households compared with Chile’s 15 percent(see table 1). Thus in Colombia most poor households will receive some benefit,whereas in Chile the errors of exclusion are much higher.
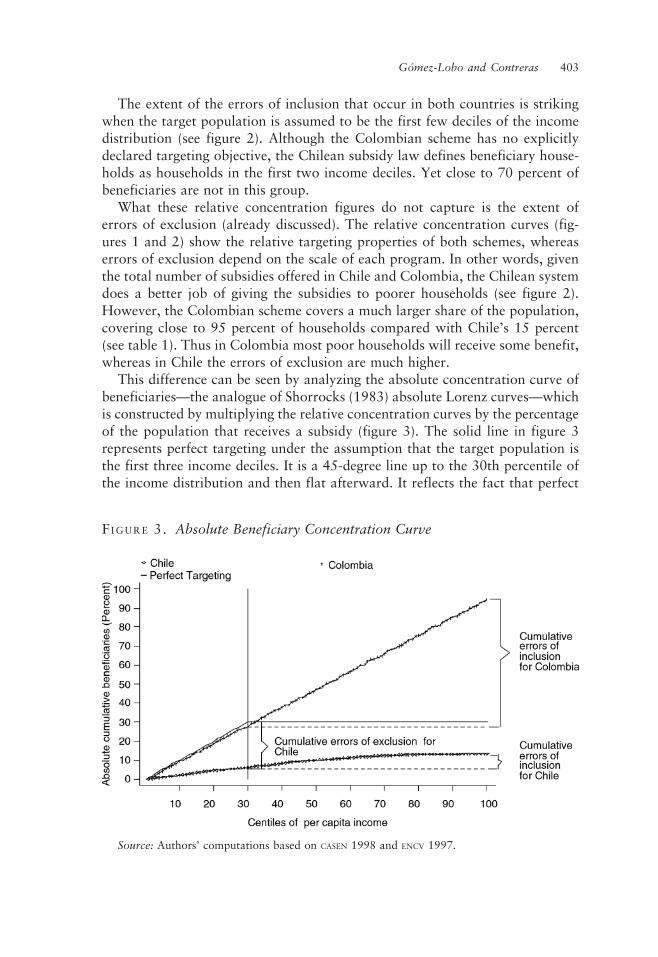
This difference can be seen by analyzing the absolute concentration curve ofbeneficiaries—the analogue of Shorrocks (1983) absolute Lorenz curves—whichis constructed by multiplying the relative concentration curves by the percentageof the population that receives a subsidy (figure 3). The solid line in figure 3represents perfect targeting under the assumption that the target population isthe first three income deciles. It is a 45-degree line up to the 30th percentile ofthe income distribution and then flat afterward. It reflects the fact that perfect
FI G U R E 3. Absolute Beneficiary Concentration Curve
Source: Authors’ computations based on CASEN 1998 and ENCV 1997.
Gomez-Lobo and Contreras 403
targeting in this case implies that only 30 percent of the population are bene-ficiaries (as reflected in the vertical axis) and that all 30 percent are concentratedin households in the first three deciles. Households above this limit are notintended beneficiaries and so the curve is flat afterward.
The empirical concentration curve will reflect targeting errors. The distancebetween the perfect targeting curve and the empirical curve at the kink pointreflects the errors of exclusion. For example, in Chile the cumulative absolutebeneficiary curve, which should include 30 percent of households at the perfecttargeting level, includes only 5 percent, implying that about 25 percent of thepopulation that should receive the subsidy under the targeting goal does not. InColombia the errors of exclusion are close to zero, because all of the poorerhouseholds receive a transfer—because of the almost universal subsidy char-acteristic of the Colombian program rather than because of the efficiency of thetargeting mechanism.
The distance between the empirical concentration curve at the 100th centileand the point where this curve crosses the 30th centile measures the errors ofinclusion of each program—the percentage of the population that receives thesubsidy but is not in the target population. In Colombia, nearly universalcoverage reflects large errors of inclusion. That makes the program extremelyexpensive from a fiscal perspective. A better targeting mechanism would lowerthese costs without necessarily endangering the protection of lower-incomehouseholds.
Thus although errors of inclusion are much higher in Colombia, errors ofexclusion are much higher in Chile, even if the target population is limited to thefirst decile. These errors of exclusion may be worrisome from a policy perspec-tive. If the objective of the water subsidy is to allow the whole target populationto consume the service at lower rates, then clearly the chosen policy instrumentis failing. Although the targeting mechanism is better in relative terms than theone used in Colombia, it still leaves many poor households without benefits.Unless the targeting mechanism is improved, the only way to benefit more of thetarget population would be to increase the number of subsidies.18
IV. CO N C L U S I O N
This study analyzed and compared two water subsidy schemes. Chile’s individ-ual means-tested subsidy was expected to be more efficient in identifying needybeneficiaries, although it can be expensive to administer and requires sophisti-cated institutional capacity at the local government level. Colombia’s scheme,based on a geographical classification of dwellings and cross-subsidies, was
18. In the summer of 2002 (January–February) the government decided to redistribute a substantial
number of water subsidies based on an evaluation showing that the subsidy was not reaching the target
population precisely enough. With data from the next CASEN (2003) it will be possible to judge whether
this change improved the targeting results of the subsidy program.
404 THE WORLD BANK ECONOMIC REV I EW, VOL . 17 , NO . 3
expected to be less efficient in identifying needy beneficiaries but also lessexpensive to administer than a means-tested scheme.
This study bore out these expectations about the targeting ability of eachscheme. Chile’s means-tested system was better able to identify poor house-holds than Colombia’s geographically targeted scheme case, but because theColombian scheme differentiates the amount of benefits per household accor-ding to the socioeconomic classification of its dwelling, the overall impacts ofthe two schemes are quite similar, at least for the first three income deciles.
However, both subsidy programs could be improved. In Chile the schemecould have a greater impact on poverty if the monetary transfers were differ-entiated by socioeconomic levels, as in Colombia. This could be done by con-ditioning the amount of transfers to eligible household on their relative CAS
scores. The poverty impact could also be increased if targeting errors werereduced. More than 60 percent of subsidies go to households that are abovethe third decile of the income distribution. Because the number of subsidiesavailable each year is determined without taking imperfections in the targetingmechanism into account, many poor deserving households are not receiving anybenefits. If the policy objective in Chile is to reach a significant proportion oflower-income households, then either the targeting mechanism must be furtherimproved or the number of subsidies given in a year has to increase to compen-sate for targeting imperfections.
In Colombia almost all poor households receive some benefit. However, thisis achieved through an overly generous program that gives some benefits toalmost all households. The high fiscal costs of this system could be reducedwithout jeopardizing the benefits given to poorer households by improving thetargeting scheme by reclassifying more dwellings of higher income householdsinto the top two socioeconomic categories. This would improve not only thedistributional effects of the scheme, by focusing resources on more needy house-holds, but also the progressivity of the scheme on the financing side, by taxingmore higher income households.
Finally, the empirically imperfect targeting results in both countries found bythis study should not be interpreted as a case against targeted welfare programs.The results are very likely better than they would have been had no special effortbeen made to reach vulnerable households. In addition, both governments haveintroduced changes to improve targeting performance. In 2002 the Chileangovernment decided to redistribute a substantial number of water subsidiesbased on an evaluation showing that the subsidy was not reaching the targetpopulation precisely enough. The changes, which generated some politicalopposition, should improve the targeting performance of the scheme. In Colom-bia the government is planning a new household classification effort that shouldalso improve the targeting properties of the subsidies.
Further research could help improve the schemes in both countries. In Chile itwould be important to investigate why there are still large errors of inclusionand exclusion despite the relatively sophisticated targeting mechanism. Perhaps
Gomez-Lobo and Contreras 405
targeting such a narrow segment of the population is difficult. Given the skewednature of the income distribution, the average household in decile three isprobably very similar in wealth, durable goods ownership, and family incomecompared with the average household in decile four. Any targeting mechanismwill have difficulties distinguishing between them. Alternatively, it may be thatthe targeting mechanism works well at the time a subsidy is originally awarded.However, because subsidies are generally given for a three-year period, thesocioeconomic conditions of households can subsequently improve, thus low-ering ex post targeting effectiveness. These and other hypotheses should beexplored in future research.
In Colombia there is an important aspect of the welfare system that meritsfurther analysis. Water, gas, and electricity subsidies and property taxes are alllinked to the socioeconomic classification of a dwelling. Because that classificationis easily verifiable, it is reasonable to conjecture that some of the benefits of thescheme are capitalized into housing and rental prices. If this is the case, then somepart of the benefit of the subsidies would go to the owner of a dwelling at the timethe scheme was introduced rather than to the current occupier. Thus the distribu-tive impact of the Colombian scheme measured in this article could well be biased.
AP P E N D I X. DA T A IS S U E S
The data for Chile came from the 1998 CASEN, a cross-sectional survey designedto collect information on the socioeconomic situation of Chilean families,including housing, education, subsidies, and labor characteristics. CASEN beganto incorporate information on water subsidy benefits in 1996. The 1998 surveyincludes information on 48,107 households as well as on the individuals withineach household.
CASEN accounts for only about half of the water subsidies distributed in thecountry. The Ministry of Social Planning is aware of this problem but assumes thatthe underreporting is random, so that the distribution of benefits from the samplecan be extrapolated to the whole water subsidy program. Some evidence that thismay be correct is provided by a comparison of the average subsidy per beneficiary,Ch$3,280 (US$7.1) per month according to program records, with the averagesubsidy per beneficiary from the 1998 survey, Ch$3,137 (US$6.8) per month.
The data used for Colombia came from the 1997 National Quality of LifeSurvey (ENCV), a household survey undertaken by the National Planning Depart-ment. The survey includes a wide range of socioeconomic variables, includingthe amount paid by a household for water and sewage services. It does not,however, register the amount of surcharge or subsidy for these services, only theactual amount spent. Therefore, subsidies must be estimated indirectly. Follow-ing Sanchez Torres and Nunez Mendez (1999), indirect information on theportion of costs covered by each tariff for different companies was used toinfer the amount of the subsidy (details can be found in Gomez-Lobo andContreras 2000).
406 THE WORLD BANK ECONOMIC REV I EW, VOL . 17 , NO . 3
This approach implies that only observations from the departments whereinformation was available could be used. These included the Departments ofCauca, Narino, Valle, Caldas, Risaralda, Quindıo, Bogota, Cundinamarca,Santander, Antioquıa, Cesar, Atlantico, and Bolivar. In addition, all householdswithout connections to piped water were dropped, because they would notreceive services from the water companies. Finally, households without a socio-economic classification were dropped.19 Of the original 9,121 households in thesample, 4,094 remained in the analysis after these criteria were applied. Someobservations do not register the water bill. Therefore, concentration curves wereconstructed using only observations with positive water charges.
RE F E R E N C E S
Brook, P. J., and S. M. Smith. 2001. Contracting for Public Services: Output-Based Aid and Its
Applications. Washington, D.C.: World Bank.
Estache, A., V. Foster, and Q. Wodon. 2002. Accounting for Poverty in Infrastructure Reform: Learning
from Latin America’s Experience. WBI Development Studies. Washington D.C.: World Bank
Institute.
Estache, A., D. Leipziger, and A. Gomez-Lobo. 2001. ‘‘Utilities ‘Privatization’ and the Poor’s Needs in
Latin America: Have We Learned Enough to Get It Right?’’ World Development 29(7):1179–98.
Gomez-Lobo, A., and D. Contreras. 2000. ‘‘Subsidy Policies for the Utility Industries: A Comparison of
the Chilean and Colombian Water Subsidy Schemes.’’ World Bank Institute, Washington, D.C.
Mideplan. 1999. ‘‘Antecedentes Administrativos, Operativos y Legales del Subsidio al Pago del Consumo
de Agua Potable y Servicios de Alcantarillado de Aguas Servidas.’’ Documentos Mideplan, Ministerio
de Planificacion y Cooperacion, Division Social, Departamento de Informacion Social, Santiago.
Sanchez Torres, F., and J. Nunez Mendez. 1999. ‘‘Decentralizacion, Pobreza y Acceso a los Servicios
Sociales: ¿Quien se Beneficio del Gasto Publico Social en los Noventa?’’ Universidad de Los Andes,
Centro de Estudios de Desarrollo Economico, Facultad de Economıa, Santa Fe de Bogota.
Serra, P. 2000. ‘‘Subsidies in Chilean Public Utilities.’’ Documento de Trabajo Serie Economıa 70.
Universidad de Chile, Centro de Economıa Aplicada, Departamento de Ingenierıa Industrial, San-
tiago.
Shorrocks, A. F. 1983. ‘‘Ranking Income Distributions.’’ Economica 50(197):3–17.
Velez Echavarrıa, C. E. 1993. Gasto Social y Desigualdad, Logros y Extravıos: Estudio de la Incidencia
del Gasto Publico Social en Colombia. Santa Fe de Bogota: Departamento Nacional de Planeacion.
World Bank. 1994. World Development Report 1994: Infrastructure for Development. New York:
Oxford University Press.
19. There were many observations with a classification of 0 (possibly an indicator of missing
information) or 9 (possibly industrial or commercial premises). One household with no adults was also
dropped from the sample.
Gomez-Lobo and Contreras 407