Embed Size (px)
Citation preview
www.dbsvickers.com
sa- DL
Value emerging • Keen competition and high acquisition price have
deterred M&A progress
• Further depreciation of Renminbi could cool downprices of water assets
• Value emerging due to recent pullback andcontinual upbeat industry outlook
• Top picks are CITIC Envirotech (CEL SP), ChinaEverbright International (257 HK) and CTEnvironmental Group (1363 HK)
1HFY15 results were in line or slightly below. 1HFY15 results reported by most water companies were largely in line with estimates with just a few fell short of expectations. The disappointment mainly came from slower-than-expected progress in construction, leading to lower construction revenue. However, operating revenue still showed robust growth along with rising treatment volume and increasing operating capacity.
Outlook remains optimistic though competition is getting keen. The Water Ten Plan has no doubt presented more business opportunities for water companies through higher water treatment standards, more technical upgrades and acceleration in market consolidation. These opportunities have also attracted more players to enter the market, leading to longer time for negotiation and higher prices for acquisition or securing new BOT projects. Nevertheless, most listed water companies made good progress in expanding their capacities so far this year. Projects under their radar screens are still plenty and we expect stronger deal flow in the 2H.
Renminbi depreciation creates both crisis and opportunities. The recent depreciation of Renminbi did not have significant adverse impact on most water companies. However, further depreciation could be negative to those water companies with offshore loans. On a positive note, capital outflow would “cool down” the prices of water assets, allowing M&A and market consolidation to speed up.
Three top picks. We like CITIC Envirotech (CEL SP), which is a pioneer in membrane technology and has overseas exposure to mitigate the downside risk of Renminbi depreciation. We also like China Everbright International (257 HK) which offers attractive return after the recent underperformance; and CT Environment Group (1363 HK) which is gaining momentum in its expansion.
HSI: 21,563
ANALYST Patricia YEUNG +852 2863 8908 [email protected]
Tony WU [email protected]
Recommendation & valuation
Upside/
(downside)
Local$ US$m Local$ % x
HK Stock s
Beijing Ents. Water(371 HK)
HKD 5.640 6,345 6.50 15.2 Buy 20.9
China Everbright Intl(257 HK)
HKD 10.620 6,144 13.80 29.9 Buy 22.6
CT Environmental(1363 HK)
HKD 2.210 1,744 2.90 31.2 Buy 18.6
Kangda Int'l(6136 HK)
HKD 2.090 559 2.60 24.4 Buy 10.8
Tianjin Cap 'H'(1065 HK)
HKD 4.160 768 3.50 (15.9) Sell 13.4
Tianjin Cap 'A'(600874 CH)
CNY 8.860 1,984 7.50 (15.3) Sell 34.6
Singapore Stock s
China EverbrightWater (CEWL SP)
SGD 0.675 1,243 0.80 18.5 Buy 19.7
CITIC Envirotech(CEL SP) #
SGD 1.545 1,233 1.70 10.0 Buy 24.0
SIIC Environment(SIIC SP)
SGD 0.164 1,296 0.18 9.8 Hold 22.2
15FPE
Company Price TargetPrice
RecomMktCap
# FY15: FY16; FY16: FY17
Source: Thomson Reuters, DBS Vickers
Based on closing prices as at 10 Sep 2015
DBS Group Research . Equity 14 September 2015
Regional Industry Focus
Water Sector Refer to important disclosures at the end of this report
Industry Focus
Water Sector
Page 2
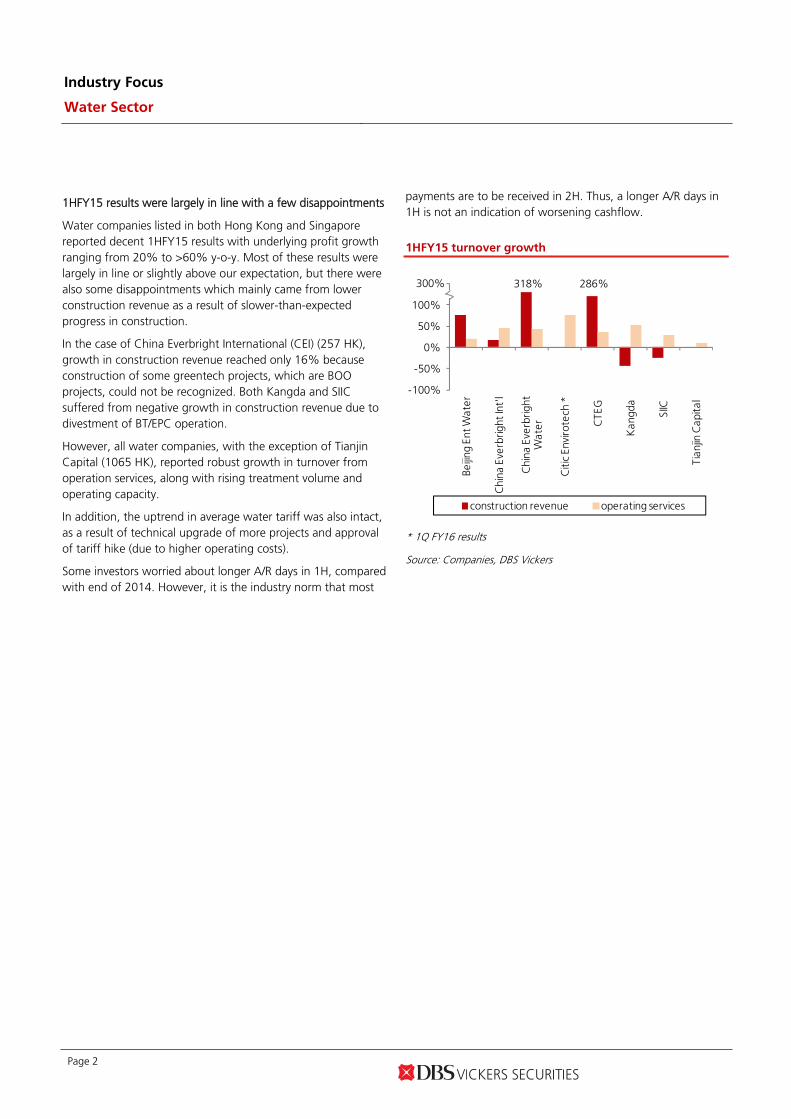
1HFY15 results were largely in line with a few disappointments
Water companies listed in both Hong Kong and Singapore reported decent 1HFY15 results with underlying profit growth ranging from 20% to >60% y-o-y. Most of these results were largely in line or slightly above our expectation, but there were also some disappointments which mainly came from lower construction revenue as a result of slower-than-expected progress in construction.
In the case of China Everbright International (CEI) (257 HK), growth in construction revenue reached only 16% because construction of some greentech projects, which are BOO projects, could not be recognized. Both Kangda and SIIC suffered from negative growth in construction revenue due to divestment of BT/EPC operation.
However, all water companies, with the exception of Tianjin Capital (1065 HK), reported robust growth in turnover from operation services, along with rising treatment volume and operating capacity.
In addition, the uptrend in average water tariff was also intact, as a result of technical upgrade of more projects and approval of tariff hike (due to higher operating costs).
Some investors worried about longer A/R days in 1H, compared with end of 2014. However, it is the industry norm that most
payments are to be received in 2H. Thus, a longer A/R days in 1H is not an indication of worsening cashflow.
1HFY15 turnover growth
-100%
-50%
0%
50%
100%
150%
Beijin
g En
t Wat
er
Chi
na E
verb
right
Int'
l
Chi
na E
verb
right
W
ater
Citi
c En
viro
tech
*
CTE
G
Kan
gda
SIIC
Tian
jin C
apita
l
construction revenue operating services
300% 318% 286%
* 1Q FY16 results
Source: Companies, DBS Vickers
Industry Focus
Water Sector
Page 3
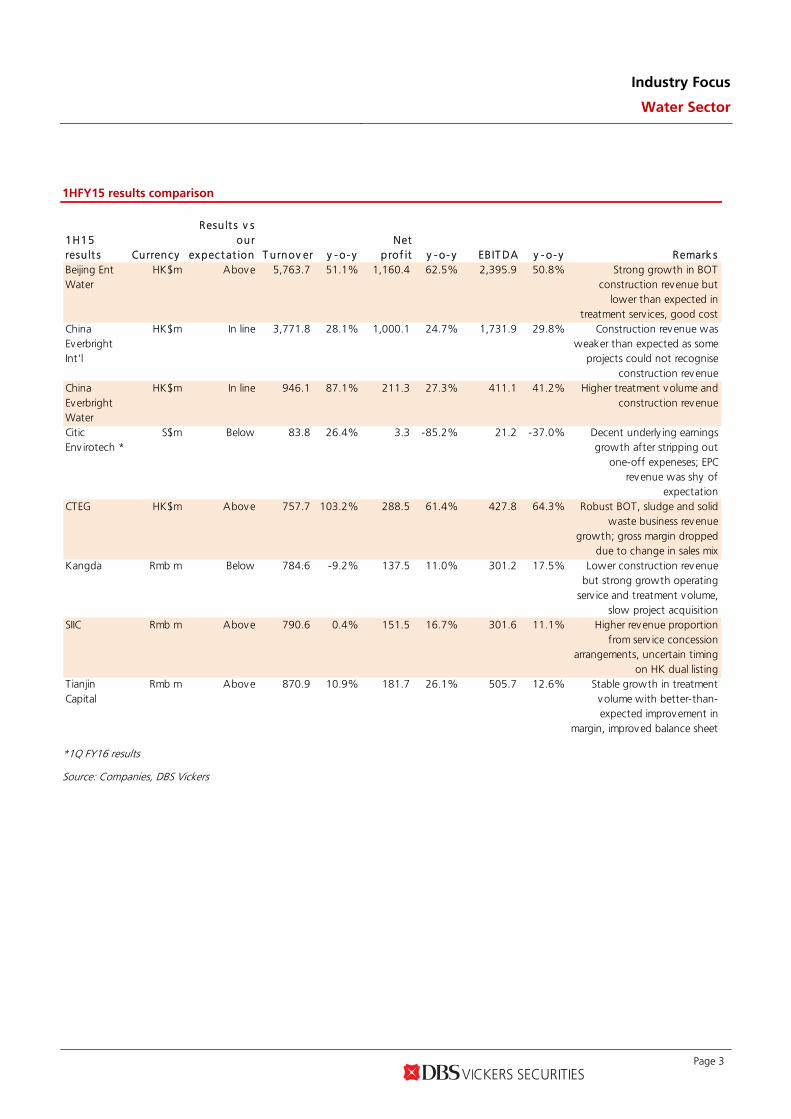
1HFY15 results comparison
1H15resu lt s Currency
Resu lt s v sour
expec t at ion T urnov er y - o- yNet
prof it y - o- y EB IT DA y - o- y Remark sBeijing EntWater
HK$m Above 5,763.7 51.1% 1,160.4 62.5% 2,395.9 50.8% Strong growth in BOTconstruction revenue but
lower than expected intreatment serv ices, good cost
ChinaEverbrightInt'l
HK$m In line 3,771.8 28.1% 1,000.1 24.7% 1,731.9 29.8% Construction revenue wasweaker than expected as some
projects could not recogniseconstruction revenue
ChinaEverbrightWater
HK$m In line 946.1 87.1% 211.3 27.3% 411.1 41.2% Higher treatment volume andconstruction revenue
CiticEnv irotech *
S$m Below 83.8 26.4% 3.3 -85.2% 21.2 -37.0% Decent underly ing earningsgrowth after stripping out
one-off expeneses; EPCrevenue was shy of
expectationCTEG HK$m Above 757.7 103.2% 288.5 61.4% 427.8 64.3% Robust BOT, sludge and solid
waste business revenuegrowth; gross margin dropped
due to change in sales mixKangda Rmb m Below 784.6 -9.2% 137.5 11.0% 301.2 17.5% Lower construction revenue
but strong growth operatingserv ice and treatment volume,
slow project acquisitionSIIC Rmb m Above 790.6 0.4% 151.5 16.7% 301.6 11.1% Higher revenue proportion
from serv ice concessionarrangements, uncertain timing
on HK dual listingTianjinCapital
Rmb m Above 870.9 10.9% 181.7 26.1% 505.7 12.6% Stable growth in treatmentvolume with better-than-expected improvement in
margin, improved balance sheet
*1Q FY16 results
Source: Companies, DBS Vickers
Industry Focus
Water Sector
Page 4
Outlook still robust but keener competition
Many investors worried that the enforcement in environmental law will be slackened to alleviate pressure on GDP growth. But we think industry outlook remains relatively upbeat. China Academy for Environmental Planning (環境保護部環境規劃院) reckons that investment in environmental sector could be a good economic driver. In fact, in the 12th Five Year Plan, a Rmb2.33trn investment in the sector pushed up GDP by Rmb2.56bn. Tightened implementation of environmental law will force out inefficient and highly polluting industries, leading to the development of new, green industries.
Along with the optimisation of China’s industrial structure, reliance on new strategic industries, including environmental protection sector, for GDP growth is increasing. According to Academy of Macroeconomic Research of NDRC (國家發展改革
委宏觀經濟研究院), the major enterprises of the new strategic industries reported growth of >10% and >17% in turnover and net profit in 1H2015 respectively. Growth of these industries will continue to be strong, particularly in the coming 13th Five Year Plan. It also expects the environmental sector to enjoy CAGR of 15-20% in the next five years with industry value reaching at least Rmb1trn by 2020.
Thus, government’s support in the environmental sector will remain strong. This also echoed with comments from management of water companies that there are plenty of water projects in the market.
However, competition is getting fierce. This is evidenced by longer time taken for negotiation of BOT projects and M&A. Apart from new SOE players, some PE funds also entered the field, despite their lack of operation experience. As these new “players” have pushed up the prices of water assets, many listed companies have turned cautious in making M&A to safeguard returns.
Keener competition is also reflected in the lower IRR of new projects though the return is still higher than the minimum required rate of return set by listed water companies.
Renminbi depreciation creates both crisis and opportunities
While the recent depreciation of the Renminbi has triggered the global stock market meltdown, we believe this presents both crisis and opportunities for water companies.
As the majority of revenue of all water companies are denominated in Reminbi, translation loss in the P/L is unavoidable. For those water companies with relatively high exposure to off-shore loan, such as CEI and Beijing Enterprises Water (BEW) (371 HK), their reporting currency is not Renminbi; thus no foreign exchange loss will be realized for the time being. However, the risk of further depreciation could not be
ruled out. Both CEI and BEW are likely to restructure its debt profile and trim off-shore loan percentage.
On the other hand, capital outflow as a result of Renminbi depreciation will be positive to the water sector. We expect prices of water assets to gradually cool down. Those water companies with strong M&A appetite can accelerate acquisitions.
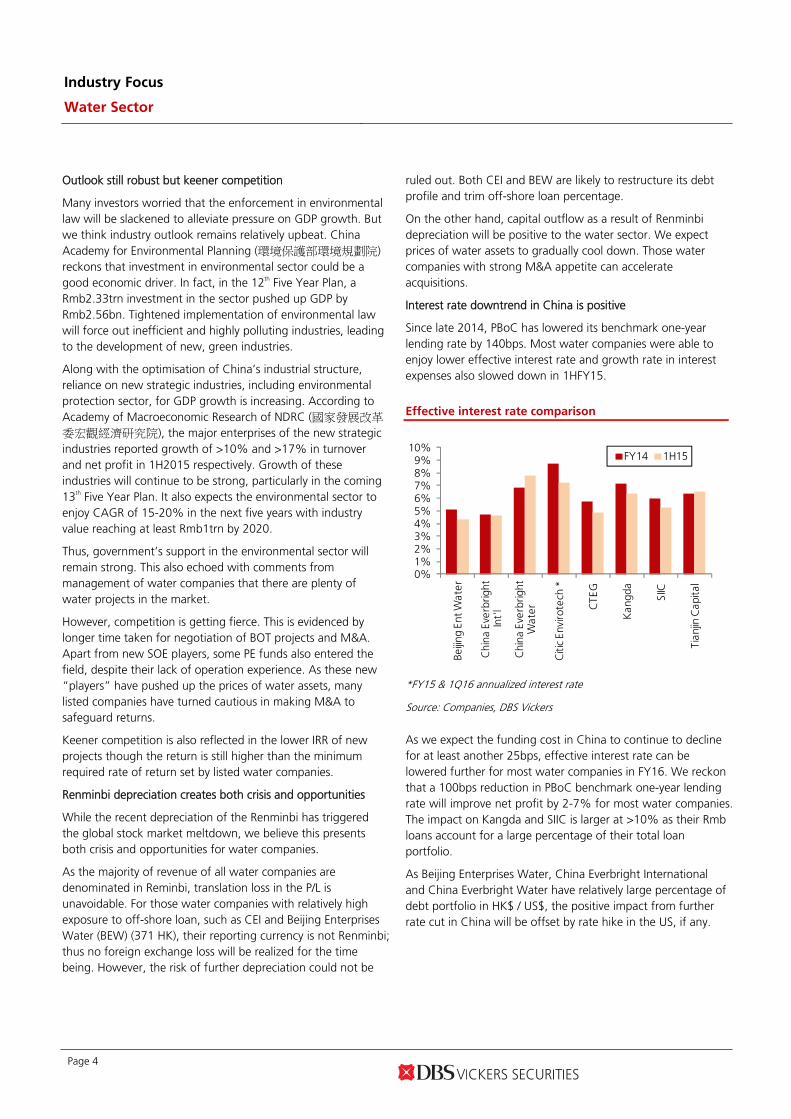
Interest rate downtrend in China is positive
Since late 2014, PBoC has lowered its benchmark one-year lending rate by 140bps. Most water companies were able to enjoy lower effective interest rate and growth rate in interest expenses also slowed down in 1HFY15.
Effective interest rate comparison
0%1%2%3%4%5%6%7%8%9%
10%Be
ijing
Ent W
ater
Chi
na E
verb
right
In
t'l
Chi
na E
verb
right
W
ater
Citi
c En
viro
tech
*
CTE
G
Kan
gda
SIIC
Tian
jin C
apita
l
FY14 1H15
*FY15 & 1Q16 annualized interest rate
Source: Companies, DBS Vickers
As we expect the funding cost in China to continue to decline for at least another 25bps, effective interest rate can be lowered further for most water companies in FY16. We reckon that a 100bps reduction in PBoC benchmark one-year lending rate will improve net profit by 2-7% for most water companies. The impact on Kangda and SIIC is larger at >10% as their Rmb loans account for a large percentage of their total loan portfolio.
As Beijing Enterprises Water, China Everbright International and China Everbright Water have relatively large percentage of debt portfolio in HK$ / US$, the positive impact from further rate cut in China will be offset by rate hike in the US, if any.

Industry Focus
Water Sector
Page 5
Valuation at 5-year historical average
Share prices of water companies have been very volatile so far this year. They all peaked in April with Tianjin Capital being the best performer and gaining as much as 78% since beginning of the year. Even CITIC Envirotech, being the worst performer, also climbed >10%. However, the meltdown in the A-share market and the unexpected depreciation of Renminbi wiped out most of the gain. In particular, since Renminbi depreciated, all water stocks, with the exception of BEW, have
underperformed the market indexes. YTD, only SIIC, CT Environmental and BEW managed a positive return of 19%, 11% and 7% respectively.
After the recent pullback, most of the water stocks are now trading at 5-year historical average adjusted PE while CITIC Envirotech is trading at -1SD. During the Asian Financial Crisis and European Debt Crisis, the water stocks troughed at around -2SD and -1SD respectively. Pegging at such trough valuation could result in further downside risk of at least 40-70%.
Relative performance – Hong Kong stocks
Relative performance – Singapore stocks
50
70
90
110
130
150
170
190
Jan-15 Mar-15 May-15 Jul-15 Sep-15
China Everbright Intl. Beijing Ents.WaterCT Environmental Tianjin CapitalKangda HSI
1 Jan 15 = 100
55
75
95
115
135
155
175
195
Jan-15 Mar-15 May-15 Jul-15 Sep-15
Citic Envirotech SIIC EnvironmentChina Everbright Water HyfluxSTI
1 Jan 15 = 100
Source: Thomson Reuters, DBS Vickers Source: Thomson Reuters, DBS Vickers
Sector PE – Hong Kong stocks
Sector adjusted PE – Hong Kong stocks
8
10
12
14
16
18
20
22
24
26
Jan-
10
Feb-
11
Mar
-12
Apr
-13
Jun-
14
Jul-1
5
Average: 14.8x
+1SD: 18.3x
-1SD: 11.4x
X
10
15
20
25
30
35
40
45
50
Jan-
10
Dec
-10
Nov
-11
Oct
-12
Sep-
13
Aug
-14
Jul-1
5
Average: 23.4x
+1SD: 31.6x
-1SD: 15.3x
X
Source: Thomson Reuters, DBS Vickers Source: Thomson Reuters, DBS Vickers
Industry Focus
Water Sector
Page 6
Sector PE – Singapore stocks
Sector adjusted PE – Singapore stocks
10
15
20
25
30
35
40
45
50
55
Jan-
10
Feb-
11
Mar
-12
Apr
-13
Jun-
14
Jul-1
5
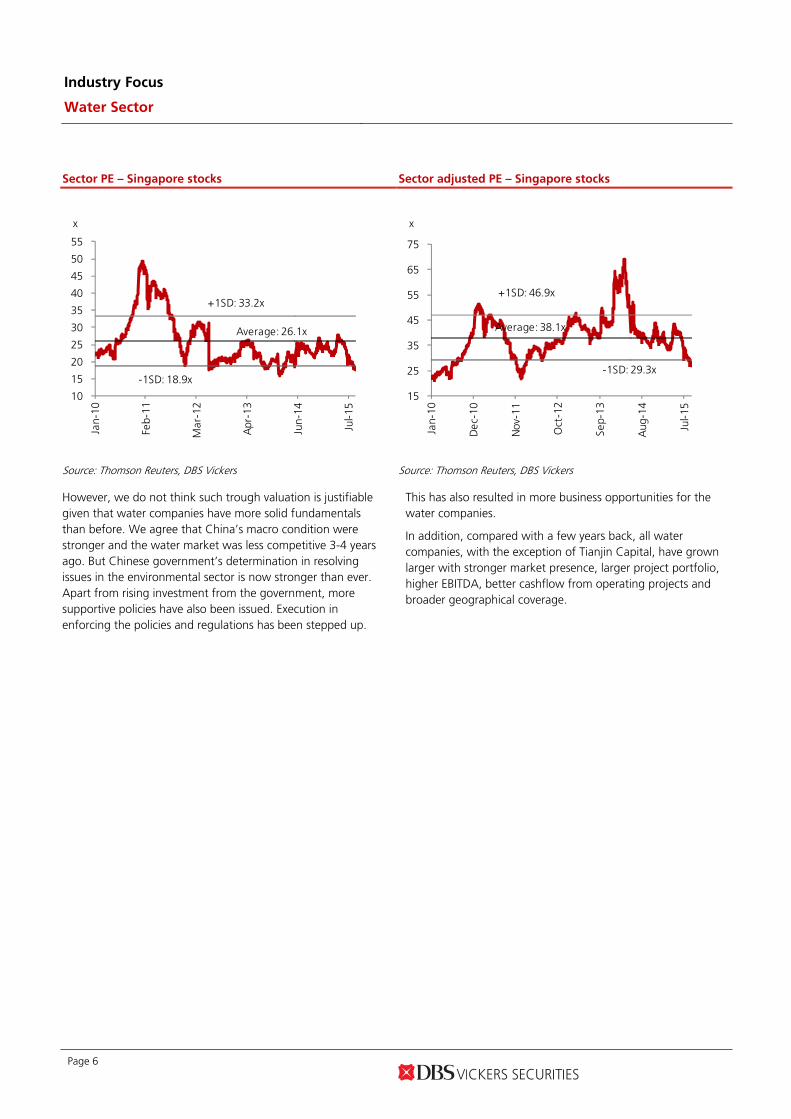
Average: 26.1x
+1SD: 33.2x
-1SD: 18.9x
x
15
25
35
45
55
65
75
Jan-
10
Dec
-10
Nov
-11
Oct
-12
Sep-
13
Aug
-14
Jul-1
5
Average: 38.1x
+1SD: 46.9x
-1SD: 29.3x
x
Source: Thomson Reuters, DBS Vickers Source: Thomson Reuters, DBS Vickers
However, we do not think such trough valuation is justifiable given that water companies have more solid fundamentals than before. We agree that China’s macro condition were stronger and the water market was less competitive 3-4 years ago. But Chinese government’s determination in resolving issues in the environmental sector is now stronger than ever. Apart from rising investment from the government, more supportive policies have also been issued. Execution in enforcing the policies and regulations has been stepped up.
This has also resulted in more business opportunities for the water companies.
In addition, compared with a few years back, all water companies, with the exception of Tianjin Capital, have grown larger with stronger market presence, larger project portfolio, higher EBITDA, better cashflow from operating projects and broader geographical coverage.
Industry Focus
Water Sector
Page 7
Fundamentals comparison
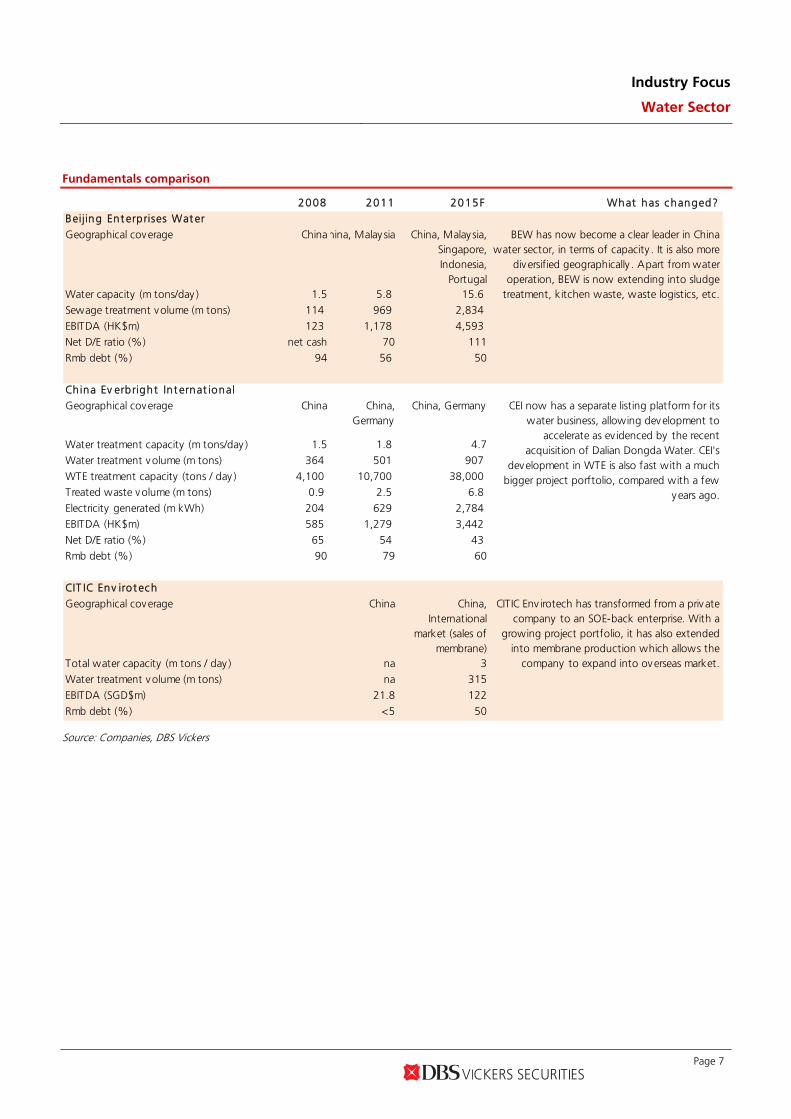
2008 2011 2015F What has changed?Beijing Ent erprises Wat er
Geographical coverage Chinahina, Malay sia China, Malaysia,Singapore,Indonesia,
PortugalWater capacity (m tons/day ) 1.5 5.8 15.6Sewage treatment volume (m tons) 114 969 2,834
EBITDA (HK$m) 123 1,178 4,593 Net D/E ratio (%) net cash 70 111
Rmb debt (%) 94 56 50
China Ev erbright Int ernat ionalGeographical coverage China China,
GermanyChina, Germany
Water treatment capacity (m tons/day ) 1.5 1.8 4.7Water treatment volume (m tons) 364 501 907
WTE treatment capacity (tons / day ) 4,100 10,700 38,000 Treated waste volume (m tons) 0.9 2.5 6.8
Electricity generated (m kWh) 204 629 2,784 EBITDA (HK$m) 585 1,279 3,442
Net D/E ratio (%) 65 54 43 Rmb debt (%) 90 79 60
CIT IC Env irot ech
Geographical coverage China China,International
market (sales ofmembrane)
Total water capacity (m tons / day ) na 3Water treatment volume (m tons) na 315
EBITDA (SGD$m) 21.8 122
Rmb debt (%) <5 50
BEW has now become a clear leader in Chinawater sector, in terms of capacity . It is also more
diversified geographically . Apart from wateroperation, BEW is now extending into sludge
treatment, kitchen waste, waste logistics, etc.
CEI now has a separate listing platform for itswater business, allowing development to
accelerate as ev idenced by the recentacquisition of Dalian Dongda Water. CEI's
development in WTE is also fast with a muchbigger project porftolio, compared with a few
years ago.
CITIC Env irotech has transformed from a priv atecompany to an SOE-back enterprise. With a
growing project portfolio, it has also extendedinto membrane production which allows the
company to expand into overseas market.
Source: Companies, DBS Vickers
Industry Focus
Water Sector
Page 8
Fundamentals comparison
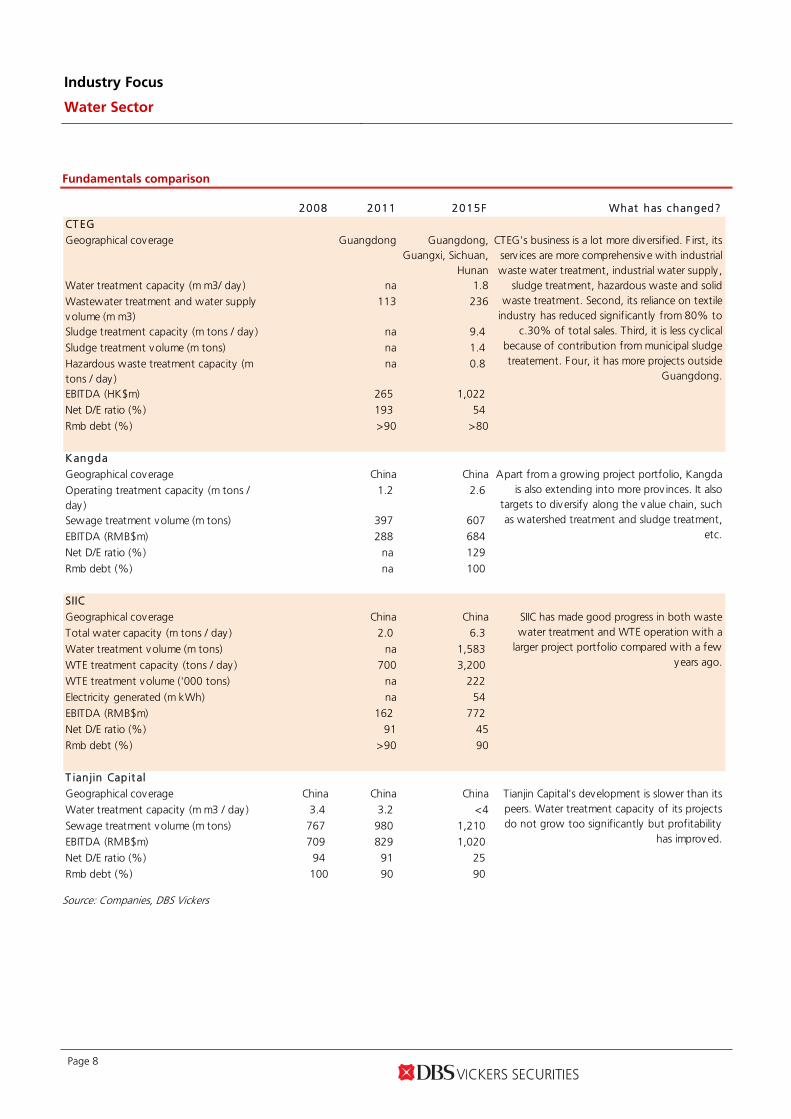
2008 2011 2015F What has changed?
CT EG
Geographical coverage Guangdong Guangdong,Guangxi, Sichuan,
HunanWater treatment capacity (m m3/ day ) na 1.8
Wastewater treatment and water supplyvolume (m m3)
113 236
Sludge treatment capacity (m tons / day ) na 9.4
Sludge treatment volume (m tons) na 1.4
Hazardous waste treatment capacity (mtons / day )
na 0.8
EBITDA (HK$m) 265 1,022
Net D/E ratio (%) 193 54
Rmb debt (%) >90 >80
K angda
Geographical coverage China China
Operating treatment capacity (m tons /day )
1.2 2.6
Sewage treatment volume (m tons) 397 607
EBITDA (RMB$m) 288 684
Net D/E ratio (%) na 129
Rmb debt (%) na 100
SIIC
Geographical coverage China China
Total water capacity (m tons / day ) 2.0 6.3
Water treatment volume (m tons) na 1,583
WTE treatment capacity (tons / day ) 700 3,200
WTE treatment volume ('000 tons) na 222
Electricity generated (m kWh) na 54
EBITDA (RMB$m) 162 772
Net D/E ratio (%) 91 45
Rmb debt (%) >90 90
T ian jin Capit al
Geographical coverage China China China
Water treatment capacity (m m3 / day ) 3.4 3.2 <4
Sewage treatment volume (m tons) 767 980 1,210
EBITDA (RMB$m) 709 829 1,020
Net D/E ratio (%) 94 91 25
Rmb debt (%) 100 90 90
SIIC has made good progress in both wastewater treatment and WTE operation with a
larger project portfolio compared with a fewyears ago.
Tianjin Capital's development is slower than itspeers. Water treatment capacity of its projectsdo not grow too significantly but profitability
has improved.
CTEG's business is a lot more diversified. F irst, itsserv ices are more comprehensive with industrialwaste water treatment, industrial water supply ,
sludge treatment, hazardous waste and solidwaste treatment. Second, its reliance on textile
industry has reduced significantly from 80% toc.30% of total sales. Third, it is less cyclical
because of contribution from municipal sludgetreatement. Four, it has more projects outside
Guangdong.
Apart from a growing project portfolio, Kangdais also extending into more prov inces. It also
targets to diversify along the value chain, suchas watershed treatment and sludge treatment,
etc.
Source: Companies, DBS Vickers
Industry Focus
Water Sector
Page 9
Our top picks
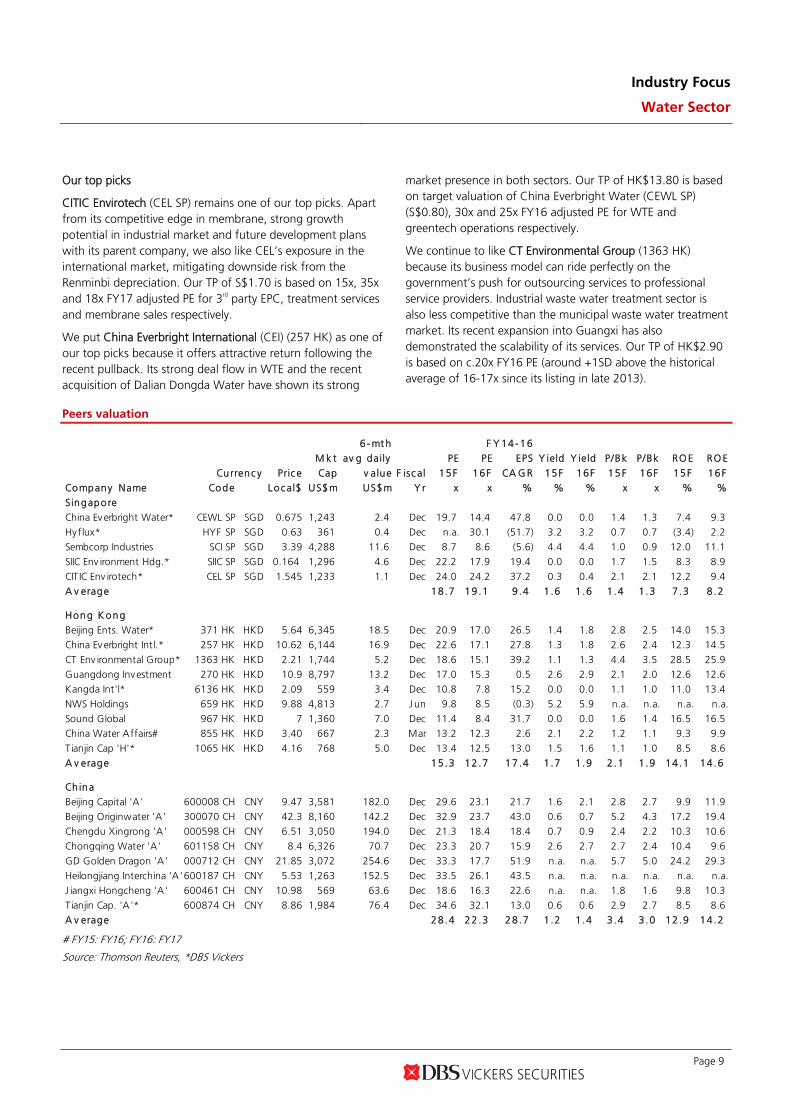
CITIC Envirotech (CEL SP) remains one of our top picks. Apart from its competitive edge in membrane, strong growth potential in industrial market and future development plans with its parent company, we also like CEL’s exposure in the international market, mitigating downside risk from the Renminbi depreciation. Our TP of S$1.70 is based on 15x, 35x and 18x FY17 adjusted PE for 3rd party EPC, treatment services and membrane sales respectively.
We put China Everbright International (CEI) (257 HK) as one of our top picks because it offers attractive return following the recent pullback. Its strong deal flow in WTE and the recent acquisition of Dalian Dongda Water have shown its strong
market presence in both sectors. Our TP of HK$13.80 is based on target valuation of China Everbright Water (CEWL SP) (S$0.80), 30x and 25x FY16 adjusted PE for WTE and greentech operations respectively.
We continue to like CT Environmental Group (1363 HK) because its business model can ride perfectly on the government’s push for outsourcing services to professional service providers. Industrial waste water treatment sector is also less competitive than the municipal waste water treatment market. Its recent expansion into Guangxi has also demonstrated the scalability of its services. Our TP of HK$2.90 is based on c.20x FY16 PE (around +1SD above the historical average of 16-17x since its listing in late 2013).
Peers valuation
6- mt h F Y 14- 16
M k t av g daily PE PE EPS Y ield Y ield P/Bk P/Bk RO E RO E
Currenc y Pric e Cap v alue F isc al 15F 16F CA G R 15F 16F 15F 16F 15F 16F
Company Name Code Local$ US$m US$m Y r x x % % % x x % %
Singapore
China Everbright Water* CEWL SP SGD 0.675 1,243 2.4 Dec 19.7 14.4 47.8 0.0 0.0 1.4 1.3 7.4 9.3
Hy flux* HYF SP SGD 0.63 361 0.4 Dec n.a. 30.1 (51.7) 3.2 3.2 0.7 0.7 (3.4) 2.2
Sembcorp Industries SCI SP SGD 3.39 4,288 11.6 Dec 8.7 8.6 (5.6) 4.4 4.4 1.0 0.9 12.0 11.1
SIIC Env ironment Hdg.* SIIC SP SGD 0.164 1,296 4.6 Dec 22.2 17.9 19.4 0.0 0.0 1.7 1.5 8.3 8.9
CITIC Env irotech* CEL SP SGD 1.545 1,233 1.1 Dec 24.0 24.2 37.2 0.3 0.4 2.1 2.1 12.2 9.4
A v erage 18.7 19 .1 9 .4 1 .6 1 .6 1 .4 1 .3 7 .3 8 .2
Hong K ong
Beijing Ents. Water* 371 HK HKD 5.64 6,345 18.5 Dec 20.9 17.0 26.5 1.4 1.8 2.8 2.5 14.0 15.3
China Everbright Intl.* 257 HK HKD 10.62 6,144 16.9 Dec 22.6 17.1 27.8 1.3 1.8 2.6 2.4 12.3 14.5
CT Env ironmental Group* 1363 HK HKD 2.21 1,744 5.2 Dec 18.6 15.1 39.2 1.1 1.3 4.4 3.5 28.5 25.9
Guangdong Investment 270 HK HKD 10.9 8,797 13.2 Dec 17.0 15.3 0.5 2.6 2.9 2.1 2.0 12.6 12.6
Kangda Int'l* 6136 HK HKD 2.09 559 3.4 Dec 10.8 7.8 15.2 0.0 0.0 1.1 1.0 11.0 13.4
NWS Holdings 659 HK HKD 9.88 4,813 2.7 J un 9.8 8.5 (0.3) 5.2 5.9 n.a. n.a. n.a. n.a.
Sound Global 967 HK HKD 7 1,360 7.0 Dec 11.4 8.4 31.7 0.0 0.0 1.6 1.4 16.5 16.5
China Water Affairs# 855 HK HKD 3.40 667 2.3 Mar 13.2 12.3 2.6 2.1 2.2 1.2 1.1 9.3 9.9
Tianjin Cap 'H'* 1065 HK HKD 4.16 768 5.0 Dec 13.4 12.5 13.0 1.5 1.6 1.1 1.0 8.5 8.6
A v erage 15.3 12 .7 17 .4 1 .7 1.9 2 .1 1.9 14.1 14 .6
Ch ina
Beijing Capital 'A' 600008 CH CNY 9.47 3,581 182.0 Dec 29.6 23.1 21.7 1.6 2.1 2.8 2.7 9.9 11.9
Beijing Originwater 'A' 300070 CH CNY 42.3 8,160 142.2 Dec 32.9 23.7 43.0 0.6 0.7 5.2 4.3 17.2 19.4
Chengdu Xingrong 'A' 000598 CH CNY 6.51 3,050 194.0 Dec 21.3 18.4 18.4 0.7 0.9 2.4 2.2 10.3 10.6
Chongqing Water 'A' 601158 CH CNY 8.4 6,326 70.7 Dec 23.3 20.7 15.9 2.6 2.7 2.7 2.4 10.4 9.6
GD Golden Dragon 'A' 000712 CH CNY 21.85 3,072 254.6 Dec 33.3 17.7 51.9 n.a. n.a. 5.7 5.0 24.2 29.3
Heilongjiang Interchina 'A'600187 CH CNY 5.53 1,263 152.5 Dec 33.5 26.1 43.5 n.a. n.a. n.a. n.a. n.a. n.a.
J iangxi Hongcheng 'A' 600461 CH CNY 10.98 569 63.6 Dec 18.6 16.3 22.6 n.a. n.a. 1.8 1.6 9.8 10.3
Tianjin Cap. 'A'* 600874 CH CNY 8.86 1,984 76.4 Dec 34.6 32.1 13.0 0.6 0.6 2.9 2.7 8.5 8.6
A v erage 28.4 22 .3 28 .7 1 .2 1.4 3 .4 3.0 12.9 14 .2
# FY15: FY16; FY16: FY17
Source: Thomson Reuters, *DBS Vickers
Industry Focus
Water Sector
Page 10
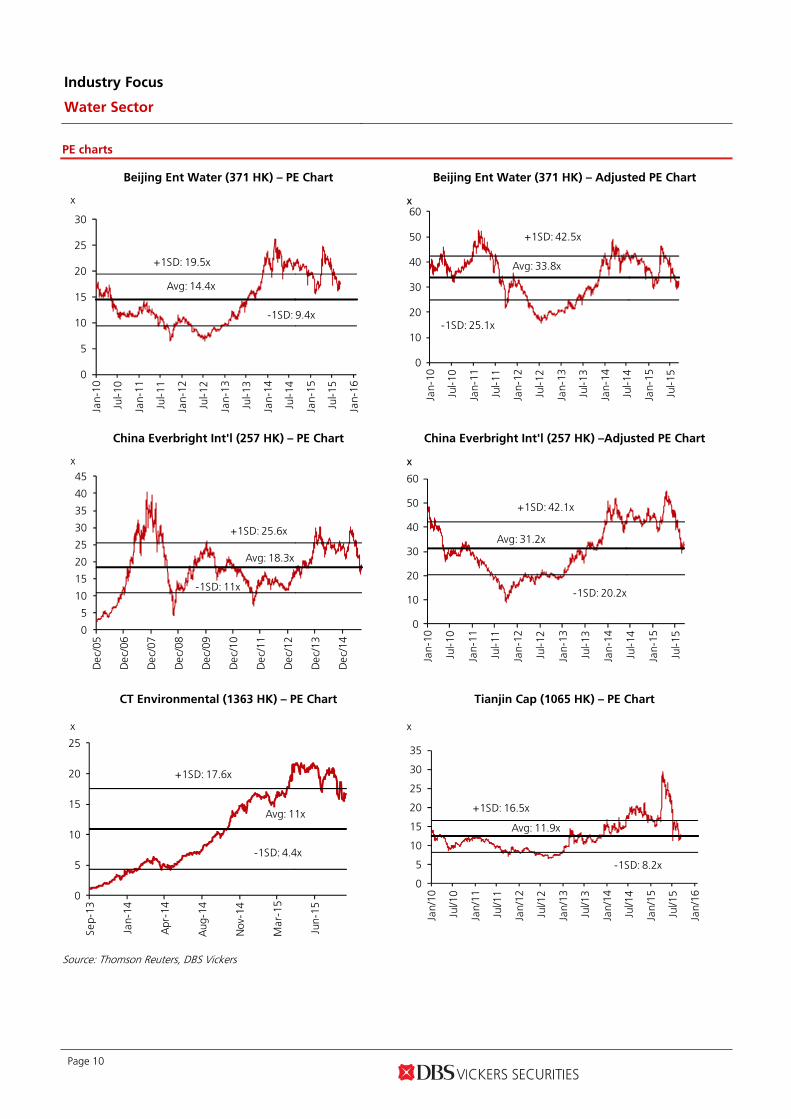
PE charts
Beijing Ent Water (371 HK) – PE Chart Beijing Ent Water (371 HK) – Adjusted PE Chart
0
5
10
15
20
25
30
Jan-
10
Jul-1
0
Jan-
11
Jul-1
1
Jan-
12
Jul-1
2
Jan-
13
Jul-1
3
Jan-
14
Jul-1
4
Jan-
15
Jul-1
5
Jan-
16
x
Avg: 14.4x
+1SD: 19.5x
-1SD: 9.4x
0
10
20
30
40
50
60
Jan-
10
Jul-1
0
Jan-
11
Jul-1
1
Jan-
12
Jul-1
2
Jan-
13
Jul-1
3
Jan-
14
Jul-1
4
Jan-
15
Jul-1
5
x
Avg: 33.8x
+1SD: 42.5x
-1SD: 25.1x
China Everbright Int'l (257 HK) – PE Chart China Everbright Int'l (257 HK) –Adjusted PE Chart
0
5
10
15
20
25
30
35
40
45
Dec
/05
Dec
/06
Dec
/07
Dec
/08
Dec
/09
Dec
/10
Dec
/11
Dec
/12
Dec
/13
Dec
/14
x
Avg: 18.3x
+1SD: 25.6x
-1SD: 11x
0
10
20
30
40
50
60
Jan-
10
Jul-1
0
Jan-
11
Jul-1
1
Jan-
12
Jul-1
2
Jan-
13
Jul-1
3
Jan-
14
Jul-1
4
Jan-
15
Jul-1
5
x
Avg: 31.2x
+1SD: 42.1x
-1SD: 20.2x
CT Environmental (1363 HK) – PE Chart Tianjin Cap (1065 HK) – PE Chart
0
5
10
15
20
25
Sep-
13
Jan-
14
Apr
-14
Aug
-14
Nov
-14
Mar
-15
Jun-
15
x
Avg: 11x
+1SD: 17.6x
-1SD: 4.4x
0
5
10
15
20
25
30
35
Jan/
10
Jul/1
0
Jan/
11
Jul/1
1
Jan/
12
Jul/1
2
Jan/
13
Jul/1
3
Jan/
14
Jul/1
4
Jan/
15
Jul/1
5
Jan/
16
x
Avg: 11.9x
+1SD: 16.5x
-1SD: 8.2x
Source: Thomson Reuters, DBS Vickers
Industry Focus
Water Sector
Page 11
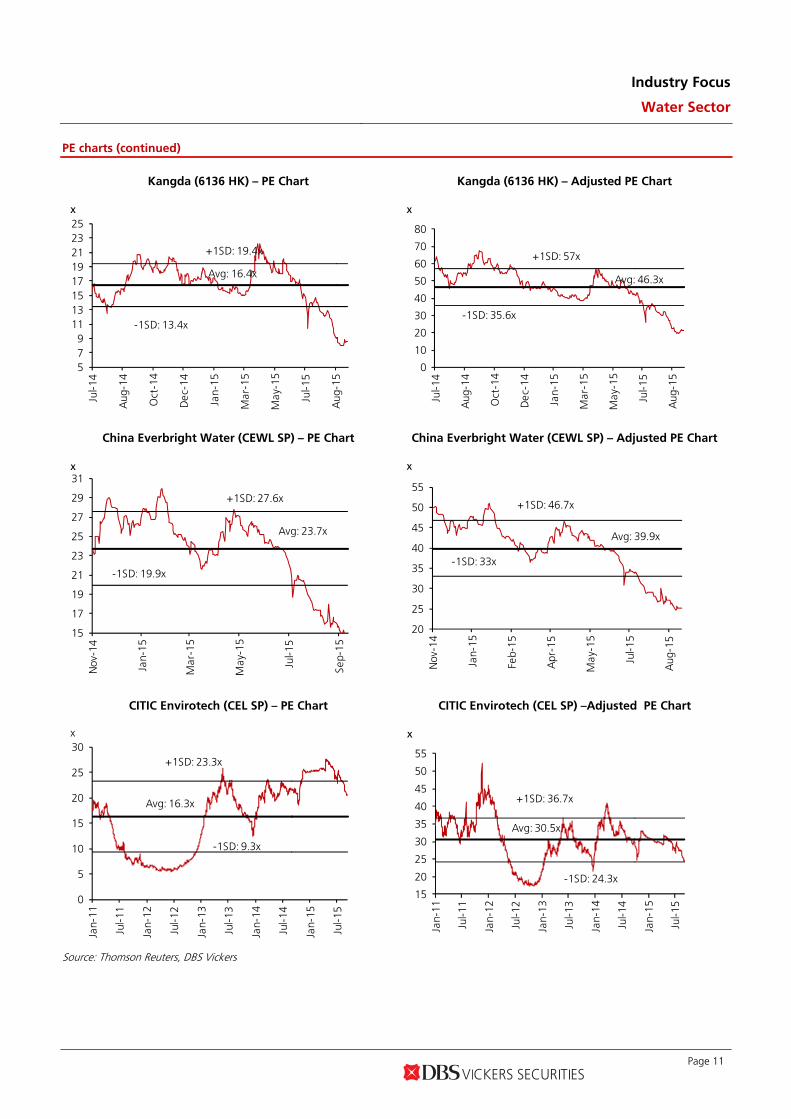
PE charts (continued)
Kangda (6136 HK) – PE Chart Kangda (6136 HK) – Adjusted PE Chart
579
1113151719212325
Jul-1
4
Aug
-14
Oct
-14
Dec
-14
Jan-
15
Mar
-15
May
-15
Jul-1
5
Aug
-15
x
Avg: 16.4x
+1SD: 19.4x
-1SD: 13.4x
0
10
20
30
40
50
60
70
80
Jul-1
4
Aug
-14
Oct
-14
Dec
-14
Jan-
15
Mar
-15
May
-15
Jul-1
5
Aug
-15
x
Avg: 46.3x
+1SD: 57x
-1SD: 35.6x
China Everbright Water (CEWL SP) – PE Chart China Everbright Water (CEWL SP) – Adjusted PE Chart
15
17
19
21
23
25
27
29
31
Nov
-14
Jan-
15
Mar
-15
May
-15
Jul-1
5
Sep-
15
x
Avg: 23.7x
+1SD: 27.6x
-1SD: 19.9x
20
25
30
35
40
45
50
55
Nov
-14
Jan-
15
Feb-
15
Apr
-15
May
-15
Jul-1
5
Aug
-15
x
Avg: 39.9x
+1SD: 46.7x
-1SD: 33x
CITIC Envirotech (CEL SP) – PE Chart CITIC Envirotech (CEL SP) –Adjusted PE Chart
0
5
10
15
20
25
30
Jan-
11
Jul-1
1
Jan-
12
Jul-1
2
Jan-
13
Jul-1
3
Jan-
14
Jul-1
4
Jan-
15
Jul-1
5
x
Avg: 16.3x
+1SD: 23.3x
-1SD: 9.3x
15
20
25
30
35
40
45
50
55
Jan-
11
Jul-1
1
Jan-
12
Jul-1
2
Jan-
13
Jul-1
3
Jan-
14
Jul-1
4
Jan-
15
Jul-1
5
x
Avg: 30.5x
+1SD: 36.7x
-1SD: 24.3x
Source: Thomson Reuters, DBS Vickers
Industry Focus
Water Sector
Page 12
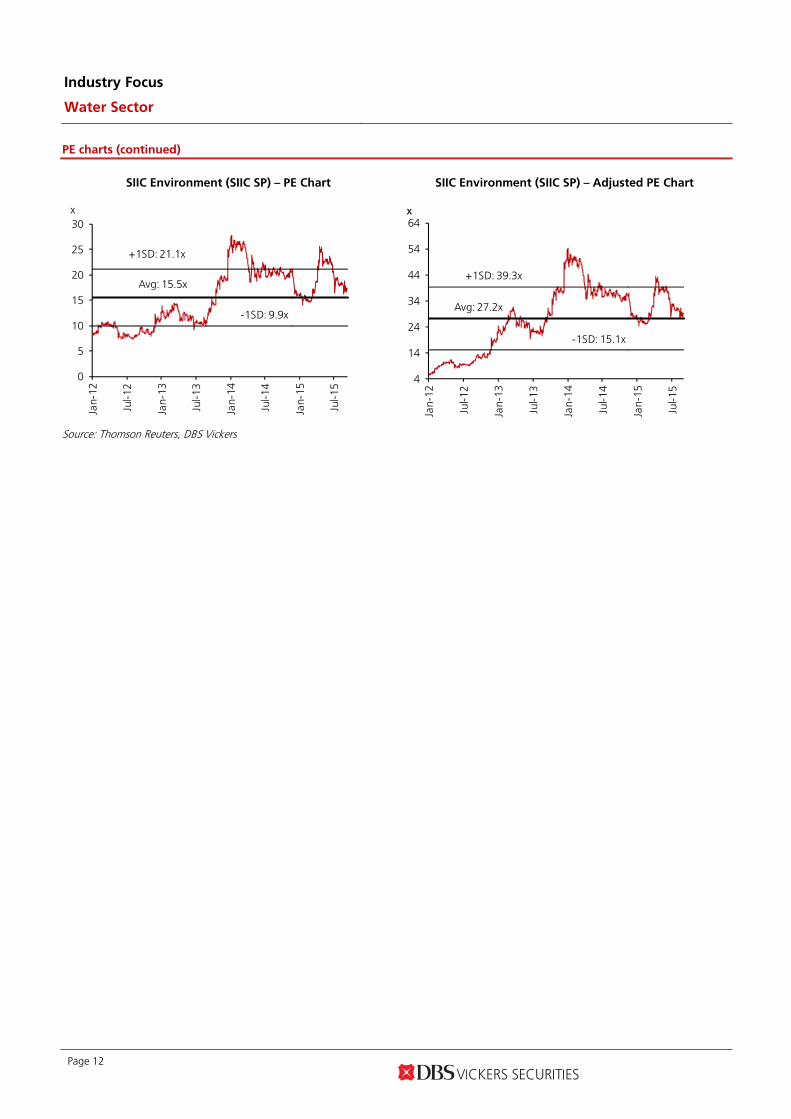
PE charts (continued)
SIIC Environment (SIIC SP) – PE Chart SIIC Environment (SIIC SP) – Adjusted PE Chart
0
5
10
15
20
25
30
Jan-
12
Jul-1
2
Jan-
13
Jul-1
3
Jan-
14
Jul-1
4
Jan-
15
Jul-1
5
x
Avg: 15.5x
+1SD: 21.1x
-1SD: 9.9x
4
14
24
34
44
54
64
Jan-
12
Jul-1
2
Jan-
13
Jul-1
3
Jan-
14
Jul-1
4
Jan-
15
Jul-1
5
x
Avg: 27.2x
+1SD: 39.3x
-1SD: 15.1x
Source: Thomson Reuters, DBS Vickers
Industry Focus
Water Sector
Page 13
STOCK PROFILES
Page 14 www.dbsvickers.com sa- DL
BUY
Last Traded Price: HK$5.64 (HSI : 21,563) Price Target: HK$ 6.50 (15% upside) (Prev. HK$6.60) Potential Catalyst: Asset injections Where we differ: We use PE (adjusted for construction revenue) to derive TP Analyst Patricia YEUNG +852 2863 8908 [email protected] Tony WU CFA [email protected] Price Relative
66
116
166
216
266
1.2
2.2
3.2
4.2
5.2
6.2
7.2
Sep-11 Sep-12 Sep-13 Sep-14 Sep-15
Relative IndexHK$
Beijing Ent Water (LHS) Relative HSI INDEX (RHS)
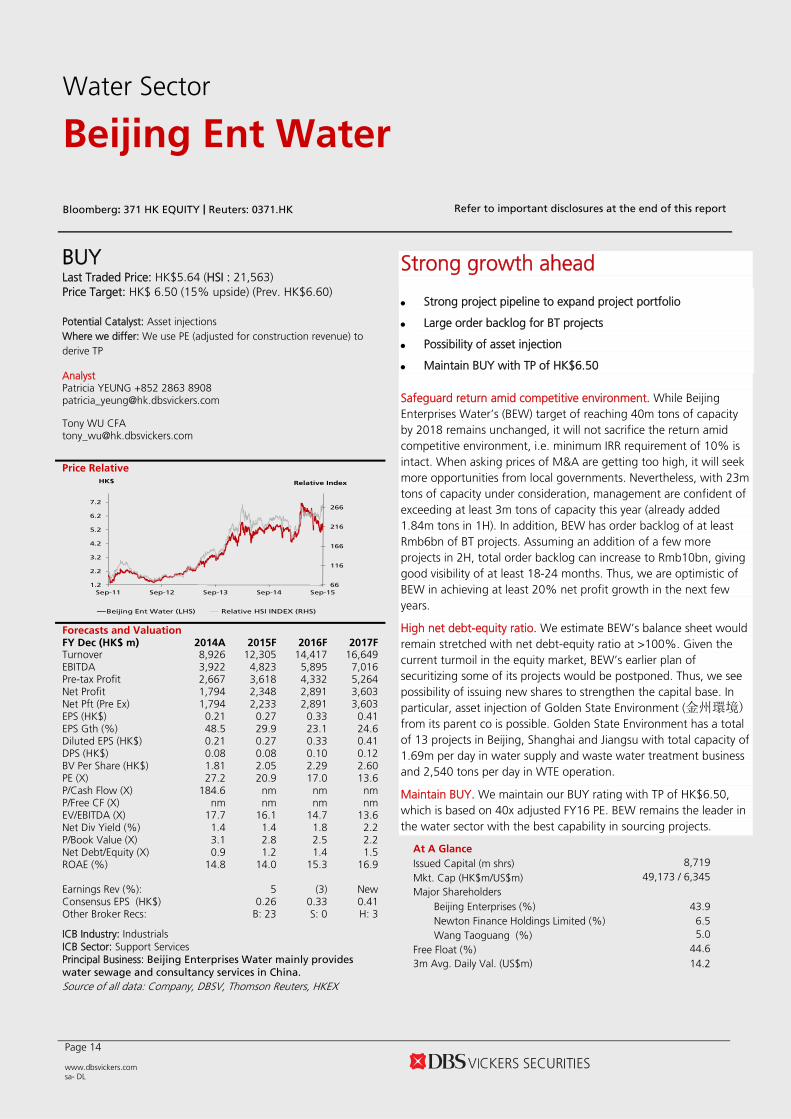
Forecasts and Valuation FY Dec (HK$ m) 2014A 2015F 2016F 2017FTurnover 8,926 12,305 14,417 16,649 EBITDA 3,922 4,823 5,895 7,016 Pre-tax Profit 2,667 3,618 4,332 5,264 Net Profit 1,794 2,348 2,891 3,603 Net Pft (Pre Ex) 1,794 2,233 2,891 3,603 EPS (HK$) 0.21 0.27 0.33 0.41 EPS Gth (%) 48.5 29.9 23.1 24.6 Diluted EPS (HK$) 0.21 0.27 0.33 0.41 DPS (HK$) 0.08 0.08 0.10 0.12 BV Per Share (HK$) 1.81 2.05 2.29 2.60 PE (X) 27.2 20.9 17.0 13.6 P/Cash Flow (X) 184.6 nm nm nm P/Free CF (X) nm nm nm nm EV/EBITDA (X) 17.7 16.1 14.7 13.6 Net Div Yield (%) 1.4 1.4 1.8 2.2 P/Book Value (X) 3.1 2.8 2.5 2.2 Net Debt/Equity (X) 0.9 1.2 1.4 1.5 ROAE (%) 14.8 14.0 15.3 16.9 Earnings Rev (%): 5 (3) New Consensus EPS (HK$) 0.26 0.33 0.41 Other Broker Recs: B: 23 S: 0 H: 3
ICB Industry: Industrials ICB Sector: Support Services Principal Business: Beijing Enterprises Water mainly provides
water sewage and consultancy services in China. Source of all data: Company, DBSV, Thomson Reuters, HKEX
Strong growth ahead
Strong project pipeline to expand project portfolio
Large order backlog for BT projects
Possibility of asset injection
Maintain BUY with TP of HK$6.50 Safeguard return amid competitive environment. While Beijing Enterprises Water’s (BEW) target of reaching 40m tons of capacity by 2018 remains unchanged, it will not sacrifice the return amid competitive environment, i.e. minimum IRR requirement of 10% is intact. When asking prices of M&A are getting too high, it will seek more opportunities from local governments. Nevertheless, with 23m tons of capacity under consideration, management are confident of exceeding at least 3m tons of capacity this year (already added 1.84m tons in 1H). In addition, BEW has order backlog of at least Rmb6bn of BT projects. Assuming an addition of a few more projects in 2H, total order backlog can increase to Rmb10bn, giving good visibility of at least 18-24 months. Thus, we are optimistic of BEW in achieving at least 20% net profit growth in the next few years.
High net debt-equity ratio. We estimate BEW’s balance sheet would remain stretched with net debt-equity ratio at >100%. Given the current turmoil in the equity market, BEW’s earlier plan of securitizing some of its projects would be postponed. Thus, we see possibility of issuing new shares to strengthen the capital base. In particular, asset injection of Golden State Environment (金州環境) from its parent co is possible. Golden State Environment has a total of 13 projects in Beijing, Shanghai and Jiangsu with total capacity of 1.69m per day in water supply and waste water treatment business and 2,540 tons per day in WTE operation.
Maintain BUY. We maintain our BUY rating with TP of HK$6.50, which is based on 40x adjusted FY16 PE. BEW remains the leader in the water sector with the best capability in sourcing projects.
At A Glance Issued Capital (m shrs) 8,719 Mkt. Cap (HK$m/US$m) 49,173 / 6,345
Major Shareholders Beijing Enterprises (%) 43.9 Newton Finance Holdings Limited (%) 6.5 Wang Taoguang (%) 5.0
Free Float (%) 44.6 3m Avg. Daily Val. (US$m) 14.2
Water Sector
Beijing Ent Water
Bloomberg: 371 HK EQUITY | Reuters: 0371.HK Refer to important disclosures at the end of this report
Water Sector
Beijing Ent Water
Page 15
Income Statement (HK$ m) Balance Sheet (HK$ m)
FY Dec 2014A 2015F 2016F 2017F FY Dec 2014A 2015F 2016F 2017F Turnover 8,926 12,305 14,417 16,649 Net Fixed Assets 1,299 1,333 1,366 1,397 Cost of Goods Sold (5,441) (7,499) (8,545) (9,549) Invts in Assocs & JVs 3,109 3,263 3,465 3,731 Gross Profit 3,485 4,806 5,872 7,100 Other LT Assets 32,155 42,976 53,690 64,272 Other Opng (Exp)/Inc (47) (340) (384) (557) Cash & ST Invts 6,091 5,482 4,934 4,440 Operating Profit 3,438 4,466 5,488 6,543 Inventory 58 80 93 108 Other Non Opg (Exp)/Inc 0 0 0 0 Debtors 8,546 9,388 10,540 11,768 Associates & JV Inc 278 153 202 267 Other Current Assets 384 529 620 716 Net Interest (Exp)/Inc (1,049) (1,116) (1,358) (1,546) Total Assets 51,641 63,050 74,708 86,432 Dividend Income 0 0 0 0 Exceptional Gain/(Loss) 0 115 0 0 ST Debt 3,945 4,695 4,460 4,237 Pre-tax Profit 2,667 3,618 4,332 5,264 Creditors 7,035 8,913 9,958 10,641 Tax (594) (796) (953) (1,158) Other Current Liab 440 440 440 440 Minority Interest (279) (474) (488) (503) LT Debt 19,546 25,686 33,825 41,836 Preference Dividend 0 0 0 0 Other LT Liabilities 1,588 1,688 1,788 1,888 Net Profit 1,794 2,348 2,891 3,603 Shareholder’s Equity 15,784 17,851 19,972 22,622 Net Profit before Except. 1,794 2,233 2,891 3,603 Minority Interests 3,304 3,778 4,267 4,770 EBITDA 3,922 4,823 5,895 7,016 Total Cap. & Liab. 51,641 63,050 74,708 86,432 Sales Gth (%) 39.3 37.9 17.2 15.5 EBITDA Gth (%) 65.4 23.0 22.2 19.0 Non-Cash Wkg. Cap 1,513 644 856 1,511 Opg Profit Gth (%) 60.5 29.9 22.9 19.2 Net Cash/(Debt) (17,400) (24,899) (33,351) (41,633) Net Profit Gth (%) 65.5 30.9 23.1 24.6 Effective Tax Rate (%) 22.3 22.0 22.0 22.0 Cash Flow Statement (HK$ m) Rates & Ratio
FY Dec 2014A 2015F 2016F 2017F FY Dec 2014A 2015F 2016F 2017F Pre-Tax Profit 2,667 3,618 4,332 5,264 Gross Margins (%) 39.0 39.1 40.7 42.6 Dep. & Amort. 206 65 67 69 Opg Profit Margin (%) 38.5 36.3 38.1 39.3 Tax Paid (277) (796) (953) (1,158) Net Profit Margin (%) 20.1 19.1 20.0 21.6 Assoc. & JV Inc/(loss) (278) (153) (202) (267) ROAE (%) 14.8 14.0 15.3 16.9 (Pft)/ Loss on disposal of FAs (177) 0 0 0 ROA (%) 4.3 4.1 4.2 4.5 Chg in Wkg.Cap. (2,732) (9,149) (10,224) (11,134) ROCE (%) 7.7 7.1 7.3 7.7 Other Operating CF 855 1,254 1,496 1,684 Div Payout Ratio (%) 37.8 30.0 30.0 30.0 Net Operating CF 264 (5,161) (5,484) (5,542) Net Interest Cover (x) 3.3 4.0 4.0 4.2 Capital Exp.(net) (691) (100) (100) (100) Asset Turnover (x) 0.2 0.2 0.2 0.2 Other Invts.(net) 1 0 0 0 Debtors Turn (avg days) 342.3 266.0 252.3 244.5 Invts in Assoc. & JV 169 0 0 0 Creditors Turn (avg days) 461.0 398.9 412.9 379.7 Div from Assoc & JV 0 0 0 0 Inventory Turn (avg days) 3.1 3.4 3.8 3.8 Other Investing CF (1,213) (840) (740) (140) Current Ratio (x) 1.3 1.1 1.1 1.1 Net Investing CF (1,734) (940) (840) (240) Quick Ratio (x) 1.3 1.1 1.0 1.1 Div Paid (346) (282) (770) (953) Net Debt/Equity (X) 0.9 1.2 1.4 1.5 Chg in Gross Debt 3,344 6,890 7,904 7,788 Capex to Debt (%) 2.9 0.3 0.3 0.2 Capital Issues 0 0 0 0 Z-Score (X) 1.5 1.3 1.2 1.2 Other Financing CF (848) (1,116) (1,358) (1,546) N.Cash/(Debt)PS (HK$) (2.00) (2.86) (3.83) (4.78) Net Financing CF 2,150 5,492 5,776 5,289 Opg CFPS (HK$) 0.35 0.46 0.54 0.64 Currency Adjustments (102) 0 0 0 Free CFPS (HK$) (0.05) (0.60) (0.64) (0.65) Chg in Cash 578 (609) (548) (493)
Interim Income Statement (HK$ m) Segmental Breakdown (HK$ m) / Key Assumptions
FY Dec 2H2013 1H2014 2H2014 1H2015 FY Dec 2014A 2015F 2016F 2017F Turnover 3,643 3,816 5,110 5,764 Revenues (HK$ m) Cost of Goods Sold (2,242) (2,220) (3,210) (3,507) Sewage treatment & 7,833 10,992 12,833 14,799 Gross Profit 1,401 1,596 1,900 2,257 Water supply 590 704 877 1,050 Other Oper. (Exp)/Inc (521) (349) (120) (339) Sewage technical 281 365 438 504 Operating Profit 880 1,247 1,781 1,918 Others 223 245 269 296 Other Non Opg (Exp)/Inc 0 0 0 0 Associates & JV Inc 113 84 195 59 Total 8,926 12,305 14,417 16,649 Net Interest (Exp)/Inc (446) (519) (565) (553) Operating profit (HK$ m) Exceptional Gain/(Loss) N/A N/A N/A N/A Sewage treatment & 3,034 4,084 4,860 5,795 Pre-tax Profit 547 812 1,410 1,424 Water supply 322 385 478 576 Tax (195) (191) (403) (352) Sewage technical 157 243 295 339 Minority Interest (45) (83) (196) (225) Others 0 0 0 0 Net Profit 570 714 1,080 1,160 Net profit bef Except. 307 538 811 847 Total 3,513 4,712 5,632 6,710 Operating profit Margins (%) Sewage treatment & 38.7 37.2 37.9 39.2 Sales Gth (%) 56.6 38.1 40.3 51.1 Water supply 54.6 54.7 54.5 54.8 Opg Profit Gth (%) 52.0 44.5 102.3 53.8 Sewage technical 55.9 66.5 67.3 67.3 Net Profit Gth (%) 56.6 38.8 89.6 62.5 Others 0.0 0.0 0.0 0.0 Gross Margins (%) 38.5 41.8 37.2 39.2 Total 39.4 38.3 39.1 40.3 Opg Profit Margins (%) 24.2 32.7 34.8 33.3 Key Assumptions Net Profit Margins (%) 15.6 18.7 21.1 20.1 Annual treated sewage (m
tons) 2,369.0 2,910.4 3,704.3 4,704.0
Average tariff (HK$/ton) 1.3 1.3 1.3 1.3 Source: Company, DBS Vickers
Page 16 www.dbsvickers.com sa- AH
BUY
Last Traded Price: HK$10.62 (HSI : 21,563) Price Target: HK$13.80 (30% upside) (Prev HK$14.30) Potential Catalyst: Stronger-than-expected project wins Where we differ: We use PE (ajdusted for construction revenue) to derive TP Analyst Patricia YEUNG +852 2863 8908 [email protected] Tony WU CFA [email protected] Price Relative
63
113
163
213
263
313
363
413
463
1.4
3.4
5.4
7.4
9.4
11.4
13.4
15.4
Sep-11 Sep-12 Sep-13 Sep-14 Sep-15
Relative IndexHK$
China Everbright Intl (LHS) Relative HSI INDEX (RHS)
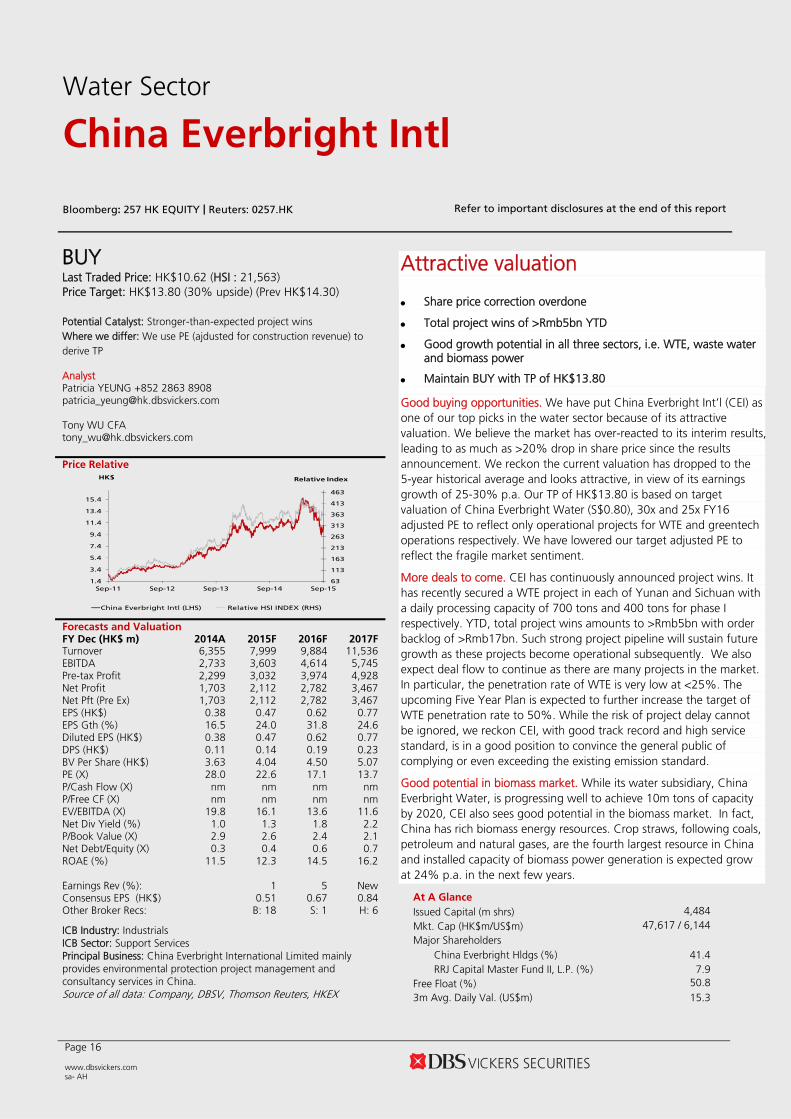
Forecasts and Valuation FY Dec (HK$ m) 2014A 2015F 2016F 2017FTurnover 6,355 7,999 9,884 11,536 EBITDA 2,733 3,603 4,614 5,745 Pre-tax Profit 2,299 3,032 3,974 4,928 Net Profit 1,703 2,112 2,782 3,467 Net Pft (Pre Ex) 1,703 2,112 2,782 3,467 EPS (HK$) 0.38 0.47 0.62 0.77 EPS Gth (%) 16.5 24.0 31.8 24.6 Diluted EPS (HK$) 0.38 0.47 0.62 0.77 DPS (HK$) 0.11 0.14 0.19 0.23 BV Per Share (HK$) 3.63 4.04 4.50 5.07 PE (X) 28.0 22.6 17.1 13.7 P/Cash Flow (X) nm nm nm nm P/Free CF (X) nm nm nm nm EV/EBITDA (X) 19.8 16.1 13.6 11.6 Net Div Yield (%) 1.0 1.3 1.8 2.2 P/Book Value (X) 2.9 2.6 2.4 2.1 Net Debt/Equity (X) 0.3 0.4 0.6 0.7 ROAE (%) 11.5 12.3 14.5 16.2 Earnings Rev (%): 1 5 New Consensus EPS (HK$) 0.51 0.67 0.84 Other Broker Recs: B: 18 S: 1 H: 6
ICB Industry: Industrials ICB Sector: Support Services Principal Business: China Everbright International Limited mainly provides environmental protection project management and consultancy services in China. Source of all data: Company, DBSV, Thomson Reuters, HKEX
Attractive valuation
Share price correction overdone
Total project wins of >Rmb5bn YTD
Good growth potential in all three sectors, i.e. WTE, waste water and biomass power
Maintain BUY with TP of HK$13.80
Good buying opportunities. We have put China Everbright Int’l (CEI) as one of our top picks in the water sector because of its attractive valuation. We believe the market has over-reacted to its interim results, leading to as much as >20% drop in share price since the results announcement. We reckon the current valuation has dropped to the 5-year historical average and looks attractive, in view of its earnings growth of 25-30% p.a. Our TP of HK$13.80 is based on target valuation of China Everbright Water (S$0.80), 30x and 25x FY16 adjusted PE to reflect only operational projects for WTE and greentech operations respectively. We have lowered our target adjusted PE to reflect the fragile market sentiment.
More deals to come. CEI has continuously announced project wins. It has recently secured a WTE project in each of Yunan and Sichuan with a daily processing capacity of 700 tons and 400 tons for phase I respectively. YTD, total project wins amounts to >Rmb5bn with order backlog of >Rmb17bn. Such strong project pipeline will sustain future growth as these projects become operational subsequently. We also expect deal flow to continue as there are many projects in the market. In particular, the penetration rate of WTE is very low at <25%. The upcoming Five Year Plan is expected to further increase the target of WTE penetration rate to 50%. While the risk of project delay cannot be ignored, we reckon CEI, with good track record and high service standard, is in a good position to convince the general public of complying or even exceeding the existing emission standard.
Good potential in biomass market. While its water subsidiary, China Everbright Water, is progressing well to achieve 10m tons of capacity by 2020, CEI also sees good potential in the biomass market. In fact, China has rich biomass energy resources. Crop straws, following coals, petroleum and natural gases, are the fourth largest resource in China and installed capacity of biomass power generation is expected grow at 24% p.a. in the next few years.
At A Glance Issued Capital (m shrs) 4,484 Mkt. Cap (HK$m/US$m) 47,617 / 6,144
Major Shareholders China Everbright Hldgs (%) 41.4 RRJ Capital Master Fund II, L.P. (%) 7.9
Free Float (%) 50.8 3m Avg. Daily Val. (US$m) 15.3
Water Sector
China Everbright Intl
Bloomberg: 257 HK EQUITY | Reuters: 0257.HK Refer to important disclosures at the end of this report

Water Sector
China Everbright Intl
Page 17
Income Statement (HK$ m) Balance Sheet (HK$ m)
FY Dec 2014A 2015F 2016F 2017F FY Dec 2014A 2015F 2016F 2017F Turnover 6,355 7,999 9,884 11,536 Net Fixed Assets 1,720 1,928 2,073 2,202 Cost of Goods Sold (3,387) (4,195) (4,931) (5,373) Invts in Assocs & JVs 282 281 280 281 Gross Profit 2,969 3,804 4,953 6,163 Other LT Assets 20,712 26,874 33,643 40,379 Other Opng (Exp)/Inc (351) (327) (479) (575) Cash & ST Invts 4,094 2,800 2,471 2,307 Operating Profit 2,618 3,476 4,474 5,588 Inventory 118 160 198 231 Other Non Opg (Exp)/Inc 0 0 0 0 Debtors 3,220 3,804 4,262 4,498 Associates & JV Inc (1) (1) (1) 1 Other Current Assets 1,056 240 297 346 Net Interest (Exp)/Inc (318) (444) (500) (661) Total Assets 31,200 36,087 43,223 50,243 Dividend Income 0 0 0 0 Exceptional Gain/(Loss) 0 0 0 0 ST Debt 2,611 2,661 2,695 2,995 Pre-tax Profit 2,299 3,032 3,974 4,928 Creditors 2,318 2,918 3,606 4,208 Tax (534) (712) (934) (1,158) Other Current Liab 68 68 68 68 Minority Interest (62) (208) (257) (303) LT Debt 6,525 8,697 12,785 16,050 Preference Dividend 0 0 0 0 Other LT Liabilities 1,834 1,834 1,834 1,834 Net Profit 1,703 2,112 2,782 3,467 Shareholder’s Equity 16,263 18,121 20,190 22,740 Net Profit before Except. 1,703 2,112 2,782 3,467 Minority Interests 1,580 1,787 2,045 2,347 EBITDA 2,733 3,603 4,614 5,745 Total Cap. & Liab. 31,200 36,087 43,223 50,243 Sales Gth (%) 19.5 25.9 23.6 16.7 EBITDA Gth (%) 24.8 31.8 28.1 24.5 Non-Cash Wkg. Cap 2,007 1,219 1,083 799 Opg Profit Gth (%) 24.7 32.8 28.7 24.9 Net Cash/(Debt) (5,042) (8,559) (13,010) (16,738) Net Profit Gth (%) 28.6 24.0 31.8 24.6 Effective Tax Rate (%) 23.2 23.5 23.5 23.5 Cash Flow Statement (HK$ m) Rates & Ratio
FY Dec 2014A 2015F 2016F 2017F FY Dec 2014A 2015F 2016F 2017F Pre-Tax Profit 2,299 3,032 3,974 4,928 Gross Margins (%) 46.7 47.6 50.1 53.4 Dep. & Amort. 116 127 141 157 Opg Profit Margin (%) 41.2 43.5 45.3 48.4 Tax Paid (188) (712) (934) (1,158) Net Profit Margin (%) 26.8 26.4 28.2 30.1 Assoc. & JV Inc/(loss) 1 1 1 (1) ROAE (%) 11.5 12.3 14.5 16.2 (Pft)/ Loss on disposal of FAs 0 0 0 0 ROA (%) 6.2 6.3 7.0 7.4 Chg in Wkg.Cap. (2,676) (5,410) (6,669) (6,488) ROCE (%) 8.0 8.6 9.4 10.0 Other Operating CF 326 444 500 661 Div Payout Ratio (%) 29.0 30.0 30.0 30.0 Net Operating CF (123) (2,519) (2,987) (1,901) Net Interest Cover (x) 8.2 7.8 9.0 8.5 Capital Exp.(net) (1,086) (300) (250) (250) Asset Turnover (x) 0.2 0.2 0.2 0.2 Other Invts.(net) 0 0 0 0 Debtors Turn (avg days) 160.1 160.3 148.9 138.6 Invts in Assoc. & JV (28) 0 0 0 Creditors Turn (avg days) 226.1 234.9 248.5 273.4 Div from Assoc & JV 0 0 0 0 Inventory Turn (avg days) 10.8 12.4 13.6 15.0 Other Investing CF 675 0 0 0 Current Ratio (x) 1.7 1.2 1.1 1.0 Net Investing CF (439) (300) (250) (250) Quick Ratio (x) 1.5 1.2 1.1 0.9 Div Paid (448) (253) (714) (917) Net Debt/Equity (X) 0.3 0.4 0.6 0.7 Chg in Gross Debt 1,187 2,222 4,122 3,565 Capex to Debt (%) 11.9 2.6 1.6 1.3 Capital Issues 0 0 0 0 Z-Score (X) 3.3 2.8 2.3 2.1 Other Financing CF (456) (444) (500) (661) N.Cash/(Debt)PS (HK$) (1.12) (1.91) (2.90) (3.73) Net Financing CF 283 1,524 2,909 1,987 Opg CFPS (HK$) 0.57 0.64 0.82 1.02 Currency Adjustments (53) 0 0 0 Free CFPS (HK$) (0.27) (0.63) (0.72) (0.48) Chg in Cash (332) (1,295) (329) (164)
Interim Income Statement (HK$ m) Segmental Breakdown (HK$ m) / Key Assumptions
FY Dec 2H2013 1H2014 2H2014 1H2015 FY Dec 2014A 2015F 2016F 2017F Turnover 2,853 2,944 3,411 3,772 Revenues (HK$ m) Cost of Goods Sold (1,624) (1,592) (1,794) (1,972) Environmental Energy 4,652 5,487 6,197 6,968 Gross Profit 1,230 1,352 1,617 1,800 Environmental Water 1,051 1,809 2,549 3,132 Other Oper. (Exp)/Inc (136) (101) (187) (106) Greentech 644 697 1,133 1,431 Operating Profit 1,094 1,250 1,430 1,694 Others 8 5 5 5 Other Non Opg (Exp)/Inc 0 0 0 0 Total 6,355 7,999 9,884 11,536 Associates & JV Inc 0 0 (1) 0 Net Interest (Exp)/Inc (166) (171) (210) (224) Segmental profit (HK$ m) Exceptional Gain/(Loss) 0 0 0 0 Environmental Energy 2,152 2,236 2,674 3,321 Pre-tax Profit 928 1,080 1,219 1,470 Environmental Water 571 857 1,205 1,471 Tax (229) (243) (291) (367) Greentech 260 316 585 801 Minority Interest (24) (35) (27) (103) Total 2,987 3,413 4,469 5,598 Net Profit 675 802 901 1,000 Net profit bef Except. 675 802 901 1,000 Segmental profit Margins (%) Environmental Energy 46.3 40.7 43.1 47.7 Environmental Water 54.3 47.4 47.3 47.0 Sales Gth (%) 41.1 19.3 19.6 28.1 Greentech 40.3 45.3 51.6 56.0 Opg Profit Gth (%) 31.0 20.9 30.8 35.5 Total 47.0 42.7 45.2 48.5 Net Profit Gth (%) 30.2 23.3 33.6 24.7 Gross Margins (%) 43.1 45.9 47.4 47.7 Key Assumptions Opg Profit Margins (%) 38.3 42.5 41.9 44.9 Volume of treated sewage (m tons) 584.8 903.3 1,165.6 1,479.5 Net Profit Margins (%) 23.6 27.2 26.4 26.5 Volume of waste processed ('000 tons) 5.4 6.8 8.5 11.1 Amount of uploaded electricity (m kWH) 1,654.5 2,150.9 2,796.1 3,774.7 Source: Company, DBS Vickers
Page 18 www.dbsvickers.com sa- AH
BUY
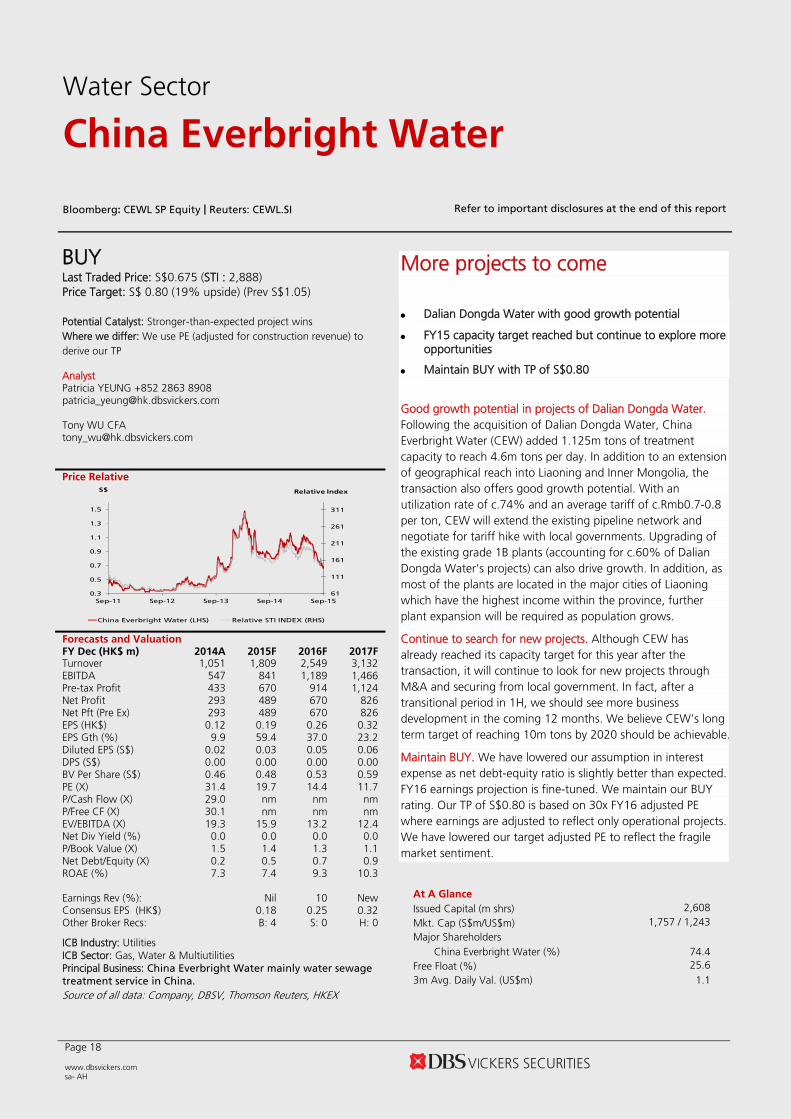
Last Traded Price: S$0.675 (STI : 2,888) Price Target: S$ 0.80 (19% upside) (Prev S$1.05) Potential Catalyst: Stronger-than-expected project wins Where we differ: We use PE (adjusted for construction revenue) to derive our TP Analyst Patricia YEUNG +852 2863 8908 [email protected] Tony WU CFA [email protected] Price Relative
61
111
161
211
261
311
0.3
0.5
0.7
0.9
1.1
1.3
1.5
Sep-11 Sep-12 Sep-13 Sep-14 Sep-15
Relative IndexS$
China Everbright Water (LHS) Relative STI INDEX (RHS)
Forecasts and Valuation FY Dec (HK$ m) 2014A 2015F 2016F 2017FTurnover 1,051 1,809 2,549 3,132 EBITDA 547 841 1,189 1,466 Pre-tax Profit 433 670 914 1,124 Net Profit 293 489 670 826 Net Pft (Pre Ex) 293 489 670 826 EPS (HK$) 0.12 0.19 0.26 0.32 EPS Gth (%) 9.9 59.4 37.0 23.2 Diluted EPS (S$) 0.02 0.03 0.05 0.06 DPS (S$) 0.00 0.00 0.00 0.00 BV Per Share (S$) 0.46 0.48 0.53 0.59 PE (X) 31.4 19.7 14.4 11.7 P/Cash Flow (X) 29.0 nm nm nm P/Free CF (X) 30.1 nm nm nm EV/EBITDA (X) 19.3 15.9 13.2 12.4 Net Div Yield (%) 0.0 0.0 0.0 0.0 P/Book Value (X) 1.5 1.4 1.3 1.1 Net Debt/Equity (X) 0.2 0.5 0.7 0.9 ROAE (%) 7.3 7.4 9.3 10.3 Earnings Rev (%): Nil 10 New Consensus EPS (HK$) 0.18 0.25 0.32 Other Broker Recs: B: 4 S: 0 H: 0
ICB Industry: Utilities ICB Sector: Gas, Water & Multiutilities Principal Business: China Everbright Water mainly water sewage
treatment service in China. Source of all data: Company, DBSV, Thomson Reuters, HKEX
More projects to come Dalian Dongda Water with good growth potential
FY15 capacity target reached but continue to explore more opportunities
Maintain BUY with TP of S$0.80
Good growth potential in projects of Dalian Dongda Water. Following the acquisition of Dalian Dongda Water, China Everbright Water (CEW) added 1.125m tons of treatment capacity to reach 4.6m tons per day. In addition to an extension of geographical reach into Liaoning and Inner Mongolia, the transaction also offers good growth potential. With an utilization rate of c.74% and an average tariff of c.Rmb0.7-0.8 per ton, CEW will extend the existing pipeline network and negotiate for tariff hike with local governments. Upgrading of the existing grade 1B plants (accounting for c.60% of Dalian Dongda Water’s projects) can also drive growth. In addition, as most of the plants are located in the major cities of Liaoning which have the highest income within the province, further plant expansion will be required as population grows.
Continue to search for new projects. Although CEW has already reached its capacity target for this year after the transaction, it will continue to look for new projects through M&A and securing from local government. In fact, after a transitional period in 1H, we should see more business development in the coming 12 months. We believe CEW’s long term target of reaching 10m tons by 2020 should be achievable.
Maintain BUY. We have lowered our assumption in interest expense as net debt-equity ratio is slightly better than expected. FY16 earnings projection is fine-tuned. We maintain our BUY rating. Our TP of S$0.80 is based on 30x FY16 adjusted PE where earnings are adjusted to reflect only operational projects. We have lowered our target adjusted PE to reflect the fragile market sentiment.
At A Glance Issued Capital (m shrs) 2,608 Mkt. Cap (S$m/US$m) 1,757 / 1,243
Major Shareholders China Everbright Water (%) 74.4
Free Float (%) 25.6 3m Avg. Daily Val. (US$m) 1.1
Water Sector
China Everbright Water
Bloomberg: CEWL SP Equity | Reuters: CEWL.SI Refer to important disclosures at the end of this report

Water Sector
China Everbright Water
Page 19
Income Statement (HK$ m) Balance Sheet (HK$ m)
FY Dec 2014A 2015F 2016F 2017F FY Dec 2014A 2015F 2016F 2017F Turnover 1,051 1,809 2,549 3,132 Net Fixed Assets 174 458 690 919 Cost of Goods Sold (463) (835) (1,183) (1,465) Invts in Assocs & JVs 0 0 0 0 Gross Profit 587 974 1,367 1,667 Other LT Assets 8,229 10,795 13,447 16,309 Other Opng (Exp)/Inc (64) (160) (206) (232) Cash & ST Invts 681 633 637 783 Operating Profit 523 814 1,160 1,435 Inventory 29 36 51 63 Other Non Opg (Exp)/Inc 0 0 0 0 Debtors 999 1,411 1,994 2,493 Associates & JV Inc 0 0 0 0 Other Current Assets 0 54 76 94 Net Interest (Exp)/Inc (90) (145) (247) (311) Total Assets 10,112 13,388 16,895 20,660 Dividend Income 0 0 0 0 Exceptional Gain/(Loss) 0 0 0 0 ST Debt 763 813 847 1,147 Pre-tax Profit 433 670 914 1,124 Creditors 600 1,033 1,455 1,788 Tax (119) (167) (228) (281) Other Current Liab 43 60 76 89 Minority Interest (21) (13) (15) (17) LT Debt 1,062 3,336 5,572 7,849 Preference Dividend 0 0 0 0 Other LT Liabilities 1,093 1,093 1,093 1,093 Net Profit 293 489 670 826 Shareholder’s Equity 6,325 6,815 7,598 8,424 Net Profit before Except. 293 489 670 826 Minority Interests 226 239 254 271 EBITDA 547 841 1,189 1,466 Total Cap. & Liab. 10,112 13,388 16,895 20,660 Sales Gth (%) (18.6) 72.2 40.9 22.8 EBITDA Gth (%) 11.5 53.6 41.4 23.3 Non-Cash Wkg. Cap 385 409 590 773 Opg Profit Gth (%) 10.4 55.7 42.5 23.7 Net Cash/(Debt) (1,143) (3,516) (5,782) (8,213) Net Profit Gth (%) 9.9 67.1 37.0 23.2 Effective Tax Rate (%) 27.5 25.0 25.0 25.0 Cash Flow Statement (HK$ m) Rates & Ratio
FY Dec 2014A 2015F 2016F 2017F FY Dec 2014A 2015F 2016F 2017F Pre-Tax Profit 433 670 914 1,124 Gross Margins (%) 55.9 53.9 53.6 53.2 Dep. & Amort. 17 26 29 31 Opg Profit Margin (%) 49.8 45.0 45.5 45.8 Tax Paid (65) (167) (228) (281) Net Profit Margin (%) 27.9 27.0 26.3 26.4 Assoc. & JV Inc/(loss) 0 0 0 0 ROAE (%) 7.3 7.4 9.3 10.3 (Pft)/ Loss on disposal of FAs 5 0 0 0 ROA (%) 3.8 4.2 4.4 4.4 Chg in Wkg.Cap. (173) (2,601) (2,843) (3,055) ROCE (%) 5.3 5.6 6.3 6.3 Other Operating CF 100 145 247 311 Div Payout Ratio (%) 0.0 0.0 0.0 0.0 Net Operating CF 317 (1,928) (1,883) (1,870) Net Interest Cover (x) 5.8 5.6 4.7 4.6 Capital Exp.(net) (11) (300) (250) (250) Asset Turnover (x) 0.1 0.2 0.2 0.2 Other Invts.(net) 0 0 0 0 Debtors Turn (avg days) 299.2 243.0 243.7 261.5 Invts in Assoc. & JV 0 0 0 0 Creditors Turn (avg days) 506.9 368.4 393.4 412.9 Div from Assoc & JV 0 0 0 0 Inventory Turn (avg days) 15.0 14.7 13.8 14.5 Other Investing CF 441 0 0 0 Current Ratio (x) 1.2 1.1 1.2 1.1 Net Investing CF 430 (300) (250) (250) Quick Ratio (x) 1.2 1.1 1.1 1.1 Div Paid 0 0 0 0 Net Debt/Equity (X) 0.2 0.5 0.7 0.9 Chg in Gross Debt (149) 2,325 2,270 2,577 Capex to Debt (%) 0.6 7.2 3.9 2.8 Capital Issues 0 0 113 0 Z-Score (X) N/A N/A N/A N/A Other Financing CF (201) (145) (247) (311) N.Cash/(Debt)PS (HK$) (0.08) (0.25) (0.40) (0.57) Net Financing CF (350) 2,180 2,137 2,265 Opg CFPS (HK$) 0.20 0.26 0.37 0.45 Currency Adjustments (6) 0 0 0 Free CFPS (HK$) 0.12 (0.85) (0.82) (0.81) Chg in Cash 391 (48) 4 146
Segmental Breakdown (HK$ m) / Key Assumptions
FY Dec 2014A 2015F 2016F 2017F Revenues (HK$ m) Construction services 107 531 877 1,063 Operation services 625 814 1,071 1,387 Finance income 311 456 593 673 Others 9 9 9 9 Total 1,051 1,809 2,549 3,132 Key Assumptions Total operating capacity (m tons) 3.5 4.5 5.7 Volume of waste water treated (m tons) 903.3 1,165.6 1,479.5 Treatment tariff (Rmb/ton) 1.3 1.3 1.4 Source: Company, DBS Vickers
Page 20 www.dbsvickers.com sa- AH
BUY
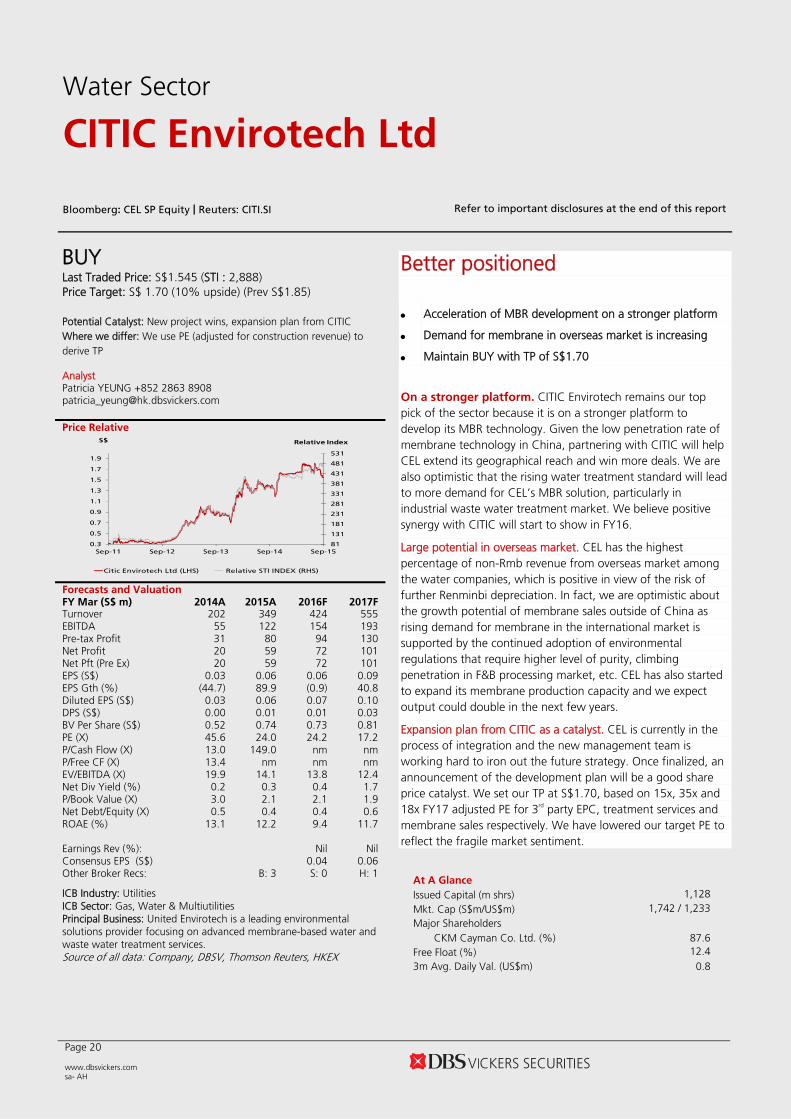
Last Traded Price: S$1.545 (STI : 2,888) Price Target: S$ 1.70 (10% upside) (Prev S$1.85) Potential Catalyst: New project wins, expansion plan from CITIC Where we differ: We use PE (adjusted for construction revenue) to derive TP Analyst Patricia YEUNG +852 2863 8908 [email protected] Price Relative
81
131
181
231
281
331
381
431
481
531
0.3
0.5
0.7
0.9
1.1
1.3
1.5
1.7
1.9
Sep-11 Sep-12 Sep-13 Sep-14 Sep-15
Relative IndexS$
Citic Envirotech Ltd (LHS) Relative STI INDEX (RHS)
Forecasts and Valuation FY Mar (S$ m) 2014A 2015A 2016F 2017FTurnover 202 349 424 555 EBITDA 55 122 154 193 Pre-tax Profit 31 80 94 130 Net Profit 20 59 72 101 Net Pft (Pre Ex) 20 59 72 101 EPS (S$) 0.03 0.06 0.06 0.09 EPS Gth (%) (44.7) 89.9 (0.9) 40.8 Diluted EPS (S$) 0.03 0.06 0.07 0.10 DPS (S$) 0.00 0.01 0.01 0.03 BV Per Share (S$) 0.52 0.74 0.73 0.81 PE (X) 45.6 24.0 24.2 17.2 P/Cash Flow (X) 13.0 149.0 nm nm P/Free CF (X) 13.4 nm nm nm EV/EBITDA (X) 19.9 14.1 13.8 12.4 Net Div Yield (%) 0.2 0.3 0.4 1.7 P/Book Value (X) 3.0 2.1 2.1 1.9 Net Debt/Equity (X) 0.5 0.4 0.4 0.6 ROAE (%) 13.1 12.2 9.4 11.7 Earnings Rev (%): Nil Nil Consensus EPS (S$) 0.04 0.06 Other Broker Recs: B: 3 S: 0 H: 1
ICB Industry: Utilities ICB Sector: Gas, Water & Multiutilities Principal Business: United Envirotech is a leading environmental solutions provider focusing on advanced membrane-based water and waste water treatment services. Source of all data: Company, DBSV, Thomson Reuters, HKEX
Better positioned • Acceleration of MBR development on a stronger platform
• Demand for membrane in overseas market is increasing
• Maintain BUY with TP of S$1.70
On a stronger platform. CITIC Envirotech remains our top pick of the sector because it is on a stronger platform to develop its MBR technology. Given the low penetration rate of membrane technology in China, partnering with CITIC will help CEL extend its geographical reach and win more deals. We are also optimistic that the rising water treatment standard will lead to more demand for CEL’s MBR solution, particularly in industrial waste water treatment market. We believe positive synergy with CITIC will start to show in FY16.
Large potential in overseas market. CEL has the highest percentage of non-Rmb revenue from overseas market among the water companies, which is positive in view of the risk of further Renminbi depreciation. In fact, we are optimistic about the growth potential of membrane sales outside of China as rising demand for membrane in the international market is supported by the continued adoption of environmental regulations that require higher level of purity, climbing penetration in F&B processing market, etc. CEL has also started to expand its membrane production capacity and we expect output could double in the next few years.
Expansion plan from CITIC as a catalyst. CEL is currently in the process of integration and the new management team is working hard to iron out the future strategy. Once finalized, an announcement of the development plan will be a good share price catalyst. We set our TP at S$1.70, based on 15x, 35x and 18x FY17 adjusted PE for 3rd party EPC, treatment services and membrane sales respectively. We have lowered our target PE to reflect the fragile market sentiment.
At A Glance Issued Capital (m shrs) 1,128 Mkt. Cap (S$m/US$m) 1,742 / 1,233
Major Shareholders CKM Cayman Co. Ltd. (%) 87.6
Free Float (%) 12.4 3m Avg. Daily Val. (US$m) 0.8
Water Sector
CITIC Envirotech Ltd
Bloomberg: CEL SP Equity | Reuters: CITI.SI Refer to important disclosures at the end of this report
Water Sector
CITIC Envirotech Ltd
Page 21
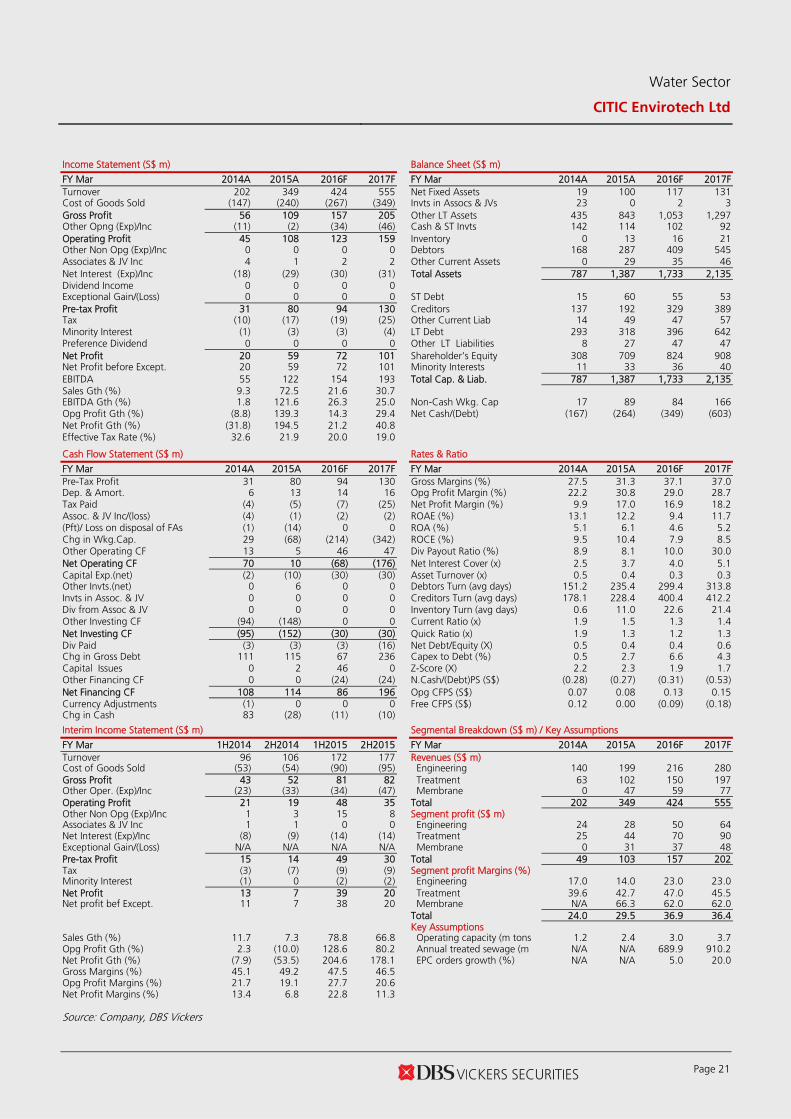
Income Statement (S$ m) Balance Sheet (S$ m)
FY Mar 2014A 2015A 2016F 2017F FY Mar 2014A 2015A 2016F 2017F Turnover 202 349 424 555 Net Fixed Assets 19 100 117 131 Cost of Goods Sold (147) (240) (267) (349) Invts in Assocs & JVs 23 0 2 3 Gross Profit 56 109 157 205 Other LT Assets 435 843 1,053 1,297 Other Opng (Exp)/Inc (11) (2) (34) (46) Cash & ST Invts 142 114 102 92 Operating Profit 45 108 123 159 Inventory 0 13 16 21 Other Non Opg (Exp)/Inc 0 0 0 0 Debtors 168 287 409 545 Associates & JV Inc 4 1 2 2 Other Current Assets 0 29 35 46 Net Interest (Exp)/Inc (18) (29) (30) (31) Total Assets 787 1,387 1,733 2,135 Dividend Income 0 0 0 0 Exceptional Gain/(Loss) 0 0 0 0 ST Debt 15 60 55 53 Pre-tax Profit 31 80 94 130 Creditors 137 192 329 389 Tax (10) (17) (19) (25) Other Current Liab 14 49 47 57 Minority Interest (1) (3) (3) (4) LT Debt 293 318 396 642 Preference Dividend 0 0 0 0 Other LT Liabilities 8 27 47 47 Net Profit 20 59 72 101 Shareholder’s Equity 308 709 824 908 Net Profit before Except. 20 59 72 101 Minority Interests 11 33 36 40 EBITDA 55 122 154 193 Total Cap. & Liab. 787 1,387 1,733 2,135 Sales Gth (%) 9.3 72.5 21.6 30.7 EBITDA Gth (%) 1.8 121.6 26.3 25.0 Non-Cash Wkg. Cap 17 89 84 166 Opg Profit Gth (%) (8.8) 139.3 14.3 29.4 Net Cash/(Debt) (167) (264) (349) (603) Net Profit Gth (%) (31.8) 194.5 21.2 40.8 Effective Tax Rate (%) 32.6 21.9 20.0 19.0 Cash Flow Statement (S$ m) Rates & Ratio
FY Mar 2014A 2015A 2016F 2017F FY Mar 2014A 2015A 2016F 2017F Pre-Tax Profit 31 80 94 130 Gross Margins (%) 27.5 31.3 37.1 37.0 Dep. & Amort. 6 13 14 16 Opg Profit Margin (%) 22.2 30.8 29.0 28.7 Tax Paid (4) (5) (7) (25) Net Profit Margin (%) 9.9 17.0 16.9 18.2 Assoc. & JV Inc/(loss) (4) (1) (2) (2) ROAE (%) 13.1 12.2 9.4 11.7 (Pft)/ Loss on disposal of FAs (1) (14) 0 0 ROA (%) 5.1 6.1 4.6 5.2 Chg in Wkg.Cap. 29 (68) (214) (342) ROCE (%) 9.5 10.4 7.9 8.5 Other Operating CF 13 5 46 47 Div Payout Ratio (%) 8.9 8.1 10.0 30.0 Net Operating CF 70 10 (68) (176) Net Interest Cover (x) 2.5 3.7 4.0 5.1 Capital Exp.(net) (2) (10) (30) (30) Asset Turnover (x) 0.5 0.4 0.3 0.3 Other Invts.(net) 0 6 0 0 Debtors Turn (avg days) 151.2 235.4 299.4 313.8 Invts in Assoc. & JV 0 0 0 0 Creditors Turn (avg days) 178.1 228.4 400.4 412.2 Div from Assoc & JV 0 0 0 0 Inventory Turn (avg days) 0.6 11.0 22.6 21.4 Other Investing CF (94) (148) 0 0 Current Ratio (x) 1.9 1.5 1.3 1.4 Net Investing CF (95) (152) (30) (30) Quick Ratio (x) 1.9 1.3 1.2 1.3 Div Paid (3) (3) (3) (16) Net Debt/Equity (X) 0.5 0.4 0.4 0.6 Chg in Gross Debt 111 115 67 236 Capex to Debt (%) 0.5 2.7 6.6 4.3 Capital Issues 0 2 46 0 Z-Score (X) 2.2 2.3 1.9 1.7 Other Financing CF 0 0 (24) (24) N.Cash/(Debt)PS (S$) (0.28) (0.27) (0.31) (0.53) Net Financing CF 108 114 86 196 Opg CFPS (S$) 0.07 0.08 0.13 0.15 Currency Adjustments (1) 0 0 0 Free CFPS (S$) 0.12 0.00 (0.09) (0.18) Chg in Cash 83 (28) (11) (10)
Interim Income Statement (S$ m) Segmental Breakdown (S$ m) / Key Assumptions
FY Mar 1H2014 2H2014 1H2015 2H2015 FY Mar 2014A 2015A 2016F 2017F Turnover 96 106 172 177 Revenues (S$ m) Cost of Goods Sold (53) (54) (90) (95) Engineering 140 199 216 280 Gross Profit 43 52 81 82 Treatment 63 102 150 197 Other Oper. (Exp)/Inc (23) (33) (34) (47) Membrane 0 47 59 77 Operating Profit 21 19 48 35 Total 202 349 424 555 Other Non Opg (Exp)/Inc 1 3 15 8 Segment profit (S$ m) Associates & JV Inc 1 1 0 0 Engineering 24 28 50 64 Net Interest (Exp)/Inc (8) (9) (14) (14) Treatment 25 44 70 90 Exceptional Gain/(Loss) N/A N/A N/A N/A Membrane 0 31 37 48 Pre-tax Profit 15 14 49 30 Total 49 103 157 202 Tax (3) (7) (9) (9) Segment profit Margins (%) Minority Interest (1) 0 (2) (2) Engineering 17.0 14.0 23.0 23.0 Net Profit 13 7 39 20 Treatment 39.6 42.7 47.0 45.5 Net profit bef Except. 11 7 38 20 Membrane N/A 66.3 62.0 62.0 Total 24.0 29.5 36.9 36.4 Key Assumptions Sales Gth (%) 11.7 7.3 78.8 66.8 Operating capacity (m tons 1.2 2.4 3.0 3.7 Opg Profit Gth (%) 2.3 (10.0) 128.6 80.2 Annual treated sewage (m N/A N/A 689.9 910.2 Net Profit Gth (%) (7.9) (53.5) 204.6 178.1 EPC orders growth (%) N/A N/A 5.0 20.0 Gross Margins (%) 45.1 49.2 47.5 46.5 Opg Profit Margins (%) 21.7 19.1 27.7 20.6 Net Profit Margins (%) 13.4 6.8 22.8 11.3 Source: Company, DBS Vickers
Page 22 www.dbsvickers.com sa- AH
BUY
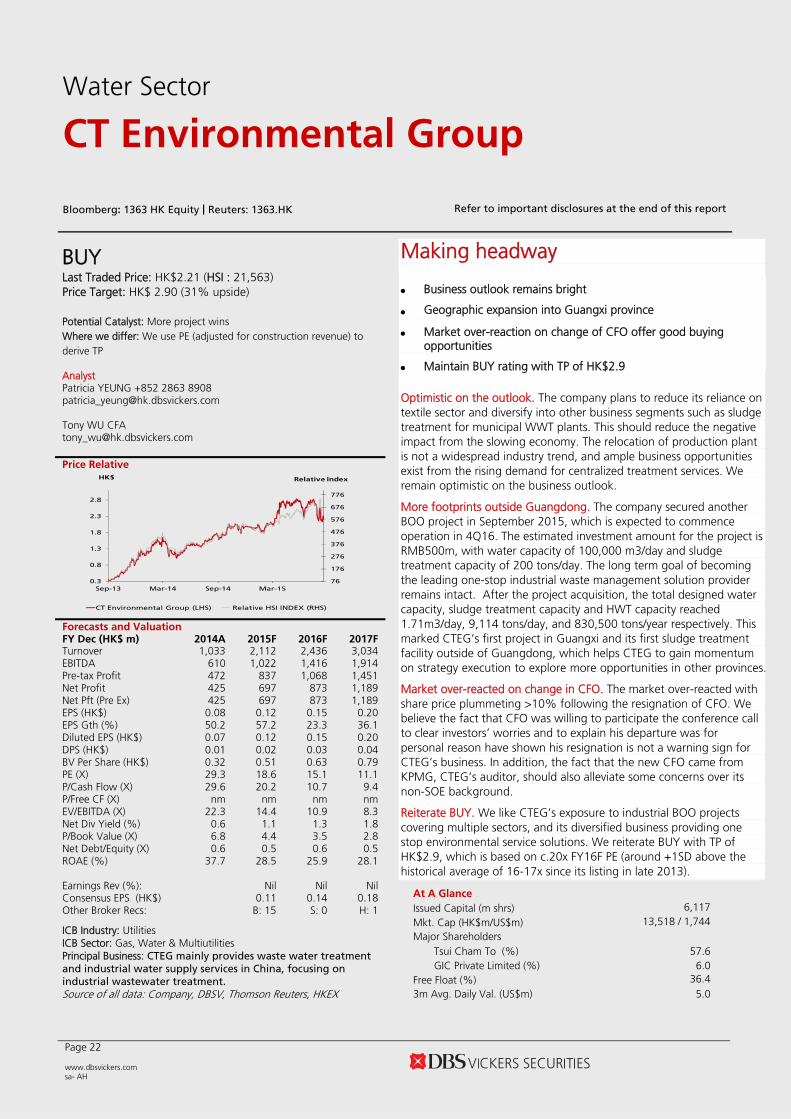
Last Traded Price: HK$2.21 (HSI : 21,563) Price Target: HK$ 2.90 (31% upside) Potential Catalyst: More project wins Where we differ: We use PE (adjusted for construction revenue) to derive TP Analyst Patricia YEUNG +852 2863 8908 [email protected] Tony WU CFA [email protected] Price Relative
76
176
276
376
476
576
676
776
0.3
0.8
1.3
1.8
2.3
2.8
Sep-13 Mar-14 Sep-14 Mar-15
Relative IndexHK$
CT Environmental Group (LHS) Relative HSI INDEX (RHS)
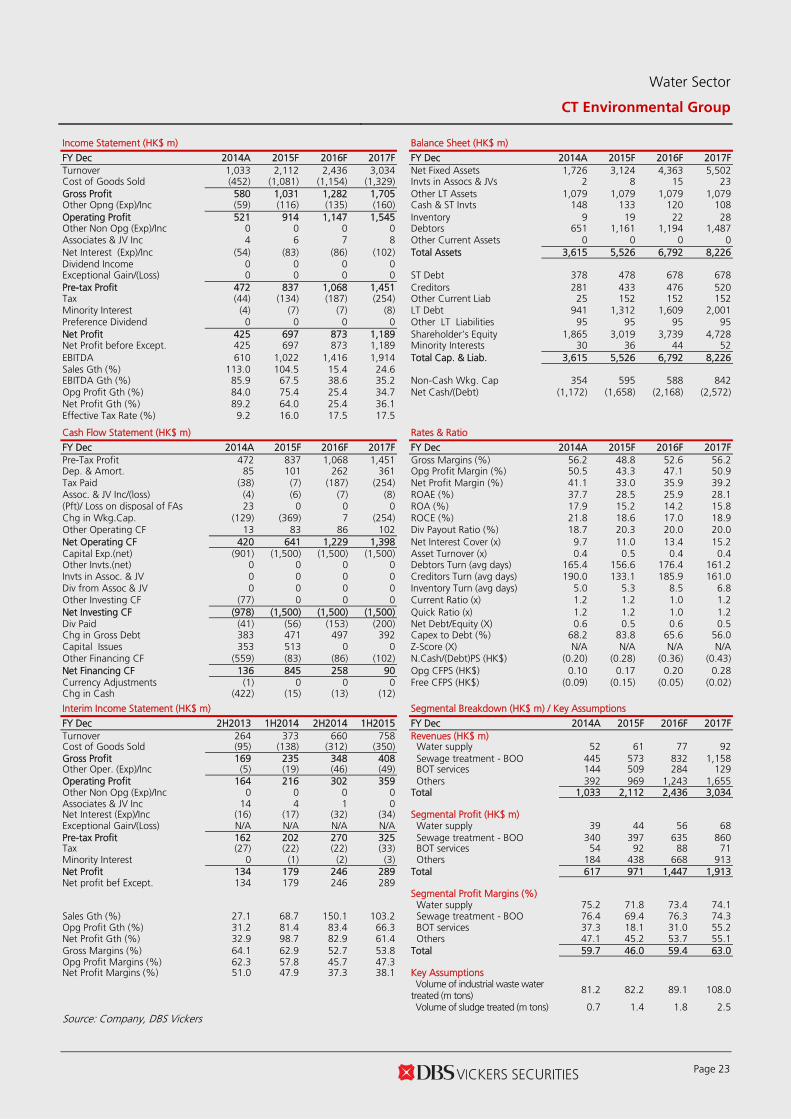
Forecasts and Valuation FY Dec (HK$ m) 2014A 2015F 2016F 2017FTurnover 1,033 2,112 2,436 3,034 EBITDA 610 1,022 1,416 1,914 Pre-tax Profit 472 837 1,068 1,451 Net Profit 425 697 873 1,189 Net Pft (Pre Ex) 425 697 873 1,189 EPS (HK$) 0.08 0.12 0.15 0.20 EPS Gth (%) 50.2 57.2 23.3 36.1 Diluted EPS (HK$) 0.07 0.12 0.15 0.20 DPS (HK$) 0.01 0.02 0.03 0.04 BV Per Share (HK$) 0.32 0.51 0.63 0.79 PE (X) 29.3 18.6 15.1 11.1 P/Cash Flow (X) 29.6 20.2 10.7 9.4 P/Free CF (X) nm nm nm nm EV/EBITDA (X) 22.3 14.4 10.9 8.3 Net Div Yield (%) 0.6 1.1 1.3 1.8 P/Book Value (X) 6.8 4.4 3.5 2.8 Net Debt/Equity (X) 0.6 0.5 0.6 0.5 ROAE (%) 37.7 28.5 25.9 28.1 Earnings Rev (%): Nil Nil Nil Consensus EPS (HK$) 0.11 0.14 0.18 Other Broker Recs: B: 15 S: 0 H: 1
ICB Industry: Utilities ICB Sector: Gas, Water & Multiutilities Principal Business: CTEG mainly provides waste water treatment
and industrial water supply services in China, focusing on
industrial wastewater treatment. Source of all data: Company, DBSV, Thomson Reuters, HKEX
Making headway
Business outlook remains bright
Geographic expansion into Guangxi province
Market over-reaction on change of CFO offer good buying opportunities
Maintain BUY rating with TP of HK$2.9 Optimistic on the outlook. The company plans to reduce its reliance on textile sector and diversify into other business segments such as sludge treatment for municipal WWT plants. This should reduce the negative impact from the slowing economy. The relocation of production plant is not a widespread industry trend, and ample business opportunities exist from the rising demand for centralized treatment services. We remain optimistic on the business outlook.
More footprints outside Guangdong. The company secured another BOO project in September 2015, which is expected to commence operation in 4Q16. The estimated investment amount for the project is RMB500m, with water capacity of 100,000 m3/day and sludge treatment capacity of 200 tons/day. The long term goal of becoming the leading one-stop industrial waste management solution provider remains intact. After the project acquisition, the total designed water capacity, sludge treatment capacity and HWT capacity reached 1.71m3/day, 9,114 tons/day, and 830,500 tons/year respectively. This marked CTEG’s first project in Guangxi and its first sludge treatment facility outside of Guangdong, which helps CTEG to gain momentum on strategy execution to explore more opportunities in other provinces.
Market over-reacted on change in CFO. The market over-reacted with share price plummeting >10% following the resignation of CFO. We believe the fact that CFO was willing to participate the conference call to clear investors’ worries and to explain his departure was for personal reason have shown his resignation is not a warning sign for CTEG’s business. In addition, the fact that the new CFO came from KPMG, CTEG’s auditor, should also alleviate some concerns over its non-SOE background.
Reiterate BUY. We like CTEG’s exposure to industrial BOO projects covering multiple sectors, and its diversified business providing one stop environmental service solutions. We reiterate BUY with TP of HK$2.9, which is based on c.20x FY16F PE (around +1SD above the historical average of 16-17x since its listing in late 2013).
At A Glance Issued Capital (m shrs) 6,117 Mkt. Cap (HK$m/US$m) 13,518 / 1,744
Major Shareholders Tsui Cham To (%) 57.6 GIC Private Limited (%) 6.0
Free Float (%) 36.4 3m Avg. Daily Val. (US$m) 5.0
Water Sector
CT Environmental Group
Bloomberg: 1363 HK Equity | Reuters: 1363.HK Refer to important disclosures at the end of this report
Water Sector
CT Environmental Group
Page 23
Income Statement (HK$ m) Balance Sheet (HK$ m)
FY Dec 2014A 2015F 2016F 2017F FY Dec 2014A 2015F 2016F 2017F Turnover 1,033 2,112 2,436 3,034 Net Fixed Assets 1,726 3,124 4,363 5,502 Cost of Goods Sold (452) (1,081) (1,154) (1,329) Invts in Assocs & JVs 2 8 15 23 Gross Profit 580 1,031 1,282 1,705 Other LT Assets 1,079 1,079 1,079 1,079 Other Opng (Exp)/Inc (59) (116) (135) (160) Cash & ST Invts 148 133 120 108 Operating Profit 521 914 1,147 1,545 Inventory 9 19 22 28 Other Non Opg (Exp)/Inc 0 0 0 0 Debtors 651 1,161 1,194 1,487 Associates & JV Inc 4 6 7 8 Other Current Assets 0 0 0 0 Net Interest (Exp)/Inc (54) (83) (86) (102) Total Assets 3,615 5,526 6,792 8,226 Dividend Income 0 0 0 0 Exceptional Gain/(Loss) 0 0 0 0 ST Debt 378 478 678 678 Pre-tax Profit 472 837 1,068 1,451 Creditors 281 433 476 520 Tax (44) (134) (187) (254) Other Current Liab 25 152 152 152 Minority Interest (4) (7) (7) (8) LT Debt 941 1,312 1,609 2,001 Preference Dividend 0 0 0 0 Other LT Liabilities 95 95 95 95 Net Profit 425 697 873 1,189 Shareholder’s Equity 1,865 3,019 3,739 4,728 Net Profit before Except. 425 697 873 1,189 Minority Interests 30 36 44 52 EBITDA 610 1,022 1,416 1,914 Total Cap. & Liab. 3,615 5,526 6,792 8,226 Sales Gth (%) 113.0 104.5 15.4 24.6 EBITDA Gth (%) 85.9 67.5 38.6 35.2 Non-Cash Wkg. Cap 354 595 588 842 Opg Profit Gth (%) 84.0 75.4 25.4 34.7 Net Cash/(Debt) (1,172) (1,658) (2,168) (2,572) Net Profit Gth (%) 89.2 64.0 25.4 36.1 Effective Tax Rate (%) 9.2 16.0 17.5 17.5 Cash Flow Statement (HK$ m) Rates & Ratio
FY Dec 2014A 2015F 2016F 2017F FY Dec 2014A 2015F 2016F 2017F Pre-Tax Profit 472 837 1,068 1,451 Gross Margins (%) 56.2 48.8 52.6 56.2 Dep. & Amort. 85 101 262 361 Opg Profit Margin (%) 50.5 43.3 47.1 50.9 Tax Paid (38) (7) (187) (254) Net Profit Margin (%) 41.1 33.0 35.9 39.2 Assoc. & JV Inc/(loss) (4) (6) (7) (8) ROAE (%) 37.7 28.5 25.9 28.1 (Pft)/ Loss on disposal of FAs 23 0 0 0 ROA (%) 17.9 15.2 14.2 15.8 Chg in Wkg.Cap. (129) (369) 7 (254) ROCE (%) 21.8 18.6 17.0 18.9 Other Operating CF 13 83 86 102 Div Payout Ratio (%) 18.7 20.3 20.0 20.0 Net Operating CF 420 641 1,229 1,398 Net Interest Cover (x) 9.7 11.0 13.4 15.2 Capital Exp.(net) (901) (1,500) (1,500) (1,500) Asset Turnover (x) 0.4 0.5 0.4 0.4 Other Invts.(net) 0 0 0 0 Debtors Turn (avg days) 165.4 156.6 176.4 161.2 Invts in Assoc. & JV 0 0 0 0 Creditors Turn (avg days) 190.0 133.1 185.9 161.0 Div from Assoc & JV 0 0 0 0 Inventory Turn (avg days) 5.0 5.3 8.5 6.8 Other Investing CF (77) 0 0 0 Current Ratio (x) 1.2 1.2 1.0 1.2 Net Investing CF (978) (1,500) (1,500) (1,500) Quick Ratio (x) 1.2 1.2 1.0 1.2 Div Paid (41) (56) (153) (200) Net Debt/Equity (X) 0.6 0.5 0.6 0.5 Chg in Gross Debt 383 471 497 392 Capex to Debt (%) 68.2 83.8 65.6 56.0 Capital Issues 353 513 0 0 Z-Score (X) N/A N/A N/A N/A Other Financing CF (559) (83) (86) (102) N.Cash/(Debt)PS (HK$) (0.20) (0.28) (0.36) (0.43) Net Financing CF 136 845 258 90 Opg CFPS (HK$) 0.10 0.17 0.20 0.28 Currency Adjustments (1) 0 0 0 Free CFPS (HK$) (0.09) (0.15) (0.05) (0.02) Chg in Cash (422) (15) (13) (12)
Interim Income Statement (HK$ m) Segmental Breakdown (HK$ m) / Key Assumptions
FY Dec 2H2013 1H2014 2H2014 1H2015 FY Dec 2014A 2015F 2016F 2017F Turnover 264 373 660 758 Revenues (HK$ m) Cost of Goods Sold (95) (138) (312) (350) Water supply 52 61 77 92 Gross Profit 169 235 348 408 Sewage treatment - BOO 445 573 832 1,158 Other Oper. (Exp)/Inc (5) (19) (46) (49) BOT services 144 509 284 129 Operating Profit 164 216 302 359 Others 392 969 1,243 1,655 Other Non Opg (Exp)/Inc 0 0 0 0 Total 1,033 2,112 2,436 3,034 Associates & JV Inc 14 4 1 0 Net Interest (Exp)/Inc (16) (17) (32) (34) Segmental Profit (HK$ m) Exceptional Gain/(Loss) N/A N/A N/A N/A Water supply 39 44 56 68 Pre-tax Profit 162 202 270 325 Sewage treatment - BOO 340 397 635 860 Tax (27) (22) (22) (33) BOT services 54 92 88 71 Minority Interest 0 (1) (2) (3) Others 184 438 668 913 Net Profit 134 179 246 289 Total 617 971 1,447 1,913 Net profit bef Except. 134 179 246 289 Segmental Profit Margins (%) Water supply 75.2 71.8 73.4 74.1 Sales Gth (%) 27.1 68.7 150.1 103.2 Sewage treatment - BOO 76.4 69.4 76.3 74.3 Opg Profit Gth (%) 31.2 81.4 83.4 66.3 BOT services 37.3 18.1 31.0 55.2 Net Profit Gth (%) 32.9 98.7 82.9 61.4 Others 47.1 45.2 53.7 55.1 Gross Margins (%) 64.1 62.9 52.7 53.8 Total 59.7 46.0 59.4 63.0 Opg Profit Margins (%) 62.3 57.8 45.7 47.3 Net Profit Margins (%) 51.0 47.9 37.3 38.1 Key Assumptions
Volume of industrial waste water
treated (m tons) 81.2 82.2 89.1 108.0
Volume of sludge treated (m tons) 0.7 1.4 1.8 2.5 Source: Company, DBS Vickers
Page 24 www.dbsvickers.com sa- AH
BUY
Last Traded Price: HK$2.09 (HSI : 21,563) Price Target : HK$ 2.60 (24% upside) (Prev HK$4.00) Potential Catalyst: New project wins Where we differ: We use PE (adjusted for construction revenue) to derive TP Analyst Patricia YEUNG +852 2863 8908 [email protected] Tony WU CFA [email protected] Price Relative
70
90
110
130
150
170
190
210
1.8
2.3
2.8
3.3
3.8
4.3
4.8
5.3
Jul-14 Dec-14 May-15
Relative IndexHK$
Kangda International (LHS) Relative HSI INDEX (RHS)
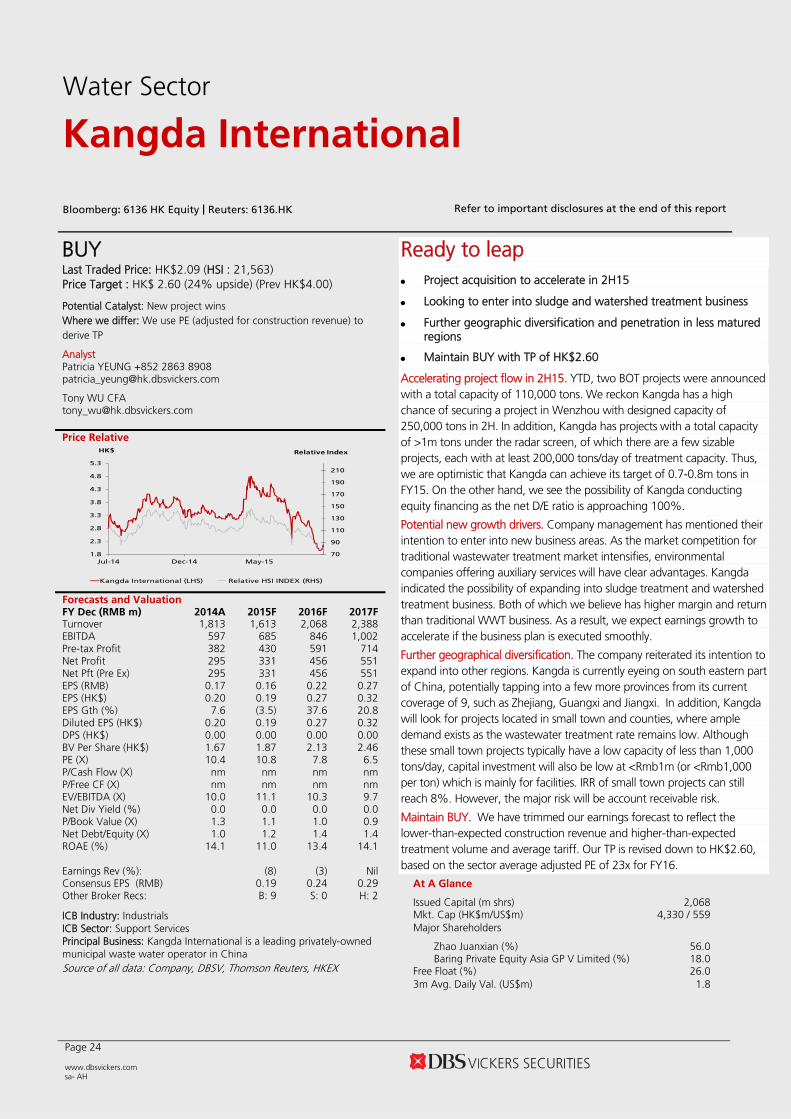
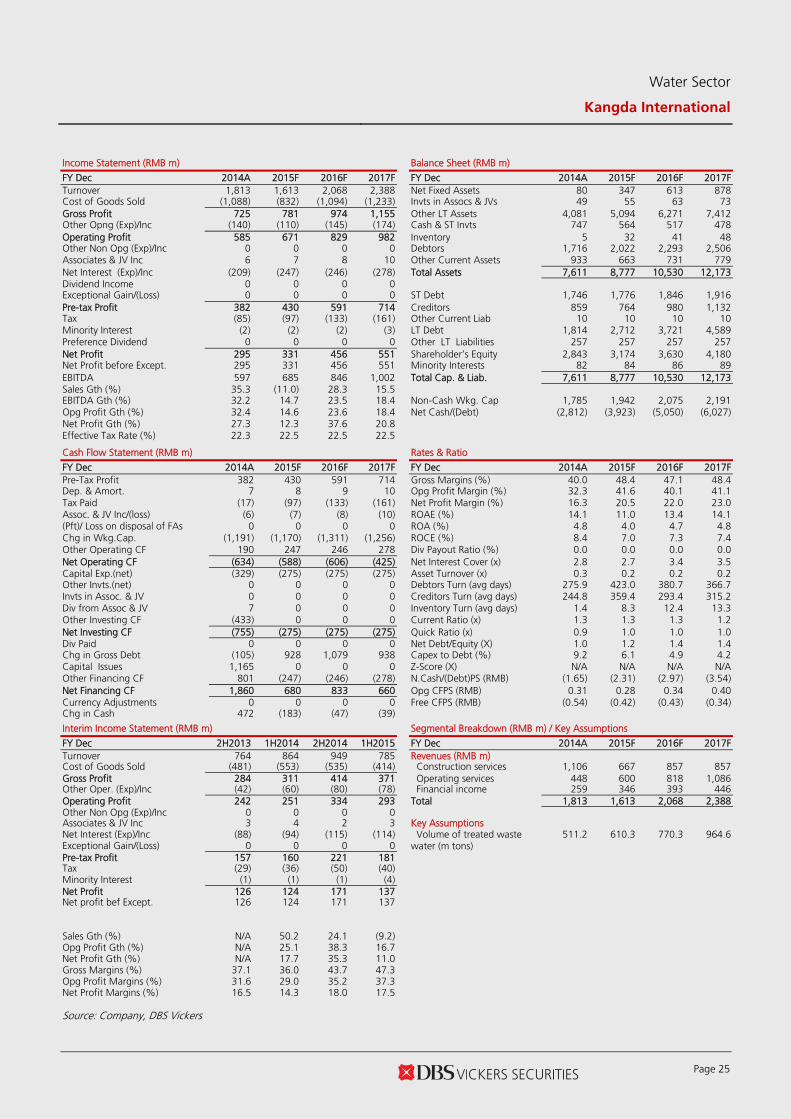
Forecasts and Valuation FY Dec (RMB m) 2014A 2015F 2016F 2017FTurnover 1,813 1,613 2,068 2,388 EBITDA 597 685 846 1,002 Pre-tax Profit 382 430 591 714 Net Profit 295 331 456 551 Net Pft (Pre Ex) 295 331 456 551 EPS (RMB) 0.17 0.16 0.22 0.27 EPS (HK$) 0.20 0.19 0.27 0.32 EPS Gth (%) 7.6 (3.5) 37.6 20.8 Diluted EPS (HK$) 0.20 0.19 0.27 0.32 DPS (HK$) 0.00 0.00 0.00 0.00 BV Per Share (HK$) 1.67 1.87 2.13 2.46 PE (X) 10.4 10.8 7.8 6.5 P/Cash Flow (X) nm nm nm nm P/Free CF (X) nm nm nm nm EV/EBITDA (X) 10.0 11.1 10.3 9.7 Net Div Yield (%) 0.0 0.0 0.0 0.0 P/Book Value (X) 1.3 1.1 1.0 0.9 Net Debt/Equity (X) 1.0 1.2 1.4 1.4 ROAE (%) 14.1 11.0 13.4 14.1 Earnings Rev (%): (8) (3) Nil Consensus EPS (RMB) 0.19 0.24 0.29 Other Broker Recs: B: 9 S: 0 H: 2
ICB Industry: Industrials ICB Sector: Support Services Principal Business: Kangda International is a leading privately-owned municipal waste water operator in China Source of all data: Company, DBSV, Thomson Reuters, HKEX
Ready to leap
Project acquisition to accelerate in 2H15
Looking to enter into sludge and watershed treatment business
Further geographic diversification and penetration in less matured regions
Maintain BUY with TP of HK$2.60
Accelerating project flow in 2H15. YTD, two BOT projects were announced with a total capacity of 110,000 tons. We reckon Kangda has a high chance of securing a project in Wenzhou with designed capacity of 250,000 tons in 2H. In addition, Kangda has projects with a total capacity of >1m tons under the radar screen, of which there are a few sizable projects, each with at least 200,000 tons/day of treatment capacity. Thus, we are optimistic that Kangda can achieve its target of 0.7-0.8m tons in FY15. On the other hand, we see the possibility of Kangda conducting equity financing as the net D/E ratio is approaching 100%.
Potential new growth drivers. Company management has mentioned their intention to enter into new business areas. As the market competition for traditional wastewater treatment market intensifies, environmental companies offering auxiliary services will have clear advantages. Kangda indicated the possibility of expanding into sludge treatment and watershed treatment business. Both of which we believe has higher margin and return than traditional WWT business. As a result, we expect earnings growth to accelerate if the business plan is executed smoothly.
Further geographical diversification. The company reiterated its intention to expand into other regions. Kangda is currently eyeing on south eastern part of China, potentially tapping into a few more provinces from its current coverage of 9, such as Zhejiang, Guangxi and Jiangxi. In addition, Kangda will look for projects located in small town and counties, where ample demand exists as the wastewater treatment rate remains low. Although these small town projects typically have a low capacity of less than 1,000 tons/day, capital investment will also be low at <Rmb1m (or <Rmb1,000 per ton) which is mainly for facilities. IRR of small town projects can still reach 8%. However, the major risk will be account receivable risk.
Maintain BUY. We have trimmed our earnings forecast to reflect the lower-than-expected construction revenue and higher-than-expected treatment volume and average tariff. Our TP is revised down to HK$2.60, based on the sector average adjusted PE of 23x for FY16.
At A Glance
Issued Capital (m shrs) 2,068 Mkt. Cap (HK$m/US$m) 4,330 / 559 Major Shareholders
Zhao Juanxian (%) 56.0 Baring Private Equity Asia GP V Limited (%) 18.0
Free Float (%) 26.0 3m Avg. Daily Val. (US$m) 1.8
Water Sector
Kangda International
Bloomberg: 6136 HK Equity | Reuters: 6136.HK Refer to important disclosures at the end of this report
Water Sector
Kangda International
Page 25
Income Statement (RMB m) Balance Sheet (RMB m)
FY Dec 2014A 2015F 2016F 2017F FY Dec 2014A 2015F 2016F 2017F Turnover 1,813 1,613 2,068 2,388 Net Fixed Assets 80 347 613 878 Cost of Goods Sold (1,088) (832) (1,094) (1,233) Invts in Assocs & JVs 49 55 63 73 Gross Profit 725 781 974 1,155 Other LT Assets 4,081 5,094 6,271 7,412 Other Opng (Exp)/Inc (140) (110) (145) (174) Cash & ST Invts 747 564 517 478 Operating Profit 585 671 829 982 Inventory 5 32 41 48 Other Non Opg (Exp)/Inc 0 0 0 0 Debtors 1,716 2,022 2,293 2,506 Associates & JV Inc 6 7 8 10 Other Current Assets 933 663 731 779 Net Interest (Exp)/Inc (209) (247) (246) (278) Total Assets 7,611 8,777 10,530 12,173 Dividend Income 0 0 0 0 Exceptional Gain/(Loss) 0 0 0 0 ST Debt 1,746 1,776 1,846 1,916 Pre-tax Profit 382 430 591 714 Creditors 859 764 980 1,132 Tax (85) (97) (133) (161) Other Current Liab 10 10 10 10 Minority Interest (2) (2) (2) (3) LT Debt 1,814 2,712 3,721 4,589 Preference Dividend 0 0 0 0 Other LT Liabilities 257 257 257 257 Net Profit 295 331 456 551 Shareholder’s Equity 2,843 3,174 3,630 4,180 Net Profit before Except. 295 331 456 551 Minority Interests 82 84 86 89 EBITDA 597 685 846 1,002 Total Cap. & Liab. 7,611 8,777 10,530 12,173 Sales Gth (%) 35.3 (11.0) 28.3 15.5 EBITDA Gth (%) 32.2 14.7 23.5 18.4 Non-Cash Wkg. Cap 1,785 1,942 2,075 2,191 Opg Profit Gth (%) 32.4 14.6 23.6 18.4 Net Cash/(Debt) (2,812) (3,923) (5,050) (6,027) Net Profit Gth (%) 27.3 12.3 37.6 20.8 Effective Tax Rate (%) 22.3 22.5 22.5 22.5 Cash Flow Statement (RMB m) Rates & Ratio
FY Dec 2014A 2015F 2016F 2017F FY Dec 2014A 2015F 2016F 2017F Pre-Tax Profit 382 430 591 714 Gross Margins (%) 40.0 48.4 47.1 48.4 Dep. & Amort. 7 8 9 10 Opg Profit Margin (%) 32.3 41.6 40.1 41.1 Tax Paid (17) (97) (133) (161) Net Profit Margin (%) 16.3 20.5 22.0 23.0 Assoc. & JV Inc/(loss) (6) (7) (8) (10) ROAE (%) 14.1 11.0 13.4 14.1 (Pft)/ Loss on disposal of FAs 0 0 0 0 ROA (%) 4.8 4.0 4.7 4.8 Chg in Wkg.Cap. (1,191) (1,170) (1,311) (1,256) ROCE (%) 8.4 7.0 7.3 7.4 Other Operating CF 190 247 246 278 Div Payout Ratio (%) 0.0 0.0 0.0 0.0 Net Operating CF (634) (588) (606) (425) Net Interest Cover (x) 2.8 2.7 3.4 3.5 Capital Exp.(net) (329) (275) (275) (275) Asset Turnover (x) 0.3 0.2 0.2 0.2 Other Invts.(net) 0 0 0 0 Debtors Turn (avg days) 275.9 423.0 380.7 366.7 Invts in Assoc. & JV 0 0 0 0 Creditors Turn (avg days) 244.8 359.4 293.4 315.2 Div from Assoc & JV 7 0 0 0 Inventory Turn (avg days) 1.4 8.3 12.4 13.3 Other Investing CF (433) 0 0 0 Current Ratio (x) 1.3 1.3 1.3 1.2 Net Investing CF (755) (275) (275) (275) Quick Ratio (x) 0.9 1.0 1.0 1.0 Div Paid 0 0 0 0 Net Debt/Equity (X) 1.0 1.2 1.4 1.4 Chg in Gross Debt (105) 928 1,079 938 Capex to Debt (%) 9.2 6.1 4.9 4.2 Capital Issues 1,165 0 0 0 Z-Score (X) N/A N/A N/A N/A Other Financing CF 801 (247) (246) (278) N.Cash/(Debt)PS (RMB) (1.65) (2.31) (2.97) (3.54) Net Financing CF 1,860 680 833 660 Opg CFPS (RMB) 0.31 0.28 0.34 0.40 Currency Adjustments 0 0 0 0 Free CFPS (RMB) (0.54) (0.42) (0.43) (0.34) Chg in Cash 472 (183) (47) (39)
Interim Income Statement (RMB m) Segmental Breakdown (RMB m) / Key Assumptions
FY Dec 2H2013 1H2014 2H2014 1H2015 FY Dec 2014A 2015F 2016F 2017F Turnover 764 864 949 785 Revenues (RMB m) Cost of Goods Sold (481) (553) (535) (414) Construction services 1,106 667 857 857 Gross Profit 284 311 414 371 Operating services 448 600 818 1,086 Other Oper. (Exp)/Inc (42) (60) (80) (78) Financial income 259 346 393 446 Operating Profit 242 251 334 293 Total 1,813 1,613 2,068 2,388 Other Non Opg (Exp)/Inc 0 0 0 0 Associates & JV Inc 3 4 2 3 Key Assumptions Net Interest (Exp)/Inc (88) (94) (115) (114) Volume of treated waste
water (m tons) 511.2 610.3 770.3 964.6
Exceptional Gain/(Loss) 0 0 0 0 Pre-tax Profit 157 160 221 181 Tax (29) (36) (50) (40) Minority Interest (1) (1) (1) (4) Net Profit 126 124 171 137 Net profit bef Except. 126 124 171 137 Sales Gth (%) N/A 50.2 24.1 (9.2) Opg Profit Gth (%) N/A 25.1 38.3 16.7 Net Profit Gth (%) N/A 17.7 35.3 11.0 Gross Margins (%) 37.1 36.0 43.7 47.3 Opg Profit Margins (%) 31.6 29.0 35.2 37.3 Net Profit Margins (%) 16.5 14.3 18.0 17.5 Source: Company, DBS Vickers
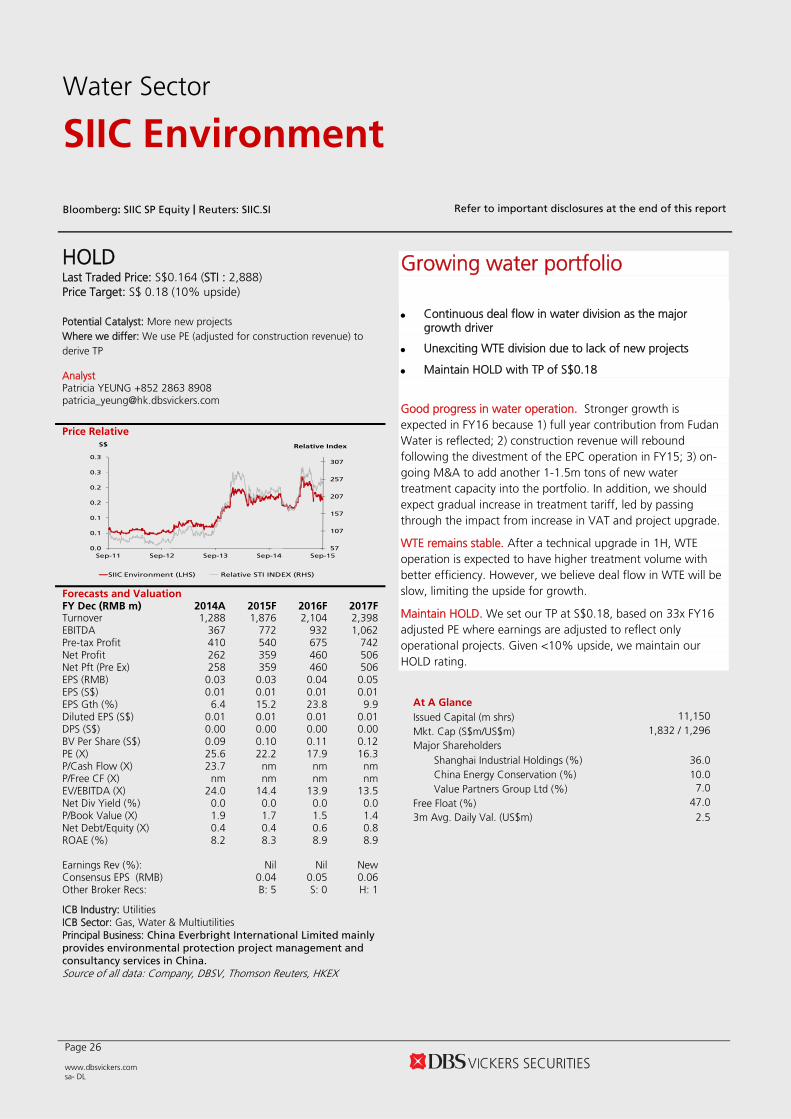
Page 26 www.dbsvickers.com sa- DL
HOLD
Last Traded Price: S$0.164 (STI : 2,888) Price Target: S$ 0.18 (10% upside) Potential Catalyst: More new projects Where we differ: We use PE (adjusted for construction revenue) to derive TP Analyst Patricia YEUNG +852 2863 8908 [email protected] Price Relative
57
107
157
207
257
307
0.0
0.1
0.1
0.2
0.2
0.3
0.3
Sep-11 Sep-12 Sep-13 Sep-14 Sep-15
Relative IndexS$
SIIC Environment (LHS) Relative STI INDEX (RHS)
Forecasts and Valuation FY Dec (RMB m) 2014A 2015F 2016F 2017FTurnover 1,288 1,876 2,104 2,398 EBITDA 367 772 932 1,062 Pre-tax Profit 410 540 675 742 Net Profit 262 359 460 506 Net Pft (Pre Ex) 258 359 460 506 EPS (RMB) 0.03 0.03 0.04 0.05 EPS (S$) 0.01 0.01 0.01 0.01 EPS Gth (%) 6.4 15.2 23.8 9.9 Diluted EPS (S$) 0.01 0.01 0.01 0.01 DPS (S$) 0.00 0.00 0.00 0.00 BV Per Share (S$) 0.09 0.10 0.11 0.12 PE (X) 25.6 22.2 17.9 16.3 P/Cash Flow (X) 23.7 nm nm nm P/Free CF (X) nm nm nm nm EV/EBITDA (X) 24.0 14.4 13.9 13.5 Net Div Yield (%) 0.0 0.0 0.0 0.0 P/Book Value (X) 1.9 1.7 1.5 1.4 Net Debt/Equity (X) 0.4 0.4 0.6 0.8 ROAE (%) 8.2 8.3 8.9 8.9 Earnings Rev (%): Nil Nil New Consensus EPS (RMB) 0.04 0.05 0.06 Other Broker Recs: B: 5 S: 0 H: 1
ICB Industry: Utilities ICB Sector: Gas, Water & Multiutilities Principal Business: China Everbright International Limited mainly
provides environmental protection project management and
consultancy services in China. Source of all data: Company, DBSV, Thomson Reuters, HKEX
Growing water portfolio Continuous deal flow in water division as the major
growth driver
Unexciting WTE division due to lack of new projects
Maintain HOLD with TP of S$0.18
Good progress in water operation. Stronger growth is expected in FY16 because 1) full year contribution from Fudan Water is reflected; 2) construction revenue will rebound following the divestment of the EPC operation in FY15; 3) on-going M&A to add another 1-1.5m tons of new water treatment capacity into the portfolio. In addition, we should expect gradual increase in treatment tariff, led by passing through the impact from increase in VAT and project upgrade.
WTE remains stable. After a technical upgrade in 1H, WTE operation is expected to have higher treatment volume with better efficiency. However, we believe deal flow in WTE will be slow, limiting the upside for growth.
Maintain HOLD. We set our TP at S$0.18, based on 33x FY16 adjusted PE where earnings are adjusted to reflect only operational projects. Given <10% upside, we maintain our HOLD rating.
At A Glance Issued Capital (m shrs) 11,150 Mkt. Cap (S$m/US$m) 1,832 / 1,296
Major Shareholders Shanghai Industrial Holdings (%) 36.0 China Energy Conservation (%) 10.0 Value Partners Group Ltd (%) 7.0
Free Float (%) 47.0 3m Avg. Daily Val. (US$m) 2.5
Water Sector
SIIC Environment
Bloomberg: SIIC SP Equity | Reuters: SIIC.SI Refer to important disclosures at the end of this report
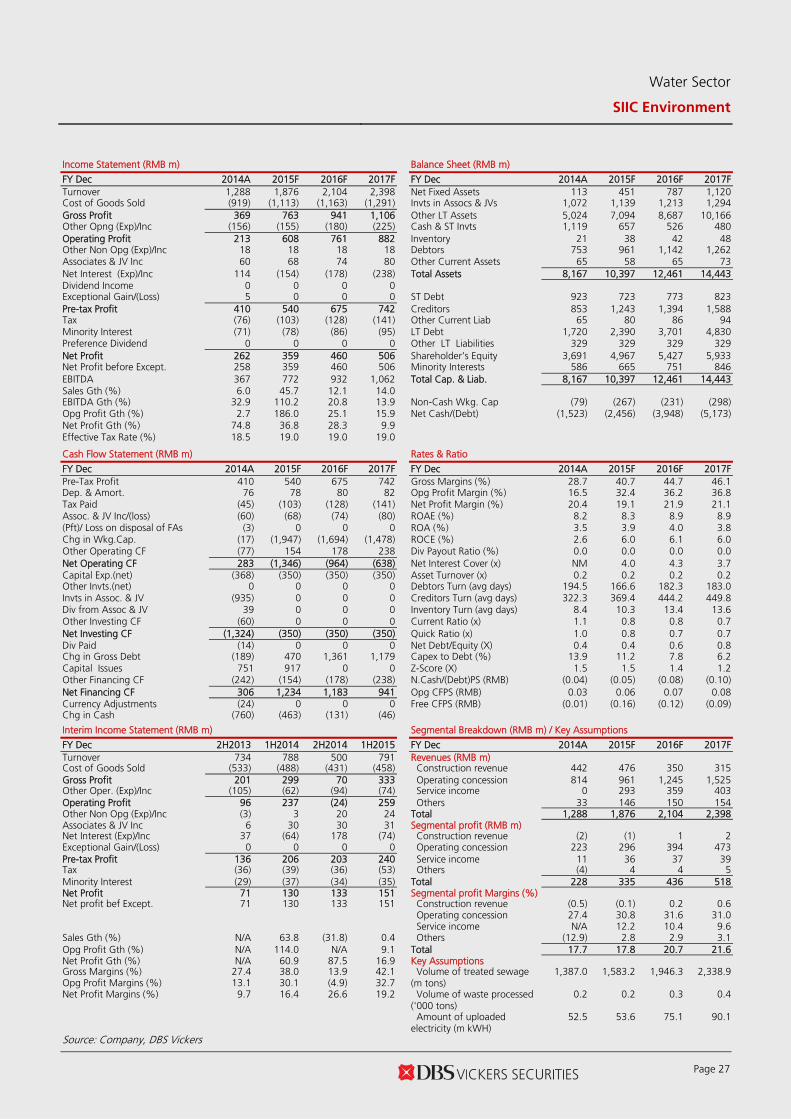
Water Sector
SIIC Environment
Page 27
Income Statement (RMB m) Balance Sheet (RMB m)
FY Dec 2014A 2015F 2016F 2017F FY Dec 2014A 2015F 2016F 2017F Turnover 1,288 1,876 2,104 2,398 Net Fixed Assets 113 451 787 1,120 Cost of Goods Sold (919) (1,113) (1,163) (1,291) Invts in Assocs & JVs 1,072 1,139 1,213 1,294 Gross Profit 369 763 941 1,106 Other LT Assets 5,024 7,094 8,687 10,166 Other Opng (Exp)/Inc (156) (155) (180) (225) Cash & ST Invts 1,119 657 526 480 Operating Profit 213 608 761 882 Inventory 21 38 42 48 Other Non Opg (Exp)/Inc 18 18 18 18 Debtors 753 961 1,142 1,262 Associates & JV Inc 60 68 74 80 Other Current Assets 65 58 65 73 Net Interest (Exp)/Inc 114 (154) (178) (238) Total Assets 8,167 10,397 12,461 14,443 Dividend Income 0 0 0 0 Exceptional Gain/(Loss) 5 0 0 0 ST Debt 923 723 773 823 Pre-tax Profit 410 540 675 742 Creditors 853 1,243 1,394 1,588 Tax (76) (103) (128) (141) Other Current Liab 65 80 86 94 Minority Interest (71) (78) (86) (95) LT Debt 1,720 2,390 3,701 4,830 Preference Dividend 0 0 0 0 Other LT Liabilities 329 329 329 329 Net Profit 262 359 460 506 Shareholder’s Equity 3,691 4,967 5,427 5,933 Net Profit before Except. 258 359 460 506 Minority Interests 586 665 751 846 EBITDA 367 772 932 1,062 Total Cap. & Liab. 8,167 10,397 12,461 14,443 Sales Gth (%) 6.0 45.7 12.1 14.0 EBITDA Gth (%) 32.9 110.2 20.8 13.9 Non-Cash Wkg. Cap (79) (267) (231) (298) Opg Profit Gth (%) 2.7 186.0 25.1 15.9 Net Cash/(Debt) (1,523) (2,456) (3,948) (5,173) Net Profit Gth (%) 74.8 36.8 28.3 9.9 Effective Tax Rate (%) 18.5 19.0 19.0 19.0 Cash Flow Statement (RMB m) Rates & Ratio
FY Dec 2014A 2015F 2016F 2017F FY Dec 2014A 2015F 2016F 2017F Pre-Tax Profit 410 540 675 742 Gross Margins (%) 28.7 40.7 44.7 46.1 Dep. & Amort. 76 78 80 82 Opg Profit Margin (%) 16.5 32.4 36.2 36.8 Tax Paid (45) (103) (128) (141) Net Profit Margin (%) 20.4 19.1 21.9 21.1 Assoc. & JV Inc/(loss) (60) (68) (74) (80) ROAE (%) 8.2 8.3 8.9 8.9 (Pft)/ Loss on disposal of FAs (3) 0 0 0 ROA (%) 3.5 3.9 4.0 3.8 Chg in Wkg.Cap. (17) (1,947) (1,694) (1,478) ROCE (%) 2.6 6.0 6.1 6.0 Other Operating CF (77) 154 178 238 Div Payout Ratio (%) 0.0 0.0 0.0 0.0 Net Operating CF 283 (1,346) (964) (638) Net Interest Cover (x) NM 4.0 4.3 3.7 Capital Exp.(net) (368) (350) (350) (350) Asset Turnover (x) 0.2 0.2 0.2 0.2 Other Invts.(net) 0 0 0 0 Debtors Turn (avg days) 194.5 166.6 182.3 183.0 Invts in Assoc. & JV (935) 0 0 0 Creditors Turn (avg days) 322.3 369.4 444.2 449.8 Div from Assoc & JV 39 0 0 0 Inventory Turn (avg days) 8.4 10.3 13.4 13.6 Other Investing CF (60) 0 0 0 Current Ratio (x) 1.1 0.8 0.8 0.7 Net Investing CF (1,324) (350) (350) (350) Quick Ratio (x) 1.0 0.8 0.7 0.7 Div Paid (14) 0 0 0 Net Debt/Equity (X) 0.4 0.4 0.6 0.8 Chg in Gross Debt (189) 470 1,361 1,179 Capex to Debt (%) 13.9 11.2 7.8 6.2 Capital Issues 751 917 0 0 Z-Score (X) 1.5 1.5 1.4 1.2 Other Financing CF (242) (154) (178) (238) N.Cash/(Debt)PS (RMB) (0.04) (0.05) (0.08) (0.10) Net Financing CF 306 1,234 1,183 941 Opg CFPS (RMB) 0.03 0.06 0.07 0.08 Currency Adjustments (24) 0 0 0 Free CFPS (RMB) (0.01) (0.16) (0.12) (0.09) Chg in Cash (760) (463) (131) (46)
Interim Income Statement (RMB m) Segmental Breakdown (RMB m) / Key Assumptions
FY Dec 2H2013 1H2014 2H2014 1H2015 FY Dec 2014A 2015F 2016F 2017F Turnover 734 788 500 791 Revenues (RMB m) Cost of Goods Sold (533) (488) (431) (458) Construction revenue 442 476 350 315 Gross Profit 201 299 70 333 Operating concession 814 961 1,245 1,525 Other Oper. (Exp)/Inc (105) (62) (94) (74) Service income 0 293 359 403 Operating Profit 96 237 (24) 259 Others 33 146 150 154 Other Non Opg (Exp)/Inc (3) 3 20 24 Total 1,288 1,876 2,104 2,398 Associates & JV Inc 6 30 30 31 Segmental profit (RMB m) Net Interest (Exp)/Inc 37 (64) 178 (74) Construction revenue (2) (1) 1 2 Exceptional Gain/(Loss) 0 0 0 0 Operating concession 223 296 394 473 Pre-tax Profit 136 206 203 240 Service income 11 36 37 39 Tax (36) (39) (36) (53) Others (4) 4 4 5 Minority Interest (29) (37) (34) (35) Total 228 335 436 518 Net Profit 71 130 133 151 Segmental profit Margins (%) Net profit bef Except. 71 130 133 151 Construction revenue (0.5) (0.1) 0.2 0.6 Operating concession 27.4 30.8 31.6 31.0 Service income N/A 12.2 10.4 9.6 Sales Gth (%) N/A 63.8 (31.8) 0.4 Others (12.9) 2.8 2.9 3.1 Opg Profit Gth (%) N/A 114.0 N/A 9.1 Total 17.7 17.8 20.7 21.6 Net Profit Gth (%) N/A 60.9 87.5 16.9 Key Assumptions Gross Margins (%) 27.4 38.0 13.9 42.1 Volume of treated sewage
(m tons) 1,387.0 1,583.2 1,946.3 2,338.9
Opg Profit Margins (%) 13.1 30.1 (4.9) 32.7 Net Profit Margins (%) 9.7 16.4 26.6 19.2 Volume of waste processed
('000 tons) 0.2 0.2 0.3 0.4
Amount of uploaded
electricity (m kWH) 52.5 53.6 75.1 90.1
Source: Company, DBS Vickers

Page 28 www.dbsvickers.com sa- AH
H: SELL Last Traded Price (H): HK$4.16 (HSI : 21,563) Price Target (H) : HK$3.50 (16% downside) (Prev HK$4.20)
A: SELL
Last Traded Price (A): RMB8.86 CSI300 Index : 3,358 Price Target (A): RMB 7.5 (15% downside) Potential Catalyst: New project wins Where we differ: We use PE (adjusted for construction revenue) to derive TP Analyst Patricia YEUNG +852 2863 8908 [email protected] Tony WU CFA [email protected]
Price Relative
67
117
167
217
267
317
1.5
2.5
3.5
4.5
5.5
6.5
7.5
8.5
9.5
Sep-11 Sep-12 Sep-13 Sep-14 Sep-15
Relative IndexHK$
Tianjin Cap. Environ. (LHS) Relative HSI INDEX (RHS) Forecasts and Valuation (H-share) FY Dec (RMB m) 2014A 2015F 2016F 2017FTurnover 1,655 1,722 1,779 1,911 EBITDA 955 1,019 1,052 1,112 Pre-tax Profit 433 504 543 577 Net Profit 308 366 394 416 Net Pft (Pre Ex) 308 366 394 416 EPS (RMB) 0.22 0.26 0.28 0.29 EPS (HK$) 0.26 0.31 0.34 0.35 EPS Gth (%) 9.4 18.7 7.6 5.8 Diluted EPS (HK$) 0.26 0.31 0.34 0.35 DPS (HK$) 0.10 0.06 0.07 0.07 BV Per Share (HK$) 3.55 3.76 4.05 4.35 PE (X) 15.9 13.4 12.5 11.8 P/Cash Flow (X) 8.1 2.0 9.8 5.2 P/Free CF (X) nm 2.6 49.4 9.1 EV/EBITDA (X) 8.2 6.1 6.0 5.4 Net Div Yield (%) 2.3 1.5 1.6 1.7 P/Book Value (X) 1.2 1.1 1.0 1.0 Net Debt/Equity (X) 0.6 0.2 0.3 0.2 ROAE (%) 7.6 8.5 8.6 8.5 Earnings Rev (%): Nil Nil New Consensus EPS (RMB) 0.24 0.26 0.29 Other Broker Recs: B: 0 S: 2 H: 0
ICB Industry: Utilities ICB Sector: Gas, Water & Multiutilities Principal Business: Tianjin Capital is principally engaged in the construction, design, management, operation, technological consultation and auxilliary services of sewage water treatment plant and related infrastrucal facilities. Source of all data: Company, DBSV, Thomson Reuters, HKEX
Lack of momentum
Traction is needed for further expansion
Sewage treatment fee is expected to go up gradually, but remains flat in FY15
Good growth in deodorization business, but market size is small
Maintain SELL; TP of HK$3.50
Ample ammunition but lacks target. As TJC used part of its RMB1.89bn cash repaid by Tianjin Sewage Company to repay some of its debt, the net D/E ratio dropped significantly from 64% in FY14 to 26% in 1HFY15. The company indicated that they are currently actively looking to expand its project portfolio. However, the project wins have been sluggish since 2012, casting doubt on the company’s ability to regain momentum amid a more competitive industry environment.
Tariff to stay flat in FY15. Starting from 2H14, approximately 60% of TJC’s sewage treatment plants have started to negotiate with local governments for higher tariff. At the same time, Qige sewage treatment plant in Hangzhou began construction in 1H15 while several waste water treatment plants in Xi’an, Guizhou and Wendeng are expected to commence upgrade construction. We believe at least one project will finish the upgrade process in 2H15. Therefore, we believe tariff will stay flat in FY15 and will begin to gradually shift up from FY16 onwards.
Tiny spark in darkness. The group’s deodorization business revenue achieved remarkable growth of 124.5% to RMB20m in 1H15. Even if the growth momentum sustains, it will still take a long time to make meaningful earnings contribution given its low base and low profit margin of c.10%. We are also doubtful on how strong the demand for deodorization business in the water market. Other business areas such as recycle water, pipeline connection, heat and cooling, and tap water are expected to remain steady in 2H15.
Maintain SELL. Our TP of HK$3.50 (H share) / Rmb7.5 (A share) is based on the historical average (H share) or -0.3 SD (A share) from 5-year historical average.
At A Glance Issued Capital (m shrs) 1,427 Mkt. Cap (HK$m/US$m) 5,949 / 768
Major Shareholders Tianjin Municipal (%) 50.1
Free Float (%) 49.9 3m Avg. Daily Val. (US$m) 2.5
Water Sector
Tianjin Cap. Environ. Bloomberg: 1065 HK EQUITY | 600874 CH Equity | Reuters: 1065.HK | 600874.SS
Refer to important disclosures at the end of this report
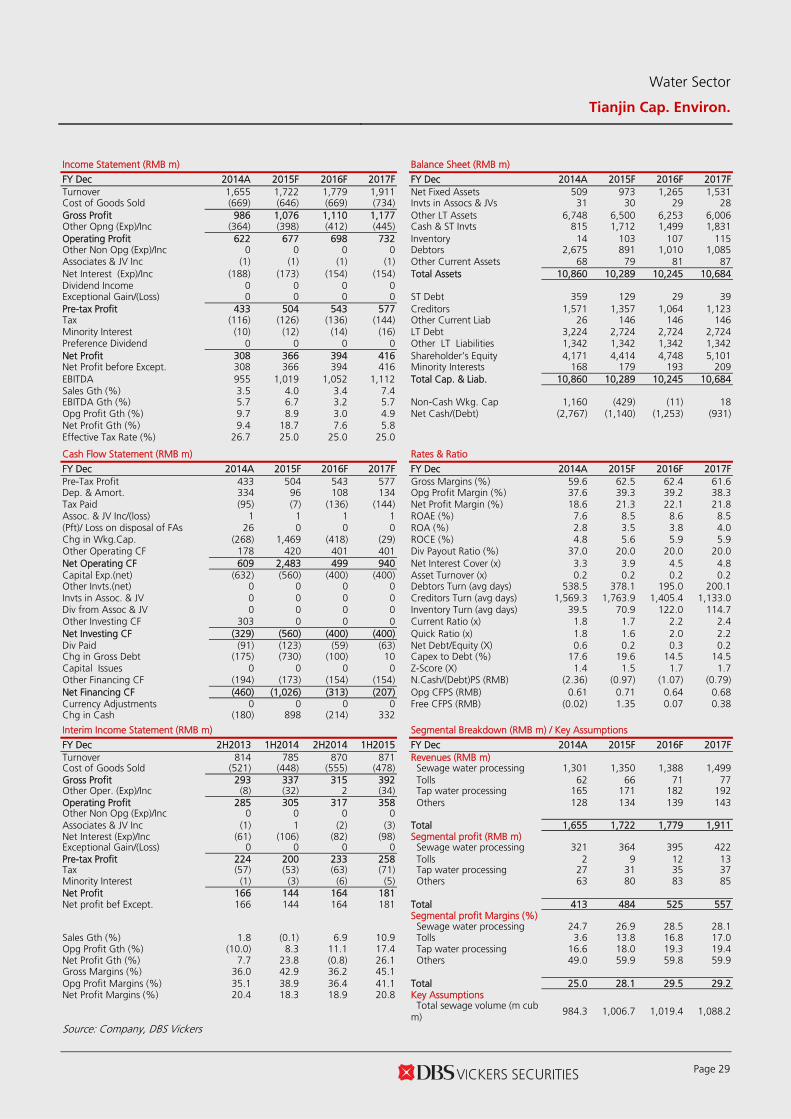
Water Sector
Tianjin Cap. Environ.
Page 29
Income Statement (RMB m) Balance Sheet (RMB m)
FY Dec 2014A 2015F 2016F 2017F FY Dec 2014A 2015F 2016F 2017F Turnover 1,655 1,722 1,779 1,911 Net Fixed Assets 509 973 1,265 1,531 Cost of Goods Sold (669) (646) (669) (734) Invts in Assocs & JVs 31 30 29 28 Gross Profit 986 1,076 1,110 1,177 Other LT Assets 6,748 6,500 6,253 6,006 Other Opng (Exp)/Inc (364) (398) (412) (445) Cash & ST Invts 815 1,712 1,499 1,831 Operating Profit 622 677 698 732 Inventory 14 103 107 115 Other Non Opg (Exp)/Inc 0 0 0 0 Debtors 2,675 891 1,010 1,085 Associates & JV Inc (1) (1) (1) (1) Other Current Assets 68 79 81 87 Net Interest (Exp)/Inc (188) (173) (154) (154) Total Assets 10,860 10,289 10,245 10,684 Dividend Income 0 0 0 0 Exceptional Gain/(Loss) 0 0 0 0 ST Debt 359 129 29 39 Pre-tax Profit 433 504 543 577 Creditors 1,571 1,357 1,064 1,123 Tax (116) (126) (136) (144) Other Current Liab 26 146 146 146 Minority Interest (10) (12) (14) (16) LT Debt 3,224 2,724 2,724 2,724 Preference Dividend 0 0 0 0 Other LT Liabilities 1,342 1,342 1,342 1,342 Net Profit 308 366 394 416 Shareholder’s Equity 4,171 4,414 4,748 5,101 Net Profit before Except. 308 366 394 416 Minority Interests 168 179 193 209 EBITDA 955 1,019 1,052 1,112 Total Cap. & Liab. 10,860 10,289 10,245 10,684 Sales Gth (%) 3.5 4.0 3.4 7.4 EBITDA Gth (%) 5.7 6.7 3.2 5.7 Non-Cash Wkg. Cap 1,160 (429) (11) 18 Opg Profit Gth (%) 9.7 8.9 3.0 4.9 Net Cash/(Debt) (2,767) (1,140) (1,253) (931) Net Profit Gth (%) 9.4 18.7 7.6 5.8 Effective Tax Rate (%) 26.7 25.0 25.0 25.0 Cash Flow Statement (RMB m) Rates & Ratio
FY Dec 2014A 2015F 2016F 2017F FY Dec 2014A 2015F 2016F 2017F Pre-Tax Profit 433 504 543 577 Gross Margins (%) 59.6 62.5 62.4 61.6 Dep. & Amort. 334 96 108 134 Opg Profit Margin (%) 37.6 39.3 39.2 38.3 Tax Paid (95) (7) (136) (144) Net Profit Margin (%) 18.6 21.3 22.1 21.8 Assoc. & JV Inc/(loss) 1 1 1 1 ROAE (%) 7.6 8.5 8.6 8.5 (Pft)/ Loss on disposal of FAs 26 0 0 0 ROA (%) 2.8 3.5 3.8 4.0 Chg in Wkg.Cap. (268) 1,469 (418) (29) ROCE (%) 4.8 5.6 5.9 5.9 Other Operating CF 178 420 401 401 Div Payout Ratio (%) 37.0 20.0 20.0 20.0 Net Operating CF 609 2,483 499 940 Net Interest Cover (x) 3.3 3.9 4.5 4.8 Capital Exp.(net) (632) (560) (400) (400) Asset Turnover (x) 0.2 0.2 0.2 0.2 Other Invts.(net) 0 0 0 0 Debtors Turn (avg days) 538.5 378.1 195.0 200.1 Invts in Assoc. & JV 0 0 0 0 Creditors Turn (avg days) 1,569.3 1,763.9 1,405.4 1,133.0 Div from Assoc & JV 0 0 0 0 Inventory Turn (avg days) 39.5 70.9 122.0 114.7 Other Investing CF 303 0 0 0 Current Ratio (x) 1.8 1.7 2.2 2.4 Net Investing CF (329) (560) (400) (400) Quick Ratio (x) 1.8 1.6 2.0 2.2 Div Paid (91) (123) (59) (63) Net Debt/Equity (X) 0.6 0.2 0.3 0.2 Chg in Gross Debt (175) (730) (100) 10 Capex to Debt (%) 17.6 19.6 14.5 14.5 Capital Issues 0 0 0 0 Z-Score (X) 1.4 1.5 1.7 1.7 Other Financing CF (194) (173) (154) (154) N.Cash/(Debt)PS (RMB) (2.36) (0.97) (1.07) (0.79) Net Financing CF (460) (1,026) (313) (207) Opg CFPS (RMB) 0.61 0.71 0.64 0.68 Currency Adjustments 0 0 0 0 Free CFPS (RMB) (0.02) 1.35 0.07 0.38 Chg in Cash (180) 898 (214) 332
Interim Income Statement (RMB m) Segmental Breakdown (RMB m) / Key Assumptions
FY Dec 2H2013 1H2014 2H2014 1H2015 FY Dec 2014A 2015F 2016F 2017F Turnover 814 785 870 871 Revenues (RMB m) Cost of Goods Sold (521) (448) (555) (478) Sewage water processing 1,301 1,350 1,388 1,499 Gross Profit 293 337 315 392 Tolls 62 66 71 77 Other Oper. (Exp)/Inc (8) (32) 2 (34) Tap water processing 165 171 182 192 Operating Profit 285 305 317 358 Others 128 134 139 143 Other Non Opg (Exp)/Inc 0 0 0 0 Associates & JV Inc (1) 1 (2) (3) Total 1,655 1,722 1,779 1,911 Net Interest (Exp)/Inc (61) (106) (82) (98) Segmental profit (RMB m) Exceptional Gain/(Loss) 0 0 0 0 Sewage water processing 321 364 395 422 Pre-tax Profit 224 200 233 258 Tolls 2 9 12 13 Tax (57) (53) (63) (71) Tap water processing 27 31 35 37 Minority Interest (1) (3) (6) (5) Others 63 80 83 85 Net Profit 166 144 164 181 Net profit bef Except. 166 144 164 181 Total 413 484 525 557 Segmental profit Margins (%) Sewage water processing 24.7 26.9 28.5 28.1 Sales Gth (%) 1.8 (0.1) 6.9 10.9 Tolls 3.6 13.8 16.8 17.0 Opg Profit Gth (%) (10.0) 8.3 11.1 17.4 Tap water processing 16.6 18.0 19.3 19.4 Net Profit Gth (%) 7.7 23.8 (0.8) 26.1 Others 49.0 59.9 59.8 59.9 Gross Margins (%) 36.0 42.9 36.2 45.1 Opg Profit Margins (%) 35.1 38.9 36.4 41.1 Total 25.0 28.1 29.5 29.2 Net Profit Margins (%) 20.4 18.3 18.9 20.8 Key Assumptions
Total sewage volume (m cub
m) 984.3 1,006.7 1,019.4 1,088.2
Source: Company, DBS Vickers
Industry Focus
Water Sector
Page 30
DBSV recommendations are based an Absolute Total Return* Rating system, defined as follows:
STRONG BUY (>20% total return over the next 3 months, with identifiable share price catalysts within this time frame)
BUY (>15% total return over the next 12 months for small caps, >10% for large caps)
HOLD (-10% to +15% total return over the next 12 months for small caps, -10% to +10% for large caps)
FULLY VALUED (negative total return i.e. > -10% over the next 12 months)
SELL (negative total return of > -20% over the next 3 months, with identifiable catalysts within this time frame)
Share price appreciation + dividends GENERAL DISCLOSURE/DISCLAIMER This report is prepared by DBS Vickers (Hong Kong) Limited (“DBSVHK”), a direct wholly-owned subsidiary of DBS Vickers Securities Holdings Pte Ltd ("DBSVH"). This report is intended for clients of DBSV Group only and no part of this document may be (i) copied, photocopied or duplicated in any form or by any means or (ii) redistributed without the prior written consent of DBSVHK. The research set out in this report is based on information obtained from sources believed to be reliable, but we (which collectively refers to DBSVHK and/or DBSVH) do not make any representation or warranty as to its accuracy, completeness or correctness. Opinions expressed are subject to change without notice. This document is prepared for general circulation. Any recommendation contained in this document does not have regard to the specific investment objectives, financial situation and the particular needs of any specific addressee. This document is for the information of addressees only and is not to be taken in substitution for the exercise of judgement by addressees, who should obtain separate independent legal or financial advice. DBSVHK accepts no liability whatsoever for any direct, indirect and/or consequential loss (including any claims for loss of profit) arising from any use of and/or reliance upon this document and/or further communication given in relation to this document. This document is not to be construed as an offer or a solicitation of an offer to buy or sell any securities. DBSVH is a wholly-owned subsidiary of DBS Bank Ltd. DBS Bank Ltd along with its affiliates and/or persons associated with any of them may from time to time have interests in the securities mentioned in this document. DBSVHK, DBS Bank Ltd and their associates, their directors, and/or employees may have positions in, and may effect transactions in securities mentioned herein and may also perform or seek to perform broking, investment banking and other banking services for these companies. Any valuations, opinions, estimates, forecasts, ratings or risk assessments herein constitutes a judgment as of the date of this report, and there can be no assurance that future results or events will be consistent with any such valuations, opinions, estimates, forecasts, ratings or risk assessments. The information in this document is subject to change without notice, its accuracy is not guaranteed, it may be incomplete or condensed and it may not contain all material information concerning the company (or companies) referred to in this report. The valuations, opinions, estimates, forecasts, ratings or risk assessments described in this report were based upon a number of estimates and assumptions and are inherently subject to significant uncertainties and contingencies. It can be expected that one or more of the estimates on which the valuations, opinions, estimates, forecasts, ratings or risk assessments were based will not materialize or will vary significantly from actual results. Therefore, the inclusion of the valuations, opinions, estimates, forecasts, ratings or risk assessments described herein IS NOT TO BE RELIED UPON as a representation and/or warranty by DBSVHK and/or DBSVH (and/or any persons associated with the aforesaid entities), that:
a. such valuations, opinions, estimates, forecasts, ratings or risk assessments or their underlying assumptions will be achieved, and
b. there is any assurance that future results or events will be consistent with any such valuations, opinions, estimates, forecasts, ratings or risk assessments stated therein.
Any assumptions made in this report that refers to commodities, are for the purposes of making forecasts for the company (or companies) mentioned herein. They are not to be construed as recommendations to trade in the physical commodity or in the futures contract relating to the commodity referred to in this report. DBS Vickers Securities (USA) Inc ("DBSVUSA"), a U.S.-registered broker-dealer, does not have its own investment banking or research department, nor has it participated in any investment banking transaction as a manager or co-manager in the past twelve months. ANALYST CERTIFICATION The research analyst primarily responsible for the content of this research report, in part or in whole, certifies that the views about the companies and their securities expressed in this report accurately reflect his/her personal views. The analyst also certifies that no part of his/her compensation was, is, or will be, directly, or indirectly, related to specific recommendations or views expressed in this report. As of the date the report is published, the analyst and his / her spouse and/or relatives and/or associate who are financially dependent on the analyst, do not hold interests in the securities recommended in this report (“interest” includes direct or indirect ownership of securities, directorships and trustee positions).
Industry Focus
Water Sector
Page 31
COMPANY-SPECIFIC / REGULATORY DISCLOSURES 1. DBSVHK and its subsidiaries do not have a proprietary position in the securities recommended in this report as of the date the report is
published. 2. DBSVHK, DBSVUSA, DBS Bank Ltd and/or other affiliates may beneficially own a total of 1% or more of any class of common equity
securities of the subject companies mentioned in this document as of the latest available date of the updated information. 3. Compensation for investment banking services:
DBSVHK, DBSVUSA, DBS Bank Ltd and/or other affiliates may have received compensation, within the past 12 months, and within the next 3 months may receive or intends to seek compensation for investment banking services from the subject companies mentioned in this document.
DBSVUSA does not have its own investment banking or research department, nor has it participated in any investment banking transaction as a manager or co-manager in the past twelve months. Any US persons wishing to obtain further information, including any clarification on disclosures in this disclaimer, or to effect a transaction in any security discussed in this document should contact DBSVUSA exclusively.
RESTRICTIONS ON DISTRIBUTION General This report is not directed to, or intended for distribution to or use by, any person or entity who is a citizen or resident of or
located in any locality, state, country or other jurisdiction where such distribution, publication, availability or use would be contrary to law or regulation.
Australia This document is being distributed in Australia by DBSVHK, which is exempted from the requirement to hold an Australian Financial Services Licence under the Corporation Act 2001 [“CA”] in respect of financial services provided to the recipients. DBSVHK is regulated by the Securities and Futures Commission under the laws of Hong KONG, which differ from Australian laws. Distribution of this report is intended only for “wholesale investors” within the meaning of the CA.
Hong Kong This report is being distributed in Hong Kong by DBS Vickers (Hong Kong) Limited which is licensed and regulated by the Hong Kong Securities and Futures Commission.
Indonesia This report is being distributed in Indonesia by PT DBS Vickers Securities Indonesia.
Malaysia This report is distributed in Malaysia by AllianceDBS Research Sdn Bhd ("ADBSR"). Recipients of this report, received from ADBSR are to contact the undersigned at 603-2604 3333 in respect of any matters arising from or in connection with this report. In addition to the General Disclosure/Disclaimer found at the preceding page, recipients of this report are advised that ADBSR (the preparer of this report), its holding company Alliance Investment Bank Berhad, their respective connected and associated corporations, affiliates, their directors, officers, employees, agents and parties related or associated with any of them may have positions in, and may effect transactions in the securities mentioned herein and may also perform or seek to perform broking, investment banking/corporate advisory and other services for the subject companies. They may also have received compensation and/or seek to obtain compensation for broking, investment banking/corporate advisory and other services from the subject companies.
Wong Ming Tek, Executive Director, ADBSR
Singapore This report is distributed in Singapore by DBS Bank Ltd (Company Regn. No. 196800306E) or DBSVS (Company Regn No. 198600294G), both of which are Exempt Financial Advisers as defined in the Financial Advisers Act and regulated by the Monetary Authority of Singapore. DBS Bank Ltd and/or DBSVS, may distribute reports produced by its respective foreign entities, affiliates or other foreign research houses pursuant to an arrangement under Regulation 32C of the Financial Advisers Regulations. Where the report is distributed in Singapore to a person who is not an Accredited Investor, Expert Investor or an Institutional Investor, DBS Bank Ltd accepts legal responsibility for the contents of the report to such persons only to the extent required by law. Singapore recipients should contact DBS Bank Ltd at 6327 2288 for matters arising from, or in connection with the report.
Thailand This report is being distributed in Thailand by DBS Vickers Securities (Thailand) Co Ltd. Research reports distributed are only intended for institutional clients only and no other person may act upon it.
United Kingdom
This report is being distributed in the UK by DBS Vickers Securities (UK) Ltd, who is an authorised person in the meaning of the Financial Services and Markets Act and is regulated by The Financial Conduct Authority. Research distributed in the UK is intended only for institutional clients.
Dubai
This research report is being distributed in The Dubai International Financial Centre (“DIFC”) by DBS Bank Ltd., (DIFC Branch) having its office at PO Box 506538, 3rd Floor, Building 3, East Wing, Gate Precinct, Dubai International Financial Centre (DIFC), Dubai, United Arab Emirates. DBS Bank Ltd., (DIFC Branch) is regulated by The Dubai Financial Services Authority. This research report is intended only for professional clients (as defined in the DFSA rulebook) and no other person may act upon it.
United States Neither this report nor any copy hereof may be taken or distributed into the United States or to any U.S. person except in compliance with any applicable U.S. laws and regulations. It is being distributed in the United States by DBSV US, which accepts responsibility for its contents. Any U.S. person receiving this report who wishes to effect transactions in any securities referred to herein should contact DBS Vickers Securities (USA) Inc (“DBSVUSA”) directly and not its affiliate.
Other jurisdictions
In any other jurisdictions, except if otherwise restricted by laws or regulations, this report is intended only for qualified, professional, institutional or sophisticated investors as defined in the laws and regulations of such jurisdictions.
DBS Vickers (Hong Kong) Limited
18th Floor Man Yee building, 68 Des Voeux Road Central, Central, Hong Kong
Tel: (852) 2820-4888, Fax: (852) 2868-1523