Embed Size (px)
Citation preview
Water Scarcity and Irrigation Efficiency in Egypt
Rehab Osman1, Emanuele Ferrari2, Scott McDonald3
This study provides quantitative assessments for the impacts of efficiency enhancement
for different types of irrigation water under water scarcity conditions. It employs a single
country CGE (STAGE) model calibrated to an extended version of a recently constructed
SAM for Egypt 2008/09. The SAM segments the agricultural accounts by season and by
irrigation scheme; Nile water- and groundwater-dependent as well as rain-fed
agricultural activities. The simulations show that Egypt should manage potential
reductions in the supply for Nile water with more efficient irrigation practice that secures
higher productivity for Nile water, groundwater and irrigated land. The results suggests
more ambitious plan to boost irrigation efficiency for summer rice in order to overweight
any potential shrinkages in its output and exports. Furthermore, even doubling all non -
conventional water resources is not sufficient to compensate the potential adverse
impacts of Nile water losses. This highlights the importance of irrigation efficiency for the
Egyptian economy.
Keywords: Water Availability, Agriculture Productivity, Nile Basin, Computable General
Equilibrium (CGE) Models.
JEL codes: Q25, D58, C68.
1 Corresponding author, Postdoctoral Research Fellow (Economics), Department of Accounting Finance and Economics, Faculty of Business,
Oxford Brookes University, Wheatley Campus, Oxford, OX33 1HX, UK, Tel: +44 (0)1865 485964, [email protected]; and Lecturer
(Economics), Institute of African Research and Studies, Cairo University, Giza, 12613, Egypt
2 Scientific Officer, European Commission, Joint Research Centre (JRC), Institute for Prospective Technological Studies (IPTS), Edificio Expo,
Inca Garcilaso 3, 41092 Seville, Spain, Tel: +34 954-488461, [email protected] 3 Visiting Professor, Institute of Agricultural Policy and Markets, University of Hohenheim, 70593 Stuttgart, Germany, Scott.Mcdonald@uni-
hohenheim.de
1
1. Water Scarcity in Egypt4
Under the current economic and population growth as well as the prospective environmental
challenges, Egypt is rapidly facing serious water scarcity issue. Water availability per capita
rate is already one of the lowest in the world. In 2000, water withdrawal per capita was
around 1000 m3. This is supposed to halve and, hence, fall below the scarcity rate by 2025.
Also, per capita renewable water share has been declining from 853.5 m3 (2002) to 785.4 m3
(2007) and reached 722.2 m3 (2012). This is predicted to reach 534 m3 by 2030 (FAO, 2014).
Nile is the main source of freshwater in Egypt with a share of more than 95 percent.
Agriculture is by far the main consumer of fresh water resources in Egypt. Irrigated
agriculture absorbs 85 percent of the annual water resource and 89 percent of Nile flows.
Besides, agriculture and irrigation in Egypt are virtually fully reliant on Nile water (80 percent
of irrigation requirements).
The issue of Egypt’s share of Nile waters is under negotiations. In April 2011, Ethiopia
has launched the construction of the Grand Ethiopian Renaissance Dam (GERD). With water
storage capacity of 63 BCM and energy generation capacity of 6,000 megawatt (MW), the
GERD is anticipated to be the biggest hydroelectric power plant and one of the largest water
reservoirs in the continent. Egyptian experts give indications of a possible water reduction
between 20 and 34 percent when the filling period overcuts the drought period. This is
estimated to be 11-19 BCM over the Dam’s filling period.
These facts emphasize the importance of potential impact of Nile water availability on the
Egyptian economy. Shortage of fresh water resources would have outstanding impacts on agricultural
activities and the whole economy. The urgent tasks are thus to reassess the productivity of irrigation
water and land as well as the efficiency of the overall irrigation system and to examine the optimal
allocation of irrigation resources.
Indeed, the significance and direction of irrigation efficiency impacts on agriculture is an
empirical exercise. Overall economic responsiveness to water availability and efficiency
shocks depends on the macroeconomic structure. In accordance with the forward and
backward linkages across sectors, the net effect is formulated and the new production mix is
defined. Furthermore, temporal and spatial water availability and efficiency generate
4
Disclaimer: the views expressed are purely those of the authors and may not in any circumstances be regarded as stating an official position of the
European Commission.
2
differentiated impulses among agricultural activities and across irrigation seasons. Clearly,
Computable General Equilibrium (CGE) models provide a theoretically consistent and
empirically sensible framework for contemplating such interlinked economy-wide impacts.
This study aims at examining the potential implications of enhancements in irrigation efficiency
under water scarcity conditions. It employs a single-country CGE model calibrated to an extended
version of a recently constructed Social Accounting Matrix (SAM) for Egypt 2008/09. The SAM
contains an unprecedented level of details on the Egyptian agricultural and irrigation schemes.
The simulation results answer several research questions. How significant are potential effects
of Nile water reductions on the agricultural sector and the whole economy likely to be? What are the
sufficient enhancements in irrigation efficiency required to compensate the potential losses of Nile
water? Is investing in securing non-conventional water resources, actually, a viable alternative
strategy to the irrigation efficiency strategy?
The rest of the paper is organized as follows. Section 2 describes the existing irrigation scheme
and irrigation resources. Section 3 places this study in its appropriate position within the relevant
literature. Based on the underlying database (described in Section 4) main features of the agricultural
and irrigation schemes are examined in Section 5. Section 6 describes the main developments
conducted on the employed model to serve the purposes of this study. Section 7 presents the
simulation scenarios and Section 8 interprets simulation results. Section 9 runs a sensitivity analysis
to test the robustness of the model results with respect to variations in the model settings. Section 10
discusses the main findings and concludes.
2. Efficient Plantation and Inefficient Irrigation
As Keller and Keller (1995, p. 6) describe “Egypt’s Nile Valley irrigation system (NVIS) is an
excellent example of a multiple use-cycle system with a high global efficiency but low local
efficiencies”. The following brief description of the irrigation scheme and usage of irrigation
resources in Egypt illustrates this paradox.
Egypt follows a multi-cropping system that permits planting up to three crops a year. Planting crops
rotates round the year during three irrigation seasons; winter (November-May), summer (May-
September) and Nili (i.e. Nile flood), from September to November. The main crops are wheat,
berseem and broad-beans (in the winter rotation), cotton and rice (in the summer rotation) whereas
maize and millet are flood crops. This rotating irrigation system helps in improving land productivity.
For example, cultivating berseem in winter improves the soil quality before soil-demanding cotton is
being planted in summer.
Nevertheless, the bulk of irrigated land depends on low-efficiency surface irrigation scheme.
3
This surface irrigation mainly depends on a single conventional source of water – Nile water. The
storage reservoir of Nasser Lake provides 56 billion m3 (BCM) per annum. Nile water naturally serves
irrigated land in the Nile Valley and Nile Delta. These irrigated lands constitute 85 percent out of the
8.7 million feddans of Egyptian irrigated land.
The existing surface irrigation scheme causes high water losses, decline in land productivity,
waterlogging and salinity problems. Moreover, unsustainable agricultural practices and improper
irrigation management affect the quality of the country’s water resources. Reductions in irrigation
water quality have, in their turn, harmful effects on irrigated soils and crops. The FAO’s Country
Programming Framework (2013, p. 13) states that “… one of the main components of the agricultural
development strategy is to achieve a gradual improvement of the efficiency of irrigation systems to
reach 80 per cent in an area of 8 m feddans, and to reduce the areas planted to rice from 1.673 m
feddan (2007) to 1.3 m feddan by 2030 in order to save an estimated 12 400 million cubic meters of
water”.5
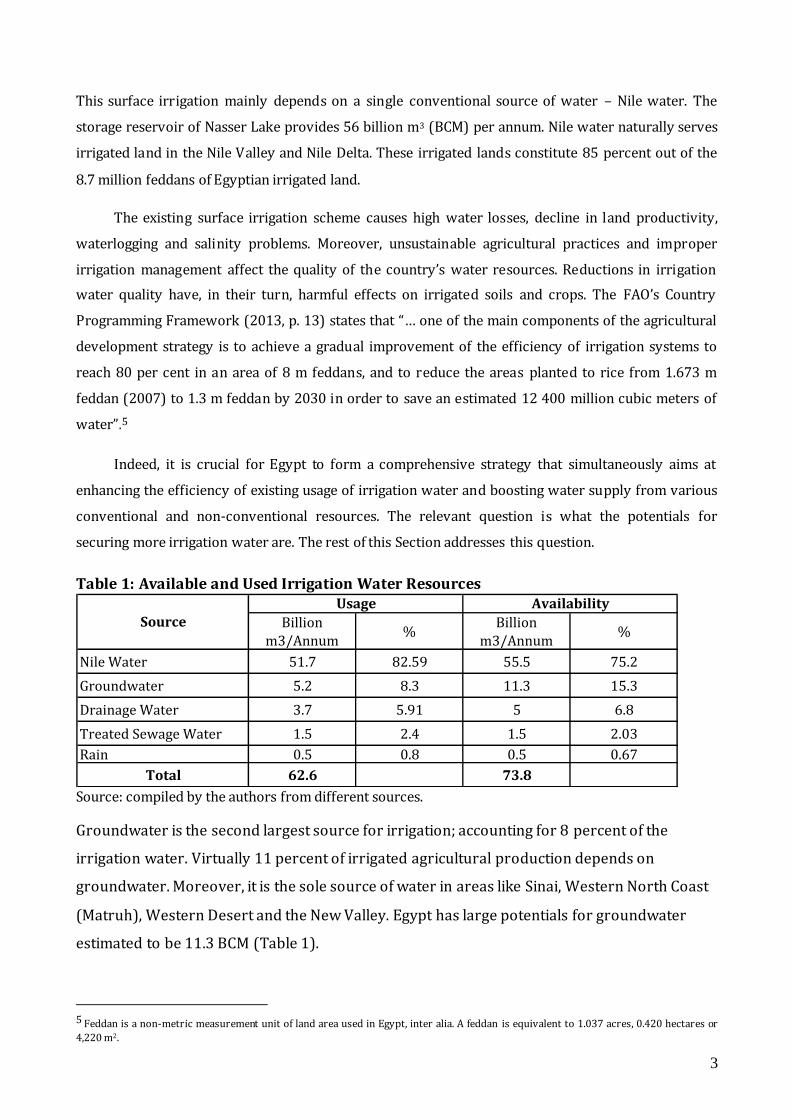
Indeed, it is crucial for Egypt to form a comprehensive strategy that simultaneously aims at
enhancing the efficiency of existing usage of irrigation water and boosting water supply from various
conventional and non-conventional resources. The relevant question is what the potentials for
securing more irrigation water are. The rest of this Section addresses this question.
Table 1: Available and Used Irrigation Water Resources
Billion
m3/Annum%
Billion
m3/Annum%
Nile Water 51.7 82.59 55.5 75.2
Groundwater 5.2 8.3 11.3 15.3
Drainage Water 3.7 5.91 5 6.8
Treated Sewage Water 1.5 2.4 1.5 2.03
Rain 0.5 0.8 0.5 0.67
Total 62.6 73.8
Usage Availability
Source
Source: compiled by the authors from different sources.
Groundwater is the second largest source for irrigation; accounting for 8 percent of the
irrigation water. Virtually 11 percent of irrigated agricultural production depends on
groundwater. Moreover, it is the sole source of water in areas like Sinai, Western North Coast
(Matruh), Western Desert and the New Valley. Egypt has large potentials for groundwater
estimated to be 11.3 BCM (Table 1).
5 Feddan is a non-metric measurement unit of land area used in Egypt, inter alia. A feddan is equivalent to 1.037 acres, 0.420 hectares or
4,220 m2.
4
Egypt does not receive rainfall except for a narrow strip along the Northern coastal area
where the average rainfall does not exceed 200 mm (about 1.5 BCM/year). This amount
cannot be considered as a reliable source of water due to its spatial and temporal variability.
Land irrigated by rainfall water locates alongside the Mediterranean shore. Besides, around
250 thousand feddans in Sinai and 150 thousand feddans in the Western North Coast depend
on seasonal rains.
Other non-conventional water resources are basically recycled drainage water and
treated sewage water. Annual drainage water utilized in agriculture is estimated to be 3.7
BCM with potentials to reach 5 BCM. Drainage water is evenly mixed by Nile water and reused
in irrigating 450 thousand feddan in North Sinai. Treated sewage water used in irrigation is
1.5 BCM with estimations to reach 2.4 BCM in 2027.
3. Literature Review
Irrigation water is a central aspect of both natural resources and environmental economics
and applied water policy analysis. Dudu and Chumi (2008) and Ponce et al., (2012) review the
partial and general equilibrium literature on modelling water at country and global level. The
most recent literature indicates how CGE model are well equipped to answer questions
related to water, in particular water scarcity and irrigation issues. CGEs prove to be flexible
enough to adapt their nested production function to include water both as a production factor
(in different position of the nest according to the choice of the modeller) used mainly by
farmers and as a commodity consumed by households. Besides, the economy-wide approach
allows researchers to consider effects of water scarcity on all economic sectors, not only in
agriculture, and to consider indirect effects as income effects due to change in water supply
(or policies affecting the water sector). At the same time, these surveys pinpoint that the areas
of irrigation, water allocation and agricultural productivity is still scarcely explored by the
literature and have potential for further research.
The issue of water scarcity in Egypt, together with its possible exacerbating factors (e.g.,
economic, population and food demand growth, climate change and the current debate over
the allocation of the Nile's waters among its ten Basin countries) is widely recognized in the
current literature (Gohar and Ward, 2010).
5
Many studies employing a CGE model have examined the economic implications of
water availability e.g., as part of climate change impact analysis (Strzepek et al. (1995), Yates
and Strzepek (1996) and Yates and Strzepek (1998)).
A few studies consider variability in water supply and the economic value of reducing
variability. Strzepek and Yates (2000) employ a recursive dynamic CGE model to examine
impacts of changes in the Nile River on the Egyptian Economy to the year 2060. Strzepek et
al., (2008) use a comparative static CGE to evaluate the economy-wide impacts of the High
Aswan Dam on the Egyptian economy.6 The study specifies water as a nested CES production
function through a fixed land-water technology. Also, it explicitly specifies a risk premium.
The results, among others, show negative impact of the Dam on summer crops.
Another strand of the relevant literature explores different approaches for maximizing
irrigation water efficiency in Egypt. Gohar and Ward (2010) examine the economic efficiency
impacts of different irrigation water allocation policies in Egypt. They show that flexible
irrigation pattern across locations, seasons and crops could improve the irrigation water
efficiency. Bader (2004), applying a Mathematical Programming approach, claims that there is
scope for improvement farms' returns through optimisation of irrigation water use and for
improvement of irrigation efficiency which leads to increase in farm income and crop
production.
He et al., (2004) examine the impact of water pricing and taxation policies on water
efficiency in Egypt. The study employs a static partial equilibrium Agricultural Sector Model of
Egypt (ASME) model for Egypt.
Robinson and Gehlhar (1995a) examine the effect of fiscal reforms by removing
subsides and taxes. The study specifies physical supply constraints for both water and land.
The first order conditions for water and land constraints are given by a linear cost function.
To ensure that at least one of the two constraints is binding, the model introduces an explicit
maximand. The same authors also investigate the impacts of establishing a market for water
and water pricing policies for the agricultural sector in Egypt (Robinson and Gehlhar, 1995b).
Overall, the implication of irrigation water scarcity and variations of agricultural factor
productivities for economic and trade structures in Egypt are not yet thoroughly examined. Indeed,
impacts generated under different water supply and productivity widely vary from an irrigation
6 For detailed description of economic, social and environmental impacts of the High Aswan Dam, see Abu-Zeid and El-Shibini (1997).
6
scheme to another. Furthermore, changes in availability and productivity generate differentiated
impulses not only among agricultural sectors but also across irrigation seasons. Therefore, studies that
do not represent different irrigation schemes and neglect irrigation seasonality do not produce
complete results.
The current study provides a rigorous quantitative impact assessment of changing water
productivity under water scarcity scenario for Egypt. It offers major contributions to the CGE
literature on water issues in Egypt. Firstly, the study introduces water as a separate production factor.
The study employs an elaborated version of a recently constructed SAM for Egypt 2008/09(see
Section 4), which for the first time explicitly represents irrigation water in Egypt. Furthermore, the
study accounts for different irrigation schemes. It represents Nile water-, groundwater- and rain-fed-
dependent activities. This detailed representation of irrigation schemes and agricultural activities
requires specifying a five level nested CES production function (see Section 6). Finally, the study takes
into account irrigation seasonality distinguishing irrigation activities not only by irrigation scheme but
also by irrigation season. Nile water, ground water, irrigated land and rain-fed land are segmented by
irrigation season; i.e. winter, summer, Nili as well as year-round.
4. An Extended SAM for Egypt 2008/09
A Social Accounting Matrix (SAM) provides a consistent framework, within which flows of
expenditure and income for the different agents in the economy at hand are recorded. A SAM
is a square matrix where each agent is represented by a column and a row that record,
respectively, the account’s expenditures and receipts.
The study employs an extended version of a recently constructed SAM for Egypt
2008/09, (Osman et al., forthcoming). The SAM is specifically developed to take into account
the Egyptian multi-cropping irrigation system. It provides detailed representation for the
agricultural activities and factors across different irrigation seasons. Furthermore, it
introduces irrigation water as a separate production factor. Nile water and irrigated land are
segmented by irrigation season.
For the purpose of this study, the 2008/09 SAM has been developed in order to
represent different irrigation systems. Three main contributions are added to the 2008/09
SAM: introducing groundwater irrigation scheme, representing rain-fed-dependent
agricultural activities and distinguishing agricultural activities and factors by irrigation
season.
7
Firstly, groundwater is introduced as another type of irrigation water. Detailed data on
cultivated land area and groundwater used to irrigate crops are compiled from (CAPMAS,
2009). Subsequently, Nile water- and groundwater-dependent agricultural activities are
distinguished. Due to lack of data, the study assumes that production cost structures for these
groundwater-dependent are similar to the corresponding seasonal crops irrigated by Nile
water. In other words, intermediate inputs and factor payments required to cultivate a feddan
of Nile-dependent winter vegetables are exactly the same for a feddan of groundwater -
dependent winter vegetables. Using water and land requirements, production cost for
groundwater-dependent crops are then computed.
8
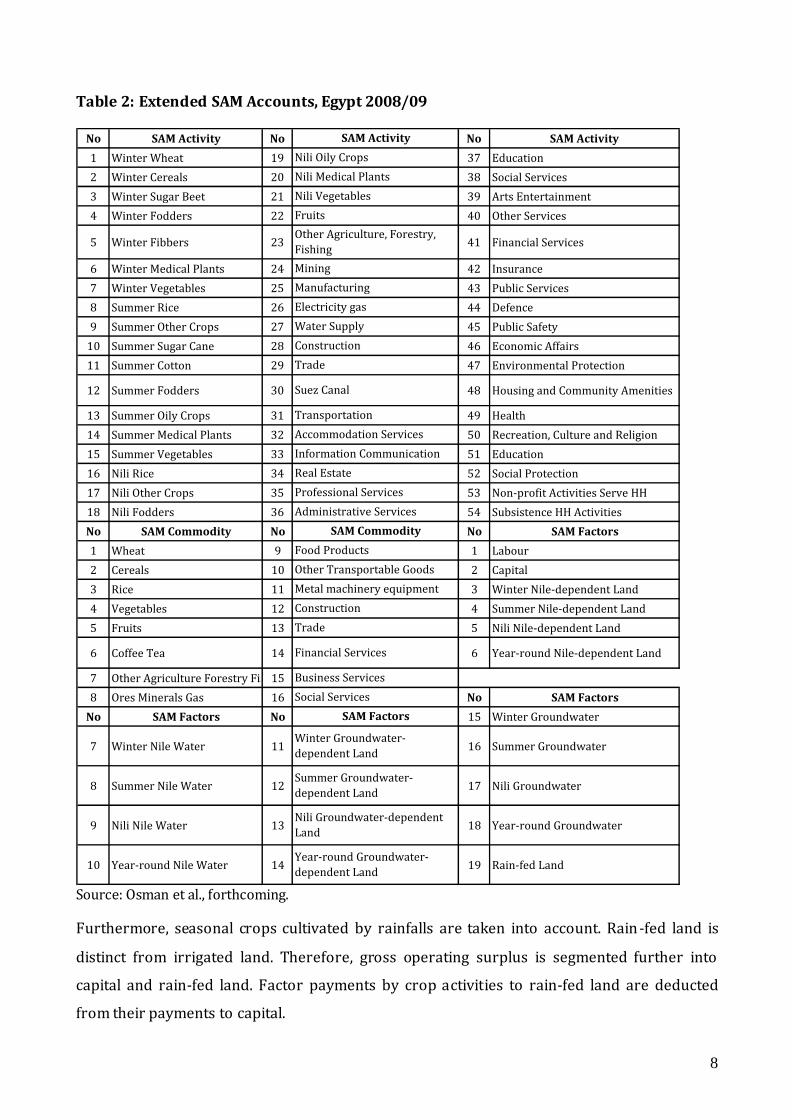
Table 2: Extended SAM Accounts, Egypt 2008/09
No SAM Activity No No SAM Activity
1 Winter Wheat 19 37 Education
2 Winter Cereals 20 38 Social Services
3 Winter Sugar Beet 21 39 Arts Entertainment
4 Winter Fodders 22 40 Other Services
5 Winter Fibbers 23 41 Financial Services
6 Winter Medical Plants 24 42 Insurance
7 Winter Vegetables 25 43 Public Services
8 Summer Rice 26 44 Defence
9 Summer Other Crops 27 45 Public Safety
10 Summer Sugar Cane 28 46 Economic Affairs
11 Summer Cotton 29 47 Environmental Protection
12 Summer Fodders 30 48 Housing and Community Amenities
13 Summer Oily Crops 31 49 Health
14 Summer Medical Plants 32 50 Recreation, Culture and Religion
15 Summer Vegetables 33 51 Education
16 Nili Rice 34 52 Social Protection
17 Nili Other Crops 35 53 Non-profit Activities Serve HH
18 Nili Fodders 36 54 Subsistence HH Activities
No SAM Commodity No No SAM Factors
1 Wheat 9 1 Labour
2 Cereals 10 2 Capital
3 Rice 11 3 Winter Nile-dependent Land
4 Vegetables 12 4 Summer Nile-dependent Land
5 Fruits 13 5 Nili Nile-dependent Land
6 Coffee Tea 14 6 Year-round Nile-dependent Land
7 Other Agriculture Forestry Fishery15
8 Ores Minerals Gas 16 No SAM Factors
No SAM Factors No 15 Winter Groundwater
7 Winter Nile Water 11 16 Summer Groundwater
8 Summer Nile Water 12 17 Nili Groundwater
9 Nili Nile Water 13 18 Year-round Groundwater
10 Year-round Nile Water 14 19 Rain-fed Land
SAM Factors
Winter Groundwater-
dependent Land
Summer Groundwater-
dependent Land
Nili Groundwater-dependent
Land
Year-round Groundwater-
dependent Land
SAM Activity
Nili Oily Crops
Nili Medical Plants
Nili Vegetables
Fruits
Other Agriculture, Forestry,
Fishing
Mining
Manufacturing
Electricity gas
Water Supply
Construction
Construction
Trade
Suez Canal
Transportation
Accommodation Services
Information Communication
Real Estate
Financial Services
Business Services
Social Services
Professional Services
Administrative Services
SAM Commodity
Trade
Food Products
Other Transportable Goods
Metal machinery equipment
Source: Osman et al., forthcoming.
Furthermore, seasonal crops cultivated by rainfalls are taken into account. Rain-fed land is
distinct from irrigated land. Therefore, gross operating surplus is segmented further into
capital and rain-fed land. Factor payments by crop activities to rain-fed land are deducted
from their payments to capital.
9
For consistency, groundwater- and rain-fed-dependent activities have to follow the
same seasonal classification as for the Nile water-dependent activities. As such, activity
accounts for crops irrigated by groundwater and for rain-fed crops are synchronized and
segmented by irrigation season; i.e. winter, summer, Nili as well as year-round.
A stochastic version of the cross-entropy (CE) methodology is used to balance the
original SAM, disaggregate the agricultural activity and commodity, and estimate the extended
SAM. Aggregates from national accounts and supply/use tables are used to control the
transaction values for the extended SAM.7 As portrayed in Table 2, the extended SAM contains
101 accounts: 54 activities, 16 commodities, 19 factors, 5 institutions, 4 tax instruments as
well as trade margin, savings/investment and rest of the world accounts.
5. Main Economic Features
Agriculture plays a significant role in the Egyptian economy. Agriculture accounts for more
than 10 percent of GDP and employs 8 percent of total labour payments. The agricultural
exports constitute 13 percent of exports. The economy has also strong industrial base,
forming 40 percent of GDP, of which 30 percent is sourced from manufacturing activities.
Services are the main productive activity, contributing almost half of GDP. Public services
account a sizable share of GDP (more than 7 percent). Furthermore, public employment
constitutes a substantial share of labour force (36 percent).
Vegetables comprise 23 percent of agricultural output evenly spread over the winter
and summer seasons. The sector roughly consumes 6 percent of Nile water used in each of the
irrigation seasons. Wheat represents 13 percent of agricultural production. It is one of the
main users of Nile land (almost 30 percent) and uses a tenth of Nile water. Rice is of a great
importance to the Egyptian economy. It contributes more than 6 percent of agricultural
production. Furthermore, it is one of the main exporting sectors. Rice is cultivated mainly in
the summer season with only 0.4 percent of rice output grows in the Nili season. This water-
intensive crop consumes more than 30 percent of annual irrigation Nile water and more than
half of summer Nile water. Fodder crops, represents another 13 percent of agricultural
production and an intensive users of Nile water (more than 17 percent).
7 For detailed information on Cross Entropy, see Robinson and El Said, (2000) and Robinson et al., (2000).
10
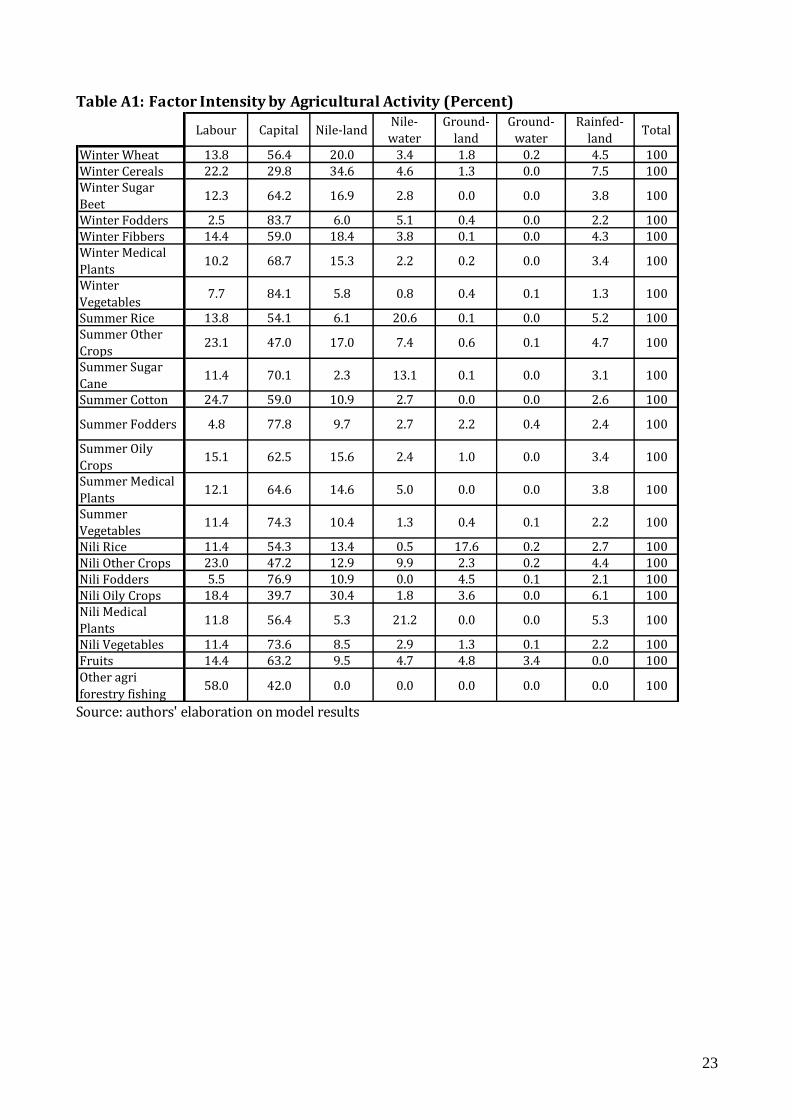
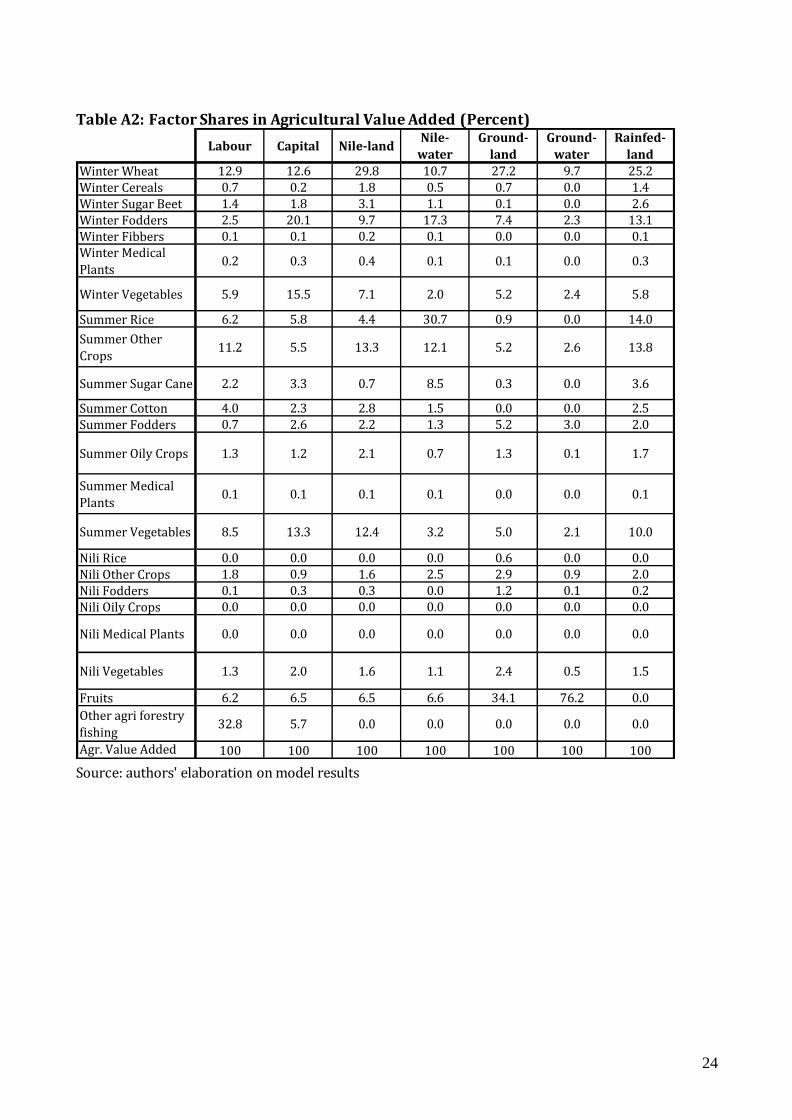
Factor intensity reflects the prevailing technology in different activities while factor
allocation represents factor usage across activities; see Table A1 and Table A2. These two
indicators are essential for understanding any potential change in factor rents and the
consequent changes in factor allocation after a policy shock. Among the agricultural sectors,
vegetables have the lowest Nile water/land intensity ratios. Nile water/land intensity ratios
for the seasonal vegetables sectors range 6-12 percent. As such, the vegetables sectors are
relatively less Nile water/land-intensive compared to other sectors. Besides, the vegetables
sectors employ small shares of Nile-water (6.3 percent) and Nile-land; 21 percent.
Nile water/land accounts for virtually 15 percent of agricultural value added and 90
percent of irrigated agriculture. Groundwater and land irrigated by ground water have small
shares in agricultural value added (less than 2 percent) and in irrigated agriculture (8
percent).
6. Single Country STAGE CGE Model
This study uses a variant of the comparative static single-country CGE Static Applied General
Equilibrium (STAGE) model.8 In this version of the model, called STAGE-WL, a Constant
Elasticity of Substitution (CES) nest is added to the production function representing derived
demand for Nile water and land as well as other sources of irrigation water.
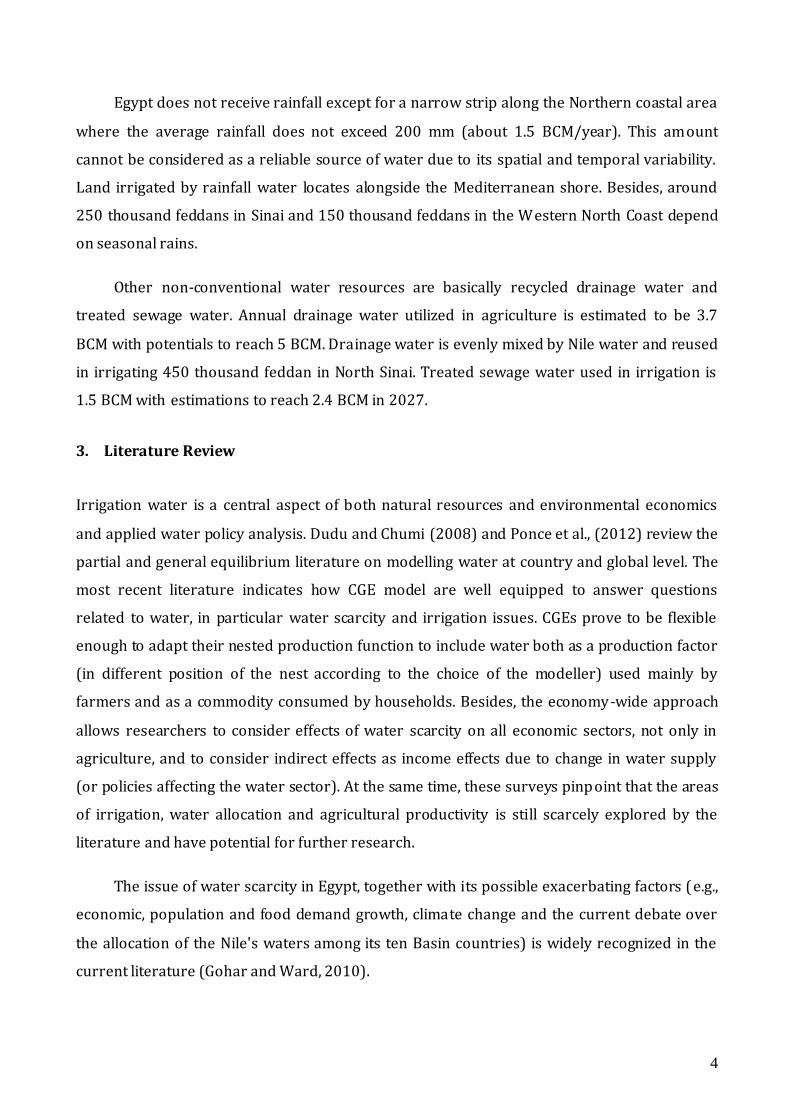
6.1 Production Specification
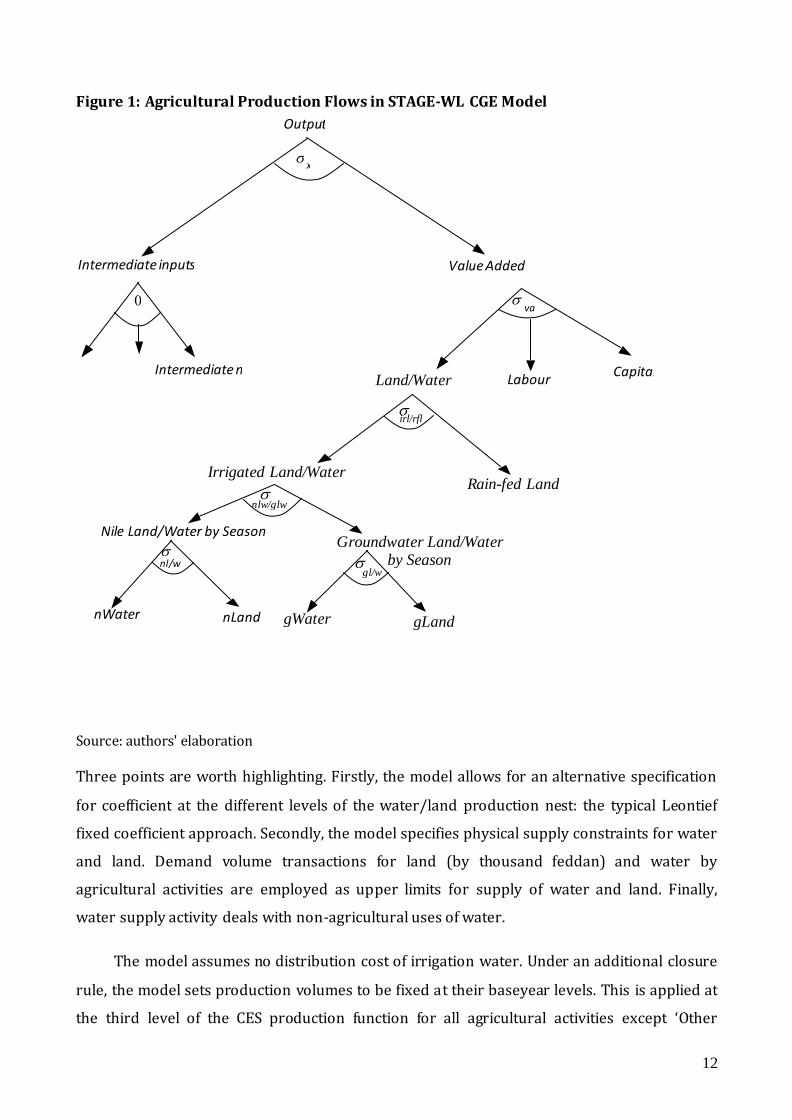
Production relationships for agricultural activities are specified through a five level standard
nested CES function (Figure 1). At the top level, value added and intermediate demand are
combined using a CES aggregator. At the second level of the nest, a CES production technology
specifies the aggregate value added as a function of primary inputs demand in each activity.
The primary inputs are capital, labour and aggregate water/land for agriculture. By
maximizing profit, farmers determine the optimal supply of crops according to the production
technology prevailing in each activity. This per se specifies their derived demand for
production factors. Farmers' demand of production factor equalizes its marginal product with
its return rate in each activity.
8 STAGE model, described in detail in McDonald S. (2007), is a descendant of the USDA ERS model (Robinson et al., 1990). Luckmann and
McDonald (2014) provide a detailed technical documentation for the STAGE_W CGE model. In this advanced variant of the model, different types of water are specified as production factors, productive activities and as produced commodities. This elaborated presentation of water allows for simulating a wide range of policy scenarios.
11
For the purposes of this study, aggregate land for agriculture is modelled as a composite
of irrigated and rain-fed land. At the third level of the agricultural production function, rain-
fed land and composite irrigated land are combined through a CES aggregator. Composite
irrigated land is land irrigated by either Nile water or groundwater.
The model segments groundwater-dependent agricultural activities from Nile water-
dependent agricultural activities. At the fourth level of the agricultural production function,
Nile land/water composite and groundwater land/water composite are combined through a
CES aggregator. This allows for specifying different substitutability between these two
irrigated lands. Both types are mobile across crops subject to changes in the ratios for land
rent in each activity to the average land rent.
At the bottom level, water and land are combined according to two CES aggregators –
each for Nile water-dependent and for groundwater-dependent activities. The greater the
irrigation water quality available for specific activities, the lower is the water price, and the
higher is the land rent. The price for composite irrigated land/water changes depending, inter
alia, on the prevailing irrigation technology. The latter is measured by factor intensity for
irrigated land and water. The activities with increasing irrigated land/water price withdraw
irrigated land/water from other activities according to the elasticity of substitution between
two irrigated lands: Nile water-dependent land and groundwater-dependent land. Excess
irrigated land supply pushes irrigated land rent to drop to clear the market. Farmers utilize
irrigated land to equalize its marginal product with its rent rate in each activity. This per se
specifies the optimal derived demand for irrigated land. The elasticity of substitution between
water and land are based on estimations provided by Calzadilla et al., (2011) for the Middle-
East region which is equal to 0.06.
12
Figure 1: Agricultural Production Flows in STAGE-WL CGE Model
Source: authors' elaboration
Three points are worth highlighting. Firstly, the model allows for an alternative specification
for coefficient at the different levels of the water/land production nest: the typical Leontief
fixed coefficient approach. Secondly, the model specifies physical supply constraints for water
and land. Demand volume transactions for land (by thousand feddan) and water by
agricultural activities are employed as upper limits for supply of water and land. Finally,
water supply activity deals with non-agricultural uses of water.
The model assumes no distribution cost of irrigation water. Under an additional closure
rule, the model sets production volumes to be fixed at their baseyear levels. This is applied at
the third level of the CES production function for all agricultural activities except ‘Other
Output
va
Labour
Nile Land/Water by Season
Capital
x
Intermediate inputs Value Added
nLand nWater
nl/w
Intermediate n
Groundwater Land/Water by Season
Irrigated Land/Water
nlw/glw
gWater gLand
gl/w
Land/Water
Rain-fed Land
irl/rfl
13
Agriculture Forestry Fishery’. This specification allows endogenously quantifying changes in
efficiency required to offset the water losses keeping agricultural output unchanged. Under
different levels of water loss, generated changes in efficiency are measured for the land/water
composite production factor.
6.2 Model Closure Rules
Egypt is a small country in the world market. It is, thus, plausible to fix world prices for
exports and imports. The model assumes that current account balance is fixed at its initial
benchmark. To clear the external balance, real exchange rate adjusts. This is the typical choice
for developing economies where foreign credit is limited and fixing current account reflects
the economic reality. The model adopts an investment-driven closure; saving rate adjusts to
generate the required savings to finance the base year investment. The combination of
exogenous investments and foreign savings, known as Johansen closure, avoids the
misleading change in household welfare due to change in foreign savings and investments in a
single-period model (Lofgren et al., 2002)9.
Capital is mobile and fully employed (medium-run closure rule). On the other hand,
labour is mobile, albeit under employed. Unemployment in labour markets is the most
reasonable assumption in a country where unemployment rate is constantly above 10
percent. Water and land, for both Nile water-dependent and groundwater-dependent
activities, are fully employed, but season-specific. For the purposes of this study, water and
land supply are set to be fixed for each irrigation season. Thus, water and land are mobile
across agricultural activities within each irrigation season but not across different seasons.
This specification implies that water and land would have distinct seasonal prices.
7. Simulation Scenarios
Four main simulation scenarios distinguish irrigation systems according to different levels of
irrigation efficiency (Table 3). The conventional definition of efficiency for a given input is
measured by the generated output. Keller and Keller (1995) demonstrate that the classical
definition of irrigation water efficiency is applicable to examining irrigation design and
management but is not precise in the case of studying water allocation. Failure to consider the
9
The result could be misleading because increase of foreign savings (or investment decrease) raises households' welfare while a
comparative static analysis does not take into account possible welfare decreases in following periods due to a higher foreign debt or a smaller capital stock.
14
inevitable water discharge, which occurs during irrigation in form of runoff or seepage, and
the recycled drainage water leads to ill-defined measure of efficiency. For the purpose of this
study, it is appropriate to use productivity as an approximate for efficiency. For agricultural
activities producing the same crop, water quality and, hence, land productivity varies
according to the employed irrigation system: Nile water-dependent versus groundwater-
dependent.
The first scenario (N-Wtr Loss) simulates the Nile water loss in isolation, which reflects
the upper limit of potential reductions of Egypt’s share of Nile water due to filling of the GERD
reservoir. It assumes a 34 percent reduction in Nile water supply evenly spread across
irrigation seasons.
The second scenario (Irrg-Eff) considers improvements of irrigation efficiency. This is
specified as external shocks of factor-specific productivities. At the fourth level of the
production nest, Nile land/water and groundwater land/water productivities rise by 30
percent. For better interpretation of the determinants of the results, this scenario is
decomposed into two components according to the source of the simulated irrigation
efficiency: Nile water-dependent irrigation (Nile Irrg-Eff) and groundwater-dependent
irrigation (Ground Irrg-Eff). The simulation scenario does not specify the underlying source
for funding the simulated improvements in irrigation efficiency. In other words, government
expenditures on R & D, for example, are not explicitly specified.
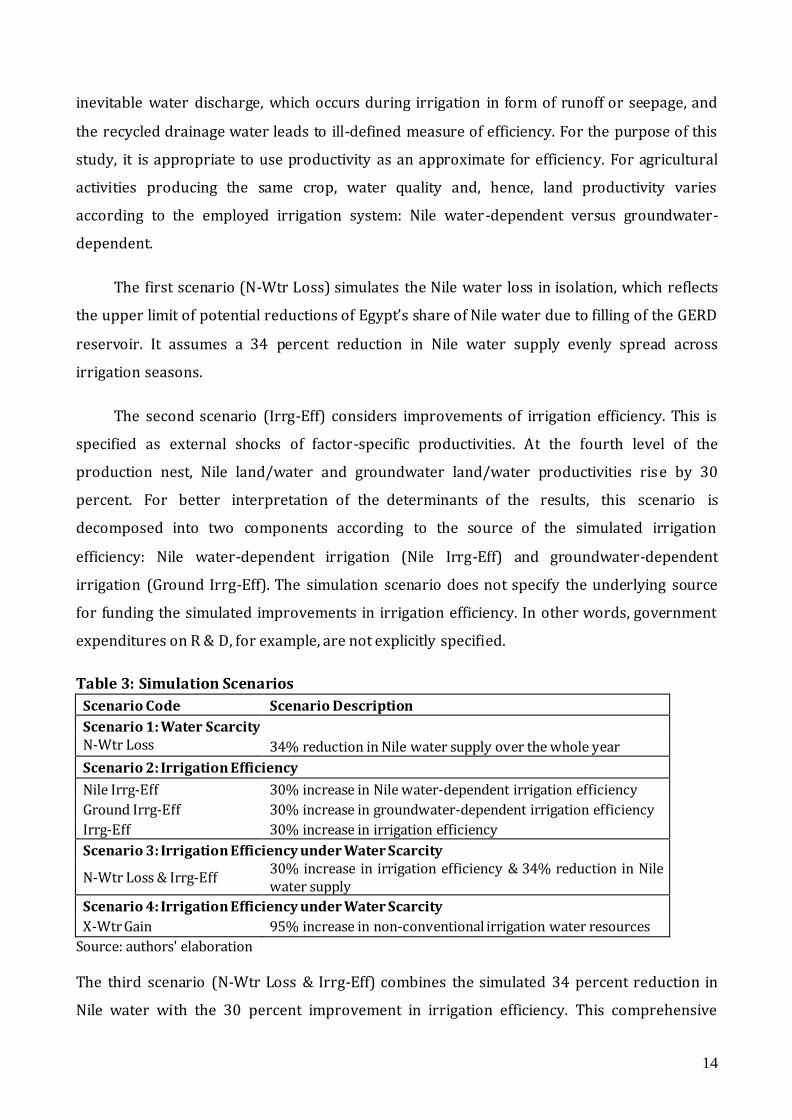
Table 3: Simulation Scenarios
Scenario Code Scenario Description
Scenario 1: Water Scarcity N-Wtr Loss 34% reduction in Nile water supply over the whole year
Scenario 2: Irrigation Efficiency
Nile Irrg-Eff 30% increase in Nile water-dependent irrigation efficiency
Ground Irrg-Eff 30% increase in groundwater-dependent irrigation efficiency
Irrg-Eff 30% increase in irrigation efficiency
Scenario 3: Irrigation Efficiency under Water Scarcity
N-Wtr Loss & Irrg-Eff 30% increase in irrigation efficiency & 34% reduction in Nile water supply
Scenario 4: Irrigation Efficiency under Water Scarcity
X-Wtr Gain 95% increase in non-conventional irrigation water resources
Source: authors' elaboration
The third scenario (N-Wtr Loss & Irrg-Eff) combines the simulated 34 percent reduction in
Nile water with the 30 percent improvement in irrigation efficiency. This comprehensive
15
scenario provides quantitative assessments for the impact of quality enhancements of
different types of irrigation water under water scarcity conditions.
The last scenario (X-Wtr Gain) assumes ceteris paribus more non-conventional water
resources are secured to compensate the simulated reductions in Nile water. It implicitly
represents the case in which Nile water loss is compensated by increases in recycled drainage
water and treated sewage water. As discussed earlier, the potential average increase in these
two water resources is estimated to be 95 percent.10 Due to lack of data, an increase in
groundwater is simulated as a proxy for potential increases in all other non-conventional
water resources. Groundwater used in irrigation is roughly equivalent to both recycled
drainage and treated sewage water combined (Table 1). This scenario simulates a 95 percent
increase in groundwater supply across different irrigation seasons.
8. Simulation Results
8.1 Macro-economic Impacts
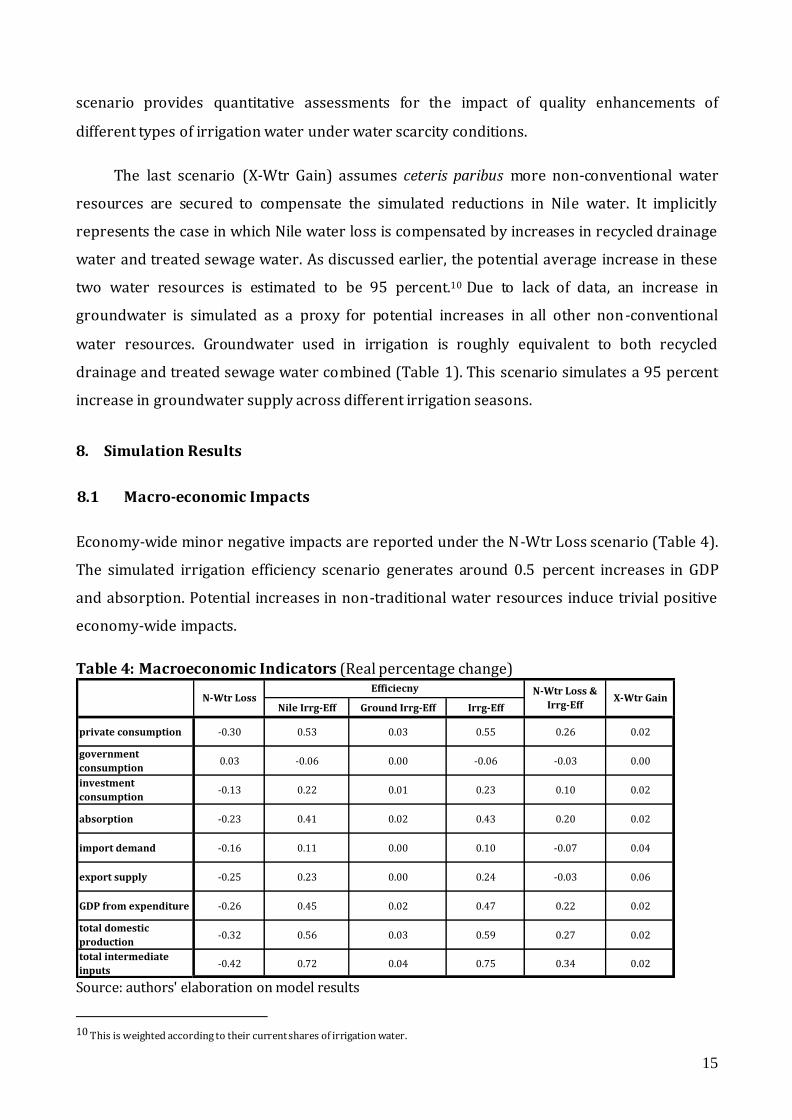
Economy-wide minor negative impacts are reported under the N-Wtr Loss scenario (Table 4).
The simulated irrigation efficiency scenario generates around 0.5 percent increases in GDP
and absorption. Potential increases in non-traditional water resources induce trivial positive
economy-wide impacts.
Table 4: Macroeconomic Indicators (Real percentage change)
Nile Irrg-Eff Ground Irrg-Eff Irrg-Eff
private consumption -0.30 0.53 0.03 0.55 0.26 0.02
government
consumption0.03 -0.06 0.00 -0.06 -0.03 0.00
investment
consumption-0.13 0.22 0.01 0.23 0.10 0.02
absorption -0.23 0.41 0.02 0.43 0.20 0.02
import demand -0.16 0.11 0.00 0.10 -0.07 0.04
export supply -0.25 0.23 0.00 0.24 -0.03 0.06
GDP from expenditure -0.26 0.45 0.02 0.47 0.22 0.02
total domestic
production -0.32 0.56 0.03 0.59 0.27 0.02
total intermediate
inputs -0.42 0.72 0.04 0.75 0.34 0.02
Efficiecny N-Wtr Loss &
Irrg-EffN-Wtr Loss X-Wtr Gain
Source: authors' elaboration on model results
10 This is weighted according to their current shares of irrigation water.
16
The generated positive effects under the Irrg-Eff scenario imply that the simulated 30 percent
improvement in irrigation efficiency is sufficient to offset the macroeconomic loss due to the
34 percent reduction in Nile water supply. The results are primarily driven by the simulated
enhancement in Nile water-dependent irrigation efficiency. This is attributed to the major
importance of the Nile water-land for agriculture as a whole and irrigated agricultural in
particular.
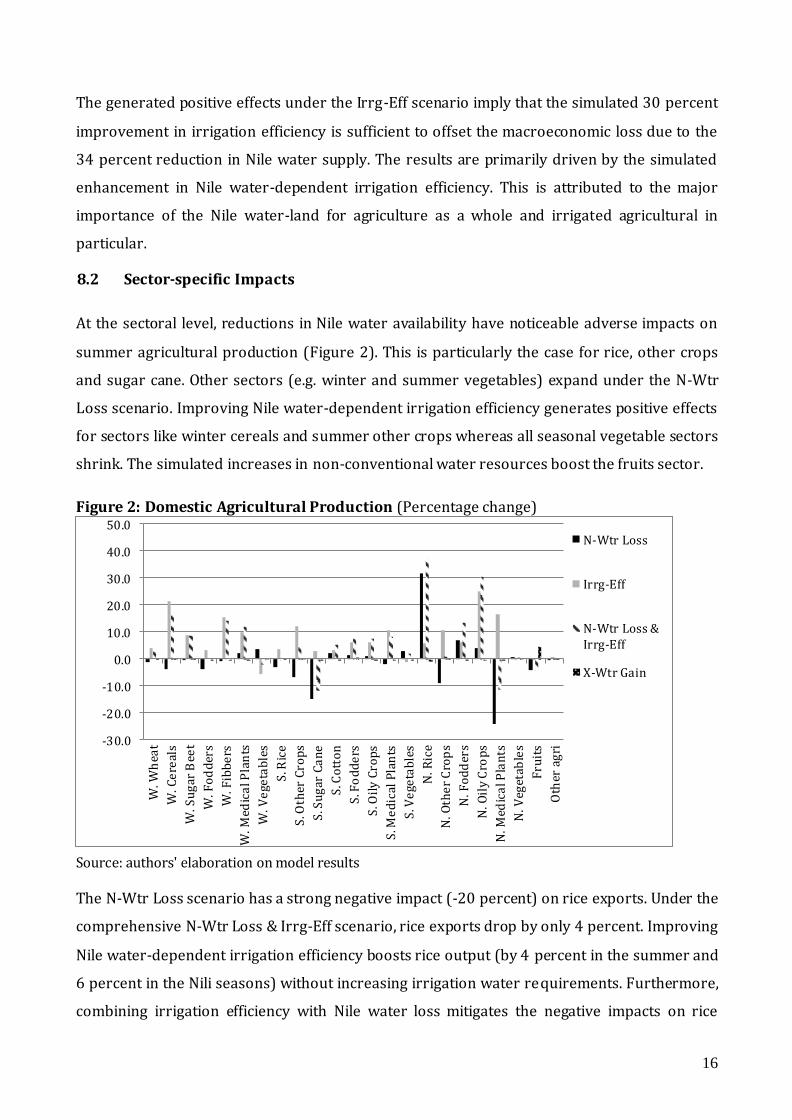
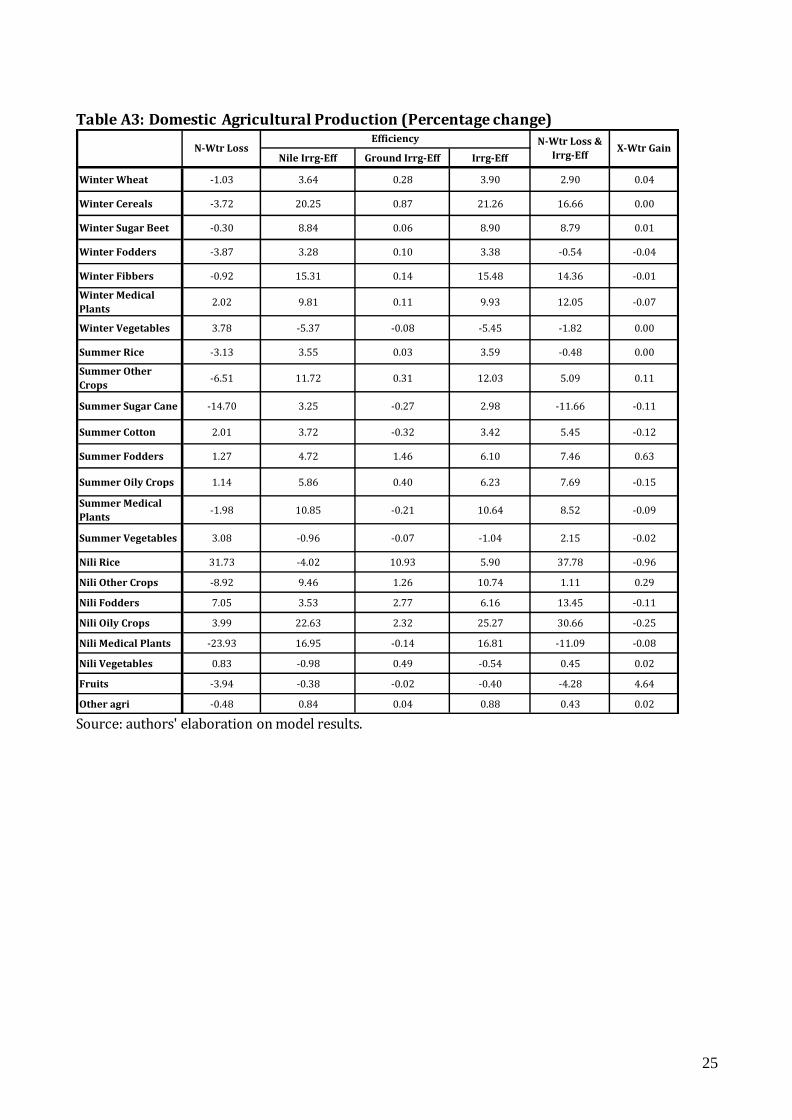
8.2 Sector-specific Impacts
At the sectoral level, reductions in Nile water availability have noticeable adverse impacts on
summer agricultural production (Figure 2). This is particularly the case for rice, other crops
and sugar cane. Other sectors (e.g. winter and summer vegetables) expand under the N-Wtr
Loss scenario. Improving Nile water-dependent irrigation efficiency generates positive effects
for sectors like winter cereals and summer other crops whereas all seasonal vegetable sectors
shrink. The simulated increases in non-conventional water resources boost the fruits sector.
Figure 2: Domestic Agricultural Production (Percentage change)
Source: authors' elaboration on model results
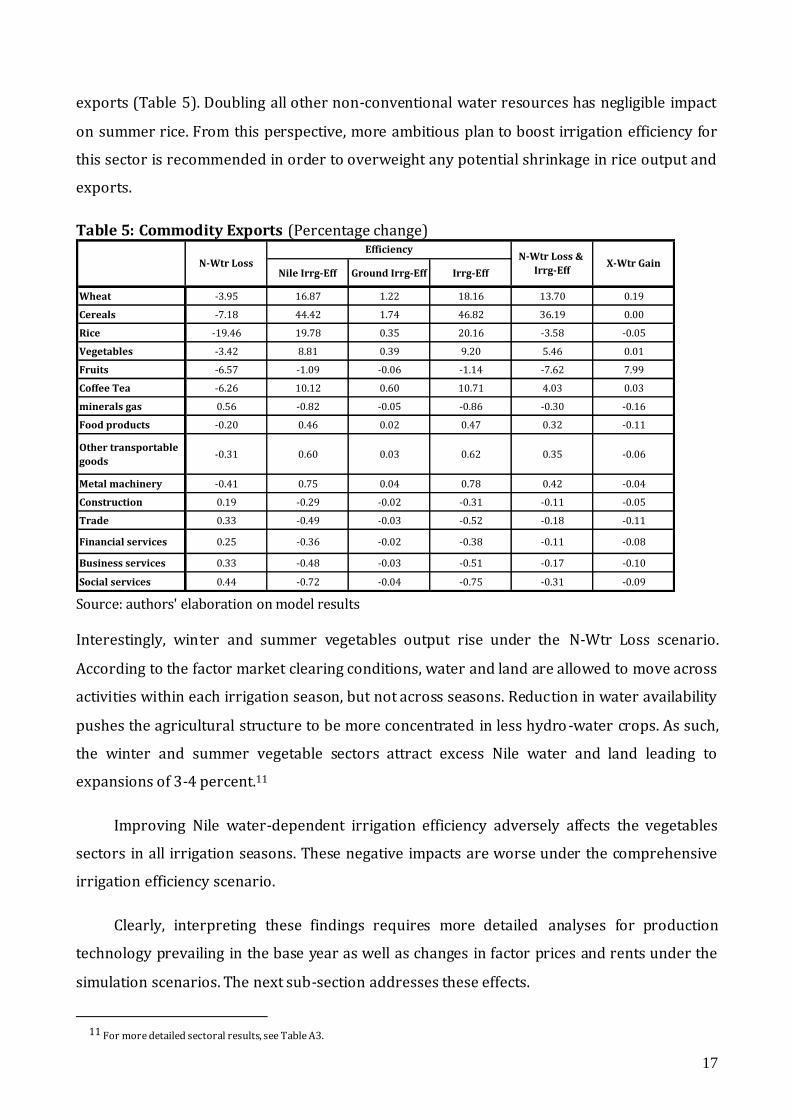
The N-Wtr Loss scenario has a strong negative impact (-20 percent) on rice exports. Under the
comprehensive N-Wtr Loss & Irrg-Eff scenario, rice exports drop by only 4 percent. Improving
Nile water-dependent irrigation efficiency boosts rice output (by 4 percent in the summer and
6 percent in the Nili seasons) without increasing irrigation water requirements. Furthermore,
combining irrigation efficiency with Nile water loss mitigates the negative impacts on rice
-30.0
-20.0
-10.0
0.0
10.0
20.0
30.0
40.0
50.0
W. W
hea
t
W. C
ere
als
W. S
ug
ar B
eet
W. F
od
der
s
W. F
ibb
ers
W. M
edic
al P
lan
ts
W. V
ege
tab
les
S. R
ice
S. O
ther
Cro
ps
S. S
ug
ar C
an
e
S. C
ott
on
S. F
od
de
rs
S. O
ily
Cro
ps
S. M
ed
ical
Pla
nts
S. V
ege
tab
les
N. R
ice
N. O
the
r C
rop
s
N. F
od
der
s
N. O
ily
Cro
ps
N. M
edic
al P
lan
ts
N. V
eget
able
s
Fru
its
Oth
er a
gri
N-Wtr Loss
Irrg-Eff
N-Wtr Loss &Irrg-Eff
X-Wtr Gain
17
exports (Table 5). Doubling all other non-conventional water resources has negligible impact
on summer rice. From this perspective, more ambitious plan to boost irrigation efficiency for
this sector is recommended in order to overweight any potential shrinkage in rice output and
exports.
Table 5: Commodity Exports (Percentage change)
Nile Irrg-Eff Ground Irrg-Eff Irrg-Eff
Wheat -3.95 16.87 1.22 18.16 13.70 0.19
Cereals -7.18 44.42 1.74 46.82 36.19 0.00
Rice -19.46 19.78 0.35 20.16 -3.58 -0.05
Vegetables -3.42 8.81 0.39 9.20 5.46 0.01
Fruits -6.57 -1.09 -0.06 -1.14 -7.62 7.99
Coffee Tea -6.26 10.12 0.60 10.71 4.03 0.03
minerals gas 0.56 -0.82 -0.05 -0.86 -0.30 -0.16
Food products -0.20 0.46 0.02 0.47 0.32 -0.11
Other transportable
goods-0.31 0.60 0.03 0.62 0.35 -0.06
Metal machinery -0.41 0.75 0.04 0.78 0.42 -0.04
Construction 0.19 -0.29 -0.02 -0.31 -0.11 -0.05
Trade 0.33 -0.49 -0.03 -0.52 -0.18 -0.11
Financial services 0.25 -0.36 -0.02 -0.38 -0.11 -0.08
Business services 0.33 -0.48 -0.03 -0.51 -0.17 -0.10
Social services 0.44 -0.72 -0.04 -0.75 -0.31 -0.09
N-Wtr Loss &
Irrg-EffN-Wtr Loss
Efficiency
X-Wtr Gain
Source: authors' elaboration on model results
Interestingly, winter and summer vegetables output rise under the N-Wtr Loss scenario.
According to the factor market clearing conditions, water and land are allowed to move across
activities within each irrigation season, but not across seasons. Reduction in water availability
pushes the agricultural structure to be more concentrated in less hydro-water crops. As such,
the winter and summer vegetable sectors attract excess Nile water and land leading to
expansions of 3-4 percent.11
Improving Nile water-dependent irrigation efficiency adversely affects the vegetables
sectors in all irrigation seasons. These negative impacts are worse under the comprehensive
irrigation efficiency scenario.
Clearly, interpreting these findings requires more detailed analyses for production
technology prevailing in the base year as well as changes in factor prices and rents under the
simulation scenarios. The next sub-section addresses these effects.
11 For more detailed sectoral results, see Table A3.
18
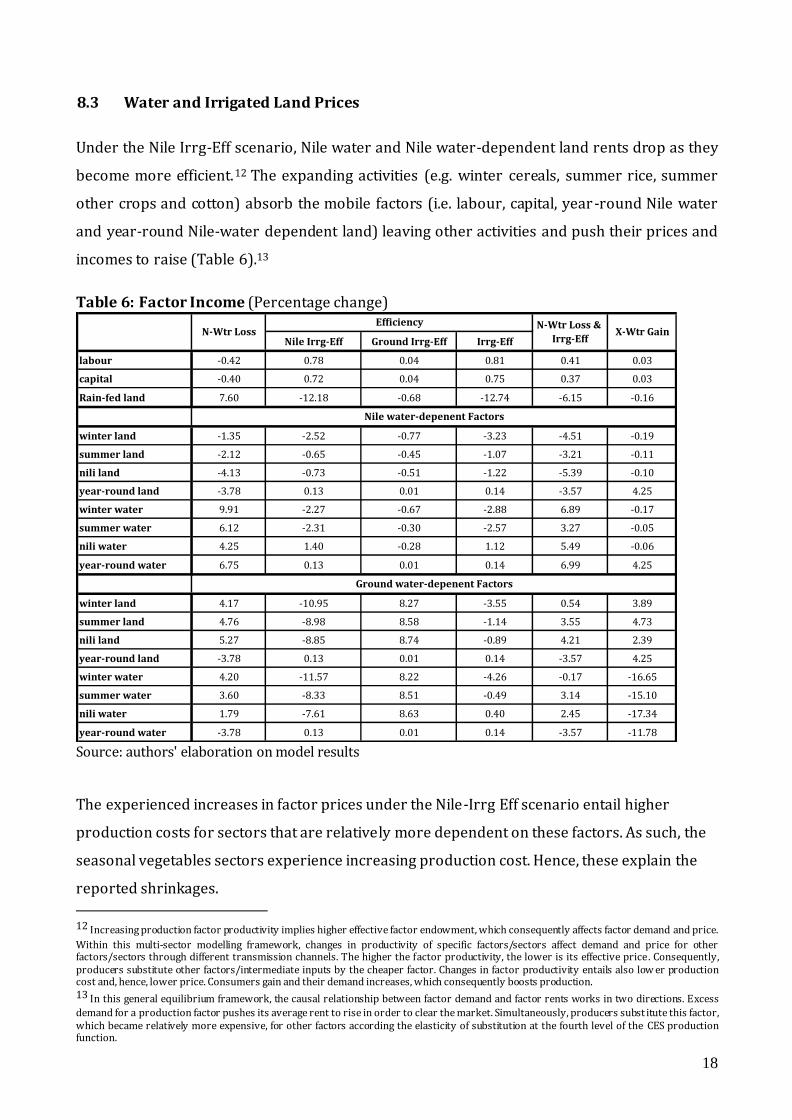
8.3 Water and Irrigated Land Prices
Under the Nile Irrg-Eff scenario, Nile water and Nile water-dependent land rents drop as they
become more efficient.12 The expanding activities (e.g. winter cereals, summer rice, summer
other crops and cotton) absorb the mobile factors (i.e. labour, capital, year-round Nile water
and year-round Nile-water dependent land) leaving other activities and push their prices and
incomes to raise (Table 6).13
Table 6: Factor Income (Percentage change)
Nile Irrg-Eff Ground Irrg-Eff Irrg-Eff
labour -0.42 0.78 0.04 0.81 0.41 0.03
capital -0.40 0.72 0.04 0.75 0.37 0.03
Rain-fed land 7.60 -12.18 -0.68 -12.74 -6.15 -0.16
winter land -1.35 -2.52 -0.77 -3.23 -4.51 -0.19
summer land -2.12 -0.65 -0.45 -1.07 -3.21 -0.11
nili land -4.13 -0.73 -0.51 -1.22 -5.39 -0.10
year-round land -3.78 0.13 0.01 0.14 -3.57 4.25
winter water 9.91 -2.27 -0.67 -2.88 6.89 -0.17
summer water 6.12 -2.31 -0.30 -2.57 3.27 -0.05
nili water 4.25 1.40 -0.28 1.12 5.49 -0.06
year-round water 6.75 0.13 0.01 0.14 6.99 4.25
winter land 4.17 -10.95 8.27 -3.55 0.54 3.89
summer land 4.76 -8.98 8.58 -1.14 3.55 4.73
nili land 5.27 -8.85 8.74 -0.89 4.21 2.39
year-round land -3.78 0.13 0.01 0.14 -3.57 4.25
winter water 4.20 -11.57 8.22 -4.26 -0.17 -16.65
summer water 3.60 -8.33 8.51 -0.49 3.14 -15.10
nili water 1.79 -7.61 8.63 0.40 2.45 -17.34
year-round water -3.78 0.13 0.01 0.14 -3.57 -11.78
Ground water-depenent Factors
N-Wtr LossN-Wtr Loss &
Irrg-Eff
EfficiencyX-Wtr Gain
Nile water-depenent Factors
Source: authors' elaboration on model results
The experienced increases in factor prices under the Nile-Irrg Eff scenario entail higher
production costs for sectors that are relatively more dependent on these factors. As such, the
seasonal vegetables sectors experience increasing production cost. Hence, these explain the
reported shrinkages.
12 Increasing production factor productivity implies higher effective factor endowment, which consequently affects factor demand and price.
Within this multi-sector modelling framework, changes in productivity of specific factors/sectors affect demand and price for other factors/sectors through different transmission channels. The higher the factor productivity, the lower is its effective price. Consequently, producers substitute other factors/intermediate inputs by the cheaper factor. Changes in factor productivity entails also low er production cost and, hence, lower price. Consumers gain and their demand increases, which consequently boosts production. 13 In this general equilibrium framework, the causal relationship between factor demand and factor rents works in two directions. Excess
demand for a production factor pushes its average rent to rise in order to clear the market. Simultaneously, producers subst itute this factor, which became relatively more expensive, for other factors according the elasticity of substitution at the fourth level of the CES production function.
19
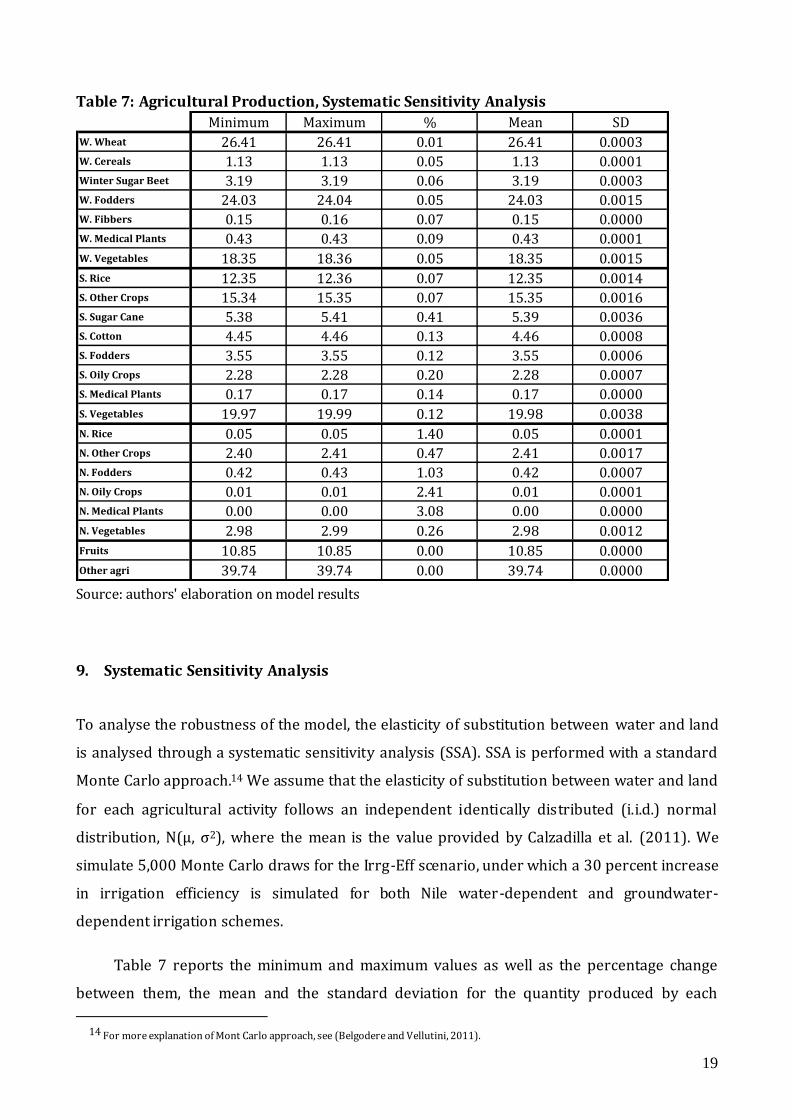
Table 7: Agricultural Production, Systematic Sensitivity Analysis
Minimum Maximum % Mean SD
W. Wheat 26.41 26.41 0.01 26.41 0.0003W. Cereals 1.13 1.13 0.05 1.13 0.0001Winter Sugar Beet 3.19 3.19 0.06 3.19 0.0003W. Fodders 24.03 24.04 0.05 24.03 0.0015W. Fibbers 0.15 0.16 0.07 0.15 0.0000W. Medical Plants 0.43 0.43 0.09 0.43 0.0001
W. Vegetables 18.35 18.36 0.05 18.35 0.0015
S. Rice 12.35 12.36 0.07 12.35 0.0014S. Other Crops 15.34 15.35 0.07 15.35 0.0016S. Sugar Cane 5.38 5.41 0.41 5.39 0.0036S. Cotton 4.45 4.46 0.13 4.46 0.0008S. Fodders 3.55 3.55 0.12 3.55 0.0006S. Oily Crops 2.28 2.28 0.20 2.28 0.0007S. Medical Plants 0.17 0.17 0.14 0.17 0.0000
S. Vegetables 19.97 19.99 0.12 19.98 0.0038
N. Rice 0.05 0.05 1.40 0.05 0.0001N. Other Crops 2.40 2.41 0.47 2.41 0.0017N. Fodders 0.42 0.43 1.03 0.42 0.0007N. Oily Crops 0.01 0.01 2.41 0.01 0.0001N. Medical Plants 0.00 0.00 3.08 0.00 0.0000
N. Vegetables 2.98 2.99 0.26 2.98 0.0012
Fruits 10.85 10.85 0.00 10.85 0.0000
Other agri 39.74 39.74 0.00 39.74 0.0000 Source: authors' elaboration on model results
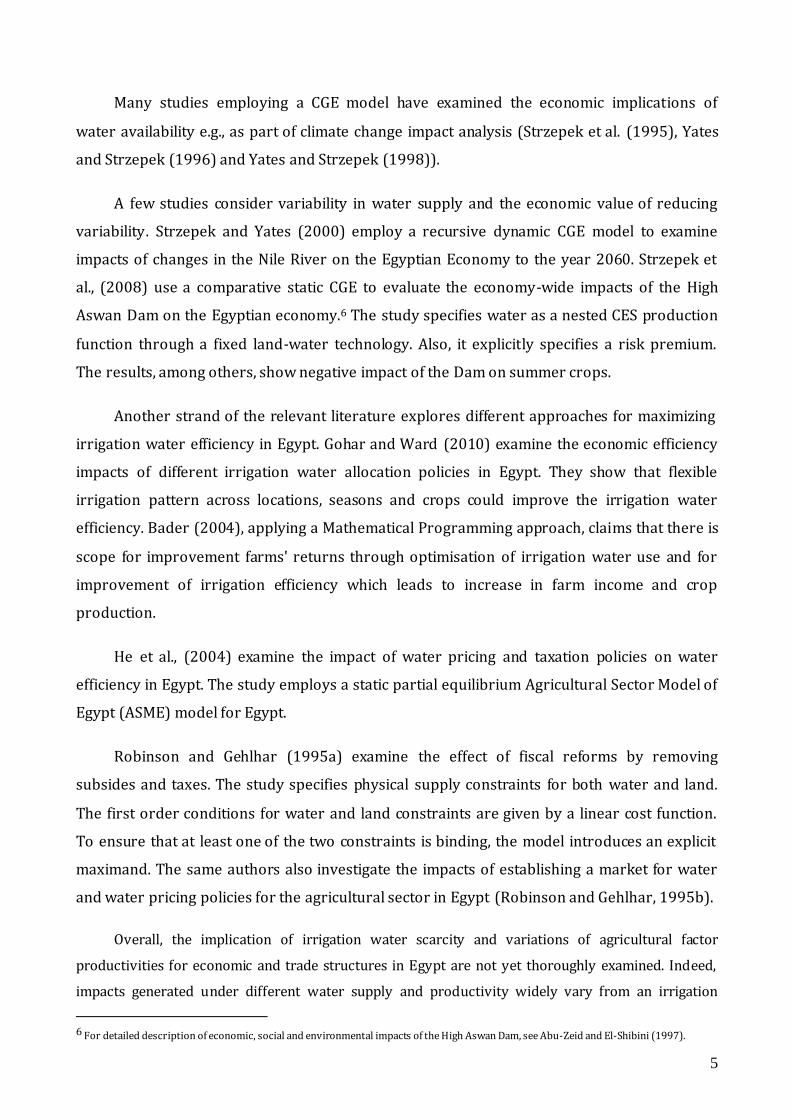
9. Systematic Sensitivity Analysis
To analyse the robustness of the model, the elasticity of substitution between water and land
is analysed through a systematic sensitivity analysis (SSA). SSA is performed with a standard
Monte Carlo approach.14 We assume that the elasticity of substitution between water and land
for each agricultural activity follows an independent identically distributed (i.i.d.) normal
distribution, N(µ, σ2), where the mean is the value provided by Calzadilla et al. (2011). We
simulate 5,000 Monte Carlo draws for the Irrg-Eff scenario, under which a 30 percent increase
in irrigation efficiency is simulated for both Nile water-dependent and groundwater-
dependent irrigation schemes.
Table 7 reports the minimum and maximum values as well as the percentage change
between them, the mean and the standard deviation for the quantity produced by each
14 For more explanation of Mont Carlo approach, see (Belgodere and Vellutini, 2011).
20
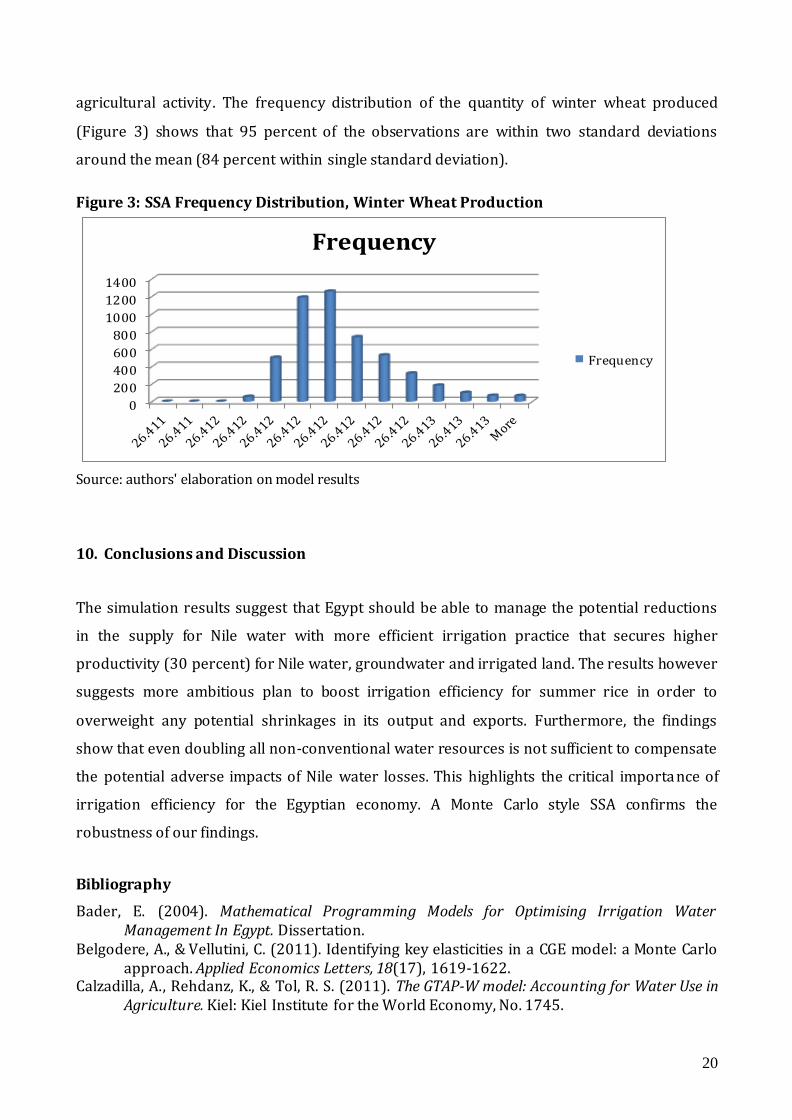
agricultural activity. The frequency distribution of the quantity of winter wheat produced
(Figure 3) shows that 95 percent of the observations are within two standard deviations
around the mean (84 percent within single standard deviation).
Figure 3: SSA Frequency Distribution, Winter Wheat Production
0
200
400
600
800
1000
1200
1400
Frequency
Frequency
Source: authors' elaboration on model results
10. Conclusions and Discussion
The simulation results suggest that Egypt should be able to manage the potential reductions
in the supply for Nile water with more efficient irrigation practice that secures higher
productivity (30 percent) for Nile water, groundwater and irrigated land. The results however
suggests more ambitious plan to boost irrigation efficiency for summer rice in order to
overweight any potential shrinkages in its output and exports. Furthermore, the findings
show that even doubling all non-conventional water resources is not sufficient to compensate
the potential adverse impacts of Nile water losses. This highlights the critical importa nce of
irrigation efficiency for the Egyptian economy. A Monte Carlo style SSA confirms the
robustness of our findings.
Bibliography
Bader, E. (2004). Mathematical Programming Models for Optimising Irrigation Water Management In Egypt. Dissertation.
Belgodere, A., & Vellutini, C. (2011). Identifying key elasticities in a CGE model: a Monte Carlo approach. Applied Economics Letters, 18(17), 1619-1622.
Calzadilla, A., Rehdanz, K., & Tol, R. S. (2011). The GTAP-W model: Accounting for Water Use in Agriculture. Kiel: Kiel Institute for the World Economy, No. 1745.
21
CAPMAS. (2009). Annual Bulletin of Irrigation and Water Resources Statistics, 2008. Cairo: Central Agency for Public Mobilisation and Statistics.
CAPMAS. (2010). Aggregated Supply and Use Tables According To Economic Activities 2008/2009. Cairo: Central Agency for Public Mobilisation and Statistics.
Dudu, H., & Chumi, S. (2008). Economics of Irrigation Water Management: A Literature Survey with Focus on Partial and General Equilibrium Models. World Bank Policy Research Working Paper.
FAO. (2013). Country Programming Framework (CPF) Government of Egypt 2012-2017. Food and Agriculture Organisation.
FAO. (2014). AQUASTAT Database. Retrieved September 29, 2014, from Food and Agriculture Organization of the United Nations: http://www.fao.org/nr/water/aquastat/main/index.stm
Gohar, A. A., & Ward, F. A. (2010). Gains from Expanded Irrigation Water Trading in Egypt: An Integrated Basin Approach. Ecological Economics, 69, 2535–2548.
He, L., Tyner, W., & Siam, G. (2004, August 1-4). Improving Irrigation Water Allocation Efficiency Using Alternative Policy Options in Egypt. Selected Paper Prepared for Presentation at the American Agricultural Economics.
Keller, A. A., & Keller, J. (1995). Effective Efficiency: A Water Use Efficiency Concept for Allocating Freshwater Resources. Center for Economic Policy Studies(Discussion Paper 22).
Lofgren, H., Harris, R., & Robinson, S. (2002). A Standard Computable General Equilibrium (CGE) Model in GAMS. Washington D.C.: International Food Policy Research Institute.
Luckmann, J., & McDonald, S. (2014). STAGE_W: An Applied General Equilibrium Model with Multiple Types of Water Technical Documentation . Agricultural Economics Working Paper Series, 23.
McDonald, S. (2007, July). A Static Applied General Equilibrium Model: Technical Documentation STAGE Version 1. Technical Report Department of Economics.
Osman, R., Ferrari, E., & McDonald, S. (forthcoming). Constructing a SAM for Egypt (2008/09): Introducing Water and Irrigation Seasonality. Journal of Development and Economic Policies.
Ponce, R., Bosello, F., & Giupponi, C. (2012). Integrating Water Resources into Computable General Equilibrium Models – A Survey. In C. Carraro, Climate Change and Sustainable Development Series.
Robinson, S., & El-Said, M. (2000). GAMS Code for Estimating a Social Accounting Matrix (SAM) Using Cross Entropry (CE) Methods. Trade and Macroeconomics Division (TMD) Discussion Paper(No 64).
Robinson, S., & Gehlhar, C. (1995a). Land, Water and Agriculture in Egypt: The Economywide Impact of Policy Reform. TMD Discussion Paper.
Robinson, S., & Gehlhar, C. (1995b). Impacts of Macroeconomic and Trade Policies on a Market-oriented Agriculture. In L. B. Fletcher, Egypt’s Agriculture in a Reform Era. Ames, Iowa: Iowa State University Press.
Robinson, S., Cattaneo, A., & El-Said, M. (2001). Updating and Estimating a Social Accounting Matrix Using Cross Entropy Methods. Economic Systems Research, 13(1), 47-64.
Robinson, S., Kilkenny, M., & Hanson, K. (1990). The USDA/ERS computable general equilibrium (CGE) model of the United States. Tech. rep. U.S. Dept. of Agriculture, Economic Research Service, Agriculture and Rural Economy Division.
Strzepek, K. M., Onyeji, S., Saleh, M., & Yates, D. (1995). An assessment of Integrated Climate Change Impacts on Egypt. In K. Strzepek, & J. Smith , As Climate Changes: International Impacts and Implications (pp. 180-200). Cambridge: Cambridge University Press
22
Strzepek, K. M., Yohe, G. W., Tol, R. S., & Rosegrant, M. W. (2008). The Value of the High Aswan Dam to the Egyptian Economy. Ecological Economics, 66(1), 117-126.
Strzepek, S. M., & Yates, D. N. (2000). Responses and Thresholds of the Egyptian Economy to Climate Change Impacts on the Water Resources of the Nile River. Climatic Change, 46, 339–356.
Yates, D. N., & Strzepek, K. M. (1996). Modeling Economy-wide Climate Change Impacts on Egypt: A Case for an Integrated Approach. Environmental Modeling and Assessment, 1(3).
Yates, D. N., & Strzepek, K. M. (1998). An Assessment of Integrated Climate Change Impacts on the Agricultural Economy of Egypt. Climate Change, 38(3).
23
Table A1: Factor Intensity by Agricultural Activity (Percent)
Labour Capital Nile-landNile-
water
Ground-
land
Ground-
water
Rainfed-
landTotal
Winter Wheat 13.8 56.4 20.0 3.4 1.8 0.2 4.5 100Winter Cereals 22.2 29.8 34.6 4.6 1.3 0.0 7.5 100Winter Sugar
Beet12.3 64.2 16.9 2.8 0.0 0.0 3.8 100
Winter Fodders 2.5 83.7 6.0 5.1 0.4 0.0 2.2 100Winter Fibbers 14.4 59.0 18.4 3.8 0.1 0.0 4.3 100Winter Medical
Plants10.2 68.7 15.3 2.2 0.2 0.0 3.4 100
Winter
Vegetables7.7 84.1 5.8 0.8 0.4 0.1 1.3 100
Summer Rice 13.8 54.1 6.1 20.6 0.1 0.0 5.2 100Summer Other
Crops23.1 47.0 17.0 7.4 0.6 0.1 4.7 100
Summer Sugar
Cane11.4 70.1 2.3 13.1 0.1 0.0 3.1 100
Summer Cotton 24.7 59.0 10.9 2.7 0.0 0.0 2.6 100
Summer Fodders 4.8 77.8 9.7 2.7 2.2 0.4 2.4 100
Summer Oily
Crops15.1 62.5 15.6 2.4 1.0 0.0 3.4 100
Summer Medical
Plants12.1 64.6 14.6 5.0 0.0 0.0 3.8 100
Summer
Vegetables11.4 74.3 10.4 1.3 0.4 0.1 2.2 100
Nili Rice 11.4 54.3 13.4 0.5 17.6 0.2 2.7 100Nili Other Crops 23.0 47.2 12.9 9.9 2.3 0.2 4.4 100Nili Fodders 5.5 76.9 10.9 0.0 4.5 0.1 2.1 100Nili Oily Crops 18.4 39.7 30.4 1.8 3.6 0.0 6.1 100Nili Medical
Plants11.8 56.4 5.3 21.2 0.0 0.0 5.3 100
Nili Vegetables 11.4 73.6 8.5 2.9 1.3 0.1 2.2 100Fruits 14.4 63.2 9.5 4.7 4.8 3.4 0.0 100
Other agri
forestry fishing58.0 42.0 0.0 0.0 0.0 0.0 0.0 100
Source: authors' elaboration on model results
24
Table A2: Factor Shares in Agricultural Value Added (Percent)
Labour Capital Nile-landNile-
water
Ground-
land
Ground-
water
Rainfed-
land
Winter Wheat 12.9 12.6 29.8 10.7 27.2 9.7 25.2Winter Cereals 0.7 0.2 1.8 0.5 0.7 0.0 1.4Winter Sugar Beet 1.4 1.8 3.1 1.1 0.1 0.0 2.6Winter Fodders 2.5 20.1 9.7 17.3 7.4 2.3 13.1Winter Fibbers 0.1 0.1 0.2 0.1 0.0 0.0 0.1Winter Medical
Plants0.2 0.3 0.4 0.1 0.1 0.0 0.3
Winter Vegetables 5.9 15.5 7.1 2.0 5.2 2.4 5.8
Summer Rice 6.2 5.8 4.4 30.7 0.9 0.0 14.0
Summer Other
Crops11.2 5.5 13.3 12.1 5.2 2.6 13.8
Summer Sugar Cane 2.2 3.3 0.7 8.5 0.3 0.0 3.6
Summer Cotton 4.0 2.3 2.8 1.5 0.0 0.0 2.5Summer Fodders 0.7 2.6 2.2 1.3 5.2 3.0 2.0
Summer Oily Crops 1.3 1.2 2.1 0.7 1.3 0.1 1.7
Summer Medical
Plants0.1 0.1 0.1 0.1 0.0 0.0 0.1
Summer Vegetables 8.5 13.3 12.4 3.2 5.0 2.1 10.0
Nili Rice 0.0 0.0 0.0 0.0 0.6 0.0 0.0Nili Other Crops 1.8 0.9 1.6 2.5 2.9 0.9 2.0Nili Fodders 0.1 0.3 0.3 0.0 1.2 0.1 0.2Nili Oily Crops 0.0 0.0 0.0 0.0 0.0 0.0 0.0
Nili Medical Plants 0.0 0.0 0.0 0.0 0.0 0.0 0.0
Nili Vegetables 1.3 2.0 1.6 1.1 2.4 0.5 1.5
Fruits 6.2 6.5 6.5 6.6 34.1 76.2 0.0
Other agri forestry
fishing32.8 5.7 0.0 0.0 0.0 0.0 0.0
Agr. Value Added 100 100 100 100 100 100 100 Source: authors' elaboration on model results
25
Table A3: Domestic Agricultural Production (Percentage change)
Nile Irrg-Eff Ground Irrg-Eff Irrg-Eff
Winter Wheat -1.03 3.64 0.28 3.90 2.90 0.04
Winter Cereals -3.72 20.25 0.87 21.26 16.66 0.00
Winter Sugar Beet -0.30 8.84 0.06 8.90 8.79 0.01
Winter Fodders -3.87 3.28 0.10 3.38 -0.54 -0.04
Winter Fibbers -0.92 15.31 0.14 15.48 14.36 -0.01
Winter Medical
Plants2.02 9.81 0.11 9.93 12.05 -0.07
Winter Vegetables 3.78 -5.37 -0.08 -5.45 -1.82 0.00
Summer Rice -3.13 3.55 0.03 3.59 -0.48 0.00
Summer Other
Crops-6.51 11.72 0.31 12.03 5.09 0.11
Summer Sugar Cane -14.70 3.25 -0.27 2.98 -11.66 -0.11
Summer Cotton 2.01 3.72 -0.32 3.42 5.45 -0.12
Summer Fodders 1.27 4.72 1.46 6.10 7.46 0.63
Summer Oily Crops 1.14 5.86 0.40 6.23 7.69 -0.15
Summer Medical
Plants-1.98 10.85 -0.21 10.64 8.52 -0.09
Summer Vegetables 3.08 -0.96 -0.07 -1.04 2.15 -0.02
Nili Rice 31.73 -4.02 10.93 5.90 37.78 -0.96
Nili Other Crops -8.92 9.46 1.26 10.74 1.11 0.29
Nili Fodders 7.05 3.53 2.77 6.16 13.45 -0.11
Nili Oily Crops 3.99 22.63 2.32 25.27 30.66 -0.25
Nili Medical Plants -23.93 16.95 -0.14 16.81 -11.09 -0.08
Nili Vegetables 0.83 -0.98 0.49 -0.54 0.45 0.02
Fruits -3.94 -0.38 -0.02 -0.40 -4.28 4.64
Other agri -0.48 0.84 0.04 0.88 0.43 0.02
N-Wtr LossN-Wtr Loss &
Irrg-Eff
EfficiencyX-Wtr Gain
Source: authors' elaboration on model results.