Embed Size (px)
Citation preview

SIMULATION OF RAIN FLOODS ON WILLOW CREEK, VALLEY COUNTY, MONTANA
by Charles Parrett
U.S. GEOLOGICAL SURVEY
Water-Resources Investigations Report 86-4341
Prepared in cooperation with the
U.S. BUREAU OF LAND MANAGEMENT
Helena, Mont ana December 1986

UNITED STATES DEPARTMENT OF THE INTERIOR
DONALD PAUL HODEL, Secretary
GEOLOGICAL SURVEY
Dallas L. Peck, Director
For more information write to:
District ChiefU.S. Geological Survey428 Federal Building301 S. Park, Drawer 10076Helena, MT 59626-0076
Copies of this report can be purchased from:
U.S. Geological Survey Books and Open-File Reports Federal Center, Bldg. 41 Box 25425 Denver, CO 80225-0425

CONTENTS
Page
Abstract ................................. 1Introduction ............................... 1Background ............................... 1Purpose and scope. ........................... 3
Study area ................................ 3Description of the Hydrologic Engineering Center-1 model ......... 4
Subbasin runoff component ....................... 6Channel routing component. ....................... 7Reservoir routing component. ...................... 8
Data requirements for Willow Creek .................... 8Willow Creek network .......................... 8Subbasin runoff component. ....................... 9Channel routing component. ....................... 14Reservoir routing component. ...................... 15Waterspreader component ........................ 20
Synthetic storm hyetograph ........................ 21Calibration by adjusting the depth-area relation ............. 24Simulation results ............................ 28Limitations of the simulation analysis .................. 30Summary and conclusions. ......................... 34Selected references. ........................... 36Supplemental data. ............................ 37
ILLUSTRATIONS
Page
Figure 1. Map showing location of Willow Creek study area and selectednearby streamflow-gaging stations .............. 2
2. Map and schematic showing typical stream basin. ........ 53. Graph showing U.S. Soil Conservation Service dimensionless unit
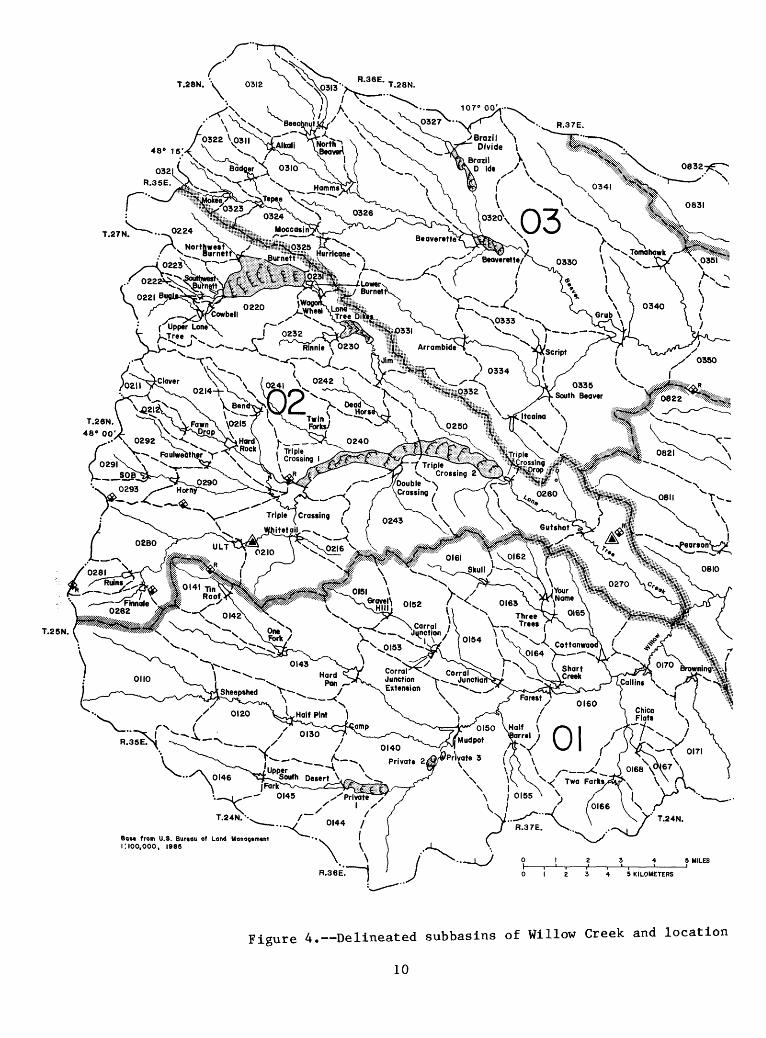
hydrograph. ......................... 74. Map showing delineated subbasins of Willow Creek and location
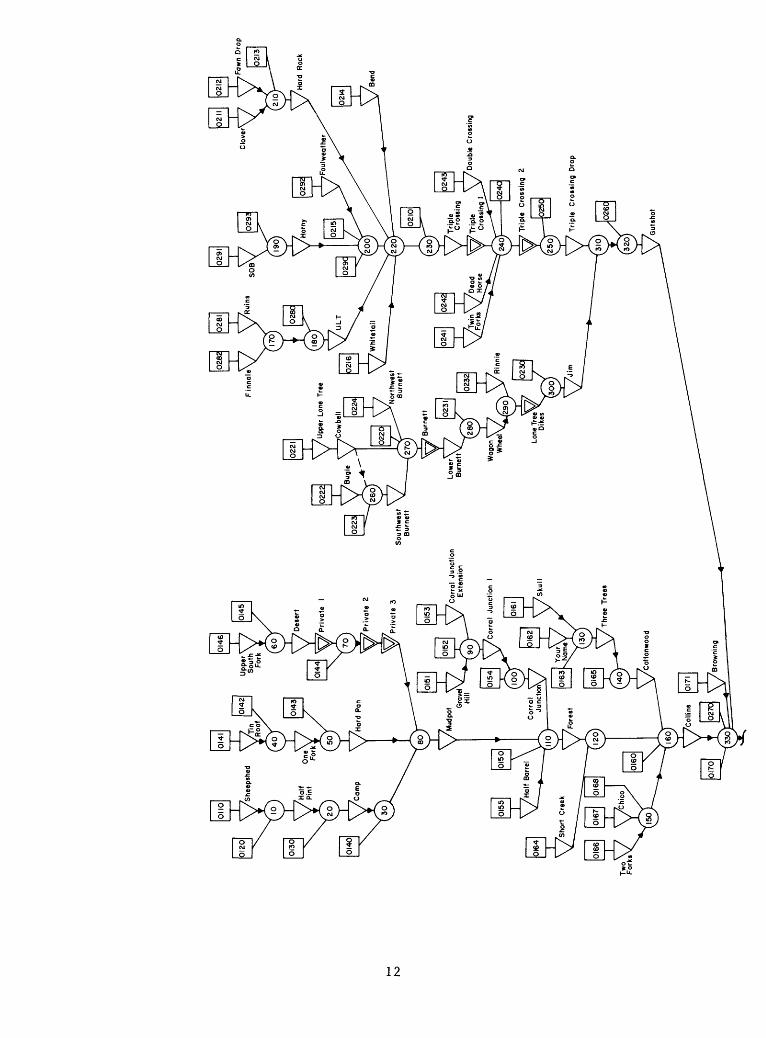
of data-collection sites. .................. 105. Schematic diagram of Willow Creek basin ............ 126. Sketch of typical waterspreader ................ 147. Four standard cross sections for channel routing. ....... 168. Diagram showing approximating reservoir elevation-volume
relation. .......................... 179. Diagram showing drop-pipe spillway. .............. 19
10. Typical reservoir spillway cross section. ........... 1911. Assumed waterspreader spillway cross section. ......... 2012. Synthetic rainfall hyetograph for 100-year-frequency, 24-hour
duration storm in Willow Creek basin. ............ 2213. Table and graph showing construction of an example 6-hour
duration storm hyetograph .................. 2314. Graph showing National Weather Service rainfall depth-drainage
area adjustment ....................... 24
III

ILLUSTRATIONS Continued
Page
Figure 15. Sketch showing example interpolation of streamflow hydrographsfrom index hydrographs. ................... 25
16. Graph showing comparison of Hydrologic Engineering Center-1results with gage data. ................... 26
17. Graph showing U.S. Soil Conservation Service rainfall depth- drainage area adjustment. .................. 27
18. Schematic diagram showing 100-year-frequency discharges atWillow Creek structures ................... 29
19. Simulated 100-year-frequency hydrographs at three locations . . 3120. Graph showing effects of reservoir volume change on computed
100-year-frequency discharge of Willow Creek. ........ 3221. Graph showing effects of waterspreader volume change on computed
100-year-frequency discharge of Willow Creek. ........ 33
TABLES
Table 1. Subbasin variables for the Willow Creek basin ..........2. Hydrologic Engineering Center-1 input for Willow Creek study. . .3. Waterspreader characteristics
384189
CONVERSION FACTORS
For those readers who may prefer to use the International System of units -(SI) rather than inch-pound units, the conversion factors for the terms used in this report are listed below.
Multiply inch-pound unit
acreacre-footcubic foot per secondfootinchmilesquare footsquare mile
By_
0.4047,233
0.028320.3048
25.401.6090.092902.590
To obtain SI unit
hectarecubic metercubic meter per secondmetermillimeterkilometersquare metersquare kilometer
Temperature in degrees Fahrenheit (°F) can be converted to degrees Celsius (°C) by the equation:
C = 5/9 (°F - 32)
IV

SIMULATION OF RAIN FLOODS ON WILLOW CREEK, VALLEY COUNTY, MONTANA
By
Charles Parrett
ABSTRACT
The Hydrologlc Engineering Center-1 (HEC-1) rainfall-runoff simula tion model was used to assess the effects of a system of reservoirs and waterspreaders located in the 550-square-mile Willow Creek basin in northeastern Montana. For simulation purposes, the basin was subdivided into 100 subbasins containing 84 reservoirs and 14 waterspreaders. Pre cipitation input to the model was a 24-hour duration, 100-year-frequency synthetic rainstorm developed from National Weather Service data. Infil tration and detention losses were computed using the U.S. Soil Conserva tion Service Curve Number concept, and the dimensionless unit hydrograph developed by the U.S. Soil Conservation Service was used to compute run off. Channel and reservoir flow routing was based on the modified Puls storage routing procedure. Waterspreaders were simulated by assuming that each dike in a spreader system functions as a reservoir, with only an emergency spillway discharging directly into the next dike. Water- spreader and reservoir volumes were calculated from surface areas measured on maps.
The first simulation was made with no structures in place, and resulted in a 100-year-frequency peak at the mouth of Willow Creek of 22,700 cubic feet per second. With all structures in place, the 100-year- frequency peak was decreased by 74 percent to 5,870 cubic feet per second.
INTRODUCTION
Background
Willow Creek, an intermittent tributary to the Milk River, drains about 550 square miles in northeastern Montana (fig. 1). Most of the drainage is located on public land administered by the U.S. Bureau of Land Management. In the early 1950*s, the Bureau began an extensive conservation program aimed at controlling runoff and sediment yield within the basin. By 1967, 190 reservoirs with a cumu lative storage capacity of about 48,000 acre-feet had been constructed (Frickel, 1972). By 1980, the total number of reservoirs was more than 200 with a total storage capacity of more than 50,000 acre-feet (Dan Muller, U.S. Bureau of Land Management, oral commun., 1985). In addition to the large number of reservoirs, several large waterspreader systems comprised of numerous low-level dikes have been constructed to intercept tributary runoff.
Although the vast system of conservation measures has undoubtedly decreased peak outflows from the basin, a quantitative evaluation of the effectiveness of the system has not been attempted. No streamflow records are available before the

40 60 MILES
0 20 40 60 KILOMETERSStudy ^ orea~~
MONTANA
1723EXPLANATION
A STREAMFLOW-GAGING STATION AND ABBREVIATED NUMBER
Figure 1. Location of Willow Creek study area and selected nearby streamflow-gaging stations.
period of reservoir construction, so the flow regimen cannot be compared "before and after." Some reservoir and runoff data were collected by the U.S. Geological Survey in the 1960's; Frickel (1972) was able to use these data to estimate that the conservation measures in place at the time decreased the peak discharge of a large flood in 1962 by about 45 percent. The decrease in discharge resulting from any single storage structure or spreader system was not possible to determine, how ever. Likewise, determination was not possible of the cumulative effects of the conservation measures on any storm other than the one for which data had been collected.
Because of rising construction and maintenance costs, a methodology for rationally evaluating the individual and cumulative flood damage reduction benefits of the conservation measures became imperative. Accordingly, a cooperative program between the U.S. Geological Survey and the U.S. Bureau of Land Management was ini tiated in 1981 to calibrate and apply a streamflow simulation model to the Willow Creek basin. The original purpose of the cooperative program was to establish a rainfall and streamflow data-collection network within the basin and to use data obtained over several years to calibrate a peak discharge model capable of simu lating the effects of numerous reservoirs and waterspreaders. A data-collection

network consisting of 5 seasonal streamflow-gaging stations, 2 water-level record ing gages on reservoirs, and 12 rain gages subsequently was established. A continuous-record streamflow-gaging station (station 06174000) has been operated at the mouth of Willow Creek since 1953.
Unfortunately, rain-caused runoff was scanty throughout northeastern Montana from 1980 to 1985, and no meaningful runoff record suitable for calibration pur poses has been collected in the Willow Creek basin. Nevertheless, because of various management directives and considerations, the Bureau of Land Management was required to develop a management plan for the Willow Creek basin by 1985. Thus, it was decided to select and use a streamflow model to investigate various plans of basin development and their effects on the 100-year-frequency peak dis charge of Willow Creek without the benefit of site-by-site calibration.
Purpose and scope
The purpose of this report is to describe the model used and the results of the various streamflow simulations made for the Willow Creek basin. The model used to make the analysis was the Hydrologic Engineering Center-1 (HEC-1) flood hydrograph model developed by the U.S. Army Corps of Engineers (1981). The model computes the runoff response of a basin to a specified precipitation input, routes the computed runoff through channels and reservoirs, and combines the resultant discharge hydrograph with discharge hydrographs from other basins where channels intersect. Large watersheds with many channels and reservoirs can be simulated with the HEC-1 model. Because of the lack of onsite calibration data, a single synthetic storm hyetograph based on National Weather Service data was used to generate 100-year-frequency peak discharges throughout the basin. The model was calibrated by adjusting the precipitation depth-drainage area relationship so that computed, unregulated 100-year-frequency peak discharges plotted reasonably close to a regression line through 100-year-frequency peak discharges at nearby gaging stations.
STUDY AREA
Willow Creek is a sparsely populated basin comprised of rolling uplands inter spersed with flat valleys and a well-defined drainage system. The relief is low to moderate with elevations ranging from 2,000 to about 2,800 feet above sea level. The basin is underlain by the easily eroded Upper Cretaceous Bearpaw Shale. The Bearpaw is overlain by the relatively more resistant sandstone of the Upper Creta ceous Fox Hills Sandstone and Hell Creek Formation along the rim of the basin (Frickel, 1972). Soils in the basin generally reflect the characteristics of their parent formations. Thus, the valley alluvium, which is derived primarily from the Bearpaw Shale, is fine grained and relatively impermeable. The alluvial soils produce little vegetation and copious amounts of runoff from moderate rain fall. Soils derived from the Fox Hills and Hell Creek Formations are sandier and produce more forage than does the valley floor alluvium. Vegetation is generally typical of the High Plains with nuttall saltbush, big sagebrush, sandberg blue- grass, blue grama, western wheatgrass, and black greasewood being the predominant species (Frickel, 1972).
The climate of the Willow Creek basin is typically continental with cold dry winters and hot summers. Temperatures at Glasgow, Montana, about 4 miles north of

the mouth of Willow Creek, range from a mean daily maximum of 85 °F in July to a mean daily minimum of 0 °F in January. The average annual precipitation at Glasgow is 12.3 inches with more than 8 inches occurring from April through August. June is the wettest month with an average of 3.0 inches, and February is the driest with an average of 0.4 inch (U.S. Environmental Data Service, 1971).
Because of the sparse precipitation and lack of a mountain snowpack to sustain base flows, Willow Creek is an intermittent stream that commonly flows only when the prairie snow cover melts or in response to intense summer rainstorms. The largest flows occur as a result of intense summer rainstorms, but, because of the large network of reservoirs and waterspreaders, rain-caused streamflow occurs relatively infrequently at the mouth.
DESCRIPTION OF THE HYDROLOGIC ENGINEERING CENTER-1 MODEL
The HEC-1 model is designed to simulate the surface-runoff response of a river basin to precipitation by representing the basin as an interconnected system of hydrologic and hydraulic components. Each component simulates an aspect of the precipitation-runoff process within a part of the basin, commonly referred to as a subbasin. A component may represent a surface runoff entity, a stream channel, or a reservoir. Representation of a component requires a set of variables that specify the particular characteristics of the component and mathematical relations, which describe the physical processes. The result of the modeling process is the compu tation of streamflow hydrographs at desired locations in the river basin.
The procedure for developing an adequate stream network model requires the following:
(1) Delineate the study area,(2) subdivide the study area into the required number of subbasins, and(3) define and link together the components required, using a schematic
diagram, so that all subbasins are hydraulically connected.
Topographic maps are used to delineate the river basin study area. Then, the study area is segmented into a number of subbasins based on the study purpose and the variability of hydrologic and basin characteristics. The study purpose defines various points of interest within the basin where hydrographs may be desired, and hence, where subbasin boundaries are needed. Likewise, basins need to be segmented where hydrologic processes or basin characteristics change. The model is based on basin-wide averages of precipitation and infiltration; if such averages are inap propriate the basin is to be divided into smaller, more homogeneous subbasins. Each subbasin is comprised of one or more hydrologic components, and the linking together of the various components constitutes the final stream model.
A simple, typical river basin map and a complementary schematic diagram (fig. 2) show how the various hydrologic components are combined for the HEC-1 model. The arrangement of the schematic diagram in figure 2 implies that streamflow compu tations are to proceed in a downstream direction. Thus, for example, a subbasin runoff hydrograph is first computed for subbasin 10 before that hydrograph is routed through a reservoir. Likewise, at the combination points two or more pre viously computed hydrographs are added together before any subsequent hydrographs are routed.

MAP SCHEMATIC
EXPLANATION
\ / RESERVOIR ROUTING COMPONENT
SUBBASIN RUNOFF COMPONENT AND
IDENTIFICATION NUMBER
* CHANNEL ROUTING COMPONENT
HYDROGRAPH COMBINATION POINT AND NUMBER
RESERVOIR
BASIN BOUNDARY
-- - SUBBASIN BOUNDARY
Figure 2. Map and schematic showing typical stream basin,
The following section of the report describes the individual hydrologic com ponents in more detail. Although several alternative procedures for computing streamflow are possible within each component, only the procedures used in the Willow Creek simulation study are described.

Subbasin runoff component
Runoff from the various subbasins, such as subbasin 10 shown in figure 2, is computed by routing an amount of precipitation excess to the subbasin outlet using unit hydrograph techniques. The precipitation excess is the subbasin average pre cipitation input minus the infiltration and detention losses. For this study, the precipitation input was a basin-wide synthetic 100-year-frequency storm obtained from depth-duration data compiled by the National Weather Service (Miller and others, 1973).
Infiltration and detention losses were computed using the Curve Number ap proach developed by the U.S. Soil Conservation Service (1972). This method re quires that an experienced soil scientist or engineer assign a Curve Number to each subbasin that characterizes its ability to absorb precipitation. A Curve Number of 0 implies that all precipitation is absorbed so that no runoff occurs, and a Curve Number of 100 implies that no absorption or detention occurs and that all precipitation is runoff. The Curve Number is a function of soil type and con dition, vegetative cover, and land use. For average soil-moisture conditions prior to the beginning of a storm, the relationship between Curve Number (CN), total storm precipitation in inches (P), and total precipitation excess in inches (PE) is:
PE = (P - 0.2'S)/(P + 0.8'S) (1)
where
S = (1,000 - 10'CN)/CN.
The synthetic unit hydrograph technique used to compute a streamflow hydro- graph from some amount of precipitation excess was the dimensionless unit hydrograph developed by the U.S. Soil Conservation Service (1972). This particular unit hydrograph was selected because it was originally developed for use with the Curve Number infiltration approach, and because it has been used in previous studies by the Bureau of Land Management. As depicted in figure 3, the amount of precipi tation excess producing the unit hydrograph is 1 inch for some unit duration (D). The unit duration is an optimum duration for producing runoff and is commonly chosen to be between one-fourth and one-half of the lag time (L) for the subbasin. The lag time, in turn, is the time in hours between the center of mass of the pre cipitation excess and the peak rate of runoff (QP). For a subbasin with a drainage area of A square miles, the peak runoff in cubic feet per second resulting from 1 inch of precipitation excess can be expressed as:
QP = 484«A/(D/2 + L) (2)
The lag time for a given subbasin is estimated from the equation:
L = h°« 8 (1000/CN - 9)°' 7 /(1900«Y°« 5 ) (3)
where
h is hydraulic length of the subbasin, in feet;CN is subbasin Curve Number; andY is subbasin average land slope, in percent.

2345
From U.S. Soil OIMENSIONLESS TIME (t/TPEAK) Coiwtrvation
Strvict (1972)
Figure 3. U.S. Soil Conservation Service dimensionless unit hydrograph,
Channel routing component
A second hydrologic process to be simulated is the change in a streamflow hydrograph that results when the streamflow is routed through a channel reach. The routing technique used in this study was the modified Puls storage routing pro cedure described by Chow (1959). This technique is based on the assumption that the attenuation of a flood peak as it moves downstream is primarily the result of the storage effects of the channel so that the following simple form of the con tinuity equation is applicable:
Inflow volume - Outflow volume = Change in storage
or if expressed in finite time intervals:
+ I2 )/2 - (Oi + 02 )/2 = (Si - S 2)/At
(4)
(5)
where the subscripts indicate the routing periods; At is the time interval between period 1 and period 2; and I, 0, and S are instantaneous values of inflow, outflow, and storage, respectively, at the beginning of the routing periods indicated.

In practice, flow and storage values are obtained from channel characteristics using the Manning equation for uniform flow. Thus, surveyed channel cross sections at the upstream and downstream ends of a routing reach together with estimates of friction slope (Manning's roughness) and energy slope are used to develop tables of discharge versus stream stage. Likewise, tables of storage versus stage are developed from the cross-sectional areas multiplied by the reach lengths.
Reservoir routing component
The modified Puls routing technique also is used to route streamflow hydro- graphs through uncontrolled reservoirs. In this instance, tables of storage versus stage and discharge versus stage are unique functions of the reservoir and spillway geometries. For the Willow Creek study, these tables were developed manually for the individual reservoirs and supplied to the HEC-1 model. Otherwise, reservoir routing using the modified Puls procedure is equivalent to channel routing described above. Discharge from Willow Creek reservoirs may be from reservoir pipes (princi pal spillways) or from emergency spillways constructed on the reservoir embankments.
DATA REQUIREMENTS FOR WILLOW CREEK
Willow Creek network
Following the sequence just described for development of an adequate simula tion model, the study area was defined to include the entire Willow Creek basin upstream from the U.S. Geological Survey streamflow-gaging station located near the mouth of Willow Creek. Simulated streamflows then could be compared directly with recorded flows. The delineation of the various subbasins was based largely on the number of significant reservoirs in the basin. A subbasin was delineated upstream from every reservoir that was believed to have a possible significant effect on streamflow. Results from earlier HEC-1 simulations made by the author for just a part of the Willow Creek basin indicated that all reservoirs with drain age areas less than about 1 percent of the total study area had less than a 10- percent cumulative effect on basin outflow. It was concluded that a conservative lower limit on subbasin size for this study would be about 0.5 square mile (about 0.1 percent of total study area). As a result, 84 reservoirs and 14 waterspreaders were included in the simulations and about 100 small reservoirs draining smaller subbasins were excluded. The 84 reservoirs used in the analysis contain more than 90 percent of the total reservoir storage of the basin. The total surface area of the 84 reservoirs at full-pool elevation is about 6 square miles, or about 1 per cent of the total basin area.
Delineated subbasins of the Willow Creek study area are shown in figure 4. Also shown is the location of each data-collection site established for the Willow Creek study. The subbasins were assigned unique four-digit identification numbers by the Bureau of Land Management similar to the hydrologic unit numbers used by the U.S. Geological Survey (Seaber and others, 1984). The first two digits identify the location of the subbasin relative to four major watersheds in the Willow Creek basin:
(1) Upper Willow Creek, identification numbers beginning with 01;(2) Lone Tree Creek, identification numbers beginning with 02;(3) Beaver Creek, identification numbers beginning with 03; and(4) Lower Willow Creek, identification numbers beginning with 08.
8

The last two digits form a downstream-order sequence, starting with 10 and proceed ing downstream by tens to a reservoir or a major tributary confluence. At each tributary, the numbering sequence begins at the mainstem number plus one and pro ceeds generally downstream. For example, in the upper Willow Creek basin, the subbasin numbers increase from 0110 to 0140 by tens. In the 0140 subbasin two tributaries join the mainstem. Subbasins in the tributary drainages are thus numbered 0141 through 0146. Deviations from the numbering sequence occur in the Lone Tree Creek basin where the subbasins were numbered by the Bureau of Land Management before the sequence was completely devised.
The schematic diagram corresponding to the delineated subbasin boundaries is shown in figure 5. Each subbasin identification number is shown within the box identifying a subbasin. Similarly, the actual reservoir name is shown beside each reservoir symbol in figure 5. Channel routings are indicated by symbol, but no identifying numbers for routings are used on the schematic. The symbols for hydro- graph combination points are numbered for identification purposes starting with 10 and proceeding downstream by tens.
Two component symbols shown in figure 5 that were not previously discussed in the HEC-1 model description are those for a waterspreader and for a spillway flow diversion. As used in the Willow Creek basin, a waterspreader is a series of low- level dams or dikes constructed across and perpendicular to the stream channel as shown in figure 6. For HEC-1 simulation purposes, each waterspreader was con sidered to be a series of reservoirs, with the output from each reservoir being the input to the next identical reservoir. How the reservoir data were obtained and linked together will be described in a subsequent section. The spillway flow diversion component represents a reservoir whose emergency spillway discharge is diverted to a different location than the principal spillway discharge. The diver sion component symbol in figure 5 shows the destination of the diverted discharge.
Subbasin runoff component
As shown in figure 4, 100 subbasins were delineated, and the following physical variables were determined for each subbasin:
(1) drainage area,(2) Curve Number,(3) hydraulic length, and(4) subbasin slope.
The first three variables were all measured from maps at a scale of 1:100,000. First, the drainage area, in square miles, was measured using an electronic digi tizer. Next, Curve Numbers were determined by soil scientists and hydrologists of the U.S. Bureau of Land Management using the latest available soil surveys and established procedures of the Soil Conservation Service (Dan Muller, written commun., 1984). Then, the hydraulic length, in feet, was measured by tracing the distance of the longest flow path in the subbasin from the subbasin divide to the outlet. Finally, the subbasin slope was approximated by subtracting the lowest elevation in the subbasin from the highest elevation along the subbasin divide and dividing the result by the hydraulic length. The subbasin slope was used to com pute subbasin lag time using equation 3. A complete listing of all measured sub- basin variables is provided in table 1 at the end of the report. Also, the com plete input stream of computer card-images for the HEC-1 model as used in the Willow Creek basin is provided in table 2 at the end of the report.
T.27N.
T.25N.
v Brazil \ Divide I
0170 Browning)
0150 \Halt
Mudpot
upper rfh-OSouth Desert \
Bat* from U.S. Bureau of Land Management 1:100,000, 1985
\. \ / .36E. ~1 ' /
345 MILES
4 5 KILOMETERS
Figure 4. Delineated subbasins of Willow Creek and location
10

R.38E.
R.38E. 06174000
R.40E.
\T.26N.
^^9837 -i
£4^%sr^rfl^P^^^\ ^&<l«£xM V
R.39E.
EXPLANATION
RESERVOIR STAGE GAGE
06i74000A CONTINUOUS-RECORD STREAMFLOW- GAGING STATION AND NUMBER
A PROJECT SEASONAL STREAMFLOW- GAGING STATION
$> RAIN GAGE (RECORDING)
Private I
01R.38E.
RAIN GAGE (NON-RECORDING)
WATERSPREADER AND NAME
RESERVOIR AND NAME
MAJOR WATERSHED BOUNDARY AND NUMBER
Upper Willow Creek
Lone Tree Creek
Beaver Creek
Lower Willow Creek
0230 "-SUBBASIN BOUNDARY AND NUMBER
of data-collection sites.
11
Faw
n D
rop

V
Arc
ham
beau
lt /if
510
) X
Will
ow F
lat
Will
ow
Fla
ti
Div
ers
ion
!rc
ham
beou
lt
Lone
Tre
e
Dik
es
EX
PLA
NA
TIO
N
RE
SE
RV
OIR
R
OU
TIN
G
CO
MP
ON
EN
T
AN
D
NA
ME
SU
BB
AS
IN
RU
NO
FF
C
OM
PO
NE
NT
A
ND
ID
EN
TIF
ICA
TIO
N
NU
MB
ER
CH
AN
NE
L
RO
UT
ING
C
OM
PO
NE
NT
HY
DR
OG
RA
PH
C
OM
BIN
AT
ION
P
OIN
T
AN
D
NU
MB
ER
WA
TE
RS
PR
EA
DE
R
CO
MP
ON
EN
T
AN
D
NA
ME
SP
ILLW
AY
F
LO
W
DIV
ER
SIO
N
CO
MP
ON
EN
T
530)
U.S
. G
eolo
gica
l S
urve
y ga
ge
06
17
40
00
Figu
re 5. Schematic di
agra
m of Wi
llow
Creek
Basi
n.

Strtom
H Vorits , 2-3 fMt A
SECTION A-A*
Figure 6. Sketch of typical waterspreader.
Channel routing component
Characterization of each channel routing component required determinations of reach length, slope of the energy grade line, channel cross section, and estimates of the Manning's roughness coefficient. The reach lengths for all channel routing components were measured on maps using the electronic digitizer. The channel slope of each reach length was assumed to be equal to the slope of the energy grade line. The channel slope was determined by subtracting the channel bed elevation at the downstream end of the routing reach from the channel bed elevation at the upstream end of the reach and dividing the difference by the reach length.
The channel cross sections were obtained from onsite surveys made by Bureau of Land Management hydrologists and technicians at selected, representative channel locations. About 40 channel sections were surveyed and divided into four groups based on size and stream order. All sections within each group were plotted and superimposed on a single graph so that a single, average cross section could be drawn for each group. The average section for each group finally was adjusted to provide an eight-point section in the HEC-1 format previously described. Thus, one of four standard, representative sections was input for each channel routing component in the study area, with the smallest section being used in the headwater
14

areas, the largest section being used in the lower Willow Creek mainstem, and the two mid-sized sections being used everywhere else. Each of the four standard sections is illustrated in figure 7.
The Manning's roughness coefficients shown in figure 7 were selected by the author from color photographs taken at the time of the channel surveys. Various HEC-1 simulations previously made by the author indicated that channel routing results were relatively insensitive to changes in the Manning coefficient, so a single set of coefficients was used for all four standard sections.
Reservoir routing component
The 84 reservoirs included in the simulation model are shown on the Willow Creek schematic (fig. 5). For the reservoir routing component, tables of reservoir storage volume and reservoir outlet discharge versus water-surface elevation were required for each reservoir. Detailed project design data had this information only for three of the largest reservoirs. Onsite surveys by personnel from the Bureau of Land Management were required to obtain the reservoir geometry data at the remaining 81 reservoirs.
Determining reservoir volumes for such a large number of reservoirs using con ventional surveying procedures would have been prohibitively expensive, so the following approximate technique was used. First, Bureau of Land Management tech nicians measured the surface area of each reservoir from aerial photographs. The surface area generally was determined at the full reservoir elevation (principal spillway elevation). Onsite surveys then were used to obtain the minimum and maxi mum reservoir elevations, the elevations and sizes of all reservoir outlet pipes, and a cross-sectional survey of the emergency spillway.
Reservoir volume (V) at any elevation was calculated from the equation:
V = (SA + SAMIN)/2 ' (E - EMIN) (6)
where
SA is surface area, in acres, for elevation E;is surface area, in acres, for the lowest stage of the reservoir; is water-surface elevation, in feet; andi s minimum reservoir elevation (lowest stage of the reservoir), in
feet.
The surface areas at the lowest stage of the reservoir and at any elevation E were calculated using the following procedures. First, the diameter of a circle with a surface area equal to that measured from the aerial photographs was calcu lated from the equation:
D = (55,462 SA) 1 / 2 (7)
where D is diameter, in feet, of a circle with an area of SA, in acres. Assuming that each reservoir was in the shape of an inverted, truncated cone as shown in figure 8, the following equation was used to calculate the diameter of the circle at the minimum reservoir elevation:
°MIN = °MAX " (EMAX
15

10
8
6
4
2
0
Manning n = O.O4
10
8
6
4
2
12
10
8
6
2
0
16
14
12
IO
8
6
4
2
050 100 ISO 2OO 250 300 350 4OO 450 500 550 600
DISTANCE, IN FEET
Figure 7. Four standard cross sections for channel routing.
16

Maximum surface area = SA max
Maximum reservoir
elevation = E max
Reservoir side slope = I/S\
Minimum reservoir
elevation = E min
^Minimum surface area = SA min
Figure 8. Approximating reservoir elevation-volume relation.
where
is diameter of the circle at minimum reservoir elevation is diameter of the circle at maximum reservoir elevation (EMAX)» and
S is the reciprocal of side-slope of the reservoir.
Based on tests made on reservoirs with known elevation-volume relationships, S was assumed to be 50 for all Willow Creek reservoirs. Next, the surface area at the minimum reservoir elevation was calculated from the following form of equation 7:
SAMIN = (°MIN
where all terms are as previously defined.
Finally, for any elevation E greater than was used to determine surface area:
D = (E -
(9)
i the following sequence of equations
+ DMINSA = (D/235.5) 2
(10)
(11)
where all terms are as previously defined.
The computation of reservoir discharge versus elevation was based on a simple orifice flow equation for reservoir outlet pipes (principal spillways) without vertical drops, a more complicated combination pipe-and-weir flow equation for outlet pipes with drops, and a broad-crested weir flow equation for emergency spillways. The orifice-flow equation used was:
Q = 0.5'A'(64.4'H) 1/2 (12)
17

where
Q is outlet-pipe discharge, in cubic feet per second; A is cross-sectional area of the outlet pipe, in square feet; and H is difference between the reservoir water-surface elevation and the
elevation of the center of the outlet pipe, in feet.
For reservoirs with vertical-drop outlet pipes as shown in figure 9, flow is initially controlled by the size of the vertical drop pipe. In this instance, the drop-pipe entrance functions as a weir, and the following weir-flow equation is applicable:
Q = C'L-H3 / 2 (13) where
Q is outlet-pipe discharge, in cubic feet per second;C is a weir coefficient that varies with head (H) and drop-pipe diameter
L is length of weir and is equal to the circumference of the drop pipe(ff'Dj); and
H is hydraulic head or difference, in feet, between the water-surfaceelevation and the drop pipe.
When the water-surface elevation in the drop pipe rises above the critical- depth elevation for weir flow (d c ), weir flow is drowned out, and the following pipe flow equation was assumed to be applicable (U.S. Bureau of Reclamation, 1977):
Q = 6.303*D'(H 1 /(2.0 +f'L /D) 1 / 2 (14)
where f is a friction factor that is a function of pipe material and diameter, and was obtained from a table, and all other variables are as previously defined or as shown in figure 9.
Flow over the emergency spillway at each reservoir was calculated from the general broad-crested rectangular weir flow equation:
Q = C»B'H3 /2 (15) where
Q is discharge, in cubic feet per second;C is a weir coefficient that is a function of the hydraulic head (H);B is effective length of the weir, in feet; andH is hydraulic head, in feet, which is approximated by the difference
between the water-surface elevation and the elevation of the crest ofthe weir.
Because the spillway cross sections were commonly irregular sections, as shown in figure 10, the following form of equation 13 was used for most surveyed spillway sections:
Q = CZ b'H3 / 2 (16) i=2
18

= water surface
I distance from H= water surface
to drop pipe
XX
distance from top of drop pipe to bottom of drop pipe
water surface in drop pipe
D| - diameter of drop pipe
D = diameter of outlet pipe
distance from . water surface in ~ riser to centerline
of outflow pipe
Lp= length of outlet pipe
Figure 9. Drop-pipe spillway. All distances and lengths are in feet.
3.0SO 100 150
HORIZONTAL DISTANCE, IN FEET200
Figure 10. Typical reservoir spillway cross section,
19

where
Q is discharge, in cubic feet per second;b is horizontal distance, in feet, between the surveyed ground elevation
at i and at i-1; IT is average of the differences between the water surface and the ground
elevation, in feet, at points i and i-1; C is weir coefficient for the head (H); and n is number of surveyed ground elevations in the emergency spillway section.
Waterspreader component
As previously indicated, a hydrologic component required for the Willow Creek study that is not considered in the standard HEO1 simulation procedure is the waterspreader. Each dike of the waterspreader was assumed to function as a reser voir, with its emergency spillway discharge being the streamflow input to the next dike (reservoir) downstream. Aerial photographs were used to determine the number of dikes and areal extent of each waterspreader. Although the number and length of the individual dikes vary from waterspreader to waterspreader, the dimensions of each dike are about equal. Thus, the spillway flow section on each dike was pre sumed to be approximated by the same rectangular and trapezoidal-shaped section as shown in figure 11. Even though the spillway cross section shown in figure 11 is
-O
S
3
Zo§
50 100 150 200 250 500
HORIZONTAL DISTANCE, IN FEET
Figure 11. Assumed waterspreader spillway cross section.
20

arbitrary, it was chosen by U.S. Bureau of Land Management hydrologists as a rea sonable approximation of the average flow section on all Willow Creek water- spreaders. A table of discharge versus waterspreader water-surface elevation thus was prepared for each dike using the spillway geometry shown in figure 11 and the emergency spillway discharge calculation procedure described previously.
To determine the required table of storage volume versus water-surface eleva tion for each reservoir (dike) within a waterspreader, the total area of the water- spreader was divided by the number of dikes. The resulting area was considered to be the reservoir surface area for each dike, and the procedure previously described was used to calculate a table of reservoir volume versus water-surface elevation. For each waterspreader, flow was simulated by routing through n consecutive, iden tical reservoirs, where n is the number of dikes in the waterspreader. The number of dikes and volumes within the various waterspreaders in the Willow Creek basin are listed in table 3 at the end of the report.
SYNTHETIC STORM HYETOGRAPH
To simulate the 100-year-frequency peak discharge from Willow Creek, a syn thetic 100-year-frequency storm was constructed from precipitation depth-duration data obtained from the National Weather Service (Miller and others, 1973). The procedure used to construct the synthetic storm is contained within the HEC-1 program and is a standard design procedure used by the Corps of Engineers. To develop the synthetic storm, 100-year-frequency precipitation depths for storm durations from 5 minutes to 24 hours were input to the model as cumulative storm amounts, and incremental amounts of precipitation at 10-minute intervals subse quently were calculated. The synthetic storm hyetograph then was constructed by arranging the incremental precipitation depths so that the largest value occurred at the center of the storm, the second largest value preceded the largest value, the third largest value followed the largest value, the fourth largest preceded the second largest, and so forth. The resultant 24-hour duration storm hyetograph for a point within the Willow Creek basin has 72 ordinates and is shown in figure 12.
The construction of a simple, 6-hour duration storm hyetograph using 1-hour time increments is illustrated in figure 13. In this instance, the resultant example storm hyetograph has only 6 ordinates rather than the 72 ordinates used for the Willow Creek basin.
The synthetic-storm construction technique used in this study results in high intensity, short duration rainfall occurring near the center of the storm duration with significantly lower intensity rainfall occurring at the beginning and end of the storm. This time pattern of rainfall distribution may not be typical of storms that produce 100-year-frequency runoff from drainage areas as large as the entire Willow Creek basin. It is, however, probably typical of storms that produce 100- year-f requency runoff from smaller drainage areas such as the subbasins comprising the Willow Creek basin. Using any single storm distribution to generate 100-year- frequency runoff from drainage areas ranging from about 1 square mile to about 500 square miles will result in non-typical storm distributions for some drainage areas. By using a standard design procedure such as the Corps of Engineers' synthetic storm, it was believed that large errors in computed runoff resulting from an in appropriate time-distribution of rainfall would be minimized. Errors that did re sult from using a single precipitation distribution were accounted for in the cali bration phase by adjusting the precipitation depth-drainage area relationship.
21

0.8
0.7
0.6
°'5
UJ 0.3
0.2
0.1
0.0
I T
iHiininniniiimii200 400 600 800 1000
TIME, IN MINLTTES1200 UOO 1600
Figure 12. Synthetic rainfall hyetograph for 100-year-frequency, 24-hour duration storm in Willow Creek basin.
Because the average depth of precipitation over an area generally decreases with the size of area, precipitation depths for storms of any frequency and duration must be adjusted for varying areas of coverage. The depth-area relationship used by the National Weather Service is shown in figure 14. Thus, to simulate the 100-year peak discharge at numerous points within a basin, each with a different drainage area, the 100-year-storm hyetograph must be revised using a depth-area adjustment similar to that shown in figure 14. Further, at combination points within the basin where hydrographs are added, the combined hydrograph must be adjusted to produce a 100-year-frequency runoff hydrograph consistent with the combined drainage areas of the contributing subbasins.
Within HEC-1, hydrographs consistent with the sizes of the contributing drain age areas are generated throughout the basin by interpolation from a set of index hydrographs that are simulated at each point for different total storm depths. To illustrate, figure 15 shows a schematic of a basin where 100-year-frequency runoff hydrographs are required for subbasin A and subbasin B, and at the confluence of stream A and stream B. The rainfall depth-drainage area relationship for a 100- year-frequency storm of some specified duration is shown by the table on the sche matic. For example, the 100-year-frequency rainfall total for a drainage area of 100 square miles in this illustrative example is 15 inches. Similarly, the 100- year-frequency rainfall totals for drainage areas of 200, 500, and 1,000 square miles are 13, 10, and 8 inches, respectively.
22

Storm duration, in hours
100-ye a r - frequencystorm depth,
in inches
I nc re mental (hourly)
precipitation, in inches
Arranged incremental
precipitation, in inches
2.13
2.35
2.55
2.70
2.85
2.99
2.13
.22
.20
.15
.15
.14
0.14
.15
.22
2.13
.20
.15
Resultant Storm Hyetograph
INCHES
ro c
z
z"0
1 ,oUJo:0.
n
.
1
i i
_
12345
TIME, IN HOURS
Figure 13. Construction of an example 6-hour duration storm hyetograph.
The simulation model then is run for each of the four different storm depths to produce four different hydrographs at each required location. The 100-year- frequency runoff hydrograph at each location then is interpolated from among the four hydrographs according to drainage area, as shown in figure 15. Thus, the hydrograph at the mouth of subbasin A, where the drainage area is 130 square miles, is determined by interpolating between the index hydrograph for 100 square miles and the index hydrograph for 200 square miles. Likewise, the hydrograph at the mouth of basin B, where the drainage area is 250 square miles, is determined by interpo lating between the index hydrograph for 200 square miles and index hydrograph for
23

1.00
0.99
0.98
0.97
0.96
0.95
0.94
0.93
0.92
0.91
0.90100 200 300 400
DRAINAGE AREA, IN SQUARE MILES500
From Miller and others (1973)
Figure 14. National Weather Service rainfall depth-drainage area adjustment.
500 square miles. At the combination point where hydrographs from basins A and B are added together, the total contributing drainage area is 380 square miles. The hydrograph at the combination point thus is determined by interpolating between the combined index hydrographs for 200 square miles and the combined index hydro- graphs for 500 square miles.
CALIBRATION BY ADJUSTING THE DEPTH-AREA RELATION
To adjust the 100-year-frequency precipitation depths for different drainage areas in the Willow Creek basin, the relationship developed by the National Weather Service (fig. 14) was used first. As a check on the validity of this adjustment, the HEC-1 simulation model was run on the Willow Creek watershed without any reser voirs or waterspreaders included. The resultant 100-year-frequency flood peaks for different subbasin sizes then were compared with 100-year-frequency flood peaks determined from nearby gaging-station data. The results of the comparison are shown in figure 16, where a best-fit regression line through the gaging-station data is compared with a best-fit regression line through the HEC-1 simulated data using the National Weather Service precipitation depth-area adjustment. The slope of the regression line through the HEC-1 simulated data is steeper than the slope of the regression line through the gaging-station data, indicating that the simu lated peaks for the larger drainage areas are too large. To adjust the slope of
24

B250 mi 2 \
Hydrographs for subbasin A
Combined hydrographs for subbasins A and B
Hydrographs for subbasin B
100-YEAR RAINFALL DEPTH-
DRAINA6E AREA FUNCTION
AREA, IN RAINFALL,
SQUARE MILES IN INCHES
100
200
500
1000
15
13
10
8
EXPLANATION
D DESIRED LOCATION FOR HYDROGRAPH
>" 'STREAM CHANNEL AND DIRECTION OF FLOW
DRAINAGE BOUNDARY
A|, 0 2 SUBBASIN LABEL AND DRAINAGE AREA, IN SQUARE MILES
/NAI5 INDEX HYDROGRAPH FOR / ^\ GIVEN PRECIPITATION
INTERPOLATED HYDROGRAPH
Figure 15. Example interpolation of streamflow hydrographs from index hydrographs.
25

10
0,0
00
22,7
00
10
,00
0
I I
I I
I I
I I
I I
I I
I I
I I
I I
I I
15
00
10
0-Y
EA
R
PE
AK
D
ISC
HA
RG
E
AT
ST
RE
AM
FL
OW
-6A
6IN
6
ST
AT
ION
S
tati
on
nu
mbe
r it
ab
bre
viat
ed
RE
GR
ES
SIO
N
LIN
E
THR
OU
GH
1
00
-YE
AR
-FR
EQ
UE
NC
Y
PE
AK
D
ISC
HA
RG
E
A
t ga
ging
st
atio
n
-
Fro
m
HE
C-I
re
tultt
utln
g N
atio
na
l W
eath
er
Ser
vice
ra
infa
ll de
pth-
drai
nage
ar
ea
adju
stm
ent
I I
Ii
I I
I I r
S3 ON
1000 10
0
Fro
m
HE
C-I
re
sult*
uei
ng U
.S.
Soi
l C
onte
rvat
ion
Ser
vice
ra
infa
ll de
pth-
drai
nage
ar
ea a
djus
tmen
t 1
3095
1445
13
08
1
310
^11500
*
,16
90
J505
H772
1
510
.183
1
I I
I I
I I
I \
II
I I
I I
10
100
DR
AIN
AG
E
AR
EA
, IN
S
QU
AR
E
MIL
ES
550
1000
IO.O
OO
Figure 16. Comparison of Hydrologic Engineering Ce
nter
-1 results with ga
ge da
ta,

the regression line through the HEC-1 data, the synthetic storm rainfall distribu tion could have been changed or the precipitation depth-drainage area adjustment could have been changed. The rainfall distribution was retained because it is a standardized HEC-1 design procedure and the precipitation depth-drainage area adjustment was modified.
For reservoir design on small watersheds, the Soil Conservation Service uses a precipitation depth-drainage area adjustment curve as shown in figure 17. Because this adjustment is applicable only to drainage areas of less than 100 square miles, the curve was arbitrarily extended as shown to be usable for the entire Willow Creek basin. Using the adjustment curve shown in figure 17, the HEC-1 simulation results for the Willow Creek basin without any structures included were much closer to the best-fit line through the gaging-station data (fig. 16). The Soil Conservation Service precipitation depth-drainage area adjustment thus was used for all subsequent simulations in the Willow Creek basin.
1.00
0.55 -
0.50100 200 300 400
DRAINAGE AREA, IN SQUARE MILES
Modified from U.S. Soil Conservation Service (1972)
Figure 17. U.S. Soil Conservation Service rainfall depth-drainage area adjustment. Dashed line indicates extension of original curve.
27

SIMULATION RESULTS
The simulation for Willow Creek without any structures constitutes a "natural flow" condition. As just described, the results of this simulation are reasonably close to the 100-year-frequency flood peaks at nearby, unregulated, gaged streams. In figure 16, the best-fit line through the simulated peaks in the Willow Creek basin plots above the best-fit line through the gage data for all drainage area sizes. Simulated peaks thus range from about 12 percent larger than the best-fit line through the gage data for a drainage area of 0.5 square mile to about 109 percent larger for a drainage area of 530 square miles. At the mouth of Willow Creek, the 100-year peak discharge for the natural-flow condition is 22,700 cubic feet per second. The largest peak discharge recorded in 30 years at the gaging station at this site is 12,400 cubic feet per second. The simulated 100-year- frequency peak thus appears to be reasonable, although comparisons are tenuous because of the increased construction of reservoirs and waterspreaders over the period of gaged record.
The next simulation for the Willow Creek watershed was run with all reservoirs and waterspreaders in place. This simulation represents present conditions in the Willow Creek basin with all structures operating normally (therefore, no structure failures due to flooding). For this simulation, all reservoirs were assumed to be full at the beginning of the 100-year-frequency storm. This assumption represents a conservative approach that obviously results in larger simulated peaks than if reservoirs are assumed to be initially empty. The conservative approach was con sidered reasonable because of the likelihood of reservoirs being filled by spring snowmelt or early summer rains before the occurrence of a 100-year-frequency rain storm. The simulation with all structures in place and operating normally resulted in a 100-year-frequency peak discharge at the mouth of Willow Creek (station 06174000) of 5,870 cubic feet per second. Comparison with the simulated peak under natural-flow conditions shows that the cumulative effect of the present system of structures in the basin is a 74-percent decrease in 100-year-frequency peak discharge at the mouth. The cumulative effect of upstream structures can be similarly determined for any other point in the basin by comparing the 100-year- frequency peak discharges for ng aral-flow and existing conditions. A schematic diagram of the Willow Creek basii (fig. 18) shows the 100-year-frequency peak dis charges for both natural-flow end existing conditions for each reservoir and waterspreader.
At the gaging station at the mouth, peak discharges greater than 5,870 cubic feet per second have occurred three times since 1953. The largest peak occurred in 1962 (peak discharge of 12,400 cubic feet per second), before several major structures had been built. The last two peak discharges greater than 5,870 cubic feet per second occurred in 1969 (peak discharge of 12,000 cubic feet per second) and in 1974 (peak discharge of 8,800 cubic feet per second) when virtually all major structures were already in place in the Willow Creek basin. On this basis, the simulated 100-year-frequency peak discharge with all structures in operation may be too small. However, damage .reports from the 1969 and 1974 floods (Dan Muller, written commun., 1983) indicate that several structures failed or suffered severe damage during both floods. Thus, it appears that structure failure at least partly contributed to the large peaks in both years. Also, reported rainfall amounts for both the 1969 and 1974 storms exceeded the 100-year-frequency, 24-hour duration totals, at least in certain locations in the Willow Creek basin. There fore, even though the simulated 100-year-frequency peak discharge with all struc tures in place has been exceeded twice in the last 15 years, the simulated peak
28

Gag
ing
stat
ion
06174000
22
.70
0
58
70
Sou
thw
est
Bur
nett
Nor
thw
est
21
20
^
Bur
nett
2050
Arc
ham
beau
lt/
mA
rcha
mbe
ault
34
20
Will
ow F
lat
1270
Fo
ulw
ea
the
r |||'
NJ
Bra
zil
Div
ide
1020
12
8 Bra
zil
Div
ide
1020
12
8
Janu
ary
1590
18
Bla
ncha
rd
Hur
rican
e15
6014
60
Tom
ahaw
k 19
00
18
90
Bea
vere
tte
4460
2810
Moc
casi
n 2720
"2TO
O"
Bea
vere
tte47
70
3390
Sou
th B
eave
r 3850
1370
3180
11
0W
agon
Whe
el
32
00
2
30
Lo
ne T
ree
Dik
es
Itcai
na 1510
67
0 77
6U
pper
Lon
e Tr
ee
\ 13
60
1320
Will
ow
7F
lat
Div
ersi
on11
1010
90
Will
ow
C
reek
7
84
734
Faw
n 949
Dro
p 9
49
Cac
tus
lftK
n la
t 16
50" 1
490
Div
ersi
on 3
Trip
le C
ross
ing
2 6J
O 36o/
Trip
le C
ross
ing
xeis
nD
ro
Double
'
*
6Jf
ifi
Cro
ssin
g
Dog
Cre
ek
1940
18
70C
actu
s F
lat
1650
13
20
Trip
le
Cro
ssin
g 15
330
Trip
le
5610
78
Cr
ossi
ngD
og C
reek
2670
708
Gut
shot
7
08
0
243"
White
tail
1050
10
50In
vern
ess
2790
376
Tar
get
\
S 20
90
Bom
ber^
79
8 28
30
530
Bom
ber
2790
53
0
Your
Nam
e 12
40
899
One
F
ork
19
90
2230
Thr
ee T
rees
336
0 2
40
0C
orra
l Ju
nctio
n I
2640
22"IO
C
orra
l Ju
nctio
nC
orra
l Ju
nctio
n'
Ext.
886
829
Har
d P
an
25
60
2
34
0S
hort
Cre
ek
1070
10
70
She
epsh
ed
1990
18
70B
row
ning
2380
1990
Hal
f P
int
2740
2280
Priv
ate
3 28
70
659
Two
Fork
s 26
90
24
50
Upp
er
Sou
th
For
k
1110
Dia
gram
m
od
ifie
d
from
U
.S.
Bur
eau
of
Land
M
anag
emen
t (1
985)
EX
PLA
NA
TIO
N
100-Y
EA
R-F
RE
QU
EN
CY
P
EA
K
DIS
CH
AR
GE
With
out
upst
ream
st
ruct
ure
s W
ith
upst
ream
st
ruct
ure
s
WA
TE
RS
PR
EA
DE
R
AN
D
NA
ME
Figure 18. Schematic di
agra
m sh
owin
g 100-year-frequency discharges at Willow Cr
eek
stru
ctur
es.

discharge may still be a reasonable estimate, given that no structures fail during the 100-year flood. The long-term validity of the simulated 100-year-frequency peak discharge can be verified only by continued rainfall and discharge data col lection.
A third simulation was run with all structures removed except for certain key structures that showed the most substantial decrease in 100-year-frequency peak discharge. Several preliminary runs were made wherein reservoirs and water- spreaders having little effect on peak discharges were successively eliminated to help select the key structures. The final determination of key structures resulted in the elimination of 78 reservoirs and 13 waterspreaders. Removing these struc tures from the analysis resulted in a simulated peak discharge at the mouth of 8,820 cubic feet per second a value 52 percent larger than the simulated peak with all structures in place. The key structures identified in the simulation analysis were Archambeault waterspreader and the following reservoirs: Collins, Forest, Grub, Gutshot, Mudpot, and Triple Crossing.
Discharge hydrographs for the three different simulations are presented in figure 19. The hydrographs were computed for Collins Reservoir, Gutshot Reservoir, and the mouth of Willow Creek for three conditions: natural flow, all structures in place, and only key structures in place. At the Collins Reservoir, the simu lated peak discharges for the three different simulations were 7,390, 599, and 2,310 cubic feet per second, respectively. At Gutshot Reservoir, the simulated peak discharges were 7,080, 243, and 2,510 cubic feet per second, respectively. As previously discussed, the peak discharges at the mouth of Willow Creek for the three simulation runs were 22,700, 5,870, and 8,820 cubic feet per second, respectively.
LIMITATIONS OF THE SIMULATION ANALYSIS
Because of the lack of recorded rainfall and runoff data, the HEC-1 simula tion model could be used in the Willow Creek basin with only a synthetic storm distribution. The model thus could not be calibrated or verified using actual rainfall-runoff data. For this reason, the measured and estimated physical vari ables describing the hydrologic components were fixed and assumed to be correct. For the simulation of natural-flow conditions, the variables having the largest effects on simulated peak discharges are probably those comprising the runoff component, namely Curve Number and lag time. A previous limited sensitivity analy sis by the author indicated that peak discharge was particularly sensitive to changes in Curve Number. This earlier analysis also indicated that peak discharge was relatively insensitive to changes in channel routing variables such as channel section geometry, slope, and Manning's roughness coefficient. Consequently, any error in simulated discharge resulting from error in the measurement or estimation of hydrologic variables is believed to be largely attributable to Curve Number. Simulation results for the natural-flow condition nonetheless are considered to be reasonable because of the comparison with nearby gaging-station data (fig. 16). On this basis, calibration data would not appear to result in significant adjust ments to Curve Numbers or any other runoff or channel routing variable.
For the simulations with structures in place, the results are subject to con siderably more error. The technique previously described for estimating reservoir volume, for example, is a generalization that may substantially overestimate or underestimate some reservoir volumes. Likewise, the assumption that waterspreader
30

DIS
CH
AR
GE
, IN
C
UB
IC
FEE
T P
ER
S
EC
ON
D
VO rt
0)
Cu
O
O Hi
o
o S
Hn x
C
oo
m o §g
w
w
K
09
> V \ / i
c c c \ .''" t-\ \
> c
\x
'
» 0
> c
? ^
""" ..-
.
. » "
*
^
i 1
- ....
"
*"
i I
...
...i
I
-..
..
......
1 «
! I
.. "
i i
> 0
DIS
CH
AR
GE
, IN
CU
BIC
F
EE
T
PE
R S
EC
ON
D
I
t-1
O 0) o o o> rt
H-
O
oa
o
o 5 *
</> X
0 a> S
H -
s K
«»
JH
o
-
w3
z * £g a>
o
w
* £
c c c
_ t^- // ii-
r>
c >
c >
c
"^^ ^ J
*^ '?
> o
> c
> c
> c
^)
^--'"
* 4
> C
> C
>
C
»**
k C
> c
> c
> cH
fl
9 C
>
C
> C
...
» > C
> c
> c
*""-
..--
"'
4 a
| 0
> c
> o

dikes function as identical reservoirs with arbitrarily sized spillways may be seriously in error. In addition, the simulation results cannot be checked for reasonableness because of the lack of recorded flood-frequency data for any similar, regulated watershed systems.
Although the error due to imprecise reservoir volume determination and waterspreader simulation can be quantified only with additional calibration data, the relative effects of the errors can be investigated with the simulation model. Thus, to investigate the effects of reservoir volume, the HEC-1 model was run with all reservoirs and waterspreaders in place, but with different reservoir elevation- volume relationships. Successive model runs were made with reservoir volumes increased by 10 percent, increased by 30 percent, decreased by 10 percent, and decreased by 30 percent. The reservoir volume changes resulted in significantly smaller percentage changes in the simulated 100-year-frequency peak at the mouth of Willow Creek. As shown in figure 20, an increase of 30 percent to all reservoir volumes resulted in only a 3.4-percent decrease in 100-year peak discharge. Simi larly, a 30-percent decrease in all reservoir volumes resulted in a 5.2-percent increase in 100-year peak discharge. If the technique for estimating reservoir volumes indeed has a 30-percent error, the error is likely to be relatively unbiased and to result in some volumes being overestimated and some volumes being under estimated. In that instance, the error in simulated 100-year-frequency peak dis charge would be between -3.4 and +5.2 percent.
-30 -20 -10 o 10 20 PERCENTAGE CHANGE IN RESERVOIR VOLUME
Figure 20. Effects of reservoir volume change on computed 100-year-frequency discharge of Willow Creek.
32

A similar analysis was made for different assumed waterspreader hydraulic characteristics. Simulations were run with spreader volumes increased 10 percent, increased 30 percent, decreased 10 percent, and decreased 30 percent. The result ant percentage changes in simulated peak discharge were insignificant, as shown in figure 21. Simulations were run with waterspreader spillway discharges increased 10 percent, increased 30 percent, decreased 10 percent, and decreased 30 percent. The percentage changes in simulated peak discharge were all zero with these condi tions. As with reservoir volume, errors in waterspreader discharge and volume are believed to be unbiased, with some discharges and volumes being overestimated and others underestimated. If so, percentage changes in simulated peak discharge would be even less than indicated in figure 21.
0.10
-0.04-30 -20 -10 0 10 20
PERCENTAGE CHANGE IN WATERSPREADER VOLUME
Figure 21. Effects of waterspreader volume change on computed 100-year-frequency discharge of Willow Creek.
Because all simulations were made with a single, standardized synthetic storm distribution, a final sensitivity analysis was made by varying the most severe rainfall intensities. As discussed earlier, the synthetic storm used in the Willow Creek basin had high, short-duration intensities in the middle of the storm that might not be typical of 100-year-frequency storms covering basins as large as Willow Creek. Accordingly, an HEC-1 run was made by decreasing by 50 percent the 100- year-frequency, 5-minute and 15-minute duration rainfall depths input to the model. The resultant 100-year peak discharge at the mouth of Willow Creek was unchanged from that produced by the standard synthetic storm. Model results thus do not appear to be overly sensitive to the maximum rainfall intensity occurring in the middle of the storm.
33

Perhaps more significant than the errors due to imprecise measurement of reser voir volume, incorrect assumptions about waterspreader hydraulic characteristics, or incorrect rainfall distribution is the likelihood that one or more structures will fail during a basin-wide 100-year-frequency storm. With such a large system of reservoirs and waterspreaders, all probably will not function properly during such a large, rare storm. The sudden failure of a full reservoir or waterspreader could result in a peak discharge at the failure location many times larger than would normally occur from storm runoff. Although such failures can be simulated with the HEC-1 model, it is not known where and when the failures might occur. To analyze all possible combinations of failures would be extremely impractical. Thus, the hydrologic consequences of various structural and management alternatives require the presumption that all structures will function equally well.
SUMMARY AND CONCLUSIONS
The HEC-1 runoff simulation model was used to evaluate the effectiveness of a complex system of reservoirs and waterspreaders in the 550-square-mile Willow Creek basin in northeastern Montana. Willow Creek is a sparsely populated basin, com posed mostly of rolling uplands interspersed with flat valleys and a well-defined drainage system. Most of the basin is publicly owned and has been managed by the U.S. Bureau of Land Management for conservation purposes. Since the early 1950's, more than 200 reservoirs have been constructed in the basin.
For simulation purposes, the basin was delineated into 100 subbasins that in cluded 84 reservoirs and 14 waterspreaders. The subbasins were linked together by channel reaches and combination points where runoff from two or more subbasins could be added together. Runoff from the subbasins was simulated by routing a synthetic, 100-year-frequency rainfall excess to the subbasin outlets using the U.S. Soil Conservation Service unit hydrograph technique. Rainfall excess was computed by subtracting infiltration and detention losses as determined from the U.S. Soil Conservation Service Curve Number approach. Runoff from the subbasins was routed through the channel reaches and reservoirs using the modified Puls storage-routing technique. The waterspreaders, which are a series of low-level dikes constructed perpendicular to and across the stream channels, were simulated by routing runoff through each dike as if it were a reservoir with only a fixed- dimension emergency spillway.
Data for computing reservoir volumes and stage-discharge relations were obtained from aerial photographs and limited field surveys. Volumes were approxi mated by using the equation for the volume of a truncated cone. Discharges through pipe outlets were calculated from orifice-flow and combined weir-flow and pipe-flow equations. Discharges through emergency spillways were calculated from broad- crested weir-flow equations.
A rainfall depth-drainage area adjustment developed by the U.S. Soil Conserva tion Service was used to ensure that consistent 100-year frequency hydrographs were produced from the different sized subbasins. In addition, consistent hydrographs were generated at combination points where hydrographs were added together by in terpolation between index hydrographs computed for different drainage areas.
The simulation model was calibrated for the Willow Creek basin by first rout ing a 100-year-frequency flood through the basin with no structures in place. This run constituted a "natural flow" condition whose results could be compared to 100-
34

year-frequency flood peaks at nearby streamflow-gaging stations. The comparison showed reasonably good agreement between the simulated 100-year-frequency peaks for various subbasins in the Willow Creek basin and the 100-year-frequency peaks at the gaging stations (12 to 109 percent larger) when a rainfall depth-drainage area rela tion developed by the U.S. Soil Conservation Service was used. The simulated peak at the mouth of Willow Creek for the natural-flow condition was 22,700 cubic feet per second.
Simulation results with all structures in place produced a peak discharge at the mouth of 5,870 cubic feet per second. For this run, all reservoirs were pre sumed to be initially full (up to the elevation of the principal spillway), and all structures were presumed to operate normally with no washouts or overtopping fail ures. Thus, the cumulative effect of all structures in the Willow Creek basin is a 74-percent decrease in the 100-year peak discharge at the mouth of Willow Creek.
Although the simulated 100-year peak discharge with all structures in place has been exceeded twice in the last 15 years, structure failures during those floods may have contributed to the large recorded peaks. Until more rainfall- runoff data become available, the simulated 100-year peak discharge based on no structure failure is presumed to be reasonable.
Additional simulation runs were made to identify the structures that produced the most significant reductions in peak discharge. Six key reservoirs and one key waterspreader were thus identified. Eliminating all structures but these seven resulted in a 100-year-frequency peak discharge at the mouth of Willow Creek of 8,820 cubic feet per second.
The greatest limitation of the simulation results is the lack of rainfall- runoff data for additional calibration and verification. Based upon the comparison of the simulated results for the natural flow condition with 100-year-frequency peak discharges at nearby gaging stations, the parameters for the subbasin runoff component and the channel routing component appear reasonable. The results of the simulation results with all reservoirs and waterspreaders in place are subject to more error. The technique for estimating reservoir storage volumes and the assump tion that waterspreaders function as a series of fixed-dimension reservoirs may not be correct.
To test the effects that errors in reservoir and waterspreader storage could have on simulated peak discharges, all reservoir and waterspreader volumes were changed in successive simulation runs by -30, -10, +10, and +30 percent. The changes in reservoir storage volume produced changes in the simulated 100-year- frequency peak discharge at the mouth of Willow Creek ranging from +5 to -3 percent. Similarly, the changes in waterspreader volume produced negligible changes in the simulated 100-year-frequency discharge at the mouth of Willow Creek. Thus, although the assumptions made concerning the reservoir and waterspreader volumes may not be correct, the resultant errors in simulated peak discharge are less than the errors in computed volumes.
35

SELECTED REFERENCES
Chow, Yen Te, 1959, Open-channel hydraulics: New York, McGraw-Hill, 680 p.
Frickel, D. G., 1972, Hydrology and effects of conservation structures, Willow Creek basin, Valley County, Montana, 1954-68: U.S. Geological Survey Water- Supply Paper 1532-G, 34 p.
Miller, J. F., Frederick, R. H., and Tracey, R. J., 1973, Precipitation-frequencyatlas of the western United States, volume 1, Montana: Silver Spring, Md.,National Weather Service, 41 p.
Parrett, Charles, and Omang, R. J., 1981, Revised techniques for estimating magni tude and frequency of floods in Montana: U.S. Geological Survey Open-File Report 81-917, 66 p.
Portland Cement Association, 1964, Handbook of concrete culvert pipe hydraulics: Skokie, 111., 267 p.
Seaber, P. R., Kappinos, F. P., and Knapp, G. L., 1984, State hydrologic unit maps: U.S. Geological Survey Open-File Report 84-708, 21 p.
U.S. Army Corps of Engineers, 1981, HEC-1 flood hydrograph package, users manual: Davis, Calif., Hydrologic Engineering Center, 300 p.
U.S. Bureau of Land Management, 1985, Draft Willow Creek interdisciplinary water shed activity plan environmental assessment: Lewistown, Mont., Lewistown District Office, 76 p.
U.S. Bureau of Reclamation, 1977, Design of small dams: U.S. Bureau of Reclama tion, Water Resources Technical Publication, 816 p.
U.S. Environmental Data Service, 1971, Climate of Montana: U.S. Department of Commerce, National Oceanic and Atmospheric Administration, Climatography of the United States No. 60-24, 21 p.
U.S. Soil Conservation Service, 1972, National engineering handbook, section 4, Hydrology: 547 p.
36

SUPPLEMENTAL DATA
37

Table ! Subbasin variables for the Willow Creek basin
Sub- basin No.
01100120013001400141
01420143014401450146
01500151015201530154
01550160016101620163
01640165016601670168
01700171021002110212
02130214021502160220
Drainage area (A)
(square miles)
11.14.803.80
20.92.10
2.8010.54.004.304.40
7.603.004.301.304.50
2.5010.73.102.003.40
1.905.304.301.123.19
7.157.567.47.61
1.11
4.831.112.891.316.60
Curve No. (CN)
8186838585
8585818078
8486858686
8085868686
8685838585
8584858586
8686858684
Hydraulic length (h)
(feet)
36,20030,00020,00039,00012,200
18,80045,90020,70020,40023,200
39,80013,60024,60014,10018,300
13,70035,50015,60014,40016,600
16,40020,80013,60011,10016,300
33,40025,40029,3007,70012,500
24,60013,30020,60010,80027,500
Subbasin slope (Y)
(percent)
1.401.101.80.82.98
.961.001.802.401.70
1.301.20.81
1.30.98
3.101.201.001.301.10
1.20.86
2.803.602.68
.811.60.75
1.701.80
1.101.20.87
1.30.84
Lag time (L)
(hours)
4.603.772.365.582.01
2.875.752.592.293.21
4.661.923.881.892.69
1.464.282.341.932.35
2.223.291.39.97
1.53
2.742.934.641.061.46
3.211.883.481.533.82
38

Table 1. Subbasin variables for the Willow Creek basin Continued
Sub- basin No.
02210222022302240230
02310232024002410242
02430250026002700280
02810282029002910292
02930310031103120313
03200321032203230324
03250326032703300331
Drainage area (A)
(square miles)
3.00.40
1.604.704.45
.462.667.765.683.07
6.6710.77.157.159.17
1.712.314.081.412.21
2.213.801.306.401.40
14.1.60
2.401.903.10
2.4011.82.8011.57.70
Curve No. (CN)
8686868585
8585858585
8585858585
8384858685
8685868686
8586868686
8585858585
Hydraulic length (h)
(feet)
20,8008,00013,30025,00031,600
6,00016,40034,10039,80022,600
20,30040,60037,50033,40040,600
12,70015,00028,60013,70021,700
19,40016,60011,40023,60018,000
46,3008,30014,80019,00019,800
11,60048,00020,70048,10024,600
Subbasin slope (Y)
(percent)
1.302.101.60.60.60
1.001.40.47.75
1.00
1.20.59.69.81.64
1.492.40.77
1.501.10
1.30.66
1.70.85
1.10
.541.601.10.79
1.00
1.30.38.82.50.81
Lag time (L)
(hours)
2.59.94
1.634.575.51
1.132.136.625.933.26
2.736.795.694.956.52
1.491.574.491.723.01
2.453.141.403.542.50
7.881.122.143.082.83
1.689.673.368.453.88
39

Table 1. Subbasin variables for the Willow Creek basin Continued
Sub- basin No.
03320333033403350340
03410350035103520360
08100811081208130820
08210822082308240825
08300831083208330834
08350836083708380840
Drainage area (A)
(square miles)
3.501.606.408.809.30
10.010.83.402.404.30
12.67.422.575.93
17.0
4.887.792.675.882.13
27.37.023.116.109.49
1.431.102.062.0418.8
Curve No. (CN)
8685858584
8685858584
8686868686
8686868586
8586858585
8687868785
Hydraulic length (h)
(feet)
20,40018,30023,80035,30027,200
37,00031,00025,00018,30023,500
62,50029,50016,60021,50051,000
19,60036,20018,00027,20015,000
61,60028,30019,80026,00039,800
13,10013,40016,40015,40082,000
Subbasin slope (Y)
(percent)
1.20.71.71.68.96
.70
.81
.56
.871.00
.42
.882.402.30.51
1.10.77
1.201.801.70
.23
.641.10.77.50
1.701.101.601.80.34
Lag titne (L)
(hours)
2.653.274.045.654.00
5.584.674.732.963.49
7.174.161.592.00
12.1
2.685.232.402.821.74
15.74.712.804.167.26
1.561.911.931.86
15.7
40

TABLE 2, HYDROLOGIC ENGINEERING CENTER-1 INPUT FOR WILLOW CREEK STUDY
we.
123456789
10111213
1415161718192021
2223242526
27282930
3132
3334353637383940
414243444546474849
5051
525354
IDIT10JDPHJDJDJDJD
KKBALSUD
KKRSSVSVSESESQSQ
KKRSRCRXRY
KKBALSUD
KKHC
KKRSSVSVSESESLSS
KKRSRCRXRYKKBALSUD
KKHC
KKRSSV
*** WILLOW CREEK WATERSHED ** ***** ** ALL RESERV IN PLACE15 0 0 3004
4,5 1,01, 0 ,62 1,21 2,13 2.35 2.55 3,
3,04 50,2,85 100,2,45 300,2,25 500,
0141 SUB-BASIN 01412,1
0 85,2,01
0141TIN ROOF RESERVOIR1 ELEV 100,0 9.86 19.88 30.06 40,41 50,93 61,61 72,47
106,08 117,64 129,38 141,30100, 101, 102, 103, 104. 105, 106, 107.110. Ill, 112, 113,11,2 12,0 12,8 13,5 14,2 14.9 15.5 16.1
499,9 1427,5 2810,1 3000,
0141ROUTE TO ONE FORK2 FLOW -1
,06 ,04 ,06 13295 ,00750 100 200 210 234 268 368 468
9,7 7,7 5,7 0 0,9 5,5 7,5 9,5
0142SUB-BASIN 01422,8
0 85.2.87
0142COMBINE 0141 AND 01422
01420NE FORK RESERVOIR1 ELEV 100.0 33.60 67.51 101.71 136.21 171,01 206,12 223,78
277,25 295,23 313,28 324,16100,0 101,0 102,0 103*0 104,0 105.0 106,0 106,5108,0 108,5 109,0 109,3100,8 7.07 .5 .5106,5 38, 2,8 1,5
0142ROUTE TO HARD PAN2 FLOW -1
,06 ,04 ,06 15100 ,00750 100 200 210 234 268 368 468
9,7 7,7 5,7 0 0,9 5,5 7,5 9,50143SUB-BASIN 014310,5
0 85,5,75
0143COMBINE 0143 AND 01422
0143HARD PAN RESERVOIR1 ELEV 100,0 58,82 147.78 207,58 267,77 328,37 389,36 450,76
3,7 4,5
83,49 94,70
108, 109,
16,9 107,3
241,53 259,35
107,0 107,5
512.57 574.78
41

INPUT FOR WILLOW CREEK STUDY (CQNT,)
4.111
5556575859
6061626364
65666768
6970717273747576
7778798081
82838485
86878889909192939495
96979899
100
101102103104
105106
107108
SVSESESQSQ
KKRSRCRXRY
KKBALSUD
KKRSSVSVSESESQSQ
KKRSRCRXRY
KKBALSUD
KKHCKKRSSVSVSESESQSQ
KKRSRCRXRY
KKBALSUD
KKHC
KKRS
700,4397.5 98,5 100,0 101,0109,0000 27,2
2095,7
0143ROUTE TO MUDPOT2 FLOW -1
,06 ,04 ,06 210040 100 200 232
12,2 10,2 8,2 1.1
0110SUB-BASIN 011011,1
0 81,4,60
OIIOSHEEPSHED RESERVOIR1 ELEV 92,0 72,45 129.72 138,68
301,90 326,23 350,83 375,6985,6 89.0 91,6 92.099.0 100,0 101,0 102.0000 4,0
17,7 18,2 32,9 35.9
0110ROUTE TO HALFPINT2 FLOW -1
,06 .04 ,06 176370 100 200 210
9,7 7,7 5.7 0
0120SUB-BASIN 01204,8
0 86,3.77
0120COMBINE 0120 ABD 01102
0120HALFPINT RESERVOIR8 EL.EV 100,0 28,60 77,06 126,54
334,94 362,20 389,74 417,5592,8 94,0 96,0 98,0106,0 107,0 108,0 109.00000
60,6 61,7 62,9 64,0
0120ROUTE TO CAMP2 FLOW -1
,06 ,04 ,06 97680 100 200 210
9,7 7,7 5,7 ,0
0130SUB-BASIN 01303,8
0 83,2,36
0130COMBINE 0130 AND 01202
0130CAMP RESERVOIR1 ELEV 100,
102,0
35,7
,0060273,0
161,25400,82
93,0103,014,137, b
,00752340.9
177,05445,64100,0110,0
065,0
,00752340,9
103,0
36,8
3254,3
184,06426,21
94,0104,014,839.5
2685,5
202,70474,02101,0111,032,466,1
2685,5
104,0
37,9
4257,3
207,12504,01
95,0107,015.4
179.2
3687,5
228,61520,01102,0112.055,867,1
3687,5
105.0
38,9
52510,3
230.43557,25
96.0109.016.0
1311.9
4689.5
254.79560,85103,0114,057,0
380,3
4689,5
106,0 107,0
39,9 128,8
254,00 277,82
97,0 98.0
16,6 17,2
281,24 307,95590,00104,0 105,0115,058.2 59.4887,4
42

TABLE 2,
109110111112113114
115116117118119
120121122123
124125126127128129130131132133134135136
137138139140
141142
143144145146147148149150
151152153154155
156157158159160
161162163
SVSVSESESQSQ
KKRSRCRXRY
KKBALSun
KKRSSVSVSESESLSSKKRSRCRXRY
KKBALSUD
KKHC
KKRSSVSVSESESQSQ
KKRSSVSESQ
KKRSSVSESQ
KKRSSV
0571.20
95 , 5107,0
0179,0
HYDROLOGIC ENGINEERING CENTER-1 INPUT FOR WILLOW
95.92 193.25623.16 675.50
97.5 99.5108.0 109.0
0 0182.0 223.0
217.81728.22100,0110.0
0799.1
267,20 316,95 367,06781,32101,0 102,0 103,0111,032,4 84,7 143,0
2109,5
CREEK STUDY (CONT.)
, , , , , ,8, , . . , , ,9, , , , , ,10
417,54 468,39 519,61
104,0 105,0 106,0
168,0 171,0 175,0
0130ROUTE TO MUDPOT2
,060
12,2
FLOW -1.04 .06100 200
10.2 8.2
230272321,1
,0060273 325 425
0 4,3 7,3525.10.3
0146SUB-BASIN 01464,4
03,21
01461
,075,099,0118.101,116,0146
2,06.0
9,7
01454,3
02 , 29
01452
01451
,0985,686,5106,0
,0,0
WSAA011
,00,0,
WSAA021
.00,0,
WSAA031
.0
78.
UPPER SOUTH FORKELEV 100.3.2 9,787.0100.0 102.120.7.1 .569. 2.8
ROUTE TO DESERTFLOW -1.04 .06
100, 200.7.7 5,7
SUB-BASIN 0145
80.
COMBINE 0146 AND
DESERT RESERVIORELEV 87.594.7 190.9
1094,7 1205,588.5 90.5108. 110.
.0 ,0
.0 .0
PRIVATE NO. 1ELEV 0,05,97 12.07
1. 2,0, 142,
PRIVATE NO, 1ELEV 0,05,97 12*07
1. 2,0. 142,
PRIVATE NO, 1ELEV 0,05,97 12.07
RESERVOIR
16,7
104,
,51,5
12500210,
,0
0145
288,41267,192,5111,1
.0
.0
18,293,
614,
18,293,
614,
18,29
24,1 29,9 38,0
106, 108, 110,
, 0075234, 268, 368,
,9 5,5 7,5
387,5 487,9 589*91374,6 1489,3 1605,694*5 96,5 98,5113, 115. 117.
.0 ,0 .0119. 336. 617.
24.64 31.134. 5.
1869. 3626.
24.64 31,134, 5,
1869, 3626,
24,64 31,13
46,5 55,5 65,0
112, 114, 116,
468,9*5
667,3 771,9 878,01723,6 1789,2100,0 102, 104,119, 120,1
,0 ,0 ,0950, 1135,0
43

TABLE 2.-"-
164165
166167168169170
171172173174175176177178179180
181182183184185
186187188189190
191192193194195
196197198199200
201202203204205
206207208209210
211212213214215
216217
SESQ
KKRSSVSESQ
KKRSSVSESQKKRSSVSESQ
KKRSSVSESQ
KKRSSVSESQ
KKRSSVSESQ
KKRSSVSESQ
KKRSSVSESQ
KKRSSVSESQ
KKRSSVSESQ
KKRS
0.0.
USAA041
.00.0,
USAA051
.00.0.
USAA061
.00.0,
USAA071
.00.0.
USAA081
.00,0,
USAA091
,00.0,
WSAA101
.00.0.
USAA111
.00.0.
USAA121
.00.0.
USAA131
.00,0,
USAA141
HYDROLOGIC ENGINEERING CENTER-1 INPUT F(
1.0.
PRIVATEELEV5.97
1.0.
PRIVATEELEV5.97
1»0.
PRIVATEELEV5.97
1.0.
PRIVATEELEV5.97
1.0.
PRIVATEELEV5.97
1.0.
PRIVATEELEV5.97
1.0.
PRIVATEELEV5.97
1»0.
PRIVATEELEV5.97
1.0.
PRIVATEELEV5.97
1.0.
PRIVATEELEV5.97
1.0.
PRIVATEELEV
2.142.
NO. 10.0
12.072.
142.
NO. 10.0
12.072.
142.NO. 1
0.012.07
2.142.
NO. 10.0
12.072.
142.
NO. 10.0
12.072.
142.
NO. 10.0
12.072.
142.
NO. 10.0
12.072.
142.
NO. 10.0
12.072.
142.
NO. 10.0
12.072.
142.
NO. 10.0
12.072.
142.
NO. 10.0
3.614.
18.293.
614.
18.293.
614.
18.293.
614.
18.293.
614.
18.293.
614.
18.293.
614.
18.293.
614.
18.293.
614.
18.293.
614.
18.293.
614.
4.1869.
24.644.
1869.
24.644.
1869.
24.644.
1869.
24.644.
1869.
24.644.
1869.
24.644.
1869.
24.644.
1869.
24.644.
1869.
24.644.
1869.
24.644.
1869.
5.3626.
31.135.
3626.
31.135.
3626.
31.135.
3626.
31.135.
3626.
31.135.
3626.
31.135.
3626.
31.135.
3626.
31.135.
3626.
31.135.
3626.
31.135.
3626.
44

TABLE 2. HYDROLOGIC ENGINEERING CENTER-1 INPUT FOR WILLOW CREEK STUDY (CONT.)
10. j. ni_
218219220221222223224
225226
227228229230231
232233234235236
237238239240241
242243244245246
247248249250251
252253254255256
257258259260261262263264265266
267268269270271
svSESQKKBALSun
KKHC
KKRSRCRXRY
KKRSSVSESQ
KKRSSVSESQ
KKRSSVSESQ
KKRSSVSESQ
KKRSSVSESQ
KKRSSVSESQKKRSSVSESQ
KKRSSVSESQ
.00.0.
5.971.0.
0144SUB-BASIN4.0
2.59
01442
01442
.06.0
12.2
WSAA011
.00.0.
WSAA021
.00.0.
WSAA031
.00.0.
WSAA041
.00.0.
WSAA051
.00.0.
WSAA061
.00.0.
WSAA071
.00.0.
WSAA081
.00.0.
81.
COMBINE
ROUTE TOFLOW.04
100.10.2
PRIVATEELEV4.91
1.0.
PRIVATEELEV4.91
1.0.
PRIVATEELEV4.91
1.0.
PRIVATEELEV4.91
1.0.
PRIVATEELEV4.91
1.0.
PRIVATEELEV4.91
1.0.
PRIVATEELEV4.91
1.0.
PRIVATEELEV4.91
1 .0.
12.072.
142.0144
0145 AND
MUDPOT - 1.06
200.8.2
NO. 20.0
9.942.
142.
NO. 20.0
9.942.
142.
NO. 20.0
9.942.
142.
NO. 20.0
9.942.
142.
NO. 20.0
9.942.
142.
NO. 20.0
9.942.
142.NO. 2
0.09.94
2.142.
NO. 20.0
9.942.
142.
18.293.
614.
0144
18139.232 .1.1
15.093.
614.
15.093.
614.
15.093.
614.
15.093.
614.
15.093.
614.
15.093.
614.
15,093.
614.
15.093.
614.
24.644.
1869.
.0060273.
.0
20.354.
1869.
20.354.
1869.
20.354.
1869.
20.354.
1869.
20.354.
1869.
20.354.
1869.
20.354.
1869.
20.354.
1869.
31.135.
3626.
325. 425. 525.4.3 7.3 10.3
25.735.
3626.
25.735.
3626.
25.735.
3626.
25 . 735.
3626.
25.735.
3626.
25.735.
3626.
25.735.
3626.
25.735.
3626,
45

TABLE HYUROLOGIC ENGINEERING CENTER-1 INPUT FOR WILLOW CREEK STUDY (CONT,)
. Altt.
272273274275276
277278279280281
282283284285286
287288289290291
292293294295296
297298299300301
302303304305306307308309310311
312313314315316
317318319320321
322323324325326
KKRSSVSESQ
KKRSSVSESQ
KKRSSVSESQ
KKRSSVSESQ
KKRSSVSESQ
KKRSSVSESQ
KKRSSVSESQKKRSSVSESQ
KKRSSVSESQ
KKRSSVSESQ
KKRSSVSESQ
WSAA091
.00.0,
WSAA101
.00.0.
WSAA111
.00.0.
WSAA121
.00.0.
WSAA131
.00.0.
WSAA141
.00.0.
WSAA151
,00.0.
WSAA011
.00.0.
WSAA021
.00.0.
WSAA031
,00.0.
USAA041
.00.0.
PRIVATEELEV4.91
1.0.
PRIVATEELEV4,91
1,0,
PRIVATEELEV4.91
1,0.
PRIVATEELEV4.91
1,0.
PRIVATEELEV4,91
1,0,
PRIVATEELEV4,91
1,0,
PRIVATEELEV4,91
1,0,
PRIVATEELEV4,30
1,0,
PRIVATEELEV4,30
1,0,
PRIVATEELEV4,30
1,0,
PRIVATEELEV4,30
1,0,
NO, 20,0
9,942,
142,
NO, 20,0
9,942,
142,
NO, 20,0
9.942,
142.
NO, 20,0
9,942.
142.
NO. 20.0
9.942.
142.
NO. 20.0
9.942.
142.
NO. 20.0
9.942.
142.NO. 3
0.08.71
2.142.
NO. 30.0
8.712.
142.
NO. 30,0
8.712.
142.
NO, 30,0
8,712,
142,
15,093,
614,
15,093,
614.
15,093,
614,
15,093,
614,
15,093,
614,
15,093,
614,
15,093.
614,
13,233,
614,
13,233,
614,
13.233.
614,
13,233,
614,
20,354,
1869.
20.354.
1869.
20.354.
1869.
20.354,
1869.
20.354.
1869.
20.354,
1869.
20.354,
1869.
17,864,
1869,
17,864,
1869.
17.864.
1869.
17.864.
1869.
25.735.
3626.
25.735.
3626.
25.735.
3626,
25.735,
3626.
25.735.
3626.
25.735.
3626.
25.735.
3626.
22,615,
3626,
22,615,
3626.
22.615.
3626.
22.615,
3626.
46

. J. WK.
327328329330331
332333334335336
337338339340341
342343344345
346347348349350351352353354355
356357358359360
361362363364
365366367368369
370371372373374
375376377378
KKRSSVSESQ
KKRSSVSESQ
KKRSSVSESQ
KKBALSUD
KKHCKKRSSVSVSESESQSQ
KKRSRCRXRY
KKBALSUD
KKRSSVSESQ
KKRSRCRXRY
KKBALSUD
USAA051
,00,0,
WSAA061
.00,0,
WSAA071
.00.0.
014020,9
05.58
01404
01401
.02060*3
99,0109,
,0166.
01402
.06.0
12.2
01513.0
1*92
01511
,097.2
,0
01512
.06.0
9.7
01524,3
03,88
PRIVATE NO, 3ELEV 0,04.30 8.71
1. 2,0, 142,
PRIVATE NO, 3ELEV 0.04.30 8.71
1. 2.0. 142.
PRIVATE NO. 3ELEV 0,04,30 8.71
1, 2.0, 142.
SUB-BASIN 0140
85,
COMBINE 0140 AND
MUDPOT RESERVOIRELEV 100,
202,7 406.22270.4 2481.3
100, 101,110, 111.
.0 41,8174, 181,
ROUTE TO FORESTFLOW ~1.04 ,06
100. 200,10.2 8.2
SUB-BASIN 0151
86.
13,233<
614,
13.233.
614,
13.233.
614.
0143 AND
610.42692.8
102.112,100.
. 349.
22544.232 »1.1
17,86 22.614, 5.
1869, 3626,
17,86 22,614 , 5 ,
1869. 3626.
17,86 22,614, 5.
1869, 3626,
0130 AND 0144
815,2 1021.0 1227,4 1434.5 1642,4 1851,02905.2 3118.3
103. 104. 105. 106. 107. 108,113, 114,112, 123, 133. 142. 151. 159.
1135. 2411.
,0060273, 325, 425, 525,
,0 4,3 7,3 10,3
GRAVEL HILL RESERVOIRELEV 100.31,2 67.698.5 100.0
.0 .0
ROUTE TO CORRAL.FLOW -1.04 .06
100, 200,7.7 5.7
SUB-BASIN 0152
85,
92.3101.19.6
JUNCTION
10045.210.0,0
117.1 167.7 194.4 2.19.3102. 104, 105. 106,20.1 39.4 118,3 260,8
NO 1
,0075234, 268. 368. 468.0.9 5.5 7.5 9,5
379 KK 0153 SUB-BASIN 0153
47

LINE
380381382
383384385386387388389390
391392393394395
396397398399400
401402403404
405406
407408409410411
412413414415
416417418419420421
422423424425426
427428429430431432
TABLE 2.--
BALSUD
KKRSSVSESLSSKKHC
KKRSSVSESQ
KKRSRCRXRY
KKBALSUD
KKHC
KKRSSVSESQ
KKBALSUD
KKRSSVSESLSS
KKRSRCRXRY
KKBALSUDKKHC
1,30
1 . 89
01531
.099.0101.
103,70152
3
01521
,099,3
,0
01522
.06,0
9.7
01544,5,0
2,69
01542
01541
,0100.
,0
01552,5
01.46
01551
.0100.
101,3107,5
01552
,06,0
9,7
01507.6
04.660150
4
HYDROLOBIC ENGINEERING CENTER-1 INPUT FOR WILLOW
..,,,». 2.. ,,,,,3,,,»...4.......5.......6. ...... 7. ,
86.
CORRAL JUNCTION EXT RESERVOIRELEV 100.3.2 9.7 16.7 24.1 38.0 46.5
100.0 102. 104. 106. 109. 111.53.14 .5 .545 . 2.8 1.5
COMBINE 0153 AND 0151 AND 0152
CORRAL JUNCTION NO 1 RESERVOIRELEV 100.47.4 76.2 104.9 133.9 163.2 192.8101,0 102.0 103. 104. 105. 106.32.4 34.2 35.2 36.2 41,6 232.9
ROUTE TO CORRAL JUNCTIONFLOW ~1,04 ,06 12690, .0075
100. 200. 210. 234. 268. 368.7,7 5.7 .0 .9 5.5 7.5
SUB-BASIN 0154
86,
COMBINE 0154 AND 0152
CORRAL JUNCTION RESERVOIRELEV 100,49.7 99.7 150.1 251.9 355.3 460.1101. 102, 103. 105. 107. 109,41,8 86,8 90.4 97,4 104. 135.9
SUB-BASIN 0155
80.0
HALF BARREL RESERVOIRELEV 100.17,6 35.4 53.4 71.6 90,0 108,7101. 102. 103, 104, 105, 106.4.91 .5 .548. 2.8 1.5
ROUTE TO FORESTFLOW -1.04 .06 19498. .0075
100, 200. 210. 234. 268. 368.7.7 5.7 .0 .9 5.5 7.5
SUB-BASIN 0150
84.0
COMBINE 0150 AND 0154 AND 0155 AND 0140
CREEK STUDY (CONT. )
.... .8, ..... ,9, .... .10
55.5 65.0 87.0113.5 115.5 119.8
222.6 283.1 313.0107. 109. 110.
854.1 3364.1 5159.9
468.9.5
513.1 566.4110. 111.
293.6 604.5
127,6 146,7 221,5107. 108. 111.8
468.9.5
48

,INE
433434435436437438
439440441442
443444445446447
448449
450451452453454
455456457458
459460461462463
464465466467468
469470471472473474475476477
478479480481
482483
484485
TABLE 2.--
KKRSSVSESLSS
KKBALSUD
KKRSSVSESQ
KKHC
KKRSRCRXRY
KKBALSUD
KKRSSVSESQ
KKRSRTRXRY
KKBALSUDKKRSSVSESQ
KKBALSUD
KKHC
KKF'^S
01501
.0100.
102.2117.4
01641.9
02.22
01641
.0100.
.0
01502
01502
.06.0
12.2
01613.1
02.34
01611
.083.5
.0
01612
.06.0
9.7
01622.0
01.930162
1.0
100.,0
01633.4
02 . 35
01633
01631
HYDROLOGIC ENGINEERING CENTER-1 INPUT FOR WILLOW CREEK STUDY (CONT.)
....... 2 ....... 3 ....... 4 ....... 5 ....... 6 ....... 7 ....... 8 ....... 9 ...... 10
FOREST RESERVOIRELEV 100.67.6 262.1 458.6 657.2 857,8 1060,5 1316,8 1472.1 1681,1103. 105, 107, 109, 111. 113. 115, 117. 119,15.2 .5 .5124, 2.8 1.5
SUB-BASIN 0164
86.0
SHORTCREEK RESERVOIRELEV 100.11.8 23.7 35.8 48,1 60,6101, 102, 103, 104, 105,19.8 21.9 23.8 318.9 1219.1
COMBINE 0150 AND 0164
ROUTE TO COLLINSFLOW ~1.04 ,06 19990, .0060
100. 200, 232. 273, 325, 425, 525,10,2 8.2 1,1 ,0 4.3 7.3 10.3
SUB-BASIN 0161
86.
SKULL RESERVOIRELEV 86.578.5 139.4 155.1 171.1 187,289,0 93. 94, 95. 96,
,0 ,0 85,4 313.0 656.
ROUTE TO THREE TREEFLOW -1.04 .06 14815. .0075
100. 200. 210. 234. 268. 368. 468.7.7 5.7 .0 .9 5.5 7.5 9.5
SUB-BASIN 0162
86,
YOUR NAME RESERVOIRELEV 100.
,0 23,9 68,0 90,4 113,1 136,0 169.0 218.2 259,2102. 108. 110. 111. 112. 113. 114. 116.5 118.225.2 66,7 75,6 79,7 83,6 120, 138,0 840, 1530,
SUB-BASIN 0163
86,0
COMBINE 0163 AND 0161 AND 0162
THREE TREE RESERVOIRELEV 100,
49

TABLE 2, HYDROLOGIC ENGINEERING CENTER-1 INPUT FOR WILLOW CREEK STUDY (CQNT.)
LINE ID.......1.......A-...,,,». 3....... 4. ...... ij«...«,,o,«. ..../,»..... 8»,»»»»»9»,»»»» 10
486487488
489490491492493
494495496497
498499
500501502503504
505506507508
509510511512513514515516517518519
520521522523
524525526527528
529530531532
533534
535536537538
SVSESO
KKRSRCRXRY
KKBALSUD
KKHC
KKRSSVSESQ
KKBALSUD
KKRS8VSESLSSKKRSRCRXRY
KKBALSUD
KKRSSVSESQ
KKBALSUD
KKHC
KKRSRCRX
,099 . 2
,0
01632
.06,0
9,7
01655.3
03.29
01652
01651
,0100.
.0
01664,3
01,39
016610
94,5100,8101.10166
2,06,0
6,5
01671,12
0,97
01671
,0100,
,0
01683,19
01,53
01683
01682
.06,0
15.0 33.9 72,4 111,8 152.1 193.4 244.0 261,0100,0 101,0 103. 105. 107. 109. 111. 112,
,0 41,8 70.1 79.5 87.9 95,6 127,2 338.4
ROUTE TO COTTONWOODFLOW -1,04 .06 12692, ,0075
100, 200, 210, 234, 268. 368. 468,7,7 5,7 ,0 ,9 5,5 7.5 9,5
SUB-BASIN 0165
85,0
COMBINE 0165 AND 0163
COTTONWOOD RESERVOIRELEV 100,13,6 104.8 197,4 291.3 386.8 532,6 581,9101, 103, 105, 107. 109. 112. 113,50.4 107. 119. 131. 141. 248.3 513.9
SUB-BASIN 0166
83,
TWO FORKS RESERVOIRELEV 100,64,7 144,6 158,1 174,5 199,2 226,9 254,8 283,197,0 100.0 100.5 101.1 102.0 103, 104, 105,2.95 .5 ,5115,0 2.8 1.5
ROUTE TO MOUTH OF 0168FLOW -1,04 .06 9653, ,0080
100, 200, 203. 209. 222. 322, 422,4.5 2,5 2,0 0,0 2,5 4,5 6,5
SUB-BASIN 0167
85,
CHICO RESERVOIRELEV 100.11,7 23,7 35,7 48.0 60.4 73,1 86,0 98,9 112,1
101,0 102, 103. 104. 105. 106, 107. 108, 109,15, 18,3 18,9 19,4 19,9 20.5 20,9 227, 854,7
SUB-BASIN 0168
85,
COMBINE 0168 AND 0167 AND 0166
ROUTE TO COLL INSFLOW -1,04 .06 15558, .0075
100, 200. 210. 234. 268. 368. 468,
50

.J.NE
539
540541542543
544545
546547548549550
551552553554555556557558559
560561562563564565
566567568569570
571572573574
575576
TABLE 2.--
I D » » - - - 1
RY
KKBALSUD
KKHC
KKRSSVSESQ
KKRSRCRXRYKKBALSUD
KKRSSVSESLS3
KKRSRCRXRY
KKBALSUD
KKHC
9*7
016010*71
04*28
01604
01601
.0100*
.0
0160o
,06,0
15,601717 « 56
02,93
01711
,0100,
101,5116,1
01712
,06,0
12,2
01704,15
02,74
01603
HYDROLOG'IC ENGINEERING CENTER-1 INPUT FOR WILLOW CREEK STUDY (CONT,)
»»»,,,» 2 »,,,,»» 3 .»»,».» 4 ,,,,»,» 5 ,,,,»,, 6 .------ ̂ ------- « ------- <? ------ 1 <">
7.7 5,7 0,0 0,9 5.5
SUB-BASIN 0160
85,
COMBINE 0160 AND 0165 AND 0150 AND 0168
COLL INS RESERVOIRELEV 100,125,3 251,2 377,6 760,4 1018,5101, 102, 103, 106, 108,58,4 183, 333. 466, 481,
ROUTE TO LONE TREE CREEKFLOW -1,04 ,06 15497, ,0034
100, 200. 230, 270, 320,13,6 11,6 1,3 ,0 1,2
SUB-BASIN 0171
84,0
BROWNING RESERVOIRELEV 100,,01 32,7 98,8 166,2 234,8
101, 102, 104, 106, 108,7,07 ,5 .5100, 2.8 1,5
ROUTE TO LONE TREE CREEKFLOW -1.04 .06 29154. .0060
100, 200, 232, 273. 325.10.2 8.2 1.1 .0 4,3
SUB-BASIN 0170
85.
COMBINE 0160 AND 0171
7.5 9.5
1278.9 1541.7 1674,0 1806,8110, 112. 113, 1.14,0495. 577.8 858. 1356,2
400, 600,11,2 15,2
375.6 484,5 558.7 630.3112. 115. 117. 118.9
425. 525.7.3 10.3
* ****************** END OF PAGE 1-* ****************** START OF PAGE
577 KK 0282 SUB-BASIN 0282578 BA 2.31579 LS 0 84,580 UD 1.57
581 KK 0282 FINNALE RESERVOIR582 RS 1 ELEV 94.0583 SV 7.3 35.7 55.4584 SE 87.0 90.0 92.0585 SQ ,0 ,0 ,0
586 KK 0281 SUB-BASIN 0281587 BA 1.71588 LS 0 83.589 UD 1,49
BUT 0200 BASIN NOT COMBINED.
75,894,0
.0
96,9 118,6 141,196,0 98,0 100.0417. 1931, 4400,
51

TABLE 2, HYDROLOGIC ENGINEERING CENTER-1 INPUT FOR WILLOW CREEK STUDY (CQNT.)
LINE
590591592593594595596
597598599600601
602603604605
606607
608609610611612
613614615616617
618619620621
622623624625626
627628629630631
632633634635636637
638639640641642
KKRSSVSESQKKHC
KKRSRCRXRY
KKBALSUD
KKHC
KKRSSVSESQ
KKRSRCRXRY
KKBALSUD
KKRSSVSESQ
KKRSRCRXRY
KKHCKKBALSUD
KKRSSVSESQ
KKRSSVSESQKKHC
KKRSRCRXRY
KKBALSUD
KKHC
KKRSSVSESQ
KKRSRCRXRY
KKBALSUD
KKRSSVSESQ
KKRSRCRXRY
KKHCKKBALSUD
KKRSSVSESQ
02811
11.092.4
.00281A
2
0281B2
.06.0
9.7
02809.17
06.52
0280A2
02801
.094.0
.0
0280B2
.06.0
9.7
02161.31
01.53
02161
,095.2
,0
0216A2
.06.0
6.5
0280C2
02911.41
01.72
02911
.096.9
.0
RUINS RESERVOIRELEV19.594.024.5
COMBINE
ROUTE TOFLOW.04
100.7.7
92.424.295.032.1
FINNALE
SUB-BASIN
85.
COMBINE
ULT-1.06
200.5.7
0280
0280 AND
28.96.
108.
900
AND RUINS
255392100.
3898
1930
,,,
300
48,7100,0
6370,0OUTFLOW
,0075234,
0 0
ROUTED FLOW
9
FROM
268, 368, 468.5.5 7.5 9.5
FINNALE/RUINS
ULT RESERVOIRELEV68.095.6
,0
ROUTE TOFLOW.04
100,7.7
SUB-BASIN
86.
WHITETAILELEV13.297.0
.0
ROUTE TOFLOW.04
100,4,5
COMBINE
95,685,196,038,4
TC "\
.06200.5.7
0216
,128.97.
425.
21100210
0200
17198
1578
,,
600
215.3 259.4 303.899.0 100.0 101.0
3310.0 5830.0 8950.0
.0075234,
0 9268, 368. 468.5.5 7.5 9.5
RESERVOIR100.20.898.0
.0
,36.100,
JUNCTION WITH 1
.06200.2.5
WITH SO
SUB-BASIN
86.0
0291
99282032,
0300
SO
5210256
,,
FORK
403
60.7 69.1 77.7 86.5 95,4103.0 104.0 105.0 106,0 107,057,8 59.1 60,6 215.0 701.0
LONE TREE
.0080209,
0 0222. 322. 422.2.5 4.5 6.5
FORK FLOW
SOB RESERVOIRELEV9.1
98.3.0
100.026.1100.0
,0
43,102,55,
707
6210458
,«,
004
80.8 100.4 110.4 120.6106.0 108.0 109.0 110.061.4 64.2 312.0 932.0
52

LINE
643644645646647
648649650651
652653
654655656657658
659660661662663
664665666667
668669670671672
673674675676677678679
680681682683
684685
686687688689
690691692693694
KKRSRCRXRY
KKBALSUD
KKHC
KKRSSVSESQ
KKRSRCRXRY
KKBALSUD
KKRS8VSESQ
KKRSRCRXRYKKHC
KKBALSUD
KKHC
KKBALSUD
KKRSSVSESQ
KKRSRCRXRY
KKBALSUD
KKHC
KKRSSVSESQ
KKRSRCRXRY
KKBALSUD
KKRS8VSESQ
KKRSRCRXRYKKHC
KKBALSUD
KKHC
KKBALSUD
KKRSSVSESQ
0291A 5
,06,0
6,5
02932,21
02,45
0291B2
02911
.097,2
,0
0291C2
.06,0
9,7
0292M2,21
03.01
02921
.098,5
,0
0292A2
,06,0
6,5029A
2
02904.08
04,49
0290A 3
0211,61
01,06
02111
.095.4
.0
ROUTE TO HORNYFLOW -1,04 .06
100, 200,4,5 2.5
SUB-BASIN 0293
86,0
COMBINE 0293 AND
HORNY RESERVOIRELEV 100.09,8 22,1
98,0 99.0,0 ,0
ROUTE TO JUNCTIONFLOW -1.04 .06
100. 200.7.7 5,7
SUB-BASIN 0292
85,
5223,0 ,008203,0 209. 222, 322, 422,
2.0 ,0 2.5 4.5 6,5
ROUTED FLOW FROM SOB
34.7 47.4 60.3 73,4 86,7 100.0100,0 101.0 102,0 103,0 104.0 105.0
.0 36.8 114.0 146.0 150.0 237.0
WITH FOULWEATHER OUTFLOW
22163. ,0075210, 234, 268. 368. 468.
.0 .9 5.5 7.5 9.5
107,0106,0444,0
FQULWEATHER RESERVOIRELEV 100,013,5 32,0
100,0 102,0.0 57,4
ROUTE TO JUNCTIONFLOW ~1,04 .06
100, 200,4.5 2,5
51.5 70.9 91.4 113.0 134.0 146.0104, 106,0 108,0 110,0 112.0 113.060.9 64,3 67.7 71.0 789.0 1600,0
WITH HORNY OUTFLOW
16695. .0080203, 209, 222, 322, 422,2.0 .0 2.5 4.5 6.5
COMBINE ROUTED FLOW FROM HORNY W ROUTED FLOW FROM FOUL WEATHER
SUB-BASIN 0290
85 , 0
COMBINE 0290 WITH
SUB-BASIN 0211
85,
CLOVER RESERVOIRELEV 100,07,5 12,4
97,0 98.0,0 ,0
COMBINED FLOW FROM HORNY AND FOULWEATHER
17.3 22,4 27.6 32.9 38.4 43.999,0 100.0 101.0 102.0 103,0 104,0
,0 ,0 24,5 45.2 47,0 169.0
49,6105,0600.0
53

TABLE 2, HYDROLOGIC ENGINEERING CENTER-1 INPUT FOR WILLOW CREEK STUDY (CONT.)
LINE ID ****,,*!,*,,,**>-.. ***,,*,3*,,*,,,4*t,,,*,5,*t,,,*6,*<>,,*t7,,,,*,*8....*t,9*,*,*,10
695696697698699
700701702703
704705
706707708709
710711712713714
715716717718719720721
722723724725726
727728729730731
732733734735
736737738739740
741742743744745
KKRSRCRXRY
KKBALSUD
KKHC
KKBALSUD
KKRSSVSESQ
KKRSRCRXRYKKHC
KKRS8VSESQ
KKRSRCRXRY
KKBALSUD
KKRSSVSESQ
KKRSRCRXRY
0211A2
.06*0
6,5
02134*83
03*21
0213A2
02121.11
01*46
02121
3*9100*
*0
0212A2
*06,0
6*50212B
2
02121
1*498*0
*0
0212C2
.06.0
6.5
02141.11
01.88
02141
5*596..0
0214A ?
.06.0
6.5
ROUTE TO HARDROCKFLOW -1.04 .06
100* 200.4*5 2,5
SUB-BASIN 0213
86*
COMBINE 0213 AND
SUB-BASIN 0212
86*
FAWN RESERVOIRELEV 100*06*4 9*1101. 102.41.8 121.
ROUTE TO HARDROCKFLOW -1,04 ,06
100. 200.4.5 2*5
17831 ,008203, 209, 222* 322,2,0 ,0 2,5 4,5
ROUTED FLOW FROM CLOVER
11*8 14*6 17*5 20*4103. 104. 105* 106*139, 182, 400, 900,
8856 ,0080203, 209* 222, 322*
2* ,0 2.5 4,5
422.6.5
23.5107,
1800*
422 ,6,5
COMBINE WITH ROUTED FLOW FROM CLOVER
HARDROCK RESERVOIRELEV 100.15,5 29*899*0 100.0
*0 .0
ROUTE TO TCFLOW -1*04 *06
100* 200,4.5 2.5
SUB-BASIN 0214
86.
BEND RESERVOIRELEV 100*28. 51.198. 100..0 ,0
ROUTE TO TCFLOW --1,04 ,06
100, 200,4,5 2.5
58,9 88,8 119,6 151.1102, 104,0 106,0 108,0152. 248.0 265.0 499,0
13818* *0080203* 209* 222* 322,2*0 *0 '2*5 4*5
75. 99.6 125, 138,102, 104, 106. 107,44,3 47.8 54, 346,
17714. ,0080203 * 209 , 222 . 322 ,2.0 ,0 2.5 4,5
422*6*5
422 ,6,5
746 KK 0214A COMBINE WITH ROUTED FLOW FROM HARDROCK
54

. INE
747
748 749
750 751 752 753
754 755
756 757758759760761762763
765766767768769
770771772773774
775776777778779
780781782783784
785786787788789
790791792793794
795796797798799
ID*
HC
KK HC
KK BA LS UD
KK HC
KK KMRSSVSVBESESQ
KKRSSVSESQ
KKRSSVSESQ
KKRSSVSESQ
KKRSSVSESQ
KKRSSVSESQ
KKRSSVSESQ
KKRSSVSESQ
1' > ...... ~\ .
2
TC COMBINE FLOW FROM 3 MA 3
0210 SUB-BASIN 0210 7*47
0 85 . 4.64
TC COMBINE 0210 WITH TRIB 2
TC TC RESERVOIR TC RESERVOIR WITH IRRIG
1,0
1957,1578 , 0587 « 5
.0
TCWS11
0.00.00.0
TCWS11
0.00,00.0
TCWS11
0.00.00.0
STOR16.9
2565.0578 . 5589.0
20.
.097.0
3115.0579.5590.0
67.
TC WATERSPREADERELEV55 . 31.00.0
0.0111.0
2.0142.0
TC WATERSPREADERELEV55.31.00,0
0,01 11.0
2.0142.0
TC WATERSPREADERELEV55 , 31,00.0
0,0111.0
2.0142.0
TCWS1TC WATERSPREADER1
0.00.00.0
TCWS11
0.00.00.0
TCWS11
0.00,00.0
TCWS11
0.00.00.0
ELEV55 . 31.00.0
0.0111.0
2.0142.0
TC WATERSPREADERELEV55 . 31 .00.0
0.01 11.0
2.0142.0
TC WATERSPREADERELEV55.31.00.0
0,0111,0
2,0142,0
TC WATERSPREADERELEV55 . 31.00.0
0,0111.0
2.0142.0
219,3565.580.591.112
1
167,3,
614,
1
167,3,
614,
1
167,3.
614.
1
167,3.
6 1 A ,
1
167.3.
614.
1
167.3.
614,
4 ur A ...... .7 ....... R ....... 9 ...... 1ft
JOR TRIES INTO TC RESERVOIR
INFLOW TO TC
PIPE AS PRINCIPAL SPILLWAY
7050*
000
000
000
000
000
000
I DIKE
167.3,
614.
000
367406558159212'
2234
1869
2234
1869
2234
1869
2234
1869
2234
1869
2234
1869
7
2234
1869
.5
.0
,5,08,
, 5,0,0
.5,0,0
, 5,0,0
,5.0,0
,5.0.0
,5,0,0
,5.0,0
540,4615,582 ,593.
1 35
280.5 .
3262.
280.5 ,
3262,
280,5 ,
3262.
280,5,
3262 .
280,5 ,
3262,
280,5 ,
3262 ,
280 ,5.
3262,
9 750,4 998,0 1280,6 1597.60 5215.0 5815.05 583.5 584.5 585.5 586.50 594.0 595.0
142. 149. 155. 161.
300
300
300
300
300
300
300
55

TABLE HYDRO-LOGIC ENGINEERING CENTER-1 INPUT FOR WILLOW CREEK STUDY (CONT
800301802803804305806807808809
8108 1 1812313814
815816317818319
820321822823824
825826827828
329830331832333
834835836837838
839840
341842843844345846347848849
850851852353854
KKRSSVSESQKKRSSVSESQ
KKRSSVSESQ
KKRSSVSESQ
KKRSSVSESQ
KKBALSUD
KKRSSVSESQ
KKRSRCRXRY
KKHC
KKBALSUDKKRSSVSESQ
KKRSRCRXRY
TCWSI1
0,00,00,0
TCWSI].
0,00,00,0
TCUS11
0,00,00.0
TCWSI1
0.00,00,0
TCWSI1
0,00,00,0
02415 , 68
05 , 93
02411
2 . 29100,
,0
0241A2
.06,0
9,7
TCWSI2
02423,07
03 , 260242
12 , 9
100,0.0
02.42A2
,06.0
6 . 5
TC WATERSPREADERELEV 0,055,3 111.01,0 2,00,0 142,0
TC WATERSPREADERELEV 0,055,3 111,01,0 2,00.0 142.0
TC WATERSPREADERELEV 0.055,3 111,01.0 2.00,0 142,0
TC WATERSPREADERELEV 0.055 ,3 111,01.0 2.00,0 142,0
TC WATERSPREADERELEV 0,055,3 111.01.0 2,00,0 142,0
SUB-BASIN 0241
85,
1 DIKE
167,03,0
614.01 DIKE
167.03.0
614,0
I DIKE
167.03.0
614,0
1 DIKE
167.03.0
614.0
8
223,4,
1869.9
223 ,4,
1869,
10
223 ,4,
1869,
11
223.4.
1869,
500
500
500
500
280,5,
3262.
230 ,b ,
3262.
280,5,
3262,
230,b ,
3262.
300
300
300
300
1 - DIKE 12
167,03,0
614,0
223 ,4,
1869,
500
280.5.
3262,
300
TWIN FORKS RESERVOIRELEV 100,43,6 95,3102. 104,43.4 53.2
144.1106,57.6
193.10861,
4»6
243,11065,
7 295,1 347.61 1 2 , 114,
4 225,1 1207,
ROUTE TO TC SPREADER IFLOW -1,04 ,06
100, 200.7,7 5.7
6088,210.0,0
COMBINE ROUTED FLOW FROM
SUB-BASIN 0242
85.
, 007234
5,9
TC WITH
2685.
368. 468.5 7.5 9.5
ROUTED FLOW FROM TWIN FORKS
DEAD HORSE RESERVOIRELEV 100,22,2 42.?102, 104.33,2 38,1
62,9106,42,5
34.10846.
3,4
95,10943.
2 117.6 129,1111. 112,
3 99,0 301,
ROUTE TO TC SPREADER 2FLOW -1,.04 ,06
100, 200,4,5 2,5
6132,203,2.0
, 0080209
,»0
2222 ,
322 , 422 ,5 4,5 6 » 5
10
56

TABLE 2. HYDROLOGIC ENGINEERING CENTER-1 INPUT FOR WILLOW CREEK STUDY (CONT,)
855 856
857 858 859 860
861 862
863 864 865 866
867868869870871
872873874875876
877878
879880881882883884885886887888
889890891892893
894895896897898
899900901902903
904905906
KK HC
KK BA LS UD
KK HC
KK BA LS UD
KKRSSVSESQ
KKRSRCRXRY
KKHC
KKRSSVSESQKKRSSVSESQ
KKRSSVSESQ
KKRSSVSESQ
KKRSSVSESQ
KKRSSV
TCWSI
0240 7.76
0 6.62
TCWSI 2
0243 6.67
0 2.73
02431
2.6 . 6100.0
0.0
0243A2
.06,0
6,5
TCWSI2
WSAA011
,00.0,
WSAA021
,00,0,
WSAA031
,00,0.
WSAA041
.00.0.
WSAA051
.00.0,
WSAA061
,0
COMBINE ROUTED FLOW FROM DEAD HORSE W
SUB-BASIN 0240
85,
COMBINE 0240 W TCWSI INFLOW
SUB-BASIN 0243
85,
DOUBLE CROSS DETENTION RESERVOIRELEV116.3102.064.2
100,207 ,104,7.1,
0302
299 , 7106,077,6
346.107.80.
506
393108187
,,
ROUTED FLOW FROM TC
6 441,0 488,8 537,0 586.00 109,0 110,0 111.0 112,00 746.0 1700.0 2937,0 4436,0
ROUTE TO TCWSIFLOW.04
100.4.5
COMBINE
DOUBLEELEV
53.401 .0.
DOUBLEELEV53.40
1.0.
DOUBLEELEV
53.401 .0.
DOUBLEELEV
53.401.0.
DOUBLE:ELEV
53.401.0.
DOUBLEELEV53.40
- 1,06
2002 ,
ROUTED
CROSS0.
107.2
142CROSS
0.107.
2142
CROSS0.
107.2
142
CROSS0.
107.2
142
CROSS0.
107.2
142
CROSS0,
107.
,5
1240,203 .2.0
FLOW FROM
02,,
02,
02,
02,
02,*
02
161.33.
614.
161,33,
614,
161,33.
6 1 4 .
161.33.
614.
161.33.
614.
161.3
.00802090.
,0
DOUBLE
215,4
1869
215.4
1869
215,4
1869
215.4
1869
215.4
1869
215.
8,
/ ) /.,o
CROSS
270
2
,5
i'?2 , 422 «5 4.5 6,5
W TCWSI. INFLOW
8,
3626.
8,
270 ,58,
3626,
8,.
8»,
8,
270
362
270
»56
,5
8,
8t
3626,
270 +
58,
3626,
8 270 * 8
57

LINE
907908
909910911912913
914915916917918
919920921922923
924925926927928929930931932933
934935936937938
939940941942
943944
945946947948949
950951952953
954955956957958959
TABLE 2, -
I £i ....... 1 .
SESO
KKRS8VSESQ
KKRS8VSESQ
KKRSSVSESQ
KKRS8VSESQKKRSSVSESQ
KKRSSVSESQ
KKBALSUD
KKHC
KKRSSVSESQ*
KKBALSUD
KKRSSVSESLSS
0.0*
WSAA071
,00.0,
W8AA081
,00.0,
W8AA091
,00.0.
W8AA101
,00,0.
WSAA111
,00*0,
USA A 121
.00*0*
025010.7
06.79
TCWS22
TCDRP1
23 . 0100.0
.0
HYDROLOGIC ENGINEERING CENTER-
> ...».»?....... 1 ,»,-- - A .......
1. 2.0. 142.
DOUBLE CROSSELEV 0 , 0
53.40 107.21 . 2 .0. 142.
DOUBLE CROSSELEV 0.0
53.40 107.21 , 2 .0. 142.
DOUBLE CROSSELEV 0.0
53.40 107.21. 2.0. 142.
DOUBLE CROSSELEV 0.0
53.40 107.21. 2.0. 142.
DOUBLE CROSSELEV 0.0
53.40 107.21. 2.0. 142.
DOUBLE CROSSELEV 0.0
53.40 107.21. 2.0. 142,
SUB-BASIN 0250
85.
COMBINE 0250 WITH
TC DROP RESERVOIRELEV 100,28,7 34.0101,0 102,058.4 183.0
3,614,
161.33.
614.
161.33.
614.
161.33.
614.
161,33.
614,
161,33,
614.
161.33,
614,
ROUTED
40.4103.0251.0
*********************** START PAGE
02213.0
02.59
02211
0.0100.0101.0111,5
SUB-BASIN 0221
86.
41869
215.4
1869
215.4
1869
215.4
1869
215.4
1869
215,4
1869
215,4
1869
FLOW
46,104,462,5
1 INPUT FOR WILLOW CREEK STUDY (CONT,)
"='. yt "7 Q O 1 A
, 5 ,3626 ,
8 270 , 85,
3626 ,
8 270 , 8, 5 .
3626.
8 270.8. 5 .
3626.
8 270.85.
3626,
8 270.85.
3626.
8 270.8. 5 .
3626.
FROM TCWSI
400
UPPER LONE TREE RESERVOIRELEV 100,8,67 17,5101.0 102.03.14 .548.0 2.8
26,5103.0
.51.5
44.105.
9 63.9 83.7 104.0 114,5 140,20 107.0 109.0 111,0 112,0 114.0

TABLE 2.-- HYDROLOGIC ENGINEERING CENTER-1 INPUT FOR WILLOW CREEK STUDY <CONT*>
10L. O.m:_
960961962963964
965966967968
969970971972
973974975976977
978979980981
982983
984985
986987988989990991
992993
994995996997
998999
100010011002
10031004
100510061007100810091010
KKRSSVSESQ
KKDTDIDQ* *KKBALSUD
KKRSSVSESQ
KKBALSUD
KKDR
KKHC
KKRSSVSESLSS
KKHC
KKBALSUD
KKRSSVSESQ
KKHC
KKBALSUDKKHC
0225 COWBELL RESERVOIR1 ELEV 100,
0,0 2,9 6,1 9,6 13.3 17,3 19,5100,0 102,0 104.0 106.0 108.0 1.10.0 111.00.0 12,6 28.9 39.3 69.9 854. 1632,
0225 DIVERT SPILLWAY PLOWS INTO SW BURNETTDIVERT
28,9 39,3 69,9 854, 1632,7,1 11,1 36.6 816. 1592.
0222 SUB-BASIN 02220.4
0 86,0,94
0222 BUGLE RESERVOIR1 ELEV 100,
0, 1,8 7.2 12,9 19,0 25,5 32,4 3799,3 100.0 102.0 104,0 106,0 108,0 110,0 1110,0 0,0 25.2 66,6 96.1 118,0 327,0 605
0223 SUB-BASIN 02231,60
0 86,1,63
0225 RETRIEVE FLOW DIVERTED FROM COWBELL-DIVERT
0223 COMBINE 0222 AND 0223 AND DIVERT FLOW3
0223 SW BURNETT RESERVOIR1 ELEV 100,
0, 26,0 52,8 80,3 108,6 148,1100, 102, 104, 106, 108. 110,7
101,5 7.07 .5 .5108,9 45, 2,8 1,5
0223 COMBINE 0223 AND 0225 (NON-SPILL FLOW FROM COWBELL)2
0224SUB--BASIN 02244,70
0 85 ,4,57
0224 NW BURNETT RESERVOIR1 ELEV 100.
3.65 77.3 152.1 228.2 305.6 344.8100. 102.0 104,0 106.0 108.0 109,00.0 50,4 87.3 113.0 767.0 1307,0
0224 COMBINE 0224 AND 02232
0220 SUB-BASIN 02206,60
0 84 ,3.820220 COMBINE 0220 AND 0224
2
.8
.5,0

TABLE 2* HYDROLOGIC ENGINEERING CENTER-1 INPUT FOR WILLOW CREEK STUDY <CONT*>
1 0
10111012101310141015
10161017101810191020
10211022102310241025
10261027102810291030
10311032103310341035
10361037103810391040
10411042104310441045
10461047104810491050105110521 05310541 055
10561 057105810591060
1061106210631064
KKRSSVSESQ
KKRSSVSESQ
KKRSSVSESQ
KKRSSVSESQ
KKRSSVSESQ
KKRSSVSESQ
KKRSSVSESQ
KKRSSVSESQKKRSSVSESQ
KKRSSVSESQ
KKRSSVSE
WSAA011
,00,0.
WSAA021
,00,0,
WSAA031
,00,0,
WSAA041
,00,0,
WSAA051
.00,0,
WSAA061
.00.0.
WSAA071
.00.0.
WSAAOS1
.00.0.
WSAA091
.00.0.
WSAA101
.00.0.
WSAA111
.00.
BURNETTELEV
59.481.0.
BURNETTELEV59.48
1,0.
BURNETTELEV
59.481 .0.
BURNETTELEV59.48
1.0.
BURNETTELEV
59.481 .0.
BURNETTELEV59.48
1.0.
BURNETTELEV
59.481.0.
BURNETTELEV59.48
1 .0.
BURNETTELEV
59.481.0,
BURNETTELEV59,48
1,0,
BURNETTEl v..v
59,481,
0.0119.36
2.142,
0,0119.36
2.142.
0.0119.36
2 .142.
0.0119.36
2.142.
0,0119,36
2 ,142,
0,0119,36
2 ,142.
0.0119.36
2 .142.
0,0119.36
2,142,
0,0119,36
2,142,
0,0119,36
2.142,
0,0119.36
2 .
179.643.
614.
179.643.
614.
179.643.
614,
179.643.
614.
179.643,
614,
179,643,
614,
179.643.
614,
179,643,
614,
179.643.
614.
179.643.
614.
179.643,
240,314,
1869,
240.314.
1869.
240,314,
1869,
240,314,
1869,
240,314.
1869,
240.314,
1869.
240.314.
1869.
240,314,
1869.
240,314,
1869.
240,314.
1869.
240.314.
301.385.
362.6.
301,385,
3626 ,
301,385,
3626,
301.385 .
3626,
301,38b .
3626.
301,385.
3626.
301,38b ,
3626,
301,385 ,
3626,
301,38b ,
3626,
301,38e;
3626 ,
301,385 ,
60
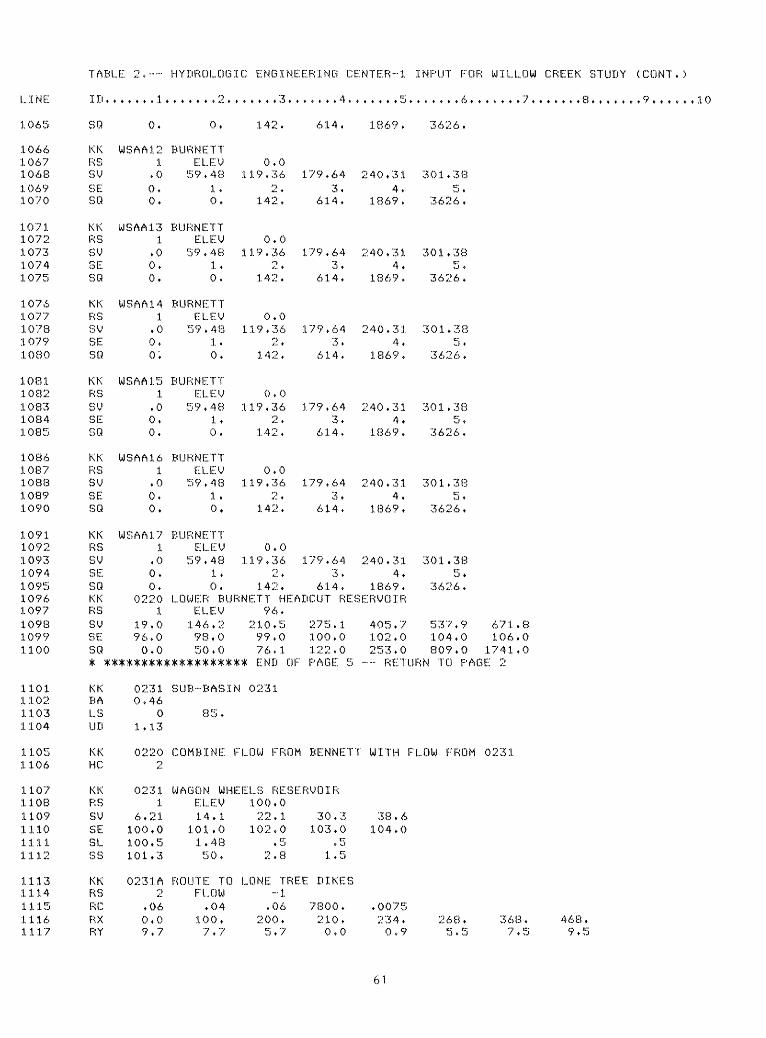
TABLE 2* HYDROLOGIC ENGINEERING CENTER-1 INPUT EGR WILLOW CREEK STUDY (CGNT.)
LINE
1065
10661067106810691070
107110721 07310741 075
10761077107810791080
10811082108310841085
10861087108810891090
1091109210931094109510961097109810991100
1101110211031104
11051106
110711081109111011111112
11131114111511161 1 1 7
ID
SO
KKRSSVSESQ
KKRSSVSESQ
KKRS8VSESQ
KKRSS'v1
SESQ
KKRSSVSESQ
KKRSSVSESQKKRSSVSESQ*
KKBAL.SUD
KKHC
KKRSSVSESLSS
KKRSRCRXRY
.,.,,,, 1 ,
0.
WSAA121
,00.0.
UISAA131
,00*0.
USAA141
.00,o;
WSAA151
.00,0,
USAA161
,00.0.
WSAA171
,00*0*
02201
19,096*00,0
' )
0,
BURNETTEL..EV59.48
1 ,0.
BURNETTELEV
59,481 ,0,
BURNETTELEV59,48
1 ,0,
BURNETTELEV
59,481 ,0,
BURNETTELEV59,48
1,0,
BURNETTELEV
59,481 ,0,
..... 3 * *
142,
0,0119,36
''*
142,
0.0119,36
' y
142,
0,0119,36
2 t
142.
0 . 0119,36
o t
142,
0,0119,36
'!>
142,
0,0119,36
2 ,142,
..... 4 ..
614.
179,643,
614,
179,643,
614,
179,643.
614,
179,643,
6 1 4 ,
179,643,
614,
179,643.
614,LOWER BURNETT HEADCUT RES
ELEV146,298,050,0
96,210,599,076.1
******************* END OF
02310,46
01,13
0220'.>
02311
6 , 2 1100,0100,5101*3
0231 A2
,060 . 09,7
SUB-BASIN
85,
COMBINE F
0231
LOW FROM
275.1100,0122,0PAGE 5
BENNETT
1869,
240.314,
1869,
240,314,
1869,
240.314.
1869,
240,314.
1869.
240.314,
1869,
240,314,
1869,ERVOIR
405.7102,0253,0
....... 6 ,,,,.,. 7 .,,,.,, 8 ,,,,,,, 9 ,,,,,,
3626.
301,385 ,
3626 ,
301,385*
3626,
301,385 ,
3626,
301 ,385 ,
3626,
301,385 ,
3626,
301,385 ,
3626,
537.9 671,8104,0 106.0809,0 1741,0
- RETURN TO PAGE 2
WITH FLOW FROM 0231
WAGON WHEELS RESERVOIRELEV14, 1
101,01 . 4850,
ROUTE TOFLOW,04
100,7 , 7
100,022 , 1102,0
, b2,8
30 , 3103,0
,51,5
38 , 6104.0
LONE TREE DIKES... !
,06200,5,7
7800 ,210,0,0
, 0075234,0,9
268. 368, 468.5.5 7.5 9,5
10
61
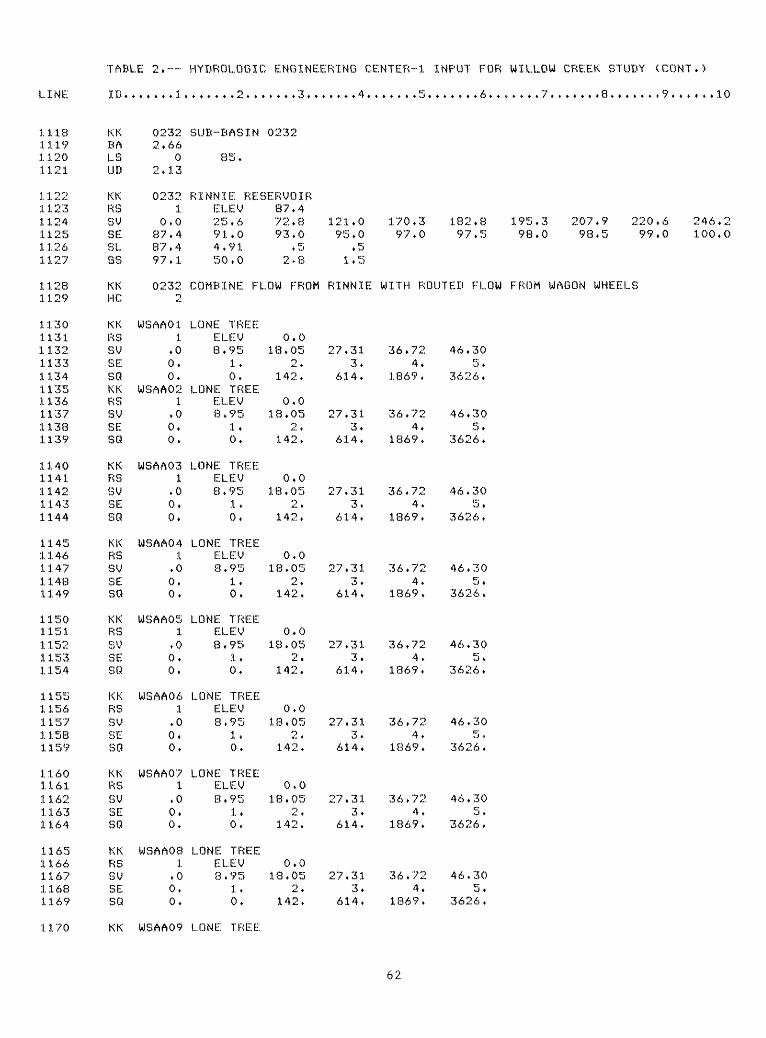
TABLE 2*-- HYDROLOGIC ENGINEERING CENTER-1 INPUT FOR WILLOW CREEK STUDY (CONT.)
i_ 4. IXK:.
1118 1119 1.1.20 1121
1 12211231124112511261127
11281129
11301 1 3 111321133113411351136113711381139
11401141114211431144
11451146114711431149
1150115.1.115211531154
11551:1.56115711581159
11601161116211631164
11651166116711681169
KK BA LS UD
KKRS8VSESLSS
KKHC
KKRSSVSESOKKRSSVSESQ
KKRSSVSESQ
KKRSSVSESQ
KKRSSVSESQ
KKRSSVSESQ
KKRSSVSESQ
KKRSSVSESQ
0232 2.66
0 2.13
02321
0.087.487 . 497 . 1
0232p
WSAA011
.00.0.
WSAA021
.00.0.
WSAA031
.00.0.
WSAA041
.00.0.
WSAA051
.00.0.
WSAA061
.00.0.
WSAA071
.00.0*
WSAA081
.00.0.
SUB-BASIN 0232
85*
RINNIE RESERVOIRELEV25 . 691*04 * 9 150.0
87.472.893.0
.52*8
COMBINE FLOW FROM
LONE TREEELEV8 . 95
1 .0,
LONE TREEELEV8*95
1*0.
LONE TREEELEV8 * 95
1*0.
LONE TREEELEV8*95
1 .0*
LONE TREEELEV8*95
1.0*
LONE TREEELEV3*95
1*0*
LONE TREEELEV8 * 95
1.0.
LONE TREEELEV3*95
1.0,
0.018.05
2.142*
0.018.05
2 .142.
0.013.05
2.142.
0.018.05
rt t
142.
0.018.05
2 .142.
0.013.05
2 .142.
0.018.05
O A'» *
142.
0.018.05
2.142.
121.095.0
. 51.5
R INN IE
27.313.
614.
27.313.
614.
27,313.
614.
27.313.
614.
27.313.
614.
27 . 3 13.
614.
27.313.
614.
27.313.
614,
170.397.0
182.8 195.3 207.9 220.6 246.297.5 98.0 98.5 99.0 100.0
WITH ROUTED FLOW FROM WAGON WHEELS
36 . 724.
1869.
36.724.
1869.
36.724.
1869.
36.724.
1369.
36.724.
1369.
36.724.
1869.
36.724.
1869.
36.724.
1369.
46.305 .
3626.
46.305.
3626 .
46.305 »
3626.
46.305.
3626.
46.305 *
3626.
46.305*
3626.
46.30b .
3626 .
46.305.
3626.
1170 KK WSAA09 LONE TREE
62

TABLE 2. HYDROLOGIC ENGINEERING CENTER-1 INPUT FOR WILLOW CREEK STUDY (CONT.
L.. .L I^C.
1171117211731174
1175117611771178117911801181118211831184
11851186118711881189
.1.190119111921193
11941195
11961197119811991200
12011202120312041205
12061207
12081209121012111212
1213121412151216
1217121812191220122112221223
RSSV
SESR
KKRSSVSESOKKRSSVSESR
KKRSSVSESR
KKBALSUD
KKHC
KKRSSVSESR
KKRSRCRXRY
KKHC
KKRSRCRXRY
KKBALSUD
KKHCKKRSSVSESR
1,00.0.
WSAA101
.00,0,
WSAA111
.00.0.
WSAA121
.00.0.
02304.45
05.51
02302
02301
123.8100,0
,0
TCUS2 ->
,06,0
9,7
TCWS2 ->
GUTS2
.060.012.2
02607.15
04.95
GUTS2
GUTS1
421.2100.00.0
ELEV8 . 95
1,0,
LONE TREEELEV8,95
1,0,
LONE TREEELEV8,95
1,0,
LONE TREEELEV8.95
1.0.
SUB-BASIN
85 .
COMBINE 0
0,018,05
2 .142.
0.018.05
2 .142.
0.018,05
2 ,142,
0,018,05
2 .142.
0230
230 WITH
27*313.
614.
27.313.
614.
27.313.
614.
27.313.
614.
FLOW
36.72 46.304. 5,
1869. 3626.
36.72 46.304. 5,
1869. 3626.
36,72 46,304 , 5 »
1869, 3626.
36.72 46.304. 5.
1869. 3626.
FROM LONE TREE DIKES
JIM DETENT RESERVOIRELEV
172,1101,050,4
ROUTE TOFLOW,04
100,7,7
100.220 .7102.0154.0
269.7103.0202.0
319.1 368.8 418,8 520,1 571.2104.0 105.0 106.0 108.0 109.0209.0 215.0 221.0 250.0 344.0
TC WSPREADER 2_. i
.06200,5,7
COMBINE WITH FLOW
ROUTE TOFLOW.04
100,10,2
SUB-BASIN
85 ,
COMBINE 0
GUTSHOT.... i
,06200 ,8,2
0260
260 WITH
30619.210.0.0
FROM
20977.232.1.1
FLOW
.0075234, 269. 368, 468.0.9 5,5 7,5 9,5
TC WATERSPREADER 1
,0075273, 325, 425, 525,0,0 4,3 7,3 10,3
ROUTED TO GUTSHQT
GUTSHOT RESERVOIRELEV
687,5102,0183,0
100.0956 . 2104.0211.0
1227 . 2106.0221 , 0
1500.7 1776,6 2054,9 2194,9 2618.8 3048.3108,0 110,0 112.0 113.0 116.0 119,0231.0 240,0 249,0 253,0 468,6 2430,
63

TABLE 2.-- HYDROLOGIC ENGINEERING CENTER-1 INPUT FOR WILLOW CREEK STUDY (CONT.)
10
12241225122612271228
122912301 23 11232
12331234
12351236123712381239
1240124112421243
12441245124612471248
12491250125112521253
12541255
125612571258125912601261126212631264
12651266126712681269
12701271
1272127312741275
KKRSRCRXRY
KKBALSUD
KKHC
KKRSRCRXRY
KKBALSUD
KKRSSVSESQ
KKRSRCRXRY
KKHC
KKBALSUDKKRSSVSESQ
KKRSRCRXRY
KKHC
KKBALSUD
0200 ROUTE TO CONFLUENCE WITH2 FLOW -1
.06 .04 .06 27035.0.0 100. 200. 232.12.2 10.2 8.2 1*1
0270 SUB-BASIN 02.707.15
0 85.4.95
0270 COMBINE 0270 WITH ROUTED3
T010 ROUTE TO COMBINE POINT 102 FLOW -1
.06 .04 .06 24470.0.0 100. 200. 230.
15.6 13.6 11.6 1.3
0811 SUB-BASIN 08117.42
0 86.4.16
0811 PEARSON DETENT RESERVOIR1 ELEV 100.0
0.0 11.9 31.9 72.1100. 101.5 102.0 103.0
0. 0.0 54.9 57.1
0811 A ROUTE TO COMBINE POINT 102 FLOW -1
.06 .04 .06 13130.0. 100. 200. 210.
9.7 7.7 5.7 0.0
10A COMBINE WITH ROUTED FLOW > *i.
0812 SUB-BASIN 08122.57
0 86.1.590812 LOR I. RESERVOIR
1 ELEV 100.64.4 107.8 151.5 195.6100.0 101.0 102.0 103.0
0.0 27.2 38.6 39.9
0812 ROUTE TO COMBINE. POINT 102 FLOW -1
.06 .04 .06 24900..0 100. 200. 203.
6.5 4.5 2.5 2.0
COLL INS RESER OUTFLOW
0060273. 325. 425. 525.0.0 4.3 7.3 10.3
FLOW FROM GUTSHOT AND COLL.. INS
.0034270. 320. 400. 600.0.0 1.2 11.2 15.2
112.6 153.4 194.5 277.8 362.4104.0 105.0 106.0 108.0 110.059.3 61.3 63.3 67.2 589.0
.0075234. 268. 368. 468.0.9 5.5 7.5 9.5
FROM COLL INS
239.9 284,7 329.7 375.2104.0 105.0 106.0 107.041.1 147.0 632.0 1429,0
.008209. 222. 322. 422.0.0 2.5 4.5 6.5
10A COMBINE WITH FLOW AT POINT 10< _ >
0813 SUB -BASIN 08135 . 93
0 86.2 * 00

TABLE 2. HYDROLOGIC ENGINEERING CENTER-1 INPUT FOR WILLOW CREEK STUDY (CONT+)
1276 12771278127912801281
128212831284128512861 287
128812891290129112921293
129412951296129712981299
1300130113021303130413051306130713081309
13101311131213131314
13151316131713181319
13201321132213231324
13251326132713281329
KK KORSSVSESO
KKKORSSVSESQ
KKKORSSVSESQ
KKKORSSVSESQ
KKRSSVSESQKKRSSVSESQ
KKRSSVSESQ
KKRSSVSESQ
KKRSSVCUT
SQ
KKRSSVSESQ
0813 21
,0100,0,0
WSAA0121
.00 +0,
WSAA02^1
,00.0,
WSAA0321
,00,0 +
WSAA041
+ 00 +0 +
WSAAOS1
+ 00 +0 +
WSAA061
+ 00 +0 +
WSAA071
.00 +0,
WSAA081
.00.0 +
WSAA091
+ 00 +0,
BOMBER DETENTION'!>
ELEV+ 01
103 + 151,4
BOMBERo
ELEV2 + ^2
1 ,0 +
BOMBERo
ELEV2 + 22
1 +0 +
BOMBER'?
ELEV/ ) / ) , )
1 +0,
BOMBERELEV2,22
1.0 +
BOMBERELEV*? t o 1?
1 +0,
BOMBERELEV2,22
1 +0.
BOMBERELEV2 + 22
1.0 +
BOMBERELEV2 + 22
1 +0 +
BOMBERELEV2 + 22
1 +0 +
100.62.2104.064 + 7
0.04.52
2 +142 +
0,04 + 52
2 +142 +
0 + 04 + 52
2 +142 +
0 + 04.52
2 +142 +
0 + 04 + 52
2 +142 +
0 + 04 + 52
p f142 +
0 + 04.52
2 .142.
0.04 + 52
2 +142 +
0.04.52
2 .142 +
RESERVOIR
131+7105.093 + 4
6 + 903 +
614,
6 + 903.
614.
6 + 903 +
614,
6 + 903.
614 +
6 + 903 +
614 +
6,903 +
614 +
6,903 +
6 1 4 ,
6 + 903 +
614,
6,903,
614.
272 + 1107 + 0153,0
9,364 +
1869,
9,364.
1869,
9.364 +
1869 +
9 + 364 +
1869,
9,364.
1869,
9,364,
1869,
9,364 +
1869 +
9 + 364 +
1869 +
9,364.
1869 +
414,1 557,9 703,5 776,9 925+1109+0 111,0 113+0 114,0 116+0190+0 221+0 248+0 271+0 694.0
11,915 +
3626 +
11+915 +
3626,
11 + 9 15 +
3626 +
11+91ErX..' +
3626 +
11,915 +
3626,
11.915 +
3626.
11,915 ,
3626,
11.915.
3626,
11 + 915 +
3626 +
1330 KK WSAA10 BOMBER

ENGINEERING CENTER-1 INPUT FOR WILLOW CREEK STUDY (CONT.)
10i-. a. IIL.
1331133213331334
13351336133713381339
13401341134213431344
1345134613471348134913501351135213531354
13551356135713581359
13601361136213631364
13651366136713681369
1370.1.37113721 3731374
13751376137713781379
13801381138213831384
RSSVBESQ
KKRSSVSESQ
KKRSSVSESQ
KKRSSVSESQKKRSSVSESQ
KKRSSVSESQ
KKRSSVSESQ
KKRSSVSESQ
KKRSSVSESQ
KKRSSVSESQ
KKRSSVSESQ
1,00*0,
WSAA111
,00.0,
WSAA121
.00,0.
WSAA131
.00,0,
WSAA141
,00,0.
WSAA151
.00,0.
WSAA161
,00,0.
WSAA171
,00,0,
WSAAIB1
.00.0.
WSAA191
.00,0*
USAA201
.00,0,
EL.EV2,22
1,0.
BOMBERELEV2 .22
1.0.
BOMBERELEV2 . 22
1.0.
BOMBERELEV2*22
1.0.
BOMBERELEV2*22
1 ,0.
BOMBERELEV2 » 2 2
1*0*
BOMBERELEV2 » 22*" * 1 7
0.
BOMBERELEV2*22
1.0,
BOMBERELEV2*22
1*0*
BOMBERELEV2 « 22
1.0.
BOMBERELEV2 f 22
1*0*
0.04*52
2,142.
0.04.52
2.142.
0.04.52
o
142.
0.04.52
2.142.
0.04.52
2 1142.
0.04.52
2.142.
0.04.52
2.142.
0.04.52
2.142.
0.04.52
2 ,142.
0.04.52
2.142.
0.04 . 52
2 .142.
6.903.
614.
6.903.
614.
6.903.
614.
6.903 .
614.
6.903.
614.
6.903.
614.
6.903,
614.
6.903.
614,
6.903.
614.
6.903.
614.
6.903.
614.
9.364.
1869.
9.364.
1869.
9.364.
1869.
9.364.
1869.
9.364.
1869.
9.364.
1869.
9.364.
1369.
9,364.
1869.
9.364,
1869,
9,364.
1869,
9.364,
1869,
11,915 ,
3626 ,
11.915.
3626.
11.915 .
3626 .
11,915 ,
3626,
11.91b ,
3626.
11,915.
3626.
11.915 ,
3626,
11.915 .
3626.
11.915 .
3626,
11,915 ,
3626,
11,915.
3626,
66

TABLE 2, - - HYDROLOGIC ENGINEERING CENTER-1 INPUT FOR WILLOW CREEK STUDY <CONT.)
10
13851386138713881389
139013911392.1.393139413951396139713981399
140014011402140314041405
14061407140814091410
1 4 1 11 4 1 2141314141415
14161417141814191420
1421142214231424.1.425
1426142714281 4291430
1431143214331434143514361437143814391440
KKP '" 1 ,;.>SVSESQ
KKRSSVSESQKKRSSVSESQ
KKKQRSSVSESQ
KKRSSVSESQ
KKRSSVSESQ
KKRSSVSESQ
KKRSSVSESQ
KKRSSVSESQ
KKRSSVSESQKKRSSVSESQ
WSAA211
.00.0.
USAA221
.00.0,
USAA231
.00.0.
USAA249
1
,0
0.0.
USAA011
.00.0,
WSAA021
.00.0.
WSAA031
,00.0,
WSAA041
.00,0.
USAA051
.00.0,
WSAA061
.00.0.
USAA071
.00.0,
BOMBERELEV9 , 9 9
1,
0.
BOMBERELEVo t 9 9
1 .
0,
BOMBERELEV2 , 2 2
1 ,0,
BOMBER9
ELEVo t 9 9
1,
0.
0.04.52
2.142 .
0.04.52
9 t
142,
0,04,52
9
142,
0,04.52
9
142.
6,903.
614.
6.903 .
614.
6.903.
614.
6.903,
614,
9,364,
1869,
9,364,
1869,
9,364,
1869,
9,364,
1869,
11.9 15.
362.6,
11.915 ,
3626 ,
11,915 ,
3626,
11,9 15,
3626 ,
INVER SPREADERELEV
21,271,0,
INVER SELEV
21,271 .0,
0.042.77
9
142.
P READER0.0
42,77*.- *
142.
64,513,
614.
64.513 .
614.
86,494,
1369,
86,494,
1869.
1 08 , 7 15,
3626,
108.715 ,
3626.
INVER SPREADERELEV
21,271 ,0.
INVER SELEV
21.271 ,0,
0.042.77
9
142.
PREADER0.0
42.772 .
142.
64.513,
614.
64.513.
614,
86,494,
1869,
86,494.
1869,
108.7.15.
3626,
108.715 .
3626,
INVER SPREADERELEV
21.271.0.
0,042.77
9 t
142.
64,513,
614,
86.494.
1869,
108,715 ,
3626,
INVER SPREADERELEV
21 « 271,0,
0.042.77
9 t
142.
64,513.
614.
86,494,
1869,
108,715 ,
3626 ,INVER SPREADER
ELEV21.27
J. .0,
0.042,77
2,142.
64,513,
614,
86,494,
1869,
108,715 ,
3626.
67

LINE
14411442144314441 445
14461447
1448144914501451
14521453145414551456
14571458145914601461
14621463
14641465146614671468
1469147014711472
1473147414751476147714781479148014811482
14831484
1485148614871488
1489149014911492
KKRSRCRXRY
KKHC
KKBALSUD
KKRSSVSESQ
KKRSRCRXRY
KKHC
KKRSRCRXRY
KKBALSUD
KKRSSVSESQKKRSRCRXRY
KKHC
KKBALSUD
KKRSSVSE
081 3 A2
,060,09,7
10C2
08245 , 88
02,82
08241
0,0100.0
0.0
0824A2
.060.09,7
10A2
10T202
,060,015,6
08252,13
01,74
08251
18,6100,00,0
0825A2
,060,06 , 5
20A2
08214,88
02,68
08211
0,0100,0
ROUTE TOFLOW.04
100.7,7
COMBINE
COMBINE~ 1
,06200,5,7
WITH FLOW
POINT 10
7480.210.0.0
AT POINT
,0075234.0.9
10
268. 368, 468,5 , 5 7 ,5 9,5
SUB-BASIN 0824
85,
TARGET RESERVOIRELEV38,3101,032,4
ROUTE TOFLOW,04
100,7,7
COMBINE
ROUTE TOFLOW,04
100,1 3 . 6
100,102.5102.0121.0
COMBINE 1
.06200,5.7
WITH FLOW
COMBINE-1.06
200,11,6
167.1103.0146.0
POINT 10
6950,210,0.0
AT POINT
POINT 20
44748,230,1.3
297.5105.0183.0
.0075234,0,9
10
,0034270,0.0
429,6 563.4 630.9107.0 109,0 110,0212,0 318,0 519,0
268 . 368 . 468 ,5.5 7,5 9.5
320, 400, 600.1,2 11.2 15,2
SUB-BASIN 0825
86,
SKEETERELEV37 , 4101.021.4
ROUTE TOFLOW.04
100,4 ,5
COMBINE
DETENTION100.56.4102.028.0
COMBINE... i.06
200.2,5
RESERVOIR
75.7103.028.9
POINT 20
40590.203.2.0
95,2104.029,8
,0080209.0.0
ROUTED FLOW FROM SKEETER
114,9 134.8 154.0 175,4 196,1105.0 106.0 107.0 108.0 109,030.7 31.5 32,9 228.0 838.0
2.22. 322. 422,2.5 4.5 6,5
WITH ROUTED FLOW FROM 10
SUB-BASIN 0821
86.
DOG CREEK DETENTION RESERVOIRELEV15,7102,0
100,32,0104,0
48,9106,0
66.4108.0
84.5 113,0 132,7110.0 113,0 115.0
68

LINE
14931494
1495149614971498
149915001501
150215031504150515061507
15081509151015111512
1513151415151516151715181519152015211522
152315241 52515261527
152815291530153115321533
1534153515361 5371538
15391540154115421543
154415451546
TABLE 2, --
I D , - * 'I
SLSS
KKBALSUD
KKKOHC
KKKORSSVSESQ
KKRSSVSESQ
KKRSSVSESQKKRSSVSESQ
KKRSSVSESQ
KKKORSSVSESQ
KKRSSVSESQ
KKRSSVSESQ
KKRSSV
101*5113*0
08232*67
02*40
0823o-?
WSAA01 ->
1.00»0,
WSAA021
.00,0,
WSAA031
.00*0,
WSAA041
.00*0*
WSAA051
.00,0,
WSAA0621
,00.0,
WSAA071
,00,0,
WSAA081
,00,0*
WSAA091
,0
HYDROLOGIC ENGINEERING CENTER-1 INPUT FOR WILLOW CREEK STUDY (CONT.)
> . , ....?». f - - - - 3 ....... A ....... !=; . . . . . , , A ....... 7 ....... P ....... 9 ......
7 , 0760*
SUB-BASIN
86,0
,52,8
0823
COHBINE 0823 AND2
DOG CREEK2
ELEV18,78
1,0*
DOG CREEKELEV18.78
1,0,
DOG CREEKELEV18,78
1,0,
DOG CREEKELEV18,78
1,0,
DOG CREEKELEV
18,781,0,
DOG CREEK2
ELEV18,78
1,0,
DOG CREEKELEV18,78
1,0,
DOG CREEKELEV
18.781,0,
DOG CREEKELEV18,78
0.037,78
2,142,
0,037.78
2 ,142,
0,037.78
2 .142.
0.037.78
2.142.
0,037,78
2142,
0.037.78
2.142,
0.037.78
2 .142.
0.037.78
2.142.
0.037.78
,51.5
0821
57 . 003.
614.
57.003.
614.
57,003,
614.
57,003,
614,
57 , 003,
614,
57.003,
614,
57,003.
6.14,
57,003.
614.
57.00
76,454,
1869,
76.454.
1869.
76 . 454,
1869.
76.454.
1869.
76.454.
1869.
76.454.
1869.
76.454.
1869,
76,454,
1869,
76.45
96.135.
3626,
96,135,
3626 ,
96,135,
3626.
96.135.
3626,
96.135,
3626.
96.135.
3626.
96,135.
3626,
96,135,
3626,
96,13
10
69

LINE
15471548
154915501551155215531554
155515561557155815591560156115621 5631564
15651566156715681569
15701571157215731574
15751576157715781579
15801581158215831584
15851586158715881 589
15901591159215931594
15951596159715981599
TABLE 2.--
J D » - - 1
SESQ
KKKORSSVSESQ
KKRSSVSESQKKRSSUSESQ
KKRS8VSESQ
KKRSSVSESQ
KKRS3VSESQ
KKRSSVSESQ
KKRSSVSESQ
KKRS3VSESQ
KKRSSVSESQ
0*0,
WSftftlO21
.00.0.
USAA111
,00,0,
W3AA121
,00,0,
WSAA131
,00,0.
WSAA141
,00*0*
WSAA151
.00.0,
WSAA161
,00.0,
WSAA171
,00*0*
WSAA181
.00*0,
WSAA191
,00.0,
HYDROLOGIC ENGINEERING CENTER-1 INPUT FOR WILLOW CREEK STUDY <CONT*>
>,»»»» , 2 » » t "* .-.-..- A ....... S ....... A ....... 7 ....... R ....... O ......
1 .0,
DOG CREEK?
ELEV18,78
1 *0.
DOG CREEKELEY18,78
1*0»
DOG CREEKELEV18,78
1.0,
DOG CREEKELEV18,78
1,0.
DOG CREEKELEV18,78
1,0,
DOG CREEKEL EV
18,781,0,
DOG CREEKELEV18,78
1.0,
DOG CREEKELEV18,78
1,0,
DOG CREEKELEV18,78
1,0,
DOG CREEKELEV18,78
1,0,
2,142,
0,037,78
2 ,142,
0,037.78
p t142,
0,037,78
2,142,
0,037,78
2 ,142,
0.037,78
2 ,142,
0,037,78
2 ,142.
0,037,78
9142,
0,037 , 78
2 ,142,
0,037,78
2,142.
0,037 , 78
2 t142,
3,614,
57,003,
614,
57,003,
614,
57,003,
614,
57,003.
614,
57 . 003.
614,
57,003,
614,
57,003,
614,
57,003,
614,
57,003.
614,
57,003,
614,
4,1869,
76,454,
1869,
76,454,
1869,
76,454,
1869,
76,454,
1869,
76 ,454,
1869,
76 , 454,
1869,
76,454,
1869,
76.454,
1869,
76.454,
1869,
76 ,454,
1869.
iK-
3626 I
96,135,
3626.
96.13b »
3626.
96.13Ib ,
3626.
96.13b .
3626,
96.135,
3626,
96,135,
3626.
96.135 »
3626.
96. 13b ,
3626,
96.135 .
3626,
96.135.
3626,
10
1600 KK WSAA20 DOG CREEK

TABLE 2. HYDROLOGIC ENGINEERING CENTER-1 INPUT FOR WILLOW CREEK STUDY (CONT.)
i_. .1 1 < i-
160116021 603160416051606160716081609
16101611161216131614
16151616
1617161816191620
16211622162316241625
1626162716281629
16301631163216331634
16351636163716381639
1640164116421643164416451646164716481649
16501651165216531654
RSSVSESQKKRSSVSESQ
KKRSRCRXRY
KKHC
KKBALSUD
KKRSSVSESQ
KKDTDIDQ
KKRSSVSESQ
KKRSSVSESQ
KKRSSVSESQKKRSSVSESQ
KKRSSVSESQ
1.00.0.
WSAA211
.00.0.
20A2
.060.09.7
20B2
08227.79
05.23
082.21
0.097.0.0
0822DIVERT
11.60.0
WSAA011
.00.0.
WSAA021
.00.0.
WSAA031
.00.0.
WSAA041
.00.0.
WSAA051
.00.0.
ELEV18.78
1.0.
0.037.78
2 .142.
57.003.
614.
76.454.
1869.
96.135.
3626.DOG CREEK
ELEV18.78
1.0.
0.037.78
2.142.
ROUTE TO COMBINEFLOW.04
100.7.7
COMBINE
.... 1
.06200.5.7
57.003,
6 1 4 .
POINT
17090.210.0.0
76.454.
1869.
20
.0075234.0.9
96.135 .
3626.
268. 368. 468.5.5 7.5 9.5
WITH FLOW AT POINT 20
SUB-BASIN 0822
86.
CACTUSELEV.01
98.02.7
DIVERT
36.011.5
CACTUSELEV7.96
1.0.
CACTUSELEV7 . 96
1 .0.
CACTUSELEV7.96
1.0.
CACTUSELEV7.96
1.0.
CACTUSELEV7.96
1.0.
FLATS DETENTION97.
8.39100.011.6
SPILLWAY
99.065 . 0
FLATS0.0
10.042 t
142.
FLATS0.0
10.042.
142.
FLATS0.0
10.042 t
142.FLATS
0.010.04
2.1 "L.
FLATS0,0
10.042 .
142.
37.0102.036.0
RESERVOIR
79 . 2104.099.0
104.8 140.0105.0 106.0123.0 417.0
FLOWS AROUND SPREADERS
123.085.0
15,233.
614.
15.233.
614.
15.233.
614.
15.233.
614.
15,233.
614.
417.0375 . 0
20.554.
1869.
20.554.
1869.
20.554.
1869.
20,554.
1869.
20.554,
1869.
25.98urO *
3626.
25.985.
3626.
25.985.
3626.
25.985.
3626.
25.985.
3626.
10
71

TABLE 2 » - HYDROLOQIC ENGINEERING CENTER-1. INPUT FOR WILLOW CREEK STUDY (CONT,)
10
16551656165716581659
16601661166216631664
16651666166716681669
16701671167216731674
16751676167716781679
16801681168216831684
1685168616871688168916901691169216931694
16951696.1.69716981699
17001701170217031704
17051706170717081709
KKRSSVSESQ
KKRSSVSESQ
KKRSSVSESQ
KKRSSVSESQ
KKRSSVSESQ
KKRSSVSESQ
KKRSSVSESQKKRSSVSESQ
KKRSSVSESQ
KKRSSVSESQ
KKRSSVSESQ
WSAA061
,00.0.
WSAA071
.00,0,
WSAA081
,00,0.
USAA091
,00,0,
WSAA101
.00,0,
WSAA111
,00,0,
USA A 121
,00,0,
WSAA131
,00,0,
WSAA141
,00,0,
WSAA151
.00.0,
WSAA161
,00,0,
CACTUSELEV7,96
1,0,
CACTUSELEV7,96
.1. ,0,
CACTUSELEV7 , 96
1 .0.
CACTUSELEV7,96
1,0,
CACTUSELEV7,96
1.0,
CACTUSELEV7.96
1 ,0.
CACTUSELEV7.96
1.0,
CACTUSELEV7,96
1 ,0,
CACTUSELEV7,96
1,0,
CACTUSELEV7,96
1,0,
CACTUSELEV7 . 96
1,0,
FLATS0.0
10.04'*> **.. *
142.
FLATS0.0
10.042.
142.
FLATS0.0
10.042.
142.
FLATS0,0
10.042 .
142.
FLATS0,0
10,042,
142.
FLATS0,0
10,042 ,
142,
FLATS0,0
10,04* * ,
142,FLATS
0,010.04
2 ,142,
FLATS0,0
10,042 ,
142.
FLATS0.0
10.042 .
142.
FLATS0,0
10,04i*
142.
15.233 .
614.
15.233.
614.
15.233.
614.
15.233,
614,
15.233,
614,
15,233 ,
614,
15,233,
614.
15.233.
614.
15.233.
614,
15,233,
614.
15.233,
614,
20,554.
1869.
20.554,
1869.
20.554,
1869,
20,554,
1869.
20.554.
1869.
20.554,
1869,
20 . 554.
1869.
20,554,
1869,
20,554,
1869,
20,554.
1869.
20 . 554.
1869,
25 , 985,
3626 ,
25,985.
3626 .
25.98S.
3626.
25.985.
3626.
25 , 985,
3626,
25.985.
3626.
25 . 985.
3626 .
25.98vj .
3626.
25 . 985,
3626,
25,985,
3626,
25,985,
3626.
72

LINE
TABLE 2,- - HYDROLOGIC ENGINEERING CENTER-1 INPUT FOR WILLOW CREEK STUDY (CGNT.)
ID,,,..,,1,,,.,,.2.,.,,,,3,,,.,.,4 ....... 5,...,,,6,,,,,,,7,,,,.,,8 ,,,,,,, 9 .,,,,, 10
17101711
17121713
17141715171617171718
1719172.0
1721172217231724172.5
1726172717231729173017311732173317341735
17361737173817391740
1741174217431744
.1.7451746
1747174817491750.1.7511752
17531754175517561757
17581759.1.760
KKDR
KKHC
KKRSRCRXRY
KKHC
KKRSRCRXRY*
KKBALSUDKKRSSVSESLSS
KKRSRCRXRY
KKBALSUD
KKHC
KKRSS'v1
SESLSS
KKRSRCRXRY
KKBALS
0822A RETRIEVE DIVERTED FLOWDIVERT
0822B COMBINE DIVERTED FLOW AND SPREADER OUTFLOW2
0822A ROUTE TO COMBINE POINT 202 FLOW -1
.06 .04 ,06 7130* .00750,0 100. 200. 210. 234, 268. 368. 468,9.7 7,7 5.7 0,0 0.9 5.5 7,5 9.5
2 OB COMBINE FLOW FROM CACTUS FLATS WITH FLOW AT 20':>
20T30 ROUTE TO COMBINE POINT 302 FLOW -1
,06 ,04 ,06 9790. .00340.0 100. 200, 230. 270. 320. 400. 600.
15,6 13,6 11.6 1.3 0.0 1,2 1.1.2 15,2********************* PAGE 4 STARTS HERE *****************
0321SUB--BASIN 03210.6
0 861.120321MOKEE RESERVOIR
1 ELEV 100,,0 1.62 10.00 18,79 28.04 37,74 47,92 51,60
97,6 98,0 100,0 102,0 104.0 106.0 108,0 108,7100,1 ,79 .5 .5100.2 30. 2.8 1.5
0321ROUTE TO TEEPEE2 FLOW - !
,06 .04 ,06 5818 ,00300 100 200 203 209 222 322 422
6,5 4,5 2.5 2.0 0 2,5 4,5 6.5
0323SUB-BASIN 03231,9
0 863.08
0323COMBINE 0323 AND 03212
0 3 2 3 T E E P E E R E S E R V 0 1 R1 ELEV 100,0 9.86 19,88 30,07 40.42 61.63 83,52 106.11 132,97
100,0 .1.01.0 102,0 103.0 104.0 106.0 108.0 1.10.0 112.3100,8 1.77 ,5 .5108.6 37. 2.8 1.5
0323ROUTE TO MOCASSIN2 FLOW - !
.06 .04 ,06 12412 ,00750 100 200 210 234 268 368 468
9.7 7.7 5,7 0 0,9 5,5 7,5 9,5
0322SUB--B AS I N 03222,4
0 86
73

TABLE 2.--~ HYDROLOGIC ENGINEERING CENTER-1 INPUT FOR WILLOW CREEK STUDY (CONT.)
LINE
1761
ID
UD
. . .1
2*14
10
176217631764176517661767
176817691770177117721773177417751776
17771778
17791780178117821783
1784178517861787
17881789179017911792
17931794
17951796179717981799
1800180118021803
180418051806180718081809
1810181118121813
KKRSSVSESLS3
KKRSRCRXRYKKBALSUD
KKHC
KKRSSVSESO
KKBALSUD
KKRS8VSESQ
KKHC
KKRSRCRXRY
KKBALSUD
KKRSSVSESL.SS
KKBALSUD
0322BADGER RESERVOIR1 ELEV 100,0 19,8 34,20 48,78 78,53 109,09 140,47 172,68 205,75 239,69
98,6 100.0 101.0 102.0 104.0 106,0 108,0 110,0 112,0 114,0100,8 1,77 ,5 ,5113,0 45,0 2,8 1,5
0322ROUTE TO MOCASSIN2 FLOW -1
,06 ,04 .06 14150 ,00800 100 200 203 209 222 322 422
6,5 4.5 2.5 2,0 0 2,5 4,5 6,50324SUB-BASIN 03243,1
0 862 , 83
0324COMBINE 0324 AND 0322 AND 03233
0324MOCASSIN RESERVOIR1 ELEV 100,0 66.60 85.12 103.85 142,01 181,07 221.07 262.02 282.85 303.92
96.3 100.0 101.0 102.0 104.0 106,0 108.0 110.0 111.0 112,00 0 32.4 84.7 89,6 92,0 94.3 107,3 307.3 861.1
0325SUB-BASIN 03252,4
0 851,68
0325HURRICANE RESERVOIR1 ELEV 100,0 105.06 128.60 176,42 225,26 275.14 300,47 326.07 351,93 378.00
95.4 100.0 101,0 103,0 105,0 107.0 108.0 109.0 110,0 111,00 0 15,0 18,7 19,6 20.5 97,3 493,5 1358,1 2506,5
0324COMBI.NE 0325 AND 03242
0324ROUTE TO BEAVERETT2 FLOW -1
.06 ,04 ,06 36135 ,00750 100 200 210 234 268 368 468
9,7 7,7 5,7 0 0.9 5.5 7.5 9,5
0313SUB-BASIN 03131,4
0 862,50
0313BEECHNUT RESERVOIR1 ELEV 100,0 10,45 21,07 31,85 48,34 59.56 70.94 82.51 93.06
100,0 101,0 102.0 103.0 104,5 105.5 106.5 107.5 108.5100,8 1.77 .5 .5103.8 75. 2.8 1.5
0312SUB--BASIN 03126.4
0 863.54
74

TABLE 2. - HYDROLGGIC ENGINEERING CENTER-1 INPUT FOR WILLOW CREEK STUDY (CQNT.)
LINE
18141815
18161817181818191820
18211822182318241825
1826182718281829
183018311832183318341835
18361837183818391840
18411842
1843184418451846
IP ./1848
18491850185118521853185418551856185718581.859
1860186118621863
18641865
KKHC
KKRSSVSESQ
KKRSRCRXRY
KKBALSUD
KKRSSVSESLSS
KKRSRCRXRY
KKHC
KKBALSUD
KKHC
KKRSSVSESLSSKKRSRCRXRY
KKBALSUD
KKHC
0312COMBINE 0312 AND 03132
0312N. BEAVER RESERVOIR1 ELEV 100,0 25,94 52.15 78.62 132.35 187,15 243.05
100,0 101.0 102.0 103.0 105,0 107,0 109.00 27,2 57,2 59.4 63,7 67.7 322.2
0312ROUTE TO HAMMS2 FLOW -1
,06 .04 .06 11479 . .00750 100 200 210 234 268 368
9,7 7.7 5.7 0 0.9 5.5 7,5
0311SUB-BASIN 03111.3
0 861,40
0311 ALKALI RESERVOIR1 ELEV 100.0 10.90 21.96 33.20 44.61 56,20 79.90
100.0 101,0 102.0 103.0 104.0 105.0 107.0100,8 1,77 ,5 ,5106.9 35. 2,8 1.5
03 11 ROUTE TO HAMMS2 FLOW -1
.06 ,04 .06 15725 .00750 100 200 210 234 268 368
9.7 7.7 5.7 0 0.9 5.5 7.5
03 11 COMBINE 0311 AND 03122
0310SUB-BASIN 03103,8
0 853,14
0310COMBINE 0310 AND 03112
0310HAMMS RESERVOIR1 ELEV 100,0 127,24 228,75 296,96 365.59 434.65 504.13
98.1 100.0 101.5 102.5 103.5 104.5 105,5101.5 7.07 .5 ,5104,6 60 2.8 1.50310ROUTE TO BEAVERETT
2 FLOW -1.06 .04 .06 30982 .0075
0 100 200 210 234 268 3689.7 7.7 5.7 0 0.9 5.5 7.5
0326SUB-BASI.N 032611,8
0 859,67
0326COMBINE 0326 AND 0310 AND 03243
271,41 300,05 319.00110.0 11.1,0 112,0965,3 1976.1 3233,5
4689*5
104.34 116,83109.0 110.0
4689.5
609.17 750.73 807.85107.0 109.0 109.8
4689 . 5
75
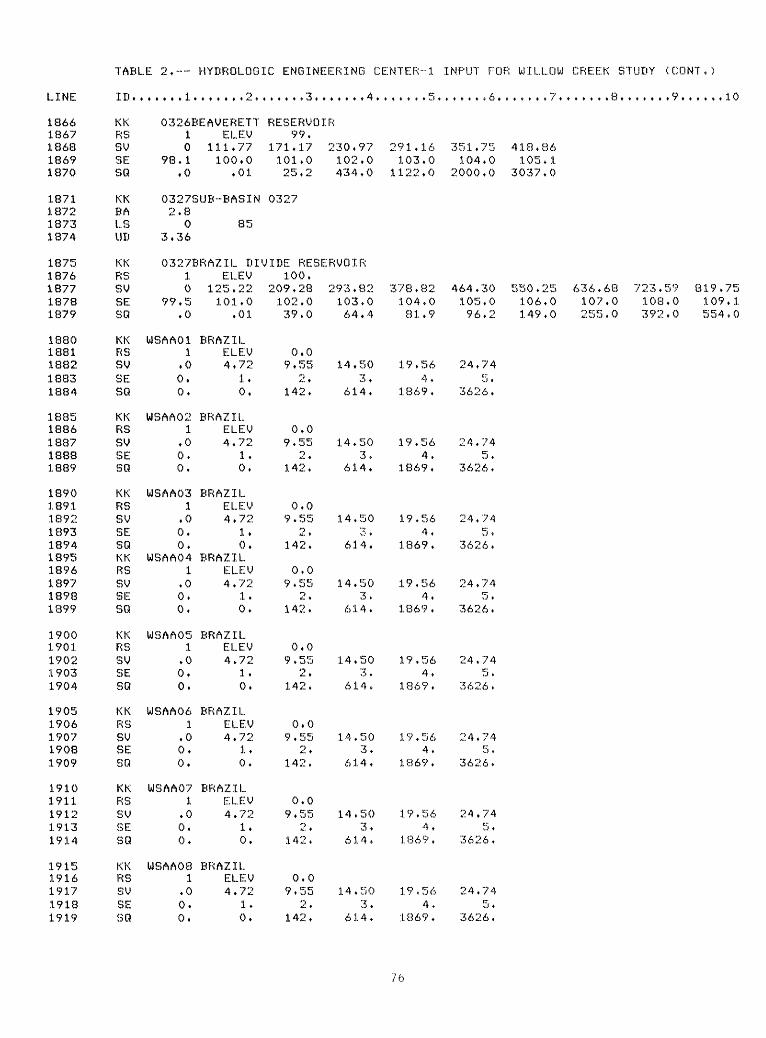
TABLE 2* HYBROLOGIC ENGINEERING CENTER-1 INPUT FOR WILLOW CREEK STUDY (CONT,)
186618671 86818691870
1871187218731874
18751876187718781879
18801881188218831884
18851886188718881889
1890189118921893189418951896189718981899
19001901190219031904
19051906190719081909
19101911191219131914
19151916191719181919
KKRSSVSESQ
KKBALSUD
KKRSSVSESQ
KKRSSVSESQ
KKRSSVSESQ
KKRSSVSESQKKRSSVSESQ
KKRSSVSESQ
KKRSSVSESQ
KKRSSVSESQ
KKRSSVSESQ
0326BEAVERETT10
98,1,0
ELEV111, 77100.0
.01
0327SUB-BASIN2,8
03,36
85
RESERVOIR99.
171.17101.025.2
0327
230 . 97102.0434.0
291.16103.0
1122,0
351.75 418,86104,0 105,1
2000.0 3037.0
0327BRAZIL DIVIDE RESERVOIR10
99,5.0
USAA011
,00,0,
WSAA021
,00.0,
USAA031
,00,0.
USAA041
,00.0,
WSAA051
,00,0.
WSAA061
.00.0.
USAA071
.00,0.
USAA081
,00.0.
ELEV- ,.)r:. ^^J. *' \J * A*« *i.
101.0,01
BRAZILELEV4.72
1.0.
BRAZILELEV4,72
1.0,
BRAZILELEV4.72
1.0.
BRAZILELEV4.72
1.0.
BRAZILELEV4.72
1.0.
BRAZILELEV4.72
1,0.
BRAZILELEV4.72
1,0,
BRAZILELEV4,72
1,0,
100.209,28102.039.0
0.09.55
? .142.
0.09.55
9
142.
0.09 . 55
9
142.
0.09 . 55
* > t
142.
0.09.55
2 .142.
0.09.55
2 .142.
0.09.55
2 t142.
0.09.55
^>142.
293.82103.064.4
14.503*
614.
14.503.
614.
14.503 .
614.
14.503.
614.
14.50 7 t
614.
14.503.
614.
14.503.
614.
14.503.
6 1 4 .
378,82104,081.9
19.564,
1869.
19.564.
1869.
19.564.
1869.
19,564.
1869.
19,564.
1869.
19,564,
1869,
19,564,
1869.
19,564,
1869.
464.30 550.25 636.68 723.59 819.75105.0 106.0 107.0 108.0 109.196,2 149,0 255.0 392,0 554,0
24,745,
3626,
24,745,
3626.
24.745 ,
3626.
24.745 .
3626,
24,745,
3626 ,
24,745 ,
3626.
24,74b ,
3626,
24,745,
3626,
76

LINE
19201921192219231924
192519261 92719281929
1930193119321 9331934
1935193619371938193919401941194219431944
19451946194719481949
19501951195219531954
19551956195719581959
19601961196219631964
19651966196719681969
19701971197219731974
TABLE 2.-~~
KKRSSVSESQ
KKRSSVSESQ
KKRSSVSESQ
KKRSSVSESQKKRSSVSESQ
KKRSSVSESQ
KKRSSVSESQ
KKRSSVSESQ
KKRSSVSESO
KKRSSVSESQ
KKRSSVSESQ
WSAA091
.00*0.
WSAA101
.00*0.
WSAA111
.00*0,
WSAA011
,00*0.
WSAA021
,00*0.
WSAA031
.00*0.
WSAA041
.00*0.
WSAA051
,00.0*
WSAA061
.00«0.
WSAA071
.00,0,
WSAA081
.00.0,
HYDROLOGIC
o
BRAZIL.ELEV4,72
1*0.
BRAZILELEV4*72
1 .0,
BRAZILELEV4.72
1*0,
INVER DIKESELEV4.07
1.0.
INVER DIKESELEV4.07
1.0.
INVER DIKESELEV4.07
1.0.
INVER DIKESELEV4.07
1,0.
INVER DIKESELEV4.07
1.0.
INVER DIKESELEV4.07
1.0.
INVER DIKESELEV4.07
1.0.
INVER DIKESELEV4.07
1.0.
ENGINEERING CENTER-1 INPUT FOR WILLOW CREEK STUDY (CONT.)
0.09 . 55
2 »142.
0.09.55
2 .142.
0.09.55
1 1142.
0.08 . 25
2.142.
0.08.25
> t
142.
0.08 . 25
2.142.
0.08.25
'? t
142.
0.08.25
9 ,
142.
0.08 . 25
2 »142.
0.08.25
-> t
142.
0.08.25
' ' .142.
14.503.
614.
14.503.
6 1 4 .
14.503.
614.
12.533.
6 1 4 *
12.533.
614.
12.533.
614.
12.533.
614.
12.533.
614.
12.533.
614.
12.533.
614.
12.533.
614.
19.564.
1369.
19.564.
1869.
19.564.
1869.
16.924.
1869.
16.924.
1869.
16.924.
1869.
16.924.
1869.
16.924.
1869.
16.924.
1869.
16.924.
1869.
16.924.
1869.
24.745 .
3626 .
24.745.
3626.
24.745.
3626.
21.42b .
3626.
21.425.
3626.
21 . 425.
3626.
21.425.
3626.
21.425.
3626.
21 .425.
3626.
21 ,425.
3626.
21 . 425.
3626.
10
77

TABLE 2.~ HYDROLOGIC ENGINEERING CENTER-1 INPUT FOR WILLOW CREEK STUDY (CQNT.)
10l._ 4. 11 1_
19751976197719781979
198019811982198319841985
19861987198819891990
19911992199319941995
19961997199819992000
20012002200320042005
20062007200820092010
20112012201320142015
20162017201820192020
20212022202320242025202620272028
KKRSSV8ESQ
KKBALSur.iKKHC
KKRSSVSESQ
KKRSSVSESQ
KKRSSVSESQ
KKRSSVSESQ
KKRSSVSESQ
KKRSSVSESQ
KKRS8VSESQ
KKRSSVSESQKKRSSV
WSAA091
,00,0.
1NVER DIKESELEV4*07
1.0.
0.08 . 25
2 »142.
12.533.
614.
16,924.
1869.
21.425.
3626.
0320SUB-BASIN 032014.1
07.88
85
0320COMBINE 0323
WSAA011
,00.0.
USAA021
.00.0.
USAA031
.00,0.
USAA041
.00.0.
USAA051
.00*0.
WSAA061
.00.0.
WSAA071
,00.0.
WSAA081
,00-.0.
WSAA091
,0
BEAVERETTEELEV7*71
1.0.
BEAVERETTEELEV7.71
1.0.
BEAVERETTEELEV7.71
1.0.
BEAVERETTEELEV7.71
1.0.
BEAVERETTEELEV7.71
1.0.
BEAVERETTEELEV7.71
1.0.
BEAVERETTEELEV7.71
1.0.
BEAVERETTEELEV7.71
1.0.
BEAVERETTEELEV7.71
0 AND
0.015.55
2 .142.
0.015 .55
2.142.
0,015.55
2.142.
0.015.55
2.142.
0.015.55
2.142.
0.015.55
2.142.
0.015,55
2.142,
0.015.55
2.142.
0.015.55
0327 AND
23.553.
614,
23.553,
614.
23 . 553.
614.
2 3 . 5 53.
614.
23.553.
614.
23 . 553.
614.
23,553.
614,
23,553,
614,
23.55
0326 **BEAVERETT SPREADER FOLLOWS**
31.684.
1869.
31.684.
1869.
31.684.
1869.
31.684,
1869.
31.684.
1869.
31.684.
1869.
31.684.
1869.
31,684,
1869.
31 .68
39.975.
3626.
39.975.
3626.
39.975.
3626 .
39.975.
3626.
39 . 975.
3626.
39.975.
3626.
39.975.
3626.
39.975.
3626.
39.97

ro
ro r
o ro
j-.j
?o r
o ro
ro
ro r
o ro
ro
ro r
o ro
ro
ro
ro r
o ro
ro
ro
ro r
o ro
ro
ro
ro r
o ro
ro
ro
ro r
o ro
ro
ro
ro r
o ro
ro
ro
to r
o ro
o
oo
oooo
oo
oo
oo
oo
o
oo
oo
o
ooooo
oo
oo
o
oo
oo
o
oo
oo
o
oo
oo
oco
co
x!
xj x
j x!
xi
xi x
j xj
xj
xj !
> i>
&- o
ON
ON
ON O
N ON
o-
c.nc
.nc.
ncn
en e
n en
en
en
en .&
. .&
->
.&
> >
->
> >
*»
CN*
w c
* w
M-
o s
j co
xj
ON e
n -&
w r
o i--
o N
Q co
xj
ON
en .
£ o«
j ro
M-
o -
o co
xj
o-
en
*» CKJ
ro
!-
o N
Q co
x>
ON
en .
£ w
ro
H-
o N
O oo
xj o
i
- "s^
. CO
>
1
7^ -
< x
o
coCO
CO
CO
33
53 P
I <C
CO
y? o
^ en
^
o r
n <:
co
co c
o co
^ 7
; 53
m c
co
co e
o co
re
x
o m
c c
o
co tf
> &
j?
53 m
<:
co
CO
0 CO en
* C*i
co e
n CO C3 "3?
?£
3> CO ' z. o Ckl
C>4 en
-&
» W
O
en o e
n o r
o o o
-05 c D? i 5? i
-1-> O H*
CO
CO - O 0
en
-r-i r
o o -
& z: o CN!
W o c
o ro
.* o o
ro o O
N
roro
o 71 6 c !
~n r
n, 0 H
£ C3 CD 33 C *33
j . -'
00*
0 Xi f
O
!-* X! i-»
!-*
en-S»
»ro r
o en
en
->.f-
* ON
5?
I':
3>rn
<c
r~ m
m 3
3 -i -! m
o » o
0 0 *
- o Xi »
O i
-1 x! "-
^
en4i ro
ro
en
en
i-*M.
en w rn 3>
m ̂
ci m
c m i
-1 m
0 » o
0 0
* o Xj f.
O H
1 xj i-
1j-*
en
£»
ro
w e
n
* en
i-*i-*
^. w rn 3>
m <
:' m
m 3
3 !
! m
o » o
0 O
-
* * O H> W jt1 m 3>
xj m <
r r r
no !
-* xi
rn
3?
»
i-1 <
: rn i im
is-
en
> *o
ro r
o en
-
en o
O O
H*
. o i
-' ro ?j
! m̂ .xi m c
r~ m
o f
-* xi r
n 33
r-- c m -H !m
i-j.s-*
en
4i
O
ro r
o en
-
en
o
00*
0 H*
xj r
n*
r~o H
* xj
m
i-1^
en>
. o
ro r
o en
.
en
o
r-1
i-1
W m̂ . <3 m 3? !
i m
o o
. » o xj »
O i-
1 Xi i-*
M-
en.&
*
ro r
o en
* *
en
H*
O C
j-' O
a? m 3>m <i
!i fT]
m 3
3 o .-
!
-i mi-*
o
> ro r-
.o
* *
of-J
O
xj
O-
O t
fi O
0303
03.£>
O
- 03
o-
03
ro
M.
CM03
i-
*O
-NO
4
i 0>
CO
en CO
ro
w e
n *
en CO
CD ON
NO
J
S.
en
ON ro
ON e
nO
N ro
o- e
n
ON ro
ON e
n
ON ro
o- e
nX
j
ON ro
ON e
nen
Xj
.£»
ro
w e
n
o e
n
ro

TABLE 2,-- HYDROLOGIC ENGINEERING CENTER-1 INPUT FOR WILLOW CREEK STUDY (CONT.)
1 0
208220832084
20852086208720882089
20902091209220932094
2095209620972098
209921002101210221032104
21052106210721082109
211021112112211321142115
21162117211821192120
21212122212321242.1.25
2126212721282129
21302131
213221332134
BALSUD
KKRSSVsr:r.SQ
KKRSRCRXRY
KKBALSUD
KKRSSVSESLSS
KKRSRCRXRY
KKHCKKBALSUD
KKRSSVSESQ
KKRSRCRXRY
KKBALSUD
KKHC
KKRSSV
3.50 86
2 , 65
0332ITCAINA RESERVOIR1 ELEV 100*0 202,78 344,73 416,35 488,41 560,91
95,1 98,0 100,0 101,0 102,0 103.0,0 ,0001 ,0002 15,0 17.4 18,0
0332ROUTE TO SOUTH BEAVER2 FLOW -1
,06 ,04 ,06 7283 .00750 100 200 210 234 268
9,7 7,7 5.7 0 0.9 5,5
0333SUB-BASIN 03331.6
0 853.27
0333SCRIFT RESERVOIR1 ELEV 100.0 40,70 70.10 99.78 129.74 159,98
98,6 100.0 101.0 102.0 103.0 104.0100.8 1.77 ,5 .5106.3 51. 2.8 1.5
0333ROUTE TO SOUTH BEAVER2 FLOW -1
.06 ,04 .06 10147 .00750 100 200 210 234 268
9.7 7.7 5.7 0 0.9 5.5
0333COMBINE 0333 AND 03322
0331SUB-BASIN 03317.7
0 853.88
0331ARRAMBIDE RESERVOIR1 ELEV 100.0 50.18 101,39 153,65 180,18 206,98
94,0 96.0 98.0 100.0 101.0 102.00 0 0 0 21.4 32,3
0331 ROUTE TO SOUTH BEAVER2 FLOW -1
.06 ,04 ,06 19129 .00750 100 200 210 234 268
9.7 7,7 5,7 0 0,9 5,5
0334SUB-BASIN 03346.4
0 854.04
0334CQMBINE 0334 AND 0331 AND 03333
0334SOUTH BEAVER RESERVOIR1 ELEV 100.0 42.27 183,58 325.49 468.01 611,14
633 , 85 707 , 23 781. 05104.0 105,0 106,018,9 167,8 623,6
368 4687,5 9.5
236.84 299.62 370,00106,5 108.5 110.7
368 4687.5 9.5
233.00 261.38 288,98103.0 104.0 105.033.7 101,5 413,2
368 4687.5 9.5
899.24 1189.81 1336,00
80

LINE
21352136
21372138213921402141
21422143
2144214521462147
214821492150215121522153
21542155215621572158
21592160216121622163
2164216521662167
21682169217021712172
21732174217521762177
2178217921802181
21822183
2.18421852186
TABLE
ID,..,
SESQ
KKRSRCRXRY
KKHC
KKBALSUD
KKBALSUDKKHC
KKRSSVSESQ
KKRSRCRXRY
KKBALSUD
KKRSsvSESQ
KKRSRCRXRY
KKBALSUD
KKHC
KKRSRC
2. HYDROLOGIC ENGINEERING CENTER ! INPUT FOR WILLOW CREEK
, ... 1 ,..»,., 2 ....... 3 ....... 4 ....... 5 ....... 6 ....... 7 ....... 8
99.7 100.0 101*0 102.0 103.0 104.0 106.0 108.00 0 32,4 84.7 96.6 99.9 106,0 315.9
0334ROUTE TO GRUB2 FLOW -1
,06 ,04 ,06 17562 .00600 100 200 232 273 325 425 525
12.2 10.2 8.2 1.1 0 4.3 7.3 10.3
0335COMBINE 0334 AND 03352
0335 SUB-BASIN 03358.81
0 85.5,65
0330 SUB-BASIN 033011.5
0 85.8.450330 COMBINE 0330 AND 0335 AND INFLOW TO GRUB
3
0335GRUB RESERVOIR1 ELEV 100.0 1397.33 1958.37 2520.63 3084,09 4214,67 5919.67 7062,45
97,5 100.0 101.0 102.0 103.0 105.0 108,0 110.00 0 58.4 183.0 317.0 339.0 400.9 983.0
0325ROUTE TO MILLER COULEE CONFLUENCE2 FLOW -1
.06 .04 .06 20801 .00600 100 200 232 273 325 425 525
12.2 10.2 8.2 1.1 0 4.3 7.3 10.3
0341 SUB-BASIN 034110.0
0 865.58
0341 TOMAHAWK RESERVOIR1 ELEV 100.0 14.17 42.70 71.51 129.96 189.53 250,23 281,01
99.5 100.0 101.0 102.0 104.0 106.0 108.0 109.00 0 32,4 76.0 81.1 85,8 90.4 294,5
0341 ROUTE TO MILLER COULEE CONFLUENCE2 FLOW -1
.06 .04 ,06 15977 .00750 100 200 210 234 268 368 468
9,7 7,7 5,7 0 0,9 5,5 7,5 9,5
0340SUB-BASIN 03409.3
0 844.00
0340COMBINE 0340 AND 0341 AND 03353
0340ROUTE TO BIG FORK CONFLUENCE2 FLOW -1
,06 ,04 ,06 33099 .0060
STUDY (CONT.)
109.01009.1
7635.68 8210.00111,0 112.0
1517.0 2190.4
312.09 343,45110,0 111, 0957.6 2016.3
81

TABLE 2. HYDROLOGIC ENGINEERING CENTER-1 INPUT FOR WILLOW CREEK STUDY (CONT.)
10L- A ITI
21872188
218921902191219221932194219521962197
21982 1 99220022012202
22032204
2205220622072208
2209221022112212
22132214
22152216221722182219
2220222122222223
22242225
22262227
2228222922302231T}~ro*~ A- W A«
RXRY
KKBALSUDKKRSSVSESQ
KKRSRCRXRY
KKHC
KKBALSUD
KKBALSUD
KKHC
KKRSRCRXRY
KKBALSUD
KKHC
KKHC
KKRSRCRXRY
0 100 200 232 273 325 425 52512.2 10.2 8.2 1.1 0 4.3 7.3 10.3
0351 SUB-BASIN 03513.4
0 854.730351BIGFORK RESERVOIR
1 ELEV 100.0 61.86 12.4.12 249.85 377.22 506.23 571.36 636.91 702.87
100.0 101.0 102.0 104.0 106.0 108,0 109.0 110.0 111.00 27.2 40.1 44.2 47.9 51,3 183*5 616.7 1260,0
0351ROUTE TO BIGFORK CONFLUENCE2 FLOW -1
,06 ,04 ,06 9613 .00750, 100 200 210 234 268 368 468
9.7 7,7 5.7 0 0.9 5.5 7.5 9,5
0340COMBINE 0340 AND 03512
03SOSUB--BASIN 035010,8
0 854,67
0352SUB-BASIN 03522 , 4
0 852.96
0350COMBINE 0350 AND 0352 AND 03403
350ROUTE TO WILLOW CREEK5 FLOW -1
.06 .04 .06 16204 .00600 100 200 232 273 325 425 525
12.2 10.2 8.2 1,1 0 4,3 7.3 10.3
0360SUB-BASIN 03604.3
0 84.3.49
0360COMBINE 0360 AND 03502
30A COMBINE WITH FLOWS FROM BEAVER CREEK2
30 ROUTE TO 302 FLOW -1
.06 .04 .06 45830. .00340,0 100. 200. 230. 270. 320, 400, 600.15.6 13.6 11.6 1.3 0,0 1,2 11.2 15.2
* ********************* END OF PAGE 4
* ********************* PAGE 32233 KK 0831 SUB-BASIN 08312234 BA 7*022235 LS 0 86*2236 UD 4*71
82

TABLE 2. - HYDROLOGIC ENGINEERING CENTER-1 INPUT FOR WILLOW CREEK STUDY (CONT.)
l... j. INK;.
22372238223922402241
22422243224422452246
2247224822492250
22512252225322542255
22562257225822592260
22612262
2263226422652266
22672268226922702271
2272227322742275227622772278
2279228022812 2 8 2
22832284
2285228622872288
KKRSSVSESQ
KKRSRCRXRY
KKBALSUD
KKRSSVSESQ
KKRSRCRXRY
KKHC
KKBALSUD
KKRSSVSESQ
KKRSRCRXRYKKHC
KKBALSUD
KKHC
KKRSSVSE
08311
69,5100,00.0
0831 A9
.060,09.7
08323,11
02 . 80
08321
279.9100.00.0
0832A'->
.060.06.5
BLANC2
08336.10
04,16
08331
323.4100.00.0
0833BoA~
,060.09.7
BLANC2
08349,49
07.26
BLANC9
BLANC1
0,0100.0
JUDY RESERVOIRELEV 100.139.3 209.6 280.4101.0 102.0 103.032.4 54.1 56.4
351*5 423,1 495.2 567,7 640,6 695,0104,0 105,0 106,0 107,0 108.0 109,058.5 60,6 62,6 199,4 1044,0 2376,0
ROUTE TO BLANCHARD RESERVOIRFLOW -1.04 ,06 35240,
100.0 200.0 210.07,7 5,7 0,0
SUB-BASIN 0832
85,
DEEP CUT RESERVOIRELEV 100,
386,3 494,2 603,6102.0 104,0 106,034,1 36.1 38.0
,0075234.0 268.0 368,0 468.0
0.9 5.5 7.5 9.5
714.6 827.1 880.0108.0 110.0 111.039.9 371.0 1084.0
ROUTE TO BLANCHARD RESERVOIRFLOW -1.04 .06 27590.
100, 200, 203.4.5 2.5 2.0
COMBINE WITH FLOW FROM
SUB-BASIN 0833
85.
.0082 09, 222, 3 2 2 , 4 2 2 ,0,0 2.5 4,5 6,5
JUDY
JANUARY DETENT RESERVOIRELEV 100.
510.9 700.4 891.9102,0 104,0 106.034,1 35,8 37,4
ROUTE TO BLANCHARDFLOW -1.04 .06 18870.
100, 200, 210,7,7 5,7 0.0
COMBINE WITH FLOW WITH
SUB-BASIN 0834
85.
1085,4 1281,0 1488,5 1578,2 1678,3108.0 110.0 112.0 113.0 114.039.0 40.5 42.0 360.0 1276.0
.0075234. 268. 368. 468.0.9 5.5 7,5 9,5
FLOW AT BLANCHARD
COMBINE WITH FLOW AT BLANCHARD
BLANCHARD DETENTION RESERVOIRELEV 100,
610,2 1224,0 1841,4102,0 104.0 106.0
2462,4 3087.0 3400,7 3821.0 4664.4108.0 110.0 111.0 114,0 115,0
83

LINE
2289
229022912 2 9 222932294
22952296
2297229822992300
230123022303230423052306
2307230823092310
2311231223132314231523162317
2318231923202321
23232324232523262327
23282329
2330233123322333
23342335233623372338
23392340
TABLE 2.-- HYDROLOGIC ENGINEERING CENTER-1 INPUT FOR WILLOW CREEK STUDY (CONT,)
10
SQ
KKRSRCRXRY
KKHC
KKBALSUD
KKRSSVSESLSS
KKBALSUD
KKRSSVSESQKKHC
KKBALSUD
KKRSSVSESLSS
KKHC
KKBALSUD
KKRSsvSESQ
KKHC
0,0
3 OB2
,060.012,2
30B"3
08382.04
01 , 67
08381
0,0100,0101,5103,0
08372,06
01.93
08371
0.0100,0
0.00837A"3
08361,10
01.91
08361
0.098.1101.5105.3
0837B"3
08351.43
01 .56
0835'
0.0100.0
0,0
083 7 C9
121,0 135,0 150,0 163,0 175,0 181,0 555.0 1756.0
ROUTE TO COMBINE POINT 30FLOW -1.04 ,06 26620, .006
100.0 200.0 232.0 273.0 325.0 425.0 525.010.2 8.2 1.1 0.0 4,3 7.3 10,3
COMBINE WITH FLOW AT 30
SUB-BASIN 0838
87.
ARCHAMBEAULT RESERVO I RELEV 100.42.9 86,8 131,7 154,5 196.1102.0 104.0 106.0 107,0 108.37,07 .5 ,530. 2,8 1,5
SUB-BASIN 0837
86,
WILLOW FLAT RESERVOIRELEV 100,,01 27,6 65.3 103.8 143.2 167.3
102.0 104.0 106.0 108.0 110.0 111,225,2 61,5 96,2 202,0 761,0 1145,0
COMBINE WITH FLOW FROM ARCHAMBEAULT
SUB-BASIN 0836
87,
WILLOW CR RESERVOIRELEV 100.22.3 46,5 71,3 97,0 110,0 126.0100,0 102,0 104.0 106.0 107.0 108.27.07 .5 , 530. 2.8 1.5
COMBINE WITH FLOW FROM ARCH AND WILLOW FLAT
SUB-BASIN 0835
86.
WILLOW FLAT DIVERSION DAMELEV 100,6.1 18.5 43,8 69.8
101.0 102.0 104,0 106.046.9 269.0 1200.0 2760,0
COMBINE WITH FLOW FROM ARCH , WILLOW FLAT, AND WILLOW CR RES

TABLE 2*- HYDROLOGIC ENGINEERING CENTER-1 INPUT FOR WILLOW CREEK STUDY (CGNT.)
101.. .1. 1 < l~
23412342234323442345
23462347234823492350
2351235223532354235523562357235323592360
23612362236323642365
23662367236823692370
23712372237323742375
237623772.37823792380
23812382238323842385
23862387238823892390
2391239223932394
KKRSSVSESQ
KKRSSVSESQ
KKRSSVSESQKKRSSVSESQ
KKRSSVSESQ
KKRSSVSESQ
KKRSSVSESQ
KKRSSVSESQ
KKRSSVSESQ
KKRSSVSESQ
KKRSSVSE
WSAA011
,00.0*
WSAA021
.00.0.
WSAA031
.00.0,
WSAA041
.00,0*
WSAA051
,00*0.
WSAA061
.00.0.
WSAA071
.00*0,
WSAA081
.00,0,
WSAA091
.00,0,
WSAA101
,00.0.
W3AA111
.00,
ARCHAMBEAULTELEV 0*0
40.84 82,001 , 2*0. 142*
ARCHAMBEAULTELEV 0.040,84 82,00
1 , 2 »0, 142,
ARCHAMBEAULTELEV 0,0
40,84 82.001 , 2 ,0, 142,
ARCHAMBEAULTELEV 0,0
40.84 82.001, 2.0, 142.
ARCHAMBEAULTELEV 0,0
40.84 82.001. 2,0, 142,
ARCHAMBEAULTELEV 0,040,84 82,00
1. 2.0. 142.
ARCHAMBEAULTELEV 0.0
40.84 82.001 . 2 ,0, 142.
ARCHAMBEAULTELEV 0,040,84 82,00
1 , 2 ,0, 142,
ARCHAMBEAULTELEV 0,0
40,84 82,001 , 2 ,0, 142,
ARCHAMBEAULTELEV 0,0
40.84 82.001, 2,0, 142,
ARCHAMBEAULTELEV 0 . 0
40.84 82,001 , 2 ,
123.53.
614.
123.53.
614.
123.53.
614.
123.53 .
614.
123.53.
614,
123,53,
614.
123,53,
614.
123.53.
614.
123.53.
614.
123.53,
614,
123,53,
165,34,
1869,
165,34,
1869,
165.34.
1869,
165.34.
1869,
1 65 , 34,
1869,
165,34,
1869,
165,34,
1869.
165.34.
1869.
165.34.
1869.
165.34.
1869.
1 65 . 34.
207 . 55 .
3626.
207,55.
3626,
207,5t:r *J *
3626,
207 , 55,
3626,
207,55 ,
3626.
207,55.
3626.
207 . 55.
3626.
207 . 55,
3626.
207.5o .
3626.
207.55 .
3626.
207.55 .
85

LINE
2395
2396239723982399240024012402240324042405
24062407240824092410
24112412241324142415
24162417241824192420
24212422242324242425
24262427242.824292430
24312432243324342435
24362437243824392440
244124422443244424452446244724482449
TABLE 2, -
i n , 1
SQ
KKRSSVBESQKKRS8VSESQ
KKRSSVSESQ
KKRSSVSESQ
KKRSSVSESQ
KKRSSVSESQ
KKRSSVSESQ
KKRSSVSESQ
KKRSSVSESQ
KKRSSVSESQKKRSSVSE
0,
WSAA121
,00,0.
WSAA131
,00*0.
WSAA141
.00.0*
WSAA151
.00.0.
WSAA161
.00,0*
WSAA171
.00,0.
WSAA181
,00.0.
WSAA191
,00,0,
WSAA201
.00,0.
WSAA211
,00,0.
WSAA22.1.
,00.
HYDROLOOIC ENGINEERING CENTER-1 INPUT FOR WILLOW CREEK STUDY <CQNT*>
0. 142*
ARCHAMBEAULTELEV 0 , 040*84 82,00
1 . 2 .0, 142*
ARCHAMBEAULTELEV 0.0
40*84 82,001 , 2 ,0* 142,
ARCHAMBEAULTELEV 0*040*84 82*00
.1. » 2 *0, 142*
ARCHAMBEAULTELEV 0*0
40,84 82*001* 2,0. 142*
ARCHAMBEAULTELEV 0.040*84 82*00
1* 2*0, 142*
ARCHAMBEAULTELEV 0 * 0
40,84 82*001* 2*0, 142*
ARCHAMBEAULTELEV 0,0
40,84 82,001* 2*0, 142,
ARCHAMBEAULTELEV 0*0
40*84 82,001* 2,0, 142,
ARCHAMBEAULTELEV 0*040*84 82*00
1, 2*0* 142*
ARCHAMBEAULTELEV 0*0
40; 84 82*001 » 2 »0* 142,
ARCHAMBEAULTELEV 0*040.84 82.00
1. 2*
614*
123*53.
614,
123*53*
614*
123.53.
614.
123,53*
614,
123*53*
614,
123*53*
614*
123*53*
614*
123,53*
614.
123*53*
614,
123*53*
614*
123,53.
1869.
.165.34.
1869*
165.34,
1869,
165.34*
1869*
165,34,
1869,
165.34,
1869,
165,34,
1869*
165,34,
1869.
165,34,
1869*
165,34*
1869*
165,34.
1869*
165,34*
3626,
207*55,
3626*
207,55 «
3626*
207*55.
3626 *
207*55*
3626.
207,55.
3626,
207,55 ,
3626,
207,55,
3626*
207*55,
3626*
207.55.
3626 .
J07.5b *
3626*
207*55 «
10
86

LINE
2450
24512452245324542455
24562457245824592460
24612462246324642465
24662467246824692470
24712472247324742475
24762477247824792480
24812482248324842485
2486248724882489249024912492249324942495
24962497249824992500
250125022503
TABLE 2t~
T I'l ,-...-- 1
SQ
KKRSSVSESQ
KKRSSVSESQ
KKRSSVSESQ
KKRSSVSESQ
KKRSSVSESQ
KKRSSVSESQ
KKRSSVSESQ
KKRSSVSESQKKRSSVSESQ
KKRSSVSESQ
KKRS8V
0.
UISAA231
,00.0*
WSAA241
.00,0.
WSAA251
.00*0*
WSAA261
,00.0,
WSAA271
,00.0,
UISAA281
.00*0.
UISAA291
,00.0.
WSAA301
.00,0.
UISAA311
,00*0*
UISAA321
,00*0.
WSAA331
,0
HYDROLOGIC ENGINEERING CENTER-1 INPUT FOR WILLOW CREEK STUDY (CONT.)
, , , , , , , r> »,,,,,, 3 ,,--- - A . . . . . . . i::; ....... A . . . . . . . 7 . . . . . . . Q ...... . ' > . . . . .
0, 142*
ARCHAMBEAULTELEV 0,0
40.84 32.001 . 2,0. 142.
ARCHAMBEAULTELEV 0,0
40.84 82,001. 2.0. 142,
ARCHAMBEAULTELEV 0 . 0
40,84 82,001, 2,0, 142,
ARCHAMBEAULTELEV 0,0
40,84 82,001 » 2,0, 142,
ARCHAMBEAULTELEV 0,0
40,84 82,001, 2.0, 142,
ARCHAMBEAULTELEV 0,040,84 82,00
1, 2,0, 142,
ARCHAMBEAULTELEV 0,0
40,84 82,001 , 2 ,0, 142,
ARCHAMBEAULTELEV 0,040,84 82,00
1 , 2 ,0, 142,
ARCHAMBEAULTELEV 0,0
40,84 82,001 , 2 ,0, 142.
ARCHAMBEAULTELEV 0,040.84 82,00
1, 2,0, 142,
ARCHAMBEAULTELEV 0,0
40,84 82,00
6 1 4 ,
123,53,
614,
123,53,
6 1 4 .
123 , S3.
6 1 4 .
123,53.
614,
123,53*
614,
123,53,
614,
123,53,
614,
123.53,
614,
123,53,
614,
123,53,
614,
123,5
1869.
165,34,
1869.
165.34,
1869,
165,34,
1869,
165,34,
1869,
1 65 , 34,
1869,
165,34,
1869,
165,34,
1869,
165.34.
1869,
165,34,
1869.
165,34,
1869,
165,3
3626 *
207,55 ,
3626.
207,55 ,
3626,
207,5b *
3626,
207 . 55,
3626,
207,55,
3626,
207,55,
3626,
207,55 ,
3626,
207,55,
3626,
207,5'::> ,
3626.
207.55,
3626.
207,5
10
87

LINE-
25042505
25062507250825092510
25112512251325142515
25162517251825192520
25212522
2523252425252526
25272528
252925302531253225332534253525362537
2538253925402541
TABLE 2,--~
J D ....... 1 ,
SESQ
KKRSSVSESQ
KKRS8VSESQ
KKRSRCRXRY
KKHC
KKBALSUD
KKHC
KKRSRCRXRYKKBALSUD
KKKOHC22
0.0.
WSAA341
*00.0,
USAA351
,00,0,
30 C2
,060,09,7
30C?
083027.3
015*7
30C2
30C2
,060,0
15,6084018,8
015,7
1002i
HYDROLOGIC ENGINEERING CENTER-- 1 INPUT FOR WILLOW CREEK STUDY (CONT.)
..,,.,. 2 ,,,,,,, 3 ,,,,,,, 4 ,,,,,., 5 ,,,,,,, 6 ,,,,,,, 7 ,,,,,,, 8 ..,,,,, 9 *.«*«.
1, 2, 3, 4, 5,0, 142, 614, 1869, 3626,
ARCHAMBEAULTELEV 0 , 040,84 82,00 123,5 165,3 207,5
1, 2, 3. 4, 5,0, 142, 614, 1869, 3626.
ARCHAMBEAULTELEV 0 , 0
40,84 82,00 123,5 165.3 207,51 , 2 , 3 , 4 , 5 ,0, 142, 614, 1869, 3626,
ROUTE TO COMBINE POINT 30FLOW -1,04 ,06 19670, ,0075
100, 200, 210, 234, 268, 368. 468,7.7 5,7 0.0 0,9 5,5 7,5 9,5
COMBINE WITH OTHER ROUTED FLOWS AT 30
SUB-BASIN 0830
85,
COMBINE WITH FLOW AT POINT 30
ROUTE TO USGS GAGEFLOW -1,04 ,06 53610, .0034
100, 200, 230, 270, 320, 400, 600,13.6 11.6 1.3 0.0 1.2 11.2 15.2
SUB--BASIN 0840
85,
COMBINE WITH ROUTED FLOW AT USGS GAGE2
10

Table 3. Waterspreader characteristics
Waterspreader name
Archambeault
Beaverette
Bomber
Brazil Divide
Burnett
Cactus Flat
Dog Creek
Inverness
Lone Tree Dikes
Private 1
Private 2
Private 3
Triple Crossing 1
Triple Crossing 2
Number of dikes
35
16
24
20
17
16
21
7
12
14
15
7
12
12
Total storage volume
(acre-feet)
7,260
640
286
465
5,120
416
2,020
761
556
436
386
158
3,360
3,250
tj. U.S. GOVERNMENT PRINTING OFFICE:1987- 791-962/60025 89