Embed Size (px)
Citation preview

COMSATS’ Series of Publications on Science and Technology
Water Resources in the South:Present Scenario and Future
Prospects
November 2003
COMSATS
Commission on Science and Technology forSustainable Development in the South
COMSATS Headquarters4th floor, Shahrah-e-Jamhuriat, Sector G-5/2, Islamabad, Pakistan
E-mail: [email protected], Website: www.comsats.org.pkPh: (+92-51) 9214515, (+92-51) 9204892 Fax: (+92-51) 9216539
3

PREFACE
In order to deliberate upon the issues related to water resources, COMSATS organized atwo-day meeting at its Headquarters on the 1st and 2nd November, 2001. The meeting,which was attended by eminent experts, scientists, researchers and engineers fromCOMSATS’ member countries, focused on various crucial issues related to water-resources, and thought-provoking contributions were made during the course of themeeting.
The meeting had five technical sessions, and these sessions had a thematic sequence oftopics, which included the areas of drought-preparedness and management, hydrologicalmodeling, seawater pollution, ground-water salinity, recycling through bio-filters. In addition,various strategies for efficient management and sustainability of water-resources werediscussed, and recommendations were made for potential implementation of thesestrategies.
This book is a selected compilation of the technical papers presented at the meeting. It isexpected to be the first in a series of COMSATS’ publications that we hope to bring out inthe area of water-resources. This series may prove to be the right beginning in thestreamlining of efforts aimed at solving water-related issues in our member countries.The references in the various articles of this book have been arranged in two systems:Numeric and Harvard Referencing Method.
I would like to thank Dr. Ishfaq Ahmad for his continued guidance and support to COMSATSover the years. He was instrumental in initiating activities related to water-resources atCOMSATS, and his valuable suggestions enabled us to arrange this meeting. Our gratitudeis also due to the speakers, participants and other individuals who made this meeting asuccess. Special credit is due to the team at COMSATS, who worked wholeheartedly inorganizing this meeting and in making it a success. In this regard, special appreciationand accolades are due to Dr. M. M. Qurashi, the editor of this publication, whoseunparalleled interest and direction make this a significant book vis-à-vis the importanceof the subject. Last, but certainly not the least important, is the acknowledgement that isdue to Mr. Salman Malik and Mr. Irfan Hayee for their valuable efforts and untiringcontribution to the compilation and editing of this document.
i
Table of Contents
Contents Page #
Management of Water-Resources in South Asia 01Muhammad HanifWater-Resources Situation in Pakistan: Challenges and Future Strategies 21M.A. Kahlown and Abdul MajeedEfficient and Sustainable Irrigation-Management in Pakistan 41Illahi B. ShaikhOptimal Utilization of Water-Resources at Mangla Reservoir 51Qamar-uz-Zaman ChaudhryStrategic Sustainable Development of Groundwater in Thar Desert of Pakistan 57Nayyer Alam ZaighamMathematical Modeling of the Upper-Indus Glaciers 75Khalid RashidThe Climate and Flood-Risk Potential of Northern Areas of Pakistan 87Shaukat Ali AwanDrought-Mitigation Interventions by Improved Water-Management 101(A Case Study from Punjab - Pakistan)Asrar-ul-HaqAssessment of Water-Quality 111Iqbal H. QureshiEvaluation of Water-Quality by Chlorophyll and Dissolved Oxygen 123Zahid Latif, M.A.Tasneem, T. Javed, S. Butt, M. Fazil, M. Ali and M.I. SajjadSalinity of Groundwater in Coastal Aquifer of Karachi, Pakistan 137A. Mashiatullah, R.M. Qureshi, N.A. Qureshi, E. Ahmad,M.A. Tasneem, M.I. Sajjad, H.A. KhanStudies of Seawater Pollution on the Pakistan Coast Using Stable Carbon- 155Isotope TechniqueRiffat M. Qureshi, A. Mashiatullah, M.I. Sajjad, M. Fazil, E. Ahmad and H.A. KhanUse of Brackish Water for Agriculture: Growth of Salt-Tolerant Plants and 163their Effects on Soil-PropertiesJaved Akhter, Shafeeq Ahmed and Kauser A. Malik

2
Some Interesting Aspects of Water, with Special Reference to Nuclear 179DesalinationInam-ur-RahmanAlleviating Water-Problems: Marrying Old and New Ideas 191Q. Isa Daudpota
INDEX- Subject Index 196- Author Index 199
Management of Water-Resources in South Asia
Muhammad Hanif
1
ABSTRACT
The South Asian Region consists of Pakistan, India, Nepal, Bhutan, Bangladesh, Sri Lankaand Maldives. The region has a high-altitude mountain terrain, sub–mountaineous tracts,large flood-plains with a network of rivers and streams, deserts and large coastal areas.The South Asian Region has three distinct rainfall systems. Most of the rainfall is in summer(80%) and is brought by southwestern monsoon system. In winter, the rainfall is broughtabout by northeastern monsoon in Bangladesh / adjoining areas, and by western weather-system in Pakistan and other parts of the region. The winter rains are a very importantsource of water-supply for crops, as the water-scarcity peaks during this period.
Indus, Ganges and their tributaries mainly cover the sub continent. There are widefluctuations in the river-flows during the year. The supplies peak up generally in themonsoon and during snowmelts (July- September) and the flows largely recede in the dryseason, particularly in winter. A huge irrigation network , the world’s largest, has beenbuilt on the rivers in the region. A water reservoir capacity of 248 MAF has been built in theregion for a sustained production of crops. In addition, these reservoirs have provided animportant opportunity in hydel power generation, fishing and ground-water recharge ofthe adjoining areas.
Groundwater is an important source of water supply. Large parts of the South Asian Regionhave a sweet-water aquifer. In all countries of the region, subsurface water is pumpedthrough shallow wells or deep tubewells/ turbines, mainly for agricultural purposes. Thetotal withdrawals of water from surface and subsurface are estimated at 772 MAF. About90 % of the water-supplies in the region are used for agriculture and the remaining forhouseholds, industry and other purposes. Canals irrigation is mostly in the public sectorand wells/tubewells are generally in the private sector.
The population of South Asia is 1.30 billion. The cropped area of the region is 204.8million ha. Rice is the single predominant crop of the region, occupying 22.6% of thecropped area, followed by wheat in 14% area. Other important crops grown in the regionare coarse grains, grown on 12.1% of area, pulses 10.5%, cotton 4.5%, oilseeds 4.5%,beans 3.8% and sugarcane 2.0%. The plantations such as tea, coconut and rubber,although having high commercial value, are grown on considerably smaller area.
About 40% of cropped area in this region is irrigated and 60% is dependent upon rains.Water requirements for the 8 important crop (grown on 74% of area) have been workedout at 1166 million-acre feet (MAF). Rice is the single largest irrigated crop (more than90% irrigated) consuming 63 % of the water among these crops. In some countries, it is
MANAGEMENT OF WATER-RESOURCES INSOUTH ASIA
2
Management of Water-Resources in South Asia
almost the only irrigated crop. Wheat is the second largest crop grown, both under rainfedand irrigated conditions. Water requirements have been estimated as: wheat 10%, coarsegrains 7%, pulses 6% and sugarcane 6%. The water requirement for these five cropsmakes up 92% of the water requirements.
Prolonged dry weather, many a times, results in droughts in the region. The impact ofdrought is generally of universal nature, affecting vast areas in a country or the wholeregion. There were acute shortages of water in drought-hit areas. The crops were damagedand the pastures dried up; even drinkable water became a problem. Excessive mining ofwater in some areas lowered the water-table to dangerously low levels. There was massivehuman and livestock migration from these areas. The damage to the livestock-sector wascolossal. It is proposed that the regional countries should put in place a system thatforecasts droughts, assesses damages and provides relief-assistance to minimize thehardships of life. Some countries of the region have already started putting piped water-supplies and building communication-networks in these areas. The regional countriesshould take short and long-term measures to mitigate the affects of drought.
The reservoirs are useful, but there are growing concerns on building reservoirs in thecountries of the region. These concerns are both national and international in character.There is a growing feeling that the reservoirs result in displacement of people/farmingcommunities, create environmental problems and, many a times, lead to politicization ofthe issues. High initial capital-investment is another issue. Most of the reservoirs havewatershed-management programs in the catchment areas. However, sometimes thecatchment is in adjoining countries, which makes it impracticable to launch watershedprograms. Once the reservoirs are built, the rapid sedimentation is a big issue and callsfor appropriate policy and action plans.
Governments of the region need to make policies for conservation of water-resourcesthat optimize use-efficiency. The countries of the region, in general, have agencies thathave already done useful work in water-resources development, through construction ofa network of water-structures such as reservoirs, dams, barrages, canals, link canals,lakes and ponds. The water-distribution systems have been geared to match water-requirements during the critical growth-stages of crops. De-silting of canals and minorsand renovation of water-courses for improving water-delivery efficiency have been carriedout in various parts of the region.
At farm level, programs have been undertaken to improve water-use efficiency, throughprecision land-leveling of uneven fields., sowing of crops on ridges and beds, use ofpressurized irrigation-system for orchards, vegetables, floriculture and other high-valuedcrops. The cropping patterns are being adapted to minimize water-indents. All these worksneed to be furthered. Some countries of the region need to have a second look at theirheavy dependence on mono-crop system of growing rice — a water-thirsty crop.
3
The statistics on subsurface water and from glacier melts, many a times, are inadequateor faulty and the countries of the region need to improve it for planning purposes.
Most of the rivers and creeks in their upper reaches have good-quality water. As waterflows down-stream, the industrial and urban effluents load this water with heavy metals,injurious chemicals and biological pollutants. Cases of ill health, through pollution ofdrinkable water, have been reported in Pakistan and other countries. Iron and nitratepollution has been noticed in Sri Lanka. The salinization of subsurface water, throughintrusion of seawater, has been reported in India, Pakistan, Maldives and Sri Lanka in thecoastal areas. This is an area that needs attention of the Governments in the region, inthe context of appropriate legislation and implementation of sound environmental policies.
Over the last two decades, there is a growing participation of the farming communities inwater resource development, distribution and on-farm water-management programs, inthe countries of the region. Water-users’ associations have been organized and activelyinvolved in the planning and development programs of water-sector in agriculture. Thesefarmers’ organizations can be further involved in transforming agricultural/rural scenarios.
The studies carried out in countries of the region indicate that large O & M costs are beingincurred on irrigation networks by maintaining them in public sector. At least part of thisexpenditure can be minimized through participation of farmers in maintenance of thesecanals. The subsidies on irrigation lead to an inefficient water-use. The Governments canhave a second look on this issue.
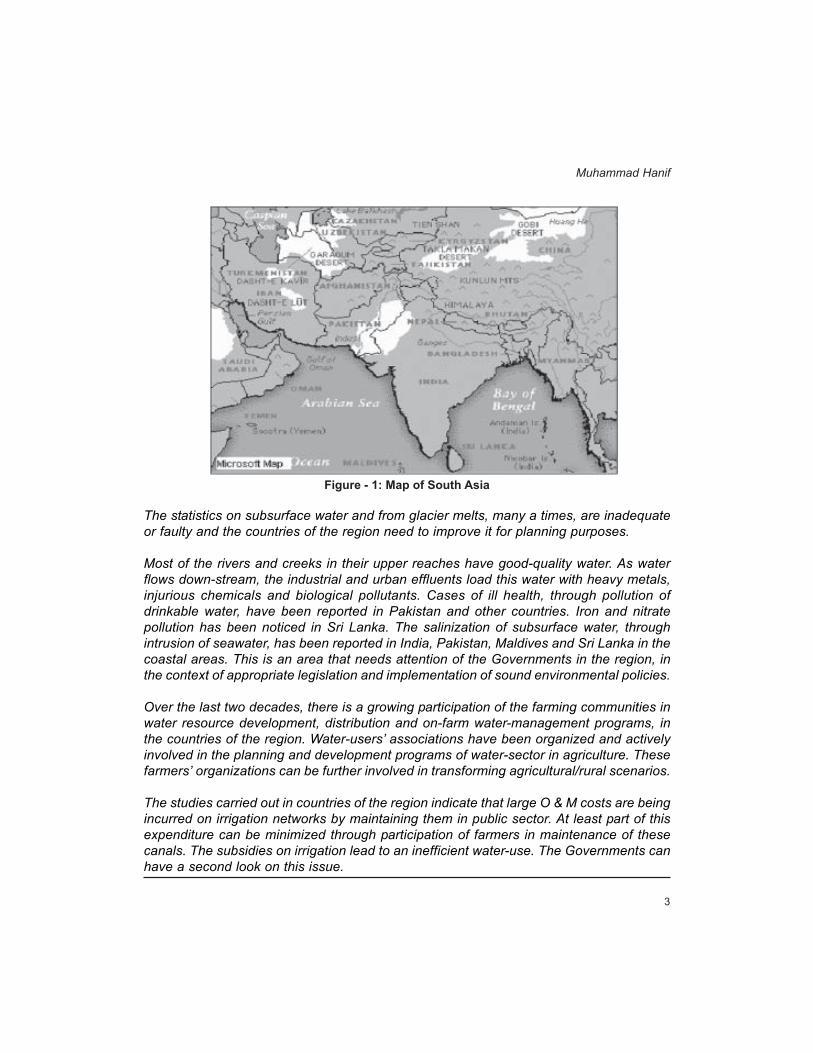
Figure - 1: Map of South Asia
Muhammad Hanif
4
Management of Water-Resources in South Asia
INTRODUCTION
South Asian Region consists of Pakistan, India, Nepal, Bhutan, Bangladesh, Sri Lankaand Maldives. The map of the region is given in Figure-1. The region has high- altitudemountain terrains, sub–mountainous tracts, large flood-plains, with a network of riversand streams, deserts and large coastal areas. The famous Indus and Gangetic civilizationsthrived and prospered in this region.
Agriculture has been the main pursuit in the region since human civilization began. Landand water have been the primary resources for this activity since primeval times. Initially,the human settlements were built near the water-bodies, like rivers and lakes. Humanbeings learnt from experience that water is a basic input in raising crops. Agriculturecontinued to be mainly carried out under rain-fed conditions. Irrigated agriculture startedmuch later.
As primary structures, wells and karezes (sub-surface irrigation ditches) are known tohave been built in various parts of the world, including South Asia. These Structureshelped an assured production of crops and also helped to raise farm-productivity. Withexpansion in human population, the land and water-resources came under pressure. Thedisasters, like drought, disease, insect hazards (locust and others), resulted in cropdamages, many a times leading to famines. In addition, the process of degradation ofland and water-resources, through salinization, water-logging, industrial effluents and otherenvironmental hazards, is an on-going process and is a major threat to agriculture. Thereis a need for a judicious management of these scarce resources.
A number of efforts were initiated in the South Asian region, particularly during the lastmillennium, for the proper management/use of land and water-resources. This becomesmore demanding at a time when large fertile tracts of agricultural land are falling victim torapid industrialization, urbanization and other non-farm uses. Similarly, management ofwater-resources is of prime importance for fostering activities of agriculture sector oncommercial lines.
SOUTH ASIAN SCENARIO
Population
The population of the world in 1998 was 5.98 billion, Asia 3.63 billion and South Asia 1.30billion. The population of South Asia was 21.7 % of the world population and 36.0 % ofAsian population. The data is as in Table-1.1.
The world has a population of 43% engaged in agricultural discipline. However, Asianinvolvement in agriculture is 53% and South Asia 56%; Bhutan and Nepal have more than

5
90% of their population in agriculture sector. The Maldives, on the other side has lessthan the South Asian %age population engaged in agriculture sector.
Land
The cropped area of the world is about 1512 million ha. The cropped area in Asia is 557.6million ha and South Asian cropped area is 204.8 million ha. This makes 12.6 % of theworld-cropped area and 36.7 of the Asian cropped area. The cropped area in South Asiais 40% irrigated (82.6 million ha) and 60 % rainfed (122.2 million ha). The per-head cropped
Category Total Agricultural % in Agriculture
World 5,978.40 2,575.50 43.08 Asia 3,634.30 1,956.50 53.83 South Asia 1,309.40 735.70 56.18 Bangladesh 126.90 72.00 56.74 Bhutan 2.10 1.90 90.48 India 998.10 553.20 55.43 Maldives 0.3 0.08 26.67 Nepal 23.4 21.8 93.16 Pakistan 140.0 78.0 55.71 Sri Lanka 18.6 8.7 46.77
Source: FAO Production Year Book, 1999
Table - 1.1: Population (million)
Muhammad Hanif
Category Land Area Cultivated Area Irrigated Area Per-head Cropped area
Unit (000) Ha (000) Ha (000) Ha Ha World 13,048,407 1,511,964 271,432 0.25 Asia 3,085,414 557,633 191,171 0.15 South Asia 412,917 204,810 82,631 0.16 Bangladesh 13,017 8,774 3,844 0.07 Bhutan 4,700 160 1 0.08 India 297,319 169,500 59,000 0.17 Maldives 30 3 - 0.01 Nepal 14,300 2,968 1,135 0.13 Pakistan 77,088 22,050 18,000 0.16 Sri Lanka 6,463 1,888 651 0.1 Source: FAO Production Year Book, 1999.
Table - 1.2: Area Profile of South Asian Countries
6
Country Wheat Rice Coarse grains
Cotton Sugar cane
Pulses Oil seeds
Beans Total
Bangladesh 0.85 10.50 0.00 0.00 0.17 0.67 0.50 0.00 12.69 India 27.40 44.80 29.40 9.00 4.15 25.30 10.50 9.90 160.45 Nepal 0.64 1.52 1.10 0.00 0.00 0.30 0.00 0.04 3.60 Pakistan 8.30 2.40 1.80 3.00 1.10 1.71 0.90 0.25 19.46 Sri Lanka 0.00 0.82 0.00 0.00 0.00 0.05 0.00 0.03 0.90 Total 37.19 60.04 32.30 12.00 5.42 28.03 11.90 10.22 197.10
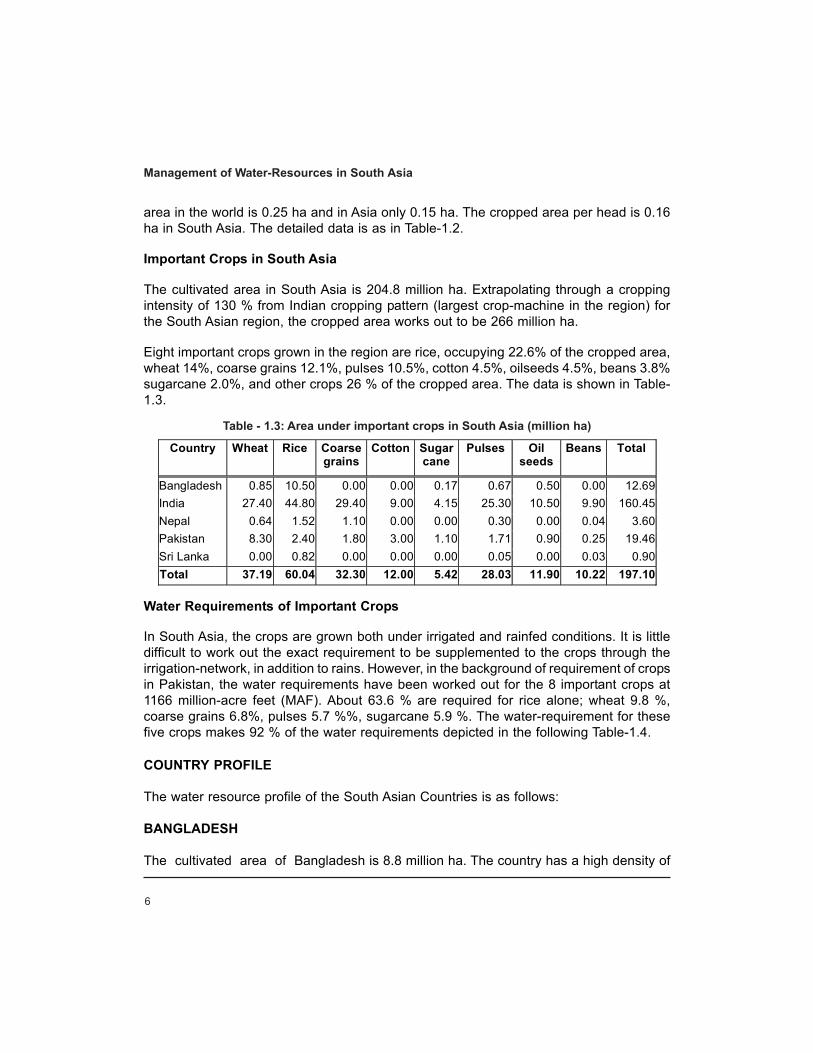
Table - 1.3: Area under important crops in South Asia (million ha)
Management of Water-Resources in South Asia
area in the world is 0.25 ha and in Asia only 0.15 ha. The cropped area per head is 0.16ha in South Asia. The detailed data is as in Table-1.2.
Important Crops in South Asia
The cultivated area in South Asia is 204.8 million ha. Extrapolating through a croppingintensity of 130 % from Indian cropping pattern (largest crop-machine in the region) forthe South Asian region, the cropped area works out to be 266 million ha.
Eight important crops grown in the region are rice, occupying 22.6% of the cropped area,wheat 14%, coarse grains 12.1%, pulses 10.5%, cotton 4.5%, oilseeds 4.5%, beans 3.8%sugarcane 2.0%, and other crops 26 % of the cropped area. The data is shown in Table-1.3.
Water Requirements of Important Crops
In South Asia, the crops are grown both under irrigated and rainfed conditions. It is littledifficult to work out the exact requirement to be supplemented to the crops through theirrigation-network, in addition to rains. However, in the background of requirement of cropsin Pakistan, the water requirements have been worked out for the 8 important crops at1166 million-acre feet (MAF). About 63.6 % are required for rice alone; wheat 9.8 %,coarse grains 6.8%, pulses 5.7 %%, sugarcane 5.9 %. The water-requirement for thesefive crops makes 92 % of the water requirements depicted in the following Table-1.4.
COUNTRY PROFILE
The water resource profile of the South Asian Countries is as follows:
BANGLADESH
The cultivated area of Bangladesh is 8.8 million ha. The country has a high density of

7
population of 834 inhabitants per km2. The average holding per farm household in 1983was 0.9 ha. Nearly 24 per cent of farm households own less than 0.2 ha and another 46per cent own up to 1.0 ha. Agriculture is mainly carried out under conventional subsistence-farming practices. Rice is the main crop, occupying an area of 10.5 million ha, whichmakes 90 % of the area under cereal crops. Other important crops grown in the countryare pulses, oilseeds, jute and sugar cane. Recently a plan has been prepared to introduceand expand cotton-production in the country to meet domestic requirements and to sustainthe exports of garments and other textile made ups.
Bangladesh has a tropical monsoon climate. About 80 per cent of the total rainfall occursin the monsoon and the average annual rainfall over the country is 2320 mm. Being adeltaic country, cyclone cause heavy damage to the agricultural economy and structures.Floods, cyclones and droughts are a common feature of the climate pattern in Bangladesh.There are wide annual variations in rainfall and temperature throughout the country.
Ganges, Brahmaputra and Meghna, and their tributaries cover the flood plains ofBangladesh. The total dam capacity is 17.3 MAF. In addition, there are three barragesacross the Teesta, Tangon and Manu rivers that are used as diversion structures forirrigation purposes only. In 1990, the total water withdrawal for agricultural, domestic andindustrial purposes was estimated at about 12.4 MAF. ,of which agriculture makes 86%,the domestic industrial sectors make 14%. The requirement of navigation and fisheries isestimated at 8.5 MAF. Approximately 73 per cent of the total water-withdrawal comesfrom groundwater.
Muhammad Hanif
Crops Area Water Requirements Total % Share
Unit Million ha Acre inches* MAF Wheat 37.19 15 114.9 9.8 Rice 60.04 60 741.8 63.6 Coarse grains 32.3 12 79.8 6.8 Cotton 12.00 16 39.5 3.4 Sugarcane 5.42 60 67.0 5.7 Pulses 28.03 10 69.3 5.9 Oilseeds 11.90 12 29.4 2.5 Beans 10.22 12 25.3 2.2 Total 197.1 29 1166.9 100
* By Pakistan standard
Table - 1.4: Water Requirements of Important Crops

8
Management of Water-Resources in South Asia
In Bangladesh, irrigation through major canals covers only 6 per cent of the total irrigatedarea, the remaining being classed as minor irrigation consisting of low lift pumps, shallowtube-wells, deep tube-wells. Government’s main emphasis in Bangladesh is the expansionof small-scale irrigation.
At present, irrigation is practiced for rice (71 per cent) and wheat (9 per cent), whichtogether occupy 80 per cent of the irrigated land. Irrigation is mainly used in the dry season.
Because of its low-lying topography, about 22 per cent of the area of the country areflooded each year. Flood control and drainage are used to reduce the depth of flooding oreliminate, through ‘controlled flooding’ high and untimely floods in order to provide greatersecurity for crop production.
Water-management and flood-protection occupy a pivotal position in the planning processof Bangladesh. The major emphasis in Bangladesh is on the following issues:
• Improving use efficiency of existing facilities with an effective O&M;• De-Silting of rivers and channels;• Integrated flood control / drainage;• Participation of water-users in the planning and design of new irrigation/drainage
projects.
BHUTAN
Bhutan is a Himalayan country with a rugged mountain terrain. Climate ranges from hotand humid subtropical conditions in the south to the incessant ice and snow in Himalayas.
The only dam in the country is the Chukka hydropower dam. Most rivers are deeply incisedinto the landscape, a fact that greatly limits the possibilities for run-of-the-river irrigation.The total water-withdrawal was estimated at 16.2 thousand-acre feet in 1987.
The cultivated area in Bhutan is 160 thousand ha. Out of this, about 1 thousand ha areirrigated and rest is dependent upon rains. The irrigated area is mostly under rice crop.
The irrigation-management strategy mainly focuses on:
• Sustainable improvements in water-delivery and use-efficiency;• Diversifying the range of irrigation from mono-cropped rice system to multi-crop system;• Increasing the role of water-users and the private sector, and to reduce recurrent
government investments in irrigation schemes.

9
INDIA
The total cultivable area of India is estimated at 169.5 million ha, or about 57 per cent ofthe land area. The cropping intensity is 130 per cent. The major cereals grown in India arewheat, rice, and coarse grains. Ninety one per cent of the farmers have land holdings lessthan 4 ha. The average farm size is estimated at 1.57 ha.
The rainfall in India is brought about by the monsoon system and western disturbances.The average rainfall is 1170 mm. There are places, which get world’s highest rainfall of12,500 mm. On the other extreme, there are places like Rajasthan, Gujarat, Saurashtraand Kutch, which get less than 150-mm rainfall. Most of these areas have undergoneextensive drought conditions, with massive human and livestock migration. This calledfor an intervention from the Government to address the drudgeries of masses in theseareas. Temperature variations are also marked.
The major sources of water in India are rainfall and the glacier melts. The total surfaceflow, including groundwater is 1570 MAF. Out of this 587 MAF are utilized. The total water-storage capacity constructed up to 1996 was of the order of 212 MAF. In 1990, the totalwater-withdrawal was estimated at 425 MAF, of which 92 per cent was for irrigationpurposes.
India has the largest irrigated area of the world, size of the irrigated area is 59 million ha.Irrigation is mainly concentrated in the north of the country, along the Indus and Gangesrivers.
Uttar Pradesh (22 per cent of the irrigated area), Rajasthan (9 per cent) Madhya Pradesh(9 per cent) and Punjab (8 per cent) Liberal subsidies on electricity and its abundantsupplies has helped to foster both production and productivity of crops. This situation hasresulted in huge inefficient use of water at the farm.
The average overall water-use efficiency in canal irrigation systems is estimated at 40 percent. Water-rates are uniform throughout the state in Andhra Pradesh, Gujarat, Kerala,Madhya Pradesh and West Bengal. However, in Bihar, Haryana, Maharashtra, Punjab,Rajasthan, Tamil Nadu, Tripura and Uttar Pradesh, the rates vary within the state fromregion to region or project to project.
The water-rates are higher for storage-systems than for flow-diversion schemes. Similarly,the rates for canal-lift irrigation are generally higher (double) than flow-irrigation whenwater lifting is undertaken by the Government bodies. The development of sprinkler anddrip-irrigation is likely not to pick up in various states of India particularly in view of free orsubsidized electric tariff. However, India is providing subsidy to promote drip irrigation.
Muhammad Hanif
10
Management of Water-Resources in South Asia
A number of Indian states in recent years are cutting down or partially withdrawing subsidies.This is likely to promote the efficient use of pressurized irrigation systems. However sinceIndia does not have compulsion from the donor-agencies, it may take considerable timebefore the efficient use of water accelerates. The area under drip-irrigation is mainlyconcentrated in Maharashtra, Andhra Pradesh and Karnataka. The drip-irrigation is mainlyfollowed on high-value horticultural crops/orchards.
Drainage works have been undertaken on about 5.8 million ha, which is 12 per cent of theirrigated area. In addition, 3.1 million ha are affected by salinity and about 0.24 million haby alkalinity. These figures however seem gross under estimates.
Indian irrigation is dominated by the public sector. The O&M of most schemes requirepublic sector involvement. India adopted a national water-policy in 1987 for the planningand development of water-resources. It emphasizes the need for river basin planning.Water allocation priority has been given to drinking water, followed by irrigation, hydropower,navigation and industrial or other uses in the order. All the states are required to developtheir state water-policy within the framework of the national water-policy and, accordingly,set up a master plan for water-resources development.
All rivers in their upper reaches have good quality of water. Like elsewhere, the deteriorationin quality of water starts downstream through domestic, industrial and agricultural pollutants.These pollutants also affect groundwater. The mining of groundwater in drought-hit stateshas resulted in lowering of water-table in large number of Indian States to very low levels.This is mainly because of the conditions of non-recharging of water in current droughtconditions that forced a large number of the farming communities to migrate from water-starving areas to water sanctuaries. Indian policy of providing heavy subsidy on electrictariff has also been responsible for this situation.
MALDIVES
The total cultivated area of Maldives is estimated at 3000 ha. Permanent crops as coconutand aeronaut are grown on an area of 2000 ha and annual field-crops as maize, sorghum,cassava, onion and chilies are grown on an area of 1000 ha.
The islands have a tropical climate with two monsoons, which are:
• The southwest monsoon from May to September;• The northeast monsoon from November to March.
The precipitation is uniformly distributed between April - December. The January – Marchis a dry period. The mean annual rainfall is 1883 mm. The islands do not have any rivers.Rainwater is collected through water-harvesting on a small scale and used for drinking

11
purposes. Maldives finds it extremely difficult to obtain suitable drinkable water. Threedesalination plants are in operation, with a total production of 1000 m³/d.
NEPAL
Nepal is a land locked Himalayan State located entirely in the Ganges basin. The cultivablearea of Nepal is estimated at 2.96 million ha. One third of this area is in the Terai plain, 8per cent in the Siwalik, 48 per cent in the mountain and hill region and 10 per cent in thehigh Himalayas. Agriculture contributed 40 per cent of GDP in 1996 and employed morethan 93 per cent of the economically active population of the country. The main agriculturalexports are rice, pulses and jute.
The mean annual rainfall is 1500 mm. There are two rainy seasons in Nepal: one in thesummer (June to September) when the southwest monsoon brings more than 75 per centof the total rainfall, and the other in winter (December to February) accounting for lessthan 25 per cent of the total. The summer monsoon-rain first falls in the southeast of thecountry and gradually moves westwards with diminishing intensity. This results in morerainfall in the east of the country. During winter, rainfall is brought about by westerlydisturbances.
All rivers in Nepal drain into the Ganges River. The country is divided into five river basins,which are from west to east. The seasonal distribution of flow is extremely variable. Theflows in rivers, both from rains and snow-melt greatly recede during January – Marchperiod. This situation improves during July – August period as snowmelt and rainfall picksup.
The surface-water resources produced internally are estimated at 168 MAF water. Thegroundwater-resources have not been fully assessed. The Terai and some parts of theSiwalik valley have sweet-water aquifers. A rough estimate is made by assuming agroundwater-resource equivalent to ten per cent of surface-water, i.e. approximately 17MAF. This makes Nepal one of the Asian countries with the highest level of water-resourcesper inhabitant.
The total dam-capacity of Nepal is 69 thousand-acre feet. This is a small fraction of thepotential dam-capacity of 117 MAF. The irrigated area in Nepal is 1.14 million ha. Irrigationis mainly done by flooding. Ninety one per cent area is dependent on surface-water and 9per cent on groundwater. The Department of Irrigation is responsible for the managementof the irrigation programs. The main irrigated crop is paddy in summer, followed by wheatcrop in winter.
Muhammad Hanif
12
Management of Water-Resources in South Asia
PAKISTAN
Rainfall activity over Pakistan occurs mainly in two distinct periods, namely summer (Juneto September, the monsoon season) and winter (December to March). More rains fallduring the monsoon season than during the winter season.
The annual flow of water in the Indus River system, on an average, is 140 MAF. The flowduring summer is 118 MAF (84%) and in winter is 22 MAF (16). Indus is the Main Rivercontributing 65% of water supplies, with Jhelum giving 17% and Chenab 19%. In the lightof Indus-Basin Water-Treaty, Pakistan has built a series of link canals to divert water fromthe western rivers, to provide water to the Southern Punjab. Pakistan has built a reservoircapacity of 18 MAF water to cater for the needs during periods of scarcity, mainly wintercrops. About 4 MAF capacity has already been reduced through sedimentation. The alluvialplains of Pakistan have a sweet-water aquifer of 50 MAF. Out of this, 40 MAF is beingexploited through 600,000 tubewells mainly in private sector. The availability of water inKharif is 77 MAF and Rabi 56 MAF, making total water supplies at 133 MAF.
Under On-Farm Water-Management Program, 45 thousand watercourses have beenimproved, out of a total of 120 thousand watercourses. A follow-up program, pursuant toimprovement of watercourses to improve water-use efficiency was carried out at farmer’sfields. Technologies are disseminated to Farmers on laser-leveling of fields, sowing ofcrops on beds and furrows, zero tillage, inter-cultural practices and balanced applicationof fertilizers. This helps to raise the productivity of crops and living standards of the farmingcommunity. The pressurized irrigation system e.g. sprinkler and trickle irrigation system,were introduced for high-value crops viz. orchard and vegetables. This system is particularlygood for areas with an uneven topography, particularly in rainfed areas. The initialinvestment is very high/prohibitive and poor farming-communities, especially in droughthit Balochistan and other places, cannot afford such a high capital investment. Anotherproblem with the pressurized irrigation system is that most of the materials are imported.Local initiatives have been taken recently, which are of infinitesimal nature. There is aneed for inducting the private-sector in this area, assuring competitive and cost-effectivesupplies of the pressurized-irrigation materials to the interested farmers.
Rod Kohis are hilly valleys, where hill-torrents move at a rapid pace and result in soilerosion and damage to standing crops. Primarily, the structures in these areas are built toslow down the speed of the torrents. Research is underway to investigate practices andpackage of technology to minimize the farm-losses to soil and crops.
As water-resources are under high pressure, the Ministry of Food and Agriculture is in theprocess of promoting cropping pattern/production practices that minimize the requirementsof irrigation-water, without compromise on farm-productivity/profitability.
13
A flow of 10 MAF is required to maintain ecology in the deltaic region and to avoid intrusionof sea water. There was not much water available for the purpose during the droughtencountered over the last three years. As a result, the seawater intruded, causing damageto farmlands.
SRI LANKA
Sri Lanka receives rainfall mainly through two monsoons. The rainfall-intensity variesmarkedly across the island. Based on rainfall, several agro-climatic regions (wet zone,intermediate zone, dry zone and arid zone) can be recognized. There is considerablevariation around the mean annual rainfall of 2000 mm. The highest rainfalls are in thecentral highlands.
Groundwater resources have been extensively used. Sri Lanka’s largest aquifer extendsover 200 km in the northwestern and northern coastal areas. There are about 15000tube-wells in the country. The quality of the groundwater is generally fairly good andrelatively constant throughout the year. However, in some parts of the country (northernand northwestern coastal areas) excessive concentrations of iron and nitrates (due toagro-chemicals and fertilizers) have been reported. Furthermore, due to uncontrolledextraction of groundwater for domestic and agricultural uses, intrusion of brackish waterhas occurred in the coastal areas.
Groundwater is an important source of water for irrigation and domestic use. It isincreasingly used as drinking water, especially in small towns and rural areas. The totalwater-demand is estimated to be 9.3 MAF. Of this, 90 per cent is for agriculture, 7 per centfor domestic purposes and 3 per cent for industrial purposes.
The total cultivated area of Sri Lanka is 1.9 million ha. Out of this 0.7 million ha areirrigated and rest is dependent upon rains. Of this cultivated area, 1 million ha are underpermanent crops such as tea, rubber and coconut. Annual crops viz. paddy, sugar cane,maize, green gram, green chilies and cowpeas, are grown on 0.9 million ha.The irrigationsystems in Sri Lanka are designed mainly for paddy (0.8 million ha) cultivation. Otherirrigated crops are chilies (15000 ha), sweet potato, banana and green gram.
In Sri Lanka, irrigation-schemes can be classed as minor, medium or major, dependingon the area they serve. Minor schemes provide facilities for less than 80 ha. In 1995, theyserved about 200 000 ha. Medium schemes provide facilities for areas of 80-400 ha. In1995, they served 61 000 ha. Major schemes provide facilities for more than 400 ha. In1995, they served 309 000 ha.
Muhammad Hanif

14
Management of Water-Resources in South Asia
Storage schemes have two purposes: storage and flood control. Water is impounded inthese tanks by building dams across valleys, and then released when required to servicedownstream areas.
Diversion weirs, commonly called anicuts, are constructed in perennial streams in the wetzone, to convey water to the fields below. In the wet zone, flood-control and drainageschemes have been incorporated into the irrigation-system mainly in the lower reaches ofrivers. In the coastal areas, saltwater exclusion schemes have been commissioned wherewater salinity affects the agriculture. Flood bunds and pumps are the main features inflood-protection schemes, whereas gated regulators are adopted in saltwater-exclusionschemes.
Lift-irrigation schemes, with mechanically or electrically operated pumps, have beenintroduced recently to irrigate the highlands. It is estimated that around 1000 ha are irrigatedby groundwater-wells.
In 1980, an attempt was made to establish a water-tax. However, this attempt failed becauseof the political unrest in the 1980s. Irrigation development, O&M and rehabilitation havebeen predominantly state activities. The participation of water-users has been adopted inirrigation schemes in recent years. A Water Resources Council has been established inSri Lanka, to oversee the implementation of the action-plan of water management.
ISSUES AND OPPORTUNITIES FOR SOUTH ASIA
Climate
The climate is the biggest factor affecting availability of water. The South Asian Regionhas two distinct rainfall systems. In summer, the southwestern system brings rainfall tothis region. In winter, Bangladesh and adjoining areas of India get rainfall from the NorthEastern monsoon system. Pakistan and other parts of the region get rainfall from thewestern weather system. La-Nina (dry spell) and El-Nino (wet spell) are the two distinctphenomena that effect the availability of water extraordinarily. The details are as follows:
a. La-Nina: This is a situation of low or no rainfall resulting in drought. The South AsianRegion suffered from this phenomenon during last 3-4 years resulted in a drought in theregion, severely affecting the economy of the countries in the region.
The effects of drought are of universal nature, affecting vast areas in a country or theregion. There were areas in the region, particularly in arid and semi-arid climate, wherethere was acute shortage of water. In these areas, the crops were damaged. The pasturesdried up. Even drinking water became a problem. There was massive human and livestock

15
migration. The damage to the livestock was substantial. A large number of crops, especiallyin rainfed area were damaged, affecting the GDP. The farmers’ incomes were also affectedand the ambit of poverty widened.
The farmers in these areas, where feasible, pumped excessive quantities of water fromthe sub-surface, disturbing the ecosystem. This lowered the water-table depth todangerously low levels, as there was no recharging system available to recoup the aquifer.This chain of events led to a vicious cycle of poverty. The countries of the region aremassively involved in mitigating the effects of drought from the destitute and povertystricken masses in the affected areas. The following short and long-term measures areproposed for drought hit areas:
Short-Term Measures
• The Governments should assess the extent of damage/likely damage and declareaffected areas as calamity-hit, to cope with the extra-ordinary situation.
• The Governments should provide a relief package, providing food for the humanbeing and feed/fodders for the animals.
• Vaccination programs may be carried out for livestock.• The elite animals of good breeds of livestock may be taken to sanctuaries, to avoid
the risk of loss of such breeds.• Governments may provide credit-line, to enable the farmers to buy seeds, fertilizers,
bullocks, farm machinery and farming inputs.
Long-Term Measures
• Governments should undertake to build up water-supply schemes in the desert/affected areas, through arranging pipeline supplies in remote water-deficit areas.
• Build up a network of roads, to facilitate the movement of goods and relief supplies inthe drought-stricken areas.
• The scientists should come up with a package of crop-production practices andtechnologies that are low water-requiring, particularly crop-varieties that have lessthirst for water.
b. El-Nino: This is a situation of high rainfall, often resulting in floods. The effects of floodsare localized in nature and show a corridor effect, around the inundating creeks andrivers. The coverage of floods is not of the same large dimension as in droughts. Thefloods are quite common in the countries of the region and damage standing crops,households, farms, irrigation structures and communication links. The opportunities for asolution to this type of situation are proposed as follows:
Muhammad Hanif

16
Management of Water-Resources in South Asia
• On short-term basis, the Governments may provide relief to the affectees and takeother appropriate measures, as reported earlier.
• On long-term basis, the Governments should plan for mitigating the effects of floods,through building of structures and reserviors to pond the water overflowing from thebanks of rivers and creeks. Sri Lanka has successfully diverted floods through buildingsuch structures.
River System
The region has a network of rivers and streams in almost all the countries. The rainfalland the snowmelt from the glaciers are the two sources of water-supply in these rivers.
There is a wide fluctuation in the river-flows during wet and dry seasons of the year. Thesupplies peak up generally in monsoon and during snowmelts (July- September) whilethe flows recede in dry season, particularly in winter. This situation calls for a judiciousmanagement of water-resources for raising crops during periods of scarcity, particularlywinter crops. The rivers need to be tamed through construction of control-structures andwater-reserviors to offset the shortages in times of scarcity.
Water-Reservoirs
To tame the rivers, there is a necessity to build up water-reservoirs on the river systems.A large number of such reservoirs have already been built in various countries of theregion, with a reservoir capacity of 248 MAF. These reservoirs are useful for a regularsupply of water during periods of scarcity, for sustained production of crops.
In addition, these reservoirs have provided an important opportunity in hydel-powergeneration, fishing and a ground-water recharge of the adjoining areas. The situation hashelped to raise farm-incomes and eradicate poverty.
The region has a huge potential for building additional storage-capacity. However, thereare inter-country conflicts on building of these reservoirs. Even within countries, many atimes, there are problems in construction of these reservoirs. There is a growing feelingthat the reservoirs result in displacement of people/farming community, createenvironmental problems and, some times, lead to politicization of the issues. High initialcapital investment is another issue. Most of the reservoirs have watershed-managementprograms in the catchment areas. However, sometimes the catchment is in adjoiningcountries, which makes it impracticable to launch watershed programs. Once the reserviorsare built, the rapid sedimentation is a big issue and calls for appropriate policy and actionplans.

17
Groundwater
The groundwater involves aspects of quantum and quality of subsurface water for humanuse and agricultural purposes. The South Asian Region has a good sweet-water aquifer.In addition, it has a large brackish subsurface-water profile.
Almost in all countries of the region, the supplementation of canal-water irrigation throughsubsurface water supplies is quite common. This water is pumped through shallow wellsor deep tubewells or turbines for industrial, potable and agricultural purposes. A largenumber of these irrigation-programs are in both public and private sector. Some countriesof the region have already handed over the public-sector tubewells to the benefiting water-users.
Recharging of the subsurface water-aquifer is highly important to keep the pumping ofwater continued from this subsurface layer. However, the countries of the region in someareas have suffered in water-recharging programs on the following accounts:
a. Drought affected the rainfall and water-balance.b. Subsidies in some countries on electric tariff and irrigation-equipment promoted in
efficient use. There is a need to minimize/withdraw these subsidies, to optimize water-use efficiency and to ensure that (inefficient) mining of water does not continue.
Water recharging is important for the countries of the region, especially in the arid andsemi-arid areas where water depth has been lowered substantially, in much case to 40-50 feet deep. In some places, the farmers have been mining fossilized water from depthsof 800-1000 feet. This water has been used to grow crops which unfortunately did notfetch good prices in some years, inflicting huge losses to the farm economy. This is aclassical case of onion-production in Balochistan, Pakistan. Such situations are quitecommon in other countries of the South Asian Region. Governments of the region need tomake policies for conservation of water-resources that optimize use efficiency.
Institutional Development
There is a need to assure that proper institutions are in place to carry out the variousactivities concerning water-resource development, distribution and on farm watermanagement.
a. Water-Resources Development
The countries of the region in general, has already established, agencies that havecomplete water-mapping of surface-water available in various parts of their country. Theseagencies have already done useful work in water-resources development, through
Muhammad Hanif

18
Management of Water-Resources in South Asia
construction of a network of water-structures, such as reservoirs, dams, barrages, canals,link canals, lakes and ponds. These agencies in the regional countries, in many caseshave information on potential sites to meet a century’s requirements of building water-reservoirs.
The estimation of subsurface water and water-supplies from glacier-melts, however, havenot been adequately quantified in some countries and this need to be carried out forbetter planning and utilization of water resources. The responsible institutions fordevelopment of resources need to be strengthened through providing financial andtechnical backstopping.
b. Water Distribution-System
A number of the countries of the region have established a scientific water-distributionsystem to meet requirements of water for crops. The drought over the last 3-4 years hasgiven very good learning experiences on judicious water-use system. The Agriculturaland Irrigation Departments were able to develop schedules for water-distribution system,depending upon crop-needs. This has helped to mitigate the ill affects of water-supplies,without much effect on productivity of crops. One classical example is the wheat crop of21 million tons in Pakistan during 1999-2000 and 19 million tons in 2000-01, despite awater shortage of 40% during the early period of wheat crop and 60-70% during earringand grain formation stages. At the beginning of the wheat-crop season, Pakistan IrrigationDepartment, in consultation with Agricultural Departments, was able to rotate the water-supply in canals. In spring 2001, when shortages further worsened, the canal-supply wasrestricted to areas that had subsurface brackish water, so that farming/ rural communitiesmay get drinking water. The strategy has helped Pakistan. Despite a very bad year, Pakistanhas sufficient stocks of wheat for domestic consumption. It has already exported 0.7 milliontons of wheat and has in pipeline, a supply of additional one million tons of wheat forexport. This is a lesson repeated in some other countries of the region also that a judiciousmanagement of water-resources can help to avert disasters in agricultural sector,particularly crops.
c. Water Conservation
The Governments should aim at conserving the soil and water-resources to maximize theefficiency of use.
Water Delivery-System
The studies carried out by various institutions in Pakistan show that the water-losses indelivery from canal to watercourse outlets are about 40 % on an average. An equal amountof water is lost in the century-old watercourses. There is a need to minimize these lossesin water-delivery through:
19
• Desilting of canals and minors.• Renovation of water-courses, through brick lining and earthing improvement.
Pakistan and other countries of the region that are conscious of this situation have alreadylaunched on-farm water management programs, in the context of their farming situations.The countries of the region need to take up crash water-management programmes, so asto quickly renovate water-delivery system, to improve efficiency of delivery.
On Farm Programs
A large number of fields are so uneven that the result is unequal distribution of waterapplied, patchy germination and poor crop-stands. There is a need for improving water-use efficiency at the farm, to maximize productivity of crops. The following programmesare being followed in Pakistan and some other countries of the region, to optimize waterat the farm:
• Precision leveling of land, in uneven fields.• Sowing of crops on ridges and beds.• Use of pressurized-irrigation systems for orchards, vegetables, floriculture and other
high-valued crops.
Some countries of the region have used subsidies to promote use of drip and trickle-irrigation systems. This generally leads to more efficient utilization of the scarce farm-resources.
Cropping Patterns
South Asia mainly grows crops with high water-requirements such as rice and sugarcane.Out of a total cultivated area of 204.8 million ha area under crops in South Asia, 60.04million ha are under rice crop alone. This far exceeds the area under any other crop.Some countries have almost one irrigated crop, rice. Another high water-requiring crop issugarcane that covers 5.42 million ha in the region.
As drought is a frequent visitor to this region, it is advisable that regional agriculturalinstitutions may focus on promoting cropping-patterns that minimize water-use foragricultural purpose. In Pakistan, the crop-substitution program includes persuadingfarmers not to grow rice in cotton zone. Similarly, the sowing of sugarbeet is being promotedto replace high water-requiring sugarcane.
Scientists in Pakistan are now focussing on reducing the sowing time of cotton from 150days to 120 days. The curtailment in growing period will help to save one irrigation. Thescientists also need to focus on other crops and should try to replace long period cultivarswith short duration cultivars.
Muhammad Hanif
20
Water Pollution
Most of the rivers and creeks in their upper reaches have good-quality water. As waterflows downstream, the industrial and urban effluents load this water with heavy metals,injurious chemicals and biological pollutants. The quality of ground-water is alsodeteriorating rapidly. Cases of ill effects of such industrial effluents have been reported inPakistan and other countries of the region. In Sri Lanka, the pollution with iron and nitrateshas been reported. The salinization of subsurface water, through intrusion of seawater,has been reported in some countries of the region in coastal areas. This is an area, thatneeds the attention of the Governments in the region, in the context of appropriatelegislation and implementation of sound environmental policies.
Participation of the Farming Communities
Over the last two decades, in the countries of the region, there is a growing involvementof the farming communities in water-resource development, distribution and on-farm-watermanagement programs. Water users’ associations have been organized and are activelyinvolved in the planning and development programs of the water-sector in agriculture.These farmer organizations can be further involved in transformation of agricultural ruralscenarios.
Pricing of Water
The studies carried out in countries of the region indicate that large O & M costs are beingincurred on irrigation-networks by maintaining them in public sector. At least part of thisexpenditure can be minimized through participation of farmers in maintenance of thesecanals. The studies carried out by IWMI in Pakistan and other countries of the regionindicate a successful experiment. It has been demonstrated that farmers can maintaincanals and water-distribution systems, quite efficiently. This can be followed up further.The rebate on electric tariff and installation of tube-wells generally leads to their inefficientuse. All such concessions and subsidies need to be withdrawn, for conservation of water-resources and their efficient utilization.
ACKNOWLEDGEMENT
The data and materials in this write up were taken from Pakistan’s Ministry of Food,Agriculture and Livestock and Food and Agricultural Organization of the United Nations,which is gratefully acknowledged.
Management of Water-Resources in South Asia
Water-Resources Situation inPakistan: Challenges and
Future StrategiesM.A. Kahlown and Abdul Majeed
21
ABSTRACT
Pakistan, once a water-surplus country, is now a water-deficit country. The rainfall is neithersufficient, nor regular, to meet the growing needs of water. About 70 per cent of the annualrainfall occurs in the months of July to September. The surface water resources of Pakistanmainly consist of flows of the Indus River and its tributaries, which bring in about 138million acre feet (MAF) of water annually. The Indus River alone provides 65% of the totalriver flows, while the share of Jhelum and Chenab is 17 and 19%, respectively. The monthsof peak-flow are June to August during the monsoon season. The flow during the Kharif(Summer) is 84% and during Rabi (Winter) season is 16%. The alluvial plains of Pakistanare blessed with extensive unconfined aquifer, with a potential of over 50 MAF, which isbeing exploited to an extent of about 38 MAF by over 562,000 private and 10,000 publictubewells. In Balochistan (outside the Indus Basin), out of a total available potential ofabout 0.9 MAF of groundwater, over 0.5 MAF are already being utilized, thereby leaving abalance of about 0.4 MAF that can still be utilized, though some aquifers are already overexploited. The Indus River System, as such, will not be able to continue self-reliance inagricultural production. Due to enormous amounts of sediments brought in by the feedingrivers, the three major reservoirs – Tarbela, Mangla and Chashma – will lose their storagecapacity, by 25% by the end of the year 2010, which will further aggravate the water-availability situation.
This article takes stock of the present situation of water-resources, present needs andfuture requirements and the challenges imposed, and suggests short, medium, and long-term strategies to cope with the situation.
The suggested short-term strategies include starting a mass-awareness campaign,propagation of high-efficiency irrigation systems, changes in cropping-patterns,identification of feasible surface-water storage sites and dams, and activation of water-user organizations. The medium-term strategies suggest giving priority to lining ofdistributaries, minors and watercourses in saline groundwater areas, construction of smalldams and installation of tubewells in technically feasible areas, improving flood and drought-forecasting methods, and a much wider application of conjunctive water-use approachand propagation of high-efficiency irrigation systems. Institutional reforms for better co-ordination and a wider formulation of a national water-policy are other priority areas underthe medium-term strategic plan. Long-term strategies include formulation of a regulatoryframework on groundwater abstraction, construction of large storage dams, better floodand drought-forecasting mechanisms and resolving water-distribution problems betweenprovinces. It is recommended that a National Commission on Water, supported by an
WATER-RESOURCES SITUATION IN PAKISTAN:CHALLENGES AND FUTURE STRATEGIES

22
experts panel, be created to steer the formulation of the strategies and ensure theimplementation of the strategies proposed.
INTRODUCTION
Water is essential for sustaining quality of life on earth. This finite commodity has a directbearing on almost all sectors of economy. In Pakistan, its importance is more than ordinarydue to the agrarian nature of the economy. The share of agricultural sector in the GrossDomestic Product (GDP) of Pakistan is about 24%. Agriculture is the major user of water,and sustainability of agriculture depends on the timely and adequate availability of water.The increasing pressures of population and industrialisation have already placed greaterdemands on water, with an ever-increasing number and intensity of local and regionalconflicts over its availability and use. Historically, the high aridity-index of the country isadding further to the significance of water in developmental activities in Pakistan.
Though, once, a water-surplus country with huge water-resources of the Indus RiverSystem, Pakistan is now a water-deficit country. At present, the annual per-capita water-availability in Pakistan is about 1,100 cubic meter (m3); below 1,000 m3, countries beginexperiencing chronic water stress (Population Action International, 1993). Table-1 givesthe comparison of per-capita water-availability upto the year 2025 in some selectedcountries of the World, including Pakistan.
The situation in Pakistan indicates that the country is nearing conditions of chronic water-stress. Meanwhile, the gap between demand and supply of water has increased to levelscreating unrest among the federating units. The extended drought during recent yearsreduced fresh-water supplies of the country, which has highlighted the importance ofdevelopment of new sources and adopting water-conservation measures for extremelyjudicious use of the finite quantity of water.
COUNTRY 1955 1990 2025 China 4,597 2,427 1,818 Mexico 11,396 4,226 2,597
Philippines 13,507 5,173 3,072 Iraq 18,441 6,029 2,356
USA 14,934 9,913 7,695 Pakistan 2,490 1,672 837 Source: Population Action International, 1993
Table - 1: Per Capita Water-Availability in Selected Countries (m3)
Water-Resources Situation in Pakistan: Challenges and Future Strategies

23
WATER-RESOURCES
Figure-1 is a map of Pakistan showing the river system with dams and barrages and theirrigated areas.
The water-resources of Pakistan include surface water, rainfall, and groundwater. Theextent of availability of these resources is location-specific. A brief description of water-resources of Pakistan is given in the following sections.
Surface Water-Resources
Surface water-resources of Pakistan are mainly based on the flows of the Indus River andits tributaries. The Indus River has a total length of 2900 kilometres (Km) and the drainage-area is about 966,000 sq. Km. Five major tributaries joining its eastern side are Jhelum,Chenab, Ravi, Beas and Sutlej; besides, three minor tributaries are the Soan, Harow, andSiran, which drain in mountainous areas. A number of small tributaries also join the Industowards its western side. The biggest of such tributaries is River Kabul.
Rivers in Pakistan have individual flow characteristics, but all of them generally start torise in the spring and early summer, with the monsoon rains and snow melting on themountains and have a combined peak discharge in July and August. The flows are minimumduring winters e.g., during the period November to February, mean monthly flows areonly about one tenth of those in summer. Besides the major rivers, there are numerous
Figure - 1: Indus River System
M.A. Kahlown and Abdul Majeed
24
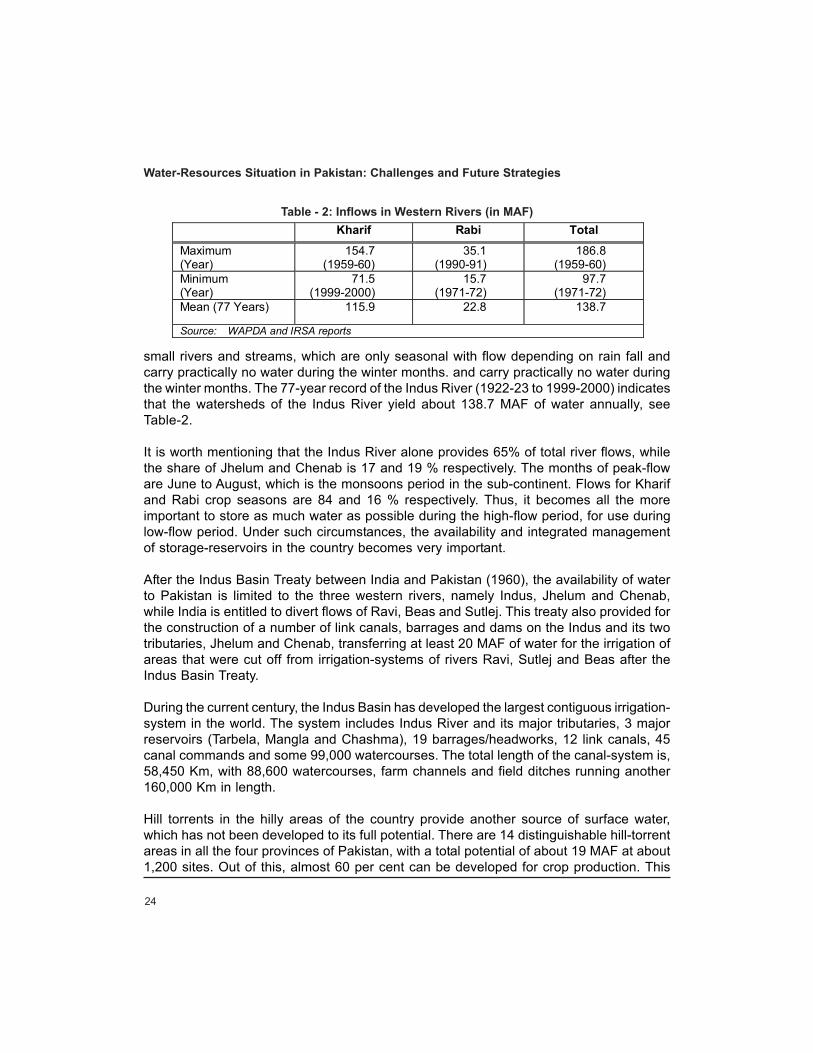
small rivers and streams, which are only seasonal with flow depending on rain fall andcarry practically no water during the winter months. and carry practically no water duringthe winter months. The 77-year record of the Indus River (1922-23 to 1999-2000) indicatesthat the watersheds of the Indus River yield about 138.7 MAF of water annually, seeTable-2.
It is worth mentioning that the Indus River alone provides 65% of total river flows, whilethe share of Jhelum and Chenab is 17 and 19 % respectively. The months of peak-floware June to August, which is the monsoons period in the sub-continent. Flows for Kharifand Rabi crop seasons are 84 and 16 % respectively. Thus, it becomes all the moreimportant to store as much water as possible during the high-flow period, for use duringlow-flow period. Under such circumstances, the availability and integrated managementof storage-reservoirs in the country becomes very important.
After the Indus Basin Treaty between India and Pakistan (1960), the availability of waterto Pakistan is limited to the three western rivers, namely Indus, Jhelum and Chenab,while India is entitled to divert flows of Ravi, Beas and Sutlej. This treaty also provided forthe construction of a number of link canals, barrages and dams on the Indus and its twotributaries, Jhelum and Chenab, transferring at least 20 MAF of water for the irrigation ofareas that were cut off from irrigation-systems of rivers Ravi, Sutlej and Beas after theIndus Basin Treaty.
During the current century, the Indus Basin has developed the largest contiguous irrigation-system in the world. The system includes Indus River and its major tributaries, 3 majorreservoirs (Tarbela, Mangla and Chashma), 19 barrages/headworks, 12 link canals, 45canal commands and some 99,000 watercourses. The total length of the canal-system is,58,450 Km, with 88,600 watercourses, farm channels and field ditches running another160,000 Km in length.
Hill torrents in the hilly areas of the country provide another source of surface water,which has not been developed to its full potential. There are 14 distinguishable hill-torrentareas in all the four provinces of Pakistan, with a total potential of about 19 MAF at about1,200 sites. Out of this, almost 60 per cent can be developed for crop production. This
Kharif Rabi Total
Maximum (Year)
154.7 (1959-60)
35.1 (1990-91)
186.8 (1959-60)
Minimum (Year)
71.5 (1999-2000)
15.7 (1971-72)
97.7 (1971-72)
Mean (77 Years) 115.9 22.8 138.7
Source: WAPDA and IRSA reports
Table - 2: Inflows in Western Rivers (in MAF)
Water-Resources Situation in Pakistan: Challenges and Future Strategies
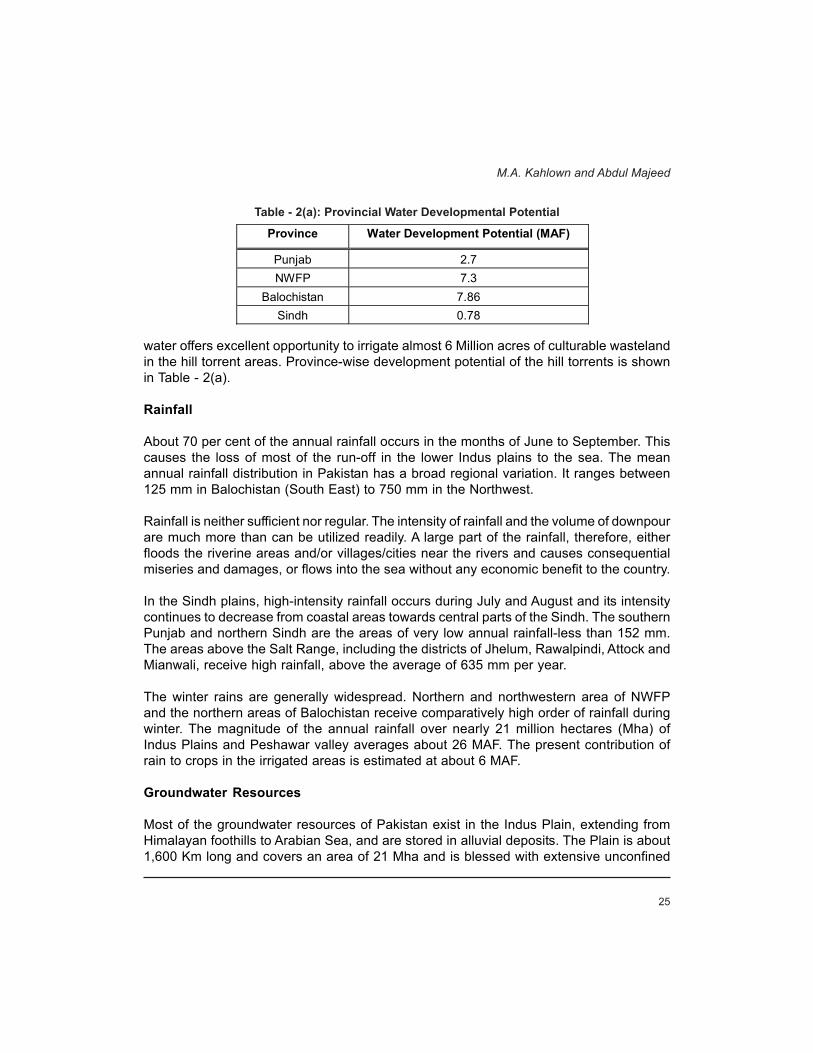
25
water offers excellent opportunity to irrigate almost 6 Million acres of culturable wastelandin the hill torrent areas. Province-wise development potential of the hill torrents is shownin Table - 2(a).
Rainfall
About 70 per cent of the annual rainfall occurs in the months of June to September. Thiscauses the loss of most of the run-off in the lower Indus plains to the sea. The meanannual rainfall distribution in Pakistan has a broad regional variation. It ranges between125 mm in Balochistan (South East) to 750 mm in the Northwest.
Rainfall is neither sufficient nor regular. The intensity of rainfall and the volume of downpourare much more than can be utilized readily. A large part of the rainfall, therefore, eitherfloods the riverine areas and/or villages/cities near the rivers and causes consequentialmiseries and damages, or flows into the sea without any economic benefit to the country.
In the Sindh plains, high-intensity rainfall occurs during July and August and its intensitycontinues to decrease from coastal areas towards central parts of the Sindh. The southernPunjab and northern Sindh are the areas of very low annual rainfall-less than 152 mm.The areas above the Salt Range, including the districts of Jhelum, Rawalpindi, Attock andMianwali, receive high rainfall, above the average of 635 mm per year.
The winter rains are generally widespread. Northern and northwestern area of NWFPand the northern areas of Balochistan receive comparatively high order of rainfall duringwinter. The magnitude of the annual rainfall over nearly 21 million hectares (Mha) ofIndus Plains and Peshawar valley averages about 26 MAF. The present contribution ofrain to crops in the irrigated areas is estimated at about 6 MAF.
Groundwater Resources
Most of the groundwater resources of Pakistan exist in the Indus Plain, extending fromHimalayan foothills to Arabian Sea, and are stored in alluvial deposits. The Plain is about1,600 Km long and covers an area of 21 Mha and is blessed with extensive unconfined
Province Water Development Potential (MAF)
Punjab 2.7 NWFP 7.3
Balochistan 7.86 Sindh 0.78
Table - 2(a): Provincial Water Developmental Potential
M.A. Kahlown and Abdul Majeed
26
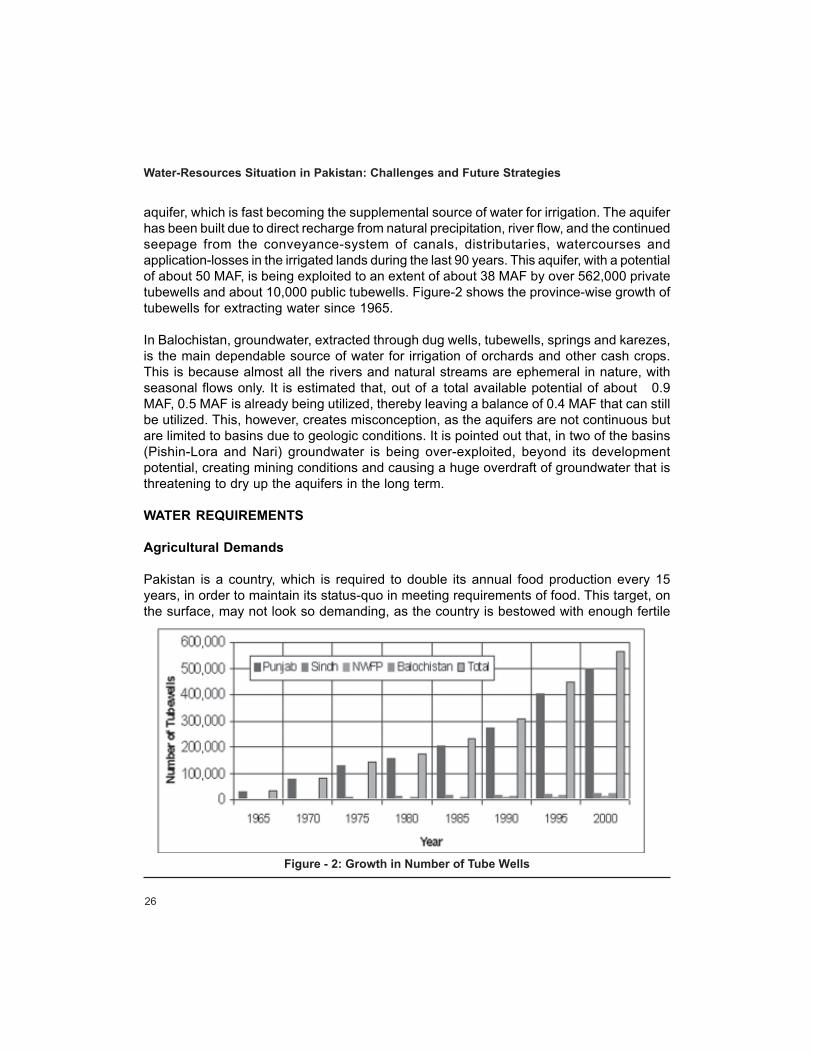
aquifer, which is fast becoming the supplemental source of water for irrigation. The aquiferhas been built due to direct recharge from natural precipitation, river flow, and the continuedseepage from the conveyance-system of canals, distributaries, watercourses andapplication-losses in the irrigated lands during the last 90 years. This aquifer, with a potentialof about 50 MAF, is being exploited to an extent of about 38 MAF by over 562,000 privatetubewells and about 10,000 public tubewells. Figure-2 shows the province-wise growth oftubewells for extracting water since 1965.
In Balochistan, groundwater, extracted through dug wells, tubewells, springs and karezes,is the main dependable source of water for irrigation of orchards and other cash crops.This is because almost all the rivers and natural streams are ephemeral in nature, withseasonal flows only. It is estimated that, out of a total available potential of about 0.9MAF, 0.5 MAF is already being utilized, thereby leaving a balance of 0.4 MAF that can stillbe utilized. This, however, creates misconception, as the aquifers are not continuous butare limited to basins due to geologic conditions. It is pointed out that, in two of the basins(Pishin-Lora and Nari) groundwater is being over-exploited, beyond its developmentpotential, creating mining conditions and causing a huge overdraft of groundwater that isthreatening to dry up the aquifers in the long term.
WATER REQUIREMENTS
Agricultural Demands
Pakistan is a country, which is required to double its annual food production every 15years, in order to maintain its status-quo in meeting requirements of food. This target, onthe surface, may not look so demanding, as the country is bestowed with enough fertile
Figure - 2: Growth in Number of Tube Wells
Water-Resources Situation in Pakistan: Challenges and Future Strategies
27
and productive lands and sufficient freshwater-resources. Despite the availability of thesebasic resources, unfortunately the country has to import large quantities of foodcommodities every year. With the current population of about 140 million people growingat the rate of almost 2.5% per annum, the country would have to feed 120 million additionalmouths by the year 2025. Table-3 shows the production and water-requirements of somemajor crops needed to maintain self-sufficiency in these food grains, which may becompared with Table-2.
Domestic and Industrial Needs
Table - 4 shows the domestic present and future domestic requirements, based on a per-capita demand of 46 m3 per annum. The corresponding industrial water-demand isconsidered negligible when compared with the domestic and agricultural demands.
MAJOR CHALLENGES
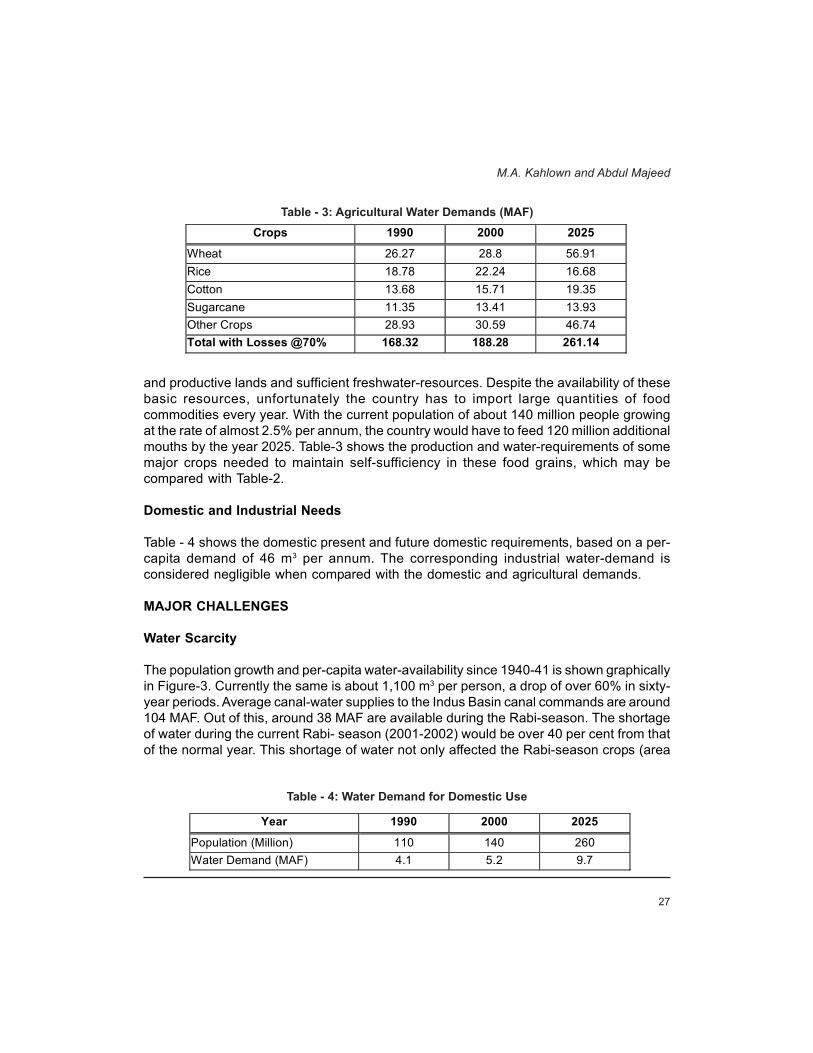
Water Scarcity
The population growth and per-capita water-availability since 1940-41 is shown graphicallyin Figure-3. Currently the same is about 1,100 m3 per person, a drop of over 60% in sixty-year periods. Average canal-water supplies to the Indus Basin canal commands are around104 MAF. Out of this, around 38 MAF are available during the Rabi-season. The shortageof water during the current Rabi- season (2001-2002) would be over 40 per cent from thatof the normal year. This shortage of water not only affected the Rabi-season crops (area
Crops 1990 2000 2025
Wheat 26.27 28.8 56.91 Rice 18.78 22.24 16.68 Cotton 13.68 15.71 19.35 Sugarcane 11.35 13.41 13.93 Other Crops 28.93 30.59 46.74 Total with Losses @70% 168.32 188.28 261.14
Table - 3: Agricultural Water Demands (MAF)
Year 1990 2000 2025
Population (Million) 110 140 260 Water Demand (MAF) 4.1 5.2 9.7
Table - 4: Water Demand for Domestic Use
M.A. Kahlown and Abdul Majeed
28
and productivity) but would also affect the plantation of cotton crop, especially in theSindh province, as the crop is planted much earlier than in Punjab.• The key issues related to water availability include the following:• Annual and seasonal variability in availability of surface water and impact of global
warming• Seawater intrusion due to low flows below Kotri, resulting in ecosystem degradation• Reduction in capacity of storage reservoirs due to sedimentation• Increase in domestic and industrial demands and consequent reduction in supplies
for irrigation• Poor delivery-efficiency in irrigation and municipal water supply systems, and• Deterioration of water-quality due to disposal of untreated urban sewage and/or
agricultural drainage effluent• Depleting groundwater tables, due to over exploitation• Salt-water intrusion, due to up-welling from underlying saline aquifer• Deteriorating performance of public tubewells, resulting in increased pumping costs
Drought
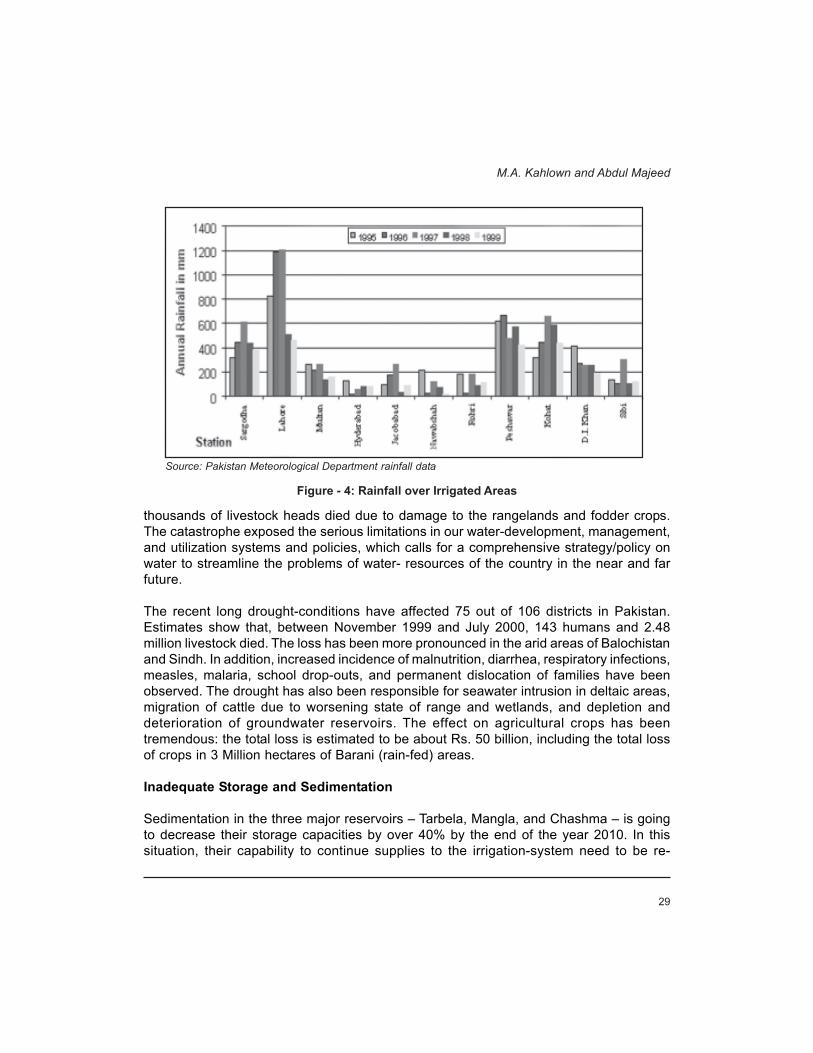
Frequency of occurrence of droughts has increased in recent years. The Droughtphenomenon (dry year) has been observed to occur in 4 out of 10 years, instead of 3 outof 10. The precipitation during the years 1997-2000 has been exceptionally low as in thisperiod the precipitation over most of the country has been less than 50% of the normal,causing severe loss to agricultural production. The rainfalls have been showing a generallydecreasing trend since 1997, which was the peak-year (Figure-4). The effect of thecontinued low rainfalls over most of the country since the last three years has resulted inlow river flows and drought conditions. Not only precious human lives were lost, but also
Figure - 3: Per-Capita Water-Availability
Water-Resources Situation in Pakistan: Challenges and Future Strategies
29
thousands of livestock heads died due to damage to the rangelands and fodder crops.The catastrophe exposed the serious limitations in our water-development, management,and utilization systems and policies, which calls for a comprehensive strategy/policy onwater to streamline the problems of water- resources of the country in the near and farfuture.
The recent long drought-conditions have affected 75 out of 106 districts in Pakistan.Estimates show that, between November 1999 and July 2000, 143 humans and 2.48million livestock died. The loss has been more pronounced in the arid areas of Balochistanand Sindh. In addition, increased incidence of malnutrition, diarrhea, respiratory infections,measles, malaria, school drop-outs, and permanent dislocation of families have beenobserved. The drought has also been responsible for seawater intrusion in deltaic areas,migration of cattle due to worsening state of range and wetlands, and depletion anddeterioration of groundwater reservoirs. The effect on agricultural crops has beentremendous: the total loss is estimated to be about Rs. 50 billion, including the total lossof crops in 3 Million hectares of Barani (rain-fed) areas.
Inadequate Storage and Sedimentation
Sedimentation in the three major reservoirs – Tarbela, Mangla, and Chashma – is goingto decrease their storage capacities by over 40% by the end of the year 2010. In thissituation, their capability to continue supplies to the irrigation-system need to be re-
Figure - 4: Rainfall over Irrigated Areas
Source: Pakistan Meteorological Department rainfall data
M.A. Kahlown and Abdul Majeed
30
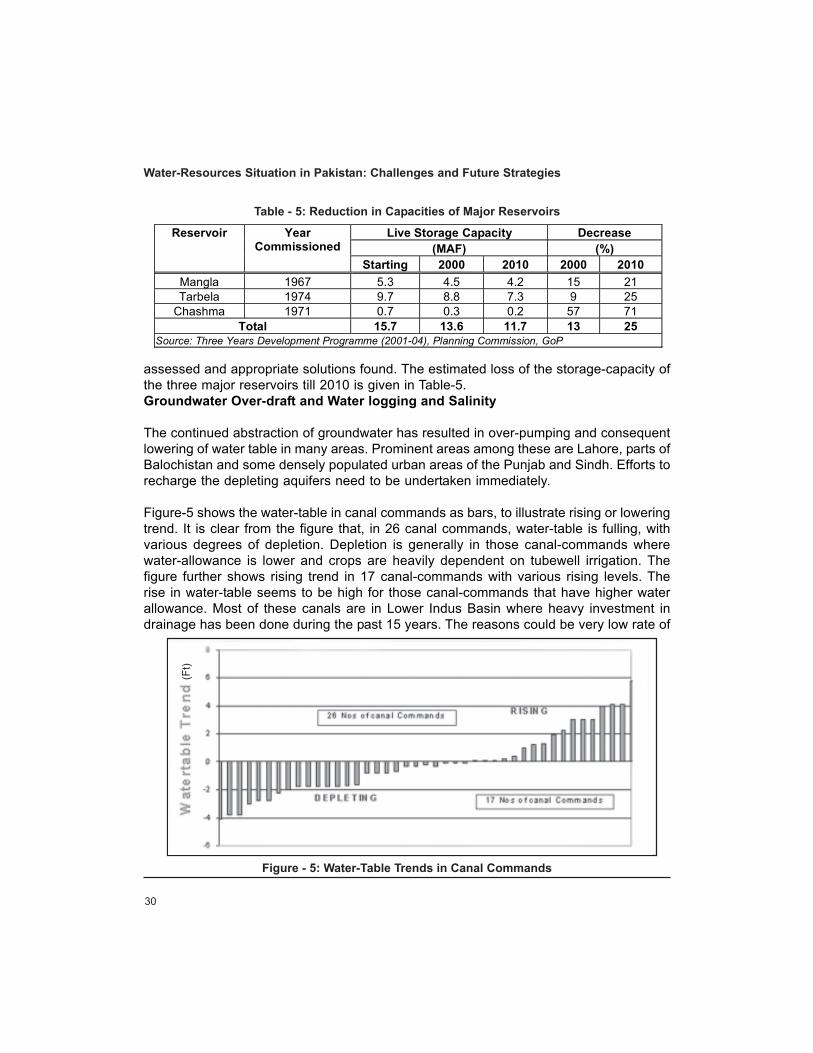
assessed and appropriate solutions found. The estimated loss of the storage-capacity ofthe three major reservoirs till 2010 is given in Table-5.Groundwater Over-draft and Water logging and Salinity
The continued abstraction of groundwater has resulted in over-pumping and consequentlowering of water table in many areas. Prominent areas among these are Lahore, parts ofBalochistan and some densely populated urban areas of the Punjab and Sindh. Efforts torecharge the depleting aquifers need to be undertaken immediately.
Figure-5 shows the water-table in canal commands as bars, to illustrate rising or loweringtrend. It is clear from the figure that, in 26 canal commands, water-table is fulling, withvarious degrees of depletion. Depletion is generally in those canal-commands wherewater-allowance is lower and crops are heavily dependent on tubewell irrigation. Thefigure further shows rising trend in 17 canal-commands with various rising levels. Therise in water-table seems to be high for those canal-commands that have higher waterallowance. Most of these canals are in Lower Indus Basin where heavy investment indrainage has been done during the past 15 years. The reasons could be very low rate of
Live Storage Capacity Decrease (MAF) (%)
Reservoir Year Commissioned
Starting 2000 2010 2000 2010 Mangla 1967 5.3 4.5 4.2 15 21 Tarbela 1974 9.7 8.8 7.3 9 25
Chashma 1971 0.7 0.3 0.2 57 71 Total 15.7 13.6 11.7 13 25
Source: Three Years Development Programme (2001-04), Planning Commission, GoP
Table - 5: Reduction in Capacities of Major Reservoirs
Figure - 5: Water-Table Trends in Canal Commands
Water-Resources Situation in Pakistan: Challenges and Future Strategies(F
t)

31
groundwater-use, floods during the summer nd mis-management of water. However, theoverall picture shows depletion of carelessly used groundwater resources, which wouldbe cared for till it is too late. It also indicates that there is a need to find appropriate water-allowance for canals, which will be required for the sustainability of groundwater. If surfacecanal supplies are not increased, the groundwater will not be available in future.
Waterlogging and salinity in Pakistan emerged as a consequence of the mismanagementof irrigated agriculture, flat topography, seepage from unlined earthen canals, inadequateprovision of drainage and the use of poor-quality drainage-effluent. The menace still persistsand the situation is becoming serious due to the problem of disposal of drainage-effluent.From 1978 to 1998, the area with water-table above 1.5 m ranged from 9.0 to 18.3%, andsimilar variations were observed between 1.5 and 3.0 m and below 3.0 m (Table-6).
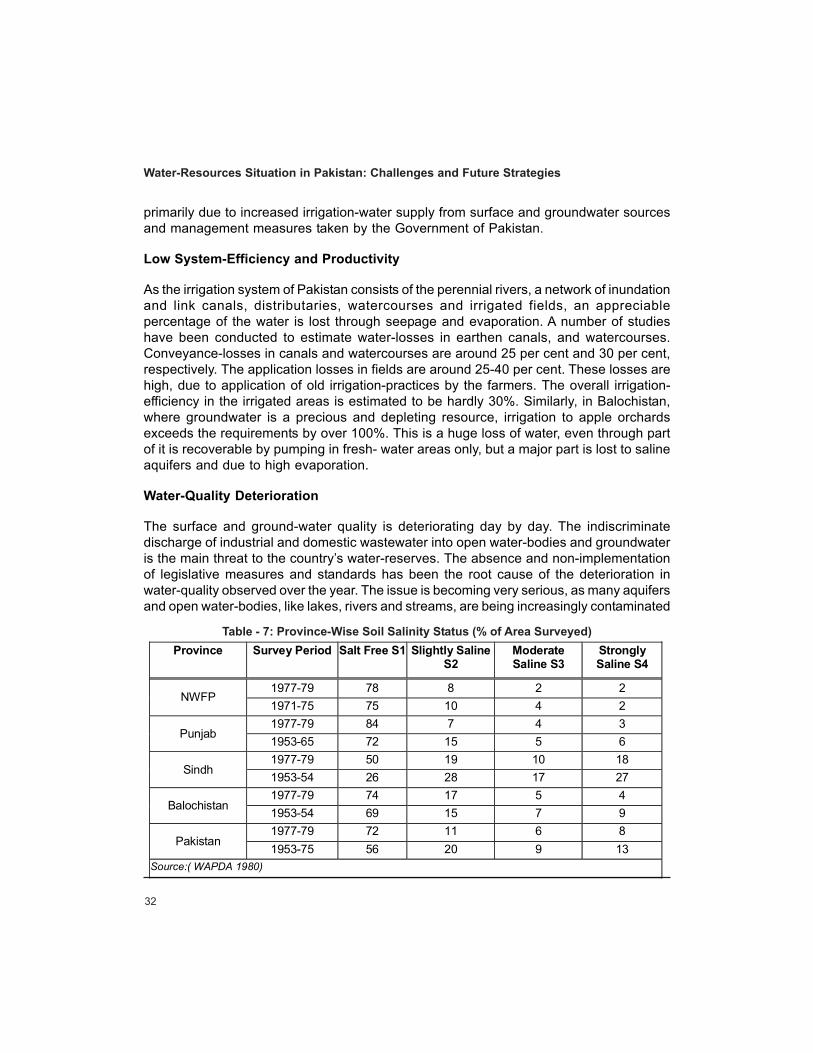
The magnitude of the salinity/sodicity problems can be gauged from the fact that, at onestage, the area of productive land being lost due to salinity was at a rate of about 40,000ha per year. A countrywide survey conducted by WAPDA during 1977-1979 showed thetrue status of soil-salinity in the canal commands. In this, covering 16.72 Mha, both surfaceand profile salinity/sodicity was established through chemical analysis. About 25% of thearea was affected by surface-salinity. Province-wise position of surface-salinity is shownin Table-7. Comparisons with past surveys have indicated that the land affected by surface-salinity decreased from 42% in the early 1960’s to about 25% in 1977-79 (WAPDA, 1980),
Table - 6: Area Under Various Water-Table Depth (% of CCA)
Year <1.5 m 1.5-3.0 m >3.0 m 1978 11.90 39.50 48.60 1982 13.50 43.20 43.30 1986 13.00 41.00 46.00 1988 9.00 38.20 52.80 1990 13.20 36.20 50.60 1992 18.30 32.60 49.10 1993 16.20 35.70 48.10 1994 12.00 36.00 52.00 1995 12.30 36.90 50.80 1996 10.40 40.10 49.50 1997 17.20 33.20 49.60 1998 14.70 36.60 48.70
Average 13.50 37.40 49.10
Source: SMO unpublished data
M.A. Kahlown and Abdul Majeed
32
primarily due to increased irrigation-water supply from surface and groundwater sourcesand management measures taken by the Government of Pakistan.
Low System-Efficiency and Productivity
As the irrigation system of Pakistan consists of the perennial rivers, a network of inundationand link canals, distributaries, watercourses and irrigated fields, an appreciablepercentage of the water is lost through seepage and evaporation. A number of studieshave been conducted to estimate water-losses in earthen canals, and watercourses.Conveyance-losses in canals and watercourses are around 25 per cent and 30 per cent,respectively. The application losses in fields are around 25-40 per cent. These losses arehigh, due to application of old irrigation-practices by the farmers. The overall irrigation-efficiency in the irrigated areas is estimated to be hardly 30%. Similarly, in Balochistan,where groundwater is a precious and depleting resource, irrigation to apple orchardsexceeds the requirements by over 100%. This is a huge loss of water, even through partof it is recoverable by pumping in fresh- water areas only, but a major part is lost to salineaquifers and due to high evaporation.
Water-Quality Deterioration
The surface and ground-water quality is deteriorating day by day. The indiscriminatedischarge of industrial and domestic wastewater into open water-bodies and groundwateris the main threat to the country’s water-reserves. The absence and non-implementationof legislative measures and standards has been the root cause of the deterioration inwater-quality observed over the year. The issue is becoming very serious, as many aquifersand open water-bodies, like lakes, rivers and streams, are being increasingly contaminated
Province Survey Period Salt Free S1 Slightly Saline S2
Moderate Saline S3
Strongly Saline S4
1977-79 78 8 2 2 NWFP
1971-75 75 10 4 2 1977-79 84 7 4 3
Punjab 1953-65 72 15 5 6 1977-79 50 19 10 18
Sindh 1953-54 26 28 17 27 1977-79 74 17 5 4
Balochistan 1953-54 69 15 7 9 1977-79 72 11 6 8
Pakistan 1953-75 56 20 9 13
Source:( WAPDA 1980)
Table - 7: Province-Wise Soil Salinity Status (% of Area Surveyed)
Water-Resources Situation in Pakistan: Challenges and Future Strategies

33
by pollution from industrial, agricultural and municipal wastes. According to estimates,pollution in River Ravi, due to sewage disposal from the city of Lahore, claims the lives ofover 5,000 tonnes of fish every year.
On the basis of data available from monitoring studies undertaken in the Salinity Controland Reclamation Projects (SCARP) has indicated a general deterioration of groundwaterquality, though little change has been observed in surface water quality. Table-8 showsthe change in water quality in SCARP areas. The table indicates appreciable increase inthe areas under hazardous water, with corresponding decrease in the areas under usablewater-quality.
WATER MANAGEMENT-STRATEGIES
A three-pronged approach towards formulation of strategies to meet the growing scarcityof water needs is proposed. The general approach involves:
a. Tapping of existing un-utilised resources and development of new and unexploredwater-resources.
b. Management of water-resources, to achieve the goal of maximum production per unitof water used.
M.A. Kahlown and Abdul Majeed
Percent Change in Water Quality Project Data Period Usable Water Marginal Water Hazardous Water
SCARP I 1962-89 -8 4 4 SCARP II 1975-88 -3 1 2 SCARP III 1969-86 -10 6 4 SCARP IV 1970-85 -10 11 -1 SCARP V 1976-86 -6 8 -2 SCARP VI 1976-89 -18 8 10 SCARP VIII 1979-89 -29 14 15
Shahpur 1977-87 -6 6 0 Peshawar 1979-88 1 -2 1 Mardan 1979-88 5 -5 0 Khairpur 1965-88 -4 6 -2 Bannu 1978-88 1 4 -5
North Rohri 1977-88 -6 5 1 South Rohri 1979-88 -5 5 0
Ghotki 1978-88 -2 2 0 Larkana 1976-88 7 -7 0
Shikarpur 1976-88 -1 1 0 Sukkur 1975-88 -5 -3 8
Table - 8: Changes in Water-Quality in SCARP Areas
34
c. Improving the institutional set-up and better governance of water-resources institutionsand infrastructure.
Based on the above approach, the following strategies are suggested. These strategiesare grouped as short-term, medium-term and long-term.
Short-Term Strategies (Time frame - 3 years)
These strategies are suggested for management of existing water-resources with themain aim to formulate a framework for dealing with drought, during the immediate twocrop seasons. Some of the suggested actions for short-term may continue during themedium and long-term strategies. Following are the details of the suggested strategies:
Awareness Campaigns: Most of the problems associated with the water-sector have risenfrom illiteracy and lack of knowledge and understanding of water-conservation practicesand high-efficiency irrigation-systems among users at large. An extensive social awarenesscampaign is required, using mass-media and a village-to-village campaign of extensionservices. Moreover, effective extension-service mechanism must be developed to transfernew and efficient irrigation methods, technologies, and practices to farmers.
Increasing On-Farm Application Efficiencies: Precision land-levelling increases field-application efficiencies in plain areas, where basin irrigation is practiced. Efforts to introducelaser-guided land-levelling with cost-effective locally developed technology should beencouraged. Similarly, farmers in upland areas, with undulating topography, should beencouraged to use high-efficiency irrigation-systems, like trickle, bubbler, and sprinkler,to conserve water. For this, demonstration plots on cost-sharing basis need to beestablished in the entire country.
Improving Conveyance Efficiencies: Earthen improvement of distributaries, minors andwatercourses, with installation of concrete control-structures, should be undertaken toenhance conveyance-efficiencies, which are presently around 55 per cent.
Motivation To Farmers And Industrialists: To motivate the farmers for adoption of the high-efficiency irrigation-systems, incentives/ subsidies and soft loans may be given. The localindustries may be encouraged to manufacture components of the systems, for which taxholidays may be given.
Improved Surface Irrigation Methods: In plain areas, where row and grain crops like cotton,wheat and maize are grown; bed and furrow-irrigation methods should be made mandatoryfor adoption by farmers, to increase the application-efficiency of water.
Changes In Cropping Patterns And Crop Varieties: To conserve water, meet water shortage,and match water-requirements with supplies, appropriate changes in cropping patterns
Water-Resources Situation in Pakistan: Challenges and Future Strategies

35
may be considered. This would require change over from high-delta to low-delta crops,capable of giving higher returns to the farmers. Similarly, growing drought and salt-resistantcrop varieties is another option that can be considered.
Reduction In Cultivation Areas: To reduce the chances of crop-failures, due to anticipatedwater shortage, planned reduction in cultivation areas to match water-availability may bepropagated in a very timely fashion.
Regulation Of Groundwater: To reduce and control the over-extraction of groundwaterresulting in mining, groundwater use must be regulated and properly priced throughappropriate legislation and its strict implementation. Subsidies given to users ofgroundwater in stressed areas, in particular, may be withdrawn.
Undertaking Skimming Wells Projects: In areas where fresh water is overlying saline water,it would help if skimming-well technology were used to pump out fresh water, withoutdisturbing the underlying saline layer. For this, it would be necessary to undertake aninvestigation exercise to delineate such areas.
Identifying New Water-Storage Sites: To tap the surface water going to waste, identificationof possible surface water storage sites for small and large dams should be done on toppriority bases. WAPDA and provincial irrigation departments should be asked to completethis task as soon as possible.
Rejuvenation Of Depleting Aquifers: Due to ever increasing number of depleting freshwater aquifers, there is a need to rejuvenate them. Various artificial recharge measuresshould be tried/experimented upon, in areas where depletion of aquifers is becoming aserious problem like in Pishin Lora and Nari basin in Balochistan and Lahore area in thePunjab. Appropriate methods of artificial recharge should be identified.
Identification Of Focal-Point Organisation: A focal point organisation must be identified tomonitor the progress of the implementation of strategies and their effect on overall wateravailability for crop use, drinking and other purposes.
Involvement of Water-User Organisations: Water User Organisations (WUOs) in irrigatedareas are very effective to motivate the farmers to solve the problems related to water usebecause of their presence at grass root level. Their involvement in the planning, executionand management of all water- resources development projects should be ensured forsustained operation and maintenance of the projects.
Providing Farmers With Information On Water-Requirements: Dissemination of informationto farmers regarding actual crop water requirements of various crops in major agro-climaticzones should be undertaken on top priority basis to avoid over and under irrigation. This
M.A. Kahlown and Abdul Majeed

36
will help in controlling wastage of water and overcoming problems like waterlogging andsalinity.
Medium-Term Strategies (Time Frame – 3 to 7 years)
Lining Of Conveyance System: Lining of canals, distributaries and watercourses is animportant option to reduce water-losses and increase water-availability at the farm gate.However, since the system conveyance-loss can be recouped in good-quality aquifers bypumping, preference should be given to lining of distributaries, minors and watercoursesin saline groundwater areas.
Construction Of Storage Reservoirs: To harness and utilize water currently going waste,small dams/storage reservoirs need to be constructed. These storages could be atappropriate sites in the Northern Areas or downstream of Tarbela. WAPDA and provincialirrigation departments have already identified most of the sites and the construction ofdams for development of water-reservoirs is included in their medium and long-term plans.
Identification Of Fresh Groundwater Areas: To decide on where to implement the strategyregarding preferential lining of the conveyance-system, installation of new tubewells, andregulation of groundwater, it is necessary that fresh groundwater areas be identified andmapped with regard to water-table depth, potential, and quality.
Institutional Improvements: Lack of co-ordination between line-departments at the provincialand federal level has been one of the stumbling blocks in successful and effectiveimplementation of various strategies and projects in the water-sector. Institutional reformsfor better co-ordination and management should be undertaken.
Finding And Developing New Resources: Glaciers and winter snowfall in the northernareas form an important and extensive potential source of water in the Indus River System.Experiments to harness this resource in a sustainable and environment friendly fashion,limited studies should be undertaken.
High-Efficiency Irrigation Systems: As a continuation of the short-term strategy, the high-efficiency irrigation-systems technology should be propagated and spread all over thecountry. The farmers will bear the full cost of systems to cover a much wider range ofcrops and agro-climatic zones.
Rejuvenation Of Aquifers: Application of the identified aquifer-rejuvenation methods willbe done on a wide scale, besides developing efficient methods for recycling of groundwater.
Water-Resources Situation in Pakistan: Challenges and Future Strategies

37
Developing Drought-Forecasting Mechanism: The country is deficient in drought-forecasting methods and techniques. Models should be developed to predict the incidenceof droughts for better preparedness and to plan ahead in the event of any drought calamity.Developing Conjunctive Use Methodologies: The saline groundwater extensively availablein various parts of Pakistan should be made use of, through developing conjunctive usemethodologies and change of crops, etc.
Corporate Farming And Consolidation Of Land Holdings: The land-holdings in the irrigatedareas are increasingly becoming fragmented, due to inheritance laws, etc., which hampersadoption of new and modern technologies. Popularising the concept of corporate farmingand consolidation of land holdings is an important area for consideration.
Undertaking Watershed-Management: The heavy amount of sediment loads brought inby the feeding-streams in our reservoirs must be checked. For this, undertaking watershed-management works in catchments of existing reservoirs and planning such activities innew project as well as projects in pipeline may be ensured.
Controlling Evaporation-Losses From Reservoirs: The methods to control evaporation-losses from open water-bodies, which are huge due to the arid climate over most of thecountry should be developed and the most economical methods adopted on our reservoirs.
Formulating A National Water-Policy: Despite heavy dependence on water for its economy,the country still does not have a national water-policy. This policy will be formed to formthe basis for future planning, development, and utilisation of water-resources. The presentdocument with little more work can provide the essential elements of such a policy.
Long-Term Strategies (Time Frame – beyond 7 years)
Regulatory Framework On Groundwater: Uncontrolled abstraction of groundwater hasplayed havoc in terms of quantity and quality in the arid areas of Balochistan and parts ofPunjab and Sindh. This needs to be checked through a stringent regulatory framework ongroundwater-abstraction.
Construction Of Storage Reservoirs: This policy/strategy on construction of storage dams,wherever feasible, should continue to be vigorously followed on long-term basis. Siteswith the possible inter-provincial conflicts should be given priority.
Improved Forecasting Of Droughts And Floods: The forecasting mechanisms for floodsand droughts should be strengthened and improved, for saving precious life and property.
M.A. Kahlown and Abdul Majeed
38
Resolving Water-Distribution Issues: The mechanism of water-distribution among provincesand on the field in the irrigated areas should be resolved amicably, to suit the groundsituations.
Continuation Of Activities Suggested Under Medium-Term Strategies: A number of activitiesunder the medium-term strategies will be continued during the long-term strategic plan.These are: undertaking the watershed-management activities, rejuvenating aquifers,propagation of high-efficiency irrigation systems, etc.
CONCLUSIONS & RECOMMENDATIONS
Pakistan’s water-resources have been diminishing at an alarming rate, as can be concludedfrom the above-stated facts. The quality of water is also deteriorating with time. To improvethe situation, the suggested strategies need to be implemented in an organized andcoordinated way, through concerted efforts, including better water-management at thefield level and good-governance and institutional arrangements. The following overallrecommendations are put forth for implementation of the proposed strategies.
i) A focal-point organization at the federal-level should be identified. This organizationis suggested to be the Pakistan Council of Research in Water-Resources, which hasthe mandate to undertake Research and Development activities in water-resourcesat the national level. The Council may be given the additional mandate to provide thenecessary coordination between the various federal and provincial planning andexecuting agencies, besides providing the advisory role for implementing the proposedstrategy.
ii) The planning and execution of mega-projects in the water-sector would continue tobe done by WAPDA. The WAPDA continue to be the key organization for implementingthe component related with the operation and maintenance of existing storagereservoirs and development of additional main reservoirs in the Indus River System.
iii) The provincial governments and its various Research and Development departmentsand agencies, like the On-Farm Water Management Project, the extension directoratesof the Agricultural Department, will play a major role in the execution of the activitiesrelated with high-efficiency irrigation systems and lining of minors and watercourses,etc. The Irrigation Department will look after the execution of water-developmentprojects of local and regional level like small dams and reservoirs, karez management,harnessing spring-water, groundwater regulation, and stream-flow diversions, etc.
iv) A committee of senior officers, at policy level, is suggested to oversee the detaileddesign and implementation of the proposed strategy as outlined in the previousparagraphs. This committee should consist of representatives of the key institutionsof four ministries viz. PCRWR, Federal Flood Commission, Pakistan MeteorologicalDepartment, Ministry of Food, Agriculture and Livestock, and the representatives of
Water-Resources Situation in Pakistan: Challenges and Future Strategies

39
provincial irrigation and agriculture departments. The committee should hold regularquarterly meetings, to review the progress of implementation of the strategy.
REFERENCES
– Agricultural Statistics of Pakistan 1999-2000, Ministry of Food and Agricultural and Livestock,Government of Pakistan.
– Annual Report 1997-98, WAPDA.– Apportionment of Indus Water Accord, Report 2001, Irrigation & Power Department, Government
of Punjab by M.H. Siddiqui.– Drought Situation in Pakistan, Web Site of Sustainable Development Networking Programme,
(web site of Sustainable Development Network of Pakistan).– Irrigated Agriculture of Pakistan by Dr. Nazir Ahmad.– Issues and Opportunities, Discussion paper prepared for the Interdepartmental Water-Resources
Policy Group, Asian Development Bank, August 1995.– Ministry of Water and Power, Report on Future Strategy to Deal with Present Water Crisis.– National Water Management Strategy, Need for Immediate Implementation by Dr. Shahid Ahmad.– Papers published in the Proceeding of National Workshop on Water-Resources Achievements
& Issues in 20th Century & Challenges for the next Millennium, Pakistan Council of Researchin Water-Resources, June 1999.
– Sustaining Water – Population and the Future of Renewable Water Supplies, Population ActionWelfare, 1993.
– Three years Development Programme (2001-04), Planning Commission February 26, 2001,Government of Pakistan.
– Various Technical Reports by WAPDA & IRSA.– WSIP. (1990) Water Sector Investment Planning Study. Federal Planning Cell/ Consultants,
Lahore – Pakistan.
M.A. Kahlown and Abdul Majeed

A
Efficient and SustainableIrrigation-Management in
PakistanIllahi B. Shaikh
41
ABSTRACT
Pakistan, with a Geographical area of 796,101 square kilometers, possesses large rivers,like Indus which, along with its 5 tributaries, namely Chenab, Jhelum, Ravi, Kabul andSutlej, forms one of the mightiest River-Systems of the world. The River-System comprises2 storage reservoirs, 19 large river headworks, 43 Canal Systems measuring 58,000kilometers, some 1.6 million kilometers of water-courses and field Irrigation Channels.Pakistan has big rivers like Indus, Chenab, Ravi, Jhelum and Sutlej, where discharges insummer season vary from 100 thousand Cusecs to 1,200 thousand Cusecs (3 thousandto 34 thousand cumecs) and can cause tremendous loss to human lives, crops and property.
In order to manage the huge Irrigation-System, Planning has been made, in consultationwith four Provincial Irrigation Departments and Government of Pakistan, to establishProvincial Irrigation and Drainage Authorities and Farmer Organizations, which are underway. Due to limited capacity of storage at Tarbela and Mangla Dams on river Indus andJhelum, with virtually no control on Chenab, Ravi and Sutlej, devastating problems arefaced between July and October in the event of excessive rainfall in the catchments. Thischapter discusses, in detail, the irrigation-network in Pakistan and the efforts to establishIrrigation and Drainage Authorities, Farmer Organizations, etc, for efficient and sustainablemanagement of irrigation in Pakistan.
INTRODUCTION
Pakistan, with a Geographical area of 796,101 square kilometers, possesses large rivers,like Indus which, along with its 5 tributaries, namely Chenab, Jhelum, Ravi, Kabul andSutlej, forms one of the mightiest River-Systems of the world. The River-System comprises2 storage reservoirs, 19 large river headworks, 43 Canal-Systems measuring 58,000kilometers, some 1.6 million kilometers of water-courses and field Irrigation-Channels.Pakistan has big rivers like Indus, Chenab, Ravi, Jhelum and Sutlej, where discharges insummer season vary from 100 thousand Cusecs to 1,200 thousand Cusecs (3 thousandto 34 thousand cusecs) and can cause tremendous loss to human lives, crops and property.Due to limited capacity of storage at Tarbela and Mangla Dams on river Indus and Jhelum,with virtually no control on Chenab, Ravi and Sutlej, devastating problems are facedbetween July and October in the event of excessive rainfall in the catchments (see Figure-1).
Pakistan comprises four major administrative units; Punjab, Sindh, North West FrontierProvince and Balochistan, besides the Federally Administered Tribal Areas. Pakistan’s
EFFICIENT AND SUSTAINABLE IRRIGATION-MANAGEMENTIN PAKISTAN
42
population as estimated in 2001 is 140 million. The population growth-rate is estimated at2.1%. The overall density of population is 174.63 per kilometers. However, there is largeregional variation in population-density. Pakistan is a country with a very diverse socialand geographic landscape, comprising high mountains in the north, to desolate plateaus,fertile plains, sandy deserts, coastal beaches and mangrove forests in the south. It hasthe largest share of the highest mountain-peaks in the world and has more glaciers thanany other land outside the North and South Poles. Pakistan’s glacial area covers some13,680 sq.km, which represents an average of 13 per cent of mountain-regions of theupper Indus-Basin.
THE IRRIGATION NETWORK
The Irrigation system of Pakistan is the largest integrated irrigation network in the world,serving 34.5 million acres (13.96 million ha) of contiguous cultivated land. The system isfed by the waters of the Indus River and its tributaries. The salient features of the systemare three major storage reservoirs, namely, Tarbela and Chashma on River Indus, andMangla on River Jhelum, with a present live-storage of about 15.4 BM3 (12.5 MAF), 19barrages; 12 inter-river link canals and 43 independent irrigation canal commands (Figure-2). The total length of main canals alone is 58,500 Km. Water courses comprise another1,621,000 Kms.
Diversion of river waters into offtaking canals is made through barrages, which are gateddiversion weirs and a system of link canals (Figure-2). The main canals, in turn, deliverwater to branch canals, distributaries and minors. The water-courses get their share ofwater through outlets in the irrigation channels. Distribution of water from a watercourseis effected through a time-schedule or “warabandi”, under which each farm gets water fora specified period once a week. The time-share of “wari” is proportionate to the farm areaowned by a farmer under the command of the water-course.
The system draws an average of 106 MAF (131 BM3) of surface-water each year forirrigation. Supplemented by an annual groundwater pumpage of some 50 MAF, the averagedepth of water available at the farmgate is 3.07 feet per acre. Approximately 3 millionindividual farms, with an average size of about 12 acres (5 ha), benefit from this system.
WATER AVAILABILITY & UTILIZATION
Pakistan has a diverse agro-ecological setting and is divided into three hydrological regions;(a) the Indus- Basin, which is the major source of Pakistan’s water, (b) the Kharan desertin west Balochistan, with inland drainage and (c) the arid Makran coast along the ArabianSea in the southern part of Balochistan. The deserts in the south (Thar and Cholistan)have no water-resources. Most of the Indus-Basin has been formed as a result of alluvialdeposits brought by rivers from the mountainous ranges in the north. The flows in the
Efficient and Sustainable Irrigation-Management in Pakistan
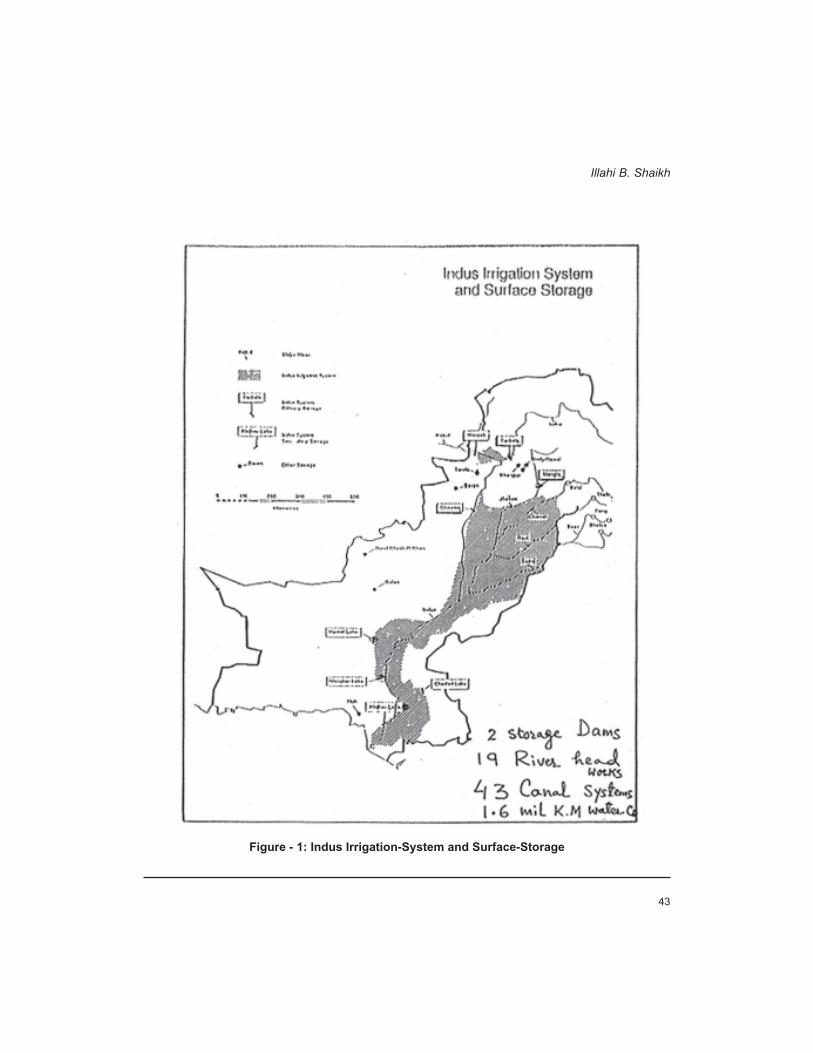
43
Figure - 1: Indus Irrigation-System and Surface-Storage
Illahi B. Shaikh

44
Indus River are from glacial snow melt, as well as rainfall outside the Indus Plains. Underthe Indus- Water Treaty (1960), the flows of the three eastern rivers, the Sutlej, Beas andRavi, have been allocated to India and water from the three western rivers, the Indus,Jhelum and Chenab is available for Pakistan.
The flow of the Indus River and its tributaries constitutes the main source of surface-waterfor the country. Based on 74 years of historic data from 1992-93 to 1996-97, the averageannual inflow of the western rivers at the rim-station amounts to 140 million acre feet MAF(173 BM3). The flow varies from year to year; the maximum was 186.79 MAF (230 BM3) in1959-60 and the minimum was 86 MAF (106 BM3) in 1999-2000. This presents a variationof more than 65% in the annual average-flows.
The groundwater storage-capacity in Pakistan is estimated to be around 55 MAF (67.8BM3). The hydrogeological conditions are mostly favourable for pumping by tube-wells. Itis estimated that 15,504 large-capacity public tube-wells and 469,546 private tube-wellsof low capacity are currently installed in the country. Thus, the groundwater pumpage inthe Indus-basin has increased from 33.4 MAF (41 BM3) in 1959 to about 50 MAF (62 BM3)in 1999-2000. Quality of groundwater is variable, with about 79% of the area in Punjaband 28% in Sindh as fresh groundwater suitable for irrigation. However, indiscriminatepumping, without proper monitoring, and lack of knowledge about the chemistry andhydrodynamics of the aquifer has already contributed to the pollution of the aquifers incertain pockets.
At the time of independence of Pakistan in 1947, about 64 MAF of water was being utilizedannually in the irrigation canals in the country. With the construction of more barrages,link canals, and storage dams, water-use has increased to an average of 106 MAF (131BM3). Per-capita availability of water has gone down from 5,104 cubic meter in 1950 toaround 1,200 cubic meter currently- Out of the 35,040 MAF flowing to the sea, a total ofabout 20 MAF (25 BM3) can be used for future development through construction of multi-purpose storages, remodeling of canals and irrigation extension schemes. There is littlepotential for increase in water availability for Pakistan from surface or groundwater sources.However, the 9th Five-Year Plan envisages that about 4.32 MAF can be made availablethrough conserving measures and installation of tube-wells in fresh groundwater areas.
Currently, 97% of the fresh water in Pakistan is used in the agriculture-sector and only 3%is available for domestic and industrial use. The competitive demands from different sectorshas not yet emerged as a key issue in Pakistan but is likely to become a major issue in thefuture. A review of growth trends shows that as the income of a country increases, the useof water by different sector changes dramatically, and the water needs of the industrialand domestic sector changes dramatically and the water needs of the industrial anddomestic sector grow rapidly until in high-income countries water requirements are 47%of the available water. In the immediate future, Pakistan needs to review strategies for
Efficient and Sustainable Irrigation-Management in Pakistan

45
Figure - 2: Schematic Diagram Indus-Basin Irrigation-System
Illahi B. Shaikh
46
reallocation of water from irrigation to domestic and industrial use to harvest economicbenefits. The rate of return of a cubic meter of water used for agriculture is less than 10%of return on municipal and industrial use. Conservation measures in agriculture cantherefore help in increasing the productivity of water.
IRRIGATION AND WATER-MANAGEMENT ISSUES
Water-resources development and management has acquired new dimensions in Pakistan.A host of factors constrain the performance of irrigation, which are multi-faceted andmulti-dimensional. The major constraints facing the irrigation management broadly include;Physical Constraints, Financial Inadequacies, Institutional Issues and EnvironmentalProblems. The Physical Constraints have been caused by the agricultural developmentbeyond the system design capacities, scarcity of irrigation water, lack of storages, andgradual deterioration of the network due to the overstressing and aging. The main FinancialIssues include inadequate maintenance funding, rise in maintenance expenditure of publictube-wells, and flood works, as well as escalating expenditures on establishment,stagnation of abiana rates, and a widening gap between the expenditure and cost recovery.The Institutional Issues have emerged because the changes in the institutional set-uphave lagged behind the changes that have taken place in the resource-base and socio-economic context over the years. On the Environmental Front, the main problems arewaterlogging and salinity, salt-imbalance, and increasing pollution of water-bodies.
A small fraction of the population pays tax; agricultural income tax has never been imposedon full-scale basis, despite its potential to generate resources for the country. The revenuefrom abiana (water tax) is also not collected seriously and there is massive leakage in thesystem. There is a legal framework in place for the organization of Water User Association(WUA), as the Punjab (1981) and Sindh (1982) Water-User Association Ordinances providefor such associations at the water-course level, while the Punjab Irrigation and DrainageAuthority Act (1997) and the Sindh Irrigation and Drainage Authority (1997) provides forestablishing Farmers Organizations (FOs) at distributary and minor levels. Despite this,the WUAs do not feel empowered to undertake the responsibility of operating andmaintaining their watercourses or have any autonomy in the management of their water-resources. Similarly, a uniform policy exists for the water supply and sanitation sector, butit is not fully implemented. The National Environmental Quality Standards exist, but theseare not enforced seriously.
The Indus-Basin Irrigation System was installed almost a hundred years ago and, now, itsefficiency has come down to such an extent that more than 50 per cent of the irrigation-water is lost in transit and during application to the crops. The quantum of wastage ofprecious irrigation-water is not only the limiting factor for expansion of the irrigated areaand realizing the maximum benefits per unit of already irrigated land, but it also hasaggravated the severity of the twin menace of waterlogging and salinity. Crop-yields on
Efficient and Sustainable Irrigation-Management in Pakistan
47
average Pakistani farms are considerably lower than the average yields attained by manyother countries of the world, under similar agro-climatic conditions. The mounting pressureof population has furthered the importance of conservation and better management ofthe scarce resource. Thus, the low productivity of irrigated agriculture and ever-increasingpressure of population present a major threat to the country’s food- security in the future.Therefore, this underscores the dire need to save every drop of water wasted in theirrigation-system and at the farm-level, through active participation of the end-users.
The importance of water for Pakistan can not be under-estimated, particularly for irrigatedagriculture in the country. In Pakistan, irrigated agriculture covers 16.2 million hectare(74%) out of the total cultivated area of 22 million hectare. Irrigated agriculture uses 97%of the available water and provides over 90% of agricultural, produce; it accounts for 25%of GDP, earns 70% of the export revenue and employs 50% of the work-force directly andanother 20% indirectly. Although the share of agriculture in GDP has declined over theyears, it is still the largest single contributor to GDP. However, despite its importance, thelevel and growth of agricultural production falls short of its real potential. The sustainabilityof irrigated agriculture is threatened by continuous deterioration of the irrigationinfrastructure.
The need for improvement and up-gradation of the irrigation system has become imperativeIndeed, over the last three decades, some damages have occurred due to floods, causingstoppage of irrigation-water to large areas, with huge economic losses. Recent surveyshave revealed that numerous important hydraulic structures are in a precarious state andthe need for rehabilitation is urgent. Besides rehabilitation, the system also needs overallimprovements to allow efficient operation and equitable water-delivery, in order to caterfor the enhanced water-demand and to meet the challenges of 21st century.
In order to address the sustainability issues, a number of policy-interventions have beenproposed. While the main thrust of the policy-framework remains on institutional reforms,other policy interventions like Global Water Law, Dis-investment of Fresh GroundwaterTube-wells, Groundwater Regulatory Framework, Optimizing Irrigation-Water Allocationsand Alternative Rate Mechanisms, are also proposed for optimizing the overall IrrigationManagement. A sectoral strategy and National Water Policy are also being formulated, tohave a historic approach for development and management of the water sector.
At the moment, the irrigation and drainage system of Pakistan suffers from a number offundamental problems, notably;
• Unsatisfactory planning and programming of public expenditure on drainage;• Delays in Implementation;• Unsatisfactory planning, funding and execution of operation and maintenance (O&M);• Deteriorating capabilities of key-institutions;
Illahi B. Shaikh

48
• Lack of public participation;• Inadequate investment in drainage;• Poor monitoring of drainage projects and infrastructure, and• Inadequate investment in research on drainage, and lack of application of research-
results to policy and planning.
FARMERS’ PARTICIPATION IN CANAL-IRRIGATION AND WATER-USERSASSOCIATIONS
Nature has blessed this country with the World’s largest and most integrated system ofirrigation. This network was installed almost a hundred years ago and now its efficiencyhas been reduced to such an extent that more than 50 per cent of the irrigation-water islost in transit and during application to the crops. The quantum of wastage of preciousirrigation-water is not only the limiting factor for expansion of the irrigated area and realizingthe maximum benefits per unit of already irrigated land, but also has aggravated theseverity of the twin menace of waterlogging and salinity. Water-Users Organizations werenot a part of the agricultural system in Pakistan till the late 1970s. With the onset of theOn-Farm Water- Management (OFWM) Pilot Projects, their involvement was experimentedupon, at times when it was considered a politically explosive and socially vulnerable issue,and it proved successful. Under various OFWM Programs, efforts were exerted to involvethem at tertiary levels of the irrigation-system and, by now, they are contributing 55 percent of the cost of the civil works on the watercourse. The usefulness of farmers’participation in other countries fostered the testing of some pilots on their participation atsecondary levels of the system. A few pilot-surveys have been conducted so far and theresults have shown that the WUA’s participation can play a promising role in the operationand maintenance of the already deteriorating irrigation-systems, not only in improvingproductivity but also in sustaining the environment. Their performance will, nevertheless,hinge upon effective organizational efforts, imparting necessary training to them, properrecognition and adequate legislative support from the government, as well as commitmentfrom operating agencies.
The Government has recently taken strategic initiatives to address the longstanding issuesof irrigation-management that had been reflecting on the performance of the sector. Thenew strategies primarily focus on better governance, decentralization, participatorymanagement and sustainability. Under the institutional reforms agenda, Provincial IrrigationDepartments (PIDAs) are being transformed into Provincial Irrigation and DrainageAuthority (PIDA). The responsibilities of management would be decentralized at canalcommand level to Area Water Boards (AWBs), while most of the existing functions at thedistributary / minor level would be performed by the Farmers Organizations (FOs). Thefocus of most of the above activities would initially be on pilot AWB and pilot FOs on theSystem. Subsequently, the reforms package will gradually be extended to other AWBsand FOs, on the basis of the results of monitoring and learning- experience of the pilot
Efficient and Sustainable Irrigation-Management in Pakistan

49
programmes. The Government has enacted the legal framework and the reform agendais under implementation, to varying degrees in all Provinces.
The strategy consists of the following interlinked parts:
• Restructuring the Provincial Irrigation Departments (PIDs), to form Public Utilities (PUs)around canal commands;
• Actively promoting formation and development of Farmers Ortganizations (FOs);• Strengthening federal agencies, notably the Water and Power Development Authority’s
(WAPDA’s) Water Wing, so as to better implement their federal responsibilities; and• Formalizing water markets and individual water-property rights.
PIDAs have been established in all the four provinces; one Area Water Board (AWB) ineach province has been notified. Also, Punjab and Sindh have notified rules and regulationsfor FOs. Other provinces are in the process of doing the same; 30 FOs have been registeredin Punjab. Formation of 23 FOs have been completed, following by registration in SindhProvince under PIDA Act.
NWFP has designated the existing Northern Irrigation Circle Mardan as Area Water Board,Swat Canals (Pilot) and its Members have already been notified. The On-Farm Water-Management of the Agriculture Department have already constituted a FO in 31 LoraCanal scheme in Lakki Marwat district and they are busy in forming FOs in Peshawar andCharsadda areas.
The Farmers’ Organization for K.K. Bund Irrigation Schemes, in Balochistan, have beenregistered. FOs registration for rehabilitation of Lasbella Canal is being processed.
The issues of physical / financial sustainability of irrigation and drainage network isassuming increasingly critical proportions. The specific policy-interventions, which areunder consideration, include the following:
i) Drainage cess and / or other appropriate measures, including cost-sharing bynon-agricultural beneficiaries, to finance the O&M cost of drainage infrastructure.
ii) Mechanisms for financing the O&M costs of flood-works, which may inter-aliainclude transfer (or cost sharing) of non-irrigation flood-infrastructure to the localbodies / other relevant beneficiaries and/or charging flood-cess, etc.
iii) Redefining water-rates and alternate rate-mechanisms to enhance the incomesand to rationalize assessment costs. For a start, flat-rate assessment could beintroduced in pilot FOs.
iv) Redefining water-rates for water-use by non-agricultural users.
Illahi B. Shaikh
50
v) Adequate O&M funding for proper upkeep of the existing irrigation-infrastructure.Revision of yardsticks, enhanced allocations and shifting of resources from SCARPtube-wells to canals operations.
vi) Need to reassess the impact of the increase in investment vis-à-vis O&Mrequirements and the increases in “abiana” to sustain such investments.
The following points regarding institutional and environmental issues are now underactive consideration of the Government:
i) Willingness to invest in social mobilization and capacity-building of the upcomingnew institutions (i.e AWBs and FOs) is absolutely essential for the success of theongoing institutional reforms. For the new entities to be sustainable, the upcomingFOs would require technical assistance and support for quite some time, whichmay account for about 20-30% of the Investment Costs.
ii) There is pressing need to take steps for expediting the capacity-building processfor the upcoming FOs if the targets, for formation of FOs and transitioning of themanagement responsibilities to them, are to be met.
iii) In order to optimize integrated resource-management, comprehensive and holisticinterventions for rationalizing existing canal-water allowance need to beundertaken. Appropriate policy also needs to be developed, to address theemerging environmental issues in order to preserve the water-quality and land-base for sustainability of the irrigated agriculture.
CONCLUSIONS
Owing to scarcity of water, proper management of water-resources is essential for theAgriculture Sector, which is the largest user (97%) of water. The development of Pakistan’seconomy strongly depends on its ability to properly operate and manage its water-resources. The efficient and effective use of all water- resources in Pakistan requiresformulation and implementation of an appropriate water-sector policy. The Ministry ofWater and Power is formulating a National Water Policy to face the challenges of water-scarcity. The overall objective is to utilize the available water-resources to meet the socio-economic and environmental needs for sustainable development in the country.
REFERENCES
– Economic Survey of Pakistan - P&D Division, Islamabad– National Drainage Programme PC-1 (1997), Water & Power Development Authority, 60 pp.– Shaikh I.B. (1998) Research Paper for 68th National Management Course, Pakistan
Administrative Staff College, Lahore, 65 pp.– South Asia - Water Vision 2025 - A Document Framed by Global Water Partnership (2000).
Efficient and Sustainable Irrigation-Management in Pakistan
Optimal Utilization of Water-Resources at Mangla Reservoir
Qamar-uz-Zaman Chaudhry
51
ABSTRACT
Pakistan has an agro-based economy, but most parts of the country are arid or semi-arid.As such, a large part of the agricultural activity depends on irrigation water, which mostlycomes from two main reservoirs, namely, Tarbela and Mangla. Optimal utilization of theavailable capacities of these reservoirs, therefore, becomes an important issue.
At the time of the dam-design, the Probable Maximum Flood (PMF) value calculated forthe dam was 26 lac cusecs. Now, Pakistan Meteorological Department (PMD) has eightyyears of data, analysis of which suggests that the present PMF value of 26 lac cusecs ismuch on the higher side and should be revised downward to around 16 lac cusecs. Thisrevision can allow raising of the present Maximum Conservation Level (MCL) of Manglaby 15-20 ft, which can be accomplished at a fraction of the original cost. The storagecapacity of the dam would be increased by about 1 million acre ft.
INTRODUCTION
Mangla Dam was built on the river Jhelum in 1960 mainly to replace waters of the threeeastern rivers allocated to India under the Indus Water Treaty.
The catchment area of the Jhelum river is about 12,870 sq. miles. Of this, 3,605 sq. milesarea (about 28%) is located at an elevation higher than 10,000 ft above Mean Sea Level(MSL). The area above 4,000 ft constitutes about 82% of the total area. The basin isbounded in the north by the great Himalayan Mountains and contains whole of the Kashmirvalley.
The climate of the Jhelum basin can be divided into four seasons. These are winter(December-February), the hot weather (March-May), the summer monsoon (June-September) and the transition (October-November). During winter season, precipitationover major porition of the basin is in the form of snow. In April, May and June, the snowmeltgives rise to high sustained river flows at Mangla, which normally reach their maximum inJune. During the summer monsoon season, preicpitation is concentrated in the southernand western portions of the basin and features intense rainstorms. It is these rainstorms,which usually gives rise to major floods.
Any proposal to carry out the structural raising of Mangla dam deserves special attentionbecause it could boost the dam’s irrigation and power potential. Besides socio-economicand geotechnological considerations, the two major issues involved in the decision-making
OPTIMAL UTILIZATION OF WATER-RESOURCES ATMANGLA RESERVOIR

52
Optimal Utilization of Water-Resources at Mangla Reservoir
process relate to: (i) the availability of water in the system, and (ii) the magnitude andvolume of the highest possible flood or the probable maximum flood (PMF).
A correct assessment of these two factors will determine whether the structural raising ofthe dam is at all needed and, if so, then exactly how much. Hydrologists appear dividedon the issue of water-availability. Some believe a 40-ft raising of the dam is notcommensurate with the water-potential of the dam. They argue that, during quite a fewseasons, the Dam’s filling even up to the present conservation- level of 1,202ft had notbeen possible. They fear that an increase in the dam’s capacity could increase the numberof water-deficient years, as well, and thus make the project uneconomical.
WATER AVAILABILITY & RE-EVALUATION OF PMF
The inflow at Mangla constitutes around 70% of snow-melt water and spring water, plusaround 30% rainfall. Dam filling under the increased capacity shall necessitate more thannormal snowfall during winter, followed by more than normal rainfall during summer. Suchoccasions would be relatively few. Thus, the water-availability for the increased capacity(built at such high cost) remains doubtful.
The second most important factor to be considered in the context of raising the capacityof Mangla dam is the accurate assessment of the magnitude and volume of the highestpossible flood, called the PMF. It is customary to express the PMF in terms of its peak(discharge) value, even though its volume is equally important. Essentially, it is on thePMF-value that the Maximum conservation-level of the reservoir is fixed and the detaileddam-operating procedure is formulated.
In the case of Mangla reservoir, a great deal has gone wrong with regard to the PMF. Asit exists today, Mangla PMF is grossly over-estimated and we have under-utilized thedam’s capacity right from the beginning. PMF study of the Mangla dam was carried out bytwo international companies. The first study was done in 1959 by M/S Binnie1 and its UKPartners, in association with M/S Harza of USA, while second study was carried out aloneby M/S Harza2, in 1992.
DISCUSSION ON VARIOUS STUDIES
Before commenting on the two studies, it is necessary that a few basic and simple elementsregarding the concept of the PMF are brought out. PMF occurs as a result of the heaviestpossible precipitation, technically called the probable Maximum precipitation (PMP). ThePMP is caused by the extremely rare combination of the most rain-producing meteorologicalfactors, which may act together to produce such an imaginably high rainfall, the equal ofwhich has never occurred before. Thus, the starting point in computing PMF is theestimation of the PMP, which, in turn, calls for an in-depth understanding of those
53
meteorological factors that are necessary to cause PMP. In Pakistan, the essential causesof the heaviest rainfall are the low-pressure weather-systems, which originate in the Bayof Bengal during monsoon season and then move across India, to arrive in the vicinity ofthe Mangla catchment. Turning of these monsoon depressions (towards the catchment)and their intensification, etc, is caused by another weather-system called the westerlywaves. Cause of the extremely heavy rainfall in Mangla catchment develops when, on anextremely rare occasion, the position of the arriving intense monsoon-depression (to thesouth) and that of the intense westerly waves (to the north) get mutually juxtaposed alonga North – South axis. The first step in computing PMP is to look for a past event in whichthe “heaviest-ever” recorded rainfall and thus the run-off had occurred. Then the actualrainfall is further enhanced (theoretically) by assuming the situation of saturatedatmospheric condition to release more (additional) rain. Such precipitation (rain) is thenconverted into run-off, to compute the PMF, using any standard rainfall / run-off modellike, for example, HEC Model.
Now, turning to the Mangla PMF study, it appears that the foreign consultants did notpossess full understanding of the local rain-producing meteorological factors. The Britishand American Meteorologists live and deal with the temperate region and its atmosphericenvironment, while Pakistan is located in the region which becomes meteorologicallytropical during summer and temperate during winter. This regional characteristic causesmuch more complex weather-systems, which are not easily comprehended by the visitingmeteorologists of European or American origin. It further appears that this lack of knowledgeof the foreign consultants forced them to play safe by aiming at a very high value of thePMF, with safety margin comparable to the one normally adopted in USA for Hurricane-related rainfall.
In achieving such a high value of PMF, they violated the very basic procedure of PMFcomputation. As indicated earlier, the first step in the PMP/PMF computational procedureis to select the past event of the heaviest rainfall, which in case of Mangla, up till that time,was the event of the year 1929. The consultants of the study, however, selected an event,which was relatively insignificant in terms of rainfall and flood intensity. This was the floodof 1956. However, strangely enough, despite selecting one of the lowest storms, theyproduced the highest PMF value. This was done by multiplying the actual storm rainfallwith an additional multiplication factor called the Wind Maximization Factor, which wasactually not applicable to Mangla storms (since the wind-factor is applicable to the coastalbelt only and not as far inland as Mangla).
PMF value of 26 lac cusecs was computed by M/S Binnie1 and Partners and M/S Harza.Against this, the highest flood actually experienced at Mangla over a period of more then80 years is less than 11 lac cusecs, which occurred in 1992. The figure of 26 lac cusecsfor PMF resulted in fixing the maximum conservation level of the dam at 1,202ft. (Crestlevel of the dam is around 1,232ft and the level in case of PMF could be taken to 1,228ft).
Qamar-uz-Zaman Chaudhry
54
Optimal Utilization of Water-Resources at Mangla Reservoir
Thus, around 26ft of the useable space was kept empty for the PMF situation. A feelingthat 26 lacs of the PMF (as against 11 lacs actually experienced so far) was on the higherside prompted WAPDA to revise the study. However, strangely enough, the revision wasagain awarded to none but M/s Harza (which was already co-author of the first study).This was done early in 1992. No wonder that, in this revised study also, the PMF ofMangla again reached close to the previous value of 26 lac cusecs. On the face of it, theprevious PMF value got confirmed through the revised study and thus the situation withregard to the water-conservation in the reservoir remained unchanged. Flaw in the entireexercise stemmed from the decision to award the revised study to M/S Harza, which wasin no position to prove its (own) earlier study wrong. Indeed, Harza is a good internationalfirm having long-standing association with WAPDA, but this did not deny WAPDA theright to an independent check of its work through some other national / international firm,since quite a few companies of equally good repute are available at the internationallevel.
In 1995, Pakistan Met. Deptt., in one of its detailed studies conducted by its Director, Mr.Abdul Majid, strongly pointed out flaws in this overestimated Mangla PMF value of 26 laccusecs. Some conservative estimates suggest that this under-utilization of Mangla Damhas caused a loss of about Rs. 20 billion3 to the national exchequer so far.
CONCLUSIONS
The gist of what has been stated above is that an independent study of the Mangla PMFneeds to be done, through a firm not involved in the earlier studies. Involvement of PakistanMeteorological Department must be ensured in the study, since the subject of PMF is ahydro-meteorological subject directly related to the technical function of PakistanMeteorological Department.
On the basis of the various studies4,5, the present author is of the firm view that the PMFvalue is most likely to range between 15 lac and 17 lac cusecs. This shall allow a raisingof Mangla’s present maximum conservation level to 15ft above the present level of 1,202ft. The first 6 ft can be raised without any structural change, while the remaining raisingcan be achieved either by raising the emergency spillway (present level 1208 ft) or just byputting gates on it. This can be done at a fraction of the cost of rupees 50 billion neededfor raising the Dam upto 40 ft. In view of the water-availability constraint, the option ofraising the level, on the basis of revised PMF, should be exercised first. It shall be muchmore beneficial to use the available funds in the construction of some new dams, ratherthan raising the Mangla dam too much, without first utilizing the dam’s available potential.

55
REFERENCES
1. M/s Binnie & Partners, with M/s Harza (1959), Report on Mangla Dam (submitted to WAPDA):The probable maximum flood on the River Jhelum.
2. M/s Harza (1992), Report on Mangla Dam PMF submitted to WAPDA3. Abdul Majeed (1995), “A proposal to raise the Mangle Maximum Conservation Level (MCL),
based upon the revised probable Maxim Flood (PMF) and improved flood-forecasting andwarning system”.
4. MJU (February 2001) Mangla Dam raising project: Feasibility sheets report.5. Q.Z., Chaudhry; (2001) Comments on the Mangla Raising Project Report”. PMD Report June
2001.
Qamar-uz-Zaman Chaudhry

A

Strategic SustainableDevelopment of Groundwater in
Thar Desert of PakistanNayyer Alam Zaigham
57
ABSTRACT
Thar Desert forms the extreme southeastern part of Pakistan, covering about 50,000 km2
area. It is one of the densely populated deserts of the world. Population of Thar is livingprimarily on limited agricultural products and by raising goats, sheep, cattle, and camels. Theregion is characterized by parallel chains of the NE-SW trending parabolic stable sand-duneshaving desertic varieties of vegetation, generally on windward sides, upto the crests. Interdunalareas are favourable for agricultural activities, where crops are mainly dependent on rainwater.Average rainfall is significant but inconsistent, due to recurrent drought-cycles causing inverseimpact on food-production and socio-economic development. In spite of extensive groundwater-exploration projects, accomplished by a number of organizations, the water-crisis of the regioncould not be controlled, most probably due to lack of systematic exploration & development ofdeep groundwater potential. Management of the available water- resources is also notadequate, even to sustain a short period of drought-cycle. On recurrence of a drought-cycle,a significant section of the population is compelled to migrate towards other parts of the Sindhprovince, which affects their socio-economic stability.
An integrated research study, based on geo-electric scanning, drilling and seismic-dataanalyses, has been carried out to delineate subsurface hydro-geological conditions beneaththe Thar Desert. Regional gradient maps of surface elevation, top of subsurface OxidizedZone, top of coal-bearing formation(s) and the deeply buried basement have been prepared,covering almost the whole of Thar Desert. These gradient maps, analyzed in conjunction withthe annual rainfall data, reveal the existence of encouraging subsurface hydrogeologicalconditions, associated with the sedimentary sequences and the basement. From the resultsof the study, it is observed that perch water aquifers, commonly being utilized throughout theThar, are present at the bottom of the dunesand-zone, with fluctuating yield controlled by theannual rainfall cycles. At places, vertical electric-soundings indicate good prospects for betterwater, associated with the basement complex. The strategic development of groundwater,based on scientific exploration and exploitation, from the deep sedimentary and basementaquifers, can de-desertify the Thar, accelerating the socio-economic stability of the people ofthe region.
INTRODUCTION
In the northeast, the Thar desert extends towards Punjab Province and eastward across theIndo-Pakistan border, spreading over an area of about 200,000 km2 (Figure-1). In the Pakistanipart of Thar, the habitations are concentrated in the form of small villages scattered all overthe desert. This desert is one of the most densely populated in the world. The population of
STRATEGIC SUSTAINABLE DEVELOPMENT OFGROUNDWATER IN THAR DESERT OF PAKISTAN

58
Strategic Sustainable Development of Groundwater in Thar Desert of Pakistan
Thar ranges from 850,000 to 950,000 (Baanhn Beli, 90; SAZDA, 1988; Qadri, 1983).Stabilization of the sanddunes and siltification in the interdunal valleys have provided goodenvironment for cultivation and, consequently, raising of goats, sheep, camels, cattle, etc.,which is the primary source of livlihood in the Thar Desert.
Physiologically, the study area is bounded by the Punjab Plains in the north, by the Indianborder in the east and south, and by the irrigated Indus Plains in the west. In the south, thereare salt marshes and mud flats of the ‘Rann of Kutch’, a former shallow arm of the ArabianSea. In general, the terrain is topographically higher in the northeastern part of the TharDesert. The elevation ranges from sea level in the south to more than 200 m in the northeastaround Gadro area.
Parallel chains of NE-SW trending, large stabilized dominantly parabolic dunes form steepridges 5-16 km long, with an average relief of 50m, locally up to 80m. Dunes have vegetation(grasses, shrubs, bushes, and trees) on windward sides up to crests (Figure-2). The interdunalvalleys are wide and filled with silty and clayey sediments, useful for cultivation where cropsare mainly dependent on rainwater. These valleys constitute almost one third of the totalarea.In Thar Desert, the rainfall is significant (average 350 mm annual) but capricious anduncertain; drought cycles have inverse impact on food-production and socio-economicdevelopment. On commencement of a drought-cycle, people of Thar usually migrate withtheir animals, temporarily, to other parts of Sindh due to poor management of the availablewater, which consequently affects their socio-economic stability.
Considering the unfavourable climate and its impact on agricultural practices, the magnitudeof population, the livestock, and the cultivated areas are surprisingly large. The crops grownare mainly millets and pulses. The agricultural crops are Bajri (Pennistum Typhoideum), Guar
Figure - 1: Index map of Pakistan showing location of study area, regional geology,contours of annual rainfall and eastward of the extent Thar Desert

59
(Cluster beans, Cyamopsis Psoralioides) and Til (Sesamum Indicum). The breeding of livestockis the main source of livelihood in the region. According to an agricultural census the livestockpopulation is more than 0.35 million.
A number of organizations have worked for the development of groundwater-resources, butthe water-crisis of the region could not be controlled, most probably, due to lack of systematicexploration & development of shallow and deep groundwater-resources. Almost the entireThar Desert has been reconnoitered geologically, through test-drilling supported by thegeophysical exploration under the coal- exploration program (Fassett and Durrani, 1994;JTB, 1994; Zaigham and Ahmad, 1996). The northeastern part of Thar Desert was alsohydrologically investigated in a joint WAPDA-BGR venture (Ploethner, 1992). Technicalmanagement of the so far developed water-resources seems inadequate, because this has
Figure - 2: A general panoramic view of Thar Desert showing broad interdunalvalley and typical vegetational growth
Figure - 3: Water crisis compels people of Thar with herds tomigrate temporarily during drought period
Nayyer Alam Zaigham
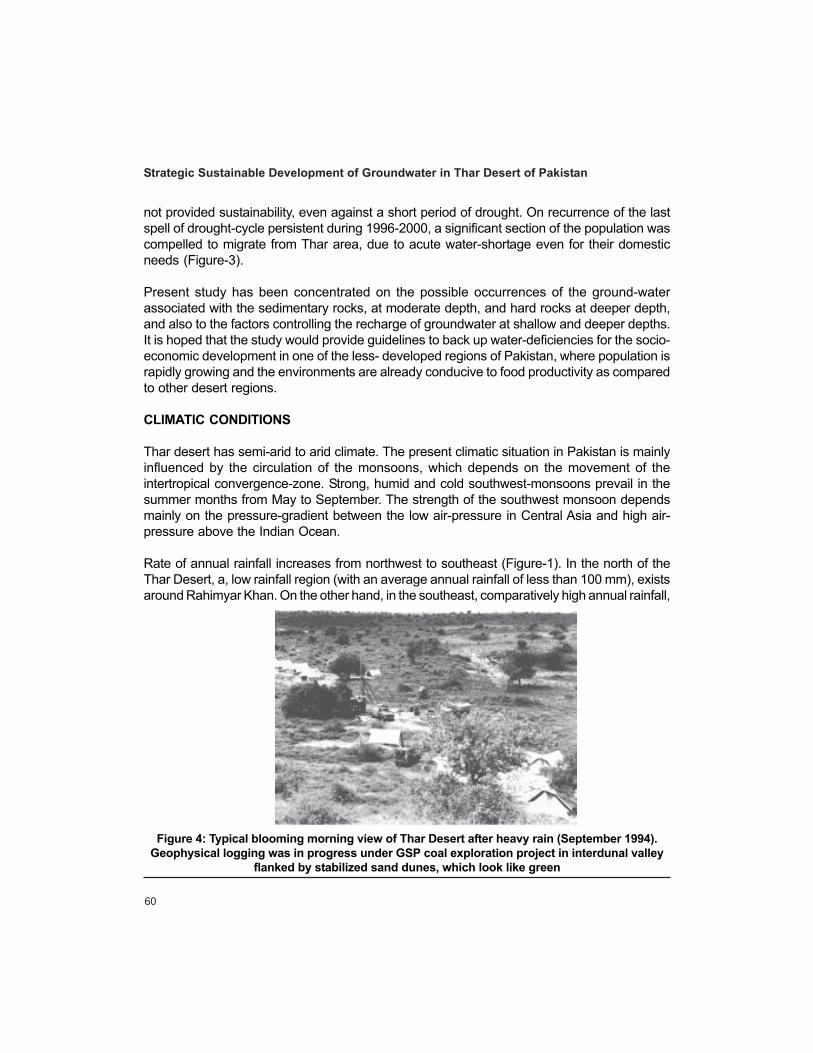
60
not provided sustainability, even against a short period of drought. On recurrence of the lastspell of drought-cycle persistent during 1996-2000, a significant section of the population wascompelled to migrate from Thar area, due to acute water-shortage even for their domesticneeds (Figure-3).
Present study has been concentrated on the possible occurrences of the ground-waterassociated with the sedimentary rocks, at moderate depth, and hard rocks at deeper depth,and also to the factors controlling the recharge of groundwater at shallow and deeper depths.It is hoped that the study would provide guidelines to back up water-deficiencies for the socio-economic development in one of the less- developed regions of Pakistan, where population israpidly growing and the environments are already conducive to food productivity as comparedto other desert regions.
CLIMATIC CONDITIONS
Thar desert has semi-arid to arid climate. The present climatic situation in Pakistan is mainlyinfluenced by the circulation of the monsoons, which depends on the movement of theintertropical convergence-zone. Strong, humid and cold southwest-monsoons prevail in thesummer months from May to September. The strength of the southwest monsoon dependsmainly on the pressure-gradient between the low air-pressure in Central Asia and high air-pressure above the Indian Ocean.
Rate of annual rainfall increases from northwest to southeast (Figure-1). In the north of theThar Desert, a, low rainfall region (with an average annual rainfall of less than 100 mm), existsaround Rahimyar Khan. On the other hand, in the southeast, comparatively high annual rainfall,
Figure 4: Typical blooming morning view of Thar Desert after heavy rain (September 1994).Geophysical logging was in progress under GSP coal exploration project in interdunal valley
flanked by stabilized sand dunes, which look like green
Strategic Sustainable Development of Groundwater in Thar Desert of Pakistan
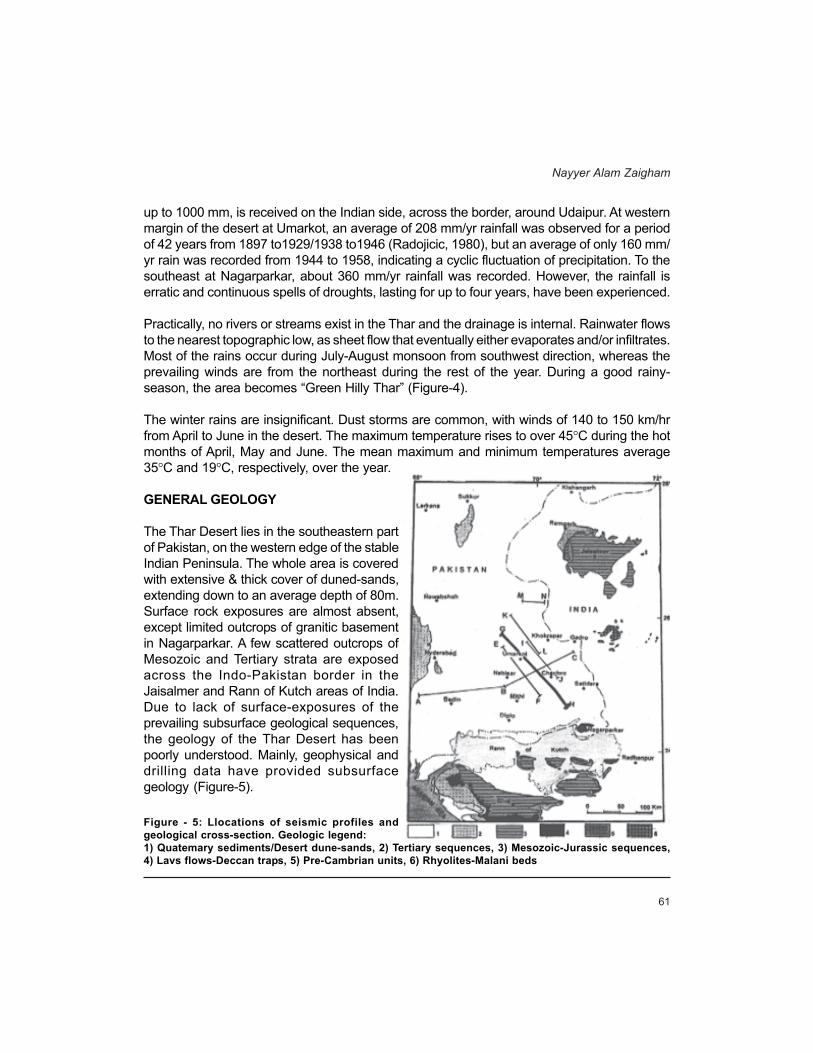
61
up to 1000 mm, is received on the Indian side, across the border, around Udaipur. At westernmargin of the desert at Umarkot, an average of 208 mm/yr rainfall was observed for a periodof 42 years from 1897 to1929/1938 to1946 (Radojicic, 1980), but an average of only 160 mm/yr rain was recorded from 1944 to 1958, indicating a cyclic fluctuation of precipitation. To thesoutheast at Nagarparkar, about 360 mm/yr rainfall was recorded. However, the rainfall iserratic and continuous spells of droughts, lasting for up to four years, have been experienced.
Practically, no rivers or streams exist in the Thar and the drainage is internal. Rainwater flowsto the nearest topographic low, as sheet flow that eventually either evaporates and/or infiltrates.Most of the rains occur during July-August monsoon from southwest direction, whereas theprevailing winds are from the northeast during the rest of the year. During a good rainy-season, the area becomes “Green Hilly Thar” (Figure-4).
The winter rains are insignificant. Dust storms are common, with winds of 140 to 150 km/hrfrom April to June in the desert. The maximum temperature rises to over 45°C during the hotmonths of April, May and June. The mean maximum and minimum temperatures average35°C and 19°C, respectively, over the year.
GENERAL GEOLOGY
The Thar Desert lies in the southeastern partof Pakistan, on the western edge of the stableIndian Peninsula. The whole area is coveredwith extensive & thick cover of duned-sands,extending down to an average depth of 80m.Surface rock exposures are almost absent,except limited outcrops of granitic basementin Nagarparkar. A few scattered outcrops ofMesozoic and Tertiary strata are exposedacross the Indo-Pakistan border in theJaisalmer and Rann of Kutch areas of India.Due to lack of surface-exposures of theprevailing subsurface geological sequences,the geology of the Thar Desert has beenpoorly understood. Mainly, geophysical anddrilling data have provided subsurfacegeology (Figure-5).
Figure - 5: Llocations of seismic profiles andgeological cross-section. Geologic legend:1) Quatemary sediments/Desert dune-sands, 2) Tertiary sequences, 3) Mesozoic-Jurassic sequences,4) Lavs flows-Deccan traps, 5) Pre-Cambrian units, 6) Rhyolites-Malani beds
Nayyer Alam Zaigham

62
Figure 6: Geological cross-section of the Thar Rift interpreted from seismic data(Zaigham and Ahmad, 1996)
Figure 7: Generalized lithological column representing the stratigraphic units encountered in holesdrilled for coal exploration and also showing hydrogeological conditions in the
Thar Desert (modified after JTB, 1994).
Strategic Sustainable Development of Groundwater in Thar Desert of Pakistan
63
The interpretation of seismic-data (Zaigham and Ahmad, 1996) shows that the Thar Desertrests upon a structural platform where granitic basement is at shallower depths (Figure-6).The granite basement has pre-Jurassic rifting, which caused flexure and the ultimatedevelopment of the Thar basin. The basement shows rise towards southeast and deepeningtowards northwest, as a result of Paleozoic-Mesozoic divergent tectonics. The consistentdepositional trends of the stratigraphic sequences from Mesozoic to Tertiary periods indicatethat the incipient rifting of the basement was pre-depositional. The younger formations arepreserved and overlie the older in the northwestern part, where geological sequences arewell developed. The older formations may be encoun-tered at greater depths towards thebasin and shallower on the continental shelf area towards southeast.
Results of the geo-electric, drilling and geophysical/geological log data (Rehman et al., 1993:Fassett and Durrani, 1994; Zaigham and Ahmed, 1996) indicate four major divisions oflithological sequences almost throughout the Thar Desert (Figure-7).
Dune Zone: This zone consists of well-sorted eolian sand. The soils of the desert containabout 8 % clay and silt, near the surface and about 15 % clay and silt in the subsoil (Kazmi,1985; Qadri, 1983). The thickness of this sand-zone varies from north to south. It is thinner inthe northern part of the desert, about 5 to 15 m thick in Gadro-Khokhrapar area. The thicknessincreases from about 40 to 93 m in the central and southern Thar in Chachro-Islamkot-Mithiarea.
Oxidized Zone: It consists of compact and loose clays, silts and sands with ironstoneconcretions and siderite nodules. This litho-unit is distinguished from other subsurface unitsby its iron oxide and limonite stainings. The thickness of this zone ranges from 11 to 209 m.The age of this unit is considered Sub-Recent (Fassett & Durrani, 1994). This oxidized zonelies unconformably over the coal-bearing formation.
Coal-Bearing Formations: The coal-bearing sequence consists of claystones, siltstones,sandstones and lignite, with intercalations of siderite bands, nodules and granite-wash atplaces. The thickness of this sequence ranges from zero to 185 m, hosting lignite beds with acumulative thickness ranging from 0.5 to about 34 m.
Basement Complex: Granitic basement is encountered at depths ranging from 112 to 279 min holes drilled in the east and southeast of Chachro (Fassett & Durrani, 1994). On the otherhand, rhyolitic/basaltic basement was reported in a well near Pabban locality, about 8 kmsouth of Gadro (Hindel, 1980). Further south along the border with India, the dioritic basementwas reported, encountered at 253 m depth in a drill hole (Ploethner, 1992).
Based on the geoelectrical resistivity survey, this basement complex, having high resistivity of50 to 150 Ùm, was interpreted to be a deep fissured sandstone aquifer, bearing fresh water,by Schildknecht & others (1991) under the WAPDA-BGR Groundwater Exploration Project.
Nayyer Alam Zaigham
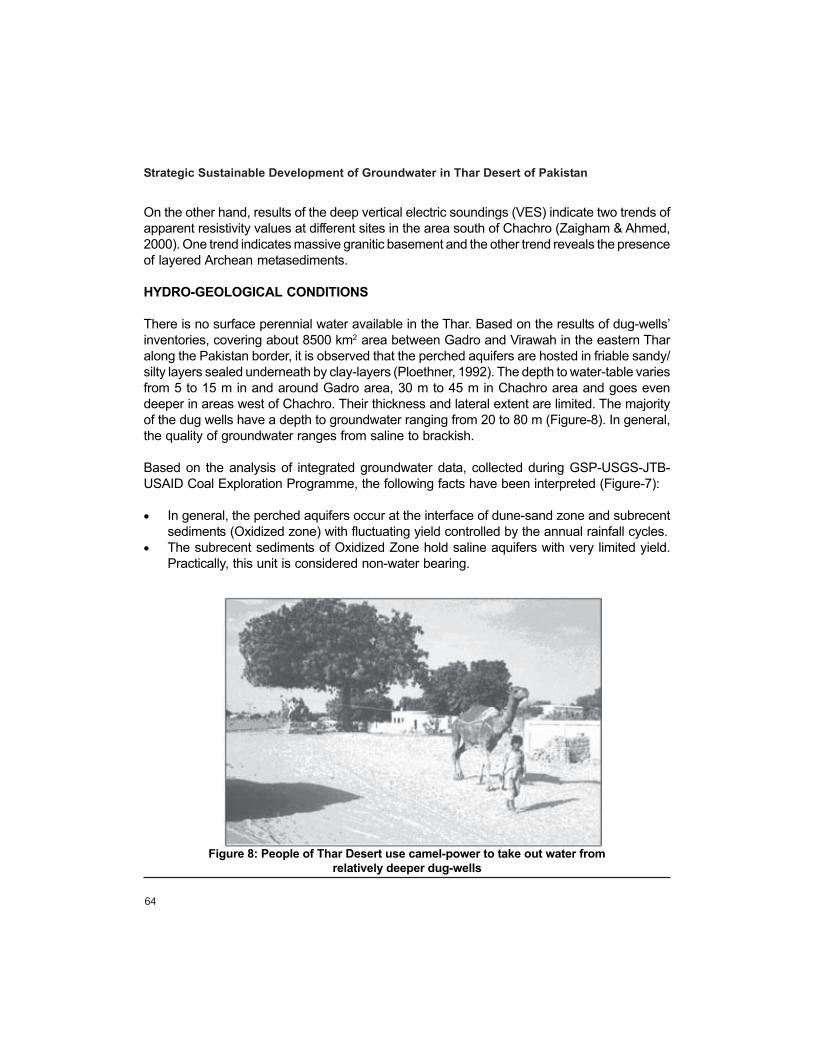
64
On the other hand, results of the deep vertical electric soundings (VES) indicate two trends ofapparent resistivity values at different sites in the area south of Chachro (Zaigham & Ahmed,2000). One trend indicates massive granitic basement and the other trend reveals the presenceof layered Archean metasediments.
HYDRO-GEOLOGICAL CONDITIONS
There is no surface perennial water available in the Thar. Based on the results of dug-wells’inventories, covering about 8500 km2 area between Gadro and Virawah in the eastern Tharalong the Pakistan border, it is observed that the perched aquifers are hosted in friable sandy/silty layers sealed underneath by clay-layers (Ploethner, 1992). The depth to water-table variesfrom 5 to 15 m in and around Gadro area, 30 m to 45 m in Chachro area and goes evendeeper in areas west of Chachro. Their thickness and lateral extent are limited. The majorityof the dug wells have a depth to groundwater ranging from 20 to 80 m (Figure-8). In general,the quality of groundwater ranges from saline to brackish.
Based on the analysis of integrated groundwater data, collected during GSP-USGS-JTB-USAID Coal Exploration Programme, the following facts have been interpreted (Figure-7):
• In general, the perched aquifers occur at the interface of dune-sand zone and subrecentsediments (Oxidized zone) with fluctuating yield controlled by the annual rainfall cycles.
• The subrecent sediments of Oxidized Zone hold saline aquifers with very limited yield.Practically, this unit is considered non-water bearing.
Figure 8: People of Thar Desert use camel-power to take out water fromrelatively deeper dug-wells
Strategic Sustainable Development of Groundwater in Thar Desert of Pakistan

65
• The coal-bearing sedimentary sequence hosts a number of confined aquifers underartesian pressure, with significant yield and acceptable quality [range: 4000 - 5000 µS/cm].
• The upper part contains generally thin layers of aquifers, but the lower part containssignificantly thick and brackish aquifers.
• Analyses of the geophysical logs show that coal-bearing formations generally contain asignificant sandstone aquifer above the Coal Seam Zone-A, with thickness ranging fromzero to 22 m. Occasional sandstone aquifer is also reported between Coal Seam Zone Band C, with thickness ranging from zero to 21 m. A large sandstone aquifer is encounteredbelow the Coal Seam Zone C, with thickness ranging from zero to 34 m. All aquifers in thecoal formation are under pressure (Figure-7).
• Electrical conductivity values of the ground water associated with deep aquifers are inacceptable range, between 4,000 and 5,000 µS/cm. The measurements of the field-conductivity indicated brackish quality of these aquifers.
• Results of pumping-test indicate nearly immediate recharge of the aquifers. It has alsobeen found that, after a longer pumping, the quality of deep ground water aquifers improves.
GROUNDWATER QUALITY
In Thar Desert, the ground water tapped by 83 % of dug wells has an electrical conductivity(EC) value ranging from 2000 µS/cm to more than 10,000 µS/cm. Thus, under normal standard,such quality of water is unfit for human consumption, but the water with EC of 5,000 µS/cm isconsidered drinkable under duress for the arid region. As such, 48 % of the water in the dugwells may be considered fit for human consumption in the area.
Figure-9 shows the distribution of electrical conductivity (EC) of groundwater in the Thar Desert.The distribution-pattern indicates three prominent good-quality groundwater zones. In thenorthern part, EC values less than 3000 µS/cm prevail, exclusively associated with the perchedaquifers encountered in the shallow dug-wells. The perched aquifers contain mostly fairlygood to brackish groundwater, but show extreme lateral variation in ground-water salinityover small distances.
The area between Gadro/Khokrapar and Chachro is dominated by EC values greater than10,000 µS/cm, indicating poor groundwater prospects. In the central part, south and southeastof Chachro extending from Pakistan-India border to Islamkot, EC values between 2,000 and5,000 µS/cm are found, particularly in the relatively deeper aquifer(s). The hydrogeologicaldata indicate good groundwater prospects, particularly associated with deep-seatedsedimentary aquifers. Another good prospective area is reflected by the EC values rangingfrom less than 2,000 to 3,000 µS/cm, in and around Nagarparkar, where the basement unitsare exposed. In the area between the central zone and Nagarparkar, EC measurements ofthe dug well water (values mainly range from 5,000 to 10,000 µS/cm) indicate brackish tosaline water- quality. In this area, deep sedimentary aquifers have not been explored in detail.
Nayyer Alam Zaigham

66
Occurrences of better groundwater (EC: < 2000 µs/cm) are associated only with the exposedgranite unit in Nagarparkar area (Fig.9), where basement is exposed otherwise no good-quality groundwater is so far exploited, associated with the basement at deeper depthsthroughout the Thar region. At places, vertical electric soundings have indicated good prospectsfor the good quality groundwater associated with the basement complex (Figure-10).
REGIONAL GRADIENTS
Basic tendency of water is to flow to the lowest topography on the down slope. In view of thisphysical property, the regional gradient-maps of surface and major subsurface interfaces
Figure - 9: Distribution of electrical conductivity of groundwater in the Thar Desert
Strategic Sustainable Development of Groundwater in Thar Desert of Pakistan
Figure 10: Deep vertical electric sounding shows layered basement indicatinggroundwater potential in basement units
Source: JTB, 1994; Ploethner, 1992; GSP, 1962

67
have been generated to study the surface and the subsurface water-movements in the TharDesert. For this study, the spot elevations and the collar elevation of the drill holes have beenused. The drill holes are located more or less on uniform grid, covering almost the whole TharDesert. Moreover, all the holes were drilled in the interdunal valleys.
Surface Gradient
Figure-11 presents the smoothened topographic map to illustrate the regional surface-gradients.Three surface-gradient trends are distinct across the Thar Desert. Originating from northeasterncorner of the study area, one trend is towards west, approaching Nabisar-Umarkot area, andthe other trend is towards south, approaching Islamkot area. There is a significant change inregional gradient striking in east-west direction along Mithi-Islamkot area. South of Mithi-Islamkot alignment, there is a west-trending gradient, starting probably from the western edgeof the subsurface continuation of the Nagarparkar basement complex.
Gradient at Top of Oxidized Zone
Figure-12 shows depth-contours on top of the zone of subrecent sediment or the bottom ofthe dune zone. The trend of contours shows that the gradient-pattern is more or less similar to
Figure 11: Map showing smoothened topography of the Thar Desert illustrating regionalgradient trends which control over-all movements of water-recharge conditions
Nayyer Alam Zaigham

68
the surface-gradient trend. Thus, it is inferred that the depositional environments for the OxidizedZone were initially similar to those under which the Dune Zone was deposited. In the southeastof Chachro, there is a significant subsurface mound-like body, indicating a possible differentialerosional feature. Moreover, there is also a marked change of south-trending gradient inMithi-Islamkot area. South of this area, the main gradient is towards the west, as in the caseof the surface-gradient trend.
Figure 12: Subsurface configuration of top of the Oxidized Zone in Thar Desert.Arrows show major gradient trends
Figure 13: Subsurface configuration of top of coal-bearing formation beneath theSubrecent Oxidized Zone in the Thar Desert
Strategic Sustainable Development of Groundwater in Thar Desert of Pakistan
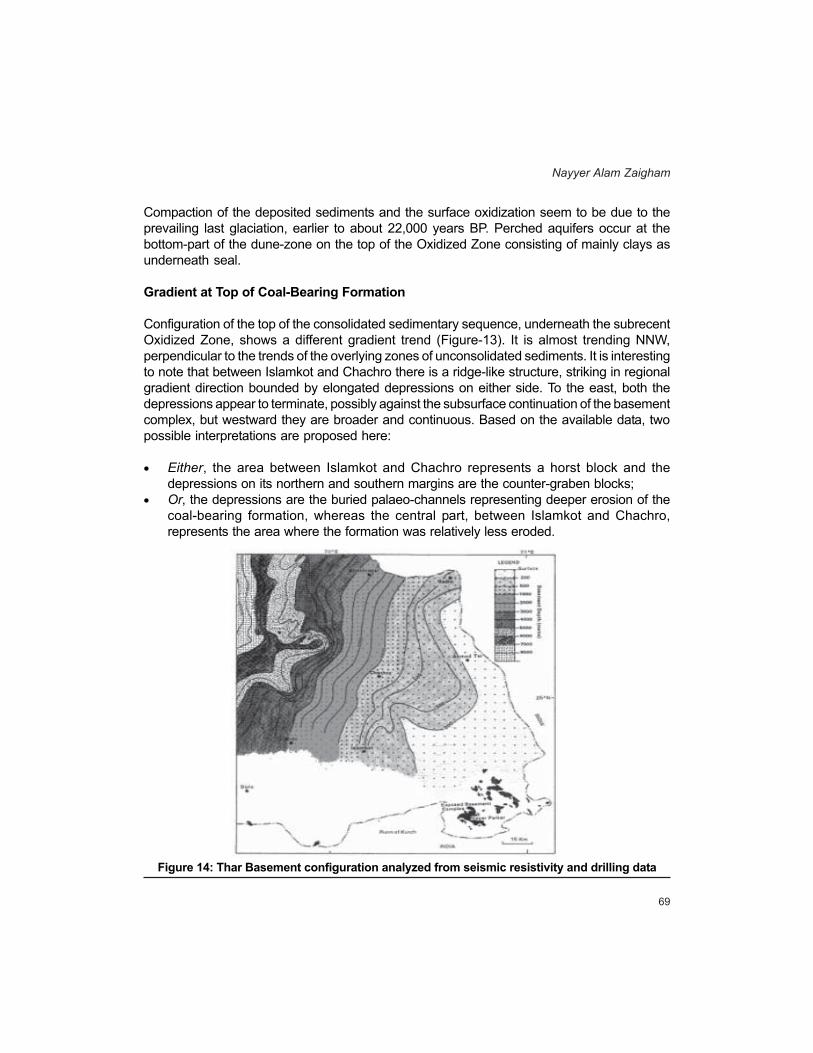
69
Compaction of the deposited sediments and the surface oxidization seem to be due to theprevailing last glaciation, earlier to about 22,000 years BP. Perched aquifers occur at thebottom-part of the dune-zone on the top of the Oxidized Zone consisting of mainly clays asunderneath seal.
Gradient at Top of Coal-Bearing Formation
Configuration of the top of the consolidated sedimentary sequence, underneath the subrecentOxidized Zone, shows a different gradient trend (Figure-13). It is almost trending NNW,perpendicular to the trends of the overlying zones of unconsolidated sediments. It is interestingto note that between Islamkot and Chachro there is a ridge-like structure, striking in regionalgradient direction bounded by elongated depressions on either side. To the east, both thedepressions appear to terminate, possibly against the subsurface continuation of the basementcomplex, but westward they are broader and continuous. Based on the available data, twopossible interpretations are proposed here:
• Either, the area between Islamkot and Chachro represents a horst block and thedepressions on its northern and southern margins are the counter-graben blocks;
• Or, the depressions are the buried palaeo-channels representing deeper erosion of thecoal-bearing formation, whereas the central part, between Islamkot and Chachro,represents the area where the formation was relatively less eroded.
Figure 14: Thar Basement configuration analyzed from seismic resistivity and drilling data
Nayyer Alam Zaigham
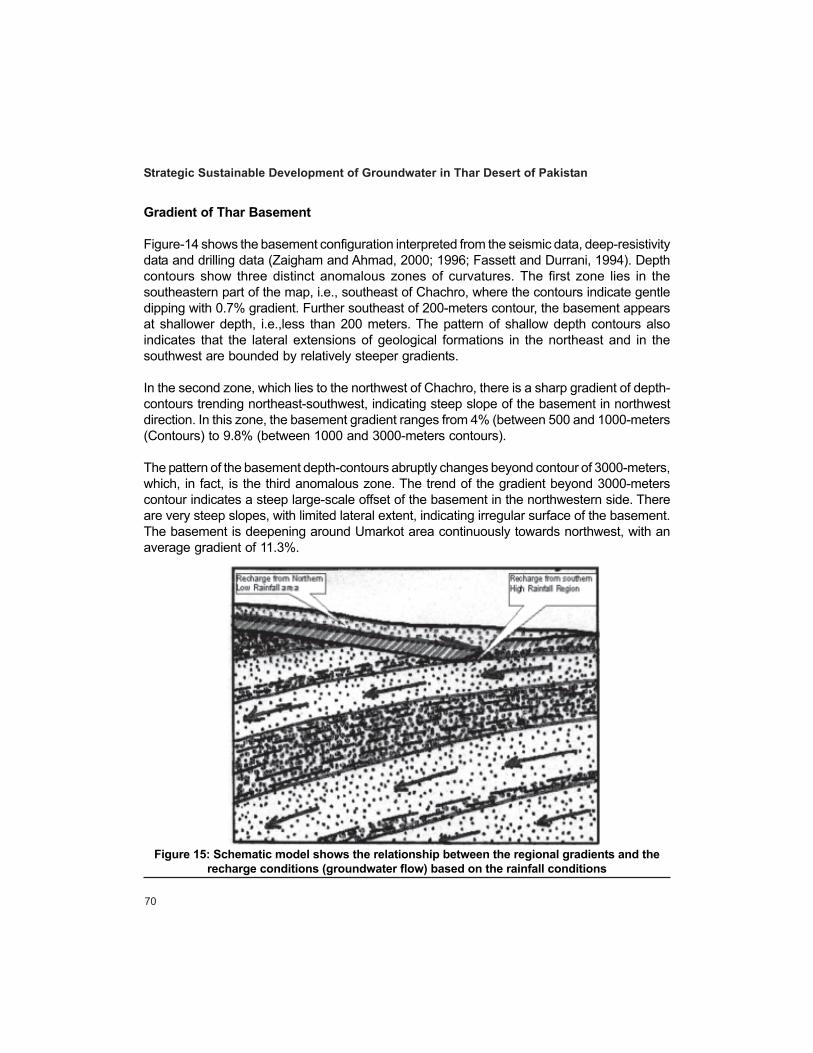
70
Gradient of Thar Basement
Figure-14 shows the basement configuration interpreted from the seismic data, deep-resistivitydata and drilling data (Zaigham and Ahmad, 2000; 1996; Fassett and Durrani, 1994). Depthcontours show three distinct anomalous zones of curvatures. The first zone lies in thesoutheastern part of the map, i.e., southeast of Chachro, where the contours indicate gentledipping with 0.7% gradient. Further southeast of 200-meters contour, the basement appearsat shallower depth, i.e.,less than 200 meters. The pattern of shallow depth contours alsoindicates that the lateral extensions of geological formations in the northeast and in thesouthwest are bounded by relatively steeper gradients.
In the second zone, which lies to the northwest of Chachro, there is a sharp gradient of depth-contours trending northeast-southwest, indicating steep slope of the basement in northwestdirection. In this zone, the basement gradient ranges from 4% (between 500 and 1000-meters(Contours) to 9.8% (between 1000 and 3000-meters contours).
The pattern of the basement depth-contours abruptly changes beyond contour of 3000-meters,which, in fact, is the third anomalous zone. The trend of the gradient beyond 3000-meterscontour indicates a steep large-scale offset of the basement in the northwestern side. Thereare very steep slopes, with limited lateral extent, indicating irregular surface of the basement.The basement is deepening around Umarkot area continuously towards northwest, with anaverage gradient of 11.3%.
Figure 15: Schematic model shows the relationship between the regional gradients and therecharge conditions (groundwater flow) based on the rainfall conditions
Strategic Sustainable Development of Groundwater in Thar Desert of Pakistan
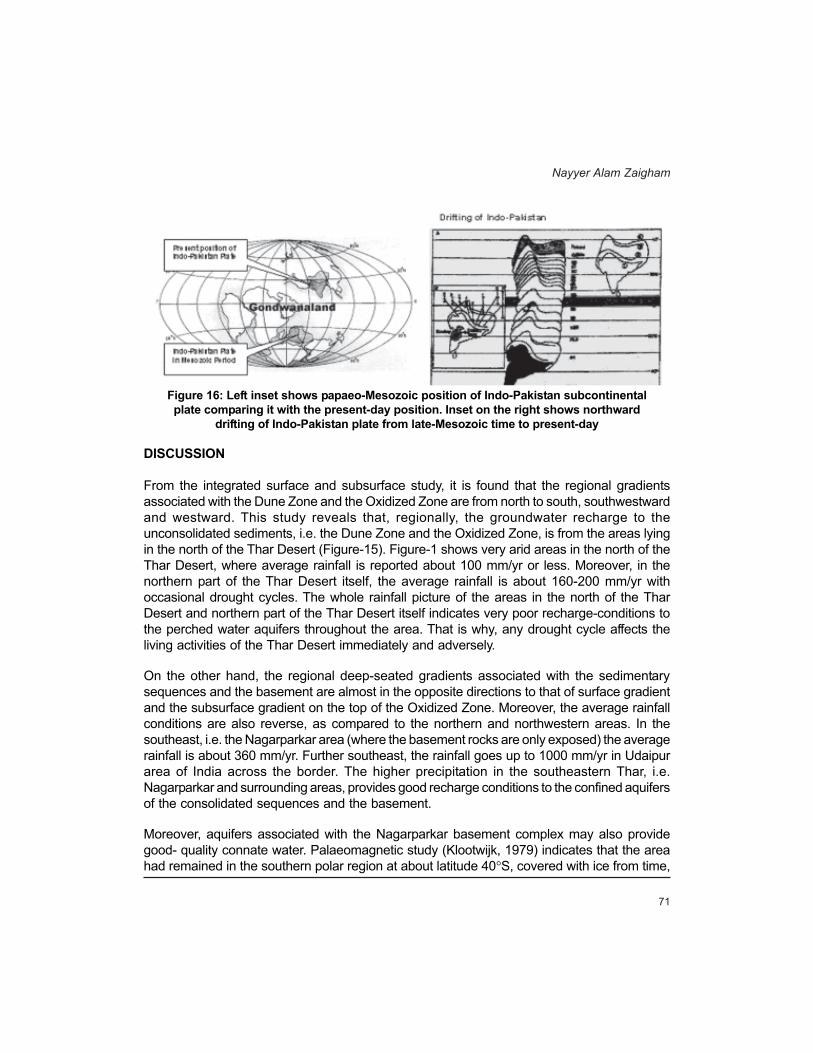
71
DISCUSSION
From the integrated surface and subsurface study, it is found that the regional gradientsassociated with the Dune Zone and the Oxidized Zone are from north to south, southwestwardand westward. This study reveals that, regionally, the groundwater recharge to theunconsolidated sediments, i.e. the Dune Zone and the Oxidized Zone, is from the areas lyingin the north of the Thar Desert (Figure-15). Figure-1 shows very arid areas in the north of theThar Desert, where average rainfall is reported about 100 mm/yr or less. Moreover, in thenorthern part of the Thar Desert itself, the average rainfall is about 160-200 mm/yr withoccasional drought cycles. The whole rainfall picture of the areas in the north of the TharDesert and northern part of the Thar Desert itself indicates very poor recharge-conditions tothe perched water aquifers throughout the area. That is why, any drought cycle affects theliving activities of the Thar Desert immediately and adversely.
On the other hand, the regional deep-seated gradients associated with the sedimentarysequences and the basement are almost in the opposite directions to that of surface gradientand the subsurface gradient on the top of the Oxidized Zone. Moreover, the average rainfallconditions are also reverse, as compared to the northern and northwestern areas. In thesoutheast, i.e. the Nagarparkar area (where the basement rocks are only exposed) the averagerainfall is about 360 mm/yr. Further southeast, the rainfall goes up to 1000 mm/yr in Udaipurarea of India across the border. The higher precipitation in the southeastern Thar, i.e.Nagarparkar and surrounding areas, provides good recharge conditions to the confined aquifersof the consolidated sequences and the basement.
Moreover, aquifers associated with the Nagarparkar basement complex may also providegood- quality connate water. Palaeomagnetic study (Klootwijk, 1979) indicates that the areahad remained in the southern polar region at about latitude 40°S, covered with ice from time,
Figure 16: Left inset shows papaeo-Mesozoic position of Indo-Pakistan subcontinentalplate comparing it with the present-day position. Inset on the right shows northward
drifting of Indo-Pakistan plate from late-Mesozoic time to present-day
Nayyer Alam Zaigham

72
to time as a part of the Gondwanaland during Paleozoic-Proterozoic time (Figure-16). DuringPaleozoic time, intracontinental rifting developed flexure basins and associated fault systems,with a number of fracture zones, due to the stretching of the upper crustal part of theGondwanaland (Zaigham et. al, 2000). Such rift-basins and ice-covers created a number ofsweet-water lakes, which might have served as the source of sweet water for the basementaquifers. Seismic study illustrates the presence of the deep-seated pre-Mesozoic fossil rift inthe Thar Desert of Pakistan (Figure-6). In addition, at places, the earth-resistivity soundingshave also indicated good prospects for good-quality groundwater associated with the basementcomplex (Zaigham and Ahmed, 2000).
Based on exploitation of the deeper water resources associated with sedimentary sequencesand the basement rock units, a better socio-economic development of Thar Desert could bepossible. If due attention is paid to the results of the present investigations, significant sustainableagricultural targets could be achieved since, already, Nature has created environments tostabilize sanddunes, siltification in interdunal valleys, and significantly encouraging rainfallconditions.
CONCLUSIONS
1. The present study indicates remarkable groundwater potential in the Thar Desert. Threesources have been identified: the bottom of the Dune Zone, the coal-bearing sedimentaryunits, and the basement.
2. In general, the regional gradients of the surface and top of the subrecent zone are towardssouth and southwest. The aquifers at the bottom of the Dune Zone significantly vary inquality (saline to brackish) as well as in their yield, being dependent on rainfall in thenorthern areas, where the annual average is about 150 mm. The quality of water rangesfrom bad to marginal, but is usable under duress. These aquifers are the main source ofwater in the Thar at present.
3. The regional gradient of the tops of the coal-bearing sedimentary units and the basementare towards northwest. The rainfall conditions in the southeast are generally good; theannual average is 360 mm around Nagarparkar. Moreover, further southeast, it increasesup to 1000 mm in the Udaipur area. The recharge condition of the aquifers associatedwith the coal-bearing sedimentary units and basement is excellent, as compared to thatat the bottom of the Dune Zone. The quality of water found in coal-bearing sedimentaryunits is generally brackish, whereas in the basement it is sweet.
4. In general, research-approach is lacking; in order to boost socio-economic developmentin Thar Desert, more detailed research studies are imperative for the formulation of ascientific systematic future strategy for exploration and development of deep waterresources associated with sedimentary sequences and basement.
5. Due attention to groundwater-research activities can de-desertify the area, since Naturehas already created conducive environments to stabilize dune sands, give better siltificationin valleys, and significantly encouraging rainfall conditions.
Strategic Sustainable Development of Groundwater in Thar Desert of Pakistan

73
REFERENCES
– Baanhn Beli, 1990, A friend for ever: Booklet on B. Beli-a people’s development alliance, Karachi,54p.
– Fassett, J. E. and Durrani, N. A., 1994, Geology and coal resources of the Thar coal field, SindhProvince, Pakistan: US Geological Survey open-file report 94-167, 74p.
– Hindel, R., 1980, Geochemical prospecting for uranium in the Tharparkar desert, Pakistan: GermanFederal Institute for Geosciences and Natural Resources (BGR) Report #. 80, Archives No. 85938,28p.
– JTB, 1994, Preliminary assessment of the lignite resources and surface mining potential, Thar coaldeposit, Tharparkar district, Sind Province, Pakistan: John T. Boyd Co. Report 2150.6, 34p.
– Klootwijk, C.T., 1979, A review of palaeomagnetic data from the Indo-Pakistan fragment ofGondwanaland: In Geodynamics of Pakistan, A. Farah & K.A. DeJong (eds.), Geological Survey ofPakistan, Quetta, p.41-80.
– Kazmi, A.H., 1985, Geology of the Thar desert, Pakistan: Acta Mineralogica Pakistanica, v. 1, p. 64-67.
– Margane, A., 1991, Paleoclimate and groundwater recharge during the past 30,000 years in Cholistan,Pakistan: German Federal Institute for Geosciences and Natural Resources report Archives No.107832, vol. 2B, 31p.
– Ploethner, D., 1992, Groundwater investigations in desert areas of Pakistan: German Federal Institutefor Geosciences and Natural Resources report Archives No. 108858, vol.2, p. 84-135.
– Qadri, S. M. A., 1983, Thar desert: Situation Paper, Irrigation Drainage & Flood Control ResearchCouncil Pakistan, Islamabad, 52p.
– Rehman, M. U., Zaigham, N. A., Nizamani, M. A., Ahmad, M., and Huda, Q. U., 1993, Coal explorationin Tharparkar, Sindh, Pakistan: Geol. Surv. Pak. Record No. 95, 35p.
– Rodojicic, S. S., 1980, Report on water resources survey for Tharparkar water supply: UNICEFIslamabad, vol. 1, 86p.
– SAZDA, 1988, Special development programme for Sind Arid Zone during seventh five year plan(1988-1993): Planning & Development Department, Government of Sind, Karachi, 124p.
– Schildkneccht, F., 1991, Geoelectrical investigations in Tharparkar: Technical Cooperation Projectno. 84.2066.3 BGR, Hannover, 19p.
– Zaigham, N. A. and Ahmad, M. A., 1996, Thar rift and its impact on the coal bearing horizons in theTharparkar region of south-eastern Pakistan: Proceedings of Second SEGMITE InternationalConference, Azmat A.K., Qamar U.H. and Viqar, H. (eds.), p. 96-100.
– Zaigham, N. A. and Ahmed, A., 1996, Subsurface scanning for coal zones and basement in theThar desert of Sindh province, Pakistan: Proceedings of Second SEGMITE International Conference,Azmat A.K., Qamar U.H. and Viqar, H. (eds.), p. 101-107.
– Zaigham, N. A. and Ahmed, A., 2000, Experimental resistivity scanning approach to delineate coalzones and the basement in Thar Desert of Sindh, Pakistan: Acta Mineralogica Pakistanica, v.11,p.129-136, and 2001.
– Zaigham, N. A. and Ahmed, A., Hissam, N., 2000, Thar rift and its significance for hydrocarbon:Special joint publication of Pakistan Association of Petroleum Geologists and Society of PetroleumEngineers, Islamabad, p.117-130, Nov. 2000.
Nayyer Alam Zaigham

A
Mathematical Modeling of theUpper-Indus Glaciers
Khalid Rashid

75
ABSTRACT
Acute water-crisis last summer lead to the desperate suggestion that water-needs couldbe met by melting the water-resources frozen as glaciers in northern areas of Pakistan,Northern areas are a precious resource, both for the high lands and the low lands, andthis resource needs to be sustained for the survival of our civilization. This is of fundamentalimportance in the light of global warming and world-wide glacier recession. This articlepresent the characteristics of the Upper Indus Glaciers and suggest ways to model andunderstand the northern areas, in order to help in attaining the sustainability of this resource.
INTRODUCTION
In the spring of 2001, Pakistan was seriously considering the option of melting upper-Indus glaciers to meet the acute shortage of water. Since substantial water-flow of theUpper Indus River originates from zones of heavy snow and glacierized basins inKarakorum and Himalayan region, it is no surprise that this idea found its way to near-acceptance at the highest level of authorities. These authorities saw in it a hope to providea quick relief to water-starved areas. Natural systems, like the northern areas of Pakistanare non-linear systems that are in a quasi-steady state. Tampering with these systemswould disturb the balance and result in serious and unforeseen disastrous ecological andsocial consequences. Amazing, however, is the fact that this idea caught the fancy of theauthorities at a time when the Glaciers in the Himalayas are melting at a rapid rate, whilenations debate cuts in greenhouse gases (Marquand). These 15,000 glaciers constitutethe largest body of ice in the world, apart from the two polar ice-caps. Their runoff feedsthe Indus and the Ganges rivers, whose waters sustain 500 million people in the Indo-Gangetic plains
The very presentation of this idea to melt glaciers reveals the lack of basic understandingof the Upper-Indus Basin glaciers and their relationship with the Indus- valley river system,the life-giver to the Indus Civilization that now forms Pakistan. The northern areas, itshigh mountains, glaciers and deep valleys, are a very precious resource for both thehighlands and the lowlands and this resource we must understand as best we can, sothat we are able to utilize it in a sustainable way. To understand and model the northernareas, much basic research should be undertaken. This is no easy task; yet it is absolutelynecessary for the survival of Indus Valley Civilization. In this paper, we present a simpleintroduction to glaciers, a numerical example of glacial motion and a general overview ofthe Upper-Indus Basin glaciers and suggest steps to initiate research and modeling ofthis system.
MATHEMATICAL MODELING OF THE UPPER-INDUSGLACIERS

76
Mathematical Modeling of the Upper-Indus Glaciers
FORMATION OF GLACIERS
A large mass of ice that is on land, and shows evidence of being in motion or of oncehaving moved, is called a glacier. The movement of glaciers is now invested with a newand practical interest for humans: early warning of global climatic changes may be indicatedby advances or retreats of glaciers. Glaciers exist on all continents, except Australia, andat virtually all latitudes from the tropics to the poles. High latitudes and high altitudes havesomething in common, for they are both cold. Mountain glaciers, such as those that existat higher elevations in mid-latitudes and tropics, are particularly sensitive indicators ofclimate-change.
Glaciers do not just freeze, they grow by a gradual transformation of snow into glacier ice.A fresh snowfall is a fluffy mass of loosely packed snowflakes, which are small, delicateice crystals, grown in the atmosphere. As the snow ages on the ground, for weeks ormonths, the crystals shrink and become more compact, and the whole mass becomessqueezed together into a more dense form, called granular snow. As new snow falls andburies the older snow, the layers of granular snow are further compacted to form a muchdenser kind of snow, usually a year or more old, with little pore-space. Further burial andslow cementation – a process by which crystals become bound together in a mosaic ofinter-grown ice crystals-finally produce solid glacial ice. The whole process may takefrom a few to twenty years. The snow is usually many meters deep, by the time the lowerlayers are converted to ice.
The formation of a glacier is complete when ice has accumulated to a thickness sufficientto make the ice move slowly under its own pressure. When this point is reached, the iceflows downhill, either as a tongue of ice filling a valley or a thick ice-cap that flows out inall directions from the highest central area where most snow accumulates. In mid-lati-tudes, such as Karakorum region, ice melts and evaporates as it flows to lower eleva-tions. Of the total amount of water on earth (1388x1015 m3) 97.3 % is in oceans and 2.7%in fresh-water reservoirs. Of this 2.7 %, the glaciers account for 77%, i.e. 29x1015 m3,acquifiers 22%, lakes and rivers 0.0053% and 000345% is in the atmosphere. If all theglaciers were to melt, the sea level would rise by about 70 meters worldwide. Changes inglaciers seem to be quite sensitive to global climate-changes. Of the numerous physicalsystems on Earth, glaciers are one of most responsive to climate-change. This is reasonenough to study and understand the changes seen and expected in the Karakorum/Himalaya glaciers.
THE BUDGET OF A GLACIER
During winter, the typical glacier grows slightly as snow falls everywhere on the ice surface.In summer, the glacier shrinks, mainly as the snow on the surface of the lowermost reachesmelts and evaporates to uncover solid ice, while the upper reaches stay snow-covered.

77
The annual growth budget of a glacier is the amount of solid water added by snow, theaccumulation, minus the amount lost, called ablation. The difference between accumulationand ablation is a measure of either growth or shrinkage of a glacier. Glacier budgetsfluctuate from year to year, and many show long-term trends of growth or shrinkage, inresponse to climate variations over periods of many decades. In temperate climates,ablation occurs mainly by melting under the Sun’s rays and less by evaporation. Warm airmay blow over lower regions and speed the melting further; the air becomes chilled in theprocess. If the air is humid, it may precipitate rain, causing even more ablation. The meltwaters from Upper Indus Basin glaciers and high altitudes in northern areas are the mainsource of water in the Indus and its western tributaries and are therefore a question ofsurvival for Pakistan.
HOW ICE MOVES
Once the ice on a slope builds to a great enough thickness, it moves throughout its bulkby internal sliding or flowing movement, as well as its base. The internal flow throughoutthe ice accounts for much of its motion. Under the stress of its weight, the individual icecrystals slip tiny distances of about 10-7 of a millimeter in short time intervals. The sumtotal of all these movements of enormous number of ice crystals over longer time periods,amounts to larger movements of the whole mass. This movement is similar to themovements shown by some metals, which slowly creep when subjected to a strong stress.Other processes that give rise to movement are also at work. Ice crystals tend to melt and
Figure-1: How ice flows in a typical valley glacier. The rate of movement decreasestowards the base. If the temperature at the base is sufficiently high than the ice pressure
will cause melting, the entire thickness of the glacier will start sliding along the liquid layernext to the ground (Press and Siever)
Khalid Rashid
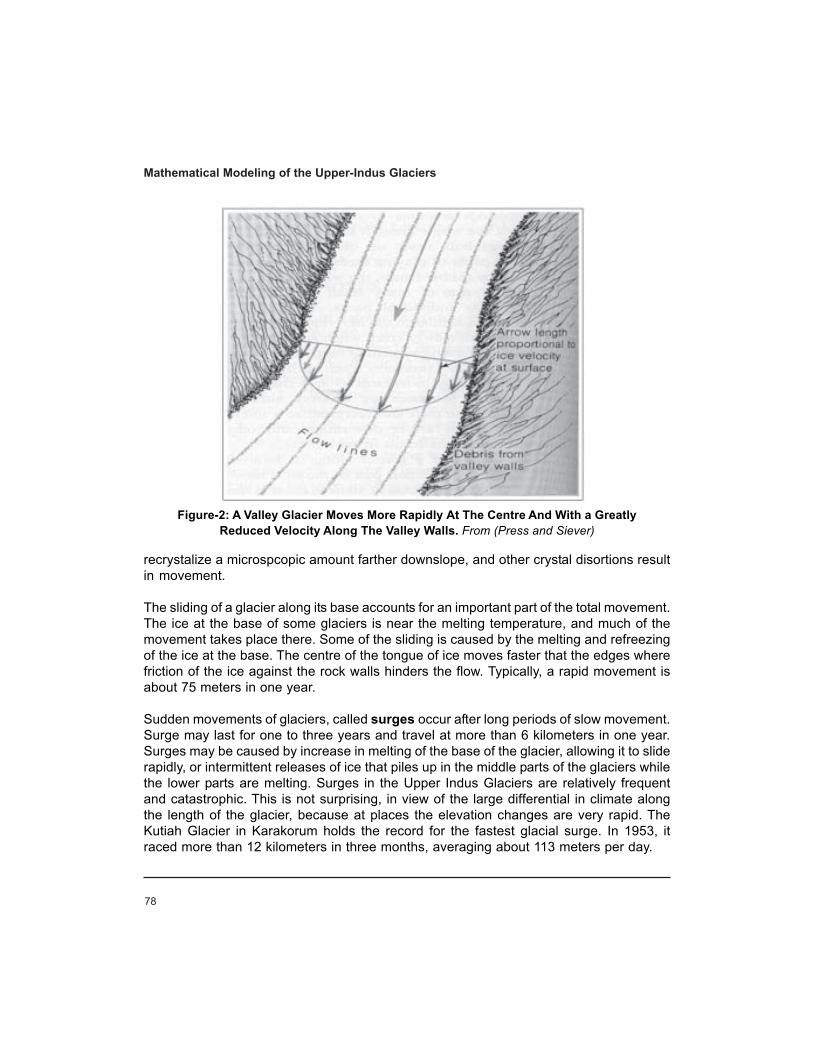
78
recrystalize a microspcopic amount farther downslope, and other crystal disortions resultin movement.
The sliding of a glacier along its base accounts for an important part of the total movement.The ice at the base of some glaciers is near the melting temperature, and much of themovement takes place there. Some of the sliding is caused by the melting and refreezingof the ice at the base. The centre of the tongue of ice moves faster that the edges wherefriction of the ice against the rock walls hinders the flow. Typically, a rapid movement isabout 75 meters in one year.
Sudden movements of glaciers, called surges occur after long periods of slow movement.Surge may last for one to three years and travel at more than 6 kilometers in one year.Surges may be caused by increase in melting of the base of the glacier, allowing it to sliderapidly, or intermittent releases of ice that piles up in the middle parts of the glaciers whilethe lower parts are melting. Surges in the Upper Indus Glaciers are relatively frequentand catastrophic. This is not surprising, in view of the large differential in climate alongthe length of the glacier, because at places the elevation changes are very rapid. TheKutiah Glacier in Karakorum holds the record for the fastest glacial surge. In 1953, itraced more than 12 kilometers in three months, averaging about 113 meters per day.
Figure-2: A Valley Glacier Moves More Rapidly At The Centre And With a GreatlyReduced Velocity Along The Valley Walls. From (Press and Siever)
Mathematical Modeling of the Upper-Indus Glaciers

79
AN EXAMPLE FROM THE THEORY OF GLACIAL MOTION
A non-linear differential equation in two independent variables furnishes a mathematicaldescription of the conditions in a glacier, particularly in the glacier tongue, or ablator, andappears in the following form (Finsterwalder).
It pertains to a central longitudinal section of a glacier moving down a slightly inclined,straight bed.
The variables u and x refer to oblique axes in the plane of the section: u(x,t) is the verticaldepth of the ice at time t at a distance x along the bed. (Figure-3). The velocity distributionis assumed to be of the form v = κun, where κ depends on the slope of the bed and the
exponent n is a constant lying between 41
and 21
. The remaining symbol is an ablation
constant; it represents the annual melting on horizontal surfaces. This particular examplehere concerns a receding glacier on a very flat bed.
Let the shape of the longtitudinal section of the glacier at time t = 0 be given indimensionsless variables by
nd for numerical values of the parameters take n = 31
, κ = 0.075, a = 21
. Then Equation
(1) becomes
The characteristics equations for equation (1) read
atu
xuaun n −=
∂∂
+∂∂
−+ ])1[( κ (1)
xxu
−−
=542 for 0 ≤ x ≤ 4 (2)
5.0]5.01.0[ 3 −=∂∂
+∂∂
−tu
xuu (3)
,adxdu
−= ,)1( aundsdx n −+= κ .1=
dsdt (4)
Khalid Rashid
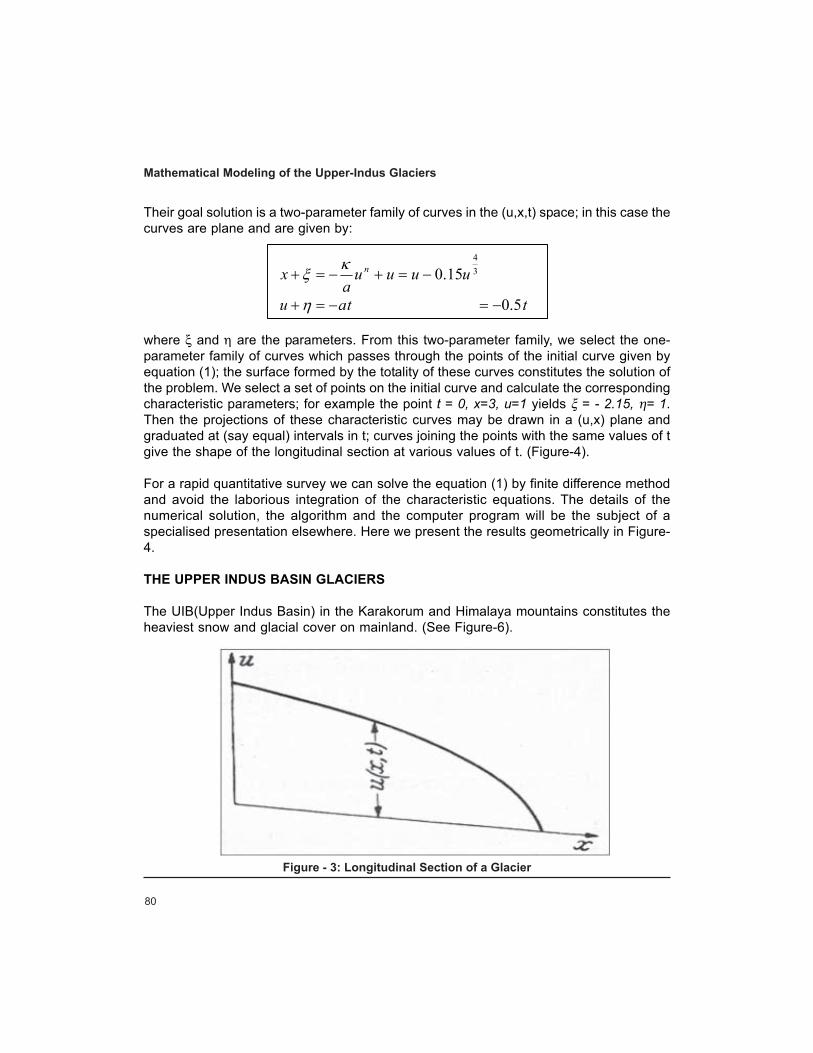
80
Their goal solution is a two-parameter family of curves in the (u,x,t) space; in this case thecurves are plane and are given by:
where ξ and η are the parameters. From this two-parameter family, we select the one-parameter family of curves which passes through the points of the initial curve given byequation (1); the surface formed by the totality of these curves constitutes the solution ofthe problem. We select a set of points on the initial curve and calculate the correspondingcharacteristic parameters; for example the point t = 0, x=3, u=1 yields ξ = - 2.15, η= 1.Then the projections of these characteristic curves may be drawn in a (u,x) plane andgraduated at (say equal) intervals in t; curves joining the points with the same values of tgive the shape of the longitudinal section at various values of t. (Figure-4).
For a rapid quantitative survey we can solve the equation (1) by finite difference methodand avoid the laborious integration of the characteristic equations. The details of thenumerical solution, the algorithm and the computer program will be the subject of aspecialised presentation elsewhere. Here we present the results geometrically in Figure-4.
THE UPPER INDUS BASIN GLACIERS
The UIB(Upper Indus Basin) in the Karakorum and Himalaya mountains constitutes theheaviest snow and glacial cover on mainland. (See Figure-6).
34
15.0 uuuua
x n −=+−=+κξ
tau −=+η t5.0−=
Figure - 3: Longitudinal Section of a Glacier
Mathematical Modeling of the Upper-Indus Glaciers
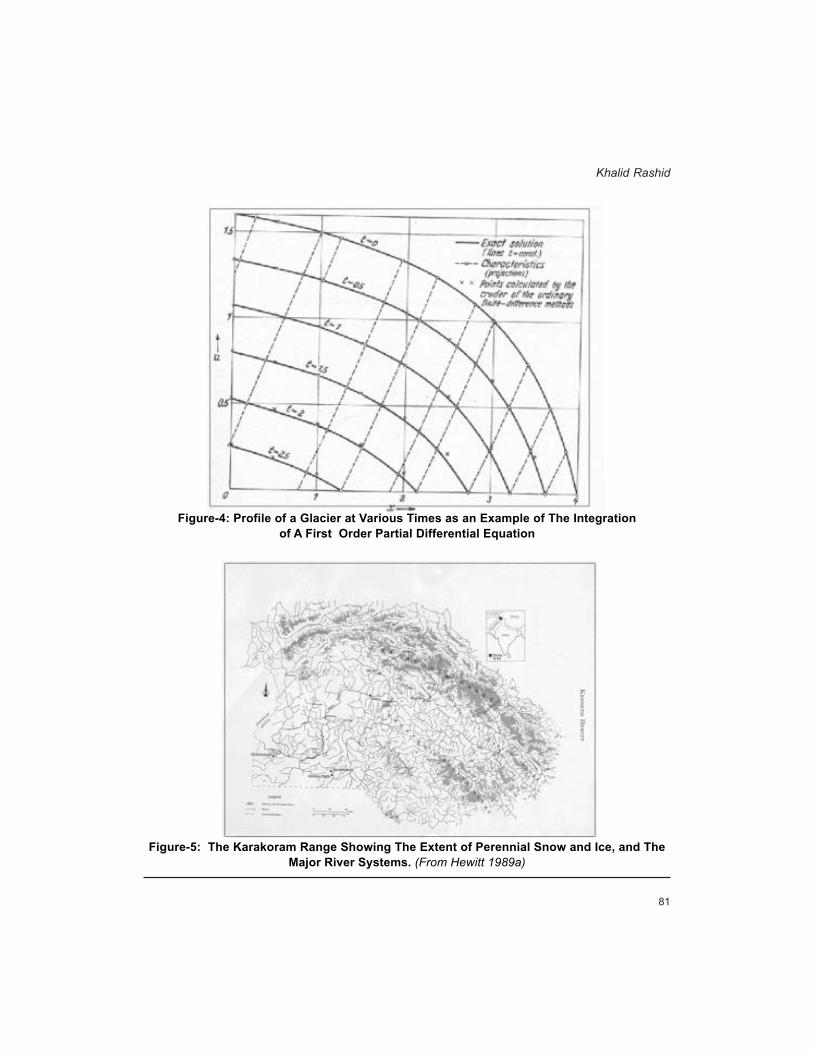
81
Figure-4: Profile of a Glacier at Various Times as an Example of The Integrationof A First Order Partial Differential Equation
Figure-5: The Karakoram Range Showing The Extent of Perennial Snow and Ice, and TheMajor River Systems. (From Hewitt 1989a)
Khalid Rashid
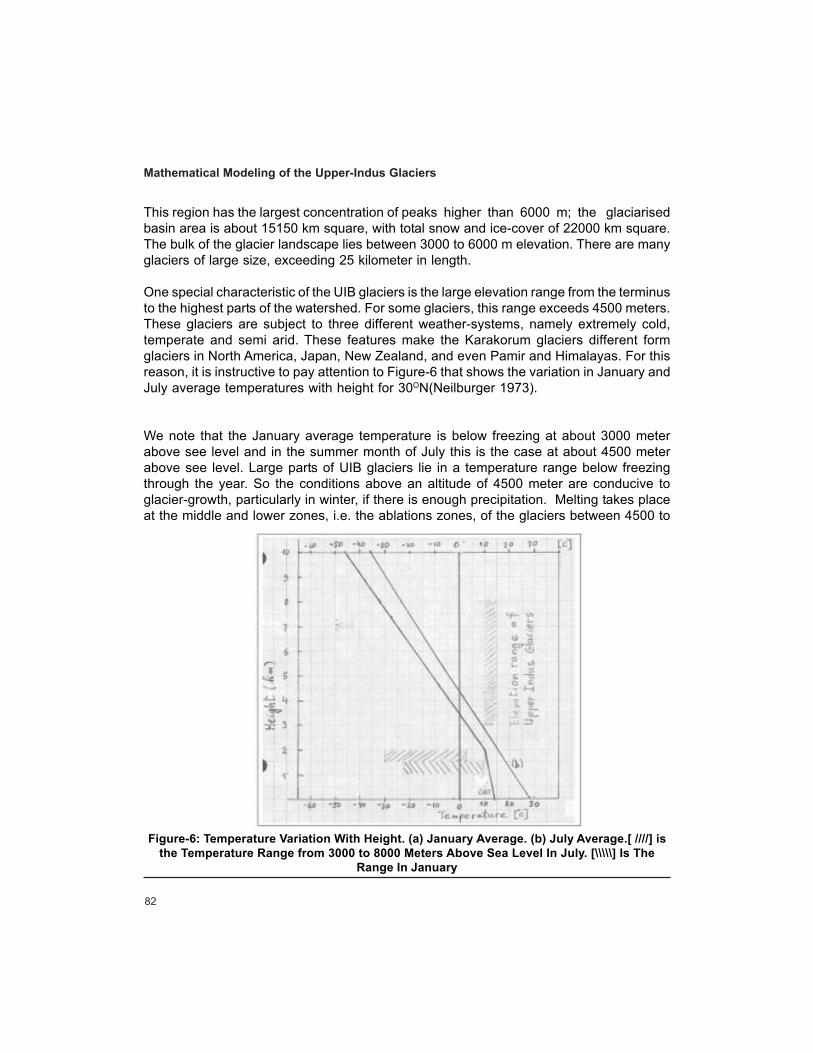
82
This region has the largest concentration of peaks higher than 6000 m; the glaciarisedbasin area is about 15150 km square, with total snow and ice-cover of 22000 km square.The bulk of the glacier landscape lies between 3000 to 6000 m elevation. There are manyglaciers of large size, exceeding 25 kilometer in length.
One special characteristic of the UIB glaciers is the large elevation range from the terminusto the highest parts of the watershed. For some glaciers, this range exceeds 4500 meters.These glaciers are subject to three different weather-systems, namely extremely cold,temperate and semi arid. These features make the Karakorum glaciers different formglaciers in North America, Japan, New Zealand, and even Pamir and Himalayas. For thisreason, it is instructive to pay attention to Figure-6 that shows the variation in January andJuly average temperatures with height for 30ON(Neilburger 1973).
We note that the January average temperature is below freezing at about 3000 meterabove see level and in the summer month of July this is the case at about 4500 meterabove see level. Large parts of UIB glaciers lie in a temperature range below freezingthrough the year. So the conditions above an altitude of 4500 meter are conducive toglacier-growth, particularly in winter, if there is enough precipitation. Melting takes placeat the middle and lower zones, i.e. the ablations zones, of the glaciers between 4500 to
Figure-6: Temperature Variation With Height. (a) January Average. (b) July Average.[ ////] isthe Temperature Range from 3000 to 8000 Meters Above Sea Level In July. [\\\\\] Is The
Range In January
Mathematical Modeling of the Upper-Indus Glaciers

83
3000 meters above sea level, mainly in the months of June, July and August. In theaccumulation zone, with an altitude greater than 5000 meters, the temperatures do notrise above the freezing point. So the growth of the glaciers take place in this zone. Fromhere, there is a flux of ice to the lower altitudes ablations zones where most of the meltingtakes place in the summer months. Climate gradients are difficult to understand. Karakorumhas the largest range of altitude-variations and atmospheric changes with altitude andprecipitation, as a function of altitude, needs to be understood. In Karakoram the gradi-ents dominate the glacier hydrology.
One of the most important elements of UIB Glaciers that we need to understand is themeasurement and quantification of melt water that can depend on various external factors,such as rain and temperature variations and internal factors, such as ice pressures atthe base of the glaciers, debris cover, and surges. Snow-melt and melt-waters from thisglacier-zone provide half or more of the flows of the main Indus(Hewitt 2001). In Figure-7we show the hydrographs of Hunza, Kabul and Indus rivers. The discharge increasesvery substantially in the months of May to September. These are the months when snow-cover disappears from areas below 4500 meters above sea-level and is the time whenrapid melting takes place between 3000 and 4000 meters on the middle and lower zonesof the glaciers. A detailed study of melt-water for the Biafo glacier basin has been carriedout by Hewitt (1989b). Being an important source of water for the Indus River, theunderstanding of these investigations is a necessary exercise at national level that cannotbe over-emphasized.
Figure-7: Hydrographs of Indus, Kabul and Hunza Rivers (from Hewitt 1989b)
Khalid Rashid

84
Biafo glacier is an important source of water for the Indus river. For the Hunza river, thecontribution of the melt-water is, on a relative scale, more than that for the Indus andKabul rivers, as we can infer from the locations of the discharge maximum. For HunzaRiver the maximum lies in early June whereas the maximum for Indus and Kabul rivers isin June and July. In June and July, monsoon rains also contribute to the discharge morethan in June, which is a monsoon-weak month.
Studies with extensive measurements of ice-loss in the ablation area of Miar glacier in theKarakorum mountains have been made as a part of a joint Canada-Pakistan Ice-HydrologyProject, whose aim was to estimate ice-loss in ablation-areas of glaciers, to predict thestream flows (Young, Schmok 1989). I am not aware if this Project is still ongoing. Needlessto say, such studies for the Korakorum glaciers must be undertaken as a national or aninternational effort, to achieve an understanding of UIB glaciers and stream-flows.
A very necessary national task would be to estimate the total ice-flux from high- altitudeaccumulation zones to lower altitude ablation zone for the UIB glaciers, because thisnumber is an important measure required in the estimation of overall stream flows. Thereis an urgent need for extensive field-observations and measurements. These can be verydifficult to perform, in higher latitudes, because of the difficult terrain and in the ablation-zones because of the large number of crevices. A fruitful approach would be to train localpeople of these areas to perform these observations and measurements.
ARTIFICIAL MELTING OF GLACIERS TO MEET WATER SHORTAGE
In the spring of this year, Pakistan was facing nearly 30 MAF(Million Acre Foot) of water-shortage for irrigation, about 50 % of its total needs. Farmers, people and, of course, theGovernment were deeply concerned. It was in this backdrop that a daily paper (THENEWS of 12-03-2001) carried the following story by G N Mughal: Pakistan may use lasertechnology to melt glaciers. Pakistan is seriously considering the option of using lasertechnology to melt some of its northern areas glaciers and snow lying underneath”.
Although this story appear to be the usual high-level rhetoric of our powerful authorities tocalm the thirsty and desperate farmers, but reliable sources indicated the seriousnesswith which this option was under consideration. This was truly a shock. I have neverheard of any attempts to melt artificially the snow and ice cover. Before looking attechnological details of such an option, let us work out the energy balance of such anexperiment. The energy required to melt 1 cm3 of ice is 333 Joules. So to melt 30 MAF(about4.2 km3) of ice 1.2 x 10¹⁹ Joules of energy are required. Any good CO2 laser can have apower of 1000 kW and an efficiency of 20%. Assuming that we have excellent optics toilluminate 100 cm2 of ice area and that we have the technological capability of operatingthe lasers, and we want to melt 30 MAF of ice in one month, the electric power required
Mathematical Modeling of the Upper-Indus Glaciers
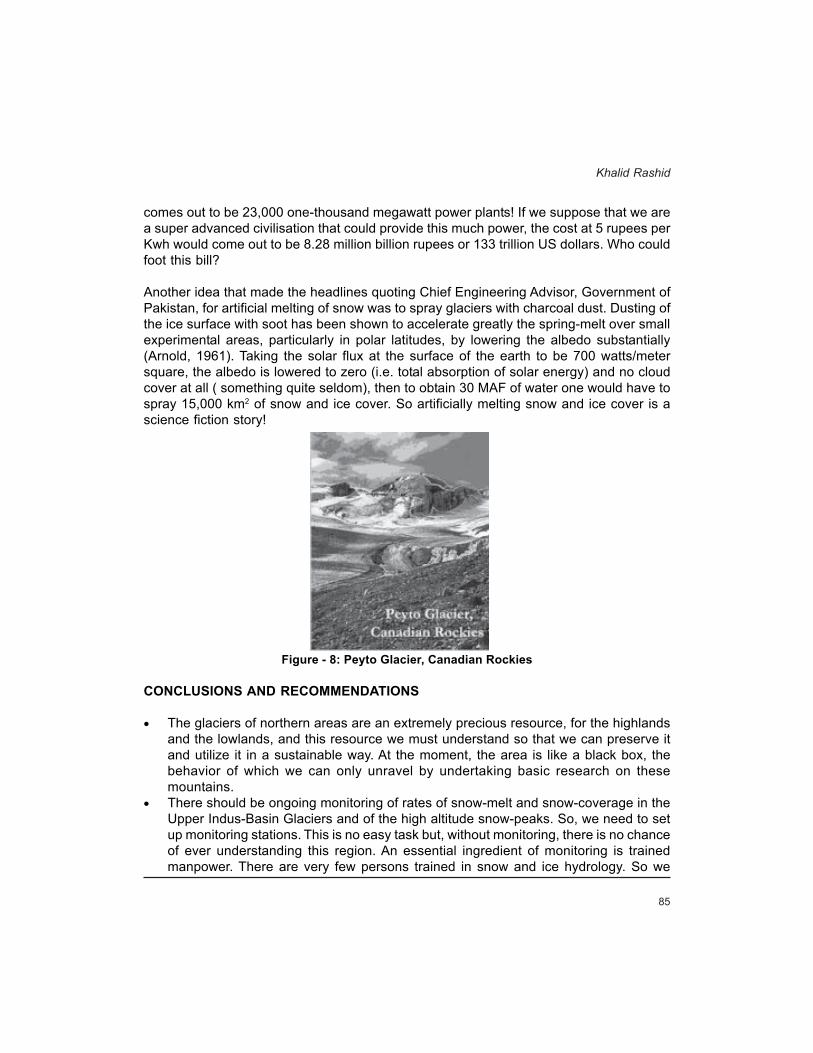
85
comes out to be 23,000 one-thousand megawatt power plants! If we suppose that we area super advanced civilisation that could provide this much power, the cost at 5 rupees perKwh would come out to be 8.28 million billion rupees or 133 trillion US dollars. Who couldfoot this bill?
Another idea that made the headlines quoting Chief Engineering Advisor, Government ofPakistan, for artificial melting of snow was to spray glaciers with charcoal dust. Dusting ofthe ice surface with soot has been shown to accelerate greatly the spring-melt over smallexperimental areas, particularly in polar latitudes, by lowering the albedo substantially(Arnold, 1961). Taking the solar flux at the surface of the earth to be 700 watts/metersquare, the albedo is lowered to zero (i.e. total absorption of solar energy) and no cloudcover at all ( something quite seldom), then to obtain 30 MAF of water one would have tospray 15,000 km2 of snow and ice cover. So artificially melting snow and ice cover is ascience fiction story!
Figure - 8: Peyto Glacier, Canadian Rockies
CONCLUSIONS AND RECOMMENDATIONS
• The glaciers of northern areas are an extremely precious resource, for the highlandsand the lowlands, and this resource we must understand so that we can preserve itand utilize it in a sustainable way. At the moment, the area is like a black box, thebehavior of which we can only unravel by undertaking basic research on thesemountains.
• There should be ongoing monitoring of rates of snow-melt and snow-coverage in theUpper Indus-Basin Glaciers and of the high altitude snow-peaks. So, we need to setup monitoring stations. This is no easy task but, without monitoring, there is no chanceof ever understanding this region. An essential ingredient of monitoring is trainedmanpower. There are very few persons trained in snow and ice hydrology. So we
Khalid Rashid

86
need to train manpower. One way to do this would be to support financially andtechnically, with infrastructure, M.Phil and Ph.D theses related to these areas. It wouldbe very worthwhile to hold an international conference on Karakorum Mountains inthe year 2002, not only to hear from the experts about the past, present and future ofthis area, but to commemorate the year 2002 as the year of the mountains. Oncesome manpower becomes available, a national Mountain Research Institute shouldbe established. At present, there are no stations directly measuring the high-altitudeclimatic conditions, i.e. precipitation and temperatures. Finally, to model water run-offfrom the Upper Indus-Basin Glaciers, an integrated approach would be required,incorporating Data collected by satellites, ground measurements and global climatictrends.
• Majority of the Pakistanis and the Government decision-makers are unaware of thelack of understanding of glaciology and hydrology of these glacier regions. In theabsence of monitoring-system, no reliable forecast is possible. It appears that theHimalayan glaciers are diminishing, but the Karakorum glaciers are expanding (Hewitt2001). Whether this is good news or bad news, we can only determine by working outthe end-effect on the amount of melt-waters and their reaching the ultimate users.
REFERENCES
– Arnold, K. 1961. An investigation into methods of accelerating the melting of ice and snow byartificial dusting. Geology of the Arctic, edited by G.O. Raagh (Toronto: University of TorontoPress), pp. 989-1012
– Collatz, Lothar. 1966. The Numerical Treatment of Differential Equations, Springer, pp308-318– Finsterwalder, S. 1907. Die Theorie der Gletsherschwankungen. Z. Gletscherk. 2, 81- 103.– Hewitt, K. 1989a. The Altitude organisation of Karakoram geomorphic processes and depositional
environments, Z. Geomorph. Supply. 76, 9-32 December.– Hewitt, K. 1989b. Hydrological investigations at Biafo glacier, Karakoruakam range, Himalaya;
An important source of water for Indus River. Annals of Glaciology, 13, 103-108.– Hewitt, K. 2001a. Hazards of melting as an option: Upper Indus Glaciers,I&II DAWN, May 20/
21.– Hewitt, K. 2001b. Upper Indus glaciers and Water Crisis. Lecture delivered in Islamabad in
July– Lowell, Thomas V. 2000. As climate changes, so do glaciers. Perspectives Vol. 97,Issue 4,
February 15, 1351-1354.– Marquand, Robert. 1999. Glaciers in the Himalayas melting at rapid rate. Christian Science
Monitor,Nov 5.– Neiburger, Morris; Edinger, G. James and Bonner, D. William; 1973, Understanding our
atmospheric environment, Freeman.– Press, Frank and Siever, Raymond, (1974) Earth, Second Edition, pp 211-234– Young, G.J. and Schmok, J.P. 1989, Ice loss in the ablation area of a Himalayan glacier; Studies
on Miar glacier, Karakoram mountains, Pakistan, Annal of Glalciology 13, 289-2.
Mathematical Modeling of the Upper-Indus Glaciers
The Climate and Flood-RiskPotential of Northern Areas
of Pakistan
Shaukat Ali Awan

87
ABSTRACT
The extreme floods in northern parts of Pakistan are caused by glacier lake out-burstsand Dam-Breaks following landslides, which block river valleys. Geographically, glacierdams in mountain rivers and valleys have occurred from the east-western and west-westernKarakuram ranges and in the lesser Karakuram range. Floods which arise from Karakuramregion pose greater problems, as these floods are neither homogenous nor stationary.These floods arise from various generating mechanisms i.e. generated by melting of snowand glacier and those generated from the monsoon rainfall and dam-breaks followinglandslide into the river and out-burst of glacier lake. The estimation of present and futurerisk of flooding at sites in northern Pakistan requires an understanding of the climate,which provides the generating mechanism of floods. Climates are extremely variable anddepend on broad global circulation-patterns and local topographic influences.
The variables of the climate are studied, using available data, with emphasis on temperatureand precipitation. Spatial Co-relation in precipitation and temperature of various northern-area stations have been conducted to find Correlation Coefficient, using regressionanalysis. This is spread over intra-seasonal and inter-station comparisons. The time-seriesanalysis of the climatic variables has been conducted to examine, geographically andstatistically, the trend in their behaviour. This may be reflected in the hydrological regimeof glaciers and rivers and it can cause non-linear flood-series through changes in any oneof the flood-generating mechanisms.
The climate feed-back mechanisms have been discussed, which are practically importantbecause they assist in seasonal prediction of climate and flow in the Indus. Additionally, ifclimate-warming is causing an upward trend in winter and spring temperatures andreduction in snowfall, the effect might be felt more widely over the region.
The non-linear changes with elevation and differences between windward and leewardsides indicate the complexity of the rainfall-distribution in the region. The study givesmonthly seasonal and annual total distribution of meteorological variables between variousnorthern-areas stations, while discussing each one with its impact and the co-relation withthe other over a wider prospective.
THE CLIMATE OF NORTHERN PAKISTAN
The assessment of the present and future risk of flooding at sites in northern Pakistanrequires an understanding of the climate, which provides the generating mechanisms of
THE CLIMATE AND FLOOD-RISK POTENTIAL OFNORTHERN AREAS OF PAKISTAN

88
floods. Mountain climates are extremely varied and depend on both broad global circulation-patterns and local topographic influences. In this study, the variability of climate isinvestigated, using all available data, with special emphasis on temperature andprecipitation. Since the measurement-network is of low density, studies have been carriedout to assess the extent to which climate at ungauged sites can be inferred from availablerecords, using correlation and regression analysis.
Mountain climates are influenced by the broad global circulation-patterns associated withlatitude, position in the continental mass and proximity to the oceans. During the winterand spring, the Karakoram area is affected by broad-scale weather-systems, originatingprimarily from the Mediterranean or from the area of the Caspian Sea (Singh et al, 1995)from airmass convective storms in the pre-monsoon season, and from monsoon systemsduring the summer. Even in the summer, there are indications that at least some of thehigher-level precipitation is also originating from westerly systems (Wake, 1987). However,in winter, under the prevailing influence of the Tibetan anticyclone, more local conditionsprevail. Mountain climates are also influenced on the medium and local-scale by elevation,valley orientation, aspect and slope, as well as the height and number of upwind barriersto the airflow.
Thus, mountain climates are much more spatially variable than neighbouring plains andrequire a much greater density of measuring stations to define the climate and hydrologicalregime with the same level of accuracy as on neighbouring lowlands. However, for logisticreasons, the density of measuring stations in mountain-regions is typically much lowerthan in lowland areas and stations are generally concentrated at lower elevations in valleysand, thus, give a biased representation of the climate. This is certainly the case in theKarakoram. Nevertheless, inferences must be made from the available data.
Temperature
The principal influence on temperatures is that of elevation, but local factors, such asaspect and the duration of sunlight and shadow from neighbouring mountains and heat-reflection from bare hillsides, may produce strong local differences. Mean monthly andannual maximum, minimum and mean temperatures are shown in Table-1. Mean monthlytemperatures are shown for the short period automatic weather-stations in Table-4.
The prevailing influence of elevation can be seen in these statistics, with the highestmean annual temperature recorded at the lowest station, Balakot. However the influenceof elevation is not uniform and Gupis, which is at a similar elevation to Skardu, isconsistently more than 1o C hotter throughout the year. Temperatures at Balakot and Dirare suppressed by greater cloudiness and rainfall, especially during the summer months.Gilgit has the highest average range of temperatures of the stations investigated, andKarimabad, Gupis and Astore the lowest range in the valley, whilst the high-level stations
The Climate and Flood-Risk Potential of Northern Areas of Pakistan

89
at Kunjerab and Shandur have significantly lower ranges. This is likely to be a local effect,dependent on shading or reflection from surrounding hills and duration of sunshine andthe persistence of snow at high levels.
Valley floors and levels below 3000 meters receive little precipitation (generally less than200 mm) and therefore contribute little to runoff. There is considerable orographicenhancement of precipitation and at 4000 meters annual precipitation of greater than 600mm may be expected. The zone of intermittent melt reaches this level from late March tomid November and continuous melt of any remaining snow can be expected to occurfrom late May to late September.
SOME CONCLUSIONS
Major summer storms are accompanied by a drop of 12-15oC in daily mean temperature.Daily maximum temperatures are more affected and may fall by as much as 20oC. Thisresults in a drop in the freezing level of more than 2000 m and the occurrence of snow,rather than rain, over much of the high Karakoram basins.
Such reductions in temperature have practical implications, both for short-term flood-forecasting and also for design flood estimation, where based on analysis of storm rainfall.The assessment of effective storm rainfall over a basin, for design purposes, must takeinto account the freezing-level and the contribution proportion of the catchment belowthis level.
Evidence from the largest monsoon and post-monsoon rainfalls in the records suggeststhat the direct contribution of rainfall to river-flow is small in northern catchments, whereasit may result in the most devastating floods in foothill basins. In most instances, the reductionin melt-runoff in high-altitude basins, due to reduced temperature and energy inputs, morethan compensates for direct runoff from rainfall, and the occurrence of rainfall is oftenaccompanied by a sharp reduction in flow.
PRECIPITATION
Precipitation is the basic-input to the hydrological cycle, making a direct contribution throughrainfall or a delayed contribution as snow. Precipitation is also a factor in the occurrenceof mass-movement, though freeze-thaw action and mechanical weathering, as a mediumfor conveyance of debris-flows, etc., and as a lubricating agent for mass-movement withslipping and sliding mechanisms.
Studies of precipitation-distribution in Northern Pakistan and neighbouring mountains havebeen more limited due to the limited availability of data, especially at higher elevations.An early study by Hill (1881) suggested that rainfall in the northwest Himalayas increases
Shaukat Ali Awan

90
The Climate and Flood-Risk Potential of Northern Areas of Pakistan
Table - 1: Maximum, Minimum and Mean Temperatures (For the Main Stations)
Station Jan Feb Mar Apr May Jun Jul Aug Sep Oct Nov Dec Year
(a) Maximum Temperature
Astore 2.4 4 8.4 14.6 19.2 24.5 27.1 27 23.5 17.2 11.1 5 15.3
Bunji 9.6 12.5 17.9 24 28 33.7 36.2 35.7 32.5 25.7 18.5 11.8 23.9
Drosh 8.8 11 15.9 22.5 28.6 35.6 36.8 35.9 33 26.6 18.9 11.8 23.8
Dir 11.3 12.3 16 22.1 27.3 32.5 31.4 30.3 29 24.8 20.1 13.9 22.6
Gilgit 9.2 12.3 17.7 23.7 28 33.9 36.1 35.4 31.9 25.3 18 11.2 23.6
Skardu 2.6 5.4 11.7 18.3 22.5 28.2 31.5 31.2 27.2 20 12.7 6 18.2
Gupis 4.1 6.6 12.2 18.5 23 29 32.1 30.9 26.4 19.9 13.6 5.8 18.5
Balakot 14 15.4 19.5 25.3 31 35.3 32.3 31.3 30.9 27.5 21.9 16 25
Chilas 12.3 14.5 20.1 26.1 31.1 37.6 39.6 38.6 35.1 28.4 20.9 13.7 26.5
Karim-abad
2.1 4.3 9 16.1 20.2 25.8 28.5 29.4 23.8 18.1 10.7 4.3 16
Misgar -1.1 1.7 7.2 12.3 16.3 21.2 24.6 25.2 20.8 14 6.9 0.5 12.5
Kunjerab -13.4 -10.9 -6.8 -0.2 3.6 6.9 11.8 11 6.6 -0.6 -6 -10.5 -0.7
Shandur -8.9 -6.5 -1.4 5.7 10.6 14.7 19.8 19.2 14.8 7.4 0.5 -5.3 5.9
(b) Minimum Temperature
Astore -7.5 -5.7 -1.1 3.5 7.1 11 14.5 14.6 10.5 4.4 -0.7 -4.5 3.8
Bunji 0.1 2.7 7.6 12.1 15.2 19.6 23.4 22.8 18.1 11.3 5.2 1.4 11.6
Drosh -0.1 1.2 5 10.1 14.9 20.7 23.2 22.5 18.4 11.8 6.2 2.2 11.4
Dir -2.5 -1.1 3 7.8 11.4 15.6 19.3 18.7 13.8 7.5 2.5 -0.7 7.9
Gilgit -2.5 0.6 5.7 9.4 11.9 15 18.5 17.9 13 6.8 0.8 -1.9 7.9
Skardu -8.2 -5 1.5 6.5 9.6 13.5 16.6 16.2 12 4.7 -1.6 -5.4 5
Gupis -4.9 -2.8 2.2 7.6 11.3 16 18.8 18 13.5 7.2 1.6 -3.1 7.1
Balakot 2 3.9 7.6 12.6 17.2 21 21.3 20.6 17.1 11.5 6.2 2.9 12
Chilas 0.9 3.4 8.4 13.8 18.4 24.3 27.3 26.8 22.5 14.6 7.1 2.1 14.1
Karim-abad
-4 -2.6 2.4 7.2 10.6 13.9 16.4 17.2 11.5 7.7 2.6 -1.8 6.8
Misgar -13.2 -9.7 -5.4 -0.2 3.4 8 11.1 11.6 6.6 -0.1 -5.8 -10.6 -0.4
Kunjerab -22.1 -20.2 -16 -10.4 -6.9 -2.8 0.8 0.4 -3.4 -10.8 -15.4 -19.4 -10.5
Shandur -16.2 -15 -11.8 -5.8 -0.5 4.6 9.4 8.9 4.4 -2.7 -8.7 -13.5 -3.9
Continue on next page…
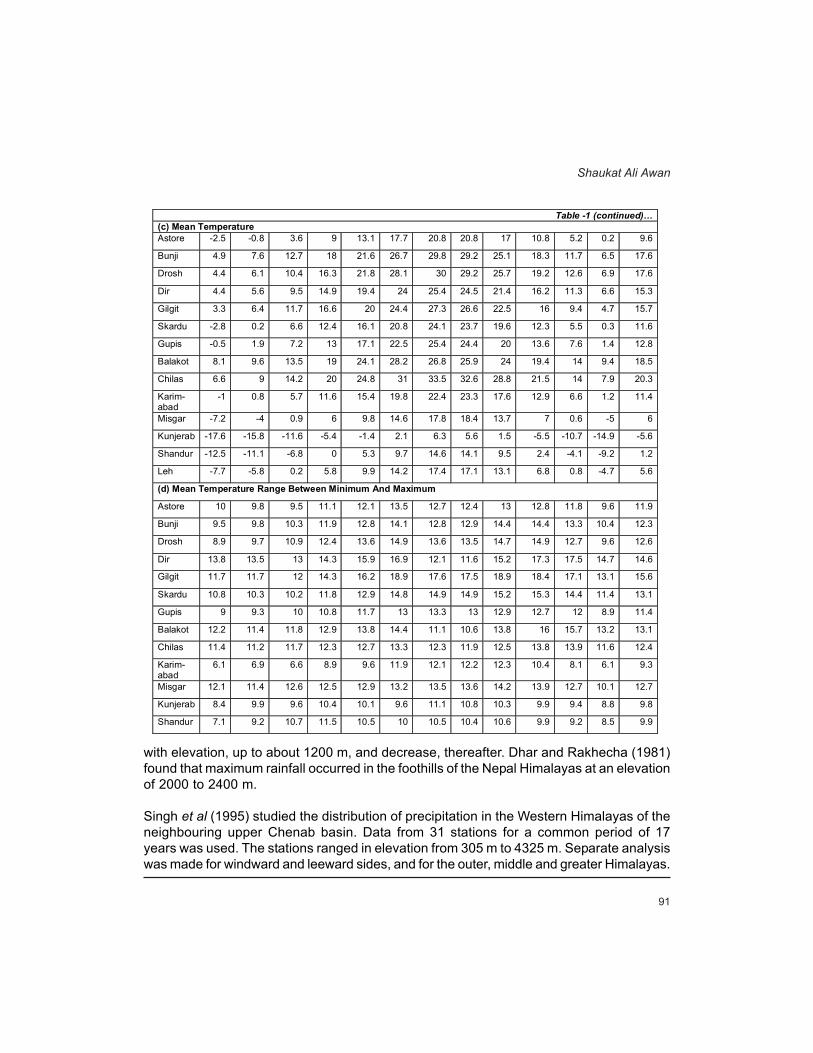
91
with elevation, up to about 1200 m, and decrease, thereafter. Dhar and Rakhecha (1981)found that maximum rainfall occurred in the foothills of the Nepal Himalayas at an elevationof 2000 to 2400 m.
Singh et al (1995) studied the distribution of precipitation in the Western Himalayas of theneighbouring upper Chenab basin. Data from 31 stations for a common period of 17years was used. The stations ranged in elevation from 305 m to 4325 m. Separate analysiswas made for windward and leeward sides, and for the outer, middle and greater Himalayas.
Shaukat Ali Awan
Table -1 (continued)… (c) Mean Temperature Astore -2.5 -0.8 3.6 9 13.1 17.7 20.8 20.8 17 10.8 5.2 0.2 9.6
Bunji 4.9 7.6 12.7 18 21.6 26.7 29.8 29.2 25.1 18.3 11.7 6.5 17.6
Drosh 4.4 6.1 10.4 16.3 21.8 28.1 30 29.2 25.7 19.2 12.6 6.9 17.6
Dir 4.4 5.6 9.5 14.9 19.4 24 25.4 24.5 21.4 16.2 11.3 6.6 15.3
Gilgit 3.3 6.4 11.7 16.6 20 24.4 27.3 26.6 22.5 16 9.4 4.7 15.7
Skardu -2.8 0.2 6.6 12.4 16.1 20.8 24.1 23.7 19.6 12.3 5.5 0.3 11.6
Gupis -0.5 1.9 7.2 13 17.1 22.5 25.4 24.4 20 13.6 7.6 1.4 12.8
Balakot 8.1 9.6 13.5 19 24.1 28.2 26.8 25.9 24 19.4 14 9.4 18.5
Chilas 6.6 9 14.2 20 24.8 31 33.5 32.6 28.8 21.5 14 7.9 20.3
Karim-abad
-1 0.8 5.7 11.6 15.4 19.8 22.4 23.3 17.6 12.9 6.6 1.2 11.4
Misgar -7.2 -4 0.9 6 9.8 14.6 17.8 18.4 13.7 7 0.6 -5 6
Kunjerab -17.6 -15.8 -11.6 -5.4 -1.4 2.1 6.3 5.6 1.5 -5.5 -10.7 -14.9 -5.6
Shandur -12.5 -11.1 -6.8 0 5.3 9.7 14.6 14.1 9.5 2.4 -4.1 -9.2 1.2
Leh -7.7 -5.8 0.2 5.8 9.9 14.2 17.4 17.1 13.1 6.8 0.8 -4.7 5.6
(d) Mean Temperature Range Between Minimum And Maximum
Astore 10 9.8 9.5 11.1 12.1 13.5 12.7 12.4 13 12.8 11.8 9.6 11.9
Bunji 9.5 9.8 10.3 11.9 12.8 14.1 12.8 12.9 14.4 14.4 13.3 10.4 12.3
Drosh 8.9 9.7 10.9 12.4 13.6 14.9 13.6 13.5 14.7 14.9 12.7 9.6 12.6
Dir 13.8 13.5 13 14.3 15.9 16.9 12.1 11.6 15.2 17.3 17.5 14.7 14.6
Gilgit 11.7 11.7 12 14.3 16.2 18.9 17.6 17.5 18.9 18.4 17.1 13.1 15.6
Skardu 10.8 10.3 10.2 11.8 12.9 14.8 14.9 14.9 15.2 15.3 14.4 11.4 13.1
Gupis 9 9.3 10 10.8 11.7 13 13.3 13 12.9 12.7 12 8.9 11.4
Balakot 12.2 11.4 11.8 12.9 13.8 14.4 11.1 10.6 13.8 16 15.7 13.2 13.1
Chilas 11.4 11.2 11.7 12.3 12.7 13.3 12.3 11.9 12.5 13.8 13.9 11.6 12.4
Karim-abad
6.1 6.9 6.6 8.9 9.6 11.9 12.1 12.2 12.3 10.4 8.1 6.1 9.3
Misgar 12.1 11.4 12.6 12.5 12.9 13.2 13.5 13.6 14.2 13.9 12.7 10.1 12.7
Kunjerab 8.4 9.9 9.6 10.4 10.1 9.6 11.1 10.8 10.3 9.9 9.4 8.8 9.8
Shandur 7.1 9.2 10.7 11.5 10.5 10 10.5 10.4 10.6 9.9 9.2 8.5 9.9

92
Separate analysis was also carried out for rainfall and snowfall, but it is difficult to drawconclusions concerning total precipitation. The windward side is assumed to be the southfor both winter and monsoon rainfall.
For the Greater Himalayas, snowfall (total snow/water equivalent) increased linearlythrough the range of altitude from 2000 m to 4325 m, reaching a maximum of 650 mm. Athigher elevations the number of snowy days increases, but the intensity of snowfalldecreases. Annual rainfall decreases with elevation as the proportion of snow to rainincreases. Total precipitation is of the order of 700 to 850 mm from 3000 m to 4325 m.
Whilst the upper Chenab and Jhelum basins are influenced to a much greater extent bymonsoon airflow than the Karakorams, the above conclusions have some bearing on theprecipitation regime of the Karakorams. Firstly, the non-linear changes with elevation andthe differences between windward and leeward sides illustrate the complexity of spatialrainfall-distribution in the region and this can be expected to be repeated in the Karakorams.Secondly, since the Karakorams are further sheltered from the monsoon airflow bymountain barriers, the monsoon precipitation is likely to be less than that for the UpperChenab and Jhelum basins at the same altitude. Thirdly, the Karakorams are affected toa much greater extent by the winter and spring westerly weather-systems for which thewindward side is the west and the leeward the east.
CONCLUSIONS
a. At an elevation of about 3000 m, solid and liquid precipitation are about equal over ayear.
b. Seasonal proportion of rainfall differs from Outer to Greater Himalayas, with 60%during the monsoon season on the windward outer Himalayas and 35% on the GreaterHimalayas (windward)
c. For the outer Himalayas, more rainfall is received on the leeward side, except duringthe Monsoon season, while on the windward side the precipitation decreases atelevations over 600 m.
d. In the middle Himalayas, rainfall on the windward side increases with elevation up toa certain altitude (varying from 1600m to 2200 m depending on season) and thendecreases. Rainfall on the leeward side is lower and has a maximum at about thesame elevation range as the windward side. Snowfall increases linearly with elevationon the windward side to a maximum of 950 mm at 2500 m, but on the leeward side itfirst increases and then decreases. Total precipitation is significantly less on the leewardside.
e. Monthly, seasonal and annual totals and seasonal distribution at Gilgit, Gupis andBunji are very similar.
f. These stations also receive amounts very similar to Skardu and Chilas during theperiod from April to September, but Skardu and Chilas receive significantly greater
The Climate and Flood-Risk Potential of Northern Areas of Pakistan
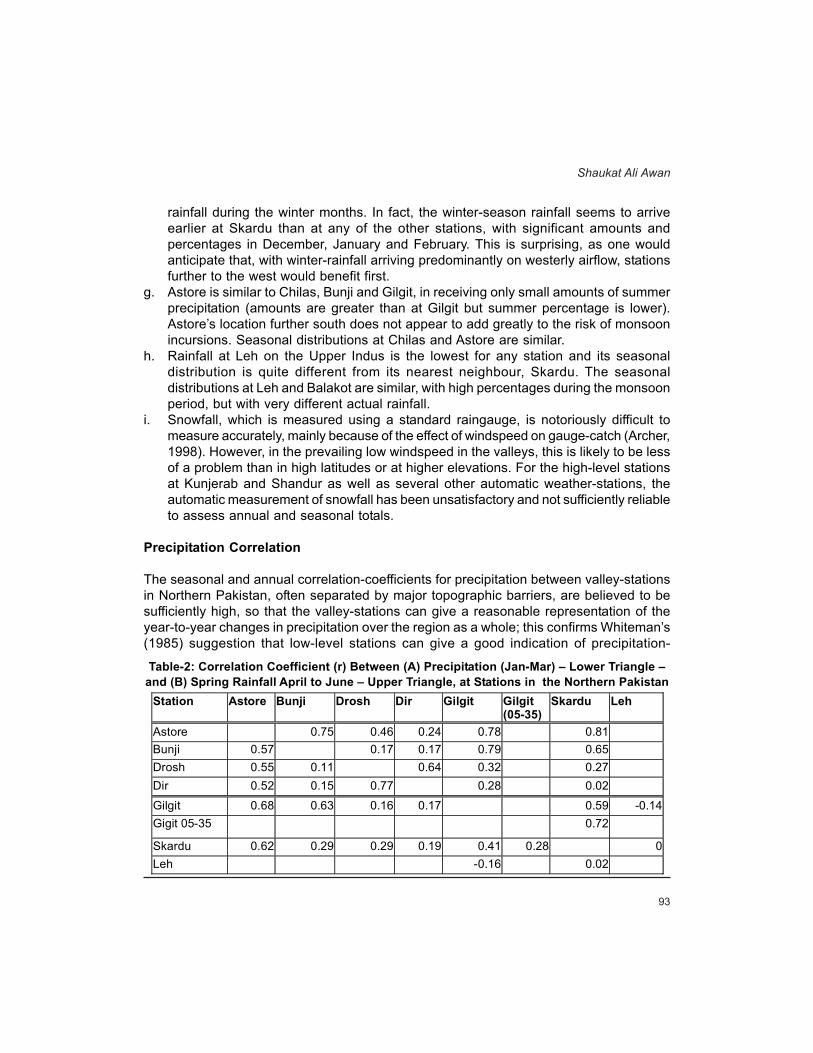
93
rainfall during the winter months. In fact, the winter-season rainfall seems to arriveearlier at Skardu than at any of the other stations, with significant amounts andpercentages in December, January and February. This is surprising, as one wouldanticipate that, with winter-rainfall arriving predominantly on westerly airflow, stationsfurther to the west would benefit first.
g. Astore is similar to Chilas, Bunji and Gilgit, in receiving only small amounts of summerprecipitation (amounts are greater than at Gilgit but summer percentage is lower).Astore’s location further south does not appear to add greatly to the risk of monsoonincursions. Seasonal distributions at Chilas and Astore are similar.
h. Rainfall at Leh on the Upper Indus is the lowest for any station and its seasonaldistribution is quite different from its nearest neighbour, Skardu. The seasonaldistributions at Leh and Balakot are similar, with high percentages during the monsoonperiod, but with very different actual rainfall.
i. Snowfall, which is measured using a standard raingauge, is notoriously difficult tomeasure accurately, mainly because of the effect of windspeed on gauge-catch (Archer,1998). However, in the prevailing low windspeed in the valleys, this is likely to be lessof a problem than in high latitudes or at higher elevations. For the high-level stationsat Kunjerab and Shandur as well as several other automatic weather-stations, theautomatic measurement of snowfall has been unsatisfactory and not sufficiently reliableto assess annual and seasonal totals.
Precipitation Correlation
The seasonal and annual correlation-coefficients for precipitation between valley-stationsin Northern Pakistan, often separated by major topographic barriers, are believed to besufficiently high, so that the valley-stations can give a reasonable representation of theyear-to-year changes in precipitation over the region as a whole; this confirms Whiteman’s(1985) suggestion that low-level stations can give a good indication of precipitation-
Station Astore Bunji Drosh Dir Gilgit Gilgit (05-35)
Skardu Leh
Astore 0.75 0.46 0.24 0.78 0.81 Bunji 0.57 0.17 0.17 0.79 0.65 Drosh 0.55 0.11 0.64 0.32 0.27 Dir 0.52 0.15 0.77 0.28 0.02
Gilgit 0.68 0.63 0.16 0.17 0.59 -0.14 Gigit 05-35 0.72
Skardu 0.62 0.29 0.29 0.19 0.41 0.28 0 Leh -0.16 0.02
Table-2: Correlation Coefficient (r) Between (A) Precipitation (Jan-Mar) – Lower Triangle –and (B) Spring Rainfall April to June – Upper Triangle, at Stations in the Northern Pakistan
Shaukat Ali Awan
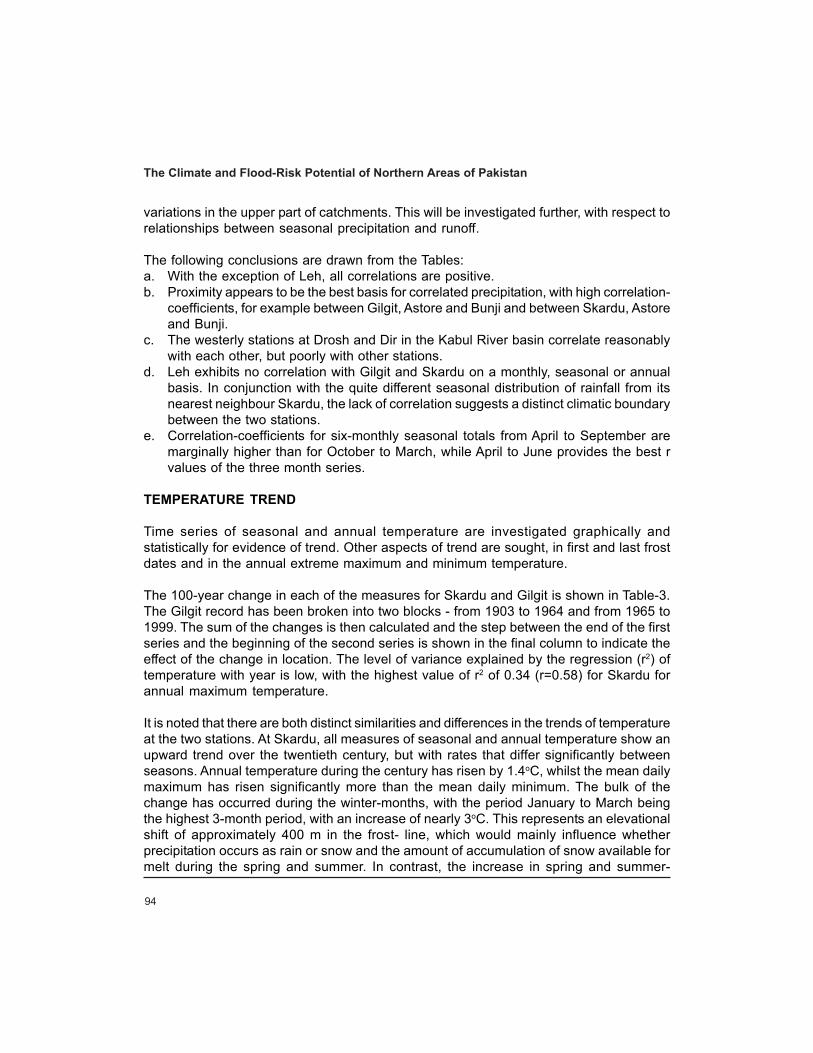
94
variations in the upper part of catchments. This will be investigated further, with respect torelationships between seasonal precipitation and runoff.
The following conclusions are drawn from the Tables:a. With the exception of Leh, all correlations are positive.b. Proximity appears to be the best basis for correlated precipitation, with high correlation-
coefficients, for example between Gilgit, Astore and Bunji and between Skardu, Astoreand Bunji.
c. The westerly stations at Drosh and Dir in the Kabul River basin correlate reasonablywith each other, but poorly with other stations.
d. Leh exhibits no correlation with Gilgit and Skardu on a monthly, seasonal or annualbasis. In conjunction with the quite different seasonal distribution of rainfall from itsnearest neighbour Skardu, the lack of correlation suggests a distinct climatic boundarybetween the two stations.
e. Correlation-coefficients for six-monthly seasonal totals from April to September aremarginally higher than for October to March, while April to June provides the best rvalues of the three month series.
TEMPERATURE TREND
Time series of seasonal and annual temperature are investigated graphically andstatistically for evidence of trend. Other aspects of trend are sought, in first and last frostdates and in the annual extreme maximum and minimum temperature.
The 100-year change in each of the measures for Skardu and Gilgit is shown in Table-3.The Gilgit record has been broken into two blocks - from 1903 to 1964 and from 1965 to1999. The sum of the changes is then calculated and the step between the end of the firstseries and the beginning of the second series is shown in the final column to indicate theeffect of the change in location. The level of variance explained by the regression (r2) oftemperature with year is low, with the highest value of r2 of 0.34 (r=0.58) for Skardu forannual maximum temperature.
It is noted that there are both distinct similarities and differences in the trends of temperatureat the two stations. At Skardu, all measures of seasonal and annual temperature show anupward trend over the twentieth century, but with rates that differ significantly betweenseasons. Annual temperature during the century has risen by 1.4oC, whilst the mean dailymaximum has risen significantly more than the mean daily minimum. The bulk of thechange has occurred during the winter-months, with the period January to March beingthe highest 3-month period, with an increase of nearly 3oC. This represents an elevationalshift of approximately 400 m in the frost- line, which would mainly influence whetherprecipitation occurs as rain or snow and the amount of accumulation of snow available formelt during the spring and summer. In contrast, the increase in spring and summer-
The Climate and Flood-Risk Potential of Northern Areas of Pakistan

95
temperatures has been quite modest. The change of 0.77oC from April to September,which is the season of snow and glacier-melt, represents an upward shift in elevation ofonly about 100 meters of the freeze-thaw boundary.
The greater backward movement of the last spring-frost than forward movement of thefirst winter-frost is consistent with the greatest temperature-changes occurring in the firstthree months of the year. In addition, the change in frost-free days with elevation isconsistent with the difference between average frost-free days at Gilgit and Skardu. Thetwo stations are separated by 750 m of elevation and have a mean difference of 30 frost-free days.
At Gilgit, in contrast, there is a mixture of positive and negative changes, even with theeffects of change in station-location taken into account. The mean annual temperaturehas declined by 0.4oC; annual maximum temperature shows an increase, whilst annualminimum shows a decrease of over 2o C. Seasonally, winter mean-temperatures show anincrease, whilst spring and summer temperatures show a decrease. Although the overalltrend is different from Skardu, the rank-order of changes amongst the seasons is about
Table - 3: 100-Year change in Temperature Measures at Skardu and Gilgit
Shaukat Ali Awan
Temperature measure Change 1900-99
oC
Change 1900-64
oC
Change 1965-99 oC
Change 1900-99 oC
Step change 1964-65
Skardu Gilgit Gilgit Gilgit Gilgit Mean annual temperature 1.37 -0.54 0.13 -0.41 -0.81 Mean annual daily maximum 2.35 0.44 0.9 1.34 0.31
Mean annual daily minimum 0.54 -1.52 -0.65 -2.17 -1.92 Annual absolute maximum 2.01 0.01 0.73 0.79 1.43 Annual absolute minimum 2.85 -3.36 0.24 -3.12 0
Jan - Mar mean 2.92 0.51 0.31 0.82 -0.19 Apr - Jun mean 0.99 -1.66 -0.28 -1.94 0.09 Jul - Sep mean 0.72 -0.71 -0.32 -1.03 -0.6
Oct - Dec mean 0.93 -0.56 0.8 0.24 -1.29 Oct - Mar mean 2.11 0.1 0.43 0.53 -1.28 Apr - Sep mean 0.77 -1.31 -0.3 -1.61 -0.17
Last spring frost -10.8 days +2.59 d -3.6 d -1.0 d +17.7 d First winter frost +3.5 days -2.16 d -4.7 d -6.8 d -20.7 d Frost free days +12.0 days -4.10 d -0.4 d -4.5 d -37.2 d
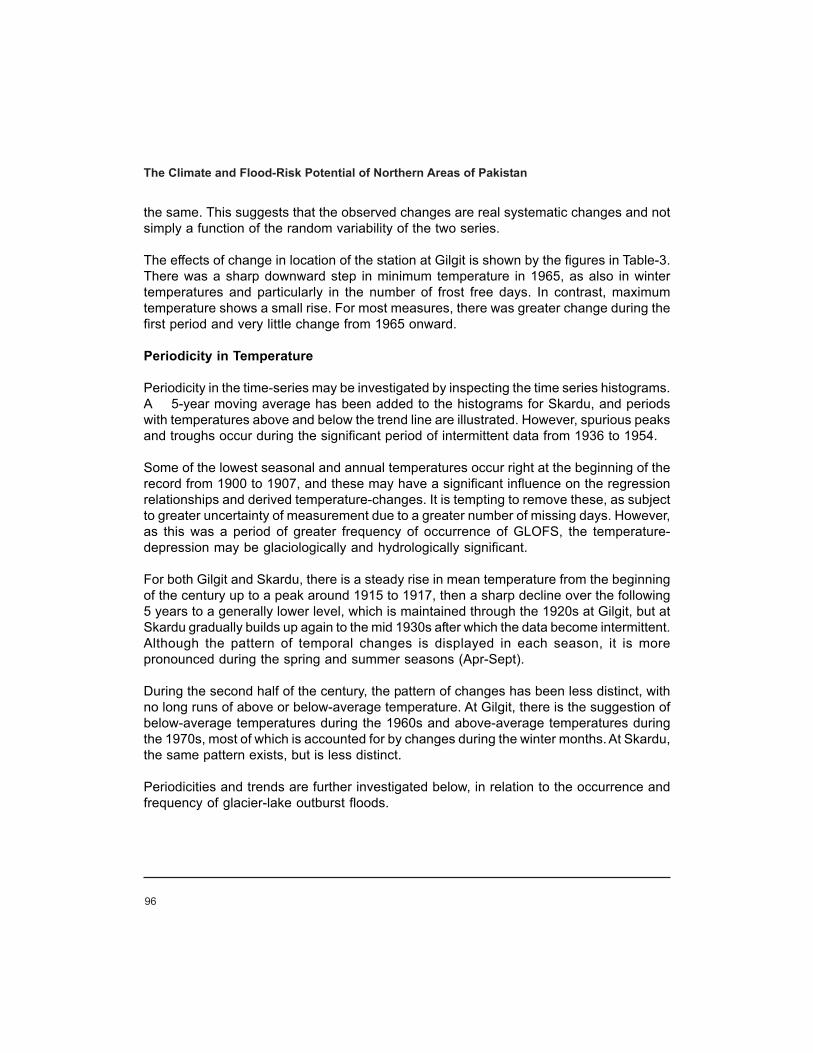
96
the same. This suggests that the observed changes are real systematic changes and notsimply a function of the random variability of the two series.
The effects of change in location of the station at Gilgit is shown by the figures in Table-3.There was a sharp downward step in minimum temperature in 1965, as also in wintertemperatures and particularly in the number of frost free days. In contrast, maximumtemperature shows a small rise. For most measures, there was greater change during thefirst period and very little change from 1965 onward.
Periodicity in Temperature
Periodicity in the time-series may be investigated by inspecting the time series histograms.A 5-year moving average has been added to the histograms for Skardu, and periodswith temperatures above and below the trend line are illustrated. However, spurious peaksand troughs occur during the significant period of intermittent data from 1936 to 1954.
Some of the lowest seasonal and annual temperatures occur right at the beginning of therecord from 1900 to 1907, and these may have a significant influence on the regressionrelationships and derived temperature-changes. It is tempting to remove these, as subjectto greater uncertainty of measurement due to a greater number of missing days. However,as this was a period of greater frequency of occurrence of GLOFS, the temperature-depression may be glaciologically and hydrologically significant.
For both Gilgit and Skardu, there is a steady rise in mean temperature from the beginningof the century up to a peak around 1915 to 1917, then a sharp decline over the following5 years to a generally lower level, which is maintained through the 1920s at Gilgit, but atSkardu gradually builds up again to the mid 1930s after which the data become intermittent.Although the pattern of temporal changes is displayed in each season, it is morepronounced during the spring and summer seasons (Apr-Sept).
During the second half of the century, the pattern of changes has been less distinct, withno long runs of above or below-average temperature. At Gilgit, there is the suggestion ofbelow-average temperatures during the 1960s and above-average temperatures duringthe 1970s, most of which is accounted for by changes during the winter months. At Skardu,the same pattern exists, but is less distinct.
Periodicities and trends are further investigated below, in relation to the occurrence andfrequency of glacier-lake outburst floods.
The Climate and Flood-Risk Potential of Northern Areas of Pakistan
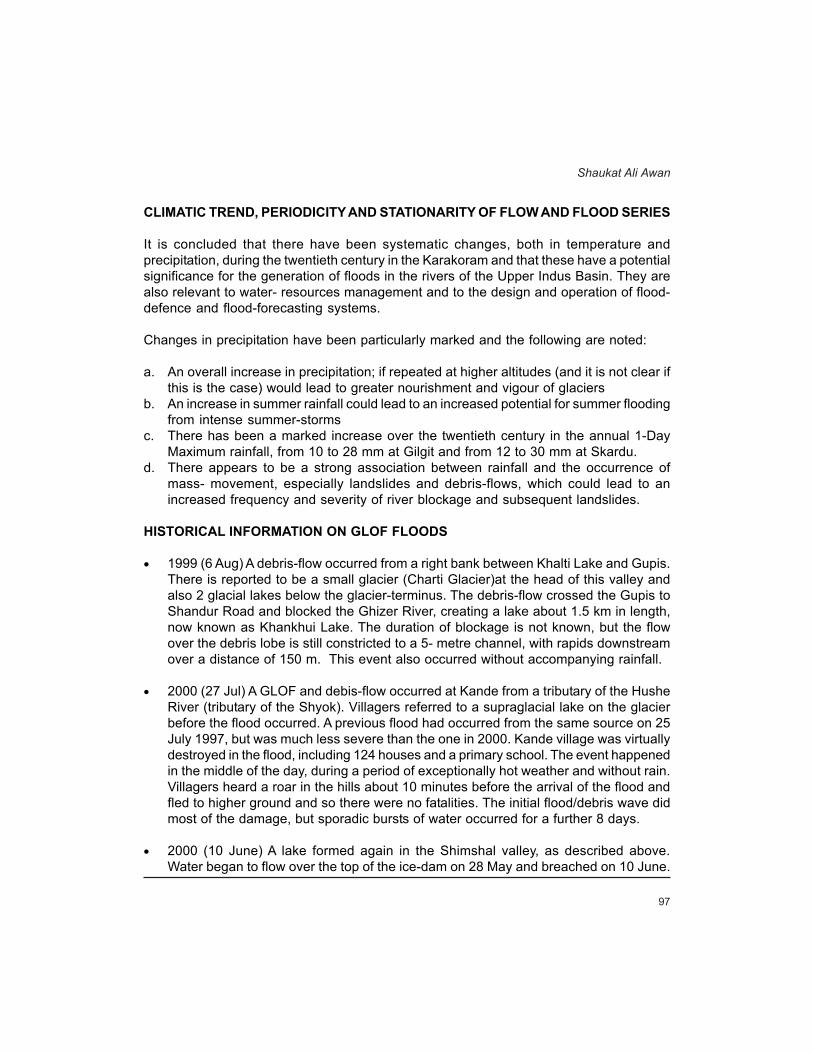
97
CLIMATIC TREND, PERIODICITY AND STATIONARITY OF FLOW AND FLOOD SERIES
It is concluded that there have been systematic changes, both in temperature andprecipitation, during the twentieth century in the Karakoram and that these have a potentialsignificance for the generation of floods in the rivers of the Upper Indus Basin. They arealso relevant to water- resources management and to the design and operation of flood-defence and flood-forecasting systems.
Changes in precipitation have been particularly marked and the following are noted:
a. An overall increase in precipitation; if repeated at higher altitudes (and it is not clear ifthis is the case) would lead to greater nourishment and vigour of glaciers
b. An increase in summer rainfall could lead to an increased potential for summer floodingfrom intense summer-storms
c. There has been a marked increase over the twentieth century in the annual 1-DayMaximum rainfall, from 10 to 28 mm at Gilgit and from 12 to 30 mm at Skardu.
d. There appears to be a strong association between rainfall and the occurrence ofmass- movement, especially landslides and debris-flows, which could lead to anincreased frequency and severity of river blockage and subsequent landslides.
HISTORICAL INFORMATION ON GLOF FLOODS
• 1999 (6 Aug) A debris-flow occurred from a right bank between Khalti Lake and Gupis.There is reported to be a small glacier (Charti Glacier)at the head of this valley andalso 2 glacial lakes below the glacier-terminus. The debris-flow crossed the Gupis toShandur Road and blocked the Ghizer River, creating a lake about 1.5 km in length,now known as Khankhui Lake. The duration of blockage is not known, but the flowover the debris lobe is still constricted to a 5- metre channel, with rapids downstreamover a distance of 150 m. This event also occurred without accompanying rainfall.
• 2000 (27 Jul) A GLOF and debis-flow occurred at Kande from a tributary of the HusheRiver (tributary of the Shyok). Villagers referred to a supraglacial lake on the glacierbefore the flood occurred. A previous flood had occurred from the same source on 25July 1997, but was much less severe than the one in 2000. Kande village was virtuallydestroyed in the flood, including 124 houses and a primary school. The event happenedin the middle of the day, during a period of exceptionally hot weather and without rain.Villagers heard a roar in the hills about 10 minutes before the arrival of the flood andfled to higher ground and so there were no fatalities. The initial flood/debris wave didmost of the damage, but sporadic bursts of water occurred for a further 8 days.
• 2000 (10 June) A lake formed again in the Shimshal valley, as described above.Water began to flow over the top of the ice-dam on 28 May and breached on 10 June.
Shaukat Ali Awan
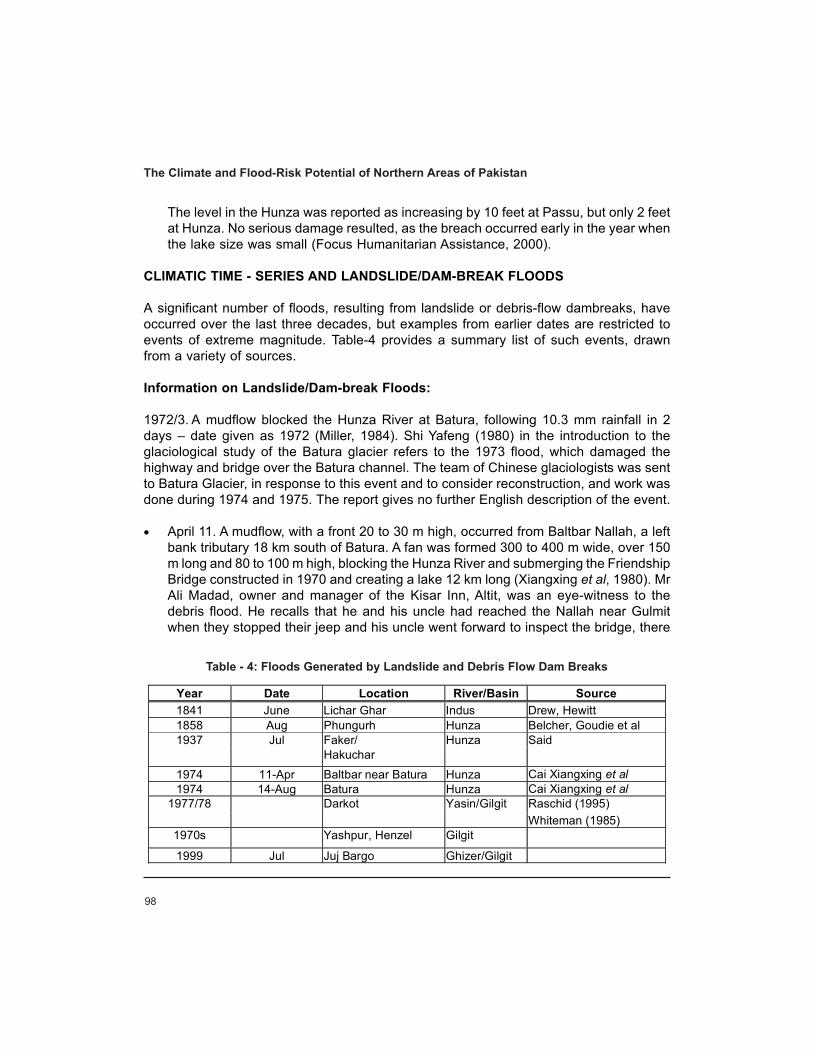
98
The level in the Hunza was reported as increasing by 10 feet at Passu, but only 2 feetat Hunza. No serious damage resulted, as the breach occurred early in the year whenthe lake size was small (Focus Humanitarian Assistance, 2000).
CLIMATIC TIME - SERIES AND LANDSLIDE/DAM-BREAK FLOODS
A significant number of floods, resulting from landslide or debris-flow dambreaks, haveoccurred over the last three decades, but examples from earlier dates are restricted toevents of extreme magnitude. Table-4 provides a summary list of such events, drawnfrom a variety of sources.
Information on Landslide/Dam-break Floods:
1972/3. A mudflow blocked the Hunza River at Batura, following 10.3 mm rainfall in 2days – date given as 1972 (Miller, 1984). Shi Yafeng (1980) in the introduction to theglaciological study of the Batura glacier refers to the 1973 flood, which damaged thehighway and bridge over the Batura channel. The team of Chinese glaciologists was sentto Batura Glacier, in response to this event and to consider reconstruction, and work wasdone during 1974 and 1975. The report gives no further English description of the event.
• April 11. A mudflow, with a front 20 to 30 m high, occurred from Baltbar Nallah, a leftbank tributary 18 km south of Batura. A fan was formed 300 to 400 m wide, over 150m long and 80 to 100 m high, blocking the Hunza River and submerging the FriendshipBridge constructed in 1970 and creating a lake 12 km long (Xiangxing et al, 1980). MrAli Madad, owner and manager of the Kisar Inn, Altit, was an eye-witness to thedebris flood. He recalls that he and his uncle had reached the Nallah near Gulmitwhen they stopped their jeep and his uncle went forward to inspect the bridge, there
Year Date Location River/Basin Source 1841 June Lichar Ghar Indus Drew, Hewitt 1858 Aug Phungurh Hunza Belcher, Goudie et al
Faker/ 1937 Jul Hakuchar
Hunza Said
1974 11-Apr Baltbar near Batura Hunza Cai Xiangxing et al 1974 14-Aug Batura Hunza Cai Xiangxing et al
Raschid (1995) 1977/78 Darkot Yasin/Gilgit Whiteman (1985)
1970s Yashpur, Henzel Gilgit
1999 Jul Juj Bargo Ghizer/Gilgit
Table - 4: Floods Generated by Landslide and Debris Flow Dam Breaks
The Climate and Flood-Risk Potential of Northern Areas of Pakistan
99
having been some previous rains. Suddenly, he heard a roaring sound and saw asmoke-like mist upstream. A wave-front of stones and mud rushed down the valley,overwhelmed the bridge and killed his uncle instantly, along with some villagers workingin nearby fields. He fled and narrowly escaped.
• 1974. A debris flow from a left-bank gully followed heavy rainfall and blocked theHunza River, which then had a flow of 250 m3/sec. The mudflow had a front 5 m high;the stage rose rapidly and submerged the bridge over the Hunza. One hour later, theriver cut through the fan deposits
• Raschid (1995) quotes a resident of Darkot on the Upper Yasin River as saying “In1977 a flood of rocks and mud all but obliterated the village and destroyed every inchof farmland”. Whiteman (1985) refers to this event as occurring in 1978.
• 31 Jul/August. A debris-flow from a small steep left-bank nallah at Juj Bargo produceda debris lobe across the river against the rock-face on the right bank. A lake wasformed upstream and destroyed the small village of Juj Bargo and still (in 2001) extendsabout 1 km in length upstream from the remaining barrier. The site is a short distanceupstream from Gakuch and the Ishkoman confluence.
SUMMARY OF CONCLUSIONS ON FLOOD STATIONARITY
Changes in the climate have had, or may have had, an influence on the magnitude andfrequency of flooding in rivers in northern Pakistan.
With respect to snow and glacier melt, the magnitude of temperature-changes during thespring and summer are insufficient to have caused a major change in the flood-potentialof catchments. However, changes in winter-temperatures are sufficient to have influencedthe amount and altitudinal distribution of snow available for melt in the subsequent seasonand this may influence the magnitude of the summer peak.
Changes in precipitation may be more significant in flood-generation. Not only have theseasonal and monthly totals shown a significant upward trend, but also the maximumannual daily amount. It would thus be inappropriate to include the full 100 year data-set inthe assessment of rainfall-frequency at Gilgit and Skardu, but rather to restrict the analysisto the last few decades.
Changes in amount and intensity of precipitation may also play a role in the frequency oflandslides, which create river- dams and subsequent flood-waves. It is possible that thegreater reported number over the last few decades is a reflection of more frequentoccurrence, due to increased rainfall, but it may also be due to the recent presence ofscientific observers to record the events. However, it is clear that there are sufficient
Shaukat Ali Awan

100
occurrences of landslide and debris-flow blockages of many rivers, so that the possibilitymust be considered in any design-estimation. A previous occurrence implies that there isa risk of future recurrence.
REFERENCES
– Archer, D.R. (1999) Practical application of historical floor information in flood-estimation. In:Hydrological Extremes: Understanding, Predicting, Mitigation, (ed by L. Gotoschalk,),. IAHSPub. No.255, pp 191-199
– Archer, D.R. (2001 a) Recent glacial outbursts, debris-flows and dambreaks in the Ghizer/Gilgit basin of northern Pakistan, GTZ/WAPDA/VSO
– De Scally, F.A., (1994) Relative importance of snow accumulation and monsoon rainfall forestimating the annual runoff, Jhelum basin, Pakistan. Hydrological Sciences Journal.39, pp192-216.
– Dhar, O.N. and Rakhecha, P.R. (1981) The effect of elevation on monsoon rainfall distributionin the Central Himalayas, Proc. International Symposium on Monsoon Dynamics, CambridgeUniv. Press pp 253-260.
– Hewitt, K. (1982) Natural dams and outburst floods in the Karakoram Himalaya, InternationalAssociation of Hydrological Sciences, Publ 138, pp 259-269.
– Hewitt, K. (1985) Pakistan case study: catastrophic floods, International Association ofHydrological Sciences, Publ. 149, pp 131-135.
– Hewitt, K. (Ed) (1990) Overall report: snow and ice hydrology project, Upper Indus basin SIHP,Cold Regions Research Centre, Wilfred Laurier University, 179 pp.
– Hill, S.A. (1981) The meteorology of North-West Himalaya, Indian Met. Mem. I (IV), pp 377-429.
– Jacobsen, J-P Climate records from Northern Pakistan (Yasin Valley), in Cultural Area Karakorm,Vewsleter 3, pp 22-25, Tubingen.
– Raschid, S. (1995) Between Two Burrs on the Map-Travels in northern Pakistan, VanguardBooks, Lahore.
– Shifeng, Y. and Wang W (1980) Research on snow-cover in China and the avalanchephenomena of Batura Glacier in Pakistan, Jour of Glaciology, 26 pp 25-30.
– Singh, P., Ramashastric, K.S. and Kumar, N. (1995) Topographic influences on precipitation-distribution in different ranges of the Western Himalayas, Nordic Hydrology, 26, pp 259-284.
– Wake, C.P. (1989) Glaciochemical investigation as a tool to determine the spatial variation ofsnow-accmulation in the Central Karakoram, Northern Pakistan, Ann, Glaciology, 13, pp 279-284.
– Whiteman, P.T.S. (1985) Mountain Oases, A Technical Report of Agricultural studies (1982-84)in Gilgit Districts, Northern areas, Pakistan, FAO/UNDP.
– Zhang, X., and shifeng, W. (1980) Changes in the Batura Galcier in the Quaternary and Recenttimes, in , Professional Papers on the Batura Glacier, (Ed Shifeng, W.)
The Climate and Flood-Risk Potential of Northern Areas of Pakistan
Drought-MitigationInterventions by Improved
Water-Management(A Case Study from Punjab - Pakistan)
Asrar-ul-Haq
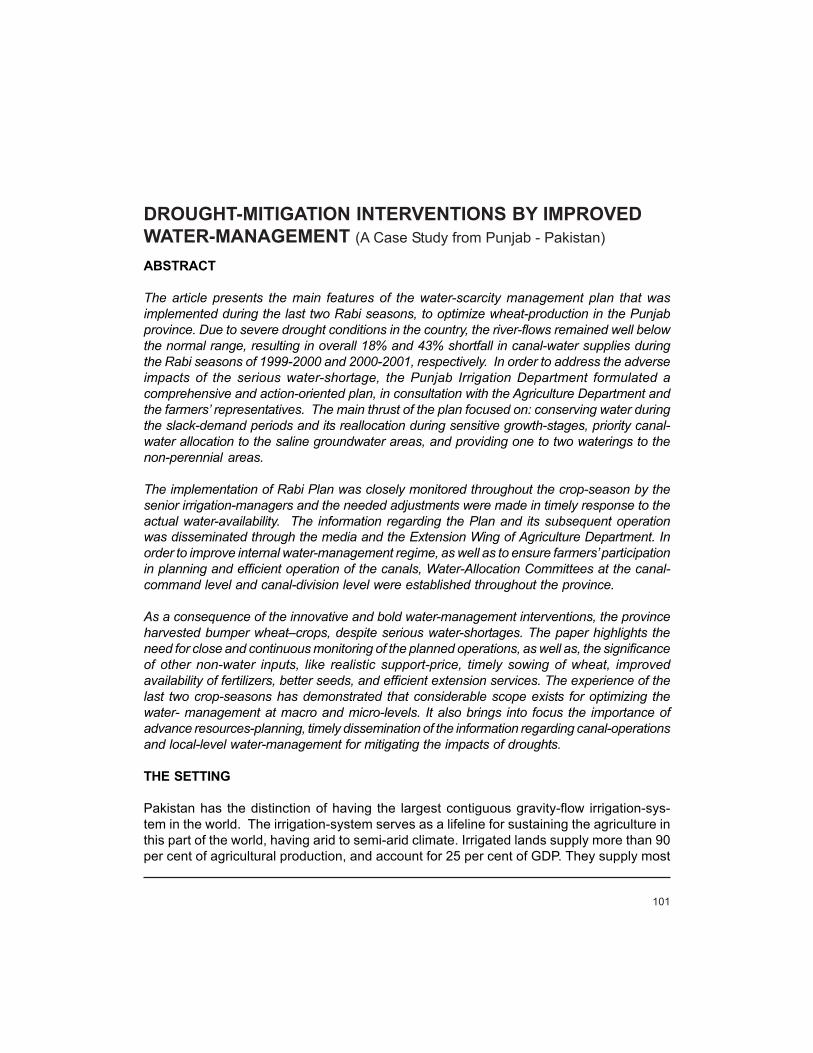
101
ABSTRACT
The article presents the main features of the water-scarcity management plan that wasimplemented during the last two Rabi seasons, to optimize wheat-production in the Punjabprovince. Due to severe drought conditions in the country, the river-flows remained well belowthe normal range, resulting in overall 18% and 43% shortfall in canal-water supplies duringthe Rabi seasons of 1999-2000 and 2000-2001, respectively. In order to address the adverseimpacts of the serious water-shortage, the Punjab Irrigation Department formulated acomprehensive and action-oriented plan, in consultation with the Agriculture Department andthe farmers’ representatives. The main thrust of the plan focused on: conserving water duringthe slack-demand periods and its reallocation during sensitive growth-stages, priority canal-water allocation to the saline groundwater areas, and providing one to two waterings to thenon-perennial areas.
The implementation of Rabi Plan was closely monitored throughout the crop-season by thesenior irrigation-managers and the needed adjustments were made in timely response to theactual water-availability. The information regarding the Plan and its subsequent operationwas disseminated through the media and the Extension Wing of Agriculture Department. Inorder to improve internal water-management regime, as well as to ensure farmers’ participationin planning and efficient operation of the canals, Water-Allocation Committees at the canal-command level and canal-division level were established throughout the province.
As a consequence of the innovative and bold water-management interventions, the provinceharvested bumper wheat–crops, despite serious water-shortages. The paper highlights theneed for close and continuous monitoring of the planned operations, as well as, the significanceof other non-water inputs, like realistic support-price, timely sowing of wheat, improvedavailability of fertilizers, better seeds, and efficient extension services. The experience of thelast two crop-seasons has demonstrated that considerable scope exists for optimizing thewater- management at macro and micro-levels. It also brings into focus the importance ofadvance resources-planning, timely dissemination of the information regarding canal-operationsand local-level water-management for mitigating the impacts of droughts.
THE SETTING
Pakistan has the distinction of having the largest contiguous gravity-flow irrigation-sys-tem in the world. The irrigation-system serves as a lifeline for sustaining the agriculture inthis part of the world, having arid to semi-arid climate. Irrigated lands supply more than 90per cent of agricultural production, and account for 25 per cent of GDP. They supply most
DROUGHT-MITIGATION INTERVENTIONS BY IMPROVEDWATER-MANAGEMENT (A Case Study from Punjab - Pakistan)
102
of the country’s needed food-grain and also are the source of raw materials for majordomestic industries.
Irrigation in the Indus Basin has a long history, dating back to the Indus Civilisation. Irrigationdevelopment on a scale unknown in history, however, started about the middle of 19th
century under British rule. The inundation canals were first improved, and then graduallyconverted to properly- regulated perennial channels, by means of weirs and barragesconstructed across the rivers. Large inter-basin link canals and storages were subsequentlyconstructed, as a consequence of Indus Water Treaty in 1960s and the first half of 1970sThe existing storage capacity of Tarbela and Mangla reservoirs, constructed as a sequel toIndus Water Treaty, is rather small; being less than 10% of the average annual river flows.The construction of these storages and link-canals allow operation of the Indus-BasinIrrigation System in a more integrated manner, with greater control and flexibility. This,however, requires comprehensive advance planning and technical expertise to optimisecanal operations (Haq, 1998).
The Punjab Irrigation network was designed as a ‘protective’ system, with low croppingintensities. However, over decades of canal-system operation and as a consequence ofrapid growth of population, the irrigation demand has increased way beyond the designedcapacities. The Irrigation network of the Province comprises 21canal-systems, about 8000km of drains, 6000 large-size public tubewells and around 500,000 small-capacity privatetubewells, 31 small dams and an extensive flood-protection infrastructure. There are 14major barrages on the five rivers flowing in the heart of this valley, with a total off-takecanal capacity of 3400 cusecs of irrigation supplies and another 3100 cusecs capacity ofinter- river links. The colossal canal network provides irrigation facilities to 8.5 Mha offertile lands in the Punjab. Of this, 5.3 Mha receive year-round (perennial) supplies, while3.2 Mha get canal water only during six summer months (non-perennial canals). Thereare two main crop- seasons, i.e. Summer (Kharif) and Winter (Rabi). Cotton, sugarcaneand rice are the main Kharif crops, while wheat is the principal Rabi crop. The groundwaterdevelopment, by means of small-capacity private tubewells, has played a significant rolein supplementing irrigation-water supplies during the last three decades and, in most ofthe Fresh Groundwater areas, the tubewells are contributing around 40% of the overallirrigation water requirements (PGC, 2000).
WATER MANAGEMENT REGIME
The waters of the Indus Basin Rivers stand apportioned between the four Provinces of Pakistan,through the Water Apportionment Accord of 1991. The province-wise Accord allocations arepresented in Table-1, while the historic uses (1977 – 82) are given in Table - 2 (GOP, 1991).The Indus River System Authority (IRSA) was established in 1993 for water-allocation and theimplementation of the Water Accord. This Authority prepares the forecast of water-availabilityfor each crop-season i.e. Kharif and Rabi, and determines the provincial shares, in accordance
Drought-Mitigation Interventions by Improved Water-Management

103
with the provisions of the Water Accord. The Provincial Irrigation Departments formulate thecanal regulation program for the crop–season, according to the provincial shares intimated byIRSA. If the available share is less than the crop requirements, a canal rotational program isprepared, to distribute the available supply equitably over the entire canal-system. Water-Allocation Committees, comprising representatives of Irrigation and Agriculture Department,as well as representatives of the farming community, are constituted at all the main canalsand branch canals level to formulate, approve and monitor the implementation of the rotationalprograms.
WATER AVAILABILITY DURING LAST TWO RABI SEASONS
Drought conditions were experienced in Pakistan during the last two years; the water shortagewas particularly severe during Rabi 2000-2001. The monsoon rains were also erratic andbelow normal in the canal-irrigated areas. The initial forecast of water- availability prepared byIRSA indicated that the expected water-availability for Punjab canals during the Rabi period1999-2000 would be about 20.9 BCM, against Punjab Accord share of 23.2 BCM and projected
(BCM) Province Kharif Rabi Total
Punjab 45.6 23.21 68.81 Sindh** 41.75 18.23 59.98 NWFP 4.28 2.83 7.11 Civil Canals*** 2.21 1.48 3.69 Baluchistan 3.51 1.25 4.76
95.14 45.52 140.66 + + + Total
2.21** 1.48** 3.69**
Note: * Para 2 Allocations
** Including already sanctioned Urban and Industrial uses for Metropolitan Karachi
***Un-gauged Civil Canals above the rim stations.
Table - 1: Accord Allocations*
Table - 2: Actual Average Historic Uses 1977-82(BCM)
Province Kharif Rabi Total
Punjab 42.62 24.29 66.91 Sindh 35.41 18.34 53.75 NWFP 2.24 1.59 3.8 Baluchistan 1.59 1.01 2.6 Total 81.83 45.23 127.06
Asrar-ul-Haq
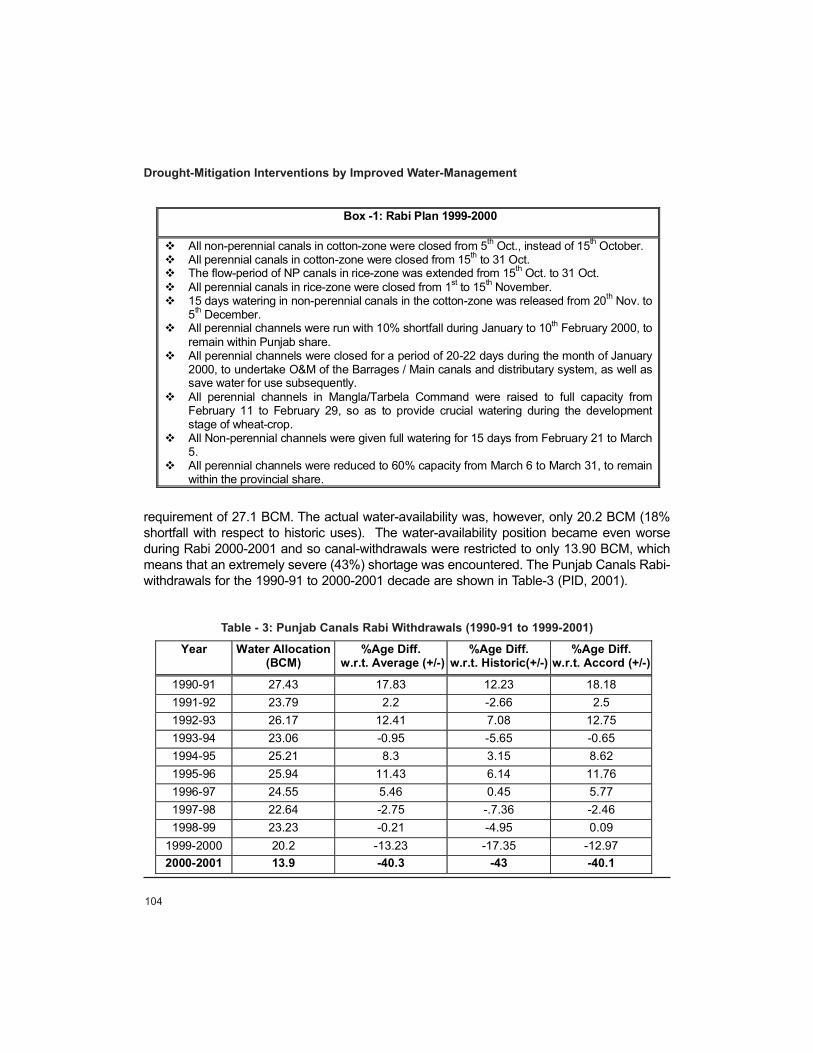
104
Year Water Allocation (BCM)
%Age Diff. w.r.t. Average (+/-)
%Age Diff. w.r.t. Historic(+/-)
%Age Diff. w.r.t. Accord (+/-)
1990-91 27.43 17.83 12.23 18.18 1991-92 23.79 2.2 -2.66 2.5 1992-93 26.17 12.41 7.08 12.75 1993-94 23.06 -0.95 -5.65 -0.65 1994-95 25.21 8.3 3.15 8.62 1995-96 25.94 11.43 6.14 11.76 1996-97 24.55 5.46 0.45 5.77 1997-98 22.64 -2.75 -.7.36 -2.46 1998-99 23.23 -0.21 -4.95 0.09
1999-2000 20.2 -13.23 -17.35 -12.97 2000-2001 13.9 -40.3 -43 -40.1
Table - 3: Punjab Canals Rabi Withdrawals (1990-91 to 1999-2001)
requirement of 27.1 BCM. The actual water-availability was, however, only 20.2 BCM (18%shortfall with respect to historic uses). The water-availability position became even worseduring Rabi 2000-2001 and so canal-withdrawals were restricted to only 13.90 BCM, whichmeans that an extremely severe (43%) shortage was encountered. The Punjab Canals Rabi-withdrawals for the 1990-91 to 2000-2001 decade are shown in Table-3 (PID, 2001).
Drought-Mitigation Interventions by Improved Water-Management
Box -1: Rabi Plan 1999-2000
All non-perennial canals in cotton-zone were closed from 5th Oct., instead of 15th October. All perennial canals in cotton-zone were closed from 15th to 31 Oct. The flow-period of NP canals in rice-zone was extended from 15th Oct. to 31 Oct. All perennial canals in rice-zone were closed from 1st to 15th November. 15 days watering in non-perennial canals in the cotton-zone was released from 20th Nov. to
5th December. All perennial channels were run with 10% shortfall during January to 10th February 2000, to
remain within Punjab share. All perennial channels were closed for a period of 20-22 days during the month of January
2000, to undertake O&M of the Barrages / Main canals and distributary system, as well as save water for use subsequently.
All perennial channels in Mangla/Tarbela Command were raised to full capacity from February 11 to February 29, so as to provide crucial watering during the development stage of wheat-crop.
All Non-perennial channels were given full watering for 15 days from February 21 to March 5.
All perennial channels were reduced to 60% capacity from March 6 to March 31, to remain within the provincial share.
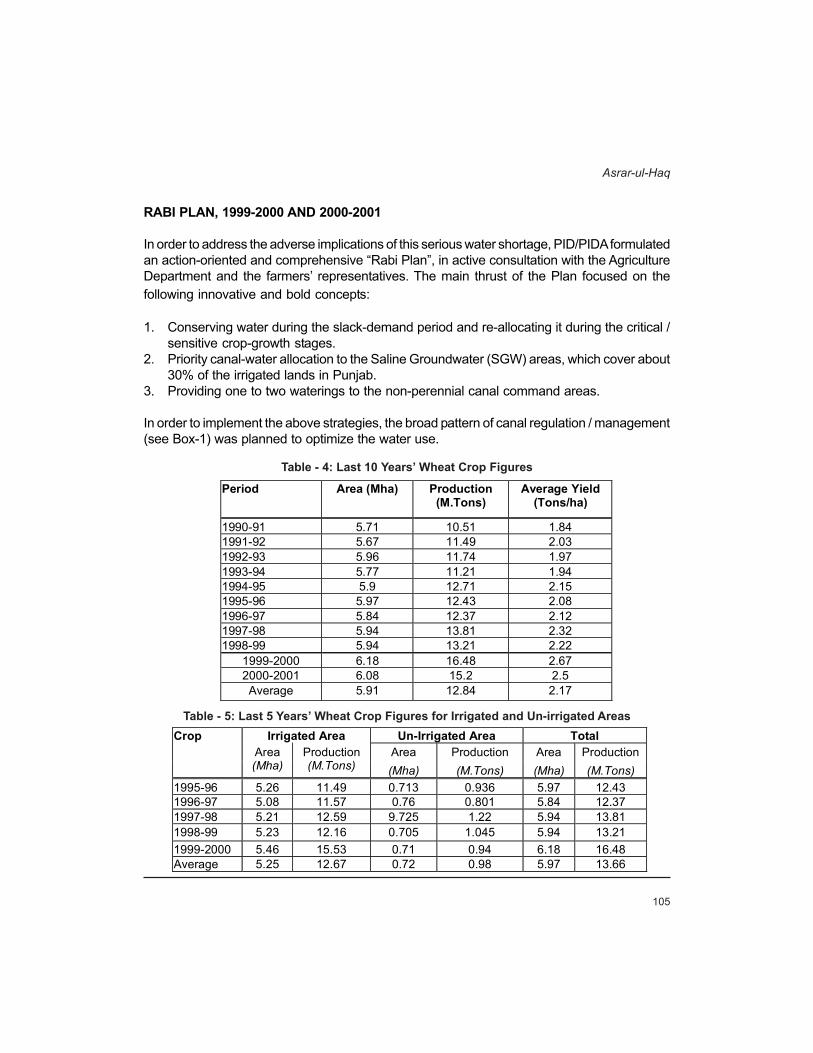
105
RABI PLAN, 1999-2000 AND 2000-2001
In order to address the adverse implications of this serious water shortage, PID/PIDA formulatedan action-oriented and comprehensive “Rabi Plan”, in active consultation with the AgricultureDepartment and the farmers’ representatives. The main thrust of the Plan focused on thefollowing innovative and bold concepts:
1. Conserving water during the slack-demand period and re-allocating it during the critical /sensitive crop-growth stages.
2. Priority canal-water allocation to the Saline Groundwater (SGW) areas, which cover about30% of the irrigated lands in Punjab.
3. Providing one to two waterings to the non-perennial canal command areas.
In order to implement the above strategies, the broad pattern of canal regulation / management(see Box-1) was planned to optimize the water use.
Table - 4: Last 10 Years’ Wheat Crop Figures
Irrigated Area Un-Irrigated Area Total Area Production Area Production
Crop Area (Mha)
Production (M.Tons) (Mha) (M.Tons) (Mha) (M.Tons)
1995-96 5.26 11.49 0.713 0.936 5.97 12.43 1996-97 5.08 11.57 0.76 0.801 5.84 12.37 1997-98 5.21 12.59 9.725 1.22 5.94 13.81 1998-99 5.23 12.16 0.705 1.045 5.94 13.21 1999-2000 5.46 15.53 0.71 0.94 6.18 16.48 Average 5.25 12.67 0.72 0.98 5.97 13.66
Table - 5: Last 5 Years’ Wheat Crop Figures for Irrigated and Un-irrigated Areas
Period Area (Mha) Production (M.Tons)
Average Yield (Tons/ha)
1990-91 5.71 10.51 1.84 1991-92 5.67 11.49 2.03 1992-93 5.96 11.74 1.97 1993-94 5.77 11.21 1.94 1994-95 5.9 12.71 2.15 1995-96 5.97 12.43 2.08 1996-97 5.84 12.37 2.12 1997-98 5.94 13.81 2.32 1998-99 5.94 13.21 2.22
1999-2000 6.18 16.48 2.67 2000-2001 6.08 15.2 2.5 Average 5.91 12.84 2.17
Asrar-ul-Haq

106
The implementation of Rabi Plan was closely monitored throughout the crop season by thesenior irrigation-managers and the needed adjustments were made timely, in response to theactual water-availability. The information regarding the Rabi Plan and its subsequent operationwas disseminated through the media and the extension wing of Agriculture Department
INTERNAL WATER-MANAGEMENT AT CANAL-COMMAND LEVEL
In order to improve internal water- management regime, as well as to ensure farmers’participation in planning and operating the canals, for equitable and efficient distributionof irrigation water, Water Allocation Committees at the Canal Command level and at theCanal Division level were established throughout the Province, as below (PID, 2000):
WATER MANAGEMENT IMPACT ON WHEAT PRODUCTION
As a consequence of the innovative and bold water-management interventions, complementedby improved agricultural practices and incentive offered by enhanced support-price, the provinceharvested a bumper wheat crop. The following analysis demonstrate the overwhelming impactof water-management optimization on the record wheat-production (GOPb, 1999; GOPb,2001):
1998-99 1999-2000 %age increase Area Production Area Production
District Area (Mha)
Production (M.Tons) (Mha) (M.Tons) (Mha) (M.Tons)
Faisalabad 0.24 0.55 0.25 0.77 4.1 40 TT Sing 0.14 0.35 0.14 0.47 0 34.2 Kasur 0.16 0.4 0.17 0.51 6.2 27.5 Bahawalpur 0.27 0.55 0.28 0.71 3.7 29
Table - 6: Wheat Areas and Production in Saline Groundwater Areas
Drought-Mitigation Interventions by Improved Water-Management
BOX - 2: RABI PLAN 2000 – 2001 All the Non-perennial canals in Cotton Zone were closed 15 days in advance (01
October instead of 15 October). All perennial channels in Cotton Zone closed for 3 weeks (10-31 October). Extension of flow period of NP channels in Rice-Zone by 5 days (upto 20 October). 10 days closure of all Perennial channels in Rice Zone. Two weeks watering in Cotton Zone for Wheat-Sowing (20 November to 05
December). Perennial Canals running
55% Capacity: Upto 15 February 70% Capacity: Upto 28 February 30% Capacity: During March
Non Perennial Channels: Closed

107
• The Wheat-crop figures for the last 10 years presented in Table-4 show that, despite 18%water-shortage during 1999-2000, the area under wheat increased by about 5% and thewheat-production increased by 28% over the last 10 years’ average. Although wheatarea and production declined during 2000-2001, compared to 1999-2000 bumper crop,yet the cropped area was 3% more than last 10 years average, while the crop-productionwas 18% higher than the last 10 years average production despite the most seriousdrought-conditions, which resulted in 43% shortage of canal water.
• It may be noted that the wheat-production in the un-irrigated areas declined by about 5%during 1999-2000 over the last five years average, due to erratic rainfall during 1999-2000 (Table-5).
• The wheat production in four selected SGW districts, where canal-water is the only sourceof irrigation, increased by 27-40% during 1999-2000 over the corresponding last yearfigures (Table-6). This clearly demonstrates the positive impacts of priority water-allocationto SGW areas.
CONCLUSIONS
The following main conclusions can be drawn from the experience gained out of the water-scarcity management programme undertaken by the Punjab Irrigation Department / PIDAduring Rabi 1999-2000 and Rabi 2000-2001. The management-interventions were unique inthe sense that they were implemented on an unprecedented mega–scale, involving over 8.5million hectares of the commanded area in the Punjab.
1. It has been demonstrated that considerable scope exists for optimizing the water-management / allocation at macro-level. It also brings into focus the significance of thefollowing optimization alternatives:
• Re-allocating water within the crop–season, to better match the crop water-requirements. Additional canal-closures can be planned for the purpose during theslack-demand periods. This also helps in improving the drainage-environment in theroot-zone, particularly in the waterlogged areas.
• Allocating preferential canal-supply to the saline groundwater areas.• Priority-water allocation during sensitive / critical crop-growth stage.• Providing one to two canal-watering to non-perennial areas, which traditionally do
not receive canal-supplies during the Rabi season.• Conjunctive groundwater use.
2. Importance of advance resource–planning, in collaboration with all the stake-holders(Irrigation Department, Agriculture Department, Water-Allocation Committees, etc.), isbrought out. The advantages / need for timely dissemination of the information regardingcanal-operation plans to the farmers is also highlighted.
Asrar-ul-Haq
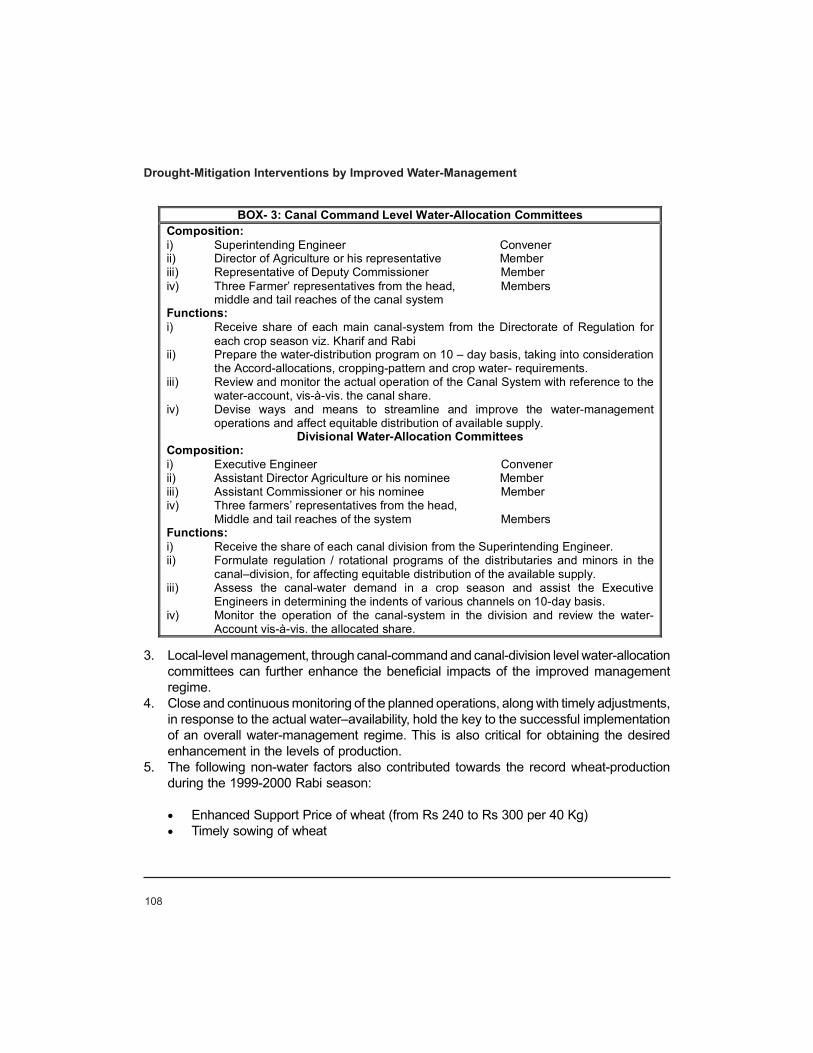
108
3. Local-level management, through canal-command and canal-division level water-allocationcommittees can further enhance the beneficial impacts of the improved managementregime.
4. Close and continuous monitoring of the planned operations, along with timely adjustments,in response to the actual water–availability, hold the key to the successful implementationof an overall water-management regime. This is also critical for obtaining the desiredenhancement in the levels of production.
5. The following non-water factors also contributed towards the record wheat-productionduring the 1999-2000 Rabi season:
• Enhanced Support Price of wheat (from Rs 240 to Rs 300 per 40 Kg)• Timely sowing of wheat
Drought-Mitigation Interventions by Improved Water-Management
BOX- 3: Canal Command Level Water-Allocation Committees Composition: i) Superintending Engineer Convener ii) Director of Agriculture or his representative Member iii) Representative of Deputy Commissioner Member iv) Three Farmer’ representatives from the head, Members
middle and tail reaches of the canal system Functions: i) Receive share of each main canal-system from the Directorate of Regulation for
each crop season viz. Kharif and Rabi ii) Prepare the water-distribution program on 10 – day basis, taking into consideration
the Accord-allocations, cropping-pattern and crop water- requirements. iii) Review and monitor the actual operation of the Canal System with reference to the
water-account, vis-à-vis. the canal share. iv) Devise ways and means to streamline and improve the water-management
operations and affect equitable distribution of available supply. Divisional Water-Allocation Committees
Composition: i) Executive Engineer Convener ii) Assistant Director Agriculture or his nominee Member iii) Assistant Commissioner or his nominee Member iv) Three farmers’ representatives from the head,
Middle and tail reaches of the system Members Functions: i) Receive the share of each canal division from the Superintending Engineer. ii) Formulate regulation / rotational programs of the distributaries and minors in the
canal–division, for affecting equitable distribution of the available supply. iii) Assess the canal-water demand in a crop season and assist the Executive
Engineers in determining the indents of various channels on 10-day basis. iv) Monitor the operation of the canal-system in the division and review the water-
Account vis-à-vis. the allocated share.
109
• Improved availability of fertilizers, better seeds and efficient extension- services, etc.• Favourable weather-conditions at the time of crop-maturing.
6. The enhanced dependence on Groundwater has resulted in considerable depletionof Aquifers and increased burden on farmers, because of high cost of Pumped Water.
7. The successful model of water-scarcity management during Rabi 1999-2000 has beena good learning experience, which has been replicated quite effectively during theRabi 2000-2001 crop, also, in the face of a much more severe water shortage.
REFERENCES
– GOP 1991: Water Accord 1991. Government of Pakistan.– GOPb. 1999. Punjab Development Statistics 1999. Bureau of Statistics, Government of Punjab.– GOPb. 2001. Final Estimate of Wheat Crop in the Punjab for the year 1999-2000. Directorate of
Agriculture, Crop Reporting Service Punjab.– Haq, A.U. 1998. A case study of the Punjab Irrigation & Power Department. IIMI Publication No.C-
12.– PID. 2001. Water Availability and Regulation. Unpublished Documents and Files. Punjab Irrigation
Department.– PGC. 2000. Groundwater Regulatory Framework Policy Paper: Current Status and Agenda for its
Completion. Punjab Private Sector Groundwater Development Project Consultants Reports No. 42& 45.
Asrar-ul-Haq

A
Assessment of Water-QualityIqbal H. Qureshi
111
ABSTRACT
Water is the most essential component of all living things and it supports the life-process.Without water, it would not have been possible to sustain life on this planet. The totalquantity of water on earth is estimated to be 1.4 trillion cubic meter. Of this, less than 1%water, present in rivers and ground resources, is available to meet our requirement. Theseresources are being contaminated with toxic substances due to ever-increasingenvironmental pollution. To reduce this contamination, many countries have establishedstandards for the discharge of municipal and industrial waste into water streams.
We use water for various purposes and for each purpose we require water of appropriatequality. The quality of water is assessed by evaluating the physical, chemical, biologicaland radiological characteristics of water. Water for drinking and food-preparation must befree from turbidity, colour, odour and objectionable tastes, as well as from disease-causingorganisms and inorganic and organic substances, which may produce adversephysiological effects. Such water is referred to as potable water and is produced bytreatment of raw water, involving various unit operations. The effectiveness of the treatment-processes is checked by assessing the various parameters of water-quality, which involvessampling and analysis of water and comparison with the National Quality Standards orWHO standards. Water conforming to these standards is considered safe and palatablefor human consumption. Periodic assessment of water is necessary, to ensure the qualityof water supplied to the public. This requires proper sampling at specified locations andanalysis of water, employing reliable analytical techniques.
INTRODUCTION: THE IMPORTANCE OF CLEAN WATER
Water is the most common substance on earth and we use it every day, without givingmuch thought to its importance and significance. In fact, water is the most essentialcomponent of all living things, as it supports the life-processes by providing the essentialnutrients to living organisms. Without water, it would not have been possible to sustainlife on this planet. About 70 per cent of the Earth’ s surface is covered with water, whichhelps to regulate the earth’s climate, by transporting heat from warmer to colder regions.The total quantity of water in the oceans, inland seas, rivers, lakes, underground reservoirs,ice caps of mountains and in the atmosphere is estimated to be about 1.4 trillion (1.4 x10¹²) cubic meters1. This quantity has remained the same ever since the formation of theearth. Water changes from one form to another and moves from one place to another,and is used countless times by many persons. All the water we use passes through the“water-cycle” and is used and reused, again and again.
ASSESSMENT OF WATER-QUALITY

112
Water is unevenly distributed on earth. The oceans and inland seas contain about 97.2%,the ice caps of mountains and glaciers about 2.15%, surface and underground resourcesabout 0.63% and the atmosphere about 0.02-0.05%1. Huge amount of water present inoceans and seas can not be used for most purposes, as it contains 35,000 ppm of dissolvedimpurities. Similarly, brackish water contains 1000-25,000 ppm of dissolved impurities.Since, for most applications, water containing less than 1000 ppm dissolved impurities isrequired, this water is not suitable for use. Icecaps and glaciers contain significant amountof relatively fresh water but its exploitation is not economical as yet, although the meltingof mountain-snow actually recharges the water streams.
This distribution shows that, out of all the available water on earth, less than 3% is freshwater. Even out of this 75% is frozen in the glaciers and icecaps. Thus, less than 1 % ofthe total water that is present in rivers and underground resources, is available to meetour present-day requirements.
The surface and ground water resources are not evenly distributed on the surface ofearth and about half of the land has very little or no water at all. This uneven distributionof water is partially responsible for unequal distribution of population in the world. About 5per cent of the land where lots of fresh water is available contains half of the worldpopulation, whereas another half is distributed on the remaining land. The limited availabilityof water in arid and semi-arid areas adversely affects the productivity and prosperity ofpeople and the quality of life.
The population of the world is growing exponentially and has increased from one billion in1820 to about 6 billion in 20002. The population-growth in Table-1 shows that it took severalthousand years to build up the world population to the one-billion mark, whereas now it istaking less than 15 years to add another billion. At present, the population is increasing atthe rate of about 80 million per annum. This rapid growth of population is putting a greatstress on all the available resources, including water. At present about 8% of the populationis facing shortage of fresh water and, with growing population, this may increase to 25%by the year 2050. It is likely that 48 countries, including Pakistan, will face fresh-water
Year 1650 1750 1850 1900 1950 1980 1994 2000
Population 0.55 0.752 1.175 1.6 2.564 4.478 5.642 6.1
Table - 1(a): Population of the World (Billion)
Assessment of Water-Quality
Year 1951 1961 1972 1982 1993 1998
Population 33.74 42.88 65.31 87.75 122.8 136.2
Table - 1(b): Population of Pakistan (Million)

113
shortage. The population of Pakistan has increased from 33.7 million in 1951 to 140million in 2000, whereas water-resources have not substantially increased. It is projectedthat the population will increase to about 250 million by the year 2025. Therefore, carefulplanning and management of the existing water-resources should be given highestconsideration, and the desalination of ocean-water may have to be exploited to add morewater resources.
In Pakistan the availability of surface and ground water is much less than the daily percapita requirement, which will further aggravate with the rapid population growth. The percapita water availability has declined from 5100 m3/a in 1950 to about 1200 m3/a in 2000which may soon fall below 1000 m3/a. Average annual water availability in Pakistan basedon seventy years data is mentioned in Table - 23. We use both surface and ground waterfor drinking and other purposes. The quality of drinking water in most areas is sub-standardas it contains many impurities. The problem of the availability of good quality drinkingwater is more pronounced in coastal areas as the groundwater in these areas containshigh amount of dissolved salts.
SOURCES OF WATER-POLLUTION
Water, during its passage through rivers and through the ground, acquires various typesof dissolved and suspended impurities. In addition to this, the ever-increasingenvironmental pollution, due to various activities of man, is contaminating the waterresources with toxic substances. The main sources of water-pollution are sewage,industrial, agricultural and chemical wastes. The large-scale use of insecticides, pesticidesand other agrochemicals is gradually contaminating the water- resources with toxicchemicals. Effluents from many industries are discharged into rivers and canals, withoutproper treatment to conform to the regulatory requirement. Similarly, untreated municipal
Iqbal H. Qureshi
Table-2: Average Annual Water-Availability In PakistanVolume of Water (bm3) Source
Summer Winter Total Water in Indus river system at rim stations 140 33 173 Direct precipitation 40 9 49 Total Available 180 42 222 10% evaporation loss from surface water 18 4 22 Seepage losses from irrigation system 36 8 44 Water released downstream of Kotri 6 6 12 Water available to users 120 24 144 Groundwater supply 13 40 53 Total at required points 133 64 197
Note: High: 230 bm3 in 1959 - 60 , Low: 124 bm3 in 1974 - 75

114
effluents are dumped into water-bodies. Table - 3 shows the quantity of sewage generated,along with the population in 10 major cities4. Most of this sewage is discharged into water-bodies without any treatment, which causes water pollution.
The pollution of water in river Ravi in Lahore and Nullah Lehi in Rawalpindi / Islamabadwas studies in April 2000 by JIAC, in collaboration with Pak.EPA, by measuring the followingparameters5:
The comparison of these parameters with those of Japanese river-water indicates highpollution in river Ravi and Nallah Lehi. Biochemical oxygen demand (BOD) and chemicaloxygen demand (COD), which are the main indicators of biological and chemical pollution,were found to be much higher (BOD>100 ppm, COD>50 ppm) in most of the samples.
The level of water-pollution due to the release of effluents from various industries in Korangisite area, Karachi, was investigated by Ali and Jilani6. The parameters studied include pH,total suspended solids, total dissolved solids, BOD , COD , grease & oil and heavy metals.The data regarding five different types of industries, along with NEQS, is tabulated intable 4, which indicates that the amounts of pollutants discharged are much higher thanthe permissible levels.
The indiscriminate release of municipal and industrial waste is polluting the water withtoxic chemicals and microorganisms that can cause various diseases. These pollutantsmust be removed by appropriate treatment before the water is supplied to the public. Thepollution of water-resources has become a serious problem and requires serious attention.
Table-3: Water And Sewage Quantities In Major Urban CentresNo Cities Population 1998
(Million) Water Supply
(mgd) Sewage (mgd)
1 Islamabad 0.525 42 33 2 Karachi 9.27 556 445 3 Lahore 5.064 405 324 4 Faisalabad 1.978 99 80 5 Multan 1.183 60 48 6 Hyderabad 1.152 58 47 7 Gujranwala 1.125 57 46 8 Peshawar 0.988 60 48 9 Quetta 0.561 23 18 10 Sargodha 0.456 19 15
Assessment of Water-Quality
Parameters Measured at site
Flow rate, Temperature, Conductivity, pH , Dissolved Oxygen , Odour , Colour and Turbidity
Parameters Measured in Lab
BOD , COD , TSS , T-N , O & G , E – Coli As , Cu , Cr , Cd , Pb and Zn

115
It is necessary to properly regulate the discharge of municipal and industrial wastewaterinto rivers and canals. In order to reduce the contamination of surface and ground-waterresources, many countries have established National Environmental Quality Standards(NEQS) for the discharge of municipal and industrial waste into water-resources. TheGovernment of Pakistan in 1993 has also established NEQS for the release of municipaland liquid industrial effluents, which are not properly enforced7.
POTABLE WATER
We use water for drinking and food preparation and for domestic, industrial, commercialand agricultural purposes. For each purpose, we require water of appropriate quality,which is suitable for that particular use. The desirable characteristics of water vary with itsintended use. Thus, the quality of water that is good for one purpose may not be good foranother. From the user’s point of view, the term “water-quality” is used to define thosebiological, chemical, physical, and radiological characteristics by which he evaluates theacceptability of the water. In may parts of the world, the people first look at the water in aglass to see if it is crystal clear, then taste it to check if it is palatable. If the water isagreeable in these qualities they assume that it is good-quality water. Water for drinkingand food-preparation must be aesthetically acceptable, that is, it should be free fromapparent turbidity, colour and odor and from any objectionable taste. Further, it must notcontain organisms capable of causing disease, nor should it contain minerals and organicsubstances which may produce adverse physiological effects8. Such water is termed as“potable water”.
Table-4: Pollution Levels (Mg/L) of Effluents From Various Industriesin Korangi Site Area Karachi
Industries4
Parameters6
Pharmace-utical
Tannery Silk Mill Paper Mill Beverages NEQS
pH 5.2 9.0 11.8 3.9 13.0 37,417.0 TSS 848.0 450.0 466.0 2,648.0 68.0 150.0 TDS 530.0 6,818.0 5,280.0 12,146.0 18,244.0 3,500.0 BOD 1,364.0 7,620.0 6,010.0 54,696.0 18,724.0 80.0 COD 3,000.0 12,000.0 4,000.0 34,000.0 2,000.0 150.0
Grease & Oil 158.0 909.0 618.0 10,644.0 163.0 10.0 Cd 6.0 889.0 14.0 917.0 20.0 0.1 Cr 1,052.0 1,600.0 100.0 400.0 400.0 1.0 Cu 129.0 240.0 200.0 3,942.0 107.0 1.0 Pb 75.0 1,000.0 117.0 1,083.0 780.0 0.5 Ni 100.0 800.0 300.0 2,000.0 364.0 1.0 Zn 812.0 1,333.0 724.0 1,217.0 4,386.0 5.0
Iqbal H. Qureshi

116
TREATMENT OF WATER
Potable water is produced by treatment of raw water, involving various operations in water-treatment plants. In many part of the world the availability of potable water is limited, dueto lack of appropriate treatment plants and financial constrains. The unit operations involvedin the production of potable water include Aeration, Coagulation and Flocculation,Sedimentation, Chlorination and other Disinfections Process, and Filtration9.
Aeration
Aeration is a process, in which air is thoroughly mixed with water to remove or decreasethe concentration of substances, which produce unpleasant taste and odor, such ashydrogen sulphide and some organic compounds. It also helps in reducing theconcentration of carbon dioxide and oxidation of iron and manganese. However, many ofthe taste and odour-producing compounds from industrial wastes and those released bydisintegration of organisms are not highly volatile and can not be removed by aerationalone.
Coagulation and Flocculation
Surface waters contain dissolved inorganic and organic materials, suspended inorganicmatter and biological substances, such as bacteria and plankton. Inorganic matter presentin the form of finely divided particles, or as colloidal particles, is the main cause of turbidity,whereas organic compounds are generally the cause of unpleasant taste, odor and colour.Some colloidal metallic hydroxides may also produce colour. The size of the fine particlesproducing turbidity may range from molecular dimension to 50µm or larger. Particles greaterthan 1µm in diameter are generally referred as silt and settle down on standing undergravity. However particles smaller than 1µm, classified as colloid, remain suspended fora very long time, as their surface area to mass ratio is very large. The removal of colloidalmaterial requires the use of procedures, which agglomerate the small particles into largeraggregates. Certain chemical agents called coagulants, such as salts of aluminium andiron, are used for this purpose. The addition of a chemical to a colloidal dispersion causesthe destabilization of particles by reduction of forces that tend to keep the particles apart.The chemical should be rapidly mixed and uniformly dispersed in water to increase theparticle-to-particle interaction. The entire process occurs in a very short time and initiallyresults in particles of submicroscopic in size. This process is called Coagulation. Theseparticles then gradually agglomerate to form larger aggregates by chemical bridging orphysical enmeshment mechanism. This process is termed as Flocculation.
The coagulation and flocculation processes are sensitive to many variables such as pH,coagulant concentration, presence of anions, etc. The mechanism for the removal ofparticles by metal coagulants and polymers involves neutralization of electrical charges,
Assessment of Water-Quality

117
Table - 5: Quality-Criteria for Domestic Water-Supplies
Iqbal H. Qureshi
Level Parameter
Permissible Desirable
Color (Cobalt-Platinum scale) 75 units < 10 Units Odor Virtually absent Virtually absent Taste Virtually absent Virtually absent Turbidity Virtually absent Virtually absent Inorganic Chemicals pH 6.0-8.5 6.0-8.5 Alkalinity (CaCO3) 30-500 mg/liter 30-500 mg/liter Ammonia 0.5 mg/liter <0.01 mg/liter Arsenic 0.05 mg/liter Absent Barium 1.0 mg/liter Absent Boron 1.0 mg/liter Absent Cadmium 0.01 mg/liter Absent Chlorides 250 mg/liter < 25 mg/liter Hexavalent Chromium 0.05 mg/liter Absent Copper 1.0 mg/liter Virtually absent Cyanide 0.01 mg/liter Absent Dissolved Oxygen >4.0 mg/liter Air Saturated Fluorides 0.8-1.7 mg/liter 1.0 mg/liter Iron(filterable) < 0.3 mg/liter Virtually absent Lead < 0.05 mg/liter Absent Manganese < 0.05 mg/liter Absent Nitrates + Nitrites < 10 mg/liter Virtually absent Phosphorus 10-50µg/liter 10µg/liter Selenium 0.01 mg/liter Absent Silver 0.05 mg/liter Absent Sulfate 250 mg/liter < 50 mg/liter Sulfides 0.01 mg/liter Absent Total Dissolved Solids(TDS) 500 mg/liter < 200 mg/liter Zinc 1.5 mg/liter Virtually absent Organic Chemicals Carbon - Chloroform extract < 0.04 mg/liter Methylene blue active substances 0.017 mg/liter Virtually absent Chlordane 0.003 mg/liter Virtually absent DDT 0.042 mg/liter Virtually absent
Dieldrin 0.017 mg/liter Virtually absent Endrin 0.001 mg/liter Virtually absent Heptachlor 0.018 mg/liter Virtually absent Heptachlor epoxide 0.018 mg/liter Virtually absent Lindane 0.056 mg/liter Virtually absent Methoxychlor 0.035 mg/liter Virtually absent Organic phosphate 0.1 mg/liter Virtually absent Taxophane 0.005 mg/liter Virtually absent
118
compaction of electrical double-layer, adsorption and bridging and mechanicalenmeshment. These processes are involved in varying degrees in coagulation flocculationsystem.
Sedimentation
The solids in their natural form, such as silt or modified form by coagulation and chemicalprecipitation, settle down under the effect of gravity. Initially the particles with densitygreater than that of water begin to settle with accelerated velocity, until the resistance ofthe liquid equals the effective weight of the particle. Thereafter, settling-velocity remainsconstant and depends upon the size, shape and density of the particles as well as thedensity and viscosity of the water. The separation of coagulated or suspended matterfrom water under the influence of gravity is known as sedimentation.
Disinfection
Surface and ground-waters generally contain microorganisms, which cause diseases suchas typhoid, cholera, dysentery, etc. Many epidemics have been attributed to waterbornediseases, especially in developing countries. In Pakistan, about 25% of all the reporteddiseases and 30% of all the deaths are attributed to the use of contaminated water.Therefore potable water should be free from disease- producing organisms, in addition toits physical and chemical qualities. The destruction of harmful and other objectionableorganisms can be achieved by disinfection of water, which kills the disease-producingorganisms. Disinfection-processes may include one or a combination of both physicaland chemical treatment, such as filtration, reverse osmosis, boiling, irradiation withultraviolet light, metal ion treatment, chlorination and treatment with surface- activechemicals. Except for chlorine and some of its compounds, most of these disinfectantshave one or more serious limitations. Therefore chlorine and its compounds are used formunicipal potable water treatment. The quality of disinfected water is checked by countingthe number of coliform bacteria E.Coli employing multiple tube fermentation or membranefilter technique. According to WHO and EPA good quality water should not have morethan one bacterium per 100 ml. Water containing more than 10 bacteria considered ascontaminated.
Taste and Odour
Many organic and inorganic substances, though present in small quantities impartobjectionable taste and odour to water. Generally inorganic compounds such as metalions in concentration of few ppm impart taste to water whereas organic materials andhydrogen sulphide are mainly responsible for imparting odour to water. Most of the odoroussubstances present in water are removed by aeration, coagulation and flocculation,sedimentation, filtration and chlorination. The remaining substances are removed by
Assessment of Water-Quality
119
treatment with activated carbon, which is considered to be the best treatment procedurefor odour and taste control.
Filtration
Water purification involves the removal of suspended silt, clay, colloids and microorganismsincluding algae, bacteria, and viruses. Most of the suspended particles and other impuritiesare removed by coagulation, flocculation, and sedimentation processes. The remainingparticles are removed by passing the water through a filtering unit. The filtering unit mayconsist of a thin porous layer of filter aid deposited by flow on a support or a bed ofgranular non-porous material held in place by the force of gravity. The filters are generallyclassified into four categories, depending upon the type of filter media used and quantitativerate of filtration. These include slow-sand filter, rapid sand filter, high-rate rapid-sand filterand diatomite filter. Rapid sand filters, consisting of a bed of sand about 30 inches thickon top of a bed of gravel, are commonly used for filtration of water.
QUALITY ASSURANCE
The production of potable water involves a number of processes to remove physical,chemical and biological impurities. The effectiveness of these treatment- processes ischecked by analyzing the final product to assess the various parameters of water-quality.The treated water should conform to the National Quality Standards (NQS) establishedby The Government for water-quality. In countries where NQS are not established, WHOwater-quality Standards10 may be used, which are given in Table - 5. Periodic assessmentof water is necessary to ensure the quality of water supplied to the public. This requirescollection of representative samples from selected locations and measurement of variousphysical, chemical and biological parameters. The sampling should be done carefully, toavoid contamination and the concentrations of the substances should not change duringstorage as a result of chemical, physical and biological processes in the samples. Variousparameters of these samples can be measured, employing suitable analytical techniquesavailable in Handbooks11,12. In order to get reliable data, it is necessary to determine theaccuracy and precision of each technique by analyzing a Standard Reference Material.Water, which conforms to the National Quality Standards, is considered safe and palatablefor human consumption and can be used in any desired amount without any adverseeffects on health.
CONCLUSIONS
• The requirement of water is increasing, with ever-increasing population; as such per-capita availability is decreasing.
• Underground water-resources are depleting, due to drought-conditions and heavymunicipal pumping and private abstraction of water.
Iqbal H. Qureshi
120
• Proper attention is not being given to water-quality and the data regarding water-quality is not readily available.
• Microbial contamination in water is common in many areas, due to cross-contaminationbetween water and sewerage lines, poor maintenance, unreliable and irregularchlorination, which result in frequent outbreak of waterborne diseases.
• The release of untreated municipal and industrial effluents into water-bodies isadversely affecting the quality of water.
RECOMMENDATIONS
• To meet our future water-requirements, it is necessary to formulate and implement aNational Policy for water-resources management.
• NEQS for the release of municipal and industrial effluents should be enforced, toprevent the pollution of water-bodies.
• Sewage-treatment plants should be installed in all major cities.• National guidelines or standards for drinking-water quality be formulated.• A program of regular monitoring of water-quality be formulated and implemented.• Environmental Data-bank be established in EPA. Data regarding water-quality from
various sources may be collected, evaluated and stored for future reference.• A program for training of personnel in analytical methodologies be prepared by EPA.
It should include sampling procedures, measurement techniques, quality control andquality assurance of data, data analysis and its co-relation.
REFERENCES
1. S.I. Ahmed. “Recent Trends in Oceanographic Research”, Proc.” The Arabian Sea, Living MarineResources and the Environment”, Eds: M.F. Thompson and N.M. Tirmizi. American Institute ofBiological Science, Vangaurd Books (Pvt) Ltd. Pakistan (1995)
2. Area and population of the World, World Almanac and Book of Facts, Ed.Robert Formighlti,Richard W. Eiger, New Jersey (1999)
3. Pakistan Council for Research on Water Resources, PCRWR, Bi-annual Report (1996)4. M.P. Aftab, Environment and Public Health Engineering Division, NESPAK, Lahore (1999)5. “3 cities investigation of air and water quality”, JICA - Pak - EPA Report (June 2001)6. I.Ali and S.Jilani, “Study of contamination in the coastal waters of Karachi , Proc: “The Arabian
Sea, Living Marine Resources and the Environment”, Ed. M. F. Thompson and N.M. Tirmizi.Vanguard Books (Pvt) Ltd. Pakistan (1995)
7. “National Environmental Quality Standards for the release of municipal and liquid industrialeffluents”. Pak EPA, Government of Pakistan, SRO 742(1)/93.(1993)
8. D.Chapman, “Water Quality Assessment” Chapman and Hall, London (1992)9. Water Treatment Handbook, Ed. A.Degrement, . Halsted Press Book, Johan Wiley & Sons,
New York (1979)10. WHO, Guidelines for Drinking Water Quality, Vol. I & II. World Health Organization, Geneva
(1994).
Assessment of Water-Quality

121
11. “Water Quality Measurement” Ed.H.B. Mark, Jr. and J.S.Mattson, Pollution Engineering andTechnology, Marcel Dekker Inc. New York and Basel (1981)
12. APHA Standard Methods of the Examination of Water and Waste water, 16th Edition, AmericanPublic Health Association Inc., Washington DC (1995)
Iqbal H. Qureshi

A
Evaluation of Water-Quality byChlorophyll and Dissolved
OxygenZahid Latif, M. Azam Tasneem, Tariq Javed, Saira Butt,
Muhammad Fazil, Mubarik Ali and M. Ishaq Sajjad
123
EVALUATION OF WATER-QUALITY BY CHLOROPHYLL AND DISSOLVED OXYGEN ABSTRACT This article focuses on the impact of Chlorophyll and dissolved Oxygen on water-quality. Kalar Kahar and Rawal lakes were selected for this research. A Spectrophotometer was used for determination of Chlorophyll a, Chlorophyll b, Chlorophyll c and Pheophytin pigment. Dissolved Oxygen was measured in situ, using dissolved-oxygen meter. The δ18O of dissolved Oxygen, like concentration, is affected primarily by three processes: air-water gas exchange, respiration and photosynthesis; δ18O is analysed on isotopic ratio mass-spectrometer, after extraction of dissolved Oxygen from water-samples, followed by purification and conversion into CO2. Rawal lake receives most of the water from precipitation during monsoon-period and supplemented by light rains in December and January. This water is used throughout the year for drinking purposes in Rawalpindi city. The water-samples were collected from 5, 7.5, and 10 meters depth for seasonal studies of physiochemical and isotopic parameters of water and dissolved Oxygen. Optimum experimental conditions for δ18O analysis of dissolved Oxygen from aqueous samples were determined. Stratification of dissolved Oxygen was observed in Rawal Lake before rainy season in summer. The water-quality deteriorates with depth, because the respiration exceeds the photosynthesis and gas exchange. The concentration and δ18O of dissolved Oxygen show no variation with depth in 1998 winter sampling. Kalar Kahar lake gets water from springs, which are recharged by local rains on the nearby mountains. It is a big lake, with shallow and uniform depth of nearly 1.5 meters. A lot of vegetation can be seen on the periphery of the lake. Algae have grown on the floor of the lake. Water-samples were collected from the corner with large amount of vegetation and from the center of the lake for dissolved Oxygen and Chlorophyll measurements. Chlorophyll result shows that Kalar Kahar Lake falls in Eutrophic category of Chlorophyll concentrations. Dissolved Oxygen ranges from 0.3 to 9.1 mg/l with minimum at the morning and maximum at 16.00 hours of the day. These alarming dissolved Oxygen results show that fish can not survive in these conditions. INTRODUCTION Chlorophyll ‘a’ is a blue-green microcrystalline solid, while Chlorophyll ‘b’ is a green black microcrystalline solid. Chlorophyll ‘a’ is of universal occurrence in the green plants; Chlorophyll ‘b’ occurs in higher plants and green algae. All plant-life contains the primary photosynthetic pigment Chlorophyll ‘a’. Chlorophyll concentration is an indirect estimation of the biomass and the photosynthesis-rate of the primary producers. According to Sakamoto and Vollenweider, lakes
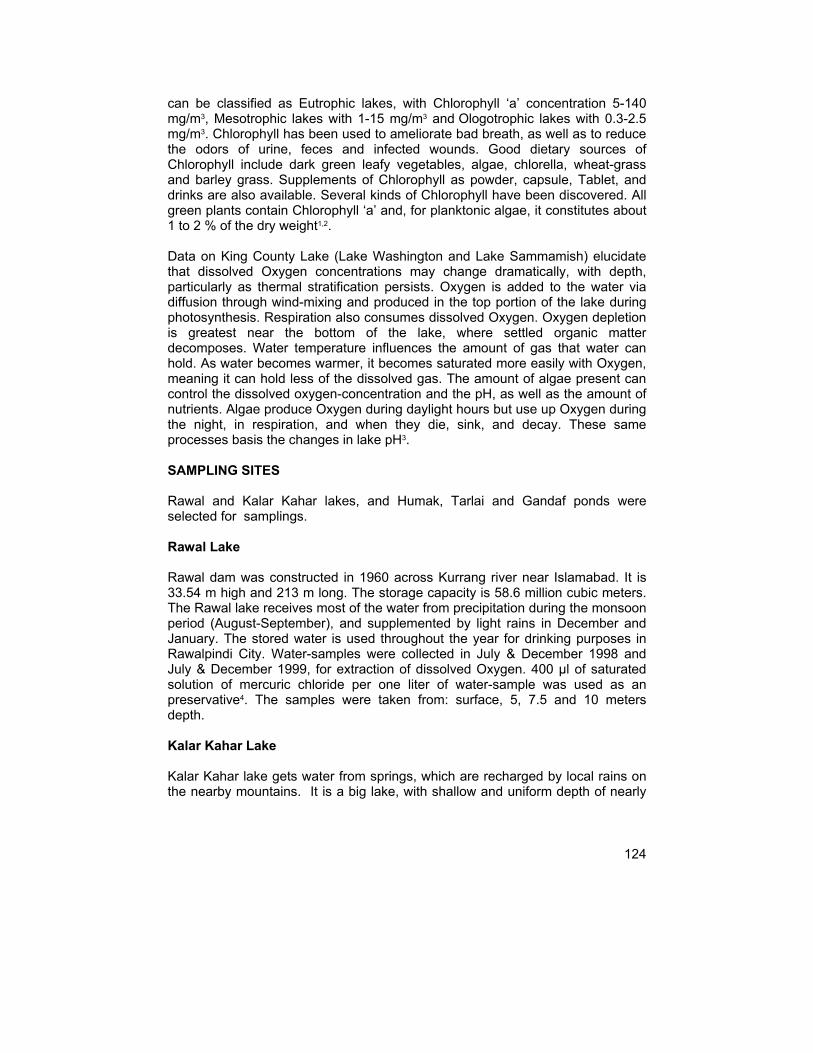
124
can be classified as Eutrophic lakes, with Chlorophyll ‘a’ concentration 5-140 mg/m3, Mesotrophic lakes with 1-15 mg/m3 and Ologotrophic lakes with 0.3-2.5 mg/m3. Chlorophyll has been used to ameliorate bad breath, as well as to reduce the odors of urine, feces and infected wounds. Good dietary sources of Chlorophyll include dark green leafy vegetables, algae, chlorella, wheat-grass and barley grass. Supplements of Chlorophyll as powder, capsule, Tablet, and drinks are also available. Several kinds of Chlorophyll have been discovered. All green plants contain Chlorophyll ‘a’ and, for planktonic algae, it constitutes about 1 to 2 % of the dry weight1,2. Data on King County Lake (Lake Washington and Lake Sammamish) elucidate that dissolved Oxygen concentrations may change dramatically, with depth, particularly as thermal stratification persists. Oxygen is added to the water via diffusion through wind-mixing and produced in the top portion of the lake during photosynthesis. Respiration also consumes dissolved Oxygen. Oxygen depletion is greatest near the bottom of the lake, where settled organic matter decomposes. Water temperature influences the amount of gas that water can hold. As water becomes warmer, it becomes saturated more easily with Oxygen, meaning it can hold less of the dissolved gas. The amount of algae present can control the dissolved oxygen-concentration and the pH, as well as the amount of nutrients. Algae produce Oxygen during daylight hours but use up Oxygen during the night, in respiration, and when they die, sink, and decay. These same processes basis the changes in lake pH3. SAMPLING SITES
Rawal and Kalar Kahar lakes, and Humak, Tarlai and Gandaf ponds were selected for samplings. Rawal Lake Rawal dam was constructed in 1960 across Kurrang river near Islamabad. It is 33.54 m high and 213 m long. The storage capacity is 58.6 million cubic meters. The Rawal lake receives most of the water from precipitation during the monsoon period (August-September), and supplemented by light rains in December and January. The stored water is used throughout the year for drinking purposes in Rawalpindi City. Water-samples were collected in July & December 1998 and July & December 1999, for extraction of dissolved Oxygen. 400 µl of saturated solution of mercuric chloride per one liter of water-sample was used as an preservative4. The samples were taken from: surface, 5, 7.5 and 10 meters depth. Kalar Kahar Lake Kalar Kahar lake gets water from springs, which are recharged by local rains on the nearby mountains. It is a big lake, with shallow and uniform depth of nearly
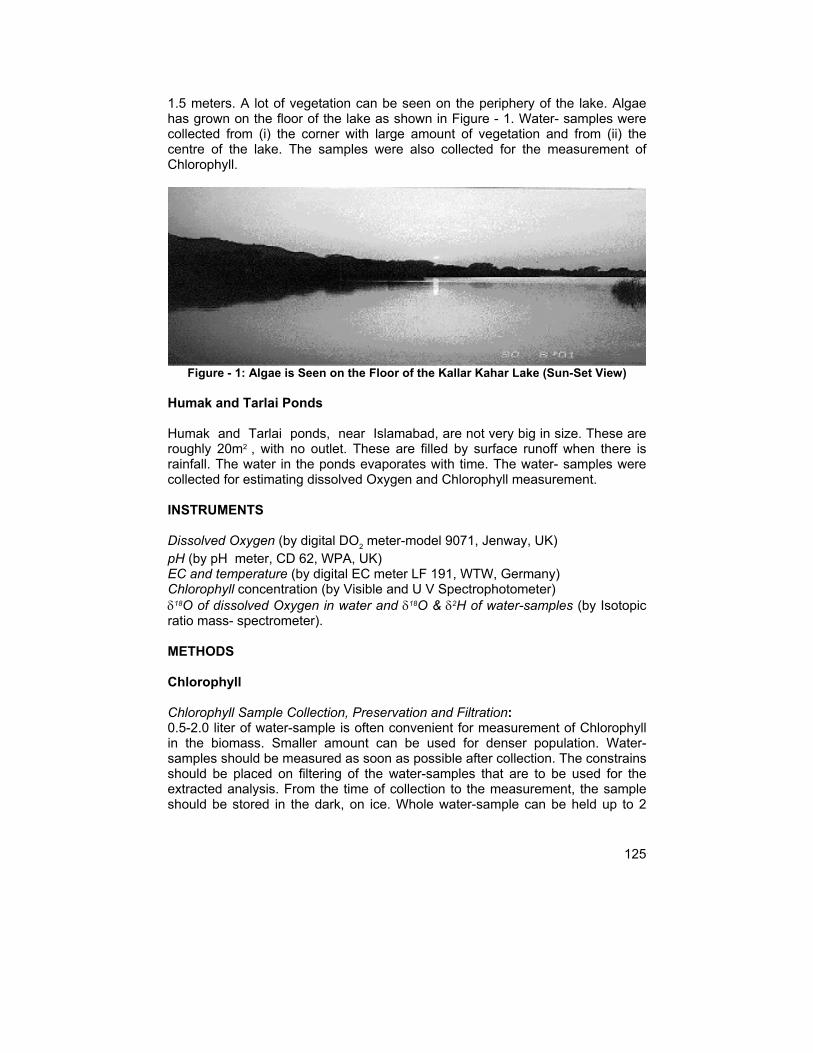
125
1.5 meters. A lot of vegetation can be seen on the periphery of the lake. Algae has grown on the floor of the lake as shown in Figure - 1. Water- samples were collected from (i) the corner with large amount of vegetation and from (ii) the centre of the lake. The samples were also collected for the measurement of Chlorophyll.
Figure - 1: Algae is Seen on the Floor of the Kallar Kahar Lake (Sun-Set View)
Humak and Tarlai Ponds Humak and Tarlai ponds, near Islamabad, are not very big in size. These are roughly 20m2 , with no outlet. These are filled by surface runoff when there is rainfall. The water in the ponds evaporates with time. The water- samples were collected for estimating dissolved Oxygen and Chlorophyll measurement. INSTRUMENTS Dissolved Oxygen (by digital DO2 meter-model 9071, Jenway, UK) pH (by pH meter, CD 62, WPA, UK) EC and temperature (by digital EC meter LF 191, WTW, Germany) Chlorophyll concentration (by Visible and U V Spectrophotometer) δ18O of dissolved Oxygen in water and δ18O & δ2H of water-samples (by Isotopic ratio mass- spectrometer). METHODS Chlorophyll Chlorophyll Sample Collection, Preservation and Filtration: 0.5-2.0 liter of water-sample is often convenient for measurement of Chlorophyll in the biomass. Smaller amount can be used for denser population. Water-samples should be measured as soon as possible after collection. The constrains should be placed on filtering of the water-samples that are to be used for the extracted analysis. From the time of collection to the measurement, the sample should be stored in the dark, on ice. Whole water-sample can be held up to 2

126
weeks in the dark at 4 oC. Used opaque bottle, because even exposure to light during storage will alter the Chlorophyll values. Samples on the filters taken from water having pH 7 or higher may be placed in airtight plastic bags and stored frozen for 3 weeks. Samples from acidic water must be processed promptly, to prevent Chlorophyll degradation. Water-sample was filtered through glass-fiber filters (Whatman GF/A). Filtration assembly was attached with suitable source of reduced pressure. Glass-fiber filter containing green pigment should be immediately analysed for Chlorophyll. Placed the glass-fiber filter in beaker and added pure acetone for Chlorophyll extraction. The sample was then crushed by glass rod. Filtered this extract through cellulose nitrate filter paper. Same procedure was repeated until the glass-fiber filter was absolutely clear from Chlorophyll. The extract was diluted to the desired volume. Sample was then transferred to the amber glass bottles and wrapped with black paper, to avoid exposure to light and stored at 4oC5, 6, 7. Spectrophotometric determination of Chlorophyll: Spectrophometer was used for determination of Chlorophyll a, Chlorophyll b, Chlorophyll c and Pheophytin pigment. Checked the optical density of the two cells (1 cm path length each) using acetone. Transferred approximately 3 ml acetone to the one cuvette and measured the optical density at 750 nm and adjusted the zero. Similarly, clarified extract was added to the second cuvette and the absorbance measured at same wavelength. Same measurements were then repeated at 664 nm. Extract was then acidified with 0.1ml 0.1M HCl. Gently agitated the acidified extract and measured the optical density at 750 and 665 nm within 90s. Subtracted the 750 nm value from the reading before (OD 664 nm) and after acidification (OD 665 nm). Following formulas was used for the calculation of Chlorophyll a and Pheophytin a.
26.7 (664b-665a) x V1 Chlorophyll a, mg/m3 = -------------------------- V2 x L 26.7 [1.7 (665a-664b) x V1 Pheophytin a, mg/m3 = --------------------------------- V2 x L where: V1 = Volume of extract, L V2 = Volume of sample, m3 L = Width of cuvitte (cm) and
664b, 665a= Optical densities of extract before, and after acidification respectively
The value 26.6 is the absorbance correction and equals A x K where
A = Absorbance coefficent for Chlorophyll a at 664 nm = 11.0, and K = Ratio expressing correction for acidification
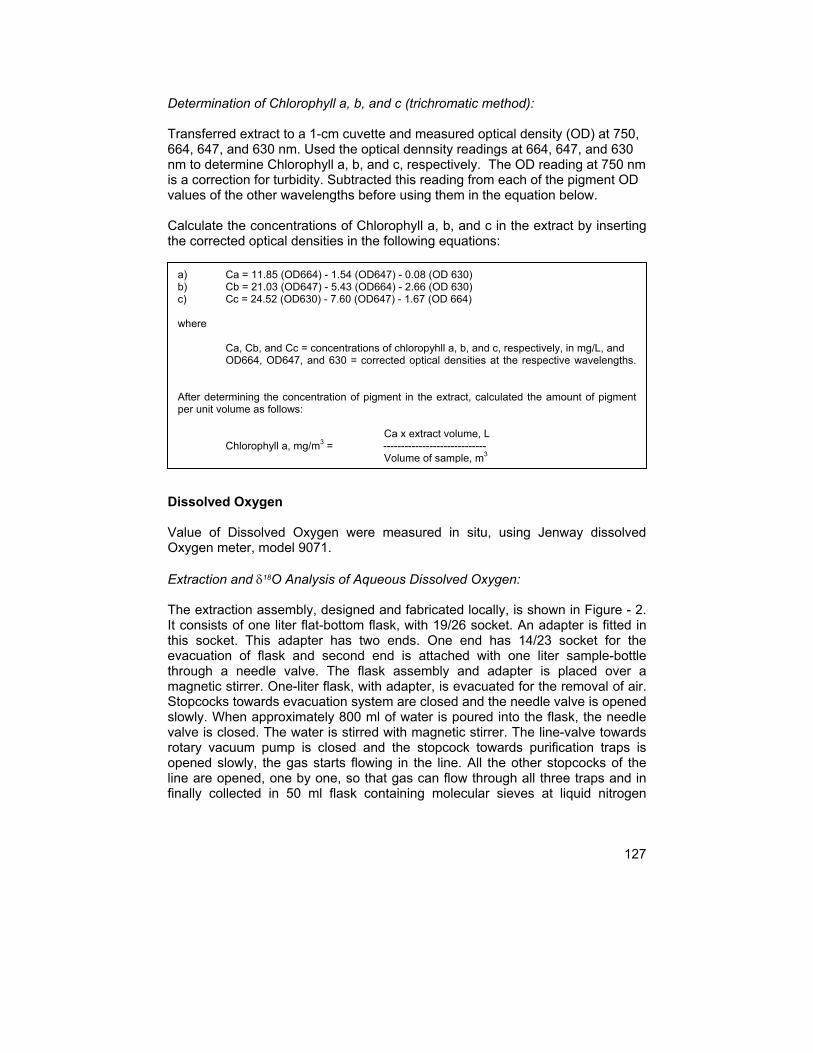
127
Determination of Chlorophyll a, b, and c (trichromatic method): Transferred extract to a 1-cm cuvette and measured optical density (OD) at 750, 664, 647, and 630 nm. Used the optical dennsity readings at 664, 647, and 630 nm to determine Chlorophyll a, b, and c, respectively. The OD reading at 750 nm is a correction for turbidity. Subtracted this reading from each of the pigment OD values of the other wavelengths before using them in the equation below. Calculate the concentrations of Chlorophyll a, b, and c in the extract by inserting the corrected optical densities in the following equations:
Dissolved Oxygen Value of Dissolved Oxygen were measured in situ, using Jenway dissolved Oxygen meter, model 9071. Extraction and δ18O Analysis of Aqueous Dissolved Oxygen: The extraction assembly, designed and fabricated locally, is shown in Figure - 2. It consists of one liter flat-bottom flask, with 19/26 socket. An adapter is fitted in this socket. This adapter has two ends. One end has 14/23 socket for the evacuation of flask and second end is attached with one liter sample-bottle through a needle valve. The flask assembly and adapter is placed over a magnetic stirrer. One-liter flask, with adapter, is evacuated for the removal of air. Stopcocks towards evacuation system are closed and the needle valve is opened slowly. When approximately 800 ml of water is poured into the flask, the needle valve is closed. The water is stirred with magnetic stirrer. The line-valve towards rotary vacuum pump is closed and the stopcock towards purification traps is opened slowly, the gas starts flowing in the line. All the other stopcocks of the line are opened, one by one, so that gas can flow through all three traps and in finally collected in 50 ml flask containing molecular sieves at liquid nitrogen
a) Ca = 11.85 (OD664) - 1.54 (OD647) - 0.08 (OD 630) b) Cb = 21.03 (OD647) - 5.43 (OD664) - 2.66 (OD 630) c) Cc = 24.52 (OD630) - 7.60 (OD647) - 1.67 (OD 664) where
Ca, Cb, and Cc = concentrations of chloropyhll a, b, and c, respectively, in mg/L, and OD664, OD647, and 630 = corrected optical densities at the respective wavelengths.
After determining the concentration of pigment in the extract, calculated the amount of pigment per unit volume as follows: Ca x extract volume, L
Chlorophyll a, mg/m3 = ----------------------------- Volume of sample, m3

128
temperature. At the end, the magnetic stirrer is switched off, the ampoule is closed and detached from the line.
Figure - 2: Dissolved Oxygen Extraction Assembly from Water Samples
Figure - 3: Precision of d18O of Dissolved Oxygen Extracted from Distilled Water,
Tap Water and Rawal lake Water (RLW) (1st Sampling, July-1998)
Figure - 4: Concentration and Isotopic Composition of Dissolved Oxygen at the
Rawal Lake Site (1st Sampling, July-1998)

129
Table-1. Experimental conditions for δ18O analysis of dissolved oxygen
A. For extraction of dissolved O2 1. Water sample taken in plastic bottles at the site 1 liter 2. Preservative Mercuric chloride 3. Evacuation time of one liter pyrex glass flask 1 minute 4. Water sample filled in the pyrex flask 800 ml 5. 5 gm molecular sieve (5oA) heating (200oC) time 1 minute 6. Moisture removal temperature for two traps -80oC 7. CO2 removal temperature for one trap Liquid air 8. Dissolved Oxygen adsorption time on molecular sieve
30 minutes
9. Dissolved Oxygen desorption time from molecular sieve
6 minutes
B. For conversion of aqueous dissolved O2 into CO2 for δ18O analysis 1. Reduction furnace, cylinder type within the silica furnace was made by
Graphite furnace with spiral platinum wire, inside and around
2. Reaction temperature provided by external heated furnace
700oC
3. Reaction time 10 minutes 4. Gas circulatory pump speed 1.3 liters per minute 5. Non-condensed gases removal time 2 minutes 6. CO2 sublimation time 3 minutes 7. CO2 is purified by using -60oC slush
Table - 2: Chlorophyll Concentrations in Kalar Kahar Lake Water Samples
Sampling Point Sampling
Date Chlorophyll a in the
presence of Pheophytin a (mg/m3)
Chlorophyll a, b, c, trichromatic method (mg/m3)
a b c KK-1 (Surface) 29-12-1999 27.39 27.89 6.57 0.59KK-1 (3 feet deep) 29-12-1999 33.33 34.33 2.77 2.13KK-2 (Surface) 29-12-1999 23.43 24.2 1.36 0.25KK-2 (3 feet deep) 29-12-1999 30.03 30.97 2.2 0.6
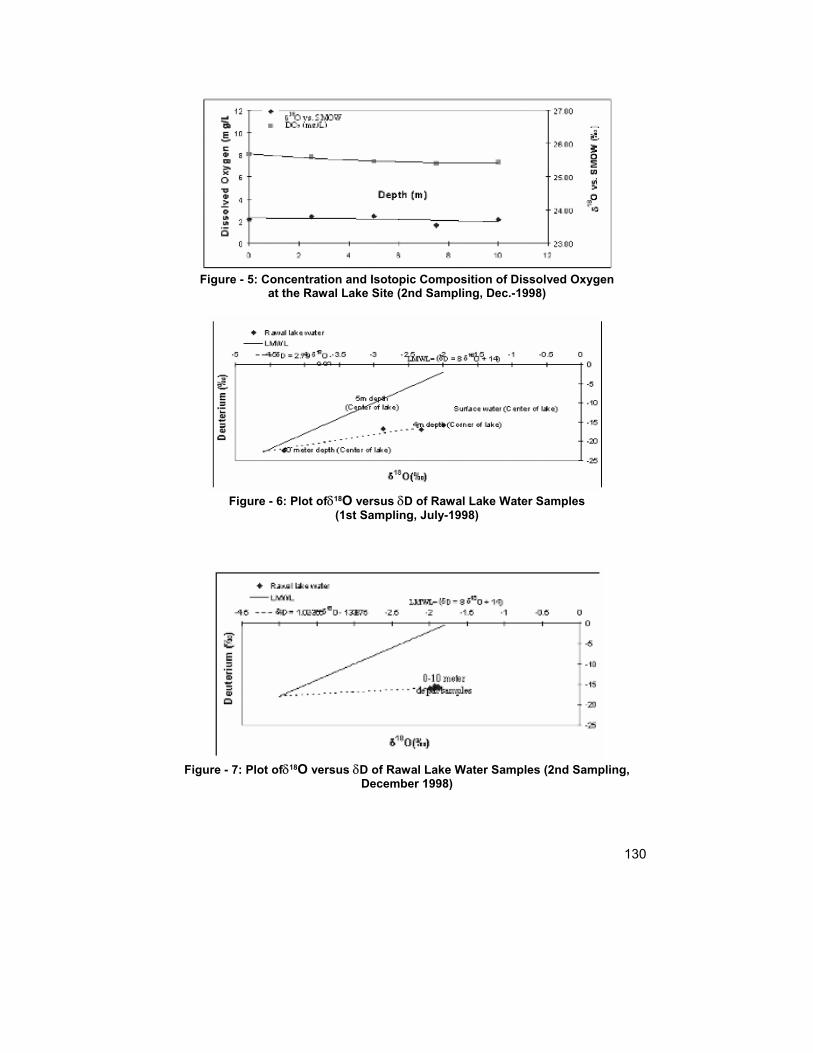
130
Figure - 5: Concentration and Isotopic Composition of Dissolved Oxygen
at the Rawal Lake Site (2nd Sampling, Dec.-1998)
Figure - 6: Plot ofδ18O versus δD of Rawal Lake Water Samples
(1st Sampling, July-1998)
Figure - 7: Plot ofδ18O versus δD of Rawal Lake Water Samples (2nd Sampling,
December 1998)
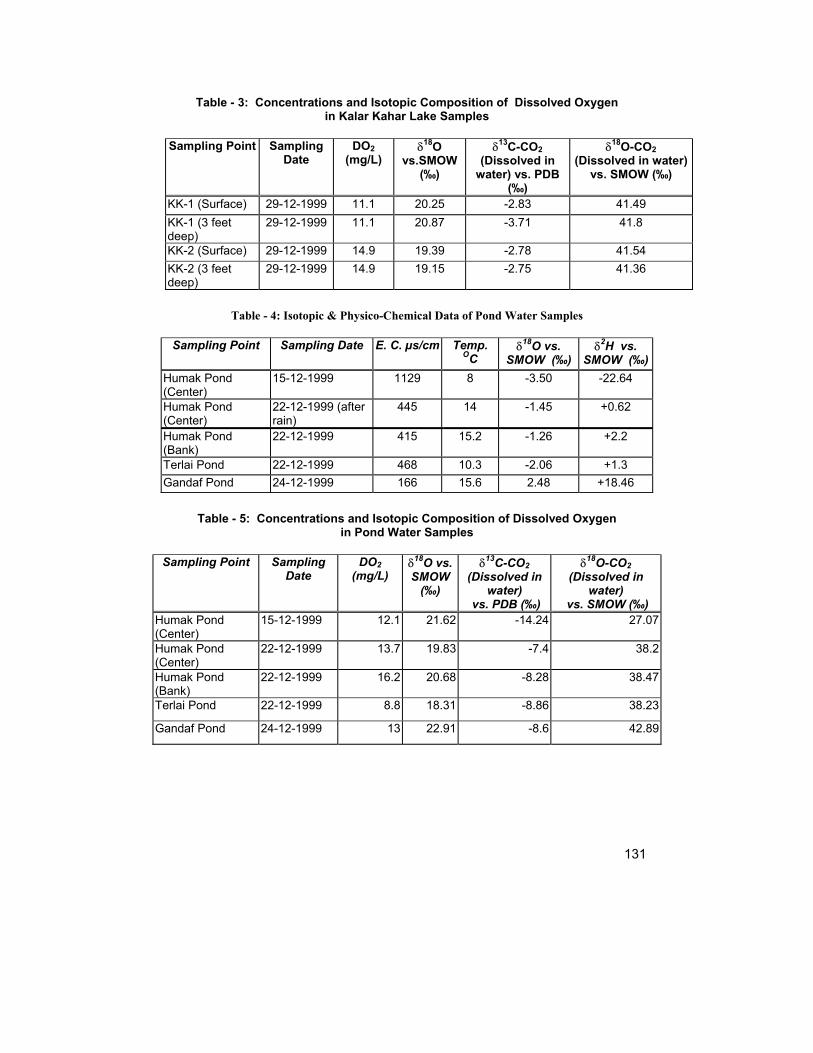
131
Table - 3: Concentrations and Isotopic Composition of Dissolved Oxygen in Kalar Kahar Lake Samples
Sampling Point Sampling
Date DO2
(mg/L) δ18O
vs.SMOW (‰)
δ13C-CO2 (Dissolved in
water) vs. PDB (‰)
δ18O-CO2 (Dissolved in water)
vs. SMOW (‰)
KK-1 (Surface) 29-12-1999 11.1 20.25 -2.83 41.49 KK-1 (3 feet deep)
29-12-1999 11.1 20.87 -3.71 41.8
KK-2 (Surface) 29-12-1999 14.9 19.39 -2.78 41.54 KK-2 (3 feet deep)
29-12-1999 14.9 19.15 -2.75 41.36
Table - 4: Isotopic & Physico-Chemical Data of Pond Water Samples
Sampling Point Sampling Date E. C. µs/cm Temp.
OC δ18O vs.
SMOW (‰) δ2H vs.
SMOW (‰) Humak Pond (Center)
15-12-1999 1129 8 -3.50 -22.64
Humak Pond (Center)
22-12-1999 (after rain)
445 14 -1.45 +0.62
Humak Pond (Bank)
22-12-1999 415 15.2 -1.26 +2.2
Terlai Pond 22-12-1999 468 10.3 -2.06 +1.3 Gandaf Pond 24-12-1999 166 15.6 2.48 +18.46
Table - 5: Concentrations and Isotopic Composition of Dissolved Oxygen
in Pond Water Samples
Sampling Point Sampling Date
DO2 (mg/L)
δ18O vs.SMOW
(‰)
δ13C-CO2 (Dissolved in
water) vs. PDB (‰)
δ18O-CO2 (Dissolved in
water) vs. SMOW (‰)
Humak Pond (Center)
15-12-1999 12.1 21.62 -14.24 27.07
Humak Pond (Center)
22-12-1999 13.7 19.83 -7.4 38.2
Humak Pond (Bank)
22-12-1999 16.2 20.68 -8.28 38.47
Terlai Pond 22-12-1999 8.8 18.31 -8.86 38.23
Gandaf Pond 24-12-1999 13 22.91 -8.6 42.89

132
The ampoule containing the purified dissolved aqueous Oxygen sample is attached at CO2 preparation system. Then the sample is introduced in the evacuated line. The valve towards rotary pump side is closed and the circulatory pump is switched on. The U-trap is immersed in a flask containing liquid nitrogen. Carbon dioxide prepared in the line is frozen in U-trap and non- condensed gases are removed by opening the valve. The liquid nitrogen flask was replaced with Freon slush at -65oC temperature. The carbon dioxide frozen in U-trap sublimes and is recollected in another evacuated ampoule at liquid nitrogen temperature. Non-condensed gases trapped in the frozen carbon dioxide are released on sublimation. The sample ampoule is detached from the line and 18O is analyzed on mass spectrometer8. Optimum experimental conditions for δ18O analysis of dissolved Oxygen of aqueous samples are described in Table-1 and the precision of δ18O of dissolved Oxygen extracted from distilled water, tap water and Rawal lake water (RLW) are depicted in Figure-3. RESULTS AND DISCUSSION Rawal Lake The EC values of Rawal lake vary from 306 µs/cm to 462 µs/cm. The pH varies from 6.65 to 7.84, temperature varies from 15.6oC 32.2oC. δ18O values of dissolved Oxygen from Rawal lake have variations from 24.15 ‰ to 29.5 ‰ and indicate that gas-exchange dominates photosynthesis and respiration9,10 at the surface of water, as the dissolved Oxygen has values close to 24.2‰, both in July and December (Figure - 4, 5). However in December, the EC, temperature, dissolved Oxygen concentration and δ18O of dissolved Oxygen have no variations with depth. In July, dissolved Oxygen concentration decreases and δ18O increases with depth. Respiration dominates over photosynthesis at 5 meters and 10 meters of depth, as dissolved Oxygen is undersaturated and δ18O is greater than 24.2‰. This lake receives most of the water from heavy precipitation in Monsoon period (August-September) and some contribution in December/January. The water remains standing throughout the year and is subjected to strong evaporation, as evident from isotopic data (Figure - 6, 7). In July, the water is at the lowest level and by that time microbiological activity becomes dominant at large depths.
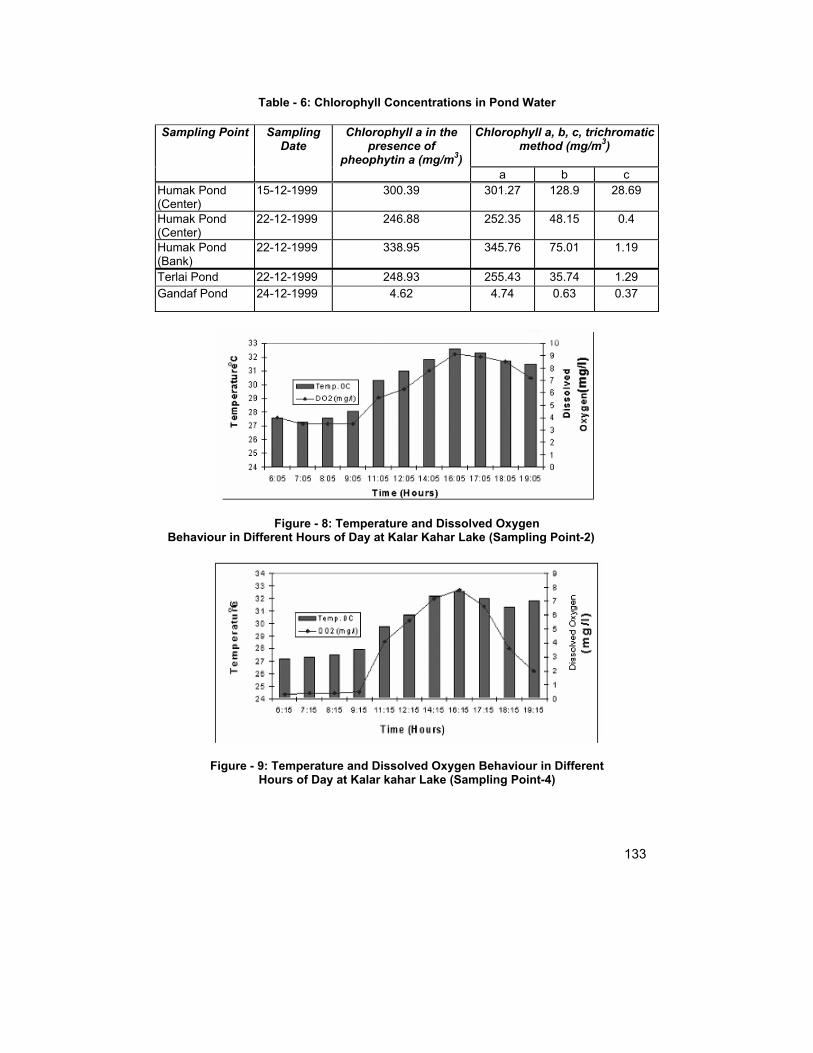
133
Table - 6: Chlorophyll Concentrations in Pond Water
Sampling Point Sampling Date
Chlorophyll a in the presence of
pheophytin a (mg/m3)
Chlorophyll a, b, c, trichromatic method (mg/m3)
a b c Humak Pond (Center)
15-12-1999 300.39 301.27 128.9 28.69
Humak Pond (Center)
22-12-1999 246.88 252.35 48.15 0.4
Humak Pond (Bank)
22-12-1999 338.95 345.76 75.01 1.19
Terlai Pond 22-12-1999 248.93 255.43 35.74 1.29 Gandaf Pond 24-12-1999 4.62 4.74 0.63 0.37
Figure - 8: Temperature and Dissolved Oxygen Behaviour in Different Hours of Day at Kalar Kahar Lake (Sampling Point-2)
Figure - 9: Temperature and Dissolved Oxygen Behaviour in Different Hours of Day at Kalar kahar Lake (Sampling Point-4)
134
Kalar Kahar Lake EC varies from 3,100 µs/cm to 3,410 µs/cm. Temperature range from 15.8 oC to 17.7 oC Dissolved Oxygen concentration varies from 11.1 mg/l to 14.9 mg/l. δ18O values of 19.15 ‰ to 20.87 ‰ indicate that photosynthesis dominates respiration and exchange-rate. The photosynthesis is evident from the presence of Chlorophyll in the ponds and Kalar kahar lake. The Chlorophyll concentration has a range of 23.43 mg/m3, to 33.33 mg/m3 as shown in Table-2. δ13C value shows that inorganic carbon source is from rock sediments (Table- 3). Temperature ranges from 27.30 oC to 32.60 oC at point-2 (east side), from 27.20 oC to 32.60 oC at point-4 (west, vegetation side) and is observed maximum at 16:10 hours of the whole day experiment (August 31, 2001). Dissolved Oxygen concentration varies from 3.50 mg/l to 9.10 mg/l at point-2 (east side), from 0.3 mg/l to 7.80 mg/l at point-4 (vegetation side) and is observed maximum at 16:10 hours of the whole day experiment (Figure - 8, 9)). Humak, Terlai and Gandaf Ponds: EC varies from 166 µs/cm to 1,129 µs/cm. Temperature range from 8.0oC to 15.6oC as shown in Table-4. Dissolved Oxygen concentration has values of 8.8 mg/l to 16.2 mg/l. δ18O of dissolved Oxygen range from 19.83 ‰ to 22.91‰ endorsing the dominance of photosynthesis over respiration and gas-exchange processes (Table-5). The Chlorophyll has highest value of 338.95 mg/m3 in Humak pond and lowest value of 4.62 mg/m3 in Gandaf pond (Table - 6).
REFERENCES 1. Rudolph C. The therapeutic value of Chlorophyll. Clin Med Surg 1930, 37, 119-21. 2. Chernomorsky SA, Segelman AB. Biological activities of Chlorophyll derivatives. N J
Med 1988, 85, 669-73. 3. Rob Blomquist (Water Quality Planner), Jeff Burkey (Hydrologist), “Interpreting King
County Lake Data, Lake Washington and Lake Sammamish,” Web site article, Department of Natural Resources, Water and Land Resources Division, July, 2001.
4. Quay. P. D., Wilbur D. O., Richey J. E., Devol A. H., Benner R. and Forsberg B. R. (1995). The 18O : 16O of dissolved Oxygen in rivers and lakes in the Amazon Basin: Determining the ratio of respiration to photosysnthesis rates in freshwaters. Limnol. Oceanogr. 1995, 40(4), 718-729.
5. Associations of Official Analytical Chemists, (Centennial Edition), Fourteen Edition, 1984, 621.
6. Water Pollution Control Federation U. S. A. Standard methods for the examination of water and wastewater, 16th edition, 1985, 507, 525-532,
7. W. A. Moore, E.J. Ludzack, and C.C. Ruchoft, Anal. Chem., 1951, 23, 1297 8. P. M. Kroopnick, H. Craig, Science, 1972, 175, 54,

135
9. Aggarwal. P. K., Fuller M., Gurgas M. M., Manning J. and Dillon M. A. (1997). Use of Stable Oxygen and Carbon Isotope Analysis for Monitoring the Pathways and Rates of Intrinsic and Enhanced in-Situ Biodegradation. Environ. Sci. Technol. 1997, 31, 590-596.
10. Jeng W. L., (1976), Studies of the Isotope Chemistry of molecular Oxygen in Biological Systems; dissertation presented to the Faculty of the Graduate School of the University of Texas at Austin, in Partial Fulfillment of the Requirement of the Degree of Doctor of Philosophy.

A
Salinity of Groundwater inCoastal Aquifer of Karachi,
Pakistan(A Preliminary Investigation)
A. Mashiatullah, R.M. Qureshi, N.A. Qureshi, E. Ahmad,M.A. Tasneem, M.I. Sajjad and H.A. Khan

137
ABSTRACT
Salinity of potable groundwater has become a problem of great concern in the KarachiMetropolis, which is not only the most populous and biggest industrial base but also thelargest coastal dwelling of Pakistan. Stable isotope techniques [18O content of oxygen inthe water molecule and 13C content of the Total Dissolved Inorganic Carbon (TDIC)] havebeen used, in conjunction with physiochemical tools (temperature, dissolved oxygen, pH,redox, electrical conductivity, salinity), to examine the quality of potable-water and thesource of salinity. Surface-water samples (12 No.) were collected from polluted streams,namely: Layari River, Malir River; Hab River/Hab Lake and the Indus River. Shallowgroundwater samples (7 No.) were collected from operating dug-wells. Relatively deepgroundwater samples (12 No.) were collected from pumping wells/tube-wells.
Physiochemical analysis of water samples was completed in the field. In the laboratory,water samples were analyzed for 18O content of oxygen in the water molecule and 13Ccontent of the TDIC, using specific gas-extraction systems and a modified GD-150 gas-source mass spectrometer. It is concluded from this preliminary investigation that thepotable aquifer system in coastal Karachi hosts a mixture of precipitation (rainwater only)from hinterlands, trapped seawater in relatively deep aquifer system, as well as intrudedseawater under natural infiltration conditions and/or induced recharge conditions (in shallowaquifers).
INTRODUCTION
Coastal Karachi is by far, the most populous (~10 million inhabitants, as per 1998 census)and the largest industrial (more than 1000 large industrial units) base of Pakistan, with acoast-line extending up to about 80 km. The major industries in Karachi include: Tanneries,Textile Industries, Chemical Industries, Detergent Industries, Iron and Steel industries,Paints and Dyes Industries, Pharmaceutical Industries, Plastic Industries, MetallurgicalIndustries, Vegetable Oil Industries, Food Industries, Oil and Lubricant Industries, CementIndustry, Auto Engineering Works, Machine-tool Factory, Power Plants, Oil Refineries, aswell as a large number of cottage industries. Discharge of raw sewage into the naturalwater resources is not only affecting the quality of surface-water resources, but is alsoexpectedly deteriorating the quality of shallow potable groundwater, through seepage ofpolluted stream-waters under natural conditions, as well as under artificially inducedrecharge conditions, caused by heavy pumping of the local aquifer.
SALINITY OF GROUNDWATER IN COASTAL AQUIFER OFKARACHI, PAKISTAN (A Preliminary Investigation)

138
In Karachi, freshwater resources are very few. The available shallow groundwater anddeep groundwater is exploited for certain domestic and industrial areas. Prolonged over-pumping of groundwater, or other alterations of the natural equilibrium between rechargeand discharge regimes of coastal aquifer system in Karachi, can lead to an encroachmentof the interface between seawater and freshwater, through intrusion and/or up-coning.Contamination by salty seawater can further increase the deterioration of groundwaterquality in the coastal aquifer. A two to three percent mixing of coastal aquifer water withseawater makes freshwater unsuitable for human consumption. A five per cent mixingmakes it unusable for irrigation1.
HYDROGEOLOGY OF THE STUDY- AREA
Hydrogeologically, the city of Karachi lies in the Hab River Basin and the Malir RiverBasin. The Malir River Basin is drained by the Malir River and the Layari River. Thecoastal aquifer of Karachi is, therefore, mainly recharged by seepage from Hab River,Hab Dam as well as the Malir and the Layari Rivers. The Hab River lies on the westernfrontier of Sindh and for some distance the boundary between Sindh and the Baluchistanprovinces. It flows about 30 kms to the west of Karachi, along the Karachi-Lasbelaboundary. It falls into the Arabian Sea near Cape Monze, with a total drainage courselength of 336 kms. Its principal tributaries are the Saruna, the Samotri and the Wira hab.Hab River gradually widens and, for some 80 kms from its mouth, is bordered by finepasture land. Water is always found in pools, but the river is being utilized for irrigationand drinking purposes after building of the Hab Dam in the north-west of Karachi in theyear 1980.
WATER-SUPPLY SCENARIO FOR COASTAL BELT OF KARACHI
Karachi has a complex water-supply system, which developed over a period of more than100 years. The shallow groundwater near the coastal belt is moderately saline. Today, thedrinking-water supply to most of the population in Karachi is managed through threeschemes: (i) reserves in the nearby Hab Dam; (ii) exploitation of relatively adequate-quality potable water in selective zones within the city, by pumping wells and dug wells;(iii) pumping of piped water from the Indus River near Thatta City, about 160 km awayfrom Karachi. The Hab Dam reservoir-capacity is insufficient to maintain long-term suppliesof drinking water to the enormous population of Karachi. During the past 15 years, anumber of pumping wells has been installed to meet requirements for the irrigation-water supply (to raise vegetables, fruits, dairy and poultry) and drinking-water supply forthe ~10 million inhabitants of Karachi. Excessive pumping of groundwater and continuouslowering of water-table is likely to result in intrusion of sea-water into the Malir Basinunder natural seepage conditions and under artificially induced conditions of recharge ofsaline seawater in the coastal aquifer(s) of Karachi. It is feared that any further lowering ofwater table in coastal aquifer of Karachi will enhance seawater intrusion, thereby, affecting
Salinity of Groundwater in Coastal Aquifer of Karachi, Pakistan

139
the quality of drinking water in the coastal aquifer system. Ultimately, the whole aquiferwater will be unfit for use, not only for drinking purposes but also for domestic, industrialand irrigation purposes. It is, therefore, necessary to encourage groundwater recharge inthe Malir River Basin, on one hand, and define the existing water quality scenario ofcoastal aquifers of Karachi, on the other hand, using modern & relatively precisetechniques, such as nuclear techniques, so as to evaluate possibilities and impacts ofsea water intrusion under heavy pumping of the Malir Basin.
OBJECTIVES AND RATIONALE
The growing concern on deterioration of groundwater-systems due to disposal of untreateddomestic sewage and industrial effluents into surface-water courses (mainly: Malir River,Layari River etc.) and its partial recharge under natural infiltration conditions, and possiblyunder artificially induced infiltration conditions, as well as saline sea-water intrusion incoastal aquifers of Karachi, are of great significance from hydrological, environmentaland public-health viewpoint. Conjunctive use of hydrochemical, biological and nucleartechniques can provide reliable information on dynamics of groundwater flow, origin andmechanism of groundwater salinity. As a first step, it was considered necessary to initiateprimary studies to:
1. Develop a general understanding about the isotopic, chemical and biological labelingof various recharge sources (rain, polluted streams/rivers, lakes, seawater) and thepotable shallow and deep groundwater in coastal aquifer of Karachi,
2. Determine surface water and potable groundwater pollution characteristics,3. Delineate spatial extent of saline groundwater, and4. Evaluate the possible role of seawater intrusion in the coastal belt of Karachi.
It was decided to focus on evaluation of stable isotope characteristics of Oxygen (18O) ofthe water molecule; stable isotopes of Carbon (13C) in dissolved inorganic carbon,physiochemical and chemical characteristics (mainly parameters like E.C., salinity, redox,pH, Temperature, and chemical activities of Chloride, Sulfate, bicarbonate) of surface-water sources (polluted rivers, lakes, precipitation, local seawater), potable shallowgroundwater and deep groundwater sources (dug wells, hand-pumps, pumping wells,which tap shallow and deep coastal aquifers of Karachi) and shallow sea water off KarachiCoast.
PRESENT INVESTIGATIONS
Field Sampling
Field sampling was performed in the jurisdiction of Karachi Metropolis during the periodfrom November 2000 to December 2000. Surface-water samples and sediment samples
A. Mashiatullah, R.M. Qureshi, N.A. Qureshi, E. Ahmad, M.A. Tasneem, M.I. Sajjad, H.A. Khan

140
were collected from various locations along polluted streams/rivers namely: Layari Riverand Malir River, Hab Dam, Hab River and local sea (shallow seawater off Karachi coast).Shallow groundwater samples were collected from hand-pumps, dug wells and boreholes/mini pumping wells installed at depths upto 8 - 30 meters. Shallow mixed deep groundwaterwas collected from bore-holes / tube-wells installed at depths greater than 50 meters.Relatively deeper groundwater was collected from a few tube-wells installed at depthsbetween 70-100 meters. All water-samples were collected in leak-tight /lined cap plasticbottles or glass bottles. Sediment samples were collected in high quality polythene bags.Sterile bottles were used for collection of water for Coliform bacterial analysis. Standardfield sample preservation methods were used for subsequent chemical, biological andisotopic analysis in the laboratory2. In the field, all samples were stored under coolconditions (<12o C). The location of sampling point was monitored with the help of aPersonal Navigator (Model GarminTM GPS-100, M/S Garmin, 11206 Thompson Avenue,Lenexa, KS 66219).
Field In-situ Analysis
Temperature, electrical conductivity, salinity, turbidity, redox potential, pH and dissolvedoxygen were measured in-situe. Turbidity was measured with a portable turbidity meter(Model 6035, JENWAY). Electrical conductivity and temperature were measured withportable conductivity meter (Model HI 8633, M/S HANNA Instruments). Redox wasmeasured with a portable ORP meter (Model: PS-19 ORP Meter, M/S Corning, Canada).Dissolved oxygen was measured with a portable D.O. Meter (Model 9070, JENWAY).Salinity was measured with a portable Salinometer (refractometer) obtained from the Centerof Excellence in Marine Biology-Karachi University-Karachi.
Laboratory Analysis
δ18O values of water samples were determined by using CO2 – H2O equilibration method.Stable inorganic carbon isotope analyses of the total dissolved inorganic carbon (TDIC)of collected water samples were determined on CO2 gas extracted from TDIC using theroutine sample preparation system by reacting 50-100 of water with 85% H3PO4
3. Thestable oxygen isotope data is expressed as δ ‰ (delta per mill.) values relative to theinternational water standard V-SMOW (Vienna Standard Mean Ocean Water). Thereproducibility of δ18O measurements was better than 0.1‰ for the working standards4.The stable carbon isotope data is expressed as δ‰ (delta per mill.) values relative to theinternational carbonate standard PDB (Pee-Dee Belemnite). The reproducibility of δ13Cmeasurements was better than 0.1‰ for the working standards. HCO3
-, Cl- and SO4-2
were determined by titrimetric. Methods5.
Salinity of Groundwater in Coastal Aquifer of Karachi, Pakistan

141
RESULTS AND DISCUSSION
It appears that five possible water-sources are contributing to the groundwater storage inKarachi. The first possible source is the rainfall. As the city of Karachi suffers from deficitof precipitation (only rainfall), the contribution to shallow groundwater storage from rain isvery little. However, rainfall in the hinterlands and other areas surrounding Karachi maysignificantly contribute to the confined groundwater flow-system. The two freshwatersources are the Hab Lake/Hab Dam and the Indus River. Water from Hab Dam and theIndus River is piped to various residential zones in Karachi for drinking and irrigationpurposes. The spring water discharges into Malir River and Layari River and the municipal/industrial waste effluents added to these rivers are also contributing to groundwater storageas a fourth recharge source. Seawater intrusion along Karachi coast is the fifth possiblesource. Keeping in view this recharge-scenario of surface-water sources, we submit thefollowing results / discussions w.r.t. our field and laboratory physico-chemical (temperature,pH, redox, dissolved oxygen, electrical conductivity, salinity and concentrations of majorion viz. HCO3
-1, Cl-, SO4-2), and isotopic (δ13C, δ18O and δ2H) investigations of surface-
water and groundwater in Coastal Karachi-Pakistan. Tables-1 through 4 present a pictureof these analyses. Results are discussed in the following section.
Sources of Surface Water
Local Precipitation (Rain)
During the sampling period, no rainfall events occurred in coastal Karachi. Therefore, itwas not possible for the sampling team to collect and analyze local rain for chemical andisotopic information. However, stable isotope data on precipitation for the period from1961 to 1975 is available from the IAEA Precipitation Network for the Karachi Station(IAEA Precipitation Network Code: 41780000, Lat. 24.90N Long. 67.13E, Alt. 23 metersabove mean sea level)6. The following stable isotope indices of precipitation in Karachiwere, therefore, used for interpretation purposes:
Indus River
Physico-chemical and environmental stable isotope analysis was performed on one water-sample collected from the Indus River near Thatta city, where the river-water is partlydiverted to Karachi for irrigation and drinking purposes (Table-1). The Indus River watershave electrical conductivity values below 500 µS/cm and salinity below 1ppt. The SO4
-2
Long Term Weighted Means: δ18O (water): - 3.93 ± 1.94 ‰ V-SMOW
A. Mashiatullah, R.M. Qureshi, N.A. Qureshi, E. Ahmad, M.A. Tasneem, M.I. Sajjad, H.A. Khan
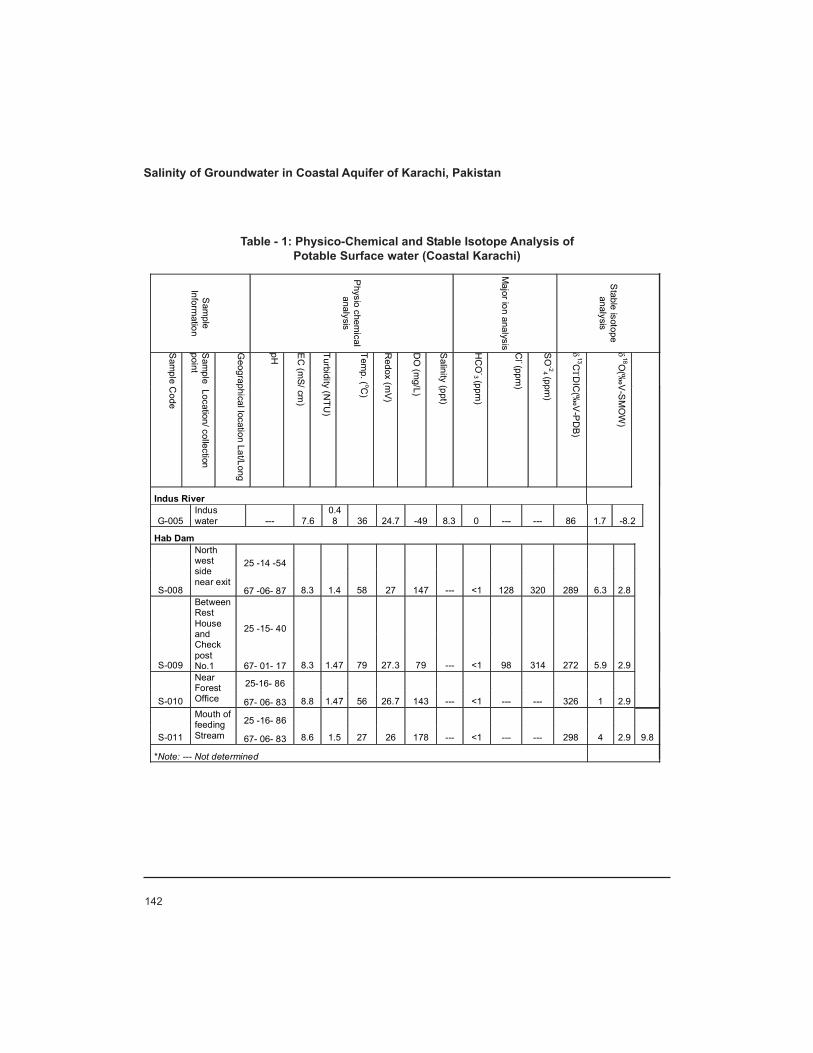
142
Table - 1: Physico-Chemical and Stable Isotope Analysis ofPotable Surface water (Coastal Karachi)
Salinity of Groundwater in Coastal Aquifer of Karachi, Pakistan
Sam
ple Inform
ation
Physio chem
ical analysis
Major ion analysis
Stable isotope
analysis
Sam
ple Code
Sam
ple Location/ collection point
Geographical location Lat/Long
pH
EC
(mS/ cm
)
Turbidity (NTU
)
Temp. ( oC
)
Redox (m
V)
DO
(mg/L)
Salinity (ppt)
HC
O-3 (ppm
)
Cl - (ppm
)
SO
-24 (ppm)
δ13C
ΤDIC
(‰V
-PD
B)
δ18O
(‰V
-SM
OW
)
Indus River
G-005 Indus water --- 7.6
0.48 36 24.7 -49 8.3 0 --- --- 86 1.7 -8.2
Hab Dam
25 -14 -54
S-008
North west side near exit
67 -06- 87 8.3 1.4 58 27 147 --- <1 128 320 289 6.3 2.8
25 -15- 40
S-009
Between Rest House and Check post No.1 67- 01- 17 8.3 1.47 79 27.3 79 --- <1 98 314 272 5.9 2.9
25-16- 86
S-010
Near Forest Office 67- 06- 83 8.8 1.47 56 26.7 143 --- <1 --- --- 326 1 2.9
25 -16- 86
S-011
Mouth of feeding Stream 67- 06- 83 8.6 1.5 27 26 178 --- <1 --- --- 298 4 2.9 9.8
*Note: --- Not determined

143
concentrations in the river water is 86 ppm. The stable isotope indices of total dissolvedinorganic carbon (TDIC) in water and of oxygen in water molecule are as follows:
Hab Dam
The water-storage in the Hab Lake was very little because the Hab River was dry, due todrought conditions in and around the study area over the past several years. Thus, mostof the Hab Lake had patches of stagnant water. Results of physico-chemical stable isotopicanalysis on Hab Lake water are presented in Table-1. Different patches of water in thelake showed similar values of mildly alkaline pH (~8.3), E.C (~1.4 mS/cm), and temperature(~ 27oC). The electrical conductivity values (~1500 µS/cm) were three times higher thanthe Indus river water-supply. Temperature of the water was also higher by about 2-3oC, ascompared to the Indus River-water supply. HCO3
- concentrations are moderate. Both theCl- and SO4
-2 concentrations in the lake water are around ~ 300 ppm.
The stable carbon isotope index (δ13CTDIC) of total dissolved inorganic carbon (TDIC) inlake-water varies in the range of + 1‰ PDB to +6.3‰ PDB in different patches ofstagnant lake water. This is indicative of various sources of dissolved inorganic carbon inthe lake or an enrichment due to biological transformation of TDIC into other carbon-containing compounds over the drought regime.
Polluted Rivers
Table-2 summarizes the physico-chemical and stable isotope analysis of oxygen in watercollected from polluted Layari and Malir Rivers. Results are discussed in the followingsection.
Layari River: The Layari River was monitored at five locations along its flow from NorthKarachi (upstream region) to Sher-Shah Bridge (downstream region) near Sea. The rangeof variation in stable isotope content of total dissolved inorganic carbon (TDIC) and ofoxygen in Layari River water are as follows:
There is a good correspondence between electrical conductivity and salinity along theflow in the river. Generally, the E.C. and salinity values tend to decrease downstream.Maximum values of EC (9.02 mS/cm) and Salinity (5 ppt) were observed at the origin ofthe Layari stream, near Yousuf Goth area. In this zone, the Layari stream receives minor
δ18O (Layari River Water): -5 to -2.7 ‰ V-SMOW (n=5) δ13C (TDIC - Layari River Water): -7.2 to -0.2 ‰ PDB (n=5)
δ13C (TDIC): + 1.7 ‰ PDB (n=1) δ18O (water): - 8.2 ‰ V-SMOW (n=1)
A. Mashiatullah, R.M. Qureshi, N.A. Qureshi, E. Ahmad, M.A. Tasneem, M.I. Sajjad, H.A. Khan
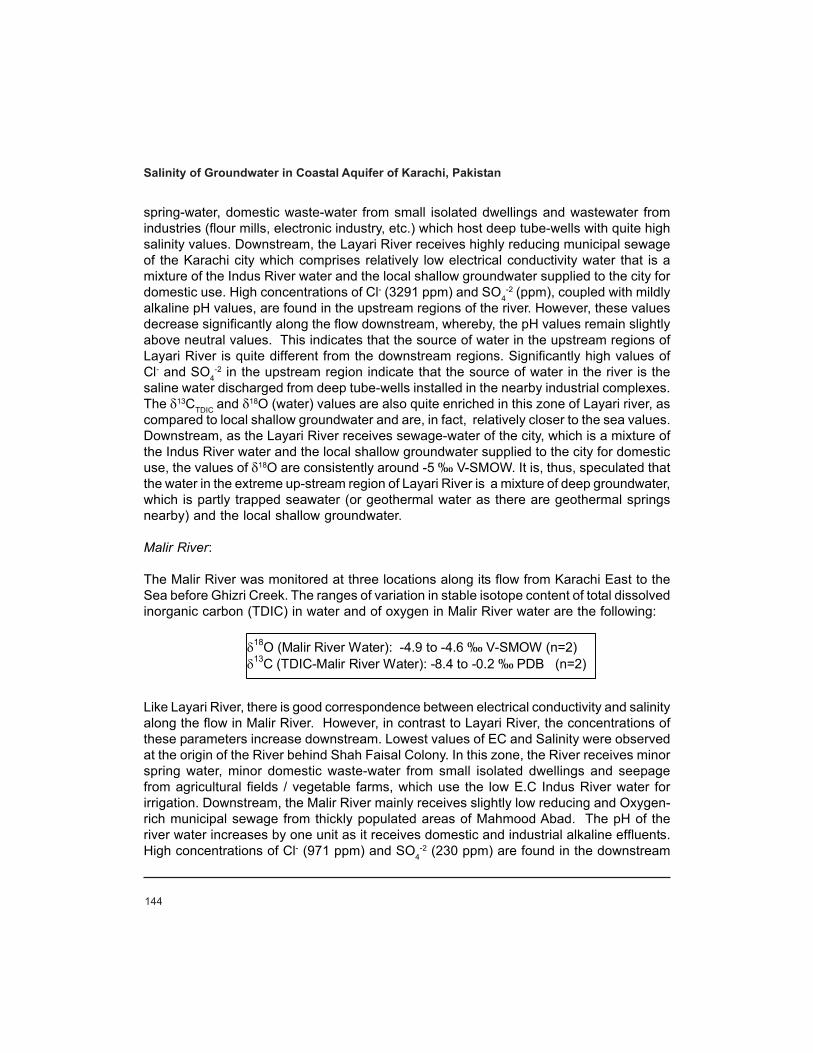
144
spring-water, domestic waste-water from small isolated dwellings and wastewater fromindustries (flour mills, electronic industry, etc.) which host deep tube-wells with quite highsalinity values. Downstream, the Layari River receives highly reducing municipal sewageof the Karachi city which comprises relatively low electrical conductivity water that is amixture of the Indus River water and the local shallow groundwater supplied to the city fordomestic use. High concentrations of Cl- (3291 ppm) and SO4
-2 (ppm), coupled with mildlyalkaline pH values, are found in the upstream regions of the river. However, these valuesdecrease significantly along the flow downstream, whereby, the pH values remain slightlyabove neutral values. This indicates that the source of water in the upstream regions ofLayari River is quite different from the downstream regions. Significantly high values ofCl- and SO4
-2 in the upstream region indicate that the source of water in the river is thesaline water discharged from deep tube-wells installed in the nearby industrial complexes.The δ13CTDIC and δ18O (water) values are also quite enriched in this zone of Layari river, ascompared to local shallow groundwater and are, in fact, relatively closer to the sea values.Downstream, as the Layari River receives sewage-water of the city, which is a mixture ofthe Indus River water and the local shallow groundwater supplied to the city for domesticuse, the values of δ18O are consistently around -5 ‰ V-SMOW. It is, thus, speculated thatthe water in the extreme up-stream region of Layari River is a mixture of deep groundwater,which is partly trapped seawater (or geothermal water as there are geothermal springsnearby) and the local shallow groundwater.
Malir River:
The Malir River was monitored at three locations along its flow from Karachi East to theSea before Ghizri Creek. The ranges of variation in stable isotope content of total dissolvedinorganic carbon (TDIC) in water and of oxygen in Malir River water are the following:
Like Layari River, there is good correspondence between electrical conductivity and salinityalong the flow in Malir River. However, in contrast to Layari River, the concentrations ofthese parameters increase downstream. Lowest values of EC and Salinity were observedat the origin of the River behind Shah Faisal Colony. In this zone, the River receives minorspring water, minor domestic waste-water from small isolated dwellings and seepagefrom agricultural fields / vegetable farms, which use the low E.C Indus River water forirrigation. Downstream, the Malir River mainly receives slightly low reducing and Oxygen-rich municipal sewage from thickly populated areas of Mahmood Abad. The pH of theriver water increases by one unit as it receives domestic and industrial alkaline effluents.High concentrations of Cl- (971 ppm) and SO4
-2 (230 ppm) are found in the downstream
δ18O (Malir River Water): -4.9 to -4.6 ‰ V-SMOW (n=2) δ13C (TDIC-Malir River Water): -8.4 to -0.2 ‰ PDB (n=2)
Salinity of Groundwater in Coastal Aquifer of Karachi, Pakistan
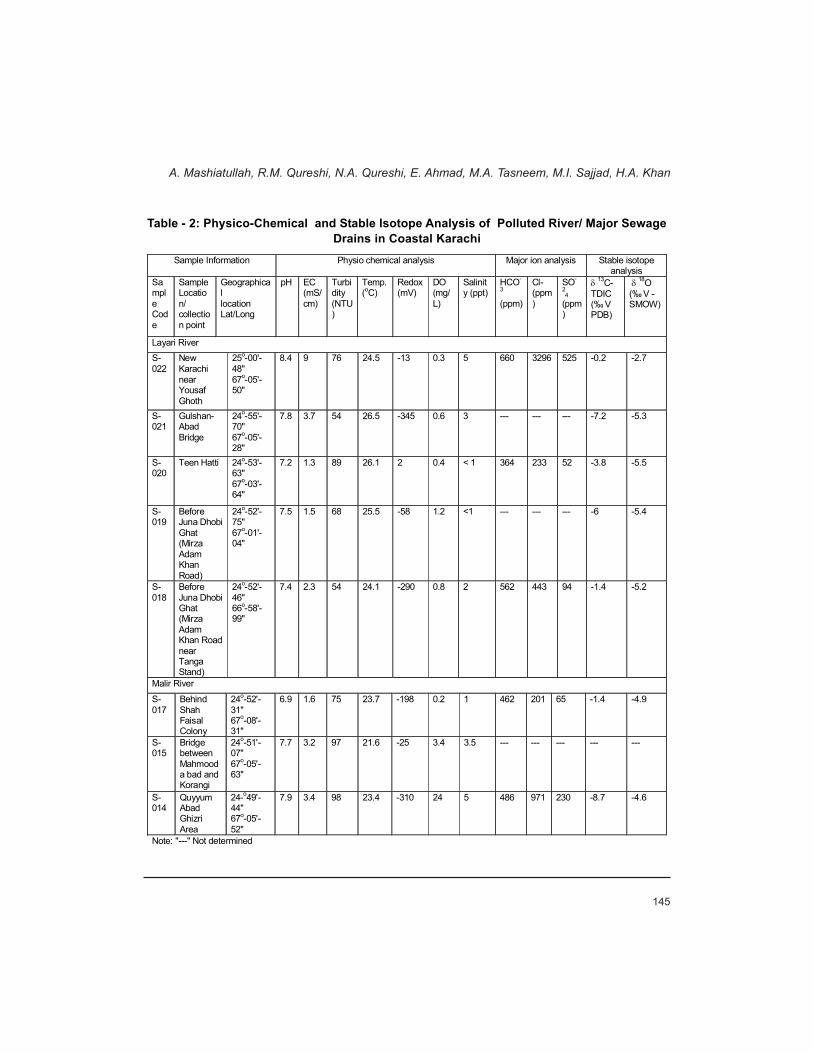
145
Sample Information Physio chemical analysis Major ion analysis Stable isotope analysis
Sample Code
Sample Location/ collection point
Geographical location Lat/Long
pH EC (mS/cm)
Turbidity (NTU)
Temp. (oC)
Redox (mV)
DO (mg/L)
Salinity (ppt)
HCO-
3 (ppm)
Cl- (ppm)
SO-
24
(ppm)
δ 13C-TDIC (‰ V PDB)
δ 18O (‰ V -SMOW)
Layari River S-022
New Karachi near Yousaf Ghoth
25o-00'-48" 67o-05'-50"
8.4 9 76 24.5 -13 0.3 5 660 3296 525 -0.2 -2.7
S-021
Gulshan-Abad Bridge
24o-55'-70" 67o-05'-28"
7.8 3.7 54 26.5 -345 0.6 3 --- --- --- -7.2 -5.3
S-020
Teen Hatti 24o-53'-63" 67o-03'-64"
7.2 1.3 89 26.1 2 0.4 < 1 364 233 52 -3.8 -5.5
S-019
Before Juna Dhobi Ghat (Mirza Adam Khan Road)
24o-52'-75" 67o-01'-04"
7.5 1.5 68 25.5 -58 1.2 <1 --- --- --- -6 -5.4
S-018
Before Juna Dhobi Ghat (Mirza Adam Khan Road near Tanga Stand)
24o-52'-46" 66o-58'-99"
7.4 2.3 54 24.1 -290 0.8 2 562 443 94 -1.4 -5.2
Malir River
S-017
Behind Shah Faisal Colony
24o-52'-31" 67o-08'-31"
6.9 1.6 75 23.7 -198 0.2 1 462 201 65 -1.4 -4.9
S-015
Bridge between Mahmooda bad and Korangi
24o-51'-07" 67o-05'-63"
7.7 3.2 97 21.6 -25 3.4 3.5 --- --- --- --- ---
S-014
Quyyum Abad Ghizri Area
24-o49'-44" 67o-05'-52"
7.9 3.4 98 23.4 -310 24 5 486 971 230 -8.7 -4.6
Note: "---" Not determined
Table - 2: Physico-Chemical and Stable Isotope Analysis of Polluted River/ Major SewageDrains in Coastal Karachi
A. Mashiatullah, R.M. Qureshi, N.A. Qureshi, E. Ahmad, M.A. Tasneem, M.I. Sajjad, H.A. Khan

146
region of the river. This is perhaps due to the effect of sea tides in the Qayyum Abad area,near Ghizri Creek.
Karachi Sea:
Table-3 presents the summary of physiochemical and stable isotope analysis of shallowseawater collected off six representative locations along Karachi coast. The pH values of~8.1 for open seawater off Karachi Coast generally conform to those for normal oceanwaters. However, pH values decrease to levels of ~7.7 near the Ghizri Creek, and theKorangi Creek which receive significant quantities of industrial acidic wastewaters.Similarly, the pH values of seawater increase to ~8.5 in the back-waters of Manora Channel,near Village Shamas-pir. Electrical Conductivity values for Karachi seawater rangebetween 49.3 mS/cm to 53.7 mS/cm, while the salinity values are ~ 39 ppt. The electricalconductivity values higher than 53 mS/cm correspond to relatively non-polluted openseawaters on north-west and south-east sides of Karachi coast. The E.C values of openseawater drop, due to input of wastewaters from Malir River via Ghizri Creek and polluteddrains around Korangi Creek. Slightly higher temperature is observed near Ghizri Coast,which is attributed to input of relatively warmer wastewaters of industrial and domesticorigin. Cl- contents of seawater off Karachi coast are in the range of 21,578 to 25,230ppm, while the SO4
-2 concentrations are in the range of 2076 to 2210 ppm. The stablecarbon isotope contents (δ13CTDIC) of total dissolved inorganic carbon (TDIC) vary in therange of - 3.9 ‰ PDB to + 0.8 ‰ PDB in different zones off Karachi coast. This isindicative of different levels and sources of dissolved inorganic carbon in seawater, dueto input of domestic and industrial wastewater into the sea from key industrial tradingestates (LITE, KITE, SITE etc.) via polluted drains. The highest δ13CTDIC value of + 0.8 ‰PDB corresponds to relatively non-polluted seawater along north-west coast of Karachi.The lowest δ13CTDIC value of -3.9 ‰ PDB corresponds to highly polluted seawater in KorangiCreek, which receives industrial and domestic waste drains from Korangi Industrial TradingEstate (KITE). The high tide (HT) stable isotope content of oxygen in relatively non-pollutedseawater, along Karachi coast, falls in the following range:
The low tide (LT) stable isotope content of oxygen in relatively polluted seawater alongKarachi coast falls in the following range:
δ18O (seawater)HT: + 0.3 to + 1.1 ‰ V-SMOW (n=5) δ13C (TDIC - seawater): -3.9 to 0.8 ‰ PDB (n=5)
δ18O (seawater) LT: -1.3 to + 0.1 ‰ V-SMOW (n =5)
Salinity of Groundwater in Coastal Aquifer of Karachi, Pakistan

147
Potable Groundwater in Coastal Aquifer
Shallow groundwater samples were obtained from hand pumps (n=1), dug wells (n=1)and shallow bores, with centrifugal pumps (n=8) installed at depths less than 50 meters(mainly between 8-30 meters); and (b) relatively deep groundwater was obtained frompumping wells (cased wells/Tube-wells) installed at depths greater than 50 meters in thecoastal aquifer of Karachi. These cased wells also tap various proportions of shallowgroundwater, in addition to deep groundwater. Tables-4a and 4b present the physico-chemical, bacteriological and stable isotope data of shallow and shallow mixed deepgroundwater. The following section presents discussion on these data-elements.
Shallow Groundwater
Physico-chemical data of shallow groundwater (depth less than 30 meters) shows thatthe shallow wells, located in the vicinity of coast and in the proximity of polluted rivers,have relatively higher values of electrical conductivity, salinity and population of Coliformbacteria. In general, the bacteriological quality of shallow groundwater is quite poor andrenders the water unfit for drinking purposes without prior treatment. The shallowgroundwater is moderately saline, representing electrical conductivity values in the rangeof 1.1 to 1.9 mS/cm and salinity in the range of 1 ppt. The pH of shallow groundwatervaries from mildly acidic (~6.3) to mildly alkaline values (~7.9). Areas with quite poorsanitary conditions have relatively low values of pH (~6.3 to 6.8). Shallow groundwaterbelow 20 meters is slightly reducing. The dissolved oxygen is in the range of 1.5 to 7.9mg/L. Turbidity of shallow groundwater varies between 3.6 NTU and 95 NTU. The
Sample Information Physio chemical analysis Major ion analysis Stable isotope analysis
Sample Code
Sample Code
Geographical location Lat/Long
pH
EC (mS/c
m)
Turbidity
(NTU)
Temp. (oC)
Redox (mV)
DO (mg/L)
Salinity (ppt)
HCO-3
(ppm) Cl-_
(ppm) SO-2
4 (ppm)
δ 13C-TDIC (‰ PDB)
δ 18O (‰ V -
SMOW)
K--12 Bule-Ji Coast
24o-49'-04" 66o-50'-41" --- 53.7 78.5 25.4 208 ---- 39 159 24138 2076 0.76 0.74
K-17 Clifton Coast
24o-47'-43" 67o-01'-40" 8.1 52.8 52.6 25.6 135 8 39 145 25230 2180 -2.77 0.87
K-24 Ghizri Coast
24o-45'-86" 67o-07'-12" 7.8 52.1 195.5 28.3 182 2.7 39 156 24230 2210 -2.72 0.82
K-26 Korangi Coast
24o-47'-99" 67o-12'-22" 7.7 52.1 173.6 25.7 104 3.8 39 --- ---- ---- -3.86 1.1
K-43 Shams Pir Coast
24 o -51’-05” 66 o -55’-05” 8.5 49.3 --- 25.3 34 ---- 32 196 21578 2323 -2.26 0.27
Table - 3: Physio-Chemical and Stable Isotope Analysis of Local Seawater(Coastal Karachi)
A. Mashiatullah, R.M. Qureshi, N.A. Qureshi, E. Ahmad, M.A. Tasneem, M.I. Sajjad, H.A. Khan

148
concentration of HCO3- (356 - 514 ppm, n=4), Cl- (82 - 169 ppm, n=4) and SO4
-2 (38-117ppm, n=4) in shallow groundwater is very reasonable.
The mean chemical concentrations of Cl-, SO4-2 and HCO3
- in shallow groundwater areas follows:
The range of variation in stable isotope content of total dissolved inorganic carbon (TDIC)and oxygen in Layari River water is as follows:
The mean stable isotope content of 18O and 13C in shallow groundwater is as follows:
The stable-isotope results indicate that the shallow / phreatic aquifers are recharged by amixture of fresh waters of Indus River and Hab River (draining spring water and floodedrainwater), as well as polluted Layari and Malir rivers and their feeding drains (both undernatural infiltration conditions and artificially induced infiltration conditions) and, to a muchsmaller extent, from direct recharge of local precipitation.
Deep Groundwater
In general, deep groundwater is mostly saline and has high electrical conductivity (range:1.9- 19.1 mS/cm) and salinity (range: 1.7-7.4 ppt), as compared to shallow groundwater.The sampled deep groundwater from pumping wells is in fact a mixture of variousproportions of shallow groundwater from freshwater phreatic/ unconfined aquifer and actualdeep groundwater from the confined aquifer. In the absence of well-logs of sampledtube-wells/pumping wells, it is not possible to estimate the proportions of inputs of shallowgroundwater in the discharge of these wells. Based on hydrochemical data, it is assumedthat the shallow mixed deep groundwater discharged by large-scale pumping wells mainlyrepresents the deep groundwater from confined aquifer. The more representative deepgroundwater wells (sample No. G-006, G-012, G-014) are those which have relativelyhigher values of electrical conductivity (range: 5.1 - 19.1 mS/cm), salinity (range: 2.7 - 7.4ppt) as well as concentrations of Cl- (range: 1480 - 6034 ppm) and SO4
-2 (range: 144 -
Mean δ18O (Shallow Groundwater): -5.9 ± 0.32 ‰ V-SMOW (n=8) Mean δ13C (TDIC-Shallow Groundwater): -10.1± 3.3 ‰ PDB (n=8)
Mean Cl- (Shallow Groundwater): 132.8 ± 36.5 ppm (n=4 ) Mean SO4
-2 (Shallow Groundwater): 63.3 ± 36.7 ppm (n=4 ) Mean HCO3
- (Shallow Groundwater): 423 ± 67.4 ppm (n=4 )
δ18O (Shallow Groundwater) -6.3 to -5.8 ‰ V-SMOW (n=8) δ13C (TDIC-Shallow Groundwater): -16.5 to -5.5 ‰ PDB (n=8)
Salinity of Groundwater in Coastal Aquifer of Karachi, Pakistan

149
A. Mashiatullah, R.M. Qureshi, N.A. Qureshi, E. Ahmad, M.A. Tasneem, M.I. Sajjad, H.A. Khan
Sam
ple
Info
rmat
ion
Phys
io c
hem
ical
ana
lysi
s M
ajor
ion
anal
ysis
St
able
isot
ope
anal
ysis
Sam
ple
Cod
e
Sam
ple
Lo
catio
n/ co
llect
ion
poin
t
Geo
grap
hica
l lo
catio
n (L
at/L
ong)
App
rox
Dep
th
(met
er)
pH
EC
(mS/
cm
)
Turb
idity
(NTU
) Te
mp
(o C)
Red
ox(m
V)
DO
(m
g/L)
Salin
ity(p
pt)
HC
O- 3
(ppm
) C
l-_
(ppm
)SO
-24
(ppm
) δ
13C
-TD
IC
(‰ P
DB)
δ
18O
(‰
V -
SM
OW
)
A: S
hallo
w g
roun
dwat
er
A-I:
Han
d pu
mp
G-0
08
Aze
em
Pur
a
(Mal
ir)
24o -5
2'-6
0"
67o -0
9'- 6
1"
10
7.5
1.4
95
27.3
-3
4 3.
6 0.
9 ---
---
---
-9
.7
-6.2
G
-002
G
ulsh
an-
e-Iq
bal
24o -5
5'- 0
0"
67o -0
4'- 7
9"
8 6.
8 1.
7 35
28
.6
-12
---
1 ---
---
---
-1
0.7
-5.8
A-II
:
Dug
wel
l
G-0
03
Mill
Are
a Li
aqua
t A
bad
(R
L)
---
15
7.4
1.8
56
29.2
-4
---
1
356
140
56
-5.5
-5
.3
A-II
I:
Bor
es/P
umpi
ng w
ells
G-0
04
Gar
den
Zoo
A
rea
(RL)
24o -5
2'- 4
1"
67o -0
1'- 4
1"
20
7.6
1.9
79
28.8
-5
2 7.
9 1
---
---
---.
-6.6
-6
.3
G-0
09
Sha
h Fa
isal
C
olon
y (R
M)
24o -5
2'-4
7"
67o -1
0'- 0
3"
25
7.5
1.1
29
28.2
10
3 2.
4 1
394
140
42
-9.8
-5
.9
G-0
11
Juna
D
hubi
G
hat
(RL)
24o -5
2'-7
6"
67o -0
1'- 0
3"
25
6.7
1.1
---
27.5
72
1.
9 0.
8 42
8 82
38
-1
0.6
-6.2
G-0
13
Nor
th
Kar
achi
, Iq
bal
Tow
n
24o -5
8'-5
9"
67o -0
3'- 9
6"
30
6.3
1.5
3.6
27.4
59
2.
8 1
---
---
---
-11.
6 -5
.8
G-0
18
Sad
dar
( C
) ---
20
7.
9 1.
6 7.
8
28.9
37
1.
5 1
514
169
117
-16.
5 -6
.0
Tabl
e - 4
(a):
Phys
ico-
Che
mic
al a
nd S
tabl
e Is
otop
e A
naly
sis
of S
hallo
w G
roun
dwat
er (C
oast
al K
arac
hi)

150
Sam
ple
Info
rmat
ion
Phys
io c
hem
ical
ana
lysi
s M
ajor
ion
anal
ysis
S
tabl
e is
otop
e an
alys
is
Sam
ple
Cod
e
Sam
ple
Lo
catio
n /c
olle
ctio
n po
int
Geo
grap
hica
l lo
catio
n (L
at/L
ong)
Appr
ox.
Dep
th
(met
er)
pH
EC
(m
S/
cm)
Turb
idity
(N
TU)
Tem
p(o C
) R
edox
(m
V)
DO
(m
g/L)
Sa
linity
(p
pt)
HC
O- 3
(ppm
) C
l-_
(ppm
) S
O-2
4 (p
pm)
δ 13
C-
TDIC
(‰
V-
PDB
)
δ 18
O
(‰ V
- S
MO
W)
G-0
01
Gul
shan
-e-
Iqba
l (R
L)
24o -5
5'- 0
1"
67o -0
4'- 7
9"
>70
7.0
2.9
27
28.6
-2
0 0.
1 2
241
1829
129
-11.
5 -5
.6
G-0
06
PEC
HS
M
ahm
ood
Aba
d
24o -5
1'-4
7"
67o -0
4'- 3
5"
>70
7.5
5.5
41
30
-51
5.6
2.9
380
1480
144
- 0.3
-4
.2
G-0
07
Gul
ista
n-e-
Joha
r 24
o -54'
-53"
67
o -07'
- 23"
>5
0 6.
6 3.
4 39
27
.3
-2
4.5
2.2
376
501
142
-10.
7 -5
.9
G-0
10
Qua
id A
bad
(R
M)
24o -5
2'-0
6"
67o -1
2'- 1
8"
>50
7.5
2.3
25
22.4
11
8 ---
1.
8 ---
---
. ---
-1
1.3
-6.2
G-0
12
Pow
er
Hou
se A
rea
(RL)
24o -5
7'-5
1"
67o -0
4'- 4
9"
~50
7.5
5.1
5.4
24.3
-0
23
1.7
2.7
373
2194
698
-10.
4 -4
.3
G-0
14
New
K
arac
hi
Nea
r you
saf
Gho
th (R
L)
25o -0
0'-4
7"
67o -0
5'- 9
1"
~100
6.
9 19
.1
9.9
29.6
45
4.
8 7.
4 29
0 60
3422
21
-13.
2 -4
.5
G-0
15
Mod
el
Col
ony
(Mal
ir)
---
45
6.5
3.5
7.7
23.5
13
9 ---
2.
2 14
4 50
1 10
2 -1
1.7
-6.0
G-0
16
Clif
ton
( C)
24o -4
9'-9
1"
66o -5
7'- 9
8"
80
7.4
7.8
2.7
28.1
23
3.
7 3.
6 28
1 32
9144
5 -1
3.2
-5.0
G-0
17
Sul
tan
A ba
d, H
ijrat
C
olon
y (
C)
24o -4
6'-0
7"
67o -0
0'- 3
1"
>70
8.6
6.6
12.2
28
.2
-48
2.3
3.2
886
3291
132
-11.
0 -5
.5
G-0
19
Mal
ir H
alt
---
>50
7.7
1.9
---
---
---
---
1.7
211
402
113
-12.
1 -5
.8
Tabl
e –
4(b)
: Phy
sio-
Che
mic
al, a
nd S
tabl
e Is
otop
e A
naly
sis
of S
hallo
w M
ixed
Dee
p G
roun
dwat
er (C
oast
al K
arac
hi)
Salinity of Groundwater in Coastal Aquifer of Karachi, Pakistan
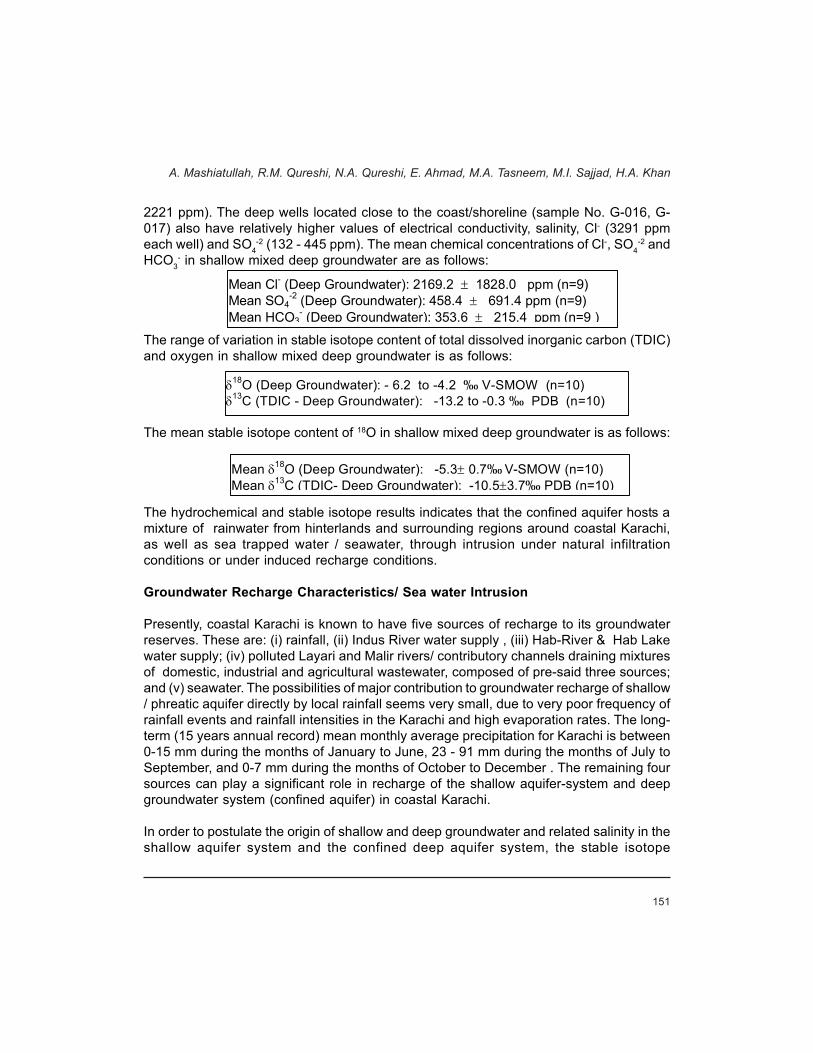
151
2221 ppm). The deep wells located close to the coast/shoreline (sample No. G-016, G-017) also have relatively higher values of electrical conductivity, salinity, Cl- (3291 ppmeach well) and SO4
-2 (132 - 445 ppm). The mean chemical concentrations of Cl-, SO4-2 and
HCO3- in shallow mixed deep groundwater are as follows:
The range of variation in stable isotope content of total dissolved inorganic carbon (TDIC)and oxygen in shallow mixed deep groundwater is as follows:
The mean stable isotope content of 18O in shallow mixed deep groundwater is as follows:
The hydrochemical and stable isotope results indicates that the confined aquifer hosts amixture of rainwater from hinterlands and surrounding regions around coastal Karachi,as well as sea trapped water / seawater, through intrusion under natural infiltrationconditions or under induced recharge conditions.
Groundwater Recharge Characteristics/ Sea water Intrusion
Presently, coastal Karachi is known to have five sources of recharge to its groundwaterreserves. These are: (i) rainfall, (ii) Indus River water supply , (iii) Hab-River & Hab Lakewater supply; (iv) polluted Layari and Malir rivers/ contributory channels draining mixturesof domestic, industrial and agricultural wastewater, composed of pre-said three sources;and (v) seawater. The possibilities of major contribution to groundwater recharge of shallow/ phreatic aquifer directly by local rainfall seems very small, due to very poor frequency ofrainfall events and rainfall intensities in the Karachi and high evaporation rates. The long-term (15 years annual record) mean monthly average precipitation for Karachi is between0-15 mm during the months of January to June, 23 - 91 mm during the months of July toSeptember, and 0-7 mm during the months of October to December . The remaining foursources can play a significant role in recharge of the shallow aquifer-system and deepgroundwater system (confined aquifer) in coastal Karachi.
In order to postulate the origin of shallow and deep groundwater and related salinity in theshallow aquifer system and the confined deep aquifer system, the stable isotope
Mean Cl- (Deep Groundwater): 2169.2 ± 1828.0 ppm (n=9) Mean SO4
-2 (Deep Groundwater): 458.4 ± 691.4 ppm (n=9) Mean HCO3
- (Deep Groundwater): 353.6 ± 215.4 ppm (n=9 )
δ18O (Deep Groundwater): - 6.2 to -4.2 ‰ V-SMOW (n=10) δ13C (TDIC - Deep Groundwater): -13.2 to -0.3 ‰ PDB (n=10)
Mean δ18O (Deep Groundwater): -5.3± 0.7‰ V-SMOW (n=10) Mean δ13C (TDIC- Deep Groundwater): -10.5±3.7‰ PDB (n=10)
A. Mashiatullah, R.M. Qureshi, N.A. Qureshi, E. Ahmad, M.A. Tasneem, M.I. Sajjad, H.A. Khan

152
composition of oxygen and hydrochemical data of groundwater samples collected in thepresent investigation is statistically evaluated.
Unpolluted seawater off Karachi coast is characterized by a δ18O value of ~ +1 ‰ V-SMOW and a chloride content of ~23000 ppm. Both the Layari River and Malir Riverwaters, as well as the Indus River water and the Hab Lake water, have extremely very lowaqueous contents of chloride and sulfate ions as compared to seawater. The averagemean value of δ18O in polluted river waters is ~ 5 ‰ V-SMOW and in shallow groundwateris -5.9 ‰ V-SMOW. Therefore, those pumping wells which are located near the coastline/shore line (where seawater intrusion could be expected) and have high chloride andsulfate values should represent seawater-intrusion and relatively enriched 18O values.However, for pumping-wells located comparatively far away from the coast andrepresenting high salinity (chloride & sulfate concentrations), the contribution of salinewater may be derived from upward diffusion from the freshwater- seawater interface,possibly as a result of local fluctuation of water-table due to pumping. In the presentinvestigations, shallow mixed deep-pumping wells installed near the coast (sample No.G-016, G-017) have significantly high values of chloride (in both wells) and sulfate (in wellnear Clifton coast), but have δ18O values closer to polluted river water and shallowgroundwater. This suggests that these coastal pumping-wells are withdrawing significantquantities of water from shallow aquifer, which also hosts recharge of seawater gushedinto the coastal zone during summer monsoon period. However, possibilities of directseawater intrusion in these wells, under prolonged pumping conditions, is yet to be verified.Noteworthy are the pumping wells with significantly high chloride-content and relativelylower sulfate-content (Well No. G-001, G-017). These samples have negative redox valuesand it is speculated that the lower sulfate contents are due to biological reduction ofsulfate. Sulfur Isotopic analysis (δ34S) of aqueous sulfate in these samples is in progress,to fully document this observation.
The relatively deeper groundwaters representing confined aquifer, and sampled from threepumping wells: No. G-006, G-012, G-014, have a mean δ18O value of -4.3 ‰ V-SMOWand excessively high values of aqueous chloride and sulfate. One of the samples No. G-006 has δ13C (TDIC) value of -0.3 ‰, PDB which is very close to the δ13C (TDIC) valuefor seawater. The other two wells No. G-012 and G-014 have δ13C (TDIC) values of -10.4‰ PDB ‰ PDB and -13.2‰ PDB. Similar depleted δ13C values have been reportedfor deep saline groundwater tapped from confined aquifer in the coastal zone of Orissa-India7. It is speculated that the groundwater tapped by these wells mainly represents amixture of recharge from rainfall in the hinterlands, flood water and spring-water drainedby the Malir River Basin and the Hab River Basin around coastal Karachi, as well asseawater. For Well No. G-006, we speculate direct intrusion of seawater by excessivepumping. However, in case of the two pumping wells No. G-012 and G-014, the excessivelyhigh values of chloride and sulfate in deep groundwater away from the coast suggestpossibilities of trapped seawater. To verify possibilities of seawater intrusion in shallow
Salinity of Groundwater in Coastal Aquifer of Karachi, Pakistan

153
groundwater and mixed deep groundwater and/or existence of trapped seawater indeep groundwater, the concentrations of SO4
-2 (in milligrams per liter, log scale) areplotted against SO4
-2/ Cl- ratios (in milliequivalents per liter, log scale) for all analyzedwater-samples (Figure-1). It is obvious that shallow groundwater and deep groundwaterplot along two distinct lines.
This is further justified by demonstrating the trend of Cl- concentrations (in ppm, log scale)versus δ18O values (in ‰ V-SMOW, linear scale) in shallow and deep groundwater andthe local seawater as well as seawater from Doha-Qatar in Gulph Area8. It may be realizedfrom Figure-2 that the extrapolated or forecast trend for shallow groundwater samples(with low SO4
-2 content) does not fall on the data points for local seawater (or other tropicalseawater from Doha/Qatar). However, the extrapolated or forecast trend for deepgroundwater samples (with high SO4
-2 and Cl- contents and enriched δ18O values) falls inthe vicinity of the data points for local seawater (or other tropical seawater from Doha/Qatar). This observation strengthens the possibilities of seawater intrusion in the coastalzone and existence of trapped seawater salinity/build-up of salt-water up-coning in thedeep confined aquifer in coastal Karachi.
CONCLUSIONS
The primary studies carried out during the first year of the project on conjunctive use ofstable isotope techniques and conventional non-nuclear techniques have successfullyprovided a general view of the stable isotope composition of oxygen and inorganic carbonin water and its dissolved inorganic carbon, as well as hydrochemistry /salinity and biologicalpollution of potable groundwater system in coastal Karachi. The conclusions on possibilities
Figure – 1: Graph of SO4-2/Cl- Ratio and SO4
-2 Concentration in Shallowand Deep Groundwater, Coastal Karachi (Pakistan)
A. Mashiatullah, R.M. Qureshi, N.A. Qureshi, E. Ahmad, M.A. Tasneem, M.I. Sajjad, H.A. Khan

154
of seawater and/or existence of trapped seawater salinity/build-up of salt-water up-coning,in the deep confined aquifer in coastal Karachi, is based on few and scattered data-points. More representative sampling thus needs to be performed during the next samplingphase.
REFERENCES
1. H. Klein and K.W. Ratzlaff (1989): Changes in saltwater intrusion in the Biscayne aquifer,Hialeah-Miami Springs area, Dade County, Florida: U.S. Geological Survey Water-ResourcesInvestigations Report No. 87-4249
2. I. D. Clark and P. Fritz (1997): Environmental Isotopes in Hydrology, Chapter-1 and Chapter-10, Lewis Publishers, New York, pp. 328
3. Craig H., “Geochim. Cosmochim. Acta”, 12, 133 (1957).4. Sajjad, M. I. (1989): Isotope hydrology in Pakistan: Methodology, Instrumentation and Application,
(Ph.D thesis) University of Punjab, Lahore, 19895. American Public Health Association : Standard Methods for the examination of water and
wastewater ,Mary Ann h. Franson (eds) 16th edition (1989)6. IAEA (1992): Statistical Treatment of Data on Environmental Isotopes in Precipitation. IAEA
Technical Reports Series No. 331. STI/DOC/10/331, ISBN 92-0-100892-9International AtomicEnergy Agency, Vienna, Austria (1992), pp: 781
7. Kulkarni K.M.; S.V. Navada; A.R. Nair, S.M. rao; K. Shivanna, U.K. Sinha and S. Sharma,(1997): Drinking Water Salinity Problem in Coastal Orissa-India - Identificationof PastTransgressionof Sea by Isotope Investigation. IAEA-SM-349/18, In: Proceedings of theInternational Symposium on Isotope Techniques in the Study of Past and Current EnvironmentalChanges in the Hydrosphere and Atmosphere, Vienna, Austria, 14-18 April, 1997.
8. Yurtsever, Y and Payne, B.R., (1978): Application of Environmental Isotopes to GroundwaterInvestigations in Qatar. IAEA-SM-228/24, In: Proceedings of the International Symposium onIsotope Hydrology, Neuherberg, F.R. Germany, 19-23 June, 1978.
Figure - 2: Chloride Versus 18O Trend Line for Shallow and ShallowMixed Deep Groundwater, Coastal Karachi (Pakistan)
Salinity of Groundwater in Coastal Aquifer of Karachi, Pakistan

Studies of Seawater Pollutionon the Pakistan Coast Using
Stable Carbon IsotopeTechnique
Riffat M. Qureshi, A. Mashiatullah, M. Fazil, M.I. SajjadE. Ahmad and H.A. Khan

155
STUDIES OF SEAWATER POLLUTION ON THE PAKISTAN COAST USING STABLE CARBON ISOTOPE TECHNIQUE ABSTRACT Environmentally stable carbon isotope ratios (δ13C ‰ PDB) of total dissolved inorganic carbon (TDIC) have been used as a natural tracer of domestic and industrial pollution- inventory in shallow seawater off the Pakistan Coast. Shallow seawater samples (sea depth range ~2-20 meters) were collected from five locations off the Baluchistan Coast (Jiwani, Gwadar, Pasni, Ormara, Sonmiani) and two locations off the Sindh Coast (Karachi and Indus Delta). Physiochemical parameters, such as pH, electrical conductivity, and Salinity, were measured in-situ. δ13C values of TDIC were measured, using gas-source mass spectrometry. Significantly depleted δ13CTDIC values (as low as -7 per mill. PDB) coupled with measurable depletion in pH, electrical conductivity and salinity, are observed in samples of seawater collected off the Indus Delta, Karachi coast, Gwadar coast and Sonmiani Bay. This is indicative of considerable inputs of pollution from industrial and/or domestic waste-drains into the marine environment off these coasts. The mangrove ecosystem is also found to strongly control the δ13CTDIC composition of seawater in the narrow channels of Jiawani Bay, Sonmiani Bay and in the backwaters of semi-closed Manora Channel. INTRODUCTION There is a serious lack of consciousness about marine pollution in Pakistan. Inadequate disposal of untreated industrial effluents and domestic sewage into shallow seawater off large coastal dwellings is a common practice. This has resulted not only in significant degradation of quality of sea-water, but has also affected the biotic life, specifically along the coast of Karachi. Some sporadic surveys, involving use of classical hydro-geochemical and biological techniques, have been made in the past to estimate the pollution along the coast of Pakistan1-
4. Environmental isotopes provide a complementary tool to deduce valuable information about the sources of pollution, as well as distribution and fate of pollutants in the hydrosphere, including the marine environment. Among these, the stable isotopes of carbon have a strong potential for determination of pollution-inventories from domestic and industrial sources (carbon flow) and pollutant-transport in the marine environment7-9. Stable carbon isotope ratios (δ13C per mill PDB) of total dissolved inorganic carbon (TDIC) have been used as potential indicators of seawater-quality off the Karachi coast8. The stable carbon isotope ratios of marine environmental samples are of prime importance, as carbon makes up a dominant part of the marine ecosystem (living environments, marine geological matrix and the domestic and industrial waste matter). The
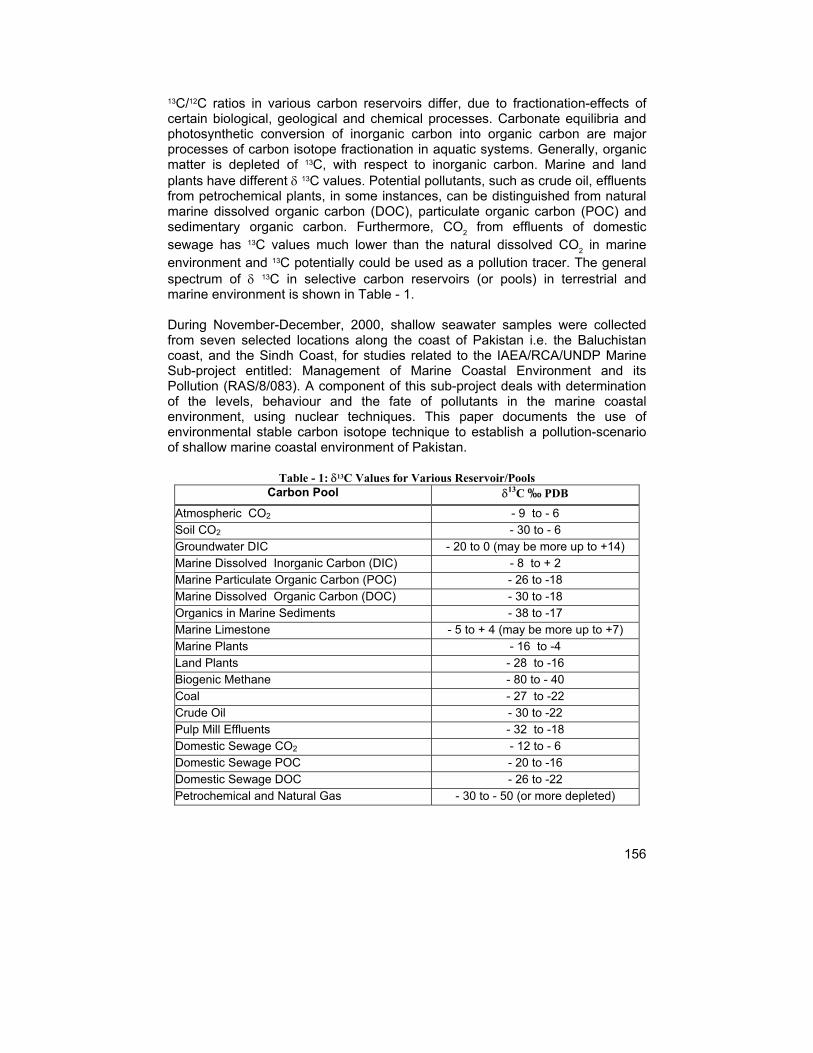
156
13C/12C ratios in various carbon reservoirs differ, due to fractionation-effects of certain biological, geological and chemical processes. Carbonate equilibria and photosynthetic conversion of inorganic carbon into organic carbon are major processes of carbon isotope fractionation in aquatic systems. Generally, organic matter is depleted of 13C, with respect to inorganic carbon. Marine and land plants have different δ 13C values. Potential pollutants, such as crude oil, effluents from petrochemical plants, in some instances, can be distinguished from natural marine dissolved organic carbon (DOC), particulate organic carbon (POC) and sedimentary organic carbon. Furthermore, CO2 from effluents of domestic sewage has 13C values much lower than the natural dissolved CO2 in marine environment and 13C potentially could be used as a pollution tracer. The general spectrum of δ 13C in selective carbon reservoirs (or pools) in terrestrial and marine environment is shown in Table - 1. During November-December, 2000, shallow seawater samples were collected from seven selected locations along the coast of Pakistan i.e. the Baluchistan coast, and the Sindh Coast, for studies related to the IAEA/RCA/UNDP Marine Sub-project entitled: Management of Marine Coastal Environment and its Pollution (RAS/8/083). A component of this sub-project deals with determination of the levels, behaviour and the fate of pollutants in the marine coastal environment, using nuclear techniques. This paper documents the use of environmental stable carbon isotope technique to establish a pollution-scenario of shallow marine coastal environment of Pakistan.
Table - 1: δ13C Values for Various Reservoir/Pools Carbon Pool δ13C ‰ PDB
Atmospheric CO2 - 9 to - 6 Soil CO2 - 30 to - 6 Groundwater DIC - 20 to 0 (may be more up to +14) Marine Dissolved Inorganic Carbon (DIC) - 8 to + 2 Marine Particulate Organic Carbon (POC) - 26 to -18 Marine Dissolved Organic Carbon (DOC) - 30 to -18 Organics in Marine Sediments - 38 to -17 Marine Limestone - 5 to + 4 (may be more up to +7) Marine Plants - 16 to -4 Land Plants - 28 to -16 Biogenic Methane - 80 to - 40 Coal - 27 to -22 Crude Oil - 30 to -22 Pulp Mill Effluents - 32 to -18 Domestic Sewage CO2 - 12 to - 6 Domestic Sewage POC - 20 to -16 Domestic Sewage DOC - 26 to -22 Petrochemical and Natural Gas - 30 to - 50 (or more depleted)

157
DESCRIPTION OF STUDY AREA Pakistan has a coastline of 960 km, bordering the Arabian Sea. It extends from the border of India near Rann of Katch in the South-East to the border of Iran near Jiawani in the North-West (Figure - 1). The Exclusive Economic Zone (EEZ) is about 240,000 sq km. On the basis of its physiographical characteristics, the coastal area of Pakistan is divided into two distinct sections, namely, the Sindh Provincial coast and the Baluchistan Provincial coast (length: ~745 km). The Sindh Provincial Coast mainly includes the Indus River Delta-zone and the Karachi coast. With the exception of the Karachi metropolis (population over 12 millions and industrial base over 1000 large industrial units) along the Sindh coast, most parts of the coastal areas of Pakistan are sparsely inhabited. The entire coast of Baluchistan has small coastal towns and developing harbours, such as Jiawani, Gwadar, Pasni, Ormara and, Sonmiani, which have a total population of about one million. The coastal zone of Pakistan supports both living and non-living resources, which annually contribute towards the national economy. The mangrove ecosystems of the Indus deltaic region, Sonmiani Bay, and Jiawani are also of significant economic as well as scientific interest to Pakistan. The mangrove habitat supports the spawning and breeding grounds of commercially important shrimps as well as for a variety of other fishes. In the absence of an alternative resource, mangroves also serve the underprivileged inhabitants of coastal communities as a valuable source of timber, charcoal and fodder for domestic animals. The environmental pollution issues in the coastal zone of Pakistan have arisen mainly due to indiscriminate discharge of untreated effluents, domestic sewage and solid wastes, as well as agricultural runoff from coastal dwellings into the marine coastal environment. Increasing pollution along the Karachi coast has resulted in considerable thinning of the mangrove forests. The recent incidences of fish-kills off the Karachi coast and Gawadar Bay have been attributed to the growing pollution in shallow marine environment of these coasts9.
Figure – 1: Pakistan’s Coast Harbour Mangroves & Fishing Zones

158
SAMPLING SITES AND FIELD METHODS About 500 ml seawater samples (depth ~ 2 -20 meters) were collected in pre-cleaned and leak-tight plastic bottles. Samples were collected from seven principal coastal locations, namely: Jiawani, Gwadar, Pasni, Ormara, Sonmiani, Karachi and Indus Delta, along the coast of Pakistan during the period Nov.-Dec., 2000 for stable carbon isotope analysis (δ13C) of total dissolved inorganic carbon (TDIC). The samples were immediately spiked with 0.1M HgCl2 solution to avoid additional input of inorganic carbon by bio-mediated decomposition of organic matter in the samples. Samples were collected during the low-tide regime as, in this regime, the polluted river and sewage drains have adequate flow of water towards the sea. The samples were filtered through Whatman-42 and 0.45 micron nitrocellulose filter-paper in the nearby base-camp laboratory within 24 hours. The time for the occurrence of a low or high tide was deduced from the standard Tide Table Guide published by the Pakistan Navy. At some locations, waste drains/polluted rivers were also tapped during the last hour of low tide in the sea and at a suitable location in pre-outfall zone, so as to exclude the influence of high-tide intrusion of seawater in the polluted channel. Physiochemical parameters, such as pH, electrical conductivity and salinity, were measured in-situ. LABORATORY METHODS Stable carbon isotope analysis of total dissolved inorganic carbon (TDIC) in water-samples was determined by gas-source mass spectrometry and using routine sample-preparation methods5,6. Seawater sample (~250 ml) was reacted with 85% pure H3PO4 acid to liberate CO2 gas from TDIC in a vacuum line. The moisture in the evolved CO2 gas was condensed in a U-trap held at -80 oC, using freon-liquid nitrogen slush. Residual moisture in the evolved CO2 gas was condensed in a subsequent U-trap, held at liquid nitrogen temperature (-196 oC). When the reaction was completed, the first U-trap was closed and the temperature of the second U-trap was raised to -80 oC with “freon-liquid nitrogen slush” to evaporate and expand the sample CO2 in the vacuum-line for pressure measurements and to transfer it in a suitable vacuum-tight Pyrex glass ampoule for stable carbon isotope analysis on a modified GD-150 Mass Spectrometer. The stable carbon isotope results are expressed as δ (delta) ‰ (per mil) values relative to the international carbonate standard, namely, PDB (Pee-Dee Belemnite): δ = {( RS - RSt) / RSt} x 1000 where R= 13C/12C ratio, S= unknown sample and St= known standard or reference material. The reproducibility of δ13C measurements was better than 0.05 ‰ PDB for the working standard.
159
RESULTS AND DISCUSSION Unpolluted seawaters have δ13CTDIC values closer to 0 ‰ PDB. Any deviation from this value will signify input of dissolved inorganic carbon from a secondary source. The coast of Baluchistan province is sparsely populated and there are no industrial activities up to now along this coast. However, untreated domestic sewage is drained into the sea from sizable dwellings (developing harbours) along this coast. Table - 2 presents a summary of the measured ranges of physiochemical parameters and δ13CTDIC contents for the marine coastal waters collected off the Baluchistan Coast. δ13CTDIC contents of clean seawater collected off the five coastal locations along Baluchistan coast range between +0.6 to -0.7 ‰ PDB. The positive values of δ13CTDIC are observed in shallow seawater collected off Jiawani Coast and Ormara Coast, whereas the negative values of δ13CTDIC are observed for Gwadar, Pasni and Sonmiani Bay. It is important to note that relatively clean surface seawater samples are collected from approximately 5 - 10 meter bathymetry line and their δ13CTDIC values are closer to typical seawater carbonate alkalinity. In contrast, the shallow seawater samples collected in the nearly inter-tidal zone (depth > 2 meters) of these coasts represent δ13CTDIC contents between -2.6 to -0.6 ‰ PDB. The shift in δ13CTDIC
contents of clean seawater towards more negative values is indicative of input of 13C depleted dissolved inorganic carbon, originated from domestic sewage drained into the sea by the adjacent dwellings along these coasts. It is important to note that relatively more depleted δ13CTDIC contents are observed in the mangrove ecosystem along Sonmiani Coast and Jiawani Coast. The values of δ13CTDIC tend to enrich in the direction of relatively clean seawater as we move out of the mangrove ecosystem. The higher depletions in δ13CTDIC values of seawater in Sonmiani Bay and along Jiwani Coast are thus attributed to the influx of carbon from the adjacent mangrove ecosystem (δ13Cmangrove leaves ~ -26 ‰ PDB). This means that the 13C depleted CO2 is being produced by the decay of mangrove-leaf litter and is then incorporated into the TDIC pool of seawater as HCO3
-1. Further, depletion in 13CTDIC contents of seawater are coupled with decrease in salinity and pH. The salinity is mainly decreased in zones adjacent to coastal dwellings. The coast of Sindh province is heavily populated along the coastal city of Karachi and there are significant industrial activities along this coast. Seawater along Karachi coast thus receives large proportions of untreated domestic and industrial sewage, as well as agricultural run-off, from adjacent dwellings and industrial zones. The Indus River has mostly dried in the delta zone due to tapping of Indus river-water in Tarbela Dam, Headworks on Indus River and due to very little rainfall in the area during past several years. However, the Indus delta Zone has small dwellings and creeks/mangrove ecosystems. Table-3 present a summary of the measured ranges of physiochemical parameters and
160
δ13CTDIC contents for the marine coastal waters collected from selective sites off the Sindh coast (Pakistan). As expected, δ13CTDIC contents of seawater off Karachi coast and in the Indus delta zone are relatively more depleted, as compared to polluted zones along Baluchistan coast. Significantly depleted δ13CTDIC values (as low as -1.7 to -7.3 ‰ PDB) are observed in the Manora Channel/Karachi Harbour area and the Ghizri-Korangi Coastal area along Karachi coast. This is attributed to the large input of domestic waste and industrial waste from Layari River, Malir River and other small polluted drains into sea-environment. Seawaters collected off Korangi coast and Indus Delta along the Sindh Coast represent a decrease in pH by about 0.5 - 1 pH units. The decrease in pH along Korangi coast is attributed to input of mainly untreated industrial-waste waters and partly domestic sewage into the sea. The decrease in pH along Indus Delta is mainly due to influx of relatively low pH waters pertaining to Indus river and sewage from the nearby coastal dwellings/villages. The decrease in pH is also associated with decrease in the values of electrical conductivity and salinity. Further, the Indus delta seawaters are relatively less polluted, as compared to the seawaters off Karachi coast.
Table-2: Summary Of Physiochemical And Stable Carbon Isotope Analysis (CTDIC) In Seawater And Polluted Drains Along Baluchistan Coast (Pakistan)
Physiochemical parameters Stable carbon isotope analysis Coastal location in
Baluchistan Province (n= total samples) [Lat/Long]
pH E.C. (mS)
Salinity(ppt)
δ 13 CTDIC (‰ PDB)
Jiwani (n=7) [N 25-02-61, E 67-44-47 to N25-02-82, E61-44-12]
8.7-8.8 51.4-55.7 41-43 Clean Sea: +0.3 (n=1) Mangrove Zone: -0.4 to -1.9 (n=2) Populated Coast*: -1.4 to -0.6 (n=4)
Gwadar (n=9) [N 25-06-23, E 62-23-53 to N 25-06-81, E62-19-85]
8.1-9.2 52.5-57.1 40-47 Clean Sea: -0.1 (n=1) Polluted Drain: -4.7 (n=1) Populated Coast: -1.8 to -0.9 (n=7)
Pasni (n=5) [N 25-5-65, E 23-28-71 to N 25-16-39, E63-28-71
8.7-8.8 54.4-54.8 41-45 Clean Sea: -0.5 (n=1) Populated Coast: -1.9 to -1.4 (n=4)
Ormara (n=5) [N 25-13-03, E 64-38-25 to N 25-12-19, E64-40-34]
7.9-8.2 55- 56.4 38 -40 Clean Sea: +0.6 (n=1) Populated Coast: -1.1 to -0.6 (n=4)
Sonmiani Bay (n=7) [N 24-48-80, E 66-59-67 to N 25-26-29, E66-31-71]
8.0-8.5 48.4-50.9 37-47 Clean Sea: -0.7 (n=1) Mangrove Zone: -2.2 to -3.7 (n=2) Populated Coast: -2.6 to -1.4 (n=4)

161
CONCLUSIONS In general, this study concludes that: a. Stable carbon-isotope contents of total dissolved inorganic carbon (TDIC)
can be used as a potential indicator of pollution-inputs from domestic and industrial sources, as well as carbon flow into the seawater from domestic and industrial sources, as also from the mangrove ecosystems.
b. The shallow marine environment along the Baluchistan Coast is relatively much less polluted, as compared to the Sindh Coast
c. Ormara Coast is the least polluted marine site of the developed zone along Baluchistan coast.
d. The North-West Coast of Karachi is the least polluted marine site off Karachi city coast
e. The most depleted δ13CTDIC values of seawater in Sonmiani Bay and Jiawani Bay are due to the impact of mangrove ecosystem.
f. Extremely depleted δ13CTDIC values of shallow seawater off the Karachi Coast indicate that Manora Channel and Korangi Creek are the most polluted marine sites off the Pakistan coast. The North-west Coast and the Clifton coast are relatively less polluted coasts.
Table-3: Summary of physiochemical and stable carbon isotope analysis of (TDIC) in
seawater and polluted drains along Sindh coast (Pakistan)
Physiochemical parameters Stable carbon isotope analysis Coastal location in Sindh Province (n= total samples) [Lat/Long]
pH E.C. (mS)
Salinity (ppt)
δ 13 CTDIC (‰ PDB)
Karachi Coast (n=31), [N 24- 47-53, E 66-59-77 to N 24-48-42, E67-17-18] 8.2-8.5 43.7-50.8 28-36 Mangrove Zone: -5.1 to -7.3 (n=2)
Polluted Drain: -3.7 to -6.0 (n=2) Populated Coast*: -6.8 to -1.7 (n=7)
8.0-8.2 50.9-55.6 37-41 Polluted Drain: -2.5 (n=1) Populated Coast: -3.1 to -0.2 (n=6)
7.3-7.9 51.4-55.3 39-41 Polluted Drain: -2.7 (n=1) Populated Coast: -6.6 to -3.0 (n=7)
Manora Channel (n=11) Clifton -Marina Club Coast (n=7) Ghizri-Korangi Coast (n=8) North-west Coast (n=7)
ND* 53.4-55.8 39-40 Clean Sea: +0.4 ** (n=1) Populated Coast: -5.3 to +0.3 (n=6)
Indus Delta (n=6) [N 24-08-41, E 67-26-83 to N24-03-29, E67-41-46]
7.3-8.3 46.6-56.5 32-45 Populated Coast: -2.3 to -1.4 (n=6)
ND = Not Determined * Seawater samples from shallow marine environment opposite coastal dwellings ** Seawater sample off Paradise Point, North West Coast of Karachi

162
REFERENCES
1. Marine Pollution Baseline Survey In The Korangi - Phitti Creek, Pakistan. Final Report of the IUCN Contract NO. OD/CDC/201/IAEA - Pakistan Baseline Survey, Project 9128. Prepared by the IAEA-Marine Environmental Studies Laboratory, International Laboratory of Marine Radioactivity, IAEA Oceanographic Museum, MC 98000, Monaco (November, 1987)
2. S. H. Khan, M. Saleem., (1988) “A preliminary study of pollution in Karachi Harbour”. In: Marine Science of the Arabian Sea. (eds. M. F. Thompson, N. M. Tirmizi) American Institute of Biological Sciences, Washington D. C., PP: 539-547
3. .A. Butt, I. A. Khanzada, S. B. Zafar, A. A. Kazmi, (1994) “Harbour Pollution and its Effects on the Pakistan Navy”. Paper presented at the Environmental Engineering Seminar organized by the National University of Science & Technology (NUST) in collaboration with University Grants Commission (U.G.C.) Islamabad, Pakistan and Michigan State University, U.S.A., 5-12 January, 1994, Islamabad, Pakistan
4. M. Saleem And G. N. Qazi, (1995) “Distribution of Trace Metals in the Sea-water and Surficial Sediment of the Karachi Harbour” Proceeding of “ the Arabian sea, Living Resources & the Environment” University of Karachi, Pakistan., (eds. M. F. Thompson, N. M. Tirmizi), PP: 659 - 666
5. Guidbook on Nuclear Techniques in Hydrology, Technical Report Series No. 91 (1983 Edition), International Atomic Energy Agency (IAEA), Vienna, Austria
6. Environmental Isotopes in Hydrology (1997 Edition), I.D. Clark and P. Fritz (Eds.), Lewis Publishers, New York (ISBN 1-56670-249-6), p. 328
7. Rodelli, M. R., J. N. Gearing, P.J. Gearing, N. Marshall, A. Sasekumar, (1984) “Stable Isotope Ratio as a tracer of Mangrove carbon Malaysia Ecosystems”, Oecologia (Berlin), 61, pp:326-333
8. Application of Isotope Techniques to Investigate Groundwater Pollution, (1998), IAEA TECHDOC-1046, pp: 185-208, International Atomic Energy Agency (IAEA), Vienna, Austria
9. abbani M.M, A. Rehman and C.E. Harms. 1990. Mass mortality of fishes caused by dinoflagellate bloom in Gwadar Bay, southwestern, Pakistan. In: Toxic Marine Phytoplankton. (Eds.): E.Graneli; B, Sundstörm; L, Edler and D.M. Anderson. Elsevier Science Publishing Co., New York. pp. 209-214.
Use of Brackish-Water forAgriculture: Growth of Salt-
Tolerant Plants and their Effectson Soil-Properties
Javed Akhter, Sahfeeq Ahmed and Kauser A. Malik
163
ABSTRACT
A five-years field study was conducted, on a saline sodic soil, to evaluate the effectivenessof biological approach for improvement of salt-affected wasteland, in terms of soil physi-cal, chemical and mineralogical characteristics. Kallar grass (Leptochloa fusca (L) Kunth),being tolerant to salinity, sodicity and alkalinity, was grown for five years, irrigated withsaline under-ground water. The cropping of kallar grass improved appreciably the physical(available water, hydraulic permeability, structural stability, bulk density and porosity), chemi-cal (salinity, pH, Sodium adsorption ratio and organic matter) and mineralogical propertiesof soil within a period of three years. The soil maintained the improved characteristics,with further growth of grass, upto five years. The study confirmed that salt-affected soilscan be improved effectively through biological means, and that growing salt-tolerant plantsis a suitable approach. Kallar grass showed a tremendous potential to improve most of thephysical, chemical and mineralogical properties, without any adverse effects of saline wateron soil- properties.
INTRODUCTION
Salinity of soils and ground-water is a serious soil-degradation problem, which is growingsteadily in many parts of the world, including Pakistan. It is a multi-dimensional problem inseveral countries and has wide macro and micro socio-economic implications. It occursmainly, but not exclusively, in arid and semi-arid regions, low-lying areas and river valleys.Food-production in many parts of the world, particularly in arid and semi-arid regions, isseverely affected due to decrease in area under cultivation, increase in area under salin-ization and decrease in overall productivity of good and fertile soils, as a result of improperirrigation and water-management practices (IAEA, 1995).
Soil salinity is wide-spread in all the countries where the climate is arid to semi-arid andaverage rainfall is less than the evapo-transpiration. Salt-affected soils cover about 10 %of the total dry land-surface of the earth (Szabolcs, 1986). These salt-affected areas aredistributed throughout the world and, unfortunately, no continent is free of salt-affectedsoils. There are large variations in the extent, type of salinity and geo-morphological char-acteristics of salt-affected soils from one region to the other. Since these salt-affectedsoils occur in various forms, both in large areas and in small isolated locations on most ofthe earth’s surface, the knowledge of their extent is understandably incomplete. Based onreliable data, the extent of existing salt-affected soils on our globe is presented in Table-1(Szabolcs, 1986).
USE OF BRACKISH-WATER FOR AGRICULTURE: GROWTHOF SALT-TOLERANT PLANTS AND THEIR EFFECTS ONSOIL-PROPERTIES
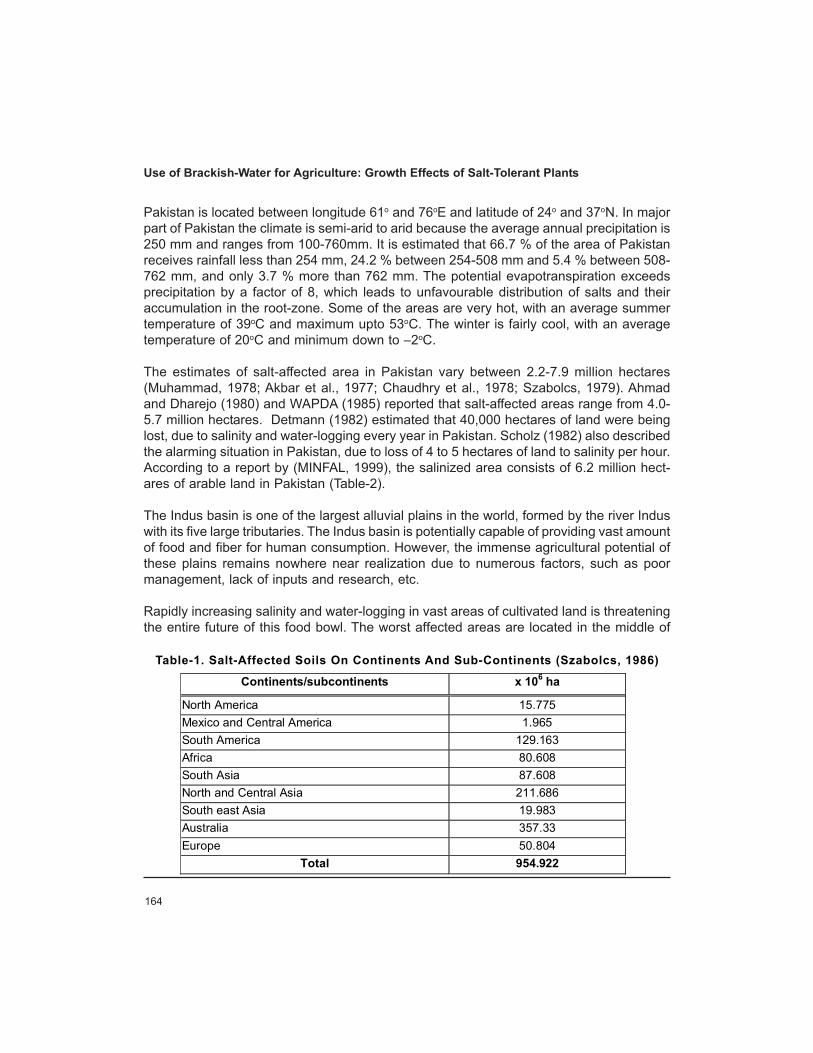
164
Use of Brackish-Water for Agriculture: Growth Effects of Salt-Tolerant Plants
Pakistan is located between longitude 61o and 76oE and latitude of 24o and 37oN. In majorpart of Pakistan the climate is semi-arid to arid because the average annual precipitation is250 mm and ranges from 100-760mm. It is estimated that 66.7 % of the area of Pakistanreceives rainfall less than 254 mm, 24.2 % between 254-508 mm and 5.4 % between 508-762 mm, and only 3.7 % more than 762 mm. The potential evapotranspiration exceedsprecipitation by a factor of 8, which leads to unfavourable distribution of salts and theiraccumulation in the root-zone. Some of the areas are very hot, with an average summertemperature of 39oC and maximum upto 53oC. The winter is fairly cool, with an averagetemperature of 20oC and minimum down to –2oC.
The estimates of salt-affected area in Pakistan vary between 2.2-7.9 million hectares(Muhammad, 1978; Akbar et al., 1977; Chaudhry et al., 1978; Szabolcs, 1979). Ahmadand Dharejo (1980) and WAPDA (1985) reported that salt-affected areas range from 4.0-5.7 million hectares. Detmann (1982) estimated that 40,000 hectares of land were beinglost, due to salinity and water-logging every year in Pakistan. Scholz (1982) also describedthe alarming situation in Pakistan, due to loss of 4 to 5 hectares of land to salinity per hour.According to a report by (MINFAL, 1999), the salinized area consists of 6.2 million hect-ares of arable land in Pakistan (Table-2).
The Indus basin is one of the largest alluvial plains in the world, formed by the river Induswith its five large tributaries. The Indus basin is potentially capable of providing vast amountof food and fiber for human consumption. However, the immense agricultural potential ofthese plains remains nowhere near realization due to numerous factors, such as poormanagement, lack of inputs and research, etc.
Rapidly increasing salinity and water-logging in vast areas of cultivated land is threateningthe entire future of this food bowl. The worst affected areas are located in the middle of
Table-1. Salt-Affected Soils On Continents And Sub-Continents (Szabolcs, 1986)
Continents/subcontinents x 106 ha
North America 15.775 Mexico and Central America 1.965 South America 129.163 Africa 80.608 South Asia 87.608 North and Central Asia 211.686 South east Asia 19.983 Australia 357.33 Europe 50.804
Total 954.922

165
DOABA (areas between two rivers). Under irrigated agriculture, salinity and sodicity occurin patches and area under-surface soil-salinity is 6.2 Mha, out of which 9.7, 19.9, 38.6 and31.8 % area is very slightly, moderately, severely, and very severely, saline, respectively(Table-2). Out of four Provinces, Punjab is severely affected by salinity (43.2 %), followedby Sindh (34.2), Baluchistan (21.8 %), and NWFP (0.8 %). The irrigated plains of Indus-basin possess an extensive ground-water aquifer under 16.2 million hectares (Mha). Out
Table-2: Province-Wise Summary — Extent Of Saline/Sodic SoilsIn Pakistan (Area in 000 ha).
Province Slightly Saline
Moderately Saline
Severely Saline
Very Severely Saline
Total
Punjab 472.4 804.8 738.3 652.0 2667.5 % (17.7) (30.2) (27.7) (24.4) (43.2) Sindh 118.1 324.7 1173.1 493.7 2109.6 % (5.6) (15.4) (55.6) (23.4) (34.2) NWFP 5.2 25.7 8.7 8.9 48.5 % (10.7) (52.9) (18.0) (18.4) (0.8) Baluchistan 3.0 74.6 464.7 805.6 1347.9 (%) (0.2) (5.5) (34.5) (59.8) (21.8) Total 598.7 1229.8 2384.8 1960.2 6173.5 % (9.7) (19.9) (38.6) (31.8) (100.0)
Source: Agricultural statistics of Pakistan, 1999-00
(Area in Million Hectares) Before Monsoon After Monsoon Province Surveyed
Area 0-1.5 m 1.5-3m >3 m 0-1.5m 1.5-3m >3 m 0.065 0.138 0.36 NWFP 0.563 0.057
(10%) 0.113 (20%)
0.393 (70%) (12%) (25%) (64%)
2.806 5.986 Punjab 9.971 0.539 (5%)
2.280 (23%)
7.132 (72%)
1.179 (12%) (28%) (60%)
1.256 1.045 Sind 5.739 0.397 (8%)
3.760 (71%)
1.118 (21%)
3.438 (60%) (22%) (18%) 0.093 0.065 0.239 Baluchistan 0.397 0.041
(10%) 0.198 (49%)
0.162 (41%) (24%) (16%) (60%)
4.775 4.265 7.63 Total 16.67 1.034 (6%)
6.351 (39%)
8.805 (55%) (29%) (26%) (46%)
Source: SCARP Monitoring Organization (1989), Planning Division, WAPDA
Table-3: Water-Table Levels In Pakistan Before/After Monsoon
Javed Akhter, Sahfeeq Ahmed and Kauser A. Malik
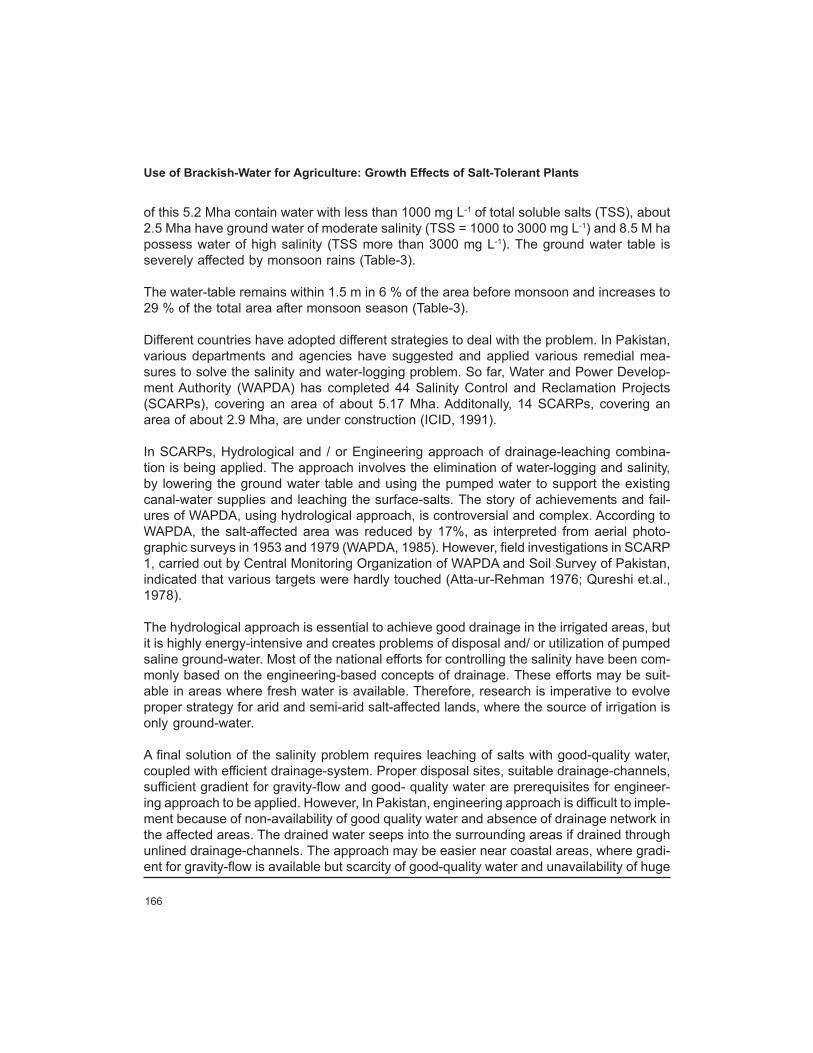
166
of this 5.2 Mha contain water with less than 1000 mg L-1 of total soluble salts (TSS), about2.5 Mha have ground water of moderate salinity (TSS = 1000 to 3000 mg L-1) and 8.5 M hapossess water of high salinity (TSS more than 3000 mg L-1). The ground water table isseverely affected by monsoon rains (Table-3).
The water-table remains within 1.5 m in 6 % of the area before monsoon and increases to29 % of the total area after monsoon season (Table-3).
Different countries have adopted different strategies to deal with the problem. In Pakistan,various departments and agencies have suggested and applied various remedial mea-sures to solve the salinity and water-logging problem. So far, Water and Power Develop-ment Authority (WAPDA) has completed 44 Salinity Control and Reclamation Projects(SCARPs), covering an area of about 5.17 Mha. Additonally, 14 SCARPs, covering anarea of about 2.9 Mha, are under construction (ICID, 1991).
In SCARPs, Hydrological and / or Engineering approach of drainage-leaching combina-tion is being applied. The approach involves the elimination of water-logging and salinity,by lowering the ground water table and using the pumped water to support the existingcanal-water supplies and leaching the surface-salts. The story of achievements and fail-ures of WAPDA, using hydrological approach, is controversial and complex. According toWAPDA, the salt-affected area was reduced by 17%, as interpreted from aerial photo-graphic surveys in 1953 and 1979 (WAPDA, 1985). However, field investigations in SCARP1, carried out by Central Monitoring Organization of WAPDA and Soil Survey of Pakistan,indicated that various targets were hardly touched (Atta-ur-Rehman 1976; Qureshi et.al.,1978).
The hydrological approach is essential to achieve good drainage in the irrigated areas, butit is highly energy-intensive and creates problems of disposal and/ or utilization of pumpedsaline ground-water. Most of the national efforts for controlling the salinity have been com-monly based on the engineering-based concepts of drainage. These efforts may be suit-able in areas where fresh water is available. Therefore, research is imperative to evolveproper strategy for arid and semi-arid salt-affected lands, where the source of irrigation isonly ground-water.
A final solution of the salinity problem requires leaching of salts with good-quality water,coupled with efficient drainage-system. Proper disposal sites, suitable drainage-channels,sufficient gradient for gravity-flow and good- quality water are prerequisites for engineer-ing approach to be applied. However, In Pakistan, engineering approach is difficult to imple-ment because of non-availability of good quality water and absence of drainage network inthe affected areas. The drained water seeps into the surrounding areas if drained throughunlined drainage-channels. The approach may be easier near coastal areas, where gradi-ent for gravity-flow is available but scarcity of good-quality water and unavailability of huge
Use of Brackish-Water for Agriculture: Growth Effects of Salt-Tolerant Plants
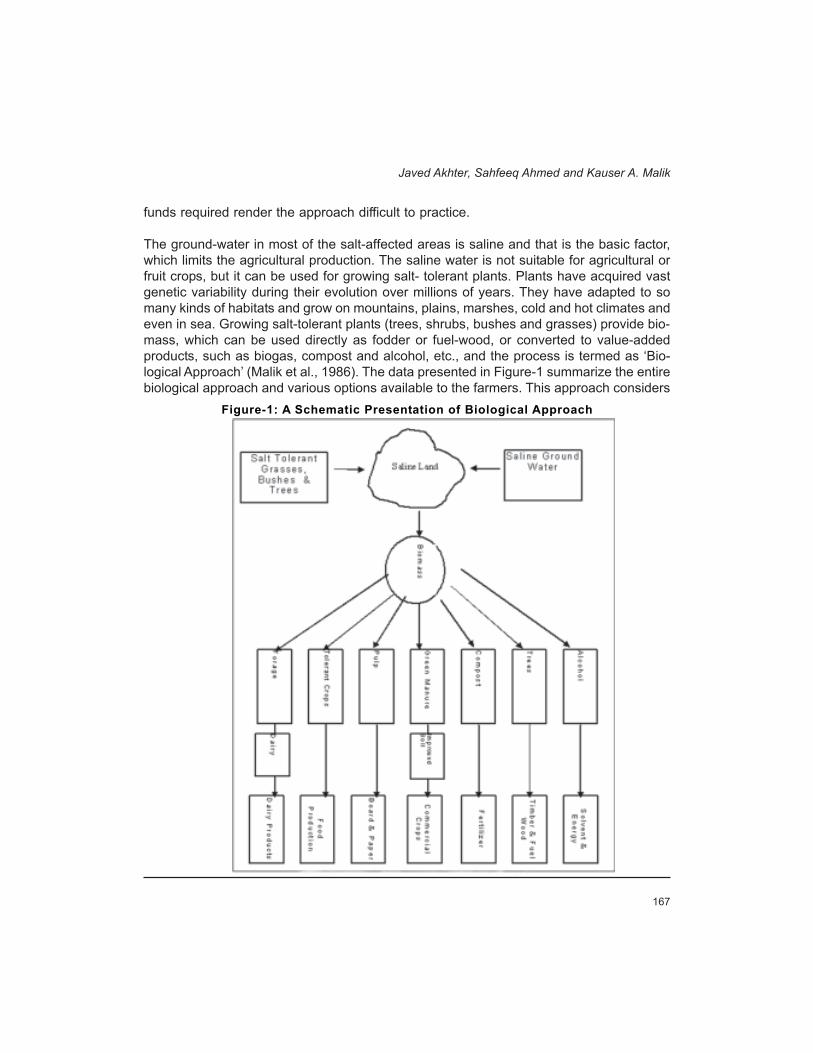
167
funds required render the approach difficult to practice.
The ground-water in most of the salt-affected areas is saline and that is the basic factor,which limits the agricultural production. The saline water is not suitable for agricultural orfruit crops, but it can be used for growing salt- tolerant plants. Plants have acquired vastgenetic variability during their evolution over millions of years. They have adapted to somany kinds of habitats and grow on mountains, plains, marshes, cold and hot climates andeven in sea. Growing salt-tolerant plants (trees, shrubs, bushes and grasses) provide bio-mass, which can be used directly as fodder or fuel-wood, or converted to value-addedproducts, such as biogas, compost and alcohol, etc., and the process is termed as ‘Bio-logical Approach’ (Malik et al., 1986). The data presented in Figure-1 summarize the entirebiological approach and various options available to the farmers. This approach considers
Javed Akhter, Sahfeeq Ahmed and Kauser A. Malik
Figure-1: A Schematic Presentation of Biological Approach
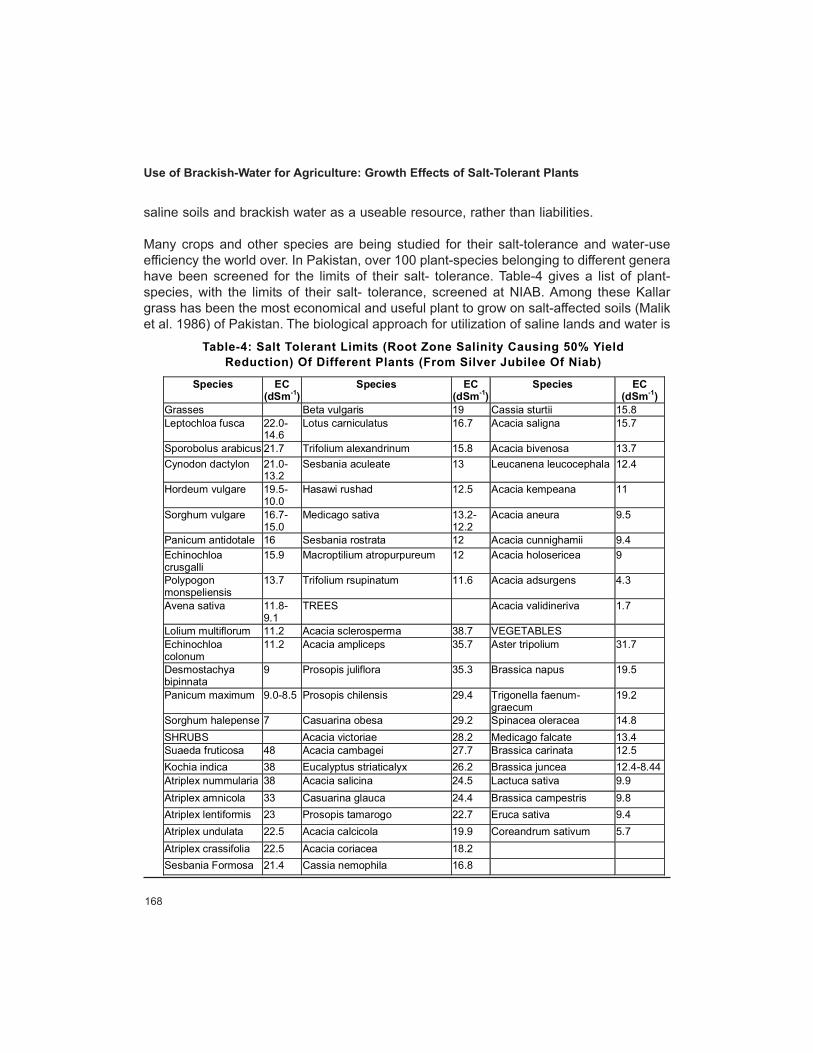
168
saline soils and brackish water as a useable resource, rather than liabilities.
Many crops and other species are being studied for their salt-tolerance and water-useefficiency the world over. In Pakistan, over 100 plant-species belonging to different generahave been screened for the limits of their salt- tolerance. Table-4 gives a list of plant-species, with the limits of their salt- tolerance, screened at NIAB. Among these Kallargrass has been the most economical and useful plant to grow on salt-affected soils (Maliket al. 1986) of Pakistan. The biological approach for utilization of saline lands and water is
Use of Brackish-Water for Agriculture: Growth Effects of Salt-Tolerant Plants
Species EC (dSm-1)
Species EC (dSm-1)
Species EC (dSm-1)
Grasses Beta vulgaris 19 Cassia sturtii 15.8 Leptochloa fusca 22.0-
14.6 Lotus carniculatus 16.7 Acacia saligna 15.7
Sporobolus arabicus 21.7 Trifolium alexandrinum 15.8 Acacia bivenosa 13.7 Cynodon dactylon 21.0-
13.2 Sesbania aculeate 13 Leucanena leucocephala 12.4
Hordeum vulgare 19.5-10.0
Hasawi rushad 12.5 Acacia kempeana 11
Sorghum vulgare 16.7-15.0
Medicago sativa 13.2-12.2
Acacia aneura 9.5
Panicum antidotale 16 Sesbania rostrata 12 Acacia cunnighamii 9.4 Echinochloa crusgalli
15.9 Macroptilium atropurpureum 12 Acacia holosericea 9
Polypogon monspeliensis
13.7 Trifolium rsupinatum 11.6 Acacia adsurgens 4.3
Avena sativa 11.8-9.1
TREES Acacia validineriva 1.7
Lolium multiflorum 11.2 Acacia sclerosperma 38.7 VEGETABLES Echinochloa colonum
11.2 Acacia ampliceps 35.7 Aster tripolium 31.7
Desmostachya bipinnata
9 Prosopis juliflora 35.3 Brassica napus 19.5
Panicum maximum 9.0-8.5 Prosopis chilensis 29.4 Trigonella faenum-graecum
19.2
Sorghum halepense 7 Casuarina obesa 29.2 Spinacea oleracea 14.8 SHRUBS Acacia victoriae 28.2 Medicago falcate 13.4 Suaeda fruticosa 48 Acacia cambagei 27.7 Brassica carinata 12.5 Kochia indica 38 Eucalyptus striaticalyx 26.2 Brassica juncea 12.4-8.44 Atriplex nummularia 38 Acacia salicina 24.5 Lactuca sativa 9.9 Atriplex amnicola 33 Casuarina glauca 24.4 Brassica campestris 9.8 Atriplex lentiformis 23 Prosopis tamarogo 22.7 Eruca sativa 9.4 Atriplex undulata 22.5 Acacia calcicola 19.9 Coreandrum sativum 5.7 Atriplex crassifolia 22.5 Acacia coriacea 18.2 Sesbania Formosa 21.4 Cassia nemophila 16.8
Table-4: Salt Tolerant Limits (Root Zone Salinity Causing 50% YieldReduction) Of Different Plants (From Silver Jubilee Of Niab)
169
not the ultimate answer for tackling the salinity problem, but it does provide an inexpensivealternative to the highly expensive leaching and drainage approach for reclamation of salt-affected soils.
In Pakistan, good-quality water is not available in sufficient quantity for irrigation and leachingof salts down to lower layers. In areas with shallow water table, salts accumulate on thesoil-surface, due to capillary phenomenon. Many of these areas have saline ground-waterthat cannot be used to irrigate economic crops. In the developing countries, no seriousattention has been given to the proper use of brackish ground-water and water flowingthrough the drainage channels. Presence of saline subsurface water poses a threat ofsalinization to fertile soils, but in Pakistan, due to lack of awareness, environmental degra-dation is not taken care of properly. Proper uses of brackish ground-water need to beexplored; growing salt-tolerant plants on salt-affected soils is one such option available.This will increase the agricultural production, which is the backbone of economy in devel-oping countries.
The purpose of this research was to study the physical, chemical and mineralogical changesin a highly saline-sodic soil under biological reclamation. The altering composition of soil-solution was used to explain the changes in selected properties of a highly salt-affectedsoil, in terms of effectiveness and sustainability of the approach over a period of 5 years.
MATERIALS AND METHODS
Five-year field-study was conducted at Biosaline Research Station (BSRS) of Nuclear In-stitute for Agriculture and Biology (Faisalabad), situated near village Dera Chahl, 30 Kmfrom Lahore, Pakistan. The station is located at longitude 74o7 ;E and latitude 31o6 ;N.Average annual rainfall is about 500 mm. At BSRS, model plots have been established todemonstrate the Biological Approach for economic utilization of salt-affected soils, by grow-ing salt- tolerant plants irrigated with brackish ground-water. This station is used as amodel for sustainable development of salt-affected land, using different techniques.
A two-factors factorial experiment was laid out in a Randomized Complete Block Design(RCBD), with three replicates. Eighteen plots of 30 m x 30 m, having similar soil-salinityand texture, were established after a preliminary survey using four-electrode electrical-conductivity probe. Kallar grass was planted on 15 plots, while 3 plots were preserved asa control/fallow. Flood- irrigations of about 75mm were applied at about 50% of soil fieldcapacity, as indicated by neutron-moisture readings. Complete record of irrigation-waterapplied and rainfall was maintained. Kallar grass, being perennial species, was continu-ously grown for five years and 5-7 cuttings were taken per year. Three plots were randomlyselected at the end of each growing season (during November) for soil sampling and tomeasure the required soil physical properties in-situ. Samples for analysis of physical andchemical properties of soil were collected from pre-selected depths of 0-20cm (D1), 40-60
Javed Akhter, Sahfeeq Ahmed and Kauser A. Malik
170
AW(kgkg-1) =Soil moisture at 0.03MPa(FC) - Soil moisture at 1.5MPa(PWP)
cm (D2) and 80-100 cm (D3). These samples were air-dried and ground to pass through 2mm sieve. A saturated soil paste extract was obtained from sub-sample of each soil, usingthe method of US Salinity Laboratory Staff, 1954.
Soil-texture was determined by sedimentation technique, developed by Jennings et al.(1922) as described by Day (1965). The amount of water retained by the soil at differentpressures was measured by ceramic-plate extractor (Soil Moisture Equipment CORP. USA).The amount of AW was calculated by the following formula:
Soil bulk-density was determined in-situ by bulk-density samplers by Blake, (1976) at theend of every growth year. The field-saturated hydraulic permeability was determined, us-ing Guelph permeameter (Model 2800KL, Soil Moisture Equipment CORP. USA) in-situ(Reynold and Elrick, 1985). The stability index (SI) was determined using dry aggregatesof 0.1 g weight and 1-2 mm size (Akhter et al., 1994).
Electrical conductivity (ECe) and pH of saturated paste extracts were determined for eachsample by WTW conductivity meter LF-530 and Corning pH meter 130, respectively. Soilsaturation extracts were analyzed for cations (Na, K, Ca and Mg). Sodium and K weredetermined with flame photometer (Model PFP7 Jenway) (U.S. Salinity Laboratory Staff,1954) and Ca and Mg by titration with ethylene-diamine-tetra-acetate (EDTA). Total carbonand organic carbon were determined by a modified, Walkely-Black method (Nielson andSommers, 1982). Inorganic carbon (Ci) was determined with modified volumetric calcimetricmethod, in which soil was treated with 4N HCl in the presence of FeCl2 in a closed systemand the volume of CO2 released was determined. Organic matter was derived by multiply-ing the organic carbon with 1.72. Mineralogical analysis was carried out with X-ray diffrac-tion (XRD); the patterns were recorded with a Philips PW1710 microprocessor- controlleddiffractometer (Raven, 1990 and Self, 1988).
RESULTS AND DISCUSSION
The soil was highly saline sodic (ECe 22.2 dSm-1; pH 10.4; SAR; 184.5) and non-gypsifer-ous sandy clay loam soil (Table 5). The brackish water (ECe 1.4 dSm-1; SAR 9.6; RSC 9.8meL-1) was used as a main source of irrigation in reclaiming saline sodic soil. Some of theselected soil-properties of control/fallow soil and chemical composition of the irrigationwater used to grow kallar grass are presented in Table-4. The results revealed that thesuccessive cropping of kallar grass for five years, as major treatments used (T1, T2, T3,T4 and T5) had a pronounced effect in improving some physico-chemical and mineralogi-cal properties of soil, as compared with uncropped practice system (To).
The amount of available water (AW) for plants increased (statistically) after growing kallar
Use of Brackish-Water for Agriculture: Growth Effects of Salt-Tolerant Plants

171
grass for 5 years. The cropping of kallar grass over all periods (1-5 year) highly increasedthe AW by 27.5%, as compared to uncropped soil. The maximum increase of 38.6% wasfound with the treatment T4 (after 4 years of cropping), followed by 37.3, 27.51, 19.6 and13.1% after 5, 3, 2 and 1 year, as compared with To. The soil AW was found to be directlyand significantly (p≤0.01) related to the growing time (Figure-2a). The simple linear re-gression (AW = 0.158 + 0.012T) showed an increase rate of 0.012 KgKg-1, (i.e.1.2%) withhighly significant r value of 0.974**(Figure-2a).
The saturated hydraulic permeability (Kfs) of the soil increased at the upper depth D1. Theeffect of cropping-system on the Kfs was highly significant. The maximum Kfs value of 55.6mmd-1 was obtained in T5 and minimum value of 0.35 mmd-1 was found in To. The maxi-mum increase of 159- fold after T5 was followed gradually by 6.1, 25.1, 43.8 and 101.6times with T1, T2, T3 and T4, as compared with Kfs of uncropped plot. The hydraulicpermeability increased in an approximately exponential manner with the growing period ofkallar grass (Figure-2b). The rate of increase of Kfs 0.982 mmd-1 was highly significant at
Javed Akhter, Sahfeeq Ahmed and Kauser A. Malik
Soil Depth (a) Physical Property Unit D1 D2 D3
Sand gKg-1 550 520 570 Silt gKg-1 230 250 250 Clay gKg-1 220 230 180 Textural Class Sandy clay loam KgKg-1 0.155 0.151 0.153 Available Water Bulk density
Mgm-3 1.62 1.73 1.68
Porosity % 38.9 34.6 36.5 Stability index 31.9 18.6 32.6 Hydraulic permeability mmd-1 0.35 0.25 0.44 (b) Chemical Properties Soil IW ECe dSm-1 22 22.2 12.5 1.4 pH 10.4 10.5 10.4 7.6 OM gKg-1 3.3 1.9 1.8 - SAR 184.4 185.2 114.5 7.8 ESP 73 73.1 62.6 - SARadj - - - 19.3 RSC - - - 9.7 D1=0-20 cm, D2=40-60 cm,D3= 80-100 cm, ECe= Electrical conductivity OM= Organic matter, SAR= Sodium adsorption ratio, adj= Adujusted ESP= Exchangeable sodium percentage, RSC= Residual sodium carbonate IW= Irrigation water used.
Table-5: Some Physical And Chemical Properties of UncroppedSoil And Irrigation Water Used (Values Are Means of 3 Replicates)
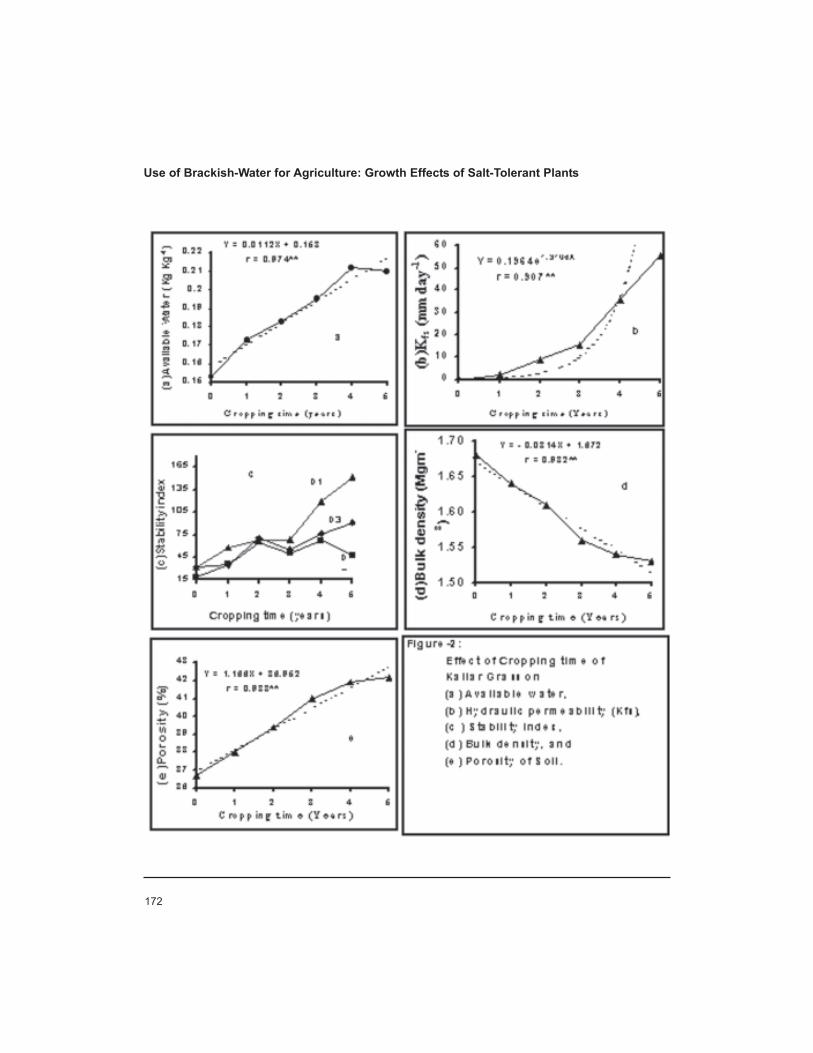
172
Use of Brackish-Water for Agriculture: Growth Effects of Salt-Tolerant Plants

173
p≤0.01 level, with an excellent correlation coefficient (r = 0.969**) with high R2=0.940value.
The soil-stability index (SI) in this study largely increased over all growing seasons (5years) by 154% of control treatment. The maximum increase in SI of 247 % was observedafter 5 years of cultivation, followed by 216, 110, 144 and 54 % over control after 4, 3, 2,and 1 year, respectively. The regression analysis indicated that SI increased linearly andsignificantly (SI = 29.87 + 13.37T) with increase in growing-time (Figure-2c), with a highregression coefficient (b) and high r (0.957**), R2 (0.915). The SI values increased at con-stant rate of 13.36 for each year of agronomical practices tested.
The soil bulk-density (BD) significantly decreased in all cropping treatments (Ts) used, ascompared to BD, of To. The application of biological approach for 5 years showed a linearreduction in BD with high r value (0.982**), R2 value of 0.964. The 96.4% BD reductionshown by regression-model resulted due to increase of cropping period. The effect ofgrowing-period of kallar grass on soil porosity was highly significant (Figure-2d): the maxi-mum increase 15.0% in porosity of the soil occurred after 5 year followed by 14.2, 11.7,7.4, and 3.5% at T4, T3, T2 and T1 over To, respectively. The soil porosity increased in aproportional pattern by increasing the growing period (Figure-2e). The increasing rate ofsoil porosity (average of 1.166 %year-1) was highly significant with an excellent value ofr=0.983** (p≤0.01).
The soil salinity (ECe) significantly (p≤0.05) decreased after growing kallar-grass for fiveyears. The cropping periods over all years significantly reduced the soil ECe by 71.4 %over To. The maximum reduction of 87.3% was observed in T5, followed by 79.9, 83.6,64.6 and 41.8 % reduction after 4, 3, 2 and 1 year in T4, T3, T2 and T1, respectively, ascompared with To. The regression analysis showed that ECe exponentially (lnECe = 2.783- 0.408T) decreased with growing time of kallar grass (Figure-3a), with highly significantregression coefficient (b) and high correlation coefficient (r =0.958** at p≤0.01) and coef-ficient of determination (R2=0.918). The ECe decreased at a constant rate of 0.408 unit(dSm-1) per year of growing kallar grass. The 91.7% of ECe reduction resulted because ofincrease of cropping time.
Soil pH statistically decreased in all treatments tested by cropping kallar- grass, as com-pared to soil pH of uncropped plots. The maximum decrease of 14.4 % in pH of soil wasobserved after 5 years, compared with To. The cultivation of kallar grass had a significantlinear effect (r = 0.854* at p≤0.05) on pH with a decrease rate of 0.229 unit for each year ofgrowing kallar grass (Figure-3b). The soil pH differed significantly at different depths of thesoil-profile. As a general pattern, the soil pH gradually increased with increase in soil depth.The highest reduction of 2.5% in soil pH was recorded in upper soil-depth D1, as com-pared with soil reaction at the deeper depth D2 (Figure-3b).
Javed Akhter, Sahfeeq Ahmed and Kauser A. Malik
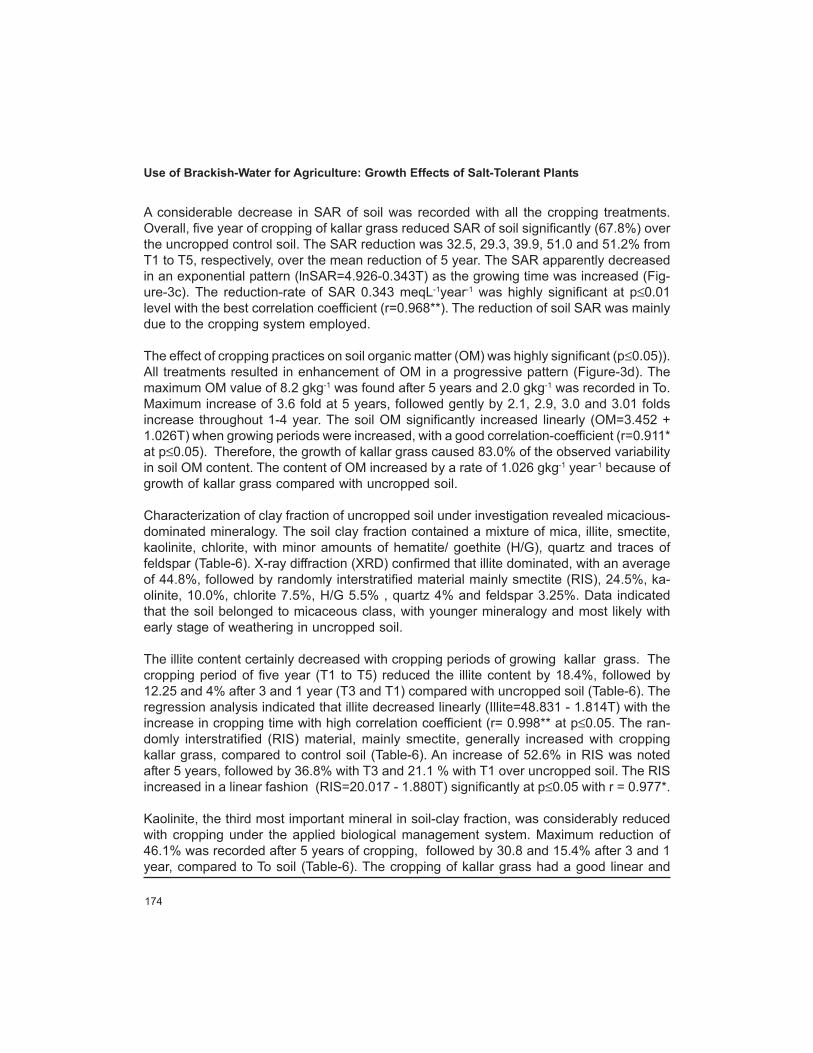
174
A considerable decrease in SAR of soil was recorded with all the cropping treatments.Overall, five year of cropping of kallar grass reduced SAR of soil significantly (67.8%) overthe uncropped control soil. The SAR reduction was 32.5, 29.3, 39.9, 51.0 and 51.2% fromT1 to T5, respectively, over the mean reduction of 5 year. The SAR apparently decreasedin an exponential pattern (lnSAR=4.926-0.343T) as the growing time was increased (Fig-ure-3c). The reduction-rate of SAR 0.343 meqL-1year-1 was highly significant at p≤0.01level with the best correlation coefficient (r=0.968**). The reduction of soil SAR was mainlydue to the cropping system employed.
The effect of cropping practices on soil organic matter (OM) was highly significant (p≤0.05)).All treatments resulted in enhancement of OM in a progressive pattern (Figure-3d). Themaximum OM value of 8.2 gkg-1 was found after 5 years and 2.0 gkg-1 was recorded in To.Maximum increase of 3.6 fold at 5 years, followed gently by 2.1, 2.9, 3.0 and 3.01 foldsincrease throughout 1-4 year. The soil OM significantly increased linearly (OM=3.452 +1.026T) when growing periods were increased, with a good correlation-coefficient (r=0.911*at p≤0.05). Therefore, the growth of kallar grass caused 83.0% of the observed variabilityin soil OM content. The content of OM increased by a rate of 1.026 gkg-1 year-1 because ofgrowth of kallar grass compared with uncropped soil.
Characterization of clay fraction of uncropped soil under investigation revealed micacious-dominated mineralogy. The soil clay fraction contained a mixture of mica, illite, smectite,kaolinite, chlorite, with minor amounts of hematite/ goethite (H/G), quartz and traces offeldspar (Table-6). X-ray diffraction (XRD) confirmed that illite dominated, with an averageof 44.8%, followed by randomly interstratified material mainly smectite (RIS), 24.5%, ka-olinite, 10.0%, chlorite 7.5%, H/G 5.5% , quartz 4% and feldspar 3.25%. Data indicatedthat the soil belonged to micaceous class, with younger mineralogy and most likely withearly stage of weathering in uncropped soil.
The illite content certainly decreased with cropping periods of growing kallar grass. Thecropping period of five year (T1 to T5) reduced the illite content by 18.4%, followed by12.25 and 4% after 3 and 1 year (T3 and T1) compared with uncropped soil (Table-6). Theregression analysis indicated that illite decreased linearly (Illite=48.831 - 1.814T) with theincrease in cropping time with high correlation coefficient (r= 0.998** at p≤0.05. The ran-domly interstratified (RIS) material, mainly smectite, generally increased with croppingkallar grass, compared to control soil (Table-6). An increase of 52.6% in RIS was notedafter 5 years, followed by 36.8% with T3 and 21.1 % with T1 over uncropped soil. The RISincreased in a linear fashion (RIS=20.017 - 1.880T) significantly at p≤0.05 with r = 0.977*.
Kaolinite, the third most important mineral in soil-clay fraction, was considerably reducedwith cropping under the applied biological management system. Maximum reduction of46.1% was recorded after 5 years of cropping, followed by 30.8 and 15.4% after 3 and 1year, compared to To soil (Table-6). The cropping of kallar grass had a good linear and
Use of Brackish-Water for Agriculture: Growth Effects of Salt-Tolerant Plants
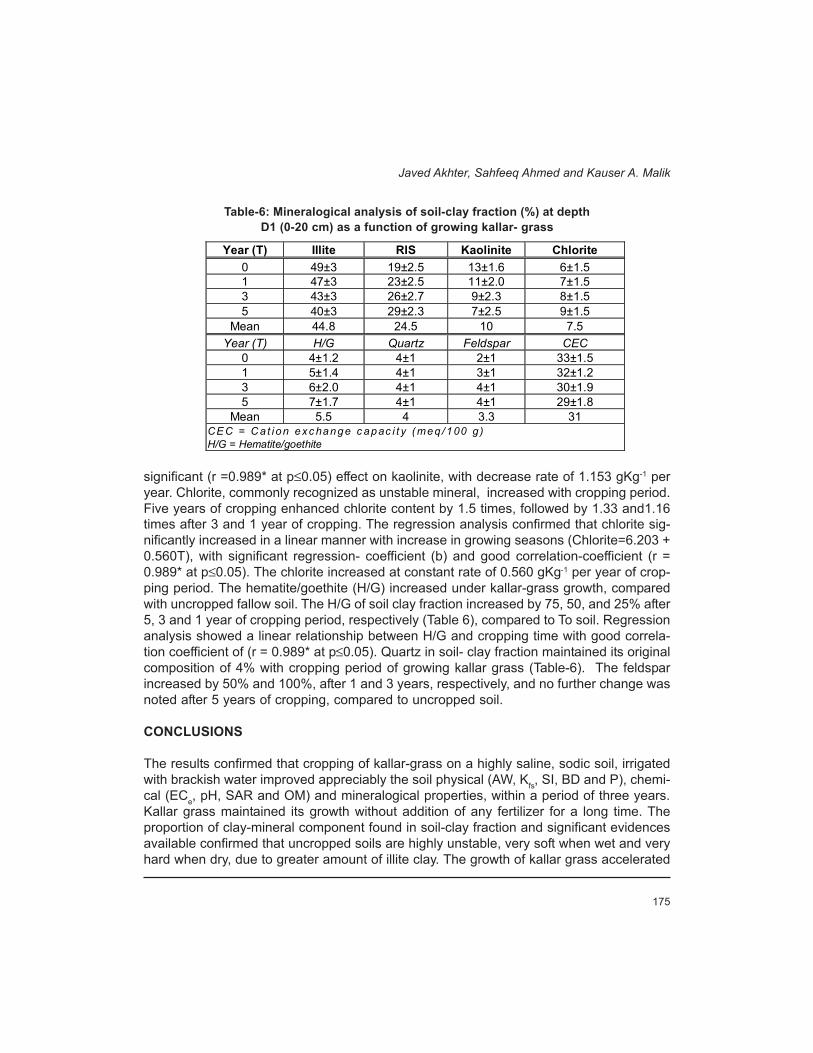
175
significant (r =0.989* at p≤0.05) effect on kaolinite, with decrease rate of 1.153 gKg-1 peryear. Chlorite, commonly recognized as unstable mineral, increased with cropping period.Five years of cropping enhanced chlorite content by 1.5 times, followed by 1.33 and1.16times after 3 and 1 year of cropping. The regression analysis confirmed that chlorite sig-nificantly increased in a linear manner with increase in growing seasons (Chlorite=6.203 +0.560T), with significant regression- coefficient (b) and good correlation-coefficient (r =0.989* at p≤0.05). The chlorite increased at constant rate of 0.560 gKg-1 per year of crop-ping period. The hematite/goethite (H/G) increased under kallar-grass growth, comparedwith uncropped fallow soil. The H/G of soil clay fraction increased by 75, 50, and 25% after5, 3 and 1 year of cropping period, respectively (Table 6), compared to To soil. Regressionanalysis showed a linear relationship between H/G and cropping time with good correla-tion coefficient of (r = 0.989* at p≤0.05). Quartz in soil- clay fraction maintained its originalcomposition of 4% with cropping period of growing kallar grass (Table-6). The feldsparincreased by 50% and 100%, after 1 and 3 years, respectively, and no further change wasnoted after 5 years of cropping, compared to uncropped soil.
CONCLUSIONS
The results confirmed that cropping of kallar-grass on a highly saline, sodic soil, irrigatedwith brackish water improved appreciably the soil physical (AW, Kfs, SI, BD and P), chemi-cal (ECe, pH, SAR and OM) and mineralogical properties, within a period of three years.Kallar grass maintained its growth without addition of any fertilizer for a long time. Theproportion of clay-mineral component found in soil-clay fraction and significant evidencesavailable confirmed that uncropped soils are highly unstable, very soft when wet and veryhard when dry, due to greater amount of illite clay. The growth of kallar grass accelerated
Javed Akhter, Sahfeeq Ahmed and Kauser A. Malik
Table-6: Mineralogical analysis of soil-clay fraction (%) at depthD1 (0-20 cm) as a function of growing kallar- grass
Year (T) Illite RIS Kaolinite Chlorite 0 49±3 19±2.5 13±1.6 6±1.5 1 47±3 23±2.5 11±2.0 7±1.5 3 43±3 26±2.7 9±2.3 8±1.5 5 40±3 29±2.3 7±2.5 9±1.5
Mean 44.8 24.5 10 7.5 Year (T) H/G Quartz Feldspar CEC
0 4±1.2 4±1 2±1 33±1.5 1 5±1.4 4±1 3±1 32±1.2 3 6±2.0 4±1 4±1 30±1.9 5 7±1.7 4±1 4±1 29±1.8
Mean 5.5 4 3.3 31 CE C = C a t i on exc hange c apac i t y ( meq / 100 g ) H/G = Hematite/goethite

176
the rate of weathering, with transformation of mica to 2:1 expansible clay, and the soilattained an appreciable improvement in soil-aggregate stability, hydraulic permeability,available water, soil-porosity or bulk density, due to increase in organic matter and leach-ing of soluble ions from the surface to lower depths.
The soil maintained the improved characteristics with further growth of grass upto fiveyears. The results confirmed the sustainability of biological approach i.e. amelioration ofsaline lands by growing salt-tolerant plant species with brackish under-ground water.
REFERENCES
– Ahmed, R. and Dharego, M.S. 1980. Reclamation of salt-affected soils. Bull. Irrigation, Drainageand Flood Control Research Council of Pakistan, 10:46-59.
– Akbar, M., Shakoor, A. and Sajjad, M.S. 1977. Prospects of breeding for salt tolerance in rice. In:
Use of Brackish-Water for Agriculture: Growth Effects of Salt-Tolerant Plants

177
Muhammad, A., Askel, R. and Brostel, R.C.(Eds.), Genetic Diversity in plants. Plenum Press,New York, 291-299 pp.
– Akhter, J., Malik, K.A., Naqvi, M.H., Ahmad, S. and Murray, R. 1994. Aggregate stability of asaline sodic soil under irrigated kallar grass Faisalabad, Pakistan. Geol. Bull. Punjab Univ., 29:53-64.
– Atta-ur-rehman, C. 1976. Review of control of water-logging and salinity through SCARPs andneed for long term planning. Bull. of Irrigation Drainage and Flood control Research Council ofPakistan, 6:30-47.
– Braunauer, S.P., Emmett, H. and Teller, E. 1938. Adsorption of gases in multimolecular layers. J.Am. Chem. Soc., 60:309-319.
– Chaudhry, M.B., Alim, M. and Rafiq, M. 1978. Nature and magnitude of saline and drainageproblem in relation to agricultural development in Pakistan. Pak. J. For., 28:70-92.
– Day, P.R. 1965. Particle fractionation and particle size analysis. In: Black, C.A. (Ed.). Method ofSoil Analysis, Part, 1, Physical and mineralogical properties, including statistics of measurementand sampling. Am. Soc. Agron., Madison, Wisconson, USA, 547-567 pp.
– Detmann, K. 1982. Signs of decay in Pakistan agriculture, loss of cultivated land and deteriora-tion of social structure in irrigated areas of Punjab. In: MenSchuz, H. (Ed.), Problems of manage-ment of irrigated lands in areas of traditional and modren cultivation. Hamburg, 133-148.
– International Atomic Energy Agency (IAEA), 1995. Management strategies to utilize salt-affectedsoils. IAEA-TECDOC-814, Vienna.
– International Commission on Irrigation and Drainage (ICID), 1991. Irrigation and drainagedevelopement in Pakistan. Asia year country report. Lahore, Pakistan.
– Jennings, D.S., Thomas, M.D. and Gardner, W. 1922. A new method of mechanical analysis ofsoils. Soil Sci., 14:485-499.
– Malik, K. A., Aslam, Z. and Naqvi, M. 1986. Kallar grass. A plant for saline land. Ghulam AliPrinters, Lahore, Pakistan, 93 pp.
– MINFAL (2000) Agricultural statistics of Pakistan (1999-00). Ministry of Food, Agriculture andLivestock. Goveronment of Pakistan, Islamabad, 302pp.
– Muhammad, S. 1978. Salt-affected soils of Pakistan. In: Proc. of Workshop/seminar on mem-brane biophysics and developement of salt tolerance in plants. March, 11-21. Univ. Agri.Faisalabad, Pakistan, 47-64 pp.
– Nelson, D.W. and Sommers, L.E. 1982. Total carbon, organic carbon and organic matter. In:Black, C.A. (Ed) Methods of soil analysis. Part 2. Chemical and microbiological properties, Sec-ond Ed. Agron. 9. ASA and SSSA. Madison. Wisconsin, USA, 539-579 pp.
– Quirk, J.P. 1955. Significance of surface areas calculated from water vapor sorption isothermsby use of B.E.T. equation. Soil Sci., 80:423-430.
– Qureshi, R.H., Sandhu, G.R. and Bhatti, H.M. 1978. Comments on the National strategy forcontrol of water-logging and salinity in Pakistan; PARC sponsored Workshop on water-loggingand salinity, May 2-4, NIAB, Faisalabad, (Unpublished).
– Raven, M.D. (1990). Xplot-version 3-user manual, manipulation of powder X-ray diffraction data.CSIRO Division of Soils Tech. Mem. No. 24/1990. 26 pp.
– Reynolds, W.D. and Elrick, D.E. 1985. In-situ measurement of field-saturated hydraulic conduc-tivity, sorptivity and alpha parameter. Soil Sci., 140:292-302.
– Scholz, F. 1982. Punjab In:Dierche weltraums Atlas textband. Braunschweig. 241-242 pp.
Javed Akhter, Sahfeeq Ahmed and Kauser A. Malik

178
– Self, P.G. 1988. User manual, PC based system for the control of a Philips PW1710X-ray diffrac-tion system. CSIRO Division of Soils Tech. Mem. No. 41/1988. 31 pp.
– Szabolcs, I. 1979. Review of Research on Salt-affected soils. Natural Resources Research XV,UNESCO, Paris, 137 pp.
– Szabolcs, I. 1986. Agronomical and ecological impact on soil and water salinity. In: Stewart, B.A.(Ed.), Advances of soil science volume 4. Springer-verlag, Newyork, 188-218 pp.
– U.S. Salinity Laboratory Staff. 1954. Saline and alkali soils. USDA, Agric. Hand book No. 60. U.S.Govt. Print. Office, Washington, DC.
– Water and Power development Authority (WAPDA), 1985. Position paper on water-logging andsalinity. Planning and development Division, Govt. of Pakistan, 27 pp.
Use of Brackish-Water for Agriculture: Growth Effects of Salt-Tolerant Plants

Some Interesting Aspects ofWater, with Special Reference
to Nuclear Desalination
Inam-ur-Rahman
179
ABSTRACT
A brief review is given of the formation, importance, resources and some uniquecharacteristics of water. A reference has been made about the available water-resourcesof Pakistan and the urgent need of acquiring additional water-resources in the country.Importance of water for energy-production and energy for acquiring additional water-resources is mentioned.
Attractive features and feasibility of nuclear desalination, using dual-purpose nuclear powerplants are discussed. Criteria for selection of suitable reactor-type and desalination processare discussed for desired water-to-power ratios. The world-wide growth of desalination-capacity, using various desalination- processes is listed.
INTRODUCTION
Some verses from the Holy Quran about water are worth considering here:
……………We made from water every living thing.[Sura Anbiyaa(21:30)]
............. The companions of the fire will call to the companions of the garden. “Pour downto us water or anything that God doth provide for your sustenance”. They will say: “Boththese things hath God forbidden to those who rejected Him”.
[Sura Araf(7:50)]
............. And further, thou seest the earth barren and lifeless, but when We pour downwater on it, it is stirred (to life), it swells, and it puts forth every kind of beautiful growth.
[Sura Hajj (22 :5)]
............. The son replied: “I will betake myself to some mountain. It will save me from thewater”. Noah said: “This day nothing can save from the command of God, any but thoseon whom He hath mercy.
[Sura Hud (11:43)]
SOME INTERESTING ASPECTS OF WATER, WITH SPECIALREFERENCE TO NUCLEAR DESALINATION
180
Some Interesting Aspects of Water, with Special Reference to Nuclear Desalination
FORMATION AND DISTRIBUTION OF WATER
This is part of the question how the earth was formed. The materials that make up theearth included plenty of oxygen and hydrogen. As the earth cooled and became solid,these elements combined to form water. The water so formed was trapped in rocks andwas released slowly, to fill up the depressions now forming the oceans.
Distribution:
About 70% of the earth’s surface is covered with water. The total quantity in the oceans,ice caps, rivers, lakes, underground and atmosphere is estimated to be around 1.4 billioncubic kilometers. The break-up is as follows:
Oceans and inland seas ............... ~ 97.21%
Ice-caps and glaciers ................... ~ 2.16%
Surface and underground ............ ~ 0.63%
Atmosphere ................................. ~ 0.001%Total =100%
IMPORTANCE AND REQUIREMENTS OF WATER
No living things (i.e. zoological and botanical) can survive without water, except perhapsthe computer viruses!
Great civilizations had their beginnings where water-supplies used to be plentiful, andhad fallen when these supplies disappeared. As water is essential for life, there havebeen instances where people have killed one another for a glass of water!
5 per cent of the land contains half the population of the world, due to uneven distributionof water.
There is as much water on earth today as there ever was and ever will be. The samewater that was dirty is purified by the great water-cycle, over and over again, even sincethe formation of the water body. If the rain fell uniformly all over the earth, it would receive26 inches a year. Every glass of water that we drink contains water-molecules that hadbeen used countless times before. Part of the water that you used today might have beenused by Pharaoh or perhaps Adam thousands of years ago!

181
For a balanced diet and reasonable living, more than 2000 gallons is required per personper day:
Diet....................................... ~2000 gallonsDomestic & Industrial................ ~200 gallons
As the total usable quantity of water is fixed and the population is increasing, additionalwater-resources are needed for about 80 million people added annually in the existingworld-population.
SOME SPECIAL CHARACTERISTICS OF WATER
Water has greatest solubility for most of the impurities —— it dissolves the impurities anddirt, purifies/cleans everything and becomes polluted, to be purified by the water-cycle. Itis said that water cleans the body, just as prayers and repentance purifies the soul!
The specific heat of water is one of the highest. This helps in maintaining the temperatureof all living beings at a manageable level. If the specific heat of water was low, like metals,the blood would have been boiling due to absorption of 2.5 million calories daily produceddue to our diet.
Water-density is highest at 4°C and decreases as temperature falls down or goes up.This is responsible for preserving aquatic life in the coldest ocean.
Very high values of heat of vaporization (540 calories) and heat of fusion (80 calories) areresponsible for prevention of floods and water-losses due to vaporization.
WATER FOR ENERGY AND ENERGY FOR WATER!
Energy is essential for economic development of a country. As a matter of fact, per-capitaenergy-consumption is the best index to gauge the standard of living of a country. Most ofthe existing energy- sources would not have been possible, without water.
On the other hand, for production of fresh water from oceans, large inputs of energy arerequired. Additional water-resources from more than 99% of the untapped water (Oceans& Ice-caps) have become absolutely necessary, keeping in view the increasing world-population and pollution of the existing water resources.
Let us review the variety of ways in which water becomes the source of energy. In the nextsection on nuclear desalination, the use of energy for production of fresh water will bediscussed. Besides, energy is needed for separation of hydrogen & deuterium, which arethe sources of chemical and nuclear energy.
Inam-ur-Rahman

182
Energy Due To Water Movement
• Hydro Energy• Tidal Energy• Wave Energy
Energy Due to Chemical & Nuclear Reactions
• Hydrogen Energy(chemical reaction, based on combustion of hydrogen)
• Fusion Energy(nuclear reaction, involving D-D reaction)
Miscellaneous Uses of Water in Energy-Production
Water is used as an essential item for electrical energy-production as a conversion mediumin conventional and nuclear power plants. In nuclear power plants, water is also used asa coolant, moderator and shielding material.
Geothermal energy cannot be utilized, effectively, without water. A geothermal power stationutilizes the high-temperature, high-pressure steam, on lines similar to the fossil and nuclearpower plants.
NEED FOR WATER-RESOURCE PLANNING FOR PAKISTAN
Keeping in view the increasing population and diminishing water-resources (due topollution, scarce rainfalls, decreasing river-discharges, silting in rivers and dams) additionalwater resources are required. In Terbella alone, silting is estimated at a rate of 6 lacs tonsdaily ——— this would require 50 thousand trucks daily to remove the silt. Water-resourceplanning is extremely necessary and deserves top priority. This is obvious from the followingdata:
Total water available in Pakistan = 142 maf(1 maf = 3.26x10¹¹ U.S. gallons)
Total water utilized annually = 65 maf(the balance is discharged to the ocean, evaporated, polluted or wasted)
Some Interesting Aspects of Water, with Special Reference to Nuclear Desalination
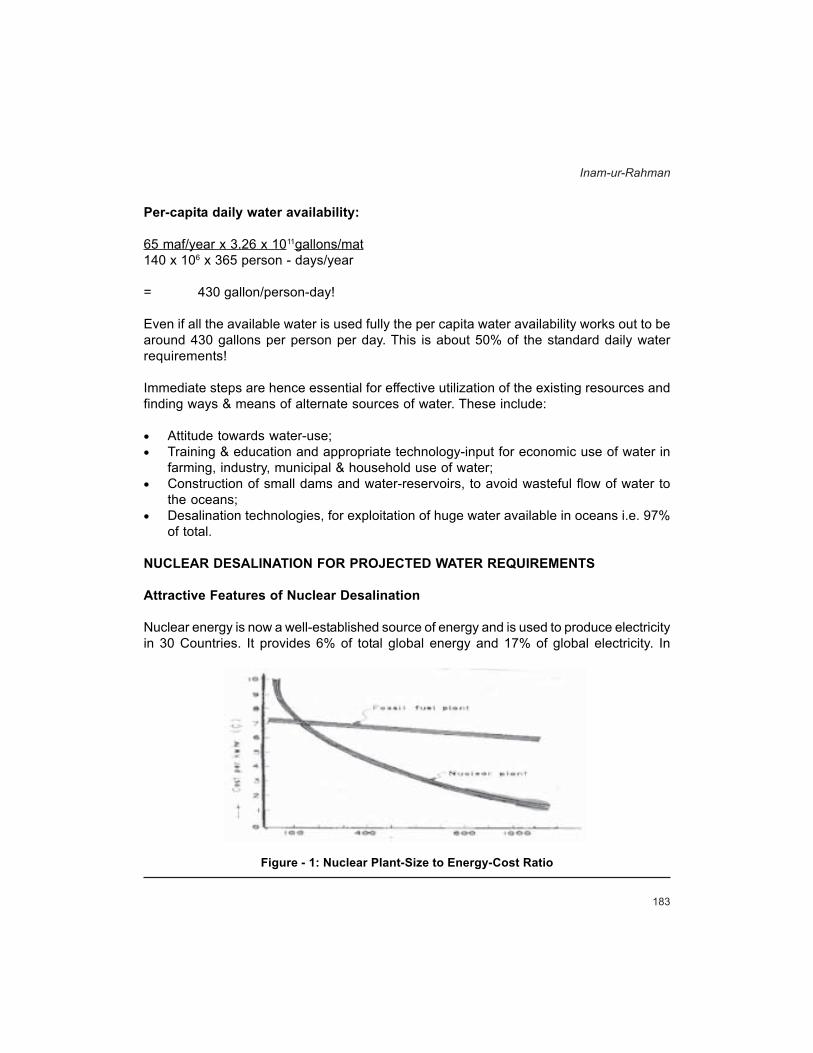
183
Per-capita daily water availability:
65 maf/year x 3.26 x 10¹¹gallons/mat140 x 106 x 365 person - days/year
= 430 gallon/person-day!
Even if all the available water is used fully the per capita water availability works out to bearound 430 gallons per person per day. This is about 50% of the standard daily waterrequirements!
Immediate steps are hence essential for effective utilization of the existing resources andfinding ways & means of alternate sources of water. These include:
• Attitude towards water-use;• Training & education and appropriate technology-input for economic use of water in
farming, industry, municipal & household use of water;• Construction of small dams and water-reservoirs, to avoid wasteful flow of water to
the oceans;• Desalination technologies, for exploitation of huge water available in oceans i.e. 97%
of total.
NUCLEAR DESALINATION FOR PROJECTED WATER REQUIREMENTS
Attractive Features of Nuclear Desalination
Nuclear energy is now a well-established source of energy and is used to produce electricityin 30 Countries. It provides 6% of total global energy and 17% of global electricity. In
Figure - 1: Nuclear Plant-Size to Energy-Cost Ratio
Inam-ur-Rahman

184
some countries, more than 70% of electrical energy is nuclear. At the end of the year2000, 439 nuclear power reactors with a total capacity of 352 Gwe were in operation.Total capacity of nuclear reactors used for co-generation of hot water/steam for districtheating, seawater desalination and other industrial processes is about 5 GWth. The firstpaper regarding the feasibility of using nuclear energy for distilling seawater by R.P.Hammond of ORNL, U.S.A. appeared in 1962 (“Large scale reactors may distill sea watereconomically” Nucleonics 20 (12):45-49, 1962). Various reasons put forward in the paperare summarized here:
1. Nuclear energy cost (unlike conventional energy cost) is very sensitive to the plantsize. Larger the nuclear power plant, lower is the cost per kwhr. Hence if energy andwater requirements of a region are pooled together, the plant-size will become larger,reducing thereby the cost of electricity, as well as water. This is shown in Figure - 1.
2. Nuclear power plants have relatively lower thermal efficiency, as compared toconventional power plants. Hence, for the same electrical energy output, the nuclearpower plant will have larger amount of waste-heat for dumping in oceans and rivers.
3. While high-quality steam is required to produce electrical energy, lower-quality steamis needed for desalination. At present, the maximum brine temperature used fordesalination is about 250°F. At higher temperature, the formation of scale and corrosionof heat-transfer surfaces drastically reduce the distillation-plant efficiency. Most of theresidual steam rejected by the turbine can thus, be used for desalination purposes.
Figure - 2: Thermal Energy Requirements for Three Plants UsingWater-Cooled Reactors
Some Interesting Aspects of Water, with Special Reference to Nuclear Desalination
1025
700
1250
0
200
400
600
800
1000
1200
1400
100 MGD Water OnlyPlant
200 MWе Power OnlyPlant
100 MGD 200 MWеDual Purpose Plant

185
The usefulness of a dual-purpose plant can be illustrated by considering three separateplants i.e. a 100 MOD water-only plant; a 200 MWe power-only plant; and a dual-purposeplant producing 100 MOD and 200 Mwe. The dual-purpose plant would need about 40%less energy, as compared to the two single-purpose plant. See Figure - 2.
Some other considerations for dual-purpose nuclear plants are listed here:a) Site-selection for a dual-purpose plant involves more work and studies, as compared
to a single-purpose water or power-only plant. Things like availability of raw feed-water, disposal/management of concentrated brine, storage and conveyance-cost ofproduct water should be considered while making selection of the site.
b) Selection of the nuclear reactor type is strongly dependent on applications of thereactor. For heat-applications, specific temperature-requirements vary greatly. Theyrange from about 100oC for desalination to 1000°C for production of hydrogen. High-temperature reactors (Gas- cooled Reactors) would yield higher power-to-water ratio,while medium-temperature reactors (pressurized water reactors) would give higherwater-to-power ratio.
Revival of interest in the use of nuclear energy for desalination (besides economicfactors) is also due to conservation of fossil fuels and protection of environment,
VARIOUS DESALINATION TECHNOLOGIES
The desalination technologies that are commonly used in various plants operating in theworld are mainly.
Table -1: Some Salient Characteristics of Commercial Desalination Process Characteristics Process Possible
Unit Size m3/d
Limiting factor
Experience Available
Maintenance Requirement
Energy Consumption
Top brine Temperature °C
MSF Present Future
50,000 75,000 ?
Vacuum System
Highest Low High? (thermal)
85-130
MED Present Future
20,000 30,000
Plant Reliability
High Low Medium ? (thermal)
55-130
RO Present Future
10,000 15,000 (small-large)
Pumps Medium High Low (electrical)
Ambient
Inam-ur-Rahman
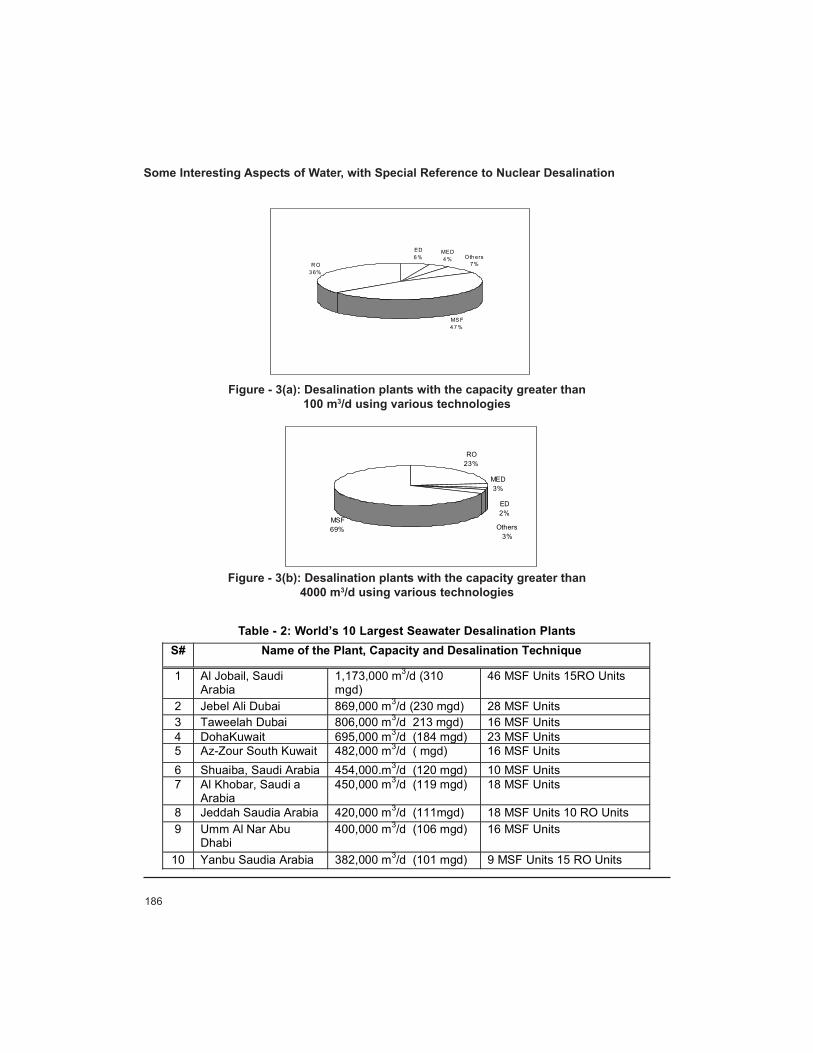
186
Table - 2: World’s 10 Largest Seawater Desalination PlantsS# Name of the Plant, Capacity and Desalination Technique
1 Al Jobail, Saudi Arabia
1,173,000 m3/d (310 mgd)
46 MSF Units 15RO Units
2 Jebel Ali Dubai 869,000 m3/d (230 mgd) 28 MSF Units 3 Taweelah Dubai 806,000 m3/d 213 mgd) 16 MSF Units 4 DohaKuwait 695,000 m3/d (184 mgd) 23 MSF Units 5 Az-Zour South Kuwait 482,000 m3/d ( mgd) 16 MSF Units 6 Shuaiba, Saudi Arabia 454,000.m3/d (120 mgd) 10 MSF Units 7 Al Khobar, Saudi a
Arabia 450,000 m3/d (119 mgd) 18 MSF Units
8 Jeddah Saudia Arabia 420,000 m3/d (111mgd) 18 MSF Units 10 RO Units 9 Umm Al Nar Abu
Dhabi 400,000 m3/d (106 mgd) 16 MSF Units
10 Yanbu Saudia Arabia 382,000 m3/d (101 mgd) 9 MSF Units 15 RO Units
Some Interesting Aspects of Water, with Special Reference to Nuclear Desalination
RO23%
MED 3%
ED 2%
Others 3%
MSF 69%
R O3 6%
ED 6 %
MED 4 % Oth ers
7%
MS F 4 7 %
Figure - 3(a): Desalination plants with the capacity greater than100 m3/d using various technologies
Figure - 3(b): Desalination plants with the capacity greater than4000 m3/d using various technologies
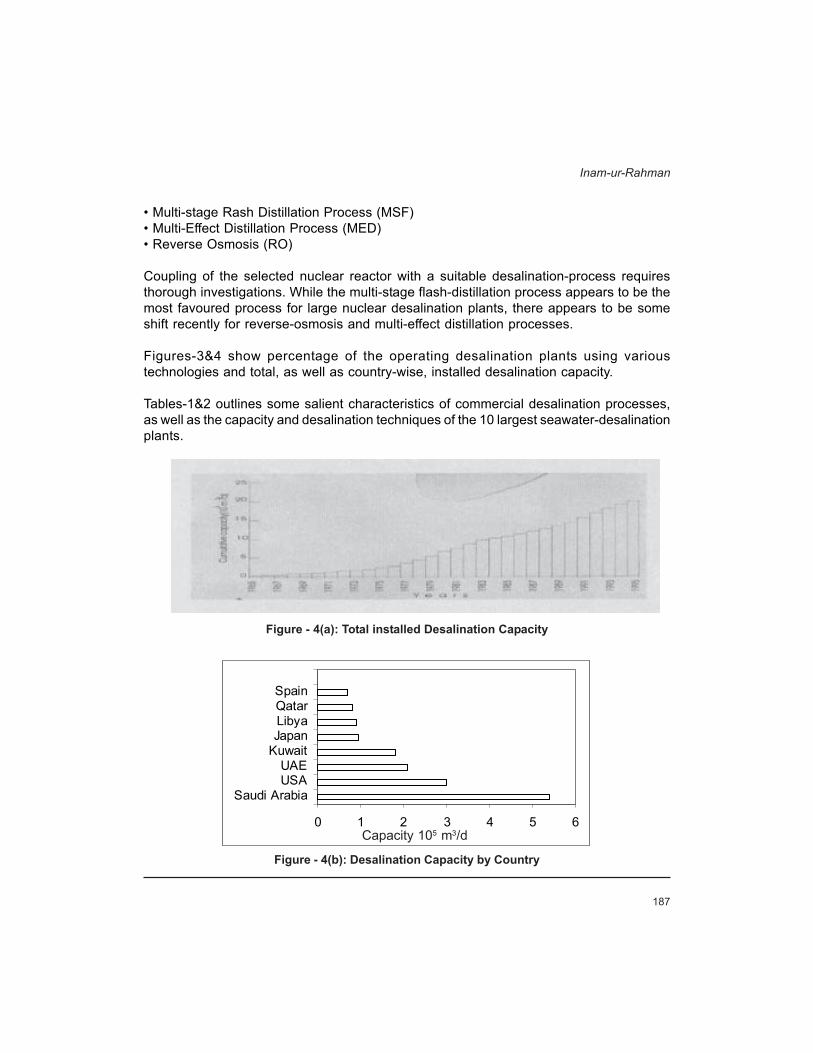
187
• Multi-stage Rash Distillation Process (MSF)• Multi-Effect Distillation Process (MED)• Reverse Osmosis (RO)
Coupling of the selected nuclear reactor with a suitable desalination-process requiresthorough investigations. While the multi-stage flash-distillation process appears to be themost favoured process for large nuclear desalination plants, there appears to be someshift recently for reverse-osmosis and multi-effect distillation processes.
Figures-3&4 show percentage of the operating desalination plants using varioustechnologies and total, as well as country-wise, installed desalination capacity.
Tables-1&2 outlines some salient characteristics of commercial desalination processes,as well as the capacity and desalination techniques of the 10 largest seawater-desalinationplants.
Inam-ur-Rahman
0 1 2 3 4 5 6
Saudi ArabiaUSAUAE
KuwaitJapanLibyaQatarSpain
Figure - 4(a): Total installed Desalination Capacity
Figure - 4(b): Desalination Capacity by Country
Capacity 105 m3/d

188
ALLOCATION OF COST TO WATER AND POWER IN DUAL-PURPOSE NUCLEARPLANTS
In a dual-purpose plant, the cost of water or power could be made to appear very attractiveby assigning all the benefit of the dual-purpose plant to any one of the two products. Thetotal annual expenditure Ca is equal to:
Ca = CE Ea + CW Wa
CE = Cost per KWhr of electricityEa = KWhr produced per yearC
W = Cost per m3 of waterWa = M3 of water produced per year.
One of the two products could be subsidized by allocating higher prices to the other, asshown in Figure-5.
METHODS OF COST CALCULATION
Cost of water appears to be very attractive if all the benefit of the dual-purpose nuclearplant is assigned to water. For example, if:
CD = Annual Cost of a dual-purpose plant producing P Mwe and W MGDCW = Annual minimum cost of a water-only plant, producing W MGDCP = Annual minimum cost of a power-only plant, producing P MWe
Figure - 5: Allocation of Cost to Water and Power
Some Interesting Aspects of Water, with Special Reference to Nuclear Desalination
Subsidized Water
Benefit of Coproduction divided between two products
Subsidized Electricity
Cost
per
m3
of w
ater
(Cw)
Cost per kw hr (CE)

189
In case all the benefit of the dual-purpose plant is given to water, the annual cost assignedto water would be:
= (CD-CP)On the other hand if all the benefit is to be assigned to power, the annual cost assigned topower would be:
= (CD – CW)
Even if the economic benefit is proportionately shared by power and water, the cost ofboth the products would be significantly lower than the minimum cost for water and powerplants, i.e. Cp
Normally, when a new item is produced in a multi-purpose plant (in this case water), thebenefit of the plant is given to the new product to make it appear more attractive fromcost-economics point of view. This should of course be done without increasing the costof other products. The cost of water from a large nuclear dual-purpose plant becomescompetitive in water-scarce areas if the annual cost assigned to water is (CD - Cp).
Inam-ur-Rahman

A
Alleviating Water-Problems:Marrying Old and New Ideas
Q. Isa Daudpota
191
ABSTRACT
Water-scarcity presents exciting challenges to all. It invites – rather forces — an attitudinalchange. This change should accompany economic, social and political incentives forconservation. There is also a need for introduction of appropriate new technologies andfor reviving long-forgotten old ones. Our traditions teach us respect, and offer lessons, forwater- harvesting of rainwater. Sewage and solid-waste management are shown to belinked to the solution of the water-resource problem. Ultraviolet purification is described; itcan provide clean water cheaply to every citizen in the South, and can be introducedwidely in Pakistan at minimal cost, thereby offering each citizen clean water. These andsimilar techniques introduced by national experts, working alongside the common people,can solve many water and related developmental issues.
INTRODUCTION
Our world is full of water – two third of it is covered with it. Despite this, expert forecasterspredict shortages of water, leading to major tension that would lead to military conflagration.The earth’s reserves of fresh water add up to more than 37 million cubic kilometers. Theice-caps bind more than three-fourth of this water, which is therefore inaccessible withcurrent technology. The rest, nearly 9 million cubic kilometer, is in aquifers, and hencenot easily exploitable.
The ultimate source of fresh water is the distillation of the oceans by solar radiation. Theannual rate of evaporation is roughly 500,000 cubic kilometer, of which 430,000 comesfrom the oceans and the remaining 70,000 from waters on the continents. Fortunately, thecontinents receive 110,000 cubic kilometer from precipitation, so that the net effect of thehydrological cycle is to transfer some 40,000 cubic kilometer of fresh water each yearfrom the oceans to the continents.
The maximum water that can be available for use by humans is about 14,000 cubickilometers per year – this is the water flowing in all rivers and streams, excludingfloodwaters. Of this, 5000 cubic kilometers flow in regions that are not inhabited. Thisleaves 9000 cubic kilometers per year, from which all human needs will have to be met. Isthis going to be adequate? A simple analysis of the per capita needs could help. For this,it is convenient to work in smaller units, i.e. cubic meters (1 cubic kilometers is made up ofa billion cubic meters). An acceptable quality of life can be maintained with 30 cubicmeters per capita. Of this allocation, less than one cubic meter is for drinking, whichneeds to be of a higher quality — chemically and biologically safe.
ALLEVIATING WATER-PROBLEMS: MARRYING OLDAND NEW IDEAS

192
Other than in the most industrialized countries, industry takes 20 cubic meters of waterper person. This is swamped by the requirements of agriculture. For a diet of 2500 caloriesper day, food-production requires 300 cubic meters per person per year. In wealthiercountries, where input requirement is 3,000 calories per day, the water needed is 400cubic meters per year per person. Adding all the requirements, it is fair to estimate thewater requirement as 350 to 450 cubic meters per person per year. Given that the globalwater supply is 9,000 cubic kilometers per year, one may be led to assume that a worldpopulation of 20 to 25 billion can be adequately supported by the water that is availableannually.
This simple calculation clearly has a flaw and it hinges on the assumption that the wateris distributed around the globe in the same way as humans are. This is not so. For example,in some parts of the world, people have to make do with just 2 cubic meter of water peryear, which is the bare biological minimum. For this low supply, they can pay as much as$20 per cubic meter. In the U.S. and other developed countries, where an average urbanuser consumes 180 cubic meters for domestic purposes, the cost is one hundredth orless of what the poor person in the developing country pays! For sustainable development,such inequities should be removed.
Agriculture uses the largest amount of fresh-water resources. More than 85% of cultivatedland is watered exclusively by rainfall. If not used, this water would be wasted. In 1970,rain-fed agriculture consumed 11,500 cubic kilometers of water; in comparison irrigatedagriculture employed 2,600 cubic kilometers on 12% of the cultivated land. This shouldsuggest that a major effort should go into optimized extraction and usage of the freerainwater that is spread widely and does not require transportation-cost to move it toplaces where people live and grow crops.
RAINWATER HARVESTING
In Pakistan, and elsewhere generally, rain-fed areas were considered high-risk foragriculture. This meant that almost all resources were put into irrigation, thereby deprivingourselves of improving the enormous potential of our rain-fed (barani) areas. These baraniareas cannot be ignored, as they nurture 80% of the country’s livestock, grow 12% ofwheat, over 50% barley, 65% of gram and 89% of groundnut production. Surface run-off,if stored in reservoirs, could help achieve the goal of food-sufficiency. Many of the problemsof irrigation, such as water-logging and salinity, could have been avoided if we had beenaware of the advantages of rainwater harvesting, a traditional method which can now betaught to the developed countries by countries in the South.
The use of rain-water harvesting has existed for 4,000 years. In Negev desert of Israel,which receives less than 15 cm of annual rainfall, hillsides were cleared to increase runoff,which was led into contour ditches. Underground storage of volume up to 300 cubic meters
Alleviating Water-Problems: Marrying Old and New Ideas
193
have been reported. In the Mediterranean region, rainwater collected from roofs, andstored in cisterns, constituted the principal source of water from the sixth century BC untiltoday.
In India, as early as the third millenium BC, farming communities in Baluchistan impoundedwater and used it for irrigation. Dams, built from stone rubble, have been found inBaluchistan and Kutch. Some of the settlements of the Indus valley civilization, datingback to 3000-1500 BC, had water-harvesting and drainage systems. The most recent tocome to light is the settlement at Dholavira in Gujarat, India. The 1997 report, “DyingWisdom” produced by the Center for Science and Environment, and dedicated to nativewisdom and the rural communities of their country, looks at the “rise, fall and potential ofIndia’s traditional water- harvesting systems”. This outstanding, seminal work, which took10 years to produce, should be essential reading for our water planners.
HANDLING ORGANIC ‘WASTE’
There is a fundamental connection between the present state of agricultural development,organic-waste management, sanitation and water supply. While water-supply and provisionof sanitation is a big challenge for the burgeoning population, an important issue is tomake organic residuals of human settlements useful in rural and urban agriculture. Thecontent of nutrients in the excreta of one person is sufficient to produce grain, with all thenutrients, to maintain life for a single human! This revolutionary thought provides thereason why no one needs to go hungry in this world.
Work done in Sweden points to how agricultural production can be increased without theuse of artificial fertilizers, provided that sanitation-technology could be made capable ofrecycling nutrients from households to agriculture. An important reason why this is needed,and is not peripheral, is that current sanitation-practices use scarce potable water to disposeoff sewage, which is then difficult to manage and causes pollution of ground and surface-water supplies.
The real goal is not just to recycle water and nutrients, but also all matter, and especiallyorganic solid wastes that constitute about 85% of all ‘wastes’ produced in humansettlements. At the moment, only 5% of the solid waste generated in the North is biologicallydigested to recover nutrients. Theoretically, it is possible to use up to 85% of solid wasteas recyclable resource. Moving beyond composting and urine-separating toilets, workabledecomposition technologies for organic wastes that produce bio-gas and bio-fertilizersare needed. Solid-waste management becomes an issue of organizing the collection,transportation and recycling of waste. Instead of problems and pollution, the end-productsmay feed the growing population and be a source of clean energy. One can then movefrom thinking about isolated technologies to totally new system-solutions.
Q. Isa Daudpota
194
This is an area where our agriculturists and other scientists could valuably spend theireffort and come up with profitable solutions, with wide-ranging impact on the health andeconomy of the country.
CHEAP CLEAN WATER WITH ULTRAVIOLET LIGHT
Poor water-supply and lack of proper sanitation condemns half the population of thedeveloping world, at any given time, to suffer from one of six main diseases associatedwith water-supply and sanitation. About 400 children below the age of 5 die every hour, indeveloping countries, from waterborne diseases. This comes to 3 million dying in a year!Diarrhea and associated diseases make them the biggest environmental threat to people.
Provision of plentiful and safe water and sanitation is essential for development; the benefitsof these are increased labor and economic productivity. A citizen should, however, demandthese as a basic civil right. What Pakistan needs is good sanitation, plentiful good-qualitywater and adequate disposal of human and animal excreta and waste. According to aformer director-general of WHO, the number of taps per 1000 persons is a better indicatorof health than the number of hospital beds.
The latest report on the quality of water in Islamabad, Pakistan’s best cared-for city, showsthat we are far from providing safe water in the country. Contamination of the water is dueto sewage entering the leaking pipes in the supply chain, says one report. Boiling of waterfor ensuring safety is very expensive and environmentally harmful. Also, expensive home-filter, with or without ultraviolet, for removal of pathogens is not feasible for most homes.Again, as with the water-harvesting, a cheap reliable hundred-year-old idea comes to therescue.
Low-pressure mercury arc (same as that used inside ordinary fluorescent lamps) puts out95% of its energy at a wavelength of 254 nanometers, which is right in the middle of therange of wavelengths that kills bacteria. The Energy-efficiency of UV treatment is veryhigh, as it uses one over two thousand of the energy that boiling does, using a bio-masscook-stove of 12% efficiency. Unlike chlorine, which does provide long-term protectionagainst re-infection by pathogens, UV does not leave a taste or odor and presents no riskof overdosing or formation of carcinogenic by-products caused by chlorine. The highsensitivity of bacteria to UV keeps the needed contact-time down to a few seconds, ascompared with 30-60 minutes for chlorine.
In the mid 90s, when floods in India caused many deaths from water-borne disease,Ashok Gadgil of Lawrence Livermore Lab. in California, used a simple idea of UV’s bio-active property to build a simple equipment that is now beginning to be used widely inIndia and other parts of the world. The beauty of it is that the assembly is simple and only
Alleviating Water-Problems: Marrying Old and New Ideas
195
local materials are needed to have a system up and running within a community, in lessthan a day.
A curved plate helps focus the UV lamp on to a channel, which carries flowing water thatis to be made bacteria-free. By using 40 Watts, such a unit can disinfect one ton of waterper hour. The cost of such a system is remarkably low. Electricity cost, using the grid or aphoto-voltaic array and amortizing over 10 years, as well as maintenance, gives the costof annual provision of drinking water for a single individual (10 liters per day) at about Rs6. No one in Pakistan has, as yet, set about installing such units in the country. Why?
CONCLUSIONS
As Pakistan’s population grows, there will be increased pressure on water-resources.The lack of good sanitation, which is already rare, threatens to cause even more serioushealth hazards. These problems invite us to search our traditions for solutions, mostimportant among them is respect for water. Technologies, old and new, can help us usethe resource sensibly. Mere technical solutions will, however, not help. We will need tobuild a community with national conservation ethics, backed by an improved management-capability. The problems of water- scarcity and poor sanitation can be turned into wonderfulopportunities to transform our societies. It is time to change the way we do things andthink anew our relationship to natural resources!
Q. Isa Daudpota

196
SUBJECT INDEX
ALLEVIATING WATER-PROBLEMS: MARRYING OLD AND NEW IDEASIntroduction, 191; Rainwater Harvesting, 192; Handling Organic ‘Waste’, 193; Cheap CleanWater with Ultraviolet Light, 194; Conclusions, 195.
ASSESSMENT OF WATER-QUALITYIntroduction - The Importance of Clean Water, 111; Sources of Water-Pollution, 113; PotableWater, 115; Treatment of Water: Aeration, Coagulation and Flocculation, Sedimentation,Disinfection, Taste and Odour, Filtration, 116; Quality Assurance, 119; Conclusions, 119;Recommendations, 120; References, 120.
DROUGHT-MITIGATION INTERVENTIONS BY IMPROVED WATER-MANAGEMENT (ACase Study from Punjab - Pakistan)The Setting, 101; Water Management Regime, 102; Water Availability during Last TwoRabi Seasons, 103; Rabi Plan, 1999-2000 and 2000-2001, 105; Internal Water-Management at Canal-Command Level, 106; Water Management Impact on WheatProduction, 106; Conclusions, 107; References, 109.
EFFICIENT AND SUITABLE IRRIGATION-MANAGEMENT IN PAKISTANIntroduction, 41; The Irrigation Network, 42; Water Availability & Utilization, 42; Irrigationand Water-Management Issues, 46; Farmers’ Participation in Canal-Irrigation and Water-Users Associations, 48; Conclusions, 50; References, 50.
EVALUATION OF WATER-QUALITY BY CHLOROPHYLL AND DISSOLVED OXYGENIntroduction, 123; Sampling Sites: Rawal Lake, Kalar Kahar Lake, Humak and TarlaiPonds, 124; Instruments, 125; Methods: Chlorophyll, Dissolved Oxygen, 25; Resultsand Discussion: Rawal Lake, Kalar Kahar Lake, Humak, Tarlai and Gandaf Ponds, 132;References, 135.
MANAGEMENT OF WATER-RESOURCES IN SOUTH ASIAIntroduction, 4; South Asian Scenario: Population, Land, Important Crops in South Asia,Water Requirements of Important Crops 4; Country Profile: Bangladesh, Bhutan, India,Maldives, Nepal, Pakistan, Sri Lanka, 6; Issues and Opportunities for South Asia: Climate,River System, Water-Reservoir, Groundwater, Institutional Development, Water Delivery-System, On Farm Programs, Cropping Patterns, Water Pollution, Participation of theFarming Communities, Pricing of Water, 14; Acknowledgement 20.
MATHEMATICAL MODELING OF THE UPPER-INDUS GLACIERSIntroduction, 75; Formation of Glaciers, 76; The Budget of a Glacier, 76; How Ice Moves,77; An Example from the Theory of Glacial Motion, 79; The Upper Indus Basin Glaciers,

197
80; Artificial Melting of Glaciers to Meet Water Shortage, 84; Conclusions andRecommendations, 85; References, 86.
OPTIMAL UTILIZATION OF WATER-RESOURCES AT MANGLA RESERVOIRIntroduction, 51; Water-Availability & Re-evaluation of PMF, 52; Discussion on VariousStudies, 52; Conclusions, 54; References, 55.
SALINITY OF GROUNDWATER IN COASTAL AQUIFER OF KARACHI, PAKISTAN (APreliminary Investigation)Introduction, 137; Hydrogeology of The Study-Area, 138; Water-Supply Scenario ForCoastal Belt of Karachi, 138; Objectives and Rationale, 139; Present Investigations: FieldSampling, Field In-Situ Analysis, Laboratory Analysis, 139; Results and Discussion,Sources of Surface Water, Potable Groundwater in Coastal Aquifer, Groundwater RechargeCharacteristics/ Sea Water Intrusion, 141; Conclusions, 153; References, 154.
SOME INTERESTING ASPECTS OF WATER, WITH SPECIAL REFERENCE TONUCLEAR DESALINATIONIntroduction, 179; Formation and Distribution of Water: Distribution, 180; Importance andRequirements of Water, 180; Some Special Characteristics of Water, 181; Water for Energyand Energy for Water!: Energy Due to Water Movement, Energy Due to Chemical & NuclearReactions, Miscellaneous Uses of Water in Energy-Production, 181; Need for Water-Resource Planning for Pakistan, 182; Nuclear Desalination for Projected WaterRequirements: Attractive Features of Nuclear Desalination, 183; Various DesalinationTechnologies, 185; Allocation of Cost to Water and Power In Dual-Purpose Nuclear Plants,188; Methods of Cost Calculation, 188.
STRATEGIC SUITABLE DEVELOPMENT OF GROUNDWATER IN THAR DESERT OFPAKISTANIntroduction, 57; Climatic Conditions, 60; General Geology, 61; Hydro-Geological Conditions,64; Groundwater Quality, 65; Regional Gradients: Surface Gradients, Gradient at Top ofOxidized Zone, Gradient at Top of Coal-Bearing Formation, Gradient at Thar Basement, 66;Discussion, 71; Conclusions, 72; References, 73.
STUDIES OF SEAWATER POLLUTION ON THE PAKISTAN COAST USING STABLECARBON ISOTOPE TECHNIQUEIntroduction, 155; Description of Study Area, 157; Sampling Sites and Field Methods,158; Laboratory Methods, 158; Results and Discussion, 159; Conclusions, 161;References, 162.
THE CLIMATE AND FLOOD-RISK POTENTIAL OF NORTHERN AREAS OF PAKISTANThe Climate of Northern Pakistan: Temperature, 87; Some Conclusions, 89; Precipitation,89; Conclusions: Precipitation Correlation, 92; Temperature Trend: Periodicity in
Subject Index

198
Temperature, 94; Historical Information on Glof Floods, 97; Climatic Time – Series andLandslide/Dam-Break Floods: Information on Landslide/Dam-break Floods, 98; Summaryof Conclusions on Flood Stationarity, 99; References, 100.
USE OF BRACKISH-WATER FOR AGRICULTURE: GROWTH OF SALT-TOLERANTPLANTS AND THEIR EFFECTS ON SOIL-PROPERTIESIntroduction, 163; Materials and Methods, 169; Results and Discussion, 170; Conclusions,175; References, 177.
WATER-RESOURCES SITUATION IN PAKISTAN: CHALLENGES AND FUTURESTRATEGIESIntroduction, 22; Water-Resources: Surface Water-Resources, Rainfall, GroundwaterResources, 23; Water Requirements: Agricultural Demands, Domestic and IndustrialNeeds, 26; Major Challenges: Water Scarcity, Drought, Inadequate Storage andSedimentation, Groundwater Over-draft and Water Logging and Salinity, Low System-Efficiency and productivity, Water Quality Deterioration, 27; Water Management-Strategies:Short-Term Strategies (Time frame – 3 years), Medium-term Strategies (Time Frame – 3to 7 years), Long-Term Strategies (Time Frame – beyond 7 years), 33; Conclusions andRecommendations, 38; References, 39.
Subject Index

199
AUTHOR INDEX
A. Mashiatullah --- Salinity of Groundwater in Coastal Aquifer of Karachi,Pakistan (A Preliminary Investigation)
A. Mashiatullah --- Studies of Seawater Pollution on the Pakistan Coastusing Stable Carbon Isotope Technique
Abdul Majeed --- Water-Resources Situation in Pakistan: Challenges andFuture Strategies
Asrar-ul-Haq --- Drought-Mitigation Interventions by Improved Water-Management (A Case Study From Punjab - Pakistan)
E. Ahmad --- Salinity of Groundwater in Coastal Aquifer of Karachi,Pakistan (A Preliminary Investigation)
E. Ahmad --- Studies of Seawater Pollution on the Pakistan Coastusing Stable Carbon Isotope Technique
H.A. Khan --- Salinity of Groundwater in Coastal Aquifer of Karachi,Pakistan (A Preliminary Investigation)
H.A. Khan --- Studies of Seawater Pollution on the Pakistan Coastusing Stable Carbon Isotope Technique
Illahi B. Shaikh --- Efficient and Suitable Irrigation-Management inPakistan
Inam-ur-Rahman --- Some Interesting Aspects of Water, With SpecialReference to Nuclear Desalination
Iqbal H. Qureshi --- Assessment of Water-Quality
Javed Akhter --- Use of Brackish-Water for Agriculture: Growth of Salt-Tolerant Plants and their Effects on Soil-Properties
Kauser A. Malik --- Use of Brackish-Water for Agriculture: Growth of Salt-Tolerant Plants and their Effects on Soil-Properties

200
Khalid Rashid --- Mathematical Modeling of the Upper-Indus Glaciers
M. Azam Tasneem --- Evaluation of Water-Quality by Chlorophyll andDissolved Oxygen
M. Fazil --- Coast using Stable Carbon Isotope Technique
M. Ishaq Sajjad --- Evaluation of Water-Quality by Chlorophyll andDissolved Oxygen
M.A. Kahlown --- Water-Resources Situation in Pakistan: Challenges andFuture Strategies
M.A. Tasneem --- Salinity of Groundwater in Coastal Aquifer of Karachi,Pakistan (A Preliminary Investigation)
M.I. Sajjad --- Salinity of Groundwater in Coastal Aquifer of Karachi,Pakistan (A Preliminary Investigation)
M.I. Sajjad --- Studies of Seawater Pollution on the Pakistan Coastusing Stable Carbon Isotope Technique
Mubarik Ali --- Evaluation of Water-Quality by Chlorophyll andDissolved Oxygen
Muhammad Fazil --- Evaluation of Water-Quality by Chlorophyll andDissolved Oxygen
Muhammad Hanif --- Management of Water-Resources in South Asia
N.A. Qureshi --- Salinity of Groundwater in Coastal Aquifer of Karachi,Pakistan (A Preliminary Investigation)
N. Alam Zaigham --- Strategic Suitable Development of Groundwater in TharDesert of Pakistan
Q. Isa Daudpota --- Alleviating Water-Problems: Marrying Old and NewIdeas
Qamar-uz-Zaman Ch. --- Optimal Utilization of Water-Resources at ManglaReservoir
Author Index

201
Riffat.M. Qureshi --- Salinity of Groundwater in Coastal Aquifer ofKarachi, Pakistan (A Preliminary Investigation)
Riffat M. Qureshi --- Studies of Seawater Pollution on the PakistanCoast using Stable Carbon Isotope Technique
Sahfeeq Ahmed --- Use of Brackish-Water for Agriculture: Growthof Salt-Tolerant Plants and their Effects on Soil-Properties
Saira Butt --- Evaluation of Water-Quality by Chlorophyll andDissolved Oxygen
Shaukat Ali Awan --- The Climate and Flood-Risk Potential ofNorthern Areas of Pakistan
Tariq Javed --- Evaluation of Water-Quality by Chlorophyll andDissolved Oxygen
Zahid Latif --- Evaluation of Water-Quality by Chlorophyll andDissolved Oxygen
Author Index