Embed Size (px)
Citation preview
Proceedings
October 1-3, 1951
HYDROLOGY. CHEMISTRY
RADAR-WEATHER
Dedicating
WATER RESOURCES BUILDING
Bulletin 41
S T A T E O F ILLINOIS D E P A R T M E N T O F REGISTRATION AND E D U C A T I O N
DIVISION OF THE S T A T E WATER SURVEY
A. M. BUSWELL, Chief
B U L L E T I N N O . 4 1
P R O C E E D I N G S O F T H E
C O N F E R E N C E O N W A T E R R E S O U R C E S O C T O B E R 1 , 2 , 3 , 1951
ON THE OCCASION OF THE
DEDICATION OF THE WATER RESOURCES BUILDING
Pr in ted by Authority of the State of Illinois
URBANA, ILLINOIS 1952
O R G A N I Z A T I O N
S T A T E O F I L L I N O I S
Hon. ADLAI E. STEVENSON, Governor
D E P A R T M E N T O F R E G I S T R A T I O N A N D E D U C A T I O N
Hon. C. HOBART ENGLE, Director
B O A R D O F
NATURAL RESOURCES AND CONSERVATION Hon. C. HOBART ENGLE, Chairman
ROGER ADAMS, Ph . D . , D. S c . , Chemis t ry LOUIS R. HOWSON, C. E . , Engineering W. H. NEWHOUSE, Ph . D . , Geology A. E. EMERSON, Ph. D . , Biology LEWIS H. TIFFANY, Ph . D . , F o r e s t r y GEORGE D. STODDARD, Ph. D . , Lit t . D . , LL . D . ,
L. H. D . , P r e s i d e n t of the Universi ty of Ill inois DELYTE W. MORRIS, Ph . D . ,
P re s iden t of Southern Illinois Universi ty
S T A T E W A T E R S U R V E Y D I V I S I O N
A. M. BUSWELL, Ph. D . , Chief
SCIENTIFIC AND TECHNICAL STAFF of the
STATE WATER SURVEY DIVISION October 1, 1951
Water Resou rce s Building Box 232, Urbana
A. M. BUSWELL, Ph . D . , Chief
ENGINEERING
Herbe r t E . Hudson, J r . , B. S . , Engineer and Head
Groundwater Hydrology
Harman F . Smith, B . S . , Engineer Ross Hanson, B. S . , Associa te Engineer Eugene G. Jones , B. S . , Field Engineer Jack Bruin, B. S . , Engineer ing Ass i s t an t Rober t T . Sasman, B . S . , Engineer ing A s s i s t a n t
Surface Water Hydrology
Wyndham J . Rober t s , M. S . , Assoc ia te Engineer Bern t O. La r son , M. S . , Associate Engineer Walter H. Roschke, J r . , M. S. , Engineering Ass i s t an t
Hydraulic Labora to ry
R o b e r t E . Rober t s , M. S . , Ass is tan t Engineer Jewell G. Dillman, Scientific and Technical Ass i s t an t
Meteorology
Glenn E. Stout, B. S., Associate Professional Scient is t Floyd A. Huff, B. S. , Assis tant Professional Scient is t
(on mi l i ta ry leave of absence) Douglas M. A. Jones, M. S . , Assis tant Profess iona l
Scientist James C. Neill, M. S., Assistant Professional Scient is t Gerald W. Farnsworth, B. S . , Engineering Ass i s t an t Homer W. Hise r , A. B . , Ass i s tan t H a r r y W. Maynard, Ass i s t an t George F . Beatty, B . S . , Ass is tan t Kenneth A. Faulk, Radar Operator J a m e s A. West, Radar Opera tor
R e s e r v o i r Sedimentation
John B. Stall , B. S . , Ass i s t an t Engineer
ENGINEERING RESEARCH
Max Suter , Ph . D . , Engineer and Head Car l C. Chamber la in , Ass i s t an t Engineer
P e o r i a Region and Labora to ry
Adolph R. Knodel, B. S . , Field Engineer Orvil le W. Vogel, B. S . , Ass is tan t Chemis t Richard L. Hurs t , Engineering Ass i s t an t Virginia Wisegarver , B . S . , Engineer ing Ass i s t an t John B. Mil l i s , Field Engineer Jacob S. Randall , B. S . , Field Engineer Harold E. Bement , Engineer ing Ass i s t an t
Ca i ro Area
Leo E. Wilson
CHEMISTRY
T. E . La r son , Ph . D . , Chemis t and Head
Boi ler Water Control
R u s s e l l W. Lane , M. S . , Chemis t L a u r e l ' M . Henley, A . B . , Ass i s t an t Chemist
Analyt ical
Wilma L . P r in ty , B . S . , Ass i s t an t Chemist Ar thu r H. Bodenschatz , B. S . , Ass i s t an t Chemis t
CHEMICAL RESEARCH
Cor ros ion
Robe r t M. King, B. S . , Ass i s t an t Chemis t
Anaerobic Fe rmen ta t ion
Henry F. Mueller, B. S . , Special Research Ass i s t an t Ar thur T. Yahiro, B. S . , Special Research Ass i s t an t
Supersonics (in cooperation with Food Technology D e p a r t ment , University of Illinois)
Li l l ian R u s s e l l , M. S . , Special R e s e a r c h Ass i s t an t
Fundamenta l P rope r t i e s of Water Substances (in coopera tion with the Office of Naval Research)
W. H. Rodebush, Ph. D., Professor of Physical Chemis t ry , Investigator
A. M. Buswell, Ph. D . , Research Professor of Chemis t ry , Investigator
Walter F . Claussen, Ph. D . , Research Assis tant P r o fessor
W. L. Masterton, M. S . , Special Research Ass i s t an t
Nitrification Studies (in cooperation with U. S. Public Health Service)
M. I rene Van Meter , M. S . , R e s e a r c h Ins t ruc tor Te t suo Shiota, M. S . , Special R e s e a r c h Ass i s t an t Norman Lawrence, B. S . , Special Research Ass i s t an t
CONSULTANTS
Radar
Wil l iam G. Albright , M. S . , Ass i s t an t P r o f e s s o r of E l e c t r i c a l Engineer ing, Universi ty of Illinois
Meteorology
Horace R. Byers , Ph . D . , Chairman, Depar tment of Meteorology, University of Chicago
ACKNOWLEDGEMENTS
The organization of the p rog ram for the Conference and publ ication detai ls were largely in the hands of Mr. H. E. Hudson, J r . Associate Engineer W. J. Roberts was in charge of local a r r angemen t s and publicity. Associate Engineer Ross Hanson assembled the p a p e r s for this bulletin and arranged them for publication. Ass is tan t Engineer J. B. Stall handled reg is t ra t ion and Ass i s t an t Engineer R. E. Rober t s took ca re of inspection t r i p s . P ro fe s so r R. K. Newton, Supervisor of Engineering Extension, University of I l l inois , and his staff rel ieved the committee of many of the conference management de ta i l s . M r s . Lois McAllister was compositor for the en t i re publication and Mr . Stanley A. Changnon, J r . , did the drafting and design.
The staff of the State Water Survey wishes to expres s its app rec i ation for the invaluable ass i s t ance of the folio-wing:
W. G. Albright, Assis tant P ro fessor of E lec t r i ca l Engineering, Univers i ty of Il l inois.
David At las , P ro jec t Scientist , Cambridge Air Force Research Center , Cambridge, Massachuse t t s .
A. C. Bemis , P ro jec t Supervisor , Wea ther -Radar Pro jec t , M. I . T . , Cambridge, Massachuse t t s .
H. R. B y e r s , Cha i rman , Department of Meteorology, University of Chicago, Chicago, I l l inois .
V. T. Chow, Department of Civil Engineer ing , Universi ty of Il l inois. J. J. Doland, Professor of Hydraulic Engineer ing, University of Illinois . W. B. Gould, Head, Sferics Section, Signal Corps Engineering Labo
r a t o r i e s , For t Monmouth, New J e r s e y . John C. Guillou, Research Ass is tant P r o f e s s o r of Hydraulic Engineer
ing, University of I l l inois. Seichi Konzo, P r o f e s s o r of Mechanical Engineer ing, University of
I l l inois . . W. M. Lansford, P rofessor of Theore t ica l and Applied Mechanics , Uni
ve r s i ty of Ill inois. J . S . Marsha l l , A s s o c i a t e P r o f e s s o r , Phys ics Department , McGill
University, Montreal , Canada. W. D. Mitchell , Hydraulic Engineer , U. S. Geological Survey, Cham
paign. J. H. Morgan, Dis t r ic t Engineer , U. S. Geological Survey, Champaign. R. S. Stauffer, A s s o c i a t e P ro fe s so r of Soil Phys i c s , University of
I l l inois.
Our grati tude is a l so due to those who have prepared the papers and discuss ions which contribute permanent value to the r eco rds of this occasion.
CONTENTS
Page
DEDICATION OF THE WATER RESOURCES BUILDING 17
PRESENTATION OF THE BUILDING TO THE UNIVERSITY OF ILLINOIS C. Hobart Engle 17
ACCEPTANCE OF THE BUILDING BY THE UNIVERSITY OF ILLINOIS Henning Larsen 18
EARLY DAYS AND ORGANIZATION OF THE ILLINOIS STATE WATER SURVEY Edward Bartow 19
THE STATE WATER SURVEY DIVISION, 1920 -A. M. Buswell 23
CONFERENCE PROCEEDINGS
PART I HYDROLOGY
HYDROLOGY AND THE HYDRAULIC LABORATORY Albert S. F ry 31
Discussions: Arno T. Lenz 38 J. I. Pe r r ey 39 Carl E. Kindsvater . 40
BED-LOAD FUNCTION FOR SEDIMENT TRANSPORTATION IN OPEN CHANNEL FLOWS Hans A. Einstein 43
Discussions: Vito A. Vanoni 46 Ralph W. Powell 48
SEDIMENTATION PROBLEMS - A PANEL DISCUSSION INTRODUCTION
L. C. Gottschalk 51
BASIC DATA COLLECTION Gunnar Brune 53
APPLICATION OF SEDIMENTATION DATA TO WATER PROJECT DESIGN N. T. Veatch 63
WATERSHED APPROACH TO SEDIMENTATION PROBLEMS Orville W. Chinn 67 Wendell LaDue 71
Discussions: Hans A. Einstein 73 Alex von Praag, Jr 73
7
P a g e ANALYSIS AND USE OF GROUNDWATER DATA
W i l l i a m F. Guyton : 75
D i s c u s s i o n s : John H. B l i s s400 Chinese With Comments 81 H. T. C r i t c h l o w 82 H. A. Spafford 84 E. W. B e n n i s o n 85
ANALYSIS AND USE OF SURFACE WATER DATA R i c h a r d Hazen 87
D i s c u s s i o n s : E . F . B r a t e r 9 6 W. D. M i t c h e l l 96 C. V. Youngquis t 98
ENGINEERING METEOROLOGY Stifel W. J ens 99
D i s c u s s i o n s : G e o r g e Benton 117 Ivan F. Houk 120 P h i l l i p Light 122
WATER USE - A P A N E L DISCUSSION INTRODUCTION
R. G. Sn ider 123
INDUSTRY'S WATER P R O B L E M S T. J. P o w e r s , . . . . 124
THE NATIONAL P I C T U R E W a l t e r P i c t o n 127
D i s c u s s i o n s : A. M. B u s w e l l 131 R. G. Sn ider C. O. W i s l e r H . E . Hudson , J r . H o r a c e G r a y J. H. M o r g a n
WATER USE CONSIDERATIONS IN THE F E D E R A L W A T E R - P O L L U T I O N PROGRAM P a u l W. Reed 133
INDUSTRIAL CONSERVATION METHODS Howard E. D e g l e r 135
INSTITUTIONAL CHANGE AND WATER RESOURCE UTILIZATION H o r a c e M. G r a y 143
STATE WATER P O L I C I E S Lou i s R. How son 145
D i s c u s s i o n s : R. O. J o s l y n 148 John W. F o s t e r 150 H o r a c e G r a y A. M. B u s w e l l H. T. C r i t c h l o w
8
Page PART II TREATMENT
SURVEY OF CORROSION CONTROL IN WATER SYSTEMS Herbert H. Uhlig 153
Discussions: E. N. Alquist 1 5 9 - 1 6 1 John F. Wilkes Chas. H. Spaulding R. C. Bardwell H. H. Uhlig
COMPOSITION OF WATER SUBSTANCE W. H. Rodebush 163
ION EXCHANGE MATERIALS A. S. Behrman 175
BOILER FEED WATER CONDITIONING Freder ick G. Straub 183
P A R T III RADAR-WEATHER
CENSUS OF RADAR-WEATHER PROJECTS A. C. Bemis 193
NAVAL RESEARCH LABORATORY'S R5D I. Katz . 199
Discussions: A. C. Bemis 203 D. Atlas H. R. Byers D. B. Talmage I. Katz
THE JOINT COMMISSION ON RADIO METEOROLOGY J. S. Marshall 205
Discussions: A. C. Bemis 207 R. M. Cunningham H. R. Byers W. B. Gould L. J. Battan J. S. Marshall
DETERMINATION OF CLOUD BASES AND TOPS BY RADAR W. B. Gould 209
Discussions: A. C. Bemis 216 - 219 J. R. Gerhardt D. Atlas D. D. Reiter M. L. Stone R. C. Jorgensen S. E. Reynolds D. M. Swingle R. Wexler P. M. Austin M. H. Ligda W. B. Gould
9
Page INTRODUCTION - MONDAY EVENING
H. R. Byers 221
DETAILS OF THE PRODUCTION MODEL AN/CPS-9 RADAR W. J. Schiff and E. L. Williams 223
Discussions: F. C. White 225 E. L. Williams
COMPARISON OF AVERAGE RADAR SIGNAL INTENSITY WITH RAINFALL DATA Pauline M. Austin 227
QUANTITATIVE RADAR-RAINFALL PROBLEMS Gerald Farnsworth 235
Discussions: R. Wexler 239 S. E. Reynolds D. D. Reiter H. R. Byers G. Farnsworth
MEASUREMENT OF POINT AND AREAL RAINFALL BY RADAR Douglas M. A. Jones and Homer Hiser 241
Discussions: L. J. Battan 254 S. E. Reynolds D. Atlas H. R. Byers J. C. Freeman D. M. A. Jones
REDUCTION OF FLUCTUATIONS IN ECHOES FROM RANDOMLY DISTRIBUTED SCATTERERS J. S. Marshall and W. Hitschfeld 255
Discussions: W. Hitschfeld 262 M. H. Ligda J. S. Marshall
THE USES AND LIMITATIONS OF RASAPH A. F le i sher 263
Discussions: M. L. Stone 267 A. Fle isher
MICROWAVE SCATTERING FROM NONSPHERICAL HYDROMETEORS David Atlas 269
THE EFFECT OF ATTENUATION ON THE RANGE PERFORMANCE OF RADAR SET AN/CPS-9 Donald M. Swingle 277
Discussions: P. M. Austin 282 M. H. Ligda F. C. White G. E. Stout E. F. Hill D. M. Swingle
10
11
Raymond Wexler 283
Discussions: D. C. Blanchard 283 M. H. Ligda J. S. Marshall R. Wexler
AIRBORNE RAINDROP SIZE MEASUREMENT AND INSTRUMENTAL TECHNIQUES R. M. Cunningham 285
Discussions: J. S. Marshall 291 D. C. Blanchard R. M. Cunningham
RESULTS OF MEASUREMENTS OF RAINDROP SIZE Roland J. Boucher 293
Discussions: D. M. A. Jones 298 R. Wexler R. J. Boucher
NEW METHOD TO MEASURE RAINDROP SIZE L. G Smith 299
P A N E L DISCUSSIONS
1. NEW DEVELOPMENTS IN USING RADAR FOR HURRICANE TRACKING Moderator: R. C. Jorgensen 301
UNIVERSITY OF FLORIDA RADAR INSTALLATION Marinos H. Latour 303
Panel Members : G. Dunn M. Latour J. Anderson
Discussions: F. C. White 305 - 315 D. Atlas J. S. Marshall H. R. Byers L. J. Battan M. H. Ligda J. C. F reeman R. C. Jorgensen
2. SUGGESTED FIELDS OF STUDY Moderator: A. C. Bemis 317
Discussions: F. C. White 319 -.326 D. M. A. Jones L. J. Battan D. Atlas G. E. Dunn I. Katz E. L. Williams S. E. Reynolds D. M. Swingle G. E. Stout J. R. Anderson P. M. Austin M. H. Ligda J. C. Freeman H. W. Maynard H. R. Byers W. B. Gould R. J. Boucher A. C. Bemis
CONFERENCE REGISTRATION . . 327
Page THEORY OF RADAR UPPER BAND
ILLUSTRATIONS
Figure Page
Dr. Arthur W. Pa lmer , 1895-1904 19 Dr. Edward Bartow, 1905-1920 20 Dr. Arthur M. Buswell, 1920 - 23
HYDROLOGY
1 San Dimas Flume 32 2 H-Flume for small s t reams 32 3 Automatic sediment sampler in laboratory 33 4 Sensitive weir plate developed in laboratory 33 5 Sediment sampler installed in field 34 6 Wind and temperature observation tower 34 7 Prototype weir field installation and model built in laboratory 35 8 Graph of observed values of von Karman universal constant k . . 46 9 Graph of calculated exponent z 47
10 Graph of the quantity against observed exponent z1 47 11 Changes where part icles of various sizes are or are not uniformly mixed . . . . . . . 49 12 Infertile overwash - Skunk River, Iowa 53 13 Channel clogged with sediment 54 14 Typical valley trench - Little Sioux (Iowa) watershed 54 15 Streambank erosion - Cuyahoga River, Ohio 54 16 Sediment sources related to size of watershed - Sangamon River, Illinois 55 17 Physiographic a r ea s in Midwest - Location of sediment records 56 18 Rates of sediment production - Midwestern United States . . . 57 19 Range end monument 58 20 Six-foot sediment spud 58 21 Planetable operator , 59 22 Extension auger 59 23 Use of sounding pole - Lake Rockwell, Ohio 60 24 DH-48 hand sediment sampler 60 25 Bed-load measurement installation - Enoree River, South Carolina 61 26 Growth at Myers Valley trench - near Council Bluffs, Iowa 61 27 Strip-cropping in Ohio ... 62 28 Notch-type gully-stabilizing s t ructure 62 29 Cuyahoga River watershed area above Akron, Ohio 71 30 Plot of 10-year centered moving average annual precipitation 88 31 Flow curves - Juniata River, Williamsburg, Pennsylvania 88 32 Storage curves of five Midwestern s t reams 90 33 Storage curves - Hocking River, Athens, Ohio 91 34 Storage curves - Driest period of record 92 35 Diversion curves - Wallkill River, Pe l le t ' s Island Mountain, New York 93 36 Diversion curves - Manhan River, Massachusetts . 94 37 Relation between r iver-water hardness and s t ream flow - Juniata River,
Williamsburg, Pennsylvania 94 38 Relation between dissolved solids and flow - Arkansas River, Van Buren, Arkansas . . 95 39 Values of infiltration capacity and runoff coefficients for varying rainfall on small
watersheds . 96 40 Duration curves - Kankakee River, Momence, Illinois, and Cache River, Forman,
Illinois 97 41 Isohyetal maps for August 3, 1939 s torm, Muskingum Basin, Ohio . . . . . 100 42 Storm rainfall over small a r eas 101 43 Mass rainfall curves - Greenville, New Mexico, and Guy, New Mexico,
September 1941 101 44 Depth-area-duration curves for a reas between a point and 200,000 square miles . . . . 104
13
14
F i g u r e P a g e
45 P e r c e n t a g e r a t i o s of a v e r a g e in t ens i ty of r a in f a l l 105 46 Ai r f i e ld d r a i n a g e - s t a n d a r d r a i n f a l l - i n t e n s i t y - d u r a t i o n c u r v e s 106 47 G e n e r a l i z e d e s t i m a t e s - M a x i m u m p o s s i b l e p r e c i p i t a t i o n 107 48 I sohye t a l m a p - San Jac in to R i v e r (Texas) Hydro log ic S tud ies 109 49 D e p t h - a r e a da ta c u r v e s - San J a c i n t o R i v e r ( T e x a s ) Hydro log ic S tud ie s 110 50 I sohye t a l m a p s - San J a c i n t o R i v e r (Texas ) H y d r o l o g i c S tud ies 111 51 E x c e s s p r e c i p i t a t i o n d i a g r a m - San Jac in to R i v e r ( T e x a s ) Hydro log ic Studies 112 52 T h r e e - y e a r t o t a l r a in fa l l - San J a c i n t o R i v e r ( T e x a s ) Hydro log ic S t u d i e s 114 53 Mean Ju ly e v a p o r a t i o n f r o m sha l low l akes and r e s e r v o i r s 115 54 Growth of w a t e r u s e in the Uni ted S ta tes - 1900-1950 128 55 W a t e r - c o o l i n g t o w e r s 138 56 W a t e r - c o o l i n g t o w e r and hea t e x c h a n g e r s . . 139
T R E A T M E N T
57 P e n t a g o n a l d o d e c a h e d r o n 168 58 B o d y - c e n t e r e d cubic pentagonal d o d e c a h e d r a l l a t t i c e showing base and cen te r of
uni t c e l l 169 59 T e t r a k a i d e c a h e d r o n 169 60 H e x a k a i d e c a h e d r o n 170 61 S c h e m a t i c d i a g r a m of power p lan t 183 62 C o n c e n t r a t i o n of s o d i u m hydrox ide in r e l a t i o n to t e m p e r a t u r e and s t e a m p r e s s u r e . . . 184 63 Rat io of s i l i c a in s t e a m to s i l i ca in solut ion v e r s u s pH of solut ion 185 64 Rat io of SiO2 in s t e a m to SiO2 so lut ion v e r s u s s a t u r a t e d s t e a m p r e s s u r e 186 65 P lo t of log of SiO2 r a t i o v e r s u s r e c i p r o c a l of a b s o l u t e t e m p e r a t u r e 186 66 C o n c e n t r a t i o n of s i l i c a in s u p e r h e a t e d s t e a m v e r s u s r e c i p r o c a l of a b s o l u t e
t e m p e r a t u r e 187
RADAR-WEATHER
67 Model of mod i f i ed R5D 199 68 C l o s e - u p of r e t r a c t a b l e m e t e o r o l o g i c a l m a s t 200 69 M e t e o r o l o g i c a l m a s t in flying pos i t i on 200 70 P o r t s ide of r a d a r - w e a t h e r c o n t r o l c o m p a r t m e n t 201 71 S t a r b o a r d s ide of r a d a r - w e a t h e r con t ro l c o m p a r t m e n t 201 72 M e t e o r o l o g i c a l o p e r a t o r ' s pos i t ion 201 73 S c h e m a t i c of flow m e t e r 202 74 An A - s c o p e c loud b a s e and top p r e s e n t a t i o n 210 75 An A - s c o p e c loud b a s e and top p r e s e n t a t i o n 210 76 An A - s c o p e cloud b a s e and top p r e s e n t a t i o n 210 77 An A - s c o p e cloud b a s e and top p r e s e n t a t i o n 210 78 Cloud b a s e and top r e c o r d 211 79 Cloud b a s e and top r e c o r d 212 80 Cloud b a s e and top r e c o r d 213 81 Cloud b a s e and top r e c o r d 214 82 Cloud b a s e and top r e c o r d 215 83 P r e l i m i n a r y s k e t c h of A N / C P S - 9 s y s t e m , 223 84 P o w e r r e c e i v e d by SCR-615B ( P r ) f rom a l u m i n u m s p h e r e t a r g e t 228 85 R e s u l t s of b e a m p a t t e r n m e a s u r e m e n t s in h o r i z o n t a l and v e r t i c a l d i r e c t i o n s 228 86 E x a m p l e s of da t a showing s i m u l t a n e o u s m e a s u r e m e n t s of r a d a r s igna l i n t ens i ty , ,
and r a i n r a t e , p 230 87 S u m m a r y of r a i n data 231 88 Re la t ion b e t w e e n r a d a r s ignal i n t ens i ty and r a i n r a t e 232 89 S imul t aneous m e a s u r e m e n t s on the pu lse i n t e g r a t o r and the H u d s o n - J a r d i ra in gage . . 233 90 Upper h a l f - p o w e r point of b e a m as a function of b e a m width and range 236 91 A P Q - 1 3 and 584 s c o p e p i c t u r e s 236 92 In tense s t o r m on A P S - 1 5 237
15
F i g u r e P a g e
93 S t o r m c a u s i n g l o s s o f r a n g e m a r k e r s and t e s t s igna l 237 94 S c a t t e r e d s t o r m s wi th v ideo c i r c u i t s mod i f i ed to r e d u c e the shadow 237 95 Effect of gage d e n s i t y on i s o h y e t a l p a t t e r n 242 96 R a d a r s t a t ion at U n i v e r s i t y of I l l inois a i r p o r t 243 97 Rada r wi th a u t o m a t i c r e c e i v e r s ens i t i v i t y and c a m e r a c o n t r o l 243 98 A i r p o r t r a d a r s t a t ion and Goose C r e e k r a i n gage n e t w o r k 244 99 I sohye t a l and i s o e c h o p a t t e r n s 245
100 I s o h y e t a l and i soecho p a t t e r n s . . . . 246 101 I s o h y e t a l and i s o e c h o p a t t e r n s 247 1.02 S t o r m r a i n f a l l p a t t e r n as s e e n by r a d a r a n d by r a i n g a g e s 248 103 S t o r m r a in fa l l p a t t e r n a s s e e n by r a d a r a n d r a i n gages 249 104 S t o r m r a in fa l l p a t t e r n as s e e n by r a d a r and r a i n gages 250 105 S t o r m ra in fa l l p a t t e r n as s e e n by r a d a r and r a i n gages 251 106 P o w e r - r a n g e fac to r v s . r a i n f a l l in tens i ty 252 107 D i s t r i b u t i o n laws of s igna l a m p l i t u d e , i n t ens i ty and i n t ens i t y l e v e l 256 108 P r o b a b i l i t y d i s t r i b u t i o n of s igna l in t ens i ty ( A 2 ) , t yp ica l t r a c e s of independent A2
v a l u e s , e t c 256 109 The p r o b a b i l i t y d i s t r i b u t i o n of JK 257 110 L i m i t s below which 2 . 5 , 10, 25, 75, 90 a n d 9 7 . 5 % of the a v e r a g e s of k i ndependen t
v a l u e s of A2 may be e x p e c t e d to l ie 257 111 F l u c t u a t i o n s in 258 112 Simpl i f ied h o d o g r a p h s 258 113 Typ ica l hodograph 258 114 T r a c e s of computed s igna l amp l i t ude A 259 115 Vec to r d i a g r a m 259 116 C o m p a r i s o n of the a v e r a g e s of v a l u e s of A2 260 117 T r a c e s for two t y p i c a l h a l f - p u l s e l eng ths of A, e tc 260 118 Moving a long b e a m t h r o u g h r a n g e i n t e r v a l h / 2 , o r scann ing t h r o u g h Φ 260 119 T y p i c a l a p p e a r a n c e of a s e c t i o n of a b r i g h t n e s s - m o d u l a t e d d i s p l a y 261 120 Same as 119 excep t t ha t a m p l i t u d e s in adjoining r o w s a r e independent 261 121 T r a n s m i s s i o n of a s imp le f i l t e r in cont inuous f r equency a n a l y s i s 265 122 I n c r e a s e in effect ive band width with i n c r e a s e in speed 265 123 F r e q u e n c y lag in p e a k t r a n s m i s s i o n 266 124 P o w e r t r a n s m i t t e d by a f i l t e r in cont inuous a n a l y s i s 266 125 Vec to r d i a g r a m i l l u s t r a t i n g the s c a t t e r i n g f r o m a h o r i z o n t a l l y o r i e n t e d p r o l a t e
e l l i p s o i d 269 126 V a r i a t i o n of s c a t t e r e d in t ens i ty wi th a x i a l r a t i o for obla te and p r o l a t e s p h e r o i d s
of w a t e r 271 127 Same as F i g . 126 excep t for i ce a t a l l wave lengths 272 128 The v a r i a t i o n of d e p o l a r i z a t i o n r a t i o with a x i a l r a t i o for ob la te and p r o l a t e s p h e r o i d s
of w a t e r . . , 272 129 The v a r i a t i o n of the p r i m a r y component of the s c a t t e r e d r a d i a t i o n for oblate p a r t i c l e s . 273 130 The v a r i a t i o n of the p r i m a r y componen t of the s c a t t e r e d r a d i a t i o n for p r o l a t e spheroids 274 131 The v a r i a t i o n of the d e p o l a r i z a t i o n r a t i o for p ro l a t e s p h e r o i d s 275 132 C r o s s - s e c t i o n of op t ica l d i s d r o m e t e r 285 133 Opt ica l d i s d r o m e t e r 286 134 Ground r a d a r s c o p e p h o t o g r a p h s 287 135 C r o s s - s e c t i o n of w e a t h e r and r a d a r p i c t u r e 288 136 Smoothed r a i n d r o p s i ze d i s t r i b u t i o n s - a n d t e m p e r a t u r e d u r i n g 3 r u n s 289 137 C o m p a r i s o n of l iquid w a t e r content as d e t e r m i n e d by the d i s d r o m e t e r v s . c a p i l l a r y
c o l l e c t o r . . . 290 138 Drop d i s t r i b u t i o n c u r v e s for v a r i o u s l iquid w a t e r con ten t s 290 139 Effect of s a m p l i n g a r e a on s t a t i s t i c a l a c c u r a c y 290 140 C r o s s - s e c t i o n of i m p a c t o m e t e r 290 141 E x a m p l e of i m p a c t o m e t e r c a m e r a f i lm 291 142 Nylon s amp l ing e l e m e n t showing de t achab l e p l a s t i c d i a p h r a g m . 293 143 P a p e r nega t i ve of r a in f a l l s a m p l e on nylon s c r e e n 294
16
Figure Page
144 Nylon screen calibration curve 294 145 Nomogram for rainfall sample . . 295 146 Z - R relationship for 63 rain samples at Cambridge, Massachusetts 296 147 Cameras in ceiling of radar operating room 306 148 Radar console 306 149 Camera used to obtain 8" x 10" negatives 306 150 Plotting rain a r ea s . . . . . . . . . 306 151 I F frequency response curves . . . . . . . . . . 307 152 Print from 8" x 10" plate back camera 308 153 Pr in t from 8" x 10" plate back camera 308 154 Positive and negative t ransparenc ies laid on top of each o the r . 309 155 RHI presentation on P P I scan with base line . . . . . 311 156 RHI presentation on P P I scan without base l i ne . . 311 157 Rain echoes showing on the "A" scope 313 158 Present radar radome - Dow Chemical Co . , Freepor t , Texas 314 159 Radar tower during construction - Dow Chemical Co 314 160 Temporary installation used during 1949 - Dow Chemical Co 315
DEDICATION OF THE WATER RESOURCES BUILDING
FOREWORD
The fol lowing a r e r e m a r k s m a d e b y D i r e c t o r Engle and Dean L a r s e n a t the banque t ded ica t ing the new Wate r R e s o u r c e s Bu i ld ing ; t h i s b a n q u e t w a s h e l d T u e s d a y e v e ning, October 2, 1951, in the g r a n d b a l l r o o m of the I l l ini M e m o r i a l Union Building, Urbana .
PRESENTATION OF THE WATER RESOURCES BUILDING TO THE UNIVERSITY OF ILLINOIS
BY C. HOBART ENGLE*
I t is i ndeed a p l e a s u r e for me to be h e r e t h i s evening and to b r ing you the g r e e t i n g s of G o v e r n o r Stevenson. We in the State Admin i s t r a t i on r e c o g nize the fine and i m p o r t a n t work be ing done by the W a t e r S u r v e y . I s h a l l n e v e r f o r g e t the t i m e , a s a y o u n g s t e r , I m a d e my f i r s t v i s i t to Ca l i fo rn ia . A s w e c r o s s e d f r o m p l e a s a n t , g r e e n , vege t a t ed a r e a s in to the b a r r e n d e s e r t , the v a l u e o f w a t e r b e c a m e obvious to m e . In my p r e s e n t capac i ty I have come to apprecia te m o r e the g r e a t impor t ance of w a t e r .
The D e p a r t m e n t of Reg i s t r a t ion and Educat ion h a s r e c e i v e d l e t t e r af ter l e t t e r of c o m m e n d a t i o n . These come f rom communi t i e s , f r o m c i t i e s , f r o m i n d u s t r i e s and r a i l r o a d s , in a p p r e c i a t i o n for the a s s i s t a n c e r e c e i v e d f r o m the W a t e r Survey i n w a t e r s u p p l y p r o b l e m s . I no te one v e r y i n t e r e s t i n g s e r i e s of c o r r e s p o n d e n c e w i t h a r a i l r o a d which had a s k e d the Water Survey for in format ion on ava i l ab i l i t y of w a t e r along i ts r i g h t - o f - w a y and had r e c e i v e d a c o m p r e h e n s i v e r e p o r t pointing to loca t ions w h e r e p r o s p e c t i v e i n d u s t r i e s might find w a t e r s u p p l i e s t o su i t t h e i r n e e d s . Th i s i s only
*Director, Department of Registration and Education, State of Illinois, Springfield, Illinois.
one of the m a n y c a s e s in which the W a t e r Su rvey s e r v e s the i n t e r e s t s of the S ta t e of I l l i no i s in the f ie ld of w a t e r r e s o u r c e s .
The Wate r R e s o u r c e s Bu i ld ing wh ich we a r e dedicat ing, cost s l ight ly in e x c e s s of half a mi l l i on d o l l a r s . M o s t o f y o u p r e s e n t t h i s e v e n i n g have inspec ted this s t r u c t u r e during th i s c o n f e r e n c e . I wou ld l i k e t o c o m m e n d D r . A r t h u r M . Buswe l l , Chief, and the h i g h l y c o m p e t e n t m e m b e r s of the W a t e r Survey staff for t h e i r a t t en t i on t o the m o s t minu te de ta i l s in the des ign and layout of th i s fine working h e a d q u a r t e r s .
Th i s building w a s c o n s t r u c t e d wi th funds a p p r o p r i a t e d to the D e p a r t m e n t of R e g i s t r a t i o n and E d u c a t i o n . The I l l ino is c ivi l a d m i n i s t r a t i v e code r e q u i r e s tha t the funct ions and du t i e s of the State W a t e r Survey sha l l b e e x e r c i s e d a t the U n i v e r s i t y of I l l inois , in cooperat ion with the Univers i ty staff, a n d in U n i v e r s i t y b u i l d i n g s . In c o m p l i a n c e with t h i s code, I de l ive r to you, Dean L a r s e n , th i s key to the Wate r R e s o u r c e s Bui ld ing , with the a s s u r a n c e t ha t in t h e s e new q u a r t e r s , the a c t i v i t i e s of the Water Survey, in coopera t ion with the Un ive r s i ty , will m o r e effectively s e r v e to solve the m a n y i m p o r t a n t wa te r p r o b l e m s in I l l i no i s .
17
ACCEPTANCE OF THE WATER RESOURCES BUILDING BY THE UNIVERSITY OF ILLINOIS
BY HENNING LARSEN*
Acting on behalf of President Stoddard and the University, I am very pleased to accept, Mr. Engle, the wonderful new Water Resources Building that is now in full operation on the University campus.
As a professor of English, I have seldom r e a l ized the importance of water . We all take it for granted. And not till we meet with experts do we begin to rea l ize the great extent of the problems and app rec i a t e why the Universi ty and the State Water Survey Division should cooperate in the great effort of providing water for every purpose in this world. Once in a while even a professor of English realizes the need and importance of water. I happened to be in New York two years ago when we were told not to shave every day to save water . I had another pract ical experience some years ago
*Dean, College of Liberal Arts and Sciences, University of Illinois, Urbana, Illinois.
when I was younger and climbed Long1 s Peak. Our guide on one occasion cautioned us, "Don't drink on the way up; wait for lunch on t o p . " When we came to the top there was no snow, no puddle, and no drink; and then we found that a very imaginative cook had provided a lunch of hard-boiled eggs and peanut butter sandwiches! Even more, when later I sat for President Stoddard on the Board of Natural Resources, did I realize the whole of the problem.
We are proud to have Dr. Buswell, Water Survey Chief, as par t of the College of Liberal Ar ts and Sciences in the Department of Chemistry. I know Dr. Buswell and his staff will continue to cooperate and that the Universi ty will give his or ganization its full support. The Water Resources Building is a creditable addition to our physical plant; on behalf of the University we accept it and say: Thank you very much for providing it.
18
EARLY DAYS AND ORGANIZATION OF THE ILLINOIS STATE WATER SURVEY
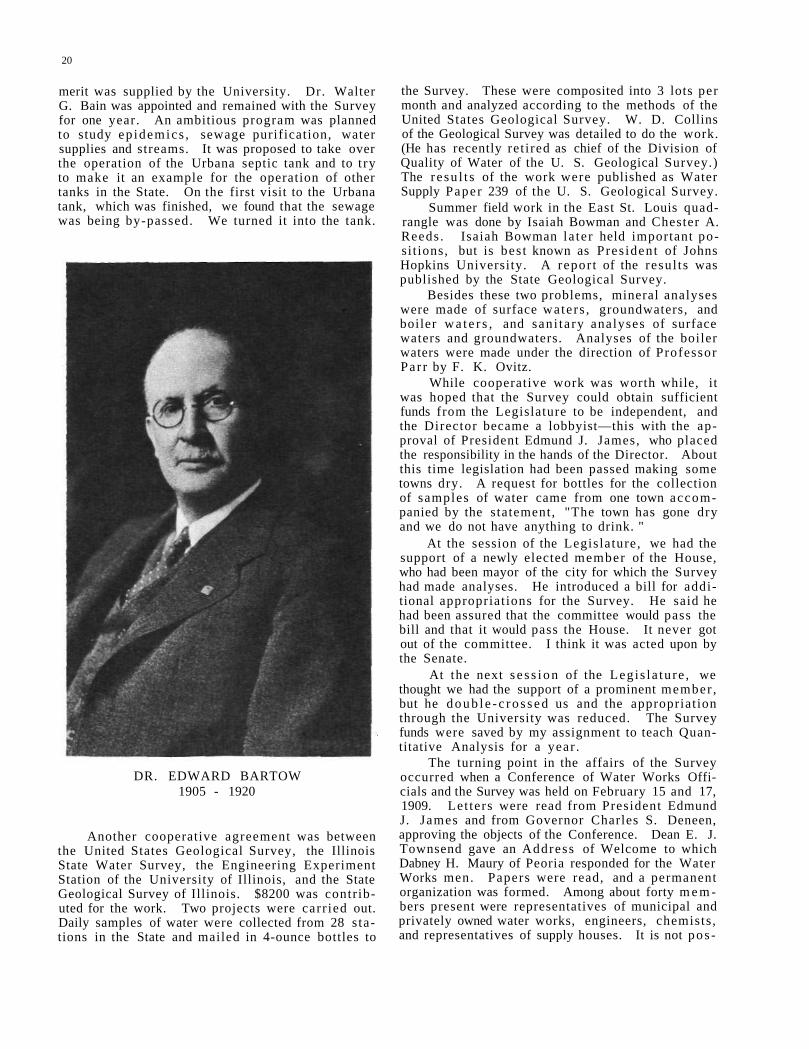
BY EDWARD BARTOW*
The Illinois State Water Survey was e s t a b l i s h e d in 1895 by the T r u s t e e s of the Universi ty of I l l i no i s . I t w a s the object t o m a k e c h e m i c a l e x a m i n a t i o n s of the w a t e r s of the State to de t e rmine the s a n i t a r y condit ion of any dr ink ing water used by c i t i zens of the State .
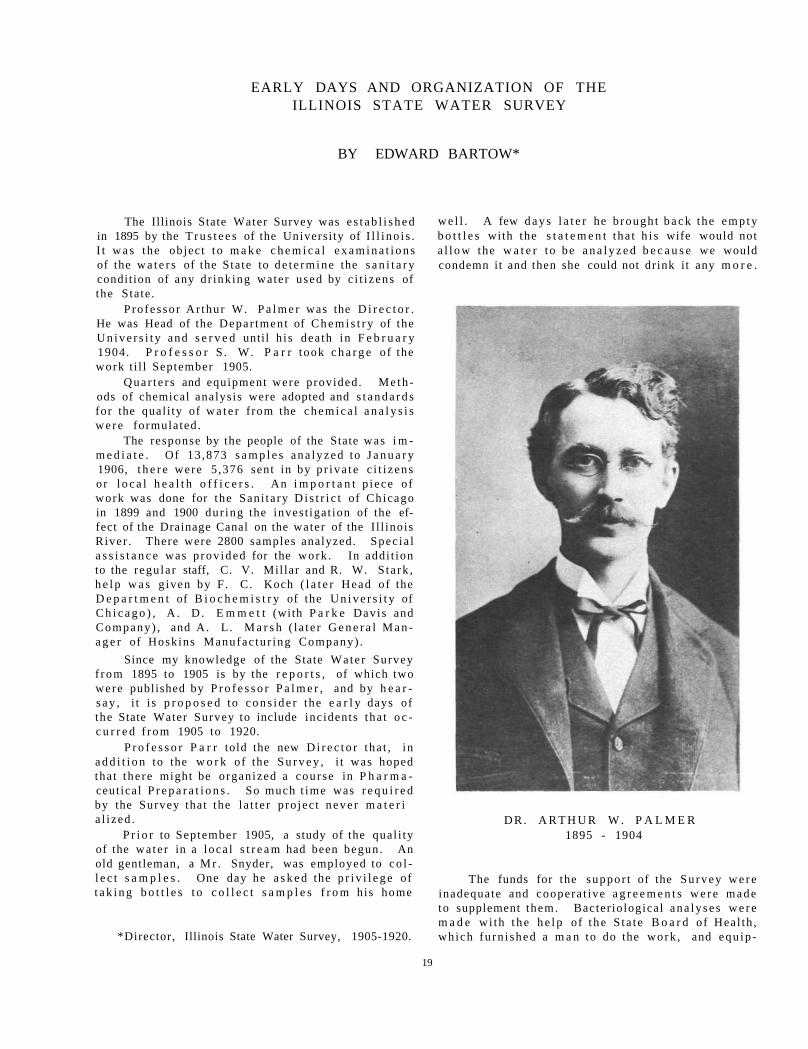
P ro fes so r Ar thur W. P a l m e r was the D i r e c t o r . He was Head of the Depar tmen t of C h e m i s t r y of the U n i v e r s i t y and s e r v e d until h i s dea th in F e b r u a r y 1904. P r o f e s s o r S . W. P a r r took c h a r g e of the work t i l l September 1905.
Qua r t e r s and equipment were provided. M e t h ods of chemical analysis were adopted and s t a n d a r d s for the qual i ty of w a t e r f rom the c h e m i c a l a n a l y s i s w e r e formulated.
The response by the people of the State was i m m e d i a t e . Of 13 ,873 s a m p l e s a n a l y z e d to J a n u a r y 1906, t h e r e were 5 ,376 sent in by p r i v a t e c i t i z ens or l o c a l h e a l t h o f f i c e r s . An i m p o r t a n t p iece of work was done for the Sani ta ry D i s t r i c t of Chicago in 1899 and 1900 dur ing the inves t igat ion of the effect of the Drainage Canal on the water of the I l l inois River . There were 2800 samples analyzed. Spec ia l a s s i s t a n c e was p rov ided for the work . In addi t ion to the regu la r staff, C. V. Mil lar and R. W. S ta rk , h e l p w a s g iven by F . C . Koch ( l a t e r Head of the D e p a r t m e n t of B i o c h e m i s t r y of the U n i v e r s i t y of C h i c a g o ) , A . D . E m m e t t (with P a r k e Davis and Company) , and A. L . M a r s h ( l a t e r G e n e r a l M a n a g e r of Hoskins Manufac tu r ing Company) .
Since my knowledge of the State Wate r Survey f r o m 1895 to 1905 is by the r e p o r t s , of which two were published by P r o f e s s o r P a l m e r , and by h e a r s a y , i t i s p r o p o s e d to c o n s i d e r the e a r l y days of the State Water Survey to include incidents tha t o c c u r r e d f r o m 1905 to 1920.
P r o f e s s o r P a r r told the new D i r e c t o r tha t , in a d d i t i o n to the w o r k of the S u r v e y , i t was hoped tha t the re might be organized a course in P h a r m a ceut ical P r e p a r a t i o n s . So much t ime was r e q u i r e d by the Survey that the l a t t e r p ro jec t n e v e r m a t e r i a l i zed .
P r i o r to September 1905, a study of the qual i ty of the wa te r in a loca l s t r e a m had been begun. An old gentleman, a M r . Snyder, was employed to c o l l e c t s a m p l e s . One day he a s k e d the p r i v i l e g e of t a k i n g b o t t l e s t o c o l l e c t s a m p l e s f r o m his home
*Director, Illinois State Water Survey, 1905-1920.
w e l l . A few d a y s l a t e r he b rough t b a c k the e m p t y b o t t l e s with the s t a t e m e n t tha t h i s wife would not a l l o w the w a t e r to be a n a l y z e d b e c a u s e we would condemn it and then she could not drink it any m o r e .
D R . A R T H U R W . P A L M E R 1895 - 1904
The funds for the suppor t of the Su rvey w e r e inadequate and coopera t ive a g r e e m e n t s w e r e m a d e to supplement them. Bacter iological ana ly se s w e r e m a d e wi th t h e h e l p of t h e S ta t e B o a r d of Heal th , which fu rn i shed a m a n to do the work , and equ ip -
19
merit was supplied by the University. Dr. Walter G. Bain was appointed and remained with the Survey for one year. An ambitious program was planned to study ep idemics , sewage purification, water supplies and streams. It was proposed to take over the operation of the Urbana septic tank and to t ry to make it an example for the operation of other tanks in the State. On the first visit to the Urbana tank, which was finished, we found that the sewage was being by-passed. We turned it into the tank.
DR. EDWARD BARTOW 1905 - 1920
Another cooperative agreement was between the United States Geological Survey, the Illinois State Water Survey, the Engineering Experiment Station of the University of Illinois, and the State Geological Survey of Illinois. $8200 was contributed for the work. Two projects were carr ied out. Daily samples of water were collected from 28 s tations in the State and mailed in 4-ounce bottles to
the Survey. These were composited into 3 lots per month and analyzed according to the methods of the United States Geological Survey. W. D. Collins of the Geological Survey was detailed to do the work. (He has recently ret i red as chief of the Division of Quality of Water of the U. S. Geological Survey.) The r e su l t s of the work were published as Water Supply Paper 239 of the U. S. Geological Survey.
Summer field work in the East St. Louis quadrangle was done by Isaiah Bowman and Chester A. Reeds . Isaiah Bowman la te r held important posi t ions, but is bes t known as Pres ident of Johns Hopkins University. A repor t of the resul ts was published by the State Geological Survey.
Besides these two problems, mineral analyses were made of surface waters , groundwaters, and boiler w a t e r s , and sani ta ry analyses of surface waters and groundwaters. Analyses of the boiler waters were made under the direction of Professor Par r by F. K. Ovitz.
While cooperative work was worth while, it was hoped that the Survey could obtain sufficient funds from the Legislature to be independent, and the Director became a lobbyist—this with the approval of President Edmund J. James, who placed the responsibility in the hands of the Director. About this time legislation had been passed making some towns dry. A request for bottles for the collection of samples of water came from one town accompanied by the statement, "The town has gone dry and we do not have anything to drink. "
At the session of the Legislature, we had the support of a newly elected member of the House, who had been mayor of the city for which the Survey had made analyses. He introduced a bill for additional appropriat ions for the Survey. He said he had been assured that the committee would pass the bill and that it would pass the House. It never got out of the committee. I think it was acted upon by the Senate.
At the next s e s s i o n of the Legis la tu re , we thought we had the support of a prominent member , but he d o u b l e - c r o s s e d us and the appropriation through the University was reduced. The Survey funds were saved by my assignment to teach Quantitative Analysis for a year .
The turning point in the affairs of the Survey occurred when a Conference of Water Works Officials and the Survey was held on February 15 and 17, 1909. Let ters were read from President Edmund J. James and from Governor Charles S. Deneen, approving the objects of the Conference. Dean E. J. Townsend gave an Address of Welcome to which Dabney H. Maury of Peoria responded for the Water Works men. Papers were read, and a permanent organization was formed. Among about forty m e m bers present were representatives of municipal and privately owned water works, engineers, chemists , and representatives of supply houses. It is not pos -
20
21
sible to men t ion a l l of those p r e s e n t , but i t should be noted tha t R. W. Bingham was r e g i s t e r e d f r o m the Danvi l le W a t e r Company . At the t i m e he was p u b l i s h e r o f the L o u i s v i l l e C o u r i e r J o u r n a l and l a t e r was A m b a s s a d o r t o G r e a t B r i t a i n . C h a r l e s Boeschens t e in , S e c r e t a r y , Vice P r e s i d e n t - T r e a s u r e r of the E d w a r d s v i l l e W a t e r Company , was a prominent Democrat ic official, National C o m m i t t e e m a n for I l l i no i s . M r . G e o r g e J . Long r e g i s t e r e d as P r e s i d e n t of the Danvil le W a t e r Company . He was Pres iden t of a large s teel company and a w inne r of the Kentucky D e r b y .
A c o m m i t t e e of the W a t e r Supply A s s o c i a t i o n went to Springfield. The Leg i s l a tu re was n o n p a r t i s a n i n i t s d e a l i n g wi th the W a t e r S u r v e y . When t h e c o m m i t t e e , i n c l u d i n g M r . H e n r y M o r g a n , a D e m o c r a t , G e n e r a l M a n a g e r o f the P e o r i a W a t e r C o m p a n y ( M r . M o r g a n h a d b e e n p o s t m a s t e r o f P e o r i a dur ing both of C leve land ' s a d m i n i s t r a t i o n s ) walked on the f loor of the H o u s e , M r . G o r m a n , a D e m o c r a t , a leading m e m b e r of the House and the r e p r e s e n t a t i v e f r o m P e o r i a , g r e e t e d h i m wi th , "How a r e you, H e n r y ? W h a t can I do for y o u ? " Mr . Morgan quietly said, " I am he re in the i n t e r e s t of the W a t e r S u r v e y b i l l . I would l ike to see the S p e a k e r . " " R i g h t t h i s w a y , " s a i d M r . G o r m a n , and we w e r e a l l u s h e r e d in to the office of the R e publ ican S p e a k e r .
The L e g i s l a t u r e in 1911 m a d e an a p p r o p r i a t ion so that we could employ engineers and e s t a b l i s h a n e n g i n e e r i n g d i v i s i o n . T h e a p p r o p r i a t i o n was $ 15, 0 0 0 . T h e p r e v i o u s a p p r o p r i a t i o n had b e e n $ 3 , 0 0 0 .
When a v i s i t was pa id to the l a b o r a t o r y of t h e State Board of Health of Massachuse t t s at L a w r e n c e , t h e D i r e c t o r s t a t e d t ha t h e e m p l o y e d h igh s choo l g r a d u a t e s a s t h e y did no t l e a v e h i m . I t was the pol icy of the Water Survey to t r a i n men to t ake p o sitions e lsewhere. One of our men became D i r e c t o r of the Lawrence Labora to ry .
I t is not poss ib le to ment ion a l l of the m e n who have been connected with the Survey and to t e l l wha t t hey a r e doing or have done . I wil l r e f e r you to a manuscr ip t of an Autobiography that has t r i e d to t e l l i t i n 4 5 p a g e s . T h e fo l lowing a r e s o m e tha t a r e known to many of you:
The f i r s t M. S. was g r an t ed to Jus ta L i n d g r e n . Then followed Lewis I . B i r d s a l l , who h a s j u s t r e t i r e d f r o m the h e a d s h i p of t h e Div i s ion for W a t e r T r e a t m e n t C h e m i c a l s o f t h e G e n e r a l C h e m i c a l Company. F r a n k B a c h m a n was San i t a ry E n g i n e e r for the D o r r Company. W. F . Lange l i e r i s A s s o ciate P r o f e s s o r of Sani ta ry Engineer ing a t the U n i v e r s i t y o f C a l i f o r n i a . F r e d Wi lbu r T a n n e r h a s been head of the Depa r tmen t of Bac te r io logy at the U n i v e r s i t y of I l l ino i s . F l o y d Wi l l iam Moh lman is
Chief C h e m i s t of the S a n i t a r y D i s t r i c t of Ch icago . C h a r l e s H e r b e r t Spaulding was for m a n y y e a r s i n charge of the water purif icat ion p lant at Springfield, Il l inois. William D. Hatfield is in charge of the s e w age pur i f ica t ion plant a t D e c a t u r , I l l ino i s . F r i e n d Lee Mickle is Direc tor of the Bureau of L a b o r a t o r i e s of the State Board of Health of Connect icut . R o b e r t E. Greenfield is General Manager of the A. E. S ta ley Manufacturing Company factory at Decatur , I l l i no i s . Sidney D. Kirkpatr ick is Consulting Editor for s o m e of the M c G r a w - H i l l pub l i ca t ions and, I be l i eve , a v ice p r e s i d e n t of the c o m p a n y . Otto M. Smi th i s h e a d of the D e p a r t m e n t of C h e m i s t r y and C h e m i ca l E n g i n e e r i n g a t the O k l a h o m a A g r i c u l t u r a l and M e c h a n i c a l C o l l e g e . C . C . L a r s o n i s i n c h a r g e of the Water Purif icat ion and Sewage Disposa l P l a n t o f S p r i n g f i e l d , I l l i n o i s . G a i l P . E d w a r d s , after, holding v a r i o u s p l a c e s i n w a t e r and sewage p u r i fication, is now a professor in New York Un ive r s i t y . Robert C. Bardwel l is Superintendent of Water S e r vice of the Chesapeake and Ohio Railway. Eli Mande l i s chemist for the Commonweal th Edison Company . Wi l l i am C. M a r t i i s h e a d c h e m i s t for the Ch icago Department of Health, Car l J. Lauter is chief c h e m i s t of the Wash ing ton , D. C. f i l t r a t i on p lant , and A r t h u r F . Mel lon i s supe r in t enden t o f f i l t ra t ion a t Minneapo l i s . We a r e p r o u d of the p a r t t h e s e m e n have t a k e n in he lp ing to obtain p u r e w a t e r for the c o u n t r y .
These and other m e m b e r s of the staff and g r a d uate students have made possible not only the rou t ine a n a l y s e s , b u t m a n y r e s e a r c h e s , t ha t have b e e n m a d e the b a s i s for t h e s e s , have been pub l i shed in the 14 r e p o r t s of the State Water Survey f rom 1905 to 1920.
T h e s e r e s e a r c h e s inc lude s t u d i e s o f the u s e of bleaching powder for s t e r i l i z i n g wa te r s u p p l i e s , the ac t iva ted sludge p r o c e s s ( s e v e r a l p a p e r s ) , the r e m o v a l of i r o n f r o m the U n i v e r s i t y and ci ty s u p p l y , p o l l u t i o n o f L a k e M i c h i g a n by w a s t e s f r o m the C o r n P r o d u c t s f a c t o r y a t Waukegan , the f i r s t e x p e r i m e n t s with P e r m u t i t in t h e U . S . A . I t m i g h t a l s o b e m e n t i o n e d t ha t the W a t e r Su rvey sen t a l l i t s e n g i n e e r i n g ' staff to the Ohio R i v e r dur ing the g r e a t flood of 1913. The I l l inois Water Supply A s soc ia t ion , founded under S u r v e y s p o n s o r s h i p , b e came the f i r s t section of the Amer ican Water W o r k s Association.
In conclusion, while I have many pages of m a n u s c r i p t in the A u t o b i o g r a p h y , I wi l l c l o s e with the s t a t e m e n t t h a t t h e a n n u a l a p p r o p r i a t i o n for the W a t e r S u r v e y i n c r e a s e d f r o m $ 3 , 000 t o $ 3 5 , 000 f rom 1905 to 1920; i t i s nothing c o m p a r e d to wha t h a s happened s ince . I wish the Survey and i t s staff continued s u c c e s s .
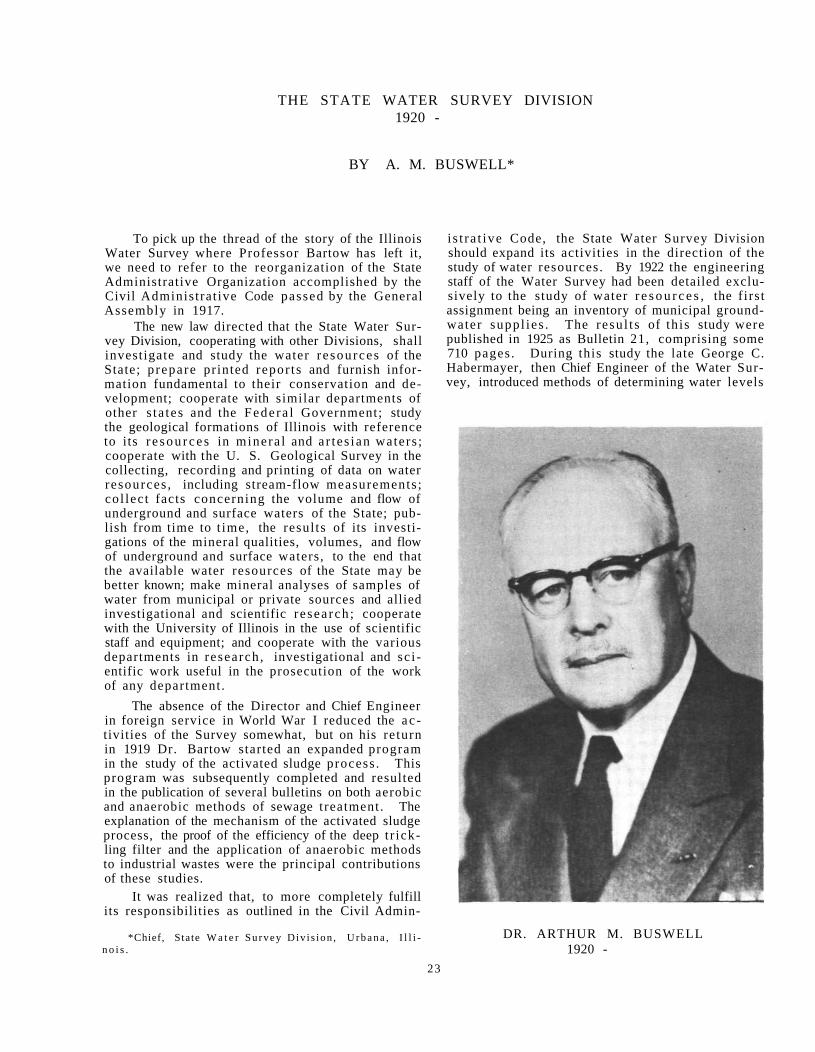
THE STATE WATER SURVEY DIVISION 1920 -
BY A. M. BUSWELL*
To pick up the thread of the story of the Illinois Water Survey where Professor Bartow has left it, we need to refer to the reorganization of the State Administrative Organization accomplished by the Civil Administrat ive Code passed by the General Assembly in 1917.
The new law directed that the State Water Survey Division, cooperating with other Divisions, shall investigate and study the water r e sources of the State; p repare printed repor ts and furnish information fundamental to their conservation and development; cooperate with similar departments of other s ta tes and the Fede ra l Government; study the geological formations of Illinois with reference to its r e s o u r c e s in minera l and a r tes ian waters ; cooperate with the U. S. Geological Survey in the collecting, recording and printing of data on water resources , including stream-flow measurements ; col lec t facts concerning the volume and flow of underground and surface waters of the State; publish from time to t ime, the resul ts of its investigations of the mineral qualities, volumes, and flow of underground and surface waters, to the end that the available water resources of the State may be better known; make mineral analyses of samples of water from municipal or private sources and allied investigational and scientific r e sea rch ; cooperate with the University of Illinois in the use of scientific staff and equipment; and cooperate with the various departments in research , investigational and sc i entific work useful in the prosecution of the work of any department.
The absence of the Director and Chief Engineer in foreign service in World War I reduced the ac tivities of the Survey somewhat, but on his return in 1919 Dr. Bartow started an expanded program in the study of the activated sludge process . This program was subsequently completed and resulted in the publication of several bulletins on both aerobic and anaerobic methods of sewage treatment. The explanation of the mechanism of the activated sludge process, the proof of the efficiency of the deep t r ickling filter and the application of anaerobic methods to industrial wastes were the principal contributions of these studies.
It was realized that, to more completely fulfill its responsibilities as outlined in the Civil Admin-
*Chief, State W a t e r Survey Div i s ion , U r b a n a , I l l i n o i s .
i s t ra t ive Code, the State Water Survey Division should expand its activities in the direction of the study of water resources. By 1922 the engineering staff of the Water Survey had been detailed exclusively to the study of water r e s o u r c e s , the f irs t assignment being an inventory of municipal groundwater suppl ies . The resu l t s of th is study were published in 1925 as Bulletin 21, comprising some 710 pages . During this study the late George C. Habermayer, then Chief Engineer of the Water Survey, introduced methods of determining water levels
DR. ARTHUR M. BUSWELL 1920 -
23
in wells and emphasized the importance of well yield tests wherever possible. Following the inventory of groundwater supplies, a study of surface water supplies was undertaken. Various typical r e s e r voirs were selected throughout the State, rain gages and staff gages were installed, and arrangements made to employ local gage r eade r s to begin collecting data necessary for calculating the yield of a given watershed a rea .
At this t ime the cooperative s t ream-gaging program with the U. S. Geological Survey was provided for by a biennial appropriation of $6, 000 running to the Illinois Division of Waterways. This appropriation was not considered adequate, and in 1933 the respons ib i l i ty for cooperative work on stream-gaging was t ransferred to the State Water Survey Division and the biennial appropriation increased to $10,800. This appropriation has been repeatedly inc reased and at p resen t amounts to $42,000.
The serious drought of 1936 resulted in a shortage of water supplies, both surface and ground, in many localities. This situation was aggravated by the tremendous industrial expansion during the early war years . To meet the increased need for study of water resources , the Legislature made an appropriation to the Water Survey of $100,000 at a special session called in the early spring of 1942. This appropriation made it possible to collect what has subsequently been found to be invaluable data on water recessions in important industrial a reas and to point out methods for supplementing these supplies.
The chemical work of the Water Survey, which f irst began in the analyt ical laboratory and then passed to the experimental sewage treatment plant, has during the last 15 years shifted its emphasis to the question of quality of water for industrial uses and with pa r t i cu la r emphas is on corrosion problems and newer water-softening methods. The regular analytical p rogram has , of course, been continued.
During the period of World War II the chemical staff of the Water Survey devoted its entire time to cooperating with the University of Illinois and the Chemical Warfare Service in the study of the detection of chemical warfare agents in water and the development of methods for their removal . Two defense weapons were developed as a result of this program. These weapons were taken over by the Army and produced in quantity for use in case toxic chemicals were employed in warfare.
PRESENT ORGANIZATION
The Water Survey Division is now departmentalized into the following technical Subdivisions: Engineering, Engineering Research , Chemistry, Chemical Research .
The Engineering Subdivision is concerned with g roundwa te r and su r face water hydrology, the Champaign hydrologic labora tory , meteorology, municipal groundwater surveys , r e se rvo i r sedimentation.
The Engineering Research Subdivision is r e sponsible for groundwater studies in the Peor ia region and for the infiltration pit and laboratory located at Peor ia , for groundwater studies in the Chicago-Joliet region, and at Cairo.
The Chemical Subdivision is concerned with chemical analysis of waters in Illinois and for r e search on the propert ies of water and on methods of treatment of the various waters for various u se s . The correlat ion and quantitative interpretation of analytical data with respect to hydrology is an important activity of this subdivision.
Under Chemical Resea rch the Water Survey is working in the field of supersonics; chemistry of water substance, in cooperation with the Navy and the University Department of Chemistry; and nitrification studies in cooperation with the U. S. Public Health Service.
ENGINEERING
GROUNDWATER SERVICES
Individuals and organizations in Illinois send many requests for groundwater information to the Water Survey. During the year 1950, there were 423 repor ts prepared in answer to these reques ts , many of which consisted of summaries of the exis t ing data on groundwater developments and poss i b i l i t i e s , p r e p a r e d in cooperat ion with the State Geological Survey.
An average of 80 pumping tes ts of wells a r e made by staff members each year .
Wate r - leve l r e c o r d e r s a r e maintained in 85 observation wells, and data on water levels a r e r e corded for some 1500 additional wells. This intensive groundwater data-collecting program topping the hal f -century ' s existence of the Water Survey, during which a very considerable l ibrary of basic data had been assembled, resulted in the publication in 1951 of Bulletin No. 40, comprising 1379 pages and entitled, "Public Ground-water Supplies in Illinois."
AREAL GROUNDWATER STUDIES
In May 1939 the Peor i a Association of Commerce requested the Water Survey to make a study of the groundwater resources of the Peor ia -Pekin a r e a , the depletion of t he se r e s o u r c e s , and the remedy for obtaining adequate water resources for the a r e a . An intensive a r e a l investigation of all city and industrial well supplies was made. Total groundwater use in the a r ea is estimated to be 85
24
25
mgd. F rom this study it became evident that one of the best ways of replenishing Peor ia ' s groundwater resources would be through the construction of an infiltration pit. As early as 1943 the Board of Natura l Resources and Conservation passed a resolution which recognized that an emergency existed in the groundwater supply at Peoria and that an artificial recharging pit might be used to meet this emergency. On May 18, 1951, a permanent infiltration pit was placed in operation in the Peoria area. In 1949 the Water Survey staff for the Peor ia-Pekin region moved into a new three-story laboratory building constructed in the city of Peoria near the shore of the Illinois River, The infiltration pit is constructed between the laboratory building and the r iver .
CHICAGO-JOLIET AREA
Principal source of groundwater in the Chicago area is in the deep sandstones. Total groundwater use in the area is 83 mgd. The Water Survey maintains three field engineers in the a rea collecting water levels, pumpage data, and other information on groundwater.
EAST ST. LOUIS AREA
Water levels and pumpage data from wells in the American Bottoms are recorded routinely by a field engineer stationed in the area . The groundwater levels show few changes; however, the wells close to the Mississippi River rise somewhat, corresponding to the effect of the high r ive r s tages. Groundwater use totals nearly 100 mgd. in this one area, which is one of the most intensively developed sources of groundwater in the world. Use is steadily increasing. Three high-capacity groundwater collectors have been installed in recent years .
SURFACE WATER
Industrial Use. A study has been made of all industrial and irr igation uses of surface water in Illinois. Of the 10 billion gallons per day-used by industry, 0.85 billion gallons per day could be cons idered consumptive use and 9. 15 billion gallons pe r day nonconsumptive use. This amount is divided up amongst (1) manufacturers - 7 billion gallons per day, (2) steam power - 2. 8 billion gallons pe r day, and (3) minera l processing - 0 . 2 billion gallons per day.
Irrigation Use. There are approximately 200 irrigation systems in Illinois at present in five pr incipal categories: truck gardens, flowers, pasture, forestry, and corn. This represents an investment of over $500, 000, a potential capacity of 100,000 gallons per minute, and a total i r r iga ted area of
9,000 ac res . The water resources in use a r e p r i mari ly surface, with groundwater providing about 20 percent of the amount pumped.
STREAM GAGING
Stream-gaging activities are carr ied on under the usual cooperative arrangement with the Water Resources Branch of the U. S. Geological Survey in which costs are shared equally. There a r e now 156 s t ream-gaging stations in I l l inois. Study of the runoff cha rac t e r i s t i c s of Illinois watersheds using the stream-gaging data is ca r r i ed on in the Water Survey offices. Correlated with this study is a study of stream discharge relations, the physical character is t ics of the basins, surface re tention and detention and overland flow, infiltration r a t e s , and hydrograph analyses .
For nearly 30 years the Survey has maintained a research project on small watersheds in Illinois, which includes compilation of m e a s u r e m e n t s of precipitation, discharge, storage, and pumpage of the five water supply reservoi rs in Illinois.
RESERVOIR SEDIMENTATION
At the present t ime, sedimentation accumulation data are available on 41 reservoirs in Illinois. Most of this information has been collected during the las t 10 years under the cooperative r e sea rch agreement between the State Water Survey, the Soil Conservation Service, and the Illinois Agricultural Experiment Station. Detailed sedimentation surveys have been made on 18 rese rvo i r s , and reconnaissance surveys have been made on 17 r e s e r v o i r s . Cross-sections have been taken on six new r e s e r voirs during construction.
This program is furnishing results of value to waterworks officials who are responsible for the dependabil i ty of impounding r e s e r v o i r s . In the field of agriculture this program is furnishing data on sed iment product ion from known soi ls under various conditions.
METEOROLOGY
Of all hydrologic data, precipitation measu re ments have proved least trustworthy; however, the Water Survey's present program has begun to p ro duce data of much improved dependability. The pr inc ipa l phases of the p rog ram a r e : (1) the El Paso areal rainfall study, (2) the Goose Creek a rea l rainfall study, (3) Boneyard Creek hydrologic study (in cooperation with the Department of Civil Engineering, University of Illinois), (4) gaging installat ions in conjunction with other s t r e a m flow and groundwater studies, (5) auxiliary radar installations, and (6) the University Weather Station. The program involves approximately 60 automatic rain
26
gages. Results of the studies of rainfall m e a s u r e ment with radar have produced a quantitative r e l a tionship between radar signal strength and rainfall intensity.
The Weather Station makes approximately 2, 000 repor t s pe r year . Of these , 270 a r e to the U. S. Weather Bureau; 600 to University departments; to other organizations and individuals—1130.
The Water Survey maintains three Class "A" Weather Bureau-type pan evaporation stations in Illinois located at Carbondale, Urbana, and Rock-ford. In addition, there is the U. S. Weather Bureau station at Springfield, Illinois. Data collected at the Water Survey stations a r e published by the U. S. Weather Bureau. The Water Survey maintains a study of evaporation by determining vapor-pressure gradients through sensitive dewpoint r e corders at Four-Mile Crib located in Lake Michigan and at Urbana (in cooperation with the University of Illinois Department of Civil Engineering).
CHEMISTRY
ANALYTICAL METHODS AND ANALYSES
The need for new or especially modified methods for testing water has continued since the ear l ies t days of the organization. Recent contributions include methods for the determination of methane gas, sodium, ha rdness , control of sewage t reatment , and feed water for power plants.
Circular No. 31 gives complete chemical analyses of all public groundwater supplies in Illinois. This c i rcular , which includes a discussion on the significance of mine ra l ingredients in water , is the r e su l t of frequent r eques t s and considerable interest in the chemical quality of public water supplies aside from the physical data on the source of water.
The following annual s ta t i s t ics on analyses indicate the magnitude of the Water Survey laboratory work: bac te r io log ica l 1;856; minera l 184; part ial mineral 596; gas 6; special chemical tes ts 812. This gives a total of 3, 454 chemical analyses in an average year.
CORROSION
A survey of the corros ive character is t ics of Illinois water has made possible recommendations as to suitable materials for pumps, valves and other equipment. A large number of requests for such information are received regularly. The hydraulic laboratory offers opportunity to test corrosive a c tion under operating conditions.
WATER FOR STEAM POWER PLANTS
Recently the Water Survey has been assigned the control of feed water t rea tment for the power
plants at State institutions. Besides resulting substantial financial savings and improved operation, this work is developing information of value to many private industries.
Testing of New Techniques. The evaluation of new techniques in the solution of the problems of water chemistry is a continuing activity. The use of infrared spectroscopy, supersonics, exact specific g rav i t i es , solubil i t ies , t r a c e r isotopes and the s t ruc ture of water substance, are recent and cur rent topics under investigation.
PUBLICATIONS
The State Water Survey Division and its p r e dece s so r , Illinois State Water Survey, has published 40 Bulletins, 35 Ci rcu lars , and 15 Reports of Investigations.
WATER RESOURCES CONFERENCE
On October 1-3, 1951, a Water Resources Conference was held on the occasion of the dedication of the new Water Resources Building, housing the offices and labora tory of the State Water Survey Division, on the Universi ty of Illinois campus at Urbana.
There were more than 475 regis t ra t ions for the three concurrent p r o g r a m s of HYDROLOGY, TREATMENT, and RADAR-WEATHER. Nearly all of the registrants were from outside of Champaign-Urbana, and a large proportion were from outside the State of Illinois.
The sess ions for Hydrology and Treatment were held in the Illini Union and East Chemistry Buildings, respectively, located on the University of Illinois campus. The Radar-Weather sessions were held on the Allerton Estate 20 miles southwest of Champaign-Urbana, where all meetings, housing and meals were provided under one roof.
The very large attendance was very gratifying and may be attributed in part to the very high quality of the conference program and, to a large extent, to the careful planning and pre l iminary publicity. All m e m b e r s of the staff contributed unstintingly to the extra effort required to make the conference a success. The burden fell heaviest on Mr. H. E. Hudson, J r . , Mr. W. J. Rober t s , Mr. Glenn E. Stout, and Dr. T. E. Larson.
Seventy speakers took part . All of the papers presented at each of the sess ions were on topics of immediate interest and were warmly received, as indicated by both the p repa red and impromptu discussions. The State Water Survey Division is pleased to present this Bulletin No. 41, which contains the papers and prepared discussions as p r e sented, together with a t ranscr ip t of the oral d i s cussions, with the hope that it will be a valuable reference work for all in the field of Water Resources.

H Y D R O L O G Y
P r o g r a m Chairman
HERBERT E. HUDSON, JR.
Hydrology
Techn ica l s e s s i o n s to be held in Room 314, I l l ini Union Building.
MONDAY, OCTOBER 1
Registrat ion at Water R e s o u r c e s Buildin g, 605 Eas t Springfield Avenue, Champaign
* * *
Afternoon Sess ion Wallace M. Lansford , P r e s i d i n g
2:00 "Hydrology and the Hydraulic Labora tory , " A l b e r t S . F r y
2:30 Discuss ion: Arno T. Lenz , J. I . P e r r e y , C a r l E . Kindsva ter
3:00 D i s c u s s i o n f rom the floor
3:15 "Bed Load Funct ion for Sediment T r a n s p o r t a t i o n in Open Channe l F lows , "
Hans A. E ins te in 3:50 Discussion: Vito Vanoni,
Ralph W. Powel l 4:15 D i scus s ion f rom the floor 4:30 Adjournment
* * * Evening
6:30 Informal get-together, Urbana-Lincoln Hotel
Buffet supper . Foo tba l l and r a d a r mov ie s .
Morning
Hydrology TUESDAY, OCTOBER 2
Morning Sess ion Alex Van P r a a g , P r e s i d i n g
9:30 Panel discussion: "Sedimentation P r o b l e m s " L. C. Got t scha lk , Modera to r
9:35 " B a s i c Data Col lec t ion ," Gunnar Brune 9:50 "Application of Sedimentation Data to Water
P r o j e c t Des ign , " N. T. Veatch 10:05 " W a t e r s h e d A p p r o a c h to Sedimenta t ion
P r o b l e m s , " O. W. Chinn, Wendell LaDue
10:35 Di scuss ion from the floor
10:45 "Analysis and Use of Groundwater D a t a , " Wil l iam F. Guyton
11:20 Discussion: John H. Bliss , Howard C r i t c h -low, H. A. Spafford
11:50 Discuss ion from the floor
Afternoon Sess ion J . J . Doland, P r e s i d i n g
2:00 "Analysis and Use of Surface Water Data , " R icha rd Hazen
2:35 Discussion: E. F. Brater , W. D. Mitchel l , C. V. Youngquist
3:00 Di scuss ion from the floor
3:15 "Engineering Meteorology, " Stifel W. J ens 3:55 Discussion: George Benton, Ivan E. Houk,
Phi l l ip Light 4:20 Di scuss ion from the floor
* * *
5:30 Recept ion , Music Lounge, Second F l o o r , I l l ini Union Building
6:30 Banquet , Grand B a l l r o o m , Illini Union The p r o g r a m will include the ded ica
tion ceremony, and an address by C la rk M. Eichelberger, National Director , A m e r i c a n Associa t ion for the United Nations.
Hydrology
WEDNESDAY, OCTOBER 3
Morning Sess ion H o r a c e G r a y , P r e s i d i n g
9:30 P a n e l d i scuss ion : " W a t e r U s e " R. G. Sn ider , M o d e r a t o r
"Industry's Water Problems, " T. J. P o w e r s "The Nat iona l P i c t u r e , " Wal te r P ic ton "Hea l th A s p e c t s , " P a u l W. Reed "Industrial Conservation Methods,"
Howard E . Degle r
10:30 D i scus s ion f rom the f loor
10:45 "State Water P o l i c i e s , " Louis R. Howson 11:25 D i s c u s s i o n : R . O. J o s l y n , Thornd ike
Savil le 11:50 D i scus s ion f rom the floor
Afternoon Sess ion
2:00-5:00 Conference of State Water R e s o u r c e s Agencies
This s e s s i o n includes the r epo r t i ng of r e su l t s of a q u e s t i o n n a i r e s en t to a l l S ta te Wate r Agencies in the Nation on collection of bas ic data . These da ta wi l l be s u m m a r i z e d a t the mee t ing . D i s c u s s i o n of a d m i n i s t r a t i v e , f i s ca l , and other s t a t e p r o b l e m s is being p lanned by a commi t t ee consis t ing of C. V. Youngquist, Cha r l e s Beche r t , Howard Critchlow, T. E. Larson, Ea r l Sanderson, H. E. Hudson, J r .
HYDROLOGY A N D THE HYDRAULIC LABORATORY
BY A L B E R T S. FRY*
WITH DISCUSSIONS BY ARNO T. LENZ, J. I. PERREY AND C. E. KINDSVATER
THE PLACE OF HYDROLOGY
The period since the early 1930's has been one of great activity in the development of the water r e sources of the country. Many single-purpose and many multiple-purpose projects have been built in the in teres ts of flood control, navigation, hydro-power generat ion, i r r igat ion, water supply, and other purposes. Many more such projects are contemplated for the future. In the planning, design, and operation of such projects , the science of hydrology has an essential and important part . It is logical then that, along with the increased water project development, the science of hydrology itself should have gone forward at an accelerated pace so that today hydrology, though special ized to a considerable degree, is recognized as being a sc i ence of major importance.
As defined in a recent book, Applied Hydrology by Linsley, Kohler, and Paulhus, hydrology is "that branch of physical geography dealing with the waters of the earth with special reference to proper t ies , phenomena, and distribution. It t reats specifically of the occurrence of water on the earth, the description of the earth with respect to water, the physical effects of water on the ear th , and the relation of water to life on the earth. " According to the Ameri can Geophysical Union it " is a borderline science of interest to agronomists , engineers, fores ters , meteorologists, soils technicians, geologists, and o thers . " The fields of in te res t according to the AGU are precipitation, runoff, infiltration and per colation, evaporation and transpiration, chemistry of na tura l wate rs , ground water, so i l -mois ture , dynamics of s treams, including transportation and deposition of sediment and movement of flood-waves, limnology, glaciers, and snow and snow surveying.
MODERN HYDRAULIC LABORATORY
Where does a hydraulic laboratory fit into such a framework? Before discussing this specifically, it is app ropr i a t e to consider what consti tutes a modern hydraulic laboratory. Broken down into its simplest and most basic components the hydraulic laboratory must consist of five elements: space,
*Chief, Hydraulic Data Branch,' Tennessee Valley Authority, Knoxville, Tennessee.
a water supply system, a collection, of measuring ins t ruments , shop facil i t ies, and a staff. While it is difficult to select any one of these five as more important than the o thers , probably an adequate staff is the most important of all .
Present day hydraulic problems are in general so complex that a staff with a very broad training is required. At the present t ime most laboratory staffs consist not only of civil engineers trained in the field of hydraulics but also of electr ical engineers , mechanical engineers, chemical engineers or chemis t s , and there is a growing tendency to incorporate one or more physicis ts . Because of the extreme diversity of the problems encountered, each of the staff members must have a broad knowledge in his specific field rather than be a specialist in any one phase of that branch. The laboratory staff mus t include competent craftsmen who can handle almost any type of small construction that may a r i s e . Since much of the work performed in a laboratory cannot be done with purchasable i tems, these craftsmen must be capable of fabricating a l most any type of art icle that might be required in such a laboratory. The item may be a complicated electrical instrument or a large concrete weir. It may be a relatively simple piece of sheet metal or a complex machined item.
THE LABORATORY IN HYDROLOGY
With such a staff and the other essential components of a hydraulic laboratory, the laboratory is properly equipped to make significant contributions to many and varied phases of hydrology.
The a r ea s in which the laboratory may be of primary value include (1) the development of special devices and equipment, (2) ratings and calibrations, (3) manufacturing special devices, (4) maintenance of hydrologic equipment, and (5) working out solutions for hydrologic problems, either in the realm of fundamental research or specific problems encountered in a particular hydrologic project.
DEVELOPMENT OF SPECIAL DEVICES AND EQUIPMENT
F u r t h e r advancement in seve ra l important hydrologic fields waits upon either refinement of available instruments or development of new ones.
31
32
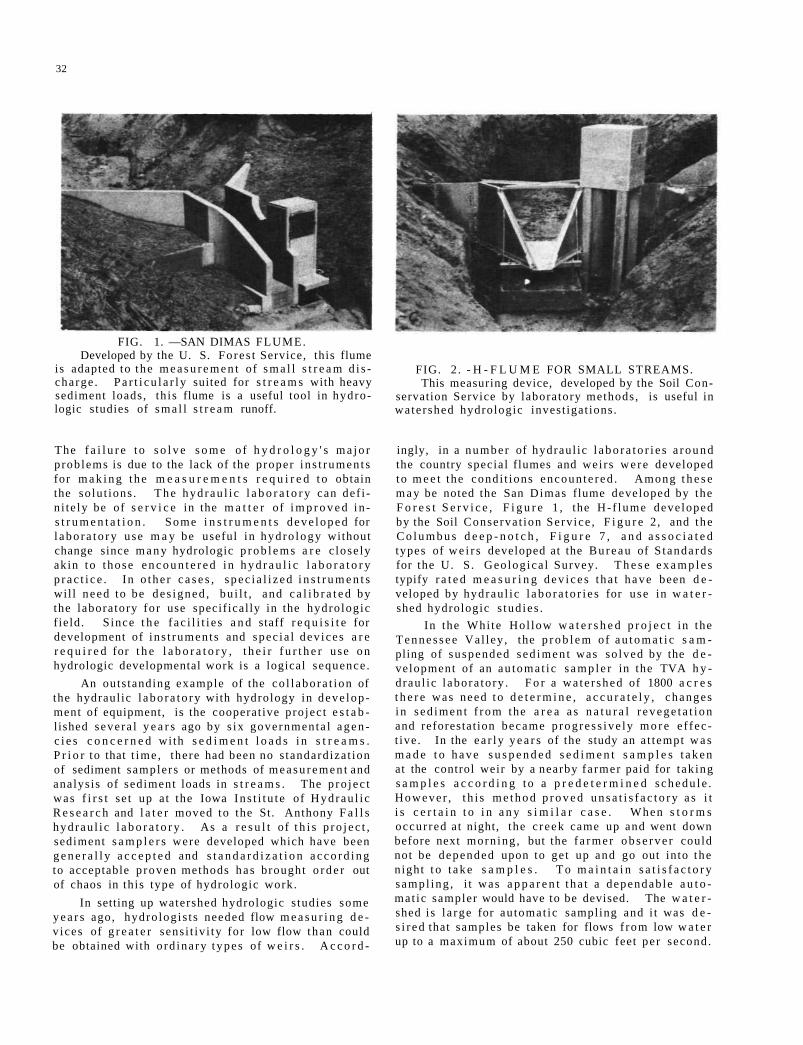
FIG. 1. —SAN DIMAS FLUME. Developed by the U. S. Fo res t Service, this flume
is adapted to the m e a s u r e m e n t of s m a l l s t r e a m d i s charge . P a r t i c u l a r l y suited for s t r e a m s with heavy sediment loads, th is flume is a useful tool in hydro-logic studies of s m a l l s t r e a m runoff.
The f a i l u r e t o s o l v e s o m e o f h y d r o l o g y ' s m a j o r p rob lems is due to the lack of the proper i n s t rumen t s for m a k i n g t h e m e a s u r e m e n t s r e q u i r e d t o obtain the so lu t ions . T h e hyd rau l i c l a b o r a t o r y can def i n i te ly be of s e r v i c e in the m a t t e r of i m p r o v e d i n s t r u m e n t a t i o n . Some i n s t r u m e n t s d e v e l o p e d for l a b o r a t o r y use m a y be useful in hyd ro logy without change since m a n y hydrologic p r o b l e m s a r e c lose ly akin to those e n c o u n t e r e d in h y d r a u l i c l a b o r a t o r y p r a c t i c e . In o the r c a s e s , s p e c i a l i z e d i n s t r u m e n t s wil l need to be des igned , bu i l t , and c a l i b r a t e d by the laboratory for use specif ical ly in the hydrologic f ield. S ince t h e f ac i l i t i e s a n d staff r e q u i s i t e for development of in s t rumen t s and spec ia l dev ices a r e r e q u i r e d for t h e l a b o r a t o r y , t h e i r f u r t h e r use on hydrologic developmental work is a logical sequence .
An outs tanding example of the co l l abora t ion of the hydraul ic l a b o r a t o r y with hydrology in deve lop ment of equipment, is the cooperat ive pro jec t e s t a b lished severa l y e a r s ago by s ix governmenta l a g e n c i e s c o n c e r n e d wi th s e d i m e n t l o a d s i n s t r e a m s . P r i o r to that t ime , there had been no s tandardiza t ion of sediment samplers or methods of m e a s u r e m e n t and analysis of sediment loads in s t r e a m s . The p ro j ec t was f i r s t se t up at the Iowa Ins t i t u t e of Hydrau l i c R e s e a r c h and l a t e r moved to the St. Anthony F a l l s hydrau l i c l a b o r a t o r y . As a r e s u l t of t h i s p r o j e c t , sediment s a m p l e r s were developed which have been g e n e r a l l y a c c e p t e d and s t a n d a r d i z a t i o n a c c o r d i n g to acceptable p roven methods h a s brought o r d e r out of chaos in this type of hydrologic work.
In setting up watershed hydrologic s tudies some y e a r s ago, hydro log is t s needed flow m e a s u r i n g d e v ices of g r e a t e r sens i t iv i ty for low flow than could be obtained with o rd ina ry t ypes of w e i r s . A c c o r d -
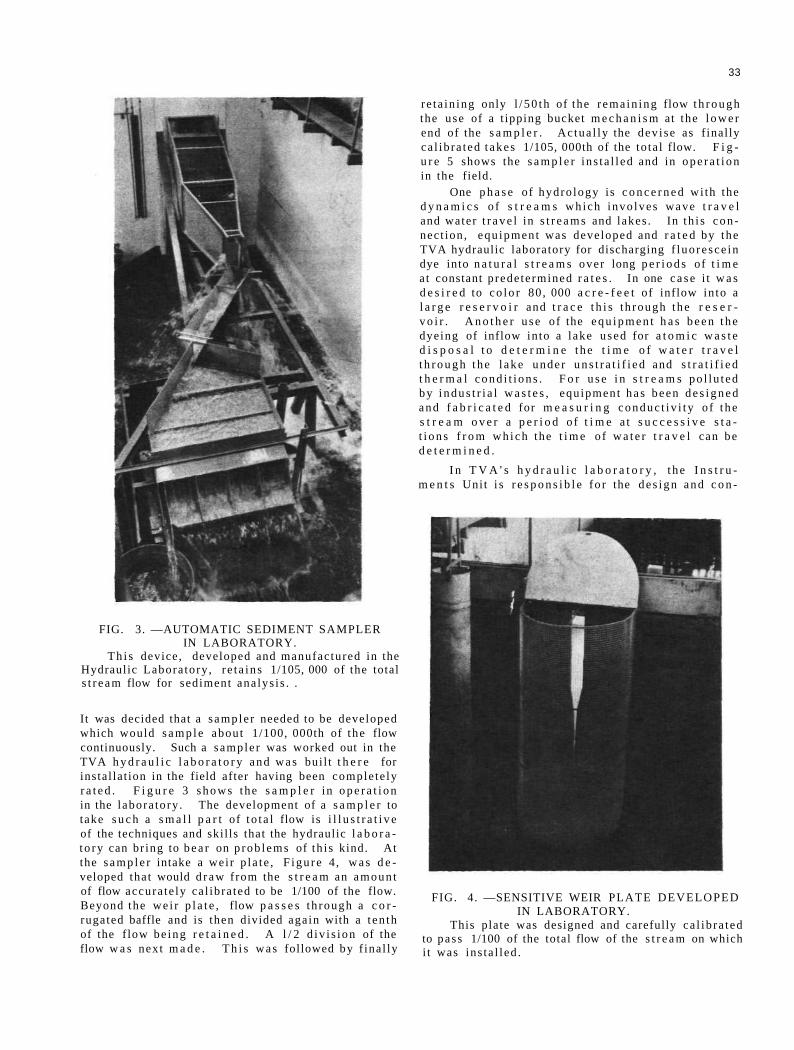
FIG. 2 . - H - F L U M E FOR SMALL STREAMS. This measuring device, developed by the Soil Con
servation Service by laboratory methods , is useful in wate rshed hydrologic invest igat ions.
ingly, in a number of hydraul ic l a b o r a t o r i e s a r o u n d the country special flumes and weirs w e r e developed to m e e t the condi t ions encoun te red . Among t h e s e m a y be noted the San Dimas flume developed by the F o r e s t S e r v i c e , F i g u r e 1 , the H- f lume deve loped by the Soil Conserva t ion Serv ice , F i g u r e 2, and the C o l u m b u s d e e p - n o t c h , F i g u r e 7 , a n d a s s o c i a t e d types of w e i r s developed at the Bureau of S tandards for the U. S. Geolog ica l Survey. T h e s e e x a m p l e s typify r a t e d m e a s u r i n g d e v i c e s tha t have been d e veloped by hydrau l ic l ab o ra to r i e s for use in w a t e r shed hydrologic s tud ies .
In the Whi te Hol low w a t e r s h e d p r o j e c t in the T e n n e s s e e Val ley , the p r o b l e m of a u t o m a t i c s a m pling of suspended s ed imen t was so lved by the d e velopment of an au tomat i c s a m p l e r in the TVA h y drau l ic l abora to ry . F o r a wa te r shed of 1800 a c r e s t h e r e was need t o d e t e r m i n e , a c c u r a t e l y , changes i n s ed imen t f r o m the a r e a a s n a t u r a l r e v e g e t a t i o n and reforestat ion became p rog res s ive ly m o r e e f fec t ive . In the ea r l y y e a r s of the study an a t tempt w a s m a d e t o h a v e s u s p e n d e d s e d i m e n t s a m p l e s t a k e n at the control weir by a nearby fa rmer paid for t ak ing s a m p l e s a c c o r d i n g to a p r e d e t e r m i n e d s c h e d u l e . However , t h i s m e t h o d p r o v e d u n s a t i s f a c t o r y a s i t i s c e r t a i n t o i n a n y s i m i l a r c a s e . When s t o r m s occur red at night, the c reek came up and went down before next morn ing , but the f a r m e r o b s e r v e r could not be depended upon to ge t up and go out into the n ight t o t ake s a m p l e s . T o m a i n t a i n s a t i s f a c t o r y sampl ing , i t was a p p a r e n t t ha t a dependab le a u t o mat ic sampler would have to be devised. The w a t e r shed is l a rge for au tomat ic sampling and i t was d e s i r e d that samples be taken for flows f rom low w a t e r up to a maximum of about 250 cubic feet pe r second.
33
FIG. 3. —AUTOMATIC SEDIMENT SAMPLER IN LABORATORY.
Th i s device, developed and manufactured in the Hydraulic Labora tory , r e t a ins 1/105, 000 of the total s t r e a m flow for sediment ana lys i s . .
It was decided that a sample r needed to be developed which would s a m p l e about 1/100, 000th of the flow continuously. Such a sample r was worked out in the TVA h y d r a u l i c l a b o r a t o r y and was bui l t t h e r e for instal la t ion in the field after having been comple te ly r a t e d . F i g u r e 3 s h o w s the s a m p l e r in o p e r a t i o n in the labora tory . The development of a s a m p l e r to take s u c h a s m a l l p a r t of t o t a l flow is i l l u s t r a t i v e of the techniques and skil ls that the hydraulic l a b o r a t o r y can br ing to b e a r on p rob lems of th i s kind. At the s a m p l e r intake a wei r p la te , F i g u r e 4 , w a s d e veloped that would d r a w from the s t r e a m an amoun t of flow accura te ly ca l ibra ted to be 1/100 of the flow. Beyond the we i r p l a t e , flow p a s s e s th rough a c o r rugated baffle and is then divided again with a t en th of the f low be ing r e t a i n e d . A l / 2 d iv i s ion of the flow w a s next m a d e . T h i s was followed by f inal ly
r e t a in ing only l / 50 th of the r ema in ing flow t h r o u g h the use of a t ipping bucket m e c h a n i s m at the l o w e r end of the s a m p l e r . Ac tua l ly the dev i se as f inal ly ca l ib ra ted t akes 1/105, 000th of the to ta l flow. F i g u r e 5 shows the s a m p l e r ins t a l l ed and in o p e r a t i o n in the field.
One p h a s e of hydro logy is c o n c e r n e d wi th the d y n a m i c s o f s t r e a m s wh ich invo lves wave t r a v e l and water t r a v e l in s t r e a m s and lakes . In t h i s c o n nect ion , equ ipment was developed and r a t e d by the TVA hydraulic laboratory for discharging f luo resce in dye into n a t u r a l s t r e a m s over long p e r i o d s of t i m e a t constant p rede te rmined r a t e s . In one c a s e i t w a s d e s i r e d to c o l o r 80 , 000 a c r e - f e e t of inflow in to a l a r g e r e s e r v o i r and t r a c e t h i s t h rough t h e r e s e r v o i r . A n o t h e r u s e o f the e q u i p m e n t h a s b e e n t h e dyeing of inflow in to a lake used for a t o m i c w a s t e d i s p o s a l t o d e t e r m i n e t h e t i m e o f w a t e r t r a v e l t h r o u g h t h e l ake unde r u n s t r a t i f i e d and s t r a t i f i e d t h e r m a l c o n d i t i o n s . F o r u s e i n s t r e a m s po l lu t ed by i n d u s t r i a l w a s t e s , equipment h a s been d e s i g n e d and f a b r i c a t e d for m e a s u r i n g conduc t iv i t y o f t h e s t r e a m o v e r a p e r i o d o f t i m e a t s u c c e s s i v e s t a t i o n s f r o m w h i c h the t i m e o f w a t e r t r a v e l can be d e t e r m i n e d .
I n T V A ' s h y d r a u l i c l a b o r a t o r y , t h e I n s t r u m e n t s Uni t i s r e s p o n s i b l e fo r the d e s i g n and c o n -
FIG. 4. —SENSITIVE WEIR PLATE DEVELOPED IN LABORATORY.
This plate was designed and carefully ca l ib ra ted to pass 1/100 of the total flow of the s t r e a m on which i t was ins ta l led .
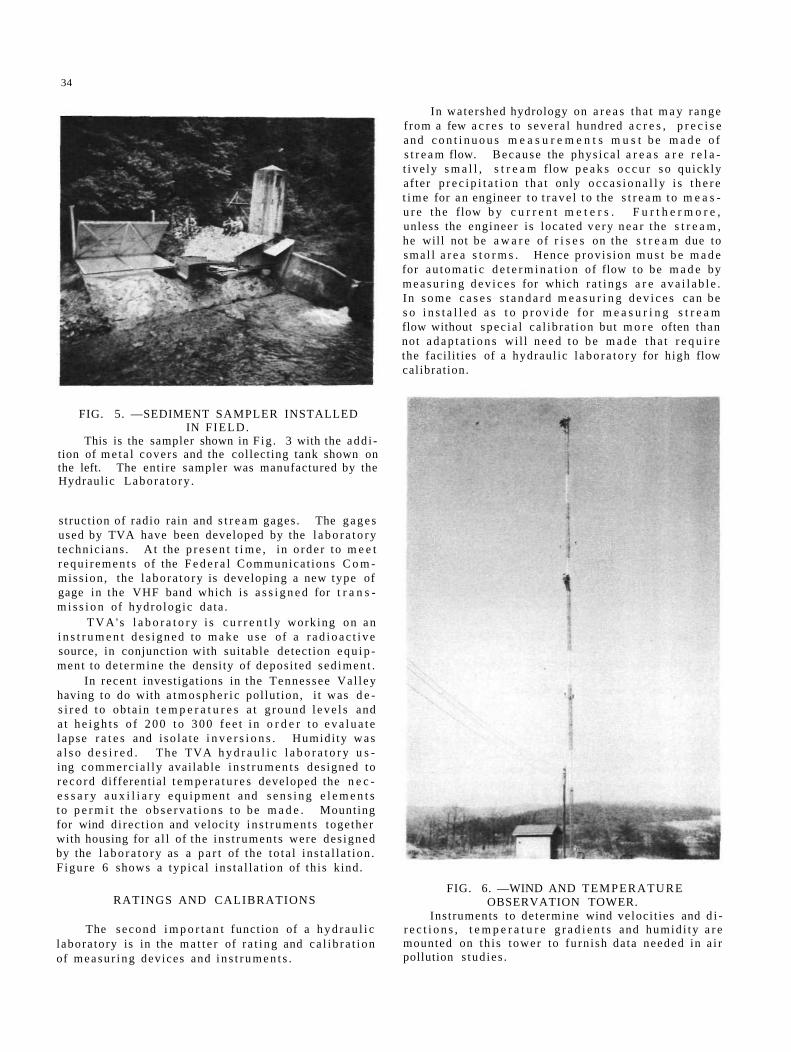
34
FIG. 5. —SEDIMENT SAMPLER INSTALLED IN FIELD.
This is the sampler shown in F ig . 3 with the add i tion of m e t a l covers and the collecting tank shown on the left. The entire sampler was manufactured by the Hydraulic Labora to ry .
s t ruct ion of radio rain and s t r e a m gages . The g a g e s used by TVA have been developed by the l a b o r a t o r y technic ians . At the p r e s e n t t i m e , in o r d e r to m e e t r equ i r emen t s of the F e d e r a l Communica t ions C o m miss ion , the l abora to ry is developing a new type of gage in the VHF band which is a s s i g n e d for t r a n s m i s s i o n of hydro log ic da ta .
T V A ' s l a b o r a t o r y i s c u r r e n t l y working on an i n s t r u m e n t d e s i g n e d to m a k e u s e of a r a d i o a c t i v e source, in conjunction with sui table detect ion e q u i p ment to de te rmine the density of deposi ted sed imen t .
In recent investigations in the Tennessee Va l l ey having to do with a t m o s p h e r i c pol lut ion, i t was d e s i r e d t o obta in t e m p e r a t u r e s a t g round l e v e l s and a t h e i g h t s o f 2 0 0 t o 3 0 0 f ee t i n o r d e r t o e v a l u a t e lapse r a t e s and i so la t e i n v e r s i o n s . Humidi ty was a l s o d e s i r e d . The TVA h y d r a u l i c l a b o r a t o r y u s ing commerc ia l ly available i n s t r u m e n t s des igned to r e co rd differential t e m p e r a t u r e s developed the n e c e s s a r y a u x i l i a r y equ ipmen t and s e n s i n g e l e m e n t s to p e r m i t the o b s e r v a t i o n s to be m a d e . Mounting for wind d i rec t ion and velocity i n s t r u m e n t s together with housing for a l l of the ins t ruments were des igned by the l a b o r a t o r y as a p a r t of the to t a l ins ta l l a t ion . F igu re 6 shows a typica l ins ta l l a t ion of th is kind.
RATINGS AND CALIBRATIONS
The second i m p o r t a n t funct ion of a h y d r a u l i c labora tory is in the ma t t e r of r a t i ng and ca l i b r a t i on of measu r ing devices and i n s t r u m e n t s .
In watershed hydrology on a r e a s tha t m a y r ange f rom a few a c r e s to s eve ra l hundred a c r e s , p r e c i s e and c o n t i n u o u s m e a s u r e m e n t s m u s t b e m a d e o f s t r e a m flow. Because the phys ica l a r e a s a r e r e l a t ive ly s m a l l , s t r e a m flow p e a k s o c c u r s o quickly af ter p r e c i p i t a t i o n t ha t only o c c a s i o n a l l y i s t h e r e t i m e for an engineer t o t r a v e l t o the s t r e a m to m e a s u r e the flow b y c u r r e n t m e t e r s . F u r t h e r m o r e , unless the engineer i s located ve ry n e a r the s t r e a m , he will not be a w a r e of r i s e s on the s t r e a m due to sma l l a r e a s t o r m s . Hence p rov i s ion m u s t b e m a d e for au toma t i c d e t e r m i n a t i o n of flow to be m a d e by m e a s u r i n g d e v i c e s for which r a t i ngs a r e a v a i l a b l e . In s o m e c a s e s s t a n d a r d m e a s u r i n g d e v i c e s can be s o i n s t a l l e d a s t o p r o v i d e for m e a s u r i n g s t r e a m flow without spec i a l ca l ib ra t ion but m o r e often than not a d a p t a t i o n s wi l l n e e d t o b e m a d e t ha t r e q u i r e the facil i t ies of a hydraul ic l a b o r a t o r y for h igh flow cal ibrat ion.
FIG. 6. —WIND AND TEMPERATURE OBSERVATION TOWER.
Instruments to determine wind veloci t ies and d i r e c t i o n s , t e m p e r a t u r e g r a d i e n t s and humid i ty a r e mounted on th i s tower to furn ish data needed in a i r pollution s tud ies .
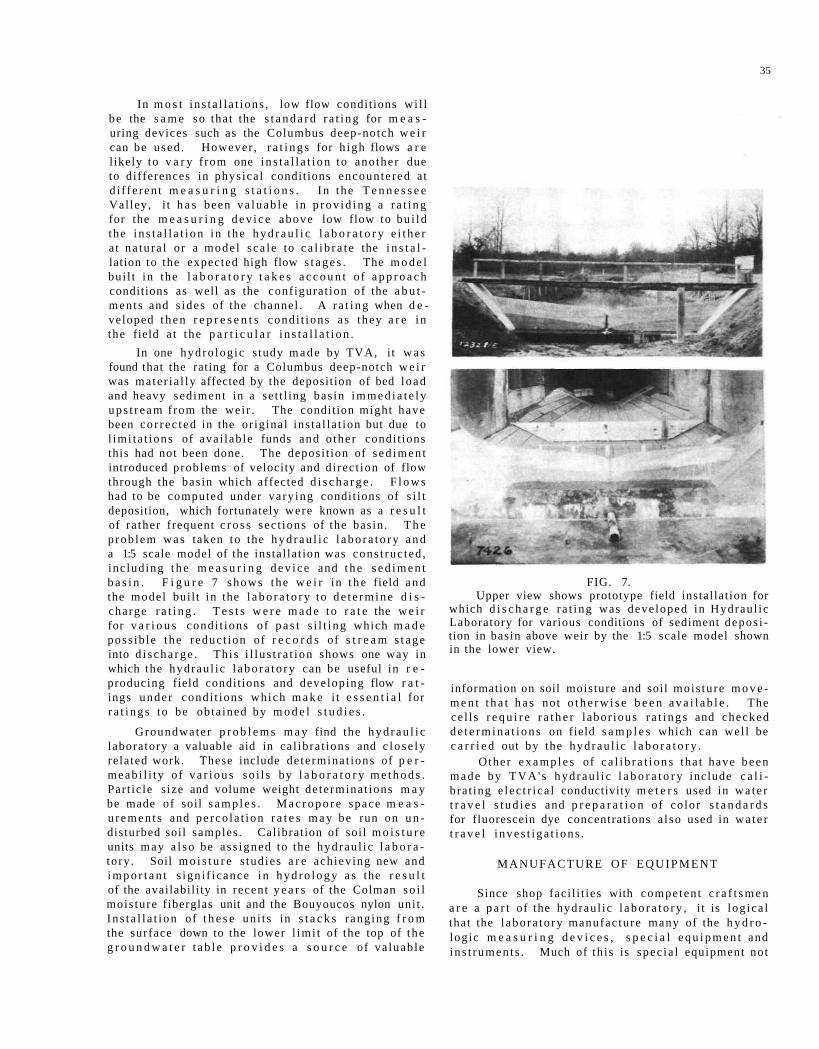
35
In m o s t i n s t a l l a t ions , low flow condit ions wi l l be the s a m e so that the s t a n d a r d r a t i n g for m e a s uring devices such as the Columbus deep-notch w e i r can be used . However , r a t i n g s for h igh flows a r e l ikely to v a r y f rom one i n s t a l l a t i o n to another due to differences in physica l condit ions encounte red at d i f f e ren t m e a s u r i n g s t a t i o n s . I n the T e n n e s s e e Val ley, i t h a s been va luab l e in p r o v i d i n g a r a t i n g for the m e a s u r i n g d e v i c e above low flow to bu i ld the i n s t a l l a t i o n in the h y d r a u l i c l a b o r a t o r y e i t h e r a t na tu ra l or a mode l sca le to c a l i b r a t e the i n s t a l lation to the expected high flow s t a g e s . The m o d e l bui l t in the l a b o r a t o r y t a k e s a c c o u n t o f a p p r o a c h conditions as well as the configurat ion of the a b u t ments and s ides of the channel . A r a t i n g when d e veloped t h e n r e p r e s e n t s cond i t ions a s they a r e i n the field a t t he p a r t i c u l a r i n s t a l l a t i o n .
In one hydro log ic s tudy m a d e by TVA, i t w a s found that the rating for a Columbus deep-notch w e i r was mate r ia l ly affected by the deposit ion of bed load and heavy sediment in a se t t l ing bas in i m m e d i a t e l y u p s t r e a m f rom the wei r . The condition might have been co r r ec t ed in the or iginal ins ta l la t ion but due to l imi ta t ions of ava i lab le funds and o the r condi t ions this had not been done. The deposi t ion of s ed imen t introduced problems of velocity and d i rec t ion of flow through the bas in which affected d i s c h a r g e . F l o w s had to be computed under va ry ing condit ions of s i l t deposition, which fortunately were known as a r e s u l t of ra ther frequent c r o s s sec t ions of the basin. T h e p rob lem was taken to the h y d r a u l i c l a b o r a t o r y a n d a 1:5 scale model of the instal lat ion was cons t ruc ted , inc luding t h e m e a s u r i n g d e v i c e and t h e s e d i m e n t b a s i n . F i g u r e 7 shows the w e i r in t h e field and the model bui l t in the l a b o r a t o r y to d e t e r m i n e d i s charge r a t i n g . T e s t s w e r e m a d e t o r a t e the w e i r for v a r i o u s condi t ions of p a s t s i l t i ng which m a d e poss ib le the reduc t ion of r e c o r d s of s t r e a m s t a g e into d i s c h a r g e . This i l l u s t r a t i on shows one way in which the hydrau l ic l a b o r a t o r y can be useful in r e producing field condit ions and developing flow r a t ings unde r condi t ions which m a k e i t e s s e n t i a l for r a t i n g s to be obta ined by m o d e l s t u d i e s .
Groundwate r p r o b l e m s m a y find the h y d r a u l i c laboratory a valuable aid in ca l ibra t ions and c l o s e l y related work. These include de te rmina t ions of p e r meab i l i t y of v a r i o u s so i l s by l a b o r a t o r y m e t h o d s . Par t ic le s ize and volume weight de terminat ions m a y be made of soil s a m p l e s . M a c r o p o r e space m e a s u r e m e n t s and pe rco la t ion r a t e s m a y be run on u n disturbed soil samples . Calibrat ion of soil m o i s t u r e units may a l s o be a s s igned to the hydrau l i c l a b o r a tory . Soil m o i s t u r e s tud ies a r e achieving new and i m p o r t a n t s ign i f i cance i n h y d r o l o g y a s the r e s u l t of the availabil i ty in recent y e a r s of the Colman so i l mois ture fiberglas unit and the Bouyoucos nylon uni t . I n s t a l l a t i o n of t h e s e un i t s in s t a c k s rang ing f r o m the surface down to the lower l imi t of the top of the g r o u n d w a t e r t a b l e p r o v i d e s a s o u r c e of va luab le
FIG. 7. Upper view shows prototype field instal lat ion for
which d i s c h a r g e r a t i ng was deve loped in Hydraul ic Laboratory for various conditions of sediment depos i tion in basin above weir by the 1:5 scale model shown in the lower view.
information on soil moisture and soil mois tu re m o v e m e n t t h a t h a s not o t h e r w i s e b e e n a v a i l a b l e . The ce l l s r e q u i r e r a t h e r l abor ious r a t i n g s and checked d e t e r m i n a t i o n s on field s a m p l e s which can wel l be c a r r i e d out by the hydrau l i c l a b o r a t o r y .
Other e x a m p l e s of c a l i b r a t i o n s tha t have been m a d e by T V A ' s hyd rau l i c l a b o r a t o r y include c a l i bra t ing e l ec t r i ca l conductivity m e t e r s used in w a t e r t r a v e l s t u d i e s and p r e p a r a t i o n of co lor s t a n d a r d s for fluorescein dye concentrations a l so used in w a t e r t r a v e l i n v e s t i g a t i o n s .
MANUFACTURE OF E Q U I P M E N T
Since shop faci l i t ies with competen t c r a f t s m e n a r e a p a r t of the hydraul ic l a b o r a t o r y , i t is log ica l that the l abora to ry manufac ture many of the h y d r o -logic m e a s u r i n g d e v i c e s , s p e c i a l e q u i p m e n t and in s t rumen t s . Much of th is is spec ia l equipment not
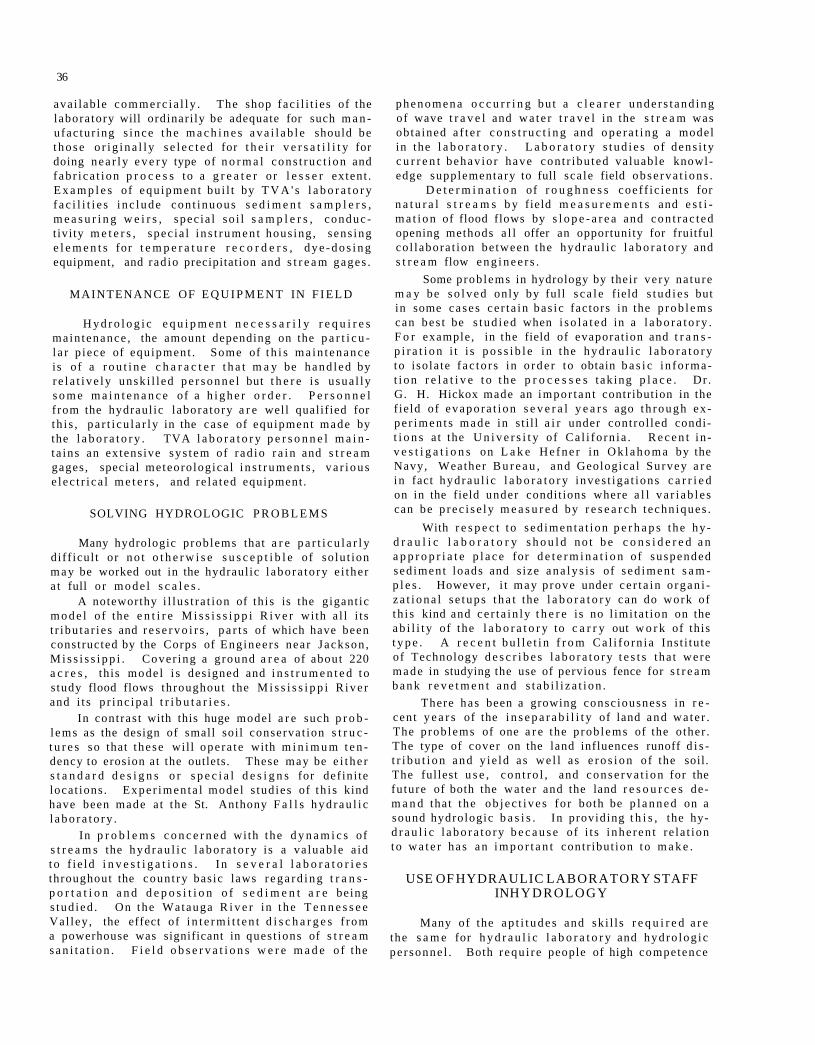
36
avai lab le commerc i a l l y . The shop fac i l i t i e s of the labora tory will ordinari ly be adequate for such m a n ufac tur ing s ince t h e m a c h i n e s a v a i l a b l e should be t h o s e o r i g i n a l l y s e l e c t e d for t h e i r v e r s a t i l i t y for doing nea r ly e v e r y type of n o r m a l cons t ruc t ion and f ab r i ca t ion p r o c e s s to a g r e a t e r o r l e s s e r extent . E x a m p l e s of equ ipmen t bu i l t by T V A ' s l a b o r a t o r y f a c i l i t i e s i nc lude con t inuous s e d i m e n t s a m p l e r s , m e a s u r i n g w e i r s , spec ia l so i l s a m p l e r s , conduct ivi ty m e t e r s , spec ia l i n s t r u m e n t hous ing , sens ing e l e m e n t s for t e m p e r a t u r e r e c o r d e r s , d y e - d o s i n g equipment, and rad io precipitation and s t r e a m gages .
MAINTENANCE OF E Q U I P M E N T IN F I E L D
H y d r o l o g i c e q u i p m e n t n e c e s s a r i l y r e q u i r e s ma in tenance , the amount depending on the p a r t i c u l a r p iece of equipment . Some of t h i s ma in t en an ce is of a r o u t i n e c h a r a c t e r t h a t m a y be hand led by r e l a t i v e l y unsk i l l ed p e r s o n n e l but t h e r e i s usua l ly s o m e m a i n t e n a n c e of a h i g h e r o r d e r . P e r s o n n e l f rom the hydraul ic labora tory a r e well qualif ied for th i s , pa r t i cu l a r ly in the case of equipment made by the l a b o r a t o r y . TVA l a b o r a t o r y p e r s o n n e l m a i n ta ins an extens ive sys t em of r ad io r a i n and s t r e a m gages , special meteorologica l i n s t r u m e n t s , v a r i o u s e l ec t r i ca l m e t e r s , and re la ted equipment .
SOLVING HYDROLOGIC P R O B L E M S
Many hydrologic problems that a r e p a r t i c u l a r l y diff icul t or no t o t h e r w i s e s u s c e p t i b l e of so lu t ion m a y be worked out in the hydraulic l abo ra to ry e i the r a t full o r m o d e l s c a l e s .
A noteworthy i l lus t ra t ion of th is is the gigant ic m o d e l of the e n t i r e M i s s i s s i p p i R i v e r wi th a l l i t s t r ibu ta r i e s and r e s e r v o i r s , p a r t s of which have been constructed by the Corps of Eng inee rs near J ackson , M i s s i s s i p p i . Cover ing a g round a r e a of about 220 a c r e s , th is mode l i s des igned and i n s t r u m e n t e d t o s tudy flood flows throughout the M i s s i s s i p p i R i v e r and i t s p r inc ipa l t r i b u t a r i e s .
In cont ras t with this huge model a r e such p r o b l ems as the design of small soi l conservat ion s t r u c t u r e s so that these wil l ope ra te with m i n i m u m t e n dency to erosion at the outlets. These may be e i t h e r s t a n d a r d d e s i g n s o r s p e c i a l d e s i g n s for def ini te locat ions . Expe r imen ta l model s tud ies of t h i s kind have been made a t the St. Anthony F a l l s h y d r a u l i c l a b o r a t o r y .
In p r o b l e m s c o n c e r n e d wi th the d y n a m i c s of s t r e a m s the h y d r a u l i c l a b o r a t o r y is a va luable a id t o f i e ld i n v e s t i g a t i o n s . I n s e v e r a l l a b o r a t o r i e s throughout the count ry basic laws r e g a r d i n g t r a n s p o r t a t i o n a n d d e p o s i t i o n o f s e d i m e n t a r e being s tud ied . On the Watauga R i v e r in t h e T e n n e s s e e Val ley , the effect of i n t e r m i t t e n t d i s c h a r g e s f rom a powerhouse was significant in ques t ions of s t r e a m s a n i t a t i o n . F i e l d o b s e r v a t i o n s w e r e m a d e o f the
p h en o men a o c c u r r i n g bu t a c l e a r e r u n d e r s t a n d i n g of wave t r a v e l and w a t e r t r a v e l in the s t r e a m was obta ined a f t e r c o n s t r u c t i n g and ope ra t i ng a model in the l a b o r a t o r y . L a b o r a t o r y s t u d i e s of dens i ty c u r r e n t behav io r have con t r ibu ted valuable knowledge supplementary to full sca le field obse rva t ions .
D e t e r m i n a t i o n of r o u g h n e s s coef f ic ien t s for n a t u r a l s t r e a m s b y field m e a s u r e m e n t s and e s t i m a t i o n of flood flows by s l o p e - a r e a and con t r ac t ed opening methods a l l offer an opportunity for fruitful co l labora t ion be tween the hydrau l ic l a b o r a t o r y and s t r e a m flow e n g i n e e r s .
Some prob lems in hydrology by their ve ry na ture m a y be s o l v e d only by full s c a l e field s t u d i e s but in some ca se s ce r t a in bas ic factors in the p r o b l e m s can bes t be s t ud i ed when i s o l a t e d in a l a b o r a t o r y . F o r example, in the field of evaporat ion and t r a n s p i r a t i o n i t i s p o s s i b l e in the h y d r a u l i c l a b o r a t o r y to isola te f ac to r s in o r d e r to obtain b a s i c in fo rmat i o n r e l a t i v e t o t h e p r o c e s s e s tak ing p l a c e . Dr . G. H. Hickox made an impor tan t contribution in the f ie ld of evapora t ion s e v e r a l y e a r s ago t h rough ex p e r i m e n t s m a d e in s t i l l a i r under control led condit i o n s a t the U n i v e r s i t y of Ca l i fo rn ia . R e c e n t in v e s t i g a t i o n s on L a k e He fne r in O k l a h o m a by the Navy, Weather B u r e a u , and Geological Survey a r e in fact hydrau l i c l a b o r a t o r y inves t iga t ions c a r r i e d on in the field under condit ions where a l l v a r i a b l e s can be p r ec i s e ly m e a s u r e d by r e s e a r c h t echn iques .
With r e s p e c t t o s ed imen ta t ion p e r h a p s the hyd r a u l i c l a b o r a t o r y s h o u l d no t b e c o n s i d e r e d a n a p p r o p r i a t e p l a c e for d e t e r m i n a t i o n of suspended sed iment loads and s ize an a ly s i s of s ed imen t s a m p l e s . However, i t may p rove under ce r t a in o rgan i z a t i o n a l s e tups t h a t the l a b o r a t o r y can do work of t h i s kind and ce r t a in ly t h e r e is no l imi ta t ion on the a b i l i t y of the l a b o r a t o r y to c a r r y out w o r k of this t y p e . A r e c e n t b u l l e t i n f r o m Ca l i fo rn i a Ins t i tu te of Technology d e s c r i b e s l a b o r a t o r y t e s t s tha t were m a d e in studying the use of pervious fence for s t r e a m b a n k r e v e t m e n t and s t ab i l i z a t i on .
There has been a growing consc iousness in r e cent y e a r s of the i n s e p a r a b i l i t y of land and wa te r . The p rob lems of one a r e the p rob lems of the o ther . The type of cover on the land influences runoff d i s t r i b u t i o n and y ie ld as we l l as e r o s i o n of the soil. The fullest u s e , con t ro l , and c o n s e r v a t i o n for the fu ture of both the wa te r and the land r e s o u r c e s dem a n d that the o b j e c t i v e s for both be p l a n n e d on a sound hydrologic b a s i s . In providing t h i s , the hyd r a u l i c l a b o r a t o r y b e c a u s e of i t s i nhe ren t re la t ion t o w a t e r has an i m p o r t a n t cont r ibut ion t o m a k e .
USE OF HYDRAULIC LABORATORY STAFF IN HYDROLOGY
Many of the a p t i t u d e s and sk i l l s r e q u i r e d a r e the s a m e for h y d r a u l i c l a b o r a t o r y and hydro log ic pe r sonne l . Both r equ i r e people of high competence
37
who are at home in basic and applied research and the solution of complex hydraulic problems. The staff of the hydraulic laboratory must collectively have a comprehensive knowledge of a wide variety of engineering and scientific fields. Because of this fact and because so much of the laboratory work closely parallels various phases of hydrology, the laboratory technical staff can both contribute directly to many hydrologic projects and serve as a valuable consulting source to the hydrologists.
THE LABORATORY IN FUTURE STATE DEVELOPMENT
Throughout the s ta te of I l l inois , there are numerous problems of hydrology that need to be studied and solved as an integral pa r t of the continued development of the resources of this great
state. The scope of these problems embraces the en t i r e field of water control , conservat ion and utilization. In connection with surface and underground water supplies, flood control, navigation, watershed protect ion, fish and wildlife, s t ream pollution, and recreational use of water, hydrology will play a la rge pa r t in future developments in Ill inois. Pro jec ts concerned with some of these act iv i t ies will range from those of l imited local import to large comprehensive developments affecting considerable a reas of the state. In the hydro-logic as well as other phases of these future programs, the new hydraulic laboratory of the Illinois State Water Survey with its modern facili t ies is cer tain to be a grea t asset with its sphere of influence stretching out to include the entire state of Illinois.
38
DISCUSSION
ARNO T. LENZ. *—The opportunity to d i s c u s s this paper is indeed a pr iv i lege and an oppor tun i ty : A pr iv i l ege because the re a r e many who could c i te from vast exper ience a multi tude of instances w h e r e the h y d r a u l i c l a b o r a t o r y has b e e n an effect ive tool in i nc r ea s ing the s t o r e of hydrologic knowledge and i ts appl ica t ion, and an opportuni ty because t h e r e i s so m u c h need for the use of a l l old tools and m a n y new ones in a f ield of s tudy so r e l a t i v e l y young in e n g i n e e r i n g .
The p a p e r t r e a t s of m a n y p r o b l e m s w h e r e the l a b o r a t o r y is of m a t e r i a l a id in the i r so lu t ion . Of p a r t i c u l a r i n t e r e s t t o m e i s the r e f e r e n c e t o the White Hollow silt sampler because (1) some 10 y e a r s ago I was br ie f ly a s s o c i a t e d with that e x p e r i m e n t a l a r e a and (2) I am of the opinion that much light can be shed on m a n y hydro logic p r o b l e m s by the s tudy of s h o r t t i m e v a r i a t i o n s in m e a s u r e m e n t s , i . e . : r a t e s of change, as cont ras ted to long t i m e a v e r a g e re su l t s . The use of continuous r e c o r d e r s for m e a s u remen t of s t r eamf low, prec ip i ta t ion , and g r o u n d water l eve l s y ie lds so much m o r e informat ion t ha t the added expense is well justified in many i n s t a n c e s . "F ind out what happens" is a good adage and an in s t a n t a n e o u s r e a d i n g t a k e n o n c e in a 1 to 3 0 - d a y per iod , or an a v e r a g e r e s u l t ove r that p e r i o d , wi l l s e ldom give the d e s i r e d in format ion , p a r t i c u l a r l y when s tudy ing s m a l l d r a i n a g e b a s i n s . Obvious ly the h y d r a u l i c l a b o r a t o r y m u s t take l e a d e r s h i p i n the development of the i n s t r u m e n t s requi red . L a b o r a t o r i e s such as the one we a r e here to ded i ca t e can and will do much to lead in these deve lopmen t s .
When the n u m b e r of such spec ia l i n s t r u m e n t s r e q u i r e d i s s m a l l , t h e i r m a n u f a c t u r e for s a l e o r lease to v a r i o u s governmenta l and pr iva te a g e n c i e s who have need for them should be a p rope r function of the laboratory, a function fraught with many p e r i l s as many wel l know.
The ra t ing and cal ibrat ion of measur ing d e v i c e s is indeed a function of the l abo ra to ry . In m a n y i n s tances model t e s t s of existing s t ruc tures a r e e s s e n t ia l i f the s t r u c t u r e s a r e to be used as m e a s u r i n g dev ices . However , l e s t t h e r e be a tendency to en gage in wholesale ca l ibra t ion i t m a y be wel l to e m phas i ze the d e s i r a b i l i t y of us ing the v a r i o u s w e i r s and flumes mentioned by the author rather than b u i l d ing "d i f f e ren t " de s igns and ca l ib ra t ing t h e m . The labora tory is a m o r e economical tool when used for developing s tandard designs than when used for c u s tom cal ibrat ion.
The author ment ions that m a n y par t icu la r ly difficult p rob lems may be worked out either with m o d e l
*Director, Hydraulic and Sanitary Laboratory, University of Wisconsin, Madison, Wisconsin.
or full scale t e s t s . One g rea t advantage of l a b o r a t o r y work is the ability to isolate var iab les not r e a d i ly i so la ted in the field. Since so m a n y hydro logic p r o b l e m s a r e exceed ing ly c o m p l e x t h i s advantage is a ve ry r e a l one which is not r ecogn ized as m u c h as i t should b e .
One function of l abora to r i e s , too often neglected in the p r e s s of daily demands for expe r imen ta l r e s u l t s , i s the r e s p o n s i b i l i t y of m a k i n g ava i lab le to a l l , through publicat ions, the vas t s t o r e of i n fo rmat ion a l r e a d y a v a i l a b l e . E n g i n e e r s b y n a t u r e a r e pe r fec t ion i s t s . We can a lways see one m o r e check t e s t that would be desi rable before we put our n a m e s on a r e p o r t in p r i n t . Yet if we a r e wil l ing to use the in format ion in our own dai ly work , o thers a l s o would be will ing to make the s a m e use of it. W r i t ing pape r s i s h a r d work and t a k e s t i m e but l a b o r a to ry a d m i n i s t r a t o r s should make that t ime avai lab le and encourage publication of r e su l t s . Tax- suppor t ed l abo ra to r i e s p a r t i c u l a r l y have a r e a l r e spons ib i l i t y in this r e g a r d .
Finally, as a t e ache r of e n g i n e e r s , it was v e r y grat i fying to r e a d tha t the staff is one of the b a s i c e lements of the labora tory , probably the mos t b a s i c of a l l . With tha t s t a t e m e n t I am in h e a r t y a g r e e men t . With e v e r - i n c r e a s i n g u s e of our wa te r r e s o u r c e s d i s s e m i n a t i o n of knowledge of the i r l i m i t s and methods of control is a r e spons ib i l i t y the e n g i n e e r i n g p r o f e s s i o n m u s t not p a s s by. Yet f r o m a q u e s t i o n n a i r e p r e p a r e d by the C o m m i t t e e on Hydrology of the Hydrau l ics Divis ion of the A m e r i c a n Soc ie ty of C i v i l E n g i n e e r s and r e p o r t e d on by me a t the d iv i s ion m e e t i n g in J a c k s o n , M i s s . in Nov e m b e r , 1950 , i t w a s e v i d e n t t ha t half the e n g i n e e r i n g s c h o o l s i n t h i s c o u n t r y g ive n o work i n hydrology, o ther than that 10 to 30 pe r cent of such c o u r s e s as Water Supply, Sewerage , e t c . as should n o r m a l l y be u s e d to show spec i f i c app l i c a t i ons in hydrology to the p a r t i c u l a r field being s tudied. In tha t pape r i t w a s r e c o m m e n d e d tha t e v e r y col lege and u n i v e r s i t y r e q u i r e tha t e a c h c iv i l eng inee r ing s tuden t take as a m i n i m u m a 2 s e m e s t e r - h o u r or 3 q u a r t e r - h o u r c o u r s e in Hydro logy before g r a d u at ion.
The need for b r o a d t r a i n i n g of the l a b o r a t o r y staff i s well c o n s i d e r e d by the a u t h o r . That s a m e b r o a d t r a i n i n g for a l l e n g i n e e r s i s e s s e n t i a l for p r o p e r func t ion ing of the e n g i n e e r i n g p r o f e s s i o n and the n a t i o n a l good. Civi l e n g i n e e r s , a t l e a s t , should be in a position to recognize hydrologic p r o b l e m s and s u p p o r t those with s p e c i a l i z e d knowledge in the orderly economical solution of those p r o b l e m s . Unfortunately, I feel th i s s e r m o n i sn ' t r each ing the people who r e a l l y need it .
39
The staff of the Illinois State Water Survey D i v i sion a re to be commended and congratula ted on t h i s fine W a t e r R e s o u r c e s Bu i ld ing . T h r o u g h i t s u s e in the solution of hydraul ic and hydrologic p r o b l e m s they will con t r ibu te m u c h to the s t a t e and na t i ona l we l l -be ing .
J . I . PERREY. *—This meet ing and Mr . F r y ' s paper on "Hydrology and the Hydraul ic L a b o r a t o r y " a r e both e s p e c i a l l y t i m e l y , b e c a u s e the s c i ence of h y d r o l o g y i s j u s t c o m i n g o f a g e . P r i o r to 1930, hydro logy was c o n s i d e r e d t o r e l a t e p r i n c i p a l l y t o u n d e r g r o u n d w a t e r s , and the p r e s e n t concept t h a t it e m b r a c e s the whole field of o c c u r r e n c e s of w a t e r on the e a r t h was not y e t b o r n . We migh t say t h a t hydro logy was in an e m b r y o n i c s t age up to 1930.
The I n t e r n a t i o n a l A s s o c i a t i o n o f Sc ien t i f i c Hydrology, organized in 1924, recognized the r e l a t ionsh ip of s u r f a c e s t r e a m s , l a k e s , snow and ice, and u n d e r g r o u n d w a t e r s , but s t i l l r e s t r i c t e d the t e r m "hydrology" to the study of underground w a t e r .
I t i s a l m o s t 21 y e a r s s ince the A m e r i c a n G e o physica l Union e s t ab l i shed i t s Section of Hydro logy on N o v e m b e r 15, 1930. I c o n s i d e r tha t a c t as t h e f i r s t f o r m a l r ecogn i t ion of hydro logy as a d i s t i n c t sc ience c ove r ing a l l the w a t e r s of the e a r t h .
The i m p o r t a n c e of t h i s f ie ld was e m p h a s i z e d when the American Society of Civil Engineers a u t h o r i zed the e s t a b l i s h m e n t of i t s H y d r a u l i c s Div i s ion on A p r i l 19, 1938 a n d s t a t e d i t s p u r p o s e as " t h e advancement and d i s semina t ion of knowledge r e l a t ing to the occu r r ence of water in na tu re and i ts b e hav io r i n s t r u c t u r e s , w a t e r c o u r s e s , and u n d e r ground. " You will r e a d i l y see tha t t h r e e of t h e s e four p u r p o s e s a r e d i r e c t l y r e l a t e d to hydro logy .
FUNDAMENTAL HYDROLOGY
H y d r o l o g y , be ing a new s c i e n c e , p r o v i d e s a l a r g e f ie ld for m a n y new d i s c o v e r i e s by the s c i entif ic e x p l o r e r . Much of t h i s exp lo r a t i on w o r k , as Mr. F r y has pointed out, can be done b e s t in the h y d r a u l i c l a b o r a t o r y . M a n y of the f u n d a m e n t a l t h e o r i e s a n d laws r e g a r d i n g the o p e r a t i o n s i n the hydrologic cycle have not yet been developed. Such bas ic re la t ionsh ips a s evapora t ion and t e m p e r a t u r e of na tu ra l bodies of wa te r a r e not fully unde r s tood . Much h a s y e t to be l e a r n e d of the l aws af fec t ing soil mois tu re and the infi l trat ion capaci t ies of s o i l s .
The unit hydrograph method of computing r u n off d i s t r i b u t i o n for a d r a i n a g e b a s i n is a tool , d e veloped e m p i r i c a l l y , which has come into wide u s e in recen t y e a r s . I t has no b a s i s in the fundamenta l laws of sc i ence , yet, I bel ieve that r e s e a r c h in the hyd rau l i c l a b o r a t o r y can r e v e a l the b a s i c laws by
*Chief Engineer, Indiana Flood Control and Water Resources Commission, Indianapolis, Indiana.
which i t o p e r a t e s . Once the l aws a r e fully u n d e r stood, the me thod can be m o r e fully deve loped and the l imi t a t ions on its use d e t e r m i n e d .
The hyd rau l i c s of s t r e a m flow, al though i t h a s been s tud ied for m a n y y e a r s , i s s t i l l l i t t le u n d e r s tood, e s p e c i a l l y for s t r e a m s sub jec t t o v a r i a b l e s lope c o n d i t i o n s . In e s t a b l i s h i n g gaging s t a t i o n s to m e a s u r e the slope of s t r e a m s for d i s c h a r g e d e t e r m i n a t i o n s , i t h a s g e n e r a l l y b e e n a p r a c t i c e to ins ta l l the gages a t the most acces s ib l e points a long the s t r e a m . F r e q u e n t l y , l i t t l e c o n s i d e r a t i o n h a s been given t o b e n d s , v a r i a b l e c r o s s - s e c t i o n s and o t h e r n o n - u n i f o r m cond i t ions in the s lope r e a c h . I t i s g e n e r a l l y a s s u m e d tha t t h e s e cond i t ions wi l l be compensa ted for in the development of the r a t i n g for the s t r e a m . The difficulty often e x p e r i e n c e d in obta ining s a t i s f a c t o r y slope r a t i n g s i n d i c a t e s t ha t the effects of such condi t ions a r e not a l w a y s n e u t r a l i z e d in t h e r a t i n g . In t h i s f ie ld the h y d r a u l i c l a b o r a t o r y h a s a challenge to d e t e r m i n e the effects of va r ious conditions on slope r a t i ngs and to e s t a b l i sh guides to be followed in se lec t ing the b e s t p o s sible locations for gages with r e s p e c t to the p h y s i c a l f e a t u r e s of the r i v e r channel .
E Q U I P M E N T AND INSTRUMENTATION
One of the m o r e impor t an t p a r t s of M r . F r y ' s paper deal t with the development of specia l d e v i c e s and equipment . The development of new equ ipmen t and i n s t r u m e n t s m u s t keep pace with the a d v a n c e s in h y d r o l o g i c k n o w l e d g e . P r o b a b l y m a n y of the fundamenta l f ac t s yet to be l e a r n e d will depend on the use of new or b e t t e r i n s t r u m e n t s for t h e i r d i s covery .
Much labora to ry work has been expended on the study of evapora t ion in an a t t e m p t to define i t s r e l a t ionsh ip to t e m p e r a t u r e , wind ve loc i ty , r e l a t i v e h u m i d i t y and o the r f a c t o r s . Al though s o m e r e l a t i o n s h i p s have been e s t a b l i s h e d , our knowledge i s not complete enough to explain some incons i s t enc ie s in na ture .
The e v a p o r a t i o n f rom " C l a s s A " evapo ra t i on pans in t h i s s e c t i o n of the c o u n t r y is m u c h h i g h e r in Apr i l in re la t ion to t e m p e r a t u r e than i t i s du r ing other months. The ra te of evaporat ion a l so dec l i ne s m u c h m o r e r a p i d l y than t e m p e r a t u r e i n O c t o b e r . Any analys is of this situation is g rea t ly handicapped by the absence of evaporation data during the m o n t h s of November to March. Discontinuance of o b s e r v a t ions a t e v a p o r a t i o n s t a t ions d u r i n g t h i s p e r i o d i s l a rge ly because of the difficulty of making o b s e r v a t ions during f reezing weather . The deve lopment of i n s t r u m e n t s su i tab le for making yea r round o b s e r va t ions would be a wor th while under tak ing for the h y d r a u l i c l a b o r a t o r y . The d e v e l o p m e n t o f s a t i s fac tory r e c o r d i n g i n s t r u m e n t s for obtaining s i m u l taneous r e c o r d s of wa te r and a i r t e m p e r a t u r e s and evapora t ion l o s s e s would a l so be of va lue .
40
I understand that the Tennessee Valley Author i ty h a s had s o m e e x p e r i e n c e with weighing g a g e s for evapora t ion obse rva t ions , but I have not had an oppor tuni ty to find out how well they have worked .
F o r over 50 y e a r s the P r i c e type c u r r e n t m e t e r has been the s t andard ins t rument for use in s t r e a m gaging w o r k . D u r i n g th i s p e r i o d no r e a l l y b a s i c changes have been made in the m e t e r , and m o s t d e ve lopment s have been confined to the use of b e t t e r m a t e r i a l s in construction. The long use of th i s type of m e t e r a t t e s t s i t s exce l l ence . H o w e v e r , in th i s e l e c t r o n i c a g e , I be l i eve tha t a new m e t e r can be deve loped which will indicate w a t e r v e l o c i t i e s d i r e c t l y , i n s t ead of r e q u i r i n g the o p e r a t o r to count and t i m e the revo lu t ions of the m e t e r bucket whee l and then c o m p a r e t h e s e o b s e r v a t i o n s with a m e t e r ra t ing table to obtain ve loc i t ies . Record ing i n s t r u m e n t s can a l s o be developed to p r o d u c e g r a p h s of veloci ty observa t ions . Such i n s t r u m e n t s can speed up the operation of gaging a s t r e a m and provide m u c h m o r e information about the behavior of water v e l o c i t i e s .
The installation of recording gages for obtaining cont inuous r e c o r d s o f r i v e r s t a g e s i s v e r y cos t ly b e c a u s e o f the l a r g e s t r u c t u r e r e q u i r e d to house the r e c o r d i n g i n s t r u m e n t , s t i l l i ng w e l l , f lushing equipment for keeping intakes open, aux i l i a ry g a g e s , and to p r o v i d e suf f ic ien t r o o m for s e r v i c i n g and ma in ta in ing th i s equ ipment . I f s o m e inexpens ive , eas i ly installed and rel iable ins t rument , not r e q u i r ing a st i l l ing well , could be developed, the sav ings in in s t a l l a t ion c o s t s would p rov ide for m a n y m o r e r e c o r d e r i n s t a l l a t i o n s . Such g a g e s could a l s o be moved to new loca t ions without a l a r g e l o s s of in v e s t m e n t in a cos t ly s t r u c t u r e .
The field for the d e v e l o p m e n t of i n s t r u m e n t s and other equipment for use by hydro log is t s is wide open and offers an excel lent opportunity for l a b o r a t o r y r e s e a r c h .
HYDROLOGY AND STATE HYDRAULIC LABORATORIES
Near ly e v e r y s ta te un ive r s i ty tha t t e a c h e s hy d r a u l i c s has a hydrau l i c l a b o r a t o r y . The s i z e and c o m p l e t e n e s s of the l a b o r a t o r y d e p e n d s upon the e m p h a s i s p l a c e d o n h y d r a u l i c s a t t he p a r t i c u l a r un ivers i ty . B e c a u s e the eng ineer ing p r o f e s s i o n i s b r o a d and cove r s many s p e c i a l t i e s , not e v e r y un i v e r s i t y can be e x p e c t e d t o s p e c i a l i z e i n and e m p h a s i z e the s a m e phase of eng inee r ing . To t r y to cove r a l l p h a s e s would only b r e e d m e d i o c r i t y .
S e v e r a l u n i v e r s i t i e s have deve loped exce l l en t hydrau l ic l a b o r a t o r i e s , but m o s t of t h e m have e m p h a s i z e d the h y d r a u l i c s of s t r u c t u r e s . I t is good to see that we now have one that is going to s p e c i a l ize in the development of the sc i ence of hydro logy . I am glad that the Sta te tha t h a s t a k e n th i s s t e p i s located so close to Indiana, as I am s u r e that t h e r e
wil l be numerous occas ions in the future when I wi l l find it des i rable to consult with the l abora to ry .
C. E. KINDSVATER. * —It migh t be o b s e r v e d tha t the only accep tab le excuse for my comment ing on Mr. F r y ' s r e m a r k s i s t o p r e s e n t addi t ional e x a m p l e s of c o o p e r a t i o n b e t w e e n h y d r o l o g y and the h y d r a u l i c s l a b o r a t o r y . C e r t a i n l y no one i s b e t t e r qualified than he to unders tand the b r o a d e r a s p e c t s o f the s u b j e c t . F o r the p a s t 17 y e a r s a lone , a s chief of the T V A ' s H y d r a u l i c Data B r a n c h , he h a s a d m i n i s t e r e d an o rgan iza t ion composed of a m a j o r hydraulics labora tory as well as field inves t iga t ions , r i v e r f o r e c a s t i n g , and h y d r o l o g i c i n v e s t i g a t i o n s u n i t s . H i s o r g a n i z a t i o n h a s c o n t r i b u t e d m u c h t o the succe s s fu l a c c o m p l i s h m e n t of the A u t h o r i t y ' s c o m p r e h e n s i v e r i v e r - d e v e l o p m e n t p r o g r a m .
Mr. F r y n a m e d five a r e a s o f coope ra t ion b e tween hydraulics r e s e a r c h and hydrology. The f i r s t four d e a l t wi th i n s t r u m e n t a t i o n , h a v i n g a s t h e i r p r i m a r y p u r p o s e t h e i m p r o v e m e n t o f t e c h n i q u e s for d i r e c t m e a s u r e m e n t of h y d r o l o g i c q u a n t i t i e s . T h e fifth a r e a o f c o o p e r a t i o n w a s d e s c r i b e d a s " w o r k i n g out s o l u t i o n s fo r h y d r o l o g i c p r o b l e m s , e i ther in the r e a l m of hydrologic r e s e a r c h or p r o b l e m s encountered in a par t icular hydrologic project . " We may conclude tha t the l a s t topic i nc ludes a c t i v i t i e s which a i m t o w a r d the d e v e l o p m e n t o f new t h e o r e t i c a l c o n c e p t s .
Engineering hydrology is inescapably empir ical— to a degree . D i r e c t m e a s u r e m e n t s of b a s i c h y d r o -l o g i c da ta a r e the f a b r i c o f the s c i e n c e . E v e r y f o r m u l a i s judged by i t s ab i l i t y to s u b s t a n t i a t e an observed occu r r ence . In other words , good i n s t r u m e n t a t i o n and r e f i n e d m e a s u r i n g t e c h n i q u e s wi l l a l w a y s be of p r i m a r y c o n c e r n to the h y d r o l o g i s t . Bu t , e x p e r i e n c e a n d m e a s u r e m e n t i s no t enough. R e a l p r o g r e s s depends on the d e v e l o p m e n t of new i d e a s , new p h y s i c a l c o n c e p t s , and new ana ly t i ca l t o o l s with which to i n t e r p r e t the o b s e r v e d data .
My own p r e o c c u p a t i o n with the l a s t i t em in M r . F r y ' s e n u m e r a t i o n would lead m e t o p lace i t at the top of the l i s t . In my opinion, adequate s o l u t ions of the h y d r o l o g i s t ' s p r o b l e m s m u s t inevi tably b e g i n with a sound p h y s i c a l a n a l y s i s of the phen omenon c o n c e r n e d . We would p r o b a b l y a l l a g r e e on th i s e l e m e n t a r y t h e s i s . But , a r e we doing a l l we can to d e m o n s t r a t e our faith in t h i s i d e a ?
Let us examine a specif ic p r o b l e m which conc e r n s a m a j o r i t y of th i s g r o u p — t h e m o v e m e n t of wa te r in r i v e r s . The basic problem is tha t of v a r i e d flow in non-un i fo rm open channe l s . We r e c o g n i z e t ha t ex is t ing c o m p u t a t i o n m e t h o d s a r e inadequa te for a l l but the s i m p l e r a s p e c t s o f t h i s p r o b l e m . Equat ions which d e s c r i b e the mean flow pa t t e rn in
*Professor , School of Civil Engineering, Georgia Institute of Technology, Atlanta, Georgia.
4 1
p r i s m a t i c channels have not been succes s fu l l y e x tended to e m b r a c e the infinite v a r i e t y of boundary c o n d i t i o n s w h i c h c h a r a c t e r i z e n a t u r a l c h a n n e l s . T h e r e is little reason , a t the p re sen t t i m e , to th ink t h a t th is p r o b l e m i s a m e n a b l e t o e x a c t a n a l y t i c a l solution. There is both reason and example to i nd i cate that it is a problem which is deserving of a g rea t d e a l of b a s i c r e s e a r c h .
R e s e a r c h i s not n e c e s s a r i l y conduc ted in the l abora tory , but this i s usually the m o s t economica l and exped i t ious p r o c e d u r e . F i e l d r e s e a r c h o r d i na r i ly r e q u i r e s la rge inves tments in manpower and t i m e . Ins t rumenta t ion i s difficult, and na tu ra l ob s t a c l e s t o de ta i l ed m e a s u r e m e n t s a r e often i n s u r mountable . A sa t i s fac to ry range of t e s t condit ions i s f requent ly obta inable only by s p r e a d i n g the r e s e a r c h ac t iv i ty over a n u m b e r of wide ly s e p a r a t e d s i t e s . More often, i t is neces sa ry that the r e s e a r c h be delayed, perhaps for y e a r s , in order that e x t r e m e n a t u r a l o c c u r r e n c e s might be inves t iga ted . In the labora tory , on the other hand, a full range of flows is obtained by adjusting a valve. One man , working comfortably and with scientific precis ion, will ga the r in minutes or hours data which would r equ i r e s e v e r a l m e n days or w e e k s to co l l ec t in the field. I need not e l abo ra t e , for t h i s , too , i s an a c c e p t e d t h e s i s .
Why is it, then, that more fundamental r e s e a r c h in r i v e r h y d r a u l i c s i s not underway a t the p r e s e n t t i m e ? I would like to suggest one explanation. R e l a t ively few of the agencies r e p r e s e n t e d by this g roup have a d e q u a t e l a b o r a t o r y f a c i l i t i e s of t h e i r own. F e w s t a t e s , for e x a m p l e , a r e a s f o r t una t e a s the State of I l l inois in having exce l l en t f ac i l i t i e s such a s these we a r e h e r e t o ded ica t e . Many a g e n c i e s c o n c e r n e d wi th d i f f e r e n t a s p e c t s o f e n g i n e e r i n g hydrology will never have, and, in fact, could n e v e r justify hydraul ics l abora to r i e s of t he i r own. T h e s e a g e n c i e s , then , m u s t t ake the i r p r o b l e m s t o such labora tor ies as a r e available and capable of handling sponso red r e s e a r c h . And t h e r e ' s the r u b ! I f you a r e a smal l , pr ivate organization, i t may be n e c e s s a r y only that you have in your staff p e r s o n s capable of r e c o g n i z i n g the n e e d for " o u t s i d e " h e l p . The p r o c e s s of acqu i r ing such a s s i s t a n c e may be r e l a t ively s imple . If, however , you r e p r e s e n t a publ ic agency, as mos t of you do, you know that this p r o c e s s is not infrequently the ult imate s tumbling block. To acquire the a s s i s t a n c e of o thers is to admi t tha t your own staff or your own facil i t ies a r e inadequate . That, in itself, is m o r e than a selfish a d m i n i s t r a t o r can p e r m i t . F u r t h e r m o r e , s p o n s o r e d r e s e a r c h m u s t be p a i d fo r , and t h i s d i s t u r b s your budget . Knowing t h a t the top b r a s s m igh t have to be sold on the economic feasibi l i ty of r e s e a r c h , you migh t s top h e r e . O r , p e r h a p s , you h a v e a n a s t y cont r a c t i n g of f ice r , a c l e r k , or a f r u s t r a t e d l awye r who m a k e s c o n t r a c t u a l m a t t e r s so unp leasan t t ha t you p r e f e r to avoid the e n t i r e i s s u e . Le t us hope that i t is not your eng ineer ing staff who cons t i tu te
the b a r r i e r . I t i s my opinion t ha t the s i tua t ion we face cal ls not only for faith in r e s e a r c h but for bold p e r s e v e r a n c e on the p a r t of our a d m i n i s t r a t o r s .
I would like, now, to descr ibe a m o r e optimist ic t r e n d o f e v e n t s . M r . F r y m e n t i o n e d b r i e f l y two " i n d i r e c t " methods of e s t ima t ing flood flows which w e r e d e s e r v i n g o f r e s e a r c h . T h e s e w e r e the s o -ca l led s l o p e - a r e a and con t rac ted-open ing m e t h o d s . I t i s ag reed , a t p r e s e n t , that the m o s t s a t i s f a c t o r y me thod of de t e rmin ing d i s c h a r g e in l a r g e , n a t u r a l channels i s by d i r ec t measu remen t . Yet, i t i s r e c ognized that m a j o r floods on l a r g e r i v e r s a r e f r e quently impossible to measure accura te ly by exis t ing m e t h o d s , and t h a t f lood f lows o n s m a l l s t r e a m s often subside before an observer can r e a c h the s i t e . In many instances , too, past floods of g r e a t s ignif i cance a r e recorded, if at al l , only in t e r m s of h i g h -w a t e r m a r k s . I t i s on such o c c a s i o n s tha t the ind i r e c t methods of computing flood flows a r e ca l l ed upon to sa lvage the avai lable r e c o r d s .
Agenc ies p r i m a r i l y r e s p o n s i b l e for co l lec t ing r e c o r d s of flood d i s c h a r g e s have become i n c r e a s ingly a w a r e of the impor t ance of i nd i r ec t m e t h o d s . They a r e a l so aware of the inadequac ies of ex is t ing c o m p u t a t i o n p r o c e d u r e s . F o r s e v e r a l y e a r s the W a t e r R e s o u r c e s B r a n c h of the U. S. Geo log i ca l Survey has been compil ing and ana lyz ing field data w h i c h would c o n t r i b u t e to a b e t t e r u n d e r s t a n d i n g of i nd i r ec t me thods . They have a c c u m u l a t e d cons i d e r a b l e ev idence to suppor t ex i s t i ng m e t h o d s of computing flood flows by both the s l o p e - a r e a and the c o n t r a c t e d - o p e n i n g t e c h n i q u e s . And ye t , among t h e i r da ta , t h e r e a r e those unexp la ined i n c o n s i s t e n c i e s w h i c h c o n t i n u e to t h r o w a s h a d o w of uncer ta inty over all methods of de te rmina t ion by c o m putat ion ins tead of m e a s u r e m e n t . Dur ing the p a s t y e a r the U. S. G. S. h a s a u t h o r i z e d a p r o g r a m of f u n d a m e n t a l r e s e a r c h on the c o n t r a c t e d - o p e n i n g method. They have taken th is p r o b l e m to the l a b o r a t o r y . Through a r r a n g e m e n t s with the Georg i a T e c h R e s e a r c h I n s t i t u t e , t h e y a r e s p o n s o r i n g a p r o g r a m of l a b o r a t o r y r e s e a r c h which I have been p r i v i l e g e d t o d i r e c t . H e r e , t h e n , i s a n o t h e r e x ample of a way in which the l abora to ry can be ca l led upon to aid the hydrologist .
You might be in te res ted in knowing how we have a t t a c k e d th i s a s s i g n m e n t . We have acknowledged the fundamental na ture of the p r o b l e m by d e s c r i b i n g the p ro jec t as an inves t iga t ion of the flow of w a t e r t h rough open-channe l c o n s t r i c t i o n s . S t a r t ing with s i m p l e r e c t a n g u l a r c o n s t r i c t i o n s in a l e v e l , r e c t angu la r flume, we a t t empted f i r s t to gain a b e t t e r unders tanding of the flow p a t t e r n and to i so l a t e the c r i t i c a l va r i ab l e s . An ana lys i s b a s e d on t he se ex p l o r a t o r y t e s t s was then subs tan t i a ted for a l a r g e r v a r i e t y of s i m p l e c o n s t r i c t i o n s , and the r e l a t i v e inf luence of each of the m a j o r v a r i a b l e s was s y s t e m a t i c a l l y d e t e r m i n e d by e x p e r i m e n t . Cont inued s u c c e s s in c o r r e l a t i n g the e f f ec t s o f the v a r i o u s
42
boundary conditions was encouragement for extend-ing the basic analysis to the general problem. Until now, we have extended the laboratory investigations to cover three degrees of boundary roughness, several i r regular channel shapes, and a wide variety of constrictions, including some which were eccent r ica l ly located in the flume, others which were placed at an angle to the flow, some which had sloping sides, simulating embankments, and many others which contributed to a full range of practical shapes. We a re opt imist ic about our accomplishments to date. We are confident that the results of this study will be practicable.
The contracted-opening method, as suggested by Prof. S. M. Woodward, was first described in American l i terature in 1918 by Mr. Ivan E. Houk. The urgent need for this method of determining flood flows is attested by the fact that it has been kicked around for the past thirty-three years. We can only hope that the manhandling which it has received in the past eight months will leave it in better condition than that in which we found it.
In conclusion, I would like to take this opportu
nity to appeal for cooperation of another variety. Mr. Fry has given proper emphasis to the need for competent personnel in this field. Fundamental research, in engineering as in pure science, calls for a staff of experts. Exper ts in hydraulic engineering, for example, a r e certainly not produced in four years of civil engineering training. And it is increasingly apparent that job experience alone cannot produce a staff of the highest calibre. As our own technology advances , it becomes more complex. Not only in our r e sea r ch laborator ies , but in our design and field offices we need more men who have extended their college training to include at least one full year of graduate study. The colleges a re attempting to mee t this need by expanding their graduate programs. They need your help. Maintenance of competent teaching staffs and adequate educational facilities can hardly be jus t i fied on the bas is of the smal l number of students who part icipate in these p rog rams at the present t ime. Therefore, one of the greatest professional contributions which each of you can make is to publicize your need for competent hydraulic engineers.
BED-LOAD FUNCTION FOR SEDIMENT TRANSPORTATION IN OPEN CHANNEL FLOWS
BY H. A. EINSTEIN*
WITH DISCUSSIONS BY VITO A. VANONI AND RALPH W. POWELL
Most engineering design is based, to a large extent, on experience. When the backlog of exper ience in a given field inc reases in volume, it becomes difficult to apply it to a specific case unl e s s a l l the individual p ieces of exper ience a re organized into a system permitting classification and comparison of the individual observations. The philosophy of such a system is called a Theory, and the means of expression should preferably be the mathematical formula. Today, I shall attempt to give you some of the basic ideas behind my approach to the description of sediment t ransport .
The s tar t ing point of this development is an abundance of flume studies and an extreme lack of river measurements. The flume experiments must be interpreted as a model study of the natural r iver and are of significance for the river problem only if the laws of similitude can be determined according to which the flume can be tied to the prototype. The basic question of similarity as applied to sediment t r anspor t has been in my center of in teres t for many years. Our basic way of approach is that of reducing all variables and constants to dimen-sionless form. In every mathematically correc t system of similarity will such dimensionless pa r ameters and constants be equal in model and p ro totype. So will the equations between them, as long as the physical problem is the same. This is the explanat ion for the use of some ra the r abs t rac t d imens ion le s s p a r a m e t e r s .
The expression "Bed-Load Function" is a direct translation of "Geschiebefunktion" which has been used during the past 20 years in the European l i t e ra ture with the same meaning: the equilibrium rate of bed sediment moving through a r iver section. In Bulletin No. 1026** a detailed description was given of the exact definition of the problem and of its solution, as we see it today. The treatment of the bed is especially new wherein the constituents of the sediment mixture do not move at equal r a t e s . In order not to just duplicate the Bulletin, I shall give here the basic ideas only, without the use of formulas.
* Professor, Mechanical Engineering, University of California, Berkeley, California.
**Einstein, Hans A., "Bed-Load Function for Sediment Transportation in Open Channel Flows," U. S.. Dept. of Agriculture Tech. Bull. No. 1026, Sept. 1950.
My students always ask me why we are in terested in the determination of the sediment load in a r ive r , and my answer is that there a re mainly two reasons: first, we may want to predict the rate at which sediment must be expected to accumulate in a proposed reservoi r ; second, a comparison of the rates of sediment, which a river channel is able to transport, with the rates supplied to the channel from the watershed indicates whether or not a given stream channel may be expected to be stable. Both problems thus involve the determination of the sedi ment capacity of a r iver channel. The difference is that in the reservoir problem the emphasis is on the bulk of the transport , or in most cases, on the finer constituents of the sediment which a r e only lightly represen ted in the bed, while the channel problem is determined by the motion of the la rger sized particles which represent the bulk of the bed material. Therefore, it is not sufficient to describe the sediment load as a curve of the sediment ra te against discharge or stage, but the size analysis of the t ranspor t of various flows must be given, too. In Bulletin 1026 the rates of transport are calculated in function of discharge separately for the individual grain size fractions. These rates may then be added to find the total sediment rates which are required for the solution of a part icular practical problem.
If we aim to determine the capacity load of a sediment-carrying channel, the complete flow pattern must be known, as described by the discharge, the water depth, the slope, the average velocity, the velocity distribution and the shear forces along the bed. Much work has been done with good success on the descript ion of r iver flows, but there are still many unanswered questions left. For instance, different friction factors were determined in the same alluvial s t r eam channels at high and low discharges. Just recently, I published a paper together with Mr. Barbaressa, now in Minneapolis, on just this problem. By calculating friction factors from a large number of measurements in different streams, we found that the friction in those s t reams can be described as the sum of two parts . One is the friction which refers to the grains whether it is gravel, sand or finer-. This part can be expressed in a s imi la r way a s , for instance, the resu l t s of Nikuradse's experiments were expressed. He m e a s ured the friction of flows in pipes which were a r t i -
43
44
f i c i a l l y r o u g h e n e d b y g l u e i n g s a n d g r a i n s t o the o t h e r w i s e smooth wa l l . We found then tha t i t was n e c e s s a r y to add to th is fr ict ion (which m a y be p r e d ic ted from fo rm u la s a s de r ived f rom N i k u r a d s e ' s e x p e r i m e n t s ) an add i t i ona l effect which d e s c r i b e d the f r i c t iona l effect of the i r r e g u l a r i t y of the bed , and of the sand b a r s . This in itself is qui te r e a s o n a b l e but was not obv ious . The only way to dec ide whe the r ac tua l ly t h i s f r i c t iona l effect could be d i vided into two p a r t s was to find out if a r e a s o n a b l e descr ipt ion can be given of the bar r e s i s t a n c e . Th i s actual ly appears to be poss ib le if the ba r r e s i s t a n c e is descr ibed as a function of the sediment t r a n s p o r t on the bed. With our m e a g r e knowledge of the s e d i m e n t t r a n s p o r t , t h i s app roach s e e m s to be of l i t t le h e l p . H o w e v e r , we can u s e a t r i c k . In Bul le t in 1026 it is shown that the p a r t of the sed iment t r a n s po r t moving near the bed, which Bagnold has ca l l ed surface c reep , can be given as a function of , the r a t i o o f the g r a i n s i z e to the t r a c t i v e f o r c e a long the bed. The t r a c t i v e f o r c e o r bo t tom s h e a r m a y e a s i l y be c a l c u l a t ed f r o m the flow.
How mus t we i n t e r p r e t th is addi t ional f r i c t ion? Is i t the energy spent for the t r anspor t i t s e l f ? Th i s ques t ion m u s t be a n s w e r e d with a definite nega t ive b e c a u s e the v a l u e i s t h e h i g h e s t a t l ow r a t e s o f t r a n s p o r t a n d b e c o m e s p r a c t i c a l l y z e r o a t high r a t e s . The only i n t e r p r e t a t i o n which d id not lead to a n y c o n t r a d i c t i o n i s t h a t which l i n k s i t t o the s h a p e r e s i s t a n c e o f b a r s o r r i pp l e m a r k s . Th i s can be seen by careful s tudy of the f r ic t ional effect i n ava i lab le publ i shed e x p e r i m e n t s . F o r i n s t a n c e , G i lbe r t ' s exper iments will show it. The b a r s s e e m to d isappear , too, at the highest r a t e s of t r a n s p o r t . If t he f r i c t i on l aws of a flow over an a l l u v i a l bed a r e known, one may predic t the average flow veloc i ty and the ve loc i ty d i s t r i b u t i o n by known m e t h o d s .
The Bul le t in d e s c r i b e s r a t h e r e l a b o r a t e l y the p r o c e d u r e of the h y d r a u l i c calcula t ion on the b a s i s of these ra ther new formulas . I did this for the sake of the field engineer who is usual ly not too f ami l i a r with the r e s e a r c h l i t e r a t u r e . Only he can check by field measurement whether or not such new me thods a r e a p p l i c a b l e t o a c t u a l f ie ld cond i t ions d i f ferent f r o m those f r o m which t h e y were d e r i v e d .
After the flow is d e s c r i b e d in such a channel , i t i s now n e c e s s a r y t o d e r i v e the r e s u l t i n g s e d i m e n t t r a n s p o r t . The l i t e r a t u r e , so fa r , h a s given t w o a p p r o a c h e s : one i s t h e d e s c r i p t i o n o f s u s pended load and the other a desc r ip t ion of bed - load t r a n s p o r t , mos t ly by fo rmulas of the t r a c t i v e - f o r c e type. The big difficulty was that the re was ac tua l ly no l ink be tween the two and i f you a s k e d yourse l f how you can use the suspended load t h e o r y in o r d e r to p r e d i c t the r a t e s of t r a n s p o r t , then you a lways came back to the fact that no prediction of suspended load was p o s s i b l e wi thout s o m e kind of m e a s u r e m e n t de te rmining s o m e r e f e r e n c e concen t ra t ion . I s t a r t e d my s tud ies beginning with the b e d - l o a d b e -
cause at l eas t for the s tabi l i ty of the bed, the t r a n s p o r t r a t e along the b e d m u s t be e x p e c t e d to be the m o s t i m p o r t a n t p a r t of the load.
B e d - l o a d was u s u a l l y s tudied by e x p e r i m e n t s in flumes either in the labora tory or outside. T h e n , one t r i e d t o find r e l a t i o n s h i p s d e s c r i b i n g t h e r e s u l t s . Af te r a n a l y z i n g a l l a v a i l a b l e da ta I fe l t i t was n e c e s s a r y t o e n l a r g e the r a n g e , i n which e x p e r i m e n t s o f that k ind w e r e m a d e , by s i m u l t a n e ous ly i nc reas ing the flow ve loc i t i es and d e c r e a s i n g the g r a in s i ze . I got into condit ions w h e r e a l a r g e p a r t of the bed s e d i m e n t moved in s u s p e n s i o n and found that expe r imen t s of this kind could not be e x p r e s s e d b y the s a m e equa t ions a s the e x p e r i m e n t s which have p r a c t i c a l l y n o s u s p e n s i o n . F r o m tha t I concluded that t h e r e m u s t be a r e l a t ionsh ip of the b e d - l o a d type gove rn ing the r e f e r e n c e c o n c e n t r a t ion of the suspension because the total ra te of t r a n s p o r t which includes suspens ion and bed load was a function of the flow, but different f rom that for p u r e bed - load e x p e r i m e n t s . So I f igured tha t s o m e new thought m u s t be b r o u g h t in to exp la in how s u s p e n sion was governed. Tha t was done in the fol lowing way. It was assumed that the suspended load t h e o r y appl ies over prac t ica l ly the en t i re depth to d e s c r i b e the concen t r a t i on . Our d e s c r i p t i o n of s u s p e n s i o n b r e a k s down only in the immedia te p r o x i m i t y of the bed . T o s e e t h i s , l e t u s r e v i e w how s u s p e n s i o n is caused by turbulence. The turbulence gives v e r t i cal ve loc i t i e s to individual fluid m a s s e s wi thin the flow. These m a s s e s take the suspended load p a r t i c l e s along and thus lift t hem ver t ical ly . The m a s s e s which together move at the same velocity and d i r e c t ion become smal le r and sma l l e r ve ry nea r the b o t t om as is shown by the t heo ry of t u r b u l e n c e . At a d i s t a n c e of a few p a r t i c l e d i a m e t e r s f r o m t h e b e d these individual m a s s e s , which move as a unit , b e come so s m a l l that t h e y can not m o v e the p a r t i c l e any m o r e . They only t i ck le t h e m s o m e w h a t .
A t t h i s t ime w e have s o m e e x p e r i m e n t s r u n ning with a light weight m a t e r i a l as s e d i m e n t . In t h e s e , one can v e r y we l l d i s t i n g u i s h t h r e e l a y e r s with r e s p e c t to the s e d i m e n t : the bo t t om l a y e r of p a r t i c l e s which do not m o v e ; the top l a y e r w h e r e the p a r t i c l e s m o v e a b o u t wi th t h e v e l o c i t y o f t h e w a t e r and be tween the two t h e r e is a l a y e r of one to t h r e e pa r t i c l e s t h i cknes s , where they move v e r y m u c h s l o w e r by d i s t i n c t l y ro l l ing o r s l id ing o v e r the b o t t o m . T h i s m o t i o n s u g g e s t s t h e fo l lowing i n t e rp r e t a t i on . Down to about two d i a m e t e r s f r o m the bed one m a y app ly the su spended load t h e o r y . B e t w e e n t h a t e l e v a t i o n and the b e d the t r a n s p o r t r e s e m b l e s much m o r e that of bed- load. An a t t e m p t t o apply the same f o r m u l a to th i s bed l a y e r a s a p plied to pure bed- load, in expe r imen t s without s u s p e n s i o n , t u r n e d out t o be m o s t s u c c e s s f u l i f t he c o n c e n t r a t i o n i n t h i s l a y e r was i n t r o d u c e d a s t h e ini t ial concentration for the suspension above. T h u s the c o m p o s i t e t r a n s p o r t i n the e n t i r e v e r t i c a l b e -
4 5
came a function of the bed- load t r a n s p o r t and, t h u s , o f t h e d i s c h a r g e . In the a c t u a l e x p e r i m e n t one m e a s u r e s the t o t a l t r a n s p o r t a t the d o w n s t r e a m end of the f l u m e . The a n a l y s i s of the r e s u l t s is e a s y as long as the s e d i m e n t c o n s i s t s o f u n i f o r m grain. F i r s t , the t r a n s p o r t in the bed layer i s p r e dicted f rom the r e su l t s of expe r imen t s without s u s pension. This rate defines the bottom concentra t ion . By i n t e g r a t i o n of the s u s p e n d e d load over the full depth and by addit ion of the bed load, the to t a l l oad is ca lcula ted and m a y be c o m p a r e d with the m e a s urement. This same calculation applies to the r i v e r , t oo .
Then c a m e the nex t q u e s t i o n : what happens when the sediment is not uniform? If you have e v e r w o r k e d w i t h the s u s p e n d e d load t h e o r y you know that the p a r a m e t e r s of the calculat ion a r e di f ferent for the d i f f e r e n t p a r t i c l e s i z e s and t y p e s . I t i s t h u s n e c e s s a r y to c a l c u l a t e the s u s p e n s i o n o f t h e i n d i v i d u a l g r a i n s i z e s s e p a r a t e l y and the s a m e a p p l i e s a l s o t o the t o t a l load . The v e r t i c a l d i s tr ibutions of the different suspended gra in s i z e s can be calculated independently, and the same independence was found to be appl icable , to a l a rge d e g r e e , to the bed - load motion of a m i x t u r e . It was shown that for l a r g e r par t ic les of a mix ture this independence is a b s o l u t e . F o r the f iner c o m p o n e n t s of a mix tu re and for g ra in s i z e s s m a l l e r than 0 . 2 m m . one m u s t i n t r o d u c e a few c o r r e c t i o n s . The fine components of a mixture for instance hide behind or between the coarse r pa r t i c l e s of the bed and a r e not to the d e g r e e avai lable for t r a n s p o r t tha t would be expected by assuming full independence. Also when the pa r t i c l e s become so sma l l that the tota l s u r f a c e takes the appearance of a hydraul ica l ly smooth s u r face one m u s t in t roduce some c o r r e c t i o n s . T h e s e
c o r r e c t i o n s a r e v e r y i m p o r t a n t i f the p r o p e r r e sul ts a r e to be obtained. In Bul le t in 1026 a s e t of such c o r r e c t i o n s is shown which has been found to d e s c r i b e r e a s o n a b l y wel l r a t h e r l a r g e n u m b e r s o f f lume e x p e r i m e n t s . But i t m u s t be kep t in mind that these c o r r e c t i o n s a r e e m p i r i c a l and s t i l l s u b jec t to future improvement . We have found l a t e ly , for i n s t a n c e , t ha t t h e r e i s one c a s e w h e r e s o m e modif ica t ions of t he se c o r r e c t i o n s become n e c e s sa ry . This i s the case where the bed a s s u m e s the tendency to develop l aye r s . Stratification will occu r especial ly under conditions of deposition. It a p p e a r s that on a stratified deposit there is l e ss in t e r f e rence b e t w e e n the p a r t i c l e s than on a u n i f o r m l y m i x e d bed.
In s u m m a r i z i n g , one may s ta te that tha t b a s i c concep t of s e d i m e n t m o t i o n on an a l l u v i a l bed is successful, which (1) divides the to ta l t r a n s p o r t into a bed - load p a r t n e a r the bed; (2) a suspended load p a r t above t h i s l a y e r , w h e r e t h e b e d - l o a d mo t ion defines a r e f e r e n c e concen t ra t ion n e a r the bed. I t i s n e c e s s a r y , f u r the rmore , to ca lcu la te s e p a r a t e l y the t r a n s p o r t r a t e s of individual g ra in s i zes within a m i x t u r e , m a i n l y b e c a u s e of t h e i r d i f fe ren t b e havior in suspens ion . More w o r k is n e c e s s a r y on the effective exchange coeff ic ients for s u s p e n s i o n in na tu ra l r i v e r sect ions . The mutua l i n t e r f e r e n c e of the va r ious gra in s izes of a s ed imen t m i x t u r e in the b e d - l o a d m o t i o n a s d e s c r i b e d e m p i r i c a l l y i n Technical Bullet in No. 1026 needs fur ther checking b y r i v e r m e a s u r e m e n t s . N o a v a i l a b l e r i v e r o r f lume m e a s u r e m e n t s c o n t r a d i c t , in any way, the b a s i c a p p r o a c h t o the to t a l load d e t e r m i n a t i o n a s set forth in th is paper . F u r t h e r ba s i c work on th i s i n t e r p r e t a t i o n of s ed imen t mo t ion is in p r o g r e s s .
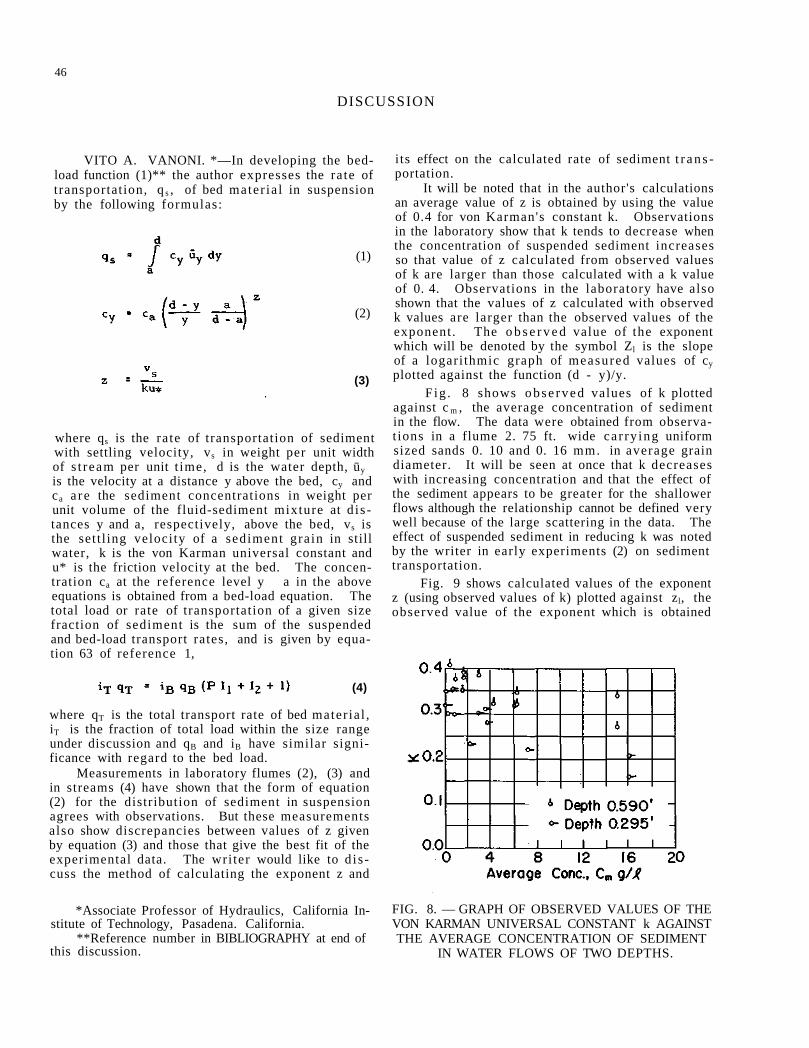
46
DISCUSSION
VITO A. VANONI. *—In developing the bed-load function (1)** the author expresses the ra te of transportation, q s , of bed mater ia l in suspension by the following formulas:
(1)
(2)
(3)
where qs is the ra te of transportation of sediment with settling velocity, vs in weight per unit width of s t ream per unit t ime, d is the water depth, ūy is the velocity at a distance y above the bed, cy and ca a re the sediment concentrations in weight per unit volume of the fluid-sediment mixture at d i s tances y and a, respectively, above the bed, vs is the set t l ing velocity of a sediment gra in in still water, k is the von Karman universal constant and u* is the friction velocity at the bed. The concentration ca at the reference level y a in the above equations is obtained from a bed-load equation. The total load or rate of transportation of a given size fraction of sediment is the sum of the suspended and bed-load transport rates, and is given by equation 63 of reference 1,
(4)
where qT is the total transport rate of bed mater ia l , iT is the fraction of total load within the size range under discussion and qB and iB have similar significance with regard to the bed load.
Measurements in laboratory flumes (2), (3) and in streams (4) have shown that the form of equation (2) for the distribution of sediment in suspension agrees with observations. But these measurements also show discrepancies between values of z given by equation (3) and those that give the best fit of the experimental data. The wri ter would like to d i s cuss the method of calculating the exponent z and
*Associate Professor of Hydraulics, California Institute of Technology, Pasadena. California.
**Reference number in BIBLIOGRAPHY at end of this discussion.
i ts effect on the calculated rate of sediment t r a n s portation.
It will be noted that in the author's calculations an average value of z is obtained by using the value of 0.4 for von Karman's constant k. Observations in the laboratory show that k tends to decrease when the concentration of suspended sediment increases so that value of z calculated from observed values of k are larger than those calculated with a k value of 0. 4. Observations in the laboratory have also shown that the values of z calculated with observed k values are larger than the observed values of the exponent . The o b s e r v e d value of the exponent which will be denoted by the symbol Zl is the slope of a logari thmic graph of measured values of cy plotted against the function (d - y)/y.
F ig . 8 shows obse rved values of k plotted against c m , the average concentration of sediment in the flow. The data were obtained from observat ions in a flume 2. 75 ft. wide ca r ry ing uniform sized sands 0. 10 and 0. 16 mm. in average grain diameter. It will be seen at once that k decreases with increasing concentration and that the effect of the sediment appears to be greater for the shallower flows although the relationship cannot be defined very well because of the large scattering in the data. The effect of suspended sediment in reducing k was noted by the writer in early experiments (2) on sediment transportation.
Fig. 9 shows calculated values of the exponent z (using observed values of k) plotted against zl, the observed value of the exponent which is obtained
FIG. 8. — GRAPH OF OBSERVED VALUES OF THE VON KARMAN UNIVERSAL CONSTANT k AGAINST THE AVERAGE CONCENTRATION OF SEDIMENT
IN WATER FLOWS OF TWO DEPTHS.
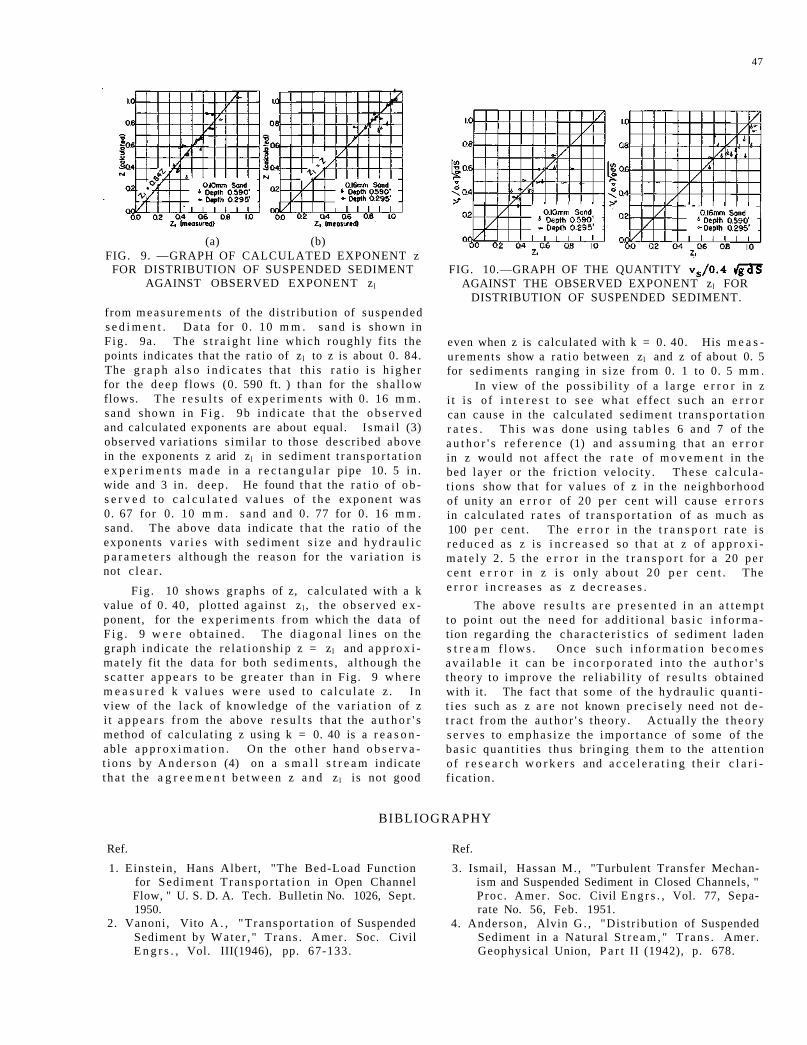
47
(a) (b) FIG. 9. —GRAPH OF CALCULATED EXPONENT z
FOR DISTRIBUTION OF SUSPENDED SEDIMENT AGAINST OBSERVED EXPONENT zl
from m e a s u r e m e n t s of the d is t r ibut ion of suspended s e d i m e n t . D a t a for 0 . 10 m m . s a n d is shown in F ig . 9a. The s t r a i g h t l ine which roughly fi ts the points indicates that the rat io of z l to z is about 0. 84. The g r a p h a l s o i n d i c a t e s tha t th i s r a t i o i s h i g h e r for the deep flows (0. 590 ft. ) t han for the sha l low flows. The r e s u l t s of e x p e r i m e n t s with 0. 16 m m . sand shown in F i g . 9b ind ica te t h a t the o b s e r v e d and calculated exponents a r e about equal. I sma i l (3) observed var iat ions s imi la r to those described above in the exponents z arid z l in sediment t r a n s p o r t a t i o n e x p e r i m e n t s m a d e in a r e c t a n g u l a r pipe 10. 5 in. wide and 3 in. deep . He found t ha t the r a t i o of o b s e r v e d to c a l c u l a t e d v a l u e s o f t h e exponen t was 0. 67 for 0. 10 m m . sand and 0. 77 for 0. 16 m m . sand. The above data indicate t h a t the r a t io of the exponents v a r i e s with sed imen t s i z e and h y d r a u l i c p a r a m e t e r s although the r ea son for the va r i a t i on is not c l e a r .
F ig . 10 shows graphs of z, ca lcu la ted with a k value of 0 . 40, plot ted aga ins t z l , the obse rved e x ponent, for the e x p e r i m e n t s f rom which the da ta of F i g . 9 w e r e ob ta ined . The d i a g o n a l l i nes on the graph indica te the re la t ionsh ip z = z l and a p p r o x i mate ly fit the data for both s e d i m e n t s , a l though the sca t t e r a p p e a r s to be g r e a t e r than in Fig. 9 w h e r e m e a s u r e d k v a l u e s w e r e used to c a l c u l a t e z . In view of the l ack of knowledge of the va r i a t i on of z i t a p p e a r s f r o m the above r e s u l t s that the a u t h o r ' s method of calcula t ing z using k = 0. 40 is a r e a s o n able a p p r o x i m a t i o n . On the o t h e r hand o b s e r v a t ions by A n d e r s o n (4) on a s m a l l s t r e a m indicate t h a t the a g r e e m e n t b e t w e e n z a n d z l i s not good
FIG. 10.—GRAPH OF THE QUANTITY AGAINST THE OBSERVED EXPONENT zl FOR
DISTRIBUTION OF SUSPENDED SEDIMENT.
even when z is calculated with k = 0. 40. His m e a s urements show a ra t io between zl and z of about 0. 5 for sed iments ranging in s ize f rom 0. 1 to 0. 5 m m .
In view of the poss ib i l i ty of a l a r g e e r r o r in z i t i s o f i n t e r e s t to s e e what effect s u c h an e r r o r can cause in the calcula ted sed iment t r a n s p o r t a t i o n r a t e s . Th i s w a s done us ing t a b l e s 6 and 7 of the a u t h o r ' s r e f e r e n c e (1) and a s s u m i n g tha t an e r r o r in z would not a f fec t the r a t e of m o v e m e n t in the bed l aye r or the f r ic t ion veloci ty . T h e s e c a l c u l a t ions show that for va lues of z in the ne ighborhood of uni ty an e r r o r of 20 pe r cent wi l l c ause e r r o r s in ca lcu la ted r a t e s of t r a n s p o r t a t i o n of as m u c h as 100 p e r cen t . The e r r o r in the t r a n s p o r t r a t e i s r e d u c e d as z is i n c r e a s e d so t ha t a t z of a p p r o x i m a t e l y 2. 5 the e r r o r in the t r a n s p o r t for a 20 pe r c e n t e r r o r in z i s on ly a b o u t 20 p e r c e n t . The e r r o r i n c r e a s e s a s z d e c r e a s e s .
The above r e s u l t s a r e p r e s e n t e d in an a t t e m p t to point out the n e e d for add i t iona l b a s i c i n f o r m a tion regarding the c h a r a c t e r i s t i c s of sediment laden s t r e a m f l o w s . Once s u c h i n f o r m a t i o n b e c o m e s a v a i l a b l e i t c a n be i n c o r p o r a t e d in to the a u t h o r ' s theory to improve the re l iab i l i ty of r e s u l t s obtained with it. The fact that some of the hydrau l ic quan t i t i e s such as z a r e not known p r e c i s e l y need not d e t r a c t f rom the a u t h o r ' s theory . Actual ly the t h e o r y s e r v e s to emphas i ze the impor t ance of some of the ba s i c quant i t ies thus br inging t h e m to the a t t en t ion o f r e s e a r c h w o r k e r s and a c c e l e r a t i n g t h e i r c l a r i f icat ion.
BIBLIOGRAPHY
Ref. 1. Einstein , Hans Albert , "The Bed-Load Function
for Sed imen t T r a n s p o r t a t i o n in Open Channel Flow, " U. S. D. A. Tech. Bulletin No. 1026, Sept. 1950.
2. Vanoni, Vito A . , "T ranspo r t a t i on of Suspended Sediment by Wate r , " T rans . Amer . Soc. Civil E n g r s . , Vol. III(1946), pp. 67-133.
Ref. 3. Ismail, Hassan M. , "Turbulent Transfer Mechan
ism and Suspended Sediment in Closed Channels, " Proc . Amer . Soc. Civil E n g r s . , Vol. 77, Separate No. 56, Feb. 1951.
4. Anderson, Alvin G . , "Dis t r ibut ion of Suspended Sediment in a Natural S t r e a m , " T r a n s . Amer . Geophysical Union, P a r t II (1942), p. 678.
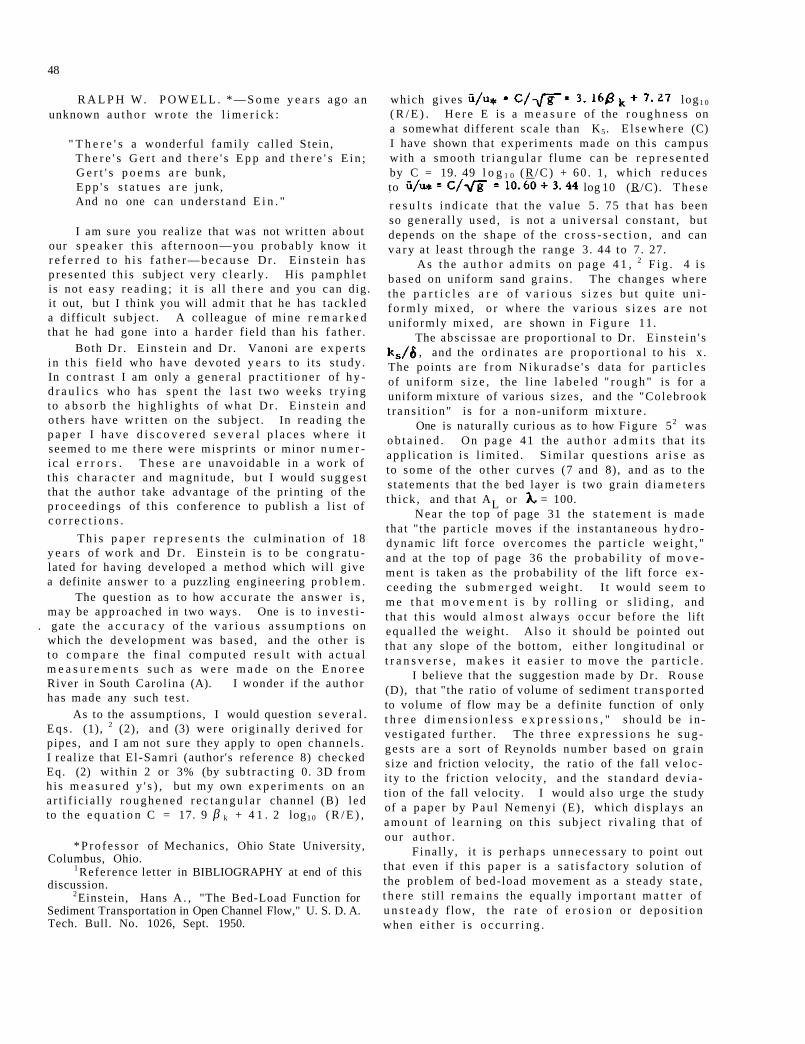
48
R A L P H W . P O W E L L . * — S o m e y e a r s ago a n unknown a u t h o r w r o t e the l i m e r i c k :
" T h e r e ' s a wonderful f ami ly ca l led Stein , T h e r e ' s G e r t and t h e r e ' s E p p and t h e r e ' s E i n ; G e r t ' s p o e m s a r e bunk, E p p ' s s t a t u e s a r e junk, And no one can u n d e r s t a n d E i n . "
I am sure you real ize that was not wri t ten about our s p e a k e r t h i s a f t e rnoon—you p robab ly know i t r e f e r r e d t o h i s f a t h e r — b e c a u s e Dr . E i n s t e i n h a s p r e sen t e d th i s subject ve ry c l e a r l y . His p a m p h l e t i s not e a s y r e a d i n g ; i t i s a l l t h e r e and you can dig. it out, but I think you will admi t that he has t a c k l e d a difficult subjec t . A colleague of mine r e m a r k e d that he had gone into a ha rde r f ield than his f a t h e r .
Both D r . E i n s t e i n and Dr. Vanoni a r e e x p e r t s in t h i s f ie ld who h a v e devo ted y e a r s to i t s s tudy . In c o n t r a s t I am only a gene ra l p r a c t i t i o n e r of h y d r a u l i c s who h a s s p e n t the l a s t two w e e k s t r y i n g to a b s o r b t h e h igh l igh t s of wha t D r . E i n s t e i n and o t h e r s have w r i t t e n on the subjec t . In r ead ing the p a p e r I h a v e d i s c o v e r e d s e v e r a l p l a c e s w h e r e i t seemed to me the re were mispr in ts o r minor n u m e r i ca l e r r o r s . T h e s e a r e unavoidab le in a work of t h i s c h a r a c t e r and magni tude , bu t I would s u g g e s t that the au thor take advantage of the pr int ing of the p r o c e e d i n g s of t h i s conference to publ ish a l i s t of c o r r e c t i o n s .
T h i s p a p e r r e p r e s e n t s the cu lmina t i on of 18 y e a r s of work and Dr . E ins t e in i s to be c o n g r a t u lated for having developed a method which wil l give a definite answer to a puzzling engineer ing p r o b l e m .
The quest ion as to how a c c u r a t e the a n s w e r i s , may be approached in two ways. One is to i n v e s t i -
. ga te the a c c u r a c y of the v a r i o u s a s s u m p t i o n s on which the deve lopment was based , and the o ther is t o c o m p a r e the f ina l computed r e s u l t wi th a c t u a l m e a s u r e m e n t s s u c h a s w e r e m a d e o n the E n o r e e River in South Carolina (A). I wonder if the au tho r has made any such tes t .
As to the assumptions , I would question s e v e r a l . E q s . (1), 2 (2), and (3) were o r ig ina l ly d e r i v e d for pipes, and I am not sure they apply to open channe l s . I real ize that El -Samri (author's reference 8) checked Eq. (2) wi th in 2 or 3% (by s u b t r a c t i n g 0. 3D f r o m h is m e a s u r e d y ' s ) , but my own e x p e r i m e n t s on an a r t i f i c i a l l y r o u g h e n e d r e c t a n g u l a r channel (B) l ed to the e q u a t i o n C = 17. 9 k + 4 1 . 2 log10 ( R / E ) ,
* P r o f e s s o r of Mechanics, Ohio State University, Columbus, Ohio.
1 Reference letter in BIBLIOGRAPHY at end of this discussion.
2Einstein, Hans A . , "The Bed-Load Function for Sediment Transportation in Open Channel Flow," U. S. D. A. Tech. Bull. No. 1026, Sept. 1950.
which gives log 1 0 ( R / E ) . H e r e E is a m e a s u r e of the r o u g h n e s s on a somewhat different sca le than K5 . E l s e w h e r e (C) I have shown that exper iments made on th i s c ampus with a smooth t r i a n g u l a r f lume can be r e p r e s e n t e d by C = 19. 49 l o g 1 0 ( R / C ) + 60 . 1, which r e d u c e s to log 10 (R/C). T h e s e r e s u l t s i n d i c a t e tha t the va lue 5 . 75 t h a t h a s been so genera l ly u s e d , is not a u n i v e r s a l cons tan t , but depends on the shape of the c r o s s - s e c t i o n , and can v a r y at leas t th rough the range 3. 44 to 7. 27.
As the a u t h o r a d m i t s on p a g e 4 1 , 2 F i g . 4 i s based on uniform sand g r a i n s . The changes w h e r e the p a r t i c l e s a r e o f v a r i o u s s i z e s bu t qu i t e un i f o r m l y mixed , o r where the v a r i o u s s i z e s a r e not un i formly m i x e d , a r e shown in F i g u r e 11.
The absc i ssae a r e proport ional to Dr. E i n s t e i n ' s , and the o r d i n a t e s a r e p r o p o r t i o n a l to h i s x .
The points a r e f r o m N i k u r a d s e ' s data for p a r t i c l e s of un i fo rm s i z e , the l ine l a b e l e d " r o u g h " is for a uniform mixture of various s izes , and the "Colebrook t r ans i t i on" is for a non-uni form m i x t u r e .
One is natural ly curious as to how F igu re 52 was o b t a i n e d . On p a g e 41 the a u t h o r a d m i t s tha t i t s app l ica t ion i s l im i t ed . S i m i l a r ques t i ons a r i s e a s to some of the o the r cu rves (7 and 8), and as to the s ta tements that the bed layer is two grain d i a m e t e r s th ick , and that AL or = 100.
Nea r the top of page 31 the s t a t e m e n t is m a d e that "the par t ic le moves if the ins tan taneous h y d r o -dynamic lift force ove rcomes the p a r t i c l e w e i g h t , " and at the top of page 36 the p r o b a b i l i t y of m o v e men t is taken as the probabi l i ty of the lift force e x ceed ing the s u b m e r g e d weight . I t would s e e m to m e t h a t m o v e m e n t i s b y r o l l i n g o r s l i d i n g , and tha t th is would a l m o s t a lways o c c u r be fo re the lift equa l l ed the weight . A l so i t should be poin ted out tha t any slope of the bot tom, e i t h e r longi tudinal or t r a n s v e r s e , m a k e s i t e a s i e r t o m o v e the p a r t i c l e .
I believe that the suggestion made by Dr . Rouse (D), that "the ra t io of volume of sediment t r a n s p o r t e d to volume of flow m a y be a definite function of only t h r e e d i m e n s i o n l e s s e x p r e s s i o n s , " shou ld b e in ves t iga ted fu r ther . The t h r e e e x p r e s s i o n s he s u g ges t s a r e a sor t of Reynolds number based on g r a i n s ize and friction velocity, the ra t io of the fall v e l o c i ty to the frict ion veloci ty , and the s t a n d a r d dev i a tion of the fall velocity. I would a l s o urge the s tudy of a paper by P a u l Nemenyi (E) , which d i sp l ays an a m o u n t of l e a r n i n g on th i s sub jec t r i va l ing tha t of our a u t h o r .
F ina l ly , i t i s p e r h a p s u n n e c e s s a r y to point out tha t even if th is p a p e r is a s a t i s f a c t o r y so lu t ion of the problem of bed- load movement as a s teady s t a t e , t h e r e s t i l l r e m a i n s the equal ly impor t an t m a t t e r of u n s t e a d y flow, t h e r a t e o f e r o s i o n o r d e p o s i t i o n when e i t h e r i s o c c u r r i n g .
β
49
FIG. 11.
BIBLIOGRAPHY
Ref.
(A) Dobson, Gilbert C., and Johnson, Joe W., "Studying Sediment Loads in Natural S t r e a m s , " Civil Engineering, Vol. 10 (1940), pp. 93-96.
(B) Powell, Ralph W., "Resistance to Flow in Rough Channels," Trans . Am. Geophysical Union, Vol. 31 (1950), pp. 575-582.
(C) , Discussion of (B), ibid, Vol. 32 (1951), p. 613.
Ref.
(D) Rouse, Hunter, "Engineering Hydrau l i cs , " John Wiley & Sons, 1950, p. 804.
(E) Nemenyi , Pau l , "The Different Approaches to The Study of Propuls ion of Granular Mater ia ls and the Value of Their Coord ina t ion , " T rans . A m e r . Geophys ica l Union, 1940, P a r t II, pp. 633-647.
S E D I M E N T A T I O N P R O B L E M S
INTRODUCTION
BY L. C. GOTTSCHALK*
Sedimenta t ion is one of the c r i t i c a l f a c t o r s in the d e v e l o p m e n t , u s e , a n d m a n a g e m e n t of w a t e r r e s o u r c e s . This has long been recognized in I l l inois . No state agency has ca r r ied out a more cons t ruc t ive p r o g r a m of s ed imen ta t ion inves t iga t ions nor over a l onge r p e r i o d of t i m e t h a n has the I l l ino i s S ta te Water Survey Division. Al l of us who have worked in th is field have come to recogn ize the p ionee r ing and v a l u a b l e c o n t r i b u t i o n s m a d e b y t h i s agency . T h e i r in i t ia l su rvey on Lake Decatur in S e p t e m b e r 1 9 3 1 — m o r e t han 2 0 y e a r s a g o — i s the f i r s t such s u r v e y e v e r m a d e by a s t a t e agency . T h e i r c o n t i nu ing i n t e r e s t in s e d i m e n t a t i o n i s qu i t e ev ident f r o m the n u m b e r o f p a p e r s on s e d i m e n t a t i o n i n c luded on the p r o g r a m of the Conference on W a t e r R e s o u r c e s in connect ion with the ded ica t ion of the W a t e r R e s o u r c e s Bui lding.
D u r i n g the p a s t 5 y e a r s I have w o r k e d v e r y c lose ly with the staff of the State Water Survey D i v i s ion in connec t ion with a s e d i m e n t a t i o n p r o g r a m the Water Survey Division is ca r ry ing on in I l l inois in c o o p e r a t i o n with the Soi l C o n s e r v a t i o n S e r v i c e and the I l l i no i s A g r i c u l t u r a l E x p e r i m e n t S ta t ion . Under th is p r o g r a m deta i led sedimenta t ion s u r v e y s have been made on 17 r e s e r v o i r s . Four r e s e r v o i r s s u r v e y e d i n the 1930's h a v e been r e s u r v e y e d a n d seve ra l additional reconnaissance- type surveys have been m a d e . These su rveys cover r e s e r v o i r s f r o m f a r m p o n d s i z e t o the l a r g e s t r e s e r v o i r s i n the S t a t e . The w a t e r s h e d a r e a s range f r o m 55 a c r e s to 906 square m i l e s . Ra t e s of sediment p roduc t ion v a r y f rom l e s s than 250 tons per a c r e to m o r e t han 5000 tons per ac re per year . Annual r a t e s of s t o r age l o s s range from 0. 3 per cent to 2. 3 per cent. M o r e than half of the r e s e r v o i r s su rveyed a r e los ing in e x c e s s of 1 per cent of their capacity annually. Only five have r a t e s of l e s s than 0. 5 per cent . Many of u s have c o n s i d e r e d that i n a r e a s w h e r e r e s e r v o i r s i t e s a r e de f in i t e ly l i m i t e d , such a s i n I l l i no i s , 0 . 25 p e r cen t annua l ly r e p r e s e n t s an i n t o l e r a b l e r a t e of depletion of e s sen t i a l , i r r ep l aceab le n a t u r a l r e s o u r c e s .
It is of in te res t to cons ider for a moment s o m e of the f ac to r s in Ill inois tha t a r e conducive to s u c h
* Head, Sedimentation Section, Office of Research, Soil Conservation Service, Washington, D. C.
a l a r m i n g r a t e s of s t o r a g e deple t ion in r e s e r v o i r s . T h r e e a r e o f ma jo r i m p o r t a n c e . They a r e :
1. C h a r a c t e r of s o i l s . 2. In tensi ty of land u s e . 3. O c c u r r e n c e of r a in fa l l .
More than 80 pe r cent of the State is b l anke ted with l o e s s of v a r i a b l e t h i c k n e s s . C o m p a r i s o n of s e d i m e n t p r o d u c t i o n r a t e s o v e r the Uni ted S t a t e s f rom a l l k inds o f s o i l s and so i l m a t e r i a l s shows that loess has the highest erodibility over wide a r e a s .
The intensity of land use for row crops in I l l inois is among the highest anywhere in the country. About one out of every t h r ee a c r e s in the State is annua l ly producing corn or soybeans. About two out of e v e r y t h r e e a c r e s a r e cu l t iva ted . C e n s u s f i gu re s show that for eve ry a c r e of hay in the State there a r e two a c r e s of s m a l l g ra ins and four a c r e s of row c r o p s . The land capability c lass i f ica t ion in the State shows t ha t a b o u t 60 p e r c e n t of the land i s s u i t a b l e for cult ivation. At the p r e s e n t t ime 68 pe r cent i s b e ing cult ivated.
Maximum rainfal l i n t ens i t i e s a r e concen t r a t ed in a per iod when the soi ls a r e m o s t exposed to e r o sion in the ea r ly pa r t of the cropping season. H e r e a t Urbana , for e x a m p l e , du r ing the 9 - y e a r p e r i o d 1941-1949, 77 per cent of the annua l soi l l o s s o c c u r r e d dur ing the mon ths of May and June .
Ex tens ion of the useful life of ex is t ing r e s e r v o i r s and p r e s e r v a t i o n of the r e m a i n i n g r e s e r v o i r s i tes will depend in l a rge m e a s u r e on the speed and s u c c e s s of c o n s e r v a t i o n w o r k on the land. Many r e s e r v o i r s a r e a l r eady so far deple ted and a r e l o s ing t h e i r capac i ty so r a p i d l y tha t t h e r e i s no hope of saving them. Exper imental s tudies and ev idences f rom r e p e a t e d w a t e r s h e d s u r v e y s i n v a r i o u s p a r t s of the country have c lear ly shown that r a t e s of s e d i men t p roduc t ion can be r e d u c e d 75 or 80 p e r cen t by a p p l i c a t i o n of m o d e r a t e c o n s e r v a t i o n f a r m i n g m e t h o d s b a s e d on u s e of the land wi thin i t s c a p a bi l i ty . Th i s will be a c c o m p l i s h e d , h o w e v e r , only when the local people , both those working the land and those in u rban a r e a s , b e c o m e fully c o n s c i o u s of what can be done and what m u s t be done to m a i n ta in the i r na tura l r e s o u r c e s .
51
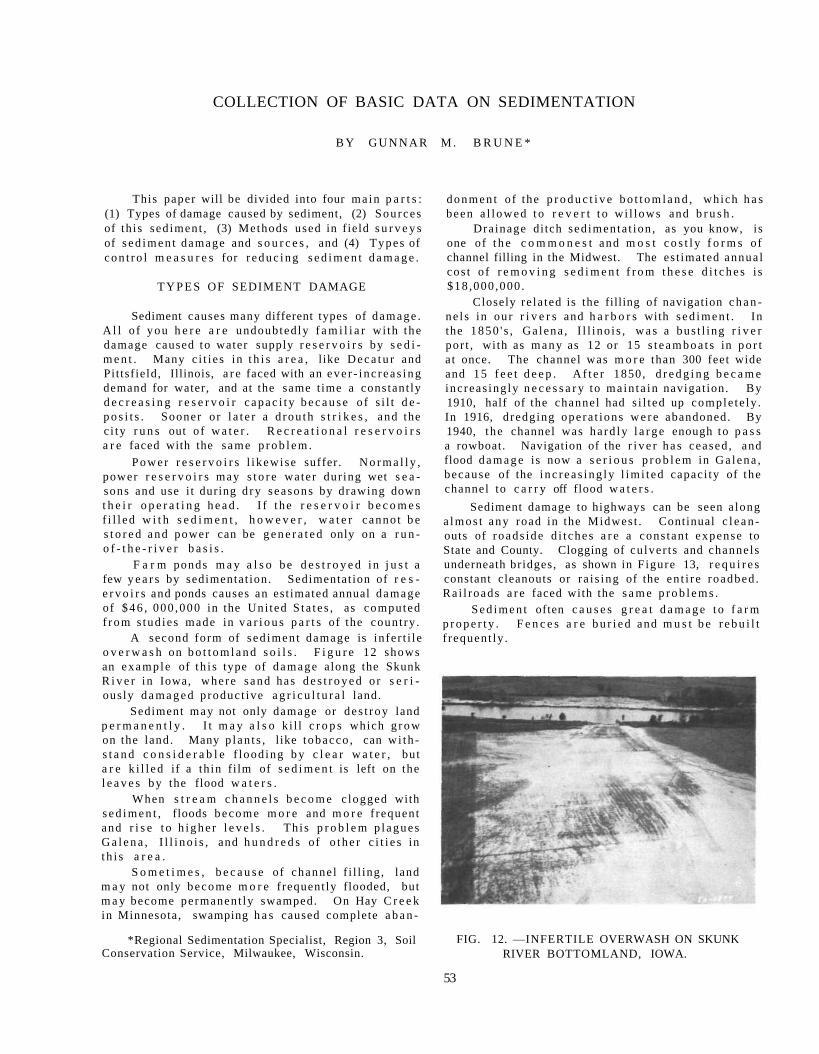
COLLECTION OF BASIC DATA ON SEDIMENTATION
B Y GUNNAR M . B R U N E *
This paper will be divided into four ma in p a r t s : (1) Types of damage caused by sediment, (2) Sources of th is sed iment , (3) Methods used in f ield s u r v e y s of s e d i m e n t damage and s o u r c e s , and (4) Types of c o n t r o l m e a s u r e s for r e d u c i n g s e d i m e n t d a m a g e .
T Y P E S OF SEDIMENT DAMAGE
Sediment causes many different types of damage . A l l o f you h e r e a r e undoubted ly f a m i l i a r wi th the damage caused to water supply r e s e r v o i r s by s e d i m e n t . Many c i t i e s in t h i s a r e a , l ike D e c a t u r and Pit tsf ield, Illinois, a r e faced with an e v e r - i n c r e a s i n g demand for water, and at the same t ime a constant ly d e c r e a s i n g r e s e r v o i r c a p a c i t y b e c a u s e o f s i l t d e p o s i t s . Sooner or l a t e r a d rou th s t r i k e s , and the c i ty r u n s out o f w a t e r . R e c r e a t i o n a l r e s e r v o i r s a r e faced with the same p r o b l e m .
P o w e r r e s e r v o i r s l ikewise suffer. N o r m a l l y , power r e s e r v o i r s may s t o r e water dur ing wet s e a sons and use i t during d r y seasons by drawing down t h e i r o p e r a t i n g h e a d . I f t he r e s e r v o i r b e c o m e s f i l l ed w i t h s e d i m e n t , h o w e v e r , w a t e r canno t b e s t o r e d and power can be g e n e r a t e d only on a r u n -o f - t h e - r i v e r b a s i s .
F a r m ponds m a y a l s o be d e s t r o y e d in j u s t a few y e a r s by sedimentat ion. Sedimentat ion of r e s e r v o i r s and ponds causes an est imated annual damage of $ 4 6 , 000 ,000 in the Uni ted S ta t e s , as computed f r o m s tud ies made in v a r i o u s p a r t s of the count ry .
A second form of sed imen t damage is in fer t i le o v e r w a s h on b o t t o m l a n d s o i l s . F i g u r e 12 shows an example of t h i s type of damage along the Skunk R i v e r in Iowa, where sand has d e s t r o y e d o r s e r i ous ly d a m a g e d produc t ive a g r i c u l t u r a l land.
Sediment may not only damage or d e s t ro y land p e r m a n e n t l y . I t m a y a l s o k i l l c r o p s which g r o w on the land. Many p l an t s , l ike tobacco , can wi th s t a n d c o n s i d e r a b l e f lood ing b y c l e a r w a t e r , but a r e k i l l e d if a th in f i lm of s e d i m e n t is left on the l e a v e s by the flood w a t e r s .
When s t r e a m c h a n n e l s b e c o m e c logged with s e d i m e n t , floods b e c o m e m o r e and m o r e f requent and r i s e t o h i g h e r l e v e l s . Th i s p r o b l e m p l agues G a l e n a , I l l i n o i s , and h u n d r e d s of o t h e r c i t i e s in t h i s a r e a .
S o m e t i m e s , b e c a u s e of channe l f i l l ing, land m a y not only become m o r e frequent ly flooded, but m a y become permanent ly swamped. On Hay C r e e k in Minnesota, swamping h a s caused complete a b a n -
*Regional Sedimentation Specialist, Region 3, Soil Conservation Service, Milwaukee, Wisconsin.
donmen t of the p r o d u c t i v e b o t t o m l a n d , which h a s been a l l owed t o r e v e r t t o wi l lows and b r u s h .
Dra inage di tch sed imenta t ion , as you know, is one of t h e c o m m o n e s t and m o s t c o s t l y f o r m s of channel filling in the Midwest. The es t imated annua l cos t o f r e m o v i n g s e d i m e n t f r o m t h e s e d i t c h e s i s $18 ,000 ,000 .
Closely re la ted is the filling of navigation c h a n ne l s in our r i v e r s and h a r b o r s with s e d i m e n t . In the 1850 ' s , Ga lena , I l l i no i s , w a s a bus t l ing r i v e r por t , with as m a n y as 12 or 15 s t e a m b o a t s in p o r t a t once. The channel was m o r e than 300 feet wide and 15 f e e t d e e p . A f t e r 1850, d r e d g i n g b e c a m e inc reas ing ly n e c e s s a r y to ma in ta in navigat ion. By 1910, half of the channel had s i l t ed up comple te ly . In 1916, d redging opera t ions w e r e abandoned. By 1940, the channel was ha rd ly l a r g e enough to p a s s a rowboat. Navigation of the r i v e r h a s ceased , and flood d a m a g e is now a s e r i o u s p r o b l e m in Ga lena , because of the i n c r e a s i n g l y l im i t ed capaci ty of the channel to c a r r y off flood w a t e r s .
Sediment damage to highways can be seen a long a lmos t any road in the Midwest . Continual c l e a n -outs of r oads ide d i t ches a r e a cons tan t expense to State and County. Clogging of cu lver t s and channels underneath bridges, as shown in Figure 13, r e q u i r e s constant cleanouts or r a i s ing of the en t i r e roadbed . Ra i l roads a r e faced with the s a m e p r o b l e m s .
S e d i m e n t often c a u s e s g r e a t d a m a g e t o f a r m p r o p e r t y . F e n c e s a r e b u r i e d and m u s t b e r e b u i l t f requent ly .
FIG. 12. —INFERTILE OVERWASH ON SKUNK RIVER BOTTOMLAND, IOWA.
53
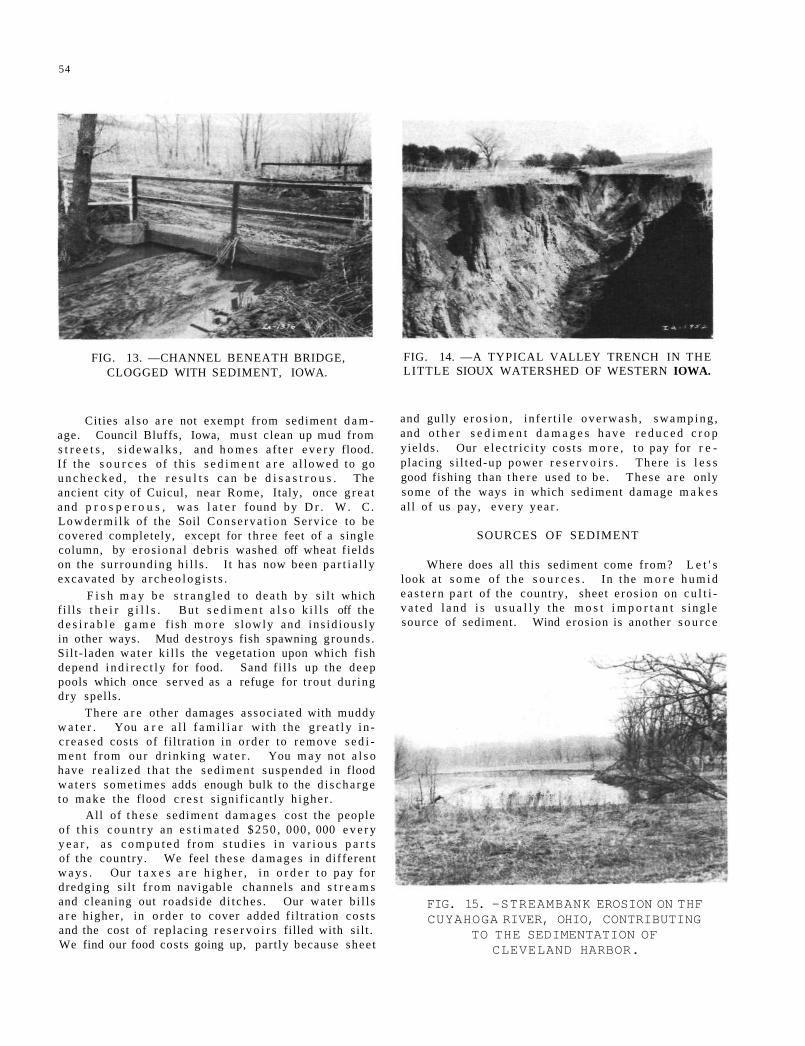
54
FIG. 13. —CHANNEL BENEATH BRIDGE, CLOGGED WITH SEDIMENT, IOWA.
Cities a l s o a r e not exempt from sediment d a m age. Council Bluffs, Iowa, mus t clean up mud from s t r e e t s , s i d e w a l k s , and h o m e s a f t e r e v e r y flood. If the s o u r c e s of t h i s s e d i m e n t a r e a l lowed to go u n c h e c k e d , t h e r e s u l t s c a n b e d i s a s t r o u s . The ancient city of Cuicul, near Rome, Italy, once g r e a t and p r o s p e r o u s , w a s l a t e r found by D r . W. C . Lowdermi lk of the Soil Conse rva t i on Serv ice to be covered completely, except for th ree feet of a single column, by e ros iona l debr i s washed off wheat f ie lds on the su r rounding h i l l s . I t has now been p a r t i a l l y excavated by a r c h e o l o g i s t s .
F i s h m a y be s t r a n g l e d t o dea th by s i l t which f i l l s t h e i r g i l l s . But s e d i m e n t a l s o k i l l s off the d e s i r a b l e g a m e f ish m o r e s lowly and in s id ious ly in other ways. Mud des t roys fish spawning grounds . Si l t - laden wate r k i l l s the vegetat ion upon which fish depend i n d i r e c t l y for food. Sand f i l l s up the deep pools which once served as a refuge for t rou t dur ing dry spells .
There a r e other damages assoc ia ted with muddy w a t e r . You a r e a l l f a m i l i a r with the g r e a t l y i n c r ea sed costs of fi l tration in o rder to remove s e d i m e n t f rom our d r ink ing w a t e r . You m a y not a l s o have r e a l i z e d t ha t the s ed imen t suspended in flood wa te r s somet imes adds enough bulk to the d i s c h a r g e to make the flood c r e s t s ignif icant ly h igher .
All of t h e s e sediment d a m a g e s cost the people of t h i s c o u n t r y an e s t i m a t e d $250 , 000, 000 e v e r y y e a r , a s c o m p u t e d f rom s t u d i e s i n v a r i o u s p a r t s of the country. We feel these d a m a g e s in different w a y s . Our t a x e s a r e h i g h e r , i n o r d e r t o pay for dredging si l t f r o m navigable channels and s t r e a m s and cleaning out roadside d i t ches . Our wate r b i l l s a r e h igher , in o rde r to cover added f i l t ra t ion cos t s and the cost of replacing r e s e r v o i r s filled with s i l t . We find our food costs going up, part ly because shee t
FIG. 14. —A TYPICAL VALLEY TRENCH IN THE LITTLE SIOUX WATERSHED OF WESTERN IOWA.
and gully e r o s i o n , in fe r t i l e o v e r w a s h , s w a m p i n g , and o t h e r s e d i m e n t d a m a g e s h a v e r e d u c e d c r o p yields . Our e l ec t r i c i t y cos t s m o r e , to pay for r e placing s i l t ed-up power r e s e r v o i r s . There i s l e s s good fishing than t h e r e used to be . These a r e only some of the ways in which sediment damage m a k e s al l of us pay, eve ry yea r .
SOURCES OF SEDIMENT
Where does all this sediment come from? L e t ' s look a t s o m e of t h e s o u r c e s . In the m o r e h u m i d e a s t e r n p a r t of the country, sheet e ros ion on c u l t i v a t e d l a n d i s u s u a l l y the m o s t i m p o r t a n t s ing le source of sediment. Wind erosion is another s o u r c e
FIG. 15. —STREAMBANK EROSION ON THF CUYAHOGA RIVER, OHIO, CONTRIBUTING
TO THE SEDIMENTATION OF CLEVELAND HARBOR.
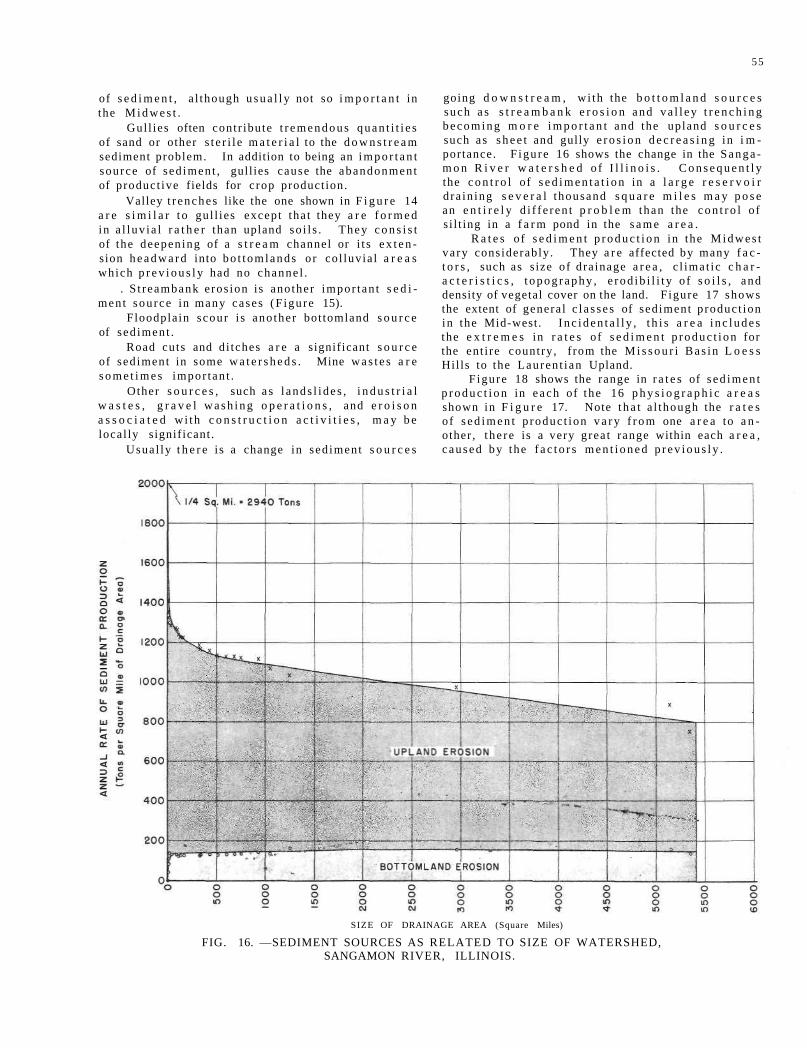
55
of s e d i m e n t , a l though u s u a l l y not so i m p o r t a n t in the M i d w e s t .
Gul l ies often cont r ibute t r e m e n d o u s q u a n t i t i e s of sand or other s t e r i l e m a t e r i a l to the d o w n s t r e a m sediment problem. In addition to being an i m p o r t a n t source of sed iment , gull ies cause the abandonment of product ive fields for c rop product ion.
Valley t r enches like the one shown in F i g u r e 14 a r e s i m i l a r t o gul l ies except tha t they a r e f o r m e d in a l l uv ia l r a t h e r than upland so i l s . They c o n s i s t of the deepen ing of a s t r e a m channel or i t s e x t e n sion h e a d w a r d into bo t tomlands o r co l luvia l a r e a s which p r e v i o u s l y had no channe l .
. S t reambank e ros ion is another impor tan t s e d i men t sou rce in many cases (F igu re 15).
Floodplain scour i s ano ther bot tomland s o u r c e of sed iment .
Road cuts and d i tches a r e a significant s o u r c e of sed iment in some w a t e r s h e d s . Mine w a s t e s a r e s o m e t i m e s impor tan t .
Other s o u r c e s , such a s l ands l i de s , i n d u s t r i a l w a s t e s , g r a v e l w a s h i n g o p e r a t i o n s , and e r o i s o n a s s o c i a t e d w i th c o n s t r u c t i o n a c t i v i t i e s , m a y b e local ly significant .
Usua l ly t h e r e i s a change in sed iment s o u r c e s
going d o w n s t r e a m , wi th the b o t t o m l a n d s o u r c e s such a s s t r e a m b a n k e r o s i o n and v a l l e y t r e n c h i n g b e c o m i n g m o r e i m p o r t a n t and the upland s o u r c e s such a s s h e e t and gully e r o s i o n d e c r e a s i n g in i m portance. F igu re 16 shows the change in the S a n g a m o n R i v e r w a t e r s h e d o f I l l i n o i s . C o n s e q u e n t l y the c o n t r o l of s e d i m e n t a t i o n in a l a r g e r e s e r v o i r d ra in ing s e v e r a l thousand s q u a r e m i l e s m a y p o s e an e n t i r e l y d i f f e r en t p r o b l e m than the c o n t r o l o f s i l t ing in a f a r m pond in the s a m e a r e a .
R a t e s of s e d i m e n t p r o d u c t i o n in the M i d w e s t va ry considerably . They a r e affected by many f a c t o r s , such as s ize of dra inage a r e a , c l imat ic c h a r a c t e r i s t i c s , t o p o g r a p h y , e r o d i b i l i t y o f s o i l s , and density of vegetal cover on the land. F igure 17 shows the extent of genera l c l a s s e s of sediment p roduc t ion in the Mid-west. I n c i d e n t a l l y , t h i s a r e a i n c l u d e s the e x t r e m e s in r a t e s of s e d i m e n t p r o d u c t i o n for the ent i re country , f rom the M i s s o u r i B a s i n L o e s s Hil ls to the Lauren t i an Upland.
F igure 18 shows the range in r a t e s of s ed imen t p r o d u c t i o n in e a c h of the 16 p h y s i o g r a p h i c a r e a s shown in F i g u r e 17. Note t h a t a l though the r a t e s of s e d i m e n t p roduc t ion v a r y f r o m one a r e a to a n other , t he r e is a very grea t range within each a r e a , c aused by the f a c t o r s m e n t i o n e d p r e v i o u s l y .
SIZE OF DRAINAGE AREA (Square Miles)
FIG. 16. —SEDIMENT SOURCES AS RELATED TO SIZE OF WATERSHED, SANGAMON RIVER, ILLINOIS.
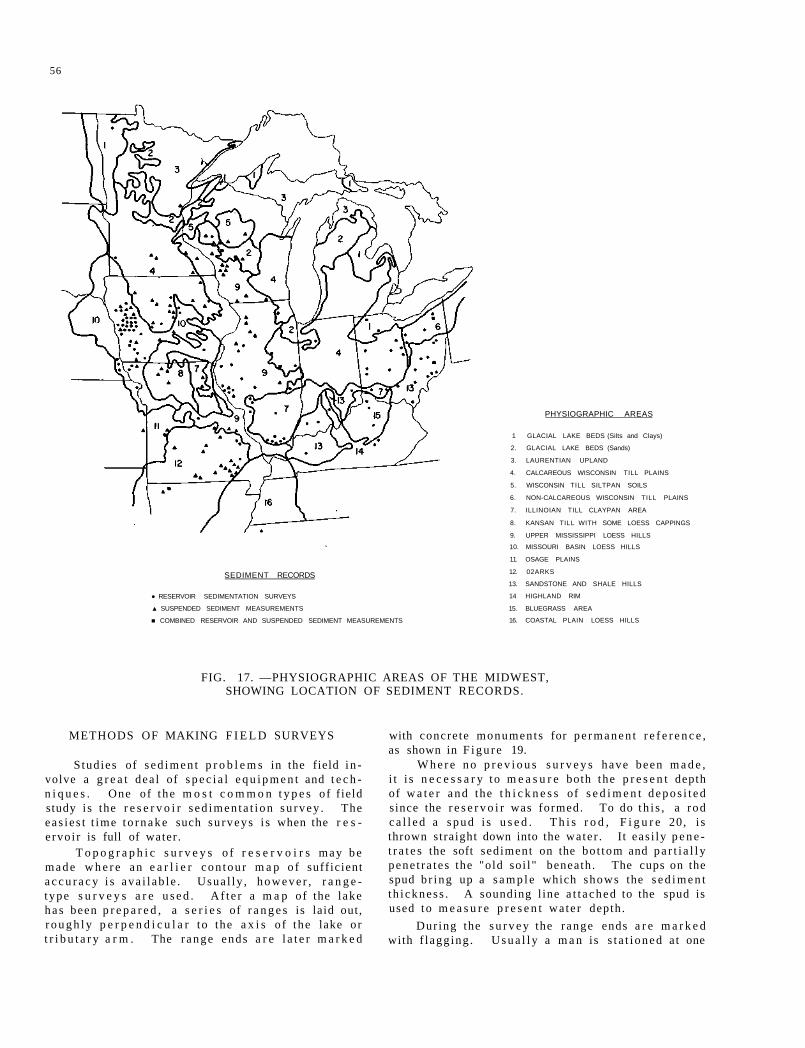
56
SEDIMENT RECORDS
● RESERVOIR SEDIMENTATION SURVEYS
▲ SUSPENDED SEDIMENT MEASUREMENTS
■ COMBINED RESERVOIR AND SUSPENDED SEDIMENT MEASUREMENTS
PHYSIOGRAPHIC AREAS
1 GLACIAL LAKE BEDS (Silts and Clays)
2. GLACIAL LAKE BEDS (Sands)
3. LAURENTIAN UPLAND
4. CALCAREOUS WISCONSIN TILL PLAINS
5. WISCONSIN TILL SILTPAN SOILS
6. NON-CALCAREOUS WISCONSIN TILL PLAINS
7. ILLINOIAN TILL CLAYPAN AREA
8. KANSAN TILL WITH SOME LOESS CAPPINGS
9. UPPER MISSISSIPPI LOESS HILLS
10. MISSOURI BASIN LOESS HILLS
11. OSAGE PLAINS
12. 02ARKS
13. SANDSTONE AND SHALE HILLS
14 HIGHLAND RIM
15. BLUEGRASS AREA
16. COASTAL PLAIN LOESS HILLS
FIG. 17. —PHYSIOGRAPHIC AREAS OF THE MIDWEST, SHOWING LOCATION OF SEDIMENT RECORDS.
METHODS OF MAKING F I E L D SURVEYS
Studies of s e d i m e n t p r o b l e m s in the field i n volve a g r e a t dea l of s p e c i a l e q u i p m e n t and t e c h n i q u e s . One of the m o s t c o m m o n t y p e s of f ield study i s the r e s e r v o i r s ed imen ta t i on su rvey . The ea s i e s t t ime t o r n a k e such su rveys i s when the r e s e rvo i r is full of water .
T o p o g r a p h i c s u r v e y s o f r e s e r v o i r s may b e m a d e w h e r e an e a r l i e r con tou r m a p o f suff icient a c c u r a c y i s ava i l ab l e . Usua l ly , h o w e v e r , r a n g e -type s u r v e y s a r e u s e d . Af t e r a m a p of the lake h a s been p r e p a r e d , a s e r i e s of r a n g e s is laid out, r o u g h l y p e r p e n d i c u l a r to the a x i s o f the lake or t r i b u t a r y a r m . The r ange ends a r e l a t e r m a r k e d
with concre te monuments for p e r m a n e n t r e f e r e n c e , as shown in F i g u r e 19.
W h e r e n o p r e v i o u s s u r v e y s have been m a d e , i t i s n e c e s s a r y to m e a s u r e both the p r e s e n t depth of w a t e r and the t h i c k n e s s of s e d i m e n t d e p o s i t e d since the r e s e r v o i r was formed. To do t h i s , a rod c a l l e d a s p u d i s u s e d . T h i s r o d , F i g u r e 20, i s thrown straight down into the water . It eas i ly p e n e t r a t e s the soft sediment on the bo t tom and p a r t i a l l y pene t ra t e s the "old soi l" beneath . The cups on the spud b r ing up a s a m p l e which shows the s e d i m e n t t h i ckness . A sounding l ine a t t a ched to the spud is used to m e a s u r e p r e s e n t wa te r depth .
Dur ing the s u r v e y the range ends a r e m a r k e d with f l agg ing . U s u a l l y a m a n is s t a t i oned a t one
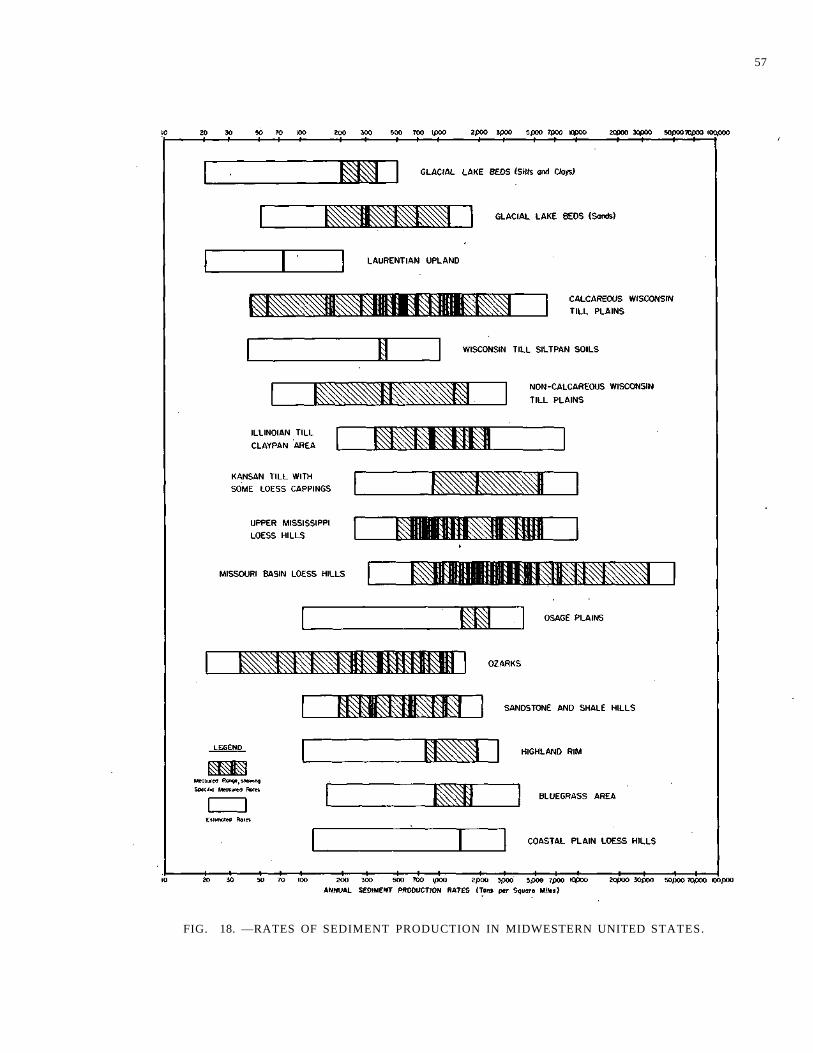
57
FIG. 18. —RATES OF SEDIMENT PRODUCTION IN MIDWESTERN UNITED STATES.
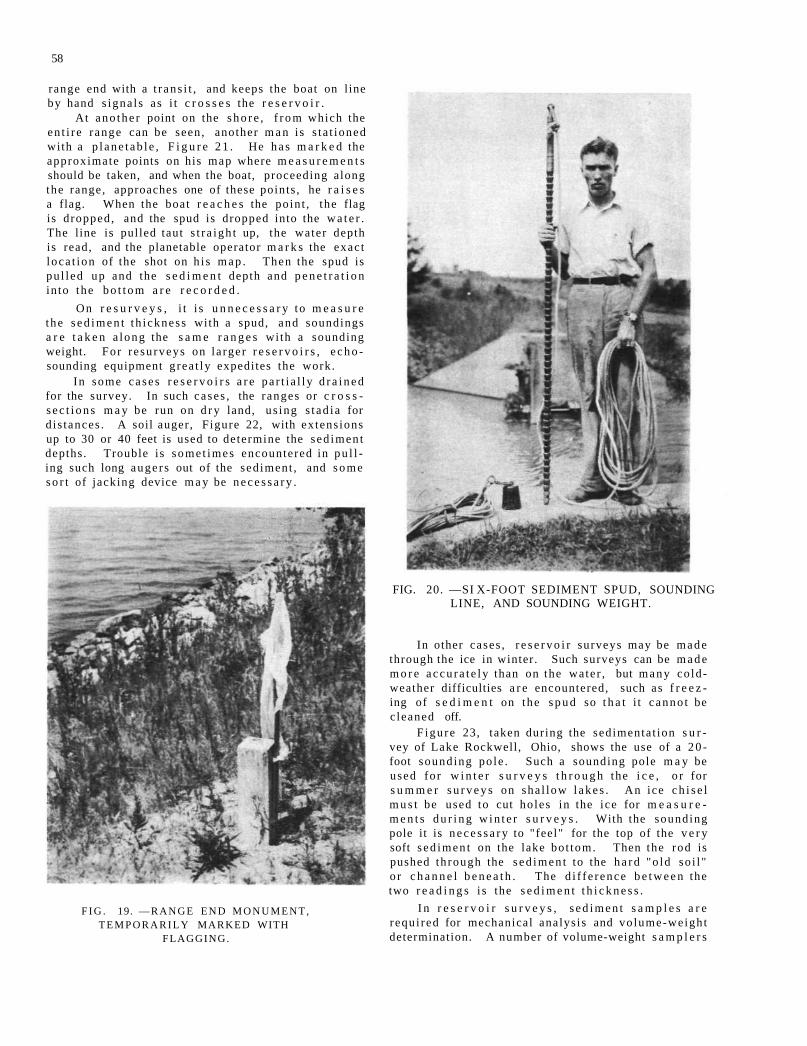
58
range end with a t r ans i t , and keeps the boat on l ine by hand s igna l s as i t c r o s s e s the r e s e r v o i r .
At ano the r point on the s h o r e , f r o m which the en t i r e r ange can be seen , another m a n is s t a t ioned with a p l a n e t a b l e , F i g u r e 2 1 . He h a s m a r k e d the approximate points on his map where m e a s u r e m e n t s should be taken, and when the boat, proceeding along the range, approaches one of these points , he r a i s e s a flag. When the boat r e a c h e s the poin t , the flag is dropped, and the spud is dropped into the w a t e r . The line is pulled taut s t r a igh t up, the water depth is read, and the planetable operator m a r k s the exac t loca t ion of the shot on h i s m a p . Then the spud is pu l l ed up and the s e d i m e n t depth and p e n e t r a t i o n in to the b o t t o m a r e r e c o r d e d .
On r e s u r v e y s , i t i s u n n e c e s s a r y to m e a s u r e the s e d i m e n t th i ckness with a spud, and soundings a r e t a k e n a long the s a m e r a n g e s wi th a sounding weight. For r e su rveys on la rger r e s e r v o i r s , e c h o -sounding equipment g rea t ly expedites the work.
In some ca se s r e s e r v o i r s a r e pa r t i a l ly d r a i n e d for the survey. In such cases , the ranges or c r o s s -s e c t i o n s m a y be run on d r y land, us ing s t ad ia for d i s tances . A soil auger , Figure 22, with ex tens ions up to 30 or 40 feet is used to determine the sed imen t depths . Trouble is some t imes encountered in p u l l ing such long auge r s out of the sed iment , and s o m e s o r t of jacking device m a y be n e c e s s a r y .
F I G . 19. — R A N G E E N D M O N U M E N T , T E M P O R A R I L Y MARKED WITH
FLAGGING.
FIG. 20. —SI X-FOOT SEDIMENT SPUD, SOUNDING LINE, AND SOUNDING WEIGHT.
In other cases , r e s e r v o i r surveys may be m a d e through the ice in winter. Such surveys can be m a d e m o r e a c c u r a t e l y than on the water , but m a n y co ld-weather difficulties a r e encountered, such as f r e e z ing of s e d i m e n t on the s p u d so t h a t i t c anno t be c leaned off.
F igu re 23, taken during the sedimenta t ion s u r vey of Lake Rockwell, Ohio, shows the use of a 2 0 -foot sounding po le . Such a sounding pole m a y be used for w i n t e r s u r v e y s t h r o u g h the i c e , o r for s u m m e r s u r v e y s on sha l low l ak es . An ice c h i s e l m u s t be used to cut ho les in the ice for m e a s u r e m e n t s d u r i n g w i n t e r s u r v e y s . With the sounding pole it is n e c e s s a r y to "feel" for the top of the v e r y soft s ed imen t on the lake bo t tom. Then the rod is pushed th rough the s ed imen t to the h a r d "o ld so i l " o r c h a n n e l b e n e a t h . The d i f f e rence b e t w e e n the two r e a d i n g s i s the s e d i m e n t t h i c k n e s s .
I n r e s e r v o i r s u r v e y s , s e d i m e n t s a m p l e s a r e requ i red for mechanical analys is and vo lume-weight determination. A number of volume-weight s a m p l e r s
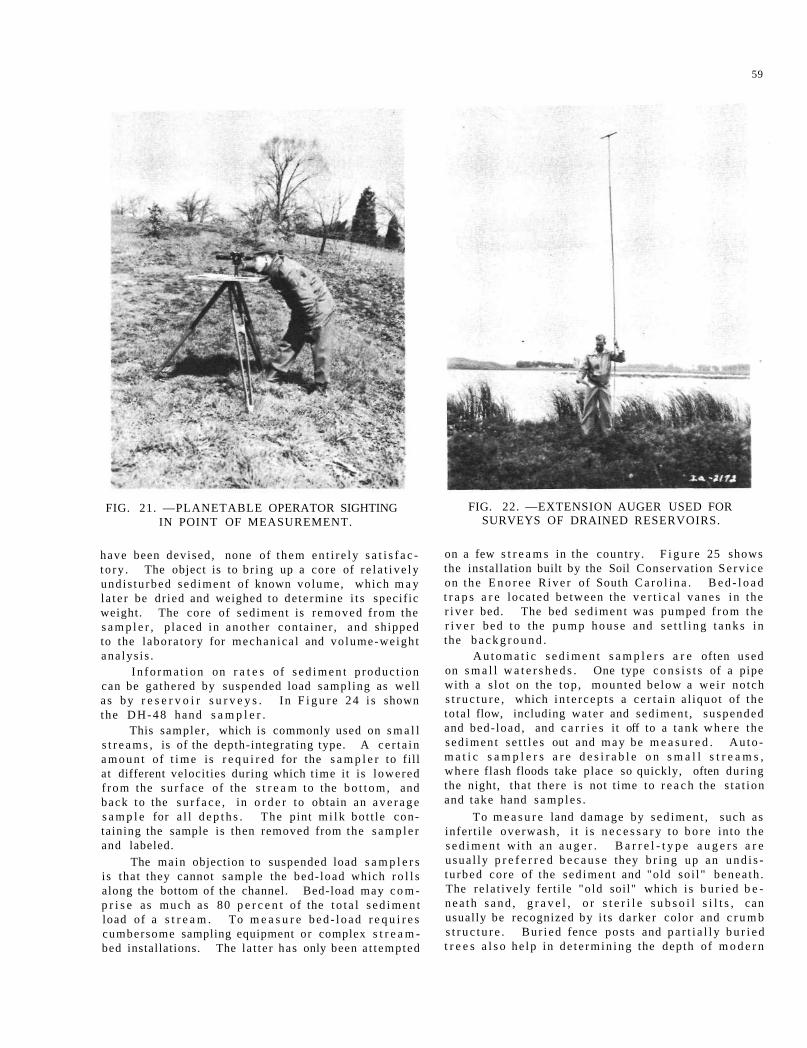
59
FIG. 21. —PLANETABLE OPERATOR SIGHTING IN POINT OF MEASUREMENT.
have been devised , none of t hem en t i r e ly s a t i s f a c to ry . The object is to br ing up a core of r e l a t i ve ly und i s tu rbed sed imen t of known volume, which m a y l a t e r be dr ied and weighed to de te rmine i t s specif ic weight. The core of sediment is r emoved f rom the s a m p l e r , p laced in another conta iner , and shipped to the labora tory for mechan ica l and vo lume-weigh t ana lys i s .
I n f o r m a t i o n on r a t e s of s e d i m e n t p roduc t ion can be gathered by suspended load sampl ing as wel l a s by r e s e r v o i r s u r v e y s . In F i g u r e 24 i s shown the D H - 4 8 hand s a m p l e r .
This sampler , which is commonly used on s m a l l s t r e a m s , is of the depth-integrating type. A ce r t a in a m o u n t of t i m e is r e q u i r e d for the s a m p l e r to fill at different velocities during which t ime it is lowered f rom the su r face of the s t r e a m to the b o t t o m , and back to the s u r f a c e , in o r d e r to obtain an a v e r a g e s a m p l e for a l l d e p t h s . The pint m i l k bot t le containing the sample is then removed from the s a m p l e r and labeled.
The main objection to suspended load s a m p l e r s is that they cannot sample the bed- load which r o l l s along the bottom of the channel. Bed-load may c o m p r i s e as m u c h as 80 p e r c e n t of the t o t a l s e d i m e n t load of a s t r e a m . To m e a s u r e b e d - l o a d r e q u i r e s cumbersome sampling equipment or complex s t r e a m -bed installations. The la t ter has only been a t tempted
FIG. 22. —EXTENSION AUGER USED FOR SURVEYS OF DRAINED RESERVOIRS.
on a few s t r e a m s in the country. F i g u r e 25 shows the installation built by the Soil Conservat ion Se rv i ce on the E n o r e e R i v e r of South C a r o l i n a . B e d - l o a d t r a p s a r e located be tween the v e r t i c a l vanes in the r i v e r bed. The bed sed iment was pumped f rom the r i v e r bed to the p u m p h o u s e and s e t t l i n g t a n k s in the b a c k g r o u n d .
A u t o m a t i c s e d i m e n t s a m p l e r s a r e often used on s m a l l w a t e r s h e d s . One type c o n s i s t s of a pipe with a s lo t on the top , mounted be low a we i r no tch s t r u c t u r e , which i n t e r cep t s a c e r t a i n a l iquot of the tota l flow, including water and sediment , suspended and bed- load, and c a r r i e s it off to a t ank w h e r e the sed imen t s e t t l e s out and may be m e a s u r e d . A u t o m a t i c s a m p l e r s a r e d e s i r a b l e o n s m a l l s t r e a m s , where flash floods take place so quickly, often dur ing the night, that there is not t ime to r e a c h the s t a t ion and take hand s amp le s .
To m e a s u r e land damage by sed imen t , such as infer t i le overwash , i t i s n e c e s s a r y to b o r e into the s e d i m e n t wi th a n a u g e r . B a r r e l - t y p e a u g e r s a r e usua l ly p r e f e r r e d b e c a u s e they b r i n g up an u n d i s tu rbed core of the sed imen t and "old so i l" benea th . The re la t ive ly fert i le "old soil" which is b u r i e d b e n e a t h s a n d , g r a v e l , o r s t e r i l e s u b s o i l s i l t s , can usually be recognized by i t s da rker color and c r u m b s t r u c t u r e . Bur i ed fence pos ts and p a r t i a l l y b u r i e d t r e e s a l s o he lp in de t e rmin ing the depth of m o d e r n
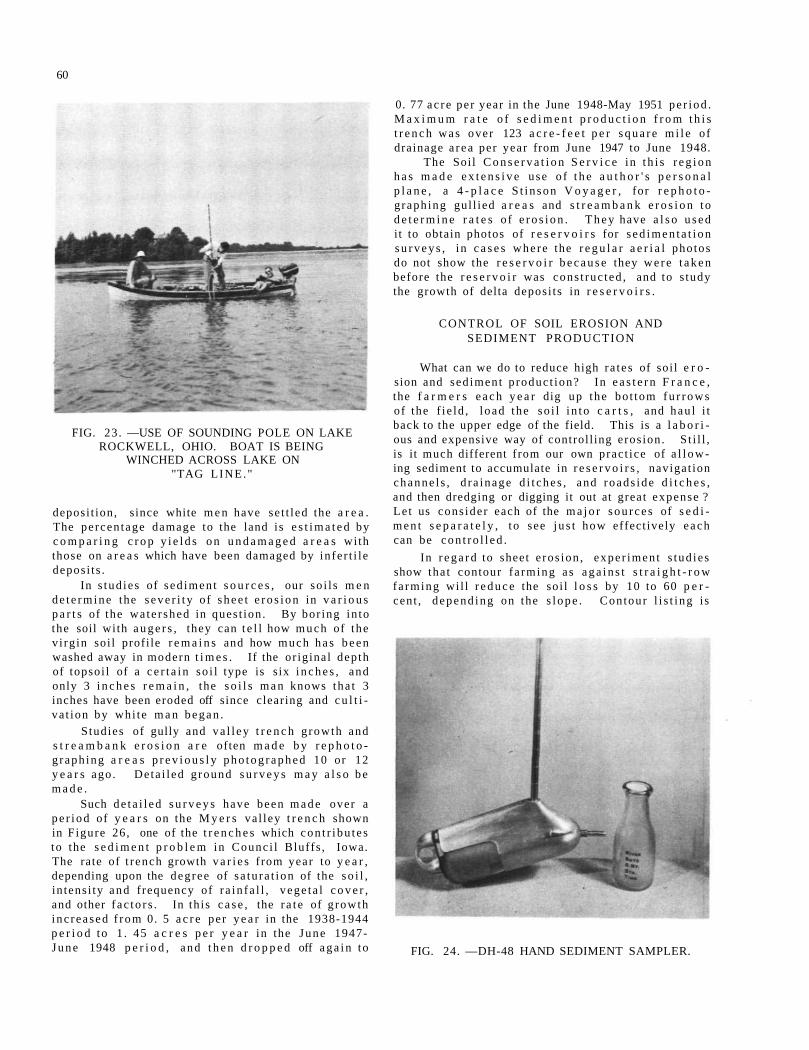
60
FIG. 23. —USE OF SOUNDING POLE ON LAKE ROCKWELL, OHIO. BOAT IS BEING
WINCHED ACROSS LAKE ON "TAG LINE."
deposi t ion, since white m e n have se t t led the a r e a . The percen tage damage to the land is e s t i m a t e d by c o m p a r i n g c r o p y i e l d s o n u n d a m a g e d a r e a s wi th those on a r e a s which have been damaged by in fe r t i l e depos i t s .
In s tud ies of sed imen t s o u r c e s , our so i l s m e n de t e rmine the s e ve r i t y of s h e e t e r o s i o n in v a r i o u s p a r t s of the wa te r shed in ques t ion . By bor ing in to the soil with a u g e r s , they can t e l l how m u c h of the v i rg in soi l profi le r e m a i n s and how much h a s b e e n washed away in modern t i m e s . If the or iginal dep th of topsoi l of a c e r t a i n so i l type is s ix i n c h e s , and only 3 i n c h e s r e m a i n , the s o i l s m a n knows tha t 3 inches have been eroded off since clearing and c u l t i va t ion by whi te m a n began .
Studies of gully and va l l ey t r e n c h g rowth and s t r e a m b a n k e r o s i o n a r e often m a d e b y r e p h o t o -g raph ing a r e a s p r e v i o u s l y p h o t o g r a p h e d 10 or 12 y e a r s ago . Deta i led g round s u r v e y s m a y a l s o b e m a d e .
Such de t a i l ed s u r v e y s have been m a d e over a pe r i od of y e a r s on the M y e r s va l ley t r e n c h shown in Figure 26, one of the t r e n c h e s which con t r i bu t e s to the s e d i m e n t p r o b l e m in Counc i l Bluffs , Iowa. The rate of t rench growth v a r i e s from year to y e a r , depending upon the degree of sa tu ra t ion of the s o i l , in tens i ty and frequency of r a in fa l l , vege ta l c o v e r , and other f ac to r s . In th is c a s e , the r a t e of g rowth inc reased f r o m 0. 5 a c r e pe r y e a r in the 1938-1944 p e r i o d to 1 . 45 a c r e s p e r y e a r in the June 1947-J u n e 1948 p e r i o d , and t h e n d r o p p e d off a g a i n to
0. 77 ac r e pe r year in the June 1948-May 1951 pe r iod . M a x i m u m r a t e o f s e d i m e n t p r o d u c t i o n f r o m t h i s t r e n c h was over 123 a c r e - f e e t p e r s q u a r e m i l e of drainage a r ea per year from June 1947 to June 1948.
The Soil C o n s e r v a t i o n S e r v i c e in t h i s r e g i o n h a s m a d e e x t e n s i v e use o f t h e a u t h o r ' s p e r s o n a l p l a n e , a 4 - p l a c e S t i n son V o y a g e r , for r e p h o t o -graph ing gul l ied a r e a s and s t r e a m b a n k e r o s i o n t o d e t e r m i n e r a t e s o f e r o s i o n . T h e y have a l s o u s e d it to obtain photos of r e s e r v o i r s for s e d i m e n t a t i o n s u r v e y s , i n c a s e s where the r e g u l a r a e r i a l photos do not show the r e s e r v o i r b e c a u s e they w e r e t a k e n before the r e s e r v o i r was cons t ruc ted , and to s tudy the growth of delta deposi ts in r e s e r v o i r s .
CONTROL OF SOIL EROSION AND SEDIMENT PRODUCTION
What can we do to reduce high ra tes of soi l e r o sion and sed iment p roduc t ion? In e a s t e r n F r a n c e , the f a r m e r s e a c h y e a r dig up the bo t tom f u r r o w s of the f i e ld , l oad the so i l i n t o c a r t s , and hau l i t back to the upper edge of the field. This is a l a b o r i ous and expensive way of control l ing eros ion . S t i l l , is it much different f rom our own prac t ice of a l l o w ing sediment to accumulate in r e s e r v o i r s , navigat ion channe l s , d ra inage d i t ches , and roads ide d i t c h e s , and then dredging or digging it out at great expense ? Le t us cons ider each of the m a j o r s o u r c e s of s e d i m e n t s e p a r a t e l y , t o see j u s t how effect ively each can be con t ro l l ed .
In r e g a r d to sheet e ros ion , exper imen t s tud ies show tha t contour f a rming as a g a i n s t s t r a i g h t - r o w fa rming wil l r e d u c e the soi l l o s s by 10 to 60 p e r cent , depend ing on the s l o p e . Contour l i s t i ng i s
FIG. 24. —DH-48 HAND SEDIMENT SAMPLER.
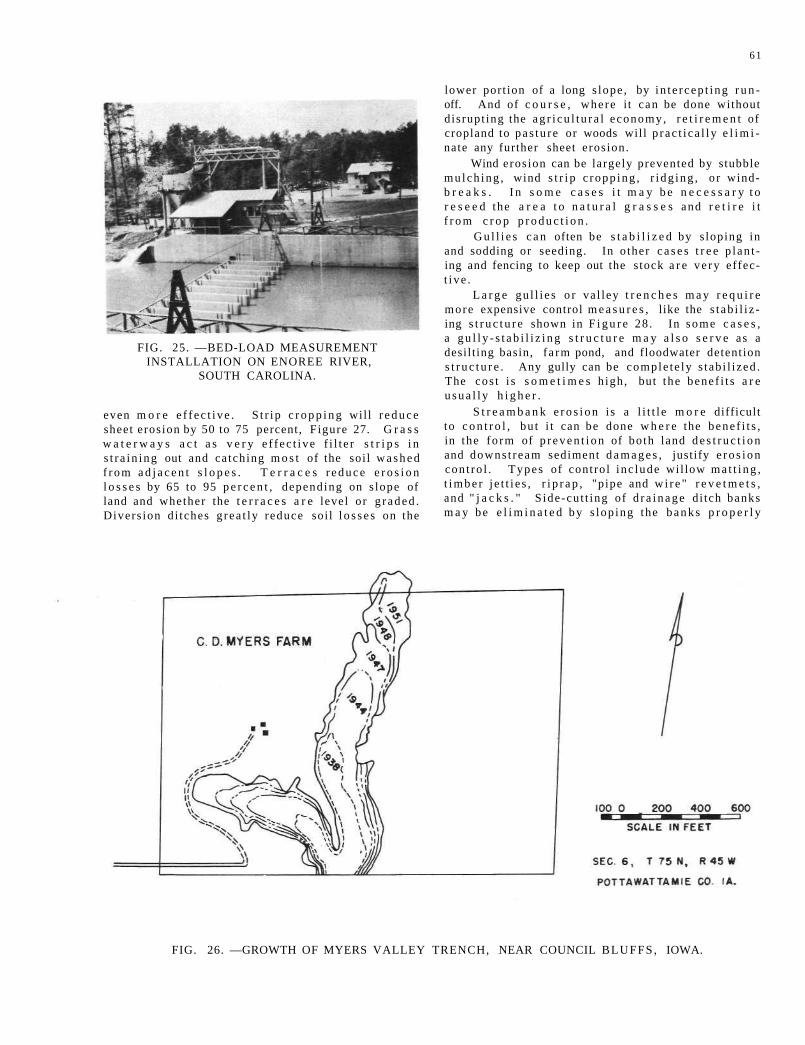
61
FIG. 25. —BED-LOAD MEASUREMENT INSTALLATION ON ENOREE RIVER,
SOUTH CAROLINA.
even m o r e e f f ec t i ve . S t r ip c r o p p i n g wil l r e d u c e sheet erosion by 50 to 75 percent, Figure 27. G r a s s w a t e r w a y s a c t a s v e r y e f f ec t ive f i l t e r s t r i p s i n s t r a in ing out and ca tching m o s t of the soi l w a s h e d f r o m a d j a c e n t s l o p e s . T e r r a c e s r e d u c e e r o s i o n l o s s e s by 65 to 95 p e r c e n t , depending on s lope of land and whether the t e r r a c e s a r e level o r g r a d e d . Divers ion d i tches g rea t ly reduce soi l l o s s e s on the
lower port ion of a long s lope , by in t e r cep t ing r u n off. And of c o u r s e , where i t can be done without d is rupt ing the a g r i c u l t u r a l economy, r e t i r e m e n t of cropland to pas tu re or woods will p r ac t i ca l ly e l i m i nate any further sheet eros ion.
Wind eros ion can be largely prevented by stubble mu lch ing , wind s t r i p c ropp ing , r i dg ing , o r windb r e a k s . I n s o m e c a s e s i t m a y b e n e c e s s a r y t o r e s e e d the a r e a t o n a t u r a l g r a s s e s and r e t i r e i t f r o m c r o p p r o d u c t i o n .
G u l l i e s c a n often be s t a b i l i z e d by s loping in and sodding or seeding. In o ther c a s e s t r e e p l an t ing and fencing to keep out the s tock a r e ve ry effect i ve .
L a r g e gu l l i e s o r va l ley t r e n c h e s m a y r e q u i r e more expensive control m e a s u r e s , like the s t ab i l i z ing s t r u c t u r e shown in F i g u r e 28 . In some c a s e s , a g u l l y - s t a b i l i z i n g s t r u c t u r e m a y a l s o s e r v e as a desil t ing basin, f a rm pond, and floodwater detent ion s t r u c t u r e . Any gully can be comple te ly s tab i l i zed . The cos t i s s o m e t i m e s h igh , but the benef i t s a r e u s u a l l y h i g h e r .
S t r e a m b a n k e r o s i o n i s a l i t t l e m o r e difficult to c o n t r o l , bu t i t can be done w h e r e the bene f i t s , in the fo rm of p r e v e n t i o n of bo th land d e s t r u c t i o n and downs t ream sediment d a m a g e s , justify e r o s i o n con t ro l . Types of control inc lude wil low m a t t i n g , t i m b e r j e t t i e s , r i p r a p , "pipe and w i r e " r e v e t m e t s , and " j a c k s . " S ide-cu t t ing of d r a i n a g e di tch banks m a y b e e l i m i n a t e d b y s lop ing the b a n k s p r o p e r l y
FIG. 26. —GROWTH OF MYERS VALLEY TRENCH, NEAR COUNCIL BLUFFS, IOWA.
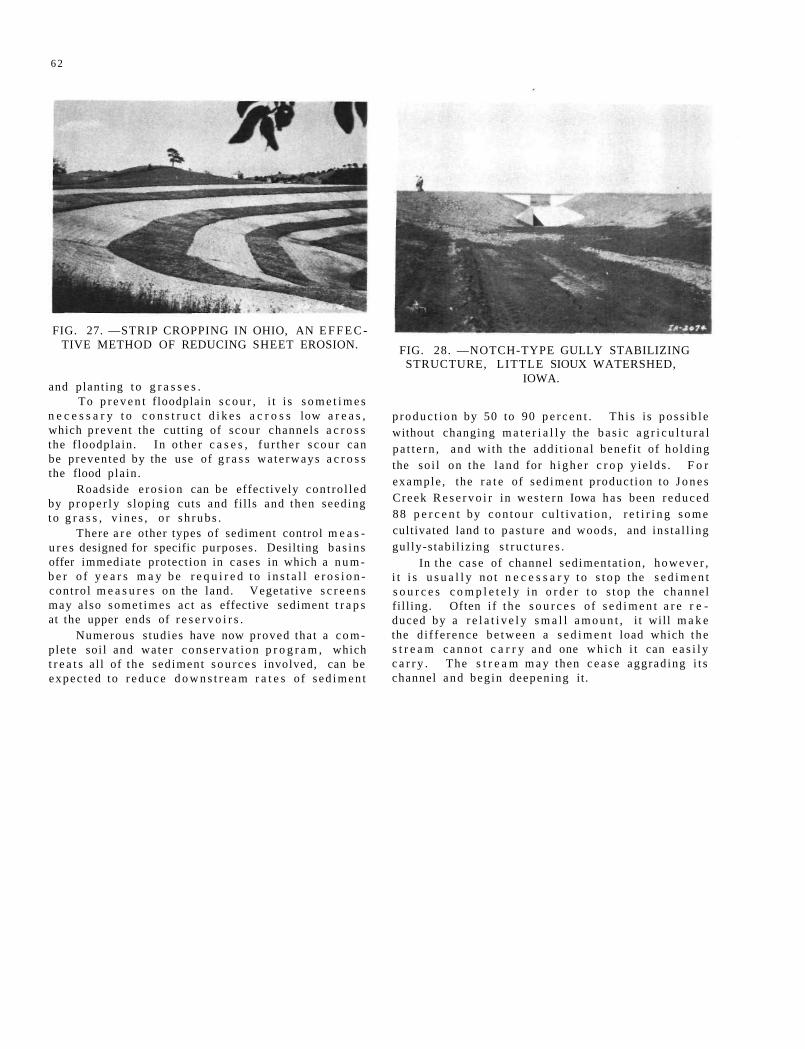
6 2
FIG. 27. —STRIP CROPPING IN OHIO, AN E F F E C TIVE METHOD OF REDUCING SHEET EROSION.
and plant ing t o g r a s s e s . To p r e v e n t f loodplain s c o u r , i t i s s o m e t i m e s
n e c e s s a r y t o c o n s t r u c t d i k e s a c r o s s low a r e a s , which p reven t the cutt ing of scour channels a c r o s s the f loodplain. In o the r c a s e s , f u r t h e r s c o u r can be prevented by the use of g r a s s wa te rways a c r o s s the flood pla in .
Roadside e ro s ion can be effect ively con t ro l l ed by p r o p e r l y s loping cuts and fi l ls and then seeding to g r a s s , v i n e s , o r s h r u b s .
There a r e other types of sediment control m e a s u r e s designed for specific purposes . Desilting b a s i n s offer immediate protection in cases in which a n u m b e r o f y e a r s m a y b e r e q u i r e d t o i n s t a l l e r o s i o n -cont ro l m e a s u r e s on the land. Vegeta t ive s c r e e n s may a lso some t imes act as effective sediment t r a p s at the upper ends of r e s e r v o i r s .
Numerous s tudies have now proved that a c o m plete soi l and water c o n s e r v a t i o n p r o g r a m , which t r e a t s a l l of the sediment s o u r c e s involved, can be expec ted to r e d u c e d o w n s t r e a m r a t e s of s ed imen t
FIG. 28. —NOTCH-TYPE GULLY STABILIZING STRUCTURE, LITTLE SIOUX WATERSHED,
IOWA.
p r o d u c t i o n by 50 to 90 p e r c e n t . Th i s is p o s s i b l e without changing m a t e r i a l l y the b a s i c a g r i c u l t u r a l p a t t e r n , and wi th the add i t iona l benef i t of ho ld ing the so i l on the l and for h i g h e r c r o p y i e ld s . F o r example , the r a t e of sed imen t product ion to J o n e s Creek R e s e r v o i r in wes t e rn Iowa h a s been r e d u c e d 88 p e r c e n t by con tou r c u l t i v a t i o n , r e t i r i n g s o m e cultivated land to pas tu re and woods, and ins ta l l ing gul ly-s tabi l iz ing s t r u c t u r e s .
In the case of channel sedimenta t ion, howeve r , i t i s u s u a l l y no t n e c e s s a r y t o s t o p the s e d i m e n t s o u r c e s c o m p l e t e l y i n o r d e r t o s top the channe l fi l l ing. Often i f t he s o u r c e s of s e d i m e n t a r e r e duced by a r e l a t i v e l y s m a l l a m o u n t , i t will m a k e the d i f f e rence b e t w e e n a s e d i m e n t load which t h e s t r e a m c a n n o t c a r r y and one w h i c h i t can e a s i l y c a r r y . The s t r e a m m a y then c e a s e aggrad ing i t s channel and beg in deepening it .
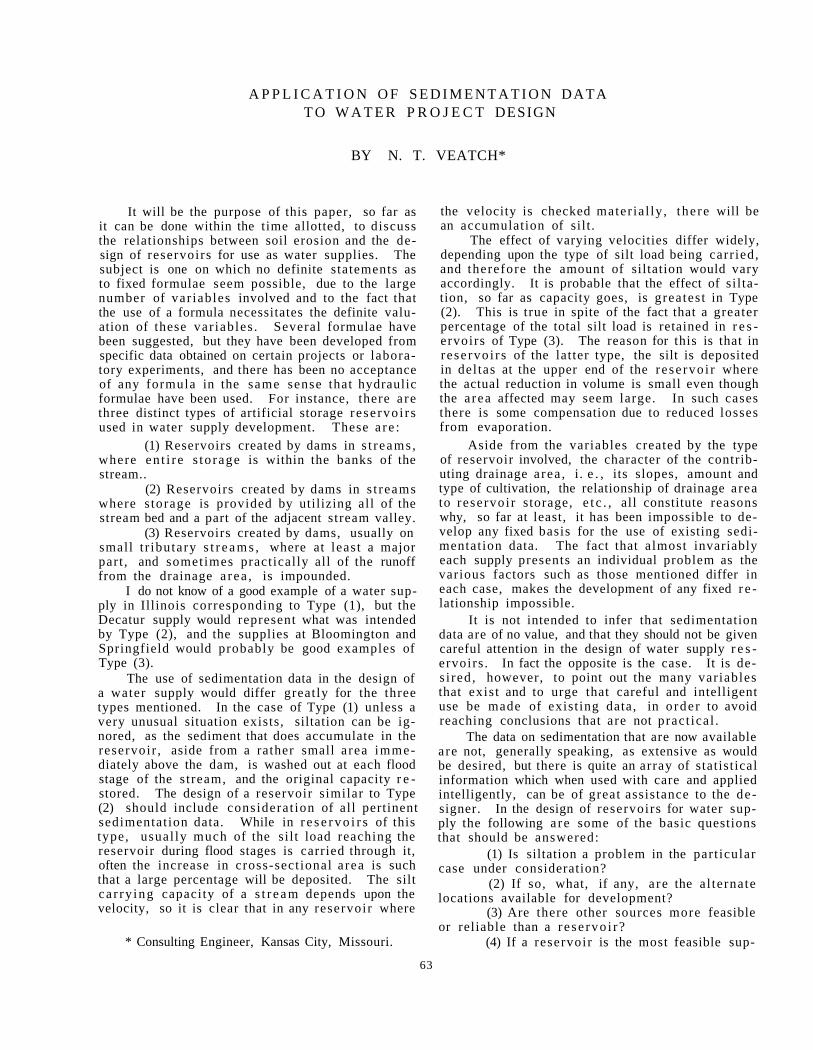
A P P L I C A T I O N O F S E D I M E N T A T I O N DATA T O W A T E R P R O J E C T DESIGN
BY N. T. VEATCH*
It will be the purpose of this paper, so far as it can be done within the time allotted, to discuss the relationships between soil erosion and the design of reservoirs for use as water supplies. The subject is one on which no definite statements as to fixed formulae seem possible, due to the large number of var iables involved and to the fact that the use of a formula necessitates the definite valuation of these var iables . Several formulae have been suggested, but they have been developed from specific data obtained on certain projects or laboratory experiments, and there has been no acceptance of any formula in the same sense that hydraulic formulae have been used. For instance, there a re three distinct types of artificial storage rese rvo i r s used in water supply development. These a re :
(1) Reservoirs created by dams in s t reams , where en t i r e s to rage is within the banks of the stream..
(2) Reservoirs created by dams in s t reams where s torage is provided by utilizing all of the stream bed and a part of the adjacent stream valley.
(3) Reservoirs created by dams, usually on small t r ibutary s t r e a m s , where at least a major part , and sometimes practically all of the runoff from the drainage a rea , is impounded.
I do not know of a good example of a water supply in Illinois corresponding to Type (1), but the Decatur supply would represent what was intended by Type (2), and the supplies at Bloomington and Springfield would probably be good examples of Type (3).
The use of sedimentation data in the design of a water supply would differ greatly for the three types mentioned. In the case of Type (1) unless a very unusual situation exists, siltation can be ignored, as the sediment that does accumulate in the reservoir , aside from a rather small a rea immediately above the dam, is washed out at each flood stage of the stream, and the original capacity r e stored. The design of a reservoir similar to Type (2) should include considerat ion of all pertinent sedimentat ion data. While in r e s e r v o i r s of this type, usual ly much of the si l t load reaching the reservoir during flood stages is carried through it, often the increase in cross-sect ional a rea is such that a large percentage will be deposited. The silt ca r ry ing capacity of a s t r e am depends upon the velocity, so it is clear that in any reservoir where
* Consulting Engineer, Kansas City, Missouri.
the velocity is checked mater ia l ly , the re will be an accumulation of silt .
The effect of varying velocities differ widely, depending upon the type of silt load being carr ied, and therefore the amount of siltation would vary accordingly. It is probable that the effect of si l tation, so far as capacity goes, is greates t in Type (2). This is true in spite of the fact that a greater percentage of the total silt load is retained in r e s ervoirs of Type (3). The reason for this is that in rese rvo i r s of the latter type, the silt is deposited in del tas at the upper end of the rese rvo i r where the actual reduction in volume is small even though the a rea affected may seem large. In such cases there is some compensation due to reduced losses from evaporation.
Aside from the variables created by the type of reservoir involved, the character of the contributing drainage a rea , i. e . , its slopes, amount and type of cultivation, the relationship of drainage area to reservoi r storage, e t c . , all constitute reasons why, so far at least, it has been impossible to develop any fixed basis for the use of existing sedimentation data. The fact that almost invariably each supply presents an individual problem as the various factors such as those mentioned differ in each case, makes the development of any fixed r e lationship impossible.
It is not intended to infer that sedimentation data are of no value, and that they should not be given careful attention in the design of water supply r e s ervoirs . In fact the opposite is the case. It is des i red , however, to point out the many variables that exist and to urge that careful and intelligent use be made of exist ing data, in o rder to avoid reaching conclusions that are not pract ical .
The data on sedimentation that are now available are not, generally speaking, as extensive as would be desired, but there is quite an array of statistical information which when used with care and applied intelligently, can be of great assistance to the de signer. In the design of reservoirs for water supply the following a re some of the basic questions that should be answered:
(1) Is siltation a problem in the part icular case under consideration?
(2) If so, what, if any, a re the a l ternate locations available for development?
(3) Are there other sources more feasible or reliable than a r e se rvo i r ?
(4) If a reservoir is the most feasible sup-
63
64
ply and siltation is a problem, what should be done about it, i. e., provide additional reservoir capacity, use preventive measures on the watershed, or both?
(5) What capacity to allow for siltation, and its probable cost.
(6) What would be the cost of acquiring the entire watershed, and the cost of construction and maintenance of proven soil erosion preventive m e a s ures on it?
(7) What are the best preventive measures to use?
(8) If other sources of supply are available, is the reservoir project economically sound?
Of the above ques t ions , those requiring the determination of whether or not siltation is to be a problem, the probable amount and what additional reservoir capacity should be provided to offset it, a re the ones where the use of all available sedimentation data is necessa'ry. The available data will all be from existing projects most of which have different physical cha rac te r i s t i c s . The data will have to be applied to the proposed project with care and discretion, and manifestly, the accuracy of the answers will be influenced by the experience and sound judgment of the designer .
In some instances there will be only one source of supply, and possibly only one feasible site for the r e se rvo i r . In such a case the question of the amount of siltation, and what to do about it, becomes an economic one in which the cost of providing p ro tection against the loss of reservoir capacity must be fully justified. If the contributing drainage area is l a rge , there is probably very little that can be done, but as in the major i ty of cases where the watersheds are comparatively small, much can be done.
Most of the sedimentation data now available has been collected by the Soil Conservation section of the D e p a r t m e n t of A g r i c u l t u r e , and by state agencies in te res ted in water r e sou rces and soil conse rva t ion . The I l l inois State Water Survey Division is an outstanding example of the lat ter . These data a r e to be found in publications of the American Waterworks Association, the American Society of Civil Engineers, certain Farm Journals, and in a large number of reports which may be obtained upon request, but which do not have general distribution. There is a list of references attached to this paper, which may be helpful to those desiring the information.
The only approach to mass data regarding si l tation in reservoirs is contained in an excellent art icle by C. B. Brown (Journal AWWA, Vol. 33, 1941, page 1026), in which annual losses in storage capacity a re given for 63 r e se rvo i r s . These r e s e r voi rs have widely divergent cha rac te r i s t i c s and nation-wide distribution. Unfortunately, detailed information regarding the r e s e r v o i r s and water sheds was not given, therefore the real significance
of the data is only apparent when considered along with such additional information. Knowledge of detailed data regarding severa l of the r e se rvo i r s listed on Figure 5 of the above mentioned ar t ic le , demonstrates that two major conclusions are jus t i fied, namely:
(a) Silt should be kept out of the s t r eams , as far as possible, by the control of erosion on the watershed.
(b) The capacity of a r e se rvo i r should be -as large as feasible in re la t ion to the a rea of its watershed.
The first conclusion is obvious, and the second borne out by practice in the waterworks industry. Numerically speaking, most of the impounding r e s ervoirs used for public water supplies, are located in the upper reaches of watersheds, and have storage capaci t ies ranging from 200 to 400 ac r e feet per square mile of watershed. As a comparison, the Decatur Lake (an example of Type (2) reservo i r ) has only 21 ac r e feet of s torage per square mile of drainage a r e a . There is some question as to whether or not this lake should be even considered as an impounding reservoir . Perhaps some t e r m such as "channel reservoirs" should be used where the storage is less than 100 acre feet per square mile of drainage a rea .
It has been realized for some time that the logical approach to some of the problems of impounded supplies is through the care of the watershed. One of these problems is pollution and another is s i l ta tion. Within certain l imits , pollution may be r e duced by treatment, but practically nothing feasible can be done about silt after it has been deposited on the reservoi r bottom. Pollution has been controlled by suitable regulations properly enforced, the water yield has been stabilized by suitable land use and, in some cases , works for the control of excessive soil erosion have been built. There a r e a number of outstanding examples of watershed maintenance, but these are limited to projects where all, or practically all, of the tributary watersheds are owned or controlled and therefore are not typical.
In the majority of instances where impounding r e s e r v o i r s a r e used for public water supply, the purchase of land has been limited to that which may be inundated and the watershed land has been left in pr ivate ownership. Many individual fa rms as well as many individual owners are commonly involved and, in the absence of cooperation among these land owners, proper care of the watershed, from the standpoint of water supply, is hardly to be expected. It seems probable that the program of soil conservation which is now being carr ied out by federal, state and local authorities may produce the answer to the problem of multiple land ownership through the organization of the owners of watershed land and convince them that the primary benefits of soil conservation accrue to the land itself.
65
The p r o g r e s s of a soi l conservat ion p r o g r a m is worthy of mention. All of the s t a t e s have l ega l i zed the f o r m a t i o n of so i l c o n s e r v a t i o n d i s t r i c t s and a ma jo r i ty of the f a rm land in the country is now i n -cluded in these d is t r ic ts . In view of such widespread p a r t i c i p a t i o n in th is p r o g r a m i t s e e m s r e a s o n a b l e to expect t ha t the land owne r s wil l be o rgan ized on an i nc r ea s ing ly l a rge n u m b e r of wa t e r sheds in the fu ture and t h a t the l and wi l l be i m p r o v e d and be made m o r e favorab le for r e s e r v o i r opera t ion , A p e r t i n e n t po in t is tha t the o r g a n i z a t i o n of the l and o w n e r s on a w a t e r s h e d m a y enable the r e s e r v o i r owner t o d e a l wi th one r a t h e r t han m a n y p a r t i e s when cons ide r ing needed con t ro l m e a s u r e s .
My personal contact with soil erosion is p e r h a p s r a t h e r t yp i ca l f rom the land o w n e r ' s viewpoint . I have a f a r m located near , and draining into a s m a l l recrea t ional r e se rvo i r in nor theas te rn Kansas. T h e f a r m cove r s about 10% of the wa t e r shed and, p r i o r to 1945, the g r e a t e r p a r t of i t had been under c o n t i nuous c u l t i v a t i o n for m a n y y e a r s without m u c h cons idera t ion of mode rn methods of farming. E v i dences of e r o s i o n were plentiful and I was advis.ed tha t the land was b e t t e r adap ted to p a s t u r e than to field c r o p s . A t what t o me was cons ide rab l e e x pense , the land was t e r r a c e d , p lanted to g r a s s and s teps were taken to control e ro s ion a t points w h e r e i t was m o s t no t i ceab le . I now feed ca t t l e , and am convinced t ha t my i n v e s t m e n t in so i l c o n s e r v a t i o n was sound. Since the e ros ion prevent ion i m p r o v e m e n t s w e r e m a d e , q u i t e a few n e i g h b o r i n g l and owners have ca r r i ed out s imi l a r improvements , and the benef i t s t o the r e s e r v o i r a r e qui te no t i ceab l e . I decided to improve my land ent i re ly from a se l f i sh standpoint I t is believed that many other r e s e r v o i r s can be benef i ted if the o w n e r s of f a r m land can be made to r e a l i z e the value of so i l conse rva t ion .
If I s e e m to be d i s c u s s i n g a g r i c u l t u r e r a t h e r t h a n e n g i n e e r i n g , my e x c u s e i s tha t we m u s t no t lose sight of the fact that the control of soi l e r o s i o n means m o r e to the land i tself than to anything e l s e . When a supp ly of w a t e r is involved i t m a y be e x p e c t e d t o r e c e i v e i n c i d e n t a l b e n e f i t s , but a t t h e p r e s e n t t i m e a t l e a s t , the a m o u n t o f land that i s , o r i s l ikely to be , t r i b u t a r y to an impounding r e s e r v o i r i s s m a l l a s c o m p a r e d t o the t o t a l i n a g r i cu l tu ra l u s e . We m u s t r e m e m b e r tha t , so far a s public w a t e r supply i s c o n c e r n e d we can , in m a n y c a s e s , build new r e s e r v o i r s when the old ones a r e full of s i l t s i nce only d o l l a r s a r e involved, but we cannot r e p l a c e topsoi l without going through a long and e x p e n s i v e p r o c e s s of r e b u i l d i n g fe r t i l i ty . A soi l conservat ion p r o g r a m is a "mus t " in this count r y as the v e r y exis tence of our r a c e depends upon i t .
C l a i m s have been m a d e t ha t e r o s i o n c o n t r o l will reduce the cost of water t r ea tmen t . It has b e e n s t a t ed , t ha t a saving of $ 7 . 00 p e r mi l l ion ga l lons
in the cos t of wa te r t r e a t m e n t " f o r a l l of the towns in the North Caro l ina P iedmont tha t have impounding r e s e r v o i r s " would follow a r educ t ion of t h i r t y p e r cent in " s u s p e n d e d load of the s t r e a m s . " The s ta tement is based on the reduct ion in the amount of a l u m needed and "on other s av ings r e s u l t i n g f r o m s m a l l e r capi ta l outlay for se t t l ing bas ins and f i l t e r p lan ts . "
We know tha t the need for coagulant is influenced by s u s p e n d e d m a t t e r and we can a g r e e tha t the control of e ros ion on the wa t e r shed could effect a reduct ion of t h i r t y pe r cent in the suspended load of the s t r e a m , but t h e r e is some quest ion w h e t h e r or not the su spended load of t h e effluent of an i m pounding r e s e r v o i r would be affected to tha t ex ten t by work on the w a t e r s h e d . S i m i l a r r e a s o n i n g a p p l i e s to the s i z e o f the b a s i n s a n d f i l t e r s n e e d e d s ince m o s t of the " s u s p e n d e d load" of the s t r e a m wil l be d e p o s i t e d as s i l t on the r e s e r v o i r bo t tom. It s e e m s probable tha t the usage of coagulant could be reduced during a p a r t of the t i m e , but the t r e a t m e n t p l a n t , w h i c h m u s t b e d e s i g n e d t o m e e t the wors t of conditions, could not be changed m a t e r i a l l y , par t icu lar ly when consideration is given to the added p r o b l e m s of t r e a t m e n t that m a y r e s u l t f r o m a lgae g r o w t h s , m i c r o - o r g a n i s m s , e t c .
In the a b s e n c e of cont ro l o v e r w a t e r s h e d land a n d in v i e w o f t h e f a c t t h a t f u n d s for u p s t r e a m e n g i n e e r i n g a r e l ike ly t o be e i t h e r l imi ted o r unava i l ab le , the eng inee r i s faced with the n e c e s s i t y of d e s i g n i n g an impounding r e s e r v o i r for as long a period of usefulness as is possible under the e x i s t ing conditions, which mus t include the abili ty of the owner to finance, as well as hydrologic f ac to r s . In spi te of a n u m b e r of ins tances of excess ive s i l t i ng , I believe it is poss ible to so des ign a r e s e r v o i r tha t i t s useful life will be long enough to justify i t s cons t r u c t i o n . The m o s t i m p o r t a n t f ea tu r e o f d e s i g n is to make the capaci ty of the r e s e r v o i r in r e l a t i o n t o i t s c a t c h m e n t a r e a a s l a rge a s poss ib le s o t ha t m o s t o f t h e s i l t i n g w i l l t ake p l a c e in t h e sha l low w a t e r s a t t h e u p p e r end.
M e n t i o n s h o u l d be m a d e of the fac t t ha t the work of the soi l conserva t ion o rgan iza t ions is e m phasizing the impor t ance of the " c a p a c i t y - t o - a r e a " r e l a t i on by furn ish ing conc re t e ev idence of a c t u a l s i l t ing r a t e s . We have not had s u c h de t a i l ed da ta in the pas t and the re fo re this is a dis t inct con t r i bu tion.
I t is ce r ta in that the soil conservat ion a g e n c i e s should be complimented on the fact that the i r p u b l i ci ty has been in readab le form, a s compared to the bulk of a r t i c l e s on sedimentation. A cer tain amoun t of p r e c i s e n o m e n c l a t u r e i s e s s e n t i a l but i t s e e m s as i f m a n y of the t e r m s used in a r t i c l e s on s e d i m e n t a t i o n cou ld be s t a t e d in p l a i n e r E n g l i s h and wi th r e s u l t i n g advantage to e v e r y o n e .
66
BIBLIOGRAPHY
1. Brown , C. B . , " E ros ion Cont ro l on Watershed L a n d s , " Jour . A. W. W. A. 38:1127(1946).
2. Garvin, A. N, and Fors te r , G. W., "Effect of Soil E ros ion on C o s t s of Public Water Supply in the North Carolina Piedmont," U. S. Soil Conservation Service S. C. S. -EC-1 (1940).
3. Brown, C. B . , " F a c t o r s in Control of Rese rvo i r Si l t ing," Jour . A. W. W. A. 33:1022 (1941).
4. Brown, C. B . , "Watershed Cont ro l , " Jour . A. W. W.A. 41:916 (1949).
5. Hudson, H. E . , J r . , "Problem of Reservoi r Si l ta-t ion," Jour. A. W. W. A. 41:913(1949).
6. Vogt , Wm., "The Road to Surv iva l , " Wm. Sloan Assoc ia tes , New York (1949).
7. Osborne, Fairf ie ld , "Our Plundered Planet ," Litt le Brown & Co . , Boston (1948).
8. Tubbs, J. N . , "Sanitary Protect ion of Roches te r , N. Y. Watershed, " Proc. A. W. W. A. 1888, p. 18.
9. Sherrerd , M. R . , "Protection of the Watershed of the Newark. N. J. Waterworks," Jour. A. W. W. A. 4:1, 30 (1917).
10. Coffin, T. D. L . , "Sanitation of the Croton Water shed (New York City)," Jour. A. W. W.A. 4:6. 30 (1917).
11. Ashe, W. W., "Protection of Public Water Supply by Forest Cover," Jour. A. W. W. A. 13:404(1925).
12. Kable, E. P . , "Reforestation of Watersheds, " Jour . A. W. W. A. 20:635(1928).
13. Darrow, W. E . , "Water Resources and Conservation of Fo re s t s , " Jour. A. W. W. A. 22:1351(1930).
14. G r e g o r y , A. F . , "P ro t ec t i on of Wate r shed for Syracuse Supply, " Jour. A. W. W. A. 32:555 (1940).
15. Lathrop, T. R., "Reforestation of Ohio Water Works P r o p e r t i e s , " Jour . A. W. W. A. 33:1175 (1941).
16. "Progress Report of Committee on Watershed P r o tection, " Jour . A. W. W. A. 10:453(1923).
17. Wohlman, A b e l , et a l , "Manual of Waterworks P rac t i ce , " A. W. W . A . , New York (1925).
18. C h a s e , E . S . , " W a t e r s h e d P r o t e c t i o n , " Jour . A. W. W.A. 20:90 (1928).
19. Rosenthal, H. , "The Protection of Impounded R e s e r v o i r s . " Jour . A. W. W.A. 21:1054 (1929).
20. Longwell, J. S . , "Developments in the Control of Eros ion." Jour . A. W. W. A. 38:1125 (1946).
21. Minor-, E. E . , "Prac t ica l F o r e s t r y , " Jour . A. W. W. A. 38:1103 (1946).
22. Hawley, R. C., "Evaluation of Returns from F o r e s t Lands . " Jour . A. W. W. A. 38:1105(1946).
23. Witzig, B . J . . "Sedimentat ion i n R e s e r v o i r s , " T r a n s . R. S. C. E. 109:1047(1944).
24. T r a s k , P . D . , e t a l . , Applied Sedimenta t ion, John Wiley & Sons , New York (1950).
25. Witzig, B. J . , "The Future of Reservoi r s , " T r a n s . A.S. C. E. 111:1300 (1946).
26. Grover, N. C. and Howard, C. S. , "The Pas sage of T u r b i d W a t e r t h rough Lake M e a d , " T r a n s . A. S. C. E. 103:720 (1938).
27. Lieberman, J . A . , "Water Resource and Water shed M a n a g e m e n t R e s e a r c h in the Southeas t , " Jour . A. W. W. A. 39:443(1947).
28. Glymph, L. M., and Jones , V. H . , "Sedimentation Survey of Lake Decatur ," U. S. Soil Conse r vation Service S. C. S. -S. S. -12 (1937).
29. Jones, V. H., "Sedimentation Survey of West F r a n k fort Reservoir , " U. S. Soil Conservation Service S. C. S. -S.S. -15 (1937).
30. Glymph, L. M . , and Jones, V. H., "Sedimentation Survey of Lake Calhoun, Galva, I l l inois , " U. S. Soil Conservation Service S. C. S. -S . S. -16 (1937).
31. Winter , Thomas Stanley Rex, M. I . C. E . , "The Silting of Impounding R e s e r v o i r s , " Institution of Civil Eng inee r s , London, England (1950).
WATERSHED APPROACH TO SEDIMENTATION PROBLEMS
BY ORVTLLE W. CHINN*
The recent devastating floods in the Mid-west with their accompanying soil erosion and sedimentation damages have again focused attention on the need for comple te wa te r shed and s t r eam basin protection program.
Starting with the watersheds in thei r present condition we can hardly expect to make a perfect job of flood control and sediment damage prevention. It is, however, within the realm of probability that we may be able to m a t e r i a l l y reduce these damage s.
We can at the presen t t ime , also by looking about us , profit by previous mis t akes and begin a program that will ultimately lead to a high degree of water and sediment control.
Our sediment problems s ta r t at the-point the rain drops f irs t strike the earth, blasting the soil pa r t i c l e s out of thei r posi t ions like smal l bomb explosions, and the problems stay with us all the way down the hillsides, through the tributaries and along the ma in s t ream channels until they reach the sea.
Contrary to a common belief, the result of the damage from these displaced particles is proportionally greater in the upper reaches of the watershed than in the lower. It is e s t ima ted that the topsoil off one 40-acre farm passes Vicksburg each minute, but there is no estimate of how much top-soil is moved about from i ts original location in our fields down the hillsides on to lower areas or to the small reservoirs and tributary stream channels in our headwater areas .
In our State in particular a considerable portion of flood damages could be charged directly to this sedimentation of our small s t r eam channels.
In approaching the solution to our watershed problems we should be as practical and as realist ic as we know how, and should s t a r t a coordinated attack at the source of the trouble and should p r o gress downstream as rapidly as possible.
On small watersheds, solutions are often s i m ple, but on the larger watersheds with a multitude of land owners , r a i l r oads , highways, State and Federal lands, the solution is much more difficult.
The Commit tees on The P r e s i d e n t ' s Water Resources Pol icy Commiss ion were pract ical ly
*Director of Flood Control and Water Usage, Kentucky Department of Conservation, Frankfort, Kentucky.
unanimous in their recommendation, that a comprehensive p rogram for the development of both water and land r e s o u r c e s should be ca r r i ed on. Just how such a p rogram should be initiated and carried out was never completely decided, as there appeared to be as many opinions as there were committees working on the commission.
It was generally agreed that the Federal government should accept the responsibility for safeguarding and developing our na tu ra l r e s o u r c e s . The commission's opinion also was that planning should be ca r r i ed on at a national level , ra ther than at a watershed, state or regional level.
What our approach on a watershed basis should be is quite a problem, and we have seen many par tial solutions during the past two decades.
Among those projects we have observed on a major wa te r shed bas is is the Tennessee Valley Authority which has done a wonderful job of developing the water r e sources of the major s t r eams in the Tennessee Valley pr imari ly for flood control, navigation, and power, and secondarily for r e c r e ation, water supply, and industrial use. Located in a region that is nearly half forested, sedimentation of the TVA reservoirs is not a major problem. The useful lives of these reservoi rs are estimated by TVA engineers to be from severa l hundred to several thousand years. Public forests in the Valley have good management including fire protection. On the privately owned forest lands, which comprise more than four-fifths of the total forest area , substantial progress has been made in watershed p ro tection since TVA was created in 1933 with consequent decreased erosion largely as a result of improved fire protection by state forestry and county organizations stimulated and encouraged by TVA. Improved forest management developed through TVA cooperation is also a factor . CCC camps working throughout the Tennessee Valley did effective work on hundreds of ac res of land in erosion control through t ree plants and gully control.
With respect to the open lands in the Tennessee Valley, the problem of erosion control, except for the CCC work, has been handled as a par t of the agricultural program administered by the agricultural colleges in the Valley s ta tes . The methods used have been educational and include test demonstration farms scat tered throughout the area . In 1949 there were 6, 000 of these test demonstration
67
68
farms in the Valley. Phosphate and other fertilizers have also been distributed widely over the area on a demonstrational basis . While this program has undoubtedly accomplished some resul ts , it has not proven to be the answer to the erosion control problems of the agricultural lands in the Valley, although it has been in operation since 1933. This would seem to indicate that educational and demonstration methods alone will not do the job even when concentrated in one basin.
Other than the TVA, the Federal agencies int e res t ed in Valley development a r e the Corps of E n g i n e e r s , the Bureau of Rec lamat ion and the Department of Agr icu l tu re . The f i rs t two mentioned agencies a re primari ly in teres ted in water development, and have not devoted much time to the p rob lems of sedimentat ion control except to study the effect of sediment on the reduction of reservoir capacities and maintenance of navigation channels.
In the Department of Agricul ture , the Fores t Service and the Soil Conservation Service are the two bureaus m o s t vitally in te res ted in complete watershed protect ion and flood control and sediment reduction.
The Soil Conservation Service working under the authority of Public Law 46 c a r r i e s out a program of soil conservation through organized Soil Conservation Distr icts . This program is based on the principle of using every acre of land according to its capabili t ies and treating it according to its needs.
The land treatment measures, including proper land use , re fores ta t ion , improved pas tu res and meadows, gully control, t e r r a c e s and diversion ditches on croplands if properly applied and maintained reduce eros ion , i n c r e a s e infiltration and reduce the sediment loads of our creeks and r ivers .
This type of treatment if concentrated in a small watershed where a high percentage of application is obtained is effective in reducing sedimentation as may be shown by the following examples. In the Newman-Georgia r e s e r v o i r the ra te of siltation from a 1. 39 square mile drainage area was reduced from 0. 5% of the lake's capacity per year to 0. 15% per year by installation of conservation measures . This wa's a reduction of 78% in the ra te of silting. Siltation was reduced from 2. 2 acre feet per square mile of drainage a rea during the period 1938-41 to 1. 02 ac re feet per square mile during the period 1941-49 in Lake Issaqueena in P ickens County, South Carolina. This is an annual reduction of 53% in the siltation ra te , and was accomplished principally by changes in land use and t reatment . Many other examples may be cited supporting this type of t reatment .
The problem confronting us at present is how we can get an effective coverage Of conservation prac t ices es tabl ished in a watershed.
The present Soil Conservation program as now operating, gives a too widespread and scattered an application to be effective. Using Kentucky as an example, we find that over a period of ten years , 12-1/2 percent of the farms in the state have soil conservat ion p lans . Of these no m o r e than 40% of the recommended water control prac t ices have been applied ( that ' s a generous es t imate) , which leaves us with 5% of the needed pract ices applied to date. This is too thin a coverage to make any appreciable reduction in the siltation of our s treams. In fact , the r a t e of s i l t deposi t ion in the small streams has increased tremendously within the past eight yea rs , par t icular ly in the smal ler s t reams.
The Muskingham conservancy distr ict in Ohio, which is a local organization, working closely with the Soil Conservat ion Service and other Federal agencies, and using their own technicians full time in the Muskingham watershed have substantially r e duced the s i l ta t ion ra te in their r e s e r v o i r s . In that connection they control more land. They were able to buy up all the farms. This would seem to indicate that an active interested local organization can obtain r e su l t s with the present agencies on a limited sca le .
The Missouri Basin comprehensive plan on the other hand has so many agencies involved and such a multitude of generalities, plans and details which cover everything from major stream improvements to gopher e rad ica t ion , and teaching farm people how to use electricity, that it appears it may never produce any action or benefits to speak of, and may eventually collapse of its own weight.
We can keep planning and planning, and there is no end if we keep on planning.
The Department of Agriculture Flood Control . p rogram as author ized in 1936 could be a highly effective weapon in combating headwater floods, erosion, and siltation. The program includes all the conservation measures recommended on private lands, highways, and railroad rights-of-way within a given watershed. In addition, upstream r e s e r voirs, desilting basins, channel improvement, and bank stabilization are provided for. This program provides a complete supplement to the work that the Corps of Engineers are doing on the main waterways for flood control and navigation. The program provides for a concentration of conservation and water control m e a s u r e s in a specific watershed. The larger watersheds are divided into minor watersheds and plans for complete coverage of practices are set up with the higher p r io r i t i es given to the more critical areas . Operations in the minor watersheds are ca r r i ed on through organized Soil Conservation Dis t r ic ts . The individual fa rmers aided by Department technicians initiate the conservation p rac t i ces on the i r land. The l a r g e r operations where group benefits a r e involved a r e planned by the Depa r tmen t technic ians and construction or
69
installation is done by private contractors at Federal expense.
The combined operations of the Department of Agriculture and the Corps of Engineers , together with the States involved, will give a drainage basin adequate protection from floods and siltation. The two p r o g r a m s should be planned and car r ied out simultaneously, or if at all possible, the agricultural program should be carried on ahead of the engineering program. This unfortunately has not been done in the past, and the Department of Agriculture has only eleven authorized flood control projects in the United States where hundreds a r e needed.
The pr inc ipa l weakness of this coordinated p rogram has been the t ime lag between the field surveys to determine the need for the operations in a watershed and the t ime such operations actually commence. In many instances this has been ten or more years. Such delays are not easily jus t i fied in the eyes of a farmer who sees his farm land
covered with swirling muddy water severa l t imes a year. He cannot understand how changes in po l i cies and procedures at top levels in Washington can delay so necessary a program for so long a time.
In summation it may be said that to be effective and practical a flood Control and sediment control program for a watershed must be financed to a large extent by Federal funds. It should include all necessary conservation and engineering works from the watershed to the mouth of the stream. It should be planned and administered by the minimum number of Federal agencies possible. It should be planned and carried out in cooperation with the state or states affected. If it is to be effective during our lifetime, and while there is still time for a remedial program to be effective, Congress or cabinet authority should see to it that such a program can clear all necessary channels and be ready for presentation to Congress in no more than six months from the completion dates of plans or survey reports.
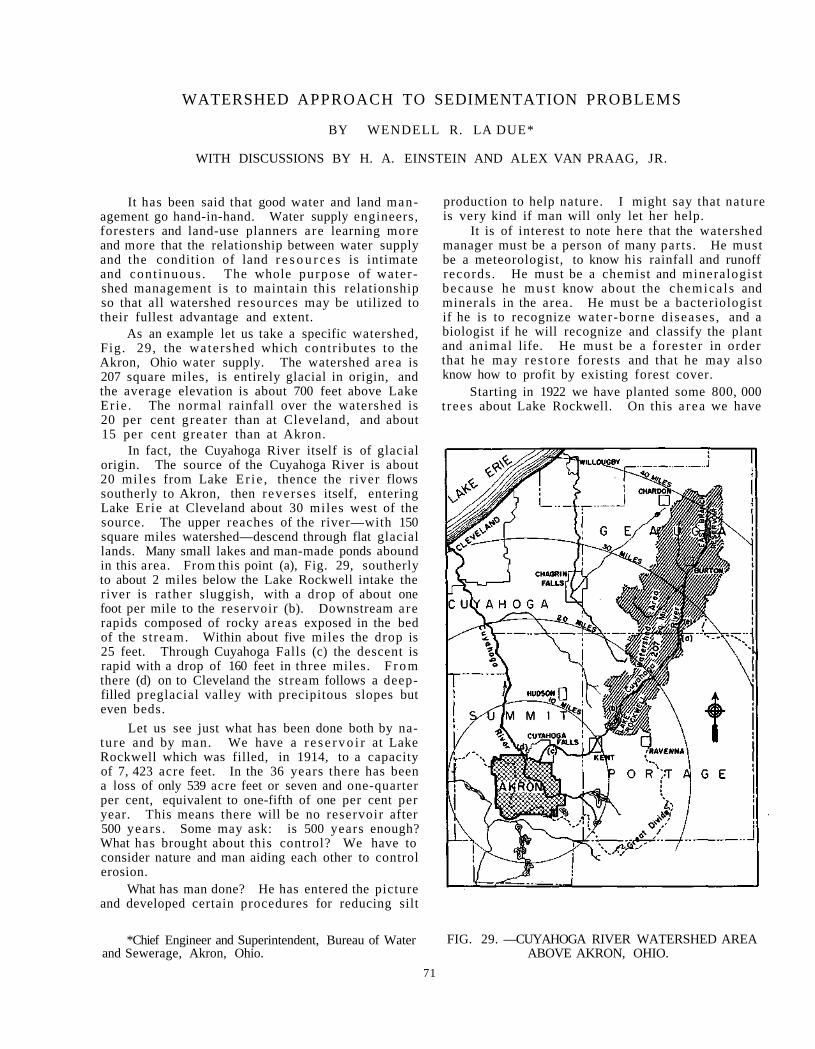
WATERSHED APPROACH TO SEDIMENTATION PROBLEMS
BY WENDELL R. LA DUE*
WITH DISCUSSIONS BY H. A. EINSTEIN AND ALEX VAN PRAAG, JR.
It has been said that good water and land management go hand-in-hand. Water supply engineers, foresters and land-use planners are learning more and more that the relationship between water supply and the condition of land r e s o u r c e s is intimate and cont inuous . The whole purpose of watershed management is to maintain this relationship so that all watershed resources may be utilized to their fullest advantage and extent.
As an example let us take a specific watershed, Fig. 29, the watershed which contributes to the Akron, Ohio water supply. The watershed a rea is 207 square miles, is entirely glacial in origin, and the average elevation is about 700 feet above Lake Er ie . The normal rainfall over the watershed is 20 per cent grea ter than at Cleveland, and about 15 per cent greater than at Akron.
In fact, the Cuyahoga River itself is of glacial origin. The source of the Cuyahoga River is about 20 miles from Lake Er ie , thence the r iver flows southerly to Akron, then reverses itself, entering Lake Erie at Cleveland about 30 miles west of the source. The upper reaches of the river—with 150 square miles watershed—descend through flat glacial lands. Many small lakes and man-made ponds abound in this area. From this point (a), Fig. 29, southerly to about 2 miles below the Lake Rockwell intake the river is rather sluggish, with a drop of about one foot per mile to the reservoir (b). Downstream are rapids composed of rocky areas exposed in the bed of the stream. Within about five miles the drop is 25 feet. Through Cuyahoga Falls (c) the descent is rapid with a drop of 160 feet in three miles. F r o m there (d) on to Cleveland the stream follows a deep-filled preglacial valley with precipitous slopes but even beds.
Let us see just what has been done both by nature and by man. We have a r e s e r v o i r at Lake Rockwell which was filled, in 1914, to a capacity of 7, 423 acre feet. In the 36 years there has been a loss of only 539 acre feet or seven and one-quarter per cent, equivalent to one-fifth of one per cent per year. This means there will be no reservoir after 500 years . Some may ask: is 500 years enough? What has brought about this control? We have to consider nature and man aiding each other to control erosion.
What has man done? He has entered the picture and developed certain procedures for reducing silt
*Chief Engineer and Superintendent, Bureau of Water and Sewerage, Akron, Ohio.
production to help nature. I might say that nature is very kind if man will only let her help.
It is of interest to note here that the watershed manager must be a person of many parts . He must be a meteorologist, to know his rainfall and runoff records . He must be a chemist and mineralogist because he m u s t know about the chemica l s and minerals in the area. He must be a bacteriologist if he is to recognize water-borne d iseases , and a biologist if he will recognize and classify the plant and animal life. He must be a fores ter in order that he may res to re forests and that he may also know how to profit by existing forest cover.
Starting in 1922 we have planted some 800, 000 t rees about Lake Rockwell. On this a rea we have
FIG. 29. —CUYAHOGA RIVER WATERSHED AREA ABOVE AKRON, OHIO.
71
72
learned to be forest exper ts . We go through our fores t every year and cull out what is not good. The city owns 8, 000 a c r e s sca t tered all over the watershed for a distance of 15 miles above Hiram Rapids (e). On those a r e a s we have f a rms , 250 cattle, a thousand sheep and a few hogs. He must be an expert in animal husbandry and sometimes he must be a veterinarian. He has to be a farmer . This fall we harvested 18, 000 bales of hay, 6, 000 bushels of oats, likewise corn and wheat. At the present time we are getting ready to sell cattle. In this business of operating so much land all types of farming operat ions will be exper ienced. We have 150 acres of fruit t rees from which we harvest 35, 000 bushels of apples.
He must be a geologist. We have coal, sandstone and shale formation 700 to 800 feet, which have to be recognized and evaluated. He must be a soil mechanic in order to build dams with what he has to work with. Eventually and inevitably he will become a conservat ionis t , in teres ted in the planting of trees and the conservation of soil. Above all , he must be an hydrologist, dealing with one of na tu r e ' s phenomena. It s eems s t range when we say that we are a part of all these things, and that a waterworks engineer should digress so far. But, if he is to protect his watershed and the future of his city and community he should at least know his area like a book in all its chapters. The problems involved in its efficient management requi re his personal interest.
I would say that the greatest advantage derived from doing all these things is that we have become good neighbors. We own only 10 per cent of this watershed. We have set an example. We find other people copying what we do. Therefore over the
past few years the watershed has changed considerably. I must direct your attention to the factthat the watershed is only about 30 miles from Cleveland, 30 miles from Youngstown and 30 miles from Akron-right in the center of the triangle with a large city at each apex and with almost one-third of the entire population of the s ta te of Ohio within a 60-mile radius.
It is to be noted that in these pursuits we deal with continually changing unknowns—rainfall, runoff, forest cover, cultivated lands, crop rotation— all changing to the vagaries of both man and nature. Each watershed has a personality of its own—to be studied, surveyed, watched, directed, controlled. Here at least on our watershed we have a 36-year record of what has occurred. With continual watershed knowledge a pattern is set for what to expect. But, in all, it figures intimate, prolonged and watchful acceptance of the relationship existing between man on the one hand and water and land resources on the other. Is 500 years enough? Have we a yardst ick? At least we have a yardstick for one area of the United States. Others will follow for comparison. Here is a t rue approach to a sedimentation problem. We have an answer, worked back to the original question—what caused such low sediment conditions? In no other waterworks structure . devised by man is the useful life susceptible to greater prolongation by the simple exercise of p re ventive maintenance. I would predict that all des igners and bui lders of r e s e r v o i r s in the future will include in their plans items of siltation control and watershed management "upstream engineering" resulting in the immensely profitable and measurable item of prolonged useful life to the s t ructure . In this nature will help—if man is willing.
73
DISCUSSION
H. A. EINSTEIN. —We have been shown very convincingly by the two speakers how important soil conservation measures on the land are , as far as the downstream runoff of sediment is concerned. But there are a few points that complicate mat te rs .
One becomes apparent in the Oxford(Mississippi) a rea of which we have seen p ic tures . Numerous large gullies have developed there in the sandy soils of the watershed/ The difficulty is that one probably cannot convince any land owner that he can improve the condition of his land by work on the gullied a reas . There is a big danger that those people will work on their best areas only and leave the poorest a reas to the elements. This is a big source of sediment that will not be touched by no rma l conservation methods . It must be paid for by the people that will benefit downstream, and that is a difficult problem of organization.
The second point is, that even if someone would stop all those gullies today such that no sediment would leave the area , it would probably take 20 or at least 10 years until one would feel a reduced output of sediment at the lower end of the 125 square mile watershed. In other words, there is so much sand accumulated in the channel system it will take that long to clean it out and only then will the sediment load at the lower end be reduced. If a r e s ervoir were built at the lower end of the watershed it would accumulate all the sediment which is stored in the channel system at the t ime. .
That ties back to what was said about the division of the sed iment load. The sil ts and clays, which are not represented in the bed, move through the system at high speed. Any change of silt output in the watershed will be felt immediately downs t ream. The mater ia l that moves as bed-load on the other hand moves very slowly and is accumulated in the sys tem and, the re fo re , its motion downs t r eam is slowly affected by changes upst ream, often only after many years.
There is one third point. Sometimes a definite possibility exists of improving the sediment problem in the reservoir without having to go all the way to the watershed. This may be done by providing sediment deposition space near the reservoir in the valley of the sediment-carrying s t ream. Nature has
provided for this possibility, for instance, in the Rio Grande valley above Elephant Butte. Today, a large percentage of the sand load is deposited in the valley above the reservoir . If I remember the figures correct ly only ten per cent of the bed-load which moves in the Rio Grande at San Acacia, about 40 miles above the reservoir , actually reaches the reservoi r . All the res t of the bed-load and much of the silt is deposited in a very dense vegetative screen of tamarisk which has developed in that part of the valley. Actually the possibility exists of providing artificially such a screen upstream of many reservoirs in order to protect the reservoirs themselves. This provides a possibility of depositing both the bed-load and at least part of the fine mate rial where it causes a minimum of damage.
ALEX VAN PRAAG, JR. —I am quite a little i n t e r e s t e d in the subject myself , coming from Decatur, which has a lake created by the damming of the Sangamon River . The watershed area is 900 square mi les and it is 90 per cent in cultivation. There is very little noncultivable land.
We have a very serious sedimentation problem. In our situation, in contrast with the fine experience which has been recited, the city of Decatur thus far has only talked about what it ought to do. The ex-ception to this statement is that the city has hired a full-time conservationist to work with the land owners in effecting a watershed land conservation p r o g r a m . It financed his s e r v i c e s out of water department funds. Can you imagine, though, how little one man alone can do?
How seriously does this affect our water supply? Our lake has been one of those studied, and by very conservative prediction we can be without sufficient water in 1954. One-third of the lake capacity has been lost to silt deposit. We continue to expand our water uses, and should we suffer an extreme drought at any t ime, we can be in a very bad shape. Yet, our citizens go out and see this lake and they think, "with that lake for a water supply, we can never be in trouble. "
A N A L Y S I S A N D USE O F G R O U N D - W A T E R D A T A
BY W. F. GUYTON*
WITH DISCUSSIONS BY JOHN H. BLISS, HOWARD CRITCHLOW AND H. A. S P A F F O R D
It gives me a g r e a t dea l of p l e a s u r e to be h e r e today and to take p a r t in th i s mee t ing honor ing the I l l inois State Water Survey Division. I have known of the work being done on ground water by this Div i s ion and by its p a r a l l e l Geological Su rvey Divis ion for a number of y e a r s , and have a lways had r e a s o n to have the highest r e s p e c t for these two Div i s ions .
As you p r o b a b l y know, the State of I l l inois is somewhat unique in that it handles most of i t s groundw a t e r i n v e s t i g a t i o n s a l o n e , wi thout t h e f inancial cooperation and ass i s t ance of the United Sta tes G e o l o g i c a l S u r v e y . I t h a s h e l d i t s own v e r y wel l in c o m p a r i s o n t o the o t h e r s t a t e s , even without the he lp of the national organizat ion, and is to be highly c o m p l i m e n t e d for the good work i t has b e e n doing.
D u r i n g r e c e n t y e a r s , n a t i o n a l a t t e n t i o n h a s b e e n d r a w n t o g r o u n d - w a t e r p r o b l e m s a t a n i n c r e a s i n g r a t e . P r o b a b l y you have r e a d some o f t h e a r t i c l e s d e s c r i b i n g the g r o u n d - w a t e r s i tua t ion throughout the country. Some of these a r t i c l e s a r e qu i t e factual and p r e s e n t the s t o ry j u s t a s i t t r u l y i s . Other a r t i c l e s , however , have been wr i t t en by pe r sons who were not thoroughly famil iar with w a t e r r e s o u r c e s p r o b l e m s but who w e r e m o t i v a t e d by a d e s i r e to produce something sensat ional . They have c r i e d that the g round-wate r r e s o u r c e s of the United Sta tes a r e decreasing and that se r ious consequences wi l l r e s u l t before many y e a r s p a s s . The t r u th i s , t h o u g h , a s h a s b e e n p o i n t e d out by a good m a n y people in a pos i t ion to know, that the supp l i e s a r e not d e c r e a s i n g ; the wa te r level i s d e c r e a s i n g , and t h e r e is no such thing as a nat ional water s h o r t a g e . O u r s u r f a c e - w a t e r and g r o u n d - w a t e r r e s o u r c e s a r e not running out. T h e r e i s j u s t a s m u c h w a t e r today as there was a good many y e a r s ago . As you know, water is a renewable r e s o u r c e , and i t i s r e p l e n i s h e d y e a r af ter y e a r by what i s known as the " h y d r o l o g i c cyc le . "
The r ea l t roub le i s s imply that people a r e u s ing m o r e and m o r e water and cos t s a r e going up as a resul t . In 1945, I made a survey of g r o u n d - w a t e r u s e and found i t to be abou t 20 b i l l ion ga l lons p e r day on an a v e r a g e . In 1935, Dr . O. E. M e i n z e r , of the U. S. G e o l o g i c a l S u r v e y , had e s t i m a t e d it to be a b o u t 10 b i l l i o n g a l l o n s p e r d a y . In 1950, K. A. MacKichan of the Geological Survey e s t i m a t e d
*Consulting Ground-Water Hydrologist , Austin, Texas .
tha t the use of g r o u n d w a t e r was 30 bi l l ion ga l lons pe r day. Thus, in 15 y e a r s the use of g r o u n d w a t e r has t r i p l ed .
Now, i t is a x i o m a t i c that e v e r y t i m e a second or a t h i r d u s e r of g r o u n d w a t e r p u t s h i s wel l into a ground-water r e s e r v o i r and s t a r t s using the w a t e r , i t l o w e r s the w a t e r l e v e l i n the f i r s t w e l l and a l l other wel ls that have been drawing f rom the r e s e r v o i r b e f o r e the new w e l l was put down. In o r d e r for g r o u n d w a t e r to flow to a we l l , i t m u s t have a gradient , and that gradient m u s t be c r e a t e d by lowe r i n g the w a t e r l e v e l in the w e l l . Such lower ing of the w a t e r l eve l in the wel l t ha t i s p u m p e d a l s o l o w e r s the w a t e r l e v e l s i n a l l t h e o t h e r wel l s i n t h a t r e s e r v o i r b e t w e e n the p u m p e d w e l l and the a r e a s o f n a t u r a l r e c h a r g e and d i s c h a r g e , and a l s o for s o m e d i s t a n c e l a t e r a l l y on e i t h e r s i de of the pumped well .
Thus a s m o r e and m o r e ground w a t e r h a s been used, and new wel ls have been ins ta l l ed , the w a t e r levels have been lowered more and m o r e , and some people have gotten the idea that ground water is r u n ning out. Where there is sufficient r echa rge to s u p ply the withdrawal, however, th is lowering of w a t e r levels does not indicate overpumping. I t is s imp ly a m a t t e r of d iver t ing the r e c h a r g e to the we l l s for use by m a n r a t h e r than let t ing i t flow to w a s t e . I t i s t r u e that i f t h e r e i s not enough r e c h a r g e to s u p ply the wi thdrawal , the wate r l e v e l s do k e e p going down and down and the g r o u n d - w a t e r supply eventual ly is exhaus ted , but for tunate ly , in m o s t of the coun t ry t h e r e i s sufficient r e c h a r g e and the p r o b l e m s a r e l a r g e l y p r o b l e m s o f e c o n o m i c s with r e spect to pumping lifts or distr ibution of wells r a t h e r than be ing p r o b l e m s of ac tua l s h o r t a g e s of w a t e r .
Of c o u r s e , t h e r e a r e s o m e r e a l s h o r t a g e s o f g r o u n d w a t e r in the United Sta tes , and I do not want t o give the i m p r e s s i o n tha t t h e r e a r e not r e a l and s e r i o u s p r o b l e m s . I have worked on s o m e of t h e m mysel f . In p a r t s of Cal i forn ia , A r i z o n a , and New Mexico , and in the High P l a in s of T e x a s and some o the r a r e a s , t h e r e s i m p l y i s not enough r e c h a r g e to supply the demands being made on the w e l l s . In those p l aces the g roundwa te r i s be ing mined , and eventually Old Mother Nature will fo rce a c e s s a t i o n of the o v e r p u m p i n g b e c a u s e t h e w a t e r l e v e l s wil l be d rawn down so far tha t the cos t of pumping wil l be exorbitant or the yields of wells will be d e c r e a s e d to s u c h an ex ten t t h a t the l a r g e a m o u n t s of w a t e r
75
76
can no longer be obtained. In one a rea where I worked las t spring, near
Deming, New Mexico, we made a special effort to point this out to the local people. We told them that they are using the water at a greater rate than the r echa rge and that, while they a r e making money now by irrigating, there will come a day when they will not be able to make money in this way because there will not be enough water left, and that as a business proposition they should plan their developments toward that eventuality.
Often, people feel that legal control of ground water is the final answer; but legal control, I am afraid, cannot do the whole job. There a re p robl ems such as those in New Mexico and the High Plains of Texas where the recharge is almost negligible in comparison with the amount of water be ing pumped, and the people simply will not stand for regulating the use of water to the amount that is available by natural recharge . They want to use this water the same as they would use coal from a coal field. And since, in most cases , they have already started using water at excessive ra tes be fore legal control is proposed , it is pract ical ly impossible for legal control to do more than to hold the problems to a minimum after that t ime. The answers there still are a long way off.
In many other places, we a re just now on the threshold of making real use of our ground-water r e sources , and legal control might well be a hindrance to the development unless very carefully applied. More often than not there just is not enough information available now to make and apply laws that are just to everyone. Too strict legal control could well stifle progress , whereas too weak legal control would be a useless burden on the taxpayers.
One thing is cer ta in , whatever is done, the persons charged with regulating our ground-water resources must be truly wise and honest men, and must be given a wide latitude for the use of personal judgment. The situation appears to be just too complicated to be handled successfully in any other way.
For tuna te ly , though, be that as it may, the ove r -a l l situation is not as bad as has been p r e sented by some people. Though the total amount of water, both surface and ground water used in the country in 1950, as estimated by MacKichan, was 170 billion gallons per day, it has been est imated a l so by the Geological Survey that the amount of water available for use, or ra ther the amount of water flowing to the oceans from our streams, is ap proximately six or seven times this amount. Thus, on the whole, there still is several t imes as much water unused as is being used.
Ground-water reservoirs contain at one t ime or another a s izable par t of this water as it flows, from the a r e a s where the ra ins fall, back to the ocean. If we develop and use this presently unused water, both ground water and surface water, in the
proper manner, there will be room for a great deal more expansion in the use of water in most places in the country.
The question of developing and using water in the proper manner is a big one. To do so we must know something about the source of the water, how much water there is in storage at the source, how much the recharge is and how it fluctuates, what the best methods of getting the water might be, and many other things that go along with development. All of this calls for what is cal led "basic data. " Unfortunately, however, the basic data available on the water resources of the United States are ra ther skimpy in comparison to the needs for such data and the g r e a t p r o g r a m s of development that a r e being undertaken.
In many cases in the past, basic data have not been obtained for our water resources until the need has arisen for such data. Then, in many instances, when the need was there , it was too late to get all the data that were needed. Such things as record of s tream flow, water levels in wells and pumpage from wells must be collected and compiled on a continuing basis. Once the water levels have fluctuated in wells it is too late to go back and find out what happened. So, in many cases where development has been made in the past , it has had to be made partly by guess, with only the use of data that could be obtained relatively quickly. The same will be t rue of developments that will be made in the future unless more attention is given to the col lection of basic data now.
The Illinois State Water Survey Division and the United States Geological Survey, and the others , certainly recognize the need for these data, but the programs which they have proposed time and t ime again for collection of basic data have been t r immed by the legislative bodies in order to leave money for more immediate problems. In the opinion of those of us who have to deal with water resources problems, this is false economy.
It is hard enough to solve ground-water problems without wasting money, even when all the data we can think of a r e avai lable. It is much, much harder when data a r e miss ing because they have not been collected over the years passed. Without data t h e r e mus t inevi tably be fumbling and bad guesses which lead to improper design of wells, the wrong spacing of wells, overpumping of rese rvo i r s , too much interference with existing developments and the l ike.
So, before I go further with this talk, I would like to make this plea: that the basic data programs proposed by the state organizations and by federal organizations, who collect the data, be given c a r e ful attention and be supported in every manner pos sible. The cost of such p r o g r a m s is only a drop in the bucket as compared to the waste of money that r e su l t s from lack of enough data.
77
This title is comprehensive. Mr. Hudson suggested that I endeavor to review the way in which ground-water data are used so as to give the state agencies and others an idea as to what kind of data a re needed. He also suggested that I briefly r e view the non-equilibrium theory of groundwater, because this theory is not too well known in many c i rc les .
In r ega rd to the ground-water data, I might first mention a few of the types of basic data which we need. The first class of data might be called "geologic. " As you know, groundwater occurs in formations of sand or gravel , or in limestone or other types of rock beneath the land surface. These formations a re sometimes regular in shape but a r e more often irregular in shape and composition. They have been laid down according to natural laws and under conditions that can be determined by proper study of the geology. A study of the geology of a w a t e r - b e a r i n g formation is about the same to a g round-water investigator as the building of the framework of a; house is to a carpenter. We must have the information from the study of geology b e fore proceeding to find out how much water there is in the formation and how to get it out in the best manner. F r o m the geology and from tes t drilling and geophysical studies we learn the location and depth of the formations, their thickness, the types of materials comprising them, and the composition of those mater ia ls , and the inevitable changes and i rregular i t ies that occur in the formations.
The next most important data are water levels and pumpage records of wells that have been drawing from the formations. At least this is the case where there are wells because, as you know, hindsight is usually better than foresight.
In most formations the flow of groundwater is laminar. In other words, the rate of flow is directly proportional to the hydraulic gradient. Also, in determining the drawdown of water level in a formation, generally the effect on the water level caused by pumping one well can be added to the effect caused by pumping another well in order to determine the combined effect of both wells. This makes the solution of a ground-water problem much simpler than it otherwise would be, because we can break the problem down into small components and then add it all up/again and get the answer. If we know what has happened in a formation over a period of years as a result of pumping from that formation, a de tailed study of the past records , taking them apar t and then putting them back together again, will give a mighty good indication of what will happen in the formation in the future if the pumping is increased or if pumping from another part of the formation is commenced.
Other important data a r e those obtained with respec t to recharge and natura l discharge of the formations. Just where are the areas of recharge
and how much water can enter the formations under various conditions? Also, what is the chemical cha rac t e r of the water in different places in the formation, and its t empera tu re? To many use r s ' the character is t ics of quality a re more important than those regard ing quanti ty. Quality records have also quite a place in determining the quantity of water available at different places, because they give a clue as to where the water is coming from and how much can flow from one area to another.
Then, of course, there are the usual data with respec t to yields and methods of construction of wells, and the various problems that go along with getting the most water out of a well.
I have left a very impor tan t set of data for special mention. These data deal with the ability of the formation to t ransmit water from one place to another, and its ability or capacity for storage of water . As you probably know, ground-water reservoirs act both as conduits and as storage r e s e r v o i r s . We call them r e s e r v o i r s , formations, aquifers, or what have you, but they all store water at least to some degree; and if the water is any good, it must be flushing itself out from one place to another in the formation, however slowly.
The characteristics of a formation to t ransmi t water may be called its permeability, or its t r a n s -missibility. Permeability generally refers to the mater ia l and t ransmissibi l i ty to the formation as a whole. The ability of the formation to store water or to hold water in the inters t ices of the sand and gravel or the cavities and crevices of l imestone, or other rocks , may be catalogued by its specific yield or effective porosity or storage coefficient. These t e r m s indicate how much water can be obtained from the formation by lowering the water table. The storage coefficient is also applied to ar tesian conditions to indicate how much water is obtained from the formation under ar tes ian conditions as a result of compression of the formation and from leakage through confining and from included fine-grained beds, when the artesian water level is lowered.
These data may be determined in part by laboratory tests, but it generally is found that pumping tests of wells, both individually and in groups, can be used to determine the characteristic more accurately and on a more general basis for the formation as a whole. Such pumping tests have been de veloped ra ther extensively in connection with the non-equilibrium theory which I expect to go into a little later .
In regard to all these various data, before d i s cussing the non-equilibrium theory, I would like to say I have yet to run across a single consulting problem in groundwater where at least some of the data were not needed and where I did not have to call on the basic data agencies for help in this r e gard; or, if they did not have the data, to go out and
78
obtain it myself. The solution of a ground-water problem gen
erally is like an equation 1, 2, 3. Rarely are enough data available so that it is just one, two, three, or so that one line of reasoning is enough. You go at the problem from several angles, each one of which will give you an idea as to what the answer i s , but a l l the pieces mus t fit and make sense and agree with one another before you are sure that the right answer is obtained. So we use all the data that a r e ava i l ab le—wate r l eve ls , pumpage records , r e c o r d s of yields of wel l s , t r ansmiss ib i l i ty and storage coefficients, chemical analyses, temperatu res , data on recharge and discharge areas—put it with what we know about the geology, the s t ructure and position and formations, and see if everything adds up to one answer. If not, there is doubt as to whether the right answer has been obtained. Where too much data a r e missing, it is like groping in the dark for a light switch. I have a witch s t ick . I could d e m o n s t r a t e its use to you here , but that does not mean that I, or anyone else, can go out and witch water. We must learn the answers from a study of facts, analyzed in a scientific manner ; and these facts which a re to be analyzed include the basic data that a re collected by the data-collecting agencies.
Now, to go on briefly with the non-equilibrium theory. This is real ly not just a theory. It is a concept based on n a t u r a l laws of occurrence of groundwater which have been discovered and proven to be correct over a period of many years . A study of this concept, the formulas which have been derived, and the coefficients which have been identified, has shown it to be a fundamental concept of physics that is applied not only to groundwater, but to e lect r ic i ty and to the flow of heat and to many other problems. While it was being developed in the field of groundwater , it was a l s o being developed in a parallel manner in the entirely separate field of petroleum.
This concept, or theory, has added a powerful new tool to the ground-water investigator's set. Its use, when enough data a r e available, puts the solution of most ground-water problems on a sound theoretical as well as experimental bas i s , rather than leaving a par t of every problem to be solved by empir ical means . Even if enough data are not avai lable , the non-equil ibrium concept is fundamental to a proper understanding of what might be the solution, and what lines the investigation should follow.
One of the things included in this concept is a recognition of artesian storage of water, i. e . , water which is obtained from storage in the formation without any unwatering of the water-bearing mater ial . Meinzer was the first to be given credit for the concept of compressibility and elasticity of a r t e sian w a t e r - b e a r i n g format ions . He studied the
Dakota sandstone and found that, although the withdrawals from wells were not being balanced by r e charge, the formation was not being de-watered. This showed that part of the water withdrawn either was coming from compression of the formation, or from leakage through confining layers, or that expansion of gas in the water remaining in the formation was replacing the water taken out. Since the composi t ion of the confining beds and the water was such that it was not conceivable that all the water was coming from leakage, nor was it conceivable that the water remaining contained enough gas to take the place of the water withdrawn, all Meinzer concluded was that at least part of the water was coming from storage as a result of compres sion of the format ion and from expansion of the water in the formation which accompanied decreased in t e rna l hydros ta t i c p r e s s u r e . Meinzer ' s f irst s ta tement on this was published in 1925.
In 1935, Theis published what has since become known as the Theis non-equilibrium formula. This formula takes into consideration the time e lement , and the withdrawal of water from storage, both ar tes ian and non-artesian. Based on certain simplifying geologic assumptions, it gives the drawdown of the water level at any place in a formation that is caused by pumping from any other place for any given length of t ime.
In order to use this formula and to adjust computations made with it so that all variations from the assumed geologic conditions are taken into a c count, we must know quite a lot about the formation; and we must accept the axiom of balancing the ground-water recharge and discharge in the formation before equilibrium can be reached. Theis has explained this, as well as his formula, in about as good a manner as anyone can explain it, in order to save water, and I would like to quote from a paper by him, originally published in the Civil Engineering magazine for May, 1940:
"It is evident that on the average the rate of d is charge from the aquifer during recent geologic time has been equal to the rate of input into it. Under natural conditions, therefore, previous to development by wells, aquifers are in a state of approximate dynamic equilibrium. Discharge by wells is thus a new discharge superimposed upon a previously stable sys tem, and it must be balanced by an increase in the recharge of the aquifer, or by a dec rease in the old natural discharge, or by loss of storage in the aquifer, or by a combination of these.
"Under Darcy 's law there is only one way of reducing the flow in the areas of natural discharge or of increasing the flow in the areas of recharge . This is by changing the p r e s s u r e gradient or the thickness of saturation of the aquifer in those a r ea s , which in turn means changing the height to which water levels r ise in wells throughout the a rea be-
79
tween the producing wells and the a reas of natural recharge or discharge. This means a lowering of water level everywhere between the wells and the a r e a s of natural d ischarge or recharge . In turn this means a reduction of storage in the aquifer and abstraction of water from it.
"There are two fundamental physical properties of any aquifer which largely control the movement of water through it. The first is the ease with which it t r an smi t s the water , analogous to the thermal conductivity of a solid in the theory of heat, or the electrical conductivity of an electrical circuit. This charac ter i s t ic of the aquifer as a whole is called the coefficient of t ransmiss ib i l i ty .
"The other important characteristic of the aquifer is the amount of water that will be released from s torage when the head in the aquifer falls. This has been called the coefficient of storage, and is defined as the amount of water in cubic feet that will be released from storage in each vertical column of the aquifer having a base 1 ft. square when the water level falls 1 ft. For non-artesian aquifers the coefficient of storage is nearly identical with the specific yield of the material of the aquifer. For artesian aquifers the coefficient depends on the compress ib i l i ty of the aquifer or of included or stratigraphically adjacent shaly beds and is much smaller .
"When a well is drawn upon . . . water levels a re drawn down in the vicinity of the well. Some water is removed from the vicinity concurrently with this reduction in water levels, and a so-called cone of depression is formed. The shape of this cone is determined principally by the ease with which water flows through the aquifer—the coefficient of transmissibility—and by the coefficient of storage.
" . . . With continued pumping the cone deepens and broadens. It is evident that the well is taking water out of storage in the vicinity and that as more and more water is removed by the well, the cone of depression affects more and more distant parts of the aquifer.
"The formula for the cone of depression in the ideal homogeneous and isotropic aquifer assumed is
in which
v = drawdown at any point, in ft. F = rate of d ischarge of the well, in gal.
per min. T = coefficient of transmissibil i ty z = l . 8 7 r 2 s / T t r = distance between pumped well and point
of observation in ft. s = coefficient of storage t = t ime the well has been discharging, in
days u = a dimensionless quantity varying between
the limits given.
" . . . The important general principle is that, according to the formula, which appears to hold except for very short periods of pumping, the rate of growth and the lateral extent of the cones of depression a r e independent of the rate of pumping. If we pump twice as hard the cone will be twice as deep at any point, but it will not extend to any more distant a reas . The disturbance in the aquifer created by the d ischarge of the well may be likened to a wave; the amplitude depends on the strength of the disturbance but the rate of propagation depends only on the medium in which the wave is formed. The reservoir from which the well takes water is almost as closely circumscribed by time as it would be by any m a t e r i a l boundary, and until sufficient time has elapsed for the cone to reach the area of natural discharge and, or the area of rejected recharge, a new equilibrium in the aquifer cannot be established.
"After the cone of depression reaches a reas of rejected recharge or natural discharge, it is modified by the effects of adding water in the former or preventing it from escaping in the la t te r . If the rate of pumping does not exceed the amount of water added in the recharge area and that prevented from escaping in the discharge area, the cone will eventually reach equilibrium, at least practically speaking. The approximate effects that occur after the cone has reached the boundaries of the aquifer can be e s t ima ted by means of var ious mathematical analyses. The effects of discontinuous pumping can also be evaluated. " End of quote from Theis.
The development of the Theis non-equilibrium formula and its application has led to many pumping tests of formations to determine the t r ansmi s -sibility and storage coefficients. Along with these pumping tes ts there have been developed various techniques for analysis of the data and various applications of the formula to widely different boundary condit ions. Many of these things have been writ ten up and published in one place or another, but on the whole they a r e sti l l in a state of flux. There is no single comprehensive manual on pumping tests nor is there a single comprehensive paper or book on the application of the results of pumping tes t s to all types of p rob lems . Generally, each ground-water office has its so-called specialist on the use of the non-equil ibrium formula, and this person endeavors to keep up with the latest developments in this field.
It is to be hoped that, before too long, the l i t erature will have become more complete and stand-
80
ardized concerning tne non-equilibrium theory and its application, so that the ordinary engineer or geologist , without help, can make and interpret pumping tests with reasonable assurance of not going off at a tangent.
In the meantime, the simple recognition of the time element in the ground-water problems and of the fact that there is a method for taking this e lement into consideration will go a long way toward making ground-water problems and their solution more understandable. The non-equilibrium concept, applied to an adequate set of data, with common sense and logical reasoning, can do a great deal more than has been done in the past toward getting good answers to ground-water problems and making sure that new developments are made on a sound and efficient bas i s .
That is the close of the prepared part. However, I have been asked to mention a little about the p rac t i cal application of the non-equilibrium theory. The non-equilibrium theory is very practical , and we have applied it throughout the country. We have found, where we can apply it, where conditions a re reasonable , that its applications have been jus t i fied. We can predict drawdowns within a very few per cent over a period of many years .
In one case at Lufkin, Texas, about 1939 there was a paper mill that put in wells and pumped about five million gallons daily. The water level plotted against time made a straight line declining. After about a year, the mill proprietors went to the U. S. Geological Survey and asked what to do, for they wanted to double the pumpage. The Survey told them it appeared that they were overpumping, but that the Survey would be glad to make pumping tes ts
to make a better determination. The pumping tes ts were made. Also, we got all the records of pump-age and water levels, and we found that, although approximately five million gallons were being taken daily, the pumping rate had been stepped up just enough to affect the water levels so that they were changed from the typical recession curves to s traight lines, when plotted on rectangular coordinates. The formation coefficients were computed. The available data indicated that there was a recharge area about 20 miles north. With this information, future r e cessions were computed for the proposed 10 MGD pumpage. New pump bowls and additional pump columns were put in the exist ing wel ls , and the pumping was doubled without any new wells. The predictions of water levels in the pumped wells have been checked within five per cent; and we checked it 20 mi les away and found the difference between computed and actual drawdowns to be less than 15 per cent.
That is just one case. The paper mill people kept accurate records and they know exactly where they stand. They know how and where to get the water by putting wells here and here . They can decide from water level data how much to pump and what future levels will be.
There a r e other examples. At Camp Hood, Texas , we made pumping t e s t s and predict ions, and they checked the actual drawdowns after a year within three per cent.
The re a r e some places where computations cannot be made so accurately. The concept is right, but the geologic conditions a r e too complicated. Trying to apply simplified assumptions to a radi cally different set of geologic conditions is not a fair test. The accuracy of the predictions of drawdown will depend on the adequacy of the mathematical assumptions as compared to actual conditions.
81
DISCUSSION
JOHN H. BLISS. *—Mr. Guyton's paper p r e sents an excellent picture of the general situation regarding the availability and use of ground water in the United States and emphasizes the need for long-range p r o g r a m s for the collection of basic ground-water data.
As he states, excepting for local problem a reas , there is no over-all shortage of ground water in the country. In general, the average annual recharge of such basins is ample for withdrawal requirements. In some areas, however, he points out that recharge of ground water is so limited that reasonable use of the r e s o u r c e mus t contemplate actual mining of the available supply. This is true in many areas of the Southwest. In New Mexico, for example, r e charge of many of our ground-water areas is limited by inadequate rainfall, by surface geological formations which retard downward percolation of water or by a combination of circumstances. The limiting of pumping withdrawals to the safe annual recharge in such basins would probably place unreasonable r e s t r i c t i o n s upon the i r legi t imate development. Ground-water mining in such basins can and should be permitted, provided that reasonable safeguards a r e observed and provided that the water use rs fully understand that the supply is not inexhaustible but will be largely exhausted in a relatively limited number of years and plan their economy accordingly.
Mr. Guyton tells of a problem area he studied l as t spring near Deming, New Mexico, where the recharge was very limited in amount and where the available ground-water supply was being rapidly exhausted. His study showed that the economic supply under presen t draft would be largely gone in a ten- to fifteen-year period—and the local people were frankly informed of this condition. Incidentally, I had the pleasure of working with Mr. Guyton on this case . His findings in the mat te r were of . great ass is tance to the State in the solution of the part icular question at issue.
New Mexico has a ground-water law which per mits the State water official to administer and control development in any ground-water basin, s t ream ox reservoir, the boundaries of which are reasonably ascer ta inable . It is patterned after the surface-water code but necessarily departs from it in many details. The sections setting forth the powers and duties of the administrative official are general and permit that officer ra ther wide latitude in making specific rules and regulations for administration of the law.
In his paper , the author points out that legal control of ground-water resources cannot be ex-
*New Mexico State Engineer, Santa Fe, N. M.
pected to do the whole job. He a lso emphasizes that too s t r i c t control may well stifle legitimate development, whereas too weak control is useless . The wri ter feels that the New Mexico law (though not perfect by any means) will permit effective development of the several ground-water a reas of the state while giving reasonable protection to the prior w a t e r - r i g h t u s e r s in each basin who spent their t ime, effort and money in proving and developing its ground-water potentialit ies. The State has in every case encouraged prospecting and development of new ground-wate r a r e a s . Although the State Engineer has the authority to define and administer all ground-water bodies of the state, he has not in recent years assumed jurisdiction over any basin where investigation or the stage of the water supply development has not indicated that control was r e quired.
Unlike the users of surface waters , it is possible for la ter comers in a ground-water basin to take water from a fully or overappropriated basin without immediately affecting the long-established water-r ight use r s . This presents a considerable problem in ground-water administration because, though it might be legally proper to do so, it would be very difficult as a practical matter to force junior appropriators to cease their use of water after they had made considerable initial investments in their water projects, should subsequent studies and information show that such junior appropriators were jeopardizing the uses of prior water users .
In most of the nine basins now administered by the State Engineer, use of water beyond the dependable recharge of the basin has been permitted. The State Engineer has had to exerc ise considerable judgment in determining the extent of development which may be permitted in each basin and still p ro vide prior appropriators with reasonable protection required by law. One criterion which has been applied (and which is based upon the contractual life of federal reclamation projects) is that early water users in a basin should, as nearly as possible, be assured of a usable water supply of at least 40 years duration. Whether this is a satisfactory cri ter ion or not, time alone will tell. It is not necessar i ly a fixed one and can be changed, if necessa ry , if changed circumstances dictate that need.
Another problem of ground-water adminis t ration which has been hinted at in Mr. Guyton's paper is that of the interrelationship of ground and surface water supplies. In most states with ground-water laws, the two a r e cons idered as separa te water supplies for administrative purposes. And yet, in many many a r e a s , we know that there is a direct relationship between surface flows and the ground
82
w a t e r s within the s t r e a m va l ley . The author s t r e s s e s the need for adequate l o n g -
r a n g e b a s i c d a t a - c o l l e c t i n g p r o g r a m s and po in t s out that lack of adequate b a s i c information m u s t i n evi tably r e s u l t in fumbling, bad g u e s s e s , and i m p r o p e r d e v e l o p m e n t o f a v a i l a b l e s u p p l i e s . B a s i c ground-water data is somewhat analogous to s t r e a m -gaging r e c o r d s of s u r f a c e - w a t e r supp l i e s . In bo th c a s e s , adequate long- t ime r e c o r d s a r e e s s e n t i a l t o an ove r - a l l understanding of the p r o b l e m s .
The la t ter par t of Mr. Guyton's paper is d e v o t e d largely to the discussion of the Theis non-equ i l ib r ium theo ry . We in New Mex ico feel tha t we have been p a r t i c u l a r l y for tunate s ince Dr . T h e i s has b e e n in charge for the U. S. Geologica l Su rvey of g r o u n d water studies in the state s ince 1931, and was w o r k ing in the s t a t e a t the t i m e he deve loped h is n o n -equil ibr ium formula. I t has been through his a d v i c e and counsel as well as that of other Survey off icials s u c h as A. G. F i e d l e r a n d S . S . Nye , tha t New Mexico was enabled to m a k e the p r o g r e s s she h a s in the t e c h n i c a l a s p e c t s o f h e r g r o u n d - w a t e r a d m i n i s t r a t i o n . The The i s f o r m u l a for d e t e r m i n i n g the e f fec t o f p u m p a g e f r o m w e l l s in the s e v e r a l ba s in s of the s ta te has been invaluable in ana lyz ing the effect o f ex i s t i ng p r o g r a m s and h a s s e r v e d as an excel len t y a r d s t i c k in fo recas t ing the r e s u l t s of u l t i m a t e b a s i n d e v e l o p m e n t s .
In c l o s i n g , I want to e c h o M r . Guy ton ' s hope tha t the l a t e s t l i t e r a t u r e on t echn iques of a n a l y s i s of g r o u n d - w a t e r da ta , the a p p l i c a t i o n of the n o n -e q u i l i b r i u m f o r m u l a , da t a o n pumping t e s t p r o b l e m s and o the r in format ion m a y be c o r r e l a t e d and s tandardized in the not too d is tant future so tha t the o rd inary engineer or geologis t may be able to a p p l y them to ground-water a r e a s with reasonab le a s s u r ance of r e a c h i n g the r ight a n s w e r s . The n e e d for such a m a n u a l or book is ev ident .
H. T . CRITCHLOW. * — M r . Guyton h a s p r e p a r e d an i n t e r e s t i n g and c o m p r e h e n s i v e p a p e r on the a n a l y s i s and use of g r o u n d - w a t e r da ta . F r o m his s e r v i c e with the U. S. Geology Survey and as a consultant on ground-water p r o b l e m s , he has g iven us the benefi t of wide e x p e r i e n c e in t h i s f ield. He has deal t intel l igent ly with r e p o r t s and r u m o r s r e garding the s e r i o u s n e s s of the g round -wa te r s i t u a t ion t h r o u g h o u t the c o u n t r y . He r e c o g n i z e s tha t the p r o b l e m i s s e r i o u s in c e r t a i n l oca l i t i e s w h e r e o v e r p u m p a g e h a s c a u s e d dep le t ion i n the g r o u n d water level beyond the dependable yield of the r a t e of r echa rge and where the contaminat ion of the w a t e r s by sa l t -wa te r intrusion has occu r red .
In determining the total amount of ground w a t e r be ing used th roughout the United S t a t e s , he s t a t e s
*Director and Chief Engineer, New Jersey Division of Water Policy and Supply, Trenton, New Jersey .
t ha t t h i s u s e has t r i p l e d d u r i n g the p a s t 15 y e a r s f r o m 10 bi l l ion gallons p e r day in 1935 to 30 b i l l i on gallons pe r day at the p r e s e n t t i m e . I would q u e s t ion th i s r a t e o f g r o w t h f r o m my e x p e r i e n c e wi th g round-wa te r p rob lems in the E a s t . F o r e x a m p l e , in New J e r s e y the consumpt ion f r o m wells i s e s t i m a t e d t o b e a r o u n d 400 m i l l i o n g a l l o n s pe r day , of which about 175 MGD is by publ ic w a t e r supp ly s y s t e m s . The r e c o r d s a r e no t c o m p l e t e . I t i s general ly t r u e that the d ivers ion of water f rom p r i va te wel ls i s not a c c u r a t e l y m e a s u r e d in m o s t i n s tances ; there fore , many of the data a r e based upon e s t i m a t e s . This emphas i ze s the need for conduc t ing c o m p r e h e n s i v e i n v e n t o r i e s of the p r i v a t e w e l l owners and of urging them to keep accu ra t e r e c o r d s of t he i r w a t e r consumption. However , t h e r e i s no doubt that use of ground water has inc reased r a p i d l y -in recent y e a r s . This has r e s u l t e d f rom many f a c t o r s . Radica l improvemen t s in the cons t ruc t ion of the development of me thods of t r e a t m e n t of g round water to soften i t and r emove i ron and other o b j e c tionable m a t e r i a l s which m a y be p r e s e n t , have done t h e i r p a r t t o i n c r e a s e the quan t i ty and improve t h e quality. The demand for additional supplies of w a t e r in war and other e m e r g e n c i e s h a s added c o n s i d e r able impetus. The resul t has been a situation which t h r e a t e n s t h e deple t ion of t h e s e va luab l e g r o u n d water r e s o u r c e s and the poss ib le contaminat ion and l o s s by s a l t - w a t e r i n t r u s i o n and o the r s o u r c e s of pol lu t ion .
Dr . Guyton s t a t e s that l ega l con t ro l of the u s e of ground water is not the whole answer to the p r o b l e m of c o n s e r v i n g the s u p p l i e s . He e m p h a s i z e s that knowledge of the source and behavior of g round w a t e r i s m o s t i m p o r t a n t t o the p r o p e r so lu t ion . Fo r tuna t e ly , much work has been done along t h e s e l ines in cer ta in a r e a s and the r e s u l t s obtained shou ld encourage s imi la r studies in r eg ions where g r o u n d wate r p r o b l e m s a r e becoming s e r i o u s . The U. S . Geological Survey has been the l e a d e r in th is f ie ld . I t began i n v e s t i g a t i n g g r o u n d - w a t e r r e s o u r c e s of the c o u n t r y soon a f t e r i t s e s t a b l i s h m e n t in 1879. Its f i rs t r epo r t on the subject was published in 1885. In 1903 the Division of Hydrology was formed, which was l a t e r r e n a m e d the Div i s ion of Ground W a t e r . Funds for t h i s work w e r e m e a g e r for many y e a r s , but in 1929, as a r e s u l t of d e m a n d s by the s t a t e s for a id , C o n g r e s s i n c r e a s e d a p p r o p r i a t i o n s for g r o u n d - w a t e r i n v e s t i g a t i o n for u s e p r i m a r i l y i n cooperation with state, county and municipal g o v e r n m e n t s on a d o l l a r - f o r - d o l l a r b a s i s . As a r e s u l t , the D i v i s i o n of Ground W a t e r h a s c o o p e r a t e d for over 20 y e a r s with many of the s t a t e s on a c o o r d i na ted p r o g r a m which has f a v o r e d the d e v e l o p m e n t of an effective technique in t h i s highly s p e c i a l i z e d scientific field with i ts p r a c t i c a l appl ica t ions . A n o t h e r r e s u l t h a s been the s e l e c t i o n and i n t ens ive t ra ining of capable geologis ts , eng inee r s and p h y s i -
83
c i s t s in the f ield. As a r e s u l t of q u e s t i o n n a i r e s sen t to a l l s t a t e
w a t e r agencies by the leaders of this conference, r e p l i e s to date from 26 s ta tes show that 23 of t hem c o opera te with the U. S. G. S. on g round-wate r s t u d i e s . A few brief s ta tements about the exper ience in New J e r s e y , I think, wil l e m p h a s i z e the i m p o r t a n c e of ba s i c data in endeavoring to deal with g r o u n d - w a t e r p r o b l e m s .
I n v e s t i g a t i o n a l w o r k in New J e r s e y began in 1923 and has continued without in te r rup t ion to da t e . F r o m the beginning, this was ca r r i ed on in c o o p e r a t ion with the U. S. G. S . , under the s p o n s o r s h i p of the State Water Supply Commiss ion and i t s s u c c e s s o r s in name due to seve ra l reorganiza t ions of s t a t e agencies—since 1945 it has been under the Divis ion of W a t e r P o l i c y and Supply of the D e p a r t m e n t of Conse rva t ion and Economic Deve lopment . During t h i s pe r i od of 28 y e a r s , f ield i n v e s t i g a t i o n s have been conducted in ten selected a r e a s within the s t a t e , for the main purpose of de t e rmin ing as fa r as p o s s ib le the dependable yield of the w a t e r - b e a r i n g f o r mat ions and the source of sa l t -wa te r contamina t ion . T h e t o t a l funds e x p e n d e d t o J u n e 30, 1951, was a b o u t $490 , 000 by the S ta te and F e d e r a l g o v e r n m e n t s , and for the c u r r e n t f i s c a l y e a r $49 , 000 h a v e been a p p r o p r i a t e d . The field i n v e s t i g a t i o n s i n c l u d e the o p e r a t i o n of 265 w a t e r - l e v e l s t a t ions and 153 w a t e r - s a m p l i n g s ta t ions for ch lor ide a n a l y s e s . The w a t e r - l e v e l s t a t ions c o m p r i s e 84 cont inuous r e c o r d e r s , 40 pe r iod ic (monthly) , and 164 occasional (quarterly) measu remen t s of water l eve l s in observation wells in the a r e a s under stu'dy. Many of t h e s e wel ls have been d r i l l e d e s p e c i a l l y for o b se rva t ion in se lec ted loca t ions . Pumping t e s t s a r e conducted to obse rve yield, drawdown, cone of d e p r e s s i o n , in te r fe rence with neighboring we l l s , and o the r per t inent data . Logs of geologic f o r m a t i o n s , inc lud ing s a m p l e s of m a t e r i a l s , a r e ob ta ined and c o r r e l a t e d . S a m p l e s o f w a t e r a r e c o l l e c t e d for c o m p l e t e c h e m i c a l a n a l y s e s , e s p e c i a l l y f rom new w e l l s , and t h o u s a n d s o f s a m p l e s have been t aken f r o m wells along the coas t for chloride a n a l y s e s to obtain advance notice on the approach of sa l t w a t e r .
A n o t h e r v e r y p r a c t i c a l u s e of the r e s u l t s of t h e s e i n v e s t i g a t i o n s i s t o a s s i s t the W a t e r Po l i cy and Supply Council in the adminis t ra t ion of the l aws on the cont ro l of ground w a t e r s . This con t ro l h a s b e e n cont inued s i n c e 1910, when a law o r i g i n a l l y p a s s e d in 1907 regu la t ing the d i v e r s i o n of su r face w a t e r s for publ ic use was a m e n d e d to extend the ju r i sd ic t ion over d ive r s ion f rom-wel l s , s u b s u r f a c e and perco la t ing w a t e r s . Under th i s l eg i s la t ion the State agency a l loca tes new or addit ional s o u r c e s of wa te r supply, upon application and after publ ic h e a r ing. The applicant is r e q u i r e d to show (1) whe ther the plans proposed a r e justified by public n e c e s s i t y ; (2) w h e t h e r they p r o v i d e for the p r o p e r and safe c o n s t r u c t i o n of a l l w o r k s connected t h e r e w i t h ; (3)
whether they provide for the p r o t e c t i o n of the s u p ply and the w a t e r s h e d f rom c o n t a m i n a t i o n o r p r o v ide for t h e p r o p e r t r e a t m e n t of s u c h supp ly ; (4) whether the reduct ion of the d ry s e a s o n flow of any s t r e a m will occur to an extent l ikely to p roduce uns a n i t a r y condit ions or o the rwise in ju re publ ic and p r i v a t e i n t e r e s t s ; (5) w h e t h e r t h e p l a n s a r e j u s t and equi tab le to the o the r m u n i c i p a l i t i e s and civi l d i v i s i o n s of the Sta te a f fec ted t h e r e b y a n d to the inhabi tants thereof, p a r t i c u l a r c o n s i d e r a t i o n be ing g iven t o t h e i r p r e s e n t and fu tu re n e c e s s i t i e s for s o u r c e s of wa te r supply.
F o r forty y e a r s of opera t ion of t h e s t a t u t e s on control of wa te r s for public and potable use in New J e r s e y , t h e r e was n o Sta te c o n t r o l o v e r p r i v a t e wel ls for indus t r i a l , c o m m e r c i a l , o r o ther p r i v a t e u s e s . Pub l i c supp l i e s w e r e thus s u b j e c t t o u n r e - s
s t r i c t e d i n t e r f e r e n c e b y p r i v a t e w e l l s t h a t m i g h t be cons t ruc t ed and ope ra t ed within t h e i r s p h e r e of influence. Fo r ten or m o r e y e a r s rel ief was sought t h r o u g h l e g i s l a t i o n . F i n a l l y , in 1947, a law was enacted giving the State agency au thor i ty to r e g u l a t e the divers ion of subsurface and pe rco la t ing w a t e r s of the s ta te for domes t ic , indus t r ia l and o the r u s e s . The law p r o v i d e s :
1 . The D e p a r t m e n t s h a l l d e l i n e a t e f r o m t ime to t ime such a r e a s of the s ta te where d i v e r s i o n of s u b s u r f a c e and p e r c o l a t i n g w a t e r s e x c e e d s or t h r ea t ens to exceed, o r o therwise t h r e a t e n s o r i m p a i r s , the n a t u r a l r e p l e n i s h m e n t o f s u c h w a t e r s .
2 . In a r e a s so de l i nea t ed no such w a t e r s s h a l l h e r e a f t e r be d i v e r t e d in e x c e s s of 100, 000 gpd. for any p u r p o s e wi thout ob ta in ing a p e r m i t . Such p e r m i t m a y be r e f u s e d o r , i f g r a n t e d , m a y inc lude such s t i p u l a t i o n s a s m a y b e n e c e s s a r y t o conserve such wa te r s of the s ta te and p r e v e n t t h e i r exhaus t ion .
3 . Any r e f u s a l to g r a n t a p e r m i t sha l l be s u b j e c t t o r e v i e w by the S u p r e m e C o u r t , both a s to ques t ion of law and fact .
4 . Any p e r s o n , co rpo ra t i on or agency d i ve r t i ng in e x c e s s of 100,000 ga l lons p e r day f rom s u c h s o u r c e s s h a l l have the p r i v i l e g e of con t inu ing to t ake f r o m the s a m e s o u r c e the quan t i ty o f wa te r which is the r a t e d capaci ty of the e q u i p m e n t a t tha t t i m e used for such water d i v e r s i o n .
Under this law, p a s s e d in 1947, four p r o t e c t e d a r e a s h a v e b e e n e s t a b l i s h e d w h e r e i n v e s t i g a t i o n of g round-wate r condit ions and expe r i ence of u s e r s h a s r e q u i r e d the e s t a b l i s h m e n t o f c o n t r o l a s p r o vided by the law.
The d e m a n d s on g r o u n d - w a t e r supp ly for in dus t r i a l , municipal , ag r i cu l tu ra l and d o m e s t i c p u r p o s e s a r e g rowing out of a l l p r o p o r t i o n to the inc r e a s e in populat ion. T h a t i s p a r t i c u l a r l y t r u e in our own s ta te . As p rev ious ly s ta ted , the e n l a r g e d demand has been due pr inc ipa l ly to me thods of wel l construct ion, deep-wel l equipment , which h a s been des igned and buil t , efficiency of pumps and m o t o r s
84
and lower power rates. Rapid growth in the use of air-conditioning equipment in many cities is inc reas ing the draft on wells and overloading drainage s y s tems. This situation is bringing about the passage of laws and regulations to require the conservation of ground water by recirculating it through cooling devices or returning it to the ground through r e charge wells.
The need for more scientific knowledge about the occurrence and. movement of ground water is vital to a satisfactory solution of dependable yield, interference, contamination, and other problems. The p rogram inaugurated by the U. S. G. S. in cooperation with the states and other local agencies has been of great help in the economic development of ground-water r e s o u r c e s . Whether the states ca r ry on investigational work in cooperation with the federal agency or through their own efforts is a matter for each to decide for itself. The important thing is to do it in a scientific and continuing manner. Research is the foundation of technical progress and pays large dividends. As increased demands a r e made upon ground-water r e sou rces , reasonable legal control by a state agency based on scientific knowledge and experience would seem to be the best solution of this important problem.
H. A. SPAFFORD. *—I want to commend Mr. Guyton on this very splendid paper and his s t raightforward and practical presentation, describing some of the tools we can use in arr iving at the solution of some of our ground-water development problems. The Illinois State Water Survey is utilizing these tools to help a lot of us a r r i v e at some of the answers we need to have. The Survey has been of great assistance, in applying these basic tools and in t e rp re t ing data , to many of us, in a r r iv ing at some equitable answers in the development of public ground-water supplies in this state.
There a r e approximately 1100 incorporated municipal i t ies in Illinois and at the present t ime about 750 have public water supplies. Approximate ly t w o - t h i r d s of t h e s e have been developed utilizing ground-water sou rces . There a re still approximately 350 incorporated communities that do not-have public water supplies. These range in population from a few villages having under 100 people to a maximum of one city having slightly over 1000 people without public water supply facilit ies. The major i ty of these potential communities yet remaining without public water supplies are located in what some of us choose to t e rm "lean" groundwater a r e a s , or where wa te r s may be so highly mine ra l i zed as to be unusable and economically untreatable by our present known methods. In spite
*Sanitary Engineer, Illinois State Department of Public Health, Springfield, Illinois.
of this , we a re sti l l developing new public water supplies within this state. We a re averaging about 10 every year and that average has been fairly consistent over the las t 20 y e a r s . In the last three years.39 new public water supplies were developed; about one half were in lean ground-water a r e a s . The State Water Survey has ass is ted , and my depar tment has been very grateful for this help, in the development of these new public supplies, p a r ticularly in these lean a reas .
Often some of these supplies a re developed from wells, that some of you would term "piddling, " at production rates of 15 or 20 gallons per minute, or less. One supply developed about one year ago for 450 people utilizes five wells , each producing 6 gallons per minute. Another town will place in operation, in a few months, wells producing at ra tes of 5 or 6 gallons per minute . These part icular wells obtain water from a relatively shallow sandstone. The pump tail pipes are to be set no deeper than the top of the water-bearing formation so they cannot be pumped below the top of the producing formation. It is interest ing to note that on these wells the dril ler reported a yield of 15 gallons per minute for periods of 24 hours, but later when the State Water Survey made carefully controlled t e s t s on them, they evaluated the safe long-time p r o duction r a t e at 6 gallons per minute. One of the things I want to s t ress is the fact that in these lean ground-water areas, we have to accept the situation that they a r e lean. We cannot attack the problem with the idea we are going to have to develop wells capable of delivering 100 or 200 or 1,000 gallons per minute. Development of public supplies is most impor tant to those smal l communit ies who have limited economic means to provide them. The re fore it is essent ia l that we cut corners as far as necessary within reasonable l imits, to make it pos sible for them to provide supplies so important to their well-being and growth.
We t ry to be both practical and reasonably conservative, in our design standards, for these small communities. Usually we use a minimum-per-capita design basis of about 50 gallons per person per day. I realize that most of you have been thinking of 100 gallons per capita per day or more . Our studies show tha t t he se small communities without indust r i e s , r a r e ly use more than 50 gallons per capita per day.
Some supplies have been developed from shallow sand and gravel deposits, subject to local recharge. In these instances we want these pockets proved by test drilling and pumping so we a re sure there will be a minimum of six months' supply available to tide over a drought period, which is about the maximum length of drought period experienced in Illinois. It may be shorter or longer in other areas .
T h e r e is another tool, I do not believe Mr. Guyton mentioned, that has been very valuable in
85
Illinois. That is the use of electrical earth r e s i s tivity surveys. In local sands and gravels that may be water-bearing, these surveys have made it possible to eliminate much unnecessary blind drilling of t e s t holes . Some ext remely valuable groundwater resources have been located in this manner and the number of test holes in these areas has been g rea t ly reduced, by the use of ear th resist ivi ty surveys.
E. W. BENNISON. *—Dr. Guyton's paper was very fine; it brought us up-to-date on the theory. I have been connected with the pract ical aspects , using what theory was available. The question that came to my mind is the limited application of that to the pract ical problems of the day. I have d is cussed these methods with men practicing in the field. There is a problem of getting these methods applied. We see ground-water developments being made every day which are generally economic propositions. We see the engineers of the country faced with developing more water quickly and cer tainly little use made of such formulas like those Dr. Guyton gave. I would like to know how to bring the theory and practice together.
*Edward E. Johnson, Inc., St. Paul, Minnesota.
W. F. GUYTON. —Certainly no one knows any more about the p rac t ica l developments than Mr. Bennison. Most of you have seen his book and lit-e ra tu re .
These formulas a re pract ical , providing you can meet the assumptions on which you make your computations. They do not help you build a well. That is another part of the problem. If we can work out the geology to put into the formulas, the theory will predict the amount of well interference over a period of years .
We have had more success in the widespread formations in the South, the formations that occur over a good many miles under conditions that are more or less uniform. In south Texas, over a d istance of 20 miles, we consider the predictions accurate enough. When you come here to another type of geology, it may be harder to use this method.
All the work in this field is still in a state of experiment, but every year we get a little closer . It has become evident to me, however, that a knowledge and appreciation of the non-equilibrium theory is of the utmost value in understanding the data we collect in everyday developments, so that we can make these developments more economical and dependable.
Surface w a t e r s p lay an i n c r e a s i n g l y i m p o r t a n t r o l e i n A m e r i c a . R i v e r s a r e d a m m e d for w a t e r supply and i r r i g a t i o n s y s t e m s and for the g e n e r a tion of power. Navigat ion channels a r e m a i n t a i n e d over many par ts of the country. Flood control w o r k s a r e built , but the menace of devasta t ing floods cont i nues i n m a n y a r e a s . S t r e a m pol lut ion i s a l l e v i a t ed b y s u p p l e m e n t a r y low r i v e r flows f rom r e s e r v o i r s . In the p r o p o s e d Incode l p r o j e c t for the De laware R ive r , m o r e than one half of the s t o r a g e is intended to improve the water quality d o w n s t r e a m and to p r even t the e n c r o a c h m e n t of sa l t wa te r f r o m Delaware Bay.
S t r eam flow is n e v e r constant , and to a c e r t a i n e x t e n t i t is u n p r e d i c t a b l e . The m e a n runoff of a s t r e a m i s i t s m o s t i m p o r t a n t c h a r a c t e r i s t i c . I t r e p r e s e n t s the max imum quanti ty of wa te r tha t t h e o r e t i c a l l y can be d e v e l o p e d . In p r a c t i c e , w o r k s can n e v e r be buil t to u t i l i ze fully the m e a n runoff. Evapora t i on and t r a n s p i r a t i o n l o s s e s a r e unavoidab le , and l a r g e flood flows a r e not often fully u t i l ized . Most s u r f a c e - w a t e r d e v e l o p m e n t s a r e d e s igned to equa l ize the flows of a r i v e r — t o r e d u c e the p e a k s and t o i n c r e a s e the d r y w e a t h e r f lows. S t r e a m - f l o w r e c o r d s a n d a n a l y s e s a r e n e e d e d t o plan proper ly the construct ion and operat ion of such w o r k s .
The r ap id growth in su r f ace w a t e r w o r k s h a s b r o u g h t a b o u t a l a r g e i n c r e a s e in the n u m b e r of p e r s o n s engaged in h y d r o l o g i c a l a n a l y s i s , and in the volume of data avai lable . E a r l i e r i n v e s t i g a t o r s had only l imited data to work with and were obliged to develop m e a n s for extending ava i lab le i n f o r m a t ion . Many e s t i m a t e s w e r e a p p r o x i m a t e a t b e s t . The inadequacy of s o m e h a s been p r o v e d t i m e and aga in by the fa i lu re of d a m s dur ing h igh floods or the lack of water dur ing extended d r y s e a s o n s . (It should be noted, however, that many sho r t ages have been due not t o i m p r o p e r e s t i m a t e s but r a t h e r t o a f a i lu re to build add i t iona l w o r k s in t i m e to m e e t r i s i n g w a t e r d e m a n d s . )
* Consulting Engineer, New York, N. Y.
Most s t r e a m - f l o w a n a l y s e s a r e m a d e i n o r d e r t o e s t i m a t e fu ture f lows. P a s t flows a r e not i m por tan t except as a guide to what may happen in the f u t u r e . N o r m a l l y , w e a s s u m e tha t f u tu r e flows will follow the pa t tern of the past . Fo r mos t p r a c t i ca l p r o b l e m s t h i s i s a fa i r a s s u m p t i o n , a l though l o n g - t e r m changes in the w e a t h e r , including t e m p e r a t u r e and r a i n f a l l , and in s u r f a c e runoff, a r e r e c o g n i z e d .
S tud ies by the U. S. Geo log i ca l S u r v e y ind i cate a gradual decline in the rainfall and runoff over m u c h of the M i s s o u r i R i v e r B a s i n dur ing the pa s t seventy years . The long- te rm rainfall t r end at four s e l e c t e d s ta t ions is shown on F i g u r e 30. The t e n dency may be r e v e r s e d within a shor t t ime , and the length and f r equency of wet and d r y s p e l l s cannot be p red ic t ed a c c u r a t e l y on the b a s i s of c y c l e s . As our r e c o r d s extend over m u c h longer p e r i o d s , the laws governing t h e s e cyc les m a y become a p p a r e n t , and i t i s p o s s i b l e t ha t a d e q u a t e e x p l a n a t i o n s will be developed even without the benefit of s u c h data.
The design of eng ineer ing works is r a r e l y affected by changes in runoff to be expec ted s e v e r a l hundred y e a r s hence . Modera te a l lowances to take c a r e o f c h a n g e s t h a t m a y d e v e l o p wi th in s h o r t e r per iods normally will suffice. Where data a r e a v a i l able for only a s h o r t p e r i o d , say twenty or t h i r ty y e a r s , i t i s i m p o r t a n t to know whe the r or not the r e c o r d r e f l e c t s a r e l a t i v e l y wet o r r e l a t i v e l y d r y per iod, and if ex t remely high and low flows occurred dur ing the p e r i o d of r e c o r d . T h i s usua l ly can be e s t a b l i s h e d qua l i t a t i ve ly , if not quan t i t a t ive ly , by the study of the longest rainfall r e c o r d s in the v ic in ity. Gene ra l ly , s t r e a m - f l o w and ra infa l l da ta a r e inadequate for a c c u r a t e e s t i m a t e s of runoff on the b a s i s of r a i n f a l l . In the e a s t e r n and m i d w e s t e r n Uni ted Sta tes the y e a r s 1930-32 and 1939-42 were unusua l ly d ry . F r o m l o n g - t e r m ra in fa l l r e c o r d s the t w e l v e - y e a r p e r i o d 1930-41 i s c o n s i d e r e d the d r i e s t to be expec t ed in the upper M i s s o u r i R iver val ley over a s m u c h a s t h r e e hundred y e a r s . R e ga rd l e s s of the exact frequency, i t is safe to a s s u m e that t h e s e d ry p e r i o d s d o r e p r e s e n t e x t r e m e condi t ions; thus , even re la t ive ly shor t r e c o r d s m a y be
87
ANALYSIS AND USE OF SURFACE WATER DATA
BY RICHARD HAZEN*
WITH DISCUSSIONS BY E. F. BRATER, W. D. MITCHELL, AND C. V. YOUNGQUIST
NEED FOR S U R F A C E WATER DATA AND ANALYSIS
EFFECT OF CHANGED CONDITIONS ON RUNOFF RECORDS AND
PROBABLE ACCURACY
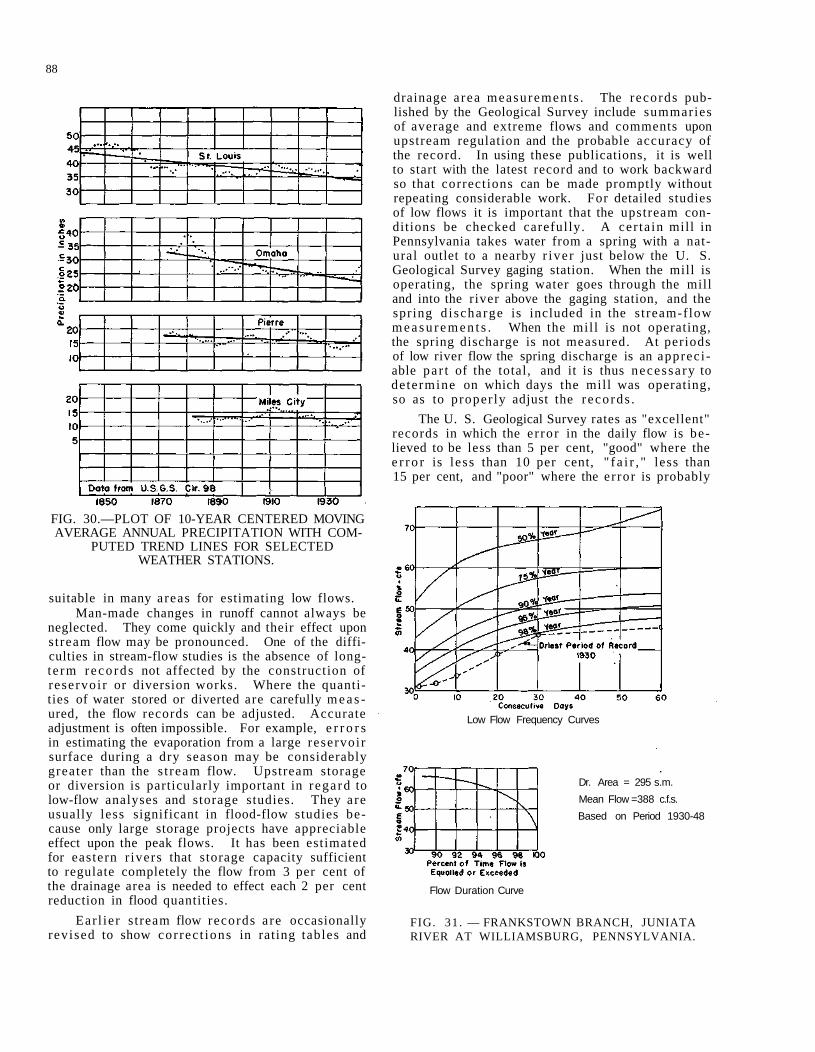
88
FIG. 30.—PLOT OF 10-YEAR CENTERED MOVING AVERAGE ANNUAL PRECIPITATION WITH COM
PUTED TREND LINES FOR SELECTED WEATHER STATIONS.
suitable in many areas for estimating low flows. Man-made changes in runoff cannot always be
neglected. They come quickly and their effect upon s t ream flow may be pronounced. One of the difficulties in stream-flow studies is the absence of long-te rm r eco rds not affected by the construction of reservoi r or diversion works. Where the quantities of water stored or diverted are carefully m e a s ured, the flow records can be adjusted. Accurate adjustment is often impossible. For example, e r r o r s in estimating the evaporation from a large reservoir surface during a dry season may be considerably greater than the s t ream flow. Upstream storage or diversion is particularly important in regard to low-flow analyses and storage studies. They are usually less significant in flood-flow studies because only large storage projects have appreciable effect upon the peak flows. It has been estimated for eastern r ivers that storage capacity sufficient to regulate completely the flow from 3 per cent of the drainage area is needed to effect each 2 per cent reduction in flood quantities.
Ear l ier s tream flow records are occasionally revised to show correc t ions in rating tables and
drainage a rea measurements . The records published by the Geological Survey include summaries of average and extreme flows and comments upon upstream regulation and the probable accuracy of the record. In using these publications, it is well to start with the latest record and to work backward so that correct ions can be made promptly without repeating considerable work. For detailed studies of low flows it is important that the upstream conditions be checked carefully. A cer ta in mill in Pennsylvania takes water from a spring with a natural outlet to a nearby r ive r just below the U. S. Geological Survey gaging station. When the mill is operating, the spring water goes through the mill and into the river above the gaging station, and the spring d ischarge is included in the s t ream-flow m e a s u r e m e n t s . When the mil l is not operating, the spring discharge is not measured. At periods of low river flow the spring discharge is an appreci able pa r t of the total, and it is thus necessa ry to determine on which days the mill was operating, so as to proper ly adjust the r ecords .
The U. S. Geological Survey rates as "excellent" records in which the e r ror in the daily flow is believed to be less than 5 per cent, "good" where the e r r o r is less than 10 per cent, " f a i r , " less than 15 per cent, and "poor" where the er ror is probably
Low Flow Frequency Curves
Dr. Area = 295 s.m. Mean Flow =388 c.f.s. Based on Period 1930-48
Flow Duration Curve
FIG. 31. — FRANKSTOWN BRANCH, JUNIATA RIVER AT WILLIAMSBURG, PENNSYLVANIA.
89
more than 15 per cent. In general, the records of monthly and yearly mean discharge are more accurate than the daily record, since the e r r o r s in the daily measurements tend to offset one another. The probable accuracy of the stream-flow data under analysis should be evaluated before any tedious detailed studies are undertaken. A particular warning is made against the use of the difference between daily measurements on the same s t ream in order to estimate the inflow between the two gages. Obviously, if the readings at one station are consistently high and at the other station consistently low, the calculated difference may be far from the truth. Flood flows are hard to estimate accurately at many s tat ions, and the r e c o r d s may be in e r r o r by as much as 25 or 50 per cent.
LOW FLOW STUDIES
In m o s t surface water s tudies we a re in ter ested in extreme flows—either dry weather flows that need to be augmented or flood flows that need to be curtai led or re leased without damage. The flow character is t ics of a r iver a re often indicated by means of a flow duration curve, usually prepared from the daily flows over the whole period of record. If the investigation is l imited to low flows, it is neces sa ry to plot only the lower end of the curve and the volume of work to be done is greatly r e duced. Figure 31 includes the lower end of a duration curve showing the flows exceeded 90 per cent of the t i m e , or more , in the Frankstown Branch of the Juniata River at Williamsburg, Pennsylvania.
The duration curve shows the runoff characteris t ics of a s t ream and how often flows of various magnitudes can be expected. Even within a r ea s of substantially the same rainfall the runoff pattern may vary widely, depending to a large extent upon the topography and natural ground storage. Thus, for example, the low flows of the Mad River in Ohio are relatively much greater than the low flows of the Hocking River. In some par ts of the country there is little or no natural ground storage, and the r ive r s d ry up entirely for weeks at a t ime. The Division of Water in the State of Ohio, with the cooperation of the U. S. Geological Survey, has p r e pared duration curves for all of the longer records in the state. The flow, exceeded 90 per cent of the time, has been designated as the "index of flow." For the Hocking River at Athens the index is 0. 088 c. f. s. per square mile; for the Mad River at Springfield the index is 0. 340 c. f. s. per square mile. The "index of flow" shows quickly whether a s t ream has relatively large or small ground storage.
A duration curve of daily flows does not indicate how the days of low flow were arranged, and whether or not they were interrupted by freshets . Thirty consecutive days during which stream flows averaged 50 c . f . s . may be of greater practical significance
than thirty days with daily flows less than 50 c. f. s. distributed over several months. Extreme low flow conditions may be shown by plotting the driest week, the driest thirty days, etc. The preparation of such graphs is laborious for s t reams with long records because there may be severa l periods of almost equal dryness, and the driest cannot be determined without studying each period in detail. F u r t h e r more , the dr ies t consecutive data do not tell how often periods of the same or nearly the same intensity occur, frequently an important consideration in water supply, hydroe lec t r i c power, and s t r eam pollution investigations.
A combination of the duration curve and the driest consecutive plotting can be obtained by subjecting the d r i e s t consecutive data for each year to a probability or s ta t is t ical analysis . The r e sults of such an analysis for the Frankstown Branch are shown on Figure 31. The lowest curve r e p r e sents the driest period of record, which corresponds very nearly to the 98 per cent condition. The record is not long and the probability plottings a r e fairly i r r egu la r . The curves shown on Figure 31 have been smoothed out to show the general trend. The analysis descr ibed above st i l l does not show the effect of two or more extremely dry periods within the same year . However, except in the event of unusual ups t ream regulation or flash floods, the lowest flows usually occur in the same general period, toward the end of a long dry spell.
STORAGE RESERVOIRS
Storage requirements a r e usually determined from m a s s d iagrams or by a r i thmet ic using the runoff data direct ly. Mass d iagrams of daily or monthly flows are used. The daily plotting resul ts in slightly greater storage requi rements , but the difference is not large for relatively high developments involving large storage with a ca r ry -over of a year or m o r e . Sometimes d iagrams of the cumulative monthly deviations from the mean flow are used. This plotting is par t icular ly helpful in showing long-term tendencies. A mass diagram of s t r e a m flows cannot be used conveniently for estimating storage needed to maintain flows low in relation to the mean flow. Either the scale is too small to take off the storage quantities accurately, or if the scale is made large enough, the diagram becomes too bulky. In this respect a diagram of the cumulative deviations from the mean is p refer able, and frequently a hydrograph of flows will give the answer as quickly as any other method. In general , plotting the data is desirable because if calculations are made directly from the runoff tables , e r r o r s are more likely to go unnoticed.
As the stream flow records become longer, the tendency is to estimate more and more the storage requirements upon the driest period of record. If
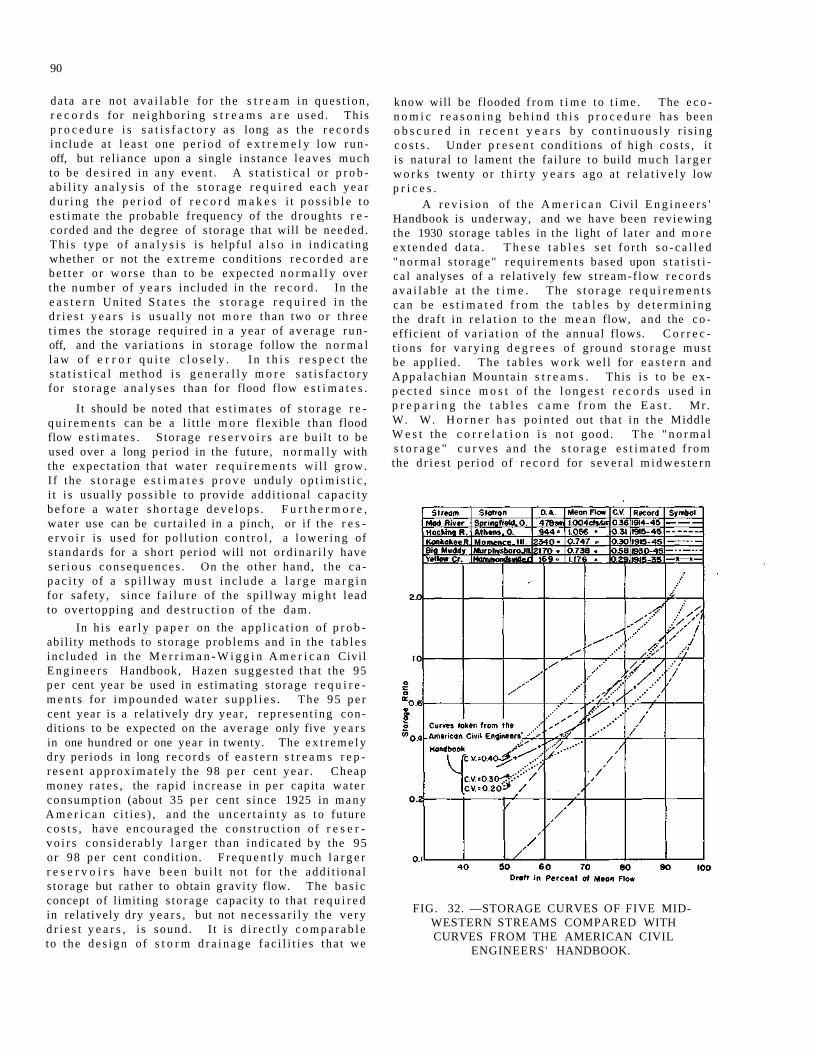
90
data a r e not a v a i l a b l e for the s t r e a m in ques t ion , r e c o r d s for n e i g h b o r i n g s t r e a m s a r e u s e d . This p r o c e d u r e i s s a t i s f a c t o r y a s long a s the r e c o r d s inc lude a t l e a s t one p e r i o d of e x t r e m e l y low r u n off, but re l iance upon a single ins tance l eaves much to be d e s i r e d in any event . A s t a t i s t i c a l or p r o b ab i l i t y a n a l y s i s o f t h e s t o r a g e r e q u i r e d e a c h y e a r d u r i n g the p e r i o d o f r e c o r d m a k e s i t p o s s i b l e t o e s t ima te the probable frequency of the d roughts r e corded and the degree of s torage that will be needed . Th i s type of a n a l y s i s i s helpful a l s o in ind ica t ing whether or not the e x t r e m e conditions r e c o r d e d a r e b e t t e r o r worse than to be expec ted n o r m a l l y over the number of y e a r s included in the r e c o r d . In the e a s t e r n Uni ted S t a t e s the s t o r a g e r e q u i r e d in the d r i e s t y e a r s i s u sua l ly not m o r e than two o r t h r e e t i m e s the storage requ i red in a year of ave rage r u n off, and the va r ia t ions in s to rage follow the n o r m a l l a w o f e r r o r q u i t e c l o s e l y . I n t h i s r e s p e c t the s t a t i s t i c a l me thod i s g e n e r a l l y m o r e s a t i s f a c t o r y for s t o r age a n a l y s e s than for flood flow e s t i m a t e s .
It should be noted that e s t i m a t e s of s t o r a g e r e q u i r e m e n t s can be a l i t t le m o r e f lexible than flood flow e s t i m a t e s . S torage r e s e r v o i r s a r e bu i l t to be used over a long per iod in the future, n o r m a l l y with the expecta t ion that wa te r r e q u i r e m e n t s wi l l g row. I f the s t o r a g e e s t i m a t e s p r o v e unduly o p t i m i s t i c , i t i s usual ly poss ib l e to provide addi t ional c apac i t y be fo re a w a t e r s h o r t a g e d e v e l o p s . F u r t h e r m o r e , water use can be cur ta i led in a pinch, or if the r e s e r v o i r is used for pol lu t ion c o n t r o l , a l ower ing of s tandards for a shor t period will not o rd ina r i l y have s e r i o u s consequences . On the o ther hand, the c a p a c i t y of a s p i l l w a y m u s t i nc lude a l a r g e m a r g i n for safety, s ince f a i l u r e of the sp i l lway m i g h t lead to overtopping and d e s t r u c t i o n of the dam.
In h i s e a r l y p a p e r on the app l i ca t i on of p r o b abil i ty methods to s torage prob lems and in the t a b l e s inc luded in the M e r r i m a n - W i g g i n A m e r i c a n Civil E n g i n e e r s Handbook, Hazen s u g g e s t e d tha t the 95 p e r cent year be used in es t imat ing s torage r e q u i r e m e n t s for impounded w a t e r s u p p l i e s . The 95 p e r cent year is a relat ively dry year , r ep re sen t ing conditions to be expected on the average only five y e a r s in one hundred or one year in twenty. The e x t r e m e l y d r y periods in long r e c o r d s of e a s t e r n s t r e a m s r e p r e s e n t a p p r o x i m a t e l y the 98 p e r cent y e a r . Cheap money r a t e s , the rapid inc rease in pe r capita wa te r consumpt ion (about 35 p e r cent s ince 1925 in m a n y A m e r i c a n c i t i e s ) , and the u n c e r t a i n t y a s to future c o s t s , have encouraged the cons t ruc t i on of r e s e r v o i r s c o n s i d e r a b l y l a r g e r than ind ica ted by the 95 or 98 pe r cent condit ion. F r e q u e n t l y m u c h l a r g e r r e s e r v o i r s h a v e b e e n bu i l t not for t h e add i t iona l s torage but ra ther to obtain gravi ty flow. The b a s i c concept of l imiting s to rage capaci ty to that r e q u i r e d in relat ively dry y e a r s , but not n e c e s s a r i l y the v e r y d r i e s t y e a r s , i s sound. I t i s d i r e c t l y c o m p a r a b l e to the d e s i g n of s t o r m d r a i n a g e f a c i l i t i e s tha t we
know will be flooded f rom t i m e to t i m e . The e c o n o m i c r e a s o n i n g b e h i n d t h i s p r o c e d u r e h a s been o b s c u r e d i n r e c e n t y e a r s b y c o n t i n u o u s l y r i s ing c o s t s . Under p r e s e n t condi t ions of h igh c o s t s , i t i s na tura l to lament the fa i lure to build m u c h l a r g e r w o r k s twenty o r t h i r t y y e a r s ago a t r e l a t i v e l y low p r i c e s .
A r e v i s i o n of the A m e r i c a n Civil E n g i n e e r s ' Handbook is underway, and we have been rev iewing the 1930 storage tab les in the light of l a te r and m o r e e x t e n d e d d a t a . T h e s e t a b l e s s e t fo r th s o - c a l l e d " n o r m a l s torage" r e q u i r e m e n t s based upon s t a t i s t i ca l analyses of a re la t ively few s t ream-f low r e c o r d s a v a i l a b l e a t t h e t i m e . The s t o r a g e r e q u i r e m e n t s can be e s t i m a t e d f r o m the t a b l e s by d e t e r m i n i n g the draf t in r e l a t i o n to the m e a n flow, and the c o efficient of va r i a t i on of the annual flows. C o r r e c t i o n s for v a r y i n g d e g r e e s of ground s t o r a g e m u s t be appl ied . The t a b l e s w o r k wel l for e a s t e r n and Appa lach ian Mounta in s t r e a m s . This i s to be e x p e c t e d s i n c e m o s t o f the l o n g e s t r e c o r d s used in p r e p a r i n g the t a b l e s c a m e f r o m the E a s t . Mr . W. W. H o r n e r h a s p o i n t e d out tha t in the Middle W e s t the c o r r e l a t i o n i s no t good. T h e " n o r m a l s t o r a g e " c u r v e s and the s t o r a g e e s t i m a t e d f rom the d r i e s t per iod of r e c o r d for s e v e r a l m i d w e s t e r n
FIG. 32. —STORAGE CURVES OF FIVE MIDWESTERN STREAMS COMPARED WITH CURVES FROM THE AMERICAN CIVIL
ENGINEERS' HANDBOOK.
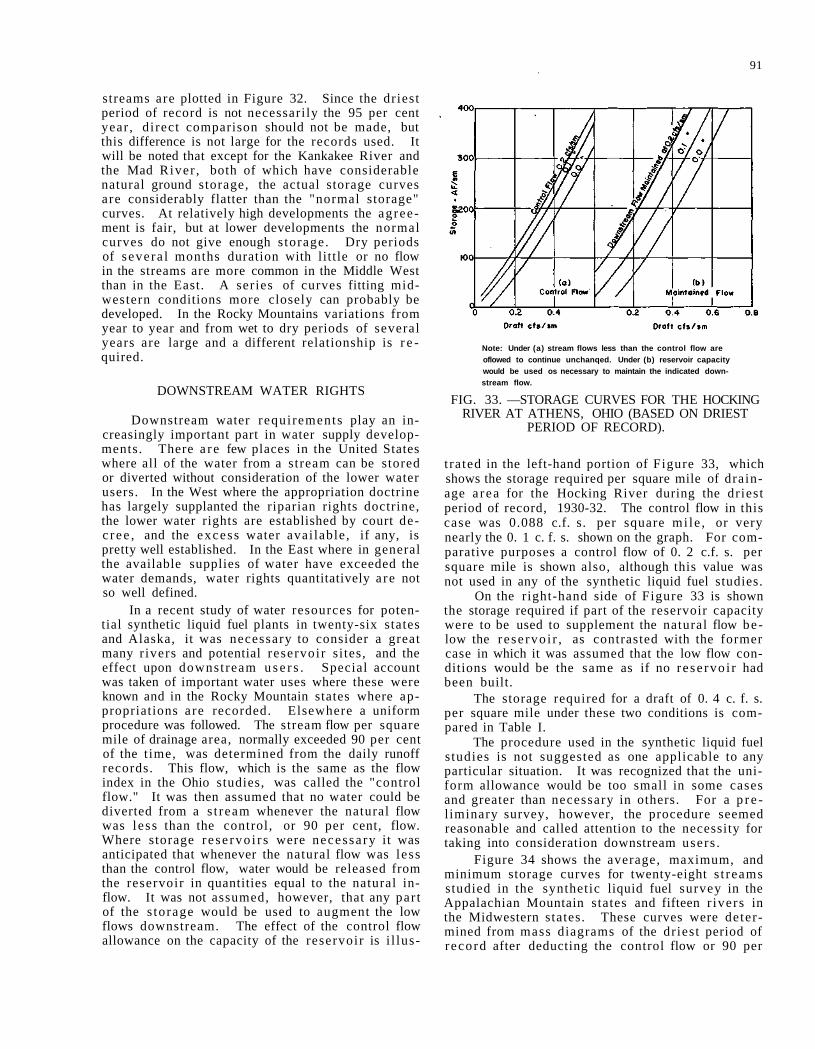
91
streams are plotted in Figure 32. Since the driest period of record is not necessarily the 95 per cent year , di rect comparison should not be made, but this difference is not large for the records used. It will be noted that except for the Kankakee River and the Mad River , both of which have considerable natural ground storage, the actual storage curves are considerably flatter than the "normal storage" curves. At relatively high developments the agreement is fair, but at lower developments the normal curves do not give enough s torage. Dry periods of severa l months duration with little or no flow in the streams are more common in the Middle West than in the East. A series of curves fitting mid-western conditions more closely can probably be developed. In the Rocky Mountains variations from year to year and from wet to dry periods of several years are large and a different relationship is r e quired.
DOWNSTREAM WATER RIGHTS
Downstream water requirements play an increasingly important part in water supply developments. There a r e few places in the United States where all of the water from a stream can be stored or diverted without consideration of the lower water users. In the West where the appropriation doctrine has largely supplanted the riparian rights doctrine, the lower water rights are established by court dec r e e , and the excess water avai lable , if any, is pretty well established. In the East where in general the available supplies of water have exceeded the water demands, water rights quantitatively a re not so well defined.
In a recent study of water resources for potential synthetic liquid fuel plants in twenty-six states and Alaska, it was necessary to consider a great many r ivers and potential reservoir si tes, and the effect upon downstream u s e r s . Special account was taken of important water uses where these were known and in the Rocky Mountain states where appropriations are recorded. Elsewhere a uniform procedure was followed. The stream flow per square mile of drainage area, normally exceeded 90 per cent of the t ime, was determined from the daily runoff records. This flow, which is the same as the flow index in the Ohio studies, was called the "control flow." It was then assumed that no water could be diverted from a s t ream whenever the natural flow was l ess than the control, or 90 per cent, flow. Where storage r e se rvo i r s were necessary it was anticipated that whenever the natural flow was less than the control flow, water would be released from the reservoir in quantities equal to the natural inflow. It was not assumed, however, that any par t of the s torage would be used to augment the low flows downstream. The effect of the control flow allowance on the capacity of the reservoir is i l lus-
Note: Under (a) stream flows less than the control flow are oflowed to continue unchanqed. Under (b) reservoir capacity would be used os necessary to maintain the indicated downstream flow.
FIG. 33. —STORAGE CURVES FOR THE HOCKING RIVER AT ATHENS, OHIO (BASED ON DRIEST
PERIOD OF RECORD).
t ra ted in the left-hand portion of Figure 33, which shows the storage required per square mile of drainage a rea for the Hocking River during the driest period of record, 1930-32. The control flow in this case was 0.088 c.f. s. per square mi le , or very nearly the 0. 1 c. f. s. shown on the graph. For comparative purposes a control flow of 0. 2 c.f. s. per square mile is shown also, although this value was not used in any of the synthetic liquid fuel studies.
On the right-hand side of Figure 33 is shown the storage required if part of the reservoir capacity were to be used to supplement the natural flow below the rese rvo i r , as contrasted with the former case in which it was assumed that the low flow conditions would be the same as if no rese rvo i r had been built.
The storage required for a draft of 0. 4 c. f. s. per square mile under these two conditions is compared in Table I.
The procedure used in the synthetic liquid fuel s tudies is not suggested as one applicable to any particular situation. It was recognized that the uniform allowance would be too small in some cases and greater than necessary in others. For a p r e liminary survey, however, the procedure seemed reasonable and called attention to the necessity for taking into consideration downstream users .
Figure 34 shows the average, maximum, and minimum storage curves for twenty-eight s t reams studied in the synthetic liquid fuel survey in the Appalachian Mountain states and fifteen r ivers in the Midwestern states. These curves were determined from mass diagrams of the driest period of record after deducting the control flow or 90 per
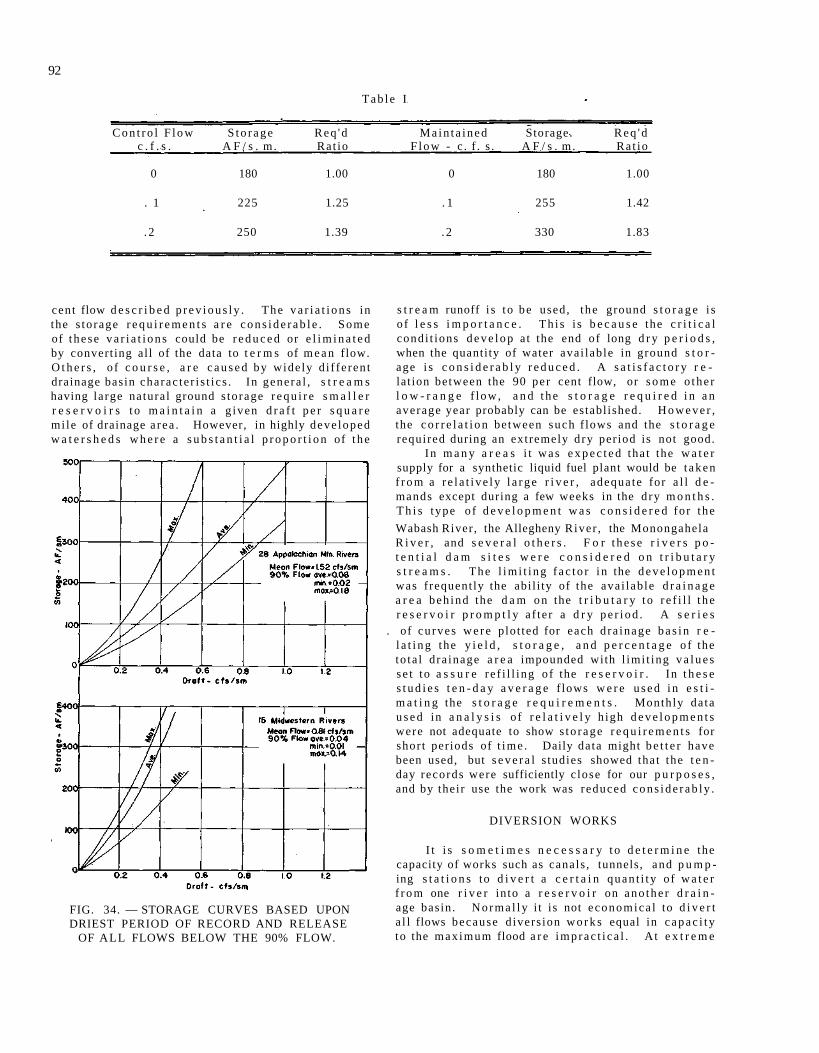
92
T a b l e I
C o n t r o l F l o w S t o r a g e Req 'd M a i n t a i n e d Storage. R e q ' d c . f . s . A F / s . m. Rat io F l o w - c . f . s . A F / s . m. Ra t io
0 180 1.00 0 180 1.00
. 1 225 1.25 . 1 255 1.42
. 2 250 1.39 . 2 330 1.83
cent flow d e s c r i b e d p r e v i o u s l y . The v a r i a t i o n s in the s to rage r e q u i r e m e n t s a r e c o n s i d e r a b l e . Some of t he se v a r i a t i o n s could be r e d u c e d or e l i m i n a t e d by convert ing al l of the data to t e r m s of m e a n flow. O t h e r s , o f c o u r s e , a r e c a u s e d by wide ly d i f fe ren t drainage basin charac te r i s t i c s . In genera l , s t r e a m s having la rge natura l ground s torage r e q u i r e s m a l l e r r e s e r v o i r s t o m a i n t a i n a g iven d r a f t p e r s q u a r e mi le of drainage a rea . However, in highly deve loped w a t e r s h e d s w h e r e a s u b s t a n t i a l p r o p o r t i o n of t h e
FIG. 34. — STORAGE CURVES BASED UPON DRIEST PERIOD OF RECORD AND RELEASE
OF ALL FLOWS BELOW THE 90% FLOW.
s t r e a m runoff i s t o be used, the ground s t o r a g e i s o f l e s s i m p o r t a n c e . Th i s i s b e c a u s e the c r i t i c a l condi t ions d e v e l o p a t the end of long d r y p e r i o d s , when the quanti ty of water avai lable in ground s t o r age i s c o n s i d e r a b l y r e d u c e d . A s a t i s f a c t o r y r e lat ion between the 90 per cent flow, or s o m e o the r l o w - r a n g e f low, a n d t h e s t o r a g e r e q u i r e d i n a n average year probably can be establ ished. H o w e v e r , the c o r r e l a t i o n be tween such f lows and the s t o r a g e required during an extremely d ry per iod is not good.
In m a n y a r e a s i t was e x p e c t e d tha t the w a t e r supply for a synthetic liquid fuel plant would be t aken f r o m a r e l a t i ve ly l a r g e r i v e r , adequa te for a l l d e mands except during a few weeks in the d ry m o n t h s . T h i s type o f d e v e l o p m e n t w a s c o n s i d e r e d for the
Wabash River , the Allegheny River , the Monongahela R i v e r , and s e v e r a l o t h e r s . F o r t h e s e r i v e r s p o t e n t i a l d a m s i t e s w e r e c o n s i d e r e d o n t r i b u t a r y s t r e a m s . The l i m i t i n g f a c t o r i n the d e v e l o p m e n t was f requent ly the abi l i ty of the ava i lab le d r a i n a g e a r e a beh ind the d a m o n the t r i b u t a r y t o r e f i l l t h e r e s e r v o i r p r o m p t l y a f te r a d r y p e r i o d . A s e r i e s
. of cu rves w e r e plot ted for each d ra inage b a s i n r e l a t i n g the y i e l d , s t o r a g e , a n d p e r c e n t a g e o f the to ta l d ra inage a r e a impounded with l imi t ing v a l u e s s e t to a s s u r e re f i l l ing of the r e s e r v o i r . In t h e s e s t u d i e s t e n - d a y a v e r a g e f lows w e r e u s e d i n e s t i m a t i n g the s t o r a g e r e q u i r e m e n t s . Monthly da ta u s e d in a n a l y s i s of r e l a t i v e l y h igh d e v e l o p m e n t s were not adequate to show s to rage r e q u i r e m e n t s for shor t per iods of t ime . Daily data might b e t t e r have been used, but s e v e r a l s tudies showed that the t e n -day records were sufficiently c lose for our p u r p o s e s , and by their use the work was reduced c o n s i d e r a b l y .
DIVERSION WORKS
I t i s s o m e t i m e s n e c e s s a r y t o d e t e r m i n e the capacity of works such as canals , tunnels, and p u m p ing s t a t i o n s to d i v e r t a c e r t a i n quan t i t y of w a t e r f r o m one r i v e r in to a r e s e r v o i r on ano the r d r a i n age bas in . N o rma l ly i t i s not economica l to d i v e r t a l l flows because d ivers ion w o r k s equal in c a p a c i t y to the max imum flood a r e i m p r a c t i c a l . At e x t r e m e
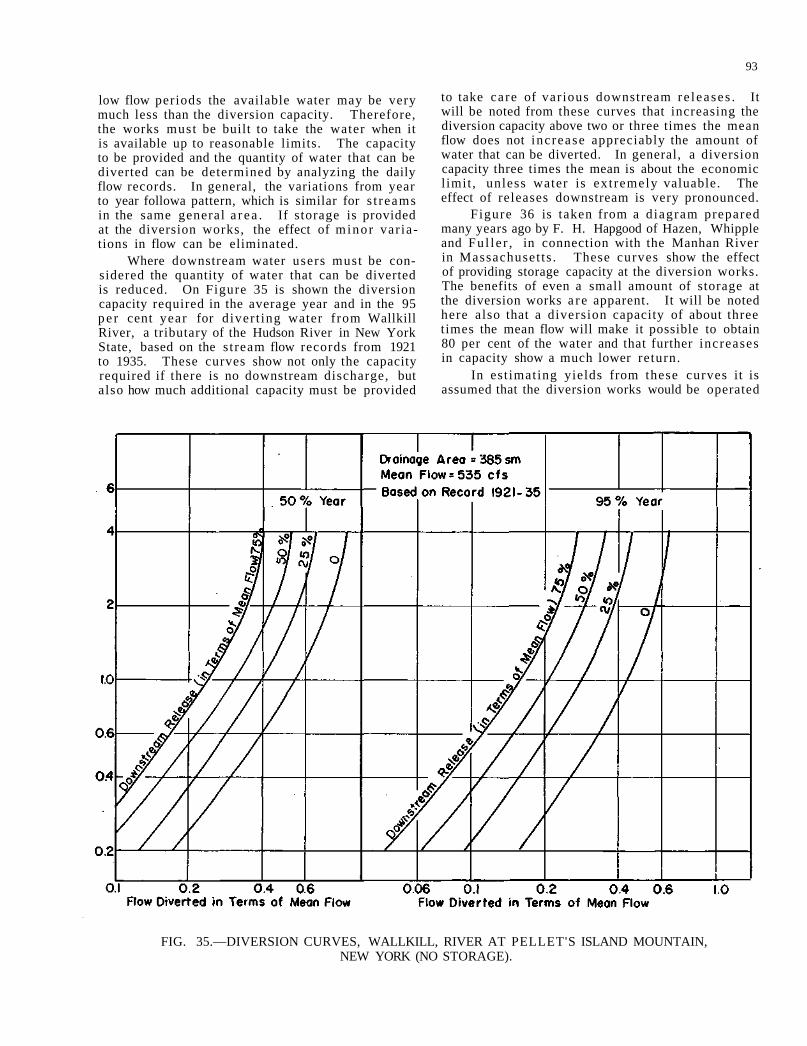
93
low flow periods the available water may be very much less than the diversion capacity. Therefore, the works must be built to take the water when it is available up to reasonable limits. The capacity to be provided and the quantity of water that can be diverted can be determined by analyzing the daily flow records. In general, the variations from year to year followa pattern, which is similar for s t reams in the same general a r ea . If storage is provided at the diversion works, the effect of minor var iations in flow can be eliminated.
Where downstream water users must be considered the quantity of water that can be diverted is reduced. On Figure 35 is shown the diversion capacity required in the average year and in the 95 pe r cent year for diver t ing water from Wallkill River, a tributary of the Hudson River in New York State, based on the s tream flow records from 1921 to 1935. These curves show not only the capacity required if there is no downstream discharge, but also how much additional capacity must be provided
to take care of var ious downstream re leases . It will be noted from these curves that increasing the diversion capacity above two or three times the mean flow does not increase appreciably the amount of water that can be diverted. In general, a diversion capacity three times the mean is about the economic l imit , unless water is ext remely valuable. The effect of releases downstream is very pronounced.
Figure 36 is taken from a d iagram prepared many years ago by F. H. Hapgood of Hazen, Whipple and Fu l le r , in connection with the Manhan River in Massachuset ts . These curves show the effect of providing storage capacity at the diversion works. The benefits of even a small amount of storage at the diversion works a r e apparent. It will be noted here also that a diversion capacity of about three times the mean flow will make it possible to obtain 80 per cent of the water and that further increases in capacity show a much lower return.
In est imating yields from these curves it is assumed that the diversion works would be operated
FIG. 35.—DIVERSION CURVES, WALLKILL, RIVER AT PELLET'S ISLAND MOUNTAIN, NEW YORK (NO STORAGE).
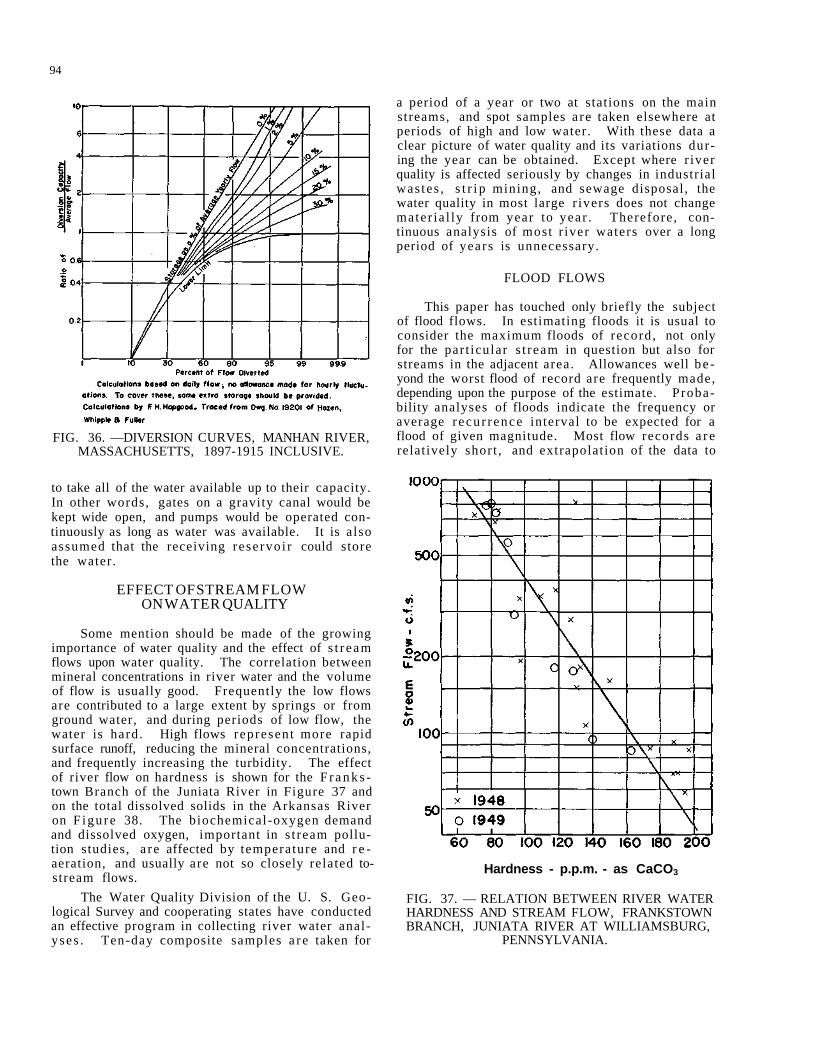
94
FIG. 36. —DIVERSION CURVES, MANHAN RIVER, MASSACHUSETTS, 1897-1915 INCLUSIVE.
to take all of the water available up to their capacity. In other words, gates on a gravity canal would be kept wide open, and pumps would be operated continuously as long as water was available. It is a lso assumed that the receiving rese rvo i r could store the water.
EFFECT OF STREAM FLOW ON WATER QUALITY
Some mention should be made of the growing importance of water quality and the effect of s t r eam flows upon water quality. The correlation between mineral concentrations in river water and the volume of flow is usually good. Frequently the low flows are contributed to a large extent by springs or from ground water, and during periods of low flow, the water is hard. High flows represent more rapid surface runoff, reducing the mineral concentrations, and frequently increasing the turbidity. The effect of river flow on hardness is shown for the F r a n k s -town Branch of the Juniata River in Figure 37 and on the total dissolved solids in the Arkansas River on F igu re 38. The biochemical-oxygen demand and dissolved oxygen, important in s t ream pollution studies, a re affected by temperature and r e -aeration, and usually are not so closely related to-stream flows.
The Water Quality Division of the U. S. Geological Survey and cooperating states have conducted an effective program in collecting river water analyses . Ten-day composite samples a r e taken for
a period of a year or two at stations on the main streams, and spot samples a re taken elsewhere at periods of high and low water. With these data a clear picture of water quality and its variations during the year can be obtained. Except where r iver quality is affected seriously by changes in industrial was tes , s t r i p mining, and sewage disposal, the water quality in most large r ivers does not change mater ia l ly from year to year . Therefore, continuous analysis of most r iver waters over a long period of years is unnecessary.
FLOOD FLOWS
This paper has touched only briefly the subject of flood flows. In estimating floods it is usual to consider the maximum floods of record, not only for the par t icular s t ream in question but also for streams in the adjacent area. Allowances well be yond the worst flood of record are frequently made, depending upon the purpose of the estimate. Probability analyses of floods indicate the frequency or average r ecu r rence interval to be expected for a flood of given magnitude. Most flow records a r e relatively short , and extrapolation of the data to
Hardness - p.p.m. - as CaCO3
FIG. 37. — RELATION BETWEEN RIVER WATER HARDNESS AND STREAM FLOW, FRANKSTOWN BRANCH, JUNIATA RIVER AT WILLIAMSBURG,
PENNSYLVANIA.
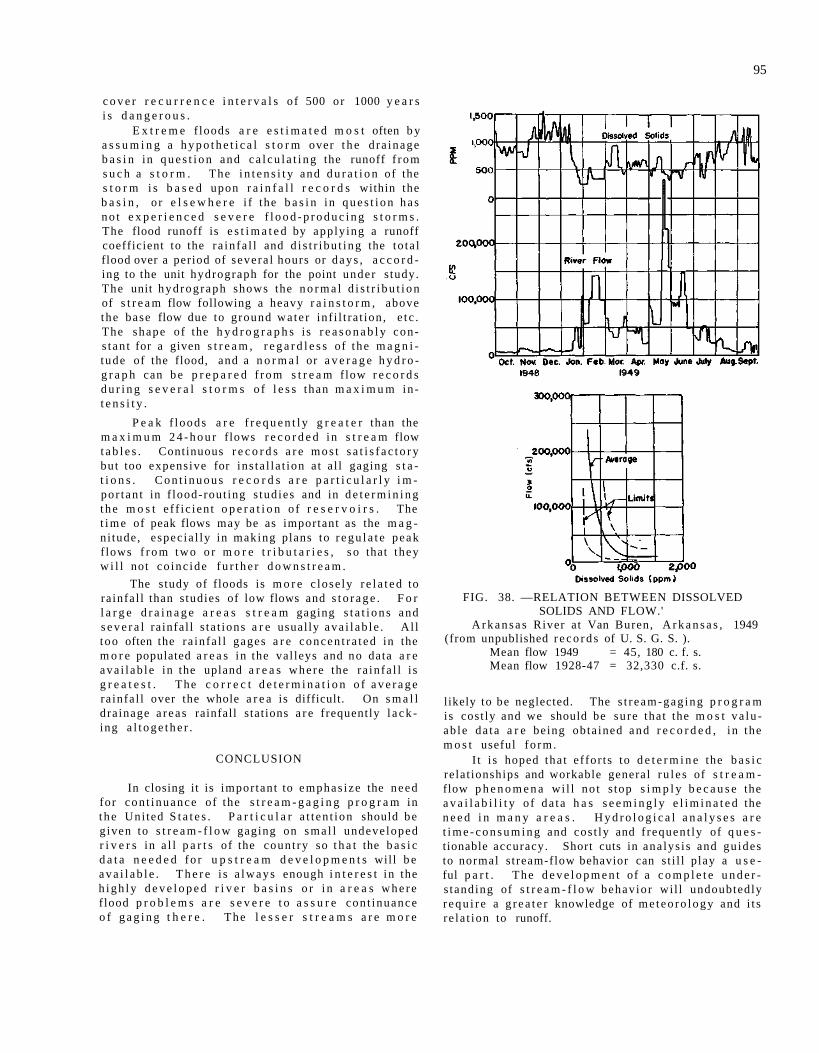
95
c o v e r r e c u r r e n c e i n t e r v a l s o f 500 or 1000 y e a r s i s d a n g e r o u s .
E x t r e m e f loods a r e e s t i m a t e d m o s t often b y a s s u m i n g a h y p o t h e t i c a l s t o r m over t h e d ra inage b a s i n in q u e s t i o n and c a l c u l a t i n g the runoff f rom s u c h a s t o r m . The i n t e n s i t y and d u r a t i o n of the s t o r m i s b a s e d upon r a i n f a l l r e c o r d s within the b a s i n , o r e l s e w h e r e i f the b a s i n in q u e s t i o n h a s no t e x p e r i e n c e d s e v e r e f l o o d - p r o d u c i n g s t o r m s . The flood runoff is e s t i m a t e d by apply ing a runoff coefficient to the ra in fa l l and d i s t r i bu t ing the to ta l flood over a period of severa l hours or d a y s , a c c o r d ing to the unit hydrograph for the point under s tudy. The unit hydrograph shows the n o r m a l d i s t r i b u t i o n of s t r e a m flow following a heavy r a i n s t o r m , above the base flow due to ground wa te r inf i l t ra t ion , e t c . The shape of the h y d r o g r a p h s is r e a s o n a b l y cons t an t for a given s t r e a m , r e g a r d l e s s of the m a g n i tude of the flood, and a n o r m a l or a v e r a g e h y d r o -g r a p h can b e p r e p a r e d f r o m s t r e a m f low r e c o r d s d u r i n g s e v e r a l s t o r m s o f l e s s than m a x i m u m in t e n s i t y .
P e a k f loods a r e f r e q u e n t l y g r e a t e r than the m a x i m u m 2 4 - h o u r f lows r e c o r d e d in s t r e a m flow t a b l e s . Continuous r e c o r d s a r e m o s t s a t i s f a c t o r y but too expensive for ins ta l la t ion a t a l l gaging s t a t i o n s . C o n t i n u o u s r e c o r d s a r e p a r t i c u l a r l y i m por tan t in f lood-rout ing s tud ies and in d e t e r m i n i n g t h e m o s t e f f i c ien t o p e r a t i o n o f r e s e r v o i r s . The t i m e of peak flows may be as important as the m a g ni tude, espec ia l ly in making plans to r e g u l a t e peak f lows f r o m two o r m o r e t r i b u t a r i e s , s o that they w i l l not co inc ide f u r t h e r d o w n s t r e a m .
The study of floods is m o r e c lose ly r e l a t e d to ra infa l l than s tudies of low flows and s t o r a g e . F o r l a r g e d r a i n a g e a r e a s s t r e a m gaging s t a t i o n s and s e v e r a l ra infal l s ta t ions a r e usual ly ava i l ab l e . Al l t oo often the ra infa l l gages a r e concen t r a t ed in the m o r e populated a r e a s in the val leys and no data a r e ava i l ab l e in the upland a r e a s where the ra in fa l l i s g r e a t e s t . The c o r r e c t d e t e r m i n a t i o n o f a v e r a g e ra infa l l over the whole a r e a is difficult. On s m a l l dra inage a r ea s rainfall s tat ions a r e frequently l a c k ing a l t o g e t h e r .
CONCLUSION
In closing it is impor tant to emphas ize the need for con t inuance of the s t r e a m - g a g i n g p r o g r a m in t h e Uni ted S t a t e s . P a r t i c u l a r a t t en t ion should be g iven to s t r e a m - f l o w gaging on s m a l l undeve loped r i v e r s in a l l p a r t s of the count ry so t h a t the b a s i c d a t a n e e d e d fo r u p s t r e a m d e v e l o p m e n t s will b e a v a i l a b l e . T h e r e i s a l w a y s enough i n t e r e s t in the h i g h l y d e v e l o p e d r i v e r b a s i n s o r i n a r e a s w h e r e f lood p r o b l e m s a r e s e v e r e t o a s s u r e con t inuance o f g a g i n g t h e r e . The l e s s e r s t r e a m s a r e m o r e
FIG. 38. —RELATION BETWEEN DISSOLVED SOLIDS AND FLOW.'
A r k a n s a s River at Van Buren, A r k a n s a s , 1949 (from unpublished r e c o r d s of U. S. G. S. ).
Mean flow 1949 = 45, 180 c. f. s. Mean flow 1928-47 = 32,330 c.f. s.
likely to be neglected. The s t r eam-gag ing p r o g r a m is cost ly and we should be sure that the m o s t v a l u ab le da ta a r e being obta ined and r e c o r d e d , i n the m o s t useful fo rm.
I t i s hoped tha t ef for ts to d e t e r m i n e the b a s i c re lat ionships and workable general r u l e s of s t r e a m -flow p h e n o m e n a wi l l no t s top s i m p l y b e c a u s e the a v a i l a b i l i t y o f da ta h a s s e e m i n g l y e l i m i n a t e d the n e e d i n m a n y a r e a s . H y d r o l o g i c a l a n a l y s e s a r e t i m e - c o n s u m i n g and cos t ly and f requent ly of q u e s tionable accuracy. Short cuts in ana lys i s and gu ides to normal s tream-flow behavior can s t i l l play a u s e ful p a r t . The d e v e l o p m e n t of a c o m p l e t e u n d e r s tanding of s t r e a m - f l o w behavior wi l l undoubtedly r e q u i r e a g r e a t e r knowledge of m e t e o r o l o g y and i t s re la t ion to runoff.
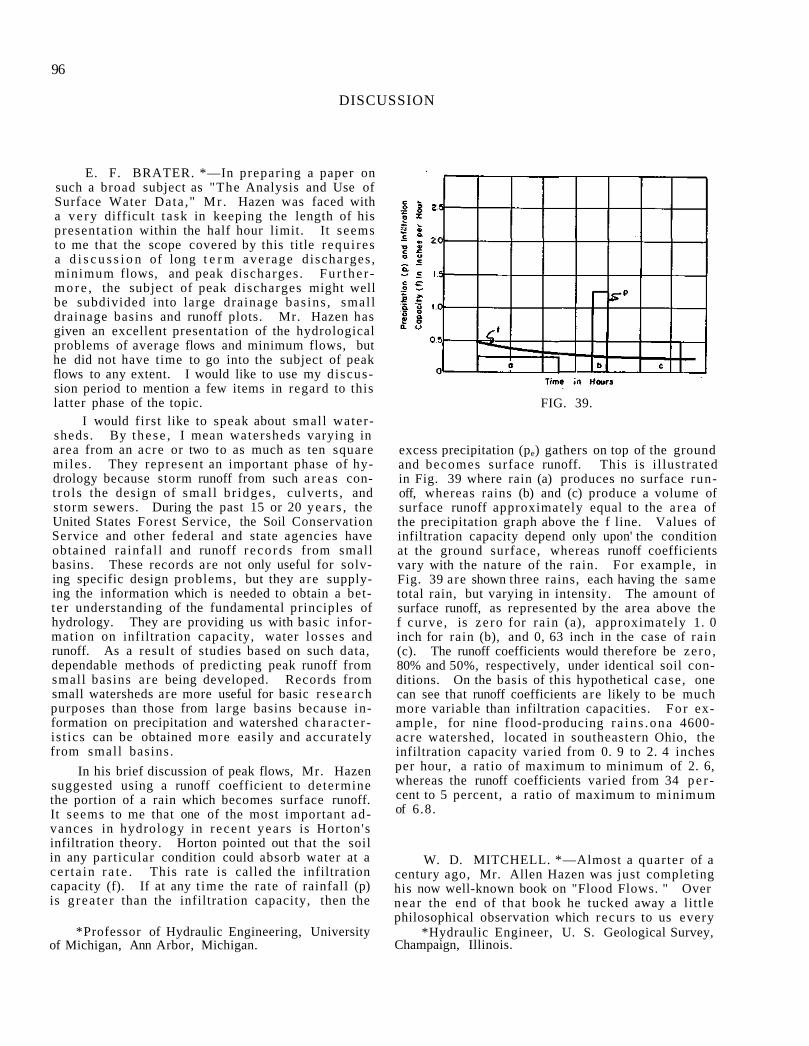
96
E. F. BRATER. *—In preparing a paper on such a broad subject as "The Analysis and Use of Surface Water Data ," Mr . Hazen was faced with a v e r y difficult t ask in keeping the length of his presentat ion within the half hour limit. It seems to me that the scope covered by this title requi res a d i s c u s s i o n of long t e r m average d ischarges , minimum flows, and peak discharges . F u r t h e r m o r e , the subject of peak discharges might well be subdivided into large drainage bas ins , smal l drainage basins and runoff plots. Mr. Hazen has given an excellent presentation of the hydrological problems of average flows and minimum flows, but he did not have time to go into the subject of peak flows to any extent. I would like to use my d iscussion period to mention a few items in regard to this latter phase of the topic.
I would first like to speak about small watersheds. By these , I mean watersheds varying in area from an acre or two to as much as ten square miles . They represent an important phase of hydrology because storm runoff from such a reas cont ro l s the design of smal l br idges , culver ts , and storm sewers. During the past 15 or 20 yea r s , the United States Forest Service, the Soil Conservation Service and other federal and state agencies have obtained ra infal l and runoff r eco rds from small basins. These records are not only useful for solving specific design problems, but they are supplying the information which is needed to obtain a bette r understanding of the fundamental principles of hydrology. They are providing us with basic information on infiltration capacity, water losses and runoff. As a result of studies based on such data, dependable methods of predicting peak runoff from small basins are being developed. Records from small watersheds are more useful for basic r e sea r ch purposes than those from large basins because information on precipitation and watershed charac te r is t ics can be obtained more easily and accurately from small basins.
In his brief discussion of peak flows, Mr. Hazen suggested using a runoff coefficient to determine the portion of a rain which becomes surface runoff. It seems to me that one of the most important advances in hydrology in r ecen t years is Horton's infiltration theory. Horton pointed out that the soil in any particular condition could absorb water at a cer ta in r a t e . This rate is called the infiltration capacity (f). If at any t ime the rate of rainfall (p) is g rea te r than the infiltration capacity, then the
*Professor of Hydraulic Engineering, University of Michigan, Ann Arbor, Michigan.
FIG. 39.
excess precipitation (pe) gathers on top of the ground and becomes surface runoff. This is i l lustrated in Fig. 39 where rain (a) produces no surface runoff, whereas rains (b) and (c) produce a volume of surface runoff approximately equal to the a rea of the precipitation graph above the f line. Values of infiltration capacity depend only upon' the condition at the ground surface, whereas runoff coefficients vary with the nature of the rain. For example, in Fig. 39 are shown three rains, each having the same total rain, but varying in intensity. The amount of surface runoff, as represented by the area above the f curve , is ze ro for ra in (a), approximately 1. 0 inch for rain (b), and 0, 63 inch in the case of rain (c). The runoff coefficients would therefore be zero , 80% and 50%, respectively, under identical soil conditions. On the basis of this hypothetical case, one can see that runoff coefficients are likely to be much more variable than infiltration capacities. Fo r example, for nine flood-producing r a in s .ona 4600-acre watershed, located in southeastern Ohio, the infiltration capacity varied from 0. 9 to 2. 4 inches per hour, a ratio of maximum to minimum of 2. 6, whereas the runoff coefficients varied from 34 p e r cent to 5 percent, a ratio of maximum to minimum of 6.8.
W. D. MITCHELL. *—Almost a quarter of a century ago, Mr. Allen Hazen was just completing his now well-known book on "Flood Flows. " Over near the end of that book he tucked away a little philosophical observation which recurs to us every
*Hydraulic Engineer, U. S. Geological Survey, Champaign, Illinois.
DISCUSSION
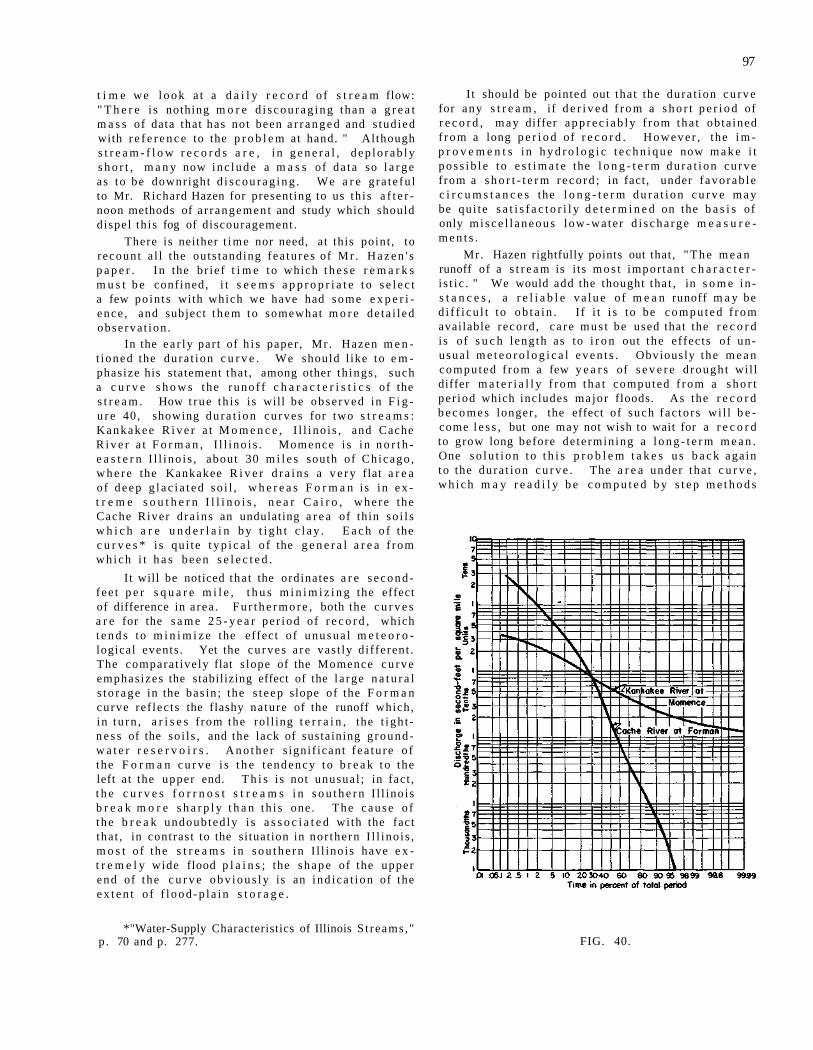
97
t i m e we l o o k a t a d a i l y r e c o r d o f s t r e a m flow: " T h e r e i s nothing m o r e d i s c o u r a g i n g than a g r e a t m a s s of data that has not been a r r a n g e d and s tud ied with r e f e r e n c e to the p r o b l e m at hand. " Although s t r e a m - f l o w r e c o r d s a r e , i n g e n e r a l , d ep lo r ab ly s h o r t , m a n y now inc lude a m a s s of da ta so l a r g e as to be downright d i s c o u r a g i n g . We a r e g ra te fu l to Mr. Richard Hazen for presenting to us th is a f t e r noon methods of a r r angemen t and study which should dispel th is fog of discouragement .
There is neither t ime nor need, at this point , to recount a l l the outs tanding fea tu res of M r . H a z e n ' s p a p e r . I n the b r ie f t i m e to which t h e s e r e m a r k s m u s t b e confined, i t s e e m s a p p r o p r i a t e t o s e l e c t a few po in t s with which we have had some e x p e r i ence , and subject t h e m to somewhat m o r e de ta i l ed observa t ion .
In the ea r l y par t of h i s paper , Mr . Hazen m e n t ioned the dura t ion c u r v e . We should l ike to e m phasize his statement that , among other th ings , such a c u r v e s h o w s the runo f f c h a r a c t e r i s t i c s of the s t r e a m . How t rue th i s i s will be obse rved in F i g u r e 40, showing d u r a t i o n cu rves for two s t r e a m s : Kankakee R i v e r a t M o m e n c e , I l l i no i s , and Cache R i v e r a t F o r m a n , I l l i no i s . Momence i s i n n o r t h e a s t e r n I l l i no i s , about 30 m i l e s south of Ch icago , w h e r e the Kankakee R i v e r d r a i n s a v e r y flat a r e a o f deep g l a c i a t e d so i l , w h e r e a s F o r m a n i s in e x t r e m e s o u t h e r n I l l i n o i s , n e a r C a i r o , w h e r e the Cache River d ra ins an undulating a r e a of thin so i l s w h i c h a r e u n d e r l a i n b y t i g h t c l a y . E a c h o f the c u r v e s * i s qu i te t y p i c a l o f the g e n e r a l a r e a f rom w h i c h i t h a s been s e l e c t e d .
I t will be noticed tha t the ordinates a r e s e c o n d -fee t p e r s q u a r e m i l e , t h u s m i n i m i z i n g the effect of difference in a rea . F u r t h e r m o r e , both the c u r v e s a r e for the s a m e 2 5 - y e a r pe r iod of r e c o r d , which t e n d s to m i n i m i z e the effect o f unusua l m e t e o r o logical events . Yet the cu rves a r e vas t ly d i f ferent . The comparat ive ly flat s lope of the Momence c u r v e emphas izes the stabilizing effect of the l a rge n a t u r a l s t o r age in the bas in ; the s t eep slope of the F o r m a n curve ref lec ts the flashy na ture of the runoff which, i n t u rn , a r i s e s f rom the rol l ing t e r r a i n , the t i gh t n e s s of the so i l s , and the lack of sustaining g round w a t e r r e s e r v o i r s . A n o t h e r s ignif icant f ea tu re of the F o r m a n c u r v e i s t h e t endency t o b r e a k t o the left a t the upper end. T h i s is not unusual ; in fact , t h e c u r v e s f o r r n o s t s t r e a m s i n s o u t h e r n I l l ino is b r e a k m o r e s h a r p l y t h a n th i s one. The cause o f t h e b r e a k undoubted ly i s a s s o c i a t e d wi th the fact tha t , in contrast to the si tuat ion in nor thern I l l ino i s , m o s t o f the s t r e a m s in s o u t h e r n I l l ino is have e x t r e m e l y wide flood p l a i n s ; the s h a p e of the upper end of the c u r v e o b v i o u s l y is an i nd i ca t i on of the e x t e n t o f f l o o d - p l a i n s t o r a g e .
*"Water-Supply Characteristics of Illinois S t reams ," p . 70 and p. 277.
I t should be pointed out that the dura t ion c u r v e for any s t r e a m , if d e r i v e d f r o m a s h o r t p e r i o d of r e c o r d , m a y differ a p p r e c i a b l y f rom tha t obta ined f r o m a long p e r i o d of r e c o r d . H o w e v e r , the i m p r o v e m e n t s i n h y d r o l o g i c t e c h n i q u e now m a k e i t p o s s i b l e t o e s t i m a t e the l o n g - t e r m d u r a t i o n cu rve f rom a s h o r t - t e r m r e c o r d ; in fact, under f avo rab le c i r c u m s t a n c e s the l o n g - t e r m d u r a t i o n c u r v e m a y be qu i te s a t i s f a c t o r i l y d e t e r m i n e d on the b a s i s of only m i s c e l l a n e o u s low-wate r d i s c h a r g e m e a s u r e m e n t s .
Mr. Hazen rightfully points out that, " T h e m e a n runoff of a s t r e a m is i ts m o s t impor tan t c h a r a c t e r i s t i c . " We would add the thought tha t , in s o m e i n s t a n c e s , a r e l i a b l e v a l u e of m e a n runoff m a y be d i f f i cu l t to o b t a i n . I f i t i s to be c o m p u t e d f r o m available record , c a r e m u s t be used that the r e c o r d is of s u c h l eng th as to i r o n out the ef fec ts of unusua l m e t e o r o l o g i c a l e v e n t s . Obviously the m e a n computed f rom a few y e a r s of s e v e r e d rough t wil l differ m a t e r i a l l y f r o m tha t computed f r o m a s h o r t per iod which includes major floods. As the r e c o r d b e c o m e s longer , the effect of such fac to r s wi l l b e come l e s s , but one may not wish to wait for a r e c o r d to grow long before de te rmin ing a l o n g - t e r m m e a n . One s o l u t i o n t o t h i s p r o b l e m t a k e s u s b a c k aga in to the dura t ion c u r v e . The a r e a under tha t c u r v e , w h i c h m a y r e a d i l y b e c o m p u t e d b y s t e p m e t h o d s
FIG. 40.
98
of i n t e g r a t i o n , r e p r e s e n t s the t o t a l d i s c h a r g e for the pe r iod on which the curve was based. T h u s the l o n g - t e r m durat ion cu rve , d e t e r m i n e d f r o m s h o r t -t e r m r e c o r d b y m e t h o d s a l r e a d y m e n t i o n e d , m a y be in tegra ted to obtain the corresponding l o n g - t e r m d i s c h a r g e .
As our c losing point we should like to r e f e r to (and applaud) Mr. Hazen 's plea for p a r t i c u l a r a t t e n tion to r e c o r d s a t the r ight p lace , s t r e a m gag ing on the s m a l l undeveloped s t r e a m s . That th i s n e e d i s being genera l ly recognized is evidenced by the fact that the Geological Survey, in cooperation wi th o ther in te res ted agencies , has grea t ly expanded—and s t i l l is expanding—the n u m b e r of ac t ive gaging s t a t i o n s on the s m a l l e r s t r e a m s . In I l l inois , for e x a m p l e , 57 of the present gaging stations have dra inage a r e a s of l e s s than 100 s q u a r e m i l e s . One half of t h e s e have d r a i n a g e a r e a s of l e s s than 20 s q u a r e m i l e s . On the other hand, however grea t may be the n u m b e r of s ta t ions , we never can hope to develop a n e t w o r k such as to provide an ac tua l s t ream-f low r e c o r d for eve ry site a t which s t r e a m development may be cons i d e r e d . To m e e t t h i s s i t u a t i o n t h e r e m u s t be a continuation of studies which have as the i r ob jec t ive the i m p r o v e m e n t o f t e c h n i q u e s for t r a n s f e r r i n g data with r e s p e c t t o p l ace , a s wel l a s with r e s p e c t to t ime . Such s tud ies , in t h e m s e l v e s , a r e a fundamenta l pa r t of the analys is and use of su r face w a t e r data.
C. V. YOUNGQUIST. * — T h e text for my d i s cuss ion is that of Lord Kelvin who s ta ted , " N e a r l y a l l t he g r a n d e s t d i s c o v e r i e s of s c i ence h a v e been but the reward of accura te measu remen t and pa t i en t , long-continued labor in the minute sifting of n u m e r i c a l r e s u l t s . "
I t shou ld be n o t i c e d t h a t L o r d Kelvin p l aced equal importance on "minute sifting" as on " a c c u r a t e m e a s u r e m e n t . "
In the f ield of s u r f a c e - w a t e r hyd ro logy m u c h less effort has been spent on "sifting" or " a n a l y s i s " than on data collection.
There a r e a t leas t two cogent r easons for a n a l ys is and interpretat ion to be ca r r i ed on c o n c u r r e n t l y with da t a c o l l e c t i o n . F i r s t — s u b s e q u e n t a n a l y s i s of data may indicate that impor tan t c o r r e l a t i v e data shou ld h a v e been c o l l e c t e d which i s f o r e v e r los t . S e c o n d — a n a l y s i s and i n t e r p r e t a t i o n m a y ind ica te the l a c k of need for s o m e b a s i c data co l l ec t i on .
The e x p e r i e n c e of Ohio m a y be t y p i c a l of the evo lu t ion o c c u r r i n g in the f ield of b a s i c d a t a c o l l e c t i on . A s y s t e m a t i c p r o g r a m of s t r e a m gaging was begun in 1921. F o r 20 y e a r s the work w a s con-
*Chief, Division of Water, Ohio Department of Natural Resources, Columbus, Ohio.
fined l a r g e l y to data co l l ec t ion with no a t t e m p t a t in t e rp re ta t ion by the State sponsoring agency . The Uni ted S t a t e s Geologica l Su rvey had a p r o g r a m of interpretat ion set up in 1934 as a work-re l ie f p r o j e c t in which s o m e Ohio r e c o r d s w e r e u sed . 'Also the flood of 1935 in the Musk ingum B a s i n and t h o s e of 1937 r e s u l t e d in some i n t e r p r e t i v e flood r e p o r t s .
In 1940 s tudents under the Nat ional Youth A d minis t ra t ion p rog ram were used to p r e p a r e d u r a t i o n t ab l e s for s e l e c t e d s t r e a m s .
In 1941, due to r e p o r t s of falling w a t e r t a b l e s o v e r the s t a t e , t he l e g i s l a t u r e c r e a t e d the Ohio Water Supply Board. The p r o g r a m was inadequa te ly f inanced and m o s t of the effort was devo ted to r e connaissance surveys of the ground-water s i t ua t i on .
The l eg i s l a tu re c rea t ed in 1945 the Ohio W a t e r R e s o u r c e s B o a r d with b r o a d d i r e c t i v e s in t h e field of wa te r r e s o u r c e s .
The f i r s t i n t e rp r e t i ve r e p o r t was tha t of flood frequency ana lys i s . This bullet in was r e c e i v e d wel l and a p p a r e n t l y s e r v e d a long felt need. I t b e c a m e a p p a r e n t that t he r e was a need for m o r e flood da ta which was not obtainable f rom the r e g u l a r s t r e a m -gaging p r o g r a m .
A s y s t e m was set up to m a k e field s u r v e y s of e v e r y l o c a l , d a m a g i n g f lood wi th i n t e r p r e t a t i o n s as to the c a u s e , f requency, flood d i s c h a r g e s , e t c . A body of information and data is becoming a v a i l a b l e which will be of g r ea t value in the des ign of w o r k s , p a r t i c u l a r l y on sma l l s t r e a m s .
A s e r i e s of two intensive s tudies was m a d e on Ohio S t r e a m F l o w C h a r a c t e r i s t i c s , one dea l ing with flow d u r a t i o n and one w a t e r supply and s t o r age r e q u i r e m e n t s . The dura t ion c u r v e s w e r e p r e p a r e d b y ha l f decade i n t e r v a l s t o f ac i l i t a t e c o m pa ra t i ve s tud ies of r e c o r d s of varying leng th . The 90% flow d u r a t i o n va lue w a s used as an index in c o m p a r i n g s t r e a m s and the inf luence of s u r f i c i a l d e p o s i t s on s t r e a m flow.
In the field of the c h e m i s t r y of su r f ace w a t e r s only s u p e r f i c i a l work h a s been done. Much m o r e bas ic data collect ion mus t be c a r r i e d on. A f e r t i l e field for i n t e r p r e t a t i o n is in the field of s u s p e n d e d sediment. Since this p r o g r a m is in i t s infancy m u c h m o r e data co l lec t ion m u s t p r e c e d e i n t e r p r e t a t i o n .
In a l l county water r e s o u r c e s inves t iga t ions the c h a r a c t e r i s t i c s of a l l the s t r e a m s in the county a r e a s c e r t a i n e d b y m i s c e l l a n e o u s d i s c h a r g e m e a s u r e ments m a d e , if poss ible , at approx imate ly the 90% flow durat ion per iod.
The en t i r e p r o g r a m of col lect ion and i n t e r p r e ta t ion of w a t e r r e s o u r c e s da ta is c a r r i e d on in c o opera t ion with the U. S. Geologica l Survey . Since a l l ac t iv i ty on wate r r e s o u r c e s in Ohio i s c o n s o l i dated in the Division of Wa te r , Ohio D e p a r t m e n t of N a t u r a l R e s o u r c e s , tha t agency i s the c o o p e r a t i n g agency with the U .S . G. S.
ENGINEERING M E T E O R O L O G Y *
BY STIFEL W. JENS**
WITH DISCUSSIONS BY GEORGE S. B E N T O N , IVAN E. HOUK AND P H I L L I P LIGHT
INTRODUCTION
It be l abor s the obvious to do m o r e than ind ica te the v a s t a r e a s of e n g i n e e r i n g in which knowledge of a t m o s p h e r i c t e m p e r a t u r e s , p rec ip i t a t ion ( r a i n , snow, s l e e t , ha i l , e t c . ) a n d winds i s e s s e n t i a l to intelligent design and operation of engineering w o r k s . Wate rway openings in b r i d g e s and c u l v e r t s , u r b a n s t o r m d r a i n a g e , m u n i c i p a l w a t e r supply , i r r i g a t ion , h y d r o e l e c t r i c power , flood con t ro l , n a v i g a t ion, e r o s i o n cont ro l , pol lu t ion aba t emen t , s t r u c t u r a l p r o v i s i o n for wind f o r c e s and t e m p e r a t u r e v a r i a t i o n s , e v a p o - t r a n s p i r a t i o n i n a g r o n o m y , a n d m a n y o t h e r a p p l i c a t i o n s — e a c h r e a d i l y b r i n g s t o m i n d the e n g i n e e r ' s dependence upon and need for me teo ro log ic data and an unders tand ing of the p h e nomena out of which came such information.
Within the l imi t s of t h i s pape r i t is i m p o s s i b l e to d i s c u s s adequate ly the de ta i l ed me teo ro log ic i n f o r m a t i o n w h i c h the h y d r a u l i c o r o t h e r e n g i n e e r dea l ing with w a t e r p r o b l e m s should p o s s e s s ; t h i s i s a v a i l a b l e i n v a r i o u s b o o k s o n m e t e o r o l o g y a s we l l as in the s e v e r a l w o r k s on hydro logy . C o n s e q u e n t l y , t he d i s c u s s i o n t o follow w i l l b e c o n fined to r a in f a l l , s ince i t i s the a t m o s p h e r i c p h e nomenon which engages m a j o r i n t e r e s t of the e n g i n e e r because of his concern with surface and g round wa te r s which a r e r e s idua l s of prec ip i ta t ion . T h e r e w i l l f i r s t be a b r i e f t r e a t m e n t of the c a u s e s and t ypes of s t o r m , ava i lab le d a t a and i t s l i m i t a t i o n s , and the p r o c e s s i n g of r a in fa l l data for e n g i n e e r i n g p u r p o s e s . Fol lowing t h i s , t h e r e will be e x a m p l e s of the u s e of r a in fa l l i n f o r m a t i o n for d e t e r m i n i n g the m a x i m u m spil lway flow and the m i n i m u m y i e l d for a l a rge wate r supply impoundment .
P R E C I P I T A T I O N
C a u s e s . All p r e c i p i t a t i o n is the r e s u l t of the a tmosphe re ' s water vapor being condensed, in whole or in p a r t , by cooling. Such cooling of m a s s e s of a i r , which r e s u l t s in fine d r o p l e t s (c louds or fog) if the point of sa tura t ion is r eached , can be b r o u g h t about by lifting or r ad i a t i on . The l a t t e r p r o d u c e s f r o s t or dew, ne i the r of w h i c h a r e of m a j o r e n g i -
*Some notes on the Engineering Understanding and Use of Rainfall Data.
**Consulting Engineer, St. Louis, Missouri .
neer ing significance, although the location of foundat ions and pipe l ines a lways r e f l ec t s the p e n e t r a t i o n o f f r o s t , a n d dew m u s t s o m e t i m e s be g iven c o n s i d e r a t i o n as a c o n t r i b u t i n g f a c t o r in c o r r o s i o n .
T y p e s of S t o r m s . Lif t ing of v a p o r - l a d e n a i r m a s s e s can r e s u l t f rom (1) topographic in f luences , (2) convergence or frontal ac t ion , (3) t h e r m a l c o n vect ion, or (4) combina t ions of any or a l l of t h e s e f a c t o r s . The s t o r m s due to the f i r s t o f t h e s e i n f l u e n c e s , which a r e m o r e g e n e r a l l y t e r m e d o r o g raph ic , a r e typified by the r i s e in m o i s t u r e - l a d e n m a s s e s of a i r as they a r e forced over mountain b a r r i e r s o r e s c a r p m e n t s ; e . g . , the Pac i f ic Ocean a i r m a s s e s l o s e t h e i r m o i s t u r e q u i c k l y a s they r i s e over the c o a s t a l m o u n t a i n s . F r o n t a l type s t o r m s o c c u r w h e n a l i g h t e r , w a r m , m o i s t u r e - b e a r i n g a i r m a s s e n c o u n t e r s a h e a v i e r co ld a i r m a s s and is forced upward and over the l a t t e r , giving up i t s m o i s t u r e . T h e e n t i r e U n i t e d S t a t e s e a s t o f the Rocky M o u n t a i n s h a s a s the m a j o r c a u s e o f p r e c ip i t a t i on , c o n v e r g e n c e and f r o n t a l a c t i o n , t y p i fied by the w a r m , m o i s t a i r f r o m the Gulf moving northwardly and encountering the southward or e a s t w a r d moving cold a i r m a s s e s f r o m Canada , o r the nor the rn Pacif ic Ocean. T h e r m a l convection m a n i fe s t s i tself mo s t l y in t h u n d e r s t o r m s and i s c a u s e d by loca l ized t e m p e r a t u r e inequa l i t i e s in the l a y e r s of a i r immed ia t e ly above the e a r t h ' s su r f ace .
The engineer is interested in the fact that s t o r m s of wide ex ten t (occas iona l ly cover ing t e n s or h u n d reds of thousands square miles) a r e frontal or o r o g r a p h i c i n type and u s u a l l y a r e c h a r a c t e r i z e d b y r a t h e r uniform dis t r ibut ion of ra infa l l , with a r e l a t ively smal l range of in tens i t i e s . The l a rge w a t e r sheds usua l ly involved in m a j o r p r o j e c t s for i r r i gation, land dra inage , h y d r o e l e c t r i c d eve lopmen t s , r i v e r nav iga t ion and flood c o n t r o l , a r e c o n c e r n e d with such w i d e s p r e a d s t o r m s .
S t o r m s c h a r a c t e r i z e d b y spo t ty d i s t r i b u t i o n , with a wide range in in tens i t ies over a l imi ted a r e a of a few hundred or thousand s q u a r e m i l e s , r e s u l t p r imar i ly f rom the convective p rocess . The t h u n d e r s t o r m s o r c l o u d b u r s t s a r e u s u a l l y o f s h o r t d u r a t ion , with v e r y high r a in fa l l r a t e s over an a r e a of not m o r e t han a few s q u a r e m i l e s . The des ign of u rban and a i r p o r t s t o r m s e w e r s , highway and r a i l road culver ts i s usually pred ica ted upon shor t d u r a t ion—high in tens i ty p rec ip i t a t ion , with a m a x i m u m
99
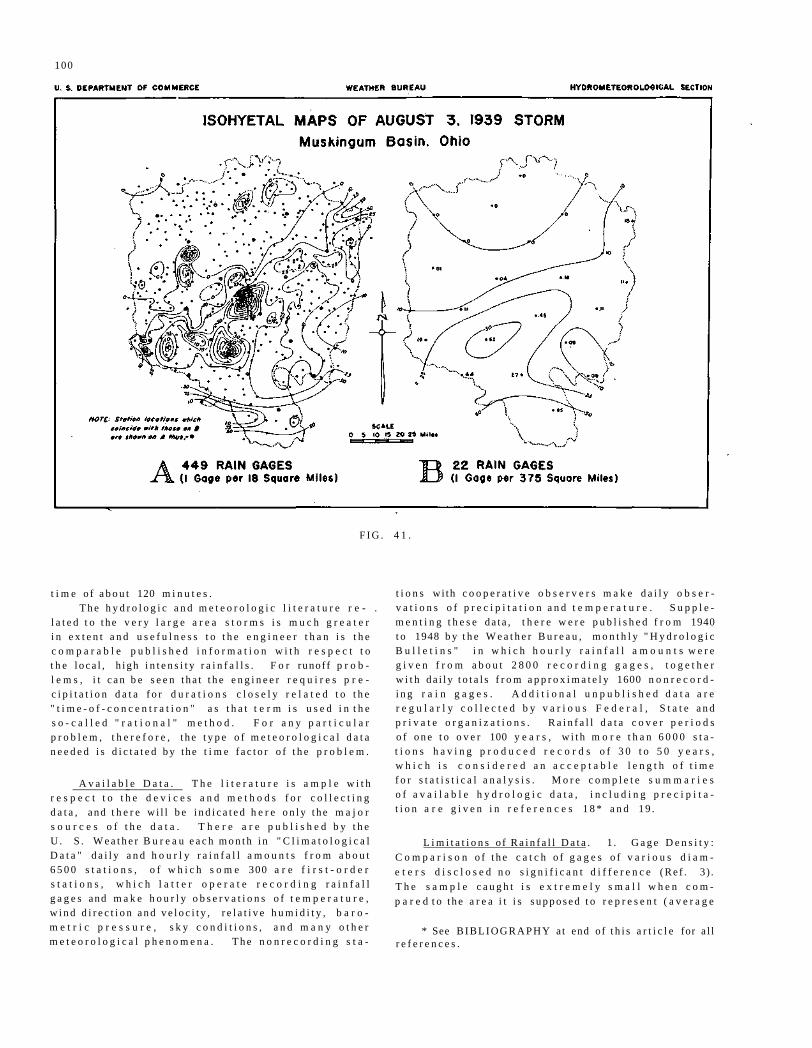
100
F I G . 4 1 .
t i m e o f a b o u t 120 m i n u t e s . T h e h y d r o l o g i c a n d m e t e o r o l o g i c l i t e r a t u r e r e - .
l a t e d t o t h e v e r y l a r g e a r e a s t o r m s i s m u c h g r e a t e r i n e x t e n t a n d u s e f u l n e s s t o t h e e n g i n e e r t h a n i s t h e c o m p a r a b l e p u b l i s h e d i n f o r m a t i o n w i t h r e s p e c t t o t h e l o c a l , h i g h i n t e n s i t y r a i n f a l l s . F o r runof f p r o b l e m s , i t c a n b e s e e n t h a t t h e e n g i n e e r r e q u i r e s p r e c i p i t a t i o n d a t a f o r d u r a t i o n s c l o s e l y r e l a t e d t o t h e " t i m e - o f - c o n c e n t r a t i o n " a s t h a t t e r m i s u s e d i n t h e s o - c a l l e d " r a t i o n a l " m e t h o d . F o r a n y p a r t i c u l a r p r o b l e m , t h e r e f o r e , t h e t y p e o f m e t e o r o l o g i c a l d a t a n e e d e d i s d i c t a t e d b y the t i m e f a c t o r o f t h e p r o b l e m .
A v a i l a b l e D a t a . T h e l i t e r a t u r e i s a m p l e w i t h r e s p e c t t o t h e d e v i c e s a n d m e t h o d s f o r c o l l e c t i n g d a t a , a n d t h e r e w i l l b e i n d i c a t e d h e r e o n l y t h e m a j o r s o u r c e s o f t h e d a t a . T h e r e a r e p u b l i s h e d b y t h e U . S . W e a t h e r B u r e a u e a c h m o n t h i n " C l i m a t o l o g i c a l D a t a " d a i l y a n d h o u r l y r a i n f a l l a m o u n t s f r o m a b o u t 6 5 0 0 s t a t i o n s , o f w h i c h s o m e 300 a r e f i r s t - o r d e r s t a t i o n s , w h i c h l a t t e r o p e r a t e r e c o r d i n g r a i n f a l l g a g e s and m a k e h o u r l y o b s e r v a t i o n s o f t e m p e r a t u r e , w i n d d i r e c t i o n a n d v e l o c i t y , r e l a t i v e h u m i d i t y , b a r o m e t r i c p r e s s u r e , s k y c o n d i t i o n s , a n d m a n y o t h e r m e t e o r o l o g i c a l p h e n o m e n a . T h e n o n r e c o r d i n g s t a
t i o n s wi th c o o p e r a t i v e o b s e r v e r s m a k e d a i l y o b s e r v a t i o n s o f p r e c i p i t a t i o n a n d t e m p e r a t u r e . S u p p l e m e n t i n g t h e s e d a t a , t h e r e w e r e p u b l i s h e d f r o m 1940 t o 1948 b y t h e W e a t h e r B u r e a u , m o n t h l y " H y d r o l o g i c B u l l e t i n s " i n w h i c h h o u r l y r a i n f a l l a m o u n t s w e r e g i v e n f r o m a b o u t 2 8 0 0 r e c o r d i n g g a g e s , t o g e t h e r w i t h d a i l y t o t a l s f r o m a p p r o x i m a t e l y 1600 n o n r e c o r d i n g r a i n g a g e s . A d d i t i o n a l u n p u b l i s h e d d a t a a r e r e g u l a r l y c o l l e c t e d b y v a r i o u s F e d e r a l , S t a t e a n d p r i v a t e o r g a n i z a t i o n s . R a i n f a l l d a t a c o v e r p e r i o d s o f o n e t o o v e r 100 y e a r s , w i t h m o r e t h a n 6 0 0 0 s t a t i o n s h a v i n g p r o d u c e d r e c o r d s o f 3 0 t o 5 0 y e a r s , w h i c h i s c o n s i d e r e d a n a c c e p t a b l e l e n g t h o f t i m e f o r s t a t i s t i c a l a n a l y s i s . M o r e c o m p l e t e s u m m a r i e s o f a v a i l a b l e h y d r o l o g i c d a t a , i n c l u d i n g p r e c i p i t a t i o n a r e g i v e n i n r e f e r e n c e s 1 8 * a n d 1 9 .
L i m i t a t i o n s o f R a i n f a l l D a t a . 1 . G a g e D e n s i t y : C o m p a r i s o n o f t h e c a t c h o f g a g e s o f v a r i o u s d i a m e t e r s d i s c l o s e d n o s i g n i f i c a n t d i f f e r e n c e ( R e f . 3) . T h e s a m p l e c a u g h t i s e x t r e m e l y s m a l l w h e n c o m p a r e d t o t h e a r e a i t i s s u p p o s e d t o r e p r e s e n t ( a v e r a g e
* See B I B L I O G R A P H Y at end of t h i s a r t i c l e for a l l r e f e r e n c e s .
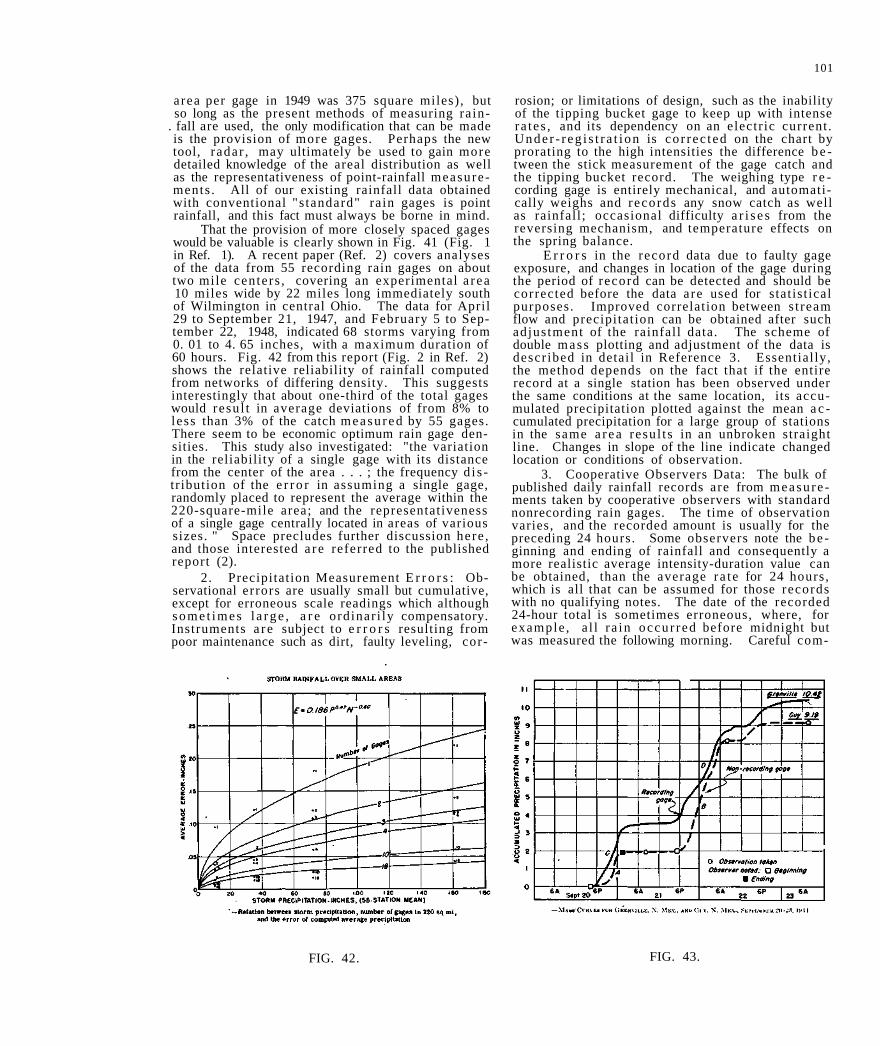
area per gage in 1949 was 375 square miles), but so long as the present methods of measuring ra in-
. fall are used, the only modification that can be made is the provision of more gages. Perhaps the new tool, radar , may ultimately be used to gain more detailed knowledge of the areal distribution as well as the representativeness of point-rainfall measurements . All of our existing rainfall data obtained with conventional "s tandard" rain gages is point rainfall, and this fact must always be borne in mind.
That the provision of more closely spaced gages would be valuable is clearly shown in Fig. 41 (Fig. 1 in Ref. 1). A recent paper (Ref. 2) covers analyses of the data from 55 recording rain gages on about two mile centers , covering an experimental a rea 10 miles wide by 22 miles long immediately south of Wilmington in central Ohio. The data for April 29 to September 21, 1947, and February 5 to September 22, 1948, indicated 68 storms varying from 0. 01 to 4. 65 inches, with a maximum duration of 60 hours. Fig. 42 from this report (Fig. 2 in Ref. 2) shows the relative reliability of rainfall computed from networks of differing density. This suggests interestingly that about one-third of the total gages would resu l t in average deviations of from 8% to less than 3% of the catch measu red by 55 gages. There seem to be economic optimum rain gage densities. This study also investigated: "the variation in the reliability of a single gage with its distance from the center of the area . . . ; the frequency d i s tribution of the e r r o r in assuming a single gage, randomly placed to represent the average within the 220-square-mile area; and the representativeness of a single gage centrally located in areas of various sizes. " Space precludes further discussion here , and those interested a r e referred to the published report (2).
2. Precipitation Measurement E r r o r s : Observational errors are usually small but cumulative, except for erroneous scale readings which although some t imes l a rge , a r e ordinar i ly compensatory. Instruments a r e subject to e r r o r s resulting from poor maintenance such as dirt, faulty leveling, cor-
FIG. 42.
rosion; or limitations of design, such as the inability of the tipping bucket gage to keep up with intense ra tes , and its dependency on an electr ic current . Unde r - r eg i s t r a t i on is co r rec ted on the chart by prorating to the high intensities the difference b e tween the stick measurement of the gage catch and the tipping bucket record. The weighing type r e cording gage is entirely mechanical, and automatically weighs and records any snow catch as well as rainfall; occasional difficulty a r i s e s from the reversing mechanism, and temperature effects on the spring balance.
E r r o r s in the record data due to faulty gage exposure, and changes in location of the gage during the period of record can be detected and should be corrected before the data are used for stat ist ical purposes. Improved correlation between s t ream flow and precipitat ion can be obtained after such adjustment of the rainfall data. The scheme of double mass plotting and adjustment of the data is descr ibed in detail in Reference 3. Essential ly, the method depends on the fact that if the entire record at a single station has been observed under the same conditions at the same location, its accumulated precipitation plotted against the mean a c cumulated precipitation for a large group of stations in the same a r ea resu l t s in an unbroken straight line. Changes in slope of the line indicate changed location or conditions of observation.
3. Cooperative Observers Data: The bulk of published daily rainfall records are from measu re ments taken by cooperative observers with standard nonrecording rain gages. The time of observation varies, and the recorded amount is usually for the preceding 24 hours. Some observers note the be ginning and ending of rainfall and consequently a more realistic average intensity-duration value can be obtained, than the average r a t e for 24 hours, which is all that can be assumed for those records with no qualifying notes. The date of the recorded 24-hour total is sometimes erroneous, where, for example , a l l r a in occur red before midnight but was measured the following morning. Careful com-
FIG. 43.
101
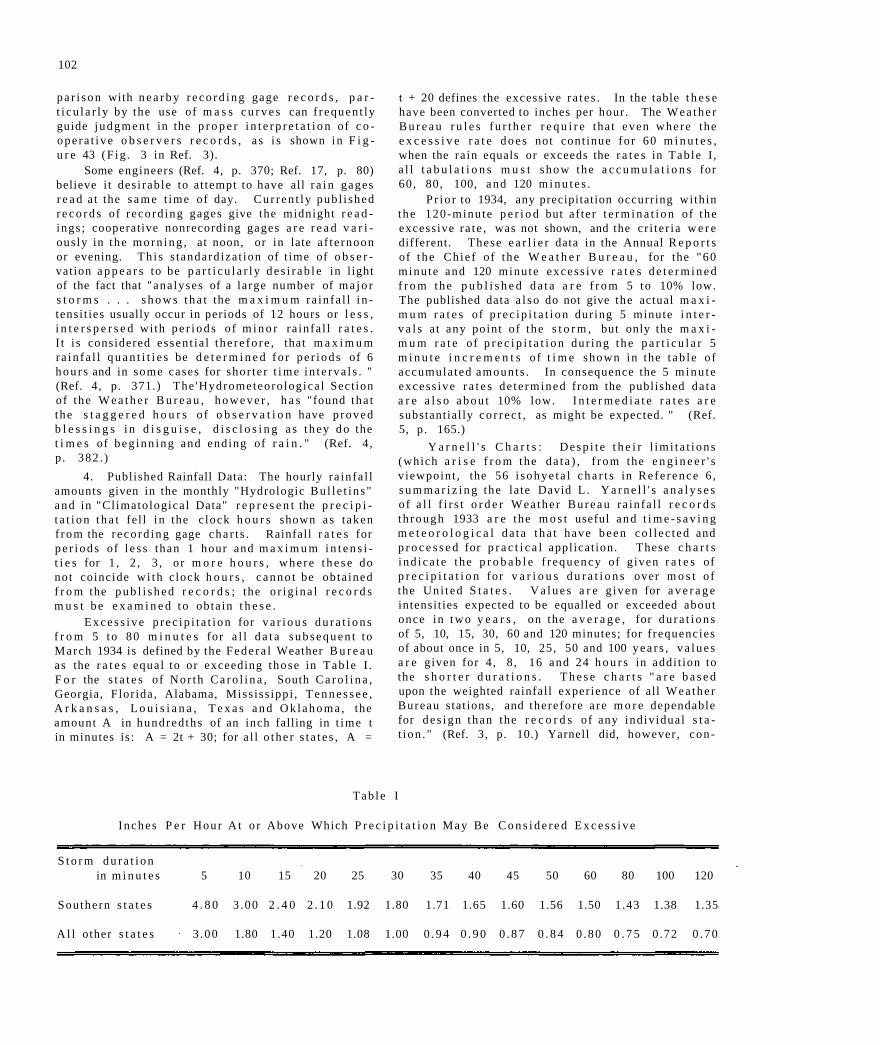
102
p a r i s o n with n e a r b y r e c o r d i n g gage r e c o r d s , p a r t i c u l a r l y by the use of m a s s c u r v e s can f r equen t ly guide j udgmen t in the p r o p e r i n t e r p r e t a t i o n of c o ope ra t i ve o b s e r v e r s r e c o r d s , a s i s shown i n F i g u r e 43 (F ig . 3 in Ref. 3).
Some engineers (Ref. 4, p. 370; Ref. 17, p. 80) believe i t des i rab le to a t tempt to have all r a i n gages r e a d at the s a m e t ime of day. C u r r e n t l y pub l i shed r e c o r d s of r eco rd ing gages give the midnight r e a d ings ; cooperative nonrecording gages a r e r e a d v a r i ous ly in the m o r n i n g , at noon, or in late a f t e rnoon or evening. Th i s s tandard iza t ion of t ime of o b s e r vat ion a p p e a r s to be p a r t i c u l a r l y d e s i r a b l e in l ight of the fact that "ana lyses of a large number of m a j o r s t o r m s . . . s h o w s t h a t the m a x i m u m ra in fa l l i n tensi t ies usually occur in periods of 12 hours or l e s s , i n t e r s p e r s e d wi th p e r i o d s o f m i n o r ra in fa l l r a t e s . I t i s considered essen t ia l t he r e fo re , that m a x i m u m ra in fa l l q u a n t i t i e s be d e t e r m i n e d f o r p e r i o d s of 6 h o u r s and in some cases for shor te r t i m e i n t e r v a l s . " (Ref. 4, p. 371.) The 'Hydrometeoro log ica l Sect ion of the W e a t h e r B u r e a u , h o w e v e r , h a s "found tha t the s t a g g e r e d h o u r s o f o b s e r v a t i o n have p roved b l e s s i n g s i n d i s g u i s e , d i s c l o s i n g a s t hey d o the t i m e s of b e g i n n i n g and ending of r a i n . " (Ref. 4, p. 382 . )
4. Published Rainfall Data: The hourly ra in fa l l amounts given in the monthly "Hydrologic Bu l l e t i n s " and in "Cl imatologica l Data" r e p r e s e n t the p r e c i p i t a t i o n t h a t fe l l i n the c lock h o u r s shown as taken f r o m the r eco rd ing gage cha r t s . Rainfall r a t e s for p e r i o d s of l e s s than 1 hour and m a x i m u m i n t e n s i t i e s for 1 , 2 , 3 , o r m o r e h o u r s , w h e r e t h e s e do not coincide w i th c lock h o u r s , c a n n o t be obta ined f r o m the p u b l i s h e d r e c o r d s ; the o r ig ina l r e c o r d s m u s t b e e x a m i n e d t o obta in t h e s e .
E x c e s s i v e p r e c i p i t a t i o n for v a r i o u s d u r a t i o n s f r o m 5 to 80 m i n u t e s for a l l d a t a s u b s e q u e n t to March 1934 is defined by the F e d e r a l Weather B u r e a u as the r a t e s equal to or exceeding those in Tab le I . F o r the s t a t e s of Nor th C a r o l i n a , South C a r o l i n a , Georgia, Flor ida , Alabama, Miss iss ippi , T e n n e s s e e , A r k a n s a s , L o u i s i a n a , T e x a s a n d O k l a h o m a , the amount A in hundred ths of an inch falling in t ime t in minutes is : A = 2t + 30; for a l l o the r s t a t e s , A =
t + 20 defines the excessive r a t e s . In the table t h e s e have been converted to inches per hour. The W e a t h e r B u r e a u r u l e s f u r t h e r r e q u i r e tha t even where the e x c e s s i v e r a t e d o e s not cont inue for 60 m i n u t e s , when the ra in equals or exceeds the r a t e s in Tab le I , a l l t a b u l a t i o n s m u s t show the a c c u m u l a t i o n s for 60 , 80, 100, and 120 m i n u t e s .
P r i o r to 1934, any precipitation occurr ing wi thin the 120-minute p e r i o d but af ter t e r m i n a t i o n of the excessive ra t e , was not shown, and the c r i te r ia w e r e different. These e a r l i e r data in the Annual R e p o r t s of t h e Chie f of the W e a t h e r B u r e a u , for the "60 minu te and 120 minu te excess ive r a t e s d e t e r m i n e d f r o m the p u b l i s h e d d a t a a r e f r o m 5 to 10% low. The published data a l s o do not give the actual m a x i m u m r a t e s of p r e c i p i t a t i o n dur ing 5 minute i n t e r v a l s a t any point of the s t o r m , but only the m a x i m u m r a t e of p r e c i p i t a t i o n dur ing t h e p a r t i c u l a r 5 m i n u t e i n c r e m e n t s o f t i m e shown in the t ab l e o f accumula ted amounts . In consequence the 5 m i n u t e excess ive r a t e s de t e rmined from the published da ta a r e a l s o a b o u t 10% low. I n t e r m e d i a t e r a t e s a r e substantial ly c o r r e c t , as might be expected. " (Ref. 5, p . 165.)
Y a r n e l l ' s C h a r t s : D e s p i t e t h e i r l i m i t a t i o n s (which a r i s e f r o m the da t a ) , f r o m the e n g i n e e r ' s v iewpoint , the 56 i s o h y e t a l c h a r t s in Re fe r ence 6, s u m m a r i z i n g the la te David L . Y a r n e l l ' s a n a l y s e s o f a l l f i r s t o r d e r Wea the r B u r e a u ra in fa l l r e c o r d s t h rough 1933 a r e the m o s t useful and t i m e - s a v i n g m e t e o r o l o g i c a l da ta t ha t have b e e n co l l ec t ed and p r o c e s s e d for p r a c t i c a l appl icat ion. These c h a r t s i nd i ca t e the p r o b a b l e f r equency of g iven r a t e s of p r e c i p i t a t i o n for v a r i o u s d u r a t i o n s over m o s t o f the Un i t ed S t a t e s . V a l u e s a r e g iven for a v e r a g e intensi t ies expected to be equalled or exceeded about once in two y e a r s , on the a v e r a g e , for d u r a t i o n s of 5, 10, 15, 30, 60 and 120 minutes; for f requencies of about once in 5, 10, 25, 50 and 100 y e a r s , v a l u e s a r e given for 4, 8 , 16 and 24 h o u r s in addi t ion to the s h o r t e r d u r a t i o n s . T h e s e c h a r t s " a r e b a s e d upon the weighted rainfall experience of all Wea the r Bureau stat ions, and therefore a re m o r e dependable for d e s i g n than the r e c o r d s of any indiv idual s t a t i on . " (Ref. 3, p. 10.) Yarnell did, however, con -
Tab le I
I nches P e r Hour A t o r Above Which P r e c i p i t a t i o n May Be C o n s i d e r e d E x c e s s i v e
S t o r m d u r a t i o n in m i n u t e s 5 10 15 20 25 30 35 40 45 50 60 80 100 120
Southern s t a t e s 4 . 8 0 3 .00 2 . 4 0 2 . 1 0 1.92 1.80 1.71 1.65 1.60 1.56 1.50 1.43 1.38 1.35
A l l other s t a t e s 3 .00 1.80 1.40 1.20 1.08 1.00 0 . 9 4 0 . 9 0 0 . 8 7 0 . 8 4 0 .80 0 . 7 5 0 .72 0 .70
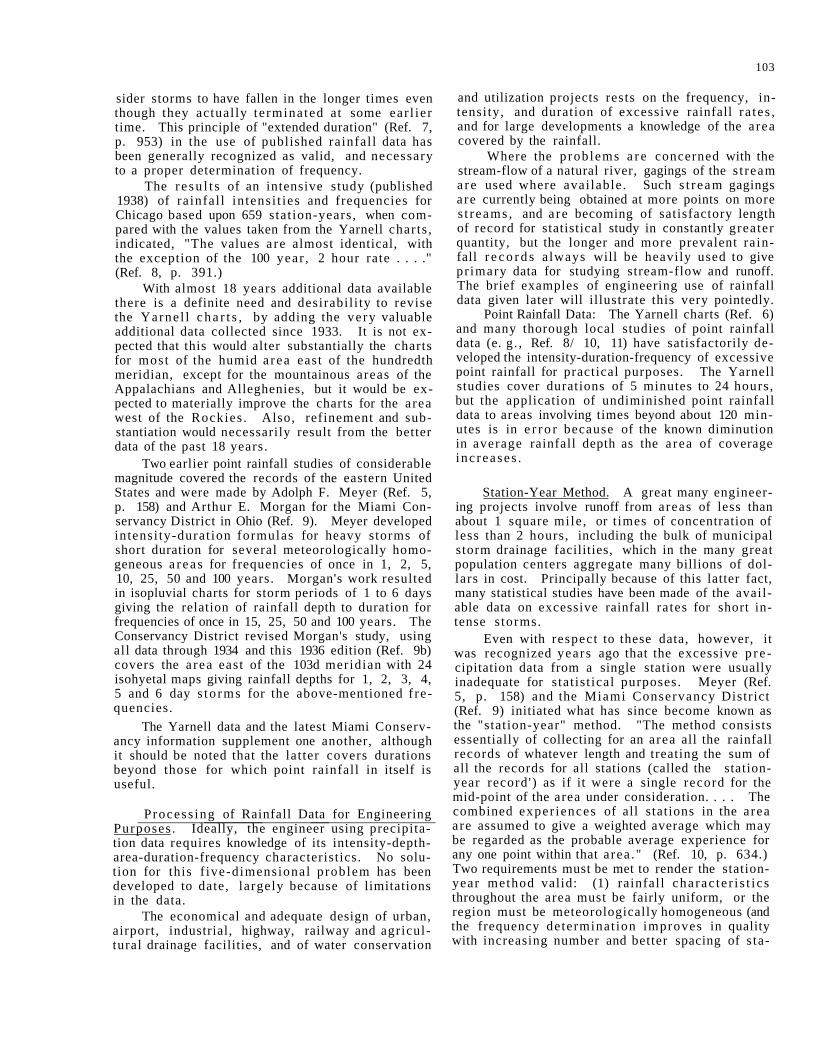
103
sider storms to have fallen in the longer times even though they actual ly te rmina ted at some ear l ie r time. This principle of "extended duration" (Ref. 7, p. 953) in the use of published rainfal l data has been generally recognized as valid, and necessary to a proper determination of frequency.
The r e s u l t s of an intensive study (published 1938) of ra infal l in tens i t ies and frequencies for Chicago based upon 659 stat ion-years, when compared with the values taken from the Yarnell char ts , indicated, "The values a re almost identical, with the exception of the 100 year , 2 hour rate . . . ." (Ref. 8, p. 391.)
With almost 18 years additional data available there is a definite need and desirabil i ty to revise the Yarne l l c h a r t s , by adding the ve ry valuable additional data collected since 1933. It is not expected that this would alter substantially the charts for most of the humid a rea east of the hundredth meridian, except for the mountainous areas of the Appalachians and Alleghenies, but it would be expected to materially improve the charts for the area west of the Rockies . Also, refinement and substantiation would necessarily result from the better data of the past 18 years.
Two earlier point rainfall studies of considerable magnitude covered the records of the eastern United States and were made by Adolph F. Meyer (Ref. 5, p. 158) and Arthur E. Morgan for the Miami Conservancy District in Ohio (Ref. 9). Meyer developed intensi ty-durat ion formulas for heavy storms of short duration for several meteorologically homogeneous a r ea s for frequencies of once in 1, 2, 5, 10, 25, 50 and 100 years. Morgan's work resulted in isopluvial charts for storm periods of 1 to 6 days giving the relation of rainfall depth to duration for frequencies of once in 15, 25, 50 and 100 years. The Conservancy District revised Morgan's study, using all data through 1934 and this 1936 edition (Ref. 9b) covers the a rea east of the 103d meridian with 24 isohyetal maps giving rainfall depths for 1, 2, 3, 4, 5 and 6 day s to rms for the above-mentioned f re quencies.
The Yarnell data and the latest Miami Conservancy information supplement one another, although it should be noted that the latter covers durations beyond those for which point rainfall in itself is useful.
P rocess ing of Rainfall Data for Engineering Purposes . Ideally, the engineer using precipitation data requires knowledge of its intensity-depth-area-duration-frequency characteristics. No solution for this f ive-dimensional problem has been developed to date, largely because of limitations in the data.
The economical and adequate design of urban, airport, industrial, highway, railway and agricultural drainage facilities, and of water conservation
and utilization projects rests on the frequency, intensity, and duration of excessive rainfall ra tes , and for large developments a knowledge of the area covered by the rainfall.
Where the prob lems a r e concerned with the stream-flow of a natural river, gagings of the s t ream a re used where avai lable. Such s t r eam gagings are currently being obtained at more points on more s t r eams , and a re becoming of satisfactory length of record for statistical study in constantly greater quantity, but the longer and more prevalent ra infall r e c o r d s always will be heavily used to give pr imary data for studying stream-flow and runoff. The brief examples of engineering use of rainfall data given later will illustrate this very pointedly.
Point Rainfall Data: The Yarnell charts (Ref. 6) and many thorough local studies of point rainfall data (e. g . , Ref. 8/ 10, 11) have satisfactorily developed the intensity-duration-frequency of excessive point rainfall for practical purposes. The Yarnell studies cover durations of 5 minutes to 24 hours, but the application of undiminished point rainfall data to areas involving times beyond about 120 minutes is in e r r o r because of the known diminution in average rainfall depth as the a rea of coverage inc reases .
Station-Year Method. A great many engineering projects involve runoff from areas of less than about 1 square mile , or t imes of concentration of less than 2 hours, including the bulk of municipal storm drainage facilities, which in the many great population centers aggregate many billions of dollars in cost. Principally because of this latter fact, many statistical studies have been made of the available data on excessive rainfall ra tes for short intense s torms.
Even with respect to these data, however, it was recognized years ago that the excessive p r e cipitation data from a single station were usually inadequate for s tat is t ical purposes. Meyer (Ref. 5, p. 158) and the Miami Conservancy District (Ref. 9) initiated what has since become known as the "station-year" method. "The method consists essentially of collecting for an area all the rainfall records of whatever length and treating the sum of all the records for all stations (called the station-year record ') as if it were a single record for the mid-point of the area under consideration. . . . The combined exper iences of all stations in the area are assumed to give a weighted average which may be regarded as the probable average experience for any one point within that a rea ." (Ref. 10, p. 634.) Two requirements must be met to render the station-year method valid: (1) rainfall charac te r i s t i c s throughout the area must be fairly uniform, or the region must be meteorologically homogeneous (and the frequency determinat ion improves in quality with increasing number and better spacing of s ta-
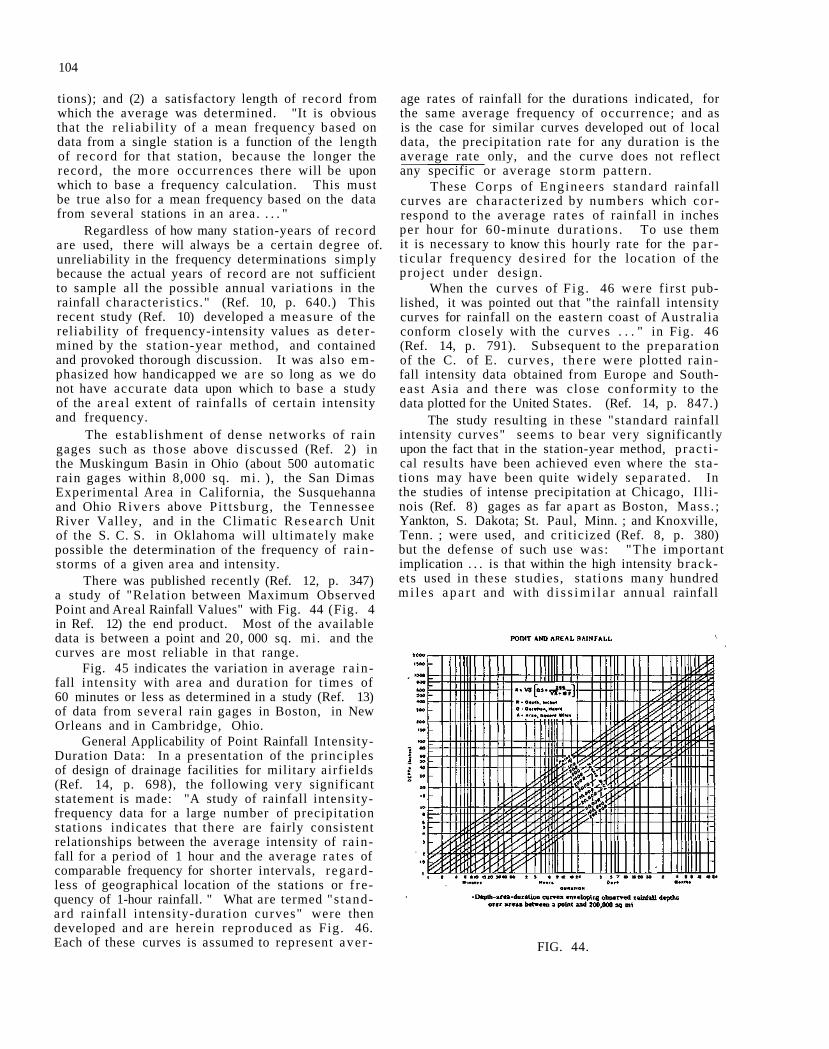
104
tions); and (2) a satisfactory length of record from which the average was determined. "It is obvious that the rel iabi l i ty of a mean frequency based on data from a single station is a function of the length of record for that station, because the longer the record, the more occurrences there will be upon which to base a frequency calculation. This must be true also for a mean frequency based on the data from several stations in an area . . . . "
Regardless of how many station-years of record are used, there will always be a certain degree of. unreliability in the frequency determinations simply because the actual years of record are not sufficient to sample all the possible annual variations in the rainfall characterist ics." (Ref. 10, p. 640.) This recent study (Ref. 10) developed a measure of the reliability of frequency-intensity values as de te r mined by the stat ion-year method, and contained and provoked thorough discussion. It was also emphasized how handicapped we a re so long as we do not have accurate data upon which to base a study of the a rea l extent of rainfalls of certain intensity and frequency.
The establishment of dense networks of rain gages such as those above discussed (Ref. 2) in the Muskingum Basin in Ohio (about 500 automatic rain gages within 8,000 sq. mi. ), the San Dimas Experimental Area in California, the Susquehanna and Ohio Rivers above Pi t t sburg, the Tennessee River Valley, and in the Climatic Research Unit of the S. C. S. in Oklahoma will ult imately make possible the determination of the frequency of ra instorms of a given area and intensity.
There was published recently (Ref. 12, p. 347) a study of "Relation between Maximum Observed Point and Areal Rainfall Values" with Fig. 44 (Fig. 4 in Ref. 12) the end product. Most of the available data is between a point and 20, 000 sq. mi. and the curves are most reliable in that range.
Fig. 45 indicates the variation in average ra infall intensity with area and duration for t imes of 60 minutes or less as determined in a study (Ref. 13) of data from several rain gages in Boston, in New Orleans and in Cambridge, Ohio.
General Applicability of Point Rainfall Intensity-Duration Data: In a presentation of the principles of design of drainage facilities for military airfields (Ref. 14, p. 698), the following very significant statement is made: "A study of rainfall intensity-frequency data for a large number of precipitation stations indicates that there are fairly consistent relationships between the average intensity of ra infall for a period of 1 hour and the average ra tes of comparable frequency for shorter intervals, r ega rd less of geographical location of the stations or f requency of 1-hour rainfall. " What are termed "s tandard rainfall intensity-duration curves" were then developed and a r e herein reproduced as Fig. 46. Each of these curves is assumed to represent ave r
age rates of rainfall for the durations indicated, for the same average frequency of occurrence; and as is the case for similar curves developed out of local data, the precipitation rate for any duration is the average rate only, and the curve does not reflect any specific or average s torm pattern.
These Corps of Engineers s tandard rainfall curves are character ized by numbers which cor respond to the average ra tes of rainfall in inches per hour for 60-minute dura t ions . To use them it is necessary to know this hourly rate for the pa r t icu lar frequency des i red for the location of the project under design.
When the curves of F ig . 46 were f i rs t published, it was pointed out that "the rainfall intensity curves for rainfall on the eastern coast of Australia conform closely with the curves . . . " in Fig. 46 (Ref. 14, p. 791). Subsequent to the preparation of the C. of E. curves , t he r e were plotted ra infall intensity data obtained from Europe and Southeas t Asia and there was close conformity to the data plotted for the United States. (Ref. 14, p. 847.)
The study resulting in these "standard rainfall intensity curves" seems to bear very significantly upon the fact that in the station-year method, p rac t i cal results have been achieved even where the s tations may have been quite widely separated. In the studies of intense precipitation at Chicago, I l l i nois (Ref. 8) gages as far apar t as Boston, Mass . ; Yankton, S. Dakota; St. Paul, Minn. ; and Knoxville, Tenn. ; were used, and crit icized (Ref. 8, p. 380) but the defense of such use was: "The important implication . . . is that within the high intensity brackets used in these studies, stations many hundred m i l e s a p a r t and with d i s s i m i l a r annual rainfall
FIG. 44.
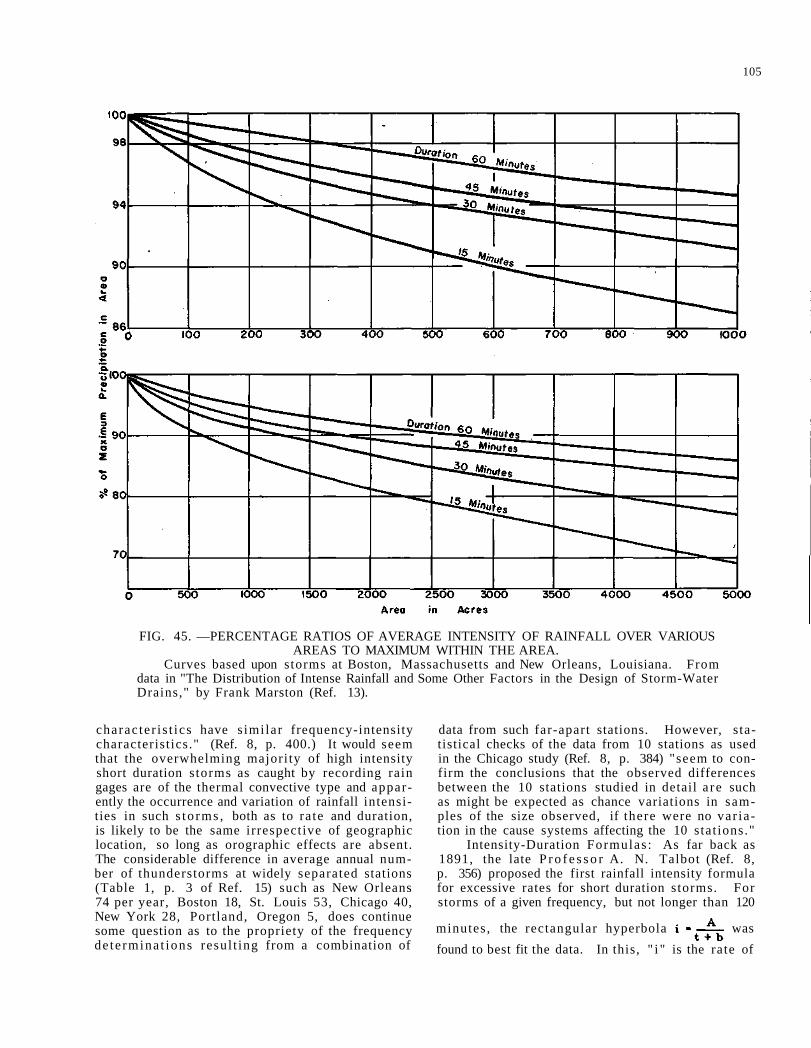
105
FIG. 45. —PERCENTAGE RATIOS OF AVERAGE INTENSITY OF RAINFALL OVER VARIOUS AREAS TO MAXIMUM WITHIN THE AREA.
Curves based upon storms at Boston, Massachusetts and New Orleans, Louisiana. From data in "The Distribution of Intense Rainfall and Some Other Factors in the Design of Storm-Water Drains," by Frank Marston (Ref. 13).
charac ter i s t ics have s imilar frequency-intensity characteristics." (Ref. 8, p. 400.) It would seem that the overwhelming majori ty of high intensity short duration s torms as caught by recording rain gages are of the thermal convective type and apparently the occurrence and variation of rainfall intensities in such s to rms , both as to ra te and duration, is likely to be the same irrespective of geographic location, so long as orographic effects are absent. The considerable difference in average annual number of thunderstorms at widely separated stations (Table 1, p. 3 of Ref. 15) such as New Orleans 74 per year, Boston 18, St. Louis 53, Chicago 40, New York 28, Portland, Oregon 5, does continue some question as to the propriety of the frequency de te rmina t ions resul t ing from a combination of
data from such far-apart stations. However, s tatistical checks of the data from 10 stations as used in the Chicago study (Ref. 8, p. 384) "seem to confirm the conclusions that the observed differences between the 10 stations studied in detail a re such as might be expected as chance variations in samples of the size observed, if there were no var iation in the cause systems affecting the 10 stat ions."
Intensity-Duration Formulas : As far back as 1891, the late P r o f e s s o r A. N. Talbot (Ref. 8, p. 356) proposed the first rainfall intensity formula for excessive rates for short duration storms. For storms of a given frequency, but not longer than 120
minutes , the rectangular hyperbola was found to best fit the data. In this, " i " is the rate of
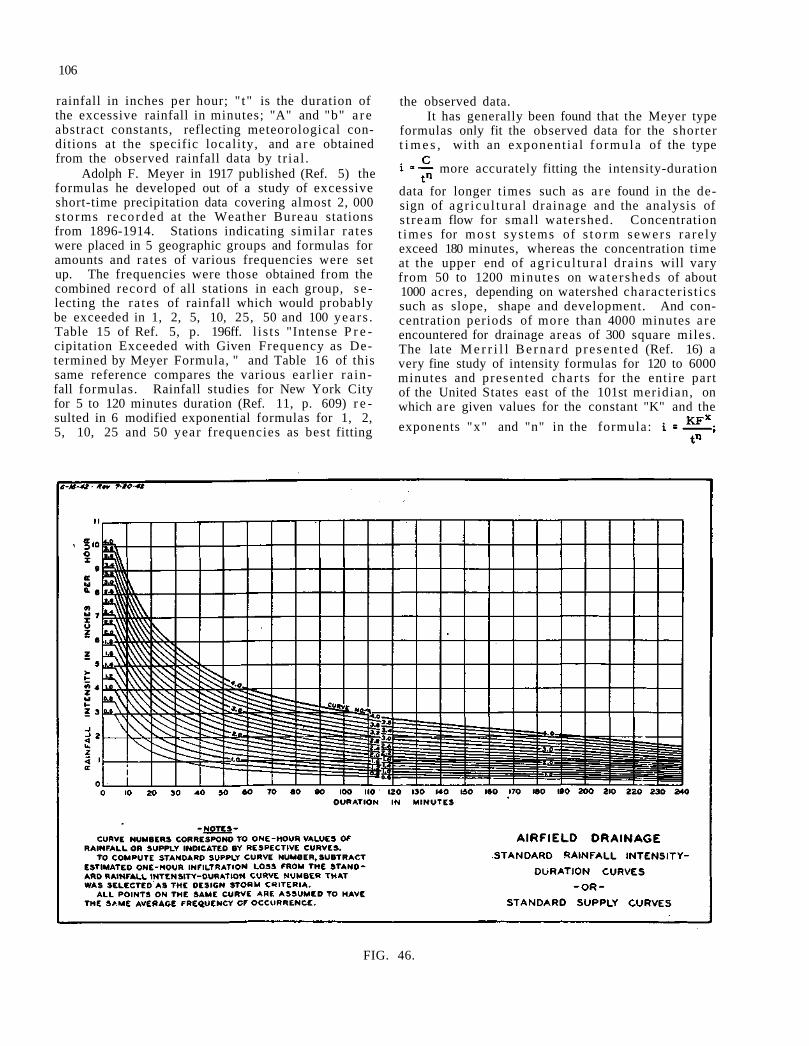
106
rainfall in inches per hour; " t" is the duration of the excessive rainfall in minutes; "A" and "b" a r e abstract constants, reflecting meteorological conditions at the specific locality, and a r e obtained from the observed rainfall data by t r ia l .
Adolph F. Meyer in 1917 published (Ref. 5) the formulas he developed out of a study of excessive short-time precipitation data covering almost 2, 000 s to rms recorded at the Weather Bureau stations from 1896-1914. Stations indicating similar ra tes were placed in 5 geographic groups and formulas for amounts and rates of various frequencies were set up. The frequencies were those obtained from the combined record of all stations in each group, s e lecting the ra tes of rainfall which would probably be exceeded in 1, 2, 5, 10, 25, 50 and 100 years . Table 15 of Ref. 5, p. 196ff. l i s ts "Intense P r e cipitation Exceeded with Given Frequency as Determined by Meyer Formula, " and Table 16 of this same reference compares the various earlier ra infall formulas. Rainfall studies for New York City for 5 to 120 minutes duration (Ref. 11, p. 609) r e sulted in 6 modified exponential formulas for 1, 2, 5, 10, 25 and 50 year frequencies as best fitting
the observed data. It has generally been found that the Meyer type
formulas only fit the observed data for the shorter t i m e s , with an exponent ial fo rmula of the type
more accurately fitting the intensity-duration
data for longer t imes such as a re found in the design of agr icu l tura l drainage and the analysis of s t ream flow for small watershed. Concentration t imes for mos t sys tems of s to rm sewers ra re ly exceed 180 minutes, whereas the concentration time at the upper end of agr icu l tu ra l dra ins will vary from 50 to 1200 minutes on wate rsheds of about 1000 acres, depending on watershed characterist ics such as slope, shape and development. And concentration periods of more than 4000 minutes are encountered for drainage areas of 300 square miles. The late M e r r i l l B e r n a r d p resen ted (Ref. 16) a very fine study of intensity formulas for 120 to 6000 minutes and presented char ts for the entire part of the United States east of the 101st meridian, on which are given values for the constant "K" and the exponents "x" and "n" in the formula:
FIG. 46.
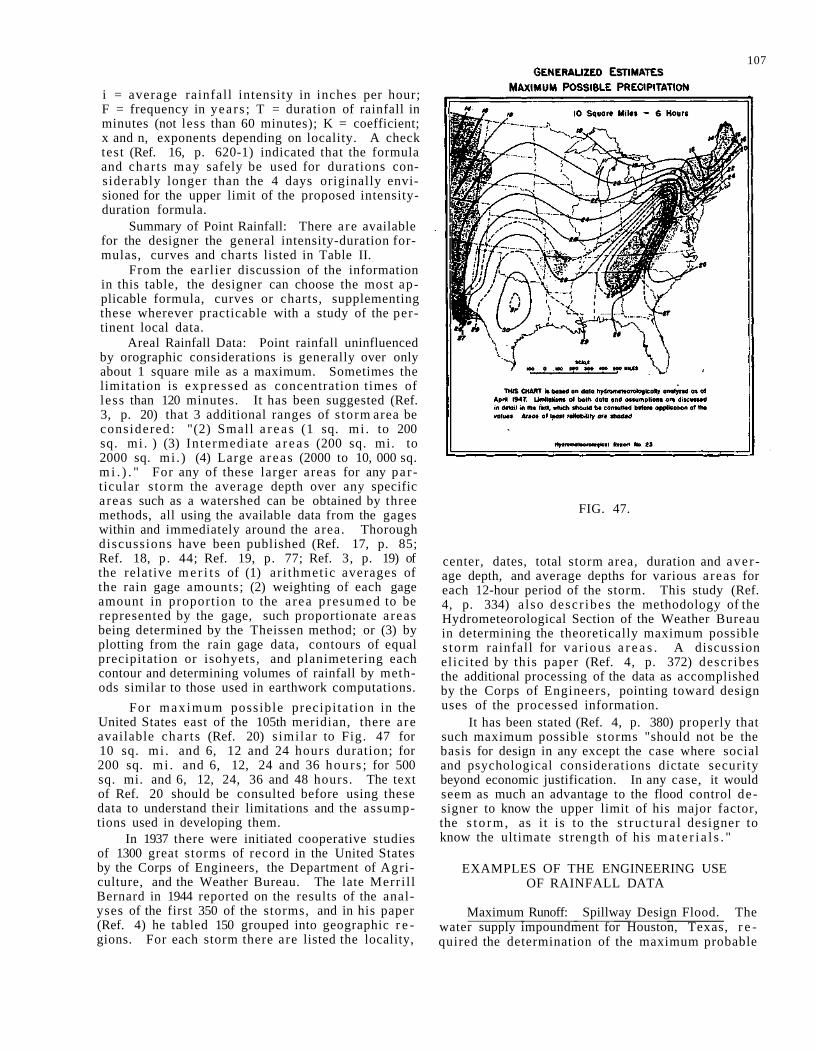
107
i = average rainfall intensity in inches per hour; F = frequency in years ; T = duration of rainfall in minutes (not less than 60 minutes); K = coefficient; x and n, exponents depending on locality. A check test (Ref. 16, p. 620-1) indicated that the formula and charts may safely be used for durations considerably longer than the 4 days originally envisioned for the upper limit of the proposed intensity-duration formula.
Summary of Point Rainfall: There are available for the designer the general intensity-duration formulas, curves and charts listed in Table II.
From the earlier discussion of the information in this table, the designer can choose the most applicable formula, curves or charts, supplementing these wherever practicable with a study of the pertinent local data.
Areal Rainfall Data: Point rainfall uninfluenced by orographic considerations is generally over only about 1 square mile as a maximum. Sometimes the limitation is expressed as concentration times of less than 120 minutes. It has been suggested (Ref. 3, p. 20) that 3 additional ranges of s torm area be considered: "(2) Small a r e a s (1 sq. mi . to 200 sq. mi . ) (3) In termedia te a r e a s (200 sq. mi. to 2000 sq. mi . ) (4) Large a reas (2000 to 10, 000 sq. m i . ) . " For any of these larger areas for any par ticular s torm the average depth over any specific a reas such as a watershed can be obtained by three methods, all using the available data from the gages within and immediately around the area. Thorough discussions have been published (Ref. 17, p. 85; Ref. 18, p. 44; Ref. 19, p. 77; Ref. 3, p. 19) of the relative m e r i t s of (1) ar i thmetic averages of the rain gage amounts; (2) weighting of each gage amount in proportion to the a rea presumed to be represented by the gage, such proportionate a reas being determined by the Theissen method; or (3) by plotting from the rain gage data, contours of equal precipitation or isohyets, and planimetering each contour and determining volumes of rainfall by methods similar to those used in earthwork computations.
For max imum possible precipi tat ion in the United States east of the 105th meridian, there are available char ts (Ref. 20) s imilar to Fig. 47 for 10 sq. mi . and 6, 12 and 24 hours duration; for 200 sq. mi . and 6, 12, 24 and 36 hours ; for 500 sq. mi. and 6, 12, 24, 36 and 48 hours. The text of Ref. 20 should be consulted before using these data to understand their limitations and the assumptions used in developing them.
In 1937 there were initiated cooperative studies of 1300 great storms of record in the United States by the Corps of Engineers, the Department of Agriculture, and the Weather Bureau. The late Merri l l Bernard in 1944 reported on the results of the analyses of the first 350 of the storms, and in his paper (Ref. 4) he tabled 150 grouped into geographic r e gions. For each storm there are listed the locality,
FIG. 47.
center, dates, total storm area, duration and aver age depth, and average depths for various a reas for each 12-hour period of the storm. This study (Ref. 4, p. 334) a lso descr ibes the methodology of the Hydrometeorological Section of the Weather Bureau in determining the theoretically maximum possible s to rm rainfall for var ious a r e a s . A discussion el ici ted by this paper (Ref. 4, p. 372) descr ibes the additional processing of the data as accomplished by the Corps of Engineers, pointing toward design uses of the processed information.
It has been stated (Ref. 4, p. 380) properly that such maximum possible storms "should not be the basis for design in any except the case where social and psychological considerations dictate security beyond economic justification. In any case, it would seem as much an advantage to the flood control designer to know the upper limit of his major factor, the s t o rm , as it is to the s t ruc tu ra l designer to know the ultimate strength of his m a t e r i a l s . "
EXAMPLES OF THE ENGINEERING USE OF RAINFALL DATA
Maximum Runoff: Spillway Design Flood. The water supply impoundment for Houston, Texas, r e quired the determination of the maximum probable
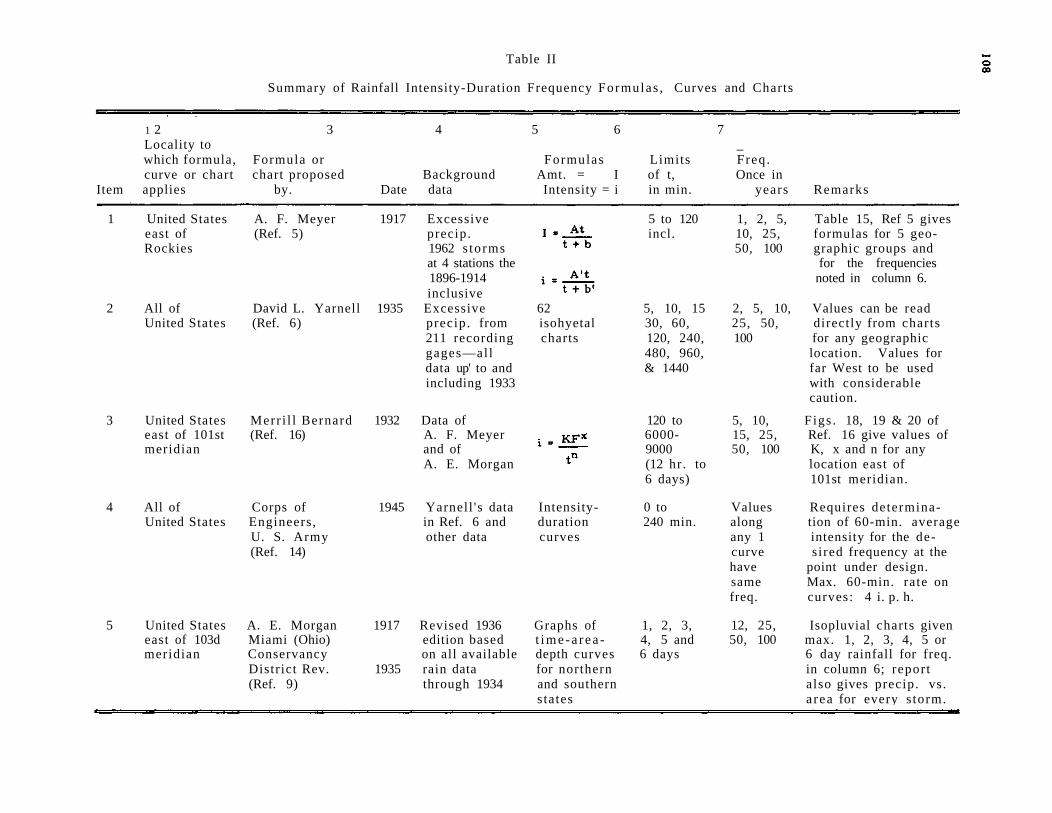
Table II
Summary of Rainfall Intensity-Duration Frequency Formulas , Curves and Charts
1 2 3 4 5 6 7 Locality to _ which formula, Formula or Formulas Limits Freq . curve or chart chart proposed Background Amt. = I of t, Once in
Item applies by. Date data Intensity = i in min. years Remarks
1 United States A. F. Meyer 1917 Excessive 5 to 120 1, 2, 5, Table 15, Ref 5 gives east of (Ref. 5) precip. incl. 10, 25, formulas for 5 geo-Rockies 1962 s torms 50, 100 graphic groups and
at 4 stations the for the frequencies 1896-1914 noted in column 6. inclusive
2 All of David L. Yarnell 1935 Excessive 62 5, 10, 15 2, 5, 10, Values can be read United States (Ref. 6) precip. from isohyetal 30, 60, 25, 50, directly from charts
211 recording charts 120, 240, 100 for any geographic gages—all 480, 960, location. Values for data up' to and & 1440 far West to be used including 1933 with considerable
caution.
3 United States Merr i l l Bernard 1932 Data of 120 to 5, 10, Figs . 18, 19 & 20 of east of 101st (Ref. 16) A. F. Meyer 6000- 15, 25, Ref. 16 give values of meridian and of 9000 50, 100 K, x and n for any
A. E. Morgan (12 hr . to location east of 6 days) 101st meridian.
4 All of Corps of 1945 Yarnell 's data Intensity- 0 to Values Requires determina-United States Engineers, in Ref. 6 and duration 240 min. along tion of 60-min. average
U. S. Army other data curves any 1 intensity for the de-(Ref. 14) curve sired frequency at the
have point under design. same Max. 60-min. rate on freq. curves: 4 i. p. h.
5 United States A. E. Morgan 1917 Revised 1936 Graphs of 1, 2, 3, 12, 25, Isopluvial charts given east of 103d Miami (Ohio) edition based t i m e - a r e a - 4, 5 and 50, 100 max. 1, 2, 3, 4, 5 or meridian Conservancy on all available depth curves 6 days 6 day rainfall for freq.
District Rev. 1935 rain data for northern in column 6; report (Ref. 9) through 1934 and southern also gives precip. vs.
s tates a rea for every s torm.
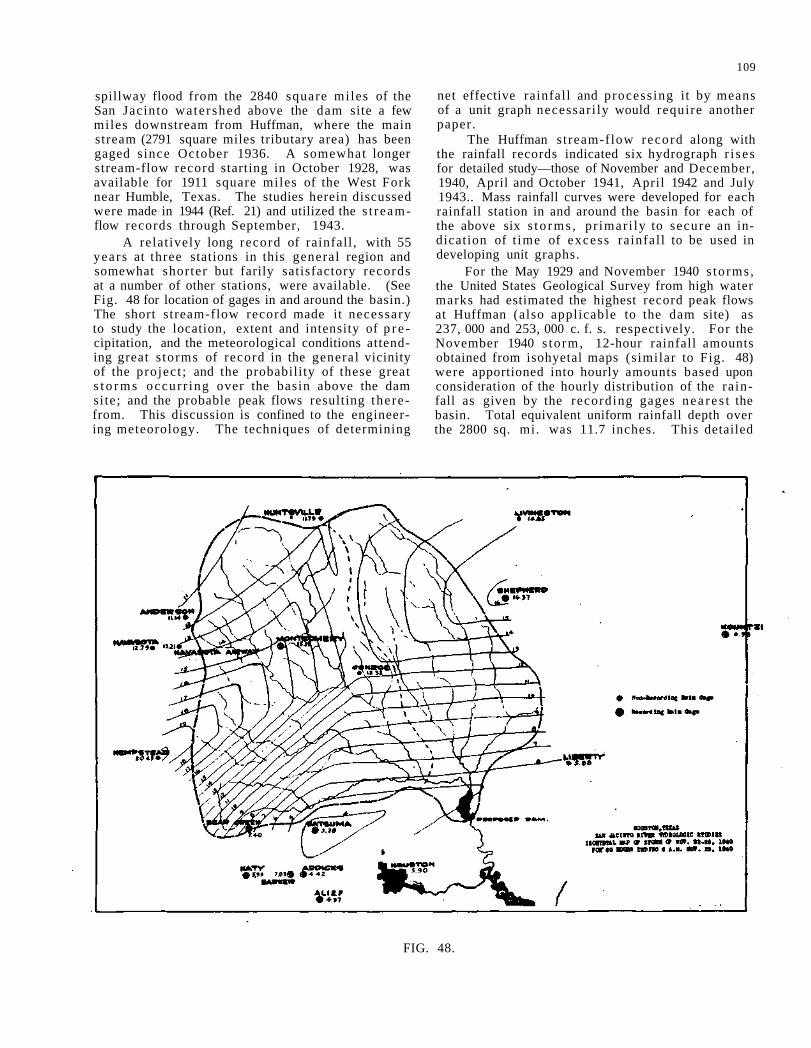
109
spillway flood from the 2840 square miles of the San Jacinto watershed above the dam site a few miles downstream from Huffman, where the main stream (2791 square miles tributary area) has been gaged s ince October 1936. A somewhat longer stream-flow record starting in October 1928, was available for 1911 square miles of the West Fork near Humble, Texas. The studies herein discussed were made in 1944 (Ref. 21) and utilized the s t ream-flow records through September, 1943.
A relat ively long record of rainfall , with 55 years at three stations in this general region and somewhat shorter but farily satisfactory records at a number of other stations, were available. (See Fig. 48 for location of gages in and around the basin.) The short stream-flow record made it necessary to study the location, extent and intensity of p r e cipitation, and the meteorological conditions attending great s torms of record in the general vicinity of the project ; and the probability of these great s t o r m s occur r ing over the basin above the dam site; and the probable peak flows resulting there from. This discussion is confined to the engineering meteorology. The techniques of determining
net effective rainfall and process ing it by means of a unit graph necessar i ly would require another paper.
The Huffman stream-flow record along with the rainfall records indicated six hydrograph r i ses for detailed study—those of November and December, 1940, April and October 1941, April 1942 and July 1943.. Mass rainfall curves were developed for each rainfall station in and around the basin for each of the above six s to rms , pr imar i ly to secure an indication of t ime of excess rainfal l to be used in developing unit graphs.
For the May 1929 and November 1940 s torms , the United States Geological Survey from high water marks had estimated the highest record peak flows at Huffman (also applicable to the dam site) as 237, 000 and 253, 000 c. f. s. respectively. For the November 1940 s to rm, 12-hour rainfall amounts obtained from isohyetal maps (similar to Fig. 48) were apportioned into hourly amounts based upon consideration of the hourly distribution of the ra infall as given by the recording gages nea re s t the basin. Total equivalent uniform rainfall depth over the 2800 sq. mi. was 11.7 inches. This detailed
FIG. 48.
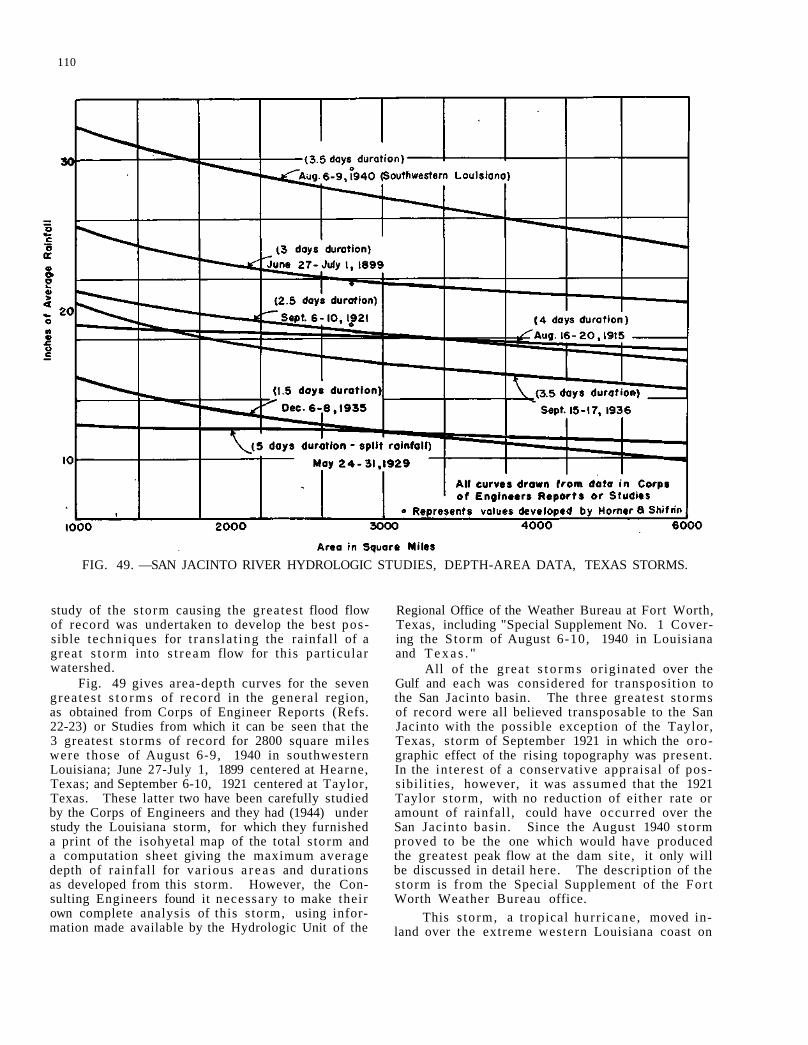
110
FIG. 49. —SAN JACINTO RIVER HYDROLOGIC STUDIES, DEPTH-AREA DATA, TEXAS STORMS.
study of the s torm causing the greatest flood flow of record was undertaken to develop the best possible techniques for t rans la t ing the rainfall of a great s to rm into s t r eam flow for this part icular watershed.
Fig. 49 gives area-depth curves for the seven grea tes t s t o r m s of record in the general region, as obtained from Corps of Engineer Reports (Refs. 22-23) or Studies from which it can be seen that the 3 greatest s torms of record for 2800 square miles were those of August 6-9, 1940 in southwestern Louisiana; June 27-July 1, 1899 centered at Hearne, Texas; and September 6-10, 1921 centered at Taylor, Texas. These latter two have been carefully studied by the Corps of Engineers and they had (1944) under study the Louisiana storm, for which they furnished a print of the isohyetal map of the total s torm and a computation sheet giving the maximum average depth of rainfall for various a r e a s and durations as developed from this storm. However, the Consulting Engineers found it necessary to make their own complete analysis of this s torm, using information made available by the Hydrologic Unit of the
Regional Office of the Weather Bureau at Fort Worth, Texas, including "Special Supplement No. 1 Covering the Storm of August 6-10, 1940 in Louisiana and T e x a s . "
All of the grea t s t o r m s originated over the Gulf and each was considered for transposition to the San Jacinto basin. The three greatest s torms of record were all believed transposable to the San Jacinto with the possible exception of the Taylor, Texas, storm of September 1921 in which the orographic effect of the rising topography was present. In the interest of a conservative appraisal of possibilities, however, it was assumed that the 1921 Taylor s torm, with no reduction of either rate or amount of rainfall , could have occurred over the San Jacinto basin. Since the August 1940 storm proved to be the one which would have produced the greatest peak flow at the dam site, it only will be discussed in detail here. The description of the s torm is from the Special Supplement of the For t Worth Weather Bureau office.
This s torm, a tropical hurr icane , moved inland over the extreme western Louisiana coast on
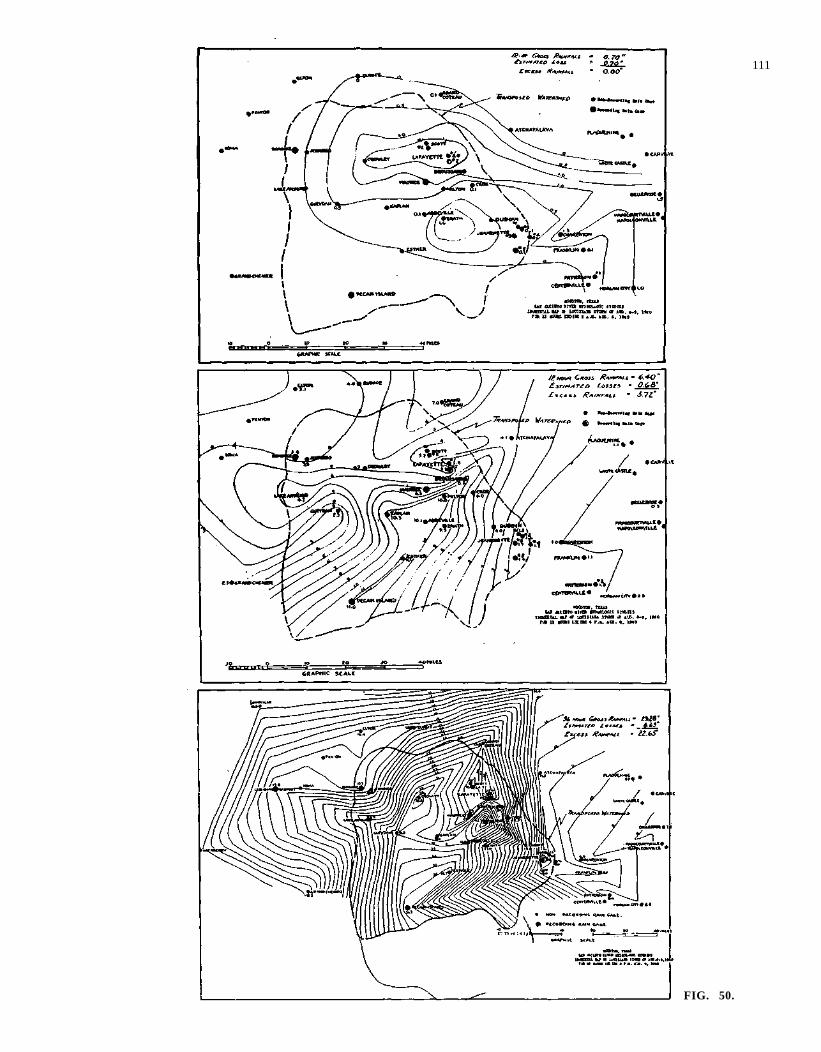
111
FIG. 50.
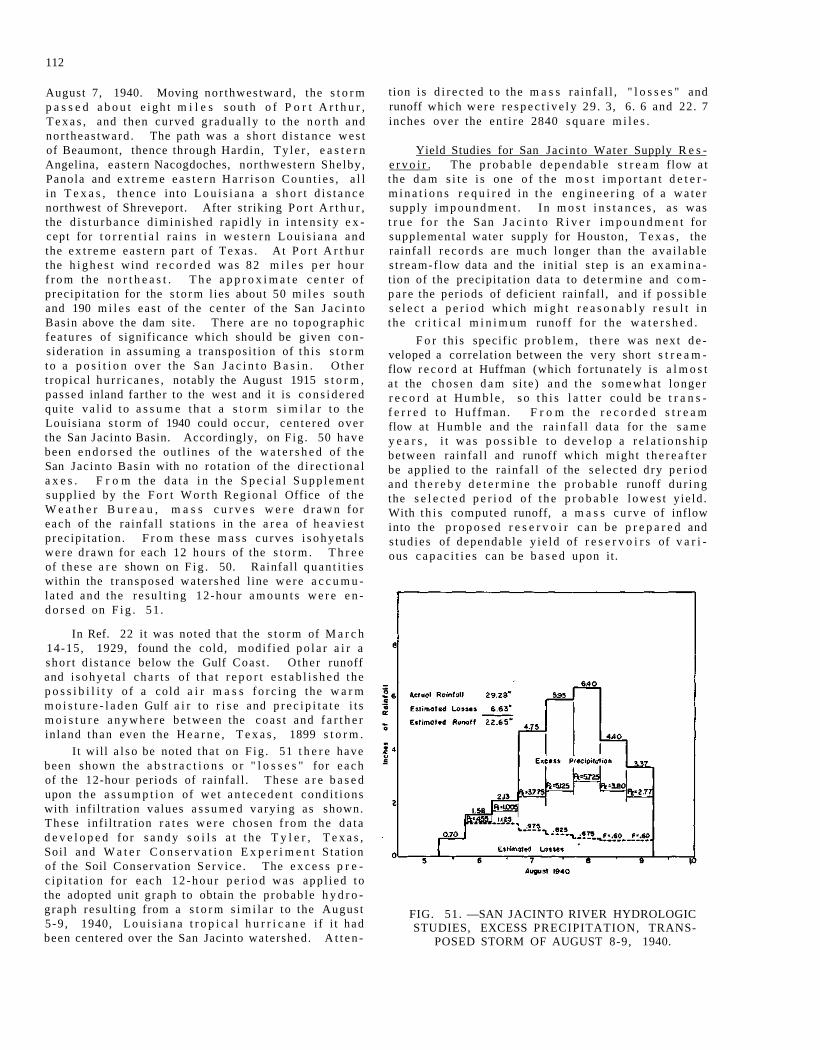
112
August 7, 1940. Moving nor thwes tward , the s t o r m p a s s e d a b o u t e i g h t m i l e s s o u t h o f P o r t A r t h u r , T e x a s , and then curved g r a d u a l l y to the n o r t h and nor theas tward . The path was a shor t d i s t ance w e s t of Beaumont, thence through Hardin, Ty l e r , e a s t e r n Angelina, eas te rn Nacogdoches, nor thwestern Shelby , Panola and e x t r e m e e a s t e r n H a r r i s o n Coun t i e s , a l l in T e x a s , t h e n c e into L o u i s i a n a a s h o r t d i s t a n c e northwest of Shreveport. After str iking P o r t A r t h u r , the d i s t u r b a n c e d imin i shed rap id ly in i n t ens i t y e x cept for t o r r e n t i a l r a i n s in w e s t e r n L o u i s i a n a and the e x t r e m e eas t e rn pa r t of Texas . At P o r t A r t h u r the h i g h e s t wind r e c o r d e d was 82 m i l e s p e r h o u r f r o m the n o r t h e a s t . T h e a p p r o x i m a t e c e n t e r o f precipi ta t ion for the s t o r m l ies about 50 m i l e s sou th and 190 m i l e s eas t of the cen te r of the San J a c i n t o Basin above the dam site. There a r e no topograph ic fea tures of significance which should be given c o n siderat ion in assuming a t ranspos i t ion of t h i s s t o r m to a p o s i t i o n o v e r the San J a c i n t o B a s i n . O the r t ropica l h u r r i c a n e s , notably the August 1915 s t o r m , passed inland farther to the west and it is c o n s i d e r e d qui te v a l i d to a s s u m e tha t a s t o r m s i m i l a r to the Louisiana s t o r m of 1940 could occur , cen te red ove r the San Jacinto Basin. Accordingly, on F ig . 50 have been e n d o r s e d the out l ines of the w a t e r s h e d of the San Jacinto Basin with no rotat ion of the d i r e c t i o n a l a x e s . F r o m the da t a i n the S p e c i a l S u p p l e m e n t suppl ied by the F o r t W o r t h Reg iona l Office of the W e a t h e r B u r e a u , m a s s c u r v e s w e r e d r a w n for each of the ra infal l s ta t ions in the a r e a of h e a v i e s t p rec ip i ta t ion . F r o m these m a s s cu rves i s o h y e t a l s were drawn for each 12 h o u r s of the s t o r m . T h r e e of t h e s e a r e shown on F i g . 50. Rainfal l q u a n t i t i e s within the t r ansposed wa te r shed l ine w e r e a c c u m u la ted and the r e su l t i ng 12-hour a m o u n t s w e r e e n d o r s e d on F i g . 51 .
In Ref. 22 it was noted that the s t o r m of M a r c h 14-15, 1929, found the cold, modi f ied p o l a r a i r a sho r t d i s t ance below the Gulf Coas t . Other runoff and i s o h y e t a l c h a r t s of tha t r e p o r t e s t a b l i s h e d the p o s s i b i l i t y o f a cold a i r m a s s f o r c i n g the w a r m m o i s t u r e - l a d e n Gulf a i r t o r i s e and p r e c i p i t a t e i t s m o i s t u r e a n y w h e r e be tween the c o a s t and f a r t h e r in land than even the H e a r n e , T e x a s , 1899 s t o r m .
I t will a l s o be noted that on F ig . 51 t h e r e have been shown the a b s t r a c t i o n s o r " l o s s e s " for e a c h of the 12-hour periods of rainfal l . These a r e b a s e d upon the a s s u m p t i o n of wet a n t e c e d e n t cond i t ions with inf i l t ra t ion values a s s u m e d vary ing as shown. These inf i l t ra t ion r a t e s w e r e chosen f r o m the da t a d e v e l o p e d for s a n d y s o i l s a t t he T y l e r , T e x a s , Soil and W a t e r C o n s e r v a t i o n E x p e r i m e n t Sta t ion of the Soil Conservat ion Se rv i ce . The e x c e s s p r e c ip i t a t i on for e ach 1 2 - h o u r p e r i o d was app l i ed t o the adopted unit graph to obtain the p robab le h y d r o -graph resu l t ing from a s t o r m s i m i l a r to the Augus t 5 -9 , 1940, L o u i s i a n a t r o p i c a l h u r r i c a n e i f i t had been centered over the San Jacinto watershed. A t t e n
t ion i s d i r e c t e d to the m a s s ra in fa l l , " l o s s e s " and runoff which w e r e r e s p e c t i v e l y 29 . 3, 6. 6 and 22. 7 inches over the en t i r e 2840 s q u a r e m i l e s .
Yield Studies for San Jacinto Water Supply R e s -e r v o i r . The p r o b a b l e d e p e n d a b l e s t r e a m flow a t the d a m s i t e i s one o f t h e m o s t i m p o r t a n t d e t e r m i n a t i o n s r e q u i r e d in t h e e n g i n e e r i n g of a w a t e r supply i m p o u n d m e n t . I n m o s t i n s t a n c e s , a s was t r u e f o r t h e San J a c i n t o R i v e r i m p o u n d m e n t for supplemental water supply for Houston, T e x a s , the rainfall r e c o r d s a r e much longer than the ava i l ab l e s t ream-f low data and the init ial s tep is an e x a m i n a tion of the precipi tat ion da ta to de t e rmine and c o m p a r e the periods of deficient rainfall , and if p o s s i b l e s e l e c t a p e r i o d which m i g h t r e a s o n a b l y r e s u l t in the c r i t i c a l m i n i m u m runoff for the w a t e r s h e d .
F o r th is specific p r o b l e m , t h e r e was nex t d e veloped a correlation between the very short s t r e a m -flow r e c o r d at Huffman (which for tunately is a l m o s t a t the c h o s e n d a m s i te ) and the s o m e w h a t longer r e c o r d a t H u m b l e , s o t h i s l a t t e r could b e t r a n s f e r r e d t o Huffman. F r o m the r e c o r d e d s t r e a m flow at Humble and the r a i n f a l l data for the s a m e y e a r s , i t was p o s s i b l e t o d e v e l o p a r e l a t i o n s h i p be tween rainfal l and runoff which migh t t h e r e a f t e r be applied to the rainfal l of the se lec ted d ry p e r i o d and t h e r e b y d e t e r m i n e t h e p r o b a b l e runoff du r ing the s e l e c t e d p e r i o d of t h e p r o b a b l e l owes t y ie ld . With t h i s computed runoff, a m a s s cu rve of inflow into the p r o p o s e d r e s e r v o i r c a n be p r e p a r e d and s tud ies of dependable y ie ld of r e s e r v o i r s of v a r i ous c a p a c i t i e s can be b a s e d upon it.
FIG. 51. —SAN JACINTO RIVER HYDROLOGIC STUDIES, EXCESS PRECIPITATION, TRANS
POSED STORM OF AUGUST 8-9, 1940.
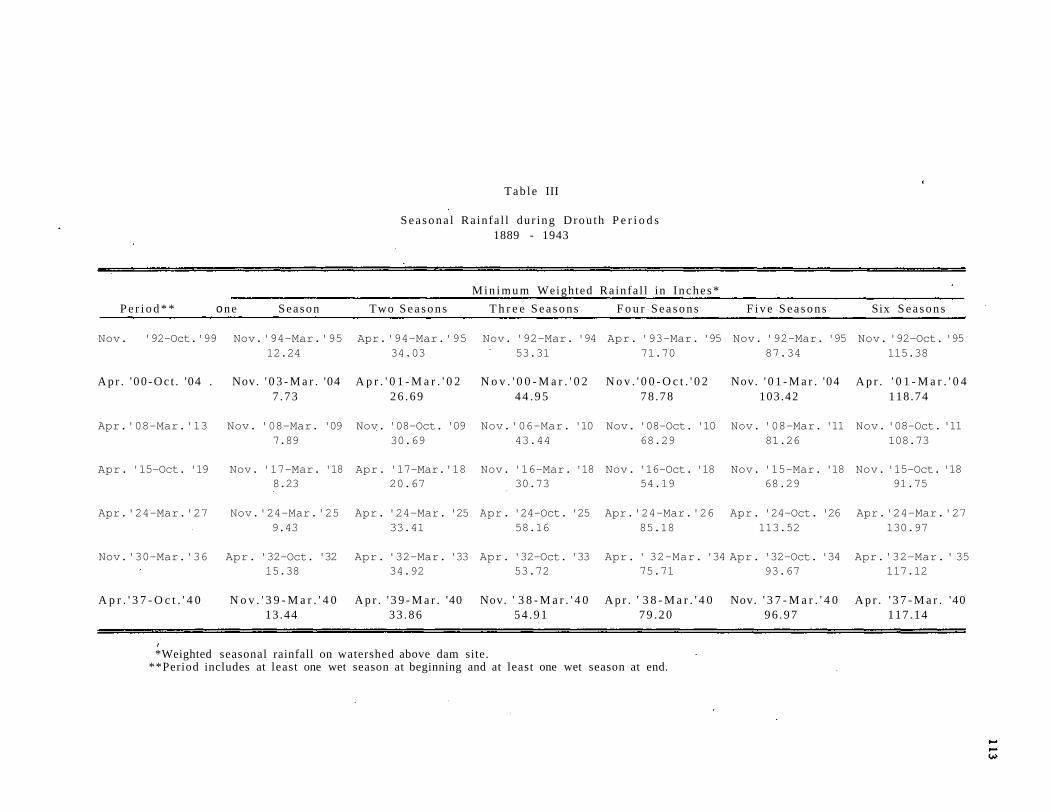
Tab le III
S e a s o n a l Rainfa l l du r ing Drou th P e r i o d s 1889 - 1943
M i n i m u m Weighted Ra infa l l in I n c h e s * P e r i o d * * one Season Two S e a s o n s T h r e e S e a s o n s F o u r S e a s o n s F i v e S e a s o n s Six S e a s o n s
Nov. '92-Oct.'99 Nov.'94-Mar.'95 Apr.'94-Mar.'95 Nov. '92-Mar. '94 Apr. '93-Mar. '95 Nov. '92-Mar. '95 Nov. '92-Oct. '95 12.24 34.03 53.31 71.70 87.34 115.38
A p r . ' 0 0 - O c t . '04 . Nov. ' 0 3 - M a r . '04 A p r . ' 0 1 - M a r . ' 0 2 N o v . ' 0 0 - M a r . ' 0 2 N o v . ' 0 0 - O c t . ' 0 2 Nov. ' 0 1 - M a r . '04 A p r . ' 0 1 - M a r . ' 0 4 7 .73 2 6 . 6 9 4 4 . 9 5 78 .78 103.42 118 .74
Apr.'08-Mar.'13 Nov. '08-Mar. '09 Nov. '08-Oct. '09 Nov.'06-Mar. '10 Nov. '08-Oct. '10 Nov. '08-Mar. '11 Nov. '08-Oct. '11 7.89 30.69 43.44 68.29 81.26 108.73
Apr. '15-Oct. '19 Nov. '17-Mar. '18 Apr. '17-Mar.'18 Nov. '16-Mar. '18 Nov. '16-Oct. '18 Nov. '15-Mar. '18 Nov. '15-Oct. '18 8.23 20.67 30.73 54.19 68.29 91.75
Apr.'24-Mar.'27 Nov.'24-Mar.'25 Apr. '24-Mar. '25 Apr. '24-Oct. '25 Apr.'24-Mar.'26 Apr. '24-Oct. '26 Apr.'24-Mar.'27 9.43 33.41 58.16 85.18 113.52 130.97
Nov.'30-Mar.'36 Apr. '32-Oct. '32 Apr. '32-Mar. '33 Apr. '32-Oct. '33 Apr. ' 32-Mar. '34 Apr. '32-Oct. '34 Apr.'32-Mar. ' 35 15.38 34.92 53.72 75.71 93.67 117.12
A p r . ' 3 7 - O c t . ' 4 0 N o v . ' 3 9 - M a r . ' 4 0 A p r . ' 3 9 - M a r . '40 Nov. ' 3 8 - M a r . ' 4 0 A p r . ' 3 8 - M a r . ' 4 0 Nov. ' 3 7 - M a r . ' 4 0 A p r . ' 3 7 - M a r . '40 13 .44 3 3 . 8 6 5 4 . 9 1 7 9 . 2 0 96 .97 117 .14
*Weighted seasonal rainfall on watershed above dam site. **Period includes at least one wet season at beginning and at least one wet season at end.
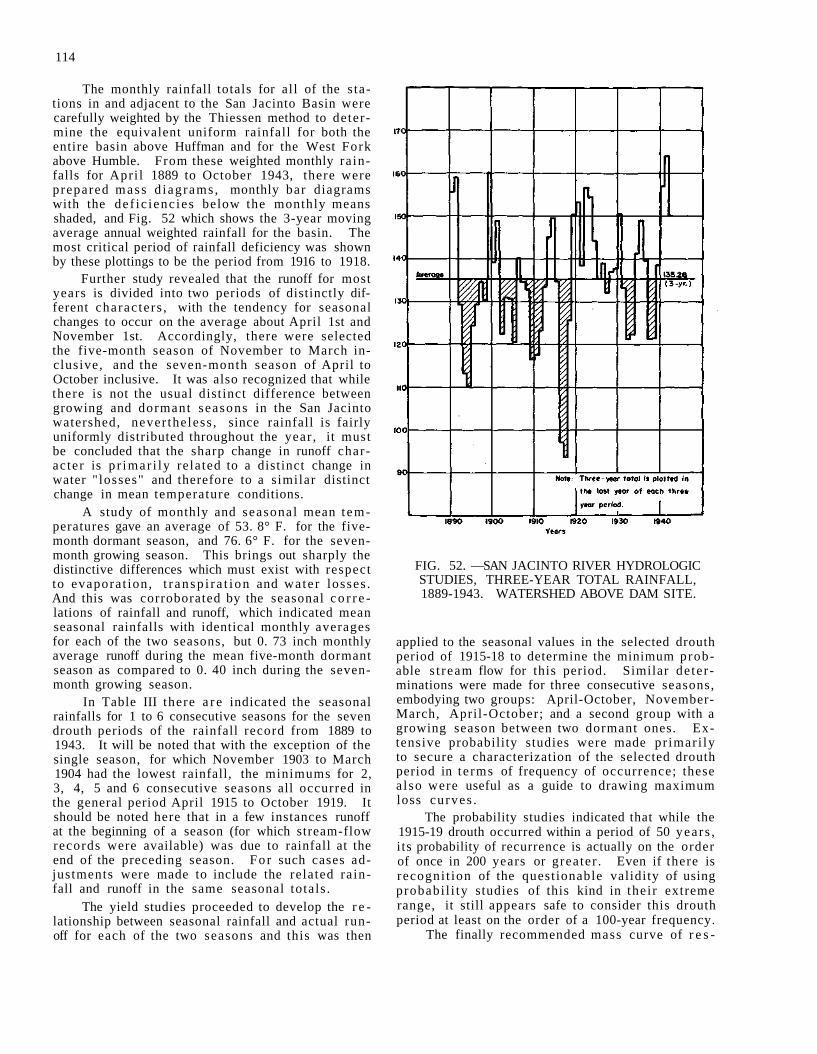
114
The monthly rainfall totals for all of the s tations in and adjacent to the San Jacinto Basin were carefully weighted by the Thiessen method to determine the equivalent uniform rainfall for both the entire basin above Huffman and for the West Fork above Humble. From these weighted monthly ra infalls for Apri l 1889 to October 1943, there were prepared mass d iagrams , monthly bar diagrams with the def ic ienc ies below the monthly means shaded, and Fig. 52 which shows the 3-year moving average annual weighted rainfall for the basin. The most critical period of rainfall deficiency was shown by these plottings to be the period from 1916 to 1918.
Further study revealed that the runoff for most years is divided into two periods of distinctly different charac ters , with the tendency for seasonal changes to occur on the average about April 1st and November 1st. Accordingly, there were selected the five-month season of November to March inclusive, and the seven-month season of April to October inclusive. It was also recognized that while there is not the usual distinct difference between growing and dormant seasons in the San Jacinto watershed, never theless , since rainfall is fairly uniformly distributed throughout the year , it must be concluded that the sharp change in runoff character is p r imar i ly related to a distinct change in water " losses" and therefore to a similar distinct change in mean temperature conditions.
A study of monthly and seasonal mean t emperatures gave an average of 53. 8° F. for the five-month dormant season, and 76. 6° F. for the seven-month growing season. This brings out sharply the distinctive differences which must exist with respect to evaporat ion, t r ansp i r a t i on and water losses . And this was corroborated by the seasonal c o r r e lations of rainfall and runoff, which indicated mean seasonal rainfalls with identical monthly averages for each of the two seasons, but 0. 73 inch monthly average runoff during the mean five-month dormant season as compared to 0. 40 inch during the seven-month growing season.
In Table III there a r e indicated the seasonal rainfalls for 1 to 6 consecutive seasons for the seven drouth periods of the rainfall record from 1889 to 1943. It will be noted that with the exception of the single season, for which November 1903 to March 1904 had the lowest rainfall, the minimums for 2, 3, 4, 5 and 6 consecutive seasons all occurred in the general period April 1915 to October 1919. It should be noted here that in a few instances runoff at the beginning of a season (for which stream-flow records were available) was due to rainfall at the end of the preceding season. For such cases adjustments were made to include the related ra infall and runoff in the same seasonal totals .
The yield studies proceeded to develop the r e lationship between seasonal rainfall and actual runoff for each of the two seasons and this was then
FIG. 52. —SAN JACINTO RIVER HYDROLOGIC STUDIES, THREE-YEAR TOTAL RAINFALL, 1889-1943. WATERSHED ABOVE DAM SITE.
applied to the seasonal values in the selected drouth period of 1915-18 to determine the minimum probable s t ream flow for this period. Similar de ter minations were made for three consecutive seasons, embodying two groups: April-October, November-March, April-October; and a second group with a growing season between two dormant ones. Extensive probability studies were made pr imar i ly to secure a characterization of the selected drouth period in te rms of frequency of occurrence; these a l so were useful as a guide to drawing maximum loss curves .
The probability studies indicated that while the 1915-19 drouth occurred within a period of 50 years , i ts probability of recurrence is actually on the order of once in 200 years or greater . Even if there is recogni t ion of the questionable validity of using probabi l i ty studies of this kind in thei r extreme range, it still appears safe to consider this drouth period at least on the order of a 100-year frequency.
The finally recommended mass curve of r e s -
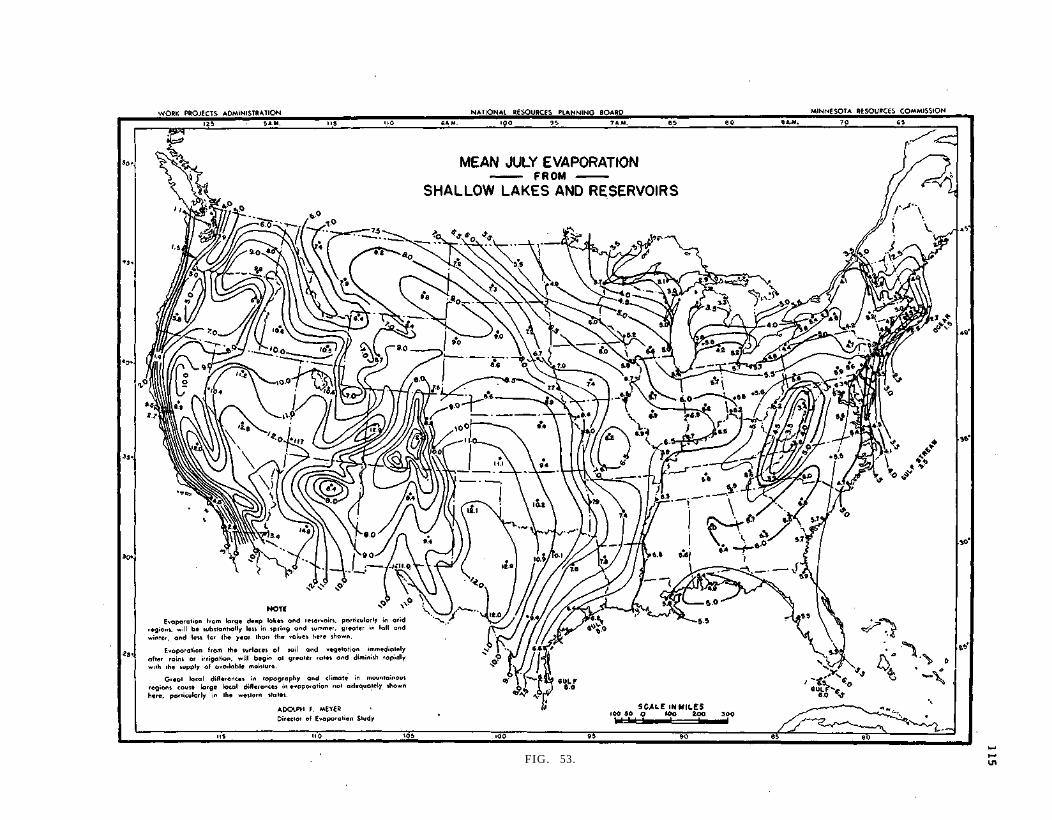
FIG. 53.
116
e rvo i r inflow incorporated the use of min imum t h r e e -seasonal runoff as obtained by subtract ing the m a x i m u m " l o s s e s " f rom the ac tua l t h r e e - s e a s o n a l r a i n fal l for the c r i t ica l period. F o r the 18 months f r o m A p r i l 1 , 1917 to O c t o b e r 3 1 , 1918, the computed runoff was 1. 65 i n c h e s .
In d e v e l o p i n g a r e a l i s t i c d e m a n d c u r v e for a wa te r supply impoundment, i t is n e c e s s a r y to e v a l u a t e , among other f ac to r s , the probable evapora t ion . T h e r e has been prepared a repor t (Ref. 25) on e v a p o ra t ion from lakes and r e s e r v o i r s based upon 50 y e a r s of Weather Bureau r e c o r d s . The r e s u l t s a r e in a d
m i r a b l y c l e a r and p r a c t i c a l f o rm , including c h a r t s giving mean evaporat ion for each month of the y e a r . This p r e sen t s the prac t i s ing engineer with e v a p o r a t i o n d a t a c o m p a r a b l e t o the point r a i n f a l l d a t a a s p r e sen t ed by Yarnell (Ref. 6). A sample r e p r o d u c t ion of one of the cha r t s is included h e r e as F i g . 53 and at tention is d i r ec t ed to the cautions and l i m i t a t ions in the "Note. "
The e n g i n e e r c o n c e r n e d with y ie ld s t u d i e s i s r e f e r r e d to Ref. 26, p. 579ff. for an excel len t b r i e f d iscuss ion of droughts, including a good b ib l iography of the l i t e r a t u r e up to then (1942).
BIBLIOGRAPHY
Ref.
1. " T h u n d e r s t o r m Ra in fa l l , " Hydrometeorological Report No. 5, U. S. Weather Bureau and Corps of Engineers , Vicksburg, Miss iss ippi , 1947.
2. Linsley, Ray K. and Kohler, Max A . , "Variat ions in S t o r m Rainfal l over Smal l A r e a s , " A. G. U. T r a n s a c t i o n s , Vol. 32, No. 2, p. 245, April 1951.
3. "Hydrology Handbook," A. S. C. E. 1949, Manuals of Engineering Practice No. 28.
4. Bernard , Mer r i l l M. , " P r i m a r y Role of Meteorology in Flood Flow Estimating," Trans. A. S. C. E . , Vol. 109, p. 311 (1944).
5. Meyer, Adolph F . , "The Elements of Hydrology, " Second edition 1928, John Wiley and Sons, Inc.
6. Yarnell , David L . , "Rainfall Intensi ty-Frequency Data," U. S. Dept. of Agric. Misc. Pub. No. 204, August 1935.
7. Sherman, Char les W., "Frequency and Intensity of Excessive Rainfalls at Boston, M a s s . , " Trans . A. S. C. E . , Vol. 95, p. 953, 1931.
8 . Sha fmayer , A. J . and Gran t , B. E . , "Rainfall Intensities and Frequenc ies , " Trans . A. S. C. E . , Vol. 103, p. 344, 1938.
9. (a) "Storm Rainfall of Eastern United States ," Technical Report, Miami Conservancy District , 1917.
(b) Pt. 5, Revised Ed. . 1936. 10. Clarke-Hafstad, Katherine, "Reliability of Station-
Year Rainfall Frequency Determinations," Trans . A. S. C. E . , Vol. 107, p. 633, 1942.
11. Ble ich , S. D . , "Rainfall Studies for New York, N. Y . , " T r a n s . A. S. C. E . , Vol. 100, p. 609, 1935.
12. Fletcher, Robert D. , "A Relation Between Maximum Observed Point and Areal Rainfall Values, " Trans. A. G. U . , Vol. 31 , p. 347, June 1950.
13. Marston, Frank A. , "The Distribution of Intense Rainfall and Some Other F a c t o r s in the Design of Storm-Water Drains, " Trans. A. S. C. E . , Vol. 87, p. 535, 1924.
14. Hathaway, Gail A . , "Mil i tary Airf ields: Design of Drainage Faci l i t ies , " Trans . A. S. C. E . , Vol. 110, p. 697, 1945.
15. Horton, R. E . , "Some Broader Aspects of Rain Intensi t ies in Relation to Storm Sewer Design,"
Ref.
Municipal and County Engineer ing , June-Ju ly , 1919.
16. B e r n a r d , M e r r i l l M . , " F o r m u l a s for Rainfall Intensi t ies ," Trans . A. S. C. E. , Vol. 96, p. 592, 1932.
17. Wisler, C. O., and Brater , E. F . , "Hydrology," John Wiley & Sons, Inc . , N. Y. , 1949.
18. Johnstone, Don, and Cross, William P . , "Elements of Applied Hydrology," The Ronald P r e s s C o . , New York, 1949.
19. L i n s l e y , Ray K . , J r . , K o h l e r , Max A . , and P a u l h u s , Joseph L . H . , "Applied Hydrology," McGraw-Hil l Book Co . , I n c . , New York, 1949, f i r s t edition.
20. "Generalized Est imates Maximum Possible P r e cipitation over the United States East of the 105th M e r i d i a n for A r e a s of 10, 200 and 500 Square M i l e s , " Hydrometeoro logica l Repor t #23, The Hydrometeorological Section, Div. of Cl imato-logical and Hydrologic Services , U. S. Weather Bureau, Washington, D. C . , June 1947.
21 . H o r n e r and Shifrin, "Review of the Hydrologic Studies Proposed'San Jacinto Reservoir ," Pt . III -Spillway Design Flood, Houston, Texas , Unpublished, July 1944.
22. "Possum Kingdom Project - Brazos River Basin, " Special Report on Hydrologic Studies, Office of Chief Engineer, Corps of Engineers, Unpublished Repoit, June 9. 1937.
23. "Buffalo Bayou, Texas , Flood Control P r o j e c t , " Vol. I . , Special Hydrology Report , Nov. 1938, Unpublished, Corps of Engineers .
24. Horne r and Shifrin, "Review of the Hydrologic Studies Proposed San Jacinto Reservoi r , " P a r t I, P robable Yield, Houston, Texas , Unpublished, St. Louis , Missour i , March 1944.
25. Meyer, Adolph F . , "Evaporation from Lakes and Reservoirs: A Study Based on Fifty Years ' Weather Bureau R e c o r d s , " Minnesota R eso u rce s Comm i s s i o n , St. P a u l , Minn. , June 1942.
26. Meinzer, Oscar E. (edit. ), Physics of the Ear th , IX. " H y d r o l o g y , " Chap. XII. " D r o u g h t s , " by William G. Hoyt, McGraw-Hill Book C o . , I n c . , New York, 1942.
1 1 7
DISCUSSION
GEORGE S. BENTON. *—I have followed with in teres t Mr. Jens ' d iscussion of "Engineer ing M e t e orology." It is a c l ea r and concise p r e sen t a t i on of cu r r en t techniques employed by hydro log i s t s in the a n a l y s i s o f p r e c i p i t a t i o n da ta . The r e p o r t r a i s e s s e v e r a l q u e s t i o n s in my mind , h o w e v e r . Can the r e l a t i o n be tween the s c i e n c e s of m e t e o r o l o g y and hydrology be desc r ibed adequately in t e r m s of t e c h niques of ana lys i s of p rec ip i t a t ion r e c o r d s ? M o r e basical ly, is the conventional attitude of the h y d r o l -og i s t , t o w a r d m e t e o r o l o g y i n g e n e r a l and h y d r o -m e t e o r o l o g y i n p a r t i c u l a r , su f f ic ien t ly b r o a d t o enable h i m to cope with p r o b l e m s which have been r a i s e d in the pa s t few y e a r s — a n d p r o b l e m s which will be r a i sed in eve r inc reas ing number dur ing the coming decade?
As a m e t e o r o l o g i s t , my own a n s w e r s to t h e s e questions a r e in the negative. I t is my f i rm conv ic tion that the re la t ion between the fields of hydro logy and meteoro logy i s going th rough an uneasy pe r i od of r e a d j u s t m e n t . New concep t s and new a t t i t udes a r e being evolved by hydro log i s t s which b e a r l i t t le r e s e m b l a n c e t o t h e c o n c e p t s and a t t i t u d e s which they a r e beginning t o r e p l a c e . This p r o c e s s will be accelerated in the future, as the science of h y d r o -me teo ro logy d e v e l o p s .
A h in t of t h i n g s to c o m e m a y be found in the sess ion on R a d a r - W e a t h e r which is being held conc u r r e n t l y wi th t h i s H y d r o l o g y c o n f e r e n c e . The meteorologist is developing powerful new tools which a r e of grea t potential value to hydrology. Yet t h e s e new tools can be of m a x i m u m util i ty only if the hy-d ro log i s t has the i n t e r e s t and the know-how to use t hem to be s t advantage . I do not m e a n by th i s tha t the p r a c t i c i n g h y d r o l o g i s t m u s t b e c o m e a n e x p e r t in the design or even the physical operat ion of e l e c t ronic equipment such as r ada r . He must , however , develop an attitude towards and a knowledge of m e t e oro logy which he l a c k s today .
The m a j o r i t y of h y d r o l o g i s t s in the pa s t have been content to u s e p r e c i p i t a t i o n r e c o r d s as a se t of b a s i c s t a t i s t i c a l da ta , and have ev idenced only a superf ic ia l i n t e r e s t in the phys ica l p r o c e s s e s on a l a r g e and s m a l l s c a l e which have given r i s e to the d i s t r i b u t i o n in s p a c e and t i m e of the quant i ty which t hey a r e s tudy ing . H y d r o l o g i s t s m a y point out that sec t ions of eve ry text in hydrology include a chapter on the cause of p rec ip i t a t ion ; that v i r t u a l ly every universi ty course in hydrology s t a r t s with a few l e c t u r e s on me teo ro logy ; and that occas iona l technical a r t i c l e s on meteorologica l subjec ts , a u t h ored by hydro log i s t s , have appea red in eng ineer ing jou rna l s . Yet with few except ions , t he se facts a r e
*Assis tant P ro fe s so r , Johns Hopkins University, Balt imore, Maryland.
exce l l en t e x a m p l e s of the inadequacy , r a t h e r than the adequacy, of the t r a in ing and e x p e r i e n c e of the a v e r a g e h y d r o l o g i s t i n s u b j e c t s m e t e o r o l o g i c a l . Texts in hydrology usual ly contain some such s t a t e m e n t as the one appearing in a recent and ve ry popul a r r e f e r e n c e (1)*: "A d i s c u s s i o n in anything like adequa te de ta i l , of ' the c a u s e s which p r o d u c e p r e c ip i t a t ion and which inf luence i t s d i s t r i b u t i o n , i t s t o t a l a m o u n t , and i t s v a r i a t i o n would b e too e x t ended for our p u r p o s e s . "
Th i s is t y p i c a l of what I m i g h t c a l l the conv e n t i o n a l v i e w o f h y d r o l o g i s t s t o w a r d s m e t e o r ology: h y d r o l o g i s t s n e e d not " for t h e i r p u r p o s e s " be c o n c e r n e d with the p h y s i c s of p r e c i p i t a t i o n or t h e m o v e m e n t o f w a t e r v a p o r in the a t m o s p h e r e ; i t i s sufficient m e r e l y to obtain and use the p r e c i p i t a t i o n r e c o r d s which a r e ava i l ab le f r o m a v a r i e t y of s o u r c e s .
This a t t i tude I have a lways found u n d e r s t a n d ing but dis turbing. Why should the hydro log is t lose i n t e r e s t in wa te r when i t r i s e s f rom the su r face of t h e e a r t h in v a p o r f o r m t h r o u g h the p r o c e s s e s o f e v a p o - t r a n s p i r a t i o n ? Why should he be i n t e r e s t e d in precipitation only from the moment that i t r e a c h e s the surface of the e a r t h as r a i n or snow? A c o m pe ten t hyd ro log i s t would not think of ana lyz ing the r e c o r d s of wel l yield f r o m a group of ground w a t e r w e l l s wi thout r e l y i n g heav i ly on h i s knowledge of the physics of the occurrence and movement of w a t e r be low the s u r f a c e of the e a r t h . Yet t h i s r e s t r a i n t v a n i s h e s when p r e c i p i t a t i o n da ta a r e p r e s e n t e d t o h i m . In this instance he often a s s u m e s that a s u p e r f icial toward the phys ics background is a sufficient prerequisi te to his analysis . This fact can be fu r the r emphas i zed by a s imp le compar i son . The concept of condensation and sublimation nuclei in the a t m o s p h e r e is as fundamenta l to an unde r s t and ing of the formation of p rec ip i ta t ion as the concept of p e r m e a b i l i t y is to an u n d e r s t a n d i n g of the m o v e m e n t of fluids through a p o r o u s s y s t e m . However , an e x a m i n a t i o n of the v a r i o u s t e x t s in hyd ro logy which h a v e been publ i shed in th i s count ry dur ing the l a s t t e n y e a r s shows tha t in only one i n s t a n c e was the e x i s t e n c e of c o n d e n s a t i o n n u c l e i o r s u b l i m a t i o n nuclei in the a t m o s p h e r e even ment ioned—and even i n t h i s e x c e p t i o n a l c a s e , the d i s c u s s i o n was r e s t r i c t e d to a few s e n t e n c e s .
I think it is important to examine why this c u r i ous dichotomy ex i s t s in the at t i tude of the h y d r o l o g i s t . Why h a s p h y s i c a l m e t e o r o l o g y b e e n p l aced in the role of a second-c lass re la t ion? The a n s w e r , I be l i eve , l i e s in t h r e e fac t s . F i r s t , a knowledge
*See BIBLIOGRAPHY at end of this discussion for al l references.
118
of the physics of precipitat ion has not in the past been of as vital practical importance to the hydrol-ogist as the understanding of certain other physical processes. The reason for this lies in the fact that the control of weather phenomena has been considered impossible, whereas the possibility of regulation of well yield, for example, is obvious. Where the possibility of control exis ts , the knowledge of how various parameters affect the phenomenon under examination becomes cr i t ica l . A second reason why the physics of precipitation has been neglected by hydrologists is based upon the complexity of the problems involved in meteorology. The atmosphere is a compress ib le , heterogeneous fluid in three d imensional unsteady state motion on a rotating ear th. There are external sources of radiational energy and internal sources for the release of latent energy. From the viewpoint of fluid mechanics and thermodynamics, the dynamics of the atmosphere is almost unbelievably complex. The hydrologist is already burdened by a vast field which includes many complex physical phenomena. He can hardly be bera ted , therefore , for having abandoned the detailed study of the physics of the atmosphere to the profess ional meteorologis t . However, once this principle had been enunciated, the hydrologist tended to d i smiss from his mind all problems of a tmospher ic physics. He began to build his own edifice of hydrologic science independent of, ra ther than closely connected to, the growing structure of meteorological knowledge. A third reason for the attitude of the hydrologist towards precipitation data a r i se s from engineering necessity. Hydrologists were confronted with problems of analysis of p r e cipitation data long before the science of meteorology had developed to a point where the study of the phys -ics of the atmosphere could be of significant help to them. Hydrologists had no alternative, therefore, but to make the best of the information at their d i s posal. However, it gradually became an occupational assumption that a careful study of meteorological theory was superfluous to the hydrologist 's needs. This att i tude was never ent i re ly justified. It is even less justified at present , for during the past few years the science of meteorology has been de veloping at an astounding rate .
It has been inevitable, in view of the above facts, that the hydrologist should encounter increasing difficulty in his use of meteorological information. Certain e r r o r s of thinking appearing at an early date are familiar to all of you. The inadequacies of the original station-year techniques of analyzing precipitation data were based in large measure on a lack of appreciation of the areal interdependence of precipitation records between stations (2). The erroneous concept of the source of water for p r e cipitation, i . e . , the idea of land-derived evapo-transpiration serving as the primary source of ra infall, was a direct result of inadequate understanding of the mobility of the atmosphere and the lack of a close relationship between precipitable water content of air and amount of precipitation (3, 4). Other
such difficulties could be enumerated. All a re examples of an inadequacy in the hydrologist's t ra ining in meteorology; however, none are of such vital importance to the field of hydrology that they served to drive home to the practicing hydrologist his need for a physical approach to meteorology problems.
In recent years , however, new questions have ar isen which are forcing a gradual revision of the conventional att i tudes of the hydrologist towards meteorology. One of these—the uses and potentialities of radar—has already been mentioned. Among the most dramatic of the others are questions ra ised by recent experimentation in the artificial nuclea-tion of convective clouds. This is not the proper place for a discussion of the meri ts and weaknesses of the methods which have been suggested for inducing precipitation. It is important to point out, however, that meteorologists themselves are divided in their evaluation of the efficacy of these techniques. The great majority believe that artificial nucleation as practiced at present is not economically, or hy-drologically, important . They feel that many of the commerc ia l ventures for increasing rainfall are being conducted by persons more interested in financial return than in alleviating water shortages or promoting scientific knowledge of cloud physics. A minority of meteorologists, however, insist that artificial nucleation is already of great economic significance and that the majority are reactionaries who are unable to see and appreciate the scope and import of daring and new ideas.
In the resulting confusion of charge and countercharge, the hydrologist has been placed in a p r e carious position. In many instances, it is he who must decide whether an organizat ion 's time and financial resources are to be placed at the disposal of the meteorologist sponsoring a program of a r t i ficial nucleation. Yet there is little in the hydrologis t ' s background to prepare him to make such a decision. In most similar situations, normal business procedure would counsel a conservative investment of funds, with an expansion of activities to be contingent upon successful accomplishment . In this case, however, the success or failure of an artificial nucleation program is far from clear. In fact, the "success" or "failure" of a program invariably depends far more on the meteorologist p r e paring the analysis than upon the data under examination. Any meteorologist worthy, or unworthy, of his calling can prepare an impressive a r ray of statistics in support of either or both points of view. The time-honored methods of hydrologic analysis of meteorological data are of little help under such circumstances.
What is the hydrologist to do today? The hydrologist obviously cannot make himself
over into a professional meteorologist in order to meet the new meteorological problems with which he is confronted today. However, two things a r e happening under the impact of these stimuli. F i r s t ,
119
the hydrologist is realizing the importance of broadening his background in physical meteorology, so that he can more adequately evaluate new problems of development in the border area between hydrology and meteorology. This requires and must accompany a more basic approach to fluid mechanics and its applications. Second, a small but growing group of professional meteorologists are devoting themselves to border problems between the two fields. The science of hydrometeorology has been born within the last decade. The hydrometeorologist of today must be thoroughly trained in physical meteorology, in cloud physics, in the causes of precipitation, and in the morphology of storms in space and time, three directional as well as surface; however, he must also be thoroughly familiar with the uses of precipitation data and with the various practical problems continually being faced by the hydrologist.
In the Civil Engineering Department of the Johns Hopkins Universi ty a p rogram is now under way which seeks to encourage these developments. Graduate study in meteorology, in hydrometeorology, and in hydrology is presented in an organized manner, as parts of a unified whole. Candidates for advanced degrees in hydrology must, as a matter of course, study basic fluid mechanics and its application to the problems of meteorology and hydrometeorology, On the other hand, meteorologists a re acquainted at an early stage in their training with the problems encountered in hydrology. The r e su l t s of such an approach have thus far been stimulating and encouraging.
Apart from the considerations discussed above, it is important to point out that additional benefits can accrue and are accruing to the field of hydrology by the growth of the science of hydrometeorology. There is no reason why the field of hydrology cannot be extended as a mat ter of course to include the a tmosphere above the continents. For example, the concept of the hydrologic cycle as it is conventionally presented by hydrologists is weak and unnecessarily restrictive. It would seem clear that
the transport of water vapor across the boundaries of a watershed by the atmosphere is every bit as essent ia l a par t of the hydrologic cycle as water losses across this boundary by deep seepage. This broadened point of view towards the hydrologic cycle has significant implications with regard to the hydrologic balance of an area. For example, as has been noted elsewhere, this approach may be of basic importance in the computation of evapo-transpiration losses from large areas for periods of time of the order of a week or a month (5).
The hydrometeorologist is learning a great deal about the movement of water vapor by the a tmosphere. One of our hosts, Mr. Stout of the Water Survey Division, has done some valuable work in this respect . An ambitious program is also well under way at the Johns Hopkins University, under the sponsorsh ip of the United States Air Force . There, I and my collaborators have been compiling data on water t ransfer by the atmosphere for the entire North American continent and the surrounding oceans. Data extracted from weather charts a re being entered on punch cards. When the first stage of the program is completed, water t ransport data for the entire calendar year of 1949 will be available at a l l levels of the a tmosphere . This information will be used, in par t , to clarify our concept of the role of the atmosphere in the hydro-logic cycle. It will also be used to analyze the water budget of storms in an attempt to clarify their physical nature as hydrometeorological entities.
The coming years will see a revolution in the hydrologist's attitudes towards meteorology. The hydrometeoro log is t of today will, I am certain, prove to the hydrologist, if such proof is necessary, that a physical approach to problems of precipitation will yield advances of extreme value and significance in the field of hydrology. These changing relationships between hydrology and meteorology a re , to me, of unique importance in evaluating Engineering Meteorology today.
BIBLIOGRAPHY
Ref. 1. Mead, Daniel W., "Hydrology," Second Edition,
McGraw-Hill Book Co. , New York, 1950. 2. Clarke-Hafstad, Katherine, "Reliability of Station-
Year Rainfall Frequency Determinations," Transr actions A. S. C. E . , Vol. 107, p. 633, 1942.
3. Holzman, Benjamin, "Sources for Moisture for Precipitation in the United States," U. S. Dept. Agric., Tech. Bull. 589. 1937.
Ref.
4. Benton, George S., Blackburn, Robert R., Snead, Vernon O., "The Role of the Atmosphere in the Hydrologic Cycle," Trans. A. G. U. , Vol. 31, pp. 61-73, 1950.
5. Benton, George S., "Water Vapor Transport Project, Quarterly Reports 1, 2 , " Dept. of Civil Engineering, The Johns Hopkins University, 1950, 1951. (Research sponsored by the Geophysical Research Directorate, U. S. Air Force.)
120
IVAN E. HOUK. *—Mr. Jens has presented an excellent paper on the "Engineering Understanding and Use of Rainfall Data. " His presentation of the subject is well developed, adequately il lustrated, and supplied with such pertinent references as may be needed in order to secure further explanations.
The use of rainfall data is the phase of engineer ing meteoro logy that is commonly involved in the work of civil engineers, especially those engaged on hydrological problems. There are several other phases of engineering meteorology, some of which are mentioned by Mr. Jens at the beginning of his p a p e r . Because of the complexity of the general subject, a few additional remarks may be justified.
In the first place, what is engineering meteor ology? Does it need a definition? Probably the t e r m s engineer ing and meteorology a re so well understood that the combined term—engineering meteorology—is in itself fully explanatory.
The Weather Glossary, published by the United States Weather Bureau in 1946, l i s ts ten subdivisions of meteorology, but does not include engineering meteoro logy . It includes hydrometeorology, which constitutes one phase of engineering meteorology.
Aeronautical meteorology has been defined as "The branch of Meteorology concerned with weather insofar as it affects aviation." Possibly engineering meteorology might be defined as the branch of meteorology concerned with weather insofar as it affects engineering.
Scientists dealing with weather phenomena usually think of weather as a tmospher i c conditions during a relatively short period of time. They think of climate as weather conditions during a comparatively long period of time, including maximum and min imum o c c u r r e n c e s as well as average data. They think of meteorology as the science that deals with atmospheric phenomena and the basic laws that produce and control such phenomena.
Actual ly, a l l t h ree—wea the r , cl imate, and meteorology—are so interrelated that definite bound-ar ies a re difficult to establish. Most people, including many engineers, use the three terms more or less synonymously.
Elements of meteorology that determine the cha rac t e r i s t i c s of the a tmosphere a r e :
Temperature Storms Radiation Precipitation Sunshine Evaporation Cloudiness Barometr ic p ressure Fog Composition of air Humidity Electr ical phenomena, and Wind Optical phenomena.
*Consulting Engineer, Denver, Colorado.
One or several of these elements, with the possible exception of the last, may be involved in some type of engineering work. Many examples could be mentioned, but a few will suffice for this discussion.
Mechanical engineers take into account weather conditions in planning the installation of heating, r e f r ige ra t ion , venti lat ing, and air-conditioning systems.
Electrical engineers make allowances for weather conditions in planning hydroelectric plants, e s pecially where subfreezing temperatures may cause frazil and anchor ice t roubles at power intakes. They also consider weather in planning transmission lines through regions where ice and sleet s torms may cause severe damages.
S t r u c t u r a l eng ineers consider temperature changes, wind forces, and accumulated snow loads in designing br idges , buildings, and other s t ructures .
Civil engineers consider weather elements in planning s t ree t s , roads , bridges, sewers, drainage sys tems, dams, r e se rvo i r s , r iver improvements , a i rpo r t s , and other i tems of construction that may be affected by heavy snowfalls, s torm rainfall, and flood runoff. In such work, a tmospheric elements of prime importance are temperature and precipitation. In planning storage projects, ra tes of evaporation and total evaporation losses constitute pert inent considerations, especially in western United States.
The par t icular phase of engineering meteorology which Mr. Jens has taken up in detail is commonly re fe r red to as hydrometeorology. Hydro-meteorology may be defined as the branch of science that deals with atmospheric mois ture , precipitation, disposal of precipitation, and effects produced by precipitation, particularly those caused by flood runoff.
This subdivision of meteorology, or of engineering meteorology, has been receiving more and more attention since the disastrous floods of March 1913 in the Ohio River valley and the subsequent intensive studies of s torm rainfall conducted by The Miami Conservancy Distr ic t .
In 1937, the Hydrometeorological Section of the United States Weather Bureau was organized to study storm rainfall, resultant flood runoff, and the various physical and a tmospher ic conditions that produce and control such phenomena. This Section, under the able d i r ec to r sh ip of the late Mer r i l l B e r n a r d and in cooperation with certain other agenc ies of the F e d e r a l Government, has been investigating and developing methods for evaluating the mos t intense flood-producing meteorological conditions that can occur in particular drainage basins. This question has always been one of the mos t t roublesome and elusive problems that engineers have had to solve. Thus far, the Section
121
has completed more than twenty reports on its investigations.
Engineers have often criticized meteorological equipment and methods of observing and recording the weather of the country. They have found fault with rain gages, snow gages, anemometers, evaporation pans, and other scientific instruments used in measuring atmospheric conditions. They have objected to locations of observation stations, methods of installing measuring apparatus, procedures followed in taking readings, and other factors involved in determining and recording meteorological phenomena.
Constructive c r i t i c i sm is always desirable. Engineers, scientists, and others employed on important work should always strive for the best possible results. Many of the faults found with me te orological observations probably were well founded. Nevertheless, I believe that past cri t icisms of our weather service have sometimes been overdone.
One fault often found with weather data in the past concerned the paucity of records. Fortunately, this fault has been corrected to a large degree during recent years . One important factor in the extension and enlargement of our weather service has been the development of aviation and the increasing needs for rel iable meteorological information in providing safe airplane transportation. Many f i rs t -order weather stations have been established and are now being maintained at airports throughout the country.
Meteorological phenomena often are so variable and erratic that the items of information needed by engineers probably never can be determined with 100 per cent efficiency. For instance, the cloudbursts that are experienced along the slopes of the Wasatch Mountains, along the Front Range of the Rockies, and to some extent in other parts of the country, a r e of such a local na ture that we can hardly hope to have rain gages installed at all places where they occur.
Mr. Jens, in his discussion of intense rainfall and point rainfall data, has referred to The Miami Conservancy District Technical Reports, the Yarnell report , and certain other sources of information. Perhaps the repor t by Shands and Ammerman on "Maximun Recorded United States Point Rainfall . . ." might also be mentioned. This repor t , published as Weather Bureau Technical Paper No. 2, 1947, gives maximum rainfalls as recorded at 207 f i rs t -order stations during periods of 5, 10, 15, 30, and 60 minutes, also during periods of 2, 3, 6, 12, and 24 hours. It supplements and amplifies the Yarnell report and includes data recorded up to the end of 1945.
In connection with considerat ions of intense rainfall, it might be interesting to mention the sharply defined edges of rainstorms that a re sometimes reported. Until recently, I have always taken such
repor ts with one or two proverbial grains of salt. However, one afternoon last August, I looked out the back windows of my home and saw raindrops falling thick and fast. Upon facing about and looking through the front windows, I saw absolutely no rain at all.
Changes in a i r tempera ture , too, a r e sometimes abrupt and large, especially in regions where chinook winds occur. At Spearfish, South Dakota, a r ise of 49 degrees in 2 minutes was observed in January 1943. Such extreme changes in temperatu re and rainfall , although probably not of great importance in most engineering work, do il lustrate the vagaries of weather and the difficulties involved in accurately observing and recording meteorological data.
Engineers engaged on special projects where meteorological phenomena constitute important cons idera t ions may have to adjust existing weather records to meet their par t icular needs. For instance, they may have to adjust rainfalls measured at different stations to the same time period, so that isohyetal charts can be prepared for the area under study; or they may have to correct wind velocit ies measured on the tops of high office buildings to ground values, for use in evaporation studies.. Other adjustments needed for special purposes might be mentioned.
In the case of unusually la rge and important projects, engineers may have to install additional stations, in order to secure more detailed data on atmospheric elements. This is often done by federal, state, and municipal agencies; also by power companies and other organizations engaged in the conservat ion, control , and use of water r esources . The Bureau of Reclamation, Corps of Engineers, and Tennessee Valley Authori ty can be cited as examples.
The fact that engineers sometimes have to adjust meteorologica l r e c o r d s , or instal l stations for securing additional data, does not constitute a reflection on our national weather service. Weather data needed by engineers often differ from weather data needed by persons engaged in other types of work. Our national agencies must supplv, insofar as possible , the data needed by persons engaged in all types of activities. To me, it seems remarkable that existing weather records throughout the country a r e as comprehensive and as well suited to the requirements of engineers as they now a re .
Mr. Jens, in his well-developed presentation, has shown how rainfall records and related meteorological data can be processed and adapted to the solution of engineering problems involving hydro-logical considerations. Other engineers might use slightly different p rocedures in corre la t ing and analyzing the data. However, his paper contains but few, if any, points that could be picked out as a basis for extended cri t icism or argument.
122
P H I L L I P L I G H T . * — T h e a u t h o r p r e s e n t s a valuable s u m m a r y of the i m p o r t a n t too l s and p r o c e d u r e s fo r hand l i ng r a i n f a l l data in e n g i n e e r i n g des ign . The fo rmulae and c h a r t s d e s c r i b e d in the p a p e r a r e d e r i v e d f r o m s t a t i s t i c a l t r e a t m e n t o f r a i n f a l l d a t a , bu t d e s p i t e s o m e l i m i t a t i o n s have had very useful appl icat ions. The science of m e t e oro logy h a s a d v a n c e d r a p i d l y in r e c e n t y e a r s due main ly to an i n c r e a s e d knowledge of the upper a i r , but t h e r e i s a l a r g e gap b e t w e e n d e v e l o p m e n t of theory and application to p rac t i ca l engineering p r o b l e m s . The r e su l t s of many meteoro log ica l i n v e s t i ga t ions a r e only qua l i t a t ive , but i t i s l ike ly t h a t a be t t e r understanding of a tmospher ic phenomena wil l lead ultimately to refinements of empir ical r e l a t i o n s .
The Y a r n e l l and M i a m i C o n s e r v a n c y D i s t r i c t c h a r t s o f r a i n f a l l i n t e n s i t y v s . d u r a t i o n and f r e quency date back to 1933 and 1934. Since that t i m e the re has been a p rogress ive inc rease in the n u m b e r of a u t o m a t i c r a i n g a g e s , and a l a rge a c c u m u l a t i o n of va luab l e r e c o r d s . The f r e q u e n c y c a l c u l a t i o n s a r e s u b j e c t t o a s a m p l i n g e r r o r , wh ich depends on the length of r e c o r d and n u m b e r of r a in fa l l s t a t i o n s . I t i s , t h e r e f o r e , i m p o r t a n t t o r e - e x a m i n e these c h a r t s , pa r t i cu la r ly those for shor t d u r a t i o n s and low f r e q u e n c i e s of o c c u r r e n c e , in the l ight of r e c e n t d a t a . M a c h i n e m e t h o d s o f t abu l a t i on a r e well adapted to frequency de terminat ions , and would r e m o v e m u c h of the d r u d g e r y involved in such r e -a n a l y s i s . Th i s would enta i l t r a n s f e r r i n g r a in f a l l da ta onto punch c a r d s , inc luding hour ly and da i ly pub l i shed a m o u n t s , a s wel l a s va lues for s h o r t e r pe r iods taken f rom or iginal r e c o r d e r c h a r t s . The Wea the r B u r e a u i s now c a r d - p u n c h i n g a l l c u r r e n t h o u r l y m e t e o r o l o g i c a l o b s e r v a t i o n s a t 500 f ield s t a t ions , and th i s includes ra in fa l l m e a s u r e m e n t s , but has been unable to under take p r o c e s s i n g of the huge backlog of data, except on a very l imited s c a l e .
The au thor has emphas i zed the d i s t inc t ion b e tween point ra in fa l l as m e a s u r e d by the individual g a g e , and the v o l u m e t r i c a m o u n t s ove r d r a i n a g e a r e a s u s u a l l y r e q u i r e d in p r a c t i c e . F i g u r e 41 o f the a u t h o r ' s p a p e r is a g r a p h i c i l l u s t r a t i o n of the e r r o r s tha t migh t be involved in volume e s t i m a t e s of rainfall made f rom the ordinary network of g a g e s . The p r e s e n t spac ing of r a i n g a g e s is s a t i s f a c t o r y for cer ta in pu rposes such as de te rmina t ion of long-t e r m p r e c i p i t a t i o n a v e r a g e s i n f a i r l y l eve l a r e a s , but has obvious weaknesses in connection with s t o r m s t u d i e s . I t i s p r o b a b l y i m p r a c t i c a b l e t o p r o v i d e the en t i r e coun t ry with gages a s c lose ly s p a c e d a s the e x p e r i m e n t a l Musk ingum n e t w o r k . Howeve r , i t i s g e n e r a l l y r e c o g n i z e d tha t a c o n s i d e r a b l e e x pansion of the p r e sen t rainfall network is well j u s t i fied economically. The Subcommittee on Hydrology of the F e d e r a l In te ragency R i v e r Bas in C o m m i t t e e h a s r e v i e w e d t h i s p r o b l e m , a n d h a s r e c e n t l y a d vocated e s t a b l i s h m e n t of app rox ima te ly 4500 a d d i t ional ra infa l l s t a t i ons .
A r e p o r t h a s r e c e n t l y b e e n i s s u e d on a jo in t Thunders to rm Pro jec t of four government a g e n c i e s :
*Hydrologist in Charge, River Forecast Center, U. S. Weather Bureau, St. Louis, Missouri .
Ai r F o r c e , Navy, National Adv i so ry Commi t t ee for Aeronau t i c s , and Weather B u r e a u . The i n v e s t i g a tion was mainly di rected towards obtaining i n f o r m a tion relat ive to flying h a z a r d s , but some of the conclusions and facts have impor tan t hydrologic i m p l i cations. It was found that a single, isolated t h u n d e r s t o r m i s a r a r e p h e n o m e n o n , and t h a t g e n e r a l l y there a r e t h r ee or more thunde r s to rm cells' ad jacen t to each other. The maximum r a t e of rainfall o c c u r s near the cel l co re within two to t h r e e minu te s a f te r the onse t of r a i n . The r a i n i n t ens i t y is heavy for five to fifteen minutes , and then s lackens off s lowly. The total s t o r m durat ion will v a r y f rom a few m i n utes for a weak cell to a lmos t an hour for l a r g e a c t ive ones. Smal l scale land fea tu res such as l a k e s , s w a m p s , h i l l s , and woods influence the a r e a l d i s t r i bu t ion and f r equency of o c c u r r e n c e of t h u n d e r s to rms . The las t conclusion indicates that n u m e r o u s a n o m a l i e s m a y ex i s t in the g e o g r a p h i c p a t t e r n of ra infal l , but r e m a i n undetected because of the open network of gages .
The method of maximum poss ib le s t o r m d e t e r minat ion outl ined by the author conforms to a g r e a t extent to p r a c t i c e s followed by the H y d r o m e t e o r o -logical Section of the Weather Bureau in their s t ud i e s for the Corps of Engineers. The method is d e s c r i b e d in de ta i l in t h e a u t h o r ' s r e f e r e n c e s , but i t m a y be of in teres t to point out the i m m e n s e amount of work r e q u i r e d i n t h e p r o c e s s i n g a n d a n a l y s i s o f da ta . M e t e o r o l o g i c a l data for a l l the h i s t o r i c a l s t o r m s of r e c o r d w i t h i n a l a r g e r e g i o n s u r r o u n d i n g the basin of i n t e r e s t a r e examined to de te rmine whe the r they can be t r a n s p o s e d , and i f ad jus tmen t s a r e r e quired in the p r o c e s s . The observed rainfal l within t h e s e s t o r m s i s e x t r a p o l a t e d to an u p p e r l imi t on the b a s i s of a pos s ib l e i n c r e a s e in the cont ro l l ing m e t e o r o l o g i c a l f a c t o r s . The n e e d for such a s p e cialized study depends on the scale of a w a t e r - c o n t r o l p r o j e c t , and t h e q u e s t i o n of sa fe ty to life in c a s e of f a i l u r e r e s u l t i n g f r o m a c r i t i c a l s t o r m dur ing and a f t e r c o n s t r u c t i o n . H o w e v e r , i n m o s t c a s e s the cos t of s u c h a s tudy is in s ign i f i can t c o m p a r e d to the t o t a l c o s t of a p r o j e c t a n d is we l l jus t i f ied .
C u r r e n t p r o p o s a l s for t h e c o n s e r v a t i o n and control of water within la rge r i v e r bas ins will m a k e c o n s i d e r a b l e d e m a n d s on t e c h n i c a l knowledge and da ta in e v a l u a t i o n and p lann ing of p r o j e c t s . The need for an expanded b a s i c da ta co l lec t ion and r e s e a r c h p r o g r a m t o m e e t t h o s e d e m a n d s i s ap t ly s t a t e d in the following e x c e r p t f r o m House Docum e n t No. 706 , 81s t C o n g r e s s :
" A s a n a t i o n we cannot a f ford to run the r i s k of d i s s i p a t i n g our r e s o u r c e s by bui ld ing p r o j e c t s tha t a r e not a d e q u a t e l y founded on good e n g i n e e r ing and scientif ic facts . It i s , t h e r e f o r e , of u t m o s t impor tance to provide the m e a n s for c o r r e c t i n g the def ic ienc ies in hydro logic b a s i c data by co l lec t ing a d e q u a t e r e c o r d s o f p r e c i p i t a t i o n , s t r e a m flow, g r o u n d w a t e r , qua l i t y o f w a t e r , s e d i m e n t l o a d s , e v a p o - t r a n s p i r a t i o n , and a l l o t h e r e s s e n t i a l da ta . P r o v i s i o n should a l s o be made for c o m p r e h e n s i v e r e s e a r c h i n t o the r e l a t i o n s h i p s a m o n g a l l t h e s e f a c t o r s , and me thods by which the m a x i m u m u t i l i zat ion of our w a t e r r e s o u r c e s m a y be effected. "
A P A N E L DISCUSSION: WATER USE
R. G. SNIDER,* Moderator
I must initially point out that any of the developments which the Conservation Foundation gets into come very largely from the association with experts and it depends essentially upon them. Actually, we are a group who were selected as general-i s t s . Therefore, I can only point out one or two r a t h e r obvious t ru ths about the point of view we take .
Today we are to hear from the customers. Up until now, I believe it is fair to say we have been talking about the water problem largely from the supplier's point of view. Now we are to hear from the customers. In business the customer is rather an important individual and all of us are rather eager to hear just how the water customer views the water problem locally and on a national basis . I have been fortunate to read most of the papers and we have a very interest ing morning ahead of us. Night before last Dr. Buswell made a rather interes t ing analogy when he told the s tory of the hen who was given duck eggs and eagle eggs along with hen's eggs. For those of you who were not there, the analogy was to indicate the breadth of this par ticular meeting. We have the radar-weather people at a meeting nearby. We have the engineering and the water treatment people, and we have other representatives of other groups. Mr. Veatch yes te r day indicated the need, as have a number of other
*Vice President, Conservation Foundation, New York, N. Y.
speakers , for greater public understanding. The first step about water problems is to cross a cer tain number of technical boundaries in an effort to make each specialized group realize how his problems bear on those of his neighbor, but even more important once that step is understood, is the need to make the general public aware that water is of particular significance and cannot be taken entirely for granted. I have noted that, because of an awareness I have toward the lack of misunderstanding, a number of people mentioned their great surprise when they found that water was not to be taken for granted.
In the course of the papers this morning we will see some of the critical points which must be made clear to a very large body of the public before we reach rea l ly adequate action on meeting local and regional water problems. For that reason I believe we should bear in mind the rather unusual approach which was taken at the banquet meeting last night of bringing in another in a field entirely separate. Mr. Eichelberger was speaking on the United Nations and deliberately did not talk to himself. So many of the technical readings are directed toward one's technical associates. It is , of course, important if we are to make the progress we need to in water developments, that we go around and talk not to ourselves but to other groups and make them understand what the impact of water is on their daily life.
123
I N D U S T R Y ' S W A T E R P R O B L E M S
BY THOMAS J. POWERS*
A glance at the b ib l iography that Dr . Raymond H e s s h a s p r e p a r e d for the Water Pol lu t ion A b a t e m e n t C o m m i t t e e of the M a n u f a c t u r i n g C h e m i s t s ' A s s o c i a t i o n r e v e a l s a t once t ha t i n d u s t r y ' s w a t e r p r o b l e m s a r e many and var ied . A r e v i e w e r of a l l the a r t i c l e s wr i t ten on th i s subject dur ing the p a s t five y e a r s wi l l r e a d i l y see t ha t i n d u s t r y ' s w a t e r p r o b l e m s r evo lve abou t t h r e e g e n e r a l t o p i c s :
1. Water quan t i ty 2 . Wate r qua l i t y 3 . Waste w a t e r con t ro l
Before we d i s c u s s these in g e n e r a l , l e t ' s s ee what an idea l i n d u s t r i a l wa te r supply migh t b e .
1. Un l imi ted vo lume 2 . Constant low t e m p e r a t u r e , s a y 60° F . 3 . L imi ted tu rb id i ty and suspended s o l i d s ,
say 10 ppm. 4 . No d i s s o l v e d g a s e s O 2 , C O 2 , H 2 S 5. Nei ther c o r r o s i v e or scal ing at 140° F. 6. Low color, say 10 ppm. Cobalt S t a n d a r d
7. Devoid of p lant and b a c t e r i a l life 8. Low d i s s o l v e d s o l i d s , say 100 ppm.
If we can assume these s tandards without a r g u ment, we immediately conclude that no sur face w a t e r i s idea l . Subsurface w a t e r s can m o r e c l o s e l y a p p r o a c h the idea l , and a r e u sed by i n d u s t r y in i m mense quantities. But since ground water r e s o u r c e s a r e l imited, we natura l ly a r r i v e a t i n d u s t r y ' s w a t e r quantity problem.
It would seem that the problem of water quant i ty can be a t t r i b u t e d to one or m o r e of the following:
1 . I m p r o p e r l and u s e r e s u l t i n g i n l o s s t h r o u g h r a p i d runoff .
2 . L o c a l o v e r e x p a n s i o n of i n d u s t r y and population in re la t ion to Water r e s o u r c e s .
3 . Imprope r water use r e su l t i ng in w a s t e . 4. Cyclic def ic iences in ra infa l l .
I n d u s t r y , of c o u r s e , can do l i t t le or nothing about ra infa l l or land u s e , but I think i t can safely be said that industry h a s overexpanded wi th r e s p e c t to i ts water supply in some a r e a s . Those i n d u s t r i e s w h i c h h a v e t i ed t h e i r w a t e r supp ly t o m u n i c i p a l supplies a r e mos t unfortunate. Where i ndus t ry e x pands, there must follow an expansion of popula t ion, a n d t h e g r o w i n g p o p u l a t i o n m u s t i nev i t ab ly have f i r s t cal l on the munic ipa l supply.
The only immed ia t e help for i n d u s t r i e s now in a s e r i o u s pos i t i on for lack of w a t e r s e e m s to lie in conserva t ive use of avai lable wa te r and the s u b -
*Chairman, Water Pollution Abatement Committee, Manufacturing Chemist ' s Association, Midland, Mich.
s t i tut ion of sea wa te r or other l e s s ideal w a t e r for hea t exchange.
T h i s n a t u r a l l y l e a d s us to the top ic of w a t e r qua l i ty . I n d u s t r i a l p l a n t s m a y be d e s i g n e d to use w a t e r s which a r e unfit for public water supply . On the o ther hand, c e r t a i n p r o c e s s e s and b o i l e r feeds r e q u i r e c o n d e n s a t e o r c o m p l e t e l y d e m i n e r a l i z e d wate r . Where water t e m p e r a t u r e s a r e too high for c e r t a i n produc t h e a t exchange , r e f r i g e r a t i o n m u s t be employed. Genera l ly speaking, however , w a t e r qua l i ty i s not a s a l l - i m p o r t a n t to i n d u s t r y a s i t i s t o m u n i c i p a l i t i e s .
Cor ros ion and sca l ing of hea t exchange equ ip ment i s probably indus t ry ' s l a r g e s t p rob lem r e l a t e d to wa te r quali ty. Th i s p r o b l e m i s so c o m p l e x and specia l ized for each individual use that we can only r e c o g n i z e i t and a d m i t tha t the cos t to i n d u s t r y as a whole is a s t agge r ing sum.
Industry can use water of var iable qual i ty . F o r example , a la rge in tegra ted chemica l plant such as Dow at Midland might use the following w a t e r s :
1. 200 MGD of r i v e r wa te r , ch lo r ina t ed for s l ime control , a s gene ra l s e r v i c e water fu rn i sh ing hea t exchange , f i r e p ro t ec t ion and some p r o c e s s ing. The cost of this water is about $20 p e r mi l l i on g a l l o n s . Th i s w a t e r m a y v a r y a s fo l lows:
Turb id i ty - 15 p p m to 40 ppm T e m p e r a t u r e - 33° F . t o 85° F . D i s so lved oxygen - 6 . 0 ppm to 12. 0 ppm Alkal in i ty - 150 to 220 ppm (b ica rbona te ) Ca l c ium - 30 to 40 ppm M a g n e s i u m - 15 to 25 ppm Color - 10 ppm to 50 p p m
2. 7. 0 MGD of Lake Huron w a t e r for feed to ion-exchange units and for special heat exchange . Cos t of th i s w a t e r is $110 pe r mi l l ion ga l lons and migh t v a r y a s fol lows:
Turb id i ty - 0-30 ppm T e m p e r a t u r e - 40° to 70° F . D i s so lved oxygen - s a t u r a t e d Alka l in i ty - 90-100 ppm Ca lc ium - 15-20 ppm M a g n e s i u m - 6-8 ppm Color - 0-5 p p m
3. 2 . 0 MGD d e e p w e l l w a t e r for s p e c i a l summer heat exchange. These wells de l iver 54° F . water , high in iron, low in oxygen, high in t o t a l d i s solved solids (1000-7000 ppm). Cost of we l l w a t e r i s $20 per mil l ion gal lons .
4. Double ion-exchange water used for s p e c ia l p r o c e s s i n g and for bo i l e r make up. 2. 0 MGD at a cos t of $400 pe r mi l l ion ga l lons .
125
INDUSTRY'S WATER PROBLEMS
BY THOMAS J. POWERS*
126
5. 1.5 MGD of potable water , softened, filtered, and chlorinated at a cost of $150 per million gallons for sanitary purposes and some p roces s ing.
The quality of water available for industry depends on the following:
1. Location geology 2. Land use 3. Upstream municipal pollution 4. Upstream industrial pollution
Of these, the only item within industry's control is the last.
We have briefly set forth the water quantity and quality p rob lems re la ted to indust r ia l use. We firmly believe that industry 's engineers can solve most of these problems to maintain and expand our indust r ia l might. It appea r s , however, that indust ry 's water supplies will, in general, become increasingly costly.
The last i tem, Waste Water Control, is the most serious problem related to industry 's water use today. Despite federal, state and local p res su re to minimize pollution of public waters, the fact r e mains that industrial establishments have not been able to tai lor waste waters to available dilution. Surprisingly, this is true even on our largest r iver sys tems , and is due in large par t to the constant expansion being demanded by our present all-out production program.
One of our larger eastern chemical companies is faced with a water problem, partially with respect to supply but mainly with respect to waste water dilution. With the small dilution available, i ts waste
water quality needs to be superlat ive, but as yet no means have been found to tailor the waste water to meet available dilution. The answer here may be to pipe a r ea waste waters overland to the sea and perhaps a return pipe line to bring sea water inland would permit this company and other industr ies to expand in that locality.
A midwestern chemical concern has now expanded beyond its waste dilution l imits and must spend upwards of two mil l ion dol lars to further t reat some of its wastes and to develop subsurface disposal for other wastes created by an unprecedented demand for certain products.
The future development of the nation's natural r e s o u r c e s will depend, in par t , on the ability of industry to meet the present, but sometimes hastily adopted, standards for waste waters .
Industry is the first to admit perplexity concerning the evaluation of s t ream pollution based on chemical s t andards . Industry has a lso been the l eader in proposing b i o - a s s a y s as an adjunct to chemical t e s t s .
Industry, as a whole, has attacked the problem of waste water control stepwise by process change and recovery , by skimming, neutral ization or precipitation and settling, followed by oxidation or reduction where proved necessary.
Most significant and encouraging, I think, is the growing recognition by industry that while it must fight to protect its water supply and defend its rights, it must by the same token live up to its responsibil i t ies as a corporate citizen in mat te rs of waste water control.
THE NATIONAL PICTURE
BY WALTER PICTON*
WITH DISCUSSIONS BY A. M. BUSWELL, R. G. SNIDER, C. O. WISLER, H. E. HUDSON, JR. , HORACE GRAY, AND J. H. MORGAN
THE GENERAL WATER PICTURE
During this conference and during our panel of today, specialists will present details of interest in their specific fields. As a generalist I will at -tempt to present the national picture as a whole. Probably more appropriately it could be called a jigsaw puzzle picture since many of the pieces a re not yet in their appropriate places.
In this presentat ion I am not speaking as an official government representative who would base all s tatements on published s ta t is t ics . Such data a re not yet available with which to complete the present picture and project it into the future. Using, therefore, other related information I have a s s e m bled an approximate picture from analyses and es t i mates of my own.
In years to come I will be able to correct and perfect these es t imates as resu l t s a re available from present endeavors to supply the data needed in this field. I hope that the questions raised with regard to my estimates will aid in stimulating additional research.
ECONOMIC IMPORTANCE
The foundation of the pat tern of development of our American industrial and metropolitan growth has been based upon the abundant and economical availability of water. Starting by settlements along fresh water , we expanded along the s t reams for the benefit from navigation and power. We now depend upon water for agricul ture , community life, health and industrial operation.
The development, t r ea tment and delivery of water has grown to rank high in importance in our national economic structure. The present value of our investment in water supply facilities for only the municipal and industrial supplies is in the neighborhood of 20 billion dollars and includes nearly 40 million tons of metals in the form of mater ia ls and equipment. These facilities require for their maintenance and operation an expenditure of over 600 million dollars annually and a slightly greater expenditure for annual expansion to keep pace with our growing population and industrial production.
The future development to satisfy our inc reas ing water requirements, in order to be successful, must be based on judicious planning. Our problems
*Water and Sewage Works Adviser, Defense Production Administration, Washington, D. C.
a re principally those of natural water availability, economical development and balanced use.
BASIC USES
For present consideration it is convenient to consider water use in five major categories. F rom these categories I have eliminated navigation, flood control, hydroelectric generation of power and r e c r e ation as nonconsuming uses. I have also eliminated water use for nuclear fission products and mili tary operations since such information is classified. The uses to be considered a r e :
(a) Irrigation (federal and nonfederal). (b) Rural (farm and ru ra l nonfarm). (c) Municipal (or public utility). (d) Industrial (private self-operated). (e) Steam power (electric and railroad).
In these categories I have estimated the uses of water for the period from 1900-1950 and made a project ion for 1960, F igure 54. The important points a re :
(a) Irrigation. This includes pr imary and supplementary supplies from both surface and ground sources. The acreage irrigated has increased from about 7. 6 million acres in 1900 to around 25 million acres in 1950. Likewise, the daily average water use has increased from about 25 billion gallons daily to 100 billion gallons daily in 1950.
(b) Rura l . Individual water supplies for rura l farms and homes are obtained largely from ground water s o u r c e s . This use has increased from about 2 billion gallons daily in 1900 to nearly 5 billion gallons daily in 1950.
(c) Municipal. Municipal water supply sys tems which in 1900 were about 3, 000 in number and served less than 30 million people have grown to nearly 16, 000 systems serving nearly 94 million people in 1950.
(d) Industrial . The privately owned self-operated water supplies of the larger basic industr ies , such as steel, oil refining, aluminum, paper and pulp products, textiles, plastics and synthetics have grown with our increase in industrial production. Their use was about 10 billion gallons daily in 1900 and has now increased to about 46 billion gallons daily in 1950.
(e) Steam power. Production of s team-generated e lect r ic power and the steam operation of railroads have increased their use of water from about 5 billion gallons daily in 1900 to about 35 bi llion gallons daily in 1950.
127
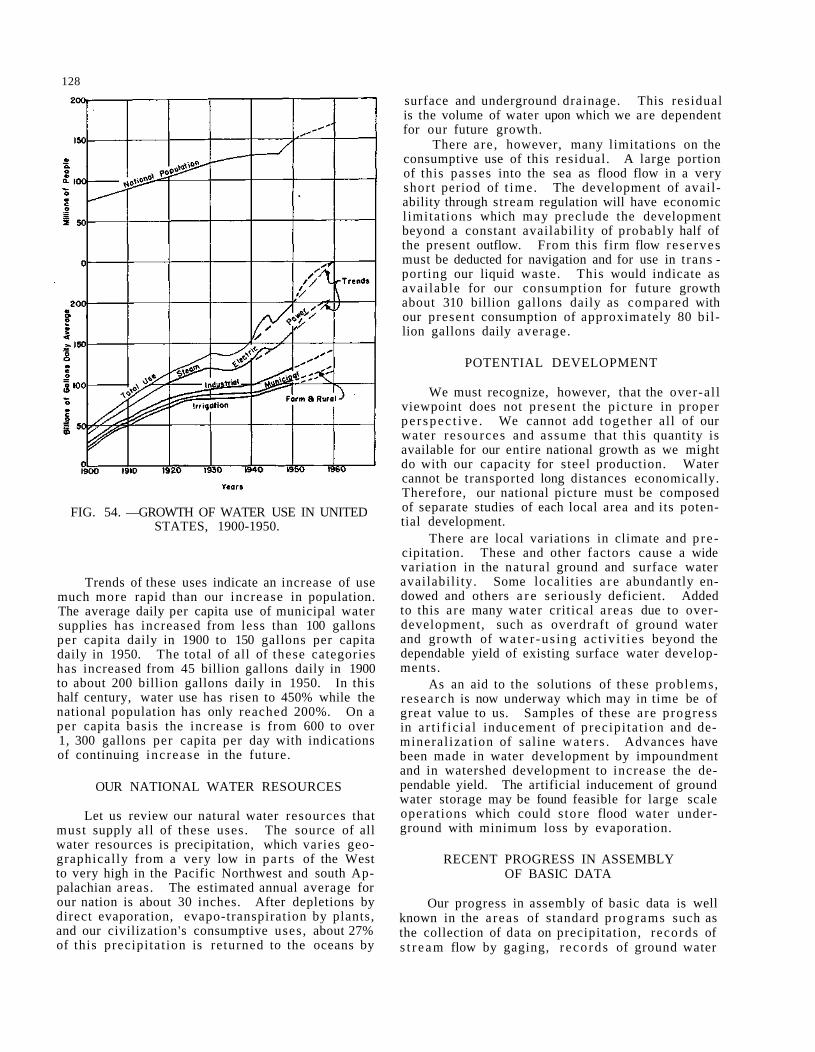
128
FIG. 54. —GROWTH OF WATER USE IN UNITED STATES, 1900-1950.
Trends of these uses indicate an increase of use much more rapid than our increase in population. The average daily per capita use of municipal water supplies has increased from less than 100 gallons per capita daily in 1900 to 150 gallons per capita daily in 1950. The total of all of these categories has increased from 45 billion gallons daily in 1900 to about 200 billion gallons daily in 1950. In this half century, water use has risen to 450% while the national population has only reached 200%. On a per capita basis the increase is from 600 to over 1, 300 gallons per capita per day with indications of continuing increase in the future.
OUR NATIONAL WATER RESOURCES
Let us review our natural water resources that must supply all of these uses. The source of all water resources is precipitation, which varies geographically from a very low in par t s of the West to very high in the Pacific Northwest and south Appalachian areas. The estimated annual average for our nation is about 30 inches. After depletions by direct evaporation, evapo-transpiration by plants, and our civilization's consumptive uses , about 27% of this precipitat ion is returned to the oceans by
surface and underground drainage. This residual is the volume of water upon which we are dependent for our future growth.
There are , however, many limitations on the consumptive use of this residual. A large portion of this passes into the sea as flood flow in a very short period of t ime. The development of availability through stream regulation will have economic l imitat ions which may preclude the development beyond a constant availability of probably half of the present outflow. From this firm flow rese rves must be deducted for navigation and for use in t rans -porting our liquid waste. This would indicate as available for our consumption for future growth about 310 billion gallons daily as compared with our present consumption of approximately 80 billion gallons daily average.
POTENTIAL DEVELOPMENT
We must recognize, however, that the over-al l viewpoint does not present the picture in proper pe r spec t ive . We cannot add together all of our water resources and assume that this quantity is available for our entire national growth as we might do with our capacity for steel production. Water cannot be transported long distances economically. Therefore, our national picture must be composed of separate studies of each local area and its potential development.
There are local variations in climate and p re cipitation. These and other factors cause a wide variation in the natural ground and surface water availabili ty. Some localit ies a r e abundantly endowed and others a r e seriously deficient. Added to this are many water critical areas due to overdevelopment, such as overdraft of ground water and growth of wa te r -us ing ac t iv i t ies beyond the dependable yield of existing surface water developments.
As an aid to the solutions of these problems, research is now underway which may in time be of great value to us. Samples of these are progress in ar t i f ic ia l inducement of precipi ta t ion and de-mineral izat ion of saline wa te r s . Advances have been made in water development by impoundment and in watershed development to increase the dependable yield. The artificial inducement of ground water storage may be found feasible for large scale operations which could s tore flood water underground with minimum loss by evaporation.
RECENT PROGRESS IN ASSEMBLY OF BASIC DATA
Our progress in assembly of basic data is well known in the a reas of standard programs such as the collection of data on precipitation, records of s t r e am flow by gaging, r eco rds of ground water
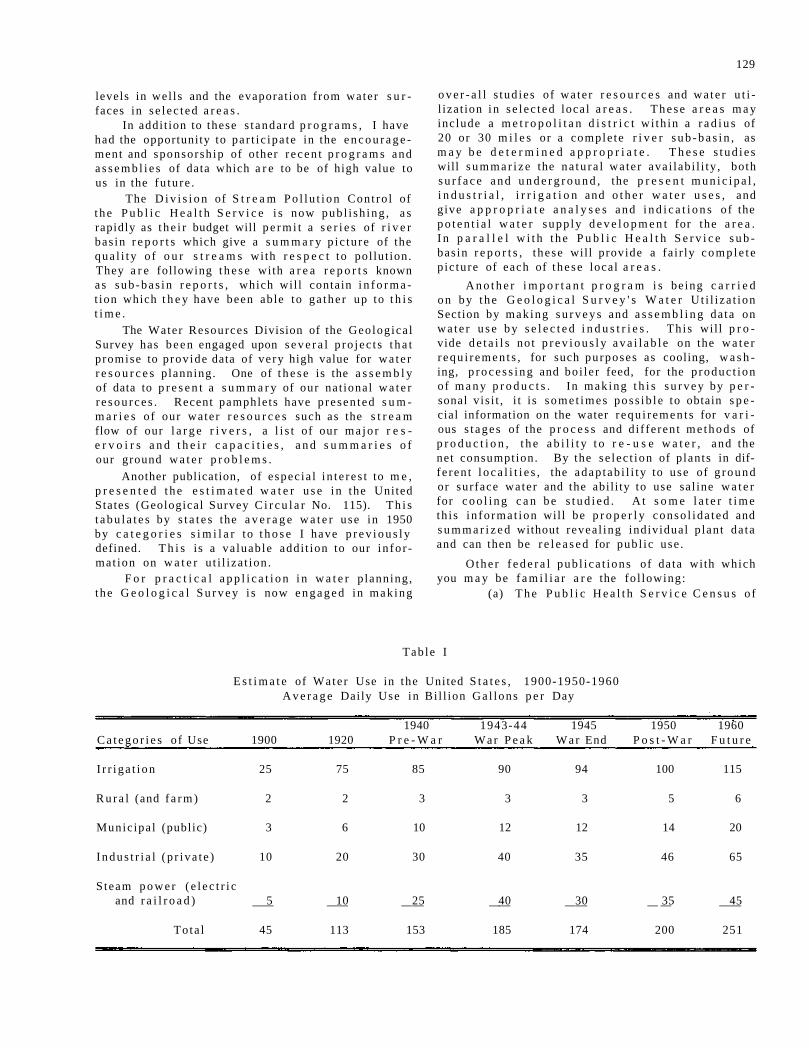
129
levels in wel ls and the evaporat ion f rom water s u r faces in s e l ec t ed a r e a s .
In addi t ion to these s t anda rd p r o g r a m s , I have had the opportunity to pa r t i c ipa te in the e n c o u r a g e ment and sponsorsh ip of other r e c e n t p r o g r a m s and a s s e m b l i e s of data which a r e to be of high value to us in the fu tu re .
The D i v i s i o n of S t r e a m P o l l u t i o n Cont ro l of t h e P u b l i c H e a l t h S e r v i c e i s now pub l i sh ing , a s rapidly as t h e i r budget will p e r m i t a s e r i e s of r i v e r bas in r e p o r t s which give a s u m m a r y p ic tu re of the qua l i t y o f o u r s t r e a m s wi th r e s p e c t to pol lut ion. They a r e following t h e s e with a r e a r e p o r t s known as sub -bas in r e p o r t s , which wil l contain i n f o r m a t ion which t h e y have been able to ga the r up to t h i s t i m e .
The Water Resources Division of the Geologica l Survey has b e e n engaged upon s e v e r a l p ro jec t s t h a t promise to p rov ide data of ve ry high value for w a t e r r e s o u r c e s planning. One of t h e s e is the a s s e m b l y of data to p r e s e n t a s u m m a r y of our nat ional w a t e r r e s o u r c e s . Recent pamphlets have p resen ted s u m m a r i e s of our water r e s o u r c e s such as the s t r e a m flow of our l a r g e r i v e r s , a l i s t of our m a j o r r e s e r v o i r s a n d t h e i r c a p a c i t i e s , a n d s u m m a r i e s o f our ground w a t e r p r o b l e m s .
Another publication, of espec ia l i n t e r e s t to m e , p r e s e n t e d t h e e s t i m a t e d w a t e r u s e i n the United States (Geological Survey C i r c u l a r No. 115). T h i s t a b u l a t e s by s t a t e s the a v e r a g e w a t e r use in 1950 by c a t e g o r i e s s i m i l a r to t h o s e I have p r e v i o u s l y defined. T h i s is a va luable addi t ion to our i n fo r mat ion on w a t e r u t i l i za t ion .
F o r p r a c t i c a l a p p l i c a t i o n i n w a t e r p lanning, the G e o l o g i c a l S u r v e y i s now e n g a g e d in mak ing
o v e r - a l l s tud ies of wa te r r e s o u r c e s and wa te r u t i l izat ion i n s e l ec t ed local a r e a s . T h e s e a r e a s m a y include a m e t r o p o l i t a n d i s t r i c t wi th in a r a d i u s of 20 or 30 m i l e s or a comple te r i v e r s u b - b a s i n , as m a y b e d e t e r m i n e d a p p r o p r i a t e . T h e s e s t u d i e s will s u m m a r i z e the na tu ra l wa te r ava i lab i l i ty , both s u r f a c e a n d u n d e r g r o u n d , the p r e s e n t m u n i c i p a l , i n d u s t r i a l , i r r i g a t i o n and o t h e r w a t e r u s e s , and give a p p r o p r i a t e a n a l y s e s and i n d i c a t i o n s o f the p o t e n t i a l w a t e r supp ly d e v e l o p m e n t for the a r e a . I n p a r a l l e l w i t h t h e P u b l i c H e a l t h S e r v i c e s u b -bas in r e p o r t s , t hese will provide a fa i r ly c o m p l e t e p ic ture of each of t he se local a r e a s .
A n o t h e r i m p o r t a n t p r o g r a m i s be ing c a r r i e d on by t h e G e o l o g i c a l S u r v e y ' s W a t e r Ut i l i za t ion Section by making s u r v e y s and a s s e m b l i n g da ta on w a t e r u s e b y s e l e c t e d i n d u s t r i e s . Th i s wil l p r o vide d e t a i l s not p r e v i o u s l y a v a i l a b l e on the w a t e r r e q u i r e m e n t s , for such purposes as cooling, w a s h ing, p r o c e s s i n g and bo i le r feed, for the p roduc t ion of m a n y p r o d u c t s . In making t h i s s u r v e y by p e r sonal v is i t , i t i s some t imes poss ib l e to obtain s p e cial information on the water r equ i r emen t s for v a r i ous s t ages of the p r o c e s s and d i f fe ren t m e t h o d s of p r o d u c t i o n , t h e a b i l i t y t o r e - u s e w a t e r , and the net consumption. By the se lec t ion of p lants in diffe ren t l o c a l i t i e s , the adap tab i l i ty to use of g r o u n d or surface water and the abil i ty to use sal ine w a t e r for c o o l i n g c a n b e s t u d i e d . A t s o m e l a t e r t i m e th i s i n fo rma t ion will be p r o p e r l y conso l ida t ed and s u m m a r i z e d without revea l ing individual p lant da ta and can then be r e l e a s e d for publ ic use .
O the r f e d e r a l pub l i ca t ions of data with which you m a y be f a m i l i a r a r e the fo l lowing:
(a) T h e P u b l i c H e a l t h S e r v i c e C e n s u s o f
Tab le I
E s t i m a t e of Wate r Use in the United S t a t e s , 1900-1950-1960 A v e r a g e Daily Use in Bi l l ion Ga l lons p e r Day
1940 1943-44 1945 1950 1960 C a t e g o r i e s o f Use 1900 1920 P r e - W a r W a r P e a k W a r End P o s t - W a r F u t u r e
I r r i g a t i o n 25 75 85 90 94 100 115
R u r a l (and f a r m ) 2 2 3 3 3 5 6
Munic ipa l (public) 3 6 10 12 12 14 20
I n d u s t r i a l ( p r iva t e ) 10 20 30 40 35 46 65
S team p o w e r ( e l e c t r i c and r a i l r o a d ) 5 10 25 40 30 35 45
Tota l 45 113 153 185 174 200 251
130
P u b l i c Wate r and Sewage Works F a c i l i t i e s . This information is a s sembled annual ly al though no publ icat ion has been made since 1945. It is hoped that another publication will be made in 1952.
(b) Recently, cooperative ana lyses have been m a d e by the P u b l i c Health Se rv i ce and the B u r e a u of Labor Sta t i s t ics of the quant i t ies of m a t e r i a l and e q u i p m e n t r e q u i r e d for the c o n s t r u c t i o n of wa te r and s ewage w o r k s .
(c) The r e p o r t of the P r e s i d e n t ' s Water R e s o u r c e s Po l icy Commiss ion ind ica tes the a d m i n i s t r a t i o n ' s i n t e r e s t in the d e v e l o p m e n t of our wa te r r e s o u r c e s . However , in cover ing so b r o a d a s u b j ec t , v e r y l i t t le space was given to speci f ic p r o b l e m s in the mun ic ipa l and i n d u s t r i a l w a t e r supply f i e l d s .
(d) The P r e s i d e n t ' s M a t e r i a l P o l i c y C o m m i s s i o n is now complet ing i t s r e p o r t . I am h o p e ful tha t the i r r e p o r t will give m o r e a t tent ion to the p r o b l e m s in f u t u r e d e v e l o p m e n t of w a t e r supply for indus t r i a l expansion.
C e r t a i n n o n f e d e r a l s u r v e y s a n d r e p o r t s have a d d e d m a t e r i a l l y to our fund of w a t e r r e s o u r c e s knowledge . Among these a r e a s tudy of the Conse rva t ion Foundat ion of g roundwate r , the c o o p e r a t ive r e p o r t of the N a t i o n a l A s s o c i a t i o n of Manuf a c t u r e r s and the C o n s e r v a t i o n Founda t ion on the u s e of w a t e r in i n d u s t r y , and the p u b l i c a t i o n s by s e v e r a l of our s t a t e s of a s s e m b l e d valuable in for
mation on the municipal and industr ia l use of ground and sur face w a t e r within t h e i r s t a t e s .
OUTLOOK
It is the p r o b l e m of th is and other Water Conf e r e n c e s to see to i t t ha t th i s i n t e r e s t i n wa te r r e s o u r c e s , water supply development , and wate r u t i l iza t ion be ma in t a ined . The r e s e a r c h now u n d e r way m u s t b e c o n t i n u e d and r e s e a r c h i n i t i a t e d i n o the r p h a s e s i n o r d e r t o p rov ide n e e d e d i n f o r m a t ion which a t p r e s e n t i s insufficient in m a n y a r e a s .
Th i s b a s i c d a t a c a n b e u s e d f o r i n t e l l i g e n t b a l a n c e d p l a n n i n g of d e v e l o p m e n t a n d u s e of our w a t e r r e sources and for project ions of our r e q u i r e m e n t s for var ious ca tegor ies of use. Such planning m u s t o f n e c e s s i t y be m a d e by n a t u r a l a r e a s with co l l abora t ion in such planning with ad jacen t a r e a s and l a r g e r r e g i o n s . The r e s p o n s i b i l i t y should be l o c a l but with the full benefi t of the adv ice tha t can be obtained f rom federa l r e s e a r c h and coordinat ion in resolving any spec ia l p r o b l e m s .
Our future development for growth may depend upon the wisdom and fo res igh t of t h e s e m a n y local a r e a s in the deve lopment and use of our w a t e r r e s o u r c e s . P r o p e r t y gu ided b y a d e q u a t e b a s i c in f o r m a t i o n , we c a n hope to a t t a i n a w e l l b a l a n c e d economy loca l ly , r e g i o n a l l y and na t i ona l l y by the op t imum u t i l i z a t i on of o u r w a t e r r e s o u r c e s .
131
A. M. B U S W E L L . —One or two p o i n t s c o m e to mind in connection with th is d i s cus s ion b e c a u s e , as you know, the p rob lem of water r e s o u r c e s is the p r o b l e m of the I l l ino i s S ta t e Wa te r S u r v e y a t the p r e s e n t t i m e . I t i s s o m e w h a t l a t e r t han we th ink wi th r e s p e c t t o our l o n g - t i m e p lanning in I l l ino is and presumably in the r e s t of the country. An e s t i m a t e m a d e by F a r r i n g t o n Danie l s i s tha t t h e r e i s "power avai lable in the wor ld to suppor t two thousand t i m e s our p re sen t populat ion." Our e s t i m a t e s a r e that in Illinois the p r e s e n t to ta l water ava i l ab l e could accommodate , with our p r e s e n t m e t h o d s , t en t i m e s ou r p r e s e n t popula t ion . The f i r s t s h o r t a g e that will be encountered will be that of wa te r supply .
W h a t i s the l o n g - t e r m big s o u r c e o f w a t e r ? That , I think, was touched upon by Dr. Conant 2 in a d d r e s s i n g the r ecen t mee t ings of c h e m i s t s in New York . D r . Conant p r e d i c t e d t h a t we would be o b taining water from the ocean, not by chemical t r e a t m e n t b u t by e v a p o r a t i o n . I t h a p p e n s t h a t in w a r r e s e a r c h work the State Water Survey ' s l a b o r a t o r y d id c o n s i d e r a b l e w o r k a long t h a t l ine . The b e s t that could be obtained was a ra t io of about t h r e e and a half p o u n d s of w a t e r to one pound of c h e m i c a l .
The big source of wa te r is a t m o s p h e r i c m o i s t u r e . T h e r e a r e compara t ive ly few who r e a l i z e the re la t ion between the amount of r a i n which fal ls and the a m o u n t of m o i s t u r e in the a t m o s p h e r e . We have h a d some ca lcu la t ions m a d e which show tha t , when it r a i n s , a re la t ive ly minor fract ion of a l l the m o i s t u r e in the a t m o s p h e r e fal ls to the e a r t h , and a cons ide rab l e f ract ion is i m m e d i a t e l y e v a p o r a t e d back into the a tmosphere . During the drouth of 1947 t h e r e w e r e 20 days when, a s f a r a s the m o i s t u r e and c loud f o r m a t i o n w e r e c o n c e r n e d , t h e r e w e r e f a v o r a b l e condi t ions for heavy r a i n s . Whi le I am not a me teo ro log i s t , I feel that a t m o s p h e r i c m o i s t u r e can be a big s o u r c e of wa te r supply. F r o m a l o n g - t i m e s t andpo in t , i t i s our l a r g e u n e x p l o r e d source of water supply. It, of course , r e s u l t s f r o m evapo ra t i on f rom the ocean by s o l a r m e a n s and i s brought inland by m e a n s of winds . T h e r e is s o m e r e a s o n to hope that i f we should decide to take the m o i s t u r e out m o r e rap id ly , the p r o c e s s of r e p l e n i shmen t might be a c c e l e r a t e d .
Our m o d e r n deve lopments i n i ndus t ry r e q u i r e t remendous amounts of water at ve ry low cost . Many i n d u s t r i e s m u s t have w a t e r a t a cos t of l e s s t han two c e n t s or down to a f r ac t i on of a cen t . To ge t co s t s down, we need to put into effect s o m e of the th ings we a l r e a d y know.
In I l l i n o i s we h a v e a l a r g e a m o u n t of u n d e veloped sur face w a t e r . We have hundreds of good r e s e r v o i r s i t e s which could be deve loped , and we have a good many p laces where r e c h a r g e of g round wa te r i s feasible .
R. G. SNIDER. —I am glad you brought up t ha t
1Science, Jan. 25, 1949. President, Harvard University, Cambridge, Mass.
poin t . The C o n s e r v a t i o n Foundat ion i s c o n s i d e r ing u n d e r t a k i n g the s p o n s o r s h i p of a p r e l i m i n a r y engineering survey dealing with the p r o b l e m of c o n ver t ing sa l t water to f resh .
C. O. WISLER. 3 —Several of our s p e a k e r s t h i s m o r n i n g h a v e r e f e r r e d to the p o s s i b i l i t y o f a u g ment ing our water suppl ies through the p r a c t i c e of ra inmaking. It is a well es tabl ished fact tha t s o m e th ing l ike a p p r o x i m a t e l y 80 p e r cen t of the w a t e r tha t falls as rain had i t s origin in oceanic e v a p o r a t i on . T h e e x a c t p e r c e n t v a r i e s . T h e p r i n c i p a l source of our water vapor is from la rge a i r m a s s e s and in t h i s a r e a i t i s f rom the Pac i f i c a i r m a s s e s . Suppose r a i n m a k i n g i s deve loped in the a r i d w e s t to the extent of its possibi l i t ies . What would happen h e r e in the cent ra l United S ta tes? I am thinking of the legal a s p e c t and the poss ib le i nvo lvemen t s t ha t might follow. I believe that it has been d e t e r m i n e d that , although 80 per cent of the ent i re ra in that fa l l s c o m e s f r o m oceanic evapora t ion , ye t in no p a r t i s tha t per cent l e ss than 50. Here we have in I l l ino is about 35 inches of rainfall. Suppose that 50 p e r cent tha t c o m e s from oceanic evapora t ion h a s b e e n r e moved f rom the a i r before i t ge t s to I l l inois ?
H. E . HUDSON, J R . 4 — T h e s t u d i e s to which Dr . B u sw e l l r e f e r r e d in h i s c o m m e n t s du r ing the panel discussion on water use , a r e pa r a l l e l to t h o s e p u b l i s h e d b y D r . Ben ton and i n d i c a t e w e a r e r e c e i v i n g a b o u t f ive p e r c e n t o f t h e m o i s t u r e tha t p a s s e s over the s ta te . The studies we m a d e for the y e a r s 1947 to 1949 indicate we w e r e r ece iv ing p r e -c ipi table wa te r about half of the t ime i t was a v a i l a b l e . 5 We may consider prec ip i tab le wa te r a s tha t which migh t be conver ted into ra in fa l l by a r t i f i c i a l m e a n s . I t i s poss ib le tha t , had o t h e r s t aken s o m e of t h a t w a t e r , our take would have b e e n r e d u c e d . A f t e r a l l , c loud s e e d i n g wil l no t be done o v e r a s t a t e as a whole, but in p a r t i c u l a r a r e a s . I l l ino i s i s not w o r r i e d . I t a p p e a r s tha t we can get w a t e r at cer ta in points; meanwhile, we have much to l e a r n about the p r o c e s s .
HORACE GRAY. —If things of this so r t come to p a s s , I t h ink the New R i v e r d o c t r i n e would so lve the p r o b l e m . I t would ex tend the p u b l i c c o n t r o l f r o m s u r f a c e and g r o u n d t o w a t e r i n the c louds .
J . H. MORGAN. 6 —I am under the i m p r e s s i o n that our present a tmospher ic mois ture supply c o m e s f r o m the Gulf. T h e r e is p len ty of w a t e r sou th of h e r e .
3 Pro fe s so r , Universi ty of Michigan, Ann Arbor, Michigan.
4Engineer , Illinois State Water Survey, Urbana, I l l inois .
5"Radar and Rainfall," Report of Investigation No. 3, Illinois State Water Survey, 1949.
6District Engineer, United States Geological Survey, Champaign, Illinois.
DISCUSSION
The use to which the waters of the nation were to be put have always been a primary consideration in the administration of the Federal water pollution control program as well as in the water pollution control programs of most of the states. In fact the basic law, Public Law 845, states in Section 2:
"The Surgeon General shall, after careful investigation, and in cooperation with other Federa l agencies, with State water pollution agencies and in te rs ta te agencies , and with municipalit ies and industries involved, prepare or adopt comprehensive programs for eliminating or reducing the pollution of interstate waters and t r ibutar ies thereof and improving the sanitary condition of surface and underground wate rs . In the development of such comprehensive programs due regard shall be given to the improvements which are necessary to conserve such waters for public water supplies, propagation of fish and aquatic life, recreational purposes and agr icu l tu re , industr ial , and other legitimate u s e s . "
Public Law 845 was approved June 30, 1948, but appropriations were not made available by Congress for its administration until July 1949. Fo l lowing the passage of the law, the U. S. Public Health Service established 10 offices in the major drainage basins of the country to car ry out its funct ions . The Upper Miss i ss ipp i and Great Lakes Drainage Basins Office in Chicago was established on July 1, 1949. These offices were staffed, as rapidly as personnel became available, with two or three sanitary engineers, an aquatic biologist, a draftsman, and the necessary clerical assis tance.
One of the first activit ies of the basin office was to obtain information upon which to base the comprehensive reports called for in the law. The s ta tes coopera ted in this endeavor by supplying basic data on water use, sources of pollution, existing t r e a t m e n t fac i l i t ies , needs , construction p rogress , e t c . , and the basin office compiled the s t a t i s t i c a l data from these bas ic data. Fifteen major drainage basin reports based on these data are in various stages of development at the present time. The reports on the Tennessee and Missouri are already out and others should be released soon.
The F e d e r a l law also d i rec ted the Surgeon General to "col lect and disseminate information relating to water pollution and the prevention and
*Sanitary Engineer, Federal Security Agency, Chicago, Illinois.
abatement t h e r e o f and "support and aid technical research to devise and perfect methods of treatment of industrial wastes . . . . "
In keeping with the provisions of these sections, part of the grant funds is made available to states for research or special studies. Typical of these projects is the study of the lagoon method of the disposal of sugar beet wastes carried on at Moorhead, Minnesota, under the sponsorship of the Minnesota Water Pollution Control Commission.
Wisconsin is sponsoring a study of industrial waste t rea tment plant design s tandards in behalf of the Upper Mississippi and Great Lakes Boards of Public Health Engineers . While it is realized that industrial wastes do not conform to any standard and, therefore, a re not susceptible to the applicat ion of s tandard design fac tors , it is hoped to develop some guide which can be of assistance to those designing treatment facilities.
Upon the formation of the I l l inois-Missouri Bi-State Development Agencies, the States of Illinois and Missouri suggested that this agency be utilized to sponsor a pollution study in the St. Louis - East St. Louis metropoli tan a rea . This study, which was needed for many r e a s o n s , was specifically recommended because the commercial fishermen below the metropolitan area complained that pollution was rendering the use of the stream unfit for this purpose. At the present time a joint survey is being made by the Bi-State Agency, Illinois, Missouri, and the Public Health Service.
The Environmental Health Center at Cincinnati has a number of research projects in progress on mat te rs related to water pollution control. Some of these a r e : biological indica tors of pollution; concentrations and analysis of minute quantities of organic chemicals causing taste and odor in public water supplies; basic data on nature and effects of var ious indust r ia l was tes . And there are many o the r s .
Unfortunately, the average individual looks upon stream pollution abatement programs as "save the fish" p r o g r a m s without real iz ing that this is but one use of water. They fail to appreciate the very vital par t that clean water plays in the industrial productivity in which we as a nation have so much pride. Few people realize, for instance, that steam generation of e lec t r ic power requi res from 52 to 170 thousand gallons of water per 1,000 kilowatt hours; rolled s teel , 6 to 110 thousand gallons per
133
WATER USE CONSIDERATIONS IN THE FEDERAL WATER POLLUTION CONTROL PROGRAM
BY PAUL W. REED*
134
ton; or aviation gasol ine, one million gallons of water per 1, 000 bar re ls , to mention a few.
Water is vital to man in many ways. Even the food he uses requires water to grow, and when grown requires more water for processing. The canning of vegetables , for instance, r equ i res from 60 to 16,000 gallons per 100 cases (24 No. 2 cans). Five gallons of water are required to process each gallon of milk, and 6, 000 gallons are required to process one ton of meat.
Little do we realize on a cold winter night as we fire up our furnaces that 200 gallons of water are needed to wash each ton of coal, or if we want a cocktail that 80, 000 gallons of water are needed for the manufacture of each 1, 000 gallons of whiskey.
Nothing has been said so far about the use of water for public water supply because it should be apparent that an adequate supply of clean water for
this use is vital. In the past in some regions we have relied heavily on our ground waters as a source of public and industr ia l water supplies, and as a r e su l t many persons could not become seriously concerned about the pollution of surface waters . In recent years we have heard much of the shortage of ground water in critical a reas . While we do not have the time to consider this problem in detail, it is evident that if we continue as a nation to need more and more water and if available ground waters decrease , conservation of our surface waters becomes increasingly important.
Our water resources are the very backbone of our entire existence so we should not waste those resources. We should also remember that the destruct ion of water by pollution denies our use of them just as surely as though they were physically removed from us.
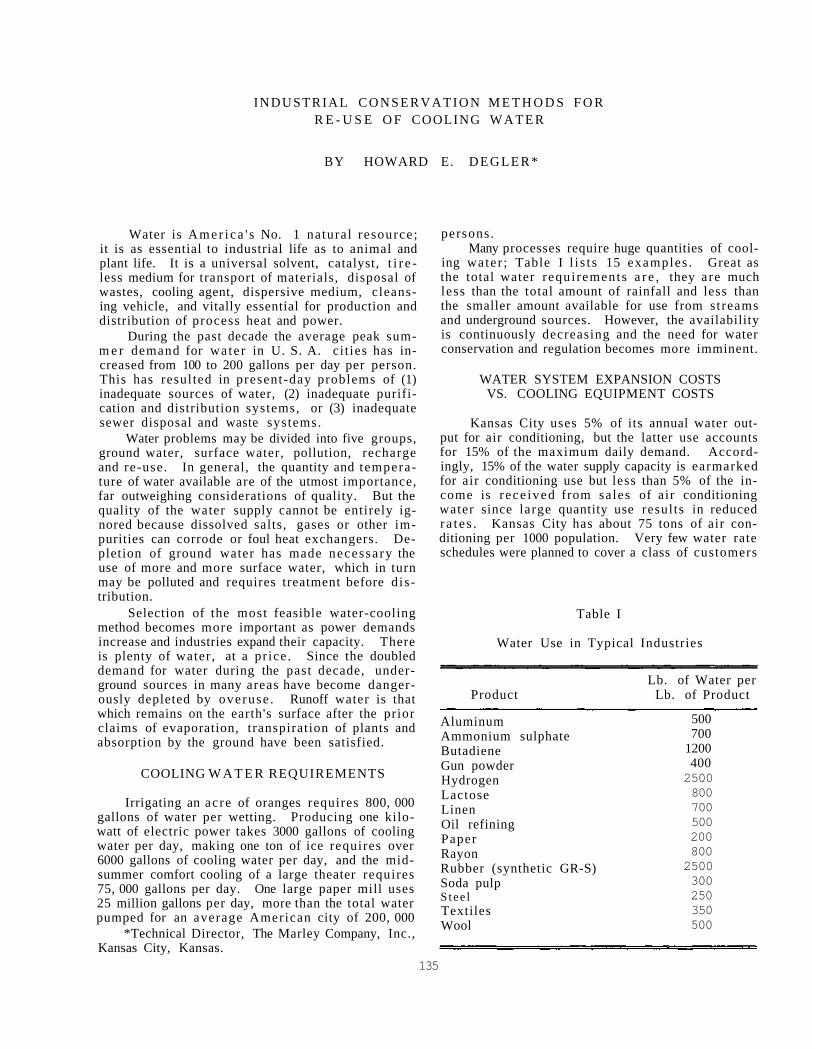
INDUSTRIAL C O N S E R V A T I O N M E T H O D S F O R R E - U S E O F COOLING W A T E R
BY HOWARD E. D E G L E R *
Water is A m e r i c a ' s No. 1 natural resource; it is as essential to industrial life as to animal and plant life. It is a universal solvent, catalyst, t i r e less medium for transport of materials, disposal of wastes, cooling agent, dispersive medium, cleansing vehicle, and vitally essential for production and distribution of process heat and power.
During the past decade the average peak summ e r demand for water in U. S. A. ci t ies has increased from 100 to 200 gallons per day per person. This has resulted in present-day problems of (1) inadequate sources of water, (2) inadequate purification and distribution systems, or (3) inadequate sewer disposal and waste systems.
Water problems may be divided into five groups, ground water, surface water, pollution, recharge and re-use. In general, the quantity and temperature of water available are of the utmost importance, far outweighing considerations of quality. But the quality of the water supply cannot be entirely ignored because dissolved salts, gases or other impurities can corrode or foul heat exchangers. Depletion of ground water has made necessary the use of more and more surface water, which in turn may be polluted and requires treatment before d istribution.
Selection of the most feasible water-cooling method becomes more important as power demands increase and industries expand their capacity. There is plenty of water , at a pr ice . Since the doubled demand for water during the past decade, underground sources in many areas have become dangerously depleted by overuse . Runoff water is that which remains on the earth's surface after the prior claims of evaporation, transpiration of plants and absorption by the ground have been satisfied.
COOLING W A T E R REQUIREMENTS
Irrigating an acre of oranges requires 800, 000 gallons of water per wetting. Producing one kilowatt of electric power takes 3000 gallons of cooling water per day, making one ton of ice requires over 6000 gallons of cooling water per day, and the midsummer comfort cooling of a large theater requires 75, 000 gallons per day. One large paper mill uses 25 million gallons per day, more than the total water pumped for an average American city of 200, 000
*Technical Director, The Marley Company, Inc., Kansas City, Kansas.
persons. Many processes require huge quantities of cool
ing water ; Table I l i s t s 15 examples . Great as the total water requi rements a r e , they are much less than the total amount of rainfall and less than the smaller amount available for use from streams and underground sources. However, the availability is continuously decreasing and the need for water conservation and regulation becomes more imminent.
WATER SYSTEM EXPANSION COSTS VS. COOLING EQUIPMENT COSTS
Kansas City uses 5% of its annual water output for air conditioning, but the latter use accounts for 15% of the maximum daily demand. Accordingly, 15% of the water supply capacity is earmarked for air conditioning use but less than 5% of the income is r ece ived from sales of air conditioning water since large quantity use results in reduced r a t e s . Kansas City has about 75 tons of air conditioning per 1000 population. Very few water rate schedules were planned to cover a class of customers
Table I
Water Use in Typical Industries
Lb. of Water per Product Lb. of Product
Aluminum Ammonium sulphate Butadiene Gun powder Hydrogen Lactose Linen Oil refining Paper Rayon Rubber (synthetic GR-S) Soda pulp Stee l Textiles Wool
500 700
1200 400 2500 800 700 500 200 800 2500 300 250 350 500
135
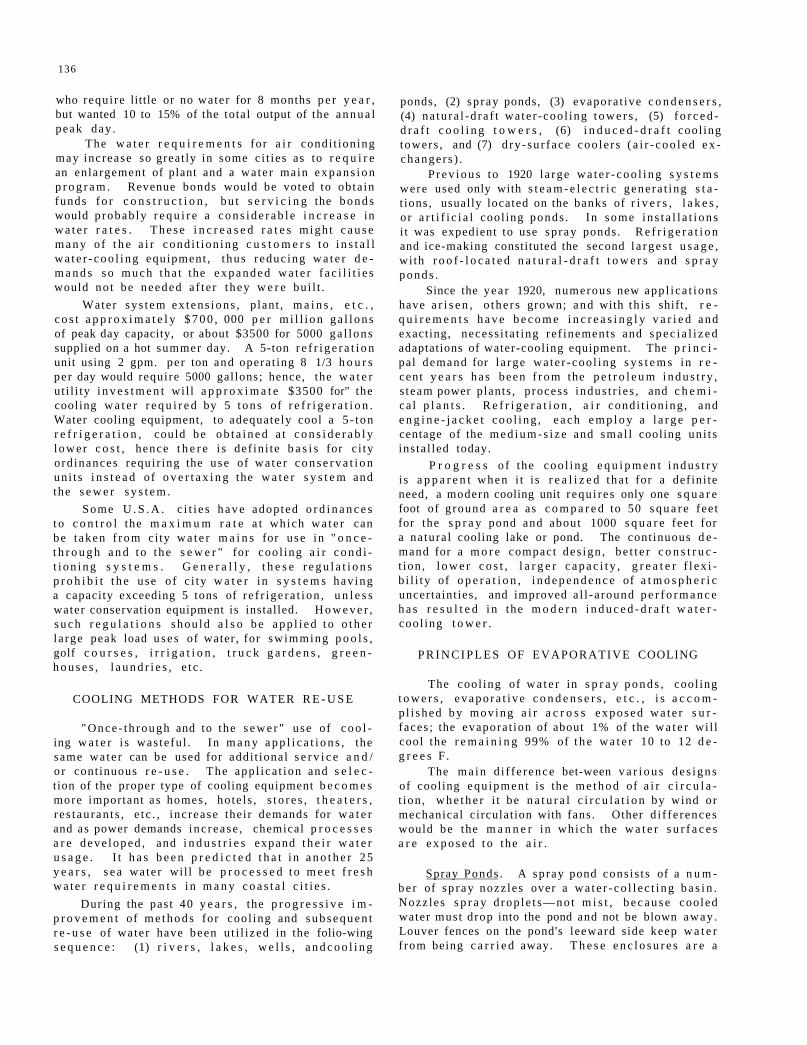
136
who requi re little or no water for 8 months p e r y e a r , but wanted 10 to 15% of the total output of the a n n u a l peak day .
The w a t e r r e q u i r e m e n t s for a i r condi t ioning may increase so great ly in some c i t ies as to r e q u i r e an enlargement of plant and a wa te r main e x p a n s i o n p r o g r a m . Revenue bonds would be voted to obta in funds f o r c o n s t r u c t i o n , bu t s e r v i c i n g the b o n d s would p robab ly r e q u i r e a c o n s i d e r a b l e i n c r e a s e in w a t e r r a t e s . T h e s e i n c r e a s e d r a t e s migh t c a u s e m a n y of t h e a i r cond i t ion ing c u s t o m e r s to i n s t a l l w a t e r - c o o l i n g equipment , t hus reduc ing w a t e r d e m a n d s s o m u c h tha t the e x p a n d e d w a t e r f a c i l i t i e s would no t be needed a f t e r they w e r e bui l t .
Water sys t em ex t ens ions , p lant , m a i n s , e t c . , c o s t a p p r o x i m a t e l y $ 7 0 0 , 000 p e r m i l l i o n g a l l o n s of peak day capacity, or about $3500 for 5000 ga l lons supplied on a hot summer day. A 5-ton r e f r i g e r a t i o n unit using 2 gpm. per ton and operat ing 8 1/3 h o u r s pe r day would require 5000 gallons; hence, the w a t e r ut i l i ty i n v e s t m e n t wi l l a p p r o x i m a t e $3500 for" the cooling w a t e r r e q u i r e d by 5 t o n s of r e f r i g e r a t i o n . Water cooling equipment, to adequately cool a 5 - ton r e f r i g e r a t i o n , could be o b t a i n e d a t c o n s i d e r a b l y l ower c o s t , hence t h e r e i s def in i te b a s i s for c i ty ord inances requi r ing the use of wa te r c o n s e r v a t i o n un i t s i n s t e a d of o v e r t a x i n g the w a t e r s y s t e m and the s e w e r s y s t e m .
Some U . S . A . c i t i e s h a v e adop ted o r d i n a n c e s t o c o n t r o l the m a x i m u m r a t e a t which w a t e r can be t aken f r o m ci ty w a t e r m a i n s for use in " o n c e -t h r o u g h a n d t o the s e w e r " for cool ing a i r c o n d i t i o n i n g s y s t e m s . G e n e r a l l y , t h e s e r e g u l a t i o n s p r o h i b i t t h e use o f c i ty w a t e r in s y s t e m s hav ing a capacity exceeding 5 tons of r e f r ige ra t ion , u n l e s s water conservation equipment is installed. H o w e v e r , s u c h r e g u l a t i o n s shou ld a l s o b e a p p l i e d t o o t h e r l a rge peak load u se s of water, for swimming p o o l s , golf c o u r s e s , i r r i g a t i o n , t r u c k g a r d e n s , g r e e n h o u s e s , l a u n d r i e s , e t c .
COOLING METHODS FOR WATER R E - U S E
"Once - th rough and to the s e w e r " use of c o o l ing w a t e r i s was te fu l . In m a n y a p p l i c a t i o n s , the same wa te r can be used for addi t ional s e r v i c e a n d / o r cont inuous r e - u s e . The app l ica t ion and s e l e c tion of the proper type of cooling equipment b e c o m e s more important a s homes , ho te l s , s t o r e s , t h e a t e r s , r e s t au ran t s , e t c . , inc rease their demands for w a t e r and as power demands inc rease , chemical p r o c e s s e s a r e deve loped , and i n d u s t r i e s expand t h e i r w a t e r u s a g e . I t h a s b e e n p r e d i c t e d t h a t i n a n o t h e r 25 y e a r s , s e a wate r wil l be p r o c e s s e d t o m e e t f r e s h w a t e r r e q u i r e m e n t s i n m a n y c o a s t a l c i t i e s .
During the pas t 40 y e a r s , the p r o g r e s s i v e i m p r o v e m e n t of m e t h o d s for cool ing and s u b s e q u e n t r e - u s e of water have been u t i l i zed in the folio-wing s e q u e n c e : (1) r i v e r s , l a k e s , w e l l s , a n d c o o l i n g
ponds, (2) sp ray ponds, (3) evapora t ive c o n d e n s e r s , (4) na tu ra l -d ra f t wa te r -coo l ing t o w e r s , (5) f o r c e d -d r a f t c o o l i n g t o w e r s , (6) i n d u c e d - d r a f t cool ing towers , and (7) d ry - su r f ace coo le r s ( a i r - c o o l e d e x changer s ) .
P r e v i o u s to 1920 l a rge w a t e r - c o o l i n g s y s t e m s were used only with s t e a m - e l e c t r i c gene ra t ing s t a t ions, usually located on the banks of r i v e r s , l a k e s , o r a r t i f i c i a l cool ing ponds . In some i n s t a l l a t i o n s i t was expedient to use sp ray ponds. R e f r i g e r a t i o n and ice-making constituted the second l a r g e s t u s a g e , wi th r o o f - l o c a t e d n a t u r a l - d r a f t t o w e r s and s p r a y p o n d s .
Since the yea r 1920, numerous new app l i ca t ions have a r i s e n , o the r s grown; and with th i s shift, r e q u i r e m e n t s h a v e b e c o m e i n c r e a s i n g l y v a r i e d and exacting, necess i ta t ing re f inements and s p e c i a l i z e d adaptations of water-cooling equipment. The p r i n c i pal demand for l a rge wa te r -coo l ing s y s t e m s in r e cent y e a r s h a s been f r o m the p e t r o l e u m i n d u s t r y , s team power plants , p rocess indus t r i e s , and c h e m i ca l p l a n t s . R e f r i g e r a t i o n , a i r condi t ion ing , and e n g i n e - j a c k e t coo l ing , e a c h e m p l o y a l a r g e p e r centage of the m e d i u m - s i z e and sma l l cooling un i t s ins ta l led today.
P r o g r e s s o f the coo l ing e q u i p m e n t i n d u s t r y i s a p p a r e n t when i t i s r e a l i z e d tha t for a def ini te need, a modern cooling unit r equ i re s only one s q u a r e foot of g round a r e a as c o m p a r e d to 50 s q u a r e fee t for the s p r a y pond and about 1000 s q u a r e feet for a na tura l cooling lake or pond. The cont inuous d e mand for a m o r e compact des ign , b e t t e r c o n s t r u c t ion , l o w e r c o s t , l a r g e r c a p a c i t y , g r e a t e r f l ex i b i l i ty of o p e r a t i o n , i n d e p e n d e n c e of a t m o s p h e r i c uncertaint ies , and improved a l l -a round p e r f o r m a n c e h a s r e s u l t e d i n the m o d e r n i n d u c e d - d r a f t w a t e r -cool ing t o w e r .
P R I N C I P L E S OF EVAPORATIVE COOLING
The cool ing of w a t e r in s p r a y p o n d s , cool ing t o w e r s , e v a p o r a t i v e c o n d e n s e r s , e t c . , i s a c c o m p l i shed b y mov ing a i r a c r o s s e x p o s e d w a t e r s u r faces ; the evapora t ion of about 1% of the w a t e r wi l l cool the r e m a i n i n g 99% of t h e w a t e r 10 to 12 d e g r e e s F .
The m a i n d i f f e rence bet-ween v a r i o u s d e s i g n s of cooling equ ipment is the m e t h o d of a i r c i r c u l a t ion , w h e t h e r i t be n a t u r a l c i r c u l a t i o n by wind or mechanical circulat ion with fans. Other d i f fe rences would be the m a n n e r in which the w a t e r s u r f a c e s a r e e x p o s e d t o the a i r .
Spray Ponds . A spray pond cons i s t s of a n u m be r of sp ray nozz les over a w a t e r - c o l l e c t i n g b a s i n . Nozz les s p r a y d rop le t s—not m i s t , b e c a u s e cooled water must drop into the pond and not be blown away . Louver fences on the pond's leeward side keep w a t e r f rom being c a r r i e d away. T h e s e e n c l o s u r e s a r e a
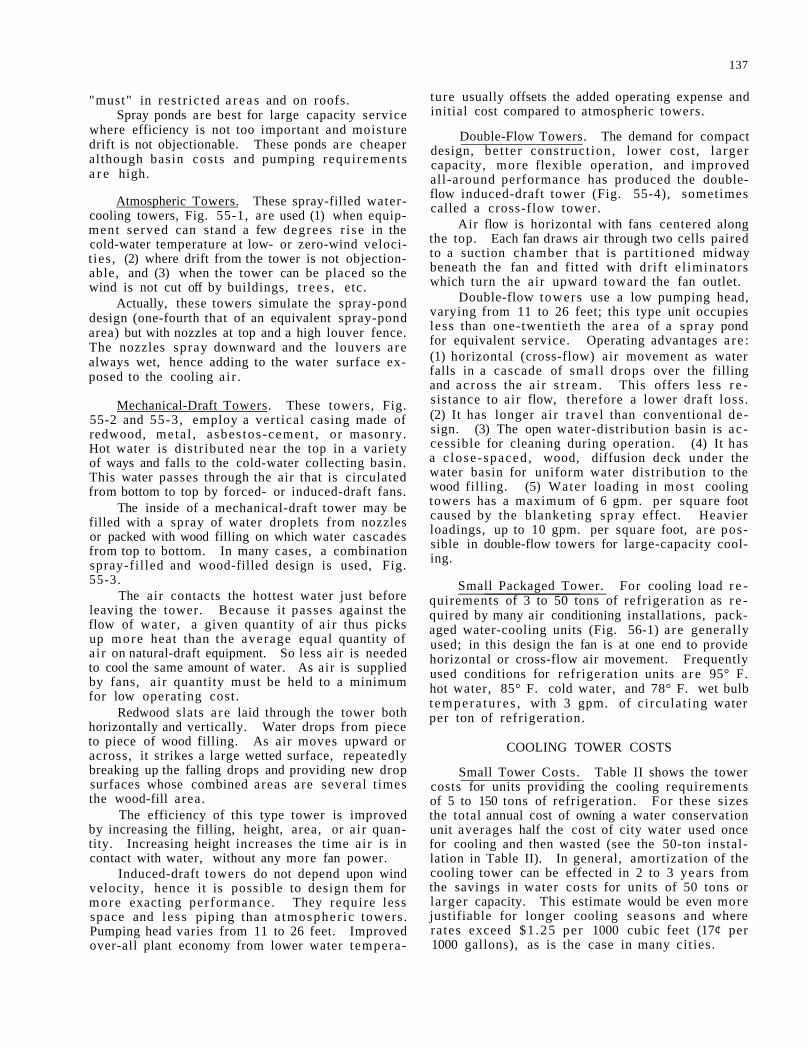
137
"must" in res t r ic ted a r ea s and on roofs. Spray ponds are best for large capacity service
where efficiency is not too important and moisture drift is not objectionable. These ponds a re cheaper although basin costs and pumping requirements a r e high.
Atmospheric Towers. These spray-filled water-cooling towers, Fig. 55-1, are used (1) when equipment served can stand a few degrees r i se in the cold-water temperature at low- or zero-wind velocit ies , (2) where drift from the tower is not objectionable, and (3) when the tower can be placed so the wind is not cut off by buildings, t r e e s , etc.
Actually, these towers simulate the spray-pond design (one-fourth that of an equivalent spray-pond area) but with nozzles at top and a high louver fence. The nozzles spray downward and the louvers a re always wet, hence adding to the water surface exposed to the cooling a i r .
Mechanical-Draft Towers. These towers, Fig. 55-2 and 55-3, employ a vert ical casing made of redwood, meta l , asbes tos -cement , or masonry. Hot water is dis tr ibuted near the top in a variety of ways and falls to the cold-water collecting basin. This water passes through the air that is circulated from bottom to top by forced- or induced-draft fans.
The inside of a mechanical-draft tower may be filled with a spray of water droplets from nozzles or packed with wood filling on which water cascades from top to bottom. In many cases, a combination spray-fil led and wood-filled design is used, Fig. 55-3.
The air contacts the hottest water just before leaving the tower. Because it passes against the flow of water , a given quantity of a i r thus picks up more heat than the average equal quantity of a i r on natural-draft equipment. So less air is needed to cool the same amount of water. As air is supplied by fans, air quantity must be held to a minimum for low operating cost .
Redwood slats a re laid through the tower both horizontally and vertically. Water drops from piece to piece of wood filling. As air moves upward or across, it strikes a large wetted surface, repeatedly breaking up the falling drops and providing new drop surfaces whose combined areas are several t imes the wood-fill area.
The efficiency of this type tower is improved by increasing the filling, height, area, or a i r quantity. Increasing height increases the time air is in contact with water, without any more fan power.
Induced-draft towers do not depend upon wind velocity, hence it is possible to design them for more exacting per formance . They require less space and l e s s piping than a tmospher ic towers. Pumping head varies from 11 to 26 feet. Improved over-all plant economy from lower water tempera
ture usually offsets the added operating expense and initial cost compared to atmospheric towers.
Double-Flow Towers. The demand for compact design, be t te r construct ion, lower cost , la rger capacity, more flexible operation, and improved all-around performance has produced the double-flow induced-draft tower (Fig. 55-4), sometimes called a cross-flow tower.
Air flow is horizontal with fans centered along the top. Each fan draws air through two cells paired to a suction chamber that is par t i t ioned midway beneath the fan and fitted with drif t e l iminators which turn the air upward toward the fan outlet.
Double-flow towers use a low pumping head, varying from 11 to 26 feet; this type unit occupies less than one-twentieth the a r ea of a spray pond for equivalent service. Operating advantages a r e : (1) horizontal (cross-flow) air movement as water falls in a cascade of smal l drops over the filling and across the a i r s t r eam. This offers less r e sistance to air flow, therefore a lower draft loss. (2) It has longer a i r t r ave l than conventional design. (3) The open water-distribution basin is ac cessible for cleaning during operation. (4) It has a c lose -spaced , wood, diffusion deck under the water basin for uniform water distribution to the wood filling. (5) Water loading in mos t cooling towers has a maximum of 6 gpm. per square foot caused by the blanketing spray effect. Heavier loadings, up to 10 gpm. per square foot, a re possible in double-flow towers for large-capacity cooling.
Small Packaged Tower. For cooling load r e quirements of 3 to 50 tons of refrigeration as r e quired by many air conditioning installations, packaged water-cooling units (Fig. 56-1) a re generally used; in this design the fan is at one end to provide horizontal or cross-flow air movement. Frequently used conditions for refrigeration units a r e 95° F. hot water, 85° F. cold water, and 78° F. wet bulb t empe ra tu r e s , with 3 gpm. of c i rculat ing water per ton of refrigeration.
COOLING TOWER COSTS
Small Tower Costs. Table II shows the tower costs for units providing the cooling requirements of 5 to 150 tons of refrigeration. For these sizes the total annual cost of owning a water conservation unit averages half the cost of city water used once for cooling and then wasted (see the 50-ton installation in Table II). In general, amortization of the cooling tower can be effected in 2 to 3 years from the savings in water costs for units of 50 tons or larger capacity. This estimate would be even more justifiable for longer cooling seasons and where rates exceed $1 .25 per 1000 cubic feet (17¢ per 1000 gallons), as is the case in many ci t ies .
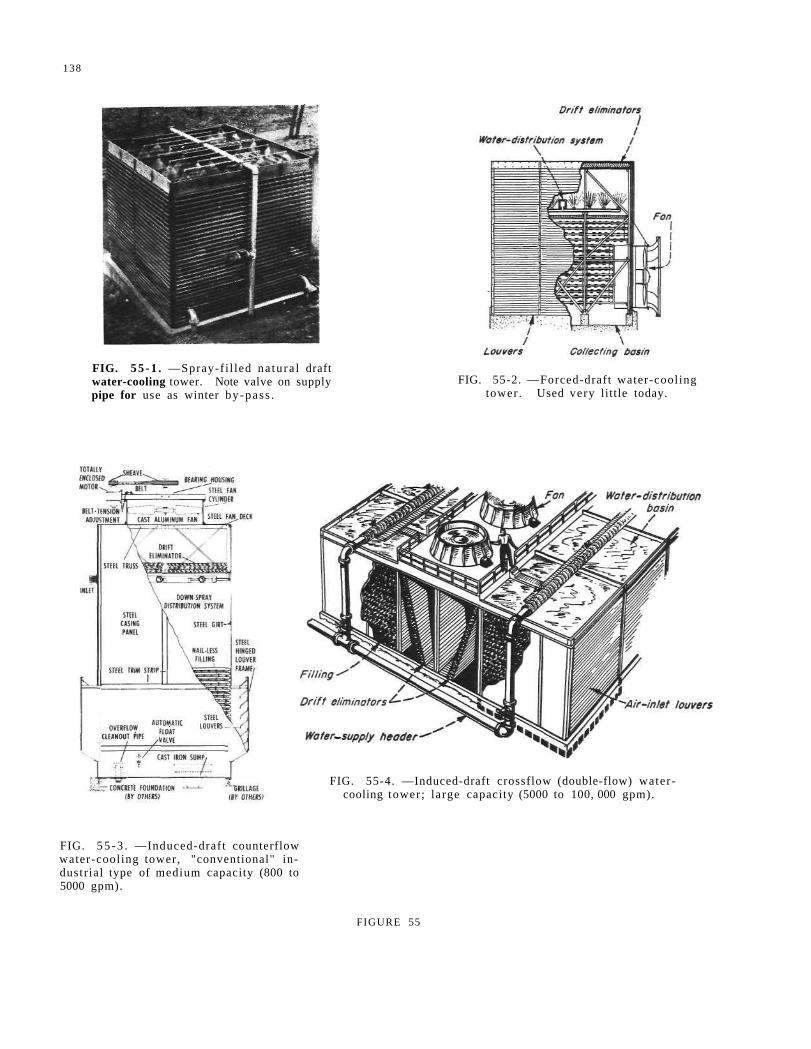
138
FIG. 5 5 - 1 . —Spray-f i l led na tu ra l draft water-cooling tower. Note valve on supply pipe for use as winter by-pass .
FIG. 55-2. —Forced-draft water-cooling tower . Used very little today.
FIG. 5 5 - 3 . —Induced-draft counterflow water-cooling tower, "conventional" industr ial type of medium capacity (800 to 5000 gpm).
FIG. 55-4. —Induced-draft crossflow (double-flow) water-cooling tower; large capacity (5000 to 100, 000 gpm).
FIGURE 55
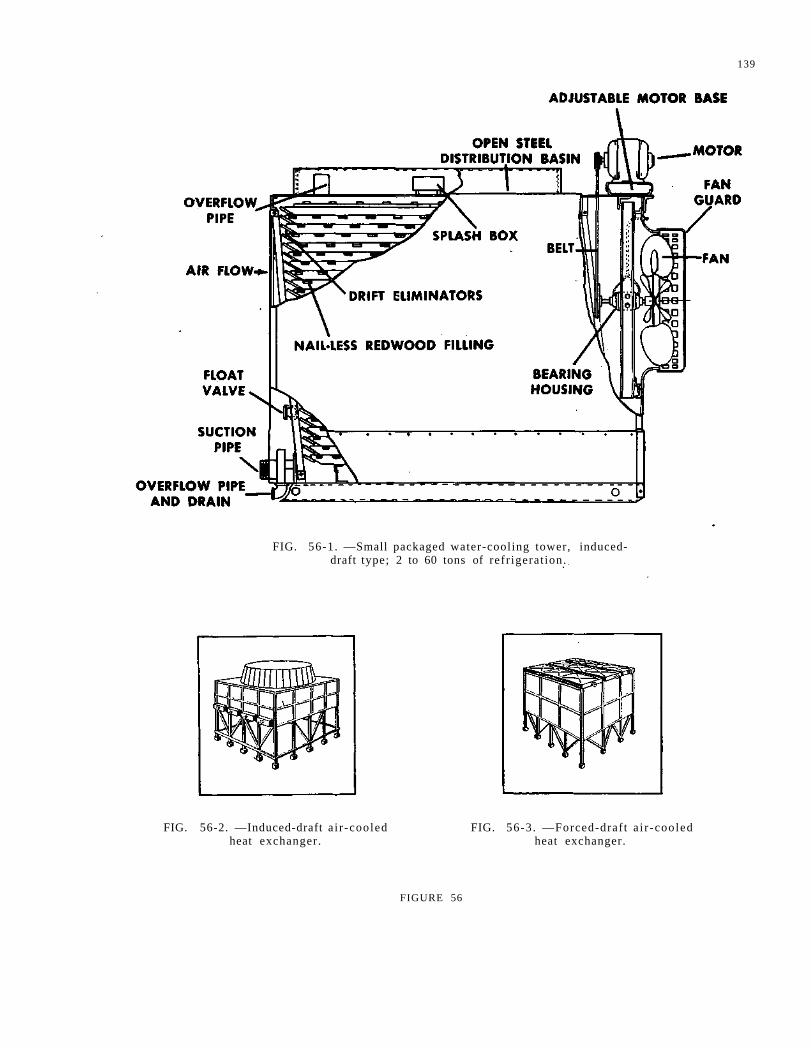
139
FIG. 56-1. —Small packaged water-cooling tower, induced-draft type; 2 to 60 tons of refr igerat ion.
FIG. 56-2. —Induced-draft a i r -cooled heat exchanger.
FIG. 56-3. —Forced-draft a i r -cooled heat exchanger.
FIGURE 56
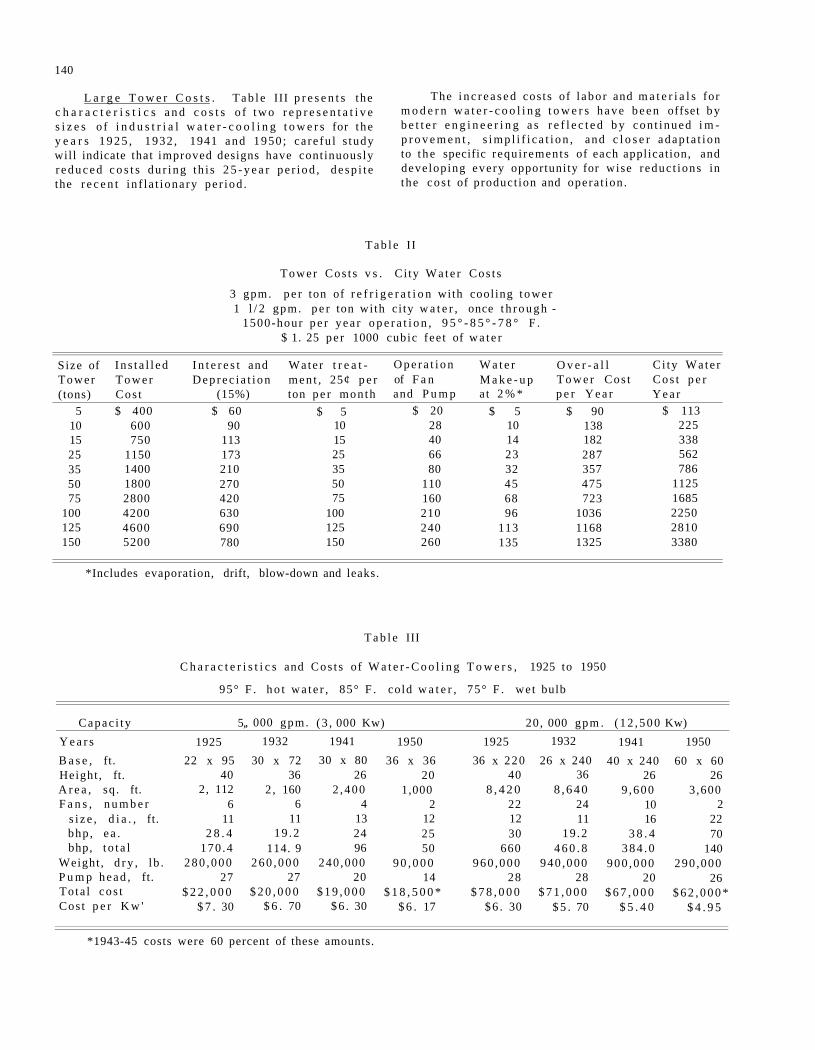
140
L a r g e T o w e r C o s t s . T a b l e III p r e s e n t s the c h a r a c t e r i s t i c s a n d c o s t s o f t w o r e p r e s e n t a t i v e s i z e s o f i n d u s t r i a l w a t e r - c o o l i n g t o w e r s for the y e a r s 1 9 2 5 , 1932 , 1941 and 1950 ; ca re fu l s tudy will indicate that improved designs have cont inuously r e d u c e d c o s t s du r ing th i s 2 5 - y e a r pe r iod , d e s p i t e the r e c e n t in f l a t ionary pe r iod .
The i n c r e a s e d cos ts of l abo r and m a t e r i a l s for m o d e r n w a t e r - c o o l i n g t o w e r s h a v e b e e n offset b y b e t t e r e n g i n e e r i n g a s r e f l e c t e d b y con t inued i m p r o v e m e n t , s i m p l i f i c a t i o n , and c l o s e r adap ta t ion to t h e specific requi rements of each application, and developing every opportunity for wise reduc t ions in the cos t of product ion and opera t ion .
T a b l e II
Tower Cos t s v s . Ci ty W a t e r Cos t s
3 gpm. p e r ton of r e f r i g e r a t i o n with cool ing t ower 1 l / 2 gpm. p e r ton wi th ci ty w a t e r , once t h r o u g h -
1500-hour p e r y e a r o p e r a t i o n , 9 5 ° - 8 5 ° - 7 8 ° F . $ 1. 25 pe r 1000 cubic fee t of w a t e r
Size of I n s t a l l e d I n t e r e s t and Wate r t r e a t O p e r a t i o n W a t e r O v e r - a l l C i ty Wa te r Tower T o w e r D e p r e c i a t i o n men t , 25¢ p e r of F a n M a k e - u p T o w e r Cos t C o s t p e r (tons) Cos t (15%) ton p e r mon th and P u m p at 2 % * p e r Y e a r Y e a r
5 $ 400 $ 60 $ 5 $ 20 $ 5 $ 90 $ 113 10 600 90 10 28 10 138 225 15 750 113 15 40 14 182 338 25 1150 173 25 66 23 287 562 35 1400 210 35 80 32 357 786 50 1800 270 50 110 45 475 1125 75 2800 420 75 160 68 723 1685
100 4200 630 100 210 96 1036 2250 125 4600 690 125 240 113 1168 2810 150 5200 780 150 260 135 1325 3380
*Includes evaporation, drift, blow-down and leaks.
T a b l e III
C h a r a c t e r i s t i c s and Cos t s of W a t e r - C o o l i n g T o w e r s , 1925 to 1950
95° F . h o t w a t e r , 85° F . cold w a t e r , 75° F . we t bulb
Capac i ty 5, , 000 gpm. (3 , 000 Kw) 20, 000 gpm . ( 1 2 , 5 0 0 Kw) Y e a r s 1925 1932 1941 1950 1925 1932 1941 1950 B a s e , ft. 22 x 95 30 x 72 30 x 80 36 x 36 36 x 220 26 x 240 40 x 240 60 x 60 Height , ft. 40 36 26 20 40 36 26 26 A r e a , sq . ft. 2, 112 2 , 160 2 ,400 1,000 8 , 4 2 0 8 ,640 9 ,600 3 ,600 F a n s , n u m b e r 6 6 4 2 22 24 10 2
s i z e , d i a . , ft. 11 11 13 12 12 11 16 22 bhp , e a . 2 8 . 4 19 .2 24 25 30 19 .2 3 8 . 4 70 bhp, t o t a l 170 .4 114. 9 96 50 660 4 6 0 . 8 3 8 4 . 0 140
Weight , d r y , l b . 2 8 0 , 0 0 0 2 6 0 , 0 0 0 240 ,000 9 0 , 0 0 0 960 ,000 940 ,000 900 ,000 290 ,000 P u m p h e a d , ft. 27 27 20 14 28 28 20 26 Tota l cos t $ 2 2 , 0 0 0 $ 2 0 , 0 0 0 $ 1 9 , 0 0 0 $ 1 8 , 5 0 0 * $ 7 8 , 0 0 0 $ 7 1 , 0 0 0 $ 6 7 , 0 0 0 $ 6 2 , 0 0 0 * Cos t p e r K w ' $ 7 . 30 $ 6 . 70 $6 . 30 $ 6 . 17 $ 6 . 30 $ 5 . 70 $ 5 . 4 0 $ 4 . 9 5
*1943-45 costs were 60 percent of these amounts.
141
AIR-COOLED EXCHANGERS
The air-cooled exchanger is a device for cooling or condensing fluids by circulation of the fluid through finned tubes and forcing of atmospheric a i r across the coil sections. This dry-surface cooler is basically a noncontact convection-type heat exchanger and requi res no water for cooling. One arrangement for a dry-cooler is the induced draft unit (Fig. 56-2) with the fan mounted on top, d i s charging the air upward and inducing air across a ho r i zon ta l bank of coils mounted below the fan. Another arrangement is the forced-draft (Fig. 56-3) with the fan discharging air upward across a hor i zontal bank of coils mounted above the fan.
The air-cooled exchanger may be used in prefer ence to a water-cooling tower for applications of "high-level heat removal" where temperatures of the fluids to be cooled are above 130° F . , and where water is scarce, expensive, and/or badly polluted. Normally, a cooling tower is more economical, but the cost of the a i r - c o o l e d exchanger decreases
relative to that of the tower as the temperature of the fluid-to-be-cooled r ises . Both units have their own applications and in some instances either type may be used.
CONCLUSION
Water-conserving devices are definitely a s s i s t ing in the efforts to sustain water supplies in many sections. However, population increases , added irrigation requirements, rapid industrial expansion, and hundreds of other lesser applications, in many sections are increasing the demands for water more rapidly than is ref lected by the ra te of installed capacity of cooling equipment. In such a reas , r e strictive legislation on the use of water is p refer able to increase in water rates or costly added facilities because of the economy of present-day water-cooling equipment. Also, the re-use of any coolant within a given heat cycle is desirable because of the improved control of the fluid and correlated p r o c e s s .
When the State of Illinois cons t ruc ted a m o d e r n h e a d q u a r t e r s and l a b o r a t o r y bui lding to house the S ta t e W a t e r S u r v e y i t t h e r e b y gave p h y s i c a l ex p r e s s i o n to the common conce rn of i t s c i t i z ens for improved control and utilization of the s t a t e ' s w a t e r r e sou rces . At the same t ime , it was an ac t of fai th, b a s e d on the d e e p - s e a t e d convict ion t ha t f ree m e n a r m e d wi th s c i e n t i f i c knowledge c a n m a s t e r the n a t u r a l f o r c e s of t h e i r e n v i r o n m e n t and use t hem for the m a x i m u m benef i t of m a n k i n d . Th i s d e d i ca to ry Conference , with i t s a r r a y of d i s t i ngu i shed sc i en t i s t s , eng inee r s and a d m i n i s t r a t o r s , l ikewise symbolizes this faith in the beneficence of sc ient i f ic method applied to r e source utilization. By the poo l ing of knowledge and the in te rchange of v i e w s , this conference can, and I am su re wil l , po in t the way toward making t ha t faith a l iving r e a l i t y .
But, if the vas t s tore of knowledge a c c u m u l a t e d by the devoted labors of the sc ien t i s t s and e n g i n e e r s is to bear fruit on a scale commensu ra t e with m o d e r n needs , we m u s t invoke the ac t ive i n t e r e s t and cooperation of other relevant groups , such a s : po l i t i ca l scientists , lawyers , economis ts , soc io log i s t s , social psychologis ts , regional and communi ty p l a n n e r s , e d u c a t o r s and p u b l i c i s t s . F o r t h e s e l a t t e r g r o u p s , in a d e m o c r a t i c s o c i e t y , a r e the i n s t r u ments of social change, the moulders of publ ic opinion, the " e n g i n e e r s " of soc ia l innovation and i n s t i t u t i o n a l a d a p t a t i o n ; t h e i r funct ion i s t o fac i l i t a te t h e ad jus tmen t of ins t i tu t ions to t e c h n i q u e s with a view toward max imiz ing the potent ia l ga ins of s c i entif ic p r o g r e s s .
The four p r e c e d i n g p a p e r s tend to e m p h a s i z e and reinforce a conclusion to which I c a m e as a r e s u l t o f m y w o r k wi th the P r e s i d e n t ' s W a t e r R e sources Policy Commission—and which I had in mind to i n t e r j e c t a t s o m e a p p r o p r i a t e point i n the d i s c u s s i o n . T h e r e I w a s i m p r e s s e d by t h e fact tha t we know so m u c h m o r e t han we a c t u a l l y put into p r a c t i c e . I was a m a z e d , and not a l i t t le d i s h e a r t ened, to observe t ha t we ut i l ize only a s m a l l f r a c t ion of the g r e a t s t o r e of s c i en t i f i c a n d t e c h n i c a l i n f o r m a t i o n a t ou r d i s p o s a l . I a s k e d m y s e l f r e peatedly why this is so. Why do we fall so far s h o r t of our potent ia l l e v e l of a c h i e v e m e n t ?
The c rux of the m a t t e r , i t s e e m s to m e , l i e s in the nature of the inst i tut ional a r r a n g e m e n t s — a l l deeply imbedded in our laws and soc ia l a t t i t u d e s — by which we g o v e r n and c o n t r o l the u t i l i z a t i o n of
*Professor of Economics , University of Illinois, Urbana, Illinois.
wa te r r e s o u r c e s . T h e s e ins t i tu t ions evolved f rom our p r e - s c i e n t i f i c , ind iv idua l i s t i c p a s t ; they w e r e a p p r o p r i a t e and useful for tha t p e r i o d , but we a r e a l l aware that those days a r e gone. We now live in an advanced industr ia l , urbanized society, and t h e r e is a glaring need to modify some of the old i n s t i t u t ions which have come down to us f r o m an e a r l i e r and s imple r p a s t . In shor t , we need to dev i se new a r r a n g e m e n t s c o n s i s t e n t wi th m o d e r n n e e d s and m o d e r n t echno logy .
Spec i f ica l ly , we should modify t h o s e i n s t i t u t ions which f r u s t r a t e the full deve lopment and s c i en t i f ic u t i l i z a t i o n of w a t e r r e s o u r c e s , and which p r e v e n t our s c i e n t i s t s and e n g i n e e r s f r o m app ly ing freely the i r knowledge and crea t ive imag ina t ion . The perfection of new institutions is a pol i t ica l p r o b l e m — h e r e I use p o l i t i c s in the v e r y b e s t s e n s e of t h e w o r d ; i t i n v o l v e s a whole s e r i e s of po l i t i ca l ac t ions . F o r example , I am deeply c o n c e r n e d with our lack of a p p r o p r i a t e organiza t ions and f inancia l p r o c e d u r e s for the s u c c e s s f u l execu t ion of l a r g e -sca le water deve lopmen t p r o j e c t s . H e r e , we need a g r e a t deal of what I ca l l " ins t i tu t iona l i nven t ive n e s s , " o r c r ea t i ve expe r imen ta t i on .
C o n s i d e r a few e x a m p l e s : the r i g h t of l andowners to m i s u s e the i r lands r e g a r d l e s s of a d v e r s e social effects, such as acce le ra ted runoff, soi l e r o s ion and dep le t ion of n a t u r a l s t o r a g e ; the r igh t to e x h a u s t g r o u n d w a t e r s ; the r i g h t t o d u m p sewage a n d i n d u s t r i a l w a s t e s in to s t r e a m s a n d l a k e s ; the doctr ine of p r i o r p reempt ion operat ive in the w e s t e r n s t a t e s ; c o n f l i c t s b e t w e e n p r i v a t e and public in te res t s ; jur isdic t ional conflicts among loca l , s ta te and f e d e r a l a g e n c i e s , and wi th in the f e d e r a l bur e a u c r a c y ; lack of organiza t ions and f inancia l p r o c e d u r e s func t iona l ly a p p r o p r i a t e for l a r g e - s c a l e i n t e g r a t e d w a t e r con t ro l s y s t e m s ; l ack of r a t i o n a l m e a n s for allocation of water to end uses in e x t r e m e s c a r c i t y s i tua t ions ; lack of adequa te g o v e r n m e n t a l power to a s s e s s deve lopmenta l cos t s in r e l a t i o n to b e n e f i t s . Such i n s t i t u t i o n a l r o a d b l o c k s and def i ciencies mus t be al leviated before we can a t ta in full application of existing scientific and technical knowle d g e .
Again , we n e e d to face up to the r e a l i t i e s of t hose r e l a t i onsh ips we ca l l " r i g h t s , " to which M r . P o w e r s r e f e r r e d when h e sa id tha t i n d u s t r y m u s t be c o n c e r n e d to p r o t e c t i t s " r i g h t s . " In the r e a l world many of these so-cal led " r i g h t s , " abou t which m e n get so a g i t a t e d and w r o u g h t up e m o t i o n a l l y , a r e either obsolete or nonexistent . When, in Washington, I encountered a gent leman who was g r e a t l y
143
INSTITUTIONAL CHANGE AND WATER RESOURCE UTILIZATION
BY HORACE M. GRAY*
144
excited about water " r igh t s " in the West I asked him what they were, beyond mere pieces of paper . He gave me an abstract legal definition that had no relation whatever to real i ty . The essential fact, in this' instance, was that there was no water; the basic scarcity rendered worthless his "right." Yet, when I showed him how, by taking concerted action and by applying scientific pr inciples , an adequate supply of water could be had to validate existing, but now worthless "rights," he took a more real is t ic attitude and was prepared to accept the institutional changes necessary to get the job done on a scientific basis. Previously he had opposed any such change as tending to jeopardize his " r i gh t s . "
Another example may be drawn from the a rea of stream pollution. In the exercise of their ancient rights and privileges, individuals, municipalities and industr ies discharge untreated waste waters into a natural stream with the consequence that i ts usefulness is destroyed for all other purposes. Our scientists and engineers know how to clean up this stream, thereby enhancing its value many fold. Yet they are prevented from doing so because we lack the necessary political organization and financial procedures for doing the job on a complete, a r e a -wide basis. Everyone admits we know how to e l im
inate stream pollution; everyone concedes that pollution of our s t r eams is a grea t social waste and ought to be prevented; yet, out of concern for individual "rights" and aversion to institutional change, we pers i s t year after year in tolerating this evil.
This is a political problem—and one fraught with extraordinary difficulty because it challenges deep-seated social atti tudes and powerful vested interests. But it is not an impossible task. Social attitudes can be modified by the processes of education; vested in teres ts can be compelled to yield to public necessity. It is the special virtue of democracy that its basic processes of free inquiry, free discussion and free legislat ive action facilitate institutional changes in accordance with the popular will. Scientists and engineers can make a vital and significant contribution to this process by gathering and analyzing the basic data concerning our water resources, by demonstrating improved methods of control and utilization, and by publicizing their findings in meaningful form. Scientific truth will thus provide a solid foundation for intelligent political action designed to ra ise the general level of efficiency with which we utilize this most basic natural resource .
S T A T E W A T E R P O L I C I E S
BY L. R. HOWSON*
WITH DISCUSSIONS BY R. O. JOSLYN, JOHN W. FOSTER, HORACE GRAY, A. M. BUSWELL, AND H. T. CRITCHLOW
BASIC CONSIDERATIONS
In a cons idera t ion of w a t e r r e s o u r c e s p o l i c i e s for t h e S t a t e o f I l l i n o i s , t h e r e a r e c e r t a i n b a s i c c o n c e p t s which a r e b e l i e v e d t o be p e r t i n e n t :
(1) I l l ino is i s not an a r i d s t a t e . Al though i t extends m o r e than 350 m i l e s nor th and sou th , the p r e c i p i t a t i o n , w h i c h a v e r a g e s a p p r o x i m a t e l y 3 5 inches p e r y e a r , i s g e n e r a l l y adequa te .
(2) The ent i re State is well watered by r i v e r s and m i n o r s t r e a m s . The n o r t h e a s t e r n p a r t o f the State bo rde r s on Lake Michigan. The ent i re w e s t e r n boundary is the Miss i s s ipp i River , and the s o u t h e r n boundary the Ohio River . A large par t of the e a s t e r n boundary is the Wabash R ive r , and the I l l inois R i v e r with i t s 28,000 square m i l e s of dra inage a r e a t r a v e r s e s through a lmos t the center of the State .
(3) Underground wate r , ei ther in the g r a v e l s , l i m e s t o n e s , o r s a n d s t o n e s , i s g e n e r a l l y a v a i l a b l e in the nor thern half of the State . Litt le ground w a t e r is ava i l ab le in the sou the rn half.
(4) In a few a r e a s t ha t w e r e o r ig ina l ly p r o vided with abundant u n d e r g r o u n d wa te r r e s o u r c e s a c u t e w a t e r cond i t ions h a v e b e e n c r e a t e d b y s u b s tan t i a l overdraf ts of both munic ipa l and i n d u s t r i a l u s e s .
(5) W a t e r r e s o u r c e s p o l i c i e s i n I l l i n o i s shou ld be c o n c e r n e d with o v e r a b u n d a n c e , tha t i s , f loods a s wel l a s i n a d e q u a c i e s .
(6) That form of legislative control for I l l inois i s b e s t which wil l a c c o m p l i s h the d e s i r e d r e s u l t s w i th a m i n i m u m of r e s t r i c t i o n s , a d m i n i s t r a t i v e p r o c e d u r e and a l l o c a t i o n s .
(7) State con t ro l should be for the c o m m o n good w i t h e n f o r c e m e n t l o c a l i z e d t o the g r e a t e s t p rac t i cab le extent.
I t should be pointed out that the State m a y have a w a t e r r e s o u r c e s policy without having l e g i s l a t i o n cont ro l l ing deve lopmen t s . The p r i m a r y q u e s t i o n s would appea r to be , f i r s t , has the State an i n t e r e s t in i t s w a t e r r e s o u r c e s ; and second, to what ex ten t tha t i n t e r e s t should be e x p r e s s e d in con t ro l l e g i s la t ion ?
ADEQUATE DATA AND STUDY ESSENTIAL
Adequa te da ta r e l a t i v e to the o c c u r r e n c e and the f a c t o r s influencing v a r i a t i o n s in o c c u r r e n c e of
*Alvord, Burdick & Howson, Chicago, Illinois.
water r e s o u r c e s and re l iable in te rpre ta t ion of t h o s e da ta a r e e s sen t i a l to p r o p e r unders tanding of w a t e r r e s o u r c e s whether above or below ground.
With r e spec t to surface wa te r s where the p r o b l e m of overabundance , as well as inadequacy , is a p rob l em, data re la t ing to ra infal l , ra infa l l i n t e n s i t i e s , runoff, erosion, s i l t - ca r ry ing c h a r a c t e r i s t i c s , m a n - m a d e e n c r o a c h m e n t s i n the f o r m o f l e v e e s and the i r effect upon flood heights and s i m i l a r da ta a r e impor tan t .
Rainfal l da ta , p a r t i c u l a r l y that r e l a t i n g to i n t e n s i t y o f fa l l w h i c h i s n e c e s s a r y t o an adequa t e in terpre ta t ion of peak runoff r a t e s , is a l l too s c a n t y . The p r o b l e m s a r i s i n g wi th r e s p e c t t o the s t o r a g e of water for public use a r e n e c e s s a r i l y s tudied with inadequate data avai lable on such impor t an t m a t t e r s as p robab le l o s s of r e s e r v o i r capac i ty due to s i l t ing , e v a p o r a t i o n f r o m the s u r f a c e o f r e s e r v o i r s , peak r a t e s of runoff as affecting adequa te sp i l lway des ign , m i n i m u m runoff and i t s dura t ion , e t c . , a l l of which a r e n e c e s s a r y to an adequate cons ide ra t i on of w a t e r s t o r a g e .
With r e s p e c t t o unde rg round w a t e r r e s o u r c e s the geology and hydrology of the a r e a m u s t be d e t e r mined before any r ea sonab l e adequa te p lan for the c o n s e r v a t i o n a n d u t i l i z a t i o n o f o u r u n d e r g r o u n d w a t e r r e s o u r c e s c a n b e m a d e . G e n e r a l l y such s t u d i e s a r e not m a d e un t i l a cu t e s h o r t a g e s a r i s e and i n m a n y c a s e s a f te r heavy f inanc ia l c o m m i t m e n t s have been m a d e b a s e d upon the a s s u m p t i o n that the water r e sou rce s were adequate for a l l u s e s .
U n d e r g r o u n d w a t e r r e s o u r c e s a r e not n e c e s sa r i ly a l l natural . Many underground water supp l i e s have b e e n g r e a t l y ex tended o r in i t i a l ly c r e a t e d by a r t i f i c i a l r e c h a r g e . T h i s m e a n s o f a u g m e n t i n g underground r e s o u r c e s has been mos t l a rge ly p r a c t i c e d in t h e a r i d s e c t i o n s o f the c o u n t r y , but in P e o r i a , I l l i n o i s , t h e r e i s now in o p e r a t i o n , a s a r e s e a r c h projec t of the I l l inois State Wate r S u r v e y , an e x p e r i m e n t a s to the p o s s i b i l i t i e s o f r e c h a r g e to the g r a v e l s along the I l l inois River on which the draft has ma te r i a l ly exceeded the n a t u r a l r e c h a r g e .
At Richland, Washington, the s i te of the H o u s ing Author i ty for the Hanford Atomic E n e r g y p lan t , a who l ly a r t i f i c i a l g round w a t e r supp ly h a s been c r e a t e d by discharging Yakima and Columbia R i v e r w a t e r on a p e r v i o u s g r a v e l m e s a f r o m which the water is la ter withdrawn by wells sunk in the v i c i n i ty of the recharge a rea . A supply of a p p r o x i m a t e l y 20 MGD of excel lent qual i ty water is being s e c u r e d
145
146
in this way at a cost but a fraction of that of pur i fying Columbia River water through a mechanical rapid sand filtration plant. Des Moines, Iowa, is another example.
It is apparent that the first requirement of any adequately considered 'water resource policy is a knowledge of the conditions, both surface and underground, as affecting the water resources available and subject to control.
THE LIMITATIONS OF STATE INTEREST
It is believed that the State has an in teres t in water r e sources from s tar t to finish, from "dew to slough" or from "cloud bank to r iver bank." It is believed, for illustration, that this in teres t includes what has come to be known as rain making. Millions a r e spent for development and conservation of visible water resources. Why is it not equally pertinent to at least explore the possibilit ies and, if the possibi l i t ies a r e a t t ract ive , eventually the economic practicabil i ty of augmenting the visible supplies by those which otherwise are not available ? It was a consideration such as this that led the Il l inois State Board of Conservation and Natural Resources to match with the Pfister Hybrid Seed Corn Company a $25, 000 expenditure to explore the pos sibilities of rain making.
The same Board recently approved the budget of the State Water Survey, which'included an item to finance a study of the use of radar in determining the extent and rates of precipitation over a greater area and with greater accuracy than is practicable with our present sparse network of rain gaging s t a t ions , par t icu lar ly those that de termine ra tes of fall.
It is believed to be a proper function of an or ganization such as the Illinois State Water Survey to conduct research on water in all its phases insofar as they affect the common good. Its activities should be limited pr imar i ly to research pointing out the possibilities and, in general, leaving the determination of economic pract icabil i ty to those who will benefit therefrom.
It is believed there should be no distinction in the i n t e r e s t of the State as between surface and underground water resources . Underground flow is simply an indication of water on its way to the surface. Today's underground flow may appear as surface flow in the future. Disturbances in underground flow where the aquifers are of broad extent a r e more gradual in the i r detectable effect upon the availability of resources than is the case with surface supplies. The storage in the voids of the sands and g rave l s is usually so extensive as to equalize seasonal excesses or inadequacies and the available resources are , therefore, of a less volatile nature than surface sources. By the same token, overdraft from underground aquifers may be more
difficult to correct and the time required for res to ra tion to normal conditions may be much longer than for surface sources.
Since the State is interested in the availability of water resources, it is likewise interested in the maintenance of quality of water which will make it available for all purposes for which it may legitimately be desired. The State, therefore, is vitally in teres ted in pollution control and in many cases pollution abatement.
Pollution control in Illinois is a responsibility of the Sanitary Water Board, which acts in close cooperation with the Illinois State Department of Health. Control over pollution in this State and in its boundary waters, where control is exercised through formal or informal State compacts, may g e n e r a l l y be cons ide red as adequate . At least marked progress has been made and with a continuation and improvement in past pollution control pro-cedures, the water resources of Illinois are believed to have all the legislative control necessary from the pollution standpoint.
A State water policy should, of course, exercise such controls as are essentially in the interest of public health. In Illinois, such controls already exist , and a r e being adequately exercised. The same can generally be stated of all of the 48 states.
LEVEL OF CONTROLS
As a resu l t of the r e p o r t of the Pres ident ' s Water Resources Policy Commission within the past year entitled, "A Water Policy for the American People, " attention has been focused upon national water resources policies. Renewed consideration is being directed toward the level at which water r e s o u r c e s policies should be determined and the cha rac te r and extent of control .
It is believed a sound policy that water r e s o u r c e s should be controlled at the lowest level of governmental operations at which such control can be effected. That, it is believed, will require adequate legislation be passed in the several states. In s ta tes such as Illinois, it would appear that the legis la t ion should be of the enabling act type by which local communities, in which the overdevelopment or pollution or abuse of na tura l water r e sources is of consequence and is adversely affecting the economy of the a r e a , should be permitted to organize a water d is t r ic t within the t e rms of the state legislative policy. In general , the creation of such a d is t r ic t will probably regulate new and additional water uses, will probably recognize prior developments, and endeavor to apportion the available resources equitably among those needing them.
The State of Illinois by Senate Bill No. 630, signed by Governor Stevenson on August 2, 1951, authorized the incorporation of Water Authorities. This legislation enables the Authorities to inspect
147
well developments, to require registration of wells, to require permits for additional wells, to regulate use during water shortage, to supplement existing water supply and to levy taxes to accomplish these objectives. This legislation is apparently limited in scope to ground water applications.
The recent legislature also passed Senate Bill No. 292, which is the new water pollution law of Illinois. This act gives the Sanitary Water Board broader powers over pollution abatement.
It should be pointed out that the regulation of many so-called water shortages in a state such as Illinois, which has abundant water resources , in many localities a choice of resources is quite largely an economic question. Most sections of the State have some choice of supplies, the one selected usually being the lowest in annual cost. As time goes on, the economic compar i son between supplies changes and the use is frequently t ransfer red to another source. An illustration of this, of course, is the Chicago area, which is underlaid with sandstones which have their outcrops in central Wisconsin. Some 50 years ago, wells penetrating these sandstones in the Chicago area flowed freely at the ground surface. While the City of Chicago drew its water supply from Lake Michigan, practically all of the suburbs and many of the major industries drew their supplies from wells penetrating the sandstone. As the draft increased, the water level r e ceded until , at the present t ime , the water level in wells penetrating the sandstones is 350 feet or more below ground level in practically all of the Chicago a r e a . As the water level receded, the major use r s found it more economical to connect to the City of Chicago, and progressively such communities as Cicero, Berwyn, Oak Park, Brookfield, the Clearing Industrial District, the Corn Products Company, all large users of water, and others gave up their wells. With each reduction in use, there would be a retardation in drop or a recovery in well water levels . Thus economics, rather than legal requirements, have largely dictated the choice and regulated the source of water supply in the Chicago a rea .
In this connection a statement which appears in the Engineering Joint Council Committee Report enti t led, "A Statement of Desirable Policy with Respect to the Conservation, Development, and Use of the National Water Resources," is pertinent. It applies to the question Mr. Alquist brought out. This statement reads:
"The Coordinating Committee points out in connection with public water supplies that, contrary to general public belief, there is no experience basis for the fear that the availability of water resources , surface or underground, is declining. Shortage of water is nei ther universal nor increasing. Synchronization of development and of use on occasion has been inadequate. Declining underground water levels prevail in some areas, with excessive ground water rises in others. On a national scale, however, there is little evidence to support the prophets of
doom in the water resources field. Intelligent husbanding and allocation are the keys to the future. "
FINANCING
In genera l , a water r e sources policy should recognize that those who benefit should pay the cost and that benefits should materially exceed costs on work that is done with public funds.
An illustration—the State of Illinois built and paid for the Illinois Waterway which has now become an important link in our national inland waterways transportation system, 20 million tons a year. As such, it is believed proper that it should now be operated and maintained by the Federa l Corps of Engineers , which it is .
Since, other than navigation, water resources development in the State of Illinois is largely local, essentially intrastate and, to a minor extent only, interstate which could be handled by state compacts, the Federa l Government 's financial participation should be, I bel ieve, l imited to supporting such federal agencies as the U. S. Public Health Service in its research and education work, in cooperating with the State, establishing and operating s t ream gaging stations and s imi lar acts for the common good, including navigation. Water resources , to repeat, should be developed and paid for by those who benefit therefrom.
Considered with respect to the next lower level, having discussed Federal , it is believed that State participation in water resources should be confined to research and that those who will profit from each individual development, again, should pay its cost.
Proceeding along the above lines of reasoning, the Illinois State Water Survey, as previously mentioned, has conducted research on the basic problems of rain making, on meteorology as related to areas and intensities of rainfall, on reservoir s tor age projects for public water supply to secure data on flood runoff as affecting spillway capacity, s i l t ing, evaporation from exposed water surfaces, etc. The Water Survey has also performed valuable se rvice in calling attention to the cost of hard water, the factors affecting corrosion, r e s e a r c h on the factors affecting the rapid deter iora t ion of deep well turbine pumping equipment, conducted some of the early research on the activated sludge process of sewage treatment, on the efficiency of trickling filters at various depths of the stone bed, factors affecting digestion and fermentation of sewage and industr ial waste solids and many other r esea rch problems which have been developed and utilized with large economic savings both within and without the State of Illinois.
While recognizing the important accomplishments of the Illinois State Water Survey with respect to the development and preservation of our water resources and taking pride in them, the work r e maining to be done is a challenge which the Illinois State Water Survey accepts in its definition of value as being a measure of future usefulness.
148
RAY O. JOSLYN. *—Mr. Howson has very ably presented a comprehensive paper on State Water Policies and limited the subject to the State of Ill inois.
Mr. Howson has mentioned the relationship and obligation of the Illinois Water Survey to various groups, and in this discussion I wish to enlarge upon that phase of the subject. The three points which I shall discuss a r e the relationship of the Illinois Water Survey
1. With the Public. 2. With the Federa l Government. 3. With Private Business.
RELATIONSHIP OF THE ILLINOIS WATER SURVEY WITH THE PUBLIC
The Illinois Water Survey naturally owes its f i rs t obligation to the ci t izens and taxpayers of the State of Illinois. In fact, its continued existence depends upon this group. How then can it best serve the common good? The water resources of the State of Illinois a re one of its greatest asse ts and like any product, a complete knowledge of its availabil i ty and application greatly enhances its value. Therefore, it is a basic function of the Survey to col lect al l avai lable technical information on water supplies—both surface and underground; to corre la te the data from tes t borings as an aid in establishing underground valleys and rese rvo i r s ; to maintain records of producing well capacities and drawdowns so the main water-bear ing strata can. be classified; to obtain logs of existing and future wells and to assemble data on rainfall, runoff and other pertinent subjects. The Water Survey should be a technical l ib rary of information of the water r e s o u r c e s of the State. This information should be made conveniently available in understandable language to city officials, engineers, contractors, and the public in general.
As a further service the Survey should expand their investigations and should serve as a research institute in obtaining information on water flows in streams, runoff, permeability and transmissibility of water sands, rehabilitation of wells, recharge of formations with surface water or discharge wells, corrosion of pumps and casings and new methods of equipment to better understand the water resources of the State. How will the above serve the taxpayer of Illinois?
(1) Industries will be attracted to the State, knowing that accurate and dependable water information is available.
*President, Layne-Western Company, Kansas City, Missouri.
(2) Municipalities can secure information regarding new and supplemental water supplies.
(3) Consulting engineers and contractors can obtain data to aid them in reports and proposals in their work and as a result of the above.
(4) The public will benefit in being able to obtain more dependable water supplies , in both quality and quantity.
The relationship to the public is to provide a technical library and a research institute.
RELATIONSHIP OF THE ILLINOIS WATER SURVEY WITH THE FEDERAL GOVERNMENT
Mr. Howson has stated that the Federal Government' s financial participation should be limited to supporting such federal agencies as the U. S. Public Health Service in its research and educational work, in cooperating in mapping the state , establishing and operating s t r e am gaging stations and s imi lar acts for the common good, including navigation. To this plan I wholeheartedly subsc r ibe ; let us see what happens when the federal participation exceeds the limitations stipulated above.
With the addition of contributed federal funds, the se rv ices will be expanded and additional data secured, but in the zeal of expansion the State Survey may find it difficult to l imit their activity to the purpose for which it was originally created.
We find that in some of the states which have received federal funds on a cooperative bas is , the State Surveys have been urged and requested to purchase tes t dri l l ing equipment for the drilling of t e s t holes , which test holes were dril led p r i mar i ly to secure regional geological information. However, many of the tes t holes were dri l led in locations that could be classed as regional or local and in some cases t es t s were dri l led for a local municipality. Whether this was due to local p ressure , or pol i t ica l persuas ion, is inconsequential but if means that the Survey was ignoring and losing sight of its main objective of securing regional data.
Municipalities a re prone to ask too much of state and federal agencies and, wanting to get "something for nothing," they a re inclined to request engineering service which should be provided at community expense. They must be repeatedly reminded that the tax-supported agency has for its main objective the securing of data to complete the state-wide pictu re .
Aggressive engineers in public employ have been known to exceed their function by conducting test drilling programs for cities or by the application of data to the detailed solution of local problems. These are clearly practices to be deplored.
DISCUSSION
149
They invade the province of private industry (the consulting engineer and the dril l ing contractor); they result in favoritism since such service cannot be offered to all who desire it; and they divert personnel away from much-needed basic studies. Many other direct or indirect objections to such "socialized engineering" a r e at once apparent.
This policy of donating service to a city is in conflict with the ideas expressed in Mr. Howson's paper, wherein he states, "that State participation in water resources should be confined to research, and that those who will profit from each individual development should pay its cost. "
Therefore, the relationship between the State Survey and the Federal Government should be one of cooperation in exchanging data and information, but certainly a state should be sufficiently interested in its own resources and financially able to lend all monetary assistance necessary to support its own State Water Survey, and the state should not reques t or accept federa l funds to assis t in carrying on this work.
It is quite noteworthy that among the several states with which the wri ter has frequent contact in regard to water information, the States of Missouri and Illinois a r e outstanding in having authentic information readi ly available and neither of these States r ece ives federa l appropria t ions on a cooperative bas i s .
RELATIONSHIP WITH PRIVATE BUSINESS
What type of relationship should exist between the State Survey and Private Business? Certainly it should be one of harmony, cooperation and respect and in no way should Pr ivate Business ever have any reason to believe that the State Survey is competing with Private Business. The private dri l ler and engineer should be anxious to turn over to the State Survey all information on logs of wells, pumping data, and interference of wells so that this information can be tabulated and used to augment existing data. The individual who is now contributing to the over -a l l fund of knowledge will be able to refer to this and other data in the future.
Due to complaints by Pr ivate Industry of the interference of the Surveys, mentioned a few moments ago, a conference was held in May of 1948 in Atlantic City, with the policy committee of the American Water Works Association, representa
tives of the U. S. G. S. and representatives of P r i vate Business. An official statement of A. W. W. A. policy committee as a result of that meeting is quoted below:
"The Association holds the opinion that neither the U. S. G. S. nor the State agencies with which it cooperates, should own or operate test well drilling equipment or equipment suitable for drilling water wells for later use. On the contrary, the Association holds the opinion that test well drilling should be done by competent private industry under contractual arrangements made by the driller with the U. S. G. S. or the State or local public agency concerned. In outlining these opinions in broad pr inciple, the Association grants that when test well d r i l l ing needs to be done—and no private contractor is willing or able to do the work—the public agency may properly do it in order that the public in teres t be served effectively. "
In view of the above, it was interesting to note a recent press report which reads as follows: "The Cha i rman of the City Council water committee, made contact with the head of the Geological Department and secured assurance that his depar t ment would make a search for good well water for the City. The geological department has a special service available which will make a careful survey of the s u b - t e r r a n e a n well water possibil i t ies in this area. The University men plan to begin work within the next week or ten days. "
Naturally, it is not a pleasant sight to a private well contractor to see a state-owned well rig d r i l l ing test holes while his rig is standing idly by. If he were one of the fortunate well dril lers who made a profit in his business and paid taxes, part of his tax money was used to buy the r ig which in turn was used to compete with him.
Cer ta in ly , no individual or company in our form of government should have to compete with his own government , either s ta te or federal , in performing his particular line of business. There fore, in summarizing this point; it should be stated that there should be no semblance of competition between the Survey and Private Business; on the contrary, with a program of cooperation, harmony and intelligent foresight, the Survey and Business should m a r c h forward together , a rm in a r m , to give the people of this great state full knowledge of their greatest heritage—WATER RESOURCES.
* * * * *
150
JOHN W. F O S T E R . * — A s a g e o l o g i s t m a y I c o m m e n t on a few po in t s which have a r i s e n h e r e t h i s m o r n i n g ? We think of g round w a t e r as a r e newable geologic r e s o u r c e , and t h e r e f o r e i ts efficient development r e q u i r e s the coord ina t ion of g e ology and engineer ing .
The State Geo log i ca l S u r v e y c o o p e r a t e s v e r y c lo se ly with the State Wate r Survey in r e s e a r c h on our S ta t e ' s wa te r r e s o u r c e s . The State Geolog ica l Survey is of the opinion that we have d i s c o v e r e d and u t i l i z e d only a s m a l l f r a c t i o n of the t o t a l g round w a t e r r e s o u r c e s ava i l ab l e in t h e S ta te . We have t r e m e n d o u s supp l i e s of ground w a t e r tha t a r e jus t beginning to be tapped. Illinois is for tunate to have pre-g lac ia l val leys, now to a large extent comple te ly b u r i e d . Many of the g l a c i a l g r a v e l s con ta in untouched water r e s o u r c e s . Much of Il l inois r e m a i n s to be explored by sys t ema t i c m e t h o d s .
The I l l inois State Geological Su rvey d o e s work in exploration but we have no dr i l l ing r i g s in o p e r a t ion, and I am s u r e Mr. J o s l y n ' s r e m a r k s on that w e r e not d i r e c t e d at I l l inois a c t i v i t i e s . We do use an e l e c t r i c a l r e s i s t i v i t y method for loca t ing a r e a s su i t ab le for t e s t d r i l l ing . We have he lped a g r e a t m a n y c o m m u n i t i e s in I l l inois in loca t ing d e p o s i t s -s u i t a b l e for the c o m m u n i t y w a t e r supply . T h e s e communit ies might otherwise have gone without d e ve lopmen t of t h e i r wa te r r e s o u r c e s , be ing unable to afford exploration by random t e s t dr i l l ing . Much of o u r w o r k i n v o l v e s the m a p p i n g of a r e a s which a p p e a r b a r r e n and unwor thy of t e s t d r i l l i n g . We often point out a r e a s favorable for t e s t d r i l l i ng , but i t is not our p r a c t i c e to point out speci f ic s i t e s for well location. I would like to s t r e s s again the need for geologic and eng inee r ing coo rd ina t i on and that the State Geological Survey works v e r y c lose ly with the S ta te W a t e r Su rvey in r e s e a r c h on the g round w a t e r r e s o u r c e s i n I l l ino i s .
R. O. JOSLYN. —I th ink , M r . F o s t e r , tha t , a t p r e s e n t , p r i v a t e i n d u s t r y i s no t ab l e t o c a r r y on res is t iv i ty exploration as effectively as the S ta te . When th is me thod does become c o m m o n in p r i v a t e i ndus t ry , then p r iva t e indus t ry can do it .
HORACE GRAY. —Mr. Joslyn has had an oppor tunity to deal with the organization of wa te r a u t h o r i t i e s in various s ta tes . I t occur red to me to a s k h im whether he r e g a r d e d I l l inois ' new W a t e r Au tho r i t y b i l l as a d e q u a t e to do the job on a c o m m u n i t y or d i s t r i c t b a s i s .
R. O. JOSLYN. —It is a v e r y b r i e f b i l l , and generally it is typically adapted to Illinois condi t ions . It i s , I think, app l i cab le only to u n d e r g r o u n d condi t ions . I am not sure that this is our whole p r o b l e m . I be l i eve the th inking m i g h t be expanded to b e t t e r control of some sur face supp l i e s too , but i t is a c rea t ive- type of bi l l , adaptab le to loca l cond i -
*Assistant Geologist. Illinois State Geological Survey, Urbana, Illinois.
t ions . Control should be left to loca l c o m m u n i t i e s w h e r e t h e r e i s o c c a s i o n for r e g u l a r o r g a n i z a t i o n and regula t ion by t h e m s e l v e s .
A. M. BUSWELL. —I think the b i l l was d r a w n essent ia l ly to cover a s i tuat ion in P e o r i a . I t is my impress ion that i t may be extended to sur face w a t e r if the conditions r equ i re . The bill m a k e s it pos s ib l e to handle water use on the lowest pol i t ica l l eve l . I t m a k e s i t p o s s i b l e for the s m a l l e s t a r e a t o handle i ts own problem. I have an example of the advantage of local control . We have had a condition of r e c e s s ion in the C h a m p a i g n - U r b a n a c o m m u n i t y , and i t h a s been n e c e s s a r y t o g o some d i s t a n c e t o s u p p l e ment our water supply. There were two local i n d u s t r i e s with a m u t u a l p r o b l e m ; a s o y b e a n p lan t r e q u i r e d a l a r g e a m o u n t of w a t e r for cool ing , and a ra i l road requi red water which was w a r m . The s o y bean plant was not success fu l in finding a wel l with a l a r g e y i e l d , and t h e r a i l r o a d had a s u b s t a n t i a l ground water supply. The Water Survey sugges t ed tha t the r a i l r o a d could r en t the w a t e r to the s o y bean mil l and then use it for i ts own pu rposes a f t e r wards . The n e c e s s a r y pipel ines have been la id and put into use so tha t s o r t of free cooperat ion is o p e r at ing h e r e . Many of u s , if we will t ake the t r o u b l e to go in to the d e t a i l s and con t ac t the i nd iv idua l s , can solve s imi la r water p rob lems in a s m a l l e r a r e a than a munic ipa l i ty .
H. T. C R I T C H L O W . - - I was i n t e r e s t e d in M r . Howson ' s c o m m e n t s f r o m the s t andpo in t of having the cont ro l over s u r f a c e wa te r for publ ic and p r i vate use and for underground w a t e r s . The e x p e r i ence in admin is te r ing such a law in New J e r s e y d e ve loped a conf l ic t b e t w e e n the u s e r s of w a t e r for publ ic supply a n d t h e p r i v a t e u s e r s o f we l l w a t e r in tha t the publ ic supply had no p r o t e c t i o n a g a i n s t the encroachment upon the i r s o u r c e s by the p r i v a t e we l l s . Th i s s i tua t ion finally r e s u l t e d in the s tudy and passage of a law which gives the State a u t h o r i t y to delineate and place under regulat ion ce r ta in a r e a s within the State to p ro tec t the sources of supply f r o m undue p u m p a g e , o r e n c r o a c h m e n t o f s a l t w a t e r . T h o se a r e a s have b e e n de l inea t ed w h e r e the need s e e m s to d ic ta te the n e c e s s i t y . That law has been on the s ta tu te book for four y e a r s , and i t h a s been r a t h e r s u r p r i s i n g to me that the i n d u s t r i a l i s t s and the o t h e r o w n e r s o f p r i v a t e w e l l s w e l c o m e s o m e c o n t r o l b e c a u s e the l aw d o e s p r o v i d e tha t t h o s e wel ls , or the well owners , have es tab l i shed c e r t a i n r i g h t s . T h i s w a s a n a t u r a l p r o v i s i o n in the law itself . So in the a d m i n i s t r a t i o n of the law, while we have a g r e a t m a n y difficult p r o b l e m s to s o l v e , everyone seems to welcome the cont ro l by the Sta te i n t h e s e a r e a s w h i c h a r e c a l l e d p r o t e c t e d a r e a s . Our expe r i ence t h e r e would indica te the p r a c t i c a bi l i ty of having p e r m i s s i v e r egu la t ion which would l imi t the cont ro l to the a r e a s where i t i s needed to p ro tec t supplies f rom damage by pollut ion or o v e r -pumpage.

T R E A T M E N T
P r o g r a m Chairman
T. E. LARSON
i
Treatment Room 116, E a s t C h e m i s t r y
Building, sou theas t c o r n e r , Mathews S t r ee t and California Avenue, Urbana .
MONDAY, OCTOBER 1
Evening
6:30 Informal get-together, Urbana-Lincoln Hotel Buffet supper. Football and radar m o v i e s .
TUESDAY, OCTOBER 2
Morning Sess ion C. H. Spaulding, P r e s i d i n g
9:00 " A d d r e s s of W e l c o m e , " Roger A d a m s 9:10 " C o r r o s i o n F u n d a m e n t a l s , " H. H. Uhlig
10:10 D i s c u s s i o n
10:45 "Composit ion of Water Subs tance , " W. H. Rodebush
11:45 D i s c u s s i o n
Afternoon Sess ion
1:45 "Exchange M a t e r i a l s , " A. S.. B e h r m a n 2:45 D i s c u s s i o n
3:15 " B o i l e r F e e d w a t e r Condi t ioning ," F . G. S t r aub
4:15 D i s c u s s i o n
* * *
5:30 Recept ion , Illini Union Building
6:30 Banquet , Illini Union Building
SURVEY OF CORROSION C O N T R O L IN W A T E R S Y S T E M S *
BY H E R B E R T H. UHLIG**
WITH DISCUSSIONS BY E. N. ALQUIST, JOHN F. WILKES, CHAS. H. SPAULDING, R. C. BARDWELL, H. H. UHLIG
Losses through corrosion of metals probably first received attention at the turn of this century, when the utilization of iron and steel took a sharp turn upwards . The es t imated figures for these losses had a certain interest as s tat is t ics , but it often remained easier, practically, to replace cor roded s t r u c t u r e s than to t r ace the source of deterioration. Today the emphasis has changed, and the need for corrosion control is accented part icularly as metal supplies become short, as ore r e serves look emaciated, and as modern industrial equipment must be better protected against increased operating pressures , temperatures and other corrosive factors.
Certainly the economics of the situation leaves no doubt that we should know more about corrosion than we do. Replacement costs for corroded equipment have become more rather than less disturbing, and shut downs, contamination of products, loss of efficiency, and accidents have never been popular. Hiding of ignorance by ample overdesign to take care of the unknown in corrosion, is less acceptable engineering practice today than it was in times past. The pipe line, the pump, or the oil well sucker rod must now entail the optimum economic design meeting both mechanical specifications and expected corrosion over a long range bas i s . The acceptable approach to corrosion problems, in other words, has become more subtle than merely increasing the c ross sectional a rea of metal. Cathodic protection, metal coatings, organic coatings, inhibitors, treatment of the environment and alloys offer proved advantages in the saving of me ta l s , human effort and dol lars . Much ha.s been done in recent years to mitigate corrosion, but ac ross the board in all industries and wherever metals a re used, the major advances along these lines are still to come.
What we presently know about corrosion mitigation has accumulated through several sources, including (a) basic research and (b) service data combined with empirical probing. Stainless steels, for example, were discovered in England by the empir-
*Also submitted to the American Chemical Society for publication in conjunction with Symposium on "Corrosion by Water" at 75th Meeting, September 4, 1951.
**Corrosion Laboratory, Department of Metallurgy, Massachusetts Institute of Technology, Cambridge, Mass.
ical probing of H. Brear ley in 1912. The use of modern protective paints and chromate inhibitors also resulted from probing combined with service data. On the other hand, modern boiler water t r ea t ment, the application of the Saturation Index to corrosion control, the discovery of cathodic protection, and the improved corrosion resistance of present-day aluminum alloys were the result of planned experiments and fundamental knowledge of the sciences;
Fundamental research in corrosion began in the early 1800's with the basic work in electrochemistry of Sir Humphrey Davy, Michael Faraday and W. H. Wollaston in England; A. Volta in Italy; and A. de La Rive in France (1)' . The quantitative relation between electr ici ty and chemical change in a cell was firmly established; from this the suggestion followed that corrosion of metals must be similar to the action that takes place in the galvanic cell. Cathodic protection, one of the most effective, p rac tical present-day means for reducing corrosion of metals, had its beginnings at this time in the sys tematic research of Davy. His laboratory experiments showed that zinc, tin or iron diminished corrosion of copper to which it was electrically coupled in a salt solution, an idea which he applied later to protect the copper sheathing of a British warship.
Although this early work established the foundations, it was not until 75 years or so later, at the turn of the 20th century, that the subject received further attention. By this t ime, the industrial age was well under way with its tremendous demands on metals, and corrosion began to make an impres sion as a subject of technical and economic importance. Willis R. Whitney in 1903 (2), while a member of the teaching staff of Massachusetts Institute of Technology, focused attention on the e lect rochemical processes attending the corrosion of iron, followed a few years later by the researches of his colleague, W. H: Walker (3). Walker and his collaborators proved the important role of dissolved oxygen in the corrosion of i ron, and showed that carbonic acid was not necessa ry to the reaction, contrary to the general impression up to that t ime. From this was built the foundations of modern boiler water t r ea tmen t , making possible the economic
Number in parentheses refers to number in BIBLIOGRAPHY at end of this article.
153
154
production of high-pressure steam in boilers cons t ruc ted of s tee l , from which followed, in turn, cheap electrical power. Corrosion control was an essential step in this development.
Basic r e sea rch gained impetus in the 1920's, and included the investigations of W. G. Whitman and those assoc ia ted with him on the behavior of i ron and s t e e l in wa te r s as a function of pH (4). This work provided a fundamental answer to the age-old controversy of whether ancient iron was better than modern, or some brand of steel or special kind of i ron was be t te r than its competitor, a question which service data had seemingly left open. Within the range of pH of most natural waters , oxygen depolarization controlled the rate of corrosion, and oxygen concentration was therefore the important factor. The gross composition, or incidental alloying elements, or inclusions, consequently had l i t t le , if any, effect on the r a t e . When this plausible conclusion was announced, a vast amount of service data in fresh waters and in sea water, either then available or obtained later, confirmed the labora tory deductions. It was this research which also explained why heat t reatment , internal stresses and surface preparation of a steel, despite erroneous intuitive concepts, were found to have practically no effect on the corrosion rate in natural waters.
In the acid region, on the other hand (below pH 4 to 6 depending on" the nature of the negative ions), where hydrogen evolution is the major cathodic r e action, it was demons t ra ted that composition of iron and steel becomes important. The controlling reaction at the minute cathodes of the steel surface in this region of pH, is determined not so much by oxygen concentration, as by hydrogen overvoltage. For this reason, surface finish, inclusions, alloying e lements , and presence or absence of s t r e s s play a part. Therefore, although any iron or steel may be equally suited to fresh or salt water, * some attention to composition is worthwhile when specifications are set up for a steam-return line handling hot carbonic acid or for similar installations.
These are only a few instances showing the r e lation between basic research in corrosion, which began 150 years ago abroad and 50 years ago in this country, to modern industrial development and to a high standard of living. They introduce the next section of this paper because throughout the develop-
*Cast iron corrodes by so-called graphitic corrosion, whereby the iron constituent of the alloy is converted to corrosion products, these acting as a cement for residual graphite flakes. A corroded cast-iron pipe, therefore, may have lost most of its mechanical strength, but is still serviceable for the purpose first intended. In this respect, it may last longer in some applications than steel or iron. It is also reported that a 3% Cr steel, even though its weight loss is parallel with other steels, is less subject to penetration by pitting.
ment of methods for combating corrosion, fundamental research has played an indispensable role. And more important, it is perhaps to fundamental r e sea rch we mus t look almost entirely for major advances in the future. In all fields of technical development, when the obvious trial and er ror methods reach diminishing returns, only systematic and unprejudiced scientific s ea r ch for further truth offers real hope of progress. Advances in corrosion control a re no exception.
SURVEY OF CORROSION MITIGATION
A survey of present means for corrosion mit i gation discloses obvious gaps in the present state of the a r t or science, as the case may be. Until these gaps are reasonably filled, the protection of metals from corrosion will remain incomplete, and the annual waste (5) from this source will continue to be large. The current la rge-sca le application of cathodic protection has offered the most recent evidence that some of the savings and conservation so much needed a re being accomplished.
CATHODIC PROTECTION
Cathodic protection is now applied largely for protecting buried pipe lines t ransport ing oil, gas and water, and, to a lesser extent, for protecting structures exposed to natural waters, such as canal gates and industrial water tanks. By passing a current through the water or soil in the order of 0. 0001 to 0. 1 amp. /sq. ft. of structure surface, the actual value varying with the nature of the environment, minute galvanic currents on the surface of the metal accounting for corrosion are neutralized, whereupon reaction ceases. The impressed current for cathodic protection is supplied from a rectifier or generator, or may be produced by the chemical energy of galvanic anodes such as magnesium. The life of s t ruc tu re s cathodically protected is prolonged almost indefinitely at the modest cost of installation and e l ec t r i c i ty , or of the sacr i f ic ia l meta l used for galvanic anodes, and is potentially useful in many places where metals are used. Cathodic protection for this reason eventually will be applied more wide -ly, and will undoubtedly enter as a factor in prolonging the life of metals used in water and sewage treatment.
Galvanized hot-water tanks are now being protected by magnesium anodes contained in the tank, thereby adding several years to their life. Indust r ia l water tanks are frequently protected using an impressed rectified A-C current and corrosion r e sistant anodes. The Panama Canal gates, covered with a hot bituminous coating, a re protected using an impressed cur ren t of 0. 001 a m p . / s q . ft. and replaceable s tee l anodes (6).
The method is also applicable for protecting the
155
outside of pipes, buried or totally immersed, whatever the corros ive medium in contact. Perhaps it is worth mentioning that when so applied it has no effect on cor ros ion of the inside surface. In order to protect the inside, it would be necessary to i n se r t a conforming anode reaching the entire length of the pipe, which obviously is not easily done. In addition, reaction products at the anode or of the anode itself a re retained within the pipe, and m u s t therefore exe r t no undesirable effects on the water or water solutions carried by the pipe system.
It is present practice to apply an organic coating conjointly with cathodic protection, thereby r e ducing the requ i red c u r r e n t for protection, and better distributing it. Since the coating is insulating, the current flows only to breaks or pinholes in the coating, which are precisely the areas where cor ros ion occurs . One magnesium anode buried in the ground can often protect five miles of a coated buried pipe line, but would be effective in protecting perhaps only 10 to 100 feet of uncoated pipe. Because alkalies are one of the reaction products at the cathode according to the reaction,
the organic coating must be alkali resistant . Cathodic protection is not effective above the
soil or water line, and cannot be applied to alleviate atmospheric or high temperature attack. It can be applied to metals other than iron and steel, with the one precaution that amphoteric metals like aluminum, zinc or lead, which are attacked by alkalies, must not be overprotected by use of high currents , since the accumulated alkali will corrode the metal . With iron or steel, overprotection is not cri t ical , because alkalies act as corrosion inhibitors.
It is not often appreciated that cathodic protection, in addition to being useful for protecting metals against rust or general surface attack, also p r e vents dezincification, pitting, intergranular corrosion, corrosion fatigue (that portion of fatigue a c c e l e r a t e d by corros ion) and s t r e s s corrosion cracking. Stainless s t ee l s , for example, which invariably pit upon exposure to sea water, a re immune when cathodically protected. Likewise, b ra s s which dezincifies or which may season crack (s t ress corrosion crack) when s tressed in certain environments can be protected by this means. The possible applications of cathodic protection in specific instances of this kind are legion and have only begun to be appreciated.
However, the basic science of this approach to corrosion control trails behind practice. Urgently needed today are quantitative data relating corrosive factors of the environment, such as pH, velocity,
dissolved sa l t s , galvanic couples, surface finish and temperature to the minimum required current for total protection. Also needed are fundamentally established c r i te r ia of complete protection more satisfactory than those now in use. Overprotection, with its added costs, or damage in some instances, would then be avoided. It is reasonable to expect improvement in the efficiency (reduction of local corrosion) of sacrificial anodes above the present 50% figure, and the development of more efficient insoluble anodes, having lower oxygen overvoltage, in applications where impressed currents a re applied. These are but a few of the many problems.
METALLIC COATINGS
The metallic coatings used in largest quantity are tin, zinc (galvanized) and nickel coatings on steel. Tin coatings are employed largely for food and other containers (tin cans) for which they are singularly well suited from the standpoint of co r ro sion protection and lack of toxicity. Zinc coatings a r e re la t ive ly effective in avoiding rus t of iron whether exposed to the atmosphere, buried in the soil, or immersed in water. The life of the coating inc reases with coating thickness . The principle of protection is the same as that explained under cathodic protection, the zinc corroding sacrificially and the result ing current protecting iron cathodically. Only in some hot waters above approximately 140° F. does zinc fail to protect iron, a fact only recently established by laboratory experiments (7), and confirmed by service data (8) and further laboratory t e s t s (9)'. This is another illustration of how fundamental work in this field points the way, whereas service tests requiring so long a time before evaluation and involving so many uncontrolled variables during the tes t often fall short of being conclusive.
Nickel coatings are noble to iron in the galvanic ser ies , and must be relatively pore-free in order to protect the base metal from attack. This is ac complished by plating a sufficient thickness of metal , usually in the order of 0. 0005 to 0. 0015 inch. P r e sumably, much better protection will eventually be achieved for the same thickness of metal when commercial plating practice makes it possible to e lec t ro-deposit nickel with fewer numbers of pores. This is a reasonable objective of present-day plating research, and is receiving some attention.
Clad coatings, such as stainless steel or nickel, bonded metallurgically to steel, or pure aluminum bonded to a stronger aluminum alloy, a re free of pores , and offer protection equivalent to the bulk metal constituting the overlay. Some design problems a r e encountered in handling edges of such composite ma te r i a l s where the underlying metal is exposed, but, in general , the problems can be handled satisfactorily. The costs run high com-
156
pared with electrodeposited coatings. Titanium-clad steel may be the ultimate answer
to many applications involving exposure to salt solutions or hot wa te r s , par t icular ly as the price of titanium is lowered. Unlike 18-8 stainless steel, this metal has been resistant to crevice corrosion and to pitting in sea water in all t e s t s conducted so far.
Fur ther developments in metal coatings may eventually provide (a) new types of sacrificial coatings in the form of alloys, (b) reduced porosity of noble-metal coatings, (c) cladding processes less expensive than those now available, and (d) sprayed m e t a l coatings with sat isfactory impermeabil i ty and lower in cost than present coatings of this kind. Sprayed coatings have the inherent advantage that they can be applied to finished s t ruc tures .
ORGANIC COATINGS
Compared with their good performance in atmospheric exposures, the common drying-oil paints have been only fair when applied to metal s t ructures totally immersed in natural waters or buried underground. Their life is short even under ideal conditions. Multiple coatings, baked on, of some synthetic resin paints a re better but expensive, and it is seldom possible to guarantee that al l edges or corners a re coated adequately, or will remain so during service.
Phosphating of surfaces before painting has usually proved beneficial in improving protective qualities of all paints. Heavy bituminous coatings remain the standard for buried pipes, and a re a lso being used on the inside of water mains. Heavy plastic coatings and rubber , bonded to steel , offer good protection to severely corrosive chemical environments where they are used with economic advantage. One of the most chemical ly res i s tan t of modern plastics is the tetrafluoroethylene type, which r e s is ts boiling acids and alkalies, all solvents, and corros ive gases like chlorine. It is so success fully res i s tan t that bonding it to meta l s has p r e sented a major problem. It is a reasonable expectation that materials of this kind will eventually enjoy wide application in many industries. Perhaps their superior resistance will eventually be incorporated into paints having protective qualities marking an improvement over present paints by several orders of magnitude.
Among the inexpensive coatings, portland ce ment continues to offer outstanding protection to iron and steel against hot or cold waters' and to the soil. Water pipes in service for 60 years or more a r e not uncommon. Glass-covered or enameled steel surfaces also offer good protection, but a re easi ly damaged mechanical ly or when subject to thermal shock, making them applicable largely to specific chemical environments, or to atmospheric exposure.
INHIBITORS
Chromates and nitrites continue to be the most efficient of our present-day inhibitors for controlling cor ros ion of iron and steel . They suffer by being toxic, and, hence, are not applicable where potable waters or food a re handled. They also have l imited use at elevated t e m p e r a t u r e s , or where salt concentrations are appreciable. Sodium s i l i cate continues in use for treating potable soft waters , effectively reducing pick up of flocculent rust , as well as reducing dezincification of b r a s s . It has not been outstandingly successful in preventing attack of galvanized domestic hot-water tanks.
G l a s s y metaphosphates a r e being used in a few parts per million to combat corrosion of steel in non-recirculating cold-water sys tems. Recent work in the Corrosion Laboratory at M. I. T. indicates that dissolved oxygen is beneficial to the efficiency of metaphosphates in a degree not previously suspected, although the effect has been known (10). The mechanism of behavior of inhibitors such as these , and a better understanding of their proper application is one of the present projects at M. I. T. supported by the Office of Naval Research.
Orthophosphates are widely used as corrosion inhibitors in boilers, both for minimizing localized attack of tubes and avoiding stress corrosion cracking. Inhibitors such as sodium nitrate and quebracho extract a lso find use in avoiding s t ress corrosion cracking (caustic embrittlement) of boi lers .
Bas ic comparative data on all commercia l ly available inhibitors are needed today relating their efficiency to temperature, pH, dissolved chlorides, sulfates, n i t ra tes , calcium and magnesium, d i s solved oxygen and organic materials. The d is turbing effect of galvanic couples a lso requi res adequate evaluation. There seems to be no doubt that a good, nontoxic, inexpensive inhibitor for potable waters, particularly if it were effective in hot-water systems, is presently needed and would be welcomed by the water industry.
ALTERATION OF ENVIRONMENT
Deaeration of boiler waters probably constitutes the most important example of mitigating corrosion of expensive equipment by altering the environment. Oxygen removal is also finding use to reduce cor rosion of pipes and steel equipment handling cold and hot waters , where the required oxygen content need be only 0. 1 to 0. 3 ppm. , instead of virtually zero as in h igh-pressure boilers. This approach may eventually prove worthwhile for corrosion control of municipal water systems, since it also solves simultaneously the householder's problem with r e spect to piping and hot-water tanks. The normal t e s t s of the water may need to be res to red by an aera tor at cold-water faucets. One problem may
157
possibly a r i se in this connection, par t icular ly in applying vacuum deaeration, through the enhanced opportunity for sulfate-reducing bacteria to accele ra te co r ros ion . These bac te r i a thr ive only in waters of low-oxygen content, and corrode ferrous meta l s many t i m e s more rapidly than normally aerated water. Their control, in some instances, has been accomplished by means such as chlorina-tion.
Deaeration of waters will also reduce cor rosion of copper, brass and lead, but not necessari ly stainless steels or aluminum, the latter depending on dissolved oxygen for their passivity or optimum corrosion resistance to aqueous media.
On this same subject, Groesbeck and Waldron (11) showed that increased dissolved oxygen, although at first stimulating attack, reduces the corrosion rate of iron in distilled water above concentrations of 16 ml. / l i t e r . This resul t has been confirmed by others . The practical value of these data has not yet been assayed in large-scale equipment, but the suggestion occurs that oxygenation of soft waters may be one possible way to reduce corrosivity of such waters in contact with steel. The mechanism proposed for this behavior is one either of building up a more protective ba r r i e r iron-oxide film, or chemisorption of an oxygen film on the iron equivalent to a monolayer or less (12). Reduction of corrosion by oxygenation is not expected for copper or brass , nor for waters containing appreciable d issolved salts, such as chlorides and sulfates, or at high temperatures , because the films responsible for passivity either no longer form on iron, or are less protective.
It was known for many years that some natural fresh waters a re more corrosive than others. The difference eventually resolved itself into the presence or absence of a protective layer on the surface of the metal, usually calcium carbonate. It remained for Langelier in 1936 (13) to analyze this problem quantitatively from the standpoint of physical chemistry, and to propose as a resul t the Langelier or Saturation Index. Waters with positive Index are supersaturated with respect to calcium carbonate; hence, they can deposit a protective film and are nonaggressive from the standpoint of corrosion. On the other hand, waters with negative Index are under saturated and aggressive. This convenient classification of waters has led to a scientific basis for co r ros ion control of water s y s t e m s and has proved useful in many instances. Only where conditions are such that calcium carbonate cannot p r e cipitate as a continuous protective film, as when colloids a r e p re sen t , does the rule break down. Also, occasionally heavy scaling occurs in waters of positive Index at elevated temperatures. Further work along these lines will undoubtedly take care of the special situations.
METALS AND ALLOYS
Galvanized iron remains the standard mater ia l for handling cold and hot waters of positive Saturation Index. In some hot wate rs , galvanized iron may pit more than ungalvanized iron, as mentioned previously. For wafers of negative Index, copper and red b rass for small-s ize pipe offer economic advantages over steel , whether galvanized or not. Monel (70% Ni - 30% Cu) and copper a re useful for hot-water tanks in. soft water a r e a s . Aluminum is satisfactory for distilled water, but is not sa t i s factorily corrosion-resistant to all types of waters , especially when the waters have been previously in contact with iron or copper. Magnesium, likewise, is sensitive to impurities in the water, and, as yet, cannot compete economically with the heavier metals mentioned above. Lead is presently expensive and, although durable, may contaminate soft waters with lead salts sufficient to render the water unsafe for drinking. This fact should be borne in mind when water softeners are installed in some of the older cities, where lead piping is still in use. Stainless steels are not used widely because of expense, and also because they may pit rapidly in some waters containing dissolved chlor ides , especia l ly when ferric and cupric ions are present simultaneously. Titanium holds promise of application in the handling of hot and cold waters, if and when the price approaches that of the stainless s teels .
SUMMARY AND CONCLUSIONS
Corrosion of metals used for waterworks and boiler operations will continue to present problems for a long t ime to come, but the over -a l l losses from this source will decrease as basic resea rch in corrosion gains support, and worker s are a t t r ac ted to the challenges of a field in which any degree of success may amount to millions of dollars saved. A reliable, inexpensive, nontoxic inhibitor is needed to help reduce tuberculation and clogging of water pipes, as well as to protect hot-water tanks. Failing th is , deaera t ion of wa te r s at the source offers some hope and promise. Intentional oxygenation of cold, soft waters, which are the most corrosive type, may also prove useful in special cases . Lime and sodium carbonate addit ions, in accord with Langelier's development, continue to be a useful approach to corrosion control.
Cathodic protection should find many economic applications in controlling corrosion of waterworks equipment, and will probably be applied more generally the next five or ten years . Improvement of corrosion protective paints and organic coatings, both from standpoint of pe r fo rmance and pr ice , should be accomplished in the near future, and will
158
help further reduce the expense and burden of m e t a l de te r io ra t ion . Of m e t a l s ava i lab le to r e s i s t a t t a c k mark ing an i m p r o v e m e n t over those now used , t i
t a n i u m offers the m o s t p r o m i s e . When the p r i c e approaches tha t of the s t a i n l e s s s t e e l s , i t wil l find use as sheet and as a clad coat ing over s t e e l .
BIBLIOGRAPHY
Ref. Ref.
1. Lymes, W., "Some Historical Developments Rela t ing to Corrosion," J. Electrochem. Soc. , 98, 3C (1951).
2. Whitney. W. R. , J. A. C. S . , 25, 395(1903). 3 . Walker , W. H . , Cederho lm, A . , and Bent, L . ,
J . A . C . S . , 29, 1251(1907) , 30, 473(1908). Walker, Trans. Electrochem. S o c , 14, 175(1908).
4. Whitman, W. G . , Russe l l , R . , and Al t ie r i , V . , Ind. Eng. C h e m . , 16, 665 (1924).
Whitman, W. G. , and Russe l l . R . , ibid, 16, 276 (1924).
5. Uhlig, H. H. , Chem. and Eng. News, 27, 2765 (1949).
Uhlig, Corros ion , 6, 29-33 (1950). 6. Miles, John A. , "Cathodic Protection of Lock Gates
of the Panama Cana l , " Office Engineering Division, Panama Canal. P r e s e n t e d at Symposium on Corrosion sponsored by Corrosion Subcommittee of Deterioration Prevention Committee and Office
of Naval Research, Washington, D. C. , February , 1949.
7. Schikorr, G. , Trans . Electrochem. S o c , 76, 247 (1939).
8. Bonilla, C . , ibid, 87, 237(1945). 9. Gilbert , P. T . , Pi t tsburgh Int. Conf. on Surface
Reactions, p. 21 (1948). Hoxeng, R . , and Prut ton, C . , Corrosion, 5, 330
(1949); 6, 308 (1950). 10. Hatch, G. B . , and Rice, O . , Ind. Eng. C h e m . ,
37, 752 (1945). Cohen, M . , T r a n s . Elec t rochem. S o c , 89. 105 (1946).
11. G r o e s b e c k , E . , and Waldron , L . , P r o c . Am. Soc. Testing Mate r ia l s , 31, P a r t II, 279(1931).
12. Uhl ig , H. H . , Metaux et C o r r o s i o n , 22, 204 (1947).
13. Langelier, W. F . , J. Am. Water Works A s s o c . , 28, 1500 (1936).
DISCUSSION
159
E. N. ALQUIST. 1—I would like to ask, P r o fessor Uhlig, regarding the Langelier formula where you lay down this calcium carbonate scale. During the War we tried that with assistance from a number of reserve technical people in two operations: one in California and one in Texas (as the last one), and our experience was not very good with that. I want to inquire if there has been set up somewhere in the basic research picture, work along that line to iron out these difficulties that we encountered and o the r s have encountered; and I would like to know if there is anyone in the audience who has had experience with it that is good and increase my own personal knowledge of the subject.
PROFESSOR UHLIG. —To answer your last question f i rs t , there is ample evidence to prove that waters depositing a calcium carbonate scale (hence of positive Saturation Index) are less corrosive than soft waters (negative Saturation Index). For example , over many y e a r s of observation, Chicago water has been consistently less corrosive to iron or steel than soft Boston water, the essential difference being due to the relative ability of Chicago water to lay down a protect ive layer of calcium carbonate. This difference in corrosivities of waters was made use of in formulating the Saturation Index.
Soft waters are treated with just sufficient lime or soda ash to bring about slight supersaturation of calcium carbonate, thereby assuring deposition of a protective calcium carbonate scale. The method fails to meet expectations only when conditions are such that the calcium carbonate is precipitated in a noncontinuous, nonprotective condition. This occur s , for example, when cer tain colloids are p r e s e n t in the water which se rve as nuclei for growth of calcium carbonate crysta ls in the body of the liquid. Also, protection may be inadequate when cer tain soluble sal ts a re present , the exact nature and critical concentration of which a r e not known so well as we should like. Further studies are needed. But in any case, lime or alkali t r ea t ment, in accord with the Saturation Index development, is a useful means of corrosion mitigation. However, the waters to which it may possibly apply should be examined in more detail than by chemical analyses for calcium, pH and alkalinity alone.
* * *
'Dow Chemical Co., Midland, Michigan.
UNIDENTIFIED. *—I am very much interested in your statement that soft waters might be amenable to treatment by overaeration. Are there any p r a c t ical applications of that? In the next breath you ment ioned that it would not be applicable to hot water, so I suppose that it d i smisses it from use in water sys tems.
PROFESSOR UHLIG. —I have proposed this idea only as an example of bas ic r e s e a r c h that holds promise of being useful practically, and which has not yet been evaluated in large-scale applications. Reduction of the corrosion ra te by oxygenation of waters is useful only in cold-water sys tems, be cause as the temperature is raised, oxygen tends to attack the iron or steel locally, followed by deep pitting. Another way of expressing this is that at high temperatures passivity breaks down, and oxygen transforms from an inhibitor to an accelerator of corrosion. From fundamental considerations, we believe that this method applies to metals where passivity is possible. Oxygenation, for example, would have no practical value where b rass or copper piping is in use, because these metals a r e not passivated by excess oxygen as is iron.
* * *
UNIDENTIFIED. —In your laboratory exper i ments, was the aeration carr ied up to saturation?
PROFESSOR UHLIG. —We oxygenated the water. Oxygen from a commercial tank was bubbled through the water in which the iron specimens were immersed. Oxygen is required rather than air . Ae ra tion will not produce similar passivity, except p e r haps in the presence of metaphosphates. We a re led to believe from present experimental data obtained at M. I. T . , that the metaphosphates permit passivation of iron and steel at lower oxygen concentrations, and that this is one of the reasons why metaphosphates behave as corrosion inhibitors. The mechanism is related to the property of the meta phosphates as complexing agents. They form soluble calcium and magnesium salts and also soluble iron complexes. Ordinarily, when a piece of iron is exposed to water , FeO forms (hydrous FeO) with a layer of Fe 3 O 4 on top, over which a layer of F e 2 O 3 normal ly fo rms . P rac t i ca l ly all of these oxide layers are potentially soluble in presence of meta-
*Following Professor Uhlig's paper, several questions were asked by persons unidentified.
2Def. 1, p. 21, Corrosion Handbook, John Wiley and Sons, Inc., 1948.
160
phosphates, and hence they do not form and are no longer present to reduce the diffusion rate of oxygen to the steel surface. The dissolved oxygen in this situation has greater access to the clean surface of steel than normally, and is therefore able to chemi-sorb as a monolayer on the metal surface. This monolayer produces passivity in the same sense that chromates or s imi la r ma te r i a l s a r e thought to make steel passive. The monolayer is essentially a dipole layer with negative charge outwards and with firm bonding to the metal surface so as to satis -fy surface valences, thereby making the metal less react ive . If the b a r r i e r oxide films a r e present , it requires a much higher partial p ressure of oxygen to achieve the same oxygen concentration at the surface of the steel, because oxygen at low part ial pressures is rapidly consumed in reaction with non-passive iron.
We a r e still in the process of evaluating this m e c h a n i s m of inhibition by metaphosphates and s imi lar complexing agents. Much of what I have said is not yet published, but I think that since the main purpose of th i s conference is to stimulate exchange of ideas , I intentionally injected these ideas and suggestions at this t ime.
* * *
JOHN F. WILKES. 3—Professor Uhlig, would you ca re to e labora te on the protect ive action of ni t r i tes in aqueous solutions?
PROFESSOR UHLIG. —Our feeling is that n i t r i t es , like chromates , have chemical affinity for i ron. The re is no question of th i s , as tables of free energy bear out. However, the reaction of iron with ni t r i tes is attended by a high-activation energy or, in other words, the react ion is slow. Because of the low rate with which chemical compounds form, the ni t r i te ion in the meantime can strongly absorb on the surface of iron as a monolayer or l e s s of n i t r i t e ions. As in the case of chemisorbed oxygen, substances of this kind set up a dipole layer with negative charge outwards and essentially satisfy surface valence forces, so that the metal surface is less react ive . We say, the re fore , that the metal has been passivated by the ni tr i te , as determined by a more noble potential and a very low corrosion rate .
I should mention that there is another school of thought in this matter which ascribes to the nitrite ions the ability to oxidize ferrous oxides to sup--posedly more protective ferric oxides, the thought being that the higher oxide of iron is less pe rmeable. These two points of view have not yet been resolved completely. Some of the basic work now going on at M. I. T. and elsewhere, is being done
3Technical Director, Dearborn Chemical Company, Chicago, Illinois.
in an attempt to support one or the other point of view, and I have no doubt but that we shall soon achieve a better understanding of this subject.
* * *
CHAS. H. SPAULDING. 4—Professor Uhlig, one of the problems in the water sys tems is that there are so many different conditions in the syst e m s , for example , where it is flowing fast and others where it is flowing slow; and then there are places where it is cold, places where it is warm and other places where it is hot, so that the equilibrium is upset, in one place or another. Convent ional ly deaera t ion has a promis ing possibility; I wonder if anyone knows of places that it has been applied, as a means of protecting the cold water sys tems in municipali t ies.
PROFESSOR UHLIG. —Not in municipalities, so far as I know. There are some industrial applications of deaeration for corrosion control both in this country and in Australia. In Australia, cold-water deaeration is used to mitigate corrosion of a s teel main 30 inches in diameter and 350 miles long. By removing 90% of dissolved oxygen in the wa te r , it was es t imated that the life of the pipe would be increased by a factor of 4 t imes .
* * *
CHAS. H. SPAULDING. —I have in mind a couple of cases in which water was taken from a dead end, a line in which there was no flow, and in which the water was full of greenish iron. In other words, it had no oxygen, and this water was from a system which was supplied with saturated water with oxygen.
PROFESSOR UHLIG. —Stagnant water in the dead end of a pipe system may suffer increased corrosion through two factors. One factor relates to differential oxygen concentration which sets up a cell with positive pole or cathode in the well aerated section of the pipe, and the corroded electrode or anode in the poorly aerated section. Galvanic ac tion of this kind usually occurs only when the conductivity of the water is relatively high.
Another factor may enter through the action of sulfate-reducing bacteria . The relatively low-oxygen concentration in the dead end of a pipe line stimulates the growth and reproduction of sulfate-reducing bacteria , which, in turn, accelerate the corrosion of iron. The corrosion products include hydrogen sulfide, iron sulfide and ordinary rust. Once established, these bacteria cause early perforation of the pipe line.
4Consultant, Urbana, Illinois.
161
It is a l so of in te res t that these bacteria may account for the act ive pitting of water pipes be neath tuberc les . A tubercle is essential ly a differential oxygen cell with a rust, calcium carbonate, or similar membrane separating a relatively aerated water outside, from poorly-aerated water inside. This alone can set up corrosion within the tubercle by differential oxygen concentration similar to cor ros ion at the end of the pipe l ine. In addition, sulfate-reducing bacteria may establish themselves inside the tubercle with corresponding high ra tes of corrosion.
* * *
JOHN F. WILKES. —Dr. Uhlig, in one of your earlier slides you showed the effect of pH on cor rosion of steel . The data failed to take the curve down into the range of pH 13-14. . I have encountered some very important problems due to corrosion, particularly in high-pressure boilers. I would like to hear more about the mechanism in that type of corrosion.
PROFESSOR UHLIG. --In the pH range 13-14, the cor ros ion of i ron increases slightly, and the potential changes from a noble value typical of pa s sive iron to an active value typical of nonpassive iron. The reason for this is that at high hydroxide iron activity, FeO no longer forms but instead a soluble sodium complex. This complex may be sodium hypoferrite or ferri te, which being soluble and tying up the ferrous ions in the complex, r e duces f e r r o u s ion activi ty at the meta l surface. This accounts for the active potential and also the slight increase in corrosion rate.
At elevated temperatures, the rate with which alkalies r e a c t with iron, even at lower pH's, is very much higher. For this reason, the pH that can be tolerated in boilers is considerably less than 14. A curve showing the relation of corrosion rate to pH at 310° C. is given on page 525 of the Cor rosion Handbook.
* * *
UNIDENTIFIED. —You mentioned carbon dioxide only to dismiss it early in your speech, and I would like a brief discourse on the part carbon dioxide has in the chemistry of corrosion.
PROFESSOR UHLIG. —The effect of carbon dioxide in the co r ros ion ra te cannot be given in general t e r m s . W. H. Walker and his associates were the first to demonstrate, in 1907, that carbon
dioxide was not e s sen t i a l to the rus t ing of iron. This has been confirmed by later experience, and the early claims shown to be erroneous. The normal amount of carbon dioxide in na tura l soft waters , similarly, is not essential to the corrosion of iron. The corrosion ra te -pH diagram shows that when the pH of a water becomes 4 or less , the corrosion of iron increases above that which applies to waters within the range of pH 4 to 9. When carbonic acid is p resen t , r a the r than hydrochloric used in the exper iments , upon which the pH curve is based, the critical pH at which hydrogen evolution occurs may be as high as 6. Therefore, only when carbon dioxide is present in amounts which depress the pH below 6 is the corrosion rate of iron affected.
In waters of positive Saturation Index, in accord with the Langelier treatment, the effect of carbon dioxide may be more appreciable than in the case of distilled or soft waters mentioned above. Dissolved carbon dioxide, in this case, may determine whether or not a water is under saturated with r e spect to calcium carbonate and is then more aggressive, or whether it is supersaturated and the re fore nonaggressive. A small amount of dissolved carbon dioxide can change a water from a so-called nonaggress ive to an aggres s ive type, and may, therefore , de termine whether a protective scale of calcium carbonate can form.
At high t empe ra tu r e s , another effect enters because the cr i t ical pH for corrosion attended by hydrogen evolution is appreciably higher than for waters at normal tempera tures . In s team return l ines , for example , dissolved carbon dioxide is very corrosive to iron and steel. As I started out to say, therefore, the situation is not simple, but depends very much on the conditions that apply.
* * *
R. C. BARDWELL. 5 —I should like to ask how this threshold treatment, by the addition of a few ppm. of hexametaphosphate, affects the Saturation Index.
PROFESSOR UHLIG. —The Saturation Index no longer applies when hexametaphosphates are present to the extent that calcium and magnesium salts are changed to soluble complexes. The Saturation Index development depends upon the formation of insoluble protective calcium carbonate films on the meta l . Therefore , when these protective films can no longer form, the Langelier treatment does not apply.
-'Engineer of Tests, Chicago and Eastern Illinois Railway, Danville, Illinois.
T H E C O M P O S I T I O N O F W A T E R S U B S T A N C E 1
BY W. H. RODEBUSH*
The ideas p resen ted in this pape r r e p r e s e n t the conclusion of fifteen y e a r s of coopera t ive r e s e a r c h between the I l l inois State Water Survey and the D i v is ion of P h y s i c a l C h e m i s t r y of the U n i v e r s i t y of I l l inois. The de ta i l s of th i s r e s e a r c h have b e e n or w i l l b e publ ished e l s ewhere wi th due acknowledge m e n t s to ind iv idua l s and to a g e n c i e s for f inancia l
2 a s s i s t a n c e . The r e s e a r c h had i t s incept ion in d i s c u s s i o n s
between Dr . A. M. Buswell and the author r e g a r d ing the nature and composition of wa te r with p a r t i c u l a r r e f e r ence to the living o r g a n i s m . Dr. B u sw e l l found c e r t a i n gene ra l l y a c c e p t e d concepts to be so vague as to ac tua l ly const i tu te a b a r r i e r to fu r the r p r o g r e s s in the f ield. As a l w a y s in s i tua t ions of t h i s k ind, f undamen ta l r e s e a r c h i s the only s o l u t ion.
F o r example , water was commonly be l i eved to be an " a s s o c i a t e d " l iquid but no one s e e m e d to be able to define what was mean t by a s s o c i a t e d . One a u t h o r i t y , for e x a m p l e , s t a t e d t h a t l iquid w a t e r was " d i h y d r o l " and ice " t r i h y d r o l . " Another i l l -defined concep t was t ha t o f " b o u n d " w a t e r . T h i s t e r m was p e r h a p s neve r in good r e p u t e and we now know t h a t i t i s m i s l e a d i n g — f r e e w a t e r would be more exact. But the phenomena in living o r g a n i s m s tha t a r e i m p l i e d by the t e r m a r e o f g r e a t i m p o r t a n c e . F o r e x a m p l e , the e c o n o m i c i m p o r t a n c e o f the frost r e s i s t a n c e of wheat and c o r n a r e obv ious . P r o f e s s o r G o r t n e r a t t he U n i v e r s i t y of Minneso ta had shown that, of two samples of wheat showing the s a m e p e r c e n t a g e of wa te r by the o r d i n a r y m e t h o d s of a n a l y s i s and the s a m e o s m o t i c coeff icient , one wou ld w i n t e r k i l l a n d the o t h e r wou ld not . I t i s c lear tha t the pr inc ip le involved h e r e i s some th ing o ther t han the one by which a u t o m o b i l e r a d i a t o r s a r e p r o t e c t e d b y a n t i - f r e e z e .
The fact tha t the a s soc ia t ion of water is due to h y d r o g e n bonding had been a n n o u n c e d by L a t i m e r and Rodebush 3 in 1920 but no d i r e c t e x p e r i m e n t a l ev idence for t h i s had been p r o d u c e d until the d i s -
*Professor of Physical Chemis t ry , University of Illinois, Urbana, Illinois.
1The title is suggested by the excellent monograph entitled, "The Properties of Ordinary Water Substance," by N. E. Dorsey, Reinhold Publishing Co. , New York, 1940.
2Acknowledgement for financial support is due to the Rockefeller Foundation, to the United States Public Health Serv ice , contract no. 666 and to the Office of Naval R e s e a r c h , contract no. N6 ORI-71.
3W. M. Latimer and W. H. Rodebush, J. Am. Chem. Soc. , 42, 1419 (1920).
c o v e r i n g in 1934 by Wulf and h i s c o l l a b o r a t o r s4 t ha t the s e c o n d h a r m o n i c i n the i n f r a r e d a b s o r p t ion of the hydroxyl group in c e r t a i n m o l e c u l e s b e came very diffuse when these groups formed h y d r o gen bonds . I t was obvious tha t i n f r a r e d s p e c t r o s copy was a v e r y p r o m i s i n g m e t h o d of a p p r o a c h to the q u a n t i t a t i v e s t u d y of h y d r o g e n bond ing . An in f ra red a p p a r a t u s was buil t in th i s l a b o r a t o r y and an impor tan t d i s c o v e r y was m a d e . In addi t ion to c o n f i r m i n g t h e effect o b s e r v e d by Wulf e t a l . , i t was found that the fundamental absorption of hydroxyl was shifted to longer wave leng ths and the e x t i n c tion coefficient g rea t ly augmented when a hyd rogen bond i s f o r m e d . Th i s d i s c o v e r y w a s m a d e i n d e -pendently by E r r e r a . 6 This effect is p ropo r t i ona t e to the ac id i ty of the hydrogen as w a s announced by V e n k a t e s w a r a n . 7
The infrared spec t romete r immedia te ly b e c a m e a t oo l of the g r e a t e s t u t i l i t y , p a r t i c u l a r l y to the o r g a n i c c h e m i s t . Some fif teen p a p e r s w e r e pub l i shed f rom t h i s l a b o r a t o r y dea l ing with s t r u c t u r e as a resul t of infrared studies. One of the i m p o r t a n t resu l t s establ ished was that the c h a r a c t e r i s t i c c r o s s l inkage in p r o t e i n s b e t w e e n pep t i de c h a i n s i s the NH→O l i n k a g e . 8
The attempt to determine the degree of a s s o c i a t ion of wa te r by the use of i n f r a r e d w a s , howeve r , d o o m e d to f a i l u r e . W a t e r i s so opaque t o i n f r a r ed even in the th innes t l a y e r s tha t no quan t i t a t ive measuremen t s could be made . The h igher h a r m o n ics of the hydrogen bond absorpt ion ce r ta in ly extend into the vis ible reg ion , giving an a b s o r p t i o n in the r e d or orange and producing the b l u i s h - g r e e n co lo r of water in th ick l a y e r s . The d e t e r m i n a t i o n of the degree of a s soc ia t ion of liquid wa te r m u s t be m a d e b y m o r e i n d i r e c t m e t h o d s , and the b e s t a p p r o a c h can be m a d e by a c o m p a r i s o n of the s t r u c t u r e s of ice and w a t e r .
Ice-Water S t ruc tu re . The l ayman has no difficulty in distinguishing ice f rom wa te r , and i t c o m e s a s a s u r p r i s e t o r e a l i z e t h a t the only p r o p e r t i e s which a r e essen t ia l ly different for t h e s e two p h a s e s
4G. E. Hilbert, O. R. Wulf, J. B. Hendricks and U. Liddell, J. Am. Chem. S o c , 58, 548(1936).
5A. M. Buswell , V. Dietz and W. H. Rodebush, J. Chem. P h y s . , 5, 84(1937) .
6J. E r r e r a and P. Mollet, Comptes Rendus Acad. Sci . , 204, 259 (1937).
7C. S. Venkate swaran, Proc . Indian Academy, 7, 13 (1938).
8A. M. Buswell, J. R. Downing and W. H. Rodebush, loc. cit.
163
164
are density and viscosity and other properties depending upon these proper t ies . The infrared absorption, the dielectric constant, and the structure itself changes continuously through the melting point so that the melting point might almost appear as a second order transition. Even the energy difference between ice and water is so small that it seems to be an accident as to which is the stable phase at lower t empera tu res .
Water is one of the few substances for which the liquid phase is more dense than the solid, and it is probably the only substance that exhibits a t empe ra tu r e of maximum densi ty a few degrees above the melting point. It is interesting to consider the reason for this behavior. Ice is a hexagonal c rys ta l . The water molecules have a coordination number of four, each water molecule being hydrogen bonded to four other water molecules in t e t r ahedra l a r rangement . The distance between oxygen a toms is 2. 76 A. The structure of ice is very open, hence the low density. There are two hydrogen bonds per molecule , and if we lump all the at t ract ion forces between molecules into one package and call it the hydrogen bond, then the energy per bond is about 6000 calories per mole. When ice m e l t s to wa te r , the dis tance between oxygens inc reases to about 2. 90 A.9 This would cause an i n c r e a s e in volume and corresponding dec rease in density of about 15%. It would also decrease the energy of the hydrogen bonds by 25% or more , and we should expect a heat of fusion of 3000-4000 calories. The heat of fusion is only 1440 calories per mole, and this is explained by the fact that additional hydrogen bonds a r e formed. The very open structure that is formed permits an increase in coordination number to a maximum of five or six, which, of course, accounts for the increase in density. The additional water molecules a re hydrogen bonded. One pair of electrons bonds two hydrogens through a resonance mechanism such as Pauling has postulated for the meta ls . This r e s o nance mechanism is greatly favored by an increase in ionic c h a r a c t e r of the O-H bond in the water molecules. Thus water has more hydrogen bonds than ice, even at the boiling point.
The heat capacity of liquid water is more than twice that of ice . The behavior of water in this respect is certainly different from that of any other liquid, and it has commonly been stated that the high value is due to the breaking of hydrogen bonds. A simple calculation shows that this explanation is untenable. The fact that the heat capacity is constant over the whole range from the melting point to the boiling point, within a few per cent, can be given a s imple explanation. F o r an ionic compound we have equipartition so that the hydrogens
9T. J. Morgan and B. E. Warren, J. Chem. Phys., 6, 666 (1938).
and the oxygen give the Dulong Pet i t value just as sodium and chlorine in sodium chloride.
The open structure of ice resembles a bridge a rch under heavy s t r e s s . The internal p ressure of liquid water due to the attraction forces between molecules would amount to a couple of thousand a tmospheres if the liquid had the density of ice. Under the t h e r m a l agitation of these molecules, the ice structure collapses at 0° C. It is well known that the melting point is lowered by pressure , and we may assume that if the internal p ressure were removed from the liquid, ice would not melt unless heated to 15 degrees or more centigrade above the melting point. We shall want to keep this fact in mind a little la ter in this paper.
Although the heat of vaporization of water is much greater than benzene, the heat and entropy of fusion a r e only a little more than half that of benzene. This is because water has a s t ructure , more structure, in fact, than any other true liquid. If water could be supercooled, it would form a glass , but the hydrogen atoms are so mobile that the supercooling cannot be carried beyond a few degrees.
The structures postulated by Pauling to give a residual value of entropy to ice at low temperatures have nothing to do with a glass-like structure. They a re variations in the definite crystalline a r rangement of the hydrogens, which at low temperatures would be frozen into one configuration. At higher temperatures enough hydrogen would be dissociated to insure a "flexible" structure for ice.
The Physical Properties of Water. The physical propert ies of water such as viscosity and di electric constant a re most readily understood when the properties of the liquid are contrasted with those of ice. These proper t ies involve what a r e known as cooperative phenomena, that i s , the displacement or orientation of a se r ies of hydrogen atoms which are attached by a covalent bond to the oxygen of one molecule and hydrogen bonded to the oxygen of another molecule. If this displacement or t r ans fer of bonds can take place one at a time—by what may be descr ibed as "zipper" action, the forces required are small but the action is slow. If a rapid displacement and transfer of a se r ies of hydrogen bonds is to occur, then very great s t resses must be applied so that a simultaneous breaking of bonds is possible. The significance of the foregoing consideration becomes apparent on a detailed consideration of the mechanism of viscosity and dielectric polarization.
Viscosity. The viscosity of liquid water is not greatly different in magnitude or temperature coefficient from tha t of other l iquids . The same mechanism is involved; the molecules must slip past one another—"jump over one another" is a more graphic expression. This involves a heat of
165
activation which may vary all the way from zero to a few thousand calories. Because of the s t ruc ture of water, the process is more uniform and the heat of activation va r ies within nar rower l imits . The temperature coefficient of the viscosity of water is about 2% per degree negative, which indicates an activation energy of 3600 calories per mole per hydrogen bond. This is l e ss than the energy of dissociation of a hydrogen bond because of the l a rge ly ionic character of the bond. A hydrogen may be attracted to two oxygens at once or even th ree . It should be recalled that with a coordination number of 6 in the liquid, each hydrogen must be surrounded by three oxygens. The transfer of the proton from molecule to molecule is facilitated and the energy hump to be t raversed is greatly reduced.
In the case of ice, no such transition is pos sible. The hydrogen bond must be completely d i s sociated before any motion can occur since the hydrogen has nowhere to go—hence the greatly higher viscosity of ice. While enormous p r e s su re s a re required to crush the ice s t ructure and lower the mel t ing point, ice will flow quite readily under shearing s t resses . This is because the s t r e s s is applied to a relatively few hydrogen bonds along the glide surface and the mass breakage of these bonds becomes possible since only a few bonds are strained at any instant.
The displacement of the hydrogen bond from one oxygen to another may be represented as the su r mounting of a potential energy b a r r i e r approximately equivalent to 3600 calories activation energy. The fraction of hydrogen bonds having sufficient energy to t ransverse this b a r r i e r is given by the
Boltzmann factor Since the frequency factor for th is t rans i t ion is about 101 3 , we have therefore a probability that the hydrogen bond will transfer 10 t imes per second. The movement of a water molecule involves the t ransfer of two hydrogen bonds, but the process is a very rapid one. It is , however, as rapid in one direction as the other. This is in the absence of a flow. When a pressure gradient is applied, a bias is introduced into the two energy levels on either side of the b a r r i e r , tending to r a i s e the one and depress the other. The resul t is that the ra te of t rans fe r is g rea te r in the one direct ion than the other and there is a flow, which will be shown later in the analogous case of the electr ical field to be proportional to the p r e s su re gradient.
There is a finite limit to the number of t r a n s fers occurring per unit time, and when the p ressu re is increased the height of the ba r r i e r is increased because of the closer approach of the atoms so that the flow no longer increases linearly with the p r e s sure gradient. Further increase in the s t ress r e sults in turbulent flow. The situation becomes
analogous at least to the flow of ice under shearing s t r e s s , where bonds are actually ruptured by the applied force. As the forces are increased further, there is reduction in apparent viscosity because of the rupture of bonds so that the flow is no longer newtonian once the cri t ical velocity of flow is exceeded.
This sharp distinction between laminar flow and turbulent flow may be described in te rms of the t ransfer of hydrogen bonds. As long as the d i s sociat ion is s imply a t r ans fe r corresponding to the normal rate as given by the kinetic theory and the process may be described as adiabatic, there is very little heat evolved. When the process be comes violent, we have rupture of bonds rather than t ransfer , the water behaves as a rigid substance, a great deal of heat is produced, and a charac te r istic turbulence results. It would be very informative to measure the rates of flow of ice and water under conditions of carefully controlled s t r e s s .
Dielectric Polarization. The Debye theory of rotating molecules cannot be cor rec t for a polar liquid, as has been shown by Onsager, and it does not give the correct temperature coefficient. We are dealing with a cooperative process in which a group of molecules is oriented. Since ice has, near the melting point, a dielectric constant s imilar to that of water, we can assume that the polarization of ice is similar to that of water. There is no difficulty in the progressive orientation of water mole -cules. The process is similar to the laminar flow described above. In the case of ice, the situation is very different. A few of the hydrogen bonds a r e , of course, dissociated, the fraction being given by
the Boltzmann factor e The polar izat ion of ice must occur by a progress ive orientation starting from these dissociated bonds as centers . This seriat im process is necessar i ly slow. The lower the temperature , the slower the process, so that at -20° C. the maximum, in phase current is obtained with a frequency of only 1000 cycles per second. At still lower t empera tu res , the polarization process does not occur at all , so that the dielectric constant falls to a low value. It will be seen that simultaneous studies of dielectric constant and viscosity would prove informative.
Water as a Solvent. When we consider the propert ies of water as a solvent, the paral lel be tween ice and water no longer holds. This is be cause the rigid lattice of ice, as we shall see la ter , allows no cavity large enough to hold even the smal l est molecu les . Water is conspicuously and par excellence a solvent for e lectrolytes . For more than sixty yea r s , since Arrhenius announced his theory of electrolyte dissociation, physical chemists
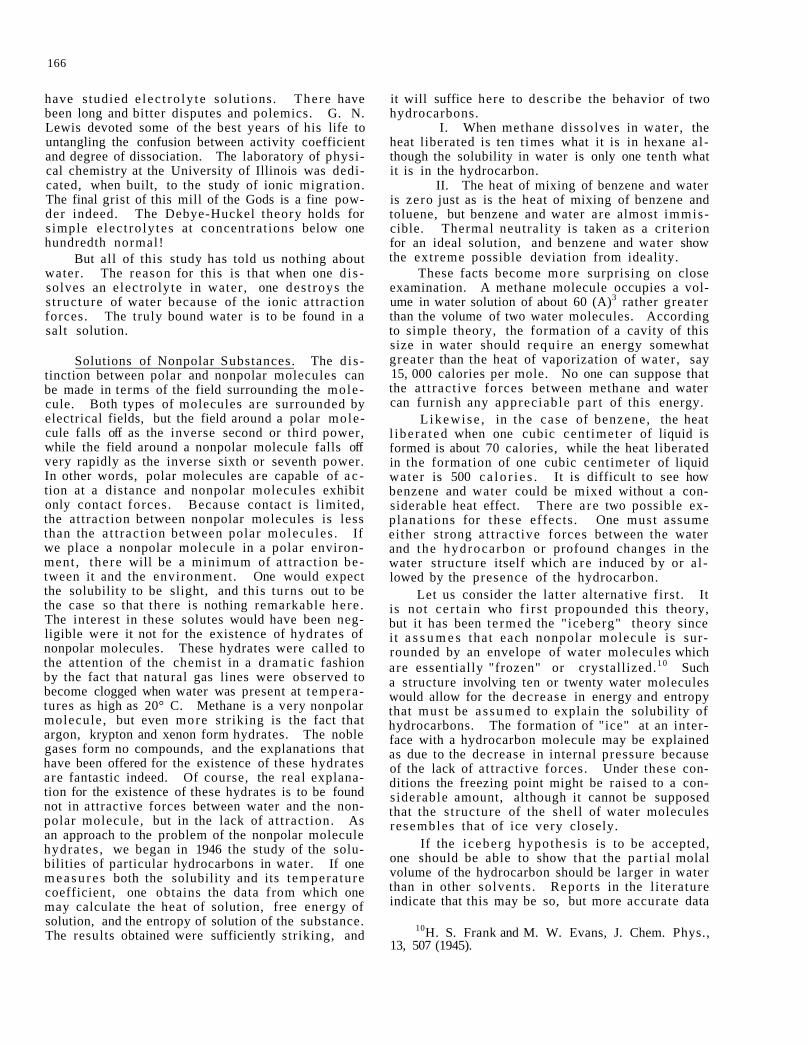
166
have studied e lec t ro ly te solutions. There have been long and bitter disputes and polemics. G. N. Lewis devoted some of the best years of his life to untangling the confusion between activity coefficient and degree of dissociation. The laboratory of physical chemistry at the University of Illinois was dedicated, when built, to the study of ionic migration. The final grist of this mill of the Gods is a fine powder indeed. The Debye-Huckel theory holds for s imple e lec t ro ly tes at concentrat ions below one hundredth normal!
But all of this study has told us nothing about water. The reason for this is that when one d is solves an e lectrolyte in water , one des t roys the s t ructure of water because of the ionic at traction forces. The truly bound water is to be found in a salt solution.
Solutions of Nonpolar Substances. The d is tinction between polar and nonpolar molecules can be made in terms of the field surrounding the molecule. Both types of molecules are surrounded by electrical fields, but the field around a polar molecule falls off as the inverse second or third power, while the field around a nonpolar molecule falls off very rapidly as the inverse sixth or seventh power. In other words, polar molecules are capable of a c tion at a distance and nonpolar molecules exhibit only contact forces . Because contact is limited, the attraction between nonpolar molecules is less than the a t t rac t ion between polar molecules . If we place a nonpolar molecule in a polar environment , there will be a minimum of a t t ract ion between it and the environment. One would expect the solubility to be slight, and this turns out to be the case so that there is nothing remarkable here . The interest in these solutes would have been negligible were it not for the existence of hydrates of nonpolar molecules. These hydrates were called to the attention of the chemist in a dramatic fashion by the fact that natural gas lines were observed to become clogged when water was present at t emperatures as high as 20° C. Methane is a very nonpolar molecule , but even more striking is the fact that argon, krypton and xenon form hydrates. The noble gases form no compounds, and the explanations that have been offered for the existence of these hydrates are fantastic indeed. Of course, the real explanation for the existence of these hydrates is to be found not in attractive forces between water and the non-polar molecule, but in the lack of at t ract ion. As an approach to the problem of the nonpolar molecule hydrates , we began in 1946 the study of the solubilities of particular hydrocarbons in water. If one m e a s u r e s both the solubility and its tempera ture coefficient, one obtains the data from which one may calculate the heat of solution, free energy of solution, and the entropy of solution of the substance. The results obtained were sufficiently striking, and
it will suffice here to describe the behavior of two hydrocarbons.
I. When methane dissolves in water , the heat liberated is ten t imes what it is in hexane a l though the solubility in water is only one tenth what it is in the hydrocarbon.
II. The heat of mixing of benzene and water is zero just as is the heat of mixing of benzene and toluene, but benzene and water are almost immiscible. Thermal neutrali ty is taken as a cri terion for an ideal solution, and benzene and water show the extreme possible deviation from ideality.
These facts become more surprising on close examination. A methane molecule occupies a volume in water solution of about 60 (A)3 rather greater than the volume of two water molecules. According to simple theory, the formation of a cavity of this size in water should require an energy somewhat greater than the heat of vaporization of water, say 15, 000 calories per mole. No one can suppose that the a t t rac t ive forces between methane and water can furnish any appreciable par t of this energy.
L ikewise , in the case of benzene, the heat l ibera ted when one cubic cent imeter of liquid is formed is about 70 calories, while the heat liberated in the formation of one cubic centimeter of liquid water is 500 c a l o r i e s . It is difficult to see how benzene and water could be mixed without a considerable heat effect. There a re two possible explanat ions for these effects . One must assume either strong at t ract ive forces between the water and the hydrocarbon or profound changes in the water structure itself which a re induced by or a l lowed by the presence of the hydrocarbon.
Let us consider the latter alternative first . It is not cer ta in who f i r s t propounded this theory, but it has been te rmed the "iceberg" theory since i t a s s u m e s that each nonpolar molecule is surrounded by an envelope of water molecules which are essentially "frozen" or crystallized.1 0 Such a structure involving ten or twenty water molecules would allow for the decrease in energy and entropy that mus t be a s sumed to explain the solubility of hydrocarbons. The formation of "ice" at an interface with a hydrocarbon molecule may be explained as due to the decrease in internal pressure because of the lack of attractive forces. Under these conditions the freezing point might be raised to a considerable amount, although it cannot be supposed that the s t ructure of the shell of water molecules resembles that of ice very closely.
If the i ceberg hypothes is is to be accepted, one should be able to show that the par t ia l molal volume of the hydrocarbon should be larger in water than in other solvents . Repor ts in the l i terature indicate that this may be so, but more accurate data
10H. S. Frank and M. W. Evans, J. Chem. Phys., 13, 507 (1945).
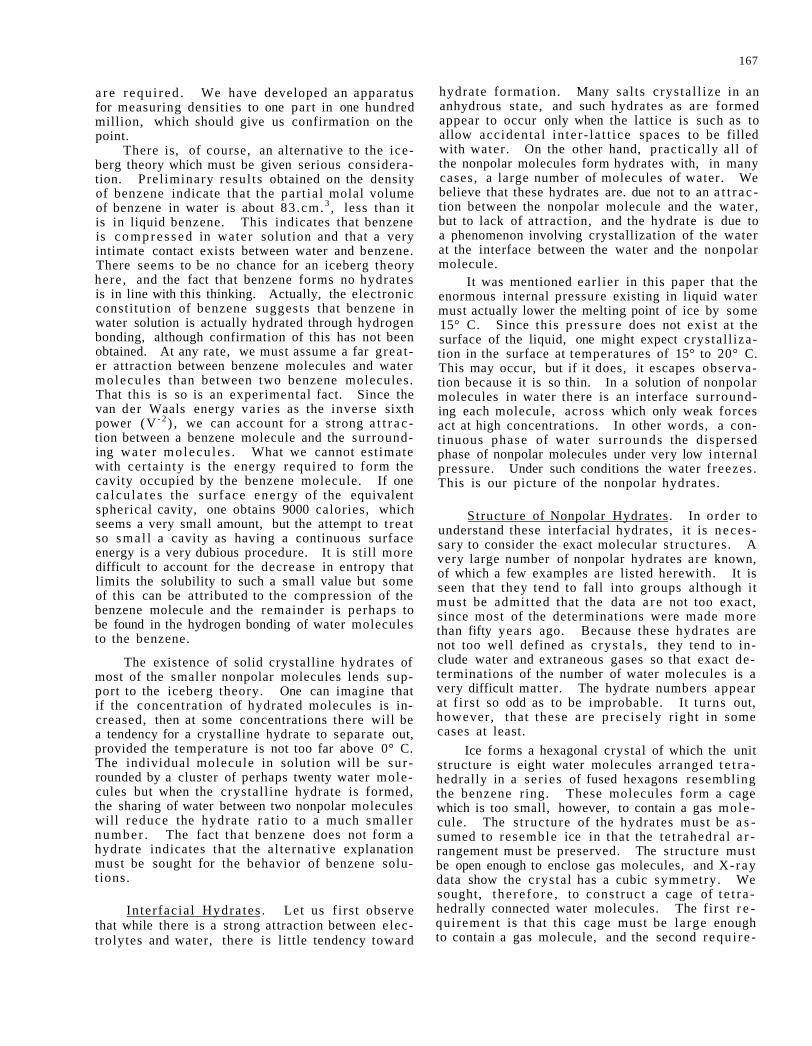
167
a r e r equ i r ed . We have developed an apparatus for measuring densities to one part in one hundred million, which should give us confirmation on the point.
There is, of course, an alternative to the iceberg theory which must be given serious consideration. Prel iminary resul ts obtained on the density of benzene indicate that the par t ia l molal volume of benzene in water is about 83 .cm. 3 , less than it is in liquid benzene. This indicates that benzene is c o m p r e s s e d in water solution and that a very intimate contact exists between water and benzene. There seems to be no chance for an iceberg theory here, and the fact that benzene forms no hydrates is in line with this thinking. Actually, the electronic constitution of benzene suggests that benzene in water solution is actually hydrated through hydrogen bonding, although confirmation of this has not been obtained. At any rate, we must assume a far grea t er attraction between benzene molecules and water molecu les than between two benzene molecules. That this is so is an experimental fact. Since the van der Waals energy var ies as the inverse sixth power (V - 2 ) , we can account for a strong a t t r a c tion between a benzene molecule and the surrounding wa te r mo lecu l e s . What we cannot estimate with certainty is the energy required to form the cavity occupied by the benzene molecule. If one ca l cu l a t e s the sur face energy of the equivalent spherical cavity, one obtains 9000 calories, which seems a very small amount, but the attempt to t reat so sma l l a cavity as having a continuous surface energy is a very dubious procedure. It is still more difficult to account for the decrease in entropy that limits the solubility to such a small value but some of this can be attributed to the compression of the benzene molecule and the remainder is perhaps to be found in the hydrogen bonding of water molecules to the benzene.
The existence of solid crystalline hydrates of most of the smaller nonpolar molecules lends support to the iceberg theory. One can imagine that if the concentration of hydrated molecules is increased, then at some concentrations there will be a tendency for a crystalline hydrate to separate out, provided the temperature is not too far above 0° C. The individual molecule in solution will be sur rounded by a cluster of perhaps twenty water molecules but when the crystal l ine hydrate is formed, the sharing of water between two nonpolar molecules will reduce the hydrate ra t io to a much smaller number . The fact that benzene does not form a hydrate indicates that the al ternative explanation must be sought for the behavior of benzene solutions.
In terfacia l Hydra tes . Let us f irs t observe that while there is a strong attraction between electrolytes and water, there is little tendency toward
hydrate formation. Many sal ts crysta l l ize in an anhydrous state, and such hydrates as are formed appear to occur only when the lattice is such as to allow accidenta l in te r - la t t ice spaces to be filled with water . On the other hand, practically all of the nonpolar molecules form hydrates with, in many cases, a large number of molecules of water. We believe that these hydrates are. due not to an a t t r a c tion between the nonpolar molecule and the water , but to lack of attraction, and the hydrate is due to a phenomenon involving crystallization of the water at the interface between the water and the nonpolar molecule.
It was mentioned earl ier in this paper that the enormous internal pressure existing in liquid water must actually lower the melting point of ice by some 15° C. Since this p r e s s u r e does not exist at the surface of the liquid, one might expect crystal l ization in the surface at temperatures of 15° to 20° C. This may occur, but if it does, it escapes observation because it is so thin. In a solution of nonpolar molecules in water there is an interface surrounding each molecule, across which only weak forces act at high concentrations. In other words, a continuous phase of water sur rounds the d ispersed phase of nonpolar molecules under very low internal pressure. Under such conditions the water f reezes . This is our picture of the nonpolar hydrates.
Structure of Nonpolar Hydrates. In order to understand these interfacial hydrates, it is neces sary to consider the exact molecular s t ructures . A very large number of nonpolar hydrates are known, of which a few examples a re listed herewith. It is seen that they tend to fall into groups although it must be admit ted that the data a r e not too exact, since most of the determinations were made more than fifty years ago. Because these hydrates a re not too well defined as c rys t a l s , they tend to include water and extraneous gases so that exact determinations of the number of water molecules is a very difficult matter. The hydrate numbers appear at f i rs t so odd as to be improbable. It turns out, however, that these a re prec i se ly right in some cases at least.
Ice forms a hexagonal crystal of which the unit structure is eight water molecules arranged t e t r a -hedrally in a ser ies of fused hexagons resembling the benzene ring. These molecules form a cage which is too small, however, to contain a gas molecule. The s t ructure of the hydrates must be a s sumed to resemble ice in that the te t rahedra l a r rangement must be preserved. The structure must be open enough to enclose gas molecules, and X-ray data show the crystal has a cubic symmetry. We sought, t he re fo re , to construct a cage of t e t r a -hedrally connected water molecules. The first r e quirement is that this cage must be large enough to contain a gas molecule, and the second requ i re -
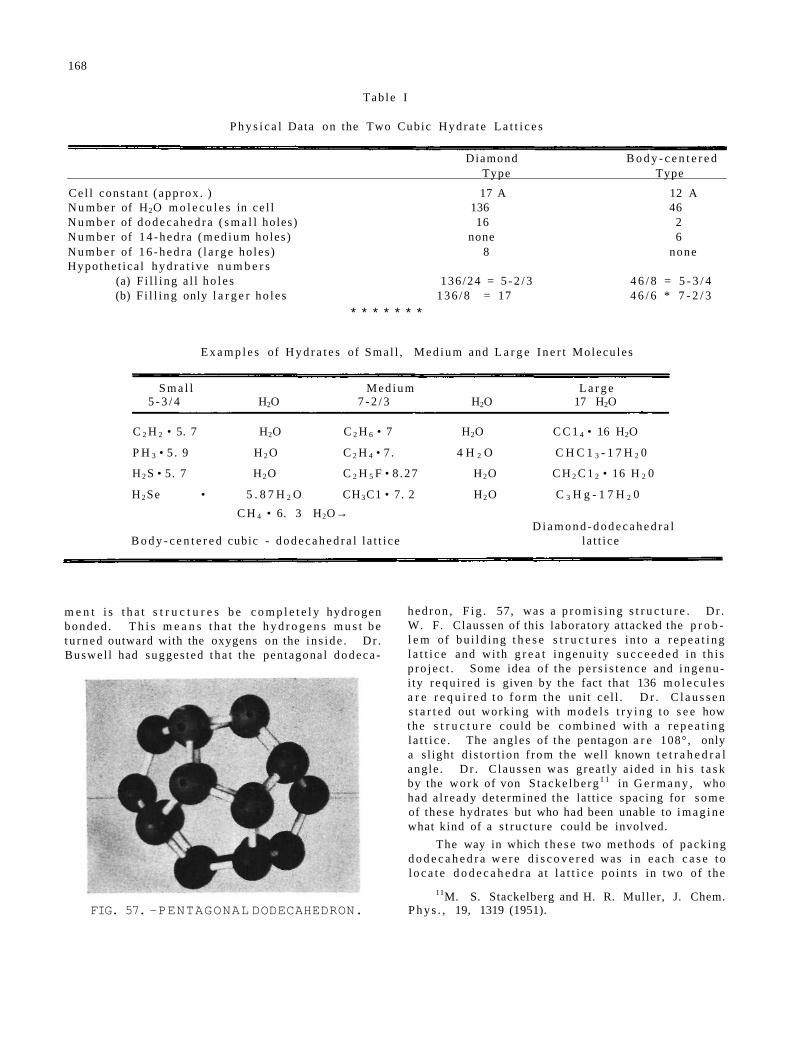
168
Tab le I
P h y s i c a l Data on the Two Cubic H y d r a t e L a t t i c e s
Diamond B o d y - c e n t e r e d Type Type
Ce l l cons tan t ( approx . ) 17 A 12 A N u m b e r of H2O m o l e c u l e s in ce l l 136 46 N u m b e r of d o d e c a h e d r a ( s m a l l holes) 16 2 N u m b e r of 1 4 - h e d r a ( m e d i u m holes) none 6 N u m b e r of 1 6 - h e d r a ( l a r g e ho les ) 8 none Hypothe t ica l h y d r a t i v e n u m b e r s
(a) F i l l i ng a l l h o l e s 136 /24 = 5 - 2 / 3 4 6 / 8 = 5 - 3 / 4 (b) F i l l i ng only l a r g e r ho l e s 1 3 6 / 8 = 17 4 6 / 6 * 7 - 2 / 3
* * * * * * *
E x a m p l e s of H y d r a t e s of Smal l , M e d i u m and L a r g e I n e r t Molecu les
S m a l l M e d i u m L a r g e 5 - 3 / 4 H2O 7 - 2 / 3 H2O 17 H2O
C 2 H 2 • 5. 7 H2O C 2 H 6 • 7 H2O C C 1 4 • 16 H2O
P H 3 • 5 . 9 H 2 O C 2 H 4 • 7 . 4 H 2 O C H C 1 3 - 1 7 H 2 0
H 2 S • 5. 7 H2O C 2 H 5 F • 8 .27 H2O C H 2 C 1 2 • 16 H 2 0
H 2 Se • 5 . 8 7 H 2 O CH3C1 • 7. 2 H2O C 3 H g - 1 7 H 2 0 C H 4 • 6. 3 H2O→
D i a m o n d - d o d e c a h e d r a l B o d y - c e n t e r e d cubic - d o d e c a h e d r a l l a t t i ce l a t t i ce
m e n t i s t h a t s t r u c t u r e s b e c o m p l e t e l y hydrogen bonded . T h i s m e a n s t h a t the h y d r o g e n s m u s t b e t u r n e d outward with the oxygens on the i n s i d e . Dr . Buswel l had sugges ted t ha t the pentagonal d o d e c a -
FIG. 57. —PENTAGONAL DODECAHEDRON.
hed ron , F i g . 57, was a p r o m i s i n g s t r u c t u r e . Dr . W. F. Claussen of this laboratory at tacked the p r o b l e m of bu i ld ing t h e s e s t r u c t u r e s in to a r e p e a t i n g l a t t i c e and wi th g r e a t ingenui ty s u c c e e d e d in t h i s p ro j ec t . Some idea of the p e r s i s t e n c e and ingenui ty r e q u i r e d is given by the fact that 136 m o l e c u l e s a r e r e q u i r e d t o f o r m the uni t ce l l . D r . C l a u s s e n s t a r t e d out working with m o d e l s t r y i n g to s e e how the s t r u c t u r e could be combined with a r e p e a t i n g l a t t i ce . The ang les of the pentagon a r e 108°, only a s l ight d i s to r t ion f rom the well known t e t r a h e d r a l angle . Dr . C laussen was grea t ly a ided in h i s t a s k by the w o r k of von S tacke lbe rg 1 1 in G e r m a n y , who had a l r eady determined the lat t ice spacing for s o m e of these hydrates but who had been unable to i m a g i n e what kind of a s t ruc tu re could be involved.
The way in which t h e s e two methods of pack ing d o d e c a h e d r a w e r e d i s c o v e r e d was i n each c a s e t o l o c a t e d o d e c a h e d r a a t l a t t i c e po in t s in two of the
11M. S. Stackelberg and H. R. Muller, J. Chem. P h y s . , 19, 1319 (1951).
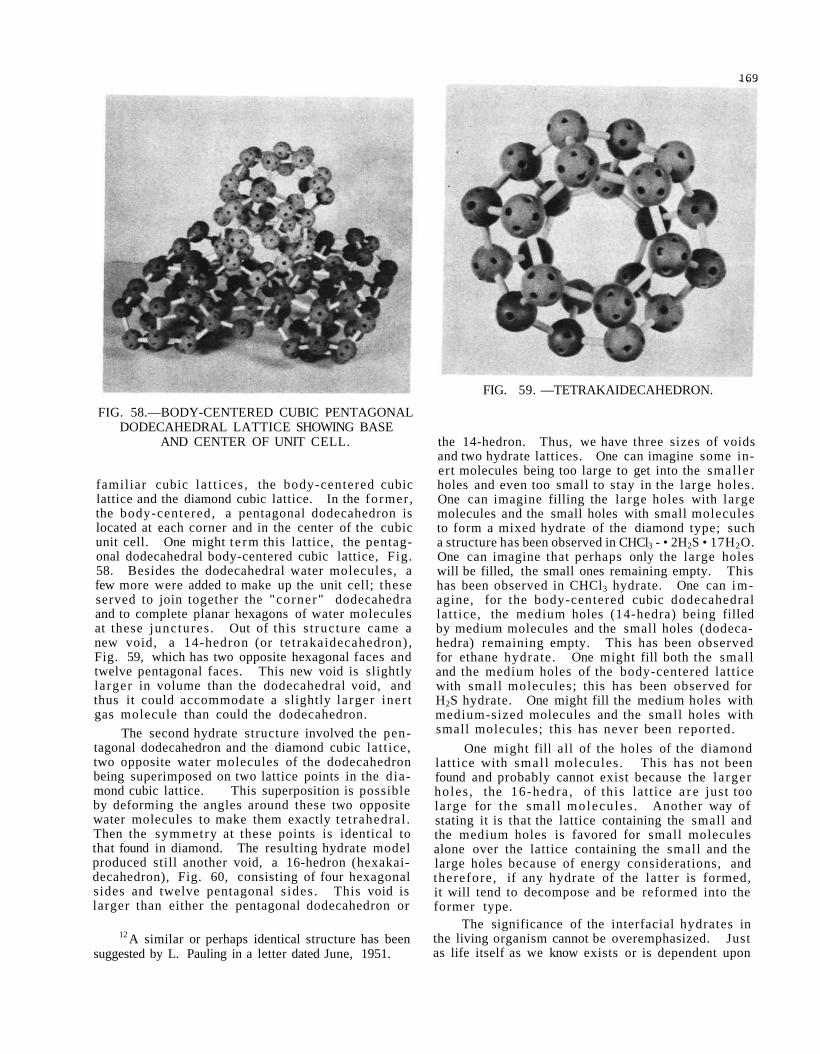
169
FIG. 58.—BODY-CENTERED CUBIC PENTAGONAL DODECAHEDRAL LATTICE SHOWING BASE
AND CENTER OF UNIT CELL.
familiar cubic la t t ices , the body-centered cubic lattice and the diamond cubic lattice. In the former , the body-centered, a pentagonal dodecahedron is located at each corner and in the center of the cubic unit cell. One might t e rm this lattice, the pentagonal dodecahedral body-centered cubic lattice, Fig. 58. Besides the dodecahedral water molecules, a few more were added to make up the unit cell; these served to join together the "corner" dodecahedra and to complete planar hexagons of water molecules at these junctures . Out of this s t ructure came a new void, a 14-hedron (or tetrakaidecahedron), Fig. 59, which has two opposite hexagonal faces and twelve pentagonal faces. This new void is slightly larger in volume than the dodecahedral void, and thus it could accommodate a slightly larger iner t gas molecule than could the dodecahedron.
The second hydrate structure involved the pentagonal dodecahedron and the diamond cubic latt ice, two opposite water molecules of the dodecahedron being superimposed on two lattice points in the diamond cubic lattice. This superposition is possible by deforming the angles around these two opposite water molecules to make them exactly te t rahedral . Then the symmetry at these points is identical to that found in diamond. The resulting hydrate model produced still another void, a 16-hedron (hexakai-decahedron), Fig. 60, consisting of four hexagonal sides and twelve pentagonal s ides . This void is larger than either the pentagonal dodecahedron or
A similar or perhaps identical structure has been suggested by L. Pauling in a letter dated June, 1951.
FIG. 59. —TETRAKAIDECAHEDRON.
the 14-hedron. Thus, we have three sizes of voids and two hydrate lattices. One can imagine some inert molecules being too large to get into the smal ler holes and even too small to stay in the large holes. One can imagine filling the large holes with large molecules and the small holes with small molecules to form a mixed hydrate of the diamond type; such a structure has been observed in CHCl3 - • 2H2S • 17H2O. One can imagine that perhaps only the large holes will be filled, the small ones remaining empty. This has been observed in CHCl3 hydrate. One can imagine, for the body-centered cubic dodecahedral lat t ice, the medium holes (14-hedra) being filled by medium molecules and the small holes (dodecahedra) remaining empty. This has been observed for ethane hydrate. One might fill both the small and the medium holes of the body-centered lattice with small molecules; this has been observed for H2S hydrate. One might fill the medium holes with medium-sized molecules and the small holes with small molecules; this has never been reported.
One might fill all of the holes of the diamond lattice with smal l molecules. This has not been found and probably cannot exist because the larger holes , the 16-hedra , of this latt ice a r e just too large for the smal l molecu les . Another way of stating it is that the lattice containing the small and the medium holes is favored for small molecules alone over the lattice containing the small and the large holes because of energy considerations, and therefore , if any hydrate of the latter is formed, it will tend to decompose and be reformed into the former type.
The significance of the interfacial hydrates in the living organism cannot be overemphasized. Just as life itself as we know exists or is dependent upon
12
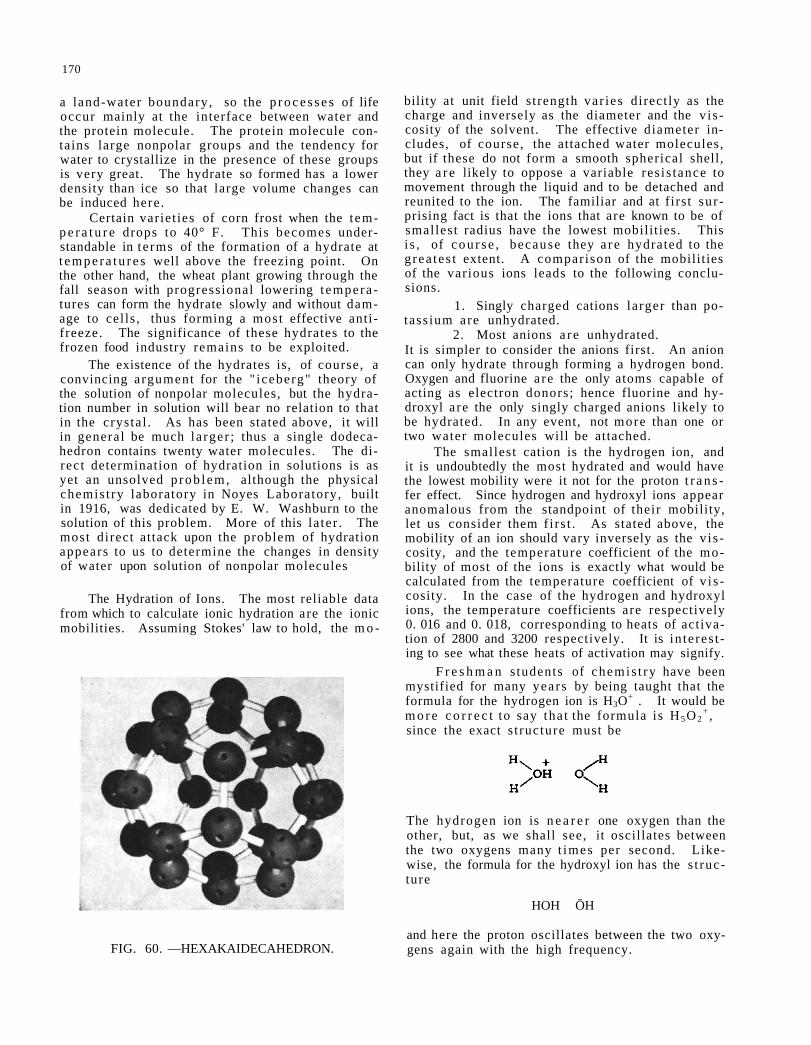
170
a land-water boundary, so the p r o c e s s e s of life occur mainly at the interface between water and the protein molecule. The protein molecule contains large nonpolar groups and the tendency for water to crystallize in the presence of these groups is very great. The hydrate so formed has a lower density than ice so that large volume changes can be induced here.
Certain variet ies of corn frost when the temp e r a t u r e drops to 40° F. This becomes understandable in te rms of the formation of a hydrate at t e m p e r a t u r e s well above the freezing point. On the other hand, the wheat plant growing through the fall season with progressional lowering t empera tures can form the hydrate slowly and without damage to cells , thus forming a most effective antifreeze. The significance of these hydrates to the frozen food industry remains to be exploited.
The existence of the hydrates is, of course, a convincing argument for the " iceberg" theory of the solution of nonpolar molecules, but the hydration number in solution will bear no relation to that in the crystal . As has been stated above, it will in general be much la rger ; thus a single dodecahedron contains twenty water molecules. The direc t determination of hydration in solutions is as yet an unsolved p rob l em, although the physical chemis t ry laboratory in Noyes Laboratory, built in 1916, was dedicated by E. W. Washburn to the solution of this problem. More of this la ter . The most direct attack upon the problem of hydration appears to us to determine the changes in density of water upon solution of nonpolar molecules
The Hydration of Ions. The most reliable data from which to calculate ionic hydration are the ionic mobilities. Assuming Stokes' law to hold, the m o -
FIG. 60. —HEXAKAIDECAHEDRON.
bility at unit field s trength var ies direct ly as the charge and inversely as the diameter and the v i s cosity of the solvent. The effective diameter includes, of course, the attached water molecules, but if these do not form a smooth spherical shell, they a r e likely to oppose a variable res is tance to movement through the liquid and to be detached and reunited to the ion. The familiar and at f irst sur prising fact is that the ions that are known to be of smallest radius have the lowest mobilit ies. This i s , of c o u r s e , because they a r e hydrated to the g rea tes t extent. A comparison of the mobilities of the various ions leads to the following conclusions.
1. Singly charged cations larger than potass ium are unhydrated.
2. Most anions a r e unhydrated. It is simpler to consider the anions first. An anion can only hydrate through forming a hydrogen bond. Oxygen and fluorine a re the only atoms capable of acting as electron donors; hence fluorine and hy-droxyl are the only singly charged anions likely to be hydrated. In any event, not more than one or two water molecules will be attached.
The smallest cation is the hydrogen ion, and it is undoubtedly the most hydrated and would have the lowest mobility were it not for the proton t r a n s fer effect. Since hydrogen and hydroxyl ions appear anomalous from the standpoint of their mobility, let us consider them f i rs t . As stated above, the mobility of an ion should vary inversely as the v i s cosity, and the temperature coefficient of the mobility of most of the ions is exactly what would be calculated from the temperature coefficient of v i s cosity. In the case of the hydrogen and hydroxyl ions, the temperature coefficients are respectively 0. 016 and 0. 018, corresponding to heats of activation of 2800 and 3200 respectively. It is in te res t ing to see what these heats of activation may signify.
F r e s h m a n s tudents of chemis t ry have been mystified for many years by being taught that the formula for the hydrogen ion is H3O+ . It would be m o r e c o r r e c t to say tha t the formula is H 5 O 2
+ , since the exact s t ructure must be
The hydrogen ion is n e a r e r one oxygen than the other, but, as we shall see, it oscillates between the two oxygens many t imes per second. Likewise, the formula for the hydroxyl ion has the s t ructure
HOH ŌH
and here the proton oscillates between the two oxygens again with the high frequency.
171
I t i s n e c e s s a r y , t h e r e f o r e , to exp la in the low conduc t iv i ty of p u r e w a t e r as an ionic s u b s t a n c e , and he re the analogy to the sa l t c r y s t a l s is helpful. The pu re sa l t c r y s t a l has p r a c t i c a l l y no conduc t i v i ty . I f t he l a t t i c e w e r e p e r f e c t wi th an exac t ly e q u i v a l e n t n u m b e r o f p o s i t i v e and n e g a t i v e ions , t he r e would be no conductance th rough the m a s s of the c r y s t a l . (Sur face conduc t ance i s , o f c o u r s e , another ma t t e r . ) The energy of ac t ivat ion r e q u i r e d to put a s e r i e s of i o n s in m o t i o n would i n c r e a s e with the d imens ion of the la t t ice in the c r y s t a l l i t e . Latt ice imperfections a r e likely to exist a t any t e m pera tu re above z e r o Kelvin, and one of the c o m m o n e s t ones is for an ion to be lacking, leaving a hole unfi l led. Th i s m a y be due to a de f i c i ency of ions of one s ign, but i t m a y equal ly wel l be due to d i s p l a c e m e n t , so t h a t an ion of oppos i t e s ign wil l be m i s s i n g s o m e w h e r e e l s e in the l a t t i c e . This c o r r e s p o n d s to the i o n i z a t i o n of p u r e w a t e r . Under the d r iv ing force of an e l e c t r i c field an ion of the c h a r g e s ign o f t h e m i s s i n g ion wi l l s l i p into the hole , and the hole wi l l m i g r a t e in the opposi te d i rect ion to the ion. This gives a per fec t i l l u s t r a t i on of what h a s been t e r m e d z i p p e r ac t i on in the d i s cus s ions of c o o p e r a t i v e p h e n o m e n a .
The b e h a v i o r of w a t e r is p r e c i s e l y ana logous to the sa l t c r y s t a l so far as e l e c t r i c a l conduct ivi ty i s c o n c e r n e d . So long as h y d r o g e n s and oxygens a r e p re sen t in equivalent amoun t s , the conduct ivi ty is negligible even though the hydrogen-oxygen l inka g e in w a t e r is l a r g e l y ion ic in c h a r a c t e r . I f a s ingle h y d r o g e n ion b r e a k s l o o s e f r o m an oxygen a tom and s t a r t s to move under the inf luence of the field, i t can get n o w h e r e b e c a u s e i t wi l l be d r a w n back to the n e g a t i v e ion. In o r d e r to ge t conductivity in this m a n n e r , i t would be n e c e s s a r y to d i s soc ia te a whole s e r i e s of hydrogen a t o m s th rough the solu t ion , and t h i s m e a n s an e n o r m o u s e n e r g y of a c t i v a t i o n . T h i s was the o r i g i n a l m e c h a n i s m sugges ted by G r o t t h u s for e l e c t r o l y t i c conduct ion. Such conductance as pure wate r h a s , t h e r e f o r e , i s due to the spontaneous ionizat ion into hydrogen and hydroxyl ions which a r e complete ly s e p a r a t e d f rom each other. The mechan i sm of conduction is t h e r e fore due to a l o c a l e x c e s s or de f i c i ency of an ion of one s ign or the o t h e r , p r e c i s e l y as is the ca se with the sa l t c r y s t a l s . I t i s p o s s i b l e to ca lcu la te the mobil i ty of the hydrogen and hydroxyl ions with considerable prec is ion . The init ial s tep is the p r o ton jump between two water molecu les in the H5O2
+
complex. So long as t h e r e is no field p r e s e n t , the osc i l l a t ion of the p r o t o n b e t w e e n the w a t e r m o l e -
cules is occurring with a frequency
where Q is the act ivat ion energy for the jump 2800 ca l s . / m o l e , and is the frequency of the proton oscillation in H 3
+ O, known from infrared absorption to be of the order of 1014. So long as no field is present, the structures are symmetrical but when a field is applied, a bias is produced in the energy levels of the proton in the two water molecules, which is
where E is the field strength, f the Faraday, Z the distance of the proton jump, and the angle with the electr ic field. The factor 4. 18 converts volt equivalents to ca lor ies . This situation is mathematically the exact analogue of the cases described ear l ie r in that a bias in the energy levels is produced by a pressure gradient or a polarization field. It was stated thus that for moderate values of the applied s t resses the effects are proportional to the applied s t r e s s , and we may proceed to show why this is so in the case of the hydrogen ion conductance.
In the presence of the applied field the expression for the rate of the protons' jump with the field is modified to
(I)
while the reverse process is
(II)
The net transfer of protons is the difference between the two expressions. For small values of E,
becomes
Hence (I) - (II) becomes
and for random orientations the average value of cos is 1/3. The rate of proton transfer by jump-
Low Conductance of Liquid Water . The e l e c t r ic ian who knows the danger of m o i s t u r e when h a n dling live wi res will be skept ical about the low conduc tance of w a t e r , but the fact i s tha t p u r e wa te r is a good in su l a to r . The common i m p u r i t i e s such a s c a r b o n d iox ide i n the a t m o s p h e r e d i s s o l v e t o give hydrogen ions and hence the high conduct iv i ty .
172
ing from one molecule to another is therefore
The apparent mobility of the proton is increased, however, by the possibility of proton exchange in the molecule. When a proton jumps to a molecule
to form the complex , the proton which
leaves this molecule is the one which is on the fa r thest side of the molecule in the direction of the field. The total gain in distance per jump t h e r e fore is more nearly three Angstroms. Hence, substituting Z = 3 x 1 0 - 8 , E = 10-8 and remembering that the mobility is the rate of transfer at unit field strength we have for the mobility
For the hydroxyl ion the same calculation gives 1. 6 x 1 0 - 3 , using Q = 3200 calor ies . The a g r e e ment is better than one has any right to expect but there is no doubt about the order of magnitude. Each hydrated ion complex has a mobility of its own independently of the proton jump mechanism. In the case ©f the proton this is small , but the hydroxyl is not greatly hydrated and must therefore contribute considerably to the conductance.
The reason that anions do not form large envelopes of water molecules is that the hydrogen bond does not "propagate" through several water mole cules. The formation of a hydrogen bond does not polarize the water molecule. On the other hand, a cation at t racts the oxygen of the water molecule and makes the hydrogens more acidic. They bond to oxygens of other water molecules so that the polarization extends through at least two layers and may involve a total of ten or more water molecules.
This polarization is greater the greater the charge, and the sma l l e r the radius of the cation. In the case of the small univalent cations this theory r e ceives confirmation from the activity coefficients. In concentrated solutions the activity r ises to values grea te r than unity because the concentration has been increased to a far greater value than the nominal value on account of the water of hydration.
The larger univalent cations, such as potassium, for example, coordinate two water molecules, but loosely, and the volume of the water molecules plus cation is now greater than the 60 which might fit into a cage formed by a dodecahedron, for example. Hence, one must conclude that the hydration is limited to two loosely held molecules.
There is a temptation to associate the phenomenon of en t ra inment which is so t roublesome in distillation with the hydration of ions. There may, of course , be an indirect connection but entrainment must be directly due to bubble formation. The surface film tends to concentrate various types of nonvolatile impuri t ies and to take on elastic p r o portions.
SUMMARY
The explanation of the unique properties of ice and water is to be found in the hydrogen-bonded s t ruc tu re common to both physical s ta tes . The more essential peculiar abnormalities of water a r e :
1. Density 2. Specific heat 3. The formation of gas hydrates 4. The high mobility of the hydrogen and
hydroxyl ions. An adequate explanation has been given for these
abnormalities. Much yet remains to be explained in regard to other physical properties of water and more especially ice. A study of the viscosity and its relation to the dielectric propert ies should be rewarding. It should be noted that the gas hydrates are essentially a cubic form of ice.
Å
173
BIBLIOGRAPHY
1. Buswell, A. M., Dietz, V. , and Rodebush, W. H. , "Infrared Absorption Studies I ," J. Chem. Phys. 5, 84 (1937); ibid, 5.(1937).
2. Buswell, A. M., Roy, M. F . , and Rodebush, W. H . , "Infrared Absorption Studies I I , " J. Am. Chem. Soc . , 59, 1767 (1938).
3. Buswell, A. M., Roy, M. F . , and Rodebush, W. H . , "Infrared Absorption Studies III," J. Am. Chem. S o c , 59, 2603 (1938).
4 . Buswe l l , A. M . , B o r s t , L . B . , and Rodebush, W. H. , "Infrared Studies IV," J. Chem. Phys., 6, 61 (1938).
5. Buswell, A. M. , and Rodebush, W. H. , "Assoc i ation Through Hydrogens," J. Phys. Chem. , 43, 219(1939).
6. Buswell, A . M . , Roy, M. F . , and Rodebush, W. H . , "Infrared Absorption Studies V, " J. Am. Chem. S o c . , 60, 2239 (1939); VI, ibid, 60, 2444(1939); VII, ibid, 60, 2528 (1939).
7. Buswell, A. M. , McMillan, G. W., Wall, F. T . , and Rodebush, W. H. , "Infrared Absorption Studies VIII," J . Am. Chem. S o c , 61, 2809(1939).
8. Buswell, A. M. , Downing, J. R . , and Rodebush, W. H., "Infrared Absorption Studies IX," J. Am.
Chem. S o c , 61, 3252 (1939); ibid, 62, 2759(1946). 9. Buswell, A. M. , Maycock, R. L . , and Rodebush,
W. H. , "Infrared Absorption Studies X," J. Chem. P h y s . , 7, 857 (1939); ibid, 8, 362 (1940).
10. Buswel l , A. M . , G o r e , R. C . , and Rodebush, W. H . , J. Phys. Chem. , 43, 1181 (1941).
11. Buswell, A. M., Krebs, K., and Rodebush, W. H . , "Infrared Absorption Studies XI," J. Phys. Chem. , 44, 1127 (1942).
12. Buswell, A. M. , Whitney, R. M . , and Rodebush, W. H. , "Infrared Absorption Studies XIII," J. Am. Chem. S o c , 69, 770(1947).
13. Bohon, R. L . , and C laus sen , W. F . , J . Am. Chem. Soc., 73, 1571 (1951).
14. Claussen, W. F . , J. Chem. P h y s . , 19, 259, 662 (1951).
15. C l a u s s e n , W. E., J. Chem. P h y s . , 19, 1425 (1951).
16. Claussen, W. F . , et a l . , in p rocess of publication.
17. Rotar iu , Claussen and Rodebush, in p r o c e s s of publication.
18. Stackelberg, M. F . , and Muller, R. H. , J. Chem. Phys. , 19, 1319 (1951).
ION E X C H A N G E M A T E R I A L S
BY A. S. BEHRMAN*
When Dr . Buswe l l a s k e d me to give t h i s t a l k on ion exchange m a t e r i a l s , I a sked h im how long he wanted the t a lk to be . He r ep l i ed , "One h o u r . " I to ld h im I was a f i r m b e l i e v e r in the s t a t e m e n t of H e n r y Ward B e e c h e r , the g r e a t p r e a c h e r , t ha t no soul i s saved after the f i r s t twenty m i n u t e s . Even s o , I h a d to a g r e e wi th D r . B u s w e l l — a n d I hope you will ag ree also—that an hour is a l l too s h o r t for an a d e q u a t e t r e a t m e n t o f j u s t about the m o s t f a s c ina t ing c h e m i c a l f ield I know.
I t s e e m s to me that we have two p r inc ipa l p o s sible approaches to our subject. One might be ca l l ed an analy t ica l approach—tha t i s , we could s t a t e and examine the e s s e n t i a l f e a t u r e s of our p r e s e n t - d a y knowledge of ion exchange m a t e r i a l s and ways of using them in industry, p a r t i c u l a r l y in wa te r t r e a t ment .
The other approach is an essen t i a l ly h i s t o r i c a l one . H e r e we could t r a c e the p r o g r e s s of the ion exchange concept and of ion exchange m a t e r i a l s f r o m t h e i r e a r l i e s t b e g i n n i n g s o n t o and t h r o u g h t h e i r p r e s e n t r e l a t i v e l y high s t a t e of d e v e l o p m e n t .
I s h a l l u s e , if I m a y , a combina t ion of t h e s e two approaches . I think tha t we will obtain a b e t t e r u n d e r s t a n d i n g of the ion exchange concep t and of ion exchange m a t e r i a l s b y t r a c i n g t h e i r p r o g r e s s historical ly. We will then be in a more advantageous pos i t ion t o examine r a t h e r c r i t i c a l l y our p r e s e n t -day knowledge and lack of knowledge, and poss ib ly to suggest other avenues for explora t ion in the fu ture .
Ion exchange, like many other indust r ia l c h e m i ca l p rocesses , has achieved a high state of p r a c t i c a l util i ty without a complete ly sa t i s fac tory t h e o r e t i c a l p i c t u r e of i t s b a s i c m e c h a n i s m . Ion exchange is un ique , h o w e v e r , in t h a t , s o m e t h i n g l ike Venus , i t sprang so wel l -grown at b i r th . Then, for a l m o s t a half c e n t u r y , i t g rew l i t t le or none. In the next half century , jus t comple ted , i t s p r o g r e s s was r e m a r k a b l e , though i t came in per iod ic waves r a t h e r than as a slow and s teady growth. The p r e s e n t in t ense i n t e r e s t and ac t iv i ty in ion exchange a p p e a r s to be a c o n s o l i d a t i o n of r e c e n t a c c u m u l a t i o n s of k n o w l e d g e , p e r h a p s to be fol lowed by a n o t h e r o f the spectacular developments which have c h a r a c t e r ized the h i s t o r y of ion exchange f rom the s t a r t .
The o r ig in of the ion exchange concep t , as is now f a i r l y we l l known, d a t e s back a l i t t l e over a cen tury . In 1850 and 1852, J. Thomas Way, Consul t ing C h e m i s t t o the Roya l A g r i c u l t u r a l Society of England, presented two papers before the Socie ty
*Consultant, Chicago, Illinois.
on the " P o w e r of Soils to A b s o r b M a n u r e " (22). ** T h e s e two p a p e r s , t o t a l ing 8 6 p a g e s , have n e v e r c e a s e d t o f a sc ina te m e . They should b e r e q u i r e d r e a d i n g for e v e r y g r a d u a t e s t u d e n t i n c h e m i s t r y .
W a y ' s work was i n s p i r e d by two e n t e r p r i s i n g a g r i c u l t u r i s t f r iends of h i s , M r . Huxtable and M r . Thompson. Mr . Huxtable s ta ted that "he had m a d e an e x p e r i m e n t i n t h e f i l t r a t i o n o f l iqu id m a n u r e t h r o u g h a bed of an o r d i n a r y l o a m y so i l ; and tha t af ter i t s p a s s a g e t h r o u g h the f i l te r bed , the u r ine was found to be d e p r i v e d of co lou r and s m e l l — i n fact t ha t i t went in m a n u r e and c a m e out w a t e r . "
M r . Thompson (21) "had found tha t so i l s have the faculty of separat ing ammonia f rom i t s solut ion: a fact appearing s t i l l m o r e ex t rao rd ina ry , i n a s m u c h as there is no ordinary form of combination by which we could conceive ammonia to be combined in a s t a t e of i n s o l u b i l i t y in the so i l . " A l s o , but a p p a r e n t l y unknown to Way, Thompson had t r e a t e d so i l wi th a solution of ammonium sulfate, and had found c a l c i u m su l fa te in the ef f luent .
I would l ike to t a k e you s t e p by s t e p t h rough W a y ' s r e s e a r c h e s , and le t you s h a r e the s u c c e s sive exa l t a t ions and d e p r e s s i o n s he m u s t have e x p e r i e n c e d in a r e a l l y a m a z i n g p u r s u i t of h i s goal . N e i t h e r t i m e n o r , I s u s p e c t , your pa t i ence would pe rmi t . Suffice i t to say, t he re fo re , that Way f i r s t cons ide red and abandoned the idea that the a b s o r p tion of ammonia was due s imply to a porous s t r u c t u r e ; o t h e r p o r o u s m a t e r i a l s he t e s t e d did no t have th i s ab i l i ty .
By f u r t h e r e x p e r i m e n t a t i o n he found t h a t t h i s "power of the soil to combine with ammonia is g r e a t ly d iminished by burning i t . " This loss of c o m b i n ing power was not due to the des t ruc t ion of o r g a n i c m a t t e r ; ac t iv i ty r e m a i n e d i f the o rgan ic m a t t e r in the so i l was bu rned with n i t r i c ac id .
Then came his important exper iments , qui te in dependent of those of Thompson, in which he t r e a t e d the s o i l wi th so lu t i ons of a m m o n i u m su l fa t e , and found in the f i l t r a te " a n abundance of su l fur ic ac id in combina t ion with l ime . "
Way pos tu l a t ed and t r i e d in t u r n the i dea tha t the effective agent in the soi l was a l ime compound; a s i l i c a t e ; a c a l c i u m s i l i c a t e ; a doub le s i l i c a t e , such as fe ldspar , the double s i l ica te of a lumina and p o t a s h ; and a l b i t e , the double s i l i c a t e of a l u m i n a and soda ; and, in t u r n , a l l r e s u l t s w e r e n e g a t i v e .
He apparen t ly had an inner conviction, n e v e r -
**Number in parentheses refers to number in BIBLIOGRAPHY at end of this a r t ic le .
175
176
theless, that he was on the right track. In his own words, "it was still possible, however, that these double si l icates, when formed artificially by p r e cipitation, might be capable of effecting that which in the mineral state they were unable to accomplish. " He prepared such artificial double silicates by r e acting sodium aluminate with sodium silicate, and aluminum sulfate with sodium silicate. The products had the long-sought property. The first synthetic base exchange materials had been produced; and it will be noted that the reagents used in their production a r e sti l l being employed for the same purpose .
Way believed there was a preferential and nonreversible order in the exchange of bases. He drew up a list of this sort in the manner of the e lect romotive series of metals. This error was corrected a few yea r s la ter by Eichhorn (10). He demonstrated the mutual replaceability of the bases . He a l so showed that the natural zeol i tes , which a re -hydrated double silicates, do possess base exchange p rope r t i e s , and that Way's negative resu l t s with natural double silicates were due to his use of anhydrous materials .
One would think that this surprisingly complete work of Way and Eichhorn would have found p r a c tical utilization fairly promptly. It did not. On the contrary, it seems to have been completely ignored for almost half a century. In 1896 Harms (14) obtained a patent covering the process of replacing potassium compounds in beet sugar juices with the l ess melass igen ic calcium compounds, thus inc reas ing the yield of crys ta l l izable sugar . The base exchange ma te r i a l utilized by Harms was a bolus , or si l iceous ear th . The p roces s was not commercially successful.
Rümpler (18), a lso working with the replacement of potash in beet sugar juices, demonstrated the base exchange power of cement. He also utilized a synthetic base exchange mater ia l which he precipitated in a porous medium such as charcoal. Riimpler pointed out that if these "zeol i tes" were regenerated with sodium compounds instead of calcium compounds, they would extract calcium, magnesium and potassium from solution.
Although Riimpler t r i ed to lay the basis for claiming that he first suggested that zeolites could be used for water t r ea tmen t , there can be little question that the real father of zeolite water softening was Robert Gans (11). It was Gans who made the f irs t fused base-exchanging sodium aluminum silicates. He christened them "Permutits"—a name which later competitors found difficult to dislodge as a generic one.
It was on Gans ' inventions that the German zeolite water softening industry was founded in the first decade of the twentieth century. Soon afterwards, as was to be expected, the Permuti ts were brought to the United S ta tes , and the American
Permut i t Company was founded. Gans' Permutits were highly porous, hydrated
sodium aluminum s i l ica tes with compositions of the anhydrous portions ranging typically from about Na2O. A l 2 O 3 • 4SiO2 to Na2O. A l 2 O 3 • 8SiO2. Gans' products and pract ice were sounder than some of his theories behind them. He drew a long and laborious distinction between "aluminate s i l icates" and "double silicates. " In the "aluminate si l icates" the alkalies and alkaline earths were supposed to be combined principal ly with the alumina, while in the "double s i l icates" the alkalies and alkaline ear ths were supposed to be combined principally with the silica. By the same token, effective base exchange products could be prepared by wet methods from sodium silicate and sodium aluminate, but not from sodium si l icate and aluminum sulfate— the reaction product in the latter case would be a "double silicate. " I was always greatly interested in this point of view, because, twenty years la ter , the company with which I was associated for many years developed a group of very effective gel zeolites made essentially from sodium silicate and a luminum sulfate.
The new method of water softening captured the fancy of the water treating world and took it by storm—although time was required to demonstrate that the new process real ly worked and was not a trick or a fraud. The incredulity was understandable.
The great success of Gans' Permutits naturally invited competition. This competition was facilitated by the fact that in the United States, unlike in Germany, no broad process patent was obtained on the softening of water with base exchange si l icates . It is true that the American Permutit Company was able to maintain for several years an almost complete monopoly on the zeolite water softener busi ness by asserting in the courts that a certain Gans apparatus patent (12) covered all downflow softeners. The lengthy and expensive litigation finally reached the Supreme Court, which invalidated this in ter pretation of the patent.
Before this litigation was well started, however, two important competitors of Gans' fused zeolites had already made good headway. The more important of these was processed glauconite, or greensand, f irst sold as the baked product under the name of "Borromite," after the inventor, George Borrow-man, of Chicago. Glauconite, as you all know, is a granular mater ia l of marine origin found ra ther extensively in portions of the Atlantic Seaboard. The most important deposits, from the water sof-. tening standpoint, have been found in New Je r sey . This mater ia l is essentially a hydrated potassium iron sil icate.
Greensand had severa l important advantages over Gans' fused zeolites. The raw mater ia l was relatively cheap and it was easily processed. Even
more important were its operating characteris t ics . It was very rapid-react ing, both in softening and in regeneration—quite in contrast to Gans' fused zeolites, which could be used at only slow rates during the softening cycle, and which were typically r egene ra t ed overnight, or , if a spare softening unit was provided, during an entire working day. Greensand was also economical in the amount of salt required for regeneration—low enough in fact, that the "salt-saving" systems used with the slow-acting, high salt-consuming fused Permutits were largely abandoned. The two disadvantages of green-sand were its low total exchange capacity per cubic foot—only a half or third that of the fused Permutits — and its small size and spherical shape, which tended to make it pack and cause serious pressure losses in long runs .
Almost concurrently with greensand appeared Refinite, a baked and rehydrated weathered bentonitic clay found in Nebraska.
In the meantime, synthetic siliceous base exchange materials prepared by wet methods had be gun to appear. In 1913 Bochringer and Gessler (6) obtained a patent for precipitating a sodium aluminum silicate from dilute solutions of sodium alumi-nate and sodium silicate. The flocculent gelatinous precipitate was filter-pressed, washed, dried, and granulated. The product, known as "Decalso, " was produced and sold by the American Zeolite Company, later taken over by the Permuti t Company.
The really noteworthy development, however, in synthetic base exchange s i l icates came in the 1920's with the announcement of the "gel zeolites. " Working quite independently, Wheaton (23) in England produced a gel zeolite from sodium silicate and sodium aluminate, and Behrman (5) in the United States prepared the first of his gel zeolites made from sodium silicate and aluminum sulfate. Gel zeolites a r e produced by reacting solutions of the proper concentrations in the right proportions, at the proper temperature, and with the proper method of mixing. Under these optimum conditions no p r e cipitate resul ts ; instead, the entire reaction mixture se ts to a firm stiff hydrogel . This colloid system is irreversible. When the hydrogel is dried, it forms hard, insoluble, highly porous part icles possessing the properties of high exchange capacity, rapid rate of exchange in softening and regeneration, and low salt consumption.
The Wheaton gel zeolites were produced in the United States under the trade name "Doucil" by the American Doucil Co . , in which the Philadelphia Quartz Co. was interested. The Behrman gel zeolites were produced by the International Fil ter Co. (now Infilco Inc.), under the trade name "Crytalite. "
The charac ter i s t ics of the gel zeolites made them particularly suitable for household softeners, and for many—but not all—types of industrial and municipal softeners, especially for very hard waters .
Their chief disadvantages were—and are—thei r re la t ive lack of stabili ty and the i r loss of silica under some conditions, particularly high temperatures and either unusually high or low pH. Competition for the Wheaton and Behrman gel zeolites developed shortly. Of greatest interest in connection with these competitive materials was the method of drying the hydrogel out-of-doors, as practiced, for example, by the National Aluminate Corporation and the Culligan Zeolite Company, and the method of drying by freezing as pract iced by the Research Products Corporation. Production by natural drying out-of-doors has at t imes reached very large proportions; drying of gels by freezing has had, to the best of our knowledge, only a limited application.
To make this greatly condensed history of s i l i ceous base exchange materials a little more complete, it should be mentioned that patent litigation was not completely absent during this period of technical and commercial development.
We have now come to the ear ly " th i r t ies . " I think it is worth pausing here just a moment to sur vey the situation as it was at that t ime. By then zeolite water softening was the generally accepted method of t r e a t m e n t wherever " z e r o hardness" was the first consideration. Accordingly, a zeolite softener was fast becoming standard equipment for laundries, for many textile dyeing and finishing plants, and for a host of other uses where lack of any hardness in the water was a proper cri terion. Because of pressure tank design and convenience in operation, household softeners began to be "mus ts" in better homes in hard water a reas .
By and large, the zeolite of choice in the early thirties was greensand for boiler feed and for most other industrial applications where the raw water was relatively soft or only moderately hard, and the gel zeol i tes for household softeners and for industrial and municipal installations when the raw water was quite hard.
Not that there was general acceptance of zeolite softening for boiler feed. The first flush of enthusiasm was over, and there was growing appreciation of the possibi l i t ies of foaming, priming, and corrosion when using for boiler feed a water of appreciably high bicarbonate hardness softened by zeolite. Zeolite followed by acid treatment and aeration was being used in a number of instances to t ry to overcome these l imitations.
Then came the " th i r t i es . " With them began what we might call the modern age of ion exchange— an age in which we, of course, are still living.
The f i rs t herald of this modern age was the appearance of organic base exchange mate r ia l s . These were the sulfonated coals , prepared by the action of concentrated or fuming sulfuric acid or sulfur trioxide on bituminous or anthracite coal. With what has always seemed to me to be a striking
177
178
lack of originality, these new m a t e r i a l s w e r e dubbed " c a r b o n a c e o u s z e o l i t e s . " Ano the r a t t e m p t t o link the future somewhat m o r e broadly with the pas t was the s u g g e s t e d n a m e " o r g a n o l i t e " ; but t h i s hybr id neve r r ece ived m o r e than v e r y l im i t ed and t e m p o r a r y accep tance .
The " c a r b o n a c e o u s z e o l i t e s " m a r k e d two i m por tan t advances in water t r e a t m e n t . One was tha t they w e r e n o n - s i l i c e o u s , and so could be used for softening b o i l e r feed wa te r without d a n g e r of contr ibuting to the formation of s i l ica te sca le—a danger to which the boi ler water field was becoming acu te ly sensi t ive . F u r t h e r m o r e , these " c a r b o n a c e o u s z e o l i t e s " had two or t h r e e t i m e s the exchange capac i ty of the same volume of g reensand , they w e r e r a p i d -ac t ing , efficient in sa l t consumpt ion , and rugged .
The o ther , and far m o r e i m p o r t a n t a d v a n t a g e , however , was the fact that the " c a r b o n a c e o u s z e o l i tes" could be used as hydrogen exchange m a t e r i a l s by regenera t ion with an acid ins tead of a sa l t . The idea of a "hydrogen zeoli te" was not new; but it had not been p o s s i b l e to p r a c t i c e the idea i n d u s t r i a l l y before , s imply because the s i l iceous base exchange m a t e r i a l s , even the mos t rugged of t h e m , could not stand up under repeated regenerat ions with the s t r ong ac id so lu t ions r e q u i r e d .
I t i s no t g e n e r a l l y a p p r e c i a t e d t h a t o rgan ic c a t i o n e x c h a n g e r s w e r e known e a r l i e r . I n 1922 Hepburn (15), an Engl i shman, was g r an t ed a pa ten t on softening wa te r using pea t as the b a s e exchange medium. While t heo re t i c a l l y pos s ib l e , the me thod w a s o b v i o u s l y n o t v e r y p r a c t i c a l o r a t t r a c t i v e . B o r r o w m a n (7) w e n t a s t e p f u r t h e r , in h i s pa ten t i s s u e d i n 1 9 3 1 . He u s e d l i g n i t e . I t i s p e r f e c t l y feasible to soften wa te r by pass ing it t h rough a bed of l ign i t e p a r t i c l e s , and s u b s e q u e n t l y r e g e n e r a t e the exhausted bed in the usual way with common sa l t . The principal deficiency of lignite is i ts low exchange capacity. At bes t th i s is only about t w o - t h i r d s tha t of greensand, which, as we have seen , was a l r e a d y los ing ground b e c a u s e i t s capac i ty was so low. I t was d o u b t l e s s for t h i s r e a s o n t h a t B o r r o w m a n ' s lignite never achieved any c o m m e r c i a l i m p o r t a n c e .
In 1940 a g roup of United S ta t e s b a s i c p a t e n t s was g ran ted on sulfonated c a r b o n a c e o u s m a t e r i a l s to L i e b k n e c h t (16) of G e r m a n y , a n d S m i t (19) of Holland. These United Sta tes pa ten t s w e r e a l l a s s igned to or o t h e r w i s e con t ro l l ed by the A m e r i c a n P e r m u t i t C o m p a n y . I t i s i n t e r e s t i n g to note that dur ing the p ro secu t i on of the pa tent app l i c a t i ons in the Patent Office the Examiner cited a B r i t i s h pa ten t to Ha l se (13). Th i s pa tent d i s c l o s e d a m e t h o d for purifying beet sugar ju ices by means of a " c h a r c o a l " p r e p a r e d by the a c t i o n of su l fu r i c a c i d on l ign i te , wood, and v a r i o u s f o r m s of c e l l u l o s e . H a l s e sa id tha t t h i s p r o d u c t h a d a l l the a d v a n t a g e s o f a n i m a l charcoal , and in addition would remove a l a r g e p r o por t ion of the sa l t s p r e s e n t . It could be r ev iv i f i ed by t r e a t m e n t with su l fur ic or h y d r o c h l o r i c a c i d .
The f i r s t p r a c t i c a l appl ica t ion of hydrogen e x change in w a t e r t r e a t m e n t in the Uni ted S ta tes of which I am a w a r e w a s for the m a n u f a c t u r e of r a w wate r ice (2). The p r i n c i p a l i m p u r i t y in the w a t e r in this case was sod ium b ica rbona te . By hydrogen exchange, using a sulfonated coal r e g e n e r a t e d with sulfuric acid, the sodium bicarbonate was conver ted to water and c a r b o n d iox ide . In o ther w o r d s , if a r a w water contains only b ica rbona tes , the d i s so lved sol ids content can be r educed by hydrogen exchange t o z e r o .
The " c a r b o n a c e o u s z e o l i t e s " h a d only a few y e a r s t o b e c o m e f i r m l y e s t a b l i s h e d i n i n d u s t r i a l w a t e r t r e a t m e n t w h e n t h e r e a l r e v o l u t i o n i n ion exchange m a t e r i a l s and m e t h o d s took p l a c e . Th i s was the c l a s s i c p a p e r by A d a m s and H o l m e s (1) in 1935 announc ing in one fel l swoop (1) p u r e l y s y n the t i c ca t ion-exchange r e s i n s , (2) anion exchange , and (3) an ion-exchange r e s i n s .
T h e c a t i o n - e x c h a n g e r e s i n s o f A d a m s and Holmes w e r e i n t e r e s t i n g , but not s t a r t l i n g , a s fa r a s the i r i m m e d i a t e i m p a c t on the w a t e r t r e a t m e n t field was concerned . After a l l , the i r o r ig ina l r e s i n s , p r e p a r e d by r e a c t i n g phenol ic compounds and formaldehyde, had ve ry l i t t le to offer tha t the sulfonated coal ma te r i a l s had not a l ready made ava i l ab le .
The r ea l sensa t ion , of cou r se , was the d e m o n s t ra t ion of anion exchange, by synthetic r e s i n s p r e p a r e d by r e a c t i n g c e r t a i n t y p e s o f a m i n e s and an a ldehyde . In th i s p a p e r , A d a m s and H o l m e s s u g g e s t e d and d e m o n s t r a t e d the obvious c o r o l l a r y of t h e i r work, that i s , the p repa ra t i on of " d e - i o n i z e d " or " d e m i n e r a l i z e d " w a t e r by a combina t ion of h y d rogen exchange a n d an ion exchange .
One would have thought that Adams and Holmes would have obtained v e r y broad p r o c e s s and p roduc t p a t e n t s c o v e r i n g t h e i r p i o n e e r i n g a c h i e v e m e n t s . T h e y did not do s o , a t l e a s t in the Un i t ed S t a t e s . E v e n be fo re the A d a m s and H o l m e s p a t e n t s w e r e i s sued in the United S ta tes , severa l fo rward- look ing companies had made such good p r o g r e s s in deve lop ing c o m p e t i t i v e m a t e r i a l s t ha t a n u m b e r of " d e -i o n i z e r " i n s t a l l a t i o n s had been m a d e .
The f i r s t anion exchange r e s i n s p l a c e d on the A m e r i c a n m a r k e t w e r e no t s a t i s f a c t o r y . T h e s e w e r e a m - p h e n y l e n e d i a m i n e - f o r m a l d e h y d e r e s i n a n d " a n i l i n e b l a c k . " A c o m m o n c h a r a c t e r i s t i c o f t h e s e two m a t e r i a l s w a s t h a t t hey would lose exchange capaci ty r a t h e r rap id ly , and without l o s ing volume. In consequence, replacement of a m a s s of inactive ma te r i a l was r equ i r ed at r e l a t ive ly s h o r t i n t e r v a l s .
I b e l i e v e t ha t t h e f i r s t a n i o n - e x c h a n g e r e s i n with reasonably s a t i s f ac to ry capaci ty and opera t ing c h a r a c t e r i s t i c s w a s a g u a n i d i n e - a l d e h y d e r e s i n known a s " A n e x 2 9 9 , " d e v e l o p e d b y I n t e r n a t i o n a l F i l t e r C o m p a n y , now Inf i lco I n c o r p o r a t e d . This r e s i n was used in a number of w a t e r - d e m i n e r a l i z i n g ins t a l l a t ions and in the f i r s t fu l l - sca l e s u g a r j u i ce
179
t r e a t m e n t p l a n t , in c o m b i n a t i o n wi th " C a t e x , " a sulfonated coal hydrogen e x c h a n g e r , and an i n t e r m e d i a t e a c t i v a t e d c a r b o n bed . T h i s i n s t a l l a t i o n was made in 1941. ("Anex" and "Catex" a r e Inf i lco ' s g e n e r i c t r a d e n a m e s for the an ion and cat ion e x c h a n g e r s t hey p r o d u c e or s e l l . )
The o r ig ina l "Anex" was a v e r y useful r e s i n , and for s e v e r a l y e a r s found fa i r ly extens ive a p p l i cat ion. I t was g radua l ly s u p e r s e d e d , however , by newer t y p e s of a n i o n - e x c h a n g e r e s i n s p o s s e s s i n g c o n s i d e r a b l y h ighe r exchange capac i t y and g r e a t e r s t ab i l i t y . A m o n g t h e s e m a y b e men t ioned the " D u o l i t e s , " p r o d u c e d b y the C h e m i c a l P r o c e s s C o m p a n y ; the a n i o n - e x c h a n g e " A m b e r l i t e s , " of Rohmand Haas; the "Ionac" anion r e s in s of A m e r i c a n Cyanamid; and the newer "Deacidi te" res ins of P e r -mut i t .
At t h i s point in our h i s t o r i c a l sketch i t i s o b v ious t h a t w e h a v e a p p r o a c h e d s o c l o s e l y t o t h e p r e s e n t d a y t h a t w e a r e d e a l i n g with p r a c t i c a l l y c u r r e n t h i s t o r y . Acco rd ing ly , l e t us endeavor to s u m m a r i z e b r i e f ly the i m p o r t a n t deve lopmen t s of the pa s t ten y e a r s , both in ion exchange m a t e r i a l s and in novel me thods of using t h e m in water t r e a t m e n t .
F i r s t , with r e s p e c t t o ca t ion exchange m a t e r i a l s , we have the following p r i n c i p a l c a t e g o r i e s :
1. The inorganic gel z eo l i t e s , the h y d r a t e d sodium a luminum s i l i ca tes we have prev ious ly d i s c u s s e d in d e t a i l . S u b s t a n t i a l q u a n t i t i e s of t h e s e m a t e r i a l s a r e s t i l l being p r o d u c e d , e spec i a l l y for household sof teners . The i r use i s s teadi ly d e c l i n ing, h o w e v e r , in favor of o r g a n i c h i g h - c a p a c i t y * m a t e r i a l s .
2. Greensand. This low cost , low capac i t y inorganic m a t e r i a l i s s t i l l being used , p a r t i c u l a r l y on low h a r d n e s s w a t e r s ; but i t s low capac i ty and s i l i ceous n a t u r e a r e con t r ibu t ing t o i ts i n c r e a s i n g abandonment in favor of efficient organic m a t e r i a l s .
*The exchange capacities of both cation and anion exchangers a re affected very appreciably by a number of factors, such as depth of bed and particle size of the exchanger, composition of the water being treated, rate of flow of the water through the bed, and the amount of salt, acid, or alkali used in regeneration. This fact is recognized and utilized in the design and operation of ion exchange plants. Accordingly, it is not possible to state precisely the capacity of any ion exchanger without specifying the conditions of use. The manufacturer or supplier should be consulted in each case. For purposes of approximate orientation, however, the following capacity ranges will be found helpful; all capacities are expressed in terms of grains of calcium carbonate equivalent per operating cubic foot of the exchanger: Green- -sand, 2 ,500-3,000; gel zeolites, 8,000-12,000; sulfonated coals, 7,000-10,000; cation exchange resins (a) low capacity, 7,000-10,000, (b) medium capacity, 12,000-15,000, (c) high capacity, 25, 000-35, 000; anion exchange resins (a) medium capacity 15,000-20,000, (b) high capacity, 25,000-35,000.
3 . Sulfonated coals . These m a t e r i a l s have replaced greensand in many indus t r i a l i n s t a l l a t ions . They a lso have a ruggedness and ce r ta in other o p e r ating charac ter i s t ics which enable them to compete— for the p re sen t , a t leas t—with synthe t ic cat ion e x change r e s i n s of h igher capaci ty .
4 . S y n t h e t i c r e s i n s . T h i s i s a c a t e g o r y which we mus t b r e a k down into t h r e e p r inc ipa l s u b divis ions:
(a) P h e n o l f o r m a l d e h y d e , su l fonated f o r m a l d e h y d e a n d s i m i l a r t y p e s o f r e s i n s . The p r e s e n t l y p r o d u c e d r e s i n s o f t h i s type cons t i tu te a group of medium exchange capacity ( c h a r a c t e r i s t i cally a little higher than that of the sulfonated coa l s ) . They a r e useful both for sodium exchange in w a t e r softening and in deminera l iz ing and other i n d u s t r i a l work.
(b) The high capacity " n u c l e a r sulfonated hydrocarbon po lymers , " more specifically, the s u l fonated polystyrene r e s i n s . Seve ra l m a n u f a c t u r e r s a r e p roduc ing r e s i n s of t h i s t y p e . A l l of t h e m , I b e l i e v e , a r e l i c e n s e d under the G e n e r a l E l e c t r i c C o m p a n y ' s p a t e n t i s s u e d t o D ' A l e l i o (9). T h e s e r e s i n s a r e becoming i n c r e a s i n g l y i m p o r t a n t i n the c a t i o n e x c h a n g e f i e ld . T h e i r c a p a c i t y i s two o r th ree t i m e s that of the med ium capaci ty syn the t i c s , and roughly ten t i m e s that of g r e e n s a n d . They a r e r e p l a c i n g to a c o n s i d e r a b l e ex ten t the gel z e o l i t e s h o u s e h o l d w a t e r s o f t e n e r s , p r i m a r i l y b e c a u s e o f t h e i r h i g h e r c a p a c i t y (about t w i c e t h a t o f the gel zeol i tes) and because of the i r economica l s a l t consumption. They a r e rugged and long- l ived. T h e i r ab i l i t y to w i t h s t a n d high t e m p e r a t u r e s i s opening up a new type of hot p r o c e s s softening which we will d iscuss in m o r e detai l very short ly . The p r i n c i p a l p r e s e n t l i m i t a t i o n a p p e a r s to be a h igh ac id cons u m p t i o n in the h y d r o g e n c y c l e . I t would not be s u r p r i s i n g i f t h i s c h a r a c t e r i s t i c w a s i m p r o v e d . T h i s type o f r e s i n i s c h a r a c t e r i s t i c a l l y suppl ied in bead fo rm.
(c) The ca rboxyl ic type cat ion exchange r e s i n . Th i s r e s i n i s unique in tha t being e s s e n t i a l ly a solid weak acid, i t will not r e a c t a p p r e c i a b l y in the h y d r o g e n cyc le with n e u t r a l s a l t s of s t rong acids , as for example, sodium chloride. I t is t h e r e fore especially useful in water t r e a t m e n t for r e m o v ing b ica rbona te a lkal ini ty without s e r i o u s l y affecting the neu t r a l s a l t concent ra t ion .
There a r e a number of modifications of the c a t ion exchange ma te r i a l s mentioned above, but I do not bel ieve that they war r an t d i scuss ion h e r e . Ne i the r do I t h ink we n e e d d e a l h e r e wi th p r o c e s s e d c lay zeol i tes or with the so -ca l l ed " s u p e r g r e e n s a n d s , " because of t h e i r re la t ive ly l imi t ed use .
When we c o m e to an ion e x c h a n g e m a t e r i a l s , the products on the marke t a r e a l l synthet ic r e s i n s . In a l l c a s e s , as far as I know, the ac t iv i ty d e r i v e s f rom bas i c n i t rogen groups .
H e r e a g a i n w e have t h r e e p r i n c i p a l c l a s s e s ,
180
with numerous modifications and variants: 1. Medium capacity r e s i n s , such as the
guanidine -melamine-formaldehyde type. 2. High capacity, weakly basic resins, con
sisting principally of polyamine-aldehyde condensation products. These resins may be considered to be solid weak bases. They are very effective for removing strong acids such as sulfuric and hydrochloric, but only slightly effective with weak acids such as carbonic and si l icic. These res ins a r e the ones most commonly used in the ordinary de-ionization plant.
3. Strongly basic res ins . Within the last two or three years these quaternarized mater ia l s have become available. They a re industrially important because they are very effective for removing weak acids. This makes them particularly valuable for the direct removal of silica from water, a method which is more generally desirable than the ingenious but indirect method of converting the silica to hydro-fluosilicic acid and removing this with one of the weakly basic resins previously available. Since the new strongly basic resins have relatively low capacity for the strong acids, they are usually employed for removing silica or carbon dioxide in a separate step following the conventional cation and anion exchange t rea tment ; but in some ca se s , especially where the total anion load is not too great, they may be used in a conventional two-bed system.
How then can we summarize briefly our present position in the cation and anion exchange mater ia l picture, par t icular ly with respect to water t r ea t ment? As regards cation exchangers, the situation is good. We now have a whole range of mater ia ls from low capaci ty greensand through sulfonated coals, medium capacity resins, gel zeolites, ca r -boxylic resins, and high capacity, thermally stable sulfonated polystyrenes. All of these materials a re presently available at reasonable pr ices ; and the prices of some of the newest materials will probably be reduced when patents expire or demand increases .
The situation in anion exchangers is not so good. It is true that we now have weakly basic anion exchange resins with capacities comparable to those of the high capacity cation exchangers; and we have quaternarized strongly basic resins especially useful for removing s i l ica . But no anion exchange resin that I know of has the long life and ruggedness of the newer cation exchangers; none can be used at high tempera tu res ; and the price of all of them is high. This high pr ice , however, is admittedly not near ly as important in water t rea tment as in some other industrial applications where the res in is consumed rather rapidly. There is still a great deal of room for improvement in anion exchange m a t e r i a l s to r e m e d y the deficiencies just mentioned. When we have anion exchange mater ia ls comparable in operating characterist ics and price with the high capacity cation exchangers now avai l
able, we will have reached an attractive plateau in water treatment.
I have to take issue with Bauman's statement (3) in his excellent chapter in which it is found that "the resin is expected to serve for a period of 25-50 years in constant contact with the solvent and with no loss in weight and no physical or chemical degradation . . . . " I don't know of anyone in the operating end of the ion exchange field who really cherishes this exceedingly great expectation. For many years the producers of ion exchange materials , and the manufacturers of equipment in which they were used, penalized themselves ent irely needlessly by preaching that the ion exchangers would last indefinitely. They do not. Ion exchanger replacement is as necessary and inescapable an operat ing cost as a r e the chemicals and water used for regenerat ion. It happens that in water treatment the unit replacement cost is re latively small, but it is there. The equipment manufacturers finally awoke to the unsoundness of their own pronouncements. The most common practice now is to guarantee the ion exchanger either (a) for a specified volume of treated water or (b) against more than a specified percentage annual loss for a few years (commonly 5 per cent per year for 3 years in the case of the stable cation exchangers).
What of the future? Speculation of this sort is always hazardous, but frequently, as in this case, very intriguing.
What will probably happen first will be a continuation of what is happening right now, that is , a greater understanding and appreciation of the ion exchange resins we now have, and a more effective use of their unique properties. Two fairly recent examples are in point.
One is the utilization of the thermal stability of the sulfonated polystyrenes in a hot-process combination lime and cation exchange softening for boiler feed water. This process, which combines the m e r its of the two types of t r ea tment and overcomes their l imitations, promises to be one of the most important advances in boiler feed water t reatment in many years.
The other example utilizes the salt-split t ing p rope r t i e s of the strongly bas ic anion exchange resins. This suggested method, still in the experimental stage, replaces the bicarbonate alkalinity in the raw water with the relatively inocuous sodium chloride. The effective agent is a bed of strongly basic anion exchange res in in the chloride form, produced by regenerating with sodium chloride. A second bed of high capacity cation exchange resin in the sodium form replaces calcium and magnesium with sodium. The two beds may be in the same tank or in separate tanks . Sodium chloride is the r e -generant for both beds.
An obvious fundamental objection to the second example just ci ted is that the p r o c e s s is purely
181
one of replacement, not removal. At the present stage of experimentation, the salt consumption is also reported to be high. Both objections—assuming that the sal t consumption cannot be improved— would limit the utilization of the method, in spite of i ts attractive simplicity. I have cited this example pr imar i ly to i l lustrate the property of salt splitting, which I believe will be made use of more extensively in the future.
I think that g rea te r use will be made also of the color-removal properties of the ion exchangers in water treatment. It is not generally appreciated that certain of the ion exchangers, both cation and anion exchangers, have marked color-removal ability which is actually being used in the treatment of other l iquids. The co lo r - remova l property depends, of course, not only on the ion exchanger but on the nature and charge of the color body particle. Several American resin producers are now turning out res ins designed pr imari ly as adsorbents, not ion exchangers; and at least one such mater ia l (a low capacity anion exchange resin) has been used successfully in Europe for several years in the de-colorization of corn sugar liquors.
And it would not be surprising if some quite new cation and anion exchangers appeared in due course. My guess is that these will not come until after we have a better fundamental understanding of ion exchange and ion exchange materials than we do now. Our theory is just beginning to catch up with a century of remarkable empirical progress. After our theory does catch up, and after we begin to think inductively on the basis of a sound theoretical explanation of what has been done in the past, we may see entirely new vistas and horizons.
In this present period of trying to find the right theory to fit the data, I think somet imes that we are so anxious to fit the data into our more familiar physico-chemical theories and terminology that we lose the forest for the trees. I would like, if I may, to give you the same e lementary picture of ion-exchange that I gave las t week in Chicago during lunch with a patent at torney friend who is also a chemist . He asked me point blank to te l l him in plain words how ion exchange works. I told him that I didn't know, but that I would try to give him a s imple picture that I had found very helpful to my own thinking: "Any ion exchange compound may be r e garded as a m a t r i x or as a clamp holding an ion by adsorptive forces of a given magnitude. In the case of a cation exchanger, the. ion clamp is acidic; in the case of an anion exchanger, the ion clamp is basic. The adsorbed ion can be knocked out and replaced by a different ion under one of two circumstances. In one, the new ion is adsorbed preferentially, that is, there is a greater inherent attraction or 'affinity' between it and the adsorbent. In the second case, the attraction or 'affinity' of the new ion is equal to or less than that of the ion first ad
sorbed, in which case the adsorbed ion is pushed out by the sheer mass effect or 'mass action' of an excess of the new ions. If this second possibility were not true, we could not have reversibility of ion exchange. Ion exchange mater ia l s , like most other adsorbents, must be highly porous, to provide the large amount of surface and surface attractive forces required. An ion exchange material is a part icular kind of an adsorbent, with a mobile adsorbate. Like any other adsorbent used with aqueous solutions, it must be insoluble in water. "
I would like to pursue that line of thought a little further. The first practical ion exchangers, as we have seen, were the sodium alumino-silicates. Here we can picture our adsorbent, or ion clamp, as a highly porous alumino-silicic acid. An interesting fact is that silicic acid itself, in the form of silica gel, is an ion exchanger, though not a very good one. Wheaton (24) describes the preparat ion of a cation exchanger by the partial neutralization of a sodium silicate solution with an acid. The resu l t ing hydrosol sets in due course to a stiff hydrogel, which is dried, washed, and granulated. The product may be regarded as essentially a highly porous silica gel containing a very appreciable quantity of adsorbed sodium ions. It may actually be used to soften water, and, when exhausted, it may be r e generated with sodium chloride. The initial exchange capacity is quite low, however, and diminishes with subsequent regenerations.
If, however, the adsorbent is not pure silicic acid, but an alumino-silicic acid, both the exchange capacity and the stability of the ion exchanger are improved. This effect reaches a practical maximum when the ratio of Al2O3 to SiO2 is about 1:6 to 1:8; and in the manufacture of gel zeolites, the proportions of sodium silicate and sodium aluminate or aluminum sulfate are usually chosen which will p rovide an Al2O3:SiO2 ratio in the range just indicated.
Following the same line of thought with inorganic anion exchangers, I would like to point out merely that the highly porous gels of the oxides or hydroxides of several of the heavy metals have very appreciable anion exchange capacities (17).
With respec t to the ion exchange r e s ins , an excellent discussion of their structure and properties has been given by Bauman (4) and will not be r e peated or elaborated on here . It is heart i ly r e c ommended to anyone interested in the ion exchange field.
What about future physical methods of employing ion exchange mater ials? I think we are beginning to see a l ready what the t rend will be. The mixed bed of cation and anion exchangers offers many interesting possibilities. The problem here , of course, is regeneration. The "monobed" sys tem of Rohm & Haas is an ingenious solution. It is interesting to note that a recently issued United States patent (20), based on an application in Holland
182
in 1939 c l a i m s the pur i f ica t ion of an i m p u r e s u g a r solution by contacting it with a mixed bed of o r g a n i c cation and anion exchangers .
A n o t h e r i n d i c a t i o n of the fu tu re t r e n d i s the announcement by one of the equipment m a n u f a c t u r e r s of a con t inuous p r o c e s s for e i t h e r ca t ion or an ion e x c h a n g e . A g a i n , t h e r e i s the r e c e n t p a t e n t (8) c o v e r i n g a con t inuous s y s t e m in which t h e l iqu id is t r e a t e d w i th a s u s p e n s i o n of m i x e d ca t ion and an ion e x c h a n g e r s ; the t r e a t e d l iquid i s s e p a r a t e d f rom the m i x e d e x c h a n g e r s ; the cat ion e x c h a n g e r s a r e s e p a r a t e d f r o m the an ion e x c h a n g e r s t h r o u g h d i f f e r e n c e s i n t h e i r p h y s i c a l p r o p e r t i e s , s u c h a s density, s ize , shape, etc. ; the separa ted e x c h a n g e r s a r e c o n t i n u o u s l y r e g e n e r a t e d and r e t u r n e d t o t h e t r e a t i n g s y s t e m .
Since I have long had a decided l iking for c o n t inuous p r o c e s s e s o f a n y s o r t , w h e r e v e r they c a n be justified, this t rend in ion exchange is v e r y h e a r t ening. Poss ib ly I should say , a r e tu rn to th i s t r e n d , s ince the idea of continuous sys tems in ion exchange is any th ing but new. The ques t ion of j u s t i f i c a t i on in any pa r t i cu la r case is a lmos t a lways one of s i m ple e c o n o m i c ba lance : I t would obviously be diff i cult to find jus t i f ica t ion for a continuous househo ld softener or other s imi la r instal lat ion where a s m a l l cap i ta l outlay provides for an un in t e r rup ted supply of sof t w a t e r for a week or m o r e , and w h e r e t h e cos t of the l abor and s a l t for r e g e n e r a t i o n a r e un impor tan t . At the other e x t r e m e , however , w h e r e
conventional instal lat ions a r e ve ry la rge , and c y c l e s shor t , a continuous s y s t e m m a y make pos s ib l e i m portant economies in both capi ta l outlay and o p e r a t ing e x p e n s e .
B e f o r e I c l o s e , I wou ld l ike to p a y a w e l l -d e s e r v e d t r i b u t e to the p r o d u c e r s of ion exchange m a t e r i a l s and to the m a n u f a c t u r e r s of ion exchange equipment. They and the i r r e s e a r c h , deve lopment , and s a l e s o r g a n i z a t i o n s have p layed a m a j o r r o l e in c a r r y i n g the gospe l of the ion exchange idea and i ts a l m o s t unl imi ted potent ia l app l ica t ions .
And so we come to the end of our d i s c u s s i o n of what to me a r e the r e a l l y signif icant a s p e c t s of ion e x c h a n g e m a t e r i a l s and m e t h o d s of us ing t h e m in wate r t r e a t m e n t . I have not felt w a r r a n t e d in t a k ing t i m e t o d i s c u s s the s p e c i a l s i l v e r z e o l i t e and auxi l iary chemicals employed to de-sa l t s m a l l quan t i t i e s o f s e a w a t e r fo r d o w n e d a v i a t o r s o r s h i p w r e c k e d m a r i n e r s . N o r h a v e I fe l t j u s t i f i e d i n descr ib ing the magic of ion exchange in i ts mani fo ld n o n - w a t e r a p p l i c a t i o n s , which now run the e n t i r e gamut f r o m sugar juice purif icat ion, to the s e p a r a t ion o f n u c l e a r f i s s i o n p r o d u c t s , t o t h e r e c o v e r y of the a n t i b i o t i c " w o n d e r d r u g s , " to the r e l i e f of a c i d o s i s . The end i s no t even r e m o t e l y in s ight .
A n d i t i s w o r t h r e m e m b e r i n g t h a t i t w a s a l l s t a r t e d a c e n t u r y ago when J . T h o m a s Way found out what it was in soil that, in Mr . Huxtable's w o r d s , c o n v e r t e d l iquid m a n u r e t o w a t e r .
B I B L I O G R A P H Y
Ref. Ref.
1. Adams, B. A. , and Holmes, E. L . , J. Soc. Chem. I n c . , 54, 1-6T (1935).
2. Applebaum, S. B . , and Riley, R . , Ind. and Eng. C h e m . , 30, 80 (1938).
3. B a u m a n , W. C . , "Ion E x c h a n g e , " edited by F. Nachod, p. 46, New York, Academic P r e s s , I n c . , 1949.
4. Bauman, W. C . , ibid, pp. 45-75. 5. Behrman, A. S. , U. S. Patent 1, 515,007 (Oct. 8,
1927). 6. Bochringer, R. , and Gessler , A. E . , U. S. Patent
1,050,204 (Jan. 14, 1913). 7. Borrowman, G., U. S. Patent 1,793,670 (Feb. 24,
1931). 8. Col l ier , D. W., U. S. Patent 2, 563, 006 (Aug. 7,
1951). 9. D'Alelio, G. F . , U. S. Patent 2, 366, 006 (Dec. 26,
1945). 10. Eichhorn, E . , Poggendorfer Annalen der Physik
u. Chem. , 105, 126(1858). 11. Gans, R . , Jahrb. Knoigl. P r e u s s . Geol. Lande-
sanstalt Bergak, 1905-1906.
12. Gans. R. , U. S. Patent 1, 195, 923 (Aug. 22, 1916). 13. Halse , C. A . , Br i t i sh Patent 7119 (1902). 14. H a r m s , F . , German Patent 95, 447 (1896). 15. Hepburn, G. C . , U. S. Pa ten t 1,426,638 (Aug.
22, 1922). 16. Liebknecht, O. , U. S. Patents 2, 191, 060 (Feb. 20,
1940), 2,206,007 (June 25, 1940). 17. Liebknecht, O. , U. S. Patent 2, 155, 318 (April 18,
1939). 18. Rumpler , A . , Die Deutsche Zuckerindustr ie 26,
585 and 625 (1901). 19. Smit, P . , U. S. Patents 2, 191,063 (Feb. 20, 1940),
2,205, 635 (June 25, 1940). 20. Smit, P . , U. S. Patent 2, 564, 820 (Aug. 21, 1951). 21. Thompson, H.. S . , J. Roy. Agr. Soc. E n g . , 11,
68 (1850). 22. Way, J. T . , J . Roy. Agr. Soc. E n g . , 11, 313
(1850); 13, 123 (1852). 23. Wheaton, H. J . , U. S. Patent 1, 586, 764 (June 1,
1926). 24. Wheaton, H. J . , U. S. Patent 1, 100,803 (June 23,
1914).
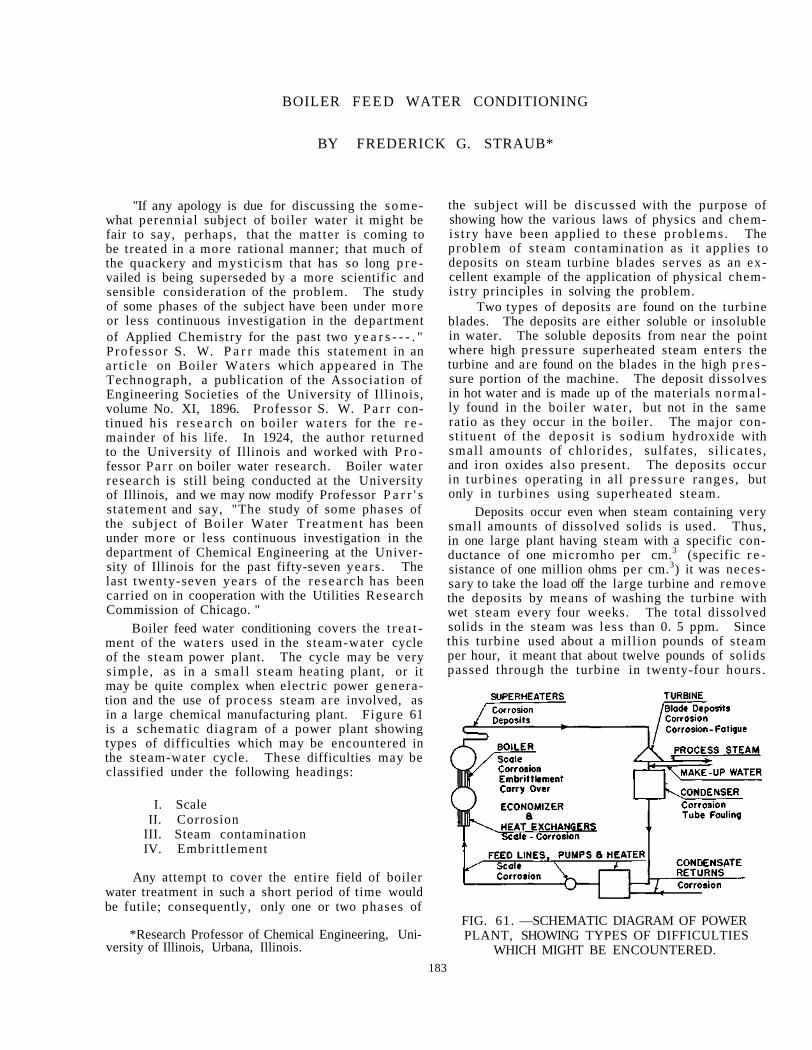
BOILER FEED WATER CONDITIONING
BY FREDERICK G. STRAUB*
"If any apology is due for discussing the somewhat perennial subject of boiler water it might be fair to say, perhaps, that the matter is coming to be treated in a more rational manner; that much of the quackery and myst icism that has so long p r e vailed is being superseded by a more scientific and sensible consideration of the problem. The study of some phases of the subject have been under more or less continuous investigation in the department of Applied Chemistry for the past two y e a r s - - - . " Professor S. W. P a r r made this statement in an ar t ic le on Boiler Waters which appeared in The Technograph, a publication of the Association of Engineering Societies of the University of Illinois, volume No. XI, 1896. Professor S. W. P a r r continued his r e s e a r c h on boiler waters for the r e mainder of his life. In 1924, the author returned to the University of Illinois and worked with P r o fessor Par r on boiler water research. Boiler water research is still being conducted at the University of Illinois, and we may now modify Professor P a r r ' s statement and say, "The study of some phases of the subject of Boiler Water Trea tment has been under more or less continuous investigation in the department of Chemical Engineering at the University of Illinois for the past fifty-seven years . The last twenty-seven years of the r e sea rch has been carried on in cooperation with the Utilities Research Commission of Chicago. "
Boiler feed water conditioning covers the t r ea t ment of the waters used in the s team-water cycle of the steam power plant. The cycle may be very s imple , as in a smal l s team heating plant, or it may be quite complex when electric power generation and the use of process steam are involved, as in a large chemical manufacturing plant. Figure 61 is a schematic diagram of a power plant showing types of difficulties which may be encountered in the steam-water cycle. These difficulties may be classified under the following headings:
I. Scale II. Corrosion
III. Steam contamination IV. Embritt lement
Any attempt to cover the entire field of boiler water treatment in such a short period of time would be futile; consequently, only one or two phases of
*Research Professor of Chemical Engineering, University of Illinois, Urbana, Illinois.
the subject will be discussed with the purpose of showing how the various laws of physics and chemis t ry have been applied to these problems. The problem of s team contamination as it applies to deposits on steam turbine blades serves as an excellent example of the application of physical chemistry principles in solving the problem.
Two types of deposits a re found on the turbine blades. The deposits are either soluble or insoluble in water. The soluble deposits from near the point where high pressure superheated steam enters the turbine and are found on the blades in the high p r e s sure portion of the machine. The deposit dissolves in hot water and is made up of the materials normal ly found in the boiler water , but not in the same ratio as they occur in the boiler. The major consti tuent of the deposit is sodium hydroxide with smal l amounts of chlor ides , sulfates, s i l icates , and iron oxides also present. The deposits occur in turbines operating in all p r e s su re ranges , but only in turbines using superheated s team.
Deposits occur even when steam containing very small amounts of dissolved solids is used. Thus, in one large plant having steam with a specific conductance of one micromho per cm.3 (specific r e sistance of one million ohms per cm.3) it was necessary to take the load off the large turbine and remove the deposits by means of washing the turbine with wet steam every four weeks. The total dissolved solids in the steam was less than 0. 5 ppm. Since this turbine used about a million pounds of s team per hour, it meant that about twelve pounds of solids passed through the turbine in twenty-four hours .
FIG. 61. —SCHEMATIC DIAGRAM OF POWER PLANT, SHOWING TYPES OF DIFFICULTIES
WHICH MIGHT BE ENCOUNTERED. 183
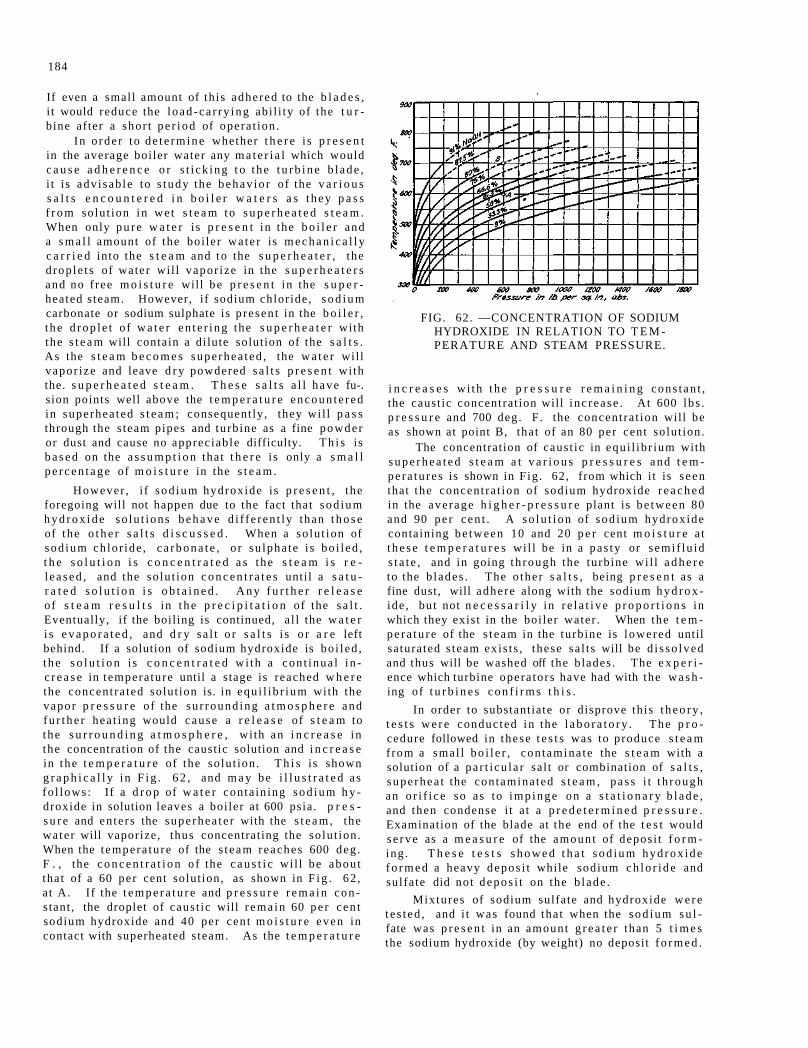
184
If even a small amount of th is adhered to the b l a d e s , i t would reduce the l oad -ca r ry ing abi l i ty of the t u r bine after a shor t pe r i od of opera t ion .
In o rde r to de t e rmine whether t h e r e i s p r e s e n t in the average boiler water any m a t e r i a l which would c a u s e a d h e r e n c e o r s t i ck ing t o the t u r b i n e b l ade , i t i s adv isab le to s tudy the behav io r of the v a r i o u s s a l t s e n c o u n t e r e d i n b o i l e r w a t e r s a s t hey p a s s f r o m solu t ion in wet s t e a m to s u p e r h e a t e d s t e a m . When only p u r e w a t e r i s p r e s e n t in the b o i l e r and a s m a l l amount of the boi ler wa te r is m e c h a n i c a l l y c a r r i e d into the s t e a m and to the s u p e r h e a t e r , the d rop le t s of water wi l l vapor ize in the s u p e r h e a t e r s and no f ree m o i s t u r e will be p r e s e n t in the s u p e r heated s team. However, if sodium chlor ide, s o d i u m carbonate or sodium sulphate is p resen t in the b o i l e r , t he d rop l e t of w a t e r en t e r ing the s u p e r h e a t e r with the s t e a m will contain a dilute solution of the s a l t s . As the s t e a m b e c o m e s supe rhea ted , the w a t e r wil l vapor ize and leave d r y powdered s a l t s p r e s e n t wi th the. s u p e r h e a t e d s t e a m . T h e s e s a l t s a l l have fu-. sion points well above the t e m p e r a t u r e e n c o u n t e r e d in superhea ted s t e a m ; consequent ly , they wil l p a s s through the s team pipes and turbine as a fine powder or dust and cause no apprec iable difficulty. T h i s is b a s e d on the a s s u m p t i o n that t h e r e is only a s m a l l p e r c e n t a g e of m o i s t u r e in the s t e a m .
However , i f sod ium hydroxide is p r e s e n t , the foregoing will not happen due to the fact that sod ium h y d r o x i d e so lu t ions b e h a v e d i f f e ren t ly than t h o s e of the o t h e r s a l t s d i s c u s s e d . When a so lu t ion of sod ium ch lor ide , c a r b o n a t e , o r su lpha te i s bo i l ed , t h e s o l u t i o n i s c o n c e n t r a t e d a s the s t e a m i s r e l e a sed , and the so lu t ion c o n c e n t r a t e s unti l a s a t u r a t e d s o l u t i o n i s o b t a i n e d . A n y f u r t h e r r e l e a s e of s t e a m r e s u l t s in t h e p r e c i p i t a t i o n of the s a l t . Eventually, if the boiling is continued, a l l the w a t e r i s e v a p o r a t e d , and d r y sa l t o r s a l t s i s o r a r e left behind. If a solution of sodium hydroxide is bo i l ed , t h e s o l u t i o n i s c o n c e n t r a t e d wi th a con t inua l i n c r e a s e in tempera ture until a stage is reached w h e r e the concent ra ted solut ion is. in equ i l ib r ium with the vapor p r e s s u r e of the su r round ing a t m o s p h e r e and f u r t h e r hea t ing would cause a r e l e a s e of s t e a m to the s u r r o u n d i n g a t m o s p h e r e , wi th an i n c r e a s e i n the concentration of the caustic solution and i n c r e a s e in the t e m p e r a t u r e of the solut ion . T h i s is shown g r a p h i c a l l y in F i g . 6 2 , and m a y be i l l u s t r a t e d a s fo l lows : If a d r o p of w a t e r conta in ing sod ium h y droxide in solution leaves a boi ler at 600 psia. p r e s s u r e and en te r s the supe rhea te r with the s t e a m , the wate r will vaporize, thus concentrating the so lu t ion . When the t empera tu re of the s t eam reaches 600 deg . F . , the c o n c e n t r a t i o n of the c a u s t i c wi l l be abou t that of a 60 per cent solut ion, as shown in F i g . 62 , at A. If the t e m p e r a t u r e and p r e s s u r e r e m a i n c o n stant , the droplet of caus t ic will r ema in 60 pe r cen t sodium hydroxide and 40 per cent m o i s t u r e even in contact with superheated s team. As the t e m p e r a t u r e
FIG. 62. —CONCENTRATION OF SODIUM HYDROXIDE IN RELATION TO T E M PERATURE AND STEAM PRESSURE.
i n c r e a s e s wi th t h e p r e s s u r e r e m a i n i n g cons tan t , the caust ic concentrat ion will i nc rease . At 600 lbs . p r e s s u r e and 700 deg. F . the concent ra t ion will be as shown at point B, that of an 80 per cent solut ion.
The concentration of caus t ic in equi l ib r ium with s u p e r h e a t e d s t e a m a t v a r i o u s p r e s s u r e s and t e m pe ra tu re s is shown in F ig . 62, from which i t is s een that the concent ra t ion of sodium hydroxide r e a c h e d in the average h i g h e r - p r e s s u r e plant is be tween 80 and 90 pe r cen t . A so lu t i on of sod ium hydrox ide containing be tween 10 and 20 p e r cent m o i s t u r e a t t h e s e t e m p e r a t u r e s wi l l be in a pas ty or semi f lu id s t a t e , and in going th rough the turbine wi l l a d h e r e to the b lades . The o the r s a l t s , being p r e s e n t as a fine dust, will adhere along with the sodium h y d r o x ide , but not n e c e s s a r i l y in r e l a t i v e p r o p o r t i o n s in which they exist in the boi ler water . When the t e m p e r a t u r e of the s t e a m in the turbine is l owered until sa turated s team exis t s , these sa l t s will be d i s so lved and thus will be washed off the blades . The e x p e r i ence which turbine opera tors have had with the w a s h ing of t u r b i n e s c o n f i r m s t h i s .
In order to substantiate or disprove th is t h e o r y , t e s t s w e r e conducted in the l a b o r a t o r y . The p r o cedure followed in these t e s t s was to produce s t e a m f rom a smal l bo i l e r , con tamina te the s t e a m with a solution of a pa r t i cu l a r sal t or combination of s a l t s , supe rhea t the con tamina ted s t e a m , pa s s i t t h rough an o r i f i c e so as to i m p i n g e on a s t a t i o n a r y b l a d e , and then condense i t a t a p r e d e t e r m i n e d p r e s s u r e . Examination of the blade at the end of the t e s t would s e rve as a m e a s u r e of the amount of depos i t f o r m ing . T h e s e t e s t s s h o w e d t h a t s o d i u m hyd rox ide f o r m e d a heavy depos i t while sodium c h l o r i d e and sulfa te did not depos i t on the b lade .
Mixtures of sodium sulfate and hydroxide w e r e t e s t ed , and i t was found tha t when the s o d i u m s u l fate was p r e s e n t in an amount g r e a t e r than 5 t i m e s the sodium hydroxide (by weight) no deposit f o r m e d .
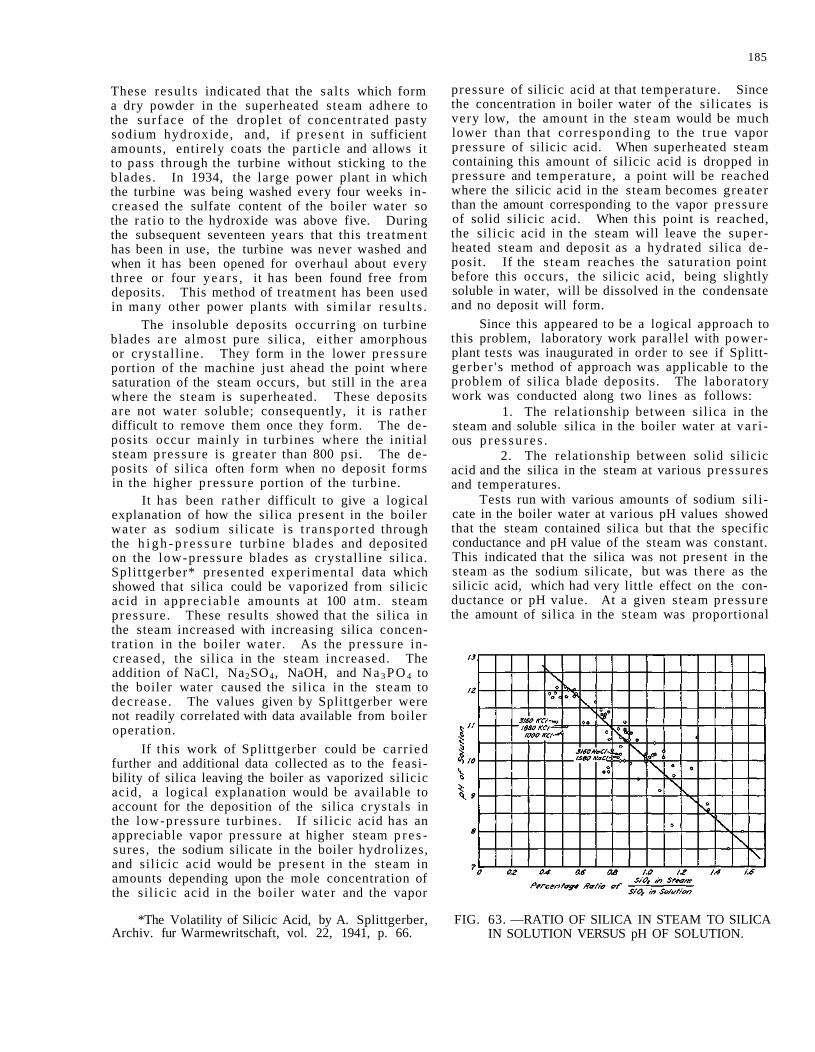
185
These resul ts indicated that the sa l ts which form a dry powder in the superheated steam adhere to the surface of the droplet of concentrated pasty sodium hydroxide , and, if p r e sen t in sufficient amounts, entirely coats the particle and allows it to pass through the turbine without sticking to the blades. In 1934, the large power plant in which the turbine was being washed every four weeks increased the sulfate content of the boiler water so the ra t io to the hydroxide was above five. During the subsequent seventeen years that this t reatment has been in use, the turbine was never washed and when it has been opened for overhaul about every three or four yea r s , it has been found free from deposits. This method of treatment has been used in many other power plants with s imilar resu l t s .
The insoluble deposits occurring on turbine blades a r e almost pure silica, ei ther amorphous or crystal l ine. They form in the lower p ressu re portion of the machine just ahead the point where saturation of the steam occurs, but still in the a rea where the steam is superheated. These deposits a re not water soluble; consequently, it is ra ther difficult to remove them once they form. The deposits occur mainly in turbines where the initial steam pressure is greater than 800 psi. The deposits of silica often form when no deposit forms in the higher p ressure portion of the turbine.
It has been ra ther difficult to give a logical explanation of how the silica present in the boiler water as sodium silicate is t ranspor ted through the h i g h - p r e s s u r e turbine blades and deposited on the low-pressure blades as crystal l ine silica. Spli t tgerber* presented experimental data which showed that silica could be vaporized from silicic acid in apprec iab le amounts at 100 a tm. steam pressure . These results showed that the silica in the steam increased with increasing silica concentrat ion in the boiler water. As the p ressure increased, the silica in the steam increased. The addition of NaCl, Na2SO4 , NaOH, and Na 3 PO 4 to the boiler water caused the silica in the steam to decrease . The values given by Splittgerber were not readily correlated with data available from boiler operation.
If this work of Splittgerber could be car r ied further and additional data collected as to the feasibility of silica leaving the boiler as vaporized silicic acid, a logical explanation would be available to account for the deposition of the silica crystals in the low-pressure turbines. If silicic acid has an appreciable vapor pressure at higher steam p r e s sures, the sodium silicate in the boiler hydrolizes, and sil icic acid would be present in the steam in amounts depending upon the mole concentration of the si l icic acid in the boiler water and the vapor
*The Volatility of Silicic Acid, by A. Splittgerber, Archiv. fur Warmewritschaft, vol. 22, 1941, p. 66.
pressure of silicic acid at that temperature. Since the concentration in boiler water of the silicates is very low, the amount in the s team would be much lower than that corresponding to the t rue vapor pressure of silicic acid. When superheated steam containing this amount of silicic acid is dropped in pressure and temperature, a point will be reached where the silicic acid in the steam becomes greater than the amount corresponding to the vapor pressure of solid silicic acid. When this point is reached, the silicic acid in the steam will leave the superheated steam and deposit as a hydrated silica deposit . If the s team reaches the saturation point before this occurs, the silicic acid, being slightly soluble in water, will be dissolved in the condensate and no deposit will form.
Since this appeared to be a logical approach to this problem, laboratory work parallel with power-plant tests was inaugurated in order to see if Splittgerber ' s method of approach was applicable to the problem of silica blade deposits. The laboratory work was conducted along two lines as follows:
1. The relationship between silica in the steam and soluble silica in the boiler water at va r i ous p r e s s u r e s .
2. The relationship between solid silicic acid and the silica in the steam at various p ressures and temperatures.
Tests run with various amounts of sodium si l i cate in the boiler water at various pH values showed that the steam contained silica but that the specific conductance and pH value of the steam was constant. This indicated that the silica was not present in the steam as the sodium silicate, but was there as the silicic acid, which had very little effect on the conductance or pH value. At a given steam pressure the amount of silica in the steam was proportional
FIG. 63. —RATIO OF SILICA IN STEAM TO SILICA IN SOLUTION VERSUS pH OF SOLUTION.
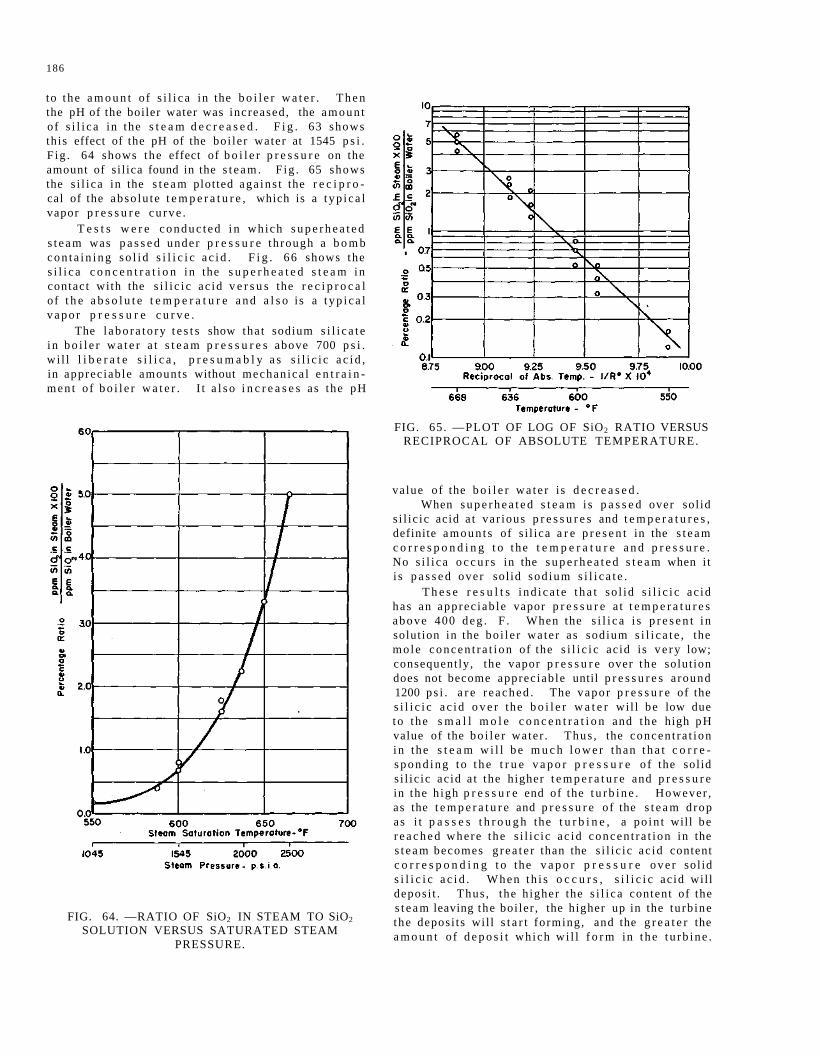
186
to the a m o u n t of s i l i c a in the b o i l e r w a t e r . T h e n the pH of the boiler water was increased , the a m o u n t of s i l i c a in the s t e a m d e c r e a s e d . F i g . 63 shows this effect of the pH of the boi le r water at 1545 p s i . F ig . 64 shows the effect of b o i l e r p r e s s u r e on the amount of s i l ica found in the s t e a m . F ig . 65 shows the s i l i ca in the s t e a m plotted aga ins t the r e c i p r o cal of the abso lu te t e m p e r a t u r e , which is a t yp i ca l vapor p r e s s u r e c u r v e .
T e s t s w e r e c o n d u c t e d i n which s u p e r h e a t e d s t e a m was p a s s e d under p r e s s u r e th rough a b o m b c o n t a i n i n g s o l i d s i l i c i c a c i d . F i g . 66 shows the s i l i c a c o n c e n t r a t i o n in the s u p e r h e a t e d s t e a m in contact with the s i l i c i c ac id v e r s u s the r e c i p r o c a l of t h e a b s o l u t e t e m p e r a t u r e a n d a l s o i s a t y p i c a l v a p o r p r e s s u r e c u r v e .
The l a b o r a t o r y t e s t s show tha t sodium s i l i c a t e i n b o i l e r w a t e r a t s t e a m p r e s s u r e s above 700 p s i . wi l l l i b e r a t e s i l i c a , p r e s u m a b l y a s s i l i c i c a c i d , in apprec iab le amounts without mechan ica l e n t r a i n -m e n t o f b o i l e r w a t e r . I t a l s o i n c r e a s e s as the pH
FIG. 64. —RATIO OF SiO2 IN STEAM TO SiO2 SOLUTION VERSUS SATURATED STEAM
PRESSURE.
FIG. 65. —PLOT OF LOG OF SiO2 RATIO VERSUS RECIPROCAL OF ABSOLUTE TEMPERATURE.
value of the b o i l e r w a t e r i s d e c r e a s e d . When s u p e r h e a t e d s t e a m i s p a s s e d over sol id
s i l ic ic acid a t var ious p r e s s u r e s and t e m p e r a t u r e s , definite a m o u n t s of s i l ica a r e p r e s e n t in the s t e a m c o r r e s p o n d i n g t o the t e m p e r a t u r e a n d p r e s s u r e . No s i l i ca o c c u r s in the s u p e r h e a t e d s t e a m when i t i s p a s s e d over sol id sod ium s i l i c a t e .
T h e s e r e s u l t s i nd i ca t e t h a t so l id s i l i c i c ac id has an apprec iab le vapor p r e s s u r e a t t e m p e r a t u r e s above 400 d e g . F . When the s i l i c a i s p r e s e n t i n solution in the bo i l e r wa te r as sodium s i l i c a t e , the mole c o n c e n t r a t i o n of the s i l i c i c acid is v e r y low; consequently, the vapor p r e s s u r e over the solut ion does not become apprec iable until p r e s s u r e s a round 1200 p s i . a r e r e a c h e d . The vapor p r e s s u r e of the s i l i c i c a c i d o v e r the b o i l e r w a t e r wi l l be low due to the s m a l l m o l e c o n c e n t r a t i o n and the high pH value of the b o i l e r water . Thus , the concen t ra t ion i n the s t e a m w i l l b e m u c h l o w e r than t h a t c o r r e s p o n d i n g to t h e t r u e v a p o r p r e s s u r e o f the sol id s i l ic ic ac id a t the higher t e m p e r a t u r e and p r e s s u r e in the h igh p r e s s u r e end of the t u r b i n e . However , as the t e m p e r a t u r e and p r e s s u r e of the s t e a m drop as i t p a s s e s t h r o u g h the t u r b i n e , a po in t will be r e a c h e d where the s i l i c ic ac id concen t r a t ion in the s t e a m becomes g r ea t e r than the s i l i c ic ac id content c o r r e s p o n d i n g t o the v a p o r p r e s s u r e o v e r sol id s i l i c i c a c i d . When t h i s o c c u r s , s i l i c i c ac id wil l deposi t . Thus , the h igher the s i l i c a content of the s t e a m leaving the boi ler , the higher up in the tu rb ine the deposi ts wil l s t a r t forming, and the g r e a t e r the a m o u n t of d e p o s i t which wi l l f o r m in t h e t u rb ine .
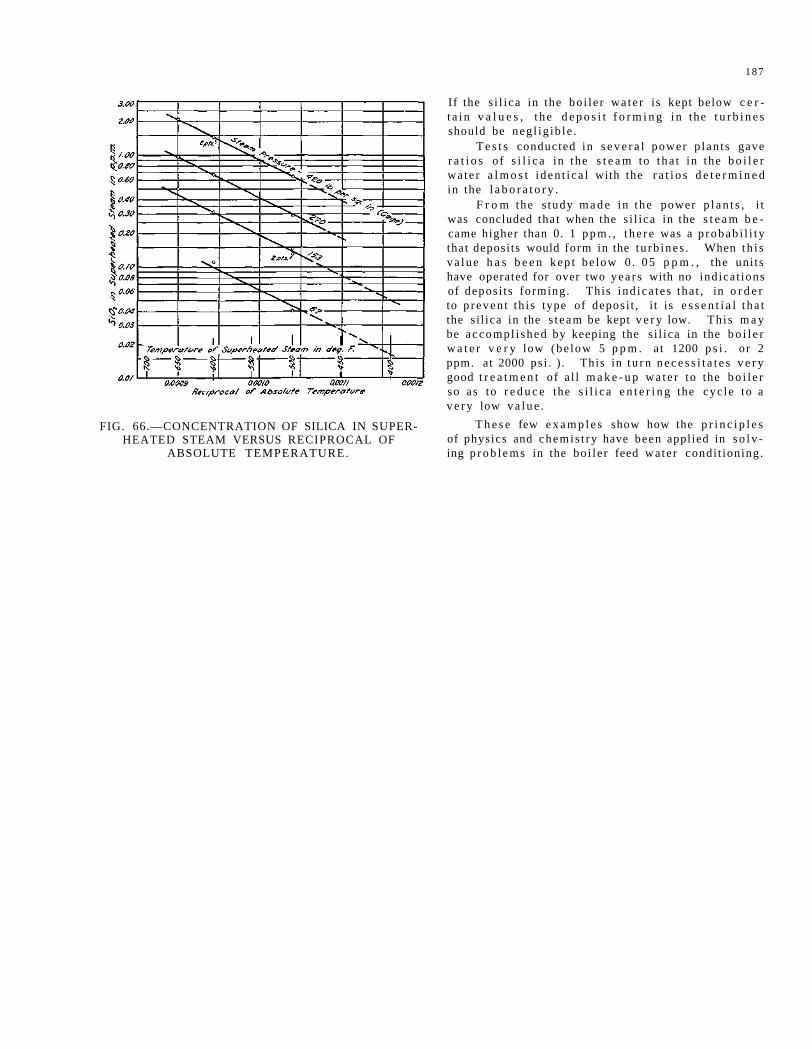
187
FIG. 66.—CONCENTRATION OF SILICA IN SUPERHEATED STEAM VERSUS RECIPROCAL OF
ABSOLUTE TEMPERATURE.
If the s i l i ca in the bo i l e r wa te r is kept below c e r t a i n v a l u e s , t h e d e p o s i t f o r m i n g i n the t u r b i n e s should be neg l ig ib le .
T e s t s conducted in s e v e r a l power p lan t s gave r a t i o s of s i l i c a in the s t e a m to t ha t in the b o i l e r wa te r a l m o s t i den t i ca l with the r a t i o s d e t e r m i n e d in the l a b o r a t o r y .
F r o m the s tudy m a d e in the power p l a n t s , i t was concluded that when the s i l i ca in the s t e a m b e came higher than 0. 1 p p m . , t h e r e was a p robab i l i t y that deposits would form in the t u rb ines . When t h i s v a l u e h a s b e e n kep t be low 0 . 05 p p m . , the uni ts have operated for over two yea r s with no indica t ions of depos i t s forming. This ind ica te s tha t , in o r d e r to p r even t th i s type of deposi t , i t is e s s e n t i a l t ha t the s i l ica in the s t eam be kept v e r y low. Th i s m a y be accompl i shed by keeping the s i l ica in the b o i l e r w a t e r v e r y low (be low 5 p p m . a t 1200 p s i . or 2 ppm. at 2000 ps i . ) . This in t u r n n e c e s s i t a t e s v e r y good t r e a t m e n t of a l l m a k e - u p w a t e r to the b o i l e r so as to r e d u c e the s i l i c a e n t e r i n g the cyc le to a v e r y low v a l u e .
T h e s e few e x a m p l e s show how the p r i n c i p l e s of physics and chemis t ry have been applied in s o l v ing p r o b l e m s in the bo i le r feed wate r condi t ioning.
R A D A R — W E A T H E R
P r o g r a m Chai rman GLEN E. STOUT
Radar-Weather
All s e s s i o n s wil l be held a t A l l e r ton E s t a t e .
M O N D A Y , OCTOBER 1
Afternoon Sess ion A. C. B e m i s , P r e s i d i n g
2:00 " C e n s u s o f R a d a r W e a t h e r P r o j e c t s , " A. C. B e m i s
3:20 " N R L ' s R 5 D , " I . Katz 3:30 "The Joint Commiss ion on Radio Me teo r
ology, " J. S. M a r s h a l l 3:45 " D e t e r m i n a t i o n of Cloud B a s e s a n d Tops
by R a d a r , " W. Gould 4:15 Discuss ion
* * *
Evening Sess ion H. R. B y e r s , P r e s i d i n g
7:15 "Details of the Production Model AN/CPS-9 R a d a r , " W. J . Schiff and
E . L . W i l l i a m s , J r . 7:30 "Comparison of Average Radar Signal Inten
sity with Rainfall R a t e , " P. M. Austin 8:00 - "Quant i ta t ive Rada r Rainfall P r o b l e m s , "
G. W. F a r n s w o r t h 8:30 " M e a s u r e m e n t of Po in t and A r e a l Rainfall
by R a d a r , " D. Jones and H. Hiser 9:00 Di scuss ion
9:30 Informal ge t - t oge the r
Radar-Weather
TUESDAY, OCTOBER 2
Morning Sess ion W. L. E v e r i t t , P r e s i d i n g
8:30 "Reduction of Fluctuations in Echoes f rom Randomly D i s t r i b u t e d S c a t t e r e r s , " J. S. M a r s h a l l and W. Hitschfeld
9:00 " T h e P r e s e n t U s e s and L i m i t a t i o n s o f R a s a p h , " A . F l e i s h e r
9:30 "Microwave Scattering frorn Nonspher ica l H y d r o m e t e o r s , " D. At las
10:00 "Effects of At tenuat ion on Range P e r fo rmance of Radar Set A N / C P S - 9 , " D. Swingle
10:30 D i scus s ion
Afternoon Sess ion J . S. M a r s h a l l , P r e s i d i n g
1:30 "Theory of Radar Upper Band," R. Wexler 2:00 " A i r b o r n e R a i n d r o p Size M e a s u r e m e n t
and Instrumental Techn iques , " R. M. Cunningham
2:30 "Results of Raindrop-Size M e a s u r e m e n t s , " R. Boucher
3:00 Discuss ion
3:30 Inspection of M. I. T. 's B-17 at Univers i ty of I l l inois A i r p o r t
* * *
5:30 Recept ion, Il l ini Union Building
6:30 Banquet, Illini Union Building
Radar-Weather WEDNESDAY, OCTOBER 3
Morning Sess ion
Panel Discuss ions : 8:30 a . m . - 11:30 a . m .
1. Topic: New Developments in Using Radar for Hurricane Tracking
Moderator: R. C. Jo rgensen
Panel Members: G. Dunn M. Latour J. Anderson
2. Topic: Suggested F ie lds of Study-
Moderator: A. C. B e m i s
Open Discuss ion
CENSUS OF RADAR-WEATHER PROJECTS
BY A. C. BEMIS*
The summary presented here was compiled from the remarks made by Mr. Bemis at the conference and the replies to a questionnaire sent out by Mr. G. E. Stout.**
WEATHER-RADAR RESEARCH PROJECTS
Microwave Propagation
1. Cen t r a l Radio Propagat ion Laboratory, National Bureau of Standards (H. Bussey)..
2. Cruft Labora tory , Harvard University, Office of Naval Research (H. R. Mimno).
3. Electr ical Engineering Research Laborato r i e s , University of Texas , Office of Naval Re search (J. R. Gerhardt).
4. Naval Electronics Laboratory, San Diego (L. J. Anderson).
5. Wave Propagation Research Branch, Naval Research Laboratory, Anacostia (M. Katzin).
General Weather Radar
6. Geophysics Research Division Air Force , Cambridge Research Center (D. Atlas).
7. MacDonald Physics Laboratory, McGill University, U. S. Air Force and DRB, CAN (J. S. Marshall).
8. Meteorological Branch, Signal Corps Engineering Laboratories (W. B. Gould).
9. Weather Radar Research, Massachusetts Institute of Technology, Signal Corps Engineering Laboratories (A. C. Bemis).
Cloud Physics , Hydrology, and Storm Detection
10. Cavendish Laboratory, Cambridge Universi ty, England (J. E. N. Hooper).
11. Division of Radio Physics, Commonwealth Scientific and Industrial Resea r ch Organization, Chippendale, Australia (E. G. Bowen).
12. Cornell Aeronautical Laboratory, Office of Naval Research (S. Chapman).
13. Engineering and Industr ial Experiment Station, University of Florida (M. H. Latour).
*Project Supervisor, Weather-Radar Project, Massachusetts Institute of Technology, Cambridge, Mass.
**Meteorologist, Illinois State Water Survey, Urbana, Illinois.
14. Mt. Washington Observatory, Harvard University, Air Force (R. Wexler).
15. Physics Department, New Mexico School of Mines (E. J. Workman).
16. Project Cirrus, General Electric Research Laboratory (I. Langmuir).
17. State Water Survey, University of Illinois (G. E. Stout).
18. Woods Hole Oceanographic Institution (A. H. Woodcock).
WEATHER-RADAR DEVELOPMENT PROJECTS
Instrumentation
19. Airborne Instruments Laboratories, Office of Naval Research (R. W. Miller) .
20. Air Weather Service , Air Force (G. A. Guy).
21. American Airlines and Air Transport Association, Office of Naval Research and National Advisory Committee for Aeronautics (F. C. White and D. B. Talmage).
22. Cook Research Laboratories, Air Materiel Command (J. C. Bellamy).
23. General Electric Company, Air Materiel Command (D. S. Davidson).
24. Glenn L. Mart in Company, Air Force (E. F. Hill).
25. Raytheon Manufacturing Company, Signal Corps Engineering Laboratories (E. L. Williams).
26. Weather Radar Branch, Signal Corps Engineering Laboratories (W. J. Schiff).
27. G e n e r a l E l e c t r i c Company, E lec t ro -Mechanical Division.
Application
28. Air Weather Service, 16th Weather Squadron, Chanute Air Force Base (H. W. Silk).
29. Dow Chemical Company, Freeport, Texas (R. C. Jorgensen).
30. A. H. Glenn and Associates, New Orleans, La. (A. H. Glenn).
31. Public Service Co. of Northern Illinois, 193
194
a n d C o m m o n w e a l t h E d i s o n C o . ( J . L . Wysong, H. L . G a r t o n ) .
32. U. S. W e a t h e r B u r e a u .
* * *
1. Cent ra l Radio Propaga t ion Labo ra to ry , Nat ional B u r e a u of S t a n d a r d s
H. B u s s e y
2 . Cruft L a b o r a t o r y , H a r v a r d U n i v e r s i t y H. R. M i m n o
The Office o f N a v a l R e s e a r c h i s sponso r ing mathemat ica l investigations of reflectivity and p r o p agat ion a t microwave frequencies . Some l a b o r a t o r y work is conducted.
3 . Organ i za t i on : U n i v e r s i t y of T e x a s , E l e c t r i c a l E n g i n e e r i n g R e s e a r c h L a b o r a t o r y , Aus t in , T e x a s
N a m e : T h e P r o p a g a t i o n C h a r a c t e r i s t i c s o f C e n t i m e t e r and M i l l i m e t e r R a d i o Waves
D i r e c t o r : A. W. S t r a i t on Sup. Agency : Office of Nava l R e s e a r c h , Con
t r ac t Nonr. 375 (01), fo rmer ly N5or i -136 POI P u r p o s e : To study t h e t r a n s m i s s i o n c h a r a c t e r
i s t i c s o f c e n t i m e t e r and m i l l i m e t e r waves t h rough the lower a t m o s p h e r e and to d e t e r mine , through m e a s u r e m e n t s of the angle-of -a r r i v a l o f r a d i o e n e r g y and h e i g h t gain and distance prof i les , the degree to which r e f r a c tion, sca t te r ing , and reflection f rom e leva ted layers a r e effective in producing the o b s e r v e d signal s t rength and phase dis t r ibut ion.
4 . Naval E l e c t r o n i c s Labo ra to ry , San Diego, C a l i fornia
L. J . A n d e r s o n
5. Organization: Naval R e s e a r c h Labo ra to ry , Navy D e p t . , Wash ing ton 20, D. C.
N a m e : Wave P r o p a g a t i o n R e s e a r c h B r a n c h D i r e c t o r : M a r t i n Katz in P u r p o s e : F u n d a m e n t a l r e s e a r c h i n r a d i o wave
p ropaga t ion a s r e l a t e d t o r a d a r
Genera l Descr ip t ion : This group i s i n t e r e s t e d in the o v e r - a l l p r o p a g a t i o n p r o b l e m . I t i n v e s t i ga t e s such phenomena a s sea r e t u r n , t a r g e t p r o p e r t i e s , r a d a r wea the r , and r a d a r r e f r ac t ion . The p r i m a r y i n v e s t i g a t i n g t o o l i s a f ly ing l a b o r a t o r y , an R5D, equ ipped wi th four r a d a r s on d i f fer e n t w a v e l e n g t h s f r o m 3 t h r o u g h 20 c m . T h e s e a r e e s p e c i a l l y d e s i g n e d r a d a r s which can r e c o r d pu l se to pulse r e t u r n s from t a r g e t s . The R5D wil l have a 15-foot v e r t i c a l r e t r a c t a b l e m e t e o r o l o g i c a l m a s t which con ta ins i n s t r u m e n t a t i o n for m e a s u r ing d r o p s i z e and d i s t r i b u t i o n in r a i n , t o t a l l iquid
w a t e r in ra in , d r y b u l b - , wet b u l b - , and dew point t e m p e r a t u r e s . I t i s a n t i c i p a t e d t h a t the i n s t a l l a t ion of this r ada r and the me teoro log ica l equ ipmen t wi l l be comple ted in 1952, when co l l ec t ion of data wi l l begin.
6 . Geophysics R e s e a r c h Division, A i r F o r c e C a m b r i d g e R e s e a r c h Cen te r
D i r e c t o r : David A t l a s
Work in the Tropospher ic Branch of the A t m o s -p h e r i c Ionization L a b o r a t o r y of the Geophys ics R e s e a r c h Division has been d i rec ted toward the use of e l e c t r o m a g n e t i c r a d i a t i o n s i n s tudy ing the lower a t m o s p h e r e with p a r t i c u l a r emphas i s in the m i c r o wave region and i ts use in the observat ion and study of c louds and p r e c i p i t a t i o n .
I . I n t e r p r e t a t i v e S t u d i e s : a i m e d a t l e a r n i n g the n a t u r e o f m i c r o w a v e r e f l e c t i o n s f rom va r ious types of a t m o s p h e r i c h y d r o m e t e o r s .
A. The i n t e r p r e t a t i o n of m i c r o w a v e r e f l e c t ions f rom ra in fa l l .
B . The m i c r o w a v e d e t e r m i n a t i o n o f p a r t i cle s ize d i s t r i b u t i o n s in c louds and p r e c ip i ta t ion .
C. The s t a t i s t i c a l n a t u r e of m i c r o w a v e r e f l ec t ions f r o m c louds and p r e c i p i t a t i o n .
D. Microwave s c a t t e r i n g f rom n o n s p h e r i c a l h y d r o m e t e o r s .
II. Cloud Phys ics Studies : d i r ec t ed at the in ter p r e t a t i o n of m i c r o w a v e r e f l ec t ions in t e r m s of the physical c h a r a c t e r i s t i c s and p r o c e s s e s within clouds and precipi ta t ion.
A. 1 cm. m i c r o w a v e in s t rumen ta t ion m a k e s i t p o s s i b l e to d e t e c t s o m e c louds in the e a r l y s t a g e s of d e v e l o p m e n t .
B . I n s t rumen t s for use with r a d a r a r e pu lse i n t e g r a t o r s , pulse f luctuat ion a n a l y z e r s , facs imi le r e c o r d e r , c a m e r a s , e t c .
C. Some special ins t ruments a r e Zenith s c a n ning antenna s y s t e m , i n s t r u m e n t s for the d e t e r m i n a t i o n of po l a r i za t i on c h a r a c t e r i s t i c s , a n d a c c u r a t e s i g n a l m e a s u r i n g equipment .
7 . Organizat ion: S t o r m y Weather R e s e a r c h G r o u p , McGil l Un ive r s i t y , Mon t r ea l , Canada
D i r e c t o r : Dr . J . S . M a r s h a l l , A s s o c i a t e P r o f e s so r of P h y s i c s
Sup. Agency: Defence Resea rch Board of Canada (Grant No. 99) which proyides equ ipmen t and maintenance only.
P u r p o s e : Study of p r e c i p i t a t i o n a n d cloud by r a d a r and o ther p h y s i c a l m e a n s
195
General Description: An AN/TPS-10A radar is operated at the Montreal Airport, Dorval, which, incidentally, renders a happy liaison with the Meteorological Service of Canada possible. The radar is used for quantitative analysis of precipitation, leading to knowledge of structure and formation.
At present , r adar studies include investigations of depolarization and fluctuations in the radar return, and of smoothing procedures. The radar observations suggest allied experiments in the laboratory and in the field. A new method of finding cloud heights by stereoscopic photographs has r e cently been developed. In the laboratory, experiments on the microphysical processes of precipitation are carried out; some of these are the studies of coalescence, evaporation and heat transfer among rain, snow and cloud part icles. Velocities of fall and the size distribution of snow particles are being investigated.
The present project at McGill is a continuation of the original "Stormy Weather" research project, which began in Ottawa in 1945 as part of the Canadian Army Operational Research Group. Results have been reported in eight CAORG repor ts , five M.S. and three Ph. D. theses .
8. Meteorological Branch, Signal Corps Engineering Laboratories
W. B. Gould
Sponsors several contracts with universities in determining the importance and application of radar in meteorology. Assisted with the development of the CPS-9.
9. Organization: Massachusetts Institute of Technology, Cambridge, Massachusetts
Director: A. C. Bemis Sup. Agency: Signal Corps Engineering L a b
o ra to r i e s , Be lmar , New Jersey , Contract No. DA-36-039-sc-124
Purpose: To explore the applications of radar in meteorology, to improve weather radar techniques, and to learn to in terpre t more completely all types of weather information which may be contributed by radar sys tems.
Genera l Descr ip t ion: The project operates four radar systems: AN/CPS-9 (XE-2), SCR-615-B, AN/TPS-10A, SCR-584.
The CPS-9 and SCR-615 are carefully cal ibrated and equipped with Pulse Integrators for meas uring weather echo intensit ies. In addition, they can be equipped with a Box Car Generator, Rasaph, individual pulse recording equipment, and other devices for studying in accurate detail the fine s t ructure of weather echoes. Autocorrelation and spect rum analysis techniques are both used.
All r adars are equipped with automatic came ra s .
B-17 No. 9281 is a thoroughly instrumented aircraft with both standard and research meteorological instruments, and has been making weather flights in conjunction with radar observations for five yea r s .
A spec ia l , h igh-sens i t iv i ty rain gage, rain drop size equipment, and radar winds aloft gear are operated 12 mi les from our main radar site.
At present we are concentrating on (1) a study of the basic nature of weather echoes, their aver age intensity and pulse-to-pulse variations; (2) the relation between the s t ructure of weather echoes as presented on scopes , and the s torm structure causing them.
10. Cavendish Laboratory, Cambridge University, England
J. E. N. Hooper
Radar is used as a tool in cloud physics studies.
11. Division of Radio Physics, Commission of Scientific and Industrial Research, Australia
Radar is used to study precipitation pat terns, "bright band" effects, e t c . , and the observations integrated into cloud physics studies.
12. Organization: Cornell Aeronautical Laboratory, Inc., 4455 Genesee St., Buffalo, N. Y.
Name: Thundercloud Electrification Studies Sup. Agency: Office of Naval Research, N6ori-
119, Task Order 13, Geophysics Branch, Code No. NR082056
Purpose: Four p r ime phases of this project a r e : e l ec t r i c field measu remen t s , snow storms, snow electrification, and rain drop electrification.
Equipment: An SG-6 (10 cm. surface search radar) was used to spot snow flurries and get ready for radiosonde re leases . Used radiosonde equipment, rain drop tube, specially modified radiosonde equipment; snow meter, DC amplifiers, etc. The final r e port is now in progress .
13. Organization: Engineering and Industrial Experiment Station, University of Florida
Director: M. H. Latour Supported by: State of Florida funds. ' Equip
ment on Bai lment Contract from the Air Materiel Command.
Purpose: A. Investigation of rainfall intensity B. Investigation of microwave attenuation C. Study of subtropical weather
Facilities: The radar equipment available consis ts of one S-band rada r , the SCR 615B, two X-Band units, the AN/APS-15 and the AN/APQ-13. The fixed radar unit has just been re located on the campus of the Uni-
196
versity on a 120-foot tower. New buildings have been erec ted to house the equipment and to serve as a laboratory.
Radar studies have been made of four tropical cyclones. Several r adar observations of squalls and frontal conditions have been made, including one of a tornado.
The rainfal l and attenuation studies will be resumed now that the equipment is located at the improved site.
14. Mt. Washington Observatory, Harvard Univers i ty
Cloud physics studies are being conducted under Air Force sponsorship. Rain drop size m e a s u r e ments and their relationship to rainfall intensities and synoptic situation studied.
15. New Mexico School of Mines, Physics Dept. E. J. Workman
Cloud phys ics s tudies a r e being conducted. E lec t r ica l potentials developed in freezing solutions, effective life of silver iodide par t ic les , r e activation of silver iodide part icles, and ammonia as an agent for reducing e lec t r i ca l potentials in clouds are a few phases of the work. Radar is used for observing rainfall pat terns and evaluating the effect of agents introduced into clouds.
16. P ro jec t C i r r u s , Genera l E lec t r ic Research Laboratory
I. Langmuir
This extensive project is essentially a study of precipitation mechanisms and the effects of various "cloud seeding" techniques.
17. Organiza t ion : I l l inois State Water Survey, Urbana, Illinois
Name: Quantitative Rainfall-Radar Study Director: Glenn E. Stout Pu rpose : To de te rmine the utility of radar
for water r e s o u r c e s applications, to develop equipment and technique for de te r mining areal rainfall with radar. One APS-15 is installed at El Paso, Illinois; a second APS-15 set and a TPL-l are located at the Univers i ty of Ill inois Airpor t . Each set has a scope camera and an automatic sys tem to control the receiver sensitivity for de te rmining isoecho pa t te rns . 34 F r i ez 12. 648" weighing bucket rain gages a r e used to check the surface rainfall patterns.
18. Organization: Woods Hole Oceanographic Institution, Woods Hole, Massachusetts
Name: Atmospheric Sea-Salt Studies Director: Alfred H. Woodcock Sup. Agency: Office of Naval Research, NR-
085-001 Purpose: To obtain the size distribution and
number of atmospheric sea-sa l t par t ic les near the sea surface, in the sub-cloud and cloud layers and determine its importance in producing heavy rainfall. Simultaneous measurements of ra in drop size d is t r ibution and salt concentrations will be made both from the ground and from aircraf t at and below the cloud level.
19. Airborne Instrument Laborator ies , Office of Naval Research
R. W. Miller
20. Air Weather Service G. A. Guy
Responsible for locating, organizing, and maintenance and training program for the CPS-9 radar .
21. Organization: National Advisory Committee for Aeronautics, 1724 F. Street NW, Washington 25, D. C.
Director : Donald B. Talmage Purpose: Currently engaged in instigating p ro j
ects to evaluate the use of Airborne Radar in thunders torms and line squalls . Up to present, we have cooperated with American Airlines and the Navy in prel iminary p r o j ects and have made tentative plans to cooperate in a jointproject with the Naval Air Test Center to continue the work.
22. Organization: Cook Research Labora tor ies , 1457 Diversey Parkway, Chicago 14, Illinois
Name: a. Lightning Avoidance b. Weather Reconnaissance Systems Study
Director: Dr. J. Robert Downing Associate: Dr. John C. Bellamy Sup. Agency: Air Materiel Command
(a) Contract No. AF33(038)-23715 (b) Contract No. AF33(038)-23324
Purpose: (a) Study of means by which a i rc ra f t in flight may detect and avoid lightning a r e a s . (b) Suggested by title.
23. General Electric Company, Air Materiel Command
D. S. Davidson
24. Organization: The Glenn L. Martin Co., Bal t i more , Maryland
Name: Airborne Weather Detection Radar Director: E. F. Hill, J r . , Project Engineer Sup. Agency: U. S. A. F . , Contract No. AF33
197
(038)-19562, classified Confidential Purpose: Development of a radar system
25. Raytheon Manufacturing Company Project Engineer: E. L. Williams
Production of the CPS-9, a 3 cm. high-power radar developed by the Signal Corps as a storm detection radar .
26. Weather Radar Branch, Signal Corps, Engineering Labora tor ies
W. J. Schiff
Responsible for the design and development of the CPS-9 radar.
27. Organization: General Electric Co . , Electro-Mechanical Division, Schenectady, N. Y.
Name: Development of "Airborne Cloud Base and Top Indicator - AN/APQ-39"
Director: S. M. Kaplan Sup. Agency: Air Force , Contract No. AF33
(038)-14299 Purpose: To permit the continuous recording
of the location and density of cloud layers above and below a surveying aircraft .
28. Organization: Detachment 16-IL, 16th Weather Squadron, Chanute Air Force Base, Illinois
Name: Storm Detection Director: Capt. H. W. Silk, J r . , Detachment
Commander Purpose: To furnish additional weather data
for dissemination to agencies of the weather network; and to enable our local forecasters to maintain a more detailed, current, and dynamic picture of hydrometeors associated with storms.
Equipment: AN/APQ-13 Airborne Type Search Radar modified for storm detection.
29. Organization: Dow Chemical Company, Electrochemical Engineering Division, Freeport , Texas
Name: Industrial Radar for Hurricane Tracking Director: Oliver Osborn Purpose: To help the Weather Bureau provide
Gulf Coast industry with bet ter hurr icane warnings. Existence of the radar has improved employee relat ions by increasing confidence in adequate s torm warnings and by prevent ion of unnecessary layoffs be cause of premature plant shutdown.
Equipment: SCR 784 and SCR 527
30. A. H. Glenn and Assoc ia tes , New Orleans, Louisiana
A. H. Glenn
Using radar as an aid in forecasting the weather for offshore drilling operations.
31. Public Service Company of Northern Illinois, and Commonwealth Edison, Chicago, Ill.
J. L. Wysong, H. L. Garton
These companies are conducting a cooperative investigation. A 3 cm. radar (APS-15) is being set up at the Chicago Municipal Airport and will be used to evaluate the use of radar for sleet warning and dense cloud coverage warning.
32. U. S. Weather Bureau
The Weather Bureau is in the process of setting up an extensive radar system for storm warning and forecasting purposes. Several stations a re already installed and many more are planned. Most of the equipment is 10 cm. (APS-2). Also radar repor ts a r e received from several individual cooperating organizations.
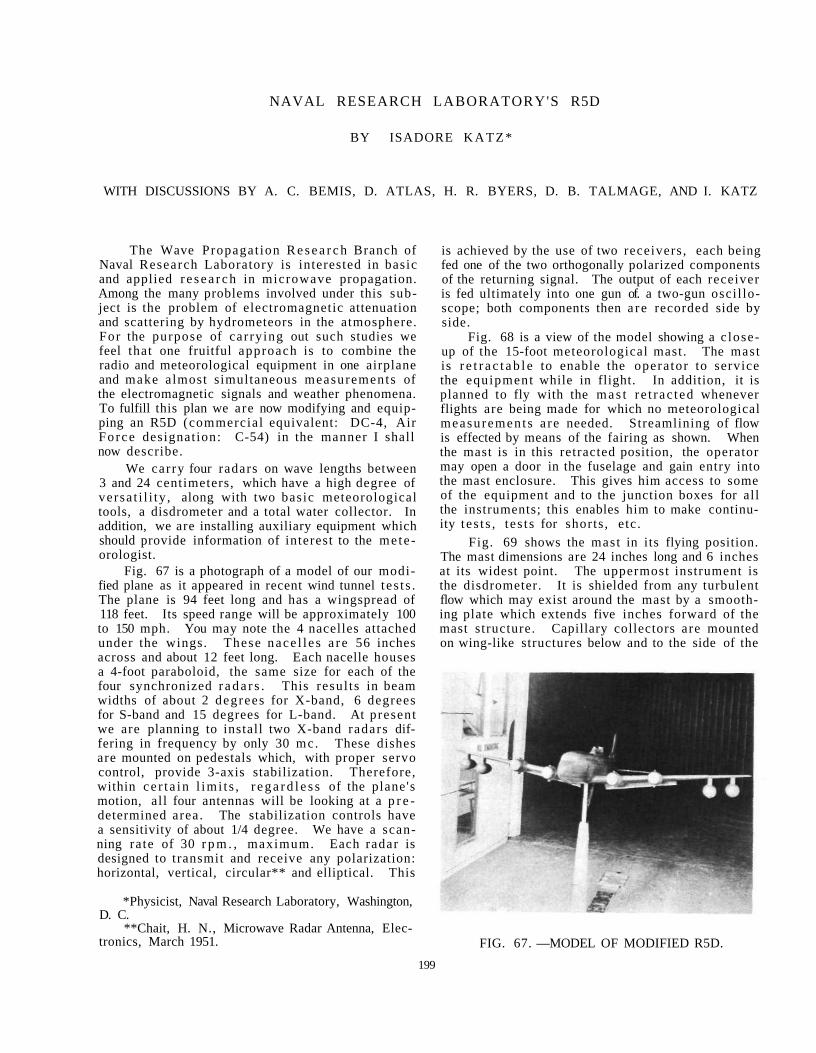
NAVAL RESEARCH LABORATORY'S R5D
BY ISADORE K A T Z *
WITH DISCUSSIONS BY A. C. BEMIS, D. ATLAS, H. R. BYERS, D. B. TALMAGE, AND I. KATZ
The Wave Propagat ion R e s e a r c h Branch of Naval Research Laboratory is interested in basic and applied r e s e a r c h in microwave propagation. Among the many problems involved under this subject is the problem of electromagnetic attenuation and scattering by hydrometeors in the atmosphere. For the purpose of carrying out such studies we feel that one fruitful approach is to combine the radio and meteorological equipment in one airplane and make almost simultaneous measurements of the electromagnetic signals and weather phenomena. To fulfill this plan we are now modifying and equipping an R5D (commercial equivalent: DC-4, Air Force designation: C-54) in the manner I shall now describe.
We carry four radars on wave lengths between 3 and 24 centimeters, which have a high degree of versa t i l i ty , along with two basic meteorological tools, a disdrometer and a total water collector. In addition, we are installing auxiliary equipment which should provide information of interest to the me te orologist.
Fig. 67 is a photograph of a model of our modified plane as it appeared in recent wind tunnel t e s t s . The plane is 94 feet long and has a wingspread of 118 feet. Its speed range will be approximately 100 to 150 mph. You may note the 4 nacelles attached under the wings. These nace l l e s a r e 56 inches across and about 12 feet long. Each nacelle houses a 4-foot paraboloid, the same size for each of the four synchronized r a d a r s . This resul ts in beam widths of about 2 degrees for X-band, 6 degrees for S-band and 15 degrees for L-band. At present we are planning to install two X-band radars differing in frequency by only 30 mc. These dishes are mounted on pedestals which, with proper servo control, provide 3-axis stabilization. Therefore, within ce r t a in l imi t s , r e g a r d l e s s of the plane's motion, all four antennas will be looking at a p r e determined area. The stabilization controls have a sensitivity of about 1/4 degree. We have a scanning rate of 30 r p m . , maximum. Each radar is designed to transmit and receive any polarization: horizontal, vertical, circular** and elliptical. This
*Physicist, Naval Research Laboratory, Washington, D. C.
**Chait, H. N., Microwave Radar Antenna, Electronics, March 1951.
is achieved by the use of two receivers , each being fed one of the two orthogonally polarized components of the returning signal. The output of each receiver is fed ultimately into one gun of. a two-gun osci l loscope; both components then a r e recorded side by side.
Fig. 68 is a view of the model showing a c lose-up of the 15-foot meteorological mast. The mast is r e t r a c t a b l e to enable the opera tor to service the equipment while in flight. In addition, it is planned to fly with the m a s t r e t r ac ted whenever flights are being made for which no meteorological measurements a re needed. Streamlining of flow is effected by means of the fairing as shown. When the mast is in this retracted position, the operator may open a door in the fuselage and gain entry into the mast enclosure. This gives him access to some of the equipment and to the junction boxes for all the instruments; this enables him to make continuity t e s t s , t es t s for shorts , etc .
Fig. 69 shows the mast in its flying position. The mast dimensions are 24 inches long and 6 inches at its widest point. The uppermost instrument is the disdrometer. It is shielded from any turbulent flow which may exist around the mast by a smoothing plate which extends five inches forward of the mast structure. Capillary collectors are mounted on wing-like structures below and to the side of the
FIG. 67. —MODEL OF MODIFIED R5D. 199
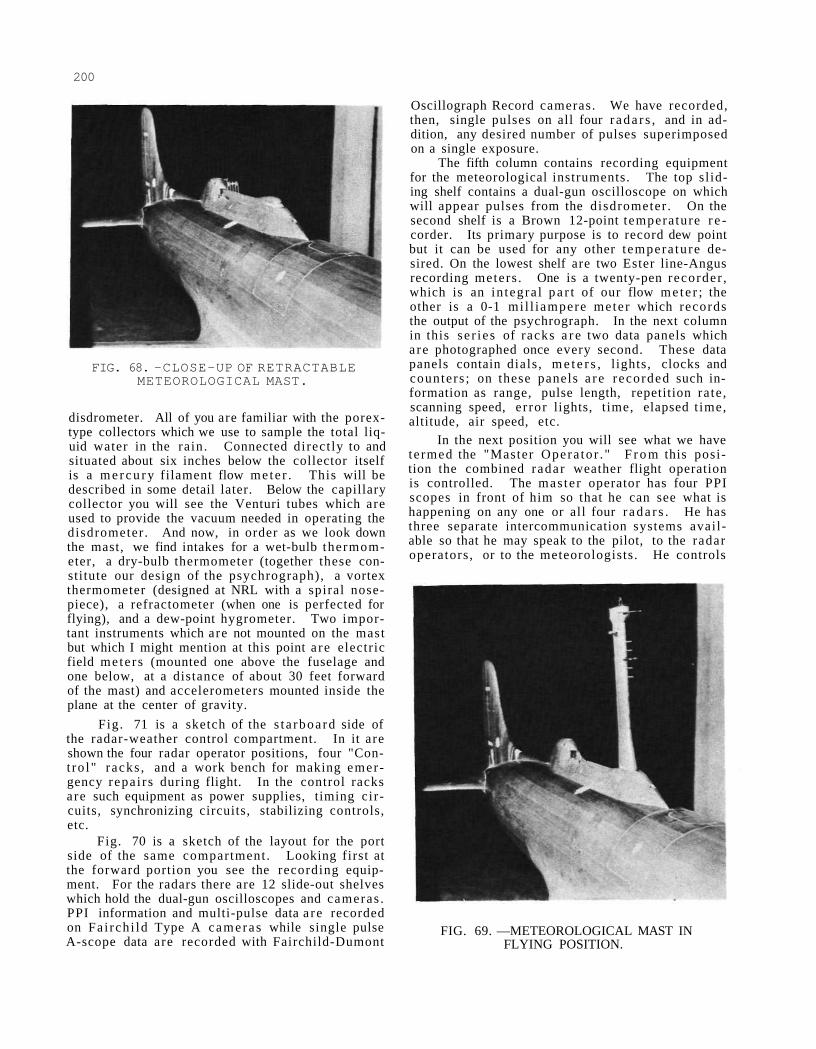
200
FIG. 68. —CLOSE-UP OF RETRACTABLE METEOROLOGICAL MAST.
disdrometer. All of you are familiar with the porex-type collectors which we use to sample the total liquid water in the rain. Connected direct ly to and situated about six inches below the collector itself is a m e r c u r y filament flow mete r . This will be described in some detail later. Below the capillary collector you will see the Venturi tubes which are used to provide the vacuum needed in operating the disdrometer . And now, in order as we look down the mast, we find intakes for a wet-bulb thermometer, a dry-bulb thermometer (together these constitute our design of the psychrograph), a vortex thermometer (designed at NRL with a spiral nose-piece), a refractometer (when one is perfected for flying), and a dew-point hygrometer. Two important instruments which are not mounted on the mast but which I might mention at this point a re electric field mete rs (mounted one above the fuselage and one below, at a distance of about 30 feet forward of the mast) and accelerometers mounted inside the plane at the center of gravity.
Fig. 71 is a sketch of the s t a rboard side of the radar-weather control compartment. In it are shown the four radar operator positions, four "Cont ro l" racks , and a work bench for making emergency repa i rs during flight. In the control racks are such equipment as power supplies, timing circuits, synchronizing circuits, stabilizing controls, etc.
Fig. 70 is a sketch of the layout for the port side of the same compartment . Looking first at the forward portion you see the recording equipment. For the radars there are 12 slide-out shelves which hold the dual-gun oscilloscopes and cameras . PPI information and multi-pulse data a re recorded on Fa i rch i ld Type A cameras while single pulse A-scope data are recorded with Fairchild-Dumont
Oscillograph Record cameras. We have recorded, then, single pulses on all four r ada r s , and in addition, any desired number of pulses superimposed on a single exposure.
The fifth column contains recording equipment for the meteorological instruments. The top sl iding shelf contains a dual-gun oscilloscope on which will appear pulses from the disdrometer . On the second shelf is a Brown 12-point temperature r e corder. Its primary purpose is to record dew point but it can be used for any other t empera ture desired. On the lowest shelf are two Ester line-Angus recording meters . One is a twenty-pen recorder , which is an in tegra l p a r t of our flow me te r ; the other is a 0-1 mi l l iampere meter which records the output of the psychrograph. In the next column in this se r ies of racks a r e two data panels which a re photographed once every second. These data panels contain dials , m e t e r s , l ights, clocks and counters ; on these panels a r e recorded such information as range, pulse length, repetition ra te , scanning speed, er ror lights, t ime, elapsed t ime, altitude, air speed, etc.
In the next position you will see what we have te rmed the "Master Opera tor . " F r o m this position the combined radar weather flight operation is controlled. The mas te r operator has four PPI scopes in front of him so that he can see what is happening on any one or all four r a d a r s . He has three separate intercommunication systems available so that he may speak to the pilot, to the radar operators, or to the meteorologists. He controls
FIG. 69. —METEOROLOGICAL MAST IN FLYING POSITION.
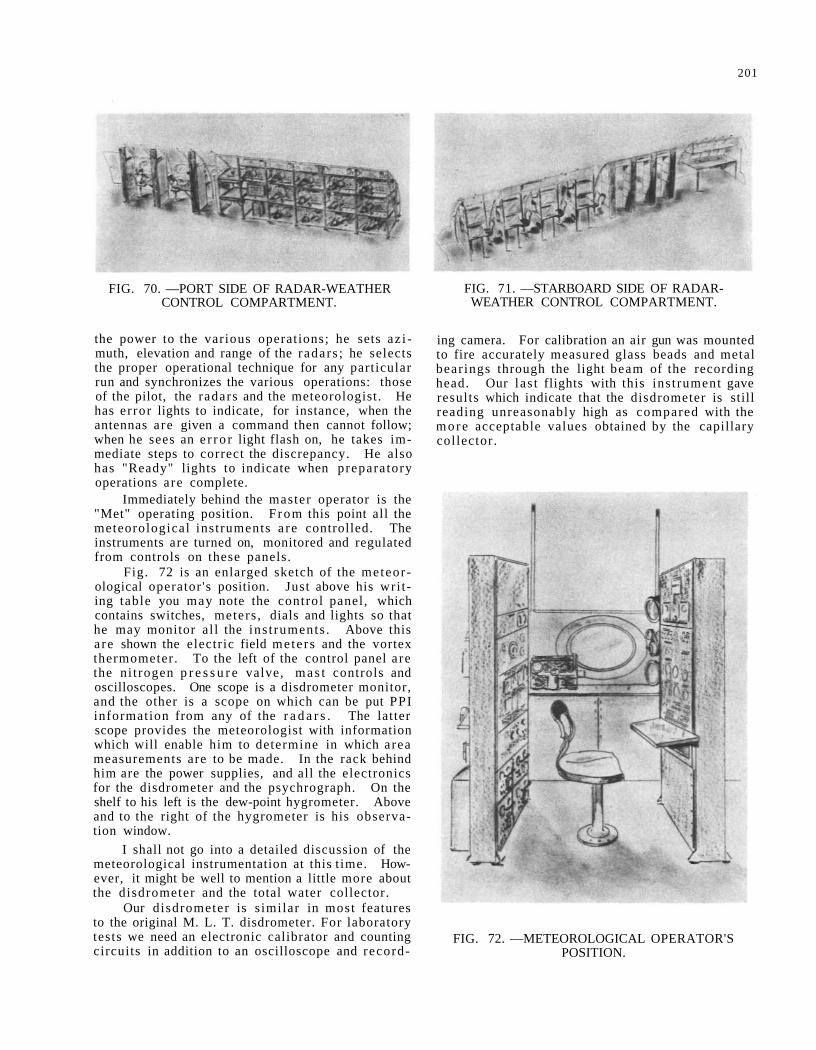
201
FIG. 70. —PORT SIDE OF RADAR-WEATHER CONTROL COMPARTMENT.
the power to the various operations; he sets az i muth, elevation and range of the radars ; he selects the proper operational technique for any particular run and synchronizes the various operations: those of the pilot, the radars and the meteorologist. He has er ror lights to indicate, for instance, when the antennas are given a command then cannot follow; when he sees an e r ro r light flash on, he takes immediate steps to correct the discrepancy. He also has "Ready" lights to indicate when preparatory operations are complete.
Immediately behind the master operator is the "Met" operating position. F rom this point all the meteorological instruments a re controlled. The instruments are turned on, monitored and regulated from controls on these panels.
Fig. 72 is an enlarged sketch of the meteorological operator 's position. Just above his wri t ing table you may note the control panel, which contains switches, meters , dials and lights so that he may monitor al l the ins t ruments . Above this a re shown the electric field mete rs and the vortex thermometer. To the left of the control panel a re the ni t rogen p r e s s u r e valve, m a s t controls and oscilloscopes. One scope is a disdrometer monitor, and the other is a scope on which can be put PPI information from any of the r a d a r s . The latter scope provides the meteorologist with information which will enable him to determine in which area measurements are to be made. In the rack behind him are the power supplies, and all the electronics for the disdrometer and the psychrograph. On the shelf to his left is the dew-point hygrometer. Above and to the right of the hygrometer is his observation window.
I shall not go into a detailed discussion of the meteorological instrumentation at this t ime. However, it might be well to mention a little more about the disdrometer and the total water collector.
Our disdrometer is s imilar in most features to the original M. L. T. disdrometer. For laboratory tests we need an electronic calibrator and counting circuits in addition to an oscilloscope and record-
FIG. 71. —STARBOARD SIDE OF RADAR-WEATHER CONTROL COMPARTMENT.
ing camera. For calibration an air gun was mounted to fire accurately measured glass beads and metal bear ings through the light beam of the recording head. Our las t flights with this ins t rument gave results which indicate that the disdrometer is still reading unreasonably high as compared with the more acceptable values obtained by the capillary collector.
FIG. 72. —METEOROLOGICAL OPERATOR'S POSITION.
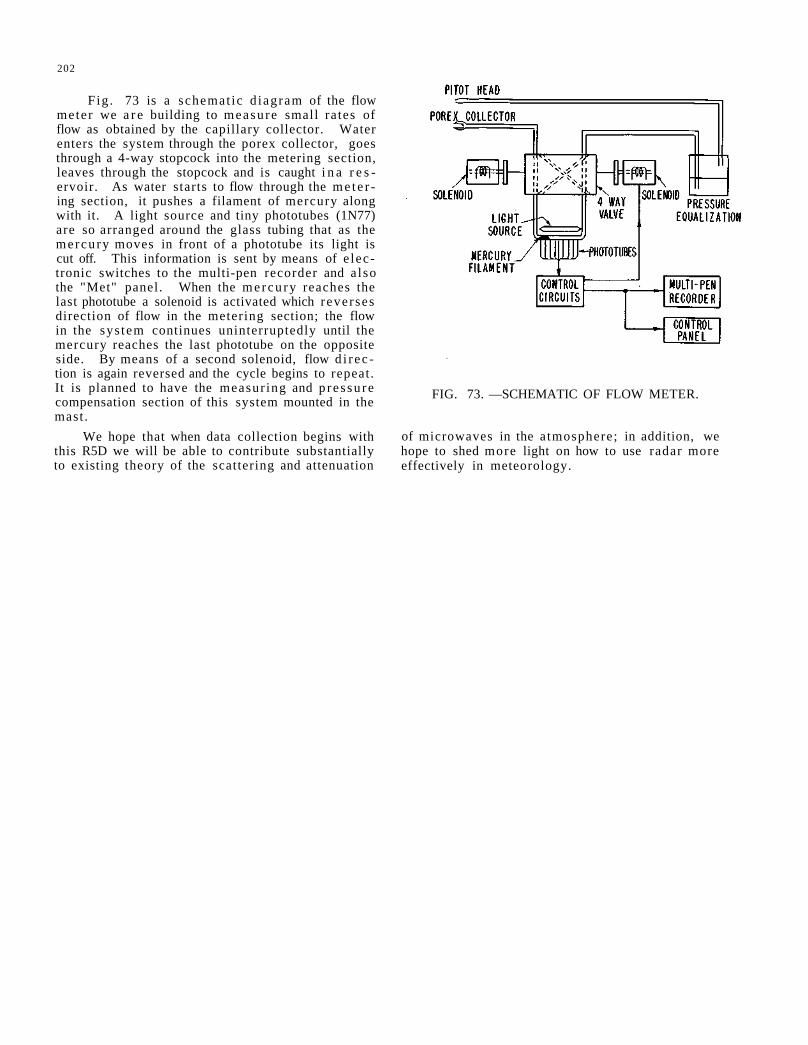
202
Fig . 73 is a schemat ic d iagram of the flow meter we a r e building to measure small ra tes of flow as obtained by the capillary collector. Water enters the system through the porex collector, goes through a 4-way stopcock into the metering section, leaves through the stopcock and is caught i n a r e s ervoir. As water starts to flow through the m e t e r ing section, it pushes a filament of mercury along with it. A light source and tiny phototubes (1N77) are so arranged around the glass tubing that as the mercury moves in front of a phototube its light is cut off. This information is sent by means of e lectronic switches to the multi-pen recorder and a l so the "Met" panel. When the mercu ry reaches the last phototube a solenoid is activated which reverses direction of flow in the metering section; the flow in the sys tem continues uninterruptedly until the mercury reaches the last phototube on the opposite side. By means of a second solenoid, flow d i r ec tion is again reversed and the cycle begins to repeat. It is planned to have the measur ing and p re s su re compensation section of this system mounted in the mast .
We hope that when data collection begins with this R5D we will be able to contribute substantially to existing theory of the scattering and attenuation
FIG. 73. —SCHEMATIC OF FLOW METER.
of microwaves in the atmosphere; in addition, we hope to shed more light on how to use radar more effectively in meteorology.
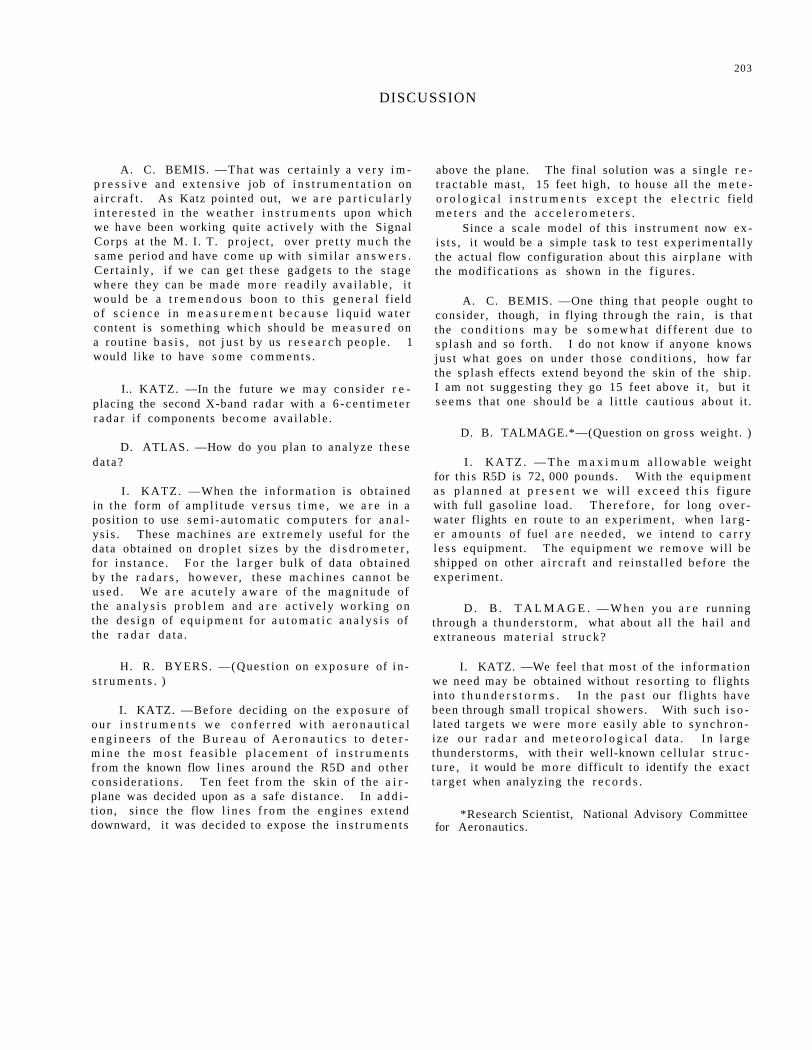
DISCUSSION
203
A. C. BEMIS. —That was ce r ta in ly a v e r y i m p r e s s i v e and e x t e n s i v e job of i n s t r u m e n t a t i o n on a i r c r a f t . As Katz pointed out, we a r e p a r t i c u l a r l y i n t e r e s t e d in the w e a t h e r i n s t r u m e n t s upon which we have been working quite ac t ive ly with the Signal Corps at the M. I . T. p ro jec t , over p r e t t y m u c h the same period and have come up with s imi la r a n s w e r s . Cer ta in ly , if we can ge t these gadge ts to the s tage where they can be m a d e m o r e r e a d i l y a v a i l a b l e , i t would be a t r e m e n d o u s boon to t h i s g e n e r a l field o f s c i e n c e in m e a s u r e m e n t b e c a u s e l iqu id w a t e r content is something which should be m e a s u r e d on a rout ine b a s i s , not j u s t by us r e s e a r c h peop le . 1 would like to have s o m e c o m m e n t s .
I.. KATZ. —In the future we m a y cons ide r r e placing the second X-band r ada r with a 6 - c e n t i m e t e r r a d a r if components become ava i l ab le .
D. ATLAS. —How do you plan to ana lyze t h e s e da ta?
I . KATZ. —When the i n f o r m a t i o n is ob ta ined in the form of ampl i tude v e r s u s t i m e , we a r e in a posit ion to use s emi -au toma t i c compute r s for a n a l ys i s . These machines a r e e x t r e m e l y useful for the data obtained on d r o p l e t s i z e s by the d i s d r o m e t e r , for i n s t ance . F o r the l a r g e r bulk of data obta ined by the r a d a r s , however , these m a c h i n e s cannot be u s e d . We a r e a c u t e l y a w a r e of t h e magn i tude of the a n a l y s i s p r o b l e m and a r e a c t i v e l y w o r k i n g on the d e s i g n of e q u i p m e n t for a u t o m a t i c a n a l y s i s of the r a d a r da t a .
H. R. BYERS. —(Ques t ion on e x p o s u r e of i n s t r u m e n t s . )
I. KATZ. —Before deciding on the e x p o s u r e of o u r i n s t r u m e n t s w e c o n f e r r e d wi th a e r o n a u t i c a l e n g i n e e r s of the B u r e a u of A e r o n a u t i c s to d e t e r m i n e the m o s t f ea s ib l e p l a c e m e n t o f i n s t r u m e n t s f rom the known flow l ines around the R5D and o the r cons ide ra t ions . Ten feet f r o m the skin of the a i r plane was decided upon as a safe d is tance . In a d d i t ion, s ince the flow l i n e s f r o m the eng ines ex tend downward, i t was decided to expose the i n s t r u m e n t s
above the plane. The final solution was a s ingle r e t rac tab le mas t , 15 feet high, to house all the m e t e o r o l o g i c a l i n s t r u m e n t s e x c e p t t h e e l e c t r i c field m e t e r s and the a c c e l e r o m e t e r s .
Since a scale model of this i n s t rumen t now e x i s t s , it would be a simple t a sk to t e s t exper imenta l ly the actual flow configuration about th is a i rp l ane with the modif icat ions as shown in the f igures .
A. C. BEMIS. —One thing tha t people ought to consider , though, in flying through the r a i n , is t ha t the c o n d i t i o n s m a y be s o m e w h a t d i f fe ren t due to sp lash and so forth. I do not know if anyone knows jus t what goes on under t hose condi t ions , how far the splash effects extend beyond the skin of the ship. I am not suggest ing they go 15 feet above i t , but it s e e m s that one should be a l i t t le caut ious about i t .
D. B. TALMAGE.*—(Question on gross weight. )
I . K A T Z . — T h e m a x i m u m a l l o w a b l e weight for th is R5D is 72, 000 pounds. With the equipment a s p l a n n e d a t p r e s e n t w e wi l l e x c e e d t h i s f igure with full gasol ine load. T h e r e f o r e , for long o v e r -water flights en route to an exper iment , when l a r g er a m o u n t s of fuel a r e needed , we intend to c a r r y l e s s equipment. The equipment we r e m o v e wil l be shipped on other a i r c r a f t and re ins t a l l ed before the exper iment .
D . B . T A L M A G E . — W h e n you a r e running through a t hunde r s to rm , what about a l l the ha i l and extraneous m a t e r i a l s t r u c k ?
I. KATZ. —We feel that mos t of the in format ion we need may be obtained without r e so r t ing to flights into t h u n d e r s t o r m s . In the p a s t our f l igh ts have been through small t ropical showers . With such i s o lated ta rge ts we were m o r e eas i ly able to s y n c h r o n ize o u r r a d a r and m e t e o r o l o g i c a l da ta . In l a r g e thunderstorms, with the i r well-known cel lular s t r u c t u r e , i t would be m o r e difficult to identify the exac t t a r g e t when analyzing the r e c o r d s .
*Research Scientist, National Advisory Committee for Aeronautics.
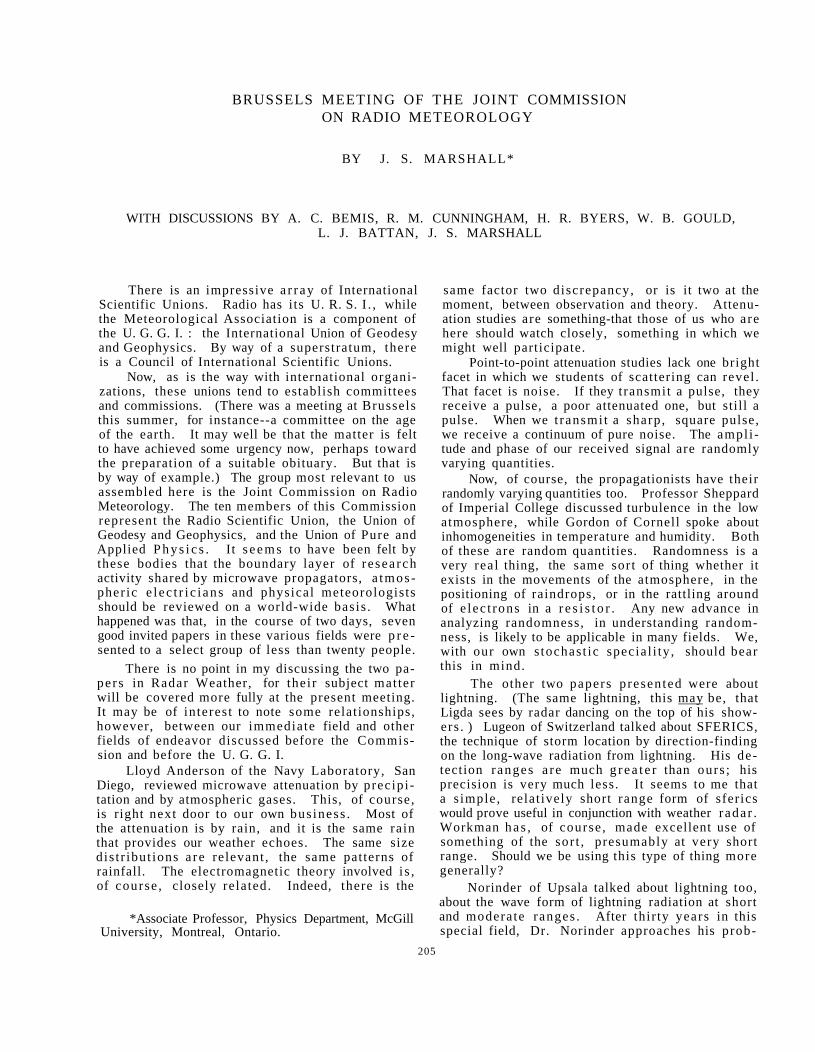
BRUSSELS MEETING OF THE JOINT COMMISSION ON RADIO METEOROLOGY
BY J. S. MARSHALL*
WITH DISCUSSIONS BY A. C. BEMIS, R. M. CUNNINGHAM, H. R. BYERS, W. B. GOULD, L. J. BATTAN, J. S. MARSHALL
There is an impressive a r r ay of International Scientific Unions. Radio has i ts U. R. S. I . , while the Meteorological Association is a component of the U. G. G. I. : the International Union of Geodesy and Geophysics. By way of a superstratum, there is a Council of International Scientific Unions.
Now, as is the way with international organizations, these unions tend to establish committees and commissions. (There was a meeting at Brussels this summer, for instance--a committee on the age of the earth. It may well be that the matter is felt to have achieved some urgency now, perhaps toward the preparation of a suitable obituary. But that is by way of example.) The group most relevant to us assembled here is the Joint Commission on Radio Meteorology. The ten members of this Commission represent the Radio Scientific Union, the Union of Geodesy and Geophysics, and the Union of Pure and Applied P h y s i c s . It s e e m s to have been felt by these bodies that the boundary layer of r esea rch activity shared by microwave propagators, a tmospher ic e l ec t r i c i ans and physical meteorologists should be reviewed on a world-wide basis . What happened was that, in the course of two days, seven good invited papers in these various fields were p r e sented to a select group of less than twenty people.
There is no point in my discussing the two papers in Radar Weather, for thei r subject mat ter will be covered more fully at the present meeting. It may be of interest to note some relationships, however, between our immediate field and other fields of endeavor discussed before the Commission and before the U. G. G. I.
Lloyd Anderson of the Navy Laboratory, San Diego, reviewed microwave attenuation by precipi tation and by atmospheric gases. This, of course, is right next door to our own bus iness . Most of the attenuation is by rain, and it is the same rain that provides our weather echoes. The same size dis t r ibut ions a re relevant , the same patterns of rainfall. The electromagnetic theory involved i s , of course , closely related. Indeed, there is the
*Associate Professor, Physics Department, McGill University, Montreal, Ontario.
same factor two discrepancy, or is it two at the moment, between observation and theory. Attenuation studies are something-that those of us who are here should watch closely, something in which we might well participate.
Point-to-point attenuation studies lack one bright facet in which we students of scattering can revel . That facet is noise. If they transmit a pulse, they receive a pulse, a poor attenuated one, but still a pulse. When we t ransmi t a sharp , square pulse, we receive a continuum of pure noise. The ampl i tude and phase of our received signal are randomly varying quantities.
Now, of course, the propagationists have their randomly varying quantities too. Professor Sheppard of Imperial College discussed turbulence in the low atmosphere, while Gordon of Cornell spoke about inhomogeneities in temperature and humidity. Both of these are random quantities. Randomness is a very real thing, the same sort of thing whether it exists in the movements of the atmosphere, in the positioning of raindrops, or in the rattling around of e lec t rons in a r e s i s t o r . Any new advance in analyzing randomness, in understanding randomness, is likely to be applicable in many fields. We, with our own s tochas t ic specia l i ty , should bear this in mind.
The other two papers presented were about lightning. (The same lightning, this may be, that Ligda sees by radar dancing on the top of his showers . ) Lugeon of Switzerland talked about SFERICS, the technique of storm location by direction-finding on the long-wave radiation from lightning. His detection ranges a re much g r e a t e r than ours ; his precision is very much less. It seems to me that a s imple, relat ively short range form of sferics would prove useful in conjunction with weather radar . Workman has , of course , made excellent use of something of the sor t , presumably at very short range. Should we be using this type of thing more generally?
Norinder of Upsala talked about lightning too, about the wave form of lightning radiation at short and moderate ranges . After thir ty years in this special field, Dr. Norinder approaches his prob-
205
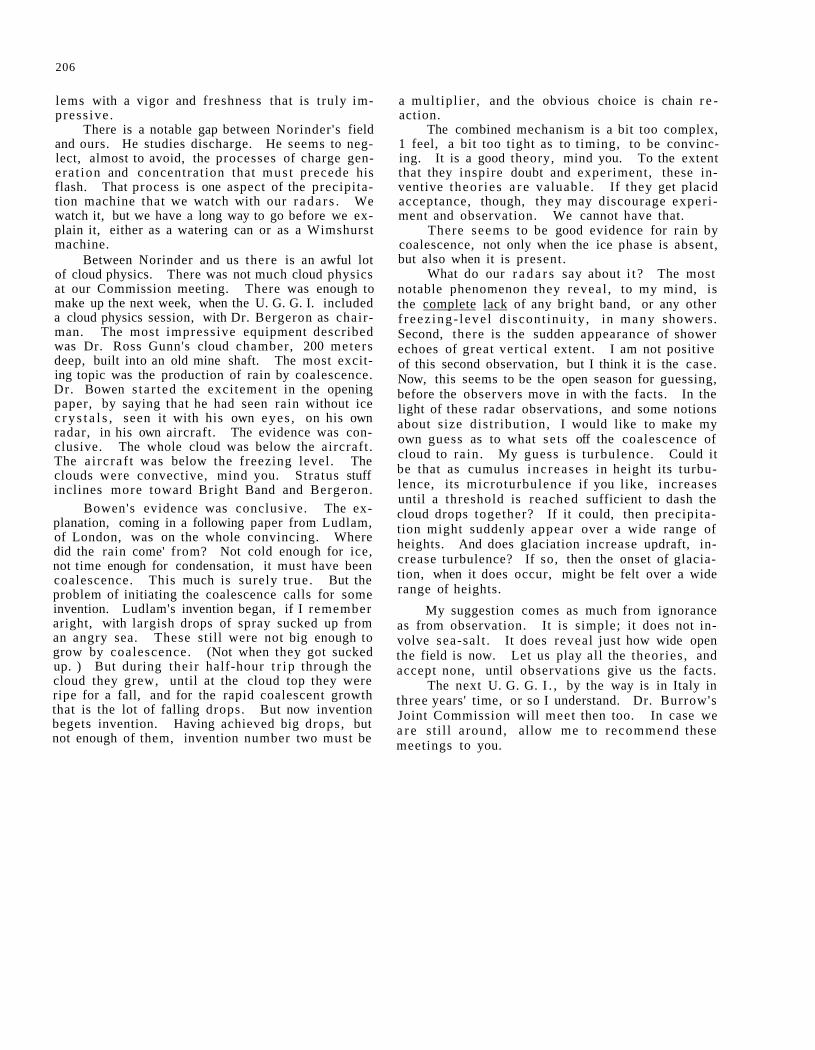
206
lems with a vigor and freshness that is truly impress ive .
There is a notable gap between Norinder's field and ours. He studies discharge. He seems to neglect, almost to avoid, the processes of charge genera t ion and concentrat ion that mus t precede his flash. That process is one aspect of the precipitation machine that we watch with our r a d a r s . We watch it, but we have a long way to go before we explain it, either as a watering can or as a Wimshurst machine.
Between Norinder and us there is an awful lot of cloud physics. There was not much cloud physics at our Commission meeting. There was enough to make up the next week, when the U. G. G. I. included a cloud physics session, with Dr. Bergeron as chairman. The most impress ive equipment described was Dr. Ross Gunn's cloud chamber, 200 meters deep, built into an old mine shaft. The most exciting topic was the production of rain by coalescence. Dr. Bowen s ta r ted the excitement in the opening paper, by saying that he had seen rain without ice c r y s t a l s , seen it with his own eyes , on his own radar, in his own aircraft. The evidence was conclusive. The whole cloud was below the aircraft . The a i rc ra f t was below the freezing level. The clouds were convective, mind you. Stratus stuff inclines more toward Bright Band and Bergeron.
Bowen's evidence was conclusive. The explanation, coming in a following paper from Ludlam, of London, was on the whole convincing. Where did the rain come' from? Not cold enough for ice, not time enough for condensation, it must have been coalescence. This much is surely t rue . But the problem of initiating the coalescence calls for some invention. Ludlam's invention began, if I remember aright, with largish drops of spray sucked up from an angry sea. These still were not big enough to grow by coalescence. (Not when they got sucked up. ) But during their half-hour t r i p through the cloud they grew, until at the cloud top they were ripe for a fall, and for the rapid coalescent growth that is the lot of falling drops. But now invention begets invention. Having achieved big drops, but not enough of them, invention number two must be
a mult ipl ier , and the obvious choice is chain r e action.
The combined mechanism is a bit too complex, 1 feel, a bit too tight as to timing, to be convincing. It is a good theory, mind you. To the extent that they inspire doubt and experiment, these inventive theor ies a r e valuable. If they get placid acceptance, though, they may discourage experiment and observation. We cannot have that.
There seems to be good evidence for rain by coalescence, not only when the ice phase is absent, but also when it is present.
What do our r a d a r s say about i t ? The most notable phenomenon they reveal , to my mind, is the complete lack of any bright band, or any other f r eez ing- l eve l d iscont inui ty , in many showers. Second, there is the sudden appearance of shower echoes of great vertical extent. I am not positive of this second observation, but I think it is the case. Now, this seems to be the open season for guessing, before the observers move in with the facts. In the light of these radar observations, and some notions about size dis t r ibut ion, I would like to make my own guess as to what se ts off the coalescence of cloud to ra in . My guess is turbulence. Could it be that as cumulus inc reases in height its turbulence, its microturbulence if you like, increases until a threshold is reached sufficient to dash the cloud drops together? If it could, then precipitation might suddenly appear over a wide range of heights. And does glaciation increase updraft, increase turbulence? If so, then the onset of glaciation, when it does occur, might be felt over a wide range of heights.
My suggestion comes as much from ignorance as from observation. It is simple; it does not involve sea-sal t . It does reveal just how wide open the field is now. Let us play all the theories , and accept none, until observations give us the facts.
The next U. G. G. I . , by the way is in Italy in three years' time, or so I understand. Dr. Burrow's Joint Commission will meet then too. In case we a r e st i l l around, allow me to recommend these meetings to you.
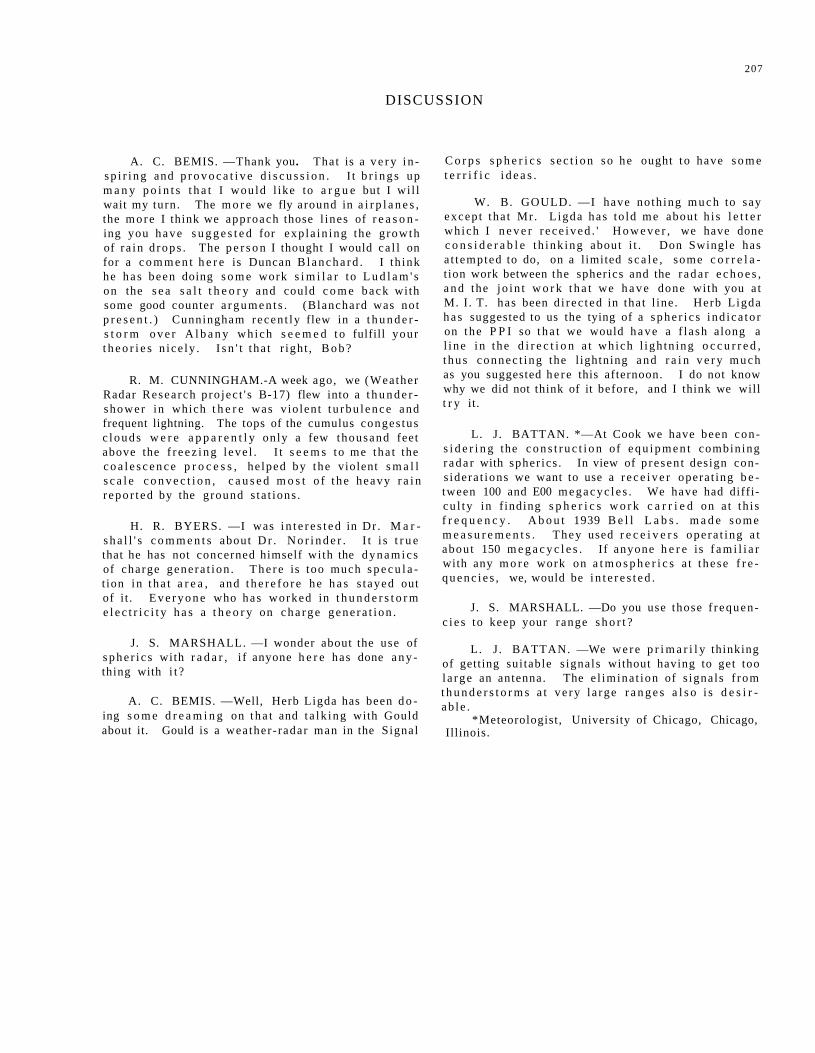
DISCUSSION
207
R. M. CUNNINGHAM.-A week ago, we (Weather Radar Research pro jec t ' s B-17) flew into a t h u n d e r -shower in which t h e r e was v io lent t u rbu l ence and frequent lightning. The tops of the cumulus conges tus c l o u d s w e r e a p p a r e n t l y only a few thousand feet above the f r e e z i n g l eve l . I t s e e m s to me tha t the c o a l e s c e n c e p r o c e s s , he lped by the violent s m a l l s c a l e c o n v e c t i o n , c a u s e d m o s t o f t h e heavy r a i n r epo r t ed by the ground s ta t ions .
H. R. BYERS. —I was i n t e r e s t e d in Dr . M a r s h a l l ' s c o m m e n t s about D r . N o r i n d e r . I t i s t r u e that he has not concerned himself with the d y n a m i c s of charge genera t ion . T h e r e is too much s p e c u l a t ion in t ha t a r e a , and t h e r e f o r e he h a s s t ayed out of i t . E v e r y o n e who has worked in t h u n d e r s t o r m e l e c t r i c i t y h a s a t h e o r y on c h a r g e gene ra t i on .
J. S. MARSHALL. —I wonder about the use of s p h e r i c s with r a d a r , i f anyone h e r e has done a n y thing with i t ?
A. C. BEMIS. —Well, Herb Ligda has been d o ing s o m e d r e a m i n g on t ha t and t a lk ing with Gould about it. Gould is a weather - radar man in the Signal
C o r p s s p h e r i c s s e c t i o n so he ought to have s o m e t e r r i f i c i d e a s .
W. B. GOULD. —I have noth ing m u c h to say excep t tha t Mr . L igda has to ld me about h i s l e t t e r which I n e v e r r e c e i v e d . ' H o w e v e r , we have done c o n s i d e r a b l e th ink ing about i t . Don Swingle has a t t empted to do, on a l imited s c a l e , some c o r r e l a t ion work between the spherics and the r ada r e c h o e s , a n d the j o in t w o r k t h a t we h a v e done with you a t M. I . T. has been d i r ec t ed in that l ine . Herb Ligda h a s suggested to us the tying of a s p h e r i c s i nd ica to r on the P P I so t ha t we would h a v e a f l a sh along a l i ne i n the d i r e c t i o n a t which l igh tn ing o c c u r r e d , t h u s connec t ing the l ightning and r a i n v e r y m u c h as you suggested h e r e this afternoon. I do not know why we did not think of it before, and I think we will t r y it.
L. J. BATTAN. *—At Cook we have been cons i d e r i n g the c o n s t r u c t i o n of e q u i p m e n t combining r a d a r with spher ics . In view of p re sen t design cons idera t ions we want to use a r e c e i v e r opera t ing b e tween 100 and E00 m e g a c y c l e s . We have had difficu l ty in f inding s p h e r i c s w o r k c a r r i e d on a t th i s f r e q u e n c y . A b o u t 1939 B e l l L a b s . m a d e s o m e m e a s u r e m e n t s . They used r e c e i v e r s ope ra t ing a t about 150 m e g a c y c l e s . If anyone h e r e is f a m i l i a r with any m o r e work on a t m o s p h e r i c s a t t he se f r e q u e n c i e s , we, would be i n t e r e s t e d .
J. S. MARSHALL. —Do you use those f r equenc i e s to keep your range s h o r t ?
L. J . BATTAN. —We w e r e p r i m a r i l y thinking of getting sui table s ignals without having to get too l a rge an antenna. The e l imina t ion of s ignals f rom t h u n d e r s t o r m s a t ve ry l a rge r a n g e s a l s o i s d e s i r ab le .
*Meteorologist, University of Chicago, Chicago, Illinois.
A. C. BEMIS. —Thank you. That is a v e r y i n s p i r i n g and p r o v o c a t i v e d i s c u s s i o n . I t b r i n g s up m a n y p o i n t s t h a t I would l ike to a r g u e but I wi l l wait my turn. The m o r e we fly around in a i r p l a n e s , the m o r e I think we approach those l ines of r e a s o n ing you have s u g g e s t e d for exp la in ing the g rowth of r a in d rops . The p e r s o n I thought I would ca l l on for a c o m m e n t h e r e is Duncan B l a n c h a r d . I th ink he h a s been doing s o m e work s i m i l a r to L u d l a m ' s on the s e a s a l t t h e o r y and could c o m e back with some good counter a r g u m e n t s . (Blanchard was not p r e s e n t . ) Cunningham recen t ly flew in a t h u n d e r s t o r m o v e r A l b a n y wh ich s e e m e d t o fulfill your t h e o r i e s n ice ly . I s n ' t tha t r ight , B o b ?
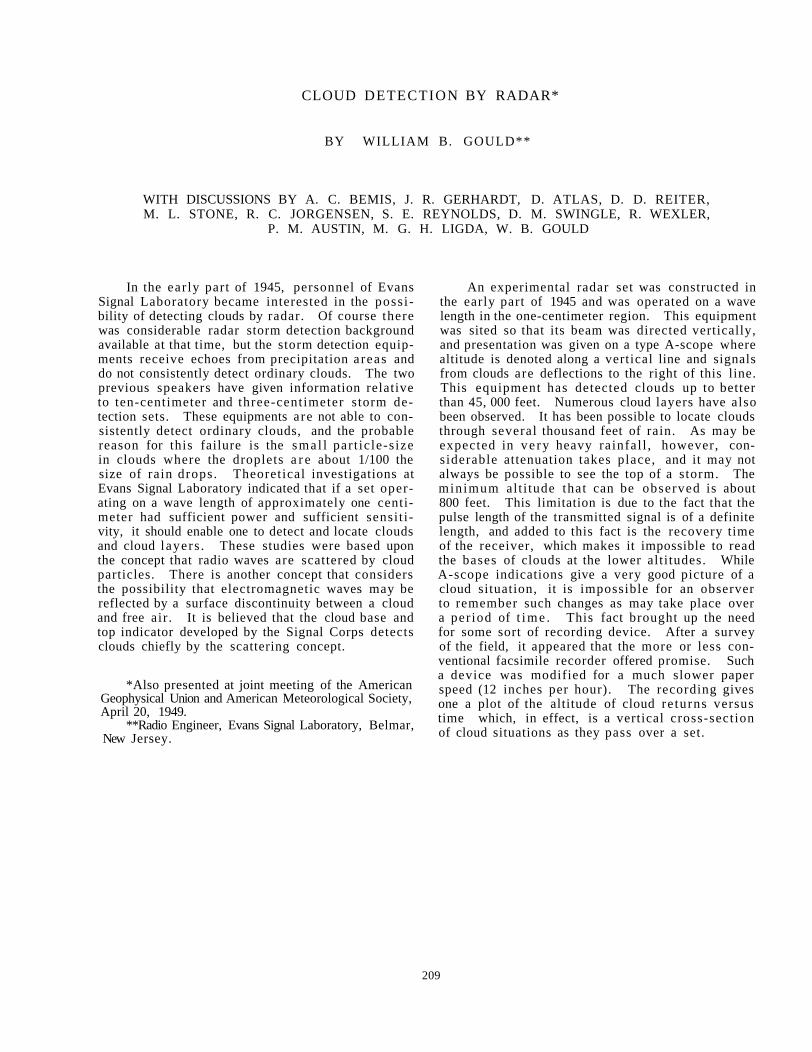
CLOUD DETECTION BY RADAR*
BY WILLIAM B. GOULD**
WITH DISCUSSIONS BY A. C. BEMIS, J. R. GERHARDT, D. ATLAS, D. D. REITER, M. L. STONE, R. C. JORGENSEN, S. E. REYNOLDS, D. M. SWINGLE, R. WEXLER,
P. M. AUSTIN, M. G. H. LIGDA, W. B. GOULD
In the ear ly part of 1945, personnel of Evans Signal Laboratory became interested in the poss i bility of detecting clouds by radar. Of course there was considerable radar storm detection background available at that time, but the storm detection equipments receive echoes from precipitation a reas and do not consistently detect ordinary clouds. The two previous speakers have given information relative to ten-centimeter and three-centimeter storm detection sets. These equipments are not able to consistently detect ordinary clouds, and the probable reason for this failure is the sma l l par t ic le-s ize in clouds where the droplets a r e about 1/100 the size of rain drops. Theoretical investigations at Evans Signal Laboratory indicated that if a set operating on a wave length of approximately one centimeter had sufficient power and sufficient sensi t i vity, it should enable one to detect and locate clouds and cloud layers . These studies were based upon the concept that radio waves are scattered by cloud particles. There is another concept that considers the possibility that electromagnetic waves may be reflected by a surface discontinuity between a cloud and free air . It is believed that the cloud base and top indicator developed by the Signal Corps detects clouds chiefly by the scattering concept.
*Also presented at joint meeting of the American Geophysical Union and American Meteorological Society, April 20, 1949.
**Radio Engineer, Evans Signal Laboratory, Belmar, New Jersey.
An experimental radar set was constructed in the early part of 1945 and was operated on a wave length in the one-centimeter region. This equipment was sited so that its beam was directed vertically, and presentation was given on a type A-scope where altitude is denoted along a vertical line and signals from clouds are deflections to the right of this line. This equipment has detected clouds up to better than 45, 000 feet. Numerous cloud layers have also been observed. It has been possible to locate clouds through several thousand feet of rain. As may be expected in ve ry heavy rainfal l , however, considerable attenuation takes place, and it may not always be possible to see the top of a storm. The minimum alt i tude that can be observed is about 800 feet. This limitation is due to the fact that the pulse length of the transmitted signal is of a definite length, and added to this fact is the recovery time of the receiver, which makes it impossible to read the bases of clouds at the lower alti tudes. While A-scope indications give a very good picture of a cloud situation, it is impossible for an observer to remember such changes as may take place over a per iod of t i m e . This fact brought up the need for some sort of recording device. After a survey of the field, it appeared that the more or less conventional facsimile recorder offered promise. Such a device was modified for a much slower paper speed (12 inches per hour). The recording gives one a plot of the altitude of cloud re turns versus time which, in effect, is a vertical cross-section of cloud situations as they pass over a set.
209
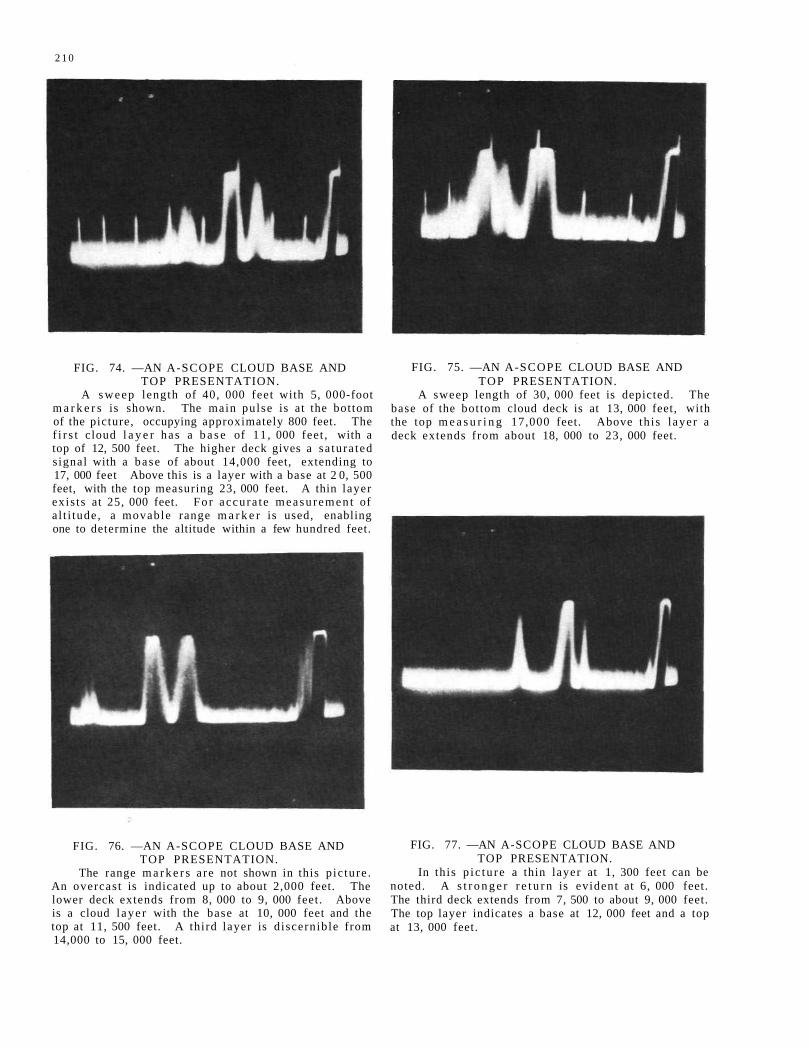
2 1 0
FIG. 74. —AN A-SCOPE CLOUD BASE AND TOP PRESENTATION.
A s w e e p length of 40, 000 feet with 5, 000-foot m a r k e r s is shown. The main pulse is at the bottom of the picture, occupying approximately 800 feet. The f i r s t cloud l a y e r has a b a s e of 11 , 000 feet , with a top of 12, 500 feet. The higher deck gives a sa tura ted s ignal with a base of about 14,000 feet, extending to 17, 000 feet Above this is a layer with a base at 2 0, 500 feet, with the top measuring 23, 000 feet. A thin layer exis ts at 25, 000 feet. Fo r accura te measu remen t of a l t i tude , a movable range m a r k e r is used, enabling one to determine the altitude within a few hundred feet.
FIG. 76. —AN A-SCOPE CLOUD BASE AND TOP PRESENTATION.
The range m a r k e r s a re not shown in this p ic ture . An overcast is indicated up to about 2,000 feet. The lower deck extends from 8, 000 to 9, 000 feet. Above is a cloud l aye r with the base at 10, 000 feet and the top at 11, 500 feet. A third layer is d iscernible from 14,000 to 15, 000 feet.
FIG. 75. —AN A-SCOPE CLOUD BASE AND TOP PRESENTATION.
A sweep length of 30, 000 feet is depicted. The base of the bottom cloud deck is at 13, 000 feet, with the top m e a s u r i n g 17,000 feet. Above th is l ayer a deck extends from about 18, 000 to 23, 000 feet.
FIG. 77. —AN A-SCOPE CLOUD BASE AND TOP PRESENTATION.
In this p i c tu re a thin layer at 1, 300 feet can be noted. A s t r o n g e r r e t u r n is evident at 6, 000 feet. The third deck extends from 7, 500 to about 9, 000 feet. The top layer indicates a base at 12, 000 feet and a top at 13, 000 feet.
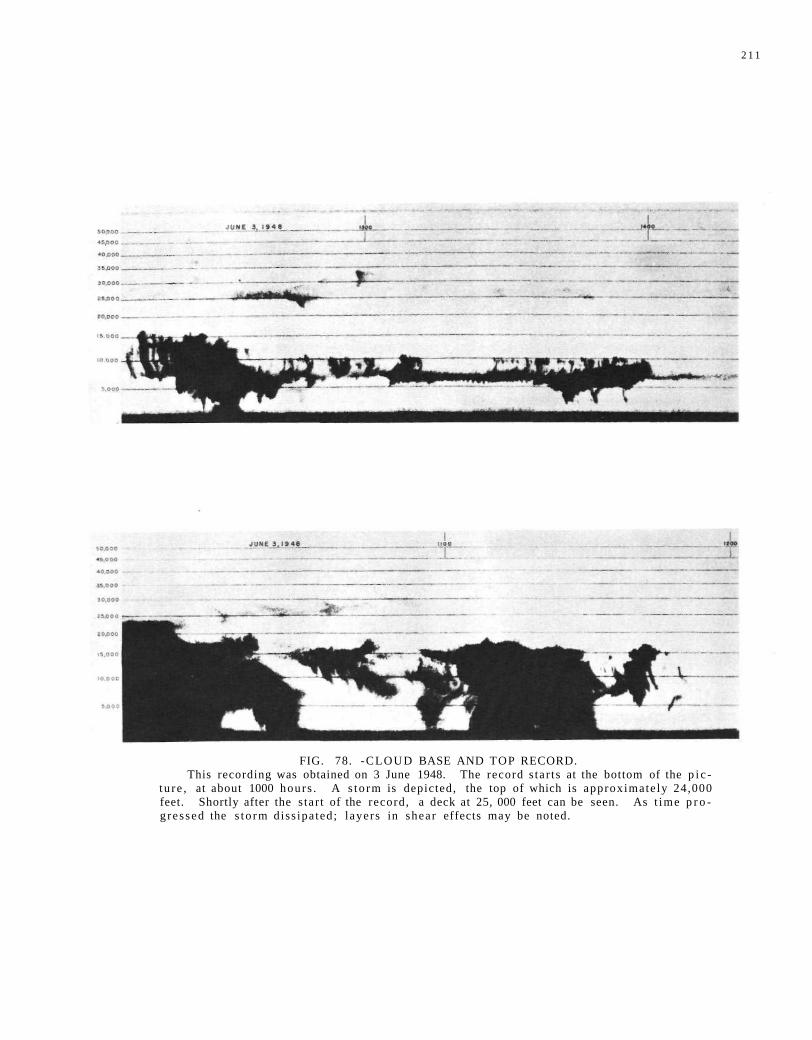
2 1 1
FIG. 78. -CLOUD BASE AND TOP RECORD. This recording was obtained on 3 June 1948. The record s tar t s at the bottom of the p i c
tu re , at about 1000 hours . A s to rm is depicted, the top of which is approximate ly 24,000 feet. Shortly after the s tar t of the record, a deck at 25, 000 feet can be seen. As t ime p r o g res sed the s to rm diss ipated; layers in shear effects may be noted.
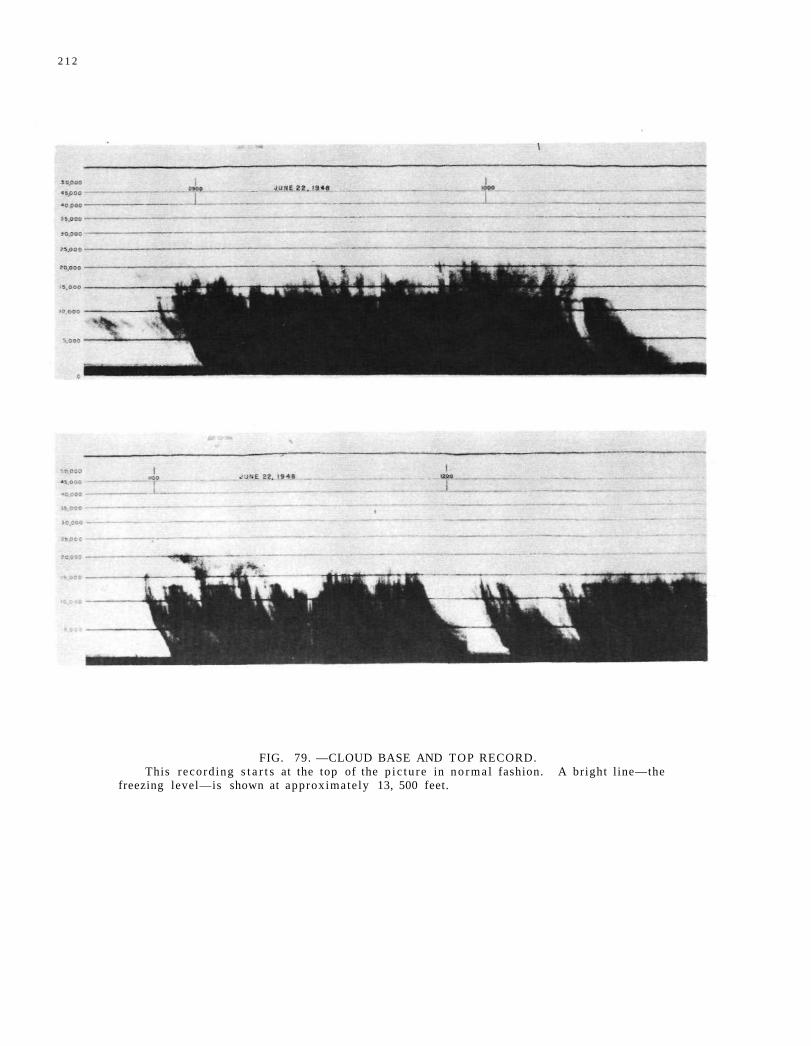
2 1 2
FIG. 79. —CLOUD BASE AND TOP RECORD. This record ing s t a r t s at the top of the p i c tu re in n o r m a l fashion. A bright l ine—the
freezing level—is shown at approximate ly 13, 500 feet.
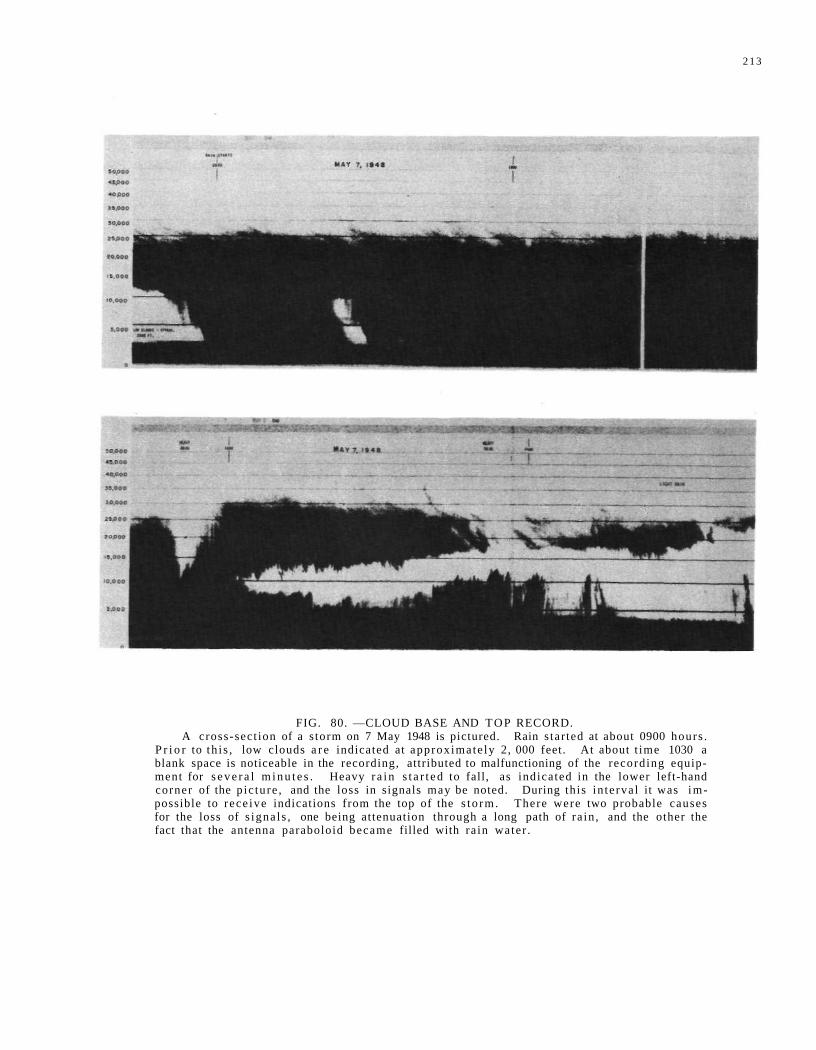
2 1 3
FIG. 80. —CLOUD BASE AND TOP RECORD. A cross-sect ion of a s torm on 7 May 1948 is pictured. Rain s tar ted at about 0900 hours .
P r i o r to th i s , low clouds a r e indicated at approximate ly 2, 000 feet. At about t ime 1030 a blank space is noticeable in the recording, attributed to malfunctioning of the recording equipment for s e v e r a l m i n u t e s . Heavy r a i n s t a r t e d to fall, as indicated in the lower left-hand corner of the p ic ture , and the loss in signals may be noted. During this in te rva l it was impossible to rece ive indications from the top of the s to rm. There were two probable causes for the loss of s igna l s , one being attenuation through a long path of ra in , and the other the fact that the antenna paraboloid became filled with ra in water .
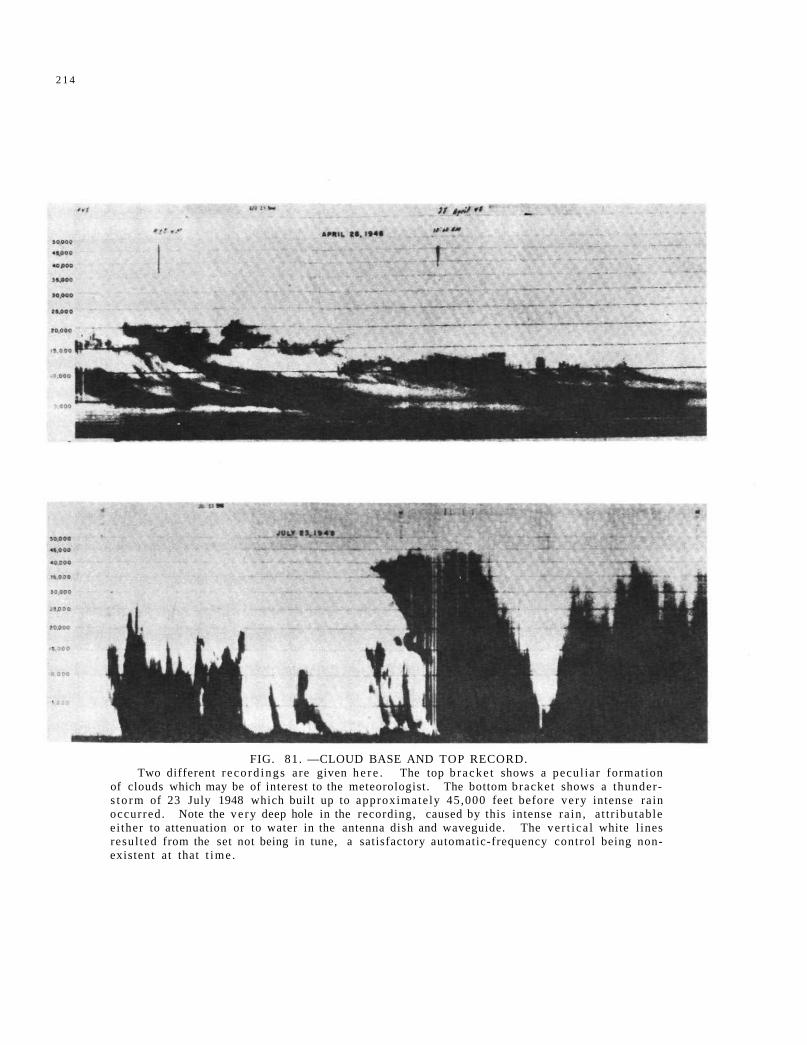
2 1 4
FIG. 81. —CLOUD BASE AND TOP RECORD. Two different r eco rd ings are given h e r e . The top b r acke t shows a pecul iar formation
of clouds which may be of interest to the meteorologist. The bottom bracket shows a thunders t o r m of 23 July 1948 which built up to approximate ly 45,000 feet before very intense rain occurred . Note the ve ry deep hole in the recording, caused by this intense ra in , a t t r ibutable e i ther to attenuation or to water in the antenna dish and waveguide. The ve r t i ca l white l ines resul ted from the set not being in tune, a satisfactory automatic-frequency control being nonexistent at that t ime .
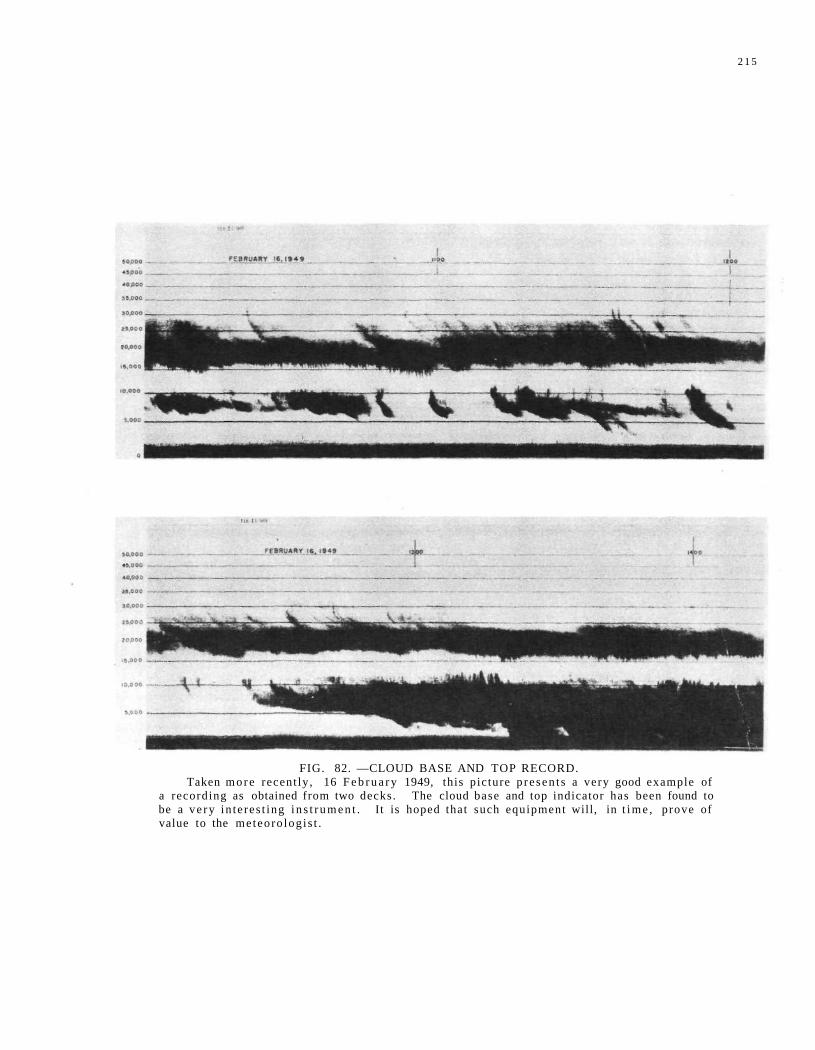
2 1 5
FIG. 82. —CLOUD BASE AND TOP RECORD. Taken m o r e recent ly , 16 F e b r u a r y 1949, this picture p re sen t s a very good example of
a recording as obtained from two decks. The cloud base and top indicator has been found to be a ve ry in te res t ing i n s t r u m e n t . It is hoped that such equipment will, in t i m e , prove of value to the meteoro log i s t .
2 1 6
DISCUSSION
A. C. BEMIS. —Is the re any d i s cus s ion on th i s i n t e r e s t i n g gadge t?
T h e A i r F o r c e i s i n t e r e s t e d i n a n a i r b o r n e model for use on the i r weather reconna issance sh ip s having antennas pointing both upward and downward f r o m the a i r p l a n e , so that they wil l be ab le to ob s e r v e cloud l a y e r s both above and be low t h e m .
You did not say anything abou t " a n g e l s , " M r . Gould.
W. B. GOULD. —I have t r i e d to s t ay c l e a r of tha t subject , Alan, in what I have ment ioned , s i nce the c a u s e s of the " a n g e l " phenomena a r e no t wel l u n d e r s t o o d .
J. R. GERHARDT. 1 — The E l e c t r i c a l E n g i n e e r ing Research Laboratory has recent ly made a s e r i e s of m e a s u r e m e n t s which s e e m to suppor t the e x i s t ence of ange l s . T h e s e m e a s u r e m e n t s involved d i r e c t r e c o r d i n g of t h e f l uc tua t i ons in the index of r e f r a c t i o n o f a t m o s p h e r i c a i r a t m i c r o w a v e f r e quenc i e s .
Modified for a i r c r a f t opera t ion , the C r a i n r e -f r a c t o m e t e r has been flown at he igh t s up to 10, 000 feet mean sea level for locations over the New J e r s e y coas ta l a r e a , Wright F ie ld , Ohio, and i m m e d i a t e l y off the California coas t . F luctuat ions in r e f r a c t i v e index a r e found a t a l l measu red a l t i tudes , p r i m a r i l y in unstable a t m o s p h e r e s but a l s o under s t ab le con di t ions. While the root mean square values of t h e s e fluctuations a r e normal ly smal l and l e s s than 1 p a r t pe r million, individual variat ions of up to 5-10 p a r t s p e r m i l l i o n have b e e n found i n a p p a r e n t l y h o m o geneous a i r masses and up to 20-30 p a r t s pe r m i l l i o n a t ce r t a in a i r cloud in te r faces and a i r m a s s bounda r i e s . F r o m a knowledge of the a i r c r a f t speeds and the p e r i o d s of the o b s e r v e d f luc tua t ions , the s c a l e or s ize of these a t m o s p h e r i c d i scon t inu i t i e s in r e f r a c t i v e index a r e of the o r d e r of a few h u n d r e d feet .
While i t has not been poss ib le to obtain d i r e c t r a d a r conf i rmat ions , the observed m a x i m u m index o f r e f r a c t i o n f l uc tua t i ons , i n t e n s i t i e s and s c a l e s would c e r t a i n l y a p p e a r t o be s u c h a s t o p e r m i t a s i g n i f i c a n t r e t u r n o f m i c r o w a v e r a d i o e n e r g y .
(Ed i to r ' s note. —A m o r e deta i led r e p o r t on the i ndex of r e f r a c t i o n m e a s u r e m e n t s i s to be g iven at the J a n u a r y A. M. S. m e e t i n g . )
W. B. GOULD. —I think that is v e r y i n t e r e s t ing, and we a r e ve ry glad to h e a r about t he se f l u c tua t ions b e c a u s e th i s cloud b a s e and t o p i n d i c a t o r is such a beautiful a n g e l d e t e c t o r .
1Assistant Director of Electrical Engineering Research Laboratory, University of Texas, Austin, Texas.
D. ATLAS. —We have b e e n ope ra t ing a 1 cm. r a d a r very s i m i l a r to the one which Mr . Gould d e s c r i b e d . Al though our p r i m a r y goal i s the study o f c l o u d p h y s i c s , we h a v e o b s e r v e d a n g e l s f r e quent ly . F r o m the n a t u r e of t h e s e echoes and the a s s o c i a t e d m e t e o r o l o g i c a l cond i t ions , I f ee l quite s u r e tha t they a r e no t due t o bugs but a r e a t m o s p h e r i c phenomena. F o r e x a m p l e , we have not iced the appearance of angels on occasion as an o v e r c a s t b r e a k s and the sun c o m e s th rough . Al though bugs like to flit a r o u n d in the sun , i t would be difficult for t h e m to t ake off and get to an a l t i tude of 3, 000 to 4, 000 feet in a few minutes after the clouds b r e a k . A l s o , a n g e l s h a v e b e e n d e t e c t e d j u s t b e f o r e and after rain showers , as well as during some of these s h o w e r s . I doubt tha t bugs would be flying a round u n d e r such c o n d i t i o n s . F i n a l l y , on o c c a s i o n we h a v e o b s e r v e d a n g e l s i n s u c h a b u n d a n c e tha t the sky would have to be black with bugs if each " a n g e l " w e r e a t t r ibu tab le to a bug.
D. D. R E I T E R . 2 — O n e day, s u m m e r of 1949, I found s t r o n g a n g e l r e t u r n s a p p e a r i n g on the A-s c o p e of the c loud b a s e and top ind ica to r a t the Evans Signal L a b s , and they were r e c o r d i n g ve ry well so I decided to s tay a l l night. About sundown, the angels began to d i s a p p e a r . I went home for some lunch, and when I c a m e back I found things w e r e going f a i r l y w e l l e x c e p t t h a t the a n g e l s had begun to i n c r e a s e a t an e n o r m o u s r a t e . T h i s went on, a n d a t m i d n i g h t t h e f a c s i m i l e r e c o r d i n g was sti l l s t ronger and fuller than eve r . The scope mus t have been sa tura ted fully up to about 6, 000 to 8, 000 feet; however, t he r e were no clouds in the sky . This condition remained for a few m o r e hour s , and about four o ' c l o c k the r e c o r d i n g s h o w e d two l a y e r s of a n g e l s . T h e y c a m e down f r o m s c a t t e r e d r e t u r n at about 20, 000 feet during the afternoon and evening to pronounced stratif ications at about 3, 000 or 4, 000 feet. Two s t ra t i f i ca t ions worked down to one , and it g r a d u a l l y d ied off t o w a r d noon the nex t day . I t r i ed to find out if t he r e was anything a b n o r m a l t ak ing p l a c e in the wea the r and in the a i r body above, but t h e r e p o r t s f r o m the m e t e o r o l o g y d e p a r t m e n t s a id t h e r e w a s no th ing a b n o r m a l a t a l l — n o r m a l day, normal p r e s s u r e , no rmal t empe ra tu r e , n o r m a l r e l a t i v e humidi ty—nothing a b n o r m a l .
D. M. SWINGLE. —On an af ternoon l ike th i s , I would expect to see plenty of ange ls , and I imag ine m o s t o f t h e m would go to s a t u r a t i o n , s i m i l a r to c louds and any o the r type of r a d a r s i g n a l s .
( E d i t o r ' s n o t e . —It was a c l e a r , w a r m day. ) 2 Elec t ron ic Scient is t , Wright Air Development
Cente r.
217
D. D. REITER.—There a r e strong radar r e turns in spite of the fact that there is nothing up there . You go out with a pair of field glasses or with a good telescope and you look up and visually one does not see these things.
W. B. GOULD. —I think Dave is a little confused at this point because I do not remember any -thing above something like 10, 000 feet. I think that was the maximum. (Note by Mr. Reiter. — There a r e recordings remaining at Evans Signal Labs if definite proof is des i red . )
A. C. BEMIS. —There is no other scheduled discussion of angels and the atmospheric discontinuities of this type on the rest of the program, so it might be well for those interested to air their views at this t ime . Are there any other comments?
M. L. STONE. 3—I ha ve observed angels on the ten-centimeter MTI (Moving Target Indicator). The cancellation was terr i f ic , yet the angels kept coming in quite strongly. The radar was located on Deer Island in Boston Harbor.
A. C. BEMIS. —Can one say that angels a r e observed more frequently with a vertical pointing set than with one pointing horizontally? Or is it just more convenient to observe them in that d i r ec tion?
W. B. GOULD. —I think that in our case it has been due to the fact that it is a by-product of the cloud base indicator where we were looking ver t i cally and m o s t of them have been seen while we were looking vert ically. The other day, though, we went over to look at angels on the CPS-9, the first t ime I had ever seen them on a CPS-9. At that t ime , we tipped the antenna down so that we had more or less of a horizontal beam, and we saw more.
A. C. BEMIS. —What I was getting at was a clue as to whether these discontinuities tend to occur with stable strat if icat ion in the a tmosphere , or whether just as often they occur with unstable turbulent elements.
R. C. JORGENSEN. —It is very seldom, if ever, that we set our antenna above the level of the horizon. Maybe it is because I do not live right, but I have never seen an angel.
(Editor 's note. —It is a 10-cm. set. )
S. E. REYNOLDS. 4 —What is the possibility of seeing an angel on the inside of a cloud?
3Electronic Engineer, Weather-Radar Project, Massachusetts Institute of Technology, Cambridge, Mass.
4Research Physicist, New Mexico School of Mines.
W. B. GOULD. —I think that the signal from the discontinuity producing this angel signal will be obscured by the cloud echo.
S. E. REYNOLDS. —You might not mistake an angel for precipitation in a cloud?
W. B. GOULD. —I think on three centimeters, it would be ent i re ly masked . I might add that I have never seen an angel on 10 centimeters so that may tie in a bit.
A. C. BEMIS. —We have observed very strong echoes from lightning d i s c h a r g e s . The ionized path of the lightning gives an echo which saturates the radar video even at great distance.
D. M. SWINGLE. —I might briefly summarize what we do know about angels. Insects and birds can certainly cause such echoes. However, insects form a rather flimsy explanation when one observes angels occurring at temperatures much below 60° F . , while visual checks for b i rds have not supported that explanation in the cases most frequently seen. If these two causes a r e ruled out as the cause of mos t angel observat ions , the next most obvious cause would be discontinuities of dielectric constant or of i t s gradient occurr ing along surfaces in the a tmosphere . The values of the dielectric gradient required are high, and the requirements on the smoothness of the surfaces rather severe, yet still within the realm of possibility. Mr. Ger-h a r d t ' s comments on observed gradients of r e fractive index in the atmosphere a re encouraging. The concentration of angels along inversions lends ' some support to this theory. One suspects that many angels may be caused by rapid changes in atmospheric dielectric constant, perhaps s t i r red up by turbulence.
D. ATLAS. —You were asking about detecting angels in clouds and s torms. Well, it is possible to differentiate between angels and precipitation echoes by the fact that their signals a r e coherent and last a long period of time relative to a precipitation echo. Of course, it would be difficult to do this on a PPI scope. You would have to utilize the A-scope and watch the flutter characteristics of the echo. The angel echo makes a definite break in the A-scope base line and might last as long as a few seconds, while precipitation and cloud echoes flutter up and down very much like receiver noise. One must be a little cautious, however, since we have occasionally observed angels with flutter char acteristics similar to those of precipitation echoes, and we had to go look out to make sure that it was not raining.
A. C. BEMIS.—Was that pointing horizontally ?
218
D. ATLAS. —Vertically.
A. C. BEMIS. —I was trying to picture them as an ins tab i l i ty phenomenon, s i m i l a r to "heat waves. "
D. ATLAS. —I would like to say that these bubbles, strong re turn from a small volume, are extremely concentrated; they are very close together. The beam at the height of the level of these angels was perhaps 2, 000 feet, that is perhaps 30 feet wide, so that it would have to be a very large number of angels per unit volume in order to give that flood, overlapping return in time and space, characteristic.
W. B. GOULD. —Mr. Atlas, you said something about the angels lasting for a very long period of t ime. I think the longest duration that we have ever observed has been something like ten seconds. That is very r a r e . I think it is more like two or three seconds and sometimes less than a second.
A. C. BEMIS. —Mr. Atlas means that the echoes on an A-scope look like airplane signals rather than precipitation signals.
D. ATLAS. —Yes, except that their durations a r e of the order noted by Mr. Gould. Cloud and precipitation echoes rarely pers is t in intensity for more than 0.01 second.
D. D. REITER. —The angel signals would fill the radar scope to a saturation up to.7, 000 feet so it looked like rain. In this case, the rapid summation of return signals in the stratifications, or unusual strength, will go to saturation in the amplifier networks.
A. C. BEMIS. —This is an important subject in one respec t . Since we do not know what these angels a r e as yet, we do not know how to use the information; but it appears to be meteorological in origin and therefore of interest to meteorologists.
UNIDENTIFIED. 5—Can you explain why a wave length of 0. 86 cm. was selected for the cloud set?
W. B. GOULD. —I can very briefly say that is based on theoretical work which was done by Ray Wexler. Ray wrote a memo in which he found that the shorter the wave length we went to, within l imits , the better return we might get from the cloud par t i c les , and I think he dodged the oxygen resonance band in that he wanted to stay away from this region and there were some other gases to avoid. At the t ime when this study was made the only equip-
5During the discussion there were comments by persons who were unidentified in the recording.
ment that was available was on a wave length of something like 0. 86 c m . , and that looked like a very good spot to locate in order to see cloud echoes.
Ray, could you elaborate any more on that study you made ?
R. WEXLER. —It was two or three years since I made that study, but as I recal l , in order to see the small drops, the signal return is inversely proportional to the fourth power of wave length. That means the smaller we go, of course, the bigger the signal, other factors remaining constant. But there were some attenuation bands that we wanted to stay away from—one at 1. 23 cm. which is due to water vapor, another at 1. 33 cm. There is another band that is an oxygen band at about 0. 6 cm. If you get below 0. 6 c m . , there is another attenuation band which would have a maximum at about 0. 2 cm. I donot think there was much to consider below about 0. 7 cm. because there are too many bad attenuation bands. I chose 0. 9 cm. as being a fair guess.
A. C. BEMIS. —Dr. Austin at M. I. T. made a similar study. Can you tell us anything about that, Polly?
P. M. AUSTIN. --I cannot say very much more than Ray has already said. I was studying the prope r t i e s of a par t i cu la r set whose wave length was a l ready fixed. There is also the question of how much power can be produced efficiently at the shorter wave lengths; so the engineering details would have to be taken into consideration as well as the scattering and attenuation at different wave lengths.
M. G. H. LIGDA. 6 —I would like to point out jus t one thing and it is a l i t t le off the subject of the proper frequency of cloud detection equipment. I was quite struck, Bill, with your pictures (which I have not studied or examined carefully before). The dis t inct b reak in the base line of the sweep through the cloud echoes suggests to me that the fluctuation characteristics of the echoes from clouds may be significantly different from that of rain, where we very seldom see a distinct break in the base line. Occasionally, with echoes of saturation strength, the base line break may extend clear up to the saturation point. I would like to hear a few suggestions of what might cause this break, whether it be the pulse repetition frequency, or difference in motion of cloud drops and rain drops, and whether anybody thinks it is significant or not.
UNIDENTIFIED. —I think it is very significant to stable clouds, anyway.
Research Assistant, Weather-Radar Project, Massachusetts Institute of Technology, Cambridge, Mass.

219
W. B. GOULD. —I think that is a characte r i s t i c . I am a little afraid to jump off the deep end h e r e and te l l you what I think makes it that way.
D. ATLAS. —I do not think so. We have the same type of radar , of course , and have actually
checked the flutter characteristics of cloud echoes. Surprisingly enough, the spectra of fluctuations as measured by Rasaph are quite broad, resembling those of rainfall. On the A-scope, however, when the receiver gain is increased, all the echoes will saturate and a distinct break will appear in the base line.
MONDAY EVENING SESSION INTRODUCTORY REMARKS
BY H. R. BYERS
The sess ion this evening is going to concern itself with the very practical problem of radar, and it happens to be the one in which the Water Survey here is the most interested and which also a number of you have done work on. I suppose the reason for my selection as chairman for this particular section is that I became extremely interested in this subject when I first started working with radar on the Thunderstorm Project in Florida. I very naively saw that it had great possibilities for the quantitative measurement of rainfall. Immediately, with the help of some of my colleagues, we started analyzing the data on the Thunderstorm Project in r e gard to some of the radar material vs. rainfall and came out with some r e su l t s that indicated to us quite clearly that radar had possibilities for quantitative measurement of rainfall, particularly over small basins where small showers are important. I had yet to discover , however, the tremendous difficulties that were involved in the obtaining of the
precise data, and it has been a process of education for me ever since, and I know that my education will continue this evening as we hear from various people who are going to talk about this subject.
When you get a bunch of r ada r engineers to gether, you are in sort of a dream world. It seems that they always talk about the radars of the future, the radars that are just barely on the drawing board. We who a r e concerned with the more practical a s pects can not dream so far ahead in the future. We, however, like to think about the radars that a re just going into production. This evening we have the opportunity of hearing about one of these radars— as a m a t t e r of fact, what appea r s to be the best radar for our purposes , namely the AN/CPS-9, and we a re fortunate to have the man who is very deeply engaged in that development this evening, who, together with his colleague, has scheduled this paper. Details of the model AN/CPS-9 radar will be presented by E. L. Williams, Jr . and W. J. Schiff.
221
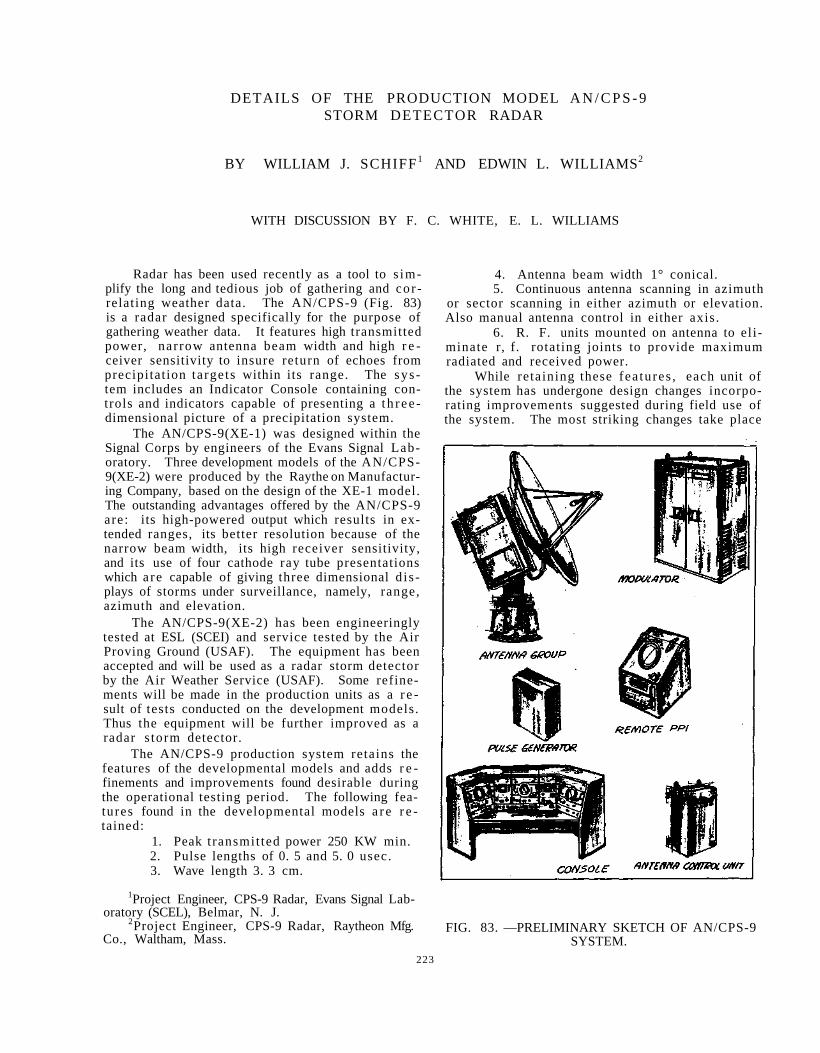
DETAILS OF THE PRODUCTION MODEL A N / C P S - 9 STORM DETECTOR RADAR
BY WILLIAM J. SCHIFF1 AND EDWIN L. WILLIAMS2
WITH DISCUSSION BY F. C. WHITE, E. L. WILLIAMS
Radar has been used recently as a tool to s implify the long and tedious job of gathering and cor relating weather data. The AN/CPS-9 (Fig. 83) is a radar designed specifically for the purpose of gathering weather data. It features high transmitted power, narrow antenna beam width and high r e ceiver sensitivity to insure return of echoes from precipitat ion targets within its range. The sys tem includes an Indicator Console containing controls and indicators capable of presenting a t h r e e -dimensional picture of a precipitation system.
The AN/CPS-9(XE-1) was designed within the Signal Corps by engineers of the Evans Signal Laboratory. Three development models of the AN/CPS-9(XE-2) were produced by the Raythe on Manufacturing Company, based on the design of the XE-1 model. The outstanding advantages offered by the AN/CPS-9 are: its high-powered output which results in extended ranges, its better resolution because of the narrow beam width, its high receiver sensitivity, and its use of four cathode ray tube presentations which a re capable of giving three dimensional d i s plays of storms under surveillance, namely, range, azimuth and elevation.
The AN/CPS-9(XE-2) has been engineeringly tested at ESL (SCEI) and service tested by the Air Proving Ground (USAF). The equipment has been accepted and will be used as a radar storm detector by the Air Weather Service (USAF). Some refinements will be made in the production units as a r e sult of tests conducted on the development models. Thus the equipment will be further improved as a radar s torm detector.
The AN/CPS-9 production system retains the features of the developmental models and adds r e finements and improvements found desirable during the operational testing period. The following features found in the developmental models a r e r e tained:
1. Peak t ransmit ted power 250 KW min. 2. Pulse lengths of 0. 5 and 5. 0 usec. 3. Wave length 3. 3 cm.
1Project Engineer, CPS-9 Radar, Evans Signal Laboratory (SCEL), Belmar, N. J.
2Project Engineer, CPS-9 Radar, Raytheon Mfg. Co., Waltham, Mass.
4. Antenna beam width 1° conical. 5. Continuous antenna scanning in azimuth
or sector scanning in either azimuth or elevation. Also manual antenna control in either axis.
6. R. F. units mounted on antenna to el iminate r, f. rotating joints to provide maximum radiated and received power.
While retaining these fea tures , each unit of the system has undergone design changes incorporating improvements suggested during field use of the system. The most striking changes take place
FIG. 83. —PRELIMINARY SKETCH OF AN/CPS-9 SYSTEM.
223
224
in the antenna pedestal and the console. A picture of the over-all system will serve as a guide as we describe these units.
Antenna Pedestal . A completely new antenna pedestal is being designed with the following features:
1. 1000# weight (excluding weight of t r ans mitter-receiver and dehydrator).
2. L a r g e r base with 32" bolt c i rc le for mounting.
3. A total of 48 slip r ings , including 10 s p a r e s (for use with auxi l iary equipment or for repai r ) .
4. Rebalanced to eliminate need for wind balancing fins and spring used in the model.
5. The t r a n s m i t t e r - r e c e i v e r , which is mounted on the antenna, is being redesigned to provide space for an echo box. Also, the R. F. plumbing is being reworked to improve the acces sibil i ty and ease of changing the magnetron and duplexing tubes. An improved and simplified dehydrator will be mounted on the transmitter to eliminate the need for rotary air joints.
Indicator Console. The indicators a r e to be relocated and modified as follows (location from left to right):
1. 7-inch RHI. A 5 " tube was formerly used.
2. 5-inch A-R scope. 3. 7-inch main PPI. 4. Indicator control (this is the ranging
unit). 5. 7-inch off-center PPI (this replaces
the " B " scope). The console will also include the antenna scan
control equipment and power supplies for the above units. A blower system is to be built into exhaust the heated air from the console to a point outside the room in which it is located. The 7-inch indicators have been designed to use the same type of front panel bezel. Synchros and handcrank gearing are part of these bezels. Note that there is a built-in camera hanger on each of these indicators . A specially designed polaroid camera is being developed by the Signal Corps to be supplied with each equipment for recording scope indications. A jack is located on each panel to supply voltage for operating lights within the camera.
The main console PPI and the remote PPI have cam-operated microswitches built-in for synchronization of single frame movie type cameras . Two switches a re provided, one at 0° and the other at 180° so the location of the film advance can be chosen to fit the storm pattern or local conditions.
The developmental models permitted detailed study of a smal l a r e a through use of a precision B scope. Field use of the equipment showed that the B scope presentation was somewhat confusing and did not offer sufficient flexibility. The new system replaces the B scope with an off-center PPI capable of 2 radii off-center displacement. This scope permits enlarging the a rea desired for de
tailed study. 10° azimuth marker s a r e available on this unit.
The two console PPI's provide four fixed ranges and three variable ranges . This added provision of variable ranges provides increased usefulness of the scope viewing area by permitting sweep expansion to most effectively display a storm pattern.
An elevation angle s trobe generator is provided which causes the PPI displays to flash at an angle which is 5 t imes the elevation angle. This permits automatic 'recording of the elevation angle in PPI scope photos and it indicates elevation angle to the remote PPI operator .
The servo accuracy of all the PPI ' s has been improved to provide an indication with less than 1° of e r ror . This is rather a small error when using a l-speed synchro system.
The range scope now includes two additional A type sweeps of 75- and 400-mile ranges . The R sweep circuits have been modified to present the range strobe on the 5-mile sweep as well as on the 20 and to permi t ranging with the strobe down to 1/2 mile when the system is operated on long pulse. (On the model, the minimum range was about 12 miles on long pulse. )
The console layout has been carefully studied to improve the location of operating controls. All controls not normal ly used a r e now located back of panel. All controls common to two or more units a re located in the same re la t ive position on the units, i. e. , range switches are always in the lower left corner. Lighting will be provided for illumination of the control labeling.
An item of in teres t to some of you is that all 6J6 tubes have been el iminated from the design. This tube was the only miniature twin triode available at the t ime the developmental models were built. The use of this tube turned into a field maintenance headache. All circuits have been checked to use newer type tubes to eliminate this problem.
A telephone switchboard is provided to permit communications between the remote telephone stations at the antenna, modulator, remote PPI , and the console.
Remote PPI. Redesign on this unit is primarily of the nature which will make it easier to produce. A blower is being added and the PPI servo amplifier circuit is being changed to use the same servo being designed for the console indicators.
Pulse Generator. Circuit design has been com-pletely checked for use of 12AT7 tubes in place of 6J6 's . However, this has resulted in practically no circuit changes. General appearance and layout of the unit will be unchanged.
Antenna Control Unit. This unit was formerly made up mostly of synchro balancing capacitors and a few control c i rcui t s . The new unit will contain the electronic servo amplifiers for controlling the antenna hydraulic servo. In addition to the servo amplifiers, the antenna safety switch and a telephone station are located at the antenna control unit.
DISCUSSION
225
F . C . WHITE. *—Would M r . Wi l l i ams m i n d giving us a l i t t l e i n fo rma t ion on what the r a in f a l l he igh t and r a t e has to be to d e t e c t a s t o r m with a 4 0 0 - m i l e r a n g e with th i s p a r t i c u l a r r a d a r ?
E . L . W I L L I A M S . — T h e r a i n would have t o be at a he igh t of 80, 000 feet to be de t ec t ed at 400
*Air Transport Association.
m i l e s under n o r m a l a t m o s p h e r i c condi t ions . Since th i s i s an ex t remely r a r e o c c u r r e n c e , s t o r m d e t e c t ion at this maximum range will probably only o c c u r under conditions which cause the b e a m to bend. Of course , this a l s o depends on the siting of the an tenna . Any ra in which occurred at th is alt i tude would p r o b ably give a r e t u r n on the r a d a r s ince only 1/100 of the beam need be filled with light r a i n to 'give a d e t e c t a b l e s i g n a l a t t h i s r a n g e . The b e a m width i s 37, 000 feet a t t h i s r a n g e .
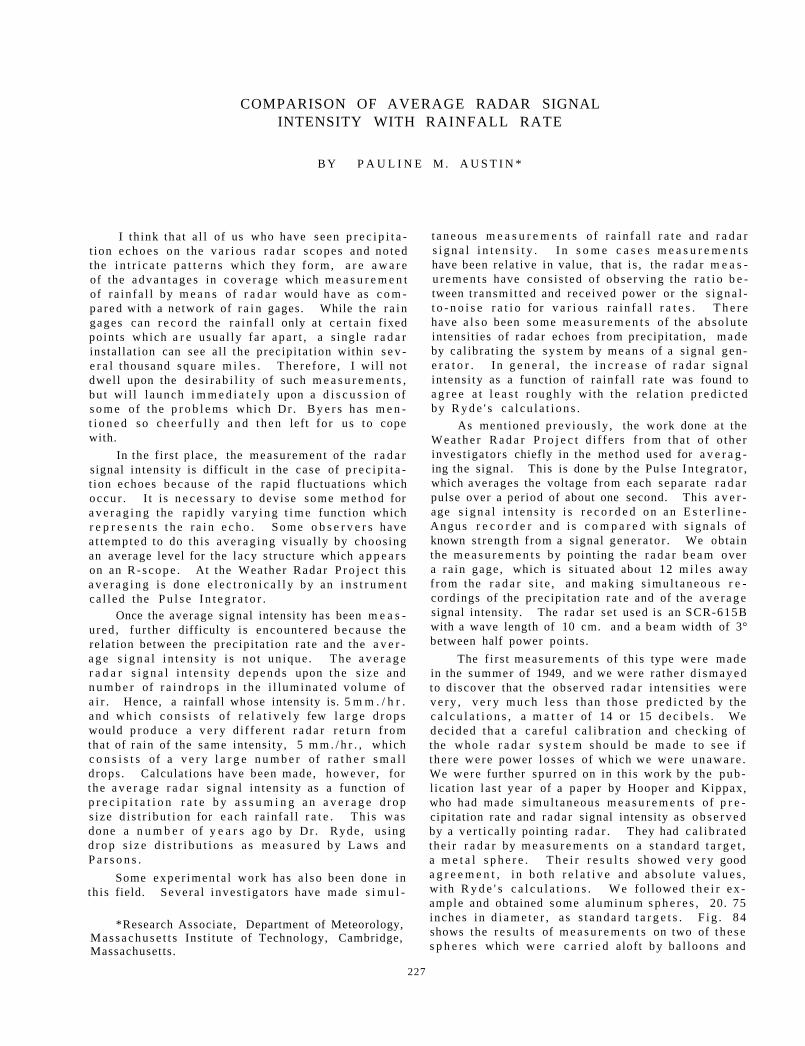
COMPARISON OF AVERAGE RADAR SIGNAL INTENSITY WITH RAINFALL RATE
B Y P A U L I N E M . A U S T I N *
I th ink that a l l of us who have seen p r e c i p i t a t ion echoes on the v a r i o u s r a d a r s copes and no ted the i n t r i c a t e p a t t e r n s which they fo rm, a r e a w a r e of the advan t ages in c o v e r a g e which m e a s u r e m e n t of r a in f a l l by m e a n s of r a d a r would have as c o m p a r e d with a network of r a i n gages. While the r a i n gages can r e c o r d the r a i n f a l l only a t c e r t a i n fixed poin ts which a r e usua l ly fa r a p a r t , a s ingle r a d a r instal lat ion can see al l the precipi ta t ion within s e v e r a l thousand squa re m i l e s . The re fo r e , I wi l l not dwel l upon the d e s i r a b i l i t y of such m e a s u r e m e n t s , bu t wi l l l aunch i m m e d i a t e l y upon a d i s c u s s i o n of s o m e of the p r o b l e m s which Dr . B y e r s has m e n t i o n e d so c h e e r f u l l y a n d t hen left for u s to cope with.
In the first place, the measurement of the r a d a r signal intensi ty is difficult in the case of p r e c i p i t a t ion echoes because of the rapid f luctuations which occu r . I t i s n e c e s s a r y to devise some m e t h o d for a v e r a g i n g the r ap id ly v a r y i n g t i m e function which r e p r e s e n t s t h e r a i n e c h o . Some o b s e r v e r s have a t t empted to do this ave rag ing visual ly by choos ing an average level for the lacy s t ructure which a p p e a r s on an R - s c o p e . At the Weather Radar P r o j e c t th i s a v e r a g i n g i s done e l e c t r o n i c a l l y by an i n s t r u m e n t ca l l ed the P u l s e I n t e g r a t o r .
Once the average signal intensity has been m e a s ured , fur ther difficulty i s encounte red b e c a u s e the relat ion between the precipi ta t ion ra te and the a v e r a g e s i g n a l i n t e n s i t y i s no t un ique . The a v e r a g e r a d a r s i g n a l i n t e n s i t y d e p e n d s upon the s i ze and n u m b e r of r a i n d r o p s in the i l l umina ted vo lume of a i r . Hence, a rainfall whose intensity is. 5 m m . / h r . and w h i c h c o n s i s t s of r e l a t i v e l y few l a r g e d r o p s would p r o d u c e a v e r y d i f fe ren t r a d a r r e t u r n f rom that of ra in of the same intensity, 5 m m . / h r . , which c o n s i s t s of a v e r y l a r g e n u m b e r of r a t h e r s m a l l d rops . Calculations have been made, however , for the a v e r a g e r a d a r s igna l in tens i ty as a function of p r e c i p i t a t i o n r a t e b y a s s u m i n g a n a v e r a g e d rop s i ze d i s t r i bu t i on for e a c h ra infa l l r a t e . Th i s was done a n u m b e r of y e a r s a g o by Dr . Ryde , us ing d r o p s i z e d i s t r i b u t i o n s a s m e a s u r e d b y L a w s and P a r s o n s .
Some expe r imen ta l work has a l s o been done in th is field. Severa l inves t iga to r s have made s i m u l -
*Research Associate, Department of Meteorology, M a s s a c h u s e t t s Insti tute of Technology, Cambridge, Massachusetts.
t a n e o u s m e a s u r e m e n t s o f r a i n f a l l r a t e and r a d a r s i g n a l i n t e n s i t y . I n s o m e c a s e s m e a s u r e m e n t s have been relat ive in value, that i s , the r ada r m e a s u r e m e n t s have cons i s ted of observ ing the r a t i o b e tween t ransmi t ted and received power or the s i g n a l -t o - n o i s e r a t i o for v a r i o u s r a i n f a l l r a t e s . T h e r e have a l s o been some m e a s u r e m e n t s of the abso lu t e intensit ies of radar echoes from precipitat ion, m a d e by cal ibrat ing the s y s t e m by m e a n s of a s ignal gen e r a t o r . In g e n e r a l , the i n c r e a s e o f r a d a r s igna l in tens i ty as a function of ra infa l l r a t e was found to a g r e e a t l e a s t rough ly with the r e l a t i o n p r e d i c t e d by R y d e ' s c a l c u l a t i o n s .
As ment ioned p rev ious ly , the work done at the W e a t h e r R a d a r P r o j e c t d i f fe r s f r o m tha t of o the r invest igators chiefly in the method used for a v e r a g ing the signal. This is done by the Pulse In t eg ra to r , which averages the voltage from each separa te r a d a r pulse over a period of about one second. This a v e r age s i g n a l i n t e n s i t y i s r e c o r d e d on an E s t e r l i n e -Angus r e c o r d e r and i s c o m p a r e d wi th s i g n a l s o f known s t rength f rom a signal genera to r . We obtain the m e a s u r e m e n t s by pointing the r a d a r b e a m over a ra in gage , which is s i tua ted about 12 m i l e s away f rom the r a d a r s i t e , and making s imu l t aneous r e cordings of the precipi ta t ion r a t e and of the a v e r a g e signal intensity. The radar set used is an SCR-615B with a wave length of 10 cm. and a b e a m width of 3° between half power points .
The f i rs t m e a s u r e m e n t s of this type were made in the summer of 1949, and we were ra ther d i s m a y e d to d iscover that the observed r a d a r in tens i t ies w e r e v e r y , v e r y m u c h l e s s than t h o s e p r e d i c t e d by the c a l c u l a t i o n s , a m a t t e r of 14 or 15 d e c i b e l s . We dec ided t ha t a c a r e f u l c a l i b r a t i o n and checking of the who le r a d a r s y s t e m shou ld be m a d e to s e e i f the re were power los ses of which we were u n a w a r e . We were further spu r red on in this work by the pub l icat ion l a s t year of a paper by Hooper and Kippax, who had made s imul taneous m e a s u r e m e n t s of p r e cipitation rate and radar signal intensity as o b s e r v e d by a ver t i ca l ly pointing r a d a r . They had c a l i b r a t e d the i r r a d a r by m e a s u r e m e n t s on a s t andard t a r g e t , a m e t a l s p h e r e . T h e i r r e s u l t s showed v e r y good a g r e e m e n t , i n bo th r e l a t i v e and a b s o l u t e v a l u e s , with R y d e ' s c a l c u l a t i o n s . We fol lowed t h e i r e x ample and obtained some a luminum s p h e r e s , 20. 75 inches i n d i a m e t e r , a s s t a n d a r d t a r g e t s . F i g . 84 shows the r e s u l t s of m e a s u r e m e n t s on two of t h e s e s p h e r e s which w e r e c a r r i e d aloft by ba l loons and
227
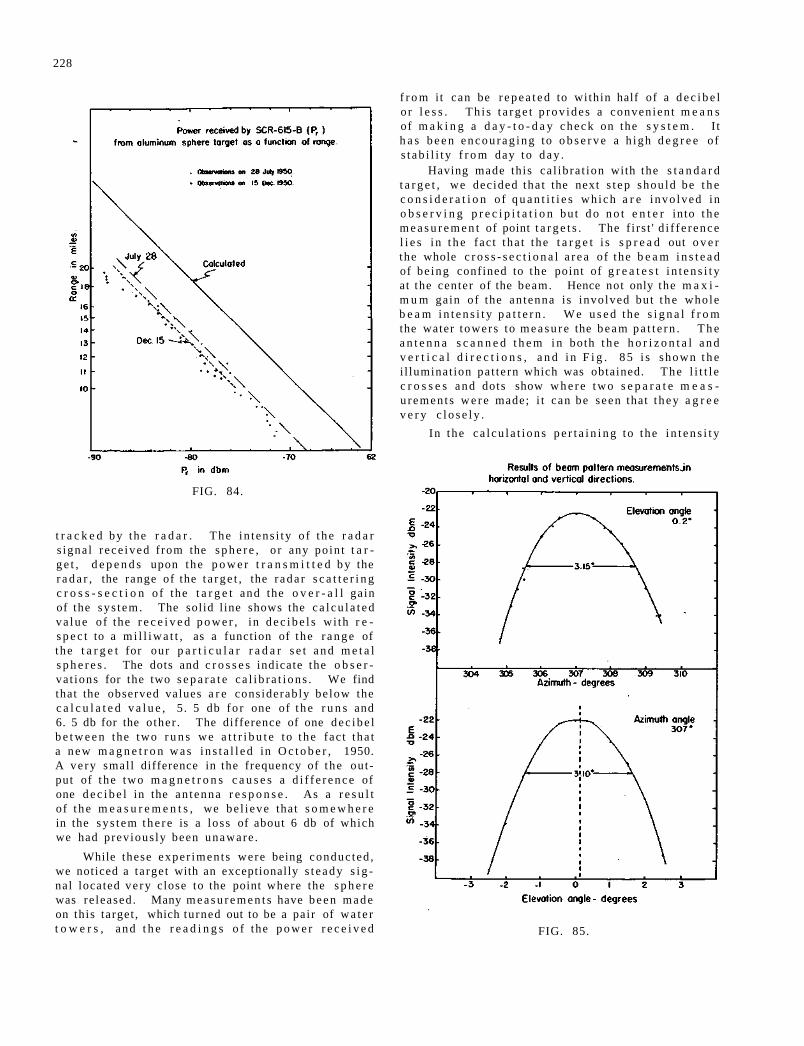
228
FIG. 84.
t r a c k e d by the r a d a r . The in t ens i ty o f t h e r a d a r s igna l r ece ived f rom the s p h e r e , o r any poin t t a r g e t , d e p e n d s upon the p o w e r t r a n s m i t t e d b y the r a d a r , the range of the t a r g e t , the r a d a r s c a t t e r i n g c r o s s - s e c t i o n o f the t a r g e t and the o v e r - a l l gain of the sys t em. The solid l ine shows the c a l c u l a t e d va lue of the r e c e i v e d p o w e r , in d e c i b e l s wi th r e s p e c t to a m i l l i w a t t , as a function of the r a n g e of the t a r g e t for our p a r t i c u l a r r a d a r s e t a n d m e t a l s p h e r e s . The dots and c r o s s e s indicate the o b s e r va t ions for the two s e p a r a t e c a l i b r a t i o n s . We find that the observed values a r e considerably be low the c a l c u l a t e d v a l u e , 5. 5 db fo r one of t h e r u n s and 6. 5 db for the o ther . The difference of one d e c i b e l b e t w e e n the two r u n s we a t t r i b u t e to t h e fac t tha t a new m a g n e t r o n w a s i n s t a l l e d in O c t o b e r , 1950. A ve ry smal l difference in the frequency of the out put of the two m a g n e t r o n s c a u s e s a d i f f e r e n c e of one d e c i b e l in the an tenna r e s p o n s e . As a r e s u l t of t h e m e a s u r e m e n t s , we be l i eve that s o m e w h e r e in the sy s t em t h e r e is a loss of about 6 db of which we had previous ly been unaware .
While these exper iments were being conduc ted , we noticed a ta rge t with an exceptionally s t e a d y s i g nal located ve ry close to the point where the s p h e r e was re leased . Many m e a s u r e m e n t s have b e e n m a d e on this target , which turned out to be a pai r of w a t e r t o w e r s , and t h e r e a d i n g s o f the p o w e r r e c e i v e d
f r o m it can be r e p e a t e d to within half of a d e c i b e l o r l e s s . Th i s t a r g e t p rov ides a convenien t m e a n s of m a k i n g a d a y - t o - d a y check on the s y s t e m . I t h a s b e e n e n c o u r a g i n g to o b s e r v e a h igh d e g r e e of s t a b i l i t y f r o m day t o d a y .
Having made this ca l ib ra t ion with the s t a n d a r d t a r g e t , we decided tha t the next s t e p shou ld be t h e c o n s i d e r a t i o n o f q u a n t i t i e s wh ich a r e invo lved in o b s e r v i n g p r e c i p i t a t i o n bu t d o n o t e n t e r into t h e m e a s u r e m e n t of point t a r g e t s . The f i rs t ' d i f f e r ence l i e s i n t h e fac t tha t the t a r g e t i s s p r e a d out o v e r the whole c r o s s - s e c t i o n a l a r e a of the b e a m i n s t e a d of be ing confined to the point of g r e a t e s t i n t e n s i t y at the center of the beam. Hence not only the m a x i m u m gain of the an tenna i s involved but t h e whole b e a m i n t e n s i t y p a t t e r n . W e u s e d the s i g n a l f r o m the water towers to m e a s u r e the b e a m p a t t e r n . T h e a n t e n n a s c a n n e d t h e m i n both t h e h o r i z o n t a l a n d v e r t i c a l d i r e c t i o n s , a n d i n F i g . 8 5 i s shown t h e i l luminat ion pa t te rn which was obtained. The l i t t l e c r o s s e s and dots show w h e r e two s e p a r a t e m e a s u remen t s w e r e made; i t can be seen that t hey a g r e e v e r y c l o s e l y .
In the ca l cu l a t i ons p e r t a i n i n g to the i n t e n s i t y
FIG. 85.
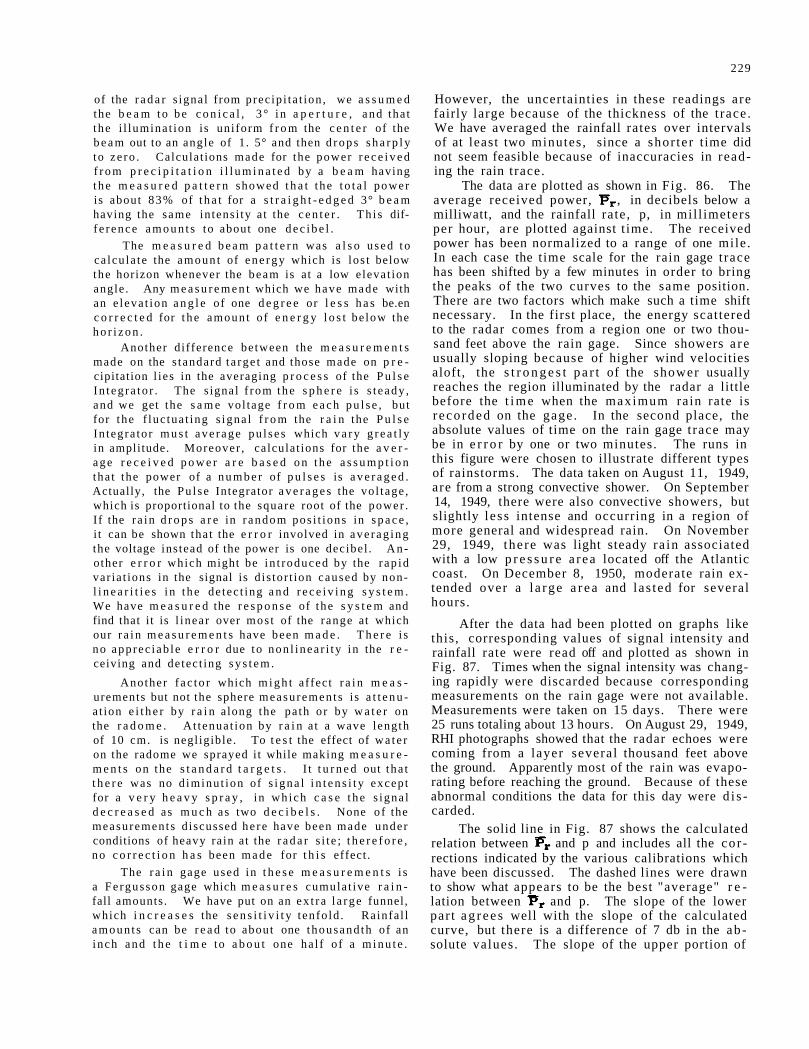
229
of the r a d a r s ignal from prec ip i ta t ion , we a s s u m e d the b e a m t o b e c o n i c a l , 3 ° i n a p e r t u r e , and tha t the i l lumina t ion is uniform f r o m the c e n t e r of the b e a m out to an angle of 1. 5° and then d r o p s s h a r p l y to ze ro . Calculat ions made for the power r e c e i v e d f r o m p r e c i p i t a t i o n i l l u m i n a t e d by a b e a m having t h e m e a s u r e d p a t t e r n showed t h a t the t o t a l power is about 83% of t h a t for a s t r a i g h t - e d g e d 3° b e a m having the same in tens i ty a t the c e n t e r . Th i s diff e r ence a m o u n t s to about one d e c i b e l .
The m e a s u r e d b e a m p a t t e r n was a l s o used t o ca lcu la te the amoun t of e n e r g y which is los t below the horizon whenever the beam is at a low e levat ion angle . Any m e a s u r e m e n t which we have made with an e leva t ion a n g l e of one d e g r e e or l e s s h a s be.en c o r r e c t e d for t h e amount of e n e r g y l o s t be low the h o r i z o n .
Another difference be tween the m e a s u r e m e n t s made on the s tandard t a rge t and those made on p r e cipitation l ies in the averaging p r o c e s s of the P u l s e In t eg ra to r . The s ignal f rom t h e s p h e r e i s s t eady , and we get the s a m e vol tage f r o m e a c h p u l s e , but for the f luc tua t ing s igna l f r o m the r a i n the P u l s e In tegra to r m u s t ave rage pu l se s which v a r y g r e a t l y in amplitude. Moreover , calculat ions for the a v e r age r e c e i v e d p o w e r a r e b a s e d o n t h e a s s u m p t i o n tha t the power of a n u m b e r of p u l s e s is a v e r a g e d . Actually, the Pu l se Integrator a v e r a g e s the vo l tage , which is proportional to the square root of the power . I f the r a in d r o p s a r e in r andom pos i t ions in s p a c e , i t can be shown tha t the e r r o r involved in ave rag ing the voltage ins tead of the power is one decibel . A n other e r r o r which might be in t roduced by the r ap id var ia t ions in the signal is d is tor t ion caused by non-l i n e a r i t i e s i n t h e de tec t ing a n d r e c e i v i n g s y s t e m . We have m e a s u r e d the r e s p o n s e of the s y s t e m and find that it is l inear over mos t of the range at which our r a i n m e a s u r e m e n t s have been m a d e . T h e r e i s no apprec iab le e r r o r due to non l inea r i ty in the r e ceiving and detec t ing s y s t e m .
Another f ac to r which m i g h t affect r a i n m e a s urements but not the sphere measuremen t s is a t t e n u a t ion e i t h e r by r a i n along the pa th or by w a t e r on the r a d o m e . At tenua t ion by r a i n a t a wave length of 10 cm. is negl igible . To t e s t the effect of w a t e r on the radome we sprayed i t while making m e a s u r e m e n t s on the s t a n d a r d t a r g e t s . I t t u r n e d out tha t t h e r e was no d iminu t ion of s i g n a l i n t e n s i t y except for a v e r y h e a v y s p r a y , in wh ich c a s e t h e s igna l d e c r e a s e d as m u c h as two d e c i b e l s . None o f the measurements d iscussed he re have been made under conditions of heavy rain at the r a d a r s i t e ; t h e r e f o r e , no c o r r e c t i o n h a s been m a d e for t h i s effect .
The r a i n gage used in t h e s e m e a s u r e m e n t s i s a Fe rgusson gage which m e a s u r e s cumula t ive r a i n fall amounts . We have put on an ex t r a l a rge funnel, which i n c r e a s e s the s e n s i t i v i t y tenfo ld . Rainfa l l amoun t s can be r e a d to about one thousand th of an inch and t h e t i m e to a b o u t one ha l f of a m i n u t e .
However, the uncertainties in these readings are fairly large because of the thickness of the t race . We have averaged the rainfall rates over intervals of at least two minutes , since a shor te r time did not seem feasible because of inaccuracies in reading the rain t race.
The data are plotted as shown in Fig. 86. The average received power, , in decibels below a milliwatt, and the rainfall rate , p, in mil l imeters per hour, a re plotted against t ime. The received power has been normalized to a range of one mile. In each case the t ime scale for the rain gage t race has been shifted by a few minutes in order to bring the peaks of the two curves to the same position. There are two factors which make such a time shift necessary. In the first place, the energy scattered to the radar comes from a region one or two thousand feet above the rain gage. Since showers a r e usually sloping because of higher wind velocities aloft, the s t r o n g e s t p a r t of the shower usually reaches the region illuminated by the radar a little before the t i m e when the maximum rain rate is r eco rded on the gage . In the second place, the absolute values of time on the rain gage t race may be in e r r o r by one or two minutes. The runs in this figure were chosen to illustrate different types of rainstorms. The data taken on August 11, 1949, are from a strong convective shower. On September 14, 1949, there were also convective showers, but slightly l ess intense and occurring in a region of more general and widespread rain. On November 29, 1949, the re was light steady ra in associated with a low p r e s s u r e a rea located off the Atlantic coast. On December 8, 1950, moderate rain extended over a l a rge a r e a and las ted for several hours.
After the data had been plotted on graphs like this , corresponding values of signal intensity and rainfall rate were read off and plotted as shown in Fig. 87. Times when the signal intensity was changing rapidly were discarded because corresponding measurements on the rain gage were not available. Measurements were taken on 15 days. There were 25 runs totaling about 13 hours. On August 29, 1949, RHI photographs showed that the radar echoes were coming from a layer several thousand feet above the ground. Apparently most of the rain was evaporating before reaching the ground. Because of these abnormal conditions the data for this day were d i s carded.
The solid line in Fig. 87 shows the calculated relation between and p and includes all the cor rections indicated by the various calibrations which have been discussed. The dashed lines were drawn to show what appears to be the best "average" r e lation between and p. The slope of the lower par t a g r e e s well with the slope of the calculated curve, but there is a difference of 7 db in the ab solute values . The slope of the upper portion of
Examples of data showing simultaneous measurements of radar signal intensity, ,and rain rate, p.
FIG. 86.
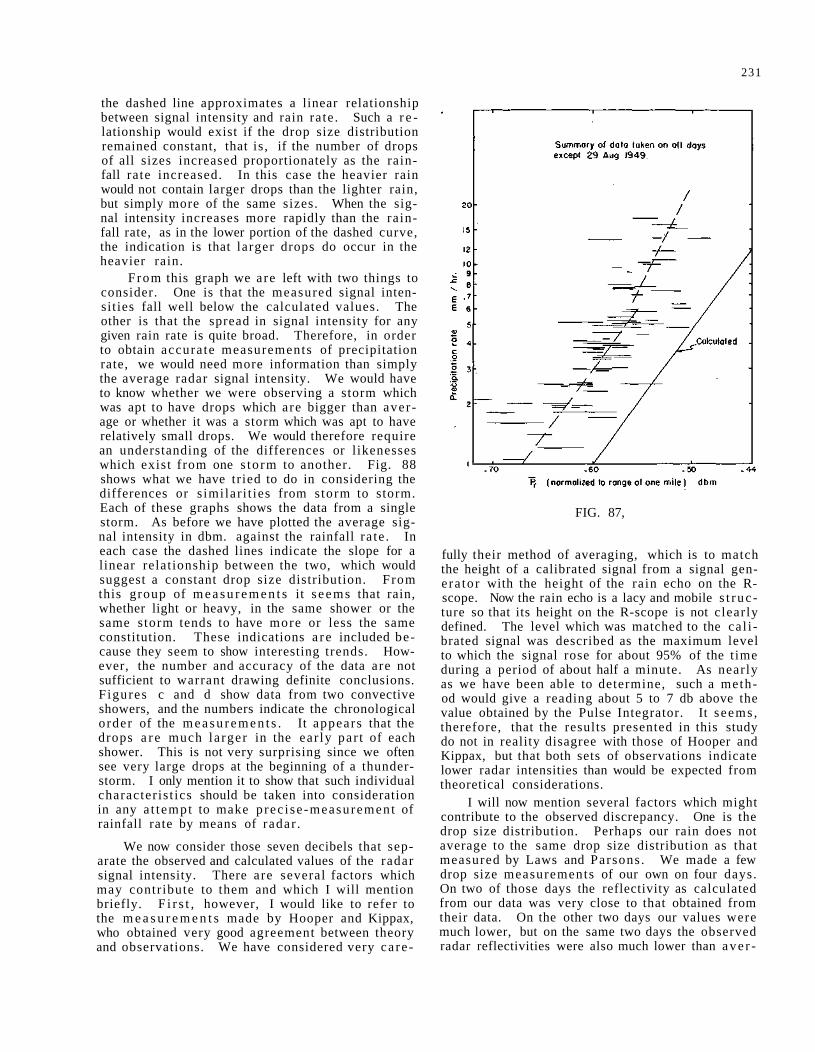
231
the dashed line approximates a linear relationship between signal intensity and rain rate . Such a r e lationship would exist if the drop size distribution remained constant, that is , if the number of drops of all sizes increased proportionately as the rainfall rate increased. In this case the heavier rain would not contain larger drops than the lighter rain, but simply more of the same sizes. When the signal intensity increases more rapidly than the rainfall rate, as in the lower portion of the dashed curve, the indication is that larger drops do occur in the heavier rain.
F rom this graph we are left with two things to consider. One is that the measured signal intensities fall well below the calculated values. The other is that the spread in signal intensity for any given rain rate is quite broad. Therefore, in order to obtain accurate measurements of precipitation rate, we would need more information than simply the average radar signal intensity. We would have to know whether we were observing a storm which was apt to have drops which are bigger than aver age or whether it was a storm which was apt to have relatively small drops. We would therefore require an understanding of the differences or l ikenesses which exist from one s to rm to another. Fig. 88 shows what we have tried to do in considering the differences or s imilar i t ies from storm to storm. Each of these graphs shows the data from a single storm. As before we have plotted the average signal intensity in dbm. against the rainfall ra te . In each case the dashed lines indicate the slope for a linear relationship between the two, which would suggest a constant drop size distribution. From this group of m e a s u r e m e n t s it s eems that rain, whether light or heavy, in the same shower or the same storm tends to have more or less the same constitution. These indications a r e included because they seem to show interesting trends. However, the number and accuracy of the data are not sufficient to warrant drawing definite conclusions. F igures c and d show data from two convective showers, and the numbers indicate the chronological order of the m e a s u r e m e n t s . It appears that the drops a r e much la rger in the ear ly par t of each shower. This is not very surprising since we often see very large drops at the beginning of a thunderstorm. I only mention it to show that such individual character is t ics should be taken into consideration in any a t tempt to make prec i se -measurement of rainfall rate by means of radar .
We now consider those seven decibels that separate the observed and calculated values of the radar signal intensity. There are several factors which may contribute to them and which I will mention briefly. F i r s t , however, I would like to refer to the m e a s u r e m e n t s made by Hooper and Kippax, who obtained very good agreement between theory and observations. We have considered very ca re -
FIG. 87,
fully their method of averaging, which is to match the height of a calibrated signal from a signal genera tor with the height of the rain echo on the R-scope. Now the rain echo is a lacy and mobile s t ruc ture so that its height on the R-scope is not clearly defined. The level which was matched to the ca l i brated signal was described as the maximum level to which the signal rose for about 95% of the t ime during a period of about half a minute. As nearly as we have been able to determine, such a method would give a reading about 5 to 7 db above the value obtained by the Pulse Integrator. It seems , therefore, that the results presented in this study do not in reality disagree with those of Hooper and Kippax, but that both sets of observations indicate lower radar intensities than would be expected from theoretical considerations.
I will now mention several factors which might contribute to the observed discrepancy. One is the drop size distribution. Perhaps our rain does not average to the same drop size distribution as that measured by Laws and Parsons . We made a few drop size measurements of our own on four days. On two of those days the reflectivity as calculated from our data was very close to that obtained from their data. On the other two days our values were much lower, but on the same two days the observed radar reflectivities were also much lower than ave r -
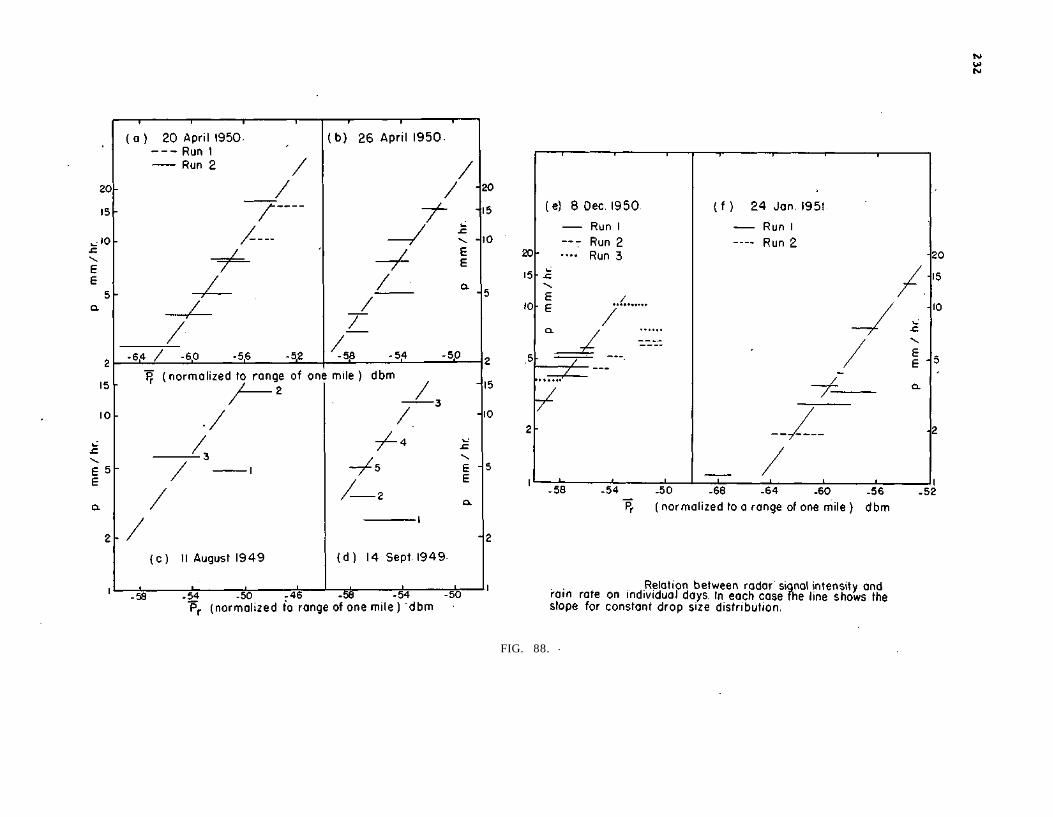
FIG. 88.
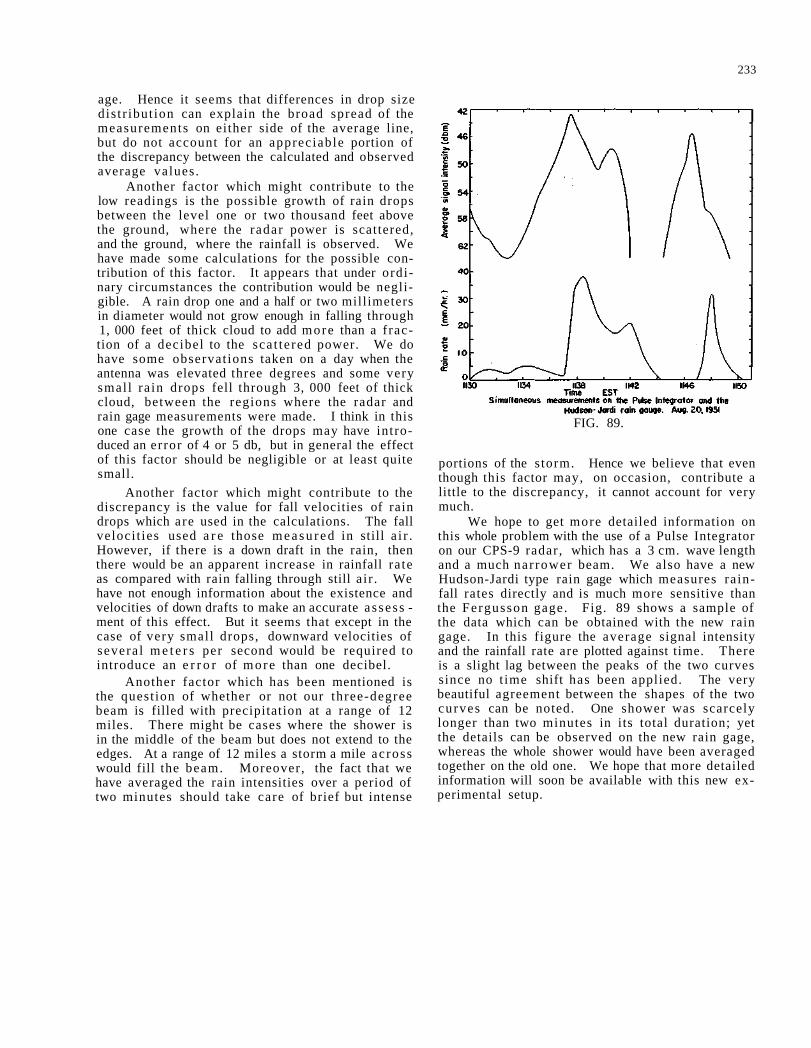
233
age. Hence it seems that differences in drop size dis t r ibut ion can explain the broad spread of the measurements on either side of the average line, but do not account for an appreciable portion of the discrepancy between the calculated and observed average values .
Another factor which might contribute to the low readings is the possible growth of rain drops between the level one or two thousand feet above the ground, where the radar power is scattered, and the ground, where the rainfall is observed. We have made some calculations for the possible contribution of this factor. It appears that under ordinary circumstances the contribution would be negligible. A rain drop one and a half or two millimeters in diameter would not grow enough in falling through 1, 000 feet of thick cloud to add more than a f raction of a decibel to the sca t te red power. We do have some observat ions taken on a day when the antenna was elevated three degrees and some very smal l ra in drops fell through 3, 000 feet of thick cloud, between the regions where the radar and rain gage measurements were made. I think in this one case the growth of the drops may have introduced an error of 4 or 5 db, but in general the effect of this factor should be negligible or at least quite small.
Another factor which might contribute to the discrepancy is the value for fall velocities of rain drops which are used in the calculations. The fall veloci t ies used a r e those m e a s u r e d in still a i r . However, if there is a down draft in the rain, then there would be an apparent increase in rainfall ra te as compared with rain falling through still a ir . We have not enough information about the existence and velocities of down drafts to make an accurate a s sess -ment of this effect. But it seems that except in the case of very small drops, downward velocities of severa l m e t e r s per second would be required to introduce an e r r o r of more than one decibel.
Another factor which has been mentioned is the quest ion of whether or not our three-degree beam is filled with precipitation at a range of 12 miles. There might be cases where the shower is in the middle of the beam but does not extend to the edges. At a range of 12 miles a storm a mile ac ross would fill the beam. Moreover, the fact that we have averaged the rain intensities over a period of two minutes should take care of brief but intense
FIG. 89.
portions of the storm. Hence we believe that even though this factor may, on occasion, contribute a little to the discrepancy, it cannot account for very much.
We hope to get more detailed information on this whole problem with the use of a Pulse Integrator on our CPS-9 radar, which has a 3 cm. wave length and a much nar rower beam. We also have a new Hudson-Jardi type rain gage which measures ra infall rates directly and is much more sensitive than the Fergusson gage. Fig. 89 shows a sample of the data which can be obtained with the new rain gage. In this figure the average signal intensity and the rainfall rate are plotted against time. There is a slight lag between the peaks of the two curves since no t ime shift has been applied. The very beautiful agreement between the shapes of the two curves can be noted. One shower was scarcely longer than two minutes in its total duration; yet the details can be observed on the new rain gage, whereas the whole shower would have been averaged together on the old one. We hope that more detailed information will soon be available with this new experimental setup.
QUANTITATIVE RADAR-RAINFALL PROBLEMS
B Y G E R A L D F A R N S W O R T H *
WITH DISCUSSIONS BY R. W E X L E R , S. E. REYNOLDS, D. D. R E I T E R , H. R. BYERS, AND G. W. FARNSWORTH
INTRODUCTION
The objective of the I l l inois State Water S u r v e y r a d a r p r o g r a m i s to e s tab l i sh , exper imen ta l ly , the r e l a t i o n s h i p b e t w e e n r e c e i v e d power and r a in f a l l intensity, and at the same t i m e develop a t echn ique that will provide and r e c o r d information on i n t e n s i t i e s and total rainfall over an a r e a such as a w a t e r shed. In working toward t h i s object ive, n u m e r o u s p r o b l e m s and q u e s t i o n s h a v e a r i s e n . Some have been solved, but a ma jo r p o r t i o n of t h e m a r e s t i l l open i s s u e s .
The c h a r a c t e r i s t i c s of the r a d a r se t need to be known quite accura te ly . B e a m width, pulse length , t r a n s m i t t e r power output, and r e c e i v e r s e n s i t i v i t y a r e some of the m o s t i m p o r t a n t . Some of the i m po r t an t m e t e o r o l o g i c a l f a c t o r s a r e r a in fa l l i n t e n sity, drop size var ia t ion and dis t r ibut ion as r e l a t e d to i n t ens i t y , and s t o r m s i z e .
RADAR P E R F O R M A N C E MEASUREMENTS
The e l e c t r i c a l c h a r a c t e r i s t i c s of a r a d a r se t mus t be accura te ly m e a s u r e d to use i t in d e t e r m i n ing r a in f a l l i n t e n s i t i e s . T h e two p a r a m e t e r s tha t s e e m t o b e m o s t u n s t a b l e a r e t r a n s m i t t e r power output, and rece iver sensi t ivi ty. T r a n s m i t t e r p u l s e length and beam width may va ry in special c a s e s but general ly can be as sumed as constant. A one d e c i bel change in e i ther t r a n s m i t t e r power or r e c e i v e r sensit ivity will produce approximate ly a 12 p e r cent change in ca lcu la ted r a in fa l l in tens i ty . Thus i t i s important to know the absolu te value of t r a n s m i t t e d power and r e c e i v e r s ens i t i v i t y a c c u r a t e l y .
The only equipment the Water Survey h a s had a v a i l a b l e for checking t r a n s m i t t e d power and r e ce iver sensitivity a r e war surplus signal g e n e r a t o r s . The TS-13 and TS-263 o p e r a t e in the 3 cm. r a n g e , and the TS-155 operates in the 10 cm. range . T h e s e s e t s a r e far f rom s a t i s f a c t o r y . I t i s doubtful tha t the absolute accuracies a r e bet ter than plus or m i n u s 3 db, a l though r e l a t i v e a c c u r a c i e s of a few t e n t h s of a db can be obtained. The ca l ib ra t ed a t t e n u a t o r dials a r e not finely divided, so interpolat ion is n e c e s s a r y to make readings c l o s e r than one db. Even
*Electrical Engineer, Illinois State Water Survey.
if the dia ls did have fine d iv i s ions , a c c u r a c y would be poor, for the ca l ib ra t ion wil l va ry with the f r e quency . The s p e c i f i c a t i o n s for a 9, 000 m c . f - m s e t built by S p e r r y , the c o m m e r c i a l equiva lent of the T S - 1 4 7 , s p e c i f i e s a w a t t m e t e r a c c u r a c y of only ±1 . 5 db, us ing the ca l i b r a t i on cu rve suppl ied with the i n s t r u m e n t .
The s a m e d i f f i cu l t i e s a r e found i n r e c e i v e r s ens i t i v i t y m e a s u r e m e n t s . The technique we use in obta in ing data r e q u i r e s t h a t r e c e i v e d power to produce a bare ly visible signal on the P P I be known. T h i s " t h r e s h o l d o f v i s i b i l i t y " m e t h o d i n t r o d u c e s another impor t an t r a d a r fac tor , the P P I b r i l l i a n c e se t t ing . The b r i l l i a n c e m u s t r e m a i n cons tan t , o r the r e c e i v e d power wi l l v a r y for t h r e s h o l d of v i s i b i l i ty .
The m a n n e r in which the s igna l g e n e r a t o r i s connected to the wave guide d i r e c t i o n a l coup le r i s a l s o impor tan t . E x p e r i m e n t s w e r e conducted l a s t s p r i n g to d e t e r m i n e how RG-8U and RG-9U f l exib le c o a x i a l c a b l e f unc t i oned a t 9 , 000 m c . The a t t e n u a t i o n of R G - 8 U w a s m u c h g r e a t e r than for RG-9U, bu t even m o r e i m p o r t a n t was the change in a t t enua t ion i n t r o d u c e d when the cab le was ben t or twisted. As much as 0. 3 db/ft. change was noted with R G - 9 U cab l e . The RG-8U had even g r e a t e r change . If f lexible c o a x i a l cab le is ,used with the t e s t s e t , i t should be kep t t o v e r y s h o r t l eng ths . I t would b e m u c h m o r e d e s i r a b l e t o use f lexible wave guide .
E F F E C T O F BEAM WIDTH
The an tenna b e a m width is qui te i m p o r t a n t in q u a n t i t a t i v e m e a s u r e m e n t s . The s i m p l e s t r e l a tionship of received power to r a i n intensi ty is b a s e d upon the a s sumpt ion tha t the r a i n s t o r m comple t e ly fills the beam to the half-power points. C o r r e c t i o n s can be m a d e i f t he b e a m is no t c o m p l e t e l y f i l led, but they a r e c o m p l i c a t e d and m a y i n t r o d u c e c o n siderable e r r o r (1).** The useful range of the r a d a r i s l i m i t e d to tha t in which i t s b e a m i s comple t e ly f i l led, u n l e s s e x t e n s i v e c o r r e c t i o n s a r e m a d e .
The T h u n d e r s t o r m P r o j e c t (2) found t ha t the ini t ial r a d a r echo usua l ly had a height close to the
**Numcrals in parentheses a re reference numbers in BIBLIOGRAPHY at end of this paper.
235
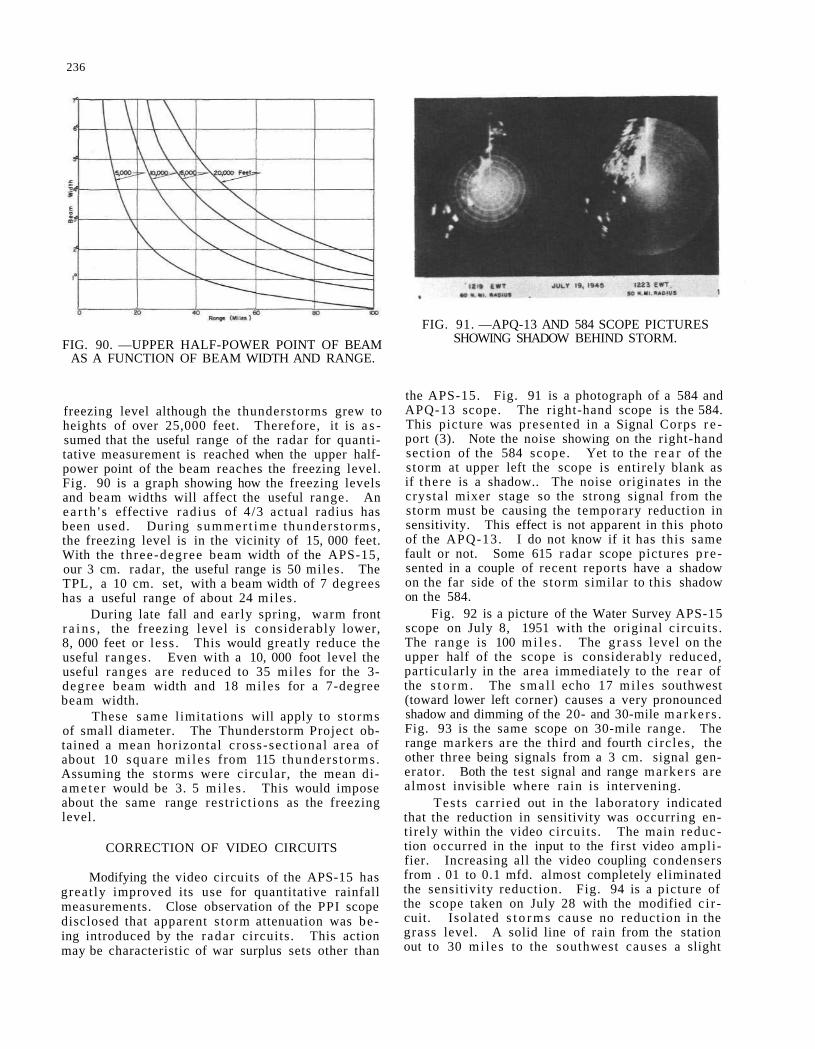
236
FIG. 90. —UPPER HALF-POWER POINT OF BEAM AS A FUNCTION OF BEAM WIDTH AND RANGE.
freezing level although the thunderstorms grew to heights of over 25,000 feet. Therefore, it is a s sumed that the useful range of the radar for quantitative measurement is reached when the upper half-power point of the beam reaches the freezing level. Fig. 90 is a graph showing how the freezing levels and beam widths will affect the useful range. An e a r t h ' s effective radius of 4/3 actual radius has been used. During summer t ime thunders torms, the freezing level is in the vicinity of 15, 000 feet. With the three-degree beam width of the APS-15, our 3 cm. radar, the useful range is 50 miles. The TPL, a 10 cm. set, with a beam width of 7 degrees has a useful range of about 24 miles .
During late fall and early spring, warm front r a i n s , the freezing level is considerably lower, 8, 000 feet or less . This would greatly reduce the useful ranges . Even with a 10, 000 foot level the useful ranges are reduced to 35 miles for the 3-degree beam width and 18 mi les for a 7-degree beam width.
These same limitations will apply to s torms of small diameter. The Thunderstorm Project obtained a mean horizontal c ross-sec t ional a rea of about 10 square mi l e s from 115 thunders torms. Assuming the storms were circular, the mean diame te r would be 3. 5 mi l e s . This would impose about the same range res t r ic t ions as the freezing level.
CORRECTION OF VIDEO CIRCUITS
Modifying the video circuits of the APS-15 has great ly improved its use for quantitative rainfall measurements. Close observation of the PPI scope disclosed that apparent s torm attenuation was being introduced by the radar circuits. This action may be characteristic of war surplus sets other than
FIG. 91. —APQ-13 AND 584 SCOPE PICTURES SHOWING SHADOW BEHIND STORM.
the APS-15. Fig. 91 is a photograph of a 584 and APQ-13 scope. The right-hand scope is the 584. This picture was presented in a Signal Corps r e port (3). Note the noise showing on the right-hand section of the 584 scope. Yet to the r e a r of the s torm at upper left the scope is entirely blank as if there is a shadow.. The noise originates in the crystal mixer stage so the strong signal from the storm must be causing the temporary reduction in sensitivity. This effect is not apparent in this photo of the APQ-13. I do not know if it has this same fault or not. Some 615 radar scope pictures p r e sented in a couple of recent reports have a shadow on the far side of the s torm similar to this shadow on the 584.
Fig. 92 is a picture of the Water Survey APS-15 scope on July 8, 1951 with the original c i rcui ts . The range is 100 m i l e s . The g ras s level on the upper half of the scope is considerably reduced, particularly in the area immediately to the rea r of the s t o r m . The smal l echo 17 mi les southwest (toward lower left corner) causes a very pronounced shadow and dimming of the 20- and 30-mile marke r s . Fig. 93 is the same scope on 30-mile range. The range markers are the third and fourth c i rc les , the other three being signals from a 3 cm. signal generator. Both the test signal and range markers are almost invisible where rain is intervening.
Tes ts carr ied out in the laboratory indicated that the reduction in sensitivity was occurring entirely within the video circuits . The main reduction occurred in the input to the first video amplifier. Increasing all the video coupling condensers from . 01 to 0.1 mfd. almost completely eliminated the sensitivity reduction. Fig. 94 is a picture of the scope taken on July 28 with the modified c i r cuit. Isolated s t o r m s cause no reduction in the grass level. A solid line of rain from the station out to 30 mi les to the southwest causes a slight
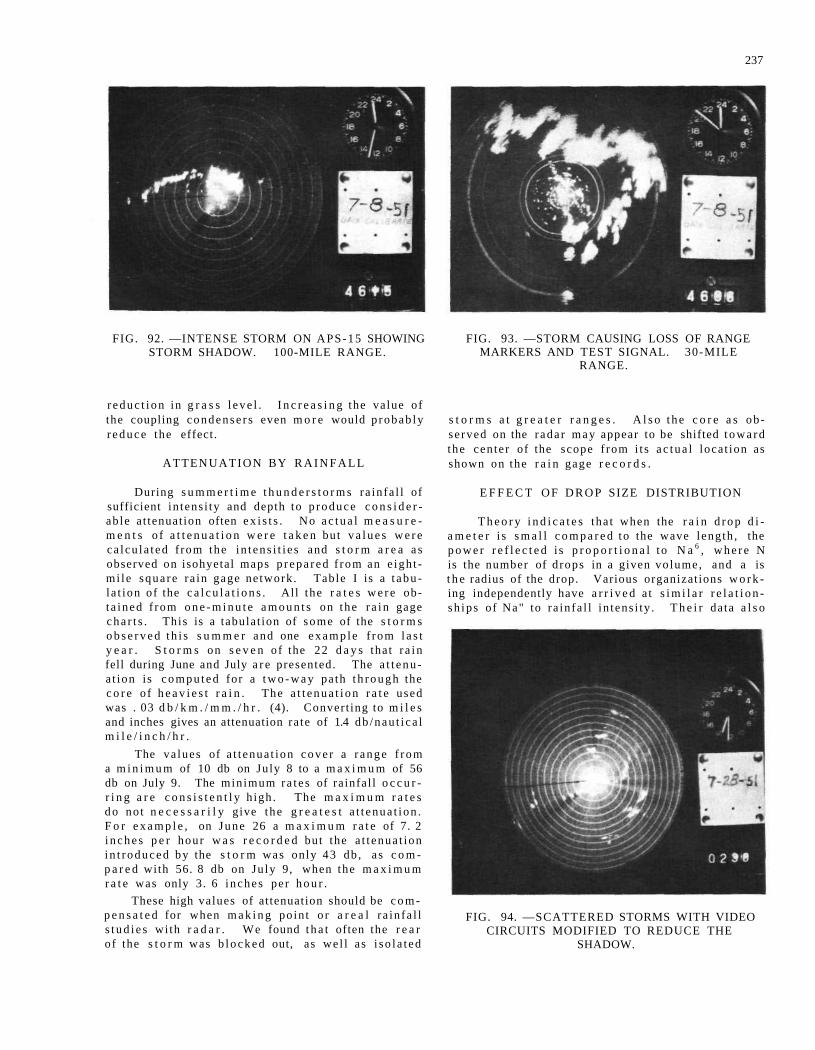
237
FIG. 92. —INTENSE STORM ON APS-15 SHOWING STORM SHADOW. 100-MILE RANGE.
FIG. 93. —STORM CAUSING LOSS OF RANGE MARKERS AND TEST SIGNAL. 30-MILE
RANGE.
r e d u c t i o n in g r a s s l e v e l . I n c r e a s i n g the value of the coupling condense r s even m o r e would p robab ly r e d u c e the effect.
ATTENUATION BY R A I N F A L L
During s u m m e r t i m e t h u n d e r s t o r m s ra in fa l l of sufficient in tens i ty and depth to p roduce c o n s i d e r ab le a t tenuat ion often e x i s t s . No a c t u a l m e a s u r e m e n t s o f a t t e n u a t i o n w e r e t a k e n but v a l u e s w e r e ca l cu la t ed f rom the i n t ens i t i e s and s t o r m a r e a a s observed on isohyetal maps p r e p a r e d f rom an e igh t -mi le squa re ra in gage ne twork . Table I is a t abu la t ion of the c a l c u l a t i o n s . All the r a t e s w e r e obt a ined f rom o n e - m i n u t e a m o u n t s on the r a i n gage c h a r t s . This is a tabulat ion of some of the s t o r m s o b s e r v e d t h i s s u m m e r and one e x a m p l e f rom l a s t y e a r . S t o r m s on s e v e n of the 22 d a y s that r a i n fell during June and July a r e presented. The a t t e n u a t ion is c o m p u t e d for a t w o - w a y pa th t h r o u g h the c o r e o f h e a v i e s t r a i n . The a t t e n u a t i o n r a t e used was . 03 d b / k m . / m m . / h r . (4). Convert ing to m i l e s and inches gives an attenuation ra te of 1.4 db /nau t i ca l m i l e / i n c h / h r .
The va lues of a t t enua t ion c o v e r a r a n g e f r o m a m i n i m u m of 10 db on July 8 to a m a x i m u m of 56 db on July 9. The min imum r a t e s of ra infal l o c c u r r i n g a r e c o n s i s t e n t l y h igh . The m a x i m u m r a t e s d o no t n e c e s s a r i l y give the g r e a t e s t a t t enua t ion . F o r e x a m p l e , on June 26 a m a x i m u m r a t e of 7. 2 i n c h e s p e r hour w a s r e c o r d e d but the a t t enua t ion i n t r o d u c e d by the s t o r m was only 43 db , a s c o m p a r e d with 56. 8 db on Ju ly 9, when the m a x i m u m r a t e was only 3. 6 i nches per h o u r .
These high values of at tenuation should be c o m p e n s a t e d for when m a k i n g poin t o r a r e a l r a in fa l l s t u d i e s wi th r a d a r . We found t h a t often the r e a r of the s t o r m was b l o c k e d out, as we l l as i so l a t ed
s t o r m s a t g r e a t e r r a n g e s . A l s o t h e c o r e a s ob se rved on the r ada r may appear to be shifted t o w a r d the cen te r of the scope f rom i t s a c t u a l loca t ion as shown on the r a i n gage r e c o r d s .
E F F E C T OF D R O P SIZE DISTRIBUTION
T h e o r y i n d i c a t e s tha t when the r a i n d r o p d i a m e t e r i s s m a l l c o m p a r e d to the wave length , the p o w e r r e f l e c t e d i s p r o p o r t i o n a l to N a 6 , w h e r e N is the number of d rops in a given vo lume, and a is t h e radius of the drop. Various organizat ions w o r k ing independently have a r r i v e d a t s i m i l a r r e l a t i o n sh ip s of Na" to ra in fa l l in tens i ty . T h e i r data a l s o
FIG. 94. —SCATTERED STORMS WITH VIDEO CIRCUITS MODIFIED TO REDUCE THE
SHADOW.
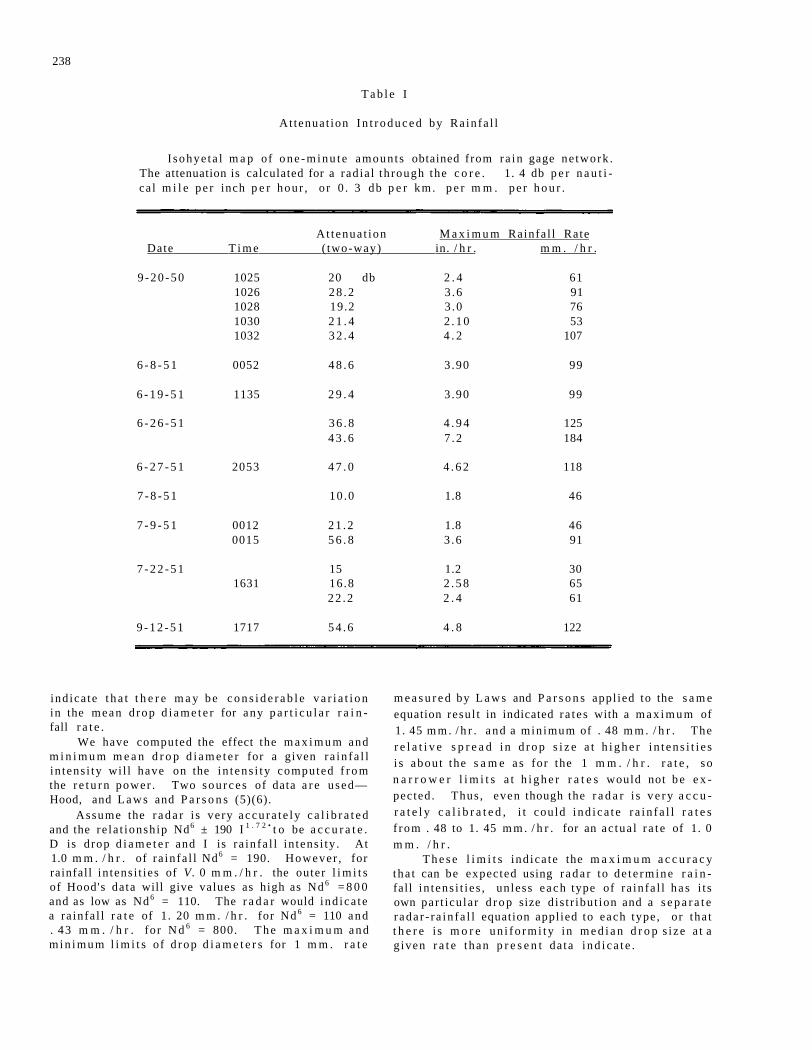
238
T a b l e I
At tenuat ion I n t r o d u c e d by Ra infa l l
I sohye ta l m a p of o n e - m i n u t e amounts obtained f rom ra in gage ne twork . The attenuation is calculated for a rad ia l th rough the c o r e . 1. 4 db p e r n a u t i ca l m i l e pe r inch p e r hour , o r 0 . 3 db p e r km. p e r m m . pe r h o u r .
At tenua t ion M a x i m u m Rainfa l l Rate Date T i m e ( two-way) in. / h r . m m . / h r .
9 - 2 0 - 5 0 1025 20 db 2 . 4 61 1026 2 8 . 2 3 .6 91 1028 19.2 3 .0 76 1030 2 1 . 4 2 . 1 0 53 1032 3 2 . 4 4 . 2 107
6 - 8 - 5 1 0052 4 8 . 6 3 .90 99
6 - 1 9 - 5 1 1135 2 9 . 4 3 .90 99
6 - 2 6 - 5 1 3 6 . 8 4 . 9 4 125 4 3 . 6 7 .2 184
6 - 2 7 - 5 1 2053 4 7 . 0 4 . 6 2 118
7 - 8 - 5 1 10 .0 1.8 46
7 - 9 - 5 1 0012 2 1 . 2 1.8 46 0015 5 6 . 8 3 .6 91
7 - 2 2 - 5 1 15 1.2 30 1631 16.8 2 . 5 8 65
2 2 . 2 2 . 4 61
9 - 1 2 - 5 1 1717 5 4 . 6 4 . 8 122
ind ica te t h a t t h e r e m a y b e c o n s i d e r a b l e v a r i a t i o n in the mean d rop d i a m e t e r for any p a r t i c u l a r r a i n fall r a t e .
We have computed the effect the m a x i m u m and m i n i m u m m e a n d r o p d i a m e t e r for a given r a in fa l l in tens i ty wi l l have on the i n t ens i ty computed f r o m the r e t u r n power . Two s o u r c e s of data a r e used— Hood, and L a w s and P a r s o n s (5)(6).
Assume the r a d a r i s very accu ra t e ly c a l i b r a t e d and the re la t ionsh ip Nd6 ± 190 I 1 . 7 2 • t o be a c c u r a t e . D is drop d i a m e t e r and I is ra in fa l l in tens i ty . At 1.0 m m . / h r . of ra in fa l l Nd6 = 190. However , for rainfall in tens i t ies of V. 0 m m . / h r . the outer l i m i t s of Hood's data will give values as high as Nd 6 = 8 0 0 and as low as Nd 6 = 110. The r a d a r would ind ica te a ra infa l l r a t e of 1. 20 m m . / h r . for Nd 6 = 110 and . 43 m m . / h r . for N d 6 = 800. T h e m a x i m u m and m i n i m u m l i m i t s of d rop d i a m e t e r s for 1 m m . r a t e
m e a s u r e d by L a w s and P a r s o n s appl ied to the s a m e equation resul t in indicated r a t e s with a m a x i m u m of 1. 45 m m . / h r . and a min imum of . 48 m m . / h r . The r e l a t i v e s p r e a d i n d r o p s i z e a t h i g h e r i n t e n s i t i e s i s abou t the s a m e a s for the 1 m m . / h r . r a t e , so n a r r o w e r l i m i t s a t h i g h e r r a t e s would not b e e x pected. Thus , even though the r a d a r i s v e r y a c c u r a t e l y c a l i b r a t e d , i t could i nd i ca t e r a i n f a l l r a t e s f rom . 48 to 1. 45 m m . / h r . for an ac tua l r a t e of 1. 0 m m . / h r .
T h e s e l i m i t s ind ica te the m a x i m u m a c c u r a c y tha t can be expected using r a d a r to de t e rmine r a i n fall in tens i t i es , unless each type of ra infa l l h a s i t s own par t icular d r o p size d is t r ibut ion and a s e p a r a t e r ada r - r a in fa l l equation applied to each type, or tha t t h e r e i s m o r e u n i f o r m i t y in m e d i a n d r o p s i ze a t a g iven r a t e than p r e s e n t da ta i n d i c a t e .
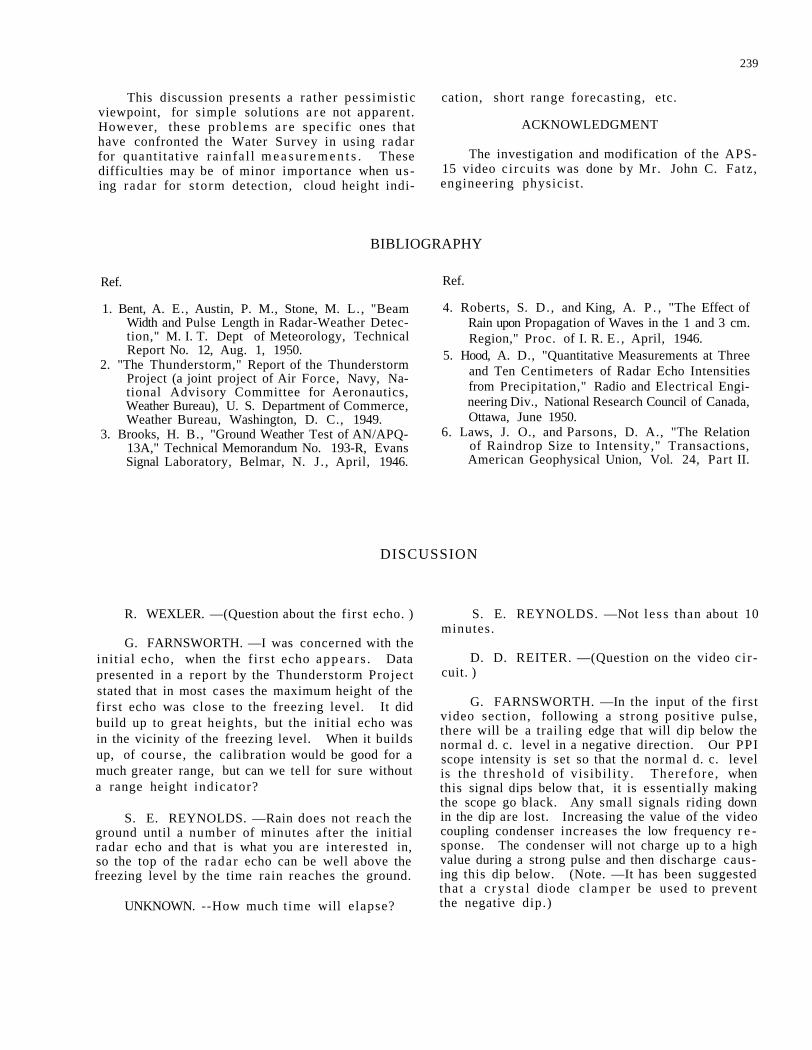
239
This discussion presents a rather pessimist ic viewpoint, for simple solutions a r e not apparent. However, these problems a r e specific ones that have confronted the Water Survey in using radar for quanti tat ive ra infa l l m e a s u r e m e n t s . These difficulties may be of minor importance when us ing radar for s torm detection, cloud height indi
cation, short range forecasting, etc.
ACKNOWLEDGMENT
The investigation and modification of the APS-15 video ci rcui ts was done by Mr. John C. Fatz, engineering physicist .
BIBLIOGRAPHY
Ref. Ref.
1. Bent, A. E., Austin, P. M., Stone, M. L., "Beam Width and Pulse Length in Radar-Weather Detection," M. I. T. Dept of Meteorology, Technical Report No. 12, Aug. 1, 1950.
2. "The Thunderstorm," Report of the Thunderstorm Project (a joint project of Air Force, Navy, National Advisory Committee for Aeronautics, Weather Bureau), U. S. Department of Commerce, Weather Bureau, Washington, D. C., 1949.
3. Brooks, H. B., "Ground Weather Test of AN/APQ-13A," Technical Memorandum No. 193-R, Evans Signal Laboratory, Belmar, N. J. , April, 1946.
4. Roberts, S. D., and King, A. P . , "The Effect of Rain upon Propagation of Waves in the 1 and 3 cm. Region," Proc. of I. R. E. , April, 1946.
5. Hood, A. D., "Quantitative Measurements at Three and Ten Centimeters of Radar Echo Intensities from Precipitation," Radio and Electrical Engineering Div., National Research Council of Canada, Ottawa, June 1950.
6. Laws, J. O., and Parsons, D. A., "The Relation of Raindrop Size to Intensity," Transactions, American Geophysical Union, Vol. 24, Part II.
DISCUSSION
R. WEXLER. —(Question about the first echo. )
G. FARNSWORTH. —I was concerned with the init ial echo, when the f i rs t echo appear s . Data presented in a report by the Thunderstorm Project stated that in most cases the maximum height of the first echo was close to the freezing level. It did build up to great heights, but the initial echo was in the vicinity of the freezing level. When it builds up, of course, the calibration would be good for a much greater range, but can we tell for sure without a range height indicator?
S. E. REYNOLDS. —Rain does not reach the ground until a number of minutes after the initial radar echo and that is what you a r e interested in, so the top of the radar echo can be well above the freezing level by the time rain reaches the ground.
UNKNOWN. --How much t ime will elapse?
S. E. REYNOLDS. —Not l ess than about 10 minutes.
D. D. REITER. —(Question on the video c i r cuit. )
G. FARNSWORTH. —In the input of the first video section, following a strong positive pulse, there will be a trailing edge that will dip below the normal d. c. level in a negative direction. Our PPI scope intensity is set so that the normal d. c. level is the th reshold of visibi l i ty. Therefore , when this signal dips below that, it is essentially making the scope go black. Any small signals riding down in the dip are lost. Increasing the value of the video coupling condenser increases the low frequency r e sponse. The condenser will not charge up to a high value during a strong pulse and then discharge causing this dip below. (Note. —It has been suggested that a c r y s t a l diode c lamper be used to prevent the negative dip.)
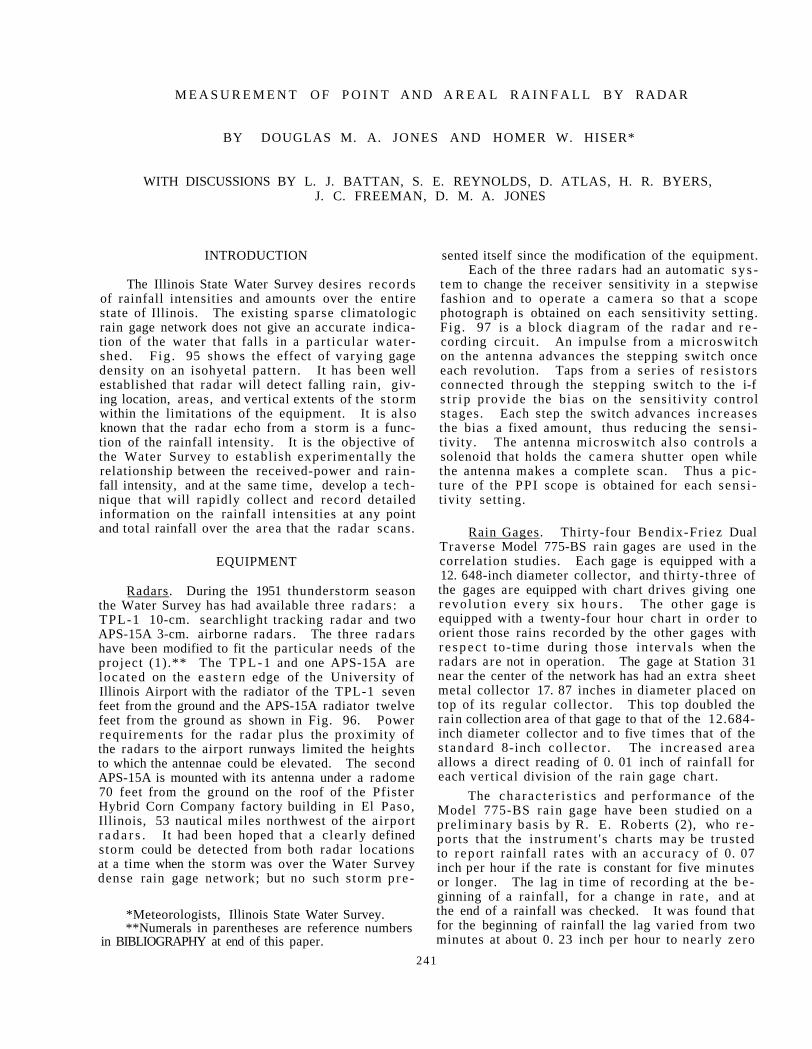
M E A S U R E M E N T O F P O I N T A N D A R E A L R A I N F A L L B Y RADAR
BY DOUGLAS M. A. JONES AND HOMER W. HISER*
WITH DISCUSSIONS BY L. J. BATTAN, S. E. REYNOLDS, D. ATLAS, H. R. BYERS, J. C. FREEMAN, D. M. A. JONES
INTRODUCTION
The Illinois State Water Survey desires records of rainfall intensities and amounts over the entire state of Illinois. The existing sparse climatologic rain gage network does not give an accurate indication of the water that falls in a part icular watershed. F ig . 95 shows the effect of varying gage density on an isohyetal pattern. It has been well established that radar will detect falling rain, giving location, areas, and vertical extents of the s torm within the limitations of the equipment. It is a lso known that the radar echo from a storm is a function of the rainfall intensity. It is the objective of the Water Survey to establish experimentally the relationship between the received-power and rainfall intensity, and at the same time, develop a technique that will rapidly collect and record detailed information on the rainfall intensities at any point and total rainfall over the area that the radar scans.
EQUIPMENT
Radars. During the 1951 thunderstorm season the Water Survey has had available three r ada r s : a TPL-1 10-cm. searchlight tracking radar and two APS-15A 3-cm. airborne radars. The three radars have been modified to fit the particular needs of the project (1).** The T P L - 1 and one APS-15A are located on the ea s t e rn edge of the University of Illinois Airport with the radiator of the TPL-1 seven feet from the ground and the APS-15A radiator twelve feet from the ground as shown in Fig. 96. Power requirements for the radar plus the proximity of the radars to the airport runways limited the heights to which the antennae could be elevated. The second APS-15A is mounted with its antenna under a radome 70 feet from the ground on the roof of the Pfister Hybrid Corn Company factory building in El Paso, Illinois, 53 nautical miles northwest of the airport r a d a r s . It had been hoped that a c lear ly defined storm could be detected from both radar locations at a time when the storm was over the Water Survey dense rain gage network; but no such s torm p r e -
*Meteorologists, Illinois State Water Survey. **Numerals in parentheses are reference numbers
in BIBLIOGRAPHY at end of this paper.
sented itself since the modification of the equipment. Each of the three radars had an automatic s y s
tem to change the receiver sensitivity in a stepwise fashion and to operate a camera so that a scope photograph is obtained on each sensitivity setting. Fig . 97 is a block diagram of the radar and r e cording circuit . An impulse from a microswitch on the antenna advances the stepping switch once each revolution. Taps from a ser ies of r e s i s to r s connected through the stepping switch to the i-f s t r i p provide the bias on the sensi t ivi ty control stages. Each step the switch advances increases the bias a fixed amount, thus reducing the sens i tivity. The antenna microswitch a l so controls a solenoid that holds the camera shutter open while the antenna makes a complete scan. Thus a picture of the PPI scope is obtained for each sens i tivity setting.
Rain Gages. Thirty-four Bendix-Friez Dual Traverse Model 775-BS rain gages are used in the correlation studies. Each gage is equipped with a 12. 648-inch diameter collector, and thir ty-three of the gages are equipped with chart drives giving one revolu t ion every six h o u r s . The other gage is equipped with a twenty-four hour chart in order to orient those rains recorded by the other gages with r e s p e c t to-t ime during those in tervals when the radars are not in operation. The gage at Station 31 near the center of the network has had an extra sheet metal collector 17. 87 inches in diameter placed on top of its regular collector. This top doubled the rain collection area of that gage to that of the 12.684-inch diameter collector and to five times that of the s t andard 8-inch col lec tor . The increased a rea allows a direct reading of 0. 01 inch of rainfall for each vertical division of the rain gage chart.
The cha rac te r i s t i c s and performance of the Model 775-BS ra in gage have been studied on a pre l iminary basis by R. E. Roberts (2), who r e ports that the instrument 's charts may be t rusted to r epor t rainfall ra tes with an accuracy of 0. 07 inch per hour if the rate is constant for five minutes or longer. The lag in time of recording at the be ginning of a rainfall, for a change in ra te , and at the end of a rainfall was checked. It was found that for the beginning of rainfall the lag varied from two minutes at about 0. 23 inch per hour to nearly zero
241
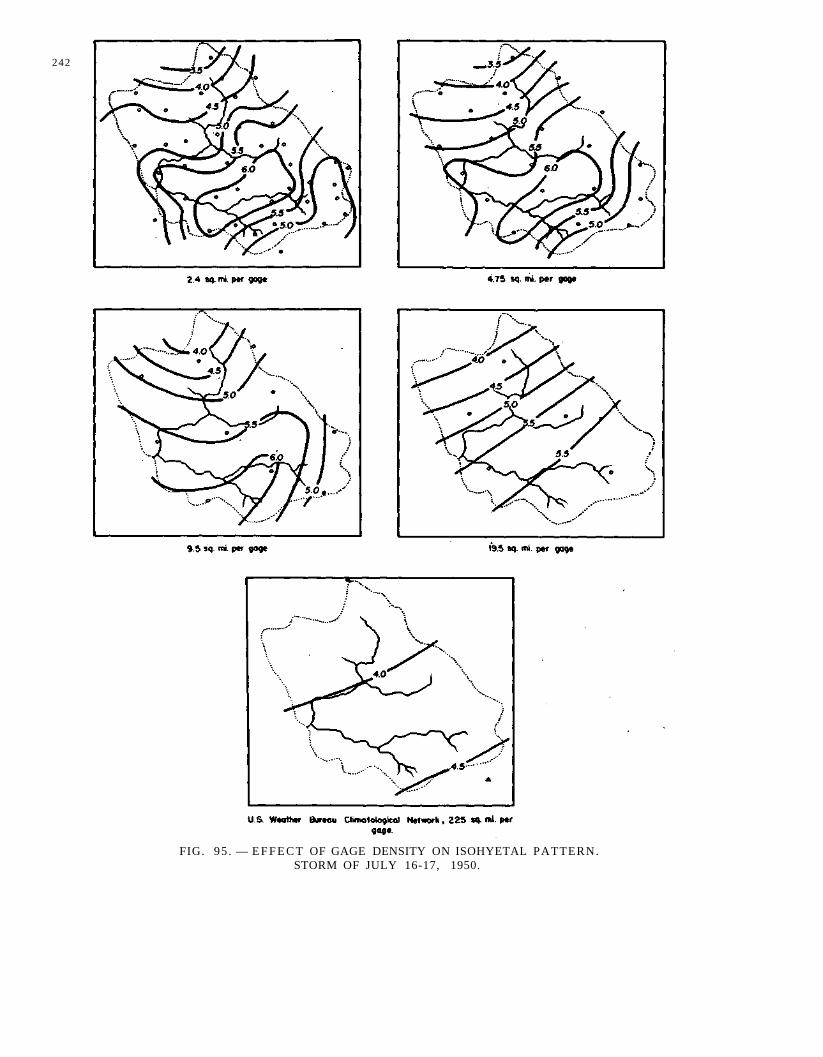
242
FIG. 95 . — E F F E C T OF GAGE DENSITY ON ISOHYETAL PATTERN. STORM OF JULY 16-17, 1950.
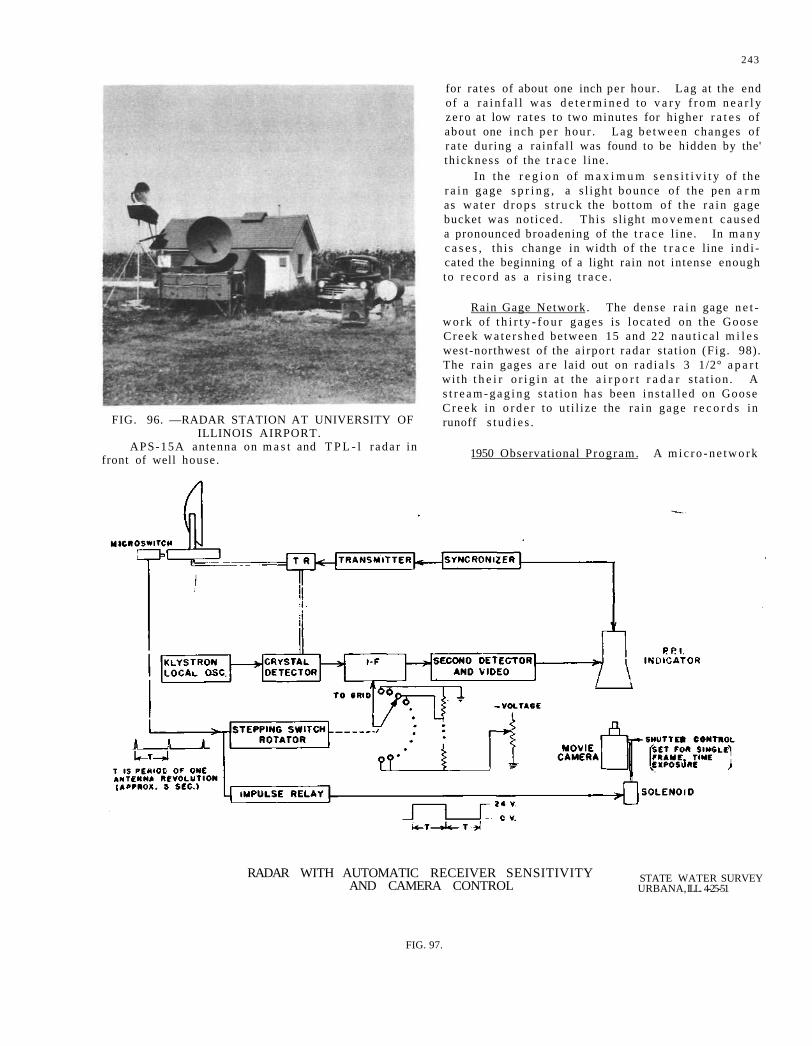
243
FIG. 96. —RADAR STATION AT UNIVERSITY OF ILLINOIS AIRPORT.
APS-15A antenna on m a s t and T P L - l r ada r in front of well house .
for ra tes of about one inch per hour. Lag at the end of a r a i n f a l l was d e t e r m i n e d to v a r y f r o m n e a r l y ze ro at low r a t e s to two minutes for higher r a t e s of about one inch p e r hour . Lag be tween changes of r a t e dur ing a ra infa l l was found to be hidden by the' th ickness of the t r a c e l ine.
In the r e g i o n of m a x i m u m s e n s i t i v i t y of the r a i n gage s p r i n g , a s l igh t bounce of the pen a r m as wa te r d r o p s s t r u c k the bot tom of the r a i n gage bucket was not iced. This s l ight m o v e m e n t caused a pronounced broadening of the t r a c e l ine. In m a n y c a s e s , th i s change in width of the t r a c e line i n d i cated the beginning of a light rain not intense enough to r e c o r d as a r i s ing t r a c e .
Rain Gage Network. The dense r a i n gage n e t w o r k of t h i r t y - f o u r gages is loca ted on the Goose Creek w a t e r s h e d between 15 and 22 n a u t i c a l m i l e s west-northwest of the a i rpor t r adar s tat ion (Fig. 98). The ra in gages a r e laid out on r a d i a l s 3 1/2° a p a r t wi th t h e i r o r i g i n a t the a i r p o r t r a d a r s t a t ion . A s t r e a m - g a g i n g s ta t ion has been in s t a l l ed on Goose C r e e k in o r d e r to u t i l ize the r a in gage r e c o r d s in runoff s t u d i e s .
1950 Observational P rogram. A m i c r o - n e t w o r k
RADAR WITH AUTOMATIC RECEIVER SENSITIVITY AND CAMERA CONTROL
STATE WATER SURVEY URBANA, ILL. 4-25-51
FIG. 97.
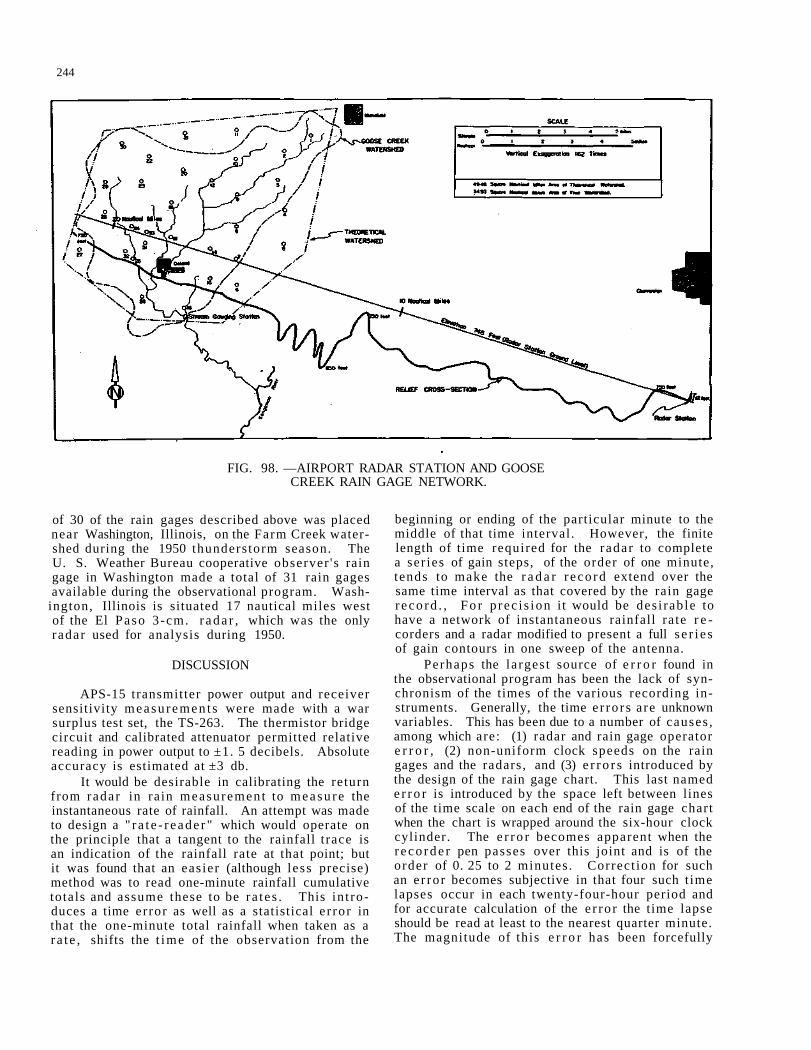
244
FIG. 98. —AIRPORT RADAR STATION AND GOOSE CREEK RAIN GAGE NETWORK.
of 30 of the rain gages described above was placed near Washington, Illinois, on the Farm Creek watershed during the 1950 thunders torm season. The U. S. Weather Bureau cooperative observer 's rain gage in Washington made a total of 31 rain gages available during the observational program. Wash
ington, Illinois is situated 17 nautical miles west of the El Paso 3-cm. r a d a r , which was the only radar used for analysis during 1950.
DISCUSSION
APS-15 transmitter power output and receiver sensitivity measu remen t s were made with a war surplus test set, the TS-263. The thermistor bridge circuit and calibrated attenuator permitted relative reading in power output to ±1. 5 decibels. Absolute accuracy is estimated at ±3 db.
It would be desirable in calibrating the return from radar in rain measurement to measu re the instantaneous rate of rainfall. An attempt was made to design a " r a t e - r eade r " which would operate on the principle that a tangent to the rainfall t race is an indication of the rainfall rate at that point; but it was found that an eas ier (although less precise) method was to read one-minute rainfall cumulative totals and assume these to be ra tes . This in t roduces a time error as well as a statistical e r ror in that the one-minute total rainfall when taken as a r a t e , shifts the t ime of the observation from the
beginning or ending of the particular minute to the middle of that time interval. However, the finite length of time required for the radar to complete a ser ies of gain steps, of the order of one minute, tends to make the r a d a r r eco rd extend over the same time interval as that covered by the rain gage r eco rd . , F o r p rec i s ion it would be des i rab le to have a network of instantaneous rainfall ra te r e corders and a radar modified to present a full s e r i e s of gain contours in one sweep of the antenna.
Perhaps the larges t source of e r r o r found in the observational program has been the lack of synchronism of the times of the various recording instruments. Generally, the time e r ro r s are unknown variables. This has been due to a number of causes , among which are: (1) radar and rain gage operator e r r o r , (2) non-uniform clock speeds on the rain gages and the radars, and (3) e r r o r s introduced by the design of the rain gage chart. This last named e r r o r is introduced by the space left between lines of the time scale on each end of the rain gage chart when the chart is wrapped around the six-hour clock cylinder. The e r r o r becomes apparent when the r e c o r d e r pen passes over this joint and is of the order of 0. 25 to 2 minutes . Correct ion for such an e r ro r becomes subjective in that four such t ime lapses occur in each twenty-four-hour period and for accurate calculation of the e r ro r the time lapse should be read at least to the nearest quarter minute. The magnitude of this e r r o r has been forcefully
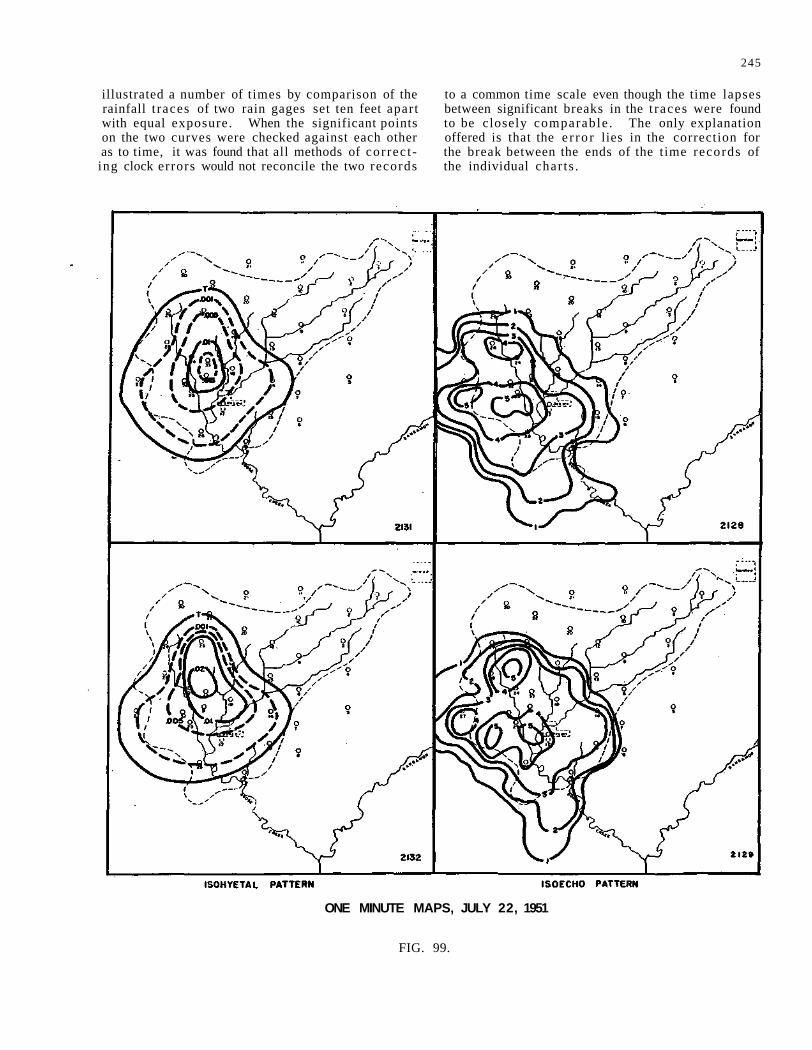
245
illustrated a number of times by comparison of the rainfall t races of two rain gages set ten feet apart with equal exposure. When the significant points on the two curves were checked against each other as to time, it was found that all methods of cor rec t ing clock errors would not reconcile the two records
ONE MINUTE MAPS, JULY 22, 1951
FIG. 99.
to a common time scale even though the time lapses between significant breaks in the t races were found to be closely comparable . The only explanation offered is that the e r ro r lies in the correction for the break between the ends of the time records of the individual char ts .
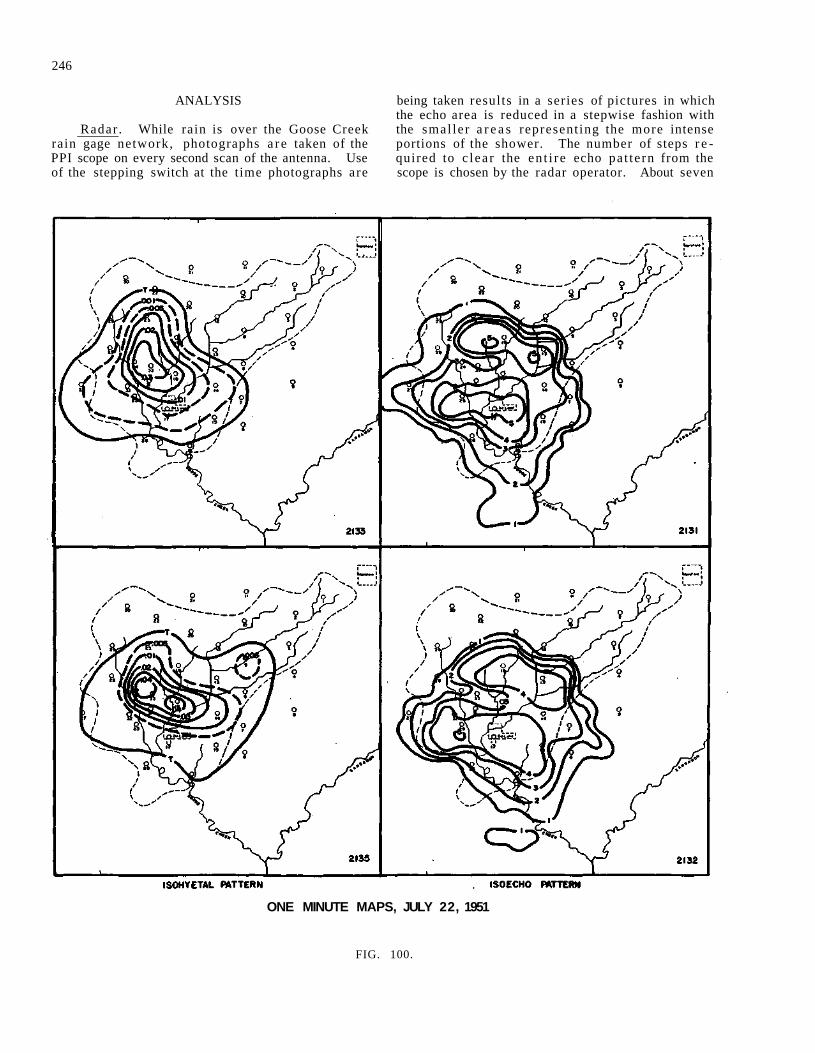
246
ANALYSIS
Radar . While rain is over the Goose Creek rain gage network, photographs a r e taken of the PPI scope on every second scan of the antenna. Use of the stepping switch at the time photographs are
being taken results in a series of pictures in which the echo area is reduced in a stepwise fashion with the smal ler a r e a s represent ing the more intense portions of the shower. The number of steps r e quired to c lea r the en t i re echo pa t te rn from the scope is chosen by the radar operator. About seven
ONE MINUTE MAPS, JULY 22, 1951
FIG. 100.
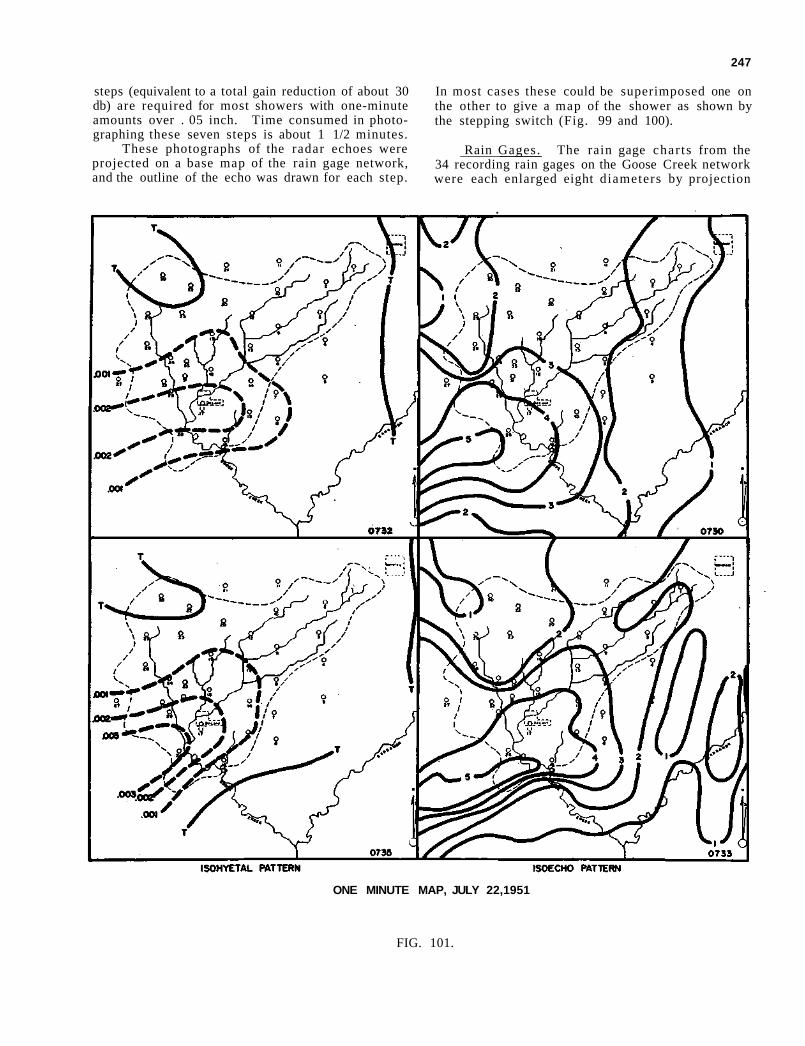
247
steps (equivalent to a total gain reduction of about 30 db) are required for most showers with one-minute amounts over . 05 inch. Time consumed in photographing these seven steps is about 1 1/2 minutes.
These photographs of the radar echoes were projected on a base map of the rain gage network, and the outline of the echo was drawn for each step.
In most cases these could be superimposed one on the other to give a map of the shower as shown by the stepping switch (Fig. 99 and 100).
Rain Gages. The rain gage char ts from the 34 recording rain gages on the Goose Creek network were each enlarged eight diameters by projection
ONE MINUTE MAP, JULY 22,1951
FIG. 101.
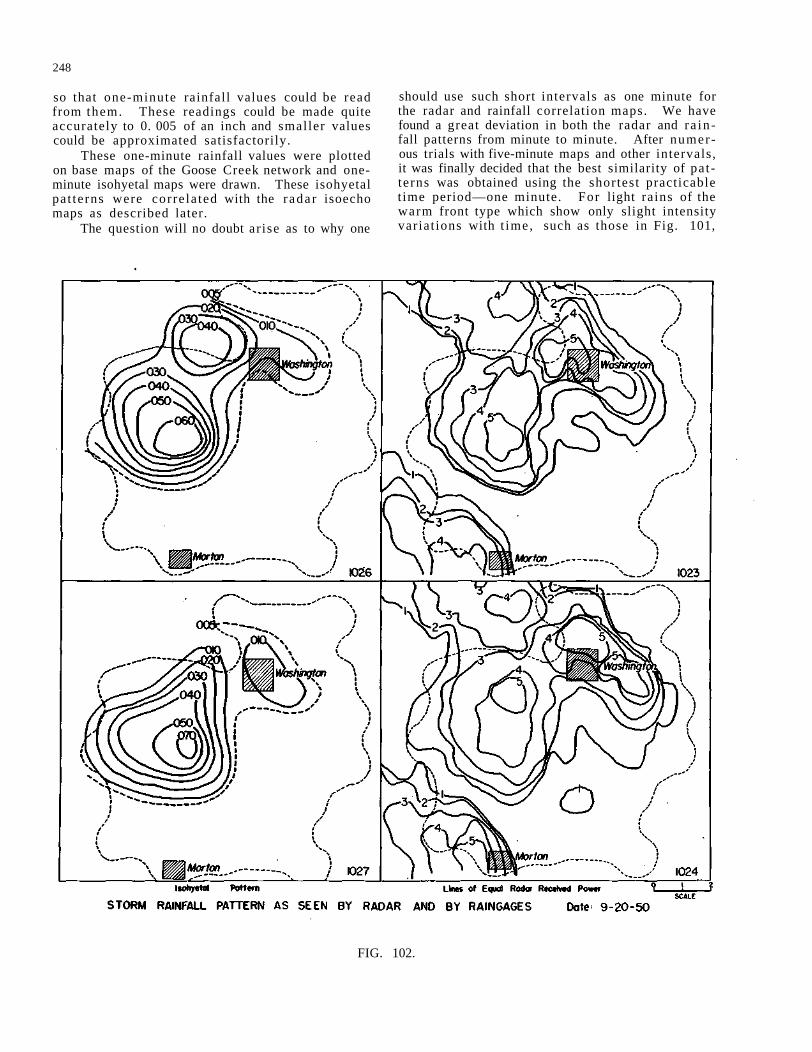
248
so that one-minute rainfall values could be read from them. These readings could be made quite accurately to 0. 005 of an inch and smaller values could be approximated satisfactorily.
These one-minute rainfall values were plotted on base maps of the Goose Creek network and one-minute isohyetal maps were drawn. These isohyetal pat terns were corre la ted with the radar isoecho maps as described later.
The question will no doubt ar ise as to why one
should use such short intervals as one minute for the radar and rainfall correlation maps. We have found a great deviation in both the radar and ra in fall patterns from minute to minute. After numerous trials with five-minute maps and other intervals, it was finally decided that the best similarity of pa t terns was obtained using the shortest practicable t ime period—one minute. For light rains of the warm front type which show only slight intensity variat ions with t ime, such as those in Fig. 101,
FIG. 102.
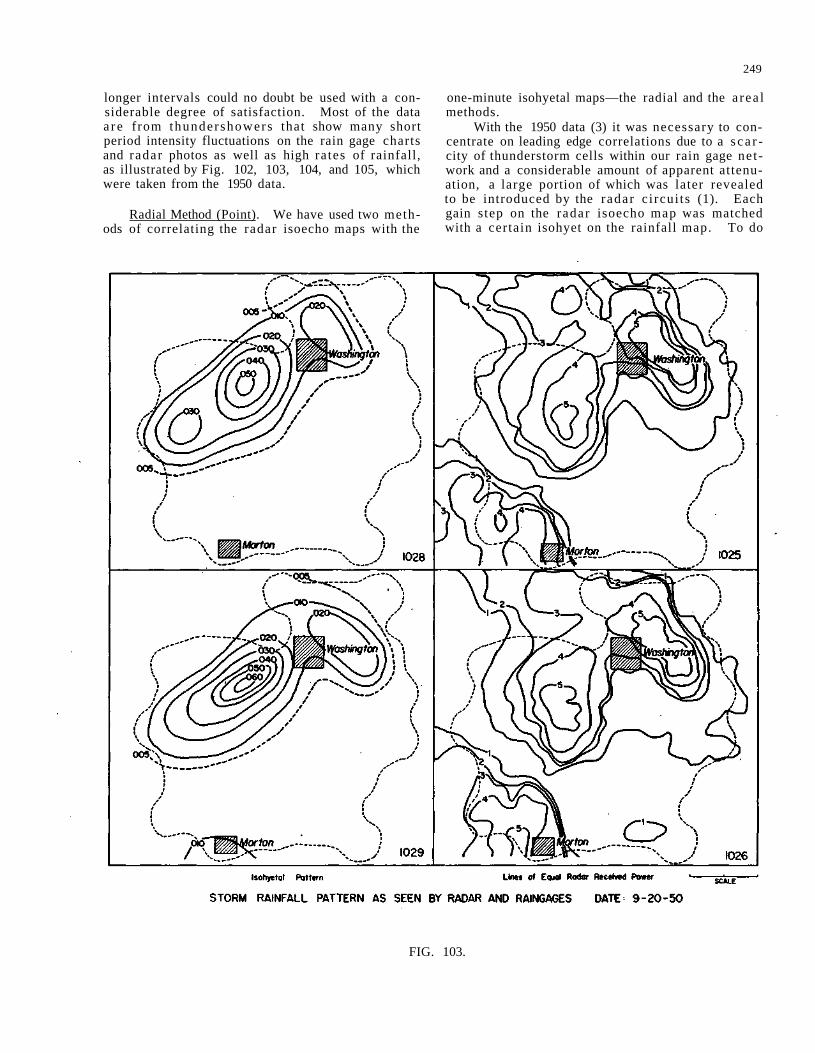
249
longer intervals could no doubt be used with a considerable degree of satisfaction. Most of the data a r e from thundershowers that show many short period intensity fluctuations on the rain gage charts and radar photos as well as high rates of rainfall, as illustrated by Fig. 102, 103, 104, and 105, which were taken from the 1950 data.
Radial Method (Point). We have used two methods of correlating the radar isoecho maps with the
one-minute isohyetal maps—the radial and the a rea l methods.
With the 1950 data (3) it was necessary to concentrate on leading edge correlations due to a s c a r city of thunderstorm cells within our rain gage net work and a considerable amount of apparent attenuation, a large portion of which was later revealed to be introduced by the radar c i rcui ts (1). Each gain step on the radar isoecho map was matched with a certain isohyet on the rainfall map. To do
FIG. 103.
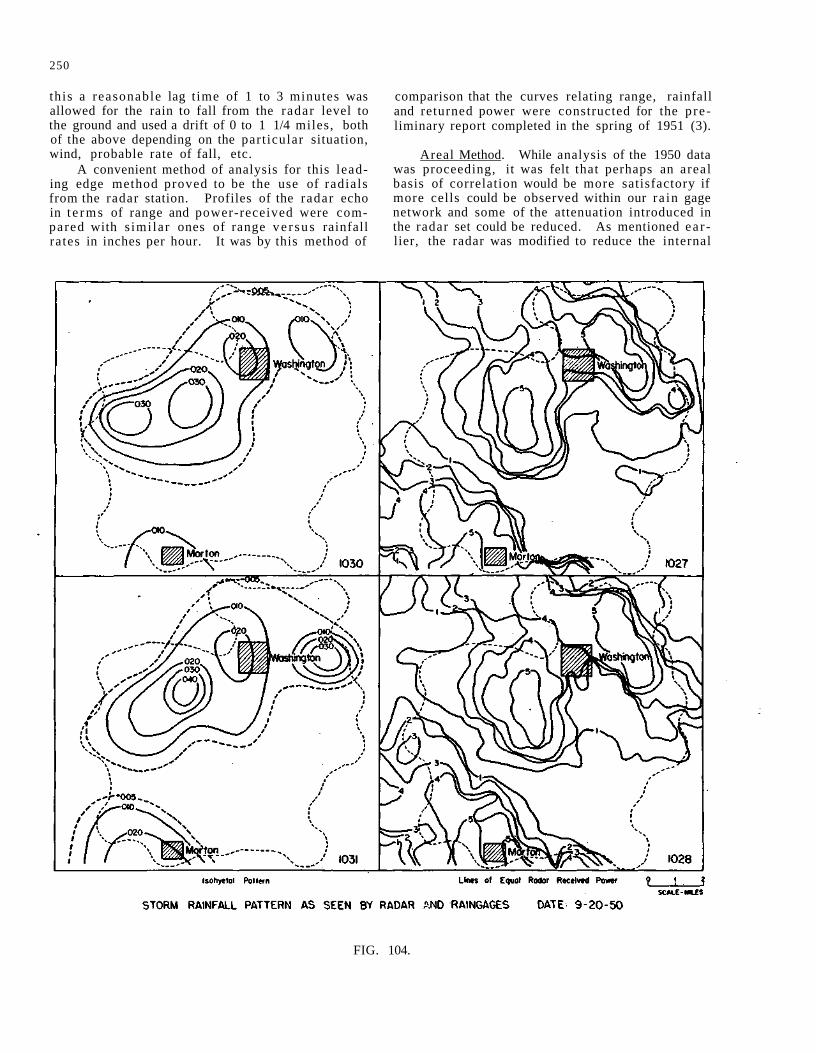
250
this a reasonable lag t ime of 1 to 3 minutes was allowed for the rain to fall from the radar level to the ground and used a drift of 0 to 1 1/4 miles, both of the above depending on the part icular situation, wind, probable rate of fall, etc.
A convenient method of analysis for this leading edge method proved to be the use of radials from the radar station. Profiles of the radar echo in t e rms of range and power-received were compared with s imilar ones of range ve r sus rainfall rates in inches per hour. It was by this method of
comparison that the curves relating range, rainfall and returned power were constructed for the preliminary report completed in the spring of 1951 (3).
Areal Method. While analysis of the 1950 data was proceeding, it was felt that perhaps an areal basis of correlation would be more satisfactory if more cells could be observed within our ra in gage network and some of the attenuation introduced in the radar set could be reduced. As mentioned ea r lier, the radar was modified to reduce the internal
FIG. 104.
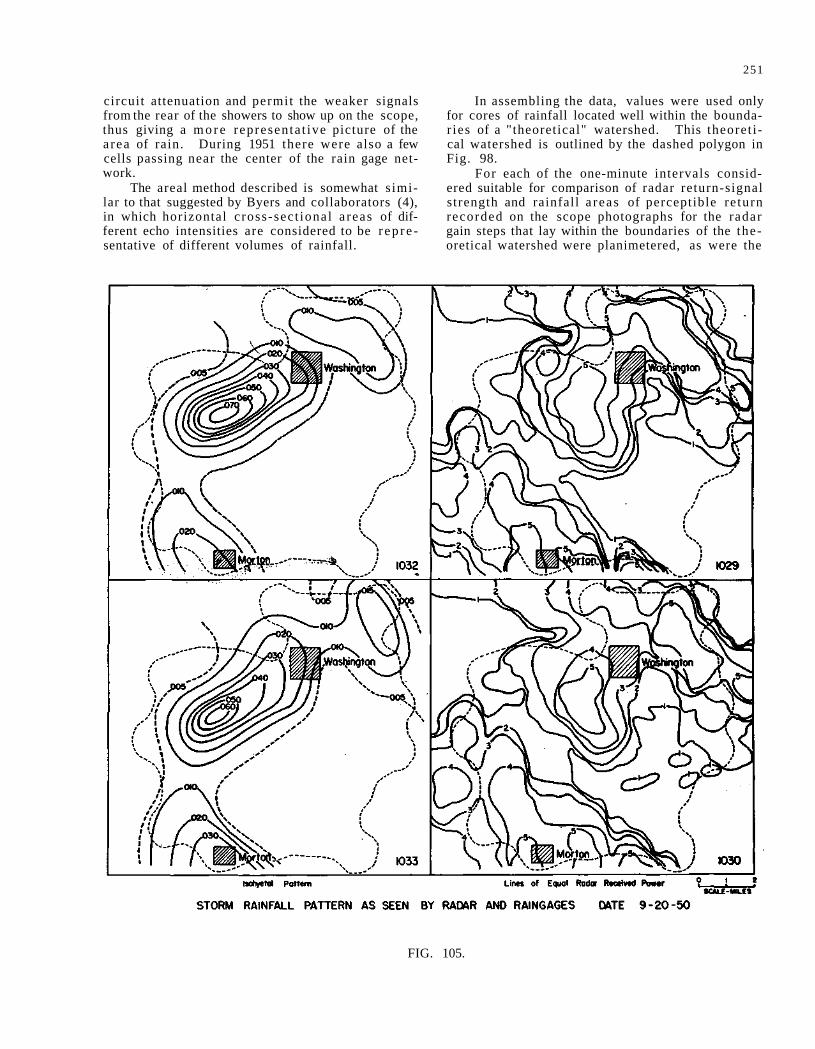
251
circuit attenuation and permit the weaker signals from the rear of the showers to show up on the scope, thus giving a m o r e representa t ive picture of the a rea of rain. During 1951 there were also a few cells passing near the center of the rain gage network.
The areal method described is somewhat s imilar to that suggested by Byers and collaborators (4), in which horizontal cross-sect ional a reas of different echo intensities are considered to be r ep re sentative of different volumes of rainfall.
In assembling the data, values were used only for cores of rainfall located well within the boundar ies of a "theoretical" watershed. This theoret i cal watershed is outlined by the dashed polygon in Fig. 98.
For each of the one-minute intervals considered suitable for comparison of radar return-signal strength and rainfall a reas of perceptible re turn recorded on the scope photographs for the radar gain steps that lay within the boundaries of the theoretical watershed were planimetered, as were the
FIG. 105.
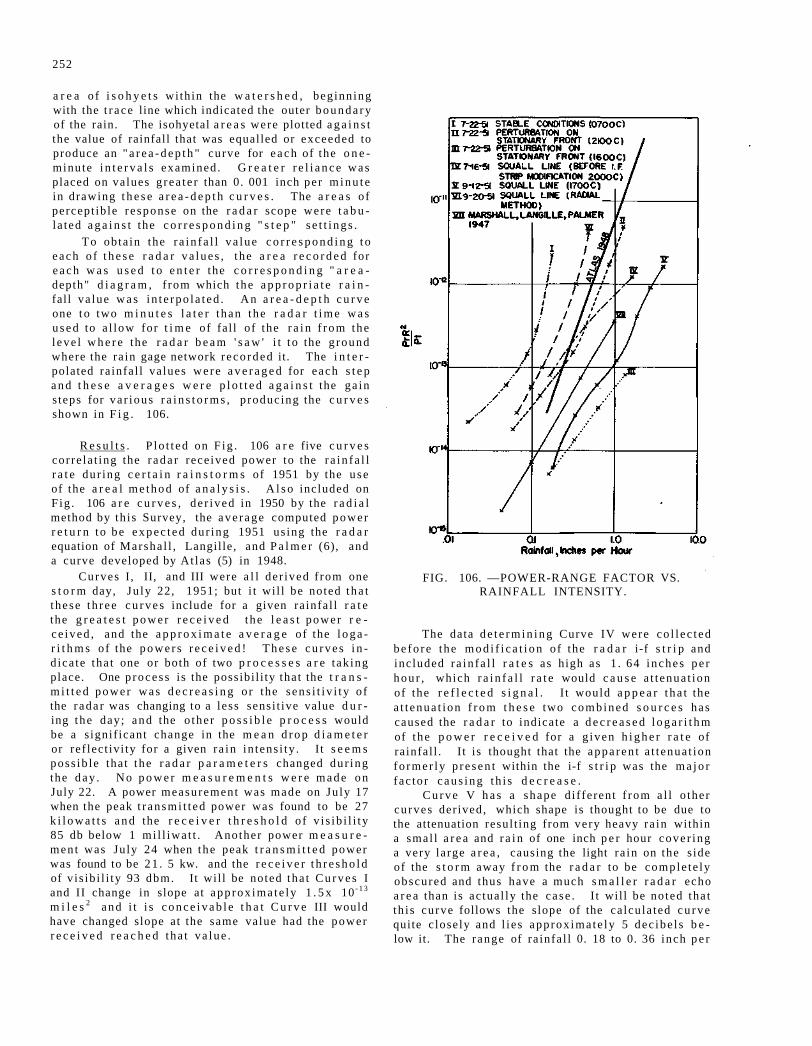
252
a r e a o f i s o h y e t s wi thin the w a t e r s h e d , beg inning with the t r ace line which indicated the outer b o u n d a r y of the rain. The isohyetal a r e a s were plotted a g a i n s t the value of rainfall that was equalled or exceeded to produce an " a r e a - d e p t h " curve for e a c h of the o n e -minute i n t e r v a l s examined. G r e a t e r r e l i a n c e was placed on values g rea t e r than 0. 001 inch per m i n u t e in drawing t h e s e a r e a - d e p t h c u r v e s . The a r e a s of percept ib le r e sponse on the r a d a r scope were t a b u la ted a g a i n s t the c o r r e s p o n d i n g " s t e p " s e t t i n g s .
T o obta in the r a in f a l l va lue c o r r e s p o n d i n g t o each o f t h e s e r a d a r va lue s , t he a r e a r e c o r d e d for e a c h w a s u s e d t o e n t e r the c o r r e s p o n d i n g " a r e a -depth" d i a g r a m , f rom which the a p p r o p r i a t e r a i n fall va lue w a s i n t e rpo la t ed . An a r e a - d e p t h c u r v e one t o two m i n u t e s l a t e r than the r a d a r t i m e w a s u s e d to a l low for t i m e of fal l of the r a i n f r o m the l eve l w h e r e the r a d a r b e a m ' s a w ' i t t o the g round where the ra in gage network r eco rded it. The i n t e r polated ra infal l va lues were a v e r a g e d for each s t e p a n d t h e s e a v e r a g e s w e r e p l o t t e d a g a i n s t the ga in s teps for va r ious r a i n s t o r m s , p roduc ing the c u r v e s shown in F i g . 106.
R e s u l t s . P lo t t ed on F ig . 106 a r e five c u r v e s cor re la t ing the r a d a r rece ived power to the r a in f a l l r a t e dur ing c e r t a i n r a i n s t o r m s of 1951 by the u s e of the a r e a l m e t h o d of a n a l y s i s . A l s o included on F ig . 106 a r e c u r v e s , de r ived in 1950 by the r a d i a l method by th is Survey, the ave rage computed power r e t u r n to be e x p e c t e d dur ing 1951 us ing the r a d a r equation of Marsha l l , Langil le, and P a l m e r (6), and a curve developed by At las (5) in 1948.
Curves I , II, and III were a l l der ived f rom one s t o r m day, Ju ly 22, 1951; but i t wi l l be noted t ha t these t h r ee c u r v e s include for a given ra infal l r a t e the g r e a t e s t p o w e r r e c e i v e d the l e a s t power r e ce ived , and the a p p r o x i m a t e a v e r a g e of the l o g a r i t h m s of the p o w e r s r e c e i v e d ! T h e s e c u r v e s i n d ica te tha t one or both of two p r o c e s s e s a r e tak ing place. One p roces s is the possibi l i ty that the t r a n s m i t t e d power was d e c r e a s i n g or the s ens i t i v i t y of the r ada r was changing to a less sensi t ive value d u r ing the day; and the o the r p o s s i b l e p r o c e s s would be a s ignif icant change in the m e a n d r o p d i a m e t e r or ref lect ivi ty for a given r a in in tens i ty . It s e e m s poss ib le that the r a d a r p a r a m e t e r s changed dur ing the day . No p o w e r m e a s u r e m e n t s w e r e m a d e on July 22. A power measurement was made on Ju ly 17 when the peak t r ansmi t t ed power was found to be 27 k i l o w a t t s a n d the r e c e i v e r t h r e s h o l d o f v i s ib i l i ty 85 db below 1 mi l l iwa t t . Another power m e a s u r e men t was July 24 when the peak t r a n s m i t t e d power was found to be 21 . 5 kw. and the r e c e i v e r t h r e s h o l d of v is ib i l i ty 93 dbm. It wil l be noted tha t C u r v e s I and II change in slope at app rox ima te ly 1 . 5 x 10 - 1 3
m i l e s 2 and i t i s c o n c e i v a b l e t h a t C u r v e III would have changed slope at the same value had the power r e c e i v e d r e a c h e d tha t va lue .
FIG. 106. —POWER-RANGE FACTOR VS. RAINFALL INTENSITY.
The data d e t e r m i n i n g Curve IV were co l l ec t ed be fo re the m o d i f i c a t i o n of the r a d a r i-f s t r i p and inc luded r a in fa l l r a t e s as high as 1 . 64 i nches pe r h o u r , which r a i n f a l l r a t e would c a u s e a t t enua t ion of the r e f l e c t e d s i g n a l . I t would a p p e a r t ha t the a t t enua t ion f r o m t h e s e two combined s o u r c e s has caused the r a d a r to indicate a d e c r e a s e d l o g a r i t h m of the p o w e r r e c e i v e d for a g iven h i g h e r r a t e of ra infal l . I t is thought that the appa ren t a t t enua t ion fo rmer ly p r e sen t within the i-f s t r i p was the m a j o r fac to r c a u s i n g th i s d e c r e a s e .
C u r v e V h a s a shape d i f ferent f rom a l l o ther cu rves der ived, which shape is thought to be due to the attenuation resul t ing from very heavy ra in within a smal l a r e a and r a i n of one inch p e r hour cover ing a very large a r e a , causing the light ra in on the s ide of the s t o r m away f r o m the r a d a r to be comple te ly obscured and thus have a much s m a l l e r r a d a r echo a r e a than is ac tua l ly the case . I t wil l be noted tha t th i s curve follows the slope of the ca lcu la ted c u r v e quite c lose ly and l i e s approx imate ly 5 dec ibe l s b e low it. The range of ra infa l l 0. 18 to 0. 36 inch p e r
253
hour on this curve tends to follow a slope similar to that of At las , but changes from 0. 36 inch per hour to a slope less than that of the calculated slope. No explanation is offered for this phenomenon. It must be remembered that these curves are plotted from points derived by averaging all values of power rece ived for a given rainfall ra te and drawing a smooth curve through those points by estimation, while At las ' cu rve is a r e g r e s s i o n curve for a straight line. Another possibility in explaining the peculiar shape of Curve V might be the Rayleigh scattering effect at 3. 2 cm. wave length as suggested by Wexler (7). This effect may be active in the change in slope noted in all the other curves since it will be noted that the breaks in slope occur in the same range of rainfall ra tes indicating that this is the range of points at which certain drop-sizes become most effective in reflecting the radar beam. This does not hold too well for Curves II, III, and VI. However, it will be noted that the la t ter named curves all occur under a certain synoptic weather condition, a perturbation on a stationary front, suggesting that there is a significant shift in drop-size distribution from one synoptic situation to another.
Curve VI has been derived from the data of September 20, 1950, and has been analyzed by the radia l method when it was assumed that rainfall attenuation at 3. 2 cm. wave length has little effect, since the only data used have come from the leading edge of the s torm to the core of heaviest ra infall ra te . Since the original analysis of this 1950 data, it has been determined that such an assumption is not valid and that the attenuation from the leading edge to the core of heaviest rain may be as high as 20 db for two-way t ransmiss ion through a s torm 12 miles in diameter with a center core of rainfall intensity of 4 inches per hour. In Curve VI attenuation due to rainfall has been masked by the increased power re turn caused by the deviation of the reflectivity, as predicted by the Rayleigh scat tering law, as the diameter of the rain drops approaches the wave length of the radar .
ACKNOWLEDGMENT
The authors are indebted to Mr. H. E. Hudson, J r . , Head, Engineering Subdivision, for guidance in writing this paper.
BIBLIOGRAPHY
Ref.
1. Farnsworth, G. W., "Quantitative Radar-Rainfall Problems." Paper read before Second Weather-Radar Conference, 1951, Illinois State Water Survey.
2. Roberts, R. E . , Progress Report, "Investigation of the Sensitivity, Accuracy, and Lag of the Bendix-Friez Dual Traverse Rain Gage," 1950, Illinois State Water Survey.
3. Hudson, H. E., Jr . , Stout, G. E., and Huff, F. A. , "Studies of Thunderstorm Rainfall with Dense Raingage Networks and Radar," Illinois State Water Survey Report of Investigation No. 13, 1951.
Ref.
4. Byers, H. R. and collaborators, "The Use of Radar in Determining the Amount of Rain Falling over a Small Area," Transactions, A. O. U., 29, 2, April 1948, p. 187.
5. Atlas, David, "Some Experimental Results of Quantitative Radar Analysis of Rain Storms," U. S. Air Force, Air Materiel Command, May 1948.
6. Marshall, J. S., Langille, R. C., and Palmer, W. McK., "Measurement of Rainfall by Radar," J. Met. 4, 6, December 1947, pp. 186-192.
7. Wexler, Raymond, "Rain Intensities by Radar," J. Met. 5, 171-173, Aug. 1948.
254
DISCUSSION
L. J. BATTAN. —Since this area idea is direct ly applicable to hydrology and since the a rea was only a basin, I wonder if any efforts were made to tie in th is information with that of the s t ream gage.
D. M. A. JONES. —A s t r eam gaging station is placed on Goose Creek, and the radar and rain gage data will be corre la ted with it; but, as yet, this has not been done.
S. E. REYNOLDS. —It seems to me that since the r ada r beam width is around 6, 000 feet at 20 m i l e s , it in effect integrates the rainfall over a number of minutes and, therefore, using a resolution of one minute on the rain gage and then comparing that to the intensity of the radar return, will in--troduce some discrepancy.
D. M. A. JONES. —That is no doubt t rue . We wondered how good our correlation can be for that reason. We have a three-degree beam width now, and we will have a one-and-one-half-degree beam width later to reduce the area. As I mentioned in the paper, we found that the five-minute intervals did not work at all ; we found no correlation whatsoever.
S. E. REYNOLDS. —That is what is hard for me to believe. It seems the longer the period, the better the correlation should be.
D. M. A. JONES. —It is because the rate changes too fast.
S. E. REYNOLDS. —But how can the radar see this ?
D. M. A. JONES.—I think that part of the solution may be in the fact that we try for a zero degree tilt on our antenna. We may be mistaken in this , but we thought we would get the best correlation by
trying to see the rain at the ground. Of' course, we still have some of the beam in the a i r .
S. E. REYNOLDS. —This means that you are only covering about 3,000 feet, then, in 20 miles .
D. ATLAS. —It seems to me that there is quite a group of us here who have worked in correlating and have paid attention to rainfall a number of years . My personal idea is that, in my work and in that of the Illinois State Water Survey, it has been shown that we have just about reached the limit of accuracy and that we should recognize that the relationship between drop measurement has certain diss imilar i ties.
H. R. BYERS. —When it comes to the practical determination of rainfall, we a r e concerned with rain that occurs over a period of time; these meas urements that we have been talking about have been correlations within a minute, and instantaneous and so forth, and I think that the data of the Water Survey and other data will bear out the fact that the time factor is extremely important in determining the total amount of rain that falls over a given spot. In the case of these discrepancies t ime is a great hea l e r , or a g r ea t smoother of the differences, and I think that over a period of a storm, part icularly if it is staying over one position for any length of t ime, you will find that the relationship is good because the t ime factor enters into it, and it is a very important point.
J. C. FREEMAN. *—I wanted to say one word as an observer and as a meteorologist . I do not want you radar men to forget what a wonderful thing it is that you can sit in a little shed somewhere and get an idea of the relative intensity of the rain over a large area. So let us get something out of it so everybody can use it.
*Meteorologist, Cook Research Laboratory, Chicago, Illinois.
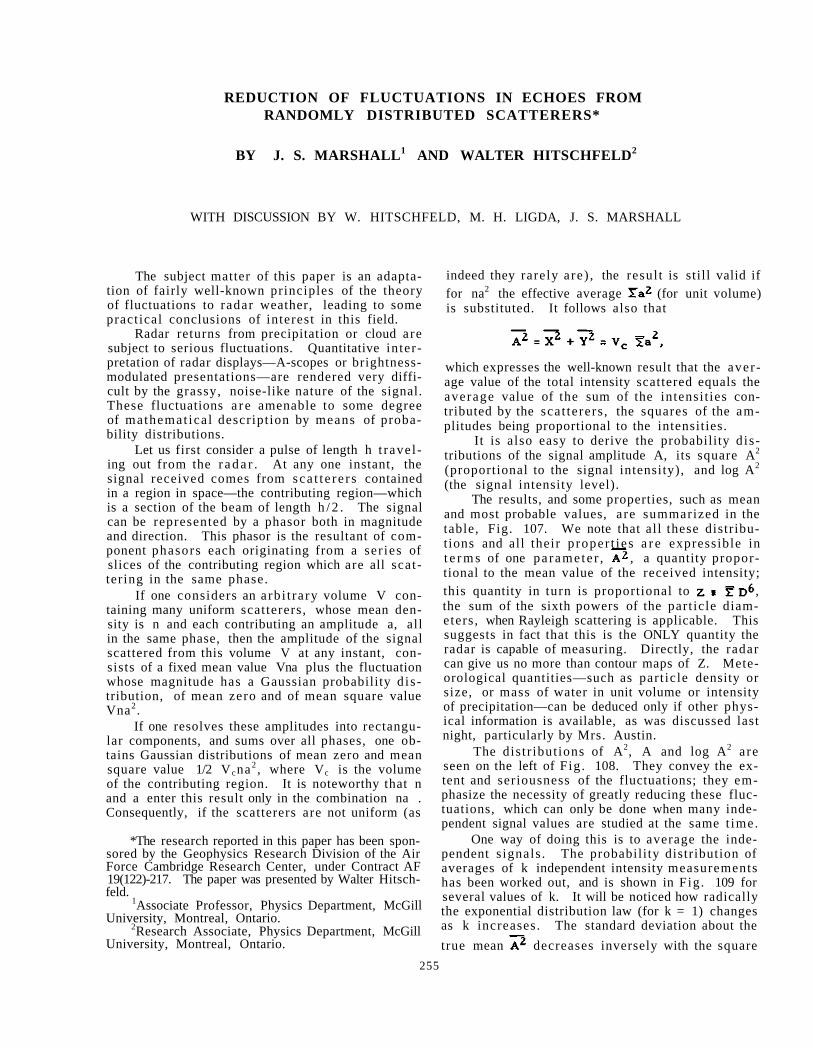
REDUCTION OF FLUCTUATIONS IN ECHOES FROM RANDOMLY DISTRIBUTED SCATTERERS*
BY J. S. MARSHALL1 AND WALTER HITSCHFELD2
WITH DISCUSSION BY W. HITSCHFELD, M. H. LIGDA, J. S. MARSHALL
The subject matter of this paper is an adaptation of fairly well-known principles of the theory of fluctuations to radar weather, leading to some practical conclusions of interest in this field.
Radar returns from precipitation or cloud are subject to serious fluctuations. Quantitative interpretation of radar displays—A-scopes or brightness-modulated presentations—are rendered very difficult by the grassy, noise-like nature of the signal. These fluctuations a r e amenable to some degree of mathemat ica l descript ion by means of probability distributions.
Let us first consider a pulse of length h t rave l ing out from the r a d a r . At any one instant, the signal received comes from sca t t e re r s contained in a region in space—the contributing region—which is a section of the beam of length h / 2 . The signal can be represented by a phasor both in magnitude and direction. This phasor is the resultant of component phasors each originating from a ser ies of slices of the contributing region which are all scattering in the same phase.
If one considers an arb i t ra ry volume V containing many uniform scatterers, whose mean density is n and each contributing an amplitude a, all in the same phase, then the amplitude of the signal scattered from this volume V at any instant, consists of a fixed mean value Vna plus the fluctuation whose magnitude has a Gaussian probability d i s tribution, of mean zero and of mean square value Vna2 .
If one resolves these amplitudes into rectangular components, and sums over all phases, one obtains Gaussian distributions of mean zero and mean square value 1/2 V cna2 , where Vc is the volume of the contributing region. It is noteworthy that n and a enter this result only in the combination na . Consequently, if the scatterers are not uniform (as
*The research reported in this paper has been sponsored by the Geophysics Research Division of the Air Force Cambridge Research Center, under Contract AF 19(122)-217. The paper was presented by Walter Hitsch-feld.
1Associate Professor, Physics Department, McGill University, Montreal, Ontario.
2Research Associate, Physics Department, McGill University, Montreal, Ontario.
indeed they rarely are) , the resul t is still valid if for na2 the effective average (for unit volume) is substituted. It follows also that
which expresses the well-known result that the aver age value of the total intensity scattered equals the average value of the sum of the intensi t ies contributed by the scat terers , the squares of the amplitudes being proportional to the intensities.
It is also easy to derive the probability d istributions of the signal amplitude A, its square A2
(proportional to the signal intensity), and log A2
(the signal intensity level). The results, and some properties, such as mean
and most probable values, a re summarized in the table, Fig. 107. We note that all these distributions and all their p roper t ies a r e expressible in t e r m s of one pa ramete r , , a quantity proportional to the mean value of the received intensity; this quantity in turn is proportional to , the sum of the sixth powers of the part icle diameters , when Rayleigh scattering is applicable. This suggests in fact that this is the ONLY quantity the radar is capable of measuring. Directly, the radar can give us no more than contour maps of Z. Meteorological quantities—such as part icle density or size, or mass of water in unit volume or intensity of precipitation—can be deduced only if other physical information is available, as was discussed last night, particularly by Mrs. Austin.
The dis tr ibut ions of A2, A and log A2 a re seen on the left of Fig . 108. They convey the extent and seriousness of the fluctuations; they emphasize the necessity of greatly reducing these fluctuations, which can only be done when many independent signal values are studied at the same t ime.
One way of doing this is to average the independent s ignals . The probability distribution of averages of k independent intensity measurements has been worked out, and is shown in Fig . 109 for several values of k. It will be noticed how radically the exponential distribution law (for k = 1) changes as k increases. The standard deviation about the true mean decreases inversely with the square
255
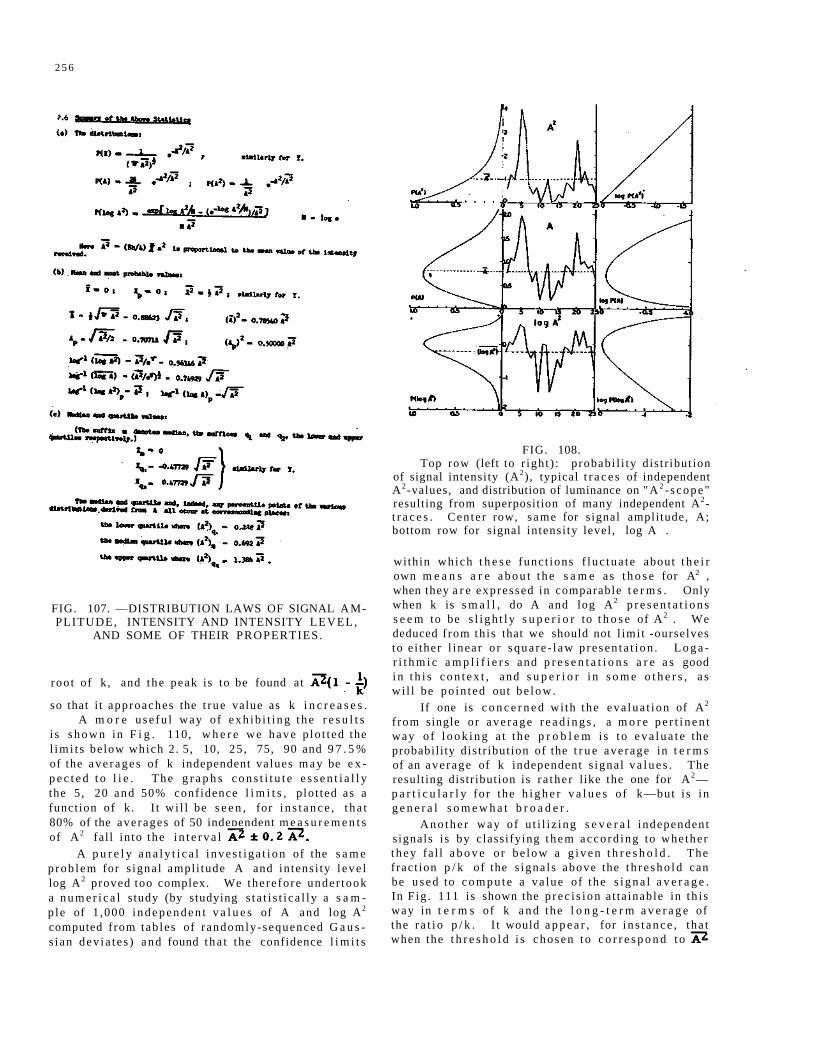
2 5 6
FIG. 107. —DISTRIBUTION LAWS OF SIGNAL AMPLITUDE, INTENSITY AND INTENSITY LEVEL,
AND SOME OF THEIR PROPERTIES.
roo t of k, and the peak is to be found at
so that i t approaches the t rue value as k i n c r e a s e s . A m o r e u s e f u l way of exh ib i t i ng t h e r e s u l t s
i s s h o w n in F i g . 110, w h e r e we h a v e p lo t t ed the l im i t s below which 2. 5 , 10, 25 , 75, 90 and 9 7 . 5 % of the a v e r a g e s of k independent values m a y be e x p e c t e d t o l i e . The g r a p h s c o n s t i t u t e e s s e n t i a l l y the 5 , 20 and 50% conf idence l i m i t s , p lo t ted as a funct ion of k . I t wi l l be s e e n , for i n s t a n c e , t ha t 80% of the ave rages of 50 independent m e a s u r e m e n t s of A2 fal l in to the i n t e r v a l
A p u r e l y a n a l y t i c a l i n v e s t i g a t i o n of the s a m e p rob lem for s igna l ampl i tude A and in tens i ty l eve l log A2 proved too complex. We there fore under took a n u m e r i c a l s tudy (by studying s t a t i s t i ca l ly a s a m p le of 1 ,000 i n d e p e n d e n t v a l u e s of A and log A2
computed f rom tab les of randomly-sequenced G a u s s i an dev ia t e s ) and found t ha t the confidence l i m i t s
FIG. 108. Top row (left to r ight ) : probabi l i ty dis t r ibut ion
of signal intensity (A2), typical t r a c e s of independent A2-values, and distribution of luminance on "A 2 - s cope" resulting from superposition of many independent A2-t r a c e s . Cen te r row, same for signal amplitude, A; bottom row for signal intensi ty level , log A .
within which t h e s e func t ions f l uc tua t e about t h e i r own m e a n s a r e a b o u t t h e s a m e as t h o s e for A , when they a r e expressed in comparable t e r m s . Only when k is s m a l l , do A and log A2 p r e s e n t a t i o n s s e e m to be s l i g h t l y s u p e r i o r to t h o s e of A . We deduced f rom th is that we should not l imi t -ourselves to e i ther l inear o r squa re - l aw p re sen ta t i on . L o g a r i t h m i c a m p l i f i e r s and p r e s e n t a t i o n s a r e a s good i n t h i s c o n t e x t , and s u p e r i o r i n s o m e o t h e r s , a s wi l l be po in ted out be low .
If one is c o n c e r n e d wi th the eva lua t ion of A2
f rom single or ave rage r e a d i n g s , a m o r e p e r t i n e n t way o f l o o k i n g a t t h e p r o b l e m i s t o e v a l u a t e the probabil i ty dis t r ibut ion of the t r u e average in t e r m s of an ave rage of k independent s igna l v a l u e s . The result ing distr ibution is r a the r like the one for A2— p a r t i c u l a r l y for the h i g h e r v a l u e s of k—but i s in g e n e r a l s o m e w h a t b r o a d e r .
A n o t h e r way of u t i l i z ing s e v e r a l independent s ignals i s by classifying t h e m acco rd ing to whe ther t h e y fa l l a b o v e or be low a g i v e n t h r e s h o l d . The f ract ion p / k of the s igna l s above the t h r e s h o l d can be u s e d to c o m p u t e a va lue of the s i g n a l a v e r a g e . In F ig . 111 is shown the p r e c i s i o n a t ta inable in t h i s way in t e r m s of k a n d the l o n g - t e r m a v e r a g e of the r a t i o p / k . I t would a p p e a r , for i n s t a n c e , tha t when the t h r e s h o l d i s chosen t o c o r r e s p o n d t o
2
2
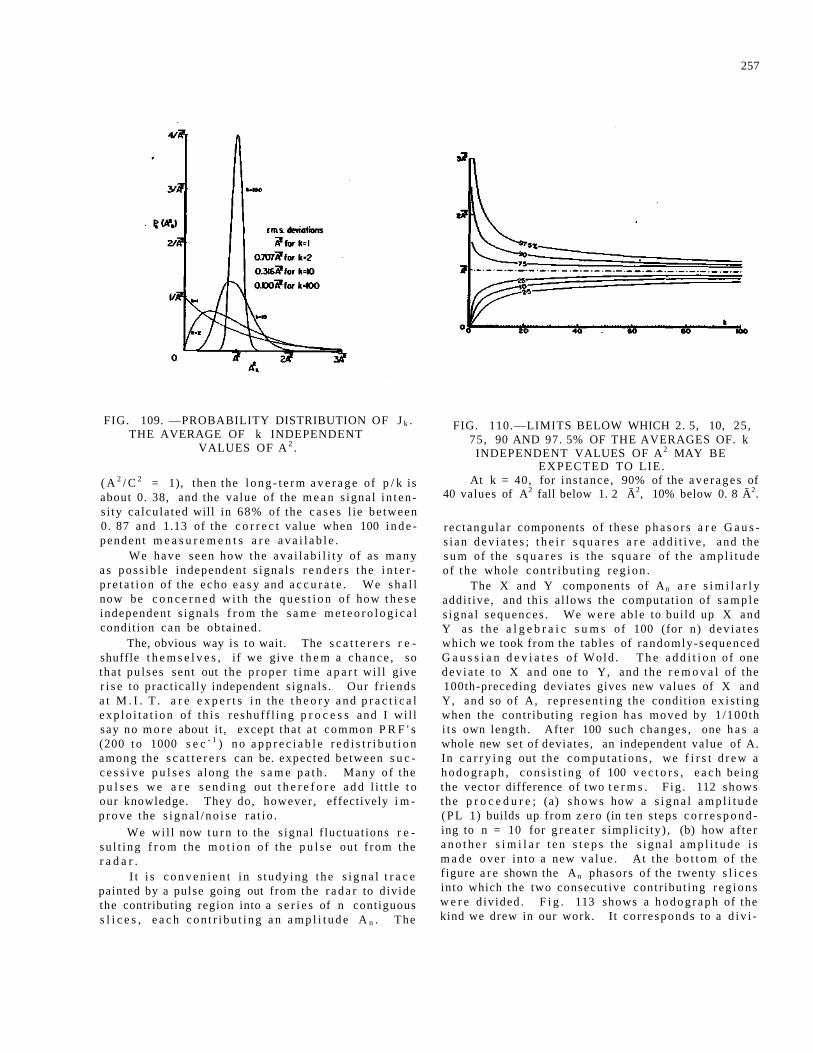
257
FIG. 109. —PROBABILITY DISTRIBUTION OF J k . THE AVERAGE OF k INDEPENDENT
VALUES OF A 2 .
( A 2 / C 2 = 1), then the l o n g - t e r m a v e r a g e of p / k is about 0. 38, and the value of the m e a n s igna l i n t e n s i ty ca lcu la ted will in 68% of the c a s e s l ie be tween 0. 87 and 1.13 of the c o r r e c t value when 100 i n d e penden t m e a s u r e m e n t s a r e a v a i l a b l e .
We have seen how the ava i l ab i l i t y of as m a n y a s pos s ib l e independent s igna l s r e n d e r s the i n t e r p r e t a t i o n of the echo e a s y and a c c u r a t e . We s h a l l now be c o n c e r n e d w i t h the q u e s t i o n of how t h e s e independent s igna ls f r o m the s a m e m e t e o r o l o g i c a l condit ion can be obta ined.
The, obvious way is to wait. The s c a t t e r e r s r e shuffle t h e m s e l v e s , i f we give t h e m a c h a n c e , so tha t pu l ses sent out the p rope r t i m e a p a r t wi l l give r i s e to pract ical ly independent s igna ls . Our f r i ends a t M . I . T . a r e e x p e r t s i n the t h e o r y a n d p r a c t i c a l e x p l o i t a t i o n of t h i s reshuf f l ing p r o c e s s and I wi l l say no m o r e about i t , except that a t common P R F ' s (200 t o 1000 s e c - 1 ) n o a p p r e c i a b l e r e d i s t r i b u t i o n among the s c a t t e r e r s can be. expected be tween s u c c e s s i v e p u l s e s a long the s a m e p a t h . Many of the p u l s e s w e a r e s e n d i n g out t h e r e f o r e a d d l i t t l e t o our knowledge. They do, however , effectively i m p r o v e the s i g n a l / n o i s e r a t i o .
We wi l l now t u r n to the s igna l f luctuat ions r e su l t i ng f r o m the m o t i o n of the p u l s e out f rom the r a d a r .
I t i s c o n v e n i e n t i n s tudy ing t h e s i g n a l t r a c e painted by a pulse going out from the r a d a r to d ivide the contributing region into a s e r i e s of n contiguous s l i c e s , e a c h c o n t r i b u t i n g a n a m p l i t u d e A n . The
FIG. 110.—LIMITS BELOW WHICH 2. 5, 10, 25, 75, 90 AND 97. 5% OF THE AVERAGES OF. k
INDEPENDENT VALUES OF A2 MAY BE EXPECTED TO LIE.
At k = 40, for ins tance , 90% of the a v e r a g e s of 40 values of A2 fall below 1. 2 Ā2, 10% below 0. 8 Ā2.
r ec tangula r components of these p h a s o r s a r e G a u s s i a n d e v i a t e s ; t h e i r s q u a r e s a r e a d d i t i v e , and the s u m of the s q u a r e s is the s q u a r e of the a m p l i t u d e of t h e whole con t r ibu t ing r e g i o n .
The X and Y components of An a r e s i m i l a r l y addi t ive , and th is a l lows the computat ion of s a m p l e s igna l sequences . We w e r e ab le to build up X and Y as t h e a l g e b r a i c s u m s of 100 (for n) d e v i a t e s which we took from the tables of randomly-sequenced G a u s s i a n d e v i a t e s of Wold . T h e a d d i t i o n of one dev ia t e to X and one to Y, and the r e m o v a l of the 100th-preceding deviates gives new values of X and Y, and so of A, r ep re sen t ing the condition ex i s t ing when the contr ibut ing reg ion h a s moved by 1 /100th i t s own length. After 100 such changes , one h a s a whole new se t of deviates, an independent value of A. In c a r r y i n g out the c o m p u t a t i o n s , we f i r s t d r e w a h o d o g r a p h , c o n s i s t i n g of 100 v e c t o r s , e a c h be ing the vector difference of two t e r m s . F ig . 112 shows the p r o c e d u r e ; (a) s h o w s how a s i g n a l a m p l i t u d e ( P L 1) builds up from z e r o (in ten s teps c o r r e s p o n d ing to n = 10 for g r e a t e r s impl ic i ty) , (b) how a f te r a n o t h e r s i m i l a r t e n s t e p s the s i g n a l a m p l i t u d e i s m a d e over in to a new v a l u e . At the b o t t o m of the f igure a r e shown the An phasors of the twenty s l i c e s into which the two consecut ive contr ibut ing r e g i o n s w e r e d iv ided . F i g . 113 shows a h o d o g r a p h of the kind we drew in our work. It co r re sponds to a d i v i -
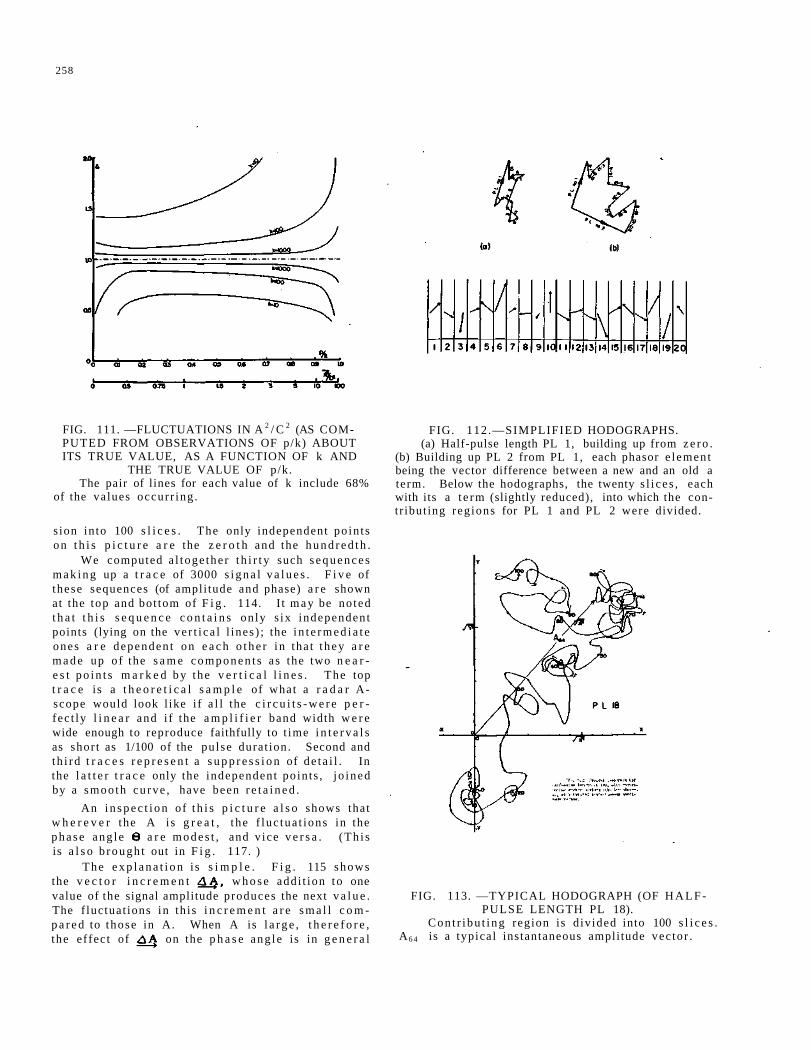
258
FIG. 111. —FLUCTUATIONS IN A 2 / C 2 (AS COMPUTED FROM OBSERVATIONS OF p/k) ABOUT ITS TRUE VALUE, AS A FUNCTION OF k AND
THE TRUE VALUE OF p/k. The pair of lines for each value of k include 68%
of the values occur r ing .
s ion in to 100 s l i c e s . The only independent po in t s on t h i s p i c t u r e a r e the z e r o t h and the h u n d r e d t h .
We computed a l toge the r t h i r t y such s e q u e n c e s m a k i n g up a t r a c e of 3000 s i g n a l v a l u e s . F i v e of these sequences (of ampli tude and phase) a r e shown at the top and bot tom of F i g . 114. I t m a y be no ted t h a t t h i s s e q u e n c e c o n t a i n s on ly s ix independent points (lying on the ve r t i ca l l ines) ; the i n t e r m e d i a t e ones a r e dependen t on e a c h o t h e r i n tha t t hey a r e m a d e up of the s a m e c o m p o n e n t s as the two n e a r e s t p o i n t s m a r k e d b y the v e r t i c a l l i n e s . The top t r a c e is a t h e o r e t i c a l s a m p l e of what a r a d a r A-scope would look l ike i f a l l the c i r c u i t s - w e r e p e r fec t ly l i n e a r and i f the a m p l i f i e r band width w e r e wide enough to reproduce faithfully to t ime i n t e r v a l s as shor t as 1/100 of the pu lse durat ion. Second and th i rd t r a c e s r e p r e s e n t a s u p p r e s s i o n of de t a i l . In the l a t t e r t r a c e only the independent poin ts , j o ined by a smooth cu rve , have been r e t a i n e d .
An i n s p e c t i o n of t h i s p i c t u r e a l s o shows that w h e r e v e r the A i s g r e a t , t he f luc tua t ions in the p h a s e ang le a r e m o d e s t , and v ice v e r s a . (Th i s is a l s o b rough t out in F i g . 117. )
The e x p l a n a t i o n i s s i m p l e . F i g . 115 shows the v e c t o r i n c r e m e n t w h o s e addi t ion t o one value of the signal amplitude produces the next v a l u e . The f luctuat ions in th is i n c r e m e n t a r e s m a l l c o m p a r e d to those in A. When A is l a r g e , t h e r e f o r e , the ef fec t of on the p h a s e ang le is in g e n e r a l
FIG. 112.—SIMPLIFIED HODOGRAPHS. (a) Half-pulse length PL 1, building up from z e r o .
(b) Building up PL 2 from PL 1, each phasor e lement being the vector difference between a new and an old a term. Below the hodographs, the twenty s l i ces , each with its a t e rm (slightly reduced), into which the contr ibut ing reg ions for PL 1 and PL 2 were divided.
FIG. 113. —TYPICAL HODOGRAPH (OF H A L F -PULSE LENGTH PL 18).
Con t r ibu t ing region is d ivided into 100 s l i c e s . A6 4 is a typical instantaneous amplitude vec tor .
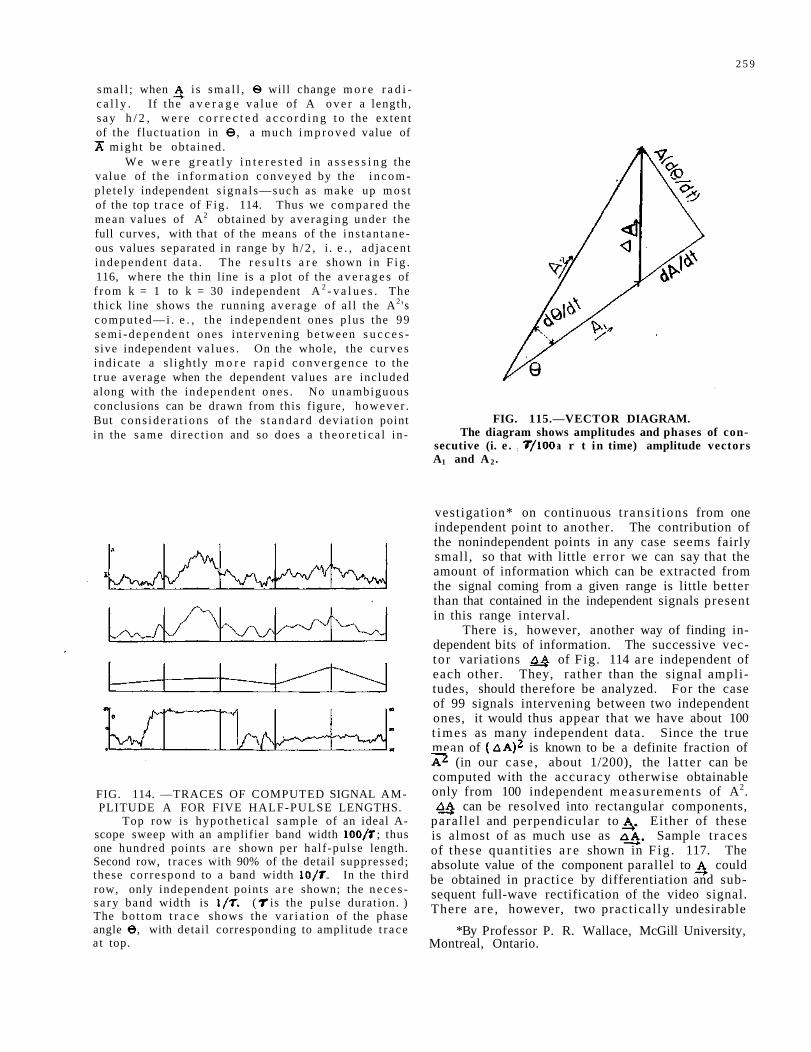
2 5 9
smal l ; when i s s m a l l , will change m o r e r a d i c a l l y . If t he a v e r a g e v a l u e of A o v e r a length, say h / 2 , w e r e c o r r e c t e d a c c o r d i n g t o the extent of the f luctuat ion in , a m u c h i m p r o v e d value of
migh t be obta ined. We w e r e g r e a t l y i n t e r e s t e d in a s s e s s i n g the
va lue of the i n f o r m a t i o n conveyed by the i n c o m plete ly independent s igna l s—such as make up m o s t of the top t r a c e of F ig . 114. Thus we compared the mean values of A2 obtained by averag ing under the full curves, with that of the means of the i n s t an t ane ous values separated in range by h / 2 , i . e . , ad jacen t independen t da t a . The r e s u l t s a r e shown in F i g . 116, where the thin line is a plot of the a v e r a g e s of f r o m k = 1 to k = 30 independent A 2 - v a l u e s . The thick line shows the running ave rage of a l l the A2 ' s compu ted—i . e . , t he independent ones p lus the 99 s e m i - d e p e n d e n t ones in te rven ing be tween s u c c e s sive independent va lues . On the whole, the c u r v e s indica te a s l ight ly m o r e r a p i d c o n v e r g e n c e to the t r u e average when the dependent values a r e included along with the independent ones . No unambiguous conclusions can be drawn from this f igure, however . But cons ide ra t i ons of the s t a n d a r d devia t ion point in the same d i rec t ion and so does a t h e o r e t i c a l in -
FIG. 114. —TRACES OF COMPUTED SIGNAL AMPLITUDE A FOR FIVE HALF-PULSE LENGTHS.
Top row is hypothe t ica l s amp le of an ideal A-scope sweep with an amplifier band width ; thus one hundred points a r e shown per half-pulse length. Second row, t races with 90% of the detail suppressed; these cor respond to a band width . In the th i rd row, only independent points a r e shown; the n e c e s s a r y band width is ( is the pu lse duration. ) The bot tom t r a c e shows the va r i a t i on of the phase angle , with detail corresponding to amplitude t r ace a t top.
FIG. 115.—VECTOR DIAGRAM. The diagram shows amplitudes and phases of con
secutive (i. e . , a p a r t in time) amplitude vectors A1 and A 2 .
vestigation* on continuous t rans i t ions from one independent point to another. The contribution of the nonindependent points in any case seems fairly small, so that with little e r ro r we can say that the amount of information which can be extracted from the signal coming from a given range is little better than that contained in the independent signals present in this range interval.
There is , however, another way of finding independent bits of information. The successive vector variations of Fig . 114 are independent of each other. They, ra ther than the signal amplitudes, should therefore be analyzed. For the case of 99 signals intervening between two independent ones, it would thus appear that we have about 100 t imes as many independent data. Since the true mean of is known to be a definite fraction of
(in our case , about 1/200), the lat ter can be computed with the accuracy otherwise obtainable only from 100 independent measurements of A2.
can be resolved into rectangular components, paral le l and perpendicular to Either of these is almost of as much use as Sample t races of these quanti t ies a r e shown in F ig . 117. The absolute value of the component parallel to could be obtained in practice by differentiation and subsequent full-wave rectification of the video signal. There a re , however, two practically undesirable
*By Professor P. R. Wallace, McGill University, Montreal, Ontario.
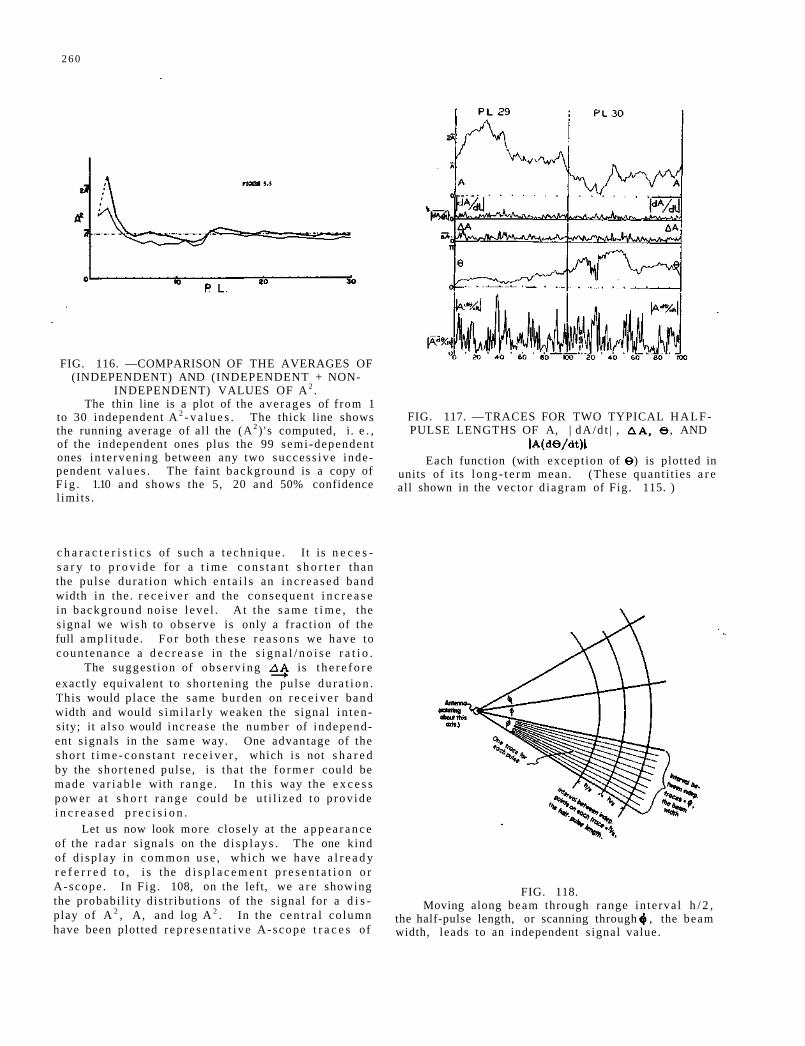
2 6 0
FIG. 116. —COMPARISON OF THE AVERAGES OF (INDEPENDENT) AND (INDEPENDENT + NON-
INDEPENDENT) VALUES OF A 2 . The thin line is a plot of the ave rages of f rom 1
to 30 independent A 2 - v a l u e s . The thick line shows the running average of al l the (A 2 ) ' s computed, i. e . , of the independent ones plus the 99 semi-dependent ones in te rven ing between any two success ive independent v a l u e s . The faint background is a copy of F i g . 1.10 and shows the 5, 20 and 50% confidence l imi ts .
c h a r a c t e r i s t i c s of such a t e c h n i q u e . I t is n e c e s s a r y to p r o v i d e for a t i m e c o n s t a n t s h o r t e r than the pu lse dura t ion which e n t a i l s an i n c r e a s e d band width in the. r e c e i v e r and the consequen t i n c r e a s e in background noise l eve l . At the s a m e t i m e , the s ignal we wi sh to obse rve is only a f rac t ion of the full ampl i tude . F o r both t he se r e a s o n s we have to coun tenance a d e c r e a s e in the s i g n a l / n o i s e r a t i o .
The sugges t ion of obse rv ing is t h e r e f o r e exactly equivalent to shor tening the pulse d u r a t i o n . This would place the same burden on r e c e i v e r band width and would s i m i l a r l y weaken the s ignal i n t e n sity; it a l s o would increase the number of independent s ignals in the same way. One advantage of the shor t t i m e - c o n s t a n t r e c e i v e r , which i s not s h a r e d by the shor tened pulse , is tha t the f o r m e r could be made v a r i a b l e with r a n g e . In t h i s way the e x c e s s power a t s h o r t r a n g e could be u t i l i zed to p rov ide i n c r e a s e d p r e c i s i o n .
Let us now look more closely at the a p p e a r a n c e of the r a d a r s ignals on the d i s p l a y s . The one kind of d i sp lay in common u s e , which we have a l r e a d y r e f e r r e d t o , i s the d i s p l a c e m e n t p r e s e n t a t i o n o r A-scope . In F ig . 108, on the left, we a r e showing the probabi l i ty dis t r ibut ions of the s ignal for a d i s play of A 2 , A, and log A 2 . In the c e n t r a l co lumn have been plotted r e p r e s e n t a t i v e A- scope t r a c e s of
FIG. 118. Moving along beam through range in te rva l h / 2 ,
the half-pulse length, or scanning through , the beam width, leads to an independent s ignal value.
FIG. 117. —TRACES FOR TWO TYPICAL H A L F -PULSE LENGTHS OF A, | dA/d t | , , AND
Each function (with except ion of ) is plotted in units of i ts l o n g - t e r m mean. (These quant i t ies a r e all shown in the vector d iagram of Fig. 115. )
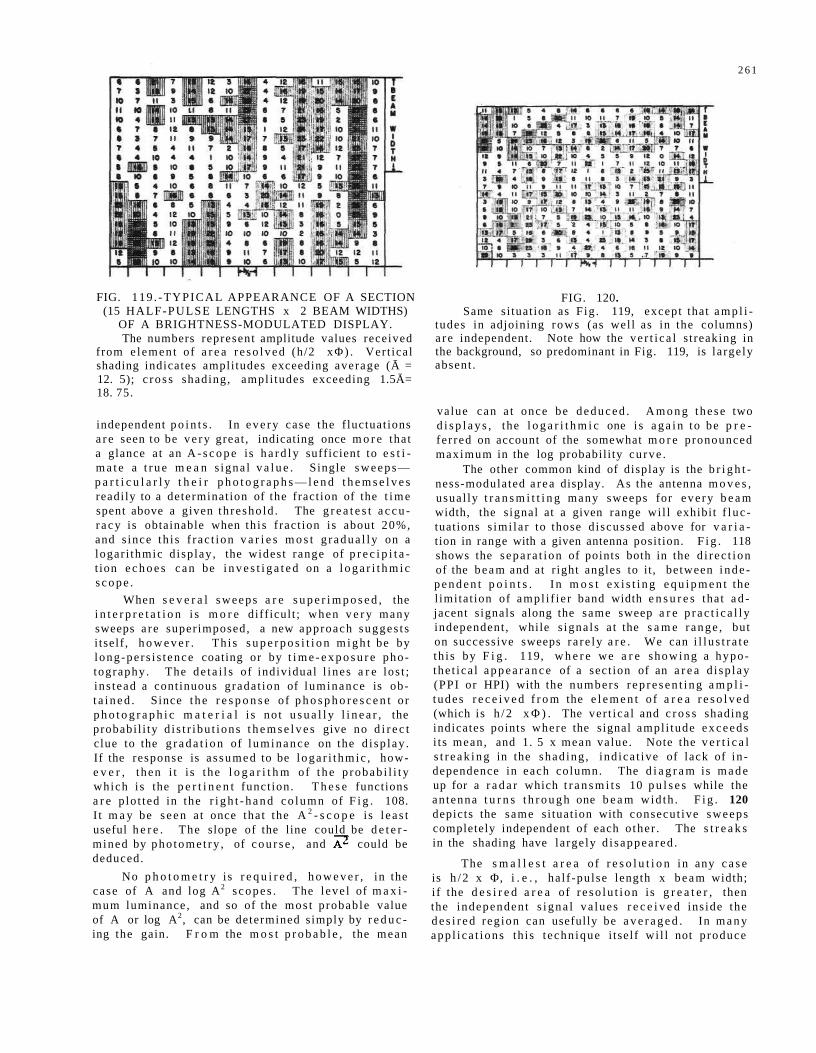
2 6 1
FIG. 119 . -TYPICAL APPEARANCE OF A SECTION (15 HALF-PULSE LENGTHS x 2 BEAM WIDTHS)
OF A BRIGHTNESS-MODULATED DISPLAY. The numbers represent amplitude values received
from e lemen t of a r e a r e s o l v e d (h/2 x Φ ) . Ver t ical shading indicates ampli tudes exceeding average (Ā = 12. 5); c ro s s shading, ampl i tudes exceeding 1.5Ā= 18. 75.
independent p o i n t s . In e v e r y case the f luctuat ions a r e seen to be v e r y great , indicating once m o r e that a glance at an A - s c o p e is h a r d l y sufficient to e s t i m a t e a t r u e m e a n s igna l v a l u e . Single s w e e p s — p a r t i c u l a r l y t h e i r p h o t o g r a p h s — l e n d t h e m s e l v e s readily to a determinat ion of the fraction of the t i m e spent above a given th resho ld . The g r e a t e s t a c c u r acy is obtainable when th is f ract ion is about 20%, and s ince th i s f r ac t ion v a r i e s m o s t g r adua l ly on a logar i thmic d isp lay , the widest range of p r e c i p i t a t ion e c h o e s c a n be i n v e s t i g a t e d on a l o g a r i t h m i c s c o p e .
When s e v e r a l sweeps a r e s u p e r i m p o s e d , the i n t e r p r e t a t i o n i s m o r e diff icul t ; when v e r y many sweeps a re super imposed, a new approach sugges t s i tself , h o w e v e r . Th i s s u p e r p o s i t i o n m i g h t be by long-pe r s i s t ence coating or by t i m e - e x p o s u r e photography. The de t a i l s of individual l ines a r e los t ; ins tead a cont inuous gradat ion of luminance is obt a i n e d . Since t h e r e s p o n s e of p h o s p h o r e s c e n t or p h o t o g r a p h i c m a t e r i a l i s no t u s u a l l y l i n e a r , the probabi l i ty d i s t r ibu t ions t h e m s e l v e s give no d i r e c t c lue to the g r a d a t i o n of l uminance on the d i sp lay . If the response is a s sumed to be l oga r i t hmic , howe v e r , t hen i t i s t he l o g a r i t h m of t h e p robab i l i t y which i s the p e r t i n e n t funct ion. T h e s e functions a r e p lo t ted in the r i g h t - h a n d co lumn of F i g . 108. I t m a y be s e e n a t once that the A 2 - s c o p e i s l e a s t useful h e r e . The slope of the line could be d e t e r mined by pho tome t ry , of c o u r s e , and could be deduced.
No p h o t o m e t r y i s r e q u i r e d , h o w e v e r , in the case of A and log A2 s c o p e s . The l eve l of m a x i mum luminance, and so of the mos t probable value of A or log A2, can be determined s imply by r e d u c ing the gain. F r o m the m o s t p r o b a b l e , the mean
FIG. 120. Same si tuat ion as F ig . 119, except that a m p l i
tudes in adjoining rows (as wel l as in the columns) a r e independent. Note how the ve r t i c a l s t reaking in the background, so predominant in Fig. 119, is la rge ly absent .
va lue can a t once be d e d u c e d . A m o n g these two d i s p l a y s , the l o g a r i t h m i c one i s a g a i n to be p r e fe r red on account of the somewhat m o r e pronounced maximum in the log probabil i ty cu rve .
The other common kind of display is the b r i g h t ness-modulated a r ea display. As the antenna m o v e s , usual ly t r a n s m i t t i n g many sweeps for eve ry b e a m width, the s ignal at a given range wil l exhibit f l uc tuations s imi la r to those d iscussed above for v a r i a tion in range with a given antenna posit ion. F i g . 118 shows the sepa ra t ion of points both in the d i r ec t ion of the b e a m and at r ight angles to it , between i n d e p e n d e n t p o i n t s . I n m o s t e x i s t i n g e q u i p m e n t the l imitat ion of ampl i f i e r band width e n s u r e s that a d jacent s ignals along the same sweep a r e p r a c t i c a l l y independent , while s igna ls a t the s a m e r ange , but on successive sweeps r a re ly a r e . We can i l l u s t r a t e th i s by F i g . 119, w h e r e we a r e showing a hypothe t i ca l a p p e a r a n c e of a sect ion of an a r e a d i sp lay (PPI or HPI) with the numbers r e p r e s e n t i n g a m p l i tudes r e c e i v e d f r o m the e l e m e n t o f a r e a r e s o l v e d (which is h / 2 x Φ ) . The ver t ica l and c r o s s shading indicates points where the signal ampl i tude exceeds i t s mean, and 1. 5 x mean value. Note the v e r t i c a l s t r e a k i n g in the shad ing , ind ica t ive of lack of in dependence in each column. The d i a g r a m is m a d e up for a r a d a r which t r a n s m i t s 10 p u l s e s while the an tenna t u r n s t h r o u g h one b e a m wid th . F i g . 120 depicts the same si tuat ion with consecut ive sweeps completely independent of each o ther . The s t r e a k s in the shading have la rgely d i sappea red .
The s m a l l e s t a r e a o f r e s o l u t i o n in any c a s e is h / 2 x Φ, i . e . , ha l f -pulse length x b e a m width; i f the d e s i r e d a r e a of r e s o l u t i o n is g r e a t e r , then the independen t s i g n a l va lues r e c e i v e d ins ide the d e s i r e d reg ion can usefully be a v e r a g e d . In m a n y app l i ca t ions th is t echn ique i tself wi l l not p roduce
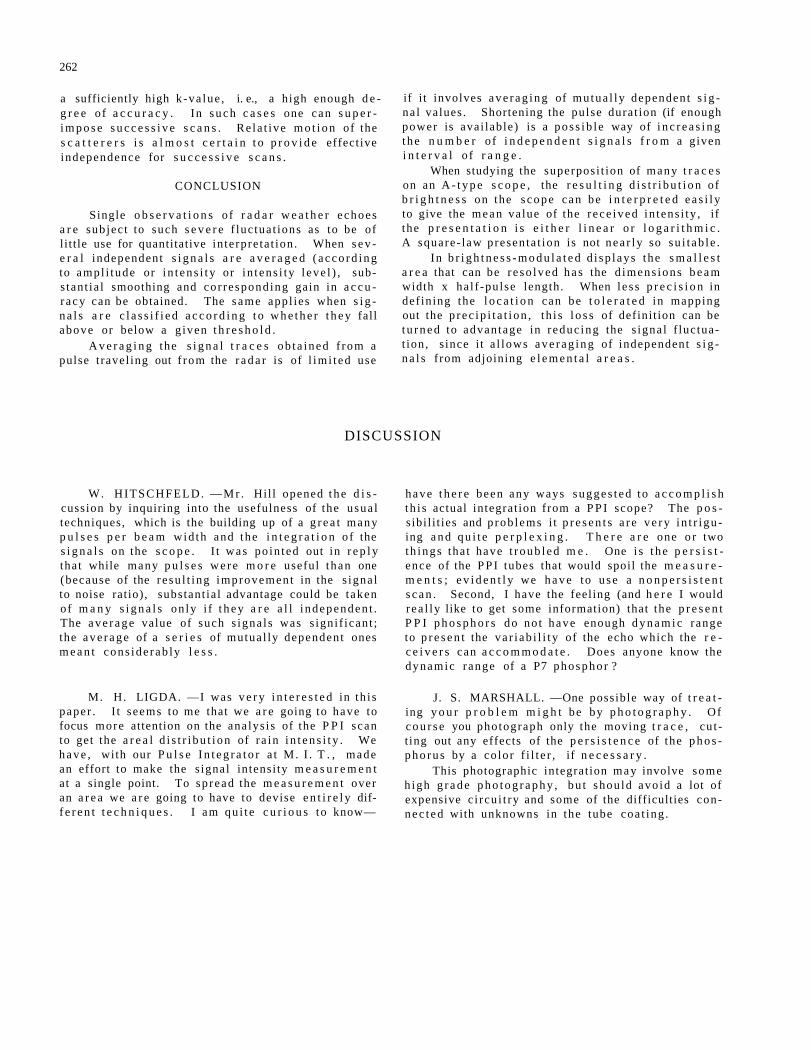
262
a sufficiently high k -va lue , i. e., a high enough d e g r e e of a c c u r a c y . In s u c h c a s e s one can s u p e r i m p o s e s u c c e s s i v e s c a n s . Re la t ive m o t i o n of the s c a t t e r e r s i s a l m o s t c e r t a i n t o p r o v i d e effective independence for s u c c e s s i v e s c a n s .
CONCLUSION
Single o b s e r v a t i o n s of r a d a r w e a t h e r echoes a r e subjec t to such s e v e r e f luc tua t ions as to be of li t t le use for quantitative in terpre ta t ion . When s e v e r a l independent s i g n a l s a r e a v e r a g e d ( a c c o r d i n g to ampl i tude or i n t ens i t y or in t ens i ty l eve l ) , sub-s tant ia l smoothing and cor responding gain in a c c u r acy can be obtained. The same appl ies when s i g n a l s a r e c l a s s i f i e d a c c o r d i n g t o w h e t h e r t h e y fall above or below a g iven t h r e s h o l d .
A v e r a g i n g the s i g n a l t r a c e s ob t a ined f rom a pulse t ravel ing out f rom the r a d a r is of l imi t ed use
W. HITSCHFELD. — M r . Hil l opened t h e d i s cussion by inquiring into the usefulness of the usua l techniques, which is the building up of a g r e a t many p u l s e s p e r b e a m wid th and the i n t e g r a t i o n o f the s i g n a l s on the s c o p e . I t was po in ted out in r e p l y that while many p u l s e s w e r e m o r e useful than one (because of the r e su l t ing improvement in the s igna l to noise ratio), substant ia l advantage could be taken of m a n y s i g n a l s on ly i f t h e y a r e a l l i ndependen t . The a v e r a g e value of such s igna l s was s igni f icant ; the a v e r a g e of a s e r i e s of mutua l ly dependent ones m e a n t cons ide rab ly l e s s .
M. H. LIGDA. —I was v e r y i n t e r e s t e d in th i s paper . I t seems to me that we a r e going to have to focus more attention on the analys is of the P P I scan to get the a r e a l d i s t r i bu t i on of r a in i n t e n s i t y . We h a v e , with our P u l s e I n t e g r a t o r a t M. I . T . , made an effort to make the s ignal intensi ty m e a s u r e m e n t at a single point. To sp read the m e a s u r e m e n t over an a r e a we a r e going to have to devise e n t i r e l y diff e r e n t t e c h n i q u e s . I am qu i t e c u r i o u s to know—
if it involves a v e r a g i n g of mutua l ly dependent s i g na l values . Shortening the pulse durat ion (if enough power is avai lable) is a pos s ib l e way of i n c r e a s i n g t h e n u m b e r of i n d e p e n d e n t s i g n a l s f r o m a given i n t e r v a l o f r a n g e .
When studying the superposi t ion of many t r a c e s on an A - t y p e s c o p e , the r e s u l t i n g d i s t r i b u t i o n of b r i g h t n e s s on the s c o p e can be i n t e r p r e t e d e a s i l y to give the m e a n value of the r ece ived in tens i ty , if the p r e s e n t a t i o n i s e i t h e r l i n e a r o r l o g a r i t h m i c . A square- law presenta t ion is not nea r ly so su i t ab le .
In b r i g h t n e s s - m o d u l a t e d d i sp lays the s m a l l e s t a r e a that can be r e so lved h a s the d imens ions b e a m width x ha l f -pulse length. When l e s s p r e c i s i o n in def ining the l o c a t i o n can be t o l e r a t e d in mapping out the p r ec ip i t a t i on , t h i s l o s s of defini t ion can be t u r n e d to advantage in r educ ing the s igna l f luctuat ion, s ince i t a l lows a v e r a g i n g of independent s i g n a l s f rom adjoining e l e m e n t a l a r e a s .
have t h e r e been any ways sugges t ed to a c c o m p l i s h th i s actual integrat ion from a P P I scope? The p o s sibi l i t ies and p rob lems i t p r e s e n t s a r e v e r y i n t r i gu ing a n d q u i t e p e r p l e x i n g . T h e r e a r e one o r two th ings tha t have t r o u b l e d m e . One i s t h e p e r s i s t ence of the P P I tubes that would spoil the m e a s u r e m e n t s ; e v i d e n t l y we h a v e to u s e a n o n p e r s i s t e n t s c a n . Second, I have the feeling (and h e r e I would r ea l ly like to get some information) that the p r e s e n t P P I p h o s p h o r s do no t have enough d y n a m i c range to p r e s e n t the va r i ab i l i t y of the echo which the r e c e i v e r s can a c c o m m o d a t e . Does anyone know the dynamic range of a P7 phospho r ?
J. S. MARSHALL. —One possible way of t r e a t ing y o u r p r o b l e m m i g h t be by p h o t o g r a p h y . Of c o u r s e you photograph only the moving t r a c e , cu t t ing out any effects of the p e r s i s t e n c e of the p h o s p h o r u s by a co lor f i l t e r , if n e c e s s a r y .
This photographic integrat ion may involve some h igh g r a d e p h o t o g r a p h y , bu t shou ld avo id a lot of expensive c i rcu i t ry and some of the difficulties conn e c t e d with unknowns in the tube coa t ing .
DISCUSSION
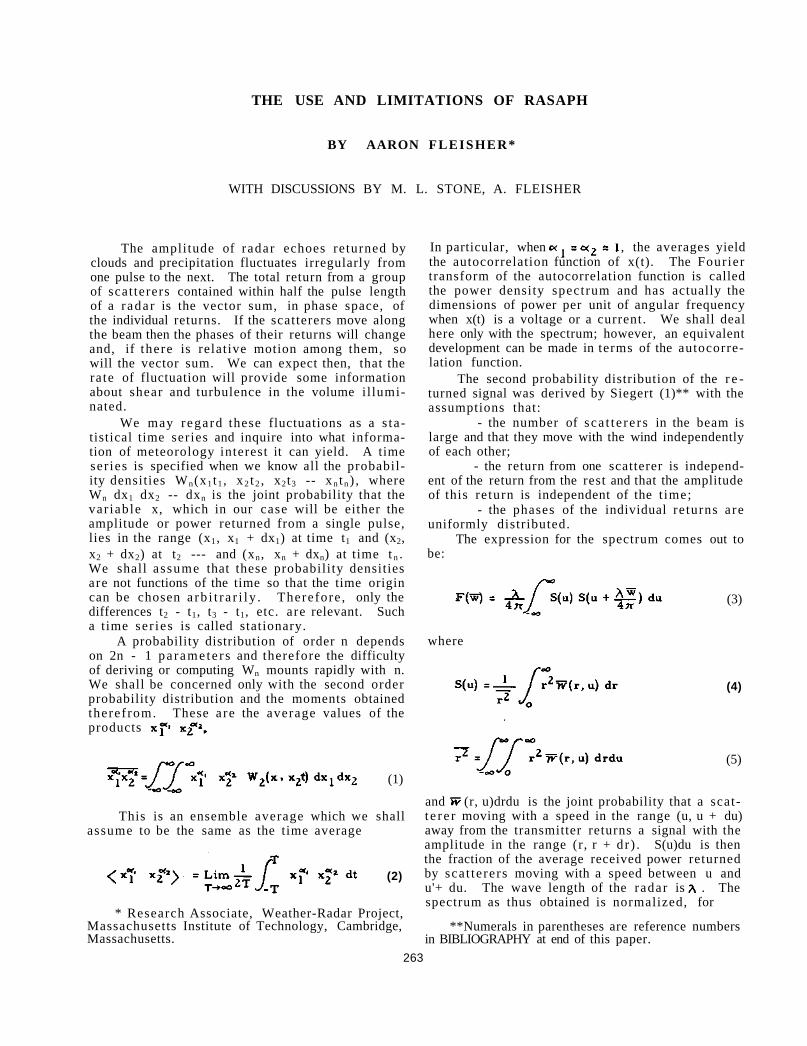
THE USE AND LIMITATIONS OF RASAPH
BY AARON FLEISHER*
WITH DISCUSSIONS BY M. L. STONE, A. FLEISHER
The amplitude of radar echoes returned by clouds and precipitation fluctuates irregularly from one pulse to the next. The total return from a group of scat terers contained within half the pulse length of a r adar is the vector sum, in phase space, of the individual returns. If the scatterers move along the beam then the phases of their returns will change and, if there is relative motion among them, so will the vector sum. We can expect then, that the ra te of fluctuation will provide some information about shear and turbulence in the volume il luminated.
We may regard these fluctuations as a s tatistical time series and inquire into what information of meteorology interest it can yield. A time ser ies is specified when we know all the probability densities Wn(x1 t1 , x 2 t 2 , x2t3 -- x n t n ) , where Wn dx1 dx2 -- dxn is the joint probability that the var iable x, which in our case will be either the amplitude or power returned from a single pulse, lies in the range (x1, x1 + dx1) at time t1 and (x2, x2 + dx2) at t2 --- and (xn , xn + dxn) at time t n . We shall assume that these probability densities are not functions of the time so that the time origin can be chosen a rb i t r a r i l y . Therefore , only the differences t2 - t1, t3 - t1, etc. are relevant. Such a time ser ies is called stationary.
A probability distribution of order n depends on 2n - 1 pa ramete r s and therefore the difficulty of deriving or computing Wn mounts rapidly with n. We shall be concerned only with the second order probability distribution and the moments obtained therefrom. These are the average values of the products
(1)
This is an ensemble average which we shall assume to be the same as the time average
(2)
* Research Associate, Weather-Radar Project, Massachusetts Institute of Technology, Cambridge, Massachusetts.
In particular, when , the averages yield the autocorrelation function of x(t). The Fourier transform of the autocorrelation function is called the power density spectrum and has actually the dimensions of power per unit of angular frequency when x(t) is a voltage or a current. We shall deal here only with the spectrum; however, an equivalent development can be made in terms of the autocorrelation function.
The second probability distribution of the r e turned signal was derived by Siegert (1)** with the assumptions that:
- the number of sca t t e re r s in the beam is large and that they move with the wind independently of each other;
- the return from one scatterer is independent of the return from the rest and that the amplitude of this return is independent of the t ime;
- the phases of the individual returns are uniformly distributed.
The expression for the spectrum comes out to be:
(3)
where
(4)
(5)
and (r, u)drdu is the joint probability that a scatt e r e r moving with a speed in the range (u, u + du) away from the transmitter returns a signal with the amplitude in the range (r, r + dr ) . S(u)du is then the fraction of the average received power returned by sca t terers moving with a speed between u and u'+ du. The wave length of the radar is . The spectrum as thus obtained is normalized, for
**Numerals in parentheses are reference numbers in BIBLIOGRAPHY at end of this paper.
263
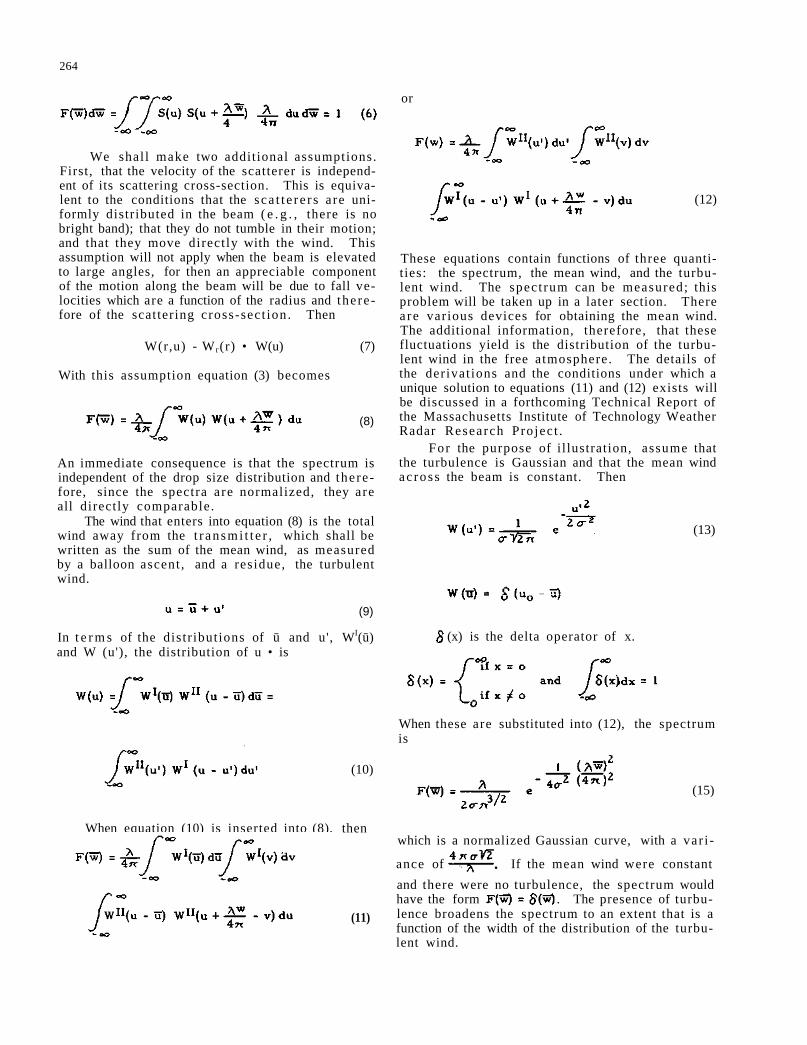
264
We shall make two additional assumptions. First, that the velocity of the scatterer is independent of its scattering cross-section. This is equivalent to the conditions that the sca t t e r e r s are uniformly distributed in the beam ( e . g . , there is no bright band); that they do not tumble in their motion; and that they move directly with the wind. This assumption will not apply when the beam is elevated to large angles, for then an appreciable component of the motion along the beam will be due to fall velocities which are a function of the radius and there fore of the scattering cross-sect ion. Then
W(r,u) - W r(r) • W(u) (7)
With this assumption equation (3) becomes
(8)
An immediate consequence is that the spectrum is independent of the drop size distribution and there fore, since the spectra are normalized, they are all directly comparable.
The wind that enters into equation (8) is the total wind away from the t r ansmi t t e r , which shall be written as the sum of the mean wind, as measured by a balloon ascent , and a residue, the turbulent wind.
(9)
In t e r m s of the distr ibutions of ū and u', WI(ū) and W (u'), the distribution of u • is
(10)
When equation (10) is inserted into (8), then
(11)
or
(12)
These equations contain functions of three quantities: the spectrum, the mean wind, and the turbulent wind. The spect rum can be measured; this problem will be taken up in a later section. There a re various devices for obtaining the mean wind. The additional information, therefore, that these fluctuations yield is the distribution of the turbulent wind in the free atmosphere. The details of the derivat ions and the conditions under which a unique solution to equations (11) and (12) exists will be discussed in a forthcoming Technical Report of the Massachusetts Institute of Technology Weather Radar Research Projec t .
For the purpose of i l lustration, assume that the turbulence is Gaussian and that the mean wind ac ross the beam is constant. Then
(13)
(x) is the delta operator of x.
When these are substituted into (12), the spectrum is
(15)
which is a normalized Gaussian curve, with a var i
ance of If the mean wind were constant and there were no turbulence, the spectrum would have the form . The presence of turbulence broadens the spectrum to an extent that is a function of the width of the distribution of the turbulent wind.
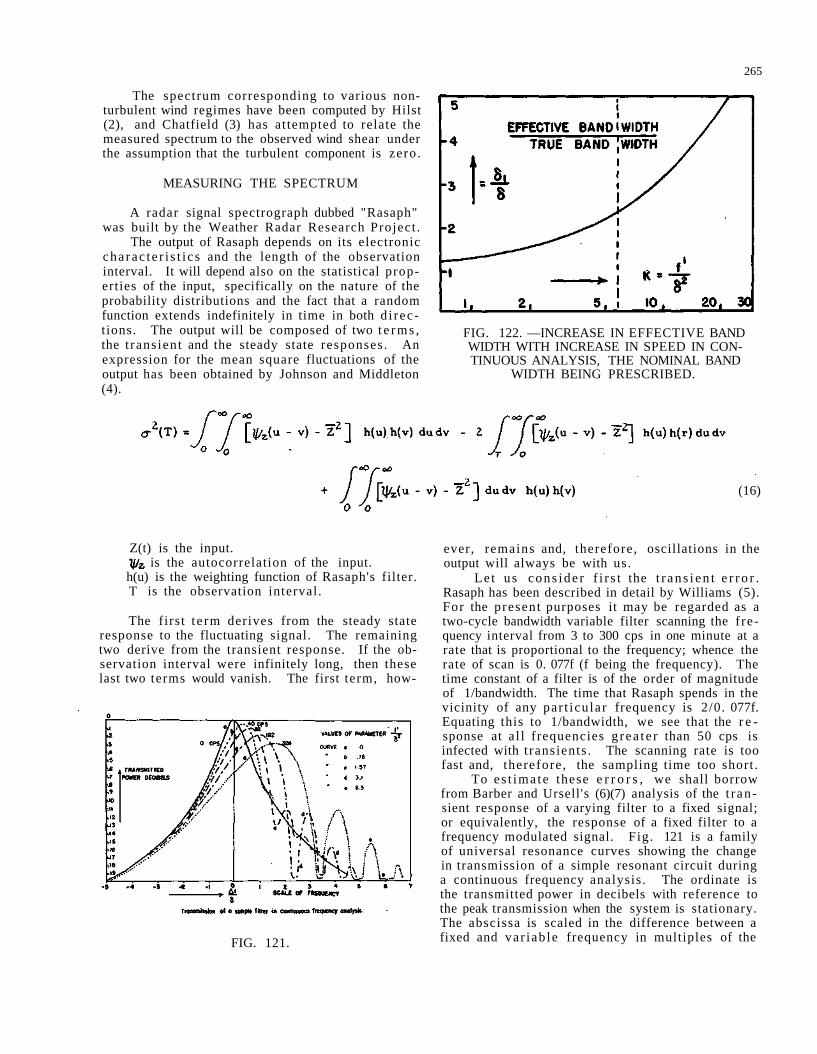
265
The spectrum corresponding to various non-turbulent wind regimes have been computed by Hilst (2), and Chatfield (3) has attempted to relate the measured spectrum to the observed wind shear under the assumption that the turbulent component is zero .
MEASURING THE SPECTRUM
A radar signal spectrograph dubbed "Rasaph" was built by the Weather Radar Research Project .
The output of Rasaph depends on its electronic cha rac te r i s t i c s and the length of the observation interval. It will depend also on the statistical properties of the input, specifically on the nature of the probability distributions and the fact that a random function extends indefinitely in time in both d i rec tions. The output will be composed of two t e r m s , the t rans ient and the steady state responses. An expression for the mean square fluctuations of the output has been obtained by Johnson and Middleton (4).
FIG. 122. —INCREASE IN EFFECTIVE BAND WIDTH WITH INCREASE IN SPEED IN CONTINUOUS ANALYSIS, THE NOMINAL BAND
WIDTH BEING PRESCRIBED.
(16)
Z(t) is the input. is the autocorrelation of the input.
h(u) is the weighting function of Rasaph's filter. T is the observation interval.
The first t e rm derives from the steady state response to the fluctuating signal. The remaining two derive from the transient response. If the observation interval were infinitely long, then these last two terms would vanish. The first term, how-
FIG. 121.
ever, remains and, therefore, oscillations in the output will always be with us.
Le t us cons ide r f i r s t the t r a n s i e n t e r r o r . Rasaph has been described in detail by Williams (5). For the present purposes it may be regarded as a two-cycle bandwidth variable filter scanning the f requency interval from 3 to 300 cps in one minute at a rate that is proportional to the frequency; whence the rate of scan is 0. 077f (f being the frequency). The time constant of a filter is of the order of magnitude of 1/bandwidth. The time that Rasaph spends in the vicinity of any par t icu lar frequency is 2/0. 077f. Equating this to 1/bandwidth, we see that the r e sponse at a l l frequencies g rea t e r than 50 cps is infected with t ransients . The scanning rate is too fast and, therefore, the sampling time too short .
To es t ima te these e r r o r s , we shall borrow from Barber and Ursell's (6)(7) analysis of the t r an sient response of a varying filter to a fixed signal; or equivalently, the response of a fixed filter to a frequency modulated signal. Fig. 121 is a family of universal resonance curves showing the change in transmission of a simple resonant circuit during a continuous frequency analysis . The ordinate is the transmitted power in decibels with reference to the peak transmission when the system is stationary. The abscissa is scaled in the difference between a fixed and var iab le frequency in multiples of the
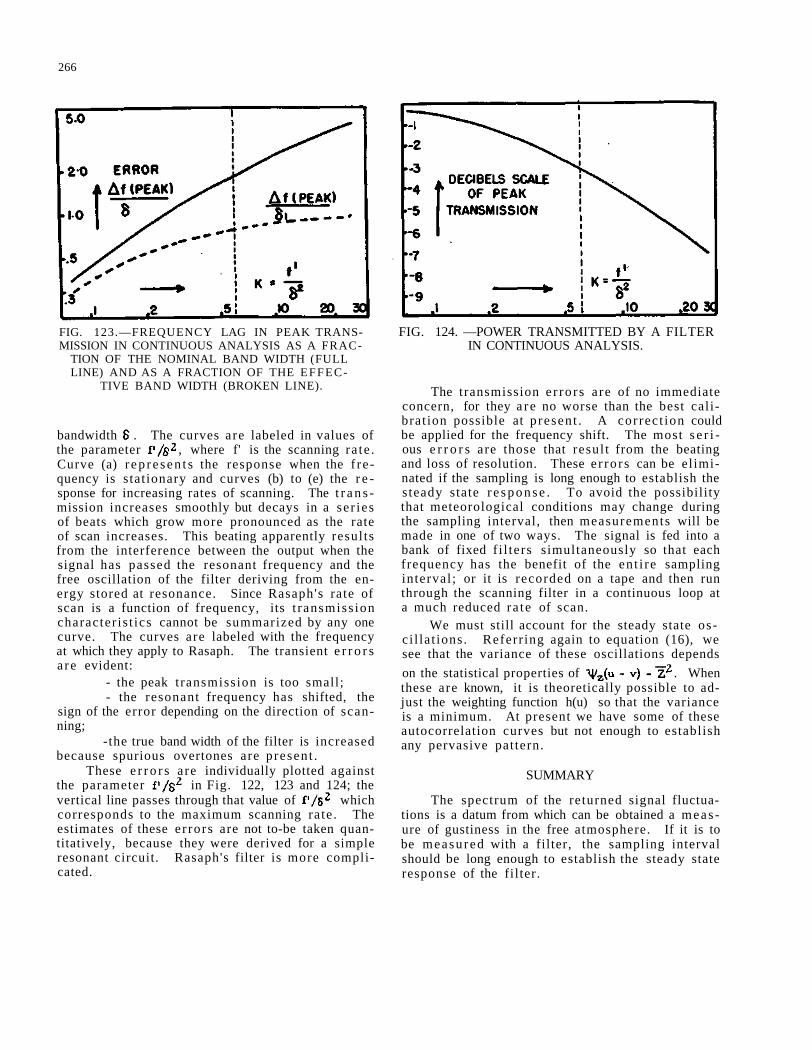
266
FIG. 123.—FREQUENCY LAG IN PEAK TRANSMISSION IN CONTINUOUS ANALYSIS AS A FRAC
TION OF THE NOMINAL BAND WIDTH (FULL LINE) AND AS A FRACTION OF THE EFFEC
TIVE BAND WIDTH (BROKEN LINE).
bandwidth . The curves are labeled in values of the parameter , where f' is the scanning ra te . Curve (a) r ep re sen t s the response when the f re quency is stat ionary and curves (b) to (e) the r e sponse for increasing rates of scanning. The t r a n s mission increases smoothly but decays in a se r ies of beats which grow more pronounced as the rate of scan increases. This beating apparently resul ts from the interference between the output when the signal has passed the resonant frequency and the free oscillation of the filter deriving from the energy stored at resonance. Since Rasaph's rate of scan is a function of frequency, its t ransmiss ion character is t ics cannot be summarized by any one curve. The curves are labeled with the frequency at which they apply to Rasaph. The transient e r r o r s a re evident:
- the peak t ransmission is too small; - the resonant frequency has shifted, the
sign of the error depending on the direction of scanning;
-the true band width of the filter is increased because spurious overtones are present .
These e r r o r s are individually plotted against the parameter in Fig. 122, 123 and 124; the vertical line passes through that value of which corresponds to the maximum scanning rate . The estimates of these e r rors are not to-be taken quantitatively, because they were derived for a simple resonant circuit. Rasaph's filter is more complicated.
FIG. 124. —POWER TRANSMITTED BY A FILTER IN CONTINUOUS ANALYSIS.
The transmission e r ro r s are of no immediate concern, for they a r e no worse than the best calibrat ion possible at p resen t . A correc t ion could be applied for the frequency shift. The most s e r i ous e r r o r s are those that resul t from the beating and loss of resolution. These e r ro r s can be el iminated if the sampling is long enough to establish the steady state r e s p o n s e . To avoid the possibility that meteorological conditions may change during the sampling interval, then measurements will be made in one of two ways. The signal is fed into a bank of fixed f i l ters simultaneously so that each frequency has the benefit of the en t i re sampling interval ; or it is recorded on a tape and then run through the scanning filter in a continuous loop at a much reduced ra te of scan.
We must still account for the steady state osci l la t ions. Referr ing again to equation (16), we see that the variance of these oscillations depends on the statistical properties of . When these are known, it is theoretically possible to adjust the weighting function h(u) so that the variance is a minimum. At present we have some of these autocorrelation curves but not enough to establish any pervasive pattern.
SUMMARY
The spectrum of the returned signal fluctuations is a datum from which can be obtained a meas ure of gustiness in the free atmosphere. If it is to be measured with a filter, the sampling interval should be long enough to establish the steady state response of the filter.
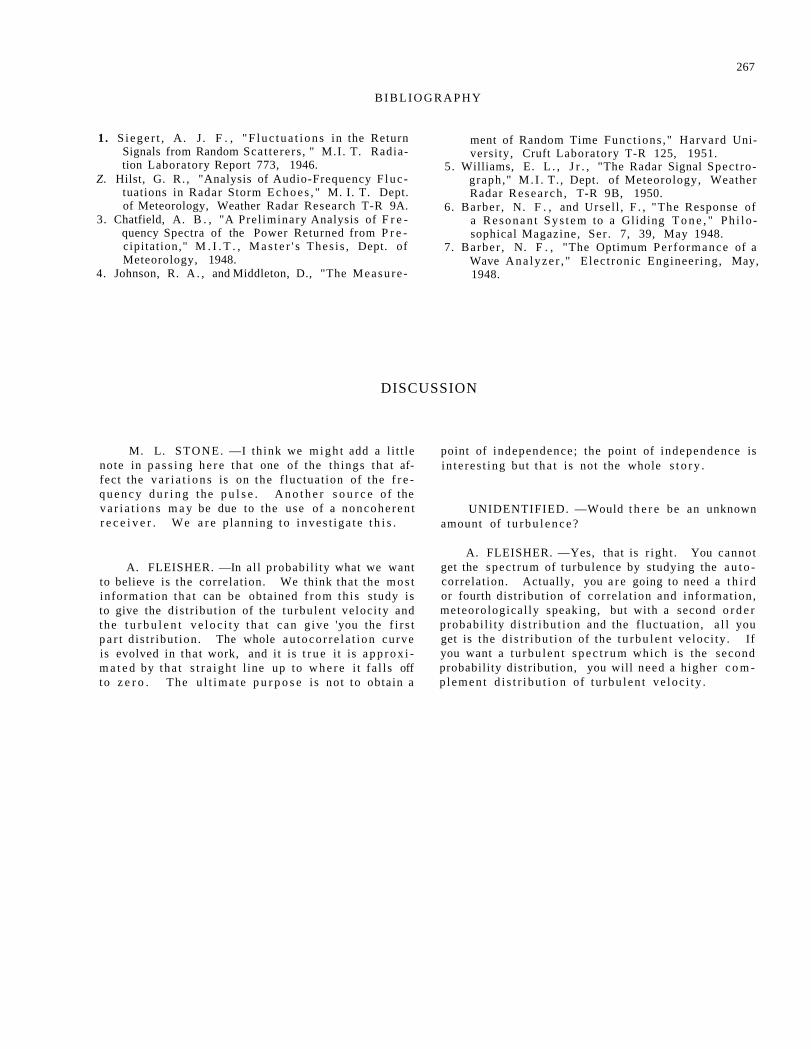
B I B L I O G R A P H Y
267
1. S i ege r t , A. J . F . , " F l u c t u a t i o n s in the Return Signals from Random Scat terers , " M.I . T. Radiation Laboratory Report 773, 1946.
Z. Hilst, G. R. , "Analysis of Audio-Frequency F luc tuations in Radar Storm E c h o e s , " M. I. T. Dept. of Meteorology, Weather Radar Research T-R 9A.
3. Chatfield, A. B . , "A Prel iminary Analysis of F r e quency Spectra of the Power Returned from P r e cipitation," M . I . T . , M a s t e r ' s Thes i s , Dept. of Meteorology, 1948.
4. Johnson, R. A . , and Middleton, D., "The Measu re
ment of Random Time Funct ions ," Harvard Universi ty, Cruft Laboratory T-R 125, 1951.
5. Williams, E. L . , J r . , "The Radar Signal Spect rograph," M. I . T. , Dept. of Meteorology, Weather Radar Resea rch , T-R 9B, 1950.
6. Barber , N. F . , and Ursel l , F . , "The Response of a Resonan t S y s t e m to a Gliding T o n e , " Ph i lo sophical Magazine, Ser . 7, 39, May 1948.
7. Barber , N. F . , "The Optimum Per fo rmance of a Wave A n a l y z e r , " Elec t ronic Engineer ing, May, 1948.
DISCUSSION
M. L. STONE. —I th ink we m i g h t add a l i t t le note in p a s s i n g h e r e that one of the th ings tha t affect the v a r i a t i o n s is on the f luctuat ion of the f r e q u e n c y d u r i n g the p u l s e . A n o t h e r s o u r c e of the v a r i a t i o n s m a y be due to the use of a noncohe ren t r e c e i v e r . We a r e planning t o i nves t i ga t e t h i s .
A. FLEISHER. —In all probabil i ty what we want to believe is the correlation. We think that the m o s t information tha t can be obtained f rom th i s s tudy is to give the dis t r ibut ion of the turbulen t veloci ty and the t u r b u l e n t v e l o c i t y t ha t c a n g ive 'you the f i r s t p a r t d is t r ibut ion. The whole au toco r re l a t i on curve is evolved in that work, and it is t r u e i t is a p p r o x i m a t e d by tha t s t r a i gh t l ine up to w h e r e i t fa l l s off to z e r o . The u l t i m a t e p u r p o s e i s not to obtain a
point of independence; the point of independence is in te res t ing but tha t is not the whole s t o r y .
UNIDENTIFIED. —Would t h e r e be an unknown amount of t u r b u l e n c e ?
A. FLEISHER. —Yes, that is r ight . You cannot get the spec t rum of turbulence by studying the a u t o correlat ion. Actually, you a r e going to need a t h i r d or fourth distr ibution of correla t ion and informat ion, meteorological ly speaking, but with a second o r d e r probabi l i ty d i s t r ibu t ion and the f luctuat ion, a l l you get is the d i s t r ibu t ion of the t u rbu l en t ve loci ty . If you want a tu rbu len t s p e c t r u m which is the second probability distribution, you will need a higher c o m p lemen t d i s t r i b u t i o n of t u rbu len t ve loc i ty .
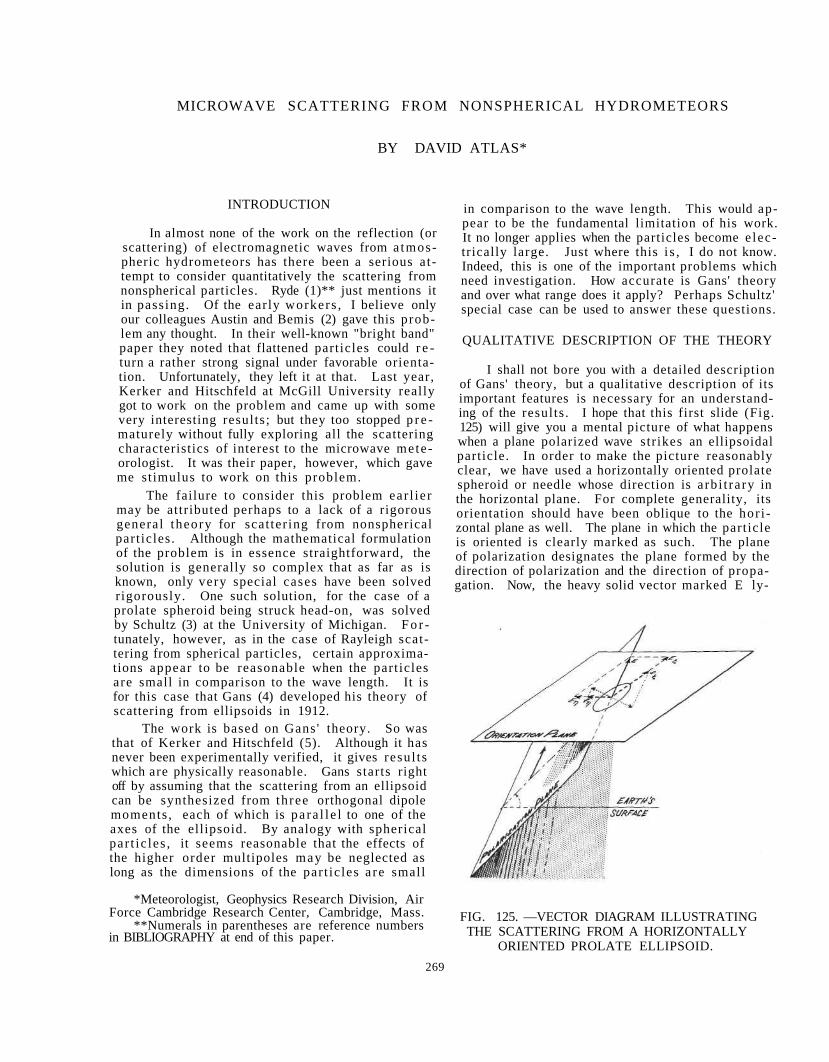
MICROWAVE SCATTERING FROM NONSPHERICAL HYDROMETEORS
BY DAVID ATLAS*
INTRODUCTION
In almost none of the work on the reflection (or scattering) of electromagnetic waves from a tmospheric hydrometeors has there been a serious at tempt to consider quantitatively the scattering from nonspherical particles. Ryde (1)** just mentions it in passing. Of the early workers , I believe only our colleagues Austin and Bemis (2) gave this problem any thought. In their well-known "bright band" paper they noted that flattened particles could r e turn a rather strong signal under favorable orientation. Unfortunately, they left it at that. Last year, Kerker and Hitschfeld at McGill University really got to work on the problem and came up with some very interesting results; but they too stopped p r e maturely without fully exploring all the scattering characteristics of interest to the microwave mete orologist. It was their paper, however, which gave me stimulus to work on this problem.
The failure to consider this problem ear l ie r may be attributed perhaps to a lack of a rigorous general theory for scat ter ing from nonspherical part icles. Although the mathematical formulation of the problem is in essence straightforward, the solution is generally so complex that as far as is known, only very special cases have been solved rigorously. One such solution, for the case of a prolate spheroid being struck head-on, was solved by Schultz (3) at the University of Michigan. F o r tunately, however, as in the case of Rayleigh scattering from spherical particles, certain approximations appear to be reasonable when the part icles are small in comparison to the wave length. It is for this case that Gans (4) developed his theory of scattering from ellipsoids in 1912.
The work is based on Gans ' theory. So was that of Kerker and Hitschfeld (5). Although it has never been experimentally verified, it gives resul ts which are physically reasonable. Gans starts right off by assuming that the scattering from an ellipsoid can be synthesized from three orthogonal dipole moments , each of which is pa ra l l e l to one of the axes of the ellipsoid. By analogy with spherical par t ic les , it seems reasonable that the effects of the higher order multipoles may be neglected as long as the dimensions of the par t ic les a re small
*Meteorologist, Geophysics Research Division, Air Force Cambridge Research Center, Cambridge, Mass.
**Numerals in parentheses are reference numbers in BIBLIOGRAPHY at end of this paper.
in comparison to the wave length. This would appear to be the fundamental limitation of his work. It no longer applies when the particles become e lectrically large. Just where this i s , I do not know. Indeed, this is one of the important problems which need investigation. How accurate is Gans' theory and over what range does it apply? Perhaps Schultz' special case can be used to answer these questions.
QUALITATIVE DESCRIPTION OF THE THEORY
I shall not bore you with a detailed description of Gans' theory, but a qualitative description of its important features is necessary for an understanding of the results . I hope that this first slide (Fig. 125) will give you a mental picture of what happens when a plane polarized wave str ikes an ellipsoidal particle. In order to make the picture reasonably clear, we have used a horizontally oriented prolate spheroid or needle whose direction is a rb i t ra ry in the horizontal plane. For complete generality, its orientation should have been oblique to the hor i zontal plane as well. The plane in which the particle is oriented is clearly marked as such. The plane of polarization designates the plane formed by the direction of polarization and the direction of propagation. Now, the heavy solid vector marked E ly-
FIG. 125. —VECTOR DIAGRAM ILLUSTRATING THE SCATTERING FROM A HORIZONTALLY
ORIENTED PROLATE ELLIPSOID. 269
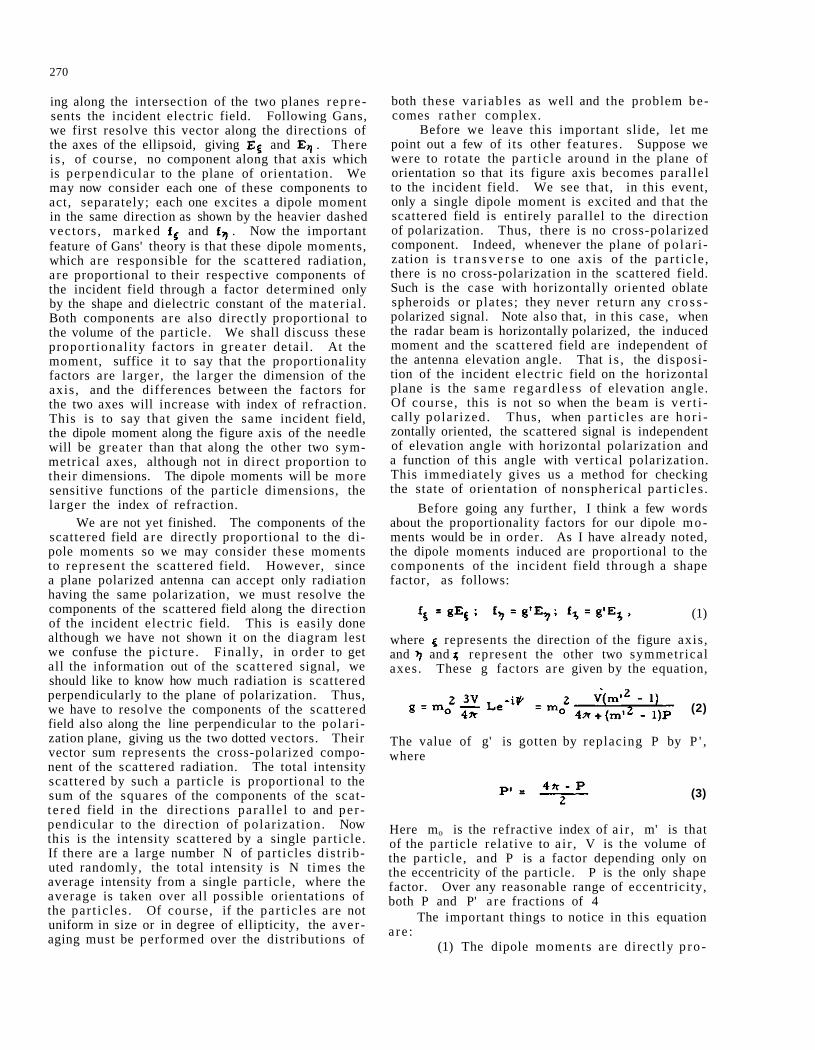
270
ing along the intersection of the two planes r ep re sents the incident electric field. Following Gans, we first resolve this vector along the directions of the axes of the ellipsoid, giving and . There i s , of course, no component along that axis which is perpendicular to the plane of orientation. We may now consider each one of these components to act, separately; each one excites a dipole moment in the same direction as shown by the heavier dashed vec tors , marked and . Now the important feature of Gans' theory is that these dipole moments, which are responsible for the scattered radiation, a re proportional to their respective components of the incident field through a factor determined only by the shape and dielectric constant of the mater ial . Both components are also directly proportional to the volume of the particle. We shall discuss these proportionali ty factors in grea te r detail . At the moment, suffice it to say that the proportionality factors are larger, the larger the dimension of the axis , and the differences between the factors for the two axes will increase with index of refraction. This is to say that given the same incident field, the dipole moment along the figure axis of the needle will be greater than that along the other two symmetrical axes, although not in direct proportion to their dimensions. The dipole moments will be more sensitive functions of the particle dimensions, the larger the index of refraction.
We are not yet finished. The components of the scattered field a r e directly proportional to the dipole moments so we may consider these moments to represent the scattered field. However, since a plane polarized antenna can accept only radiation having the same polarization, we must resolve the components of the scattered field along the direction of the incident electr ic field. This is easily done although we have not shown it on the diagram lest we confuse the p ic ture . Finally, in order to get all the information out of the scattered signal, we should like to know how much radiation is scattered perpendicularly to the plane of polarization. Thus, we have to resolve the components of the scattered field also along the line perpendicular to the polarization plane, giving us the two dotted vectors. Their vector sum represents the cross-polarized component of the scattered radiation. The total intensity scattered by such a particle is proportional to the sum of the squares of the components of the scatt e red field in the directions para l le l to and per pendicular to the direction of polarizat ion. Now this is the intensity scattered by a single part icle. If there are a large number N of particles dis t r ibuted randomly, the total intensity is N t imes the average intensity from a single particle, where the average is taken over all possible orientations of the par t ic les . Of course, if the par t ic les are not uniform in size or in degree of ellipticity, the aver aging must be performed over the distributions of
both these var iables as well and the problem becomes ra ther complex.
Before we leave this important slide, let me point out a few of its other features . Suppose we were to rotate the par t ic le around in the plane of orientation so that its figure axis becomes paral le l to the incident field. We see that, in this event, only a single dipole moment is excited and that the scattered field is entirely parallel to the direction of polarization. Thus, there is no cross-polarized component. Indeed, whenever the plane of polar i zation is t r a n s v e r s e to one axis of the par t ic le , there is no cross-polarization in the scattered field. Such is the case with horizontally oriented oblate spheroids or plates; they never re turn any c r o s s -polarized signal. Note also that, in this case, when the radar beam is horizontally polarized, the induced moment and the scattered field are independent of the antenna elevation angle. That i s , the disposition of the incident electr ic field on the horizontal plane is the same r ega rd l e s s of elevation angle. Of course, this is not so when the beam is ve r t i cally polar ized. Thus, when par t ic les are hor i zontally oriented, the scattered signal is independent of elevation angle with horizontal polarization and a function of this angle with vertical polarization. This immediately gives us a method for checking the state of orientation of nonspherical par t ic les .
Before going any further, I think a few words about the proportionality factors for our dipole moments would be in order. As I have already noted, the dipole moments induced are proportional to the components of the incident field through a shape factor, as follows:
(1)
where represents the direction of the figure axis , and and represent the other two symmetrical axes. These g factors are given by the equation,
(2)
The value of g' is gotten by replacing P by P ' , where
(3)
Here mo is the refractive index of a i r , m' is that of the particle relative to a i r , V is the volume of the part icle , and P is a factor depending only on the eccentricity of the particle. P is the only shape factor. Over any reasonable range of eccentricity, both P and P' a re fractions of 4
The important things to notice in this equation a re :
(1) The dipole moments are directly p ro -
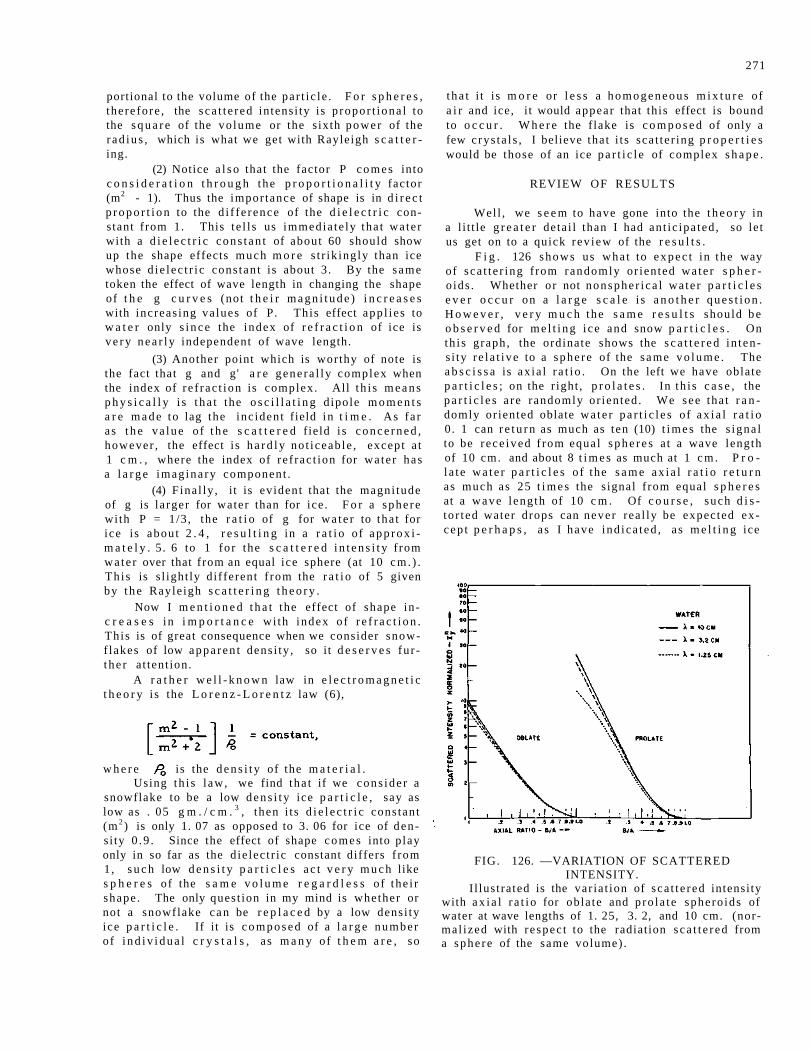
271
portional to the volume of the par t i c le . F o r s p h e r e s , there fore , the sca t t e r ed in tensi ty is p ropor t iona l to the s q u a r e of the vo lume or the s ixth power of the r ad iu s , which is what we get with Rayleigh s c a t t e r ing.
(2) Notice a l s o that the factor P c o m e s into c o n s i d e r a t i o n t h r o u g h the p r o p o r t i o n a l i t y factor (m2 - 1). Thus the impor tance of shape is in d i r e c t p r o p o r t i o n to the d i f f e rence of the d i e l e c t r i c constant f rom 1. This te l l s us immedia te ly tha t wa te r with a d i e l e c t r i c cons t an t of about 60 should show up the shape effects much m o r e s t r ik ingly than ice whose d ie l ec t r i c cons tan t is about 3 . By the same token the effect of wave length in changing the shape of t h e g c u r v e s (not t h e i r m a g n i t u d e ) i n c r e a s e s with increas ing va lues of P. This effect app l i e s to w a t e r only s i n c e the index of r e f r a c t i o n of ice is v e r y n e a r l y independent of wave length.
(3) Another point which is worthy of note is the fact that g and g' a r e gene ra l ly complex when the index of r e f rac t ion is complex. All t h i s m e a n s p h y s i c a l l y i s t ha t the o s c i l l a t i n g dipole m o m e n t s a r e m a d e to lag the inc ident field in t i m e . As fa r as t h e va lue of t h e s c a t t e r e d f ield i s c o n c e r n e d , however , the effect i s h a r d l y no t iceab le , except a t 1 c m . , where the index of re f rac t ion for wa te r has a l a r g e imag ina ry component .
(4) F ina l ly , it is evident that the magni tude of g is la rger for water than for ice . F o r a sphe re wi th P = 1/3, the r a t i o of g for w a t e r to tha t for ice is abou t 2 . 4 , r e s u l t i n g in a r a t i o of a p p r o x i m a t e l y . 5. 6 to 1 for the s c a t t e r e d i n t e n s i t y f rom wa te r over that f rom an equal ice sphere (at 10 cm. ) . Th i s is s l ight ly di f ferent f rom the r a t i o of 5 given by t h e Rayle igh s c a t t e r i n g t h e o r y .
Now I m e n t i o n e d t h a t the effect of shape inc r e a s e s in i m p o r t a n c e wi th index o f r e f r a c t i o n . This is of great consequence when we consider snow-f lakes of low appa ren t dens i ty , so it d e s e r v e s fu r t he r a t tent ion.
A r a t h e r w e l l - k n o w n law in e l e c t r o m a g n e t i c t h e o r y i s the L o r e n z - L o r e n t z law (6),
w h e r e is the d e n s i t y of the m a t e r i a l . Using th i s l aw, we find tha t if we cons ide r a
snowflake to be a low d e n s i t y ice p a r t i c l e , say as low as . 05 g m . / c m . 3 , then i t s d i e l e c t r i c cons tant (m 2 ) is only 1. 07 as opposed to 3. 06 for ice of den si ty 0 .9 . Since the effect of shape c o m e s into play only in so far as the d ie lec t r ic constant differs f rom 1 , s u c h low d e n s i t y p a r t i c l e s a c t v e r y m u c h like s p h e r e s of the s a m e v o l u m e r e g a r d l e s s of the i r shape . The only quest ion in my mind is whether or not a snowflake c a n be r e p l a c e d by a low densi ty ice p a r t i c l e . If it is c o m p o s e d of a l a r g e number of i n d i v i d u a l c r y s t a l s , as m a n y of t h e m a r e , so
t ha t i t is m o r e or l e s s a h o m o g e n e o u s m i x t u r e of a i r and ice, i t would appear that th is effect is bound to o c c u r . W h e r e the f lake is c o m p o s e d of only a few c rys ta l s , I believe that i t s sca t te r ing p r o p e r t i e s would be those of an ice p a r t i c l e of complex s h a p e .
REVIEW OF RESULTS
Well , we s e e m to have gone into the t h e o r y in a l i t t le g r e a t e r deta i l than I had an t ic ipa ted , so le t us get on to a quick rev iew of the r e s u l t s .
F i g . 126 shows us wha t to expec t in the way of sca t t e r ing f rom randomly or iented wa te r s p h e r o ids . Whether or not nonsphe r i ca l wa te r p a r t i c l e s e v e r o c c u r on a l a r g e s c a l e i s a n o t h e r q u e s t i o n . H o w e v e r , v e r y m u c h the s a m e r e s u l t s should b e o b s e r v e d for m e l t i n g i ce and snow p a r t i c l e s . On th i s graph, the ordinate shows the s c a t t e r e d in tens i ty r e l a t ive to a sphe re of the same v o l u m e . The a b s c i s s a is ax ia l r a t i o . On the left we have oblate p a r t i c l e s ; on the r ight , p r o l a t e s . In th i s c a s e , the p a r t i c l e s a re randomly or iented . We see tha t r a n domly or iented oblate wa te r p a r t i c l e s of a x i a l r a t i o 0. 1 can r e t u r n as much as ten (10) t i m e s the s igna l to be r ece ived f rom equal s p h e r e s at a wave length of 10 cm. and about 8 t i m e s as much at 1 c m . P r o l a t e w a t e r p a r t i c l e s o f the s a m e ax i a l r a t i o r e t u r n as much as 25 t i m e s the s ignal f rom equal s p h e r e s at a wave leng th of 10 c m . Of c o u r s e , such d i s to r ted water drops can never rea l ly be expected ex cep t p e r h a p s , a s I have ind ica ted , a s m e l t i n g ice
FIG. 126. —VARIATION OF SCATTERED INTENSITY.
I l lus t ra ted is the var ia t ion of sca t t e red intensi ty with a x i a l r a t i o for obla te and p ro la t e sphero ids of water at wave lengths of 1. 25, 3. 2, and 10 cm. (normal ized with r e spec t to the radiation s ca t t e r ed from a sphe re of the same volume) .
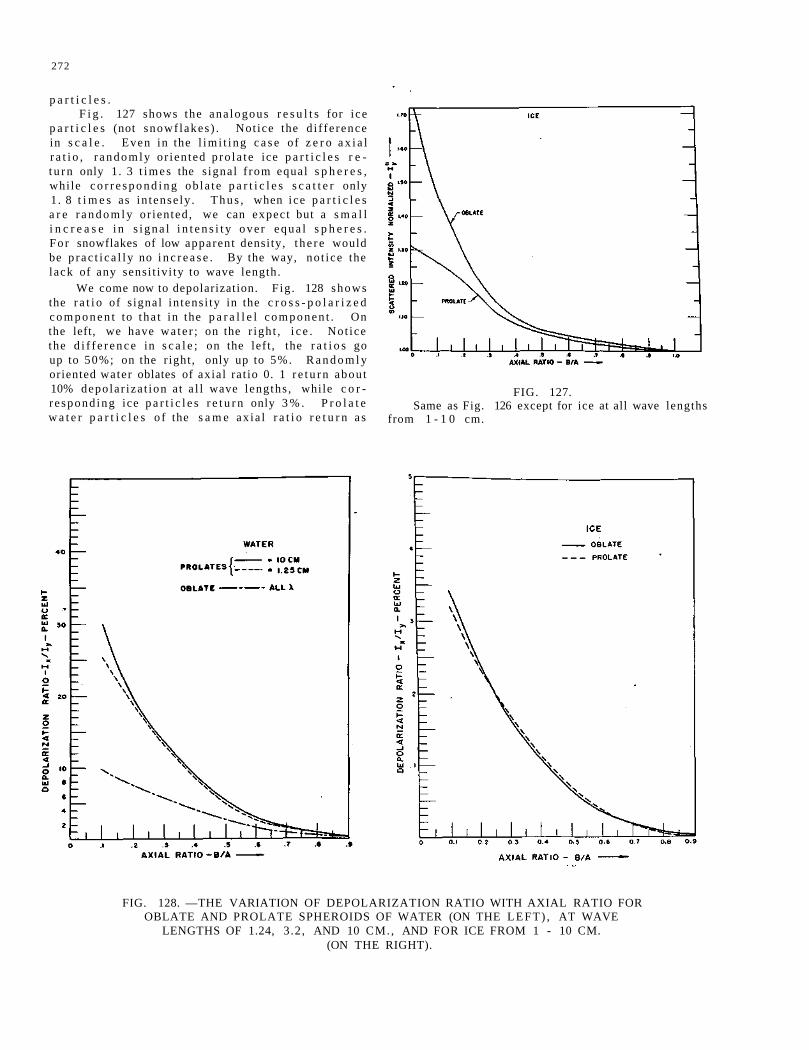
272
p a r t i c l e s . F i g . 127 shows the ana logous r e s u l t s for ice
p a r t i c l e s (not snowf lakes ) . Not ice the d i f fe rence in s c a l e . Even in the l im i t i ng c a s e of z e r o a x i a l r a t i o , r a n d o m l y or ien ted p ro l a t e ice p a r t i c l e s r e t u r n only 1. 3 t i m e s the s ignal f rom equal s p h e r e s , while c o r r e s p o n d i n g ob la te p a r t i c l e s s c a t t e r only 1 . 8 t i m e s as in tense ly . T h u s , when ice p a r t i c l e s a r e r a n d o m l y or iented , we can expect but a s m a l l i n c r e a s e i n s i g n a l i n t e n s i t y ove r e q u a l s p h e r e s . Fo r snowflakes of low apparent density, t h e r e would be p r a c t i c a l l y no i n c r e a s e . By the way, no t ice the lack of any sensi t iv i ty to wave length.
We come now to depolarization. F ig . 128 shows the r a t i o of s ignal in tens i ty in the c r o s s - p o l a r i z e d c o m p o n e n t to tha t in the p a r a l l e l c o m p o n e n t . On the left, we have wa te r ; on the r igh t , i c e . Not ice the d i f f e r e n c e in s c a l e ; on the lef t , the r a t i o s go up to 50%; on the r ight , only up to 5%. R a n d o m l y oriented water oblates of axial ra t io 0. 1 r e t u r n abou t 10% depola r iza t ion at a l l wave lengths , while c o r r e spond ing ice p a r t i c l e s r e t u r n only 3 % . P r o l a t e w a t e r p a r t i c l e s o f the s a m e ax ia l r a t i o r e t u r n a s
FIG. 127. Same as Fig. 126 except for ice at all wave lengths
from 1 - 1 0 cm.
FIG. 128. —THE VARIATION OF DEPOLARIZATION RATIO WITH AXIAL RATIO FOR OBLATE AND PROLATE SPHEROIDS OF WATER (ON THE LEFT) , AT WAVE
LENGTHS OF 1.24, 3 .2, AND 10 CM., AND FOR ICE FROM 1 - 10 CM. (ON THE RIGHT).
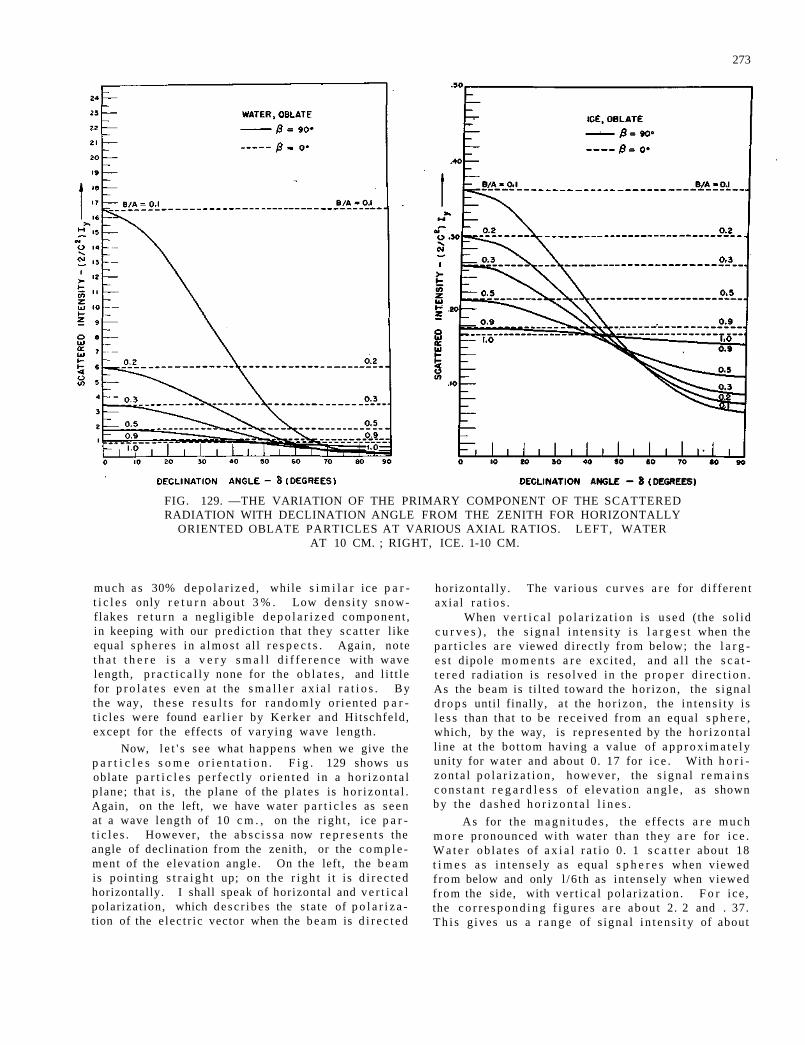
273
FIG. 129. —THE VARIATION OF THE PRIMARY COMPONENT OF THE SCATTERED RADIATION WITH DECLINATION ANGLE FROM THE ZENITH FOR HORIZONTALLY
ORIENTED OBLATE PARTICLES AT VARIOUS AXIAL RATIOS. LEFT, WATER AT 10 CM. ; RIGHT, ICE. 1-10 CM.
much a s 30% d e p o l a r i z e d , while s i m i l a r ice p a r t i c l e s only r e t u r n abou t 3 % . Low d e n s i t y snow-flakes r e t u r n a negl ig ible d e p o l a r i z e d component , in keeping with our predic t ion that they sca t t e r l ike equal s p h e r e s in a lmos t a l l r e s p e c t s . Again, note t h a t t h e r e i s a v e r y s m a l l d i f f e r e n c e with wave length, p r a c t i c a l l y none for the o b l a t e s , and l i t t le for p r o l a t e s even a t the s m a l l e r a x i a l r a t i o s . By the way, t he se r e s u l t s for r andomly or ien ted p a r t i c les were found e a r l i e r by Kerker and Hitschfeld, except for the effects of vary ing wave length.
Now, l e t ' s see what happens when we give the p a r t i c l e s s o m e o r i e n t a t i o n . F i g . 129 shows u s oblate p a r t i c l e s pe r f ec t l y o r i e n t e d in a ho r i zon ta l plane; that i s , the plane of the p l a t e s is ho r i zon ta l . Again, on the left, we have water p a r t i c l e s as s een at a wave length of 10 c m . , on the r igh t , ice p a r t i c l e s . However, the a b s c i s s a now r e p r e s e n t s the angle of declination from the zenith, or the c o m p l e ment of the elevat ion angle . On the left, the b e a m is point ing s t r a i g h t up; on the r i g h t i t i s d i r e c t e d horizontally. I shall speak of horizontal and v e r t i c a l polar izat ion, which de sc r ibe s the s ta te of p o l a r i z a tion of the e lec t r ic vector when the b e a m is d i r e c t e d
hor izonta l ly . The va r ious cu rves a r e for d i f ferent ax ia l r a t i o s .
When v e r t i c a l p o l a r i z a t i o n i s u s e d (the so l id c u r v e s ) , the s i g n a l i n t ens i t y i s l a r g e s t when the p a r t i c l e s a r e viewed d i rec t ly f rom below; the l a r g e s t dipole m o m e n t s a r e exc i ted , and a l l the s c a t t e r e d radiat ion is r e so lved in the p r o p e r d i r e c t i o n . As the beam is t i l ted toward the hor izon, the s igna l d r o p s until finally, a t the hor i zon , the in t ens i ty is l e s s than that to be rece ived f rom an equal s p h e r e , which, by the way, is r ep resen ted by the h o r i z o n t a l l ine at the bot tom having a value of a p p r o x i m a t e l y unity for water and about 0. 17 for i c e . With h o r i zon ta l p o l a r i z a t i o n , however , the s igna l r e m a i n s c o n s t a n t r e g a r d l e s s of e leva t ion a n g l e , as shown by the d a s h e d h o r i z o n t a l l i n e s .
As for the m a g n i t u d e s , the ef fec ts a r e m u c h m o r e pronounced with water than they a r e for i c e . W a t e r ob l a t e s of a x i a l r a t i o 0. 1 s c a t t e r about 18 t i m e s a s in t ense ly a s equal s p h e r e s when viewed f rom below and only l /6 th as in tensely when viewed f rom the side, with ver t i ca l po la r iza t ion . F o r i ce , the c o r r e s p o n d i n g f i gu re s a r e abou t 2. 2 and . 37. T h i s g ives us a r a n g e of s igna l i n t e n s i t y of about
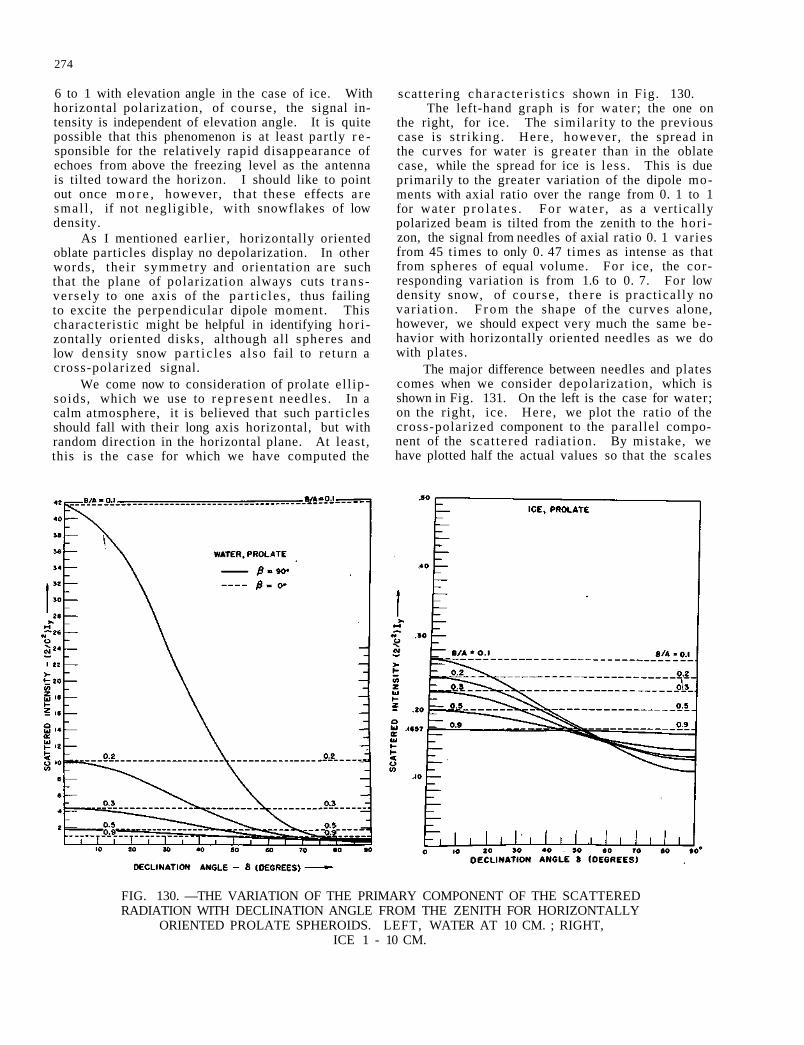
274
6 to 1 with elevation angle in the case of ice. With horizontal polarization, of course , the signal intensity is independent of elevation angle. It is quite possible that this phenomenon is at least partly r e sponsible for the relatively rapid disappearance of echoes from above the freezing level as the antenna is tilted toward the horizon. I should like to point out once m o r e , however, that these effects a re smal l , if not negligible, with snowflakes of low density.
As I mentioned earl ier , horizontally oriented oblate particles display no depolarization. In other words, their symmetry and orientation are such that the plane of polarization always cuts t r a n s verse ly to one axis of the par t ic les , thus failing to excite the perpendicular dipole moment. This characteristic might be helpful in identifying hor i zontally oriented disks, although all spheres and low densi ty snow pa r t i c l e s a l so fail to return a cross-polarized signal.
We come now to consideration of prolate el l ipsoids, which we use to r ep re sen t needles . In a calm atmosphere, it is believed that such part icles should fall with their long axis horizontal, but with random direction in the horizontal plane. At least , this is the case for which we have computed the
scattering charac te r i s t i cs shown in Fig. 130. The left-hand graph is for water ; the one on
the right, for ice. The similari ty to the previous case is s t r ik ing. Here , however, the spread in the curves for water is grea ter than in the oblate case, while the spread for ice is less . This is due primarily to the greater variation of the dipole moments with axial ratio over the range from 0. 1 to 1 for water p r o l a t e s . Fo r water , as a vertically polarized beam is tilted from the zenith to the hor i zon, the signal from needles of axial ratio 0. 1 varies from 45 times to only 0. 47 t imes as intense as that from spheres of equal volume. For ice, the corresponding variation is from 1.6 to 0. 7. For low density snow, of course , t he re is pract ical ly no variat ion. F r o m the shape of the curves alone, however, we should expect very much the same behavior with horizontally oriented needles as we do with plates.
The major difference between needles and plates comes when we consider depolarization, which is shown in Fig. 131. On the left is the case for water; on the right, ice. Here , we plot the ratio of the cross-polarized component to the parallel component of the scat tered radiat ion. By mistake, we have plotted half the actual values so that the scales
FIG. 130. —THE VARIATION OF THE PRIMARY COMPONENT OF THE SCATTERED RADIATION WITH DECLINATION ANGLE FROM THE ZENITH FOR HORIZONTALLY
ORIENTED PROLATE SPHEROIDS. LEFT, WATER AT 10 CM. ; RIGHT, ICE 1 - 10 CM.
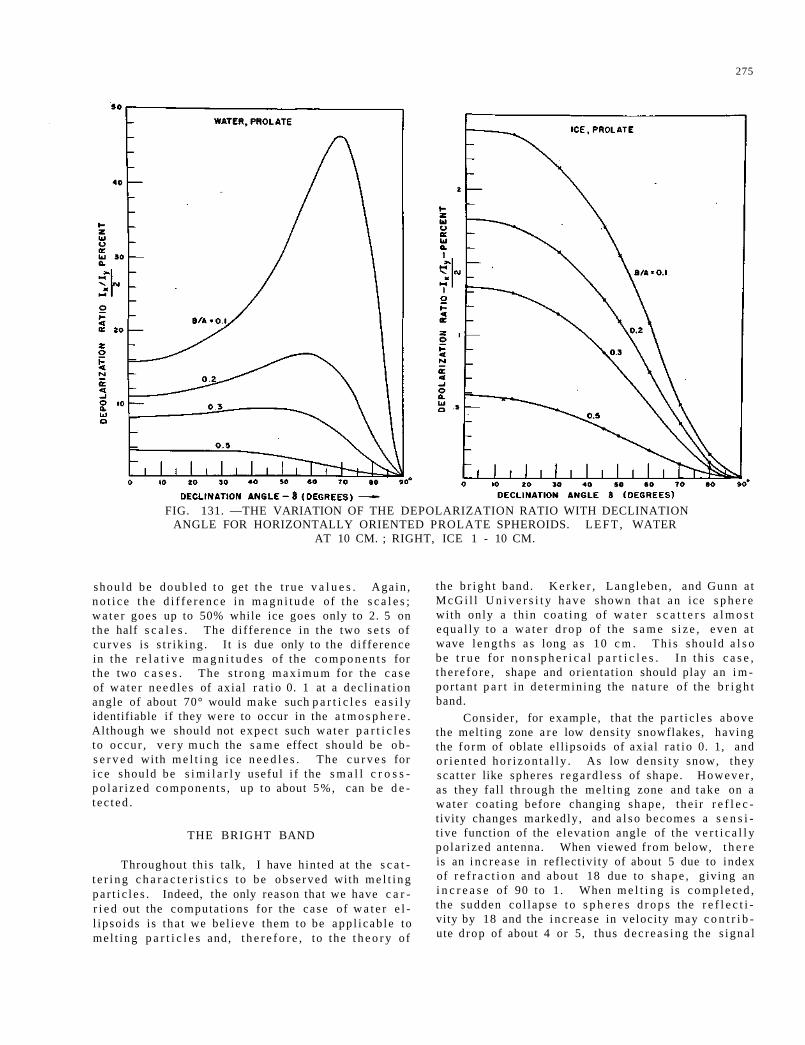
275
FIG. 131. —THE VARIATION OF THE DEPOLARIZATION RATIO WITH DECLINATION ANGLE FOR HORIZONTALLY ORIENTED PROLATE SPHEROIDS. LEFT, WATER
AT 10 CM. ; RIGHT, ICE 1 - 10 CM.
shou ld be doub led to get t h e t r ue v a l u e s . Again , n o t i c e t h e d i f f e r e n c e in m a g n i t u d e of the s c a l e s ; w a t e r goes up to 50% while ice goes only to 2. 5 on the half s c a l e s . The d i f ference in the two s e t s of cu rves is s t r i k ing . I t is due only to the d i f ference in the r e l a t i v e m a g n i t u d e s of the c o m p o n e n t s for the two c a s e s . The s t rong m a x i m u m for the c a s e of wa te r n e e d l e s of axial r a t i o 0. 1 at a dec l ina t ion angle of about 70° would make such p a r t i c l e s e a s i l y identifiable if they were to occur in the a t m o s p h e r e . Although we should not expec t such wa te r p a r t i c l e s to occur , v e r y m u c h the s a m e effect should be ob s e r v e d with m e l t i n g ice n e e d l e s . The c u r v e s for i c e should be s i m i l a r l y useful i f the s m a l l c r o s s -p o l a r i z e d componen t s , up to about 5%, can be d e t ec t ed .
THE BRIGHT BAND
Throughout th is talk, I have hinted at the s c a t t e r i n g c h a r a c t e r i s t i c s to be observed with m e l t i n g p a r t i c l e s . Indeed, the only reason that we have c a r r i e d out the computat ions for the case of w a t e r e l l ipso ids is tha t we be l ieve them to be app l i cab le to mel t ing p a r t i c l e s and, t h e r e f o r e , to the t h e o r y of
the b r i g h t band. K e r k e r , Lang leben , and Gunn a t M c G i l l U n i v e r s i t y h a v e shown tha t an ice s p h e r e with only a th in coa t ing of w a t e r s c a t t e r s a l m o s t equa l ly to a w a t e r d r o p of the s a m e s i z e , even at wave l e n g t h s as long as 10 c m . Th i s should a l s o be t r u e for n o n s p h e r i c a l p a r t i c l e s . In th i s c a s e , the re fo re , shape and or ienta t ion should play an i m por tan t p a r t in de te rmin ing the na tu re of the b r i g h t band.
Consider , for example, that the pa r t i c l e s above the melt ing zone a r e low densi ty snowflakes, having the fo rm of oblate e l l ipsoids of axial r a t io 0. 1, and o r i e n t e d h o r i z o n t a l l y . As low dens i ty snow, they sca t ter like spheres r e g a r d l e s s of shape. However , as they fal l th rough the me l t ing zone and t ake on a water coat ing before changing shape , the i r r e f l e c tivity changes markedly , and a l s o becomes a s e n s i t ive function of the elevat ion angle of the v e r t i c a l l y po la r ized antenna. When viewed f rom below, t h e r e is an i n c r e a s e in reflectivi ty of about 5 due to index of r e f r a c t i o n and about 18 due to s h a p e , giving an i n c r e a s e of 90 to 1. When m e l t i n g is c o m p l e t e d , the sudden co l lapse to s p h e r e s d r o p s the r e f l e c t i vity by 18 and the i nc r ea se in velocity may c o n t r i b ute d rop of about 4 or 5, thus d e c r e a s i n g the s igna l
276
by between 70 and 90 to 1. When viewed from the side with vert ical polarization, the reflectivity of the snowflakes may actually decrease slightly in going into the melting zone, there being an increase of 5 due to index of refraction and a decrease of 6 due to shape, or a decrease of 5/6ths. On the completion of melting, shape increases the reflectivity by about 6, and velocity decreases it by 4 or 5.
Of course , we have considered a rather ext r e m e c a s e . With more spherical par t ic les and somewhat less perfect orientation, the effects would not be quite so extreme. The fact that the results a r e so sensi t ive to direct ion of polarization and elevation angle provides us with an interesting experiment for the determination of just how important these effects are . However, we already have some evidence of this. Bright band observations made at vertical incidence generally appear to be more s t r iking than those made obliquely. I believe Dr. Swingle has observed the bright band on a 10-cm. radar at vertical incidence when there were no echoes present below it.
SUMMARY
I should like to conclude my remarks with a brief summary of these resu l t s , which, I want to emphasize, are based entirely on Cans' theory for part icles small relative to the wave length.
1. First of all, I believe that the general form and state or orientation of the simpler types of non-spherical ice particles may be determined, at least in a qualitative manner, from the character is t ics of the back-scat tered radiation. There are some ambigu i t i e s , but these may be resolved largely
from other charac te r i s t i cs of the echoes and the meteorological conditions. This is not the case for low density snowflakes.
2. In general, part icles whose axes a re o r i ented obliquely to the plane or polarization of the incident wave will re turn a cross-polar ized component; if the plane of polarization is t r ansve r se to one axis of the par t i c le , there will be no such component.
3. The back-scattered radiation from oriented par t ic les will generally be sensitive to variations in both angle of incidence to the plane of prefer red orientation and the direction of polarization of the incident wave. An array of randomly oriented p a r ticles displays no such sensitivity.
4. This sensitivity is much greater for water -coated particles than for ice of the same shape and size; for ice, it is independent of wave length; for water, the sensitivity increases slightly with wave length over the 1 to 10 cm. range.
5. The radiation scattered from nonspherical particles may be more or less intense than that from spherical part icles of the same volume depending on the state of orientation relative to the plane of polarization. Randomly oriented part icles always scatter more intensely than equal spheres; oriented particles scatter more intensely when the direction of polarization is para l le l to the major axes , and less intensely when parallel to the minor axes. Low density snowflakes scatter very much like spheres regardless of shape and orientation.
6. It is believed that these effects can not help but play an important part in determining the nature of the bright band.
BIBLIOGRAPHY
1. Ryde, J. W., "The Attenuation of Radar Echoes Produced at Centimeter Wave Lengths by Various Meteorological Phenomena," Report of a conference on meteorological factors in radio wave propagation held on 8 April 1946 at the Royal Institution, London, published by the Physical Society, 1946.
2. Austin, P. M., and Bemis, A. C., "A Quantitative Study of the "Bright Band" in Radar P re cipitation Echoes," J. Meteor., 7, 145-151, 1950.
3. Schultz, F. V., "Scattering by a Prolate Spheroid,"
Aeronautical Research Center, University of Michigan, Report UMM-42, March 1, 1950.
4. Gans, R., "Uber die Form Ultramikroskopischer Goldteilchen," Annalen der Physik, 37, 881, 1912.
5. Kerker, M., and Hitschfeld, W., "The Effect of Particle Shape and Secondary Scattering on Microwave Reflections from Clouds and Precipitation," McGill University Report MW-1, March 1951.
6. Slater, J. C., and Frank, N. H., "Electromag-net ism," McGraw-Hill, 1947, p. 110.
WITH DISCUSSIONS BY P. M. AUSTIN, M. H. LIGDA, F. C. WHITE, G. E. STOUT, E . F . HILL, D. M. SWINGLE
G e n t l e m e n , the t i t le of t h i s p a p e r is p e r h a p s not p r e c i s e l y a c c u r a t e , s i nce I in tend to d i s c u s s the considera t ions which dicta ted the choice of f r e quency m a d e in the deve lopment of R a d a r Set AN/ CPS-9 and the phi losophy upon which tha t d e v e l o p m e n t w a s b a s e d , i n add i t ion t o the m o r e l im i t ed subject of the anticipated effects of attenuation on the r a n g e p e r f o r m a n c e of tha t e q u i p m e n t . However , t he t i t l e c o m e s c lo se enough, s ince the r e l a t i o n s be tween the s e v e r i t y of s igna l a t t enua t ion by p r e c ip i t a t ion , the f r equency of o c c u r r e n c e and a r e a l extent affected by such attenuation were p redominan t in the choice of r a d a r frequency.
Before discussing the choice of r ada r f requency, I should like to outline the even t s leading up to the d e v e l o p m e n t of the A N / C P S - 9 and the phi losophy upon which that development was based . F r o m th is van tage point we sha l l be ab le to view the effects of a t t e n u a t i o n in the l igh t of wha t the r a d a r was d e s i g n e d to db and of what i t was no t des igned to do .
As is we l l -known to m o s t of the m e m b e r s of t h i s c o n f e r e n c e , the b a s i c t h e o r y d e s c r i b i n g the s c a t t e r i n g of e l e c t r o m a g n e t i c waves by d i e l e c t r i c s p h e r e s was d e r i v e d by G. Mie in 1908 in connec t ion with the p r o b l e m of t h e s c a t t e r i n g of l ight by colloidal suspensions.. The theory was expanded by s eve ra l o thers , applied to the calcula t ion of the a t tenuation of mete r - leng th waves by J. A. S t ra t ton in 1930, and appeared in his 1941 textbook on E l e c t r o magnet ic Theory.
I t was thus no grea t shock to the phys i c i s t s and eng inee r s working with cen t ime te r wave equipment a t our M. I . T. Rad ia t i on L a b o r a t o r y and in o ther a d v a n c e d d e v e l o p m e n t l a b o r a t o r i e s , when i t was found t ha t t he se waves w e r e ef fec t ive ly s c a t t e r e d by p rec ip i t a t i on p a r t i c l e s .
When equ ipment in the S-band ( app rox ima te ly 10-cm. wave length) became ope ra t iona l ( app rox i m a t e l y a t the t i m e o f the P e a r l H a r b o r d i s a s t e r ) , p r e c i p i t a t i o n e c h o e s w e r e o b s e r v e d to occur with c o n s i d e r a b l e f r e q u e n c y . H o w e v e r , a l though the echoes were de tec tab le , the por t ion of the inc ident
*Physicist, Signal Corps Engineering Laboratories, Belmar, New Jersey.
r a d a r energy a b s o r b e d and s c a t t e r e d by p r e c i p i t a t ion r ep re sen ted too s m a l l an a t tenuat ion to be d i s t u r b i n g . I t was r e c o g n i z e d tha t t h e s e p r e c i p i t a t i o n echoes w e r e the r e s u l t of Rayle igh s c a t t e r i n g a n d f u r t h e r t h a t bo th s c a t t e r i n g a n d a t t enua t i on would become m o r e pronounced as one p r o g r e s s e d toward sho r t e r wave length equipment . I t was a l s o recogn ized that p rec ip i t a t ion echo da ta might con ceivably be of some use and/or in teres t to the m e t e orologis t .
When X-band (approximate ly 3 c m . ) equipment became avai lable, i t was apparent f rom the de ta i l ed c a l c u l a t i o n s of R y d e , b a s e d on the Mie T h e o r y , t ha t both effects would be t r o u b l e s o m e under c e r t a i n c o n d i t i o n s s i n c e t hey would i n t e r f e r e in the accomplishment of the p r imary purpose of the e q u i p ment . However, the other advantages of the e q u i p men t outweighed the occas iona l p r o b l e m s of i n t e r f e r e n c e wi th n o r m a l o p e r a t i o n o f the equ ipmen t caused by p r e c i p i t a t i o n .
During the y e a r 1942, M r . A r t h u r E. Bent of the M . I . T . R a d i a t i o n L a b o r a t o r y s t u d i e d r a d a r echoes f rom ra in and cloud a r e a s . In 1943, Majo r J . O. F l e t che r worked at the Radiat ion L a b o r a t o r y under the auspices of the Army Air F o r c e s Wea the r S e r v i c e to d e t e r m i n e the i n t e r r e l a t i o n s o f r a d a r and w e a t h e r , and , as a r e s u l t of t h e i r s t u d i e s , a weather r a d a r p r o g r a m was se t up by the Wea the r S e r v i c e . A n u m b e r of f ie lds w e r e found to be of i n t e r e s t , but we wi l l c o n s i d e r today only the field of s torm detection. The Canadian Army Opera t iona l R e s e a r c h Group a l s o e n t e r e d in the field of s t o r m detec t ion dur ing 1943.
Under the guidance of Major J. O. F l e t c h e r , a group in the Weather Equipment Methods Sect ion of the U. S. A r m y Signal Corps Ground Signal Agency obta ined, se t up, and t e s t e d R a d a r S e t s SCR-584 , SCR-717B and A N / A P Q - 1 3 for poss ib le app l ica t ion t o wea the r o b s e r v a t i o n .
As t h e s e t e s t s p r o g r e s s e d , du r ing the p e r i o d f r o m 1943 to 1945, t h e r e deve loped a r e a l i z a t i o n t h a t we had in our h a n d s a t e c h n i q u e of w e a t h e r obse rva t ions which was a l m o s t i n c o m p a r a b l e with any of the p r e v i o u s l y used t echn iques , a t echn ique which could be of t r e m e n d o u s value in f o r e c a s t i n g and obse rv ing the w e a t h e r .
THE EFFECT OF ATTENUATION ON THE RANGE PERFORMANCE OF RADAR SET A N / C P S - 9
BY D O N A L D M. SWINGLE *
277
278
If one investigates the h i s to ry of m e t e o r o l o g i c a l o b s e r v a t i o n and i n s t r u m e n t a t i o n , one finds t h a t , a l though the wea the r has been of g r e a t i n t e r e s t to m e n th rough a l l a g e s , the e a r l y o b s e r v a t i o n s c o n s i s t e d a l m o s t e x c l u s i v e l y o f q u a l i t a t i v e o b s e r v a t ions . T h e s e date back a t l e a s t to the Baby lon ians (about 900 B . C . ) . Dur ing the s u c c e e d i n g t w e n t y -four cen tu r i e s , a fa i r ly extens ive wea ther lo re w a s d e v e l o p e d and s o m e of the w e a t h e r o b s e r v a t i o n s w e r e s y s t e m a t i z e d , but by and l a r g e l i t t le o f i m po r t ance o c c u r r e d in the deve lopmen t of m e t e o r o logical ins t ruments until the invention of the m e r c u r i a l b a r o m e t e r by E v a n g e l i s t a T o r r i c e l l i in 1643. The b a r o m e t e r r e m a i n s t o d a y the only m e t e o r o log i ca l i n s t r u m e n t which g ives da t a which can be cons ide red to be r e p r e s e n t a t i v e of the s u r r o u n d i n g a i r m a s s . F r o m 1650 t o 1850 m e t e o r o l o g i c a l i n s t r u m e n t s w e r e d e v e l o p e d i n r a p i d s u c c e s s i o n . These instruments were genera l ly intended to d e t e r mine the weather conditions exist ing at a given poin t of observat ion . This in s t rumen ta t ion and o b s e r v a t ion s y s t e m has b e c o m e the b a s i s for our p r e s e n t synoptic w e a t h e r ne twork and the s u r f a c e w e a t h e r c h a r t .
With t h e use of da ta f r o m s u c h i n s t r u m e n t s , one has a t t empted to fo recas t the wea ther in t e r m s of the f luc tua t ions in t e m p e r a t u r e , p r e s s u r e , h u midi ty , wind, cloud cove r , p r ec ip i t a t i on , e t c . b e tween a l a r g e n u m b e r of s u r f a c e s t a t i o n s . By the use of a l a r g e number of independent o b s e r v a t i o n s , one a t t e m p t e d to obtain a p i c t u r e of the r e a l c o n t inuous d i s t r i b u t i o n of t h e s e p a r a m e t e r s over the sur face of the map , and to f o r e c a s t the i r c h a n g e s . This modera te ly successful ven tu re h a s had enough support to es tab l i sh : f i r s t , the A r m y Signal C o r p s Weather Network in 1870, and la te r the U.S. W e a t h e r B u r e a u in 1890, and to keep i t go ing .
The n e x t m a j o r a d v a n c e i n i n s t r u m e n t a t i o n occurred with the development of radio-sonde du r ing the t h i r t i e s . Now for the f i r s t t i m e , one was e n a b l e d to d e t e r m i n e the cond i t i ons no t s i m p l y a t a point on the su r face of the e a r t h , but over a m o r e o r l e s s s lop ing l ine ex tending t h r o u g h the a t m o s p h e r e above t ha t s t a t i on . An e x t e n s i v e t echn ique of s i n g l e - s t a t i o n f o r e c a s t i n g was deve loped b a s e d on the o b s e r v a t i o n s obta inable f rom such a s c e n t s . St i l l , one w a s not sa t i s f i ed with the ava i l ab l e da ta as a p i c t u r e of the w e a t h e r , and i t was found d e s i r a b l e to e s t a b l i s h f a i r l y e x t e n s i v e n e t w o r k s o f u p p e r - a i r s t a t i o n s and a l s o t o t r a n s m i t t h i s data s o t h a t a n a r e a l a n a l y s i s m i g h t b e m a d e .
With the advent of m i c r o w a v e r a d a r , we have been able to p r o g r e s s yet another s tep in the d i r e c t ion of knowing the s ta te of the whole a t m o s p h e r e , an e s s e n t i a l i f one is f ina l ly to c o n q u e r the f o r e cas t ing p r o b l e m by way of a g e n e r a l i z e d L a p l a c e -p r o b l e m a p p r o a c h . We a r e now enabled to d e t e r mine the conditions with r e spec t to microwave s c a t t e r i n g by p r e c i p i t a t i o n not at a po in t , not a long a
line above that point, but (a) e s sen t i a l ly i n s t a n t a n e o u s l y we c a n d e t e r m i n e t h a t d i s t r i b u t i o n ove r a p l a n e o r c o n i c a l s u r f a c e abou t the r a d a r s t a t i on ; (b) given a few m i n u t e s , we can obtain the data on o t h e r con ica l s u r f a c e s and t h u s e s s e n t i a l l y c o v e r the so l id v o l u m e s u r r o u n d i n g the s t a t i o n . Using the s imp le P P I obse rva t i on , we have extended the s p a t i a l d i m e n s i o n a l i t y of our o b s e r v a t i o n f r o m a l ine to a s u r f a c e whose d i a m e t e r m a y be f r o m 50 t o 200 m i l e s . When s u i t a b l e t h r e e - d i m e n s i o n a l p r e s e n t a t i o n s a r e d e v e l o p e d , w e sha l l have c o n q u e r e d the p r o b l e m of o b s e r v i n g the d i s t r i b u t i o n of at l e a s t one m e t e o r o l o g i c a l e l e m e n t t h roughou t a v o l u m e . It is in c o n s i d e r a t i o n of t h e s e f a c t o r s that I r e f e r r ed above to microwave r ada r s t o r m d e t e c t i o n as a w e a t h e r o b s e r v a t i o n technique whol ly i n c o m p a r a b l e t o t h o s e p r e v i o u s l y ex i s t ing .
Until the summer of 1945, the only r a d a r e q u i p ment in much use for s t o r m detect ion was the SCR-584, which was a l s o used for the d e t e r m i n a t i o n of w inds . F r o m midd le 1944 t h r o u g h the s u m m e r of 1945 va r ious l ight-weight r a d a r s were inves t iga ted and tes ted by personnel of the Signal Corps L a b o r a t o r i e s .
I t was dec ided , dur ing the e a r l y p a r t of 1945, to adopt the AN/APQ-13 , a s t andard a i rborne r a d a r n o r m a l l y u s e d for nav iga t ion a n d bombing , a s a n i n t e r i m s t o r m d e t e c t i o n s e t p e n d i n g des ign of a s p e c i a l s t o r m d e t e c t o r b y the S igna l C o r p s E n g i n e e r i n g L a b o r a t o r i e s . A s p e c i a l Wea the r R a d a r Section was se t up at Evans Signal L a b o r a t o r y wi th M r . Gou ld a s Chief . A m o n g i t s f i r s t t a s k s was the d e v e l o p m e n t of the A N / C P S - 9 . , The frui t of th i s d e v e l o p m e n t was r e p o r t e d by L . A . Z u r c h e r of the Evans Signal L a b o r a t o r y at the Washington , D . C . m e e t i n g o f the A m e r i c a n M e t e o r o l o g i c a l Soc ie ty in the S p r i n g of 1949. M r . Z u r c h e r e m phas ized , as I wish a l s o to do, tha t the A N / C P S - 9 has been des igned specif ical ly for use by the m e t e orologis t as an opera t ing tool in wea ther f o r e c a s t ing. Although i t offers m a n y p o s s i b i l i t i e s for r e s e a r c h in t h e f i e l d s o f p r e c i p i t a t i o n p h y s i c s and g e n e r a l synoptic me teo ro logy , a l l f ac to rs e n t e r i n g into i t s des ign and development w e r e cons ide red in t e r m s of t h e i r effects on the d a y - t o - d a y ope ra t i on and u s e of t h e e q u i p m e n t as a s t o r m d e t e c t o r by the A i r W e a t h e r S e r v i c e .
B e c a u s e o f t h e m a n n e r in w h i c h m i c r o w a v e t r a n s m i t t i n g equipment is developed, the choice of. ope ra t ing f r e q u e n c y was by a l l odds the m o s t difficult engineer ing dec is ion to be m a d e in the d e v e l o p m e n t o f t h e e q u i p m e n t . I t w a s not e x t r e m e l y diff icul t to e s t a b l i s h l i m i t s on the r e s o l u t i o n and a c c u r a c y r e q u i r e d of the e q u i p m e n t , thus se t t ing the values of the pulse length, r e c e i v e r band width, and the ra t io of antenna a p e r t u r e to the r a d a r wave l e n g t h . One w a s t h e n left t o s u i t a b l y ad jus t the frequency to optimize the pe r fo rmance of the e q u i p ment , while s t i l l r emain ing within r easonab le s i z e ,
279
weight and power limitations. This would have been a difficult job in itself. However, one had also to consider the availability of transmitting magnetrons and other components at each particular frequency. This s e rved to reduce the problem from that of determining the optimum frequency from theoretical calculations only, to one of determining which of a set of possible frequencies would do the best job.
One can perhaps best visualize the problem by consideration of the so-called basic storm detection radar equation in which the presence of f requency dependent factors is indicated. We consider the form where it is assumed that the radar beam is completely intercepted by area of uniform p r e cipitation.
= the ratio of signal to noise power at the
receiver . C = a frequency independent constant. R = the range from the radar to the precipi ta
tion region in question. = summation of sixth powers all drop
lets contained in unit volume in the precipitation a r e a .
D = diameter of paraboloidal t rans mitting-receiving antenna.
n = noise figure of the receiver . = duration of t ransmit ted pulse.
Pt = peak transmit ted power. K = attenuation coefficient per unit depth for
rainfall of rate r.
Here one notes that the ratio of signal to noise power received from a given precipitation region is a function of:
1. The ratio of the diameter of the antenna system to the radar wave length, limits on p e r m i s sible values of this rat io being given by resolution requirements. Further limitations on the diameter of the antenna system are dictated by considerations of wind loading, weight, and power requi re ments.
2. The noise figure available at any given wave length, a function of the wave length and available components.
3. The pulse duration available at any given wave length, depending primarily on the availability of magnetrons designed to produce it. This appears in the square because of the influence of pulse duration on receiver band width. This also affects the weight, size and power consumption of the modu-
lator. 4. The peak power available at a given wave
length, which a lso depends on the development of suitable magnetrons. Choice of power will have a strong effect on the weight, s ize and power consumption of the modulator.
5. The attenuation to be expected from any given precipitation situation, which depends on the wave length and could be cr i t ical .
The design problem was to ar r ive at the best possible compromise of these various parameters involving the radar wave length, while yet making the equipment as useful as possible. The equipment was not intended to be a research tool, nor was it possible then (as it is not yet possible) to use the radar as an accura te measu re of the intensity of precipitation. This is one of the problems concerning this conference and remains one of the major problems in the radar storm detection field. The A N / C P S - 9 has instead been designed within the restrictions outlined above, to detect precipitation to as long ranges as possible whenever such p re cipitation occurs above the radar horizon. The design has been quite successful in this respect , obtaining echoes more frequently and to greater ranges than is possible with any other radar equipment of comparable weight, size and power consumption. Thus it takes the maximum advantage of the unique capability of microwave radar to detect precipitation and to represent the general spatial distribution of that precipitation over a large a rea .
The manner in which the operating wave length of A N / C P S - 9 was chosen is outlined below. As soon as storm detection was shown to be a worthwhile venture, the group at the Weather Equipment Methods Section of the Signal Corps Laboratories began an active theoret ical and experimental investigation of the factors leading to the optimum performance of s torm detection radar . As a r e sult of this study the AN/APQ-13 radar was adopted as an in te r im s t o r m detection set , as indicated above, and an active project for the development of the AN/CPS-9 equipment was established. The investigations, particularly of the effect of attenuation, were continued by the Signal Corps Engineering Laboratories .
In 1947, Wexler and Swingle published an abbreviated theory of radar s torm detection for the consumption of the meteorologist . Several of the resul ts of the Signal Corps' studies were included in this article, the most interesting being the effect of attenuation on the detection of precipitation of a given intensity over a path where precipitation of the same intensity was falling. For the complete interception case , it was shown that a rainfall of approximately one-half inch per hour would give a grea ter radar echo at 3.2 centimeters than a fall of 0. 2 inches per hour to a range of approximately
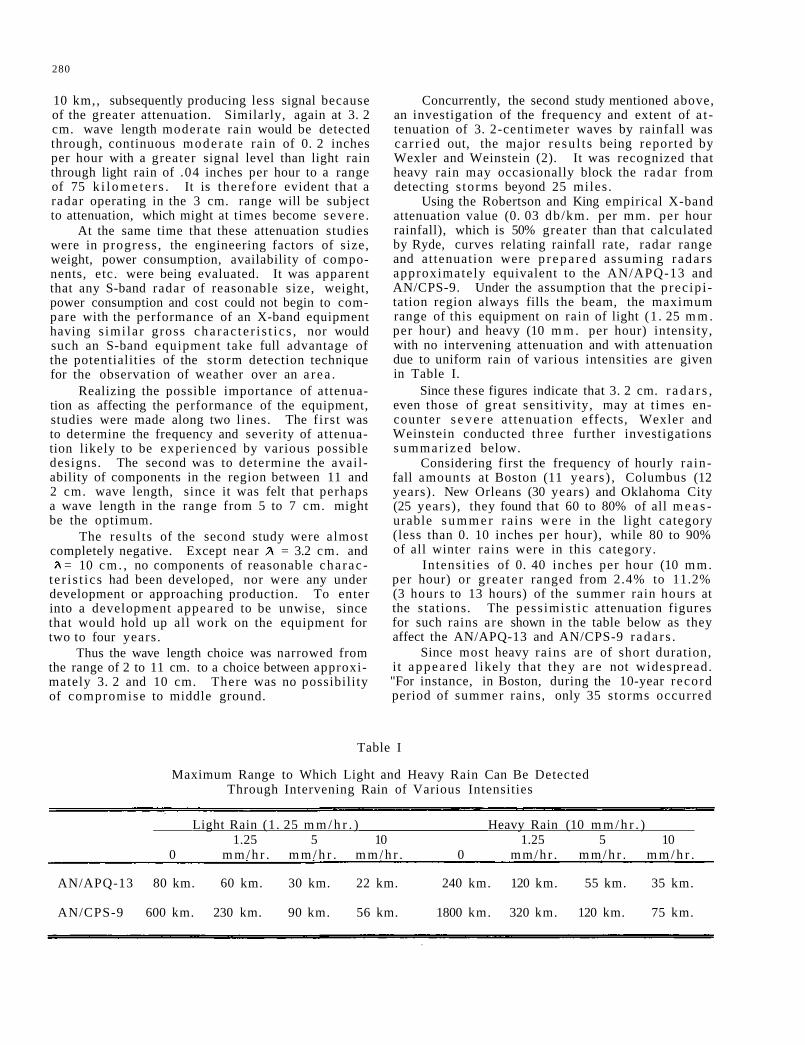
280
10 km,, subsequently producing less signal because of the greater attenuation. Similarly, again at 3. 2 cm. wave length moderate rain would be detected through, continuous modera te rain of 0. 2 inches per hour with a greater signal level than light rain through light rain of .04 inches per hour to a range of 75 k i l o m e t e r s . It is therefore evident that a radar operating in the 3 cm. range will be subject to attenuation, which might at times become severe .
At the same time that these attenuation studies were in progress , the engineering factors of size, weight, power consumption, availability of components, etc. were being evaluated. It was apparent that any S-band radar of reasonable size, weight, power consumption and cost could not begin to compare with the performance of an X-band equipment having s imi lar gross cha rac te r i s t i c s , nor would such an S-band equipment take full advantage of the potentialities of the storm detection technique for the observation of weather over an a r ea .
Realizing the possible importance of attenuation as affecting the performance of the equipment, studies were made along two lines. The f irst was to determine the frequency and severity of attenuation likely to be experienced by various possible designs. The second was to determine the availability of components in the region between 11 and 2 cm. wave length, since it was felt that perhaps a wave length in the range from 5 to 7 cm. might be the optimum.
The results of the second study were almost completely negative. Except near = 3.2 cm. and
= 10 cm. , no components of reasonable charac te r i s t i cs had been developed, nor were any under development or approaching production. To enter into a development appeared to be unwise, since that would hold up all work on the equipment for two to four years.
Thus the wave length choice was narrowed from the range of 2 to 11 cm. to a choice between approximately 3. 2 and 10 cm. There was no possibility of compromise to middle ground.
Concurrently, the second study mentioned above, an investigation of the frequency and extent of a t tenuation of 3. 2-centimeter waves by rainfall was car r ied out, the major resu l t s being reported by Wexler and Weinstein (2). It was recognized that heavy rain may occasionally block the radar from detecting s torms beyond 25 miles .
Using the Robertson and King empirical X-band attenuation value (0. 03 db/km. per mm. per hour rainfall), which is 50% greater than that calculated by Ryde, curves relating rainfall rate, radar range and attenuation were p r e p a r e d assuming rada r s approximately equivalent to the AN/APQ-13 and AN/CPS-9. Under the assumption that the prec ip i tation region always fills the beam, the maximum range of this equipment on rain of light (1 . 25 m m . per hour) and heavy (10 m m . per hour) intensity, with no intervening attenuation and with attenuation due to uniform rain of various intensities are given in Table I.
Since these figures indicate that 3. 2 cm. r a d a r s , even those of great sensitivity, may at t imes encounter s e v e r e at tenuation effects, Wexler and Weinstein conducted three further investigations summar ized below.
Considering first the frequency of hourly ra infall amounts at Boston (11 years) , Columbus (12 years). New Orleans (30 years) and Oklahoma City (25 years) , they found that 60 to 80% of all m e a s urable s u m m e r ra ins were in the light category (less than 0. 10 inches per hour), while 80 to 90% of all winter rains were in this category.
Intensi t ies of 0. 40 inches per hour (10 mm. per hour) or greater ranged from 2.4% to 11.2% (3 hours to 13 hours) of the summer rain hours at the stations. The pess imis t ic attenuation figures for such rains are shown in the table below as they affect the AN/APQ-13 and AN/CPS-9 r ada r s .
Since most heavy rains are of short duration, i t appea red l ikely that they a re not widespread. "For instance, in Boston, during the 10-year record period of summer rains, only 35 storms occurred
Table I
Maximum Range to Which Light and Heavy Rain Can Be Detected Through Intervening Rain of Various Intensities
Light Rain (1. 25 m m / h r . ) Heavy Rain (10 m m / h r . ) 1.25 5 10 1.25 5 10
0 m m / h r . m m / h r . m m / h r . 0 mm/h r . m m / h r . m m / h r .
AN/APQ-13 80 km. 60 km. 30 km. 22 km. 240 km. 120 km. 55 km. 35 km.
AN/CPS-9 600 km. 230 km. 90 km. 56 km. 1800 km. 320 km. 120 km. 75 km.
281
which had at least one mean hourly intensity of 0. 3 inches per hour or more (heavy rain) while four of these showed two consecutive hours of heavy rain and only one showed three consecutive hours of heavy ra in .
From this study they concluded that heavy rains occur infrequently and that heavy rains covering large a r e a s a r e r a r e .
A second study was made to determine the areal extent of heavy rainfall. Using a network of four stations 13 to 15 miles apart near Houston, Texas, they analyzed the hourly rainfall data for September for the years 1942-1945, that month, in the hur r i cane season, being chosen as one in which widespread heavy rain was most likely to occur.
Over the six-year record period, at least one station reported heavy rain (0. 3 inches per hour or more) for a total of 54 hours. During only one hour of this period did heavy rain occur at all four stations s imultaneously, while simultaneous heavy rain occurred for four hour's at three stations, nine hours at two stations, and forty hours at only one station. By contrast, there were twelve hours during which heavy rain occurred at one station and no rain fell at any of the other three stations. Wexler and Weinstein concluded that the odds were better than 3 to 1 that heavy rain will not extend to a diameter of 25 miles or more.
As a final study, the number of hours per year during which the AN/CPS-9 would be reduced in range below 50 miles in the detection of heavy (0. 4 inches per hour) rain were investigated. Considering the half-hourly maps of the Muskingum Valley watershed for the year 1938, they found that the mean precipi ta t ion intensity was 0. 2 inches per half hour from the center to a point 50 miles in any direction for a total of 20 hours, of which 19 corresponded to line squalls or lines of thunderstorms, the remaining rain being due to a single large (25-mile diameter) thunderstorm having extremely heavy rainfall. Only one hour occurred in which a squall line passed over the station, causing the specified attenuation along lines on both sides of the station. In no case was the intensity of rain 0. 20 inches or more per half hour in all directions.
From these studies we concluded that the pe r formance of X-band radar for storm detection would not, in most locations, be seriously limited by a t tenuation due to rainfall.
It is indeed fortunate that this is so, for cons idera t ion of the design of a r ada r having equal abilities, but not subject to severe attenuation operating at a 10 cm. wave length shows that it could not be made within reasonable s ize , weight and power limits. For instance, to retain good resolution we would require an antenna scaled up to about 25 feet in d iameter . This antenna would have to be much stronger and heavier per unit area to with
stand the increased ice and wind loading, while the pedestal and drive system would have to be similarly scaled up and strengthened. We would still need to scale up the t ransmi t t ed power by a factor of ten, resulting in an appreciably heavier and larger modulator . Both these changes would act to increase the over-all power consumption and, perhaps more important, to increase the cost of the equipment. But since the AN/CPS-9 already pushes the size and weight limits set by the requesting Using Service, such a 10 cm. radar could not have been acceptable and we would have no AN/CPS-9 today.
As was noted already, the delay in waiting for or init iating development of a whole new line of components in 5 to 7 cm. range was regarded as intolerable.
Thus we were forced by circumstance to accept 3 cm. as the operating wave length or do without the radar , while our background studies of ra infall and attenuation at 3. 2 cm. wave length showed that, although attenuation would at times be severe , the usefulness of such a radar as the AN/CPS-9 would not often be seriously impaired by attenuation due to rainfall, in most locations.
We have now had experience with the AN/CPS-9 for something like three yea r s . Attenuation has not proven to be serious at any of the three locations in the East where the radars have been used. It has most certainly not been eliminating echoes from 10% of the total radar coverage area for as much as 10% of the t ime.
In our New Jersey experience, attenuation has been noticeable, resulting in loss of echo from large a r ea s , in perhaps one or two cases per summer . This has assured us that we made the correct decision, under these c i rcumstances when the radar wave length was frozen at 3. 3 centimeters, that is in terms of the intended use of the equipment; i. e . , to detect as much of the precipitation area as pos sible and to do so as often as possible. The equipment is not intended to do a 100% job on a much smaller a rea , nor to avoid attenuation altogether so as to permit its use as a research tool or to plot contours of echo strength, the latter use still being in the research stage.
Should it appear, in the course of time and r e search , that the field equipment would be better used by changes in its design, these could be effected either by the addition of a modification kit or by production of a second model incorporating such changes as are felt necessa ry or desirable . At such t ime it will be up to the using services to state their newer requirements.
At the present time, however, the set appears to be the best that could be had by way of obtaining good sensitivity and good coverage most of the t ime, with v e r y occasional difficulties resulting from rainfall attenuation.
282
B I B L I O G R A P H Y
Ref.
1. Wexler, Raymond and Swingle, Donald M . , "Radar Storm Detec t ion ," Bulletin A m e r i c a n Meteorological Society, v. 28, pp. 159-167(1947) .
Ref.
2. Wexler, Raymond and Weinstein, Joseph, "Rainfall Intensities and Attenuation of Centimeter Waves, " Proc . IRE, p. 353 (1948).
DISCUSSION
P. M. AUSTIN. —Is the re any way of us ing the at tenuation effect? You have a good r a d a r - w e a t h e r s e t , and i f we can use i t to a c t u a l l y m e a s u r e the a t t enua t ion , i t migh t be wel l to l eave the a t t e n u a t ion in, thus helping to d e t e r m i n e p rec ip i t a t ion in t ens i t y .
D. M. SWINGLE. —That is a poss ib i l i ty which d e s e r v e s f u r t h e r i n v e s t i g a t i o n . Ray Wex le r did
. m a k e an e f f o r t in t h i s d i r e c t i o n in h i s p a p e r on " R a d a r D e t e c t i o n o f a F r o n t a l S t o r m . " 1
U N I D E N T I F I E D . —What i s the longes t r ange you have ob ta ined?
W. B. GOULD. - - I be l ieve we have had ac tua l p rec ip i t a t ion de tec ted to someth ing like 350 m i l e s .
D. ATLAS. —I s t i l l think tha t you have to find a p u r p o s e , and I be l ieve the g r e a t e s t u t i l i ty of the r a d a r se t wil l be in somehow giving us a synopt ic p i c t u r e .
M. H. LIGDA. —I think that M r . Gould 's outfit r e a l l y rang the be l l with the C P S - 9 , but having the C P S - 9 and t h e S C R - 6 1 5 B ( 3 - a n d 1 0 - c e n t i m e t e r s y s t e m s ) s i d e b y s ide a t M . I . T . , w e have been s t ruck by the difference in p resen ta t ion and in many c a s e s by the s i m i l a r i t y in p r e s e n t a t i o n which a r e obtained f rom t h e s e r a d a r s . The S C R - 6 l 5 B h a s a t h r ee -deg ree beam width that tends to broaden s m a l l p r e c i p i t a t i o n c e l l s d e t e c t e d a t a g iven r a n g e ; the b e t t e r performance of the CPS-9 resu l t s in the p r e s en ta t ion of a c e l l of about the s a m e s i z e b e c a u s e , although it has a one-degree b e a m width, i t is s e e ing the l ighter r a i n which cannot be de tec ted by the S C R - 6 1 5 B . One thing tha t we have b e e n t roub led wi th (which is going to be an ope ra t i ona l p rob l em) i s t ha t the C P S - 9 s e e s too much r a i n ! I t i s going to p r e s e n t a c o n s i d e r a b l e p r o b l e m in the i n t e r p r e t a t i o n of t h e s y n o p t i c p i c t u r e in t h a t you a r e going to find a good many o p e r a t o r s running a se t wi th the ga in s e t t i n g s so h igh as to wipe out i m p o r t a n t f e a t u r e s of the heavy r a in f a l l wi th the e x -
1R. Wexler, "Radar Detection of a Frontal Storm, June 18, 1946," J. Meteorology, pp. 38-44, Feb. 1947.
t raneous detai l f rom the weak ra infa l l . The C P S - 9 performs beautifully by vir tue of its resolving power and s h o r t wave l eng th , but s o m e t i m e s i t j u s t s e e s too much, and you a r e jus t confused by the p i c t u r e . The t e n - c e n t i m e t e r equipment could have been (and h a s been) c o n s i d e r a b l y improved , keeping in m i n d that the SCR-615 was designed pe rhaps back in 1941 or 1942 and nobody h a s r e a l l y put v e r y much m o r e work in on i t s ince . I t has roughly t h r e e t i m e s the power output of the CPS-9 , and this could have been i n c r e a s e d a p p r e c i a b l y . I would like to say tha t we a r e going to be t r o u b l e d by s ee ing t h i s v e r y l ight ra in at close range ; i t is going to complicate t h i n g s . Often you a r e not going to know w h e t h e r i t i s r a i n or cloud tha t i s be ing d e t ec t ed .
D . M . S W I N G L E . —The C P S - 9 i s p r e s u m e d to be run by i n t e l l i g e n t o p e r a t o r s . I t i s p rov ided with both gain and s e n s i t i v i t y - t i m e - c o n t r o l s . Th i s would take out the l ight r a in if i t b o t h e r s one.
F . C . W H I T E . —I would l ike to add an a m e n t o M r . J o r g e n s e n ' s c o m m e n t t h e r e wi th r e g a r d t o the o t h e r u s e s of r a d a r , s p e a k i n g fo r one of the o rgan iza t ions tha t would like to use r a d a r . I p e r s o n a l l y fly wi th L t . M o n t g o m e r y h e r e . Once we flew 12 minutes in a t hunde r s to rm at 140 knots when the r ada r told me tha t i t ended 3 m i l e s to the o the r s ide of u s . P e r s o n a l l y , I do not want to do it any m o r e .
G. E. S T O U T . 2 - - T h i s s u m m e r we had an a r e a where the re was heavy ra infal l ( g r e a t e r than 1 inch p e r h o u r ) for 50 m i l e s ' d e p t h , and a l l the 3 c m . r a d a r (APS-15) showed was the f i rs t 10 m i l e s of i t . Within a 2 0 0 - m i l e r a d i u s t h e s e heavy s t o r m s wil l o c c u r a b o u t e i g h t o r t e n t i m e s a s u m m e r in the midwes t a r e a .
E. F. HILL. 3 — I would jus t like to say tha t we have an exce l len t co l lec t ion of h i g h - p o w e r e d c o m p o n e n t s o n t h e s l i g h t l y l e s s than s i x - c e n t i m e t e r b a n d .
2Meteorologist , State Water Survey, Urbana, 111. 3 Elect ronics P ro jec t Engineer , Glenn L. Martin
Co . , Bal t imore, Maryland.
WITH DISCUSSIONS BY D. C. BLANCHARD, M. H. LIGDA, J. S. MARSHALL, R. WEXLER
( S u m m a r y ) *
The obse rva t i ons of the r a d a r upper band a r e briefly reviewed. The growth of graupel in a s u p e r c o o l e d w a t e r c loud i s a n a l y z e d . T h e r e e x i s t s a
1Research Meteorologist, Mt. Washington Observatory, 102 Mt. Auburn St. , Cambridge, Massachuset ts .
*The complete article will be published in the Quarterly Journal of the Royal Meteorological Society.
D . C . B L A N C H A R D . * — C a n you g ive m o r e i n f o r m a t i o n c o n c e r n i n g t h e c o l l e c t i o n e f f ic iency that you used in your ca l cu la t ions?
R . WEXLER. —The col lec t ion ef f ic iencies for s p h e r e , cy l inders and r ibbons have been computed by L a n g m u i r a n d B l o d g e t t . The c o l l e c t i o n effic iency for a c i r c u l a r d i sc , to which a snow c r y s t a l can be app rox ima ted , m a y be deduced by c o m p a r ing v a l u e s for s p h e r e , c y l i n d e r and r i b b o n . F o r v iscous flow it is e s t ima t ed that a c ry s t a l of r a d i u s 75 m i c r o n s and th ickness 15 m i c r o n s has a c o l l e c t ion efficiency of m o r e than 50% on d rop l e t s of 10-m i c r o n r a d i u s . The co l l ec t ion eff ic iency of den dr i t i c crystals of radius approaching 1 m m . is m u c h l e s s .
*Meteorologist , Woods Hole Oceanographic Ins . ; Woods Hole, Massachuse t t s .
c r i t ica l value of the liquid water content below which c ry s t a l growth by diffusion p redomina ted and above which the c r y s t a l c o n v e r t s into g r a u p e l o f q u a s i -s p h e r i c a l shape. The growth of a l aye r of g r a u p e l and the subsequent depletion of the cloud liquid w a t e r con ten t be low the c r i t i c a l va lue is capab le of e x p l a i n i n g the o b s e r v a t i o n s p e r t a i n i n g to the upper band .
M. H. LIGDA. —Can you give a l i t t le m o r e d e t a i l a s t o how you c o n c l u d e d t h a t t h e u p p e r band w a s no t due t o wind s h e a r ?
R . W E X L E R . - - B o w e n ' s o b s e r v a t i o n s w e r e m a d e wi th a P P I w h i c h s c a n n e d f r o m h o r i z o n to h o r i z o n a long the v e r t i c a l . The uppe r band c e r t a in ly looked h o r i z o n t a l in h i s m o t i o n p i c t u r e s of the phenomenon. I t was e s t ima ted by D r . M a r s h a l l and myself that a wind shea r of more than 150 m i l e s pe r hour in a height i n t e rva l of 1 km. would be r e qu i r ed to give the a p p e a r a n c e of a h o r i z o n t a l band.
J . S . M A R S H A L L . — T h i s p a p e r shows what h a p p e n s when a p e r f e c t l y innocent w e a t h e r - r a d a r r e s e a r c h e r studies cloud physics in England for two y e a r s . He r e t u r n s ta lk ing about dendr i t i c g rowth , sp l in te r ing and chain r e a c t i o n s !
283
THEORY OF THE RADAR UPPER BAND
BY RAYMOND WEXLER1
DISCUSSION
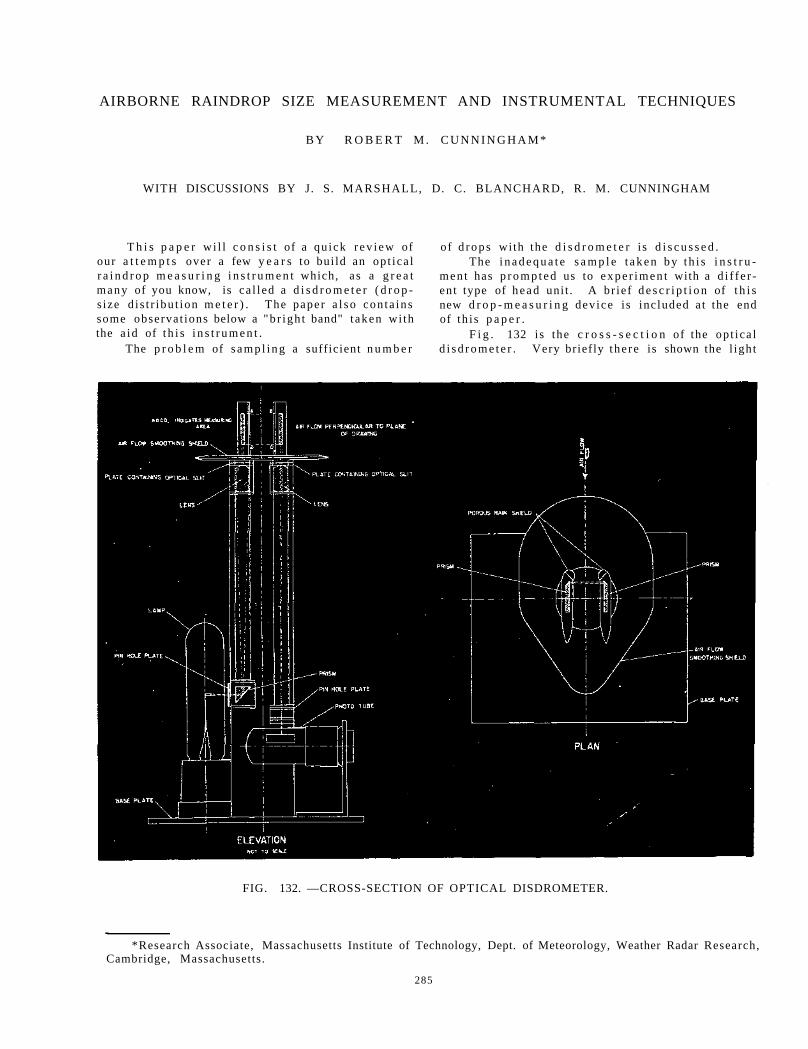
B Y R O B E R T M . C U N N I N G H A M *
WITH DISCUSSIONS BY J. S. MARSHALL, D. C. BLANCHARD, R. M. CUNNINGHAM
T h i s p a p e r wi l l c o n s i s t of a qu ick r e v i e w of our a t t e m p t s over a few y e a r s to bui ld an op t ica l r a i n d r o p m e a s u r i n g i n s t r u m e n t which, a s a g r e a t many of you know, is ca l led a d i s d r o m e t e r ( d r o p -s ize d i s t r ibu t ion m e t e r ) . The paper a l s o con ta ins some observat ions below a "b r igh t band" t aken wi th the a id of t h i s i n s t r u m e n t .
The p r o b l e m of s a m p l i n g a sufficient n u m b e r
of d r o p s wi th the d i s d r o m e t e r i s d i s c u s s e d . The i n a d e q u a t e s a m p l e t a k e n by t h i s i n s t r u
men t has p r o m p t e d us to e x p e r i m e n t with a d i f f e r ent type of h e a d uni t . A br ie f d e s c r i p t i o n of t h i s new d r o p - m e a s u r i n g dev ice i s inc luded a t the end of th i s p a p e r .
F i g . 132 is the c r o s s - s e c t i o n of the op t ica l d i s d r o m e t e r . Very briefly the re is shown the l ight
FIG. 132. —CROSS-SECTION OF OPTICAL DISDROMETER.
*Research Associate, Massachusetts Institute of Technology, Dept. of Meteorology, Weather Radar Research, Cambridge, Massachusetts.
285
AIRBORNE RAINDROP SIZE MEASUREMENT AND INSTRUMENTAL TECHNIQUES
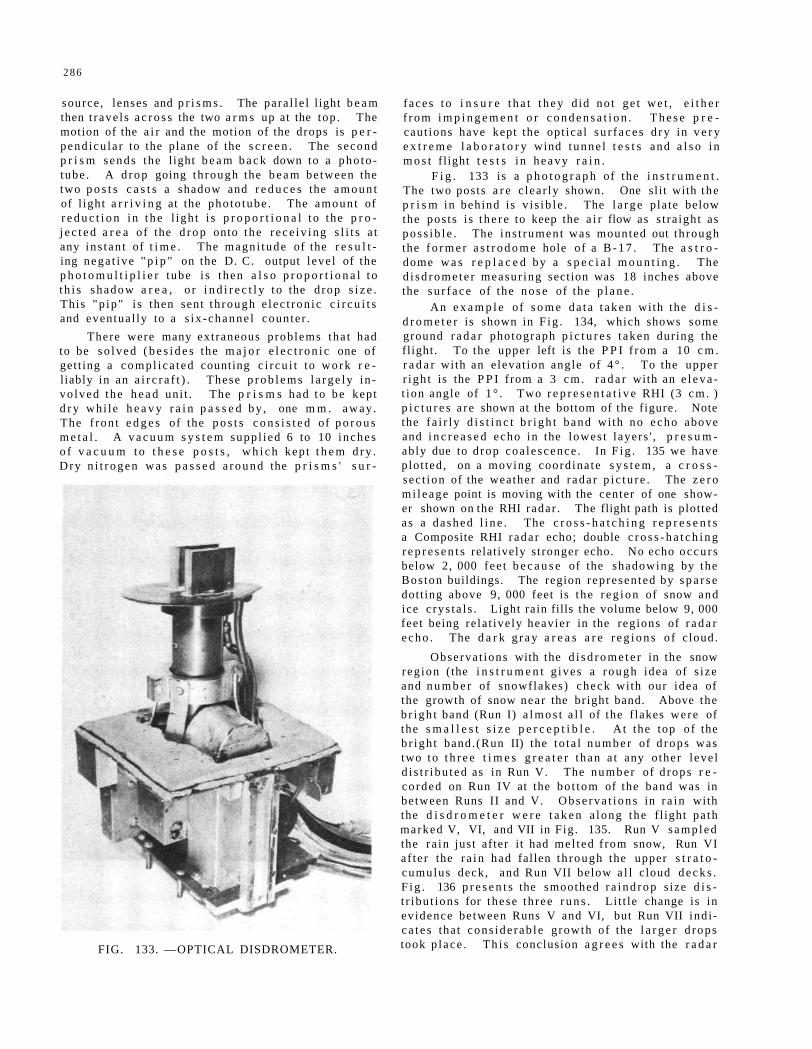
286
source , lenses and p r i s m s . The para l le l l ight b e a m then t r ave l s a c r o s s the two a r m s up at the top . The motion of the a i r and the motion of the drops is p e r pend icu la r to the plane of the s c r e e n . The second p r i s m sends the l ight b e a m b a c k down to a pho to tube . A d rop going th rough the b e a m be tween the two p o s t s c a s t s a shadow and r e d u c e s the a m o u n t of l ight a r r i v i n g at the pho to tube . The amoun t of r e d u c t i o n i n t h e l igh t i s p r o p o r t i o n a l t o the p r o j e c t e d a r e a o f the d r o p onto the r ece iv ing s l i t s a t any ins t an t of t i m e . The magn i tude of the r e s u l t ing nega t ive " p i p " on the D. C. output l eve l of the p h o t o m u l t i p l i e r tube i s then a l s o p r o p o r t i o n a l t o t h i s shadow a r e a , o r i n d i r e c t l y t o the d rop s i z e . This "p ip" i s then sent t h rough e l ec t ron ic c i r c u i t s and eventual ly to a s ix -channe l counter .
There were many extraneous problems tha t had to be so lved ( b e s i d e s the m a j o r e l e c t r o n i c one of get t ing a compl i ca t ed counting c i r cu i t to work r e liably in an a i r c r a f t ) . These p r o b l e m s l a r g e l y in vo lved the h e a d uni t . The p r i s m s had to be kept d r y whi le h e a v y r a i n p a s s e d b y , one m m . away . The f ron t e d g e s of the p o s t s c o n s i s t e d of p o r o u s m e t a l . A v a c u u m s y s t e m supp l ied 6 to 10 inches o f v a c u u m t o t h e s e p o s t s , w h i c h kep t t h e m d r y . Dry n i t r o g e n was p a s s e d a r o u n d the p r i s m s ' s u r -
FIG. 133. —OPTICAL DISDROMETER.
faces t o i n s u r e t h a t t h e y d id no t ge t w e t , e i t h e r f r o m i m p i n g e m e n t o r c o n d e n s a t i o n . T h e s e p r e caut ions have kept the opt ica l s u r f a c e s d r y in v e r y e x t r e m e l a b o r a t o r y wind t unne l t e s t s and a l s o i n m o s t fl ight t e s t s i n h e a v y r a i n .
F i g . 133 is a p h o t o g r a p h of the i n s t r u m e n t . The two posts a r e c lear ly shown. One sl i t with the p r i s m in behind i s v i s ib l e . The l a r g e pla te below the pos t s is t h e r e to keep the a i r flow as s t ra ight as p o s s i b l e . The ins t rument was mounted out th rough the f o r m e r a s t r o d o m e hole of a B - 1 7 . The a s t r o dome w a s r e p l a c e d by a s p e c i a l m o u n t i n g . The d i s d r o m e t e r measur ing section was 18 inches above the s u r f a c e of the n o s e of the p l a n e .
An e x a m p l e of s o m e da t a t a k e n with the d i s d r o m e t e r is shown in F ig . 134, which shows some ground r a d a r photograph p i c t u r e s t aken during the fl ight. To the upper left is the P P I f rom a 10 c m . r a d a r with an e levat ion angle of 4 ° . To the upper r igh t is the P P I from a 3 cm. r a d a r with an e l e v a t ion angle of 1 ° . Two r e p r e s e n t a t i v e RHI (3 c m . ) p i c t u r e s a re shown at the bottom of the figure. Note the f a i r l y d i s t i n c t b r i g h t band wi th no echo above and i n c r e a s e d echo in the lowes t l ayers ' , p r e s u m ably due to d rop coa le scence . In F i g . 135 we have plot ted , on a moving coord ina te s y s t e m , a c r o s s -sec t ion of the weather and r ada r p i c t u r e . The z e r o mi l eage point is moving with the center of one shower shown on the RHI radar . The flight path is plotted as a dashed l i n e . The c r o s s - h a t c h i n g r e p r e s e n t s a Composite RHI r ada r echo; double c r o s s - h a t c h i n g r e p r e s e n t s relatively s t ronger echo. No echo occu r s below 2, 000 fee t b e c a u s e of the shadowing by the Bos ton buildings. The region represen ted by s p a r s e dott ing above 9, 000 feet is the r e g i o n of snow and ice c rys t a l s . Light rain fills the volume below 9, 000 feet being re la t ive ly heavier in the regions of r a d a r e cho . The d a r k g r a y a r e a s a r e r e g i o n s o f c loud.
Observa t ions with the d i s d r o m e t e r in the snow reg ion (the i n s t r u m e n t g ives a r o u g h idea of s ize and n u m b e r of snowflakes) check with our idea of the growth of snow near the br ight band. Above the b r i g h t band (Run I) a l m o s t a l l of the f lakes were of the s m a l l e s t s i z e p e r c e p t i b l e . At the top of the b r igh t band.(Run II) the to t a l n u m b e r of d r o p s was two to t h r e e t i m e s g r e a t e r than a t any other leve l d i s t r i bu t ed as in Run V. The number of d rops r e co rded on Run IV at the bo t tom of the band was in be tween Runs II and V. O b s e r v a t i o n s in r a i n with the d i s d r o m e t e r w e r e t a k e n a long the f l ight pa th marked V, VI, and VII in F ig . 135. Run V s a m p l e d the r a in just after i t had mel ted f rom snow, Run VI a f te r the r a i n had fallen th rough the upper s t r a t o -cumulus deck, and Run VII below a l l cloud d e c k s . F i g . 136 p r e s e n t s the smoothed r a i n d r o p s ize d i s t r ibu t ions for these th ree r u n s . Li t t le change is in ev idence between Runs V and VI, but Run VII ind i c a t e s that cons ide rab le growth of the l a r g e r d rops took p l ace . Th i s conclusion a g r e e s with the r a d a r
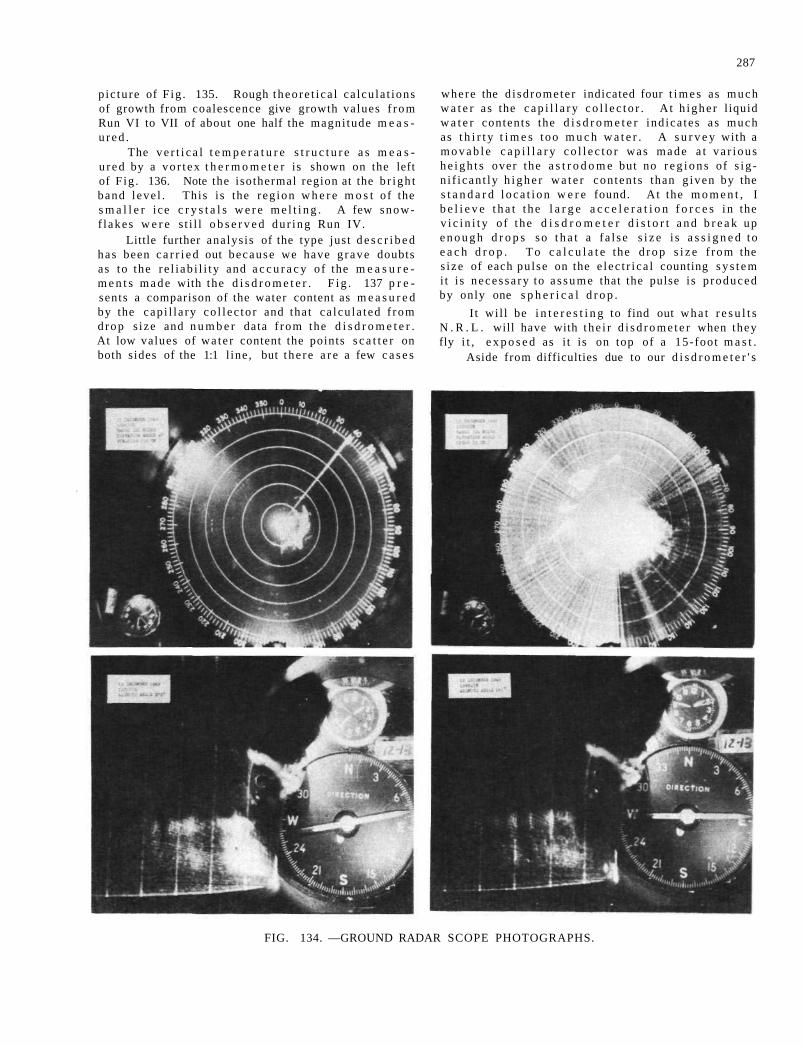
287
pic tu re of F ig . 135. Rough theo re t i ca l ca lcu la t ions of growth from coalescence give growth values f r o m Run VI to VII of about one half the magni tude m e a s u r e d .
The v e r t i c a l t e m p e r a t u r e s t r u c t u r e a s m e a s u r e d by a vo r t ex t h e r m o m e t e r is shown on the left of F ig . 136. Note the isothermal region at the b r igh t band l eve l . This i s the r eg ion w h e r e m o s t of the s m a l l e r ice c r y s t a l s w e r e m e l t i n g . A few snow-f lakes w e r e s t i l l o b s e r v e d du r ing Run IV.
Little further analys is of the type just d e s c r i b e d has been c a r r i e d out because we have g rave doubts as to the r e l i ab i l i t y and a c c u r a c y of the m e a s u r e m e n t s m a d e with the d i s d r o m e t e r . F i g . 137 p r e sents a comparison of the water content as m e a s u r e d by the cap i l l a ry co l l ec to r and that ca lcu la ted f rom d rop s ize and n u m b e r data f rom the d i s d r o m e t e r . At low values of wa te r content the points s c a t t e r on both sides of the 1:1 l ine , but t he r e a r e a few c a s e s
where the d i sd romete r indicated four t i m e s as m u c h w a t e r as the c a p i l l a r y c o l l e c t o r . At h ighe r l iquid w a t e r contents the d i s d r o m e t e r ind ica tes a s much as t h i r t y t i m e s too m u c h w a t e r . A s u r v e y with a m o v a b l e c a p i l l a r y c o l l e c t o r was m a d e a t v a r i o u s h e i g h t s over the a s t r o d o m e but no r e g i o n s of s i g n i f i can t ly h i g h e r w a t e r con ten t s than g iven by the s t a n d a r d l o c a t i o n w e r e found. At the m o m e n t , I b e l i e v e t h a t t h e l a r g e a c c e l e r a t i o n f o r c e s i n the v i c i n i t y o f the d i s d r o m e t e r d i s t o r t a n d b r e a k up e n o u g h d r o p s so t h a t a f a l s e s i z e i s a s s i g n e d to e a c h d r o p . T o c a l c u l a t e the d r o p s i z e f rom the s i ze of each pu lse on the e l ec t r i ca l counting s y s t e m i t i s neces sa ry to a s s u m e that the pulse i s p roduced by only one s p h e r i c a l d r o p .
I t wi l l be i n t e r e s t i n g to find out w h a t r e s u l t s N . R . L . will have with t he i r d i s d r o m e t e r when they fly i t , e x p o s e d as i t is on top of a 15-foot m a s t .
Aside from difficulties due to our d i s d r o m e t e r ' s
FIG. 134. —GROUND RADAR SCOPE PHOTOGRAPHS.
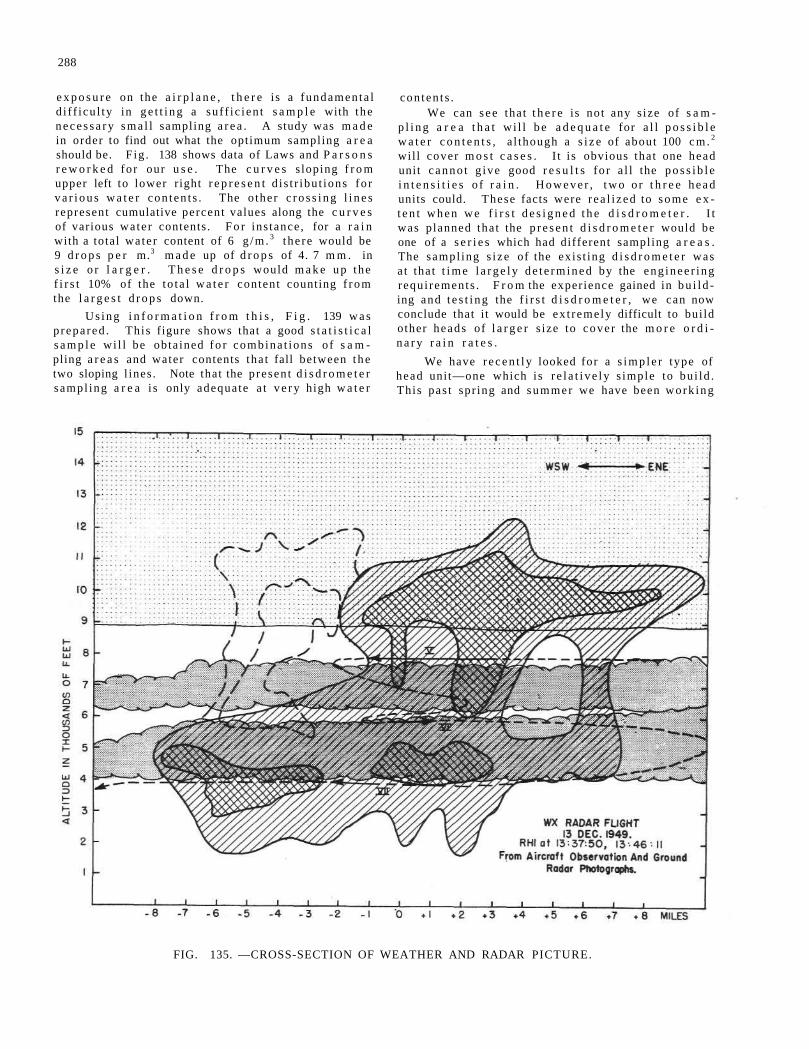
288
e x p o s u r e on the a i r p l a n e , t h e r e is a fundamenta l d i f f i cu l ty in g e t t i n g a su f f i c ien t s a m p l e with the n e c e s s a r y s m a l l sampling a r e a . A study was m a d e in order to find out what the optimum sampling a r e a should be. F ig . 138 shows data of Laws and P a r s o n s r e w o r k e d for our u s e . The c u r v e s s loping f r o m upper left to lower right r e p r e s e n t d i s t r ibu t ions fo r v a r i o u s w a t e r con ten t s . The o ther c r o s s i n g l i n e s represent cumulative percent values along the c u r v e s of various wate r contents. F o r ins tance , for a r a i n with a total wa te r content of 6 g /m . 3 t he re would be 9 d r o p s p e r m.3 m a d e up of d r o p s of 4. 7 m m . in s i z e o r l a r g e r . T h e s e d r o p s would m a k e u p the f i r s t 10% of the to t a l w a t e r content counting f r o m the l a r g e s t d r o p s down.
Us ing i n f o r m a t i o n f r o m t h i s , F i g . 139 w a s p repa red . This figure shows that a good s t a t i s t i c a l s a m p l e wi l l be obta ined f o r combina t ions of s a m pling a r e a s and water contents tha t fall between t h e two sloping l ines . Note that the p resen t d i s d r o m e t e r sampl ing a r e a i s only adequate a t v e r y high w a t e r
con ten t s . We can s e e that t h e r e is not any s ize of s a m
p l i n g a r e a t h a t wi l l b e a d e q u a t e for a l l p o s s i b l e w a t e r c o n t e n t s , a l though a s i z e of about 100 c m . 2
will cover m o s t c a s e s . I t i s obvious that one head unit c anno t g ive good r e s u l t s fo r a l l the p o s s i b l e i n t e n s i t i e s o f r a i n . H o w e v e r , t w o o r t h r e e h e a d units could. These facts were r ea l i zed to s o m e e x t e n t w h e n we f i r s t d e s i g n e d t h e d i s d r o m e t e r . I t was planned tha t the p r e s e n t d i s d r o m e t e r would be one of a s e r i e s which had different sampling a r e a s . The sampl ing s i ze of the exis t ing d i s d r o m e t e r was a t tha t t i m e l a r g e l y d e t e r m i n e d by the eng inee r ing requ i rements . F r o m the experience gained in b u i l d ing and t e s t i n g the f i r s t d i s d r o m e t e r , we can now conclude that it would be ex t remely difficult to bui ld other heads of l a r g e r s ize to cove r the m o r e o r d i n a r y r a i n r a t e s .
We have r e c e n t l y looked for a s i m p l e r type of head unit—one which i s r e l a t i v e l y s imple to bu i ld . This pas t spr ing and summer we have been work ing
FIG. 135. —CROSS-SECTION OF WEATHER AND RADAR PICTURE.
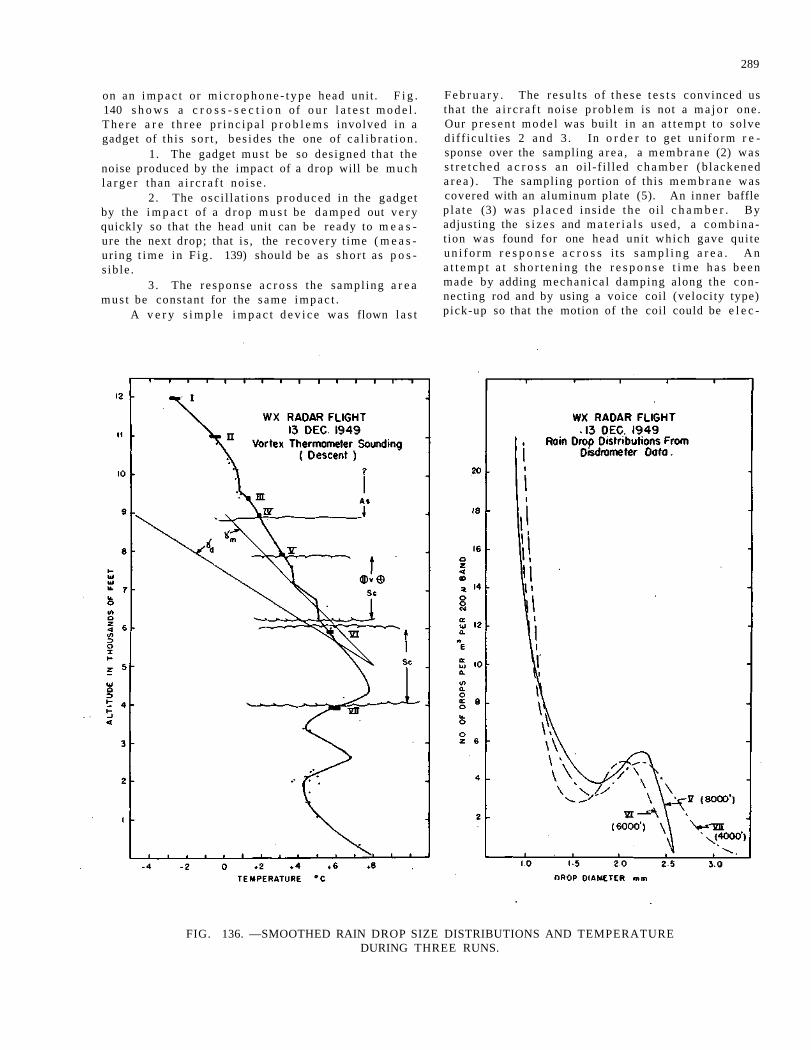
289
on an i m p a c t or m i c r o p h o n e - t y p e head unit . F i g . 140 s h o w s a c r o s s - s e c t i o n of o u r l a t e s t m o d e l . T h e r e a r e t h r e e p r i n c i p a l p r o b l e m s involved in a gadget of th is so r t , bes ides the one of c a l i b r a t i o n .
1. The gadget mus t be so des igned tha t the noise produced by the impact of a drop will be m u c h l a r g e r than a i r c r a f t no i s e .
2. The osc i l la t ions p roduced in the gadget by the i m p a c t of a d r o p m u s t be d a m p e d out v e r y quickly so that the head unit can be ready to m e a s ure the next drop; that i s , the r ecove ry t ime ( m e a s ur ing t i m e in F i g . 139) should be as sho r t as p o s s ib le .
3 . The r e sponse a c r o s s the sampl ing a r e a m u s t be constant for the same i m p a c t .
A v e r y s i m p l e i m p a c t d e v i c e was flown l a s t
F e b r u a r y . The r e su l t s of t he se t e s t s convinced us that the a i r c r a f t noise p r o b l e m is not a m a j o r one. Our p r e s e n t m o d e l was built in an a t t emp t to so lve d i f f icu l t ies 2 and 3 . In o r d e r to ge t un i fo rm r e sponse over the sampling a r ea , a m e m b r a n e (2) was s t r e t c h e d a c r o s s an oi l - f i l led c h a m b e r (b lackened a r e a ) . The sampling portion of this m e m b r a n e was covered with an aluminum plate (5). An inner baffle p l a t e (3) was p l a c e d ins ide t h e oi l c h a m b e r . By adjusting the s i z e s and m a t e r i a l s used, a c o m b i n a t ion was found for one head unit which gave qui te u n i f o r m r e s p o n s e a c r o s s i t s s a m p l i n g a r e a . A n a t t e m p t a t s h o r t e n i n g the r e s p o n s e t i m e h a s b e e n made by adding mechan ica l damping along the connecting rod and by using a voice coil (velocity type) pick-up so that the motion of the coil could be e l e c -
FIG. 136. —SMOOTHED RAIN DROP SIZE DISTRIBUTIONS AND TEMPERATURE DURING THREE RUNS.
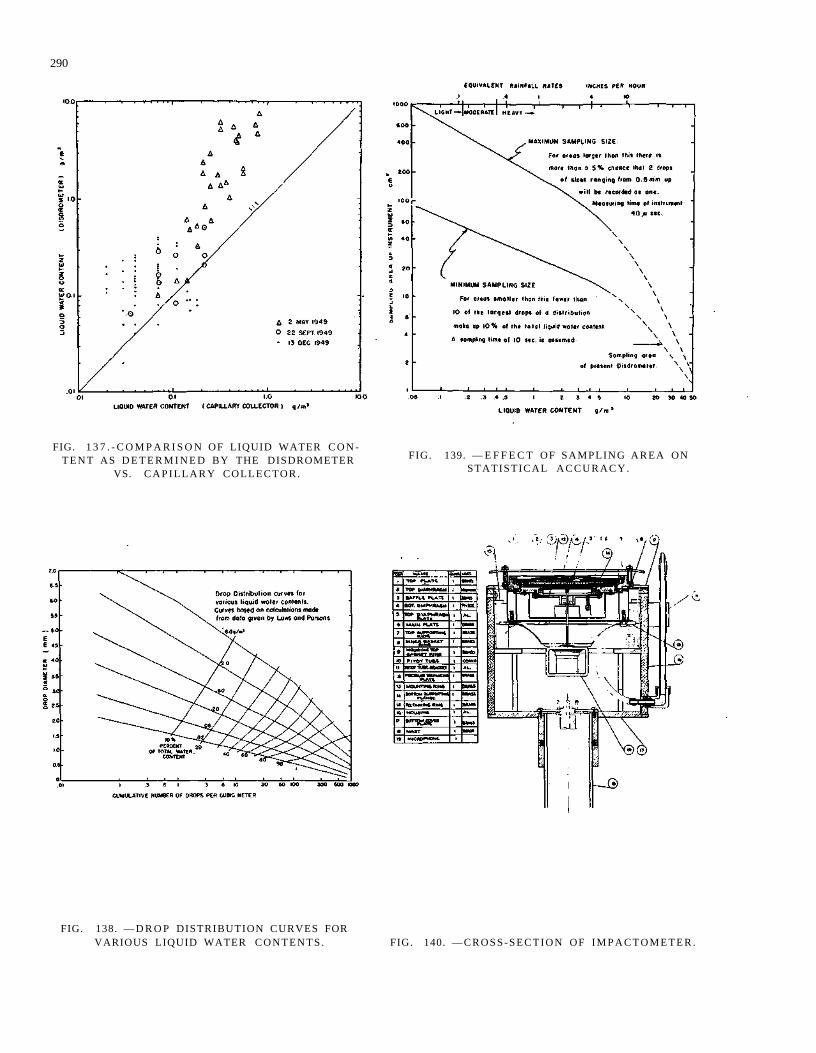
290
FIG. 1 3 7 . - C O M P A R I S O N OF LIQUID WATER C O N T E N T AS D E T E R M I N E D BY THE DISDROMETER
VS. C A P I L L A R Y COLLECTOR.
FIG. 138. — D R O P DISTRIBUTION CURVES FOR VARIOUS LIQUID WATER C O N T E N T S .
FIG. 139. — E F F E C T OF SAMPLING A R E A ON STATISTICAL A C C U R A C Y .
FIG. 140. — C R O S S - S E C T I O N OF I M P A C T O M E T E R .
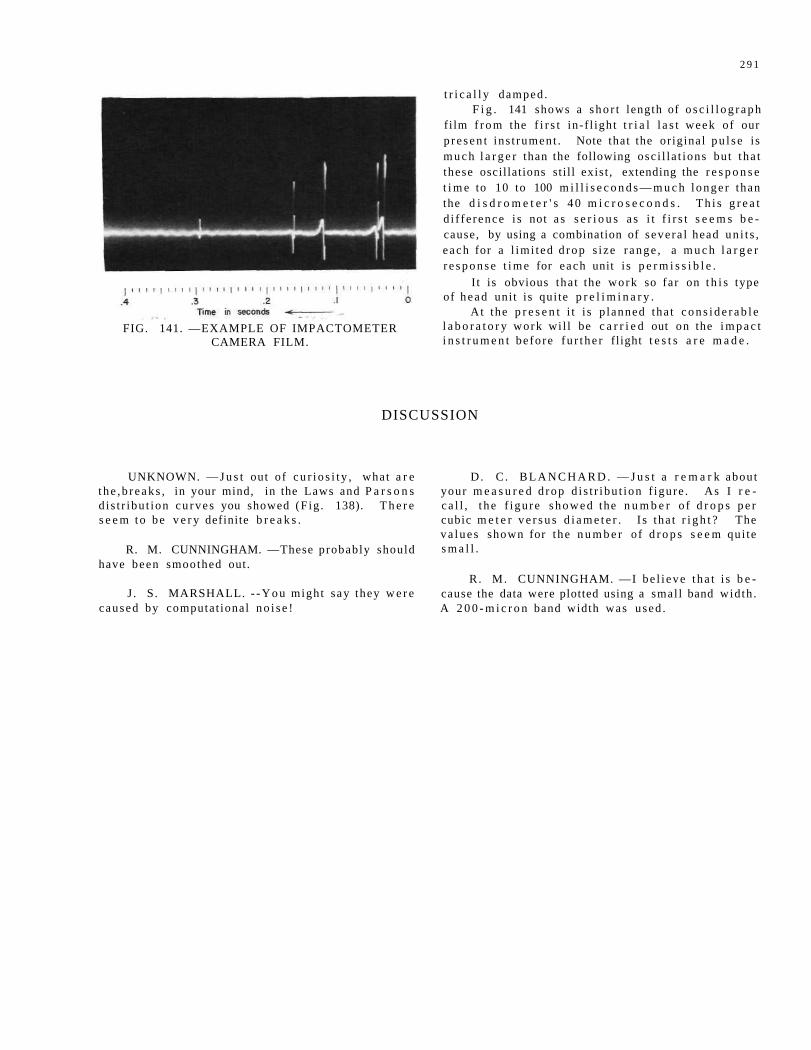
2 9 1
FIG. 141. —EXAMPLE OF IMPACTOMETER CAMERA FILM.
t r i c a l l y damped . F i g . 141 shows a s h o r t length of o s c i l l o g r a p h
fi lm f r o m the f i r s t in- f l ight t r i a l l a s t week of our p r e s e n t ins t rument . Note that the or iginal p u l s e is m u c h l a r g e r than the following osc i l l a t ions but tha t these oscillations sti l l exist , extending the r e s p o n s e t i m e to 10 to 100 m i l l i s e c o n d s — m u c h longe r than the d i s d r o m e t e r ' s 4 0 m i c r o s e c o n d s . T h i s g r e a t d i f f e rence i s not a s s e r i o u s a s i t f i r s t s e e m s b e cause, by using a combination of severa l head un i t s , e ach for a l imi ted d rop s i ze r ange , a m u c h l a r g e r r e s p o n s e t i m e for each unit i s p e r m i s s i b l e .
I t is obvious tha t the work so far on t h i s type of h e a d unit is qui te p r e l i m i n a r y .
At the p r e s e n t i t i s p lanned tha t c o n s i d e r a b l e l a b o r a t o r y work wil l be c a r r i e d out on the i m p a c t i n s t r u m e n t be fore f u r t h e r flight t e s t s a r e m a d e .
DISCUSSION
UNKNOWN. — J u s t out of c u r i o s i t y , what a r e t h e , b r e a k s , in your mind, in the Laws and P a r s o n s d i s t r ibu t ion c u r v e s you showed (F ig . 138). T h e r e s e e m to be v e r y definite b r e a k s .
R. M. CUNNINGHAM. —These probably should have been smoothed out.
J . S . MARSHALL. - - Y o u might say they w e r e caused by computat ional n o i s e !
D . C . B L A N C H A R D . — J u s t a r e m a r k about your m e a s u r e d d rop d i s t r ibu t ion f igure . As I r e c a l l , t h e f igu re s h o w e d the n u m b e r o f d r o p s p e r cubic m e t e r v e r s u s d i a m e t e r . I s tha t r i g h t ? The v a l u e s shown for the n u m b e r of d r o p s s e e m qui te s m a l l .
R . M. CUNNINGHAM. —I be l i eve t ha t i s b e cause the data were plotted using a smal l band width . A 2 0 0 - m i c r o n band width was used .
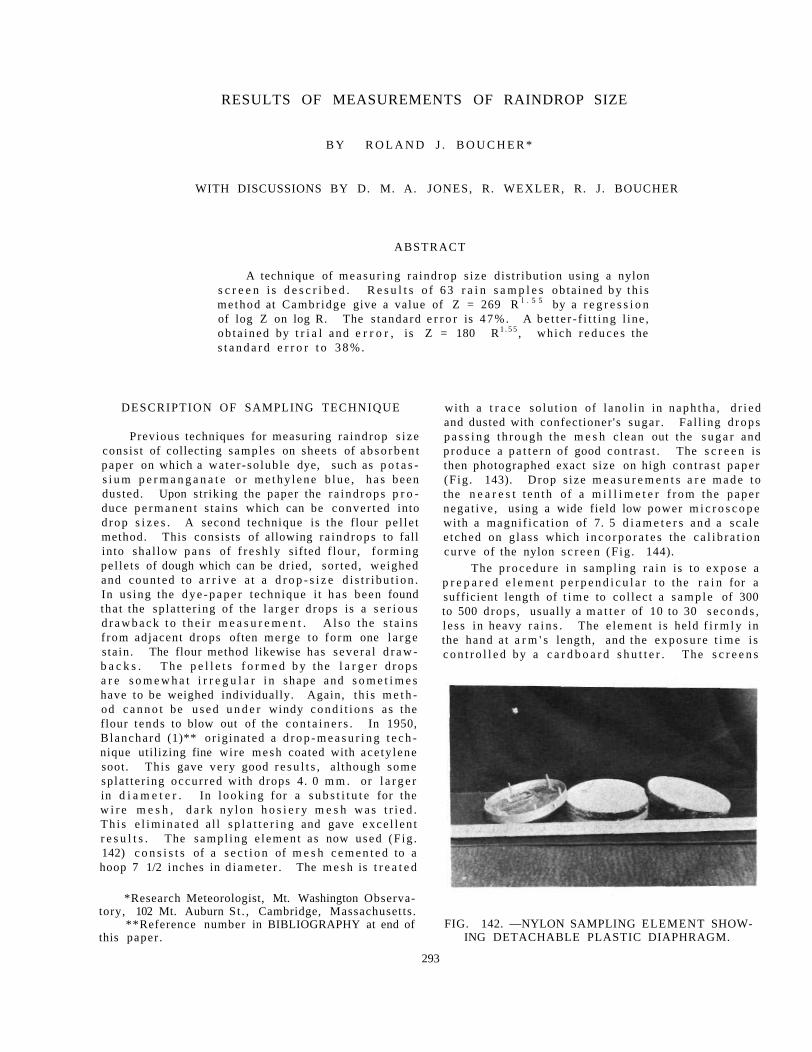
WITH DISCUSSIONS BY D. M. A. JONES, R. WEXLER, R. J . BOUCHER
ABSTRACT
A technique of m e a s u r i n g ra indrop s ize dis t r ibut ion using a nylon s c r e e n i s d e s c r i b e d . R e s u l t s o f 63 r a i n s a m p l e s ob ta ined by t h i s me thod at Cambr idge give a value of Z = 269 R l . 5 5 by a r e g r e s s i o n of log Z on log R. The s t andard e r r o r is 4 7 % . A be t t e r - f i t t i ng l ine , o b t a i n e d by t r i a l and e r r o r , is Z = 180 R 1 . 5 5 , which r e d u c e s the s t a n d a r d e r r o r t o 3 8 % .
DESCRIPTION OF SAMPLING TECHNIQUE
Previous techniques for measuring ra indrop s i z e consis t of collecting samples on sheets of a b s o r b e n t paper on which a wate r - so lub le dye, such as p o t a s s i u m p e r m a n g a n a t e o r m e t h y l e n e b l u e , h a s been dusted. Upon str iking the paper the r a i n d r o p s p r o duce p e r m a n e n t s ta ins which can be conver ted into d rop s i z e s . A second technique is the flour pe l le t method. This consis ts of allowing r a ind rops to fall into sha l low p a n s of f r e s h l y sifted f lour , fo rming pel le ts of dough which can be dried, sor ted , weighed and counted to a r r i v e a t a d r o p - s i z e d i s t r i b u t i o n . In us ing the d y e - p a p e r technique i t h a s been found tha t the spla t ter ing of the l a r g e r d rops is a s e r i o u s d r a w b a c k t o t h e i r m e a s u r e m e n t . A l s o the s t a in s f rom adjacent drops often merge to form one l a r g e s ta in . The flour method likewise has seve ra l d r a w b a c k s . T h e p e l l e t s f o r m e d b y the l a r g e r d r o p s a r e s o m e w h a t i r r e g u l a r i n shape and s o m e t i m e s have to be weighed individually. Again, th i s m e t h od c a n n o t be u s e d u n d e r windy c o n d i t i o n s as the flour t ends to blow out of the c o n t a i n e r s . In 1950, B lanchard (1)** or ig inated a d r o p - m e a s u r i n g t e c h nique utilizing fine wire m e s h coated with ace ty lene soot. This gave ve ry good r e s u l t s , a l though some sp la t te r ing occur red with drops 4. 0 m m . or l a r g e r in d i a m e t e r . In l o o k i n g for a s u b s t i t u t e for the w i r e m e s h , d a r k n y l o n h o s i e r y m e s h w a s t r i e d . Th i s e l i m i n a t e d al l s p l a t t e r i n g and gave exce l l en t r e s u l t s . The sampl ing e l emen t as now used (F ig . 142) c o n s i s t s of a s e c t i o n of m e s h c e m e n t e d to a hoop 7 1/2 inches in d i ame te r . The m e s h is t r e a t e d
*Research Meteorologist, Mt. Washington Observatory, 102 Mt. Auburn S t . , Cambridge, Massachusetts .
**Reference number in BIBLIOGRAPHY at end of this paper .
with a t r a c e so lu t ion of lanol in in naph tha , d r i e d and dusted with confectioner 's sugar . Fa l l ing d r o p s p a s s i n g th rough the m e s h c lean out the s u g a r and p roduce a p a t t e r n of good c o n t r a s t . The s c r e e n is then photographed exact s ize on high con t r a s t pape r (F ig . 143). Drop s ize m e a s u r e m e n t s a r e m a d e to the n e a r e s t t en th of a m i l l i m e t e r f r o m the pape r nega t ive , using a wide field low power m i c r o s c o p e with a magni f ica t ion of 7. 5 d i a m e t e r s and a sca le e tched on g lass which i n c o r p o r a t e s the c a l i b r a t i o n curve of the nylon s c r e e n (F ig . 144).
The p rocedu re in sampl ing r a i n is to expose a p r e p a r e d e l e m e n t p e r p e n d i c u l a r to the r a i n for a sufficient length of t i m e to col lec t a s a m p l e of 300 to 500 d rops , usually a m a t t e r of 10 to 30 s e c o n d s , l e s s in heavy r a i n s . The e l emen t is held f i r m l y in the hand a t a r m ' s length, and the exposu re t i m e i s c o n t r o l l e d by a c a r d b o a r d s h u t t e r . The s c r e e n s
FIG. 142. —NYLON SAMPLING ELEMENT SHOWING DETACHABLE PLASTIC DIAPHRAGM.
293
RESULTS OF MEASUREMENTS OF RAINDROP SIZE
B Y R O L A N D J . B O U C H E R *
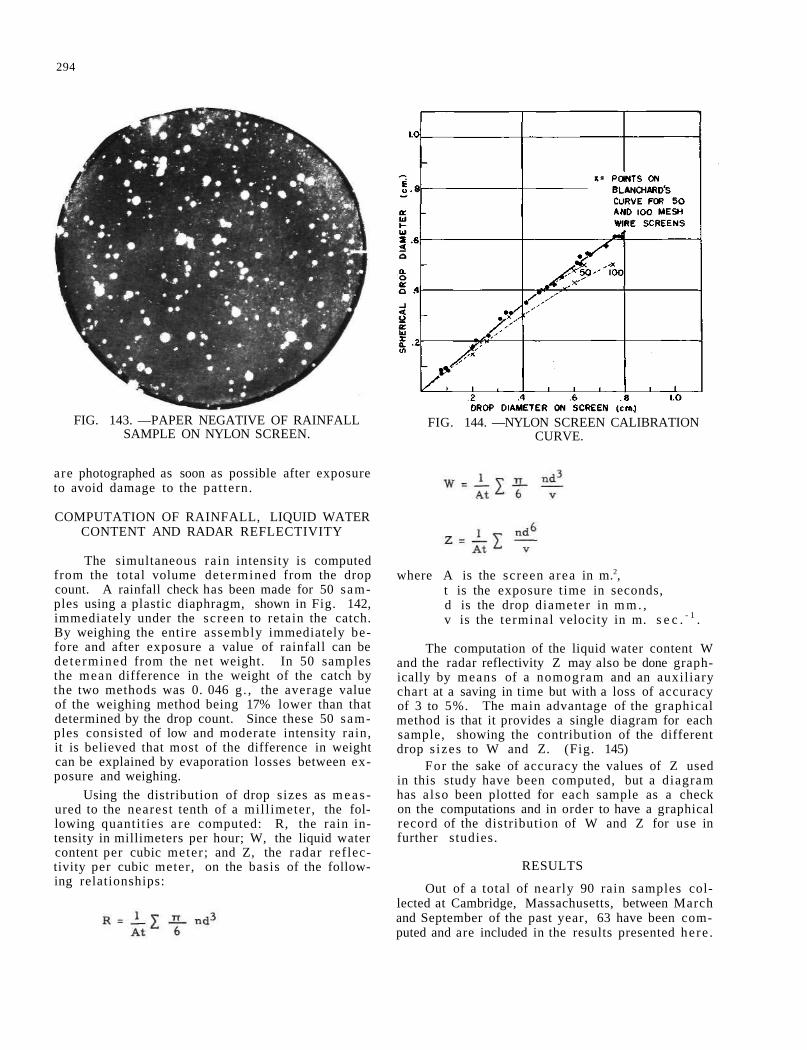
294
FIG. 143. —PAPER NEGATIVE OF RAINFALL SAMPLE ON NYLON SCREEN.
are photographed as soon as possible after exposure to avoid damage to the pat tern.
COMPUTATION OF RAINFALL, LIQUID WATER CONTENT AND RADAR REFLECTIVITY
The simultaneous ra in intensity is computed from the total volume determined from the drop count. A rainfall check has been made for 50 samples using a plastic diaphragm, shown in Fig. 142, immediately under the screen to retain the catch. By weighing the entire assembly immediately before and after exposure a value of rainfall can be de te rmined from the net weight. In 50 samples the mean difference in the weight of the catch by the two methods was 0. 046 g . , the average value of the weighing method being 17% lower than that determined by the drop count. Since these 50 samples consisted of low and moderate intensity rain, it is believed that most of the difference in weight can be explained by evaporation losses between exposure and weighing.
Using the distribution of drop sizes as m e a s ured to the nearest tenth of a mill imeter, the following quantit ies a re computed: R, the rain intensity in millimeters per hour; W, the liquid water content per cubic meter ; and Z, the radar reflectivity per cubic meter, on the basis of the following relationships:
FIG. 144. —NYLON SCREEN CALIBRATION CURVE.
where A is the screen area in m.2, t is the exposure t ime in seconds, d is the drop diameter in m m . , v is the terminal velocity in m. s e c . - 1 .
The computation of the liquid water content W and the radar reflectivity Z may also be done graphically by means of a nomogram and an auxil iary chart at a saving in time but with a loss of accuracy of 3 to 5%. The main advantage of the graphical method is that it provides a single diagram for each sample, showing the contribution of the different drop s izes to W and Z. (Fig. 145)
For the sake of accuracy the values of Z used in this study have been computed, but a diagram has a lso been plotted for each sample as a check on the computations and in order to have a graphical record of the distribution of W and Z for use in further studies.
RESULTS
Out of a total of nearly 90 rain samples collected at Cambridge, Massachusetts, between March and September of the past year, 63 have been computed and are included in the results presented here .
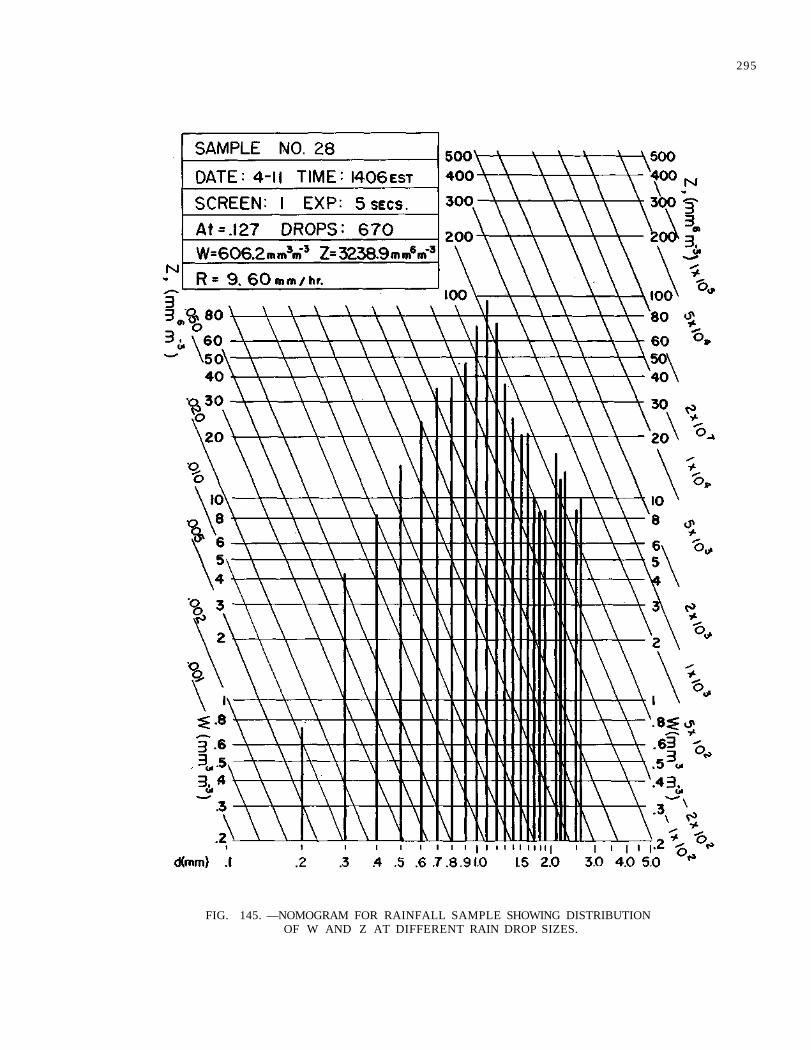
295
FIG. 145. —NOMOGRAM FOR RAINFALL SAMPLE SHOWING DISTRIBUTION OF W AND Z AT DIFFERENT RAIN DROP SIZES.
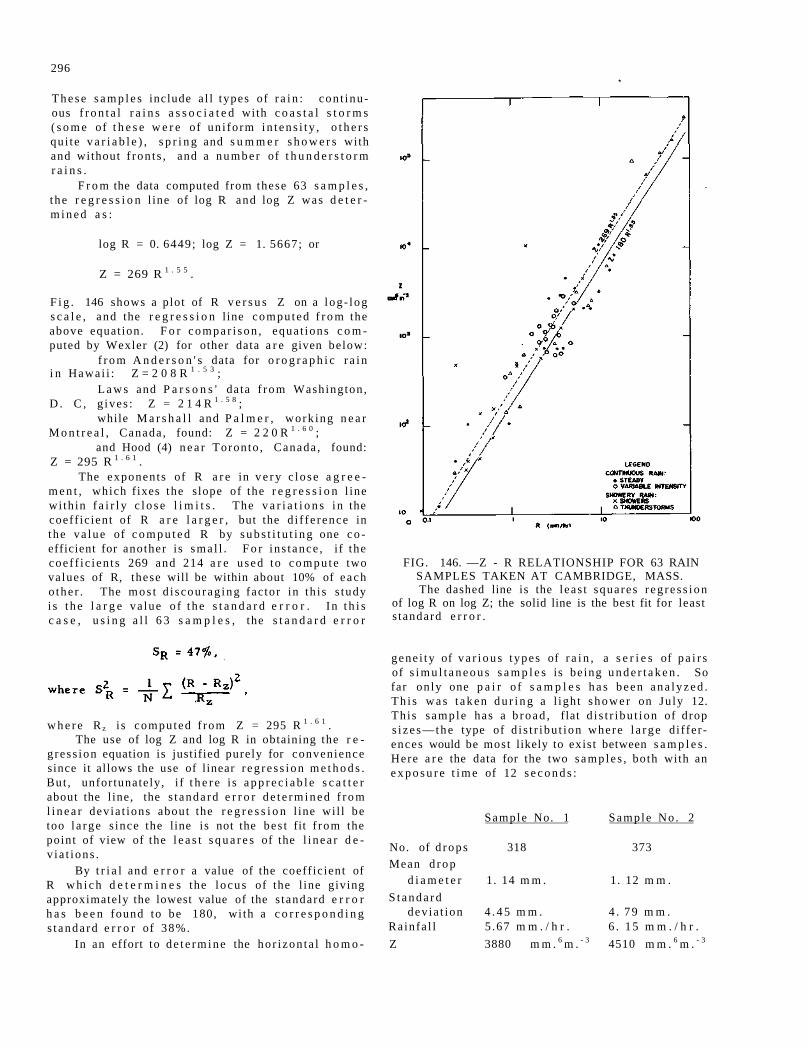
296
T h e s e s a m p l e s include a l l types of r a i n : con t inu ous f r o n t a l r a i n s a s s o c i a t e d with c o a s t a l s t o r m s ( s o m e of t h e s e w e r e of un i fo rm i n t e n s i t y , o t h e r s qu i te v a r i a b l e ) , s p r i n g and s u m m e r s h o w e r s with and without f ron t s , and a n u m b e r of t h u n d e r s t o r m r a i n s .
F r o m the data computed from these 63 s a m p l e s , t he r e g r e s s i o n l ine of log R and log Z was d e t e r m i n e d a s :
log R = 0. 6449; log Z = 1. 5667; or
Z = 269 R 1 . 5 5 .
F i g . 146 shows a plot of R v e r s u s Z on a log - log s c a l e , and the r e g r e s s i o n l ine computed f r o m the above equat ion. F o r c o m p a r i s o n , equa t ions c o m puted by Wexler (2) for other data a r e given below:
f r o m A n d e r s o n ' s data for o r o g r a p h i c r a i n i n Hawai i : Z = 2 0 8 R 1 . 5 3 ;
L a w s and P a r s o n s ' data f r o m Washington , D . C , g ives : Z = 2 1 4 R 1 . 5 8 ;
while M a r s h a l l and P a l m e r , work ing n e a r M o n t r e a l , Canada , found: Z = 2 2 0 R 1 . 6 0 ;
and Hood (4) n e a r Toronto , Canada , found: Z = 295 R 1 . 6 1 .
The exponents of R a r e in v e r y c lo se a g r e e m e n t , which f ixes the slope of the r e g r e s s i o n l ine wi th in f a i r l y c l o s e l i m i t s . The v a r i a t i o n s i n the coeff ic ient of R a r e l a r g e r , but the d i f f e rence in the va lue of c o m p u t e d R by s u b s t i t u t i n g one c o efficient for another is sma l l . F o r in s t ance , i f the coe f f i c i en t s 269 and 214 a r e u sed to c o m p u t e two values of R, these will be within about 10% of each o the r . The m o s t d i scourag ing fac tor in th i s s tudy i s t h e l a r g e va lue o f t h e s t a n d a r d e r r o r . I n t h i s c a s e , u s i n g a l l 6 3 s a m p l e s , the s t a n d a r d e r r o r
w h e r e R z i s computed f rom Z = 295 R 1 . 6 1 . The use of log Z and log R in obtaining the r e
g ress ion equation is justified purely for convenience since it allows the use of l inear r e g r e s s i o n m e t h o d s . But , unfor tunately , i f t h e r e i s a p p r e c i a b l e s c a t t e r about the l ine, the s t anda rd e r r o r d e t e r m i n e d f r o m l i n e a r dev ia t ions about the r e g r e s s i o n l ine wi l l be too l a rge s ince the line is not the bes t fit f rom the point of view of the l e a s t s q u a r e s of the l i nea r d e v ia t ions .
By t r i a l and e r r o r a value of the coeff ic ient of R w h i c h d e t e r m i n e s the l ocus of the l ine giving approximately the lowest value of the s tandard e r r o r h a s b e e n found to be 180, wi th a c o r r e s p o n d i n g s t anda rd e r r o r of 38%.
In an effort to d e t e r m i n e the ho r i zon ta l h o m o -
FIG. 146. —Z - R RELATIONSHIP FOR 63 RAIN SAMPLES TAKEN AT CAMBRIDGE, MASS. The dashed line is the l eas t squares r e g r e s s i o n
of log R on log Z; the solid line is the best fit for least s tandard e r r o r .
gene i ty of v a r i o u s types of r a i n , a s e r i e s of p a i r s of s i m u l t a n e o u s s a m p l e s is be ing u n d e r t a k e n . So far on ly one p a i r o f s a m p l e s h a s been a n a l y z e d . Th i s w a s t a k e n d u r i n g a l ight s h o w e r on Ju ly 12. This sample has a b road , flat d i s t r i bu t ion of drop s i ze s—the type of d i s t r ibu t ion where l a r g e di f fer ences would be most likely to exist between s a m p l e s . Here a r e the data for the two s amp le s , both with an e x p o s u r e t i m e of 12 s e c o n d s :
No. of d r o p s 318 373 Mean d r o p
d i a m e t e r 1. 14 m m . 1. 12 m m . S t a n d a r d
dev ia t ion 4 . 4 5 m m . 4 . 7 9 m m . Rainfa l l 5 .67 m m . / h r . 6 . 1 5 m m . / h r . Z 3880 m m . 6 m . - 3 4510 m m . 6 m . - 3
Sample No. 1 Sample No . 2
297
The two d rop- s i ze d is t r ibut ions were sub jec ted to a s t a t i s t i ca l " t" t e s t and the difference was found to be v e r y ins ignif icant , indica t ing the r a i n in t h i s i n s t ance to be homogeneous ove r a d i s tance of 100 fee t . F u r t h e r s amp l ing of t h i s type wi l l be m a d e to d e t e r m i n e t h e h o r i z o n t a l v a r i a b i l i t y o f r a i n in different types of precipi ta t ion over d is tances r a n g ing up to 400 or 500 feet .
CONCLUSION
The ny lon s c r e e n t e c h n i q u e i s a v e r y s a t i s f a c t o r y and a c c u r a t e m e t h o d of mak ing d r o p - s i z e m e a s u r e m e n t s in ra in , e l iminat ing m o s t of the d i s advantages of the previous me thods . The r e s u l t s of 63 s a m p l e s co l lec ted a t C a m b r i d g e between M a r c h and Sep t embe r , 1951, yie lded a value of
Z = 269 R 1 . 5 5 ,
which is in close ag reemen t with the r e su l t s of p r e v ious i n v e s t i g a t o r s . T h e s t a n d a r d e r r o r of R of 47% can be r e d u c e d by ob ta in ing a b e t t e r - f i t t i n g l i n e ,
Z = 180 R 1 . 5 5 ,
the s t a n d a r d e r r o r for t h i s equat ion be ing 3 8 % .
ACKNOWLEDGMENT
The r e s e a r c h r e p o r t e d i n t h i s p a p e r has b e e n made poss ib le through the suppor t and s p o n s o r s h i p ex t ended by the G e o p h y s i c s R e s e a r c h Div is ion of the A i r F o r c e C a m b r i d g e R e s e a r c h Cen te r , u n d e r Cont rac t No. AF 19(122)-399.
B I B L I O G R A P H Y
Ref. Ref.
1. Blanchard, D. C . , "The Use of Sooted Screens for D e t e r m i n i n g Raindrop Size and Dis t r ibu t ion ," Project Cir rus , General Electr ic Company, Schenectady, N. Y . , Occ. Repor t No. 16, 1949, 11 pp.
2 . W e x l e r , R . , " R a i n I n t e n s i t i e s b y R a d a r , " J . M e t e o r . , 5, 171-173, 1948.
3. Marshall, J. S . , and Pa lmer , W. M., "The D i s t r i bution of Raindrops with S i z e , " J. M e t e o r . , 5, 165-166, 1948.
4. Hood, A. D. , "Quantitative Measurements at Three and Ten Cen t ime te r s of R a d a r Echo Intensi t ies from Precipitation," N .R .C . of Canada, No. 2155, June, 1950.
298
DISCUSSION
R. J. BOUCHER. —(In reply to Mr. Jones' query.) On the Z-R diagram. Fig. 146, the ra infall is shown classified into four categories: continuous steady ra in , continuous ra in of variable intensity, showers and thunders torms. This is a f i r s t and rough a t tempt to differentiate between types of rain. There appears to be no simple correlation between the type of rain as shown here and the depa r tu re of the points from the regression line. However, further consideration will be given
to the variability of Z and R in relation to observable differences in atmospheric processes.
R.. WEXLER. —It is interesting to note here the variat ion in the exponent of R in the regress ion equation. For 53 cases with maximum precipi tation intensity of 12.4 m m . / h r . the exponent of R was 1.38. With more samples, which included rain intensities as high as 87. 5 mm. / h r . , the exponent for 63 cases was raised to 1.55.
NEW METHOD TO MEASURE RAINDROP SIZE
BY L. G. SMITH*
In Cambridge (England) we have been using a new method to measure the size of ra indrops. It is to measure the change in capacity of a paral le l-plate condenser when a drop falls between the plates. The fractional change in the capacity, C, caused by a spherical drop of volume Vd is
dC/C = 3 V d / V c ,
for V d « V c , where Vc is the volume of the condenser and the dielectric constant of the mater ia l of the drop is large compared with unity. The condenser used had pla tes 10 cm. by 12 cm. and a separation of 7 cm. The change of capacity is small, being about one part in 4 x 10³ for a drop of 5 mm. diameter, necessitating a sensitive method of detection. The method finally chosen, and which has been found to work very satisfactorily, is to make the condenser part of the tuned circuit of an oscil-
*Visiting Dept. of Meteorology, University of Chicago, Chicago, Illinois. Formerly Imperial College, London, England.
lator working at 120 Mcps. , the effect of the drop being to produce a change of frequency. The signal is reduced in frequency f irst to 10 Mcps. and then to 0. 5 M c p s . , the frequency deviation being unaltered, and detected in a phase discriminator. In this way a voltage pulse is obtained which is proportional in magnitude to the mass of the drop. If the apparatus is se t to measure drops up to. five or six mill imeters in diameter, the smallest size that can be detected is rather under one mill imeter, representing a range of m a s s of 100 to 1. A separate method had to be used to measure the smaller drops.
The main difficulty encountered in the construction of the apparatus was its sensitivity to vibration but this was largely overcome by making the condenser and associated oscillator very rigid. A discussion of the observations taken with this apparatus would be out of place here as they were part of an investigation of the relation between the electric charge and size of raindrops; the drop-size d i s t r i bution was a secondary feature.
299
A P A N E L DISCUSSION
NEW D E V E L O P M E N T S IN USING RADAR FOR HURRICANE TRACKING
ROY C. JORGENSEN, * Moderator
I am partly responsible for a program of this kind and would like to describe my reasons for suggesting it. We at Dow would like to see a yearly meeting of everyone who actually has a radar set in operation for the purpose of hurricane detection. Further, I would like an opportunity to visit all the other sets, and would like other operators to have the opportunity of visiting our set to exchange ideas on radar photography, scope interpretations, and
*Electrochemical Engineer, Dow Chemical Co., Freeport, Texas.
experimentation; in other words, a mutual cooperative program against the common enemy, the hurricane. We at Dow are interested in anything that will aid in the detection of the hur r icane . As far as that goes, if mic rose i sms were usable in our area , we would certainly be interested in working in that field also. I hope to stop in St. Louis on my way back to gather information on this subject. We would like to acquaint other people with the work we a r e doing and to learn what they a re doing in order to aid each other in this common work.
301
UNIVERSITY OF FLORIDA RADAR INSTALLATION
BY MARINOS H. L A T O U R *
The Unive r s i ty of F l o r i d a wea the r r a d a r s t a t i o n h a s a t e n - c e n t i m e t e r wave length r a d a r , the SCR 6 1 5 B , as i t s p r i n c i p a l e q u i p m e n t . We have j u s t recent ly moved the weather r ada r s tat ion f rom i t s original site at a f o r m e r a i r base (about 8 m i l e s n o r t h e a s t of Gainesvi l le) to the campus of the Univ e r s i t y . A t t h e a i r b a s e the r a d a r an tenna was mounted on the o r ig ina l 25-foot t o w e r . Unfortunate ly , the rapid growth of the 'slash p ines on the a i r base resulted in the radar beam becoming obs t ruc ted at z e r o degree e levat ion over m o s t of the n o r t h e r n s e m i c i r c l e . T o o v e r c o m e t h i s p r o b l e m , and t o make the weather r a d a r s ta t ion m o r e convenient to o u r o the r a c t i v i t i e s , the equ ipmen t w a s moved to the c a m p u s t h i s pa s t s u m m e r . Ut i l i z ing a r a d i o t o w e r r e l i n q u i s h e d by the U n i v e r s i t y ' s radio s t a t ion , we w e r e ab le to m o u n t the a n t e n n a 120 feet above the s u r f a c e . Th i s c l e a r s a l l bu i ld ings , and we have an unobs t ruc t ed ho r i zon in a l l d i r e c t i o n s . We a r e a l so planning to r e in s t a l l our 3 - c e n t i m e t e r r a d a r previously instal led a t the a i r b a s e . Another 3 - c e n t i m e t e r r a d a r wi l l be i n s t a l l e d in a mobi le unit so that we can move to a h u r r i c a n e . Since the average number of s to rms per year for a l l of F l o r i d a is only a little g r e a t e r than one, there m a y be s e v e r a l y e a r s du r ing which no s t o r m wil l pa s s within r a n g e of the fixed r a d a r s ta t ion .
We were for tunate to have sufficient funds a l located for the moving of the weather r a d a r s ta t ion and a l s o new bui ld ings for housing the equipment .
The f i rs t r a d a r observat ion of a h u r r i c a n e was in 1949. We have a ve ry good r eco rd of that s t o r m , s ta r t ing seve ra l hours before the s t o r m p rope r b e came vis ible on the scope (showing f requent squa l l l i n e s ) and c a r r y i n g t h r o u g h un t i l t h e s t o r m was f a i r l y wel l d i s s i p a t e d . Unfor tuna te ly , during the la t ter par t of the s t o r m when it was actual ly n e a r e s t the s ta t ion , i t had m o v e d into the s e c t o r where i t w a s n e c e s s a r y to t i l t the e levat ion of the b e a m up s e v e r a l d e g r e e s t o c l e a r the t r e e s n e a r the r a d a r s i t e . Although the back side of the s t o r m was los t by tilting up, we were able to compute the a p p r o x i m a t e height of the p rec ip i t a t ion in the s t o r m . The top of.the p r e c i p i t a t i o n echo was found to be about 13,000 feet. This was confirmed, l a t e r , by an a i r r econna i s sance r e p o r t .
In 1950 we had t h r e e s t o r m s , which r an our a v e r a g e up. The f i r s t s t o r m was t h e Cedar Key h u r r i c a n e which deve loped n e a r the I s l e of P i n e s
*Assistant Research Professor, University of Florida, Gainesville, Florida.
south of Cuba. This s t o r m p a s s e d over Cuba and m o v e d v e r y r a p i d l y p a r a l l e l t o the w e s t c o a s t o f F l o r i d a , about 30 to 60 m i l e s offshore . I t s e e m e d to show a t e n d e n c y to m o v e to the n o r t h w e s t but sudden ly i t s lowed down, m a d e a c o m p l e t e loop, and t u r n e d b a c k t o w a r d s the c o a s t . T h e s t o r m moved slowly toward the coast , stopping j u s t a few mi les south of Cedar Key. It then moved over Ceda r Key a n d b a c k a g a i n , m a k i n g a n o t h e r s m a l l loop. It then continued a slow movement to the sou th .
The s t o r m was in the vicinity of Cedar Key for about 12 hour s , and the town exper ienced h u r r i c a n e winds for about 12 h o u r s . When the s t o r m moved over Cedar Key and then backed off, tha t town e x p e r i e n c e d the s a m e s i d e o f the h u r r i c a n e tw ice .
The second s t o r m of 1950, which we ca l l the Miami hu r r i cane , a l so developed south of Cuba. It b roke up somewhat moving over Cuba, but then r e fo rmed as a ve ry s m a l l s t o r m . I have seen pho to g r a p h s of the r a d a r s c o p e a t the Nava l Sta t ion a t Key West. These show the s t o r m as a s ing le , t ight r ing type precipi ta t ion echo. The reDOrts f rom two automatic reporting stations in the Keys showed only l ight winds when the s t o r m p a s s e d be tween them, although they did indicate the circulation. The winds w e r e so l igh t tha t the f o r e c a s t e r s b e g a n to doubt that they did have a s t o r m between the two s t a t i o n s , e s p e c i a l l y s i nce the d i s t a n c e be tween the s t a t ions was in the order of 50 mi l e s . When the s t o r m moved ove r M i a m i a t midn igh t the c e n t e r was about five m i l e s wide. It had about an equal d i s t a n c e of high winds on ei ther side of the center ; so that the s t o r m was about 15 to 20 m i l e s wide, with the h u r r i c a n e winds fall ing off r a p i d l y on each s i d e .
This was a really intense s to rm in Miami . B o x c a r s were blown off the i r t r a c k s , and i t a l s o t u r n e d over some automobiles . There were about 13 r ad io t o w e r s l o s t i n the M i a m i a r e a . T h o s e t o w e r s t o the w e s t of M i a m i w e r e out of the p r i n c i p a l zone and e s c a p e d without d a m a g e .
When th i s s t o r m moved into our r a d a r r a n g e , i t had lost m o s t of i ts c h a r a c t e r i s t i c f o rm . As fa r as we cou ld s e e , i t w a s j u s t a s e r i e s of s q u a l l s , w e l l in a d v a n c e of t h e low p r e s s u r e c e n t e r . We plotted up some of the surface data f rom the s t a t ions along the s to rm ' s path. This indicated that the h ighes t winds moved forward so that they o c c u r r e d about 2 h o u r s or 70 to 80 m i l e s ahead of the low p r e s s u r e c e n t e r .
The o t h e r s t o r m , which d e v e l o p e d only to a s m a l l extent , was a t r o p i c a l cyclone in the Gulf of Mexico. This s to rm moved in toward Tampa, p r a c -
303
304
tically due east toward the coast. It lost force r ap idly due to the influx of cold, dry air while the s torm was still in the Gulf. Before reaching the coast it curved to the north, crossing the Florida coast near Cedar Key. There was ve ry little damage in that a rea , and the wind velocities were not very high.
There was considerable electr ical activity in the vicinity of our station during this s to rm. At the time the previous hurricane passed over Miami, considerable electrical activity was noted near the center of the storm. This is unusual as our exper i ence and our sferics records indicate small or no electr ical activity with hurr icanes .
(Note: The following comments were made during the showing of the f i lm.)
This shows our old s i te with a 3-centimeter radar on top of the SCR 615B radar. We use a modified 0-15 camera for photographing the PPI scope. Since we photograph the radar scope using only one mirror , and the data card and clock using two m i r rors , the data card and clock will appear as a m i r ror image on the film.
These show the Cedar Key storm. The center — if you can see it—was about 120 mi les from the station when we first detected it. It seemed to be charac te r ized by a single spi ra l near the " e y e . " Unfortunately, we have had to delete sections of this film because we had camera trouble and some operator e r r o r s . There was much more detail visible than we have recorded on this film.
These are the radar movies of the Miami hurricane. We started out getting what appeared to be a typical outer band and expected to see successive bands moving in behind this as the center moved towards the station. Actually, we did get this pair of bands—and some finer precipitation in this r e gion.
T h e s e a r e the fi lms of the 1949 hurr icane . Early in the afternoon of the day preceding the s torm, we saw this squall line and this smaller squall line passing over the station.
Here , about 4:00 a . m . we can see the "eye" of the storm on the scope at about 120 miles. Notice that this la rge a r ea appea r s to move around the "eye"—the "eye" appears to be near the west side of that open area . We found that there was a tendency to call any area with no precipitation the "eye" of the s t o r m s . The shape of the sp i ra ls and the previous appearance have to be considered in selecting the "eye" of the s torm.
During this period we turned the dish up in elevation so that we would clear the nearby t r e e s . The center of rotation can still be picked out, you will notice.
This map shows a suggested radar network for Florida. Stations now exist at Tampa and Miami— as well as Gainesville, of course.
(Note: This is the end of the film showing.)
We feel there can be no question as to the usefulness of radar for storm location and detection. The p rob lems now are how to get grea te r utility from the equipment. It should be possible to get more than just information as to location and movement. There are some problems which have come up. There seem to be discrepancies between points selected as the center of the storm from the radar bands and the actual center of lowest p r e s su re . There is also some question about the movement of these s to rms . They do not seem to move along a smooth curve but seem to oscillate about the smooth path.
These a re problems which we feel require further study.
305
DISCUSSION
BY
F. C. WHITE, D. ATLAS, J. S. MARSHALL, H. R. BYERS, J. R. ANDERSON, M. H. LIGDA, J. C. FREEMAN, R. C. JORGENSEN
L. J. BATTAN
R. C. JORGENSEN. —I would like to introduce the panel: We have Mr. Anderson, who was our meteorologist at Dow Chemical Company until the time he went to work for his Uncle Sam; Mr. Latour, from the University of Florida; and Mr. Dunn, of the U. S. Weather Bureau. I would also like to consider everyone present as panel members for this discussion. We will go down the list of topics, one at a t ime, and suggest that the panel and audience join the d iscuss ions . There is one restriction— we have 45 minutes left before the next speaker and about eight subjects to touch on. It is likely that we will have to chop some subjects short, for it is better to at least mention each topic than to leave one completely out. Mr. Latour suggesteda division in these topics, the first being radar equipment, and the second being utilization of radar for s torm location.
PHOTOGRAPHIC EQUIPMENT
Fig. 147 is a photograph of the ceiling of our operating room, showing two of our cameras . The camera on the right is the one used by most companies to photograph employees for identification badges. It holds 750 exposures of 35 mm. film and is used as a sti l l camera . Exposure is made by opening the shutter for one revolution of the antenna. We usually take a still photograph about every 15 minutes. The other camera is an aircraft gun camera, which is modified to expose one 16 mm. frame during each revolution of the antenna. This camera produces a movie film in which all movement is speeded up about 500 times normal speed.
UNIDENTIFIED.*—What is the film exposure t ime?
R. C. JORGENSEN.—One complete revolution of the scope, which gives an exposure of about 15 seconds.
UNIDENTIFIED. —Do you have a clock or date card at the scope ?
R. C. JORGENSEN. —We have a clock and a
*During the discussion there were comments by persons who were unidentified in the recording.
date card, which can be seen in the upper right-hand corner of each scope photograph. The camera shown on the right in Fig. 147 photographs the auxi l iary scope, which is at the top of the operating panel. This scope will be seen in the upper left-hand corner of Fig. 148. The bottom of the scope is about 6 feet high, and the camera is above 6 feet so that a person can walk under the camera ' s line of view without interfering with the photographic process . Visitors can view the scope from close range without shading the scope from the camera . Visitors to the radar during emergency operation have been a major problem. They upset operating schedules when we had only one PPI scope, but now we have made a r rangements for v is i tors to view the elevated auxiliary scope, which is also used for photography.
The th i rd c a m e r a (Fig. 149) is homemade, takes an 8" x 10" negative, and uses a projector lens swiped off of a photographic projector . We have this c amera mounted so it looks at the new P P I scope, which can be seen at the right center of Fig. 148, and which is part of the SCR 527 console. With this camera we gather data for our experimental program. By this means, we get 8" x 10" negatives, which are large enough to be placed one above the other and viewed over a ground glass in order to compare successive photographs. We have also arranged facilities for developing these films in 10 minutes.
F. C. WHITE. —For work on Bureau of Aeronaut ics , Navy Contract , American Airl ines was provided a Bell and Howell "Eymo" camera. It had provisions for the use of a 400-foot spool of film. The camera had a "stop frame" attachment, that i s , it would take one f rame at a t i m e . Roughly speaking, this provides approximately five thousand pictures of the radar scope for each film lead. The camera had a convenient carrying case; in fact, I carried it to Newfoundland and England and obtained excellent photographs of radar scopes.
R. C. JORGENSEN. —Was it 16 mm. ?
F. C. WHITE. —No, 35 mm. The larger size film provides a negative that can be blown up to 12" square, if need be, with good detail provided.
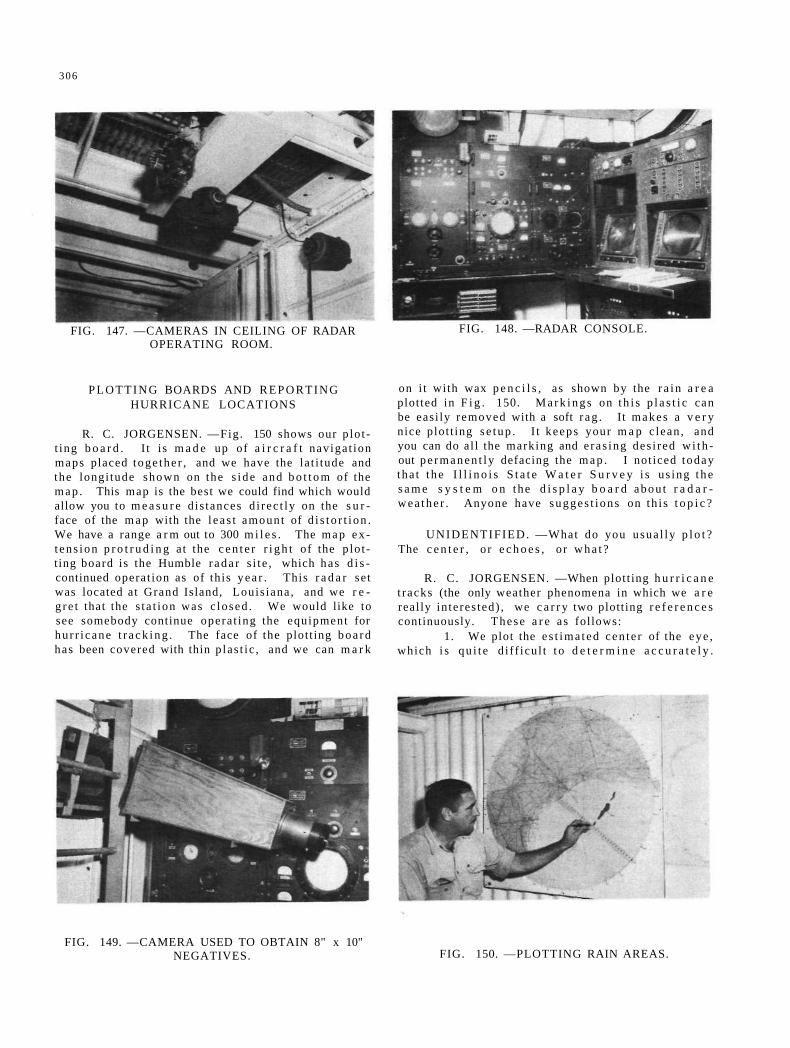
306
FIG. 147. —CAMERAS IN CEILING OF RADAR OPERATING ROOM.
FIG. 148. —RADAR CONSOLE.
P L O T T I N G BOARDS AND REPORTING HURRICANE LOCATIONS
R. C. JORGENSEN. —Fig. 150 shows our p lo t t ing b o a r d . I t i s m a d e up of a i r c r a f t naviga t ion maps placed toge the r , and we have the la t i tude and the longi tude shown on the s i de and b o t t o m of the map . This map is the best we could find which would allow you to m e a s u r e d is tances d i rec t ly on the s u r face of the m a p with the l e a s t amount of d i s to r t i on . We have a range a r m out to 300 m i l e s . The map e x t ens ion p r o t r u d i n g at the c e n t e r r i g h t of the p lo t t ing board is the Humble r a d a r s i t e , which has d i s continued operat ion as of this yea r . This r a d a r se t was located at Grand Island, Louis iana , and we r e g r e t that the s t a t ion was c losed . We would like to see somebody continue opera t ing the equipment for hu r r i cane t r a c k i n g . The face of the plott ing b o a r d has been covered with thin p las t ic , and we can m a r k
FIG. 149. —CAMERA USED TO OBTAIN 8" x 10" NEGATIVES.
on i t with wax p e n c i l s , as shown by the r a i n a r e a plotted in F i g . 150. M a r k i n g s on t h i s p l a s t i c can be easi ly removed with a soft r ag . It makes a v e r y nice plot t ing s e tup . I t keeps your m a p c lean , and you can do al l the marking and e ras ing des i red w i t h out p e r m a n e n t l y defacing the m a p . I not iced today tha t t h e I l l i n o i s S t a t e W a t e r S u r v e y i s us ing t h e s a m e s y s t e m o n the d i s p l a y b o a r d abou t r a d a r -wea the r . Anyone have sugges t ions on th i s t o p i c ?
UNIDENTIFIED. —What do you usua l ly p l o t ? The c e n t e r , or e c h o e s , or w h a t ?
R. C. JORGENSEN. —When plott ing h u r r i c a n e t racks (the only weather phenomena in which we a r e real ly in teres ted) , we c a r r y two plotting r e f e r e n c e s continuously. These a r e as follows:
1. We plot the e s t ima ted cen te r of the eye , which i s qu i t e d i f f icul t t o d e t e r m i n e a c c u r a t e l y .
FIG. 150. —PLOTTING RAIN AREAS.
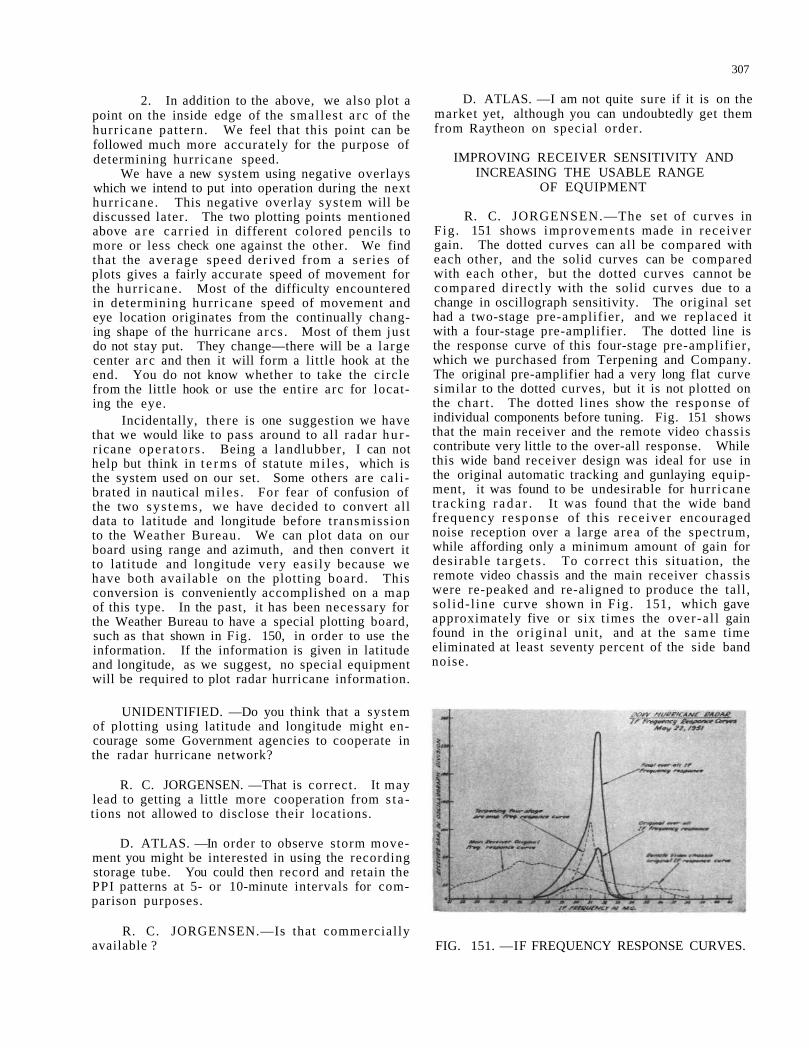
307
2. In addition to the above, we also plot a point on the inside edge of the smallest a rc of the hurricane pattern. We feel that this point can be followed much more accurately for the purpose of determining hurricane speed.
We have a new system using negative overlays which we intend to put into operation during the next hurr icane . This negative overlay system will be discussed later. The two plotting points mentioned above a r e car r ied in different colored pencils to more or less check one against the other. We find that the average speed derived from a ser ies of plots gives a fairly accurate speed of movement for the hurr icane. Most of the difficulty encountered in determining hurr icane speed of movement and eye location originates from the continually changing shape of the hurricane a rcs . Most of them just do not stay put. They change—there will be a large center a r c and then it will form a little hook at the end. You do not know whether to take the circle from the little hook or use the entire arc for locating the eye.
Incidentally, there is one suggestion we have that we would like to pass around to all radar h u r ricane opera to rs . Being a landlubber, I can not help but think in t e r m s of statute mi les , which is the system used on our set. Some others are cal i brated in nautical mi les . For fear of confusion of the two sys tems , we have decided to convert all data to latitude and longitude before t ransmission to the Weather Bureau. We can plot data on our board using range and azimuth, and then convert it to latitude and longitude very easi ly because we have both available on the plotting board. This conversion is conveniently accomplished on a map of this type. In the past, it has been necessary for the Weather Bureau to have a special plotting board, such as that shown in Fig. 150, in order to use the information. If the information is given in latitude and longitude, as we suggest, no special equipment will be required to plot radar hurricane information.
UNIDENTIFIED. —Do you think that a system of plotting using latitude and longitude might encourage some Government agencies to cooperate in the radar hurricane network?
R. C. JORGENSEN. —That is correct . It may lead to getting a little more cooperation from s ta tions not allowed to disclose their locations.
D. ATLAS. —In order to observe storm movement you might be interested in using the recording storage tube. You could then record and retain the PPI patterns at 5- or 10-minute intervals for comparison purposes.
R. C. JORGENSEN.—Is that commercial ly available ?
D. ATLAS. —I am not quite sure if it is on the market yet, although you can undoubtedly get them from Raytheon on special order .
IMPROVING RECEIVER SENSITIVITY AND INCREASING THE USABLE RANGE
OF EQUIPMENT
R. C. JORGENSEN.—The set of curves in Fig . 151 shows improvements made in receiver gain. The dotted curves can all be compared with each other, and the solid curves can be compared with each other, but the dotted curves cannot be compared direct ly with the solid curves due to a change in oscillograph sensitivity. The original set had a two-stage pre-amplifier, and we replaced it with a four-stage pre-amplifier. The dotted line is the response curve of this four-stage pre-amplifier, which we purchased from Terpening and Company. The original pre-amplifier had a very long flat curve similar to the dotted curves, but it is not plotted on the char t . The dotted lines show the response of individual components before tuning. Fig. 151 shows that the main receiver and the remote video chassis contribute very little to the over-all response. While this wide band receiver design was ideal for use in the original automatic tracking and gunlaying equipment, it was found to be undesirable for hurr icane t racking r a d a r . It was found that the wide band frequency response of this rece iver encouraged noise reception over a large area of the spectrum, while affording only a minimum amount of gain for desirable t a rge t s . To correct this situation, the remote video chassis and the main receiver chassis were re-peaked and re-aligned to produce the tall , sol id- l ine curve shown in F ig . 151, which gave approximately five or six t imes the over-a l l gain found in the or iginal unit, and at the same time eliminated at least seventy percent of the side band noise.
FIG. 151. —IF FREQUENCY RESPONSE CURVES.
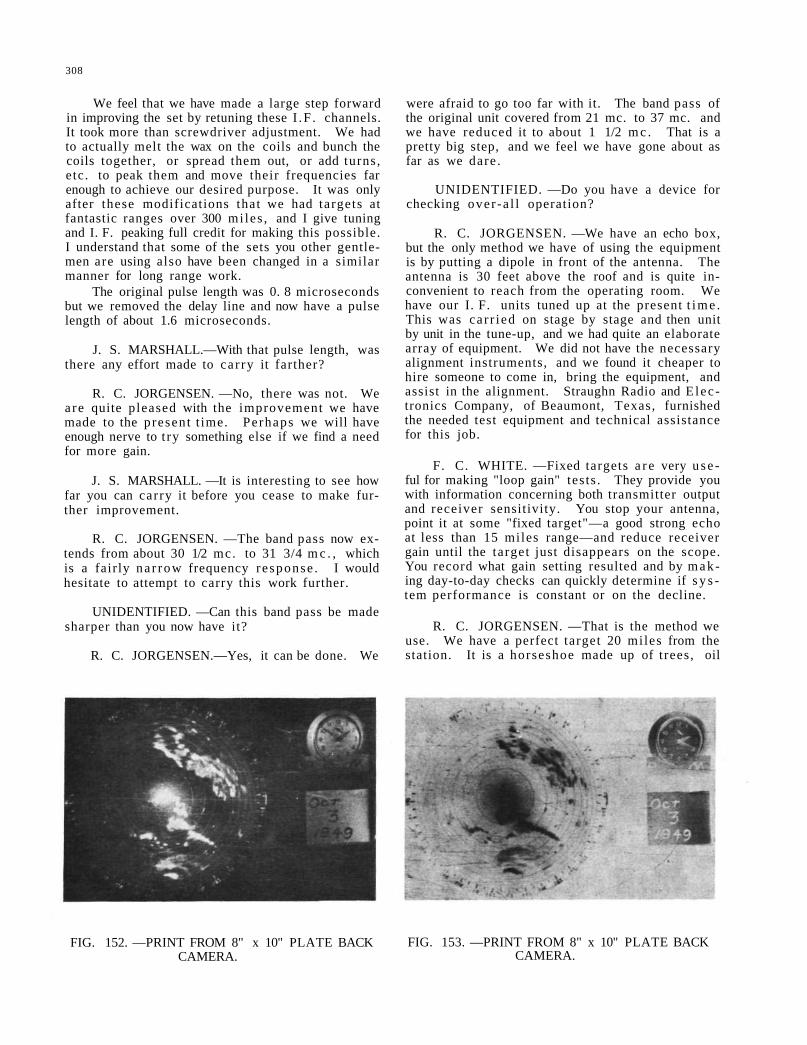
308
We feel that we have made a large step forward in improving the set by retuning these I .F . channels. It took more than screwdriver adjustment. We had to actually melt the wax on the coils and bunch the coils together, or spread them out, or add turns, etc . to peak them and move their frequencies far enough to achieve our desired purpose. It was only after these modifications that we had targets at fantastic ranges over 300 mi les , and I give tuning and I. F. peaking full credit for making this possible. I understand that some of the sets you other gentlemen are using also have been changed in a similar manner for long range work.
The original pulse length was 0. 8 microseconds but we removed the delay line and now have a pulse length of about 1.6 microseconds.
J. S. MARSHALL.—With that pulse length, was there any effort made to ca r ry it farther?
R. C. JORGENSEN. —No, there was not. We a re quite pleased with the improvement we have made to the present t ime. Perhaps we will have enough nerve to t ry something else if we find a need for more gain.
J. S. MARSHALL. —It is interesting to see how far you can carry it before you cease to make further improvement.
R. C. JORGENSEN. —The band pass now extends from about 30 1/2 mc. to 31 3/4 m c . , which is a fairly na r row frequency response . I would hesitate to attempt to carry this work further.
UNIDENTIFIED. —Can this band pass be made sharper than you now have it?
R. C. JORGENSEN.—Yes, it can be done. We
FIG. 152. —PRINT FROM 8" x 10" PLATE BACK CAMERA.
were afraid to go too far with it. The band pass of the original unit covered from 21 mc. to 37 mc. and we have reduced it to about 1 1/2 m c . That is a pretty big step, and we feel we have gone about as far as we dare .
UNIDENTIFIED. —Do you have a device for checking over -a l l operation?
R. C. JORGENSEN. —We have an echo box, but the only method we have of using the equipment is by putting a dipole in front of the antenna. The antenna is 30 feet above the roof and is quite inconvenient to reach from the operating room. We have our I. F. units tuned up at the present t i m e . This was ca r r ied on stage by stage and then unit by unit in the tune-up, and we had quite an elaborate array of equipment. We did not have the necessary alignment instruments, and we found it cheaper to hire someone to come in, bring the equipment, and assist in the alignment. Straughn Radio and E lec tronics Company, of Beaumont, Texas, furnished the needed test equipment and technical assistance for this job.
F. C. WHITE. —Fixed targets a r e very u s e ful for making "loop gain" tests . They provide you with information concerning both transmitter output and receiver sensitivity. You stop your antenna, point it at some "fixed target"—a good strong echo at less than 15 miles range—and reduce receiver gain until the target just disappears on the scope. You record what gain setting resulted and by making day-to-day checks can quickly determine if s y s tem performance is constant or on the decline.
R. C. JORGENSEN. —That is the method we use. We have a perfect target 20 miles from the station. It is a horseshoe made up of t rees, oil
FIG. 153. —PRINT FROM 8" x 10" PLATE BACK CAMERA.
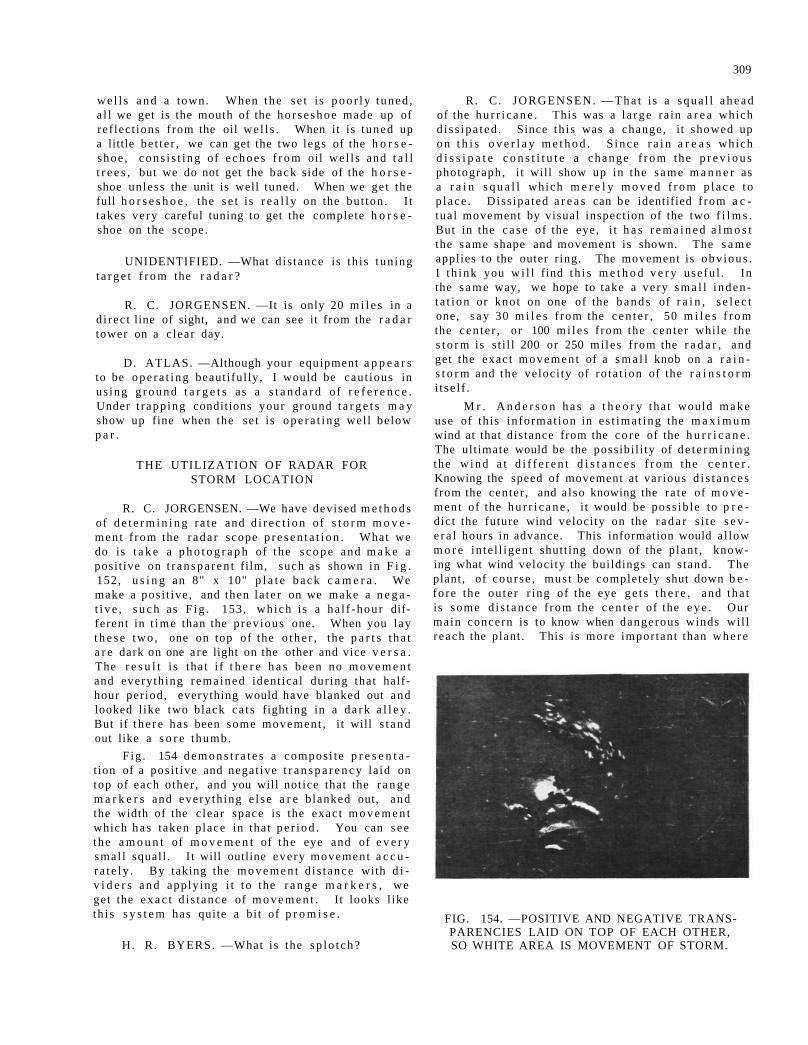
309
w e l l s a n d a town. When the se t i s p o o r l y tuned , a l l we get is the mouth of the ho r se shoe made up of ref lect ions from the oil we l l s . When it is tuned up a little be t te r , we can get the two legs of the h o r s e shoe , cons i s t i ng of e c h o e s f r o m oil we l l s and t a l l t r e e s , but we do not get the back side of the h o r s e shoe unless the unit is well tuned. When we get the full h o r s e s h o e , the s e t is r e a l l y on the but ton. I t takes very careful tuning to get the complete h o r s e shoe on the scope.
UNIDENTIFIED. —What d is tance is th is tun ing t a r g e t f r o m the r a d a r ?
R. C. JORGENSEN. —It is only 20 m i l e s in a d i rec t line of sight, and we can see it from the r a d a r tower on a c lear day.
D. ATLAS. —Although your equipment a p p e a r s to be ope ra t i ng beautiful ly, I would be caut ious in us ing g r o u n d t a r g e t s as a s t a n d a r d of r e f e r e n c e . Under t r app ing conditions your ground t a r g e t s m a y show up fine when the se t is ope ra t i ng wel l be low p a r .
THE UTILIZATION OF RADAR FOR STORM LOCATION
R. C. JORGENSEN. —We have devised m e t h o d s of d e t e r m i n i n g r a t e and d i r e c t i o n of s t o r m m o v e men t f rom the r ada r scope p r e s e n t a t i o n . What we do is t a k e a p h o t o g r a p h of the s c o p e and m a k e a posi t ive on t r anspa ren t film, such as shown in F i g . 152, u s i n g an 8" x 10" p l a t e b a c k c a m e r a . We make a posi t ive , and then la te r on we make a n e g a t i v e , s u c h as F i g . 153, which is a ha l f -hour different in t ime than the p rev ious one. When you lay t h e s e two , one on top of the o t h e r , the p a r t s tha t a r e dark on one a re light on the other and vice v e r s a . The r e s u l t i s tha t i f t h e r e h a s been no m o v e m e n t and everything remained ident ical dur ing that half-hour per iod, everything would have blanked out and looked l ike two black ca t s fighting in a d a r k a l l e y . But if t h e r e has been some movement , i t will s t a n d out like a s o r e thumb.
F ig . 154 d e m o n s t r a t e s a compos i te p r e s e n t a t ion of a posi t ive and negat ive t r a n s p a r e n c y la id on top of each other , and you will notice that the r a n g e m a r k e r s and every th ing e l s e a r e blanked out, and the width of the c lear space is the exac t m o v e m e n t which h a s taken place in that p e r i o d . You can s e e the a m o u n t of m o v e m e n t of the eye and of e v e r y smal l squall . I t will outline eve ry movement a c c u r a t e l y . By taking the m o v e m e n t d i s t ance with d i v i d e r s a n d apply ing i t t o the r a n g e m a r k e r s , we get the e x a c t d i s tance of m o v e m e n t . It looks l ike th i s s y s t e m has quite a bit of p r o m i s e .
H. R. BYERS. —What is the s p l o t c h ?
R. C. JORGENSEN. — T h a t is a squa l l a h e a d of the h u r r i c a n e . This was a l a rge ra in a r e a which d i s s ipa ted . Since th i s was a change, it showed up o n t h i s o v e r l a y m e t h o d . S ince r a i n a r e a s which d i s s i p a t e c o n s t i t u t e a change f r o m the p r e v i o u s photograph, i t will show up in the s a m e m a n n e r as a r a i n s q u a l l which m e r e l y m o v e d f r o m p l a c e t o p l ace . Diss ipated a r e a s can be identified f rom a c tual movement by visual inspection of the two f i l m s . But in the c a s e of the eye, i t h a s r e m a i n e d a l m o s t the same shape and movement is shown. The s a m e applies to the outer r ing. The movement is obv ious . I t h ink you w i l l find t h i s m e t h o d v e r y use fu l . In the s a m e way, we hope to take a ve ry s m a l l i nden t a t i on or knot on one of the b a n d s of r a i n , s e l e c t one, s a y 30 m i l e s f rom the c e n t e r , 50 m i l e s f r o m the cen te r , or 100 m i l e s f rom the center while the s t o r m is s t i l l 200 or 250 mi les f rom the r a d a r , and get the exact movemen t of a s m a l l knob on a r a i n s t o r m and the veloci ty of ro ta t ion of the r a i n s t o r m itself.
M r . A n d e r s o n h a s a t h e o r y tha t would m a k e use of this informat ion in e s t ima t ing the m a x i m u m wind at that distance from the co re of the h u r r i c a n e . The ult imate would be the possibi l i ty of de t e rmin ing the w i n d a t d i f f e r e n t d i s t a n c e s f r o m the c e n t e r . Knowing the speed of movement at var ious d i s t a n c e s from the center , and a lso knowing the ra te of m o v e ment of the h u r r i c a n e , i t would be poss ib le to p r e dict the future wind velocity on the r a d a r s i t e s e v e r a l hours in advance. This information would a l low m o r e in te l l igen t shutt ing down of the p lant , knowing what wind velocity the buildings can s tand. The plant, of cour se , mus t be completely shut down b e fo re the outer r ing of the eye g e t s t h e r e , and tha t is some d i s t ance f rom the c e n t e r of the e y e . Our main concern is to know when dangerous winds wi l l reach the plant . This is more important than w h e r e
FIG. 154. —POSITIVE AND NEGATIVE TRANSPARENCIES LAID ON TOP OF EACH OTHER, SO WHITE AREA IS MOVEMENT OF STORM.
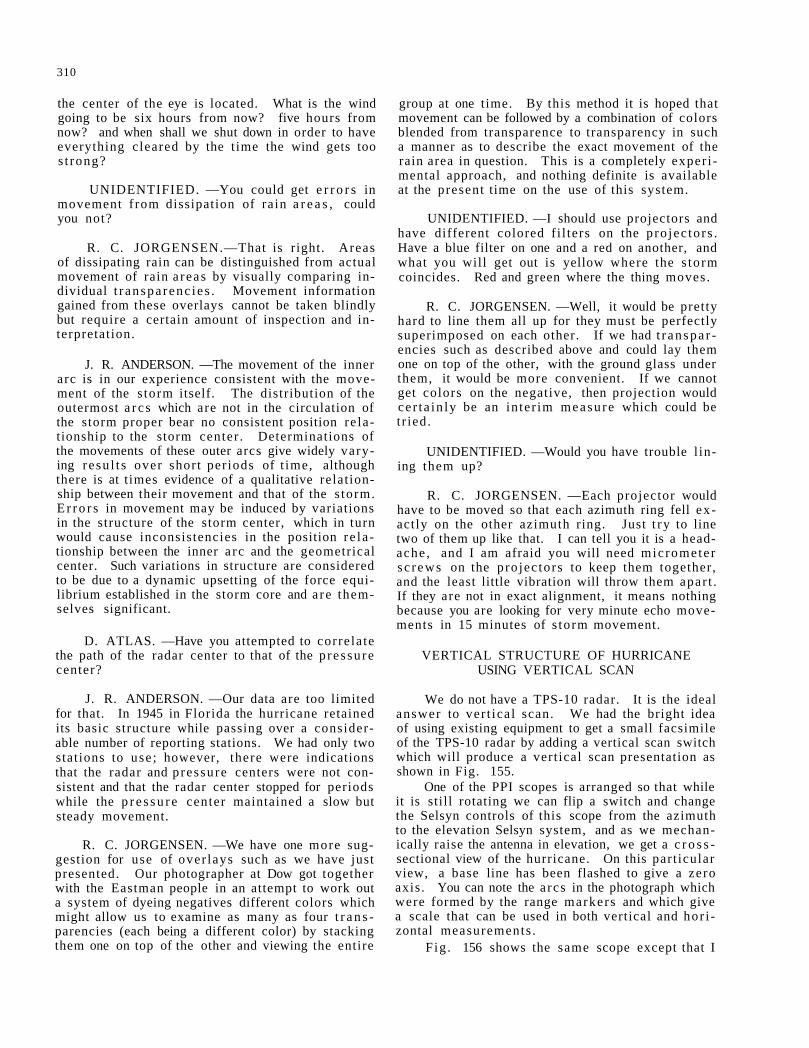
310
the center of the eye is located. What is the wind going to be six hours from now? five hours from now? and when shall we shut down in order to have everything cleared by the t ime the wind gets too s t rong?
UNIDENTIFIED. —You could get e r r o r s in movement f rom dissipation of rain a r e a s , could you not?
R. C. JORGENSEN.—That is right. Areas of dissipating rain can be distinguished from actual movement of rain a reas by visually comparing individual t r anspa renc ie s . Movement information gained from these overlays cannot be taken blindly but require a certain amount of inspection and interpretation.
J. R. ANDERSON. —The movement of the inner arc is in our experience consistent with the movement of the s torm itself. The distribution of the outermost a r c s which are not in the circulation of the storm proper bear no consistent position re lationship to the storm center . Determinations of the movements of these outer arcs give widely varying resu l t s over short per iods of t ime, although there is at t imes evidence of a qualitative relat ionship between their movement and that of the s torm. E r r o r s in movement may be induced by variations in the structure of the storm center, which in turn would cause inconsistencies in the position re l a tionship between the inner a rc and the geometrical center. Such variations in structure are considered to be due to a dynamic upsetting of the force equilibrium established in the storm core and a re themselves significant.
D. ATLAS. —Have you attempted to corre la te the path of the radar center to that of the p ressu re center?
J. R. ANDERSON. —Our data are too limited for that. In 1945 in Florida the hurricane retained its basic structure while passing over a considerable number of reporting stations. We had only two stations to use ; however, there were indications that the radar and pressure centers were not consistent and that the radar center stopped for periods while the p r e s s u r e center maintained a slow but steady movement.
R. C. JORGENSEN. —We have one more suggestion for use of over lays such as we have just presented. Our photographer at Dow got together with the Eastman people in an attempt to work out a system of dyeing negatives different colors which might allow us to examine as many as four t r a n s parencies (each being a different color) by stacking them one on top of the other and viewing the entire
group at one time. By this method it is hoped that movement can be followed by a combination of colors blended from transparence to transparency in such a manner as to describe the exact movement of the rain area in question. This is a completely exper i mental approach, and nothing definite is available at the present time on the use of this system.
UNIDENTIFIED. —I should use projectors and have different colored f i l ters on the p ro jec tors . Have a blue filter on one and a red on another, and what you will get out is yellow where the s to rm coincides. Red and green where the thing moves.
R. C. JORGENSEN. —Well, it would be pretty hard to line them all up for they must be perfectly superimposed on each other. If we had t r anspa r encies such as described above and could lay them one on top of the other, with the ground glass under them, it would be more convenient. If we cannot get colors on the negative, then projection would ce r ta in ly be an in ter im measu re which could be t r ied.
UNIDENTIFIED. —Would you have trouble l ining them up?
R. C. JORGENSEN. —Each projector would have to be moved so that each azimuth ring fell ex actly on the other azimuth ring. Just t ry to line two of them up like that. I can tell you it is a headache , and I am afraid you will need micromete r s c rews on the pro jec tors to keep them together, and the least little vibration will throw them apar t . If they are not in exact alignment, it means nothing because you are looking for very minute echo movements in 15 minutes of s torm movement.
VERTICAL STRUCTURE OF HURRICANE USING VERTICAL SCAN
We do not have a TPS-10 radar. It is the ideal answer to ver t ica l scan. We had the bright idea of using existing equipment to get a small facsimile of the TPS-10 radar by adding a vertical scan switch which will produce a vert ical scan presentation as shown in Fig. 155.
One of the PPI scopes is arranged so that while it is still rotating we can flip a switch and change the Selsyn controls of this scope from the azimuth to the elevation Selsyn system, and as we mechanically raise the antenna in elevation, we get a c r o s s -sectional view of the hurricane. On this part icular view, a base line has been flashed to give a zero axis. You can note the a rcs in the photograph which were formed by the range markers and which give a scale that can be used in both vertical and hor i zontal measurements .
F ig . 156 shows the same scope except that I
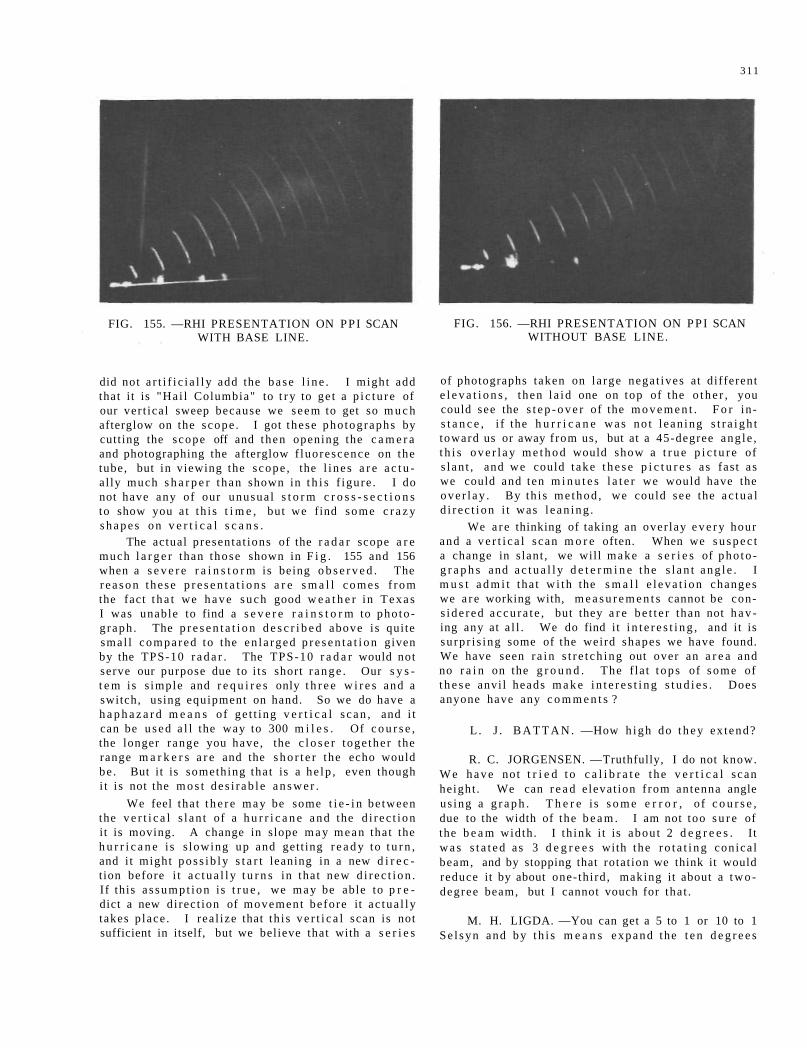
311
FIG. 155. —RHI PRESENTATION ON PPI SCAN WITH BASE LINE.
FIG. 156. —RHI PRESENTATION ON P P I SCAN WITHOUT BASE LINE.
did not a r t i f i c i a l l y add the base l i n e . I might add that i t is "Hai l Columbia" to t r y to ge t a p i c t u r e of our ver t ica l sweep because we seem to get so m u c h afterglow on the scope . I got these pho tographs by cutting the scope off and then opening the c a m e r a and photographing the afterglow f luorescence on the tube, but in viewing the scope , the l i nes a r e a c t u al ly much s h a r p e r than shown in t h i s f igure . I do not have any of our unusua l s t o r m c r o s s - s e c t i o n s to show you a t th i s t i m e , but we find some c r a z y s h a p e s on v e r t i c a l s c a n s .
The actual presenta t ions of the r a d a r scope a r e much l a r g e r than those shown in F i g . 155 and 156 when a s e v e r e r a i n s t o r m is being o b s e r v e d . The r e a s o n the se p r e s e n t a t i o n s a r e s m a l l c o m e s f r o m the fact t h a t we h a v e such good w e a t h e r in T e x a s I was unable to find a s e v e r e r a i n s t o r m to pho to graph . The p r e s e n t a t i o n d e s c r i b e d above i s qui te smal l compared to the en l a rged p r e s e n t a t i o n given by the TPS-10 r a d a r . The TPS-10 r a d a r would not serve our purpose due to i t s short r a n g e . Our s y s t e m is s imple and r e q u i r e s only t h r e e w i r e s and a switch, using equipment on hand. So we do have a h a p h a z a r d m e a n s of ge t t ing v e r t i c a l s c a n , and i t can be u s e d a l l the way to 300 m i l e s . Of c o u r s e , the longer range you have , the c l o s e r toge the r the range m a r k e r s a r e and the s h o r t e r the echo would be . But it is something that is a he lp , even though i t i s not the m o s t de s i r ab l e a n s w e r .
We feel that t h e r e may be some t i e - i n be tween the v e r t i c a l s l an t of a h u r r i c a n e and the d i r ec t ion it is moving. A change in slope m a y m e a n that the h u r r i c a n e i s s lowing up and get t ing r e a d y to t u r n , and i t might pos s ib ly s t a r t leaning in a new d i r e c t ion before i t a c tua l l y t u r n s in that new d i r e c t i o n . I f this a s sumpt ion is t r u e , we may be able to p r e dict a new di rec t ion of movement before it ac tua l ly takes p lace . I rea l ize that th i s v e r t i c a l scan is not sufficient in itself, but we believe that with a s e r i e s
of photographs taken on la rge nega t ives at different e l e v a t i o n s , then l a id one on top of the o t h e r , you could see the s t e p - o v e r of the m o v e m e n t . F o r ins t a n c e , i f the h u r r i c a n e was no t l ean ing s t r a i g h t toward us or away f rom us, but at a 45-degree ang le , t h i s o v e r l a y m e t h o d would show a t r u e p i c t u r e of s l an t , and we could t ake t h e s e p i c t u r e s as fas t a s we could and ten m i n u t e s l a t e r we would have the ove r l ay . By th i s me thod , we could see the a c t u a l d i r ec t i on i t was l ean ing .
We a r e thinking of taking an over lay e v e r y hour and a v e r t i c a l scan m o r e often. When we s u s p e c t a change in s lant , we will make a s e r i e s of p h o t o g r a p h s and a c t u a l l y d e t e r m i n e the s l a n t a n g l e . I m u s t a d m i t tha t w i th the s m a l l e l e v a t i o n changes we a r e working with, m e a s u r e m e n t s cannot be cons ide r ed accu ra t e , but they a r e b e t t e r than not h a v ing any at a l l . We do find it i n t e r e s t i n g , and it is su rp r i s ing some of the weird shapes we have found. We have seen r a i n s t r e t ch ing out over an a r e a and no r a i n on the g r o u n d . The f la t t o p s of some of t h e s e anvi l heads m a k e i n t e r e s t i n g s t u d i e s . Does anyone have any c o m m e n t s ?
L . J . B A T T A N . —How h igh do t h e y ex tend?
R. C. JORGENSEN. —Truthfully, I do not know. W e h a v e not t r i e d t o c a l i b r a t e t h e v e r t i c a l scan height . We can r e a d e levat ion f rom antenna angle us ing a g r a p h . T h e r e i s s o m e e r r o r , o f c o u r s e , due to the width of the b e a m . I am not too s u r e of the b e a m width . I th ink it is abou t 2 d e g r e e s . It w a s s t a t e d as 3 d e g r e e s with the r o t a t i n g conica l beam, and by stopping that rotat ion we think it would reduce it by about one- thi rd , making it about a t w o -degree beam, but I cannot vouch for tha t .
M. H. LIGDA. —You can get a 5 to 1 or 10 to 1 S e l s y n and b y t h i s m e a n s expand the t e n d e g r e e s
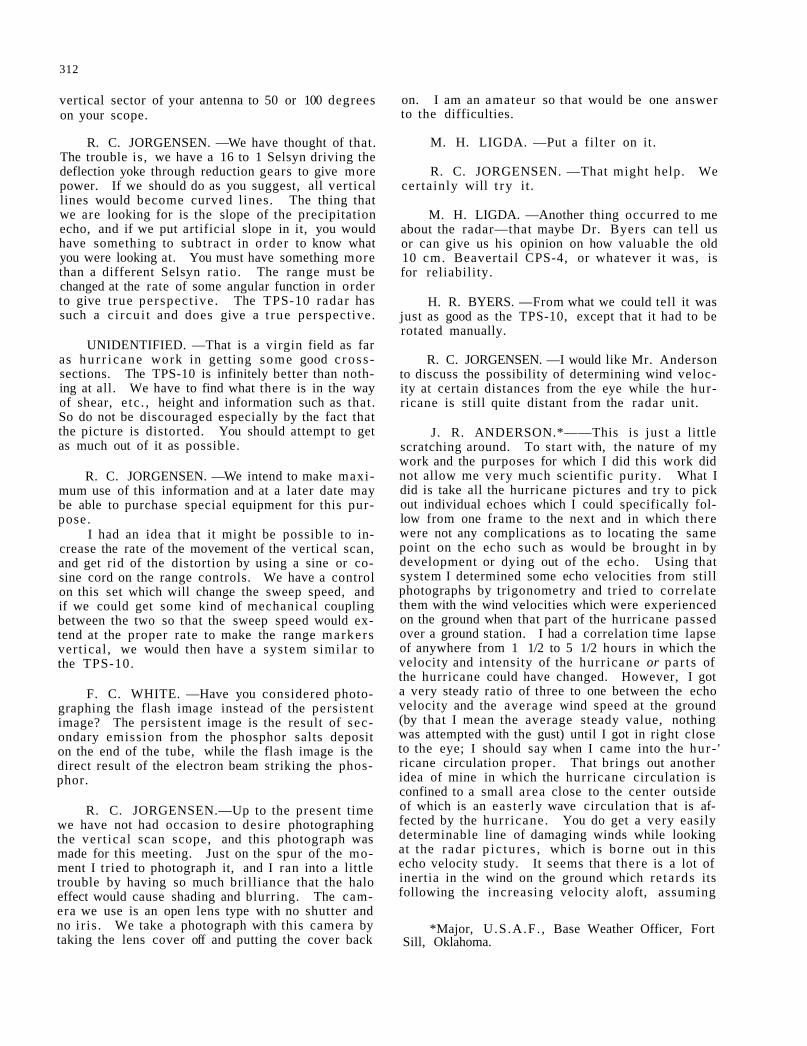
312
vertical sector of your antenna to 50 or 100 degrees on your scope.
R. C. JORGENSEN. —We have thought of that. The trouble is , we have a 16 to 1 Selsyn driving the deflection yoke through reduction gears to give more power. If we should do as you suggest, all vertical lines would become curved l ines. The thing that we are looking for is the slope of the precipitation echo, and if we put artificial slope in it, you would have something to subtract in order to know what you were looking at. You must have something more than a different Selsyn rat io. The range must be changed at the rate of some angular function in order to give t rue perspec t ive . The TPS-10 radar has such a c i rcui t and does give a t rue perspective.
UNIDENTIFIED. —That is a virgin field as far as hu r r i cane work in getting some good c r o s s -sections. The TPS-10 is infinitely better than nothing at all. We have to find what there is in the way of shear, e tc . , height and information such as that. So do not be discouraged especially by the fact that the picture is distorted. You should attempt to get as much out of it as possible.
R. C. JORGENSEN. —We intend to make maximum use of this information and at a later date may be able to purchase special equipment for this purpose.
I had an idea that it might be possible to increase the rate of the movement of the vertical scan, and get rid of the distortion by using a sine or cosine cord on the range controls. We have a control on this set which will change the sweep speed, and if we could get some kind of mechanical coupling between the two so that the sweep speed would extend at the proper rate to make the range markers vert ical , we would then have a system similar to the TPS-10.
F. C. WHITE. —Have you considered photographing the flash image instead of the persistent image? The persistent image is the result of secondary emission from the phosphor salts deposit on the end of the tube, while the flash image is the direct result of the electron beam striking the phosphor.
R. C. JORGENSEN.—Up to the present time we have not had occasion to desire photographing the vert ical scan scope, and this photograph was made for this meeting. Just on the spur of the moment I tried to photograph it, and I ran into a little trouble by having so much brilliance that the halo effect would cause shading and blurring. The camera we use is an open lens type with no shutter and no i r is . We take a photograph with this camera by taking the lens cover off and putting the cover back
on. I am an amateur so that would be one answer to the difficulties.
M. H. LIGDA. —Put a filter on it.
R. C. JORGENSEN. —That might help. We certainly will t ry it .
M. H. LIGDA. —Another thing occurred to me about the radar—that maybe Dr. Byers can tell us or can give us his opinion on how valuable the old 10 cm. Beavertail CPS-4, or whatever it was, is for reliability.
H. R. BYERS. —From what we could tell it was just as good as the TPS-10, except that it had to be rotated manually.
R. C. JORGENSEN. —I would like Mr. Anderson to discuss the possibility of determining wind velocity at certain distances from the eye while the hurricane is still quite distant from the radar unit.
J. R. ANDERSON.*——This is just a little scratching around. To start with, the nature of my work and the purposes for which I did this work did not allow me very much scientific purity. What I did is take all the hurricane pictures and try to pick out individual echoes which I could specifically follow from one frame to the next and in which there were not any complications as to locating the same point on the echo such as would be brought in by development or dying out of the echo. Using that system I determined some echo velocities from still photographs by trigonometry and tried to correlate them with the wind velocities which were experienced on the ground when that part of the hurricane passed over a ground station. I had a correlation time lapse of anywhere from 1 1/2 to 5 1/2 hours in which the velocity and intensity of the hurr icane or par t s of the hurricane could have changed. However, I got a very steady ratio of three to one between the echo velocity and the average wind speed at the ground (by that I mean the average steady value, nothing was attempted with the gust) until I got in right close to the eye; I should say when I came into the hur - ' ricane circulation proper. That brings out another idea of mine in which the hurricane circulation is confined to a small area close to the center outside of which is an easterly wave circulation that is affected by the hurr icane. You do get a very easily determinable line of damaging winds while looking at the radar p i c tu res , which is borne out in this echo velocity study. It seems that there is a lot of inertia in the wind on the ground which re tards its following the increasing velocity aloft, assuming
*Major, U.S.A.F. , Base Weather Officer, Fort Sill, Oklahoma.
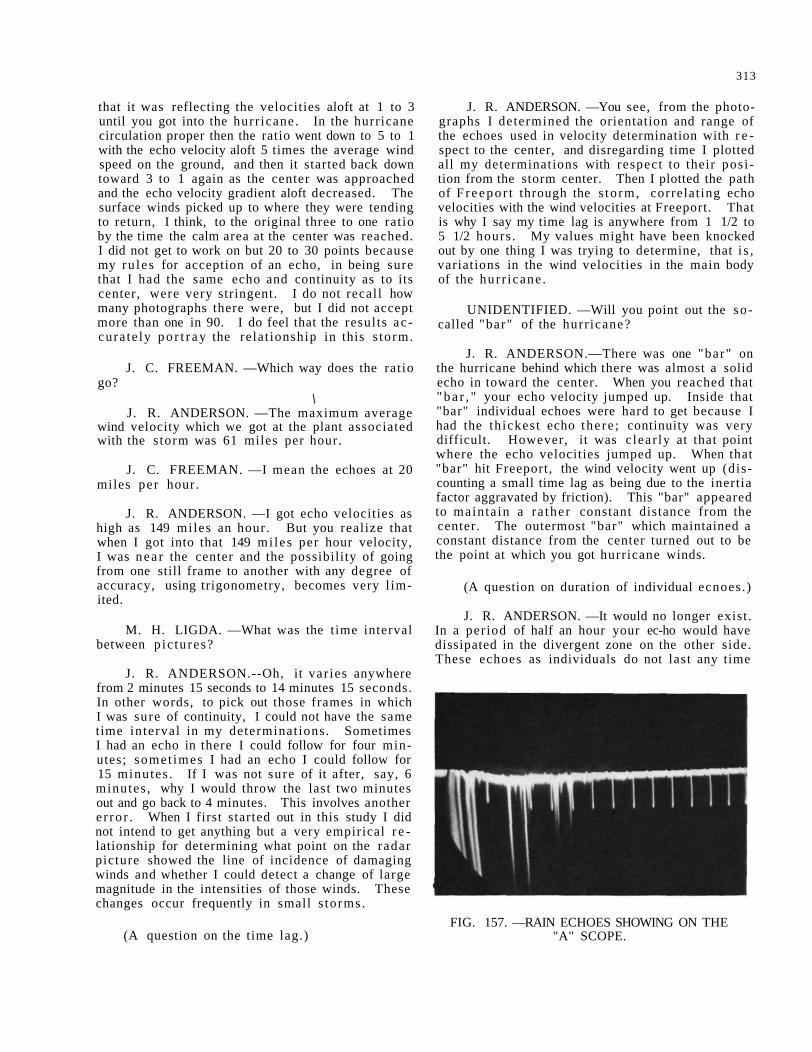
313
that it was reflecting the velocities aloft at 1 to 3 until you got into the hurr icane. In the hurricane circulation proper then the ratio went down to 5 to 1 with the echo velocity aloft 5 times the average wind speed on the ground, and then it started back down toward 3 to 1 again as the center was approached and the echo velocity gradient aloft decreased. The surface winds picked up to where they were tending to return, I think, to the original three to one ratio by the time the calm area at the center was reached. I did not get to work on but 20 to 30 points because my ru les for acception of an echo, in being sure that I had the same echo and continuity as to its center, were very stringent. I do not recall how many photographs there were, but I did not accept more than one in 90. I do feel that the results ac cura te ly p o r t r a y the relat ionship in this s torm.
J. C. FREEMAN. —Which way does the ratio go?
\ J. R. ANDERSON. —The maximum average
wind velocity which we got at the plant associated with the s torm was 61 miles per hour.
J. C. FREEMAN. —I mean the echoes at 20 miles per hour.
J. R. ANDERSON. —I got echo velocities as high as 149 miles an hour. But you realize that when I got into that 149 mi les per hour velocity, I was nea r the center and the possibility of going from one still frame to another with any degree of accuracy, using trigonometry, becomes very l imited.
M. H. LIGDA. —What was the time interval between p ic tures?
J. R. ANDERSON.--Oh, it var ies anywhere from 2 minutes 15 seconds to 14 minutes 15 seconds. In other words, to pick out those frames in which I was sure of continuity, I could not have the same time interval in my determinat ions. Sometimes I had an echo in there I could follow for four minutes; somet imes I had an echo I could follow for 15 minutes . If I was not sure of it after, say, 6 minutes , why I would throw the last two minutes out and go back to 4 minutes. This involves another e r ro r . When I first started out in this study I did not intend to get anything but a very empirical r e lationship for determining what point on the radar picture showed the line of incidence of damaging winds and whether I could detect a change of large magnitude in the intensities of those winds. These changes occur frequently in small s torms.
(A question on the time lag.)
J. R. ANDERSON. —You see, from the photographs I determined the orientation and range of the echoes used in velocity determination with r e spect to the center, and disregarding time I plotted all my determinations with respect to their pos i tion from the storm center. Then I plotted the path of F r e e p o r t through the s to rm, correlat ing echo velocities with the wind velocities at Freeport. That is why I say my time lag is anywhere from 1 1/2 to 5 1/2 hours . My values might have been knocked out by one thing I was trying to determine, that i s , variations in the wind velocities in the main body of the hur r icane .
UNIDENTIFIED. —Will you point out the so-called "bar" of the hurr icane?
J. R. ANDERSON.—There was one "bar" on the hurricane behind which there was almost a solid echo in toward the center. When you reached that " b a r , " your echo velocity jumped up. Inside that "bar" individual echoes were hard to get because I had the th ickest echo there ; continuity was very difficult. However, it was c lear ly at that point where the echo velocities jumped up. When that "bar" hit Freeport, the wind velocity went up (discounting a small time lag as being due to the inertia factor aggravated by friction). This "bar" appeared to mainta in a ra ther constant distance from the center. The outermost "bar" which maintained a constant distance from the center turned out to be the point at which you got hurricane winds.
(A question on duration of individual ecnoes.)
J. R. ANDERSON. —It would no longer exist . In a period of half an hour your ec-ho would have dissipated in the divergent zone on the other side. These echoes as individuals do not last any time
FIG. 157. —RAIN ECHOES SHOWING ON THE "A" SCOPE.
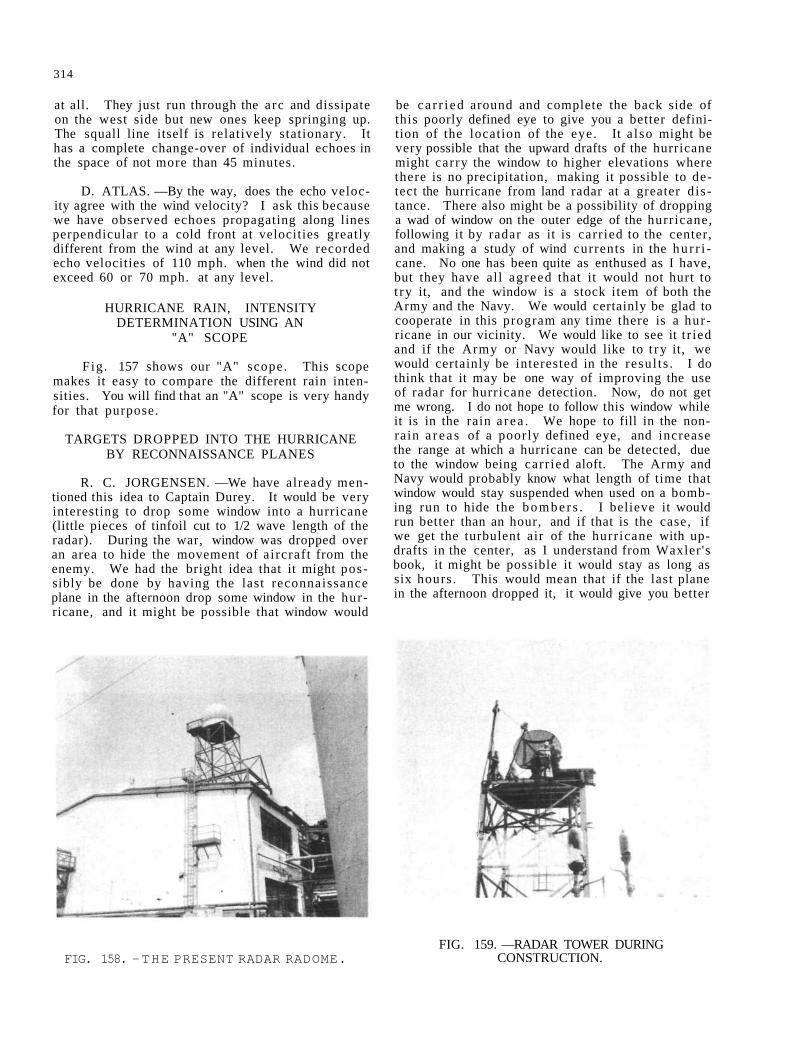
314
at all. They just run through the arc and dissipate on the west side but new ones keep springing up. The squall line itself is relatively stationary. It has a complete change-over of individual echoes in the space of not more than 45 minutes.
D. ATLAS. —By the way, does the echo velocity agree with the wind velocity? I ask this because we have observed echoes propagating along lines perpendicular to a cold front at velocities greatly different from the wind at any level. We recorded echo velocities of 110 mph. when the wind did not exceed 60 or 70 mph. at any level.
HURRICANE RAIN, INTENSITY DETERMINATION USING AN
"A" SCOPE
Fig. 157 shows our "A" scope. This scope makes it easy to compare the different rain intensities. You will find that an "A" scope is very handy for that purpose.
TARGETS DROPPED INTO THE HURRICANE BY RECONNAISSANCE PLANES
R. C. JORGENSEN. —We have already mentioned this idea to Captain Durey. It would be very interesting to drop some window into a hurricane (little pieces of tinfoil cut to 1/2 wave length of the radar). During the war, window was dropped over an area to hide the movement of a ircraf t from the enemy. We had the bright idea that it might possibly be done by having the last reconnaissance plane in the afternoon drop some window in the hurricane, and it might be possible that window would
FIG. 158. —THE PRESENT RADAR RADOME.
be ca r r i ed around and complete the back side of this poorly defined eye to give you a better definition of the location of the eye. It a l so might be very possible that the upward drafts of the hurricane might carry the window to higher elevations where there is no precipitation, making it possible to detect the hurricane from land radar at a greater d is tance. There also might be a possibility of dropping a wad of window on the outer edge of the hurricane, following it by radar as it is carr ied to the center, and making a study of wind currents in the h u r r i cane. No one has been quite as enthused as I have, but they have all agreed that it would not hurt to t ry it, and the window is a stock item of both the Army and the Navy. We would certainly be glad to cooperate in this program any time there is a hurricane in our vicinity. We would like to see it t r ied and if the Army or Navy would like to t ry it, we would certainly be interested in the resul t s . I do think that it may be one way of improving the use of radar for hurricane detection. Now, do not get me wrong. I do not hope to follow this window while it is in the rain a r ea . We hope to fill in the non-rain a r e a s of a poorly defined eye, and increase the range at which a hurricane can be detected, due to the window being carr ied aloft. The Army and Navy would probably know what length of time that window would stay suspended when used on a bombing run to hide the b o m b e r s . I believe it would run better than an hour, and if that is the case, if we get the turbulent air of the hurr icane with up-drafts in the center, as I understand from Waxler 's book, it might be possible it would stay as long as six hours. This would mean that if the last plane in the afternoon dropped it, it would give you better
FIG. 159. —RADAR TOWER DURING CONSTRUCTION.
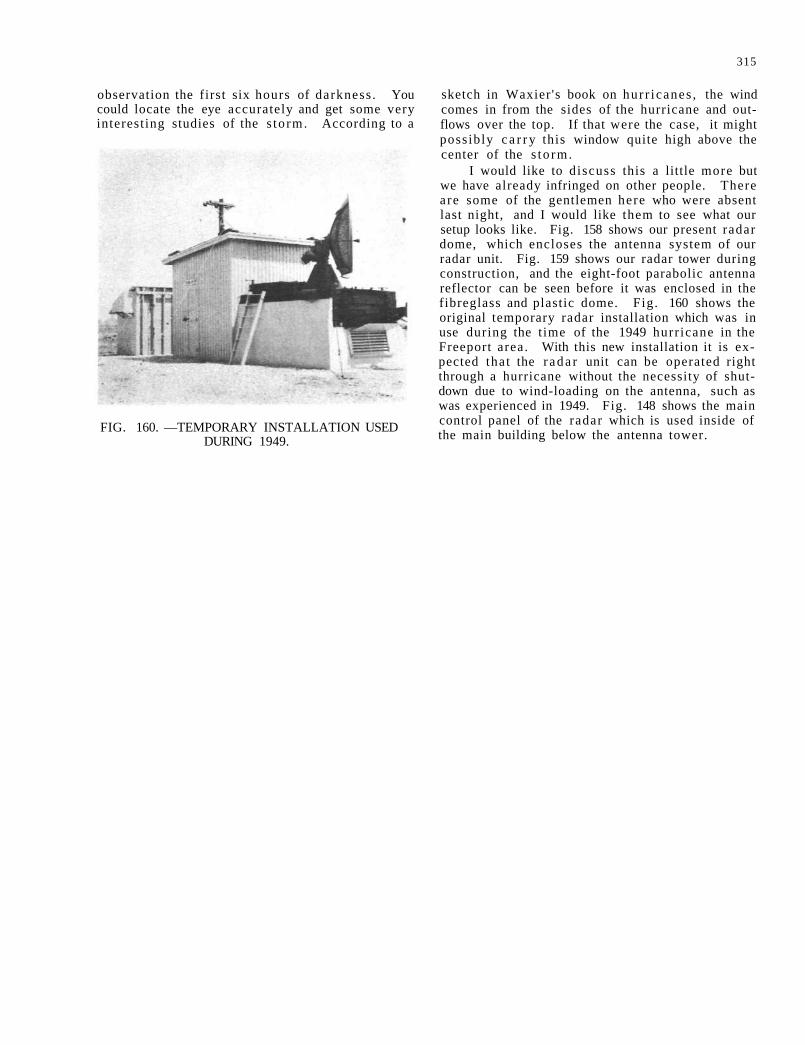
315
observation the first six hours of darkness . You could locate the eye accurately and get some very interesting studies of the s to rm. According to a
FIG. 160. —TEMPORARY INSTALLATION USED DURING 1949.
sketch in Waxier 's book on hur r icanes , the wind comes in from the sides of the hurricane and outflows over the top. If that were the case, it might possibly c a r r y this window quite high above the center of the s to rm.
I would like to discuss this a little more but we have already infringed on other people. There are some of the gentlemen here who were absent last night, and I would like them to see what our setup looks like. Fig. 158 shows our present radar dome, which encloses the antenna system of our radar unit. Fig. 159 shows our radar tower during construction, and the eight-foot parabolic antenna reflector can be seen before it was enclosed in the fibreglass and plastic dome. Fig. 160 shows the original temporary radar installation which was in use during the t ime of the 1949 hurr icane in the Freeport area. With this new installation it is expected that the r a d a r unit can be operated right through a hurricane without the necessity of shutdown due to wind-loading on the antenna, such as was experienced in 1949. Fig. 148 shows the main control panel of the radar which is used inside of the main building below the antenna tower.
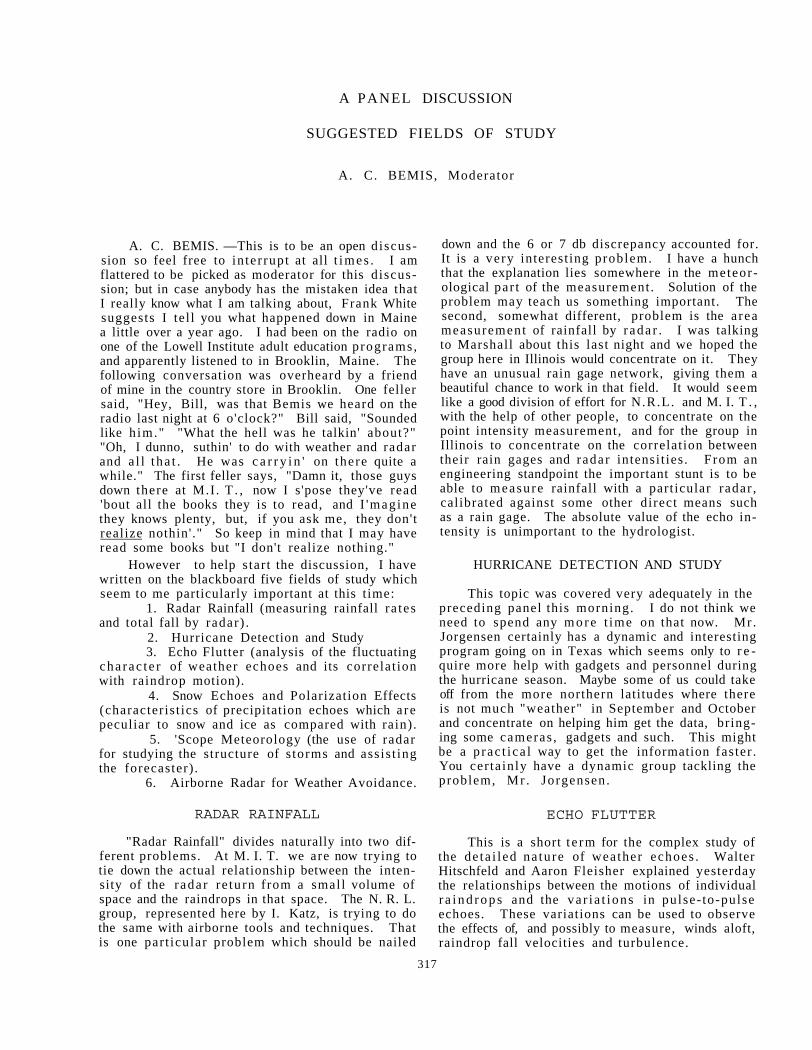
A PANEL DISCUSSION
SUGGESTED FIELDS OF STUDY
A. C. BEMIS, Moderator
A. C. BEMIS. —This is to be an open discussion so feel free to in ter rupt at all t imes . I am flattered to be picked as moderator for this discussion; but in case anybody has the mistaken idea that I really know what I am talking about, Frank White suggests I tel l you what happened down in Maine a little over a year ago. I had been on the radio on one of the Lowell Institute adult education programs, and apparently listened to in Brooklin, Maine. The following conversation was overheard by a friend of mine in the country store in Brooklin. One feller said, "Hey, Bill, was that Bemis we heard on the radio last night at 6 o'clock?" Bill said, "Sounded like h im." "What the hell was he talkin' about?" "Oh, I dunno, suthin' to do with weather and radar and a l l t ha t . He was c a r r y i n ' on there quite a while." The first feller says, "Damn it, those guys down there at M.I . T . , now I s'pose they've read 'bout all the books they is to read, and I 'mag ine they knows plenty, but, if you ask me, they don't realize nothin'." So keep in mind that I may have read some books but "I don't realize nothing."
However to help s tar t the discussion, I have written on the blackboard five fields of study which seem to me particularly important at this t ime:
1. Radar Rainfall (measuring rainfall ra tes and total fall by radar) .
2. Hurricane Detection and Study 3. Echo Flutter (analysis of the fluctuating
cha rac t e r of weather echoes and its correlat ion with raindrop motion).
4. Snow Echoes and Polarization Effects (characterist ics of precipitation echoes which a re peculiar to snow and ice as compared with rain).
5. 'Scope Meteorology (the use of radar for studying the structure of s torms and assis t ing the forecaster) .
6. Airborne Radar for Weather Avoidance.
down and the 6 or 7 db discrepancy accounted for. It is a very interest ing problem. I have a hunch that the explanation lies somewhere in the meteorological par t of the measurement . Solution of the problem may teach us something important. The second, somewhat different, problem is the a rea measurement of rainfall by r ada r . I was talking to Marshall about this last night and we hoped the group here in Illinois would concentrate on it. They have an unusual rain gage network, giving them a beautiful chance to work in that field. It would seem like a good division of effort for N.R.L. and M. I. T . , with the help of other people, to concentrate on the point intensity measurement, and for the group in Illinois to concentrate on the correlation between their rain gages and radar intensi t ies . From an engineering standpoint the important stunt is to be able to measure rainfall with a part icular radar , calibrated against some other direct means such as a rain gage. The absolute value of the echo intensity is unimportant to the hydrologist.
HURRICANE DETECTION AND STUDY
This topic was covered very adequately in the preceding panel this morning. I do not think we need to spend any m o r e t ime on that now. Mr. Jorgensen certainly has a dynamic and interesting program going on in Texas which seems only to r e quire more help with gadgets and personnel during the hurricane season. Maybe some of us could take off from the more northern latitudes where there is not much "weather" in September and October and concentrate on helping him get the data, bringing some cameras , gadgets and such. This might be a p rac t i ca l way to get the information faster . You cer ta inly have a dynamic group tackling the problem, Mr . Jorgensen.
RADAR RAINFALL
"Radar Rainfall" divides naturally into two different problems. At M. I. T. we are now trying to tie down the actual relationship between the intensity of the radar re turn from a small volume of space and the raindrops in that space. The N. R. L. group, represented here by I. Katz, is trying to do the same with airborne tools and techniques. That is one part icular problem which should be nailed
This is a short t e rm for the complex study of the de ta i led na ture of weather echoes . Walter Hitschfeld and Aaron Fleisher explained yesterday the relationships between the motions of individual r a i n d r o p s and the va r i a t ions in pulse- to-pulse echoes. These variations can be used to observe the effects of, and possibly to measure, winds aloft, raindrop fall velocities and turbulence.
317
ECHO FLUTTER
318
One very exciting thing about this approach to turbulence did not get emphasized particularly yes terday. This method of measurement has a unique quality in the field. Most turbulence studies to date have been based on a few point measurements within a large volume of space. With radar, in this case, we get instead of just a few point measurements , billions of them simultaneously. Each individual raindrop is a recording point. The radar and the gadgets we are tying onto it then becomes an analytical machine which is analyzing the data from each one of these individual points. It may well prove to be a most valuable tool in turbulence studies.
The Geophys ics R e s e a r c h Division, of the McGill group and the Mt. Washington group, have a very dynamic and progress ive p rogram in this field.
SCOPE METEOROLOGY
This topic refers to the very important use of radar in weather forecasting. This has been one of our major assignments on the M. I. T. project, but I do not feel we have made much headway on it as yet. We have collected many data and watched many storms on our scopes. This work has educated us considerably and has advanced our knowledge of the s t ruc ture of s torms but it has not put us in a position to be of much help to the forecaster . What we might s t r ive to do is to l ea rn from our r a d a r s and flight observat ions enough about the s t ruc tu re of big cyclonic s to rms so that we can, from the conventional data, specify in much greater detail just what is going to happen within these cyclonic s to rms as they develop, where instability showers will form and so forth. Even when the motion of a storm is well forecast, we often mis s forecasting the amount and placement of the p r e
cipitation. The radar should give us a better clue to the in ternal s t ruc ture of the cyclone and what occurs in greater detail. I am sure there is much internal detail within general cyclonic a reas that is not appreciated.. Within a frontal s to rm that may be 500 to 800 mi les in d iameter there a r e small a reas of convergence and instabilities that a r e , in effect, storms within a storm. There was a s to rm in New England about a month ago which was forecast to be only a few scattered showers, and moderate wind. In eastern Maine we had a big "southeaster" with heavy rain all day, yet it did not appear on the weather maps at all. It behaved like a d i s turbance along a front which had moved off the coast but was not picked up on any of the synoptic maps . Small but intense s to rms of that type may be very important.
AIRBORNE RADAR FOR WEATHER AVOIDANCE
F. C. WHITE. —One of the pract ical applications of radar that we might add to this topic, from the point of view of the people who fly, is the use of airborne radar (of the proper wave length) with the addition of isoecho contours. Preliminary data, obtained by American Airlines during work on the Navy contract, indicates that, by avoiding the a r ea s where isoecho contours converge, a large portion of thunders torm turbulence can be avoided. We should endorse the Navy program which is continuing the American Airline's work with airborne r ada r . The Navy program has two objectives: first , continued investigation of the contour convergence technique, to enable determination of whether or not isoecho contours can display the mos t turbulent portions of thunderstorms; and secondly, a de te r mination of the deterioration of airborne radar d i s play that results from thunderstorm precipitation. This second objective will be attained through the simultaneous use of both three- and ten-centimeter radar during thunderstorm probing flights.
SNOW ECHOES AND POLARIZATION EFFECTS
319
BY
F. C. WHITE, D. M. A. JONES, D. ATLAS, I. KATZ, S. E. REYNOLDS, G. E. STOUT, P. M. AUSTIN, J. C. FREEMAN, H. R. BYERS, R. J. BOUCHER, L. J. BATTAN, G. E. DUNN, E. L. WILLIAMS, D. M. SWINGLE, J. R. ANDERSON, M. H. LIGDA,
H. W. MAYNARD, W. B. GOULD, A. C. BEMIS
A. C. BEMIS. —I agree . Could we go back now to Radar Rainfall. Horace, do you have some comments to make ?
H. R. BYERS. —Well, more or less along the lines of use for hydrologic purposes. Here in Illinois we of the State Water Survey are working for the taxpayers. We have told the taxpayer that we can not m e a s u r e rain that occurs over a small basin with the existing rain gage network, even though the gages are more closely spaced in Illinois than in most s tates .
The re is hardly a week p a s s e s , during the thunderstorm season in Illinois, but that somewhere in the state a small stream floods and serious damage is caused. Radar can do a great deal for meas uring small storms in small basins. As a matter of fact, that is about the only place that radar is unique in rainfall measurements because for large storms and large basins the general rain gage network, while not adequate, is at least close to adequate . So we must concentrate , then, on small s torms and small basins, and that is what is being done in the Goose Creek network that Mr. Jones told us about the other night.
At that discussion I pointed out that the time element is very important, and I think here at this meeting we have stressed a little too much the detail of getting rain measurement and have not considered the most important thing from the hydrolo-gist 's point of view, which radar gives us very obviously, and that is the duration of rainfall over a given spot. Suppose we have a s to rm for which the precipi ta t ion indicated is 3 inches per hour, and we have a little basin and the s to rm is drifting a c r o s s the basin. If it moves a c r o s s in half an hour you get an ordinary situation, an inch and one-half of rain. It may continue raining 3 inches per hour but it moves on ac ross , depositing that rain at all the various stations through the state and nothing spectacular happens in the way of floods. On the other hand, if you have a system of cells, raining 3 inches per hour, that takes , say, three hours in getting across, then you have a real flood. Of course, that is something you can get very eas i ly on r ada r . You can look at your radar and see that this s to rm is developing over that a rea and staying there. Of course, you have serious floods.
We had one precisely like that in Chicago last week. It did not rain very hard but the s torm was there for six hours .
Then the next question is: What about the large a reas of rainfall? The hydrologist wants to know how much rain is falling over a large a rea . Some hydrologists will say if you take in a large enough a rea , say the whole state, then although the rain gages a re quite far apart, you are getting a fairly good sample. Fellows like George Benton are making computations of the total moisture exchange that is taking place in the atmosphere—evaporat ion, precipitation, e t c . , trying to find out just what the hydrologic balance i s . We are not sure—I am not sure he is either—that we know what the rainfall is over a large area. Well, radar, of course, can do that , for it not only samples as rain gages do but scans every square inch of area. What we need, then, is a future development of some means of totalizing the scan of the radar echo so we can then get some idea of the rainfall. Even if we were 100% off in these rainfall ra tes , we would still be doing better than we are with the rain gage networks. I would like to suggest the development of some means of masking off the radar scope successively for a group of different basins and then have some kind of photo-mul t ip l ie r , s torage cell , or something that will keep totalizing the echo that is received over each one of these basins over the entire range of the radar . Then you could have it arranged so it would ring a bell or something after the rain exceeded a certain value over any basin that would indicate a flood. That is something that could be done without too much trouble, and I hope that we can have some development like that in the near future.
A. C. BEMIS. —That surely sounds like the right plan of. attack to m e .
D. M. A. JONES. —I would like to bring up the point that here in Illinois we just recently have had a graphic illustration of the inadequacy of raindrop s ize distribution measu remen t s . If you or somebody else does not do it, we will have to do it.
D. ATLAS. —Dr. Byers' suggestion for m e a s -
DISCUSSION
320
uring total fall over a watershed is well taken. Until now we have been neglecting our responsibility to the hydrometeorologist by failing to provide pract i cal techniques for this purpose. Recent electronic developments, such as storage tubes, make echo totalization feasible both in space and t ime. But there is another hope for areal rainfall integration; that is the use of the otherwise bothersome attenuation at short wave lengths. Since attenuation has been shown to be linearly related to rainfall rate, the attenuation through a s torm is proportional to the integral of rain intensity. In order to measure attenuation, use must be made of two wave lengths, one of which is not attenuated (i. e . , 10 cm. ).
I. KATZ. —One of the difficulties we have is that we are trying to measure rainfall distributions on the ground and looking with radar at a reas aloft. To circumvent this difficulty either an airborne or balloonborne equipment should be developed which will give us good drop size information. As I understand it, Bob Cunningham and I a re the only two people in the United States working on an airborne disdrometer or anything like it. I may be wrong, but I think that is true. There is an uneven dis t r i bution of emphasis here; most people are working directly or indirectly on radar but very few people a r e working on meteorological instrumentation to get the important atmospheric parameters we need to accompany the radar data.
A. M. BEMIS. —There a re a number working on drop sizes at the ground.
I. KATZ. —Yes, but we must obtain drop size informat ion in the regions aloft from which the r a d a r echo or ig inates .
S. E. REYNOLDS. —It seems to me that we might mention some other classifications here; one is techniques for the use and application of radar in cloud physics, particularly those relating to precipitation mechanisms. It seems to us that one of the most important times to study these is at the time of the initial radar return.
There is one problem that is bothering us cons iderably now. That is the discrepancy between Thunderstorm Project and our data relating to the height at which the initial radar return occurs. As most of you remember, the Thunderstorm Project data show that it occurs somewhere a little warmer than -5° C . , whereas ours show that it occurs around -15° C. It seems to me that the important point here is, if the Project data are right (and in. my opinion they are much better than ours because they were taken with much better instrumentation), it almost precludes the initiation of precipitation in their storms from an ice mechanism, whereas our returns occurring first at -15 at least very strongly
suggest that it did start in accordance with the c las sical Bergeron theory in our storms. I think a little further study on this point, which we hope to do fairly soon, might clear it up. I think it is very important to find out if precipitation in the Midwest begins in the warm regions of clouds and in the Southwest begins around -15 .
UNIDENTIFIED.—(A statement to the effect that the particles might have fallen to the observed position.)
S. E. REYNOLDS. —I do not think that will work in the case of a thunders torm because (while the Thunderstorm Project did not take photographs of the clouds) our data show that the clouds a re going up at the ra te of around 1000 feet per minute for 4 or 5 minutes before the radar echo appears, which means that these things could not have fallen back down in that length of t ime.
UNIDENTIFIED. —(Apparently a statement to the effect that the circulation is complex.)
. S. E. REYNOLDS.—Well, it happens that this is another thing which we can see very well out there in our clouds. Individual updrafts affect limited regions of the clouds; that i s , the part which is going up is not several miles in diameter—it is pe r haps several thousand feet. The current s t ructure in the region in which the initial radar re tu rn ' ap-pears seems a quite simple thing. It is simply going up.
A. C. BEMIS. —It seems to me this brief d i s cussion points out that he re in cloud physics, as in a l l the r e s t of the meteorology, we find each s torm is different from the one before.. It is not going to be sufficient to get one beautiful, complete set of m e a s u r e m e n t s on one s to rm. We cannot make our measurements just once, but must r e peat them a great many t imes in different par ts of the world. This makes Katz' comment that we need more instrumentation even more significant.
G. E. STOUT. —I should like to add at this time that if at any time anyone wishes to use the data from the rain gage network you are welcome. Furthermore, if anyone desires to coordinate flight observations with rain gage network data, and sur face observations with rain gage network data and surface r ada r photos, we would be very happy to cooperate.
D. ATLAS. —I feel that we should come to some conclusion with regard to the present state of knowl-
During the discussion there were comments by persons who were unidentified in the recording.
321
edge of raindrop size distribution and the course which further research on this problem should take. It is my personal opinion that we have gone about as far as possible in determining the correlation of summation d6 to rain intensity. At least a half dozen independent studies have shown a useful cor relation of these parameters with standard e r r o r s of estimate ranging from about 20% to 40%. This is undoubtedly due to the variations in rainfall char acteristics within a storm and from storm to s torm. When we consider the various conditions under which precipitation elements are generated and the many ways in which they may be modified in falling to the ground, it is a wonder that the variabili ty is not g r e a t e r . Let us admit that this is the inherent limit and work on reducing the e r r o r s with which the radar can measure summation One of the practical problems in this regard is the determination of the range to which radar observations can yield useful measures of rain intensity in the face of increased beam dimensions, sampling altitude, and attenuation.
Lest my statement be misinterpreted, I would like to add that there is much to learn about drop size distribution and its relation to the generation and growth mechanism. It is that further study is necessary. Perhaps an understanding of the basic physics of size distribution will provide useful guides for the use of radar- ra in correlat ions.
P. M. AUSTIN. —It may well be that we have gone as far as is feasible in attempting to obtain a genera l relat ionship between rainfall rate and radar signal intensity. I believe, however, that a more accurate or detailed relationship must be established if we wish to study quantitatively the details of storm structure which have been observed, in a qualitative manner, on the radar scopes. In order to do this, the drop size, rainfall rate and radar signal intensity studies should be continued, but with more emphasis on the behavior of these variables within any one and the differences or s imilarities from one storm to another. Also, if there are any geographical differences in the composition of rain, this should be taken into consideration.
D. M. A. JONES. —Is this not saying in another way that each radar set must be calibrated as an instrument by itself?
P. M. AUSTIN. —I think that you cannot rely on the r a d a r p a r a m e t e r s for accurate measure ment. Probably a standard target should be used, or you might calibrate the radar against a rain gage.
J. C. FREEMAN. —As an uneducated outside observer, it seems to me that it is possible to calibrate the radar set locally every day there is rain and at least get some measure of the precipitation
all over the scope.
H. R. BYERS. —I should like to make one s ta tement before we go any further. In spite of what my own colleagues say here in Illinois, I think that the difference in rainfall between Boston and Champaign is overemphasized.
R. J. BOUCHER. —Drop size distributions from all the data worked up to date show that there are no essential differences in rainfall with locat ion. We have data from Canada, Cambridge, Washington, and Hawaii, and all of them agree quite closely. We would not expect any differences due to locality.
D. M. A. JONES. —I think that Dr. Byers m i s interpreted my statement somewhat. We are working with thunderstorms, and since most of our rain is derived from that, it may be that we have more thunderstorms than do other regions.
J. C. FREEMAN. —Here is an important p r a c tical question about this radar rainfall. Does this conference recommend that every group interested in hydrology get itself a r ada r set with which to measure precipitation?
A. C. BEMIS. —It seems to me that the d i s cussion here might serve to recommend such action.
J. C. FREEMAN. —I want this made clear: Is now the time to s tar t doing it everywhere?
A. C. BEMIS. —I would. It appears the Illinois group is having good succe'ss.
H. R. BYERS. —I think every organization seriously concerned with the problem of hydrology and rainfall measurement should enter this field. I must say that Dr. Buswell has done a remarkable job of developing the State Water Survey to a level of scientific achievement in this regard not approached elsewhere.
L. J. BATTAN. —If one uses the radar echoes just to draw the isohyetals to fill in the spaces between the rain gages, I think that is getting some use out of it.
A. C. BEMIS. —— Could we go on to another topic? I would like to hear more about the a i r borne program, particularly the turbulence part of it, which might be a combination of "Echo Flut ters" and "Airborne Radar for Weather Avoidance.''
F. C. WHITE. —Some may not be familiar with the work that was done by American Airlines during 1947, 1948, and 1949 under contract to the De-
322
partment of the Navy, Bureau of Aeronautics. During the summer of 1950 similar work was accomplished by the Naval Air Station, Patuxent River, under the direction of the Bureau of Aeronautics. Both of these programs included flight testing of a special circuitry attached to three-centimeter a i r borne radar which displays thunderstorm precip i tation. The circuitry creates two isoecho contours, a threshold contour, and an erasure contour, separa ted by some ten decibels of signal level. The effective gust velocity (a m e a s u r e of turbulence resu l t ing from thunders torm gust iness) was r e corded by the National Advisory Committee for Aeronautics (NACA). Through analysis of pictures of the three-centimeter radar PPI display, a correlation between squeeze of the contours and turbulence was found to exist. Where the contours were close together (the change in rainfall rate per mile was considerable), more turbulence and stronger gusts were encountered. These tentative conclusions were based on limited data, some 600 miles of flying. It should be recalled that the data were analyzed at approximately l/2 mile range to e l iminate the effect of signal attenuation on the display of contours. The Navy is in the process of es tablishing an airborne radar project at Naval Air Station, Patuxent River, to continue this flight testing and to attempt to obtain further correlation of the relationship between contour separation and turbulence. The Navy also will determine the exact effect of attenuation of the th ree -cen t imete r signal by taking simultaneous data using a ten-centimeter a i rborne radar sys tem. The Navy plans to use a PB1 (B-17G) aircraft which should be flying by the spring of 1952.
A. C. BEMIS. —I would like to emphasize one point in connection with the use of radar for studying the structure of s torms. It is most important to make constant use of vert ical sections through the atmosphere such as are given by an RHI. Cunningham, in his precipitation physics studies, has always used our RHI records much more than PPI . Since the information of precipitation requires ve r tical motion, it is obvious that vertical sections are valuable; yet we still lean too heavily on the PPI . One reason is that few radars are equipped for RHI scan, but I fear another reason is that it is too easy to look at a PPI . The PPI is such an at tract ive thing to just sit and gaze at. There it i s , neatly plotted for you and easy to understand. You know just where it is raining. However, if we are really going to get into the business and l ea rn how the ra in is formed and where it is coming from, we need vertical information. Actually, it is not hard to get. Bowen, in Australia, simply turned a PPI radar on its side and immediately got very valuable information.
I am looking forward keenly to the use of more
cloud base and top radars as bringing a tremendous advance in this general cloud physics field. There has been too little t ie-in in the past in radar work between the precipitation and the clouds from which it comes , With these cloud se t s , as Mr . Gould showed you yes terday, you have the relationship beautifully presented. You can observe the thickening cloud deck overhead and actually see the p r e cipitation begin to fall out of it. The Geophysical Research Division at Watertown also has a vertical pointing set to detect clouds. We are now getting some real data in this field, and they should be very important . I hope more and more investigators will come to the use of vertical scans whether they get the information from a vertical pointing cloud set or some scanning type such as the TPS-10.
Marshall made an interesting comment on this las t night. He said they had taken the i r TPS-10 down to the weather station in Montreal. Marshall 's group was not using it very much, and the weather boys were very keen about it and used it a lot. They had planned to rig it up for PPI scan but just had not gotten around to it. Marshall thought that this was probably a good thing, forcing the weather bureau people to use the RHI. He found them more enthusiastic about radar than most weather bureau groups who had been using PPI . As far as forecasting goes, routine use of a PPI adds little to what one learns from the teletype circui ts .
We would like to hear about the Weather Bureau ' s plans for the increasing use of r ada r . We know you are using it quite extensively now but would like to know more about your plans for the future, Mr. Dunn.
G. E. DUNN.*—There is a map on the wall in the room to our left, and I a lso have one here, which shows current and proposed radar installat ions . You can see that we will have very good coverage in the tornado and squall line section of the Great Plains of the Middle West. Also in the hurricane-susceptible area along the Gulf of Mexico and south Atlantic Coast, coverage will be ample. Still another project, now underway, is the establishment of radar installations for storm detection around the major cities of the United States, such as Washington, New York, and Chicago. When present plans a re completed, about 60 percent of the United States, especially the eastern two-thirds of the country, will pos se s s a fairly good storm detection network.
UNIDENTIFIED. —(A question in regard to the possibility of cooperative installations by the United States Government and private industry. )
*Meteorologist in Charge, U. S. Weather Bureau, Chicago, Illinois.
323
G. E. DUNN. —I believe M.I. T. has a radar installation, and it would seem that some cooperative agreement could be worked out which would provide the Boston Forecast Center with the information which the latter could use in its local forecast services. At the present time radars a r e installed and in operation in New York, Washington, Miami, Tampa (the latter in cooperation with the University of Florida); Burrwood, Louisiana; Brownsville, Texas; Wichita Falls, Texas; Wichita, Kansas; and Norfolk, Nebraska. Cooperative agreements have been worked out with private companies at several locations--the Dow Chemical Company at F reepor t , Texas is one. Another at Grand Isle, Louisiana has been discontinued. Similar installations are located at Gainesville, Florida, in connection with the University of Florida, and another at Victoria, Texas, with the Copano Research Foundation. Cooperative arrangements of one sor t or another between the Weather Bureau and private industry are in effect at Corpus Chris t i , with the Cent ra l Power and Light Company, and the one here at El Paso and Champaign with the State Water Survey Division. Plans a re underway for a radar installation at the Weather Bureau Airport Station in Chicago in cooperation with the Commonwealth Edison Company. Most of these installations are the APS-2F. During the next year or two Weather Bureau installations are planned, budget permitting, at Amari l lo, Texas; Charleston, South Carolina; Hatteras, North Carolina; Topeka; St. Louis; Phi ladelphia; Boston; Detroit; Buffalo; Goodland, Kansas; Tulsa; Des Moines; Dodge City; and Springfield, Missour i .
In connection with hurricane detection it is expected that the Navy at Jacksonville, Florida, will shortly install a radar there or perhaps has already. There is another radar installation at a base near Melborne, Florida, and two or three additional in the Bahama Islands a r e contemplated in the next year or two, as well as several in Cuba. From the standpoint of hurricane forecasting in the southeastern United States, the entire coast line will be covered quite well from Cape Hatteras around to Brownsville and extending seaward over a large portion of the Gulf of Mexico and southeastward as far as San Juan and much of the northern Caribbean. Thus it seems fair to say that already, or at least within the next few yea r s , radar is a very useful tool in hurricane forecasting.
UNIDENTIFIED. —Are all your installations APS-2 ' s?
G. E. DUNN. —I believe we have that equipment at every Weather Bureau station except New York, which has an APQ-13.
A. C. BEMIS,—Another radar coming up in a few years is the new CPS-9, as soon as Ed Williams
gets them built. Don, do you have any remarks to make about your proposed network for the siting of the CPS-9's?
D. M. SWINGLE. —Siting the CPS-9 is something that I have nothing to do with directly, but the responsibility is with the people who are really buying them, the Air Weather Service.
G. E. STOUT. —I might add a little bit about it. They tell me that one of the first sets will go in at Chanute Field so that they can train operators and maintenance personnel. They a re also planning a ring of stations in the Caribbean a rea for hurricane work.
UNIDENTIFIED. —How many CPS-9 sets a re on orde r ?
E. L. WILLIAMS. —Forty-eight. The Navy is getting five.
D. M. SWINGLE. —There is just one thing I want to mention about getting the information from the APQ-13, that is the difficulty in respect to maintenance due to mil i tary routine, e tc . and a great deal of difficulty in their siting. Now, the APQ-13 network may not be a first class network, totally independent of the qualities of the set. It is an unfortunate situation since the APQ-13 in itself is capable of doing a lot more for us than it is doing.
A. C. BEMIS. —I would very much like to hear some helpful suggestions on the problem of the use of radar for synoptic purposes. We have had it in mind for a long time, but we have not made any concrete headway on it as yet.
J. C. FREEMAN. —The hourly reporting stations are too far apart to help us find synoptic models of what we see in the radar scope. However, at many of these stat ions continuous r eco rds of pressure, temperature and wind are made. These continuous records can help fill in the large blank spaces between the stations for slowly changing pa t t e rn s .
Severa l t imes during the conference I have emphasized the need for study of the radar scope by synoptic meteorologists whose primary interest is in the weather. Such men can see things that a meteorologist whose primary interest is radar or cloud physics will pass over.
For example, when Tepper was studying squall lines and saw t ime- lapse movies of those ac ross the cloud physics nets , it was obvious, to him that some "line" was conning across the scope and s tar t ing the formation of thunderstorm cells. This observation has also been made by H. Maynard here at Urbana and by other weather men.
3 2 4
A. C. BEMIS. —The trouble with most of us is that we tend to use our radars for our own edification and amusement instead of making a real effort to analyze what we see, classify it, and then get it down on paper for the benefit of others. The t ime has a r r i v e d when a textbook or operations manual must be written.
UNIDENTIFIED. —Are there not two different synoptic codes floating around just to complicate things in t ransmit t ing data-?
A. C. BEMIS. —Well, codes are a big problem, but f irst we must decide what information is to be transmitted.
H. R. BYERS. —I might point out that in the Thunderstorm Project there has been quite a study made of squall lines. If you remember, there was not too much in the chapter of our repor t on the subject. In connection with that, Captain Pope of the Air Weather Service made a study which I think was put out as some sort of Air Weather Study (Restricted, unfortunately), in which he took observations of squall lines and thunders torms from the hourly teletype reports compared with what you see by r a d a r . I cannot quote direct ly, but there was one day in which t h e r e was more than the usual number of thunderstorms over the region of Chicago, Great Lakes to Pittsburgh and down to Tennessee, covered by our range on the CPS-6. On that day not a single hourly weather station reported a thunderstorm. Some did report distant lightning.
I should also like to ask Mr. Dunn of the Weather Bureau if it is not true that you make great use of reports in regard to squall l ines.
G. E. DUNN. —We make considerable use of the repor t s coming to us from El Paso , Illinois. However, under present procedures for the Service "A" teletype c i rcui ts , C .A.A. is not required to relay rareps from one circuit to another so that if a forecast ing center is not on the same pr imary circuit with the radar station, receipt of the radar information is quite i r r e g u l a r , to say the least.
J. R. ANDERSON. —Wasting of weather information, the way in which it is taken down at individual stations, is pitiful from a record standpoint, to put it brutally, as far as utilizing it for research purposes is concerned. There is nothing I have seen to be extracted from this data in a usable form. A method such as photographs should be inaugurated for record purposes. I have seen no pressure applied to have photographs made at all these places . It is a very simple process to do it. I have seen no system of taking synoptic weather information off of the scope in code form that I thought came anywhere near approaching the problem of record
information in a usable form, say to Mr . Dunn.
D. ATLAS. —I feel at this time that we shall not be able to fully utilize the available data unless the re is some manner of t ransmit t ing the radar p ic tures to a central collecting point where they a re integrated into a comprehensive map of p r e cipitation echoes. There is so much information in the character of the echoes which cannot be coded, unless, of course, we have an echo catalogue. As for techniques, there are a number of possible ways of t ransmit t ing and combining the scope displays for r e - t r a n s m i s s i o n . These might make use of existing coaxial and microwave circuits , although I have no idea of the expense.
UNIDENTIFIED. —What type of communication network would you use? Would you have some special type of machine at each station?
D. ATLAS. —No, I think you could do this with the present facsimile machine if the video data are transmitted to a central point for re - t ransmiss ion on the fax network.
G. E. STOUT.—I think that the whole communication problem has to be settled by some governmental agency. To me looking on from the outside, and not condemning the Weather Bureau, it appea r s that they a re a little slow realizing the problems in jumping on the ball and getting things moving. The Water Survey volunteered to send in r a r e p s , and we found that there were two codes, the Air Weather Service code, and a Weather Bureau code. F u r t h e r m o r e , there may be another code. I have seen some rarep reports that I could not decipher . A group at Memphis uses another code which is a combination of the two codes. As far as the plotting goes, we were very successful in giving radar reports to a local radio station. This was discontinued as we moved the radar station from El Paso to Champaign.
UNIDENTIFIED. —You can put it on a television station when you get set up here .
G. E. STOUT. —That is right; we just made a copy of what was showing on the scope and relayed it to the radio station in a layman's language.
UNIDENTIFIED. —Mr. Jorgensen brought up the point of using the longitude and latitude rather than the range and azimuth for radar stations. I should think it would save quite a bit of time in the Weather Bureau station in putting the scope information down in a usable form.
UNIDENTIFIED. —Possibly, but you all know that land lines a re extremely crowded. It appears
325
to me offhand that you may need latitude and longitude to degrees, minutes, and seconds, to get sufficient detail.
D. SWINGLE. —-We have the know-how to t r ans mit all the stuff by video to a central collection agency. We have yet to find the man with the dollars. It is quite expensive. There are other schemes for getting it through cheaper. These a r e the things that have to be threshed out f irst .
UNIDENTIFIED. —I was once a forecaster, and it seemed that there was much stuff being t r ans mitted that was worthless for forecasting purposes. I should want to see, before we go any further, a cri t ical survey of what value the information will have to a forecaster. I wonder whether we cannot eliminate some of the information we now have on the teletype.
A. C. BEMIS. —Is it not true that, in general, the forecaster has much more information than he has t ime to use , some of which may be valuable and some which may not?
G. E. DUNN. —Yes, but you will find that the River forecasters and Flood Control people will want river stages and rainfall repor ts , and the Clima-tologists will want crop reports . There is certain other information transmitted on the circuits which has little to do with forecasting and certainly the competition for circuit t ime is quite severe.
E. L. WILLIAMS. —This whole problem of transmitting information from the radar has been discussed over and over and is of great importance. I would like to ask a question. Is there any agency now actively working on this p rob lem? Second, what agency is responsible for it? Third, if there is none and it is not going on, how does it get started so that something can be done about the problem? There are going to be 48 CPS-9's going out into the field, and what is going to be done with the information from them ? How is it going to be used on top of al l the other meteorological information being t ransmit ted?
H. R. BYERS. —A lot of people could, probably, answer that better than I, but I will tackle it. The whole transmission system is decided on in the first place by an international commission. Secondly, there is the joint committee of the Weather Bureau, Air Force , and Navy; they work very closely together, and I think they a re rather conscientious about it. But it is only par t ia l ly their responsibility. The people in communications also must discover ways of getting information transmitted. If you have ever attended an international convention on communications, you will appreciate some
of the problems.
A. C. BEMIS. —I feel you are neglecting problem number one. Our major assignment in all this is getting the bas ic data ready to t r ansmi t . Of course, it is hard to do this until you know the capacity of the transmission channel which is to be used; but I still feel we are a long way from knowing what information we should take from the source. We understand the simple problem of transmitting P P I information on a squall line or cold front or any other sharply defined region of precipitation that a person can place accurately on a map. But there a r e many other cha rac t e r i s t i c s of precipitation echoes that may be significant yet much more difficult to in terpre t and certainly more difficult to describe.
R. J. BOUCHER. —Since there seems to be no one project assigned to the problem of fully exploiting the radar as a tool of synoptic meteorology, I would like to suggest the organization of such a project whose sole purpose would be to devise techniques for obtaining from the radar the most useful information for meteorological purposes.
A. C. BEMIS.—Mr. Gould assigned that project to us at M. I. T. quite some time ago, but we have not made much headway with it as yet. I would a p preciate suggestions as to how we might attack it more effectively.
M. H. LIGDA. —One of the chief difficulties is that r a d a r essent ia l ly te l ls you one thing and that is where it is raining. It does tell you th is , but it does not tell you the wind velocity, t emperature, and other data which are useful. Because of this fact the forecaster, the analyst, and the physical meteorologist have not yet been able to es tablish definite or c lear-cut relations between radar indications and synoptic conditions. Rareps , as such, a re of very little general use to the continental fo recas te r s at present . That is one of the main reasons the present work is progressing so slowly. It is primarily a problem of interpretation, and I have a feeling that this whole business is drifting of its own accord towards the conventional ideas of data transmission. I am a little bit afraid of this whole idea of getting, for instance, a lot of fancy fax equipment going and providing every weather base with the precipitation pattern over the whole United Sta tes . It is going to be an awful looking mess for one thing. The second thing is that, to be frank, we do not know just what it means yet. I b e lieve that it is going to be necessary to think more in terms of typing or indexing the PPI scope in t e r m s of such quantit ies as the cell life, duration, and ver t ical extent of cells—work which was s tar ted by such people as Mather and McDowell, but needs
326
further extension. Looking at it more abstract ly, we might compare our present situation to the ear ly days of aerological ascents. Isolated observations were available but interpretat ion of the sounding in terms of stability air mass type, and other p a r amete r s so vital to present day forecasting, was not poss ible . It is just at that phase of the game where we now find ourselves. It is very much the same type of problem; the conclusions are obvious.
D. SWINGLE. —The Signal Corps and the Air Weather Service have been talking over a joint study to determine just how much information is needed for weather purposes. In particular, we have been considering some sort of a limited network as an experimental proposition in order to find out how far we want to go in this business of t ransmission of data. For instance, on the CPS-9 we have range resolution of about half a mile, while at 100 miles the azimuth resolution is only about three mi les . For the general use of the data there is probably no point in directly transmitting the data to better than three miles. This is the sort of thing we hope to uncover. If we discover that all we need to know is whether there is a rain echo within a given ten-square-mile area, then data transmission will be come a relatively simple problem. If we want further information, the problem will be more difficult. These are the things we have to look into and find out how much we have to transmit.
A. C. BEMIS.—I certainly hope we can use more radar information than just where it is ra ining. Radar can give us much additional meteorological information.
UNIDENTIFIED. —How much information do you want? You and I look at it and observe a s torm moving at 25 miles per hour. The RHI shows that it is developing vertically. But how much of this information do you want to send? To what extent do you want to pre-interpret the data? To what extent do you want to transmit every detail? These a re the things we want to decide before we set up any sort of a network. As Herb says, "Just exactly what information do we want?"
UNIDENTIFIED. —What do you mean by " c l a s sifying p ic tures" ? Do you mean that you hope to be able to pick out on the' scope certain models, so that, for example, if you have a squall line, your scope appearance would match some picture in your classification book?
S. E. REYNOLDS. —It seems to me we might come a lot closer to picking out general types. It is going to be a long time before you get a par t icular synoptic situation repeated.
UNIDENTIFIED. —The difficulty with RHI is that you get ver t ica l sections through the a tmosphere, yet if you try to t ransmit volume information the task is enormous.
S. E. REYNOLDS. —It might be easier to s tar t with the PPI and get a synoptic picture out of the PPI .
M. H. LIGDA. —Well, anybody who has had quite a bit of experience looking at radar scopes gets at least a vague idea of what the weather is like without r e fe rence to a synoptic map. You get a pretty good impression of how long the precipitation is going to last (which is just about as good as the conventional New England forecasting), subject to coast line effects, etc. You get a pretty good idea from looking at the PPI scope whether the prec ip i tation is due to convective or warm frontal action. Rain and snow have their own characteristic appearance on the PPI scope. This is just an accumulation of experience, and it certainly can be sys tematized in such a manner that can be transmitted to other persons up the line who a r e going to have the stuff hit them in another eight or nine hours and tell them what to expect.
H. W. MAYNARD.*—The trouble with trying to line up different classifications is that they may run into the thousands.
M. H. LIGDA.—I do not believe that there will be that many classif ications. I think it would be more like fifty.
A. C. BEMIS. —I want to ask Mr. Gould a ques tion about the base and top radar. We were speaking a while ago of the terrific importance of vert ical sections and the valuable information that one gets from a "cloud s e t . " I believe there a re only two such radars that are now operating, yours at Belmar and At las ' machine at Watertown. Is there any chance of getting continuous weather data from these two sets so that we can attempt to analyze it, using the same procedure that we now use for joint observations with our two CPS-9 ' s ? Can we begin to make synoptic s tudies with the cloud se t? Is that going on already?
W. B. GOULD. —No, that has not been going on. I think something is needed along these lines. I have learned today that Dave has similar equipment working in Watertown. It would be possible, I should think, to take day-by-day records from the two sets and compare them, and possibly we might then be able to gain some experience. We have not been running our set regularly, but we should s tar t in doing it on a regular basis in a month or so.
A. C. BEMIS. —Good. I think the weather people there in the Met section would be keen to jump onto that program and start correlating it with the synoptic situation.
G. E. STOUT. —I believe you can classify these PPI pictures into various types like we do the synoptic weather map, like a cold front, etc. You can break them down into a series of types, and not too many different cases either. We have observed a couple of cases which we think are associated with tornado situations. I think it is possible to c las sify them and not have ten thousand classifications either.
*Meteorologist, Illinois State Water Survey, Urbana, Illinois.
CONFERENCE REGISTRATION
Abbott, T. W., Dean, College of Liberal Arts and Sciences, Southern Illinois University, Carbon-dale, Illinois.
Abbott, Mrs . T. W., Carbondale, Illinois. Abplanalp, C. C . , Dis t r ic t Manager, Wallace &
Tiernan C o . , Chicago, Ill inois. Adams, Roger A., Head, Department of Chemistry,
University of Illinois, Urbana, Illinois. Adams, Mrs . Roger A. , Urbana, Illinois. Albright, William, Assis tant Professor of Elec
t r i c a l E n g i n e e r i n g , Univers i ty of Illinois, Champaign, Illinois.
Alquist, F. N . , Dow Chemical Company, Midland, Michigan.
Ambrose, H. H. , Graduate Student, University of Iowa, Iowa City, Iowa.
Anderson, Edward M., Partner, Wilson & Anderson, Engineers, Champaign, Illinois.
Anderson, Frank W., Chemist, Urbana-Champaign Sanitary District, Urbana, Illinois.
Anderson, James R., Major, U . S . A . F . , Fort Sill, Oklahoma.
Anderson, Merl in H . , Vice P res iden t , General Filter Co . , Ames, Iowa.
Anderson, Robert H. , C. K. Willett Construction Engineers, Dixon, Illinois.
Andrews, R. C. , Engineer, Bakelite Co. , Ottawa, Illinois.
Appleman, Herber t S . , Research Meteorologist, Chief STB, Air Weather Service, DSS, Washington 20, D. C.
Aschenbrenner, Rodney, Graduate Student, Univers i ty of Illinois, Homer, Illinois.
Aten, R. E . , Student, University of Illinois, Urbana, Illinois.
Atlas, David, Meteorologist, Air Force Cambridge Research Center, Newton Centre, Mass.
Austin, Pauline M., Staff Member, Weather Radar Resea rch , Massachuset ts Institute of Technology, Concord, Massachuse t t s .
Azzaro, Alice, Typist, State Water Survey Division, Rantoul, Illinois.
Babbitt, H. E . , Professor of Sanitary Engineering, University of Illinois, Urbana, Illinois.
Baker, M. M., Asst. Eng. 1, Sta. Eff., Commonwealth-Edison Co., Pekin, Illinois.
Balkum, E. T . , Graduate Student, University of Illinois, Urbana, Illinois.
Banachowicz, Stanley, Instructor, Adv. Wx. Equip., Chanute Field, Rantoul, Illinois.
Bandish, William E . , T/Sgt., U.S.A. F. (A.W.S.) , Rantoul, Illinois.
Bardwell, R. A. , Engineer of Tests , Chicago and Eas te rn Illinois Railway, Danville, Illinois.
Bardwell, R. C. , Superintendent of Water Supply, Chesapeake and Ohio Railway, Richmond, Va.
Barr , Douglas W., Drainage Engineer, Division of Waters, State of Minnesota, White Bear Lake, Minnesota.
Barron, Edgar G., Hydraulic Engineer, U. S. Geological Survey, Louisville, Kentucky.
Bartow, Edward, Professor of Chemistry and Chemical Engineering (Emeritus), State University of Iowa, Iowa City, Iowa.
Bartow, Virginia, Assistant Professor of Chemistry, University of Illinois, Urbana, Illinois.
Battan, Louis J . , Meteorologist , Cook Electr ic Co. and University of Chicago, Chicago 49, Ill.
Bauman, Robe r t H . , Sales Manager , Raytheon Mfg. Co . , Chicago, Illinois.
Baumann, E. R., Research Associate in Civil Engineering, University of Illinois, Champaign, Ill.
Bays, Carl A., President, Carl A. Bays & Assoc . , Inc. , Urbana, Illinois.
Beattie, Homer J . , M/Sgt., Chanute Field, Illinois. Beatty, George F . , Assis tant , State Water Sur
vey, Cowan, Indiana. Beauregard, Milton F . , T/Sgt . , Weather Equip
ment Technician, A. W.S., Chanute Field, Ill. Bechert, Charles H., Director, Division of Water
Resources, Indiana Department of Conservation, Indianapolis, Indiana.
Becker, William J . , Major, Project O, Air Proving Ground, Hq. 3200 Proof Test Wing, Eglin Air Force Base, Florida.
Beeson, H. R. , Conservationist, City of Decatur, Decatur, Illinois.
Behrman, A. S . , Consultant, Chicago 6, Illinois. Beling, Ear l H. , Beling Engineering Consultants,
Moline, Illinois. Bemis, Alan C. , Research Associate, Massachu
setts Institute of Technology, Concord, Mass . Bennion, V. R., District Engineer, U. S. Geological
Survey, Iowa City, Iowa. Bennison, E. W. , Edward E. Johnson, Inc . , St.
Paul 4, Minnesota. Bensing, Eric B . , Water Chemist, Hiram Walker
and Sons, Peoria, Illinois. Benton, George S., Assistant Professor, Dept. of
Civil Engineering, Johns Hopkins University, Baltimore, Maryland.
Bergen, Stephen, Researcher, Conservation Foundation, New York, New York.
Berglund, D. A . , Chemical Engineer, City Water Department, Rockford, Illinois.
Billings, Norman, Hydrologist, Michigan Water Resources Commission, Lansing, Michigan.
Bird, Joseph M . , Lt . Col . , Chief, Operational Analysis Division, Headquarters, Air Weather Service, Washington 25, D. C.
327
328
Bishay, Mouris A., Graduate Student, Civil Engineering, University of Illinois, Champaign, Ill.
Blanchard, Duncan C., Research Associate in Meteorology, Woods Hole Oceanographic Institution, Woods Hole, Mass .
Bodenschatz, Ar thur , Ass i s tan t Chemist , State Water Survey, Champaign, I l l inois .
Bogs, George J . , Salesman, U. S. Pipe and Foundry Co., Chicago 3, Illinois.
B o r d e r s , John, Util i t ies Depar tment Manager, Socony Vacuum Oil Co. , East St. Louis, Ill.
Boucher, Roland J . , Research Meteorologist, Mt. Washington Observatory, Cambridge, Mass.
Boyer, M. C . , Associate Professor of Hydraulic Engineering, State University of Iowa, Iowa City, Iowa.
Brater , E. F . , Professor of Hydraulic Engineering, University of Michigan, Ann Arbor, Mich.
Briggs, G. F . , Field Engineer, Edward E. Johnson, Inc. , St. Paul, Minnesota.
Brinkman, William H. , Chanute Air Force Base, Ur.bana, Illinois.
Britten, Leslie L. , T/Sgt., Chanute Field Air Base, Paxton, Illinois.
Brooks, R. W., District Manager, Layne Western Co., Aurora, Illinois.
Brown, Winton C., Capt., Forecaster B r . , Chanute Air Force Base, Urbana, Illinois.
Bruin, Jack, Engineering Assistant , State Water Survey, Champaign, Illinois.
Bruin, Mrs. Jack, Champaign, Illinois. Brune, Gunnar M. , Regional Sedimentation Spe
cialist, Soil Conservation Service, Milwaukee 3, Wisconsin.
Bruns, R. B . , District Representative, Permuti t Company, Decatur, Illinois.
Buhle, M. B. , Associate Geologist, State Geological Survey, Champaign, Illinois.
Buswell, A. M. , Chief, State Water Survey Division, Urbana, Illinois.
Buswell, Mrs . A. M., Urbana, Illinois. Buxton, E. Brewster , Superintendent of Meteor
ology, Chicago and Southern Air Lines, Inc . , Memphis, Tennessee.
Byers , H. R., Chairman, Department of Meteorology, University of Chicago, Chicago, Illinois.
Carlson, Gordon V. , Superintendent of Utilities, University of Illinois, Urbana, Illinois.
Carnahan, Robert L . , Research Staff Assistant , Johns Hopkins University, Bal t imore, Md.
Car ter , R. W., Hydraulic Engineer, U. S. Geological Survey, Atlanta, Georgia.
Cartwright, Robert C., T/Sgt., U .S .A .F . , Chanute Air Force Base, Rantoul, Illinois.
Cerutt, John E . , Field Engineer, State Water Conservation Board, Montpelier, Vermont.
Chamberlain, Car l C. , Assistant Engineer, State Water Survey Division, Urbana, Illinois.
Chastain. H omer L . , Commiss ione r of Public Property, City of Decatur, Decatur, Illinois.
Chemetz, D. B . , Inst ructor , Advanced Meteorology, Chanute Air Force Base, Rantoul, Ill.
Chinn, O. W., Director, Kentucky Flood Control and Water Usage Division, Frankfort, Kentucky.
Chow, Ven Te , A s s i s t a n t in Civil Engineering, University of Illinois, Urbana, Illinois.
Clark, Bruce B., Capt. , Instructor, Chanute Air Force Base, Rantoul, Illinois.
Clark, E. S . , Bacter iologis t , State Department of Public Health, Springfield, Illinois.
Claussen, Walter F . , Research Assistant Professor, State Water Survey Division, Urbana, Illinois.
Cleavelin, Ervin L . , J r . , M/Sgt . , Chanute Air Force Base, Rantoul, Illinois.
Clemons, David D . , S/Sgt. , U. S . A . F . , Chanute Air Force Base, Rantoul, Illinois.
Cosby, J ames R . , Elect ronics Engineer, Fr iez Inst. Div. Bendix, Towson, Maryland.
Cowser, K. E . , Senior Sanitary Engineer, Illinois Health Department, Champaign, Illinois.
Crawford, L. C . , District Engineer, U. S. Geological Survey, Columbus 14, Ohio.
Cremer, Charles W., Student, University of Illinois, Champaign, Illinois.
Critchlow, Howard T. , Director and Chief Engineer, New Jersey Division of Water Policy and Supply, Trenton, N. J.
Crowley, Edward L . , Chanute Air Force Base, Rantoul, I l l inois .
Culp, R. W., M/Sgt., U .S .A.F . , A.W.S. , Rantoul, Illinois.
Cunningham, Rober t M . , R e s e a r c h Associate , Massachusetts Institute of Technology, Weather-Radar, Lincoln, Massachusetts.
Cutler, John, Steam and Power Engineer , Corn Products Refining C o . , Chicago 6, Illinois.
Cutler, Mrs . John, Oak Park , Illinois.
Dalrymple, Tate, Hydraulic Engineer, U. S. Geological Survey, Washington, D. C.
Daniels, Warren S . , Hydraulic Engineer , U. S. Geological Survey, Champaign, Illinois.
Davidson, Donald S. , Project Engineer, General Electr ic Company, Schenectady, New York.
Davis, Gordon E . , Associate Engineer, U. S. Geological Survey, Indianapolis, Indiana.
Dawson, F. M . , Dean, State University of Iowa, and Member, Iowa Natural Resources Council, Iowa City, Iowa.
Dean, Gernard, Capt., Office of Chief Signal Officer, Washington, D. C.
Deaton, Tully, Chief Engineer , Boys ' Training School, St. Charles , Illinois.
DeBerard, W. W., City Engineer, City of Chicago, Chicago, Illinois.
Dee, John F . , S /Sgt . , U . S . A . F . , Chanute Air Force Base, Rantoul, Illinois.
329
Degler, Howard E. , Technical Director, The Marley Co. , Inc. , Kansas City, Kansas.
DeJong, G. Edward , Sanitary Engineer , Beling Engineering Consultants, Moline, Illinois.
Dellert , Robert , Student, University of Illinois, Springfield, Illinois.
Denhart, Bonnie, Urbana, Illinois. Dial, E. N. , Student, University of Illinois, Urbana,
Illinois. Dietz, Jess C . , Associate Professor of Sanitary
Engineering, University of Illinois, Urbana, Illinois.
Dietz,. Mrs . J. C. , Champaign, Illinois. Dillman, Jewel G., Laboratory Technician, State
Water Survey Division, Champaign, Illinois. Doland, J. J . , Professor of Hydraulic Engineer
ing, University of Illinois, Champaign, Illinois. Doland, Miss Florence, Champaign, Illinois. Douglas, R. H . , Meteorologist , Meteorological
Service of Canada, Eastview, Ottawa, Ontario, Canada.
Douglas, Mrs. R. H., Ottawa, Ontario, Canada. Drescher, Wm. J . , District Engineer, U. S. Geo
logical Survey, Madison, Wisconsin. Druley, J. E . , Water Engineer, El Paso Natural
Gas Co. , El Paso , Texas. Dunn, Gordon E . , Meteorologist in Charge, U. S.
Weather Bureau, Chicago, Illinois. Durham, Lyle W., Dept. of Weather, U . S . A . F .
Technical School, Urbana, Il l inois.
Easterwood, H. W., J r . , Engineering Associate, Feedwaters , Inc . , Chicago Heights, Illinois.
Eichelberger , Clark, American Association for United Nations, Inc. , New York, N. Y.
Einstein, H. A., Associate Professor of Mechanical Engineering, University of California, Berkeley, California.
Ekblaw, George E . , Geologist, State Geological Survey, Urbana, Illinois.
Elliott, Wm. J . , Regional Manager, Feedwaters, Inc., Chicago 4, Illinois.
Engle, C. Hobart, Director, Department of Registration and Education, Springfield, Illinois.
Engle, Mrs. C. Hobart, Chicago, Illinois. Englis, Duane T . , Professor of Chemistry, Uni
versity of Illinois, Urbana, Illinois. Erikson, J ames , Student, University of Illinois,
Chicago 28, Illinois. Esse r , Ted, Student, University of Illinois, Cham
paign, Illinois. Everitt , W. L . , Dean of College of Engineering,
University of Illinois, Urbana, Illinois. Everitt , Mrs . W. L . , Urbana, Illinois. Everson, Roy B . , President, Everson Manufactur
ing Co., Chicago, Illinois.
Farnsworth, Gerald, Engineering Assistant, State Water Survey Division, Champaign, Illinois.
Fatz, John C., Radar Technician, State Water Survey Division, Champaign, Illinois.
Favre, Don, Student, University of Illinois, Urbana, Illinois.
Fe i t shans , Myron H . , Chanute Weather School, Rankin, Illinois.
Fielder, Benton, J r . , Capt., U . S . A . F . , Weather Radar Research Plane, Hanscom Airport, Bedford, Massachusetts.
Fish, R. E . , Hydraulic Engineer, U. S. Geological Survey, Raleigh, North Carolina.
F i s h e r , Richard F . , Ass is tant Geologist, State Geological Survey, Urbana, Il l inois.
F leming, C. J . , Student, Universi ty of Illinois, Urbana, Illinois.
Fleisher, Aaron, Research Associate, Massachusetts Institute of Technology, Cambridge, Mass .
Fletcher, Charles, Research Assistant Professor , Dept. of Aeronautical Engineering, University of Illinois, Champaign, Illinois.
Foley, Frank C . , Geologist, Illinois Geological Survey, Champaign, Illinois.
Foltz, Verlin W., Student, University of Illinois, Champaign, Illinois.
F o s t e r , John W. , Ass i s tan t Geologist , Illinois Geological Survey, Champaign, Illinois.
Fos te r , Harrie E . , J r . , Meteorologist, Weather Radar Research Project, Massachusetts Institute of Technology, Brockton, Massachusetts.
Fradel , Michael A . , M/Sgt. , Chanute Air Force Base, Illinois.
France , William C . , S/Sgt., U . S . A . F . , Chanute Air Force Base, Illinois.
F r e e l , Wil . , Associate Professor of Civil Engineering, Purdue University, West Lafayette, Indiana.
F reeman , John C . , J r . , Senior Engineer , Cook Research Laboratory, Chicago 37, Illinois.
F re l l sen , Sidney A . , Director, State Division of Waters , St. Pau l 1, Minnesota.
F ry , Alber t S . , Chief, Hydraul ic Data Branch, Tennessee Valley Authority, Knoxville, Tenn.
Funk, Marilou, Oak Park, Illinois. Funk, M r s . , Oak Park, Illinois.
Gaillard, John F . , M/Sgt., Instructor, U .S .A .F . , Rantoul, Illinois.
Galezio, E. T . , Chemist, Berghoff Brg . Corp . , For t Wayne, Indiana.
Gallaher, Wm. U., Superintendent, Appleton Water Department, Appleton, Wisconsin.
Galvanoni, R. B . , Engineer, RFD Health Department, Rockford, Illinois.
Gardner, J. R., Principal Engineer, Warren and Van Praag, Inc . , Decatur, Illinois.
Garton, H. L . , Engineer , Testing. Department, Commonwealth Edison Co . , Chicago, Illinois.
Garvey, William L . , Graduate School, Sanitary Engineering, Purdue University, West Lafayette, Indiana.
330
Gates, Charles W., Graduate Student, Purdue University, Chicago, Illinois.
Gerber , W. D . , Engineer Emeri tus , State Water Survey Division, Urbana, Illinois.
Gerhardt, John R. , Assistant Director, Electr ical Engineering Research Laboratory, University of Texas, Austin, Texas.
Gerr ish, C. J . , M/Sgt., Chanute Air Force Base, Illinois.
Gerrity, James B., M/Sgt., U.S.A.F., Air Weather Service, Chanute Air Force Base, Illinois.
Gi lc res t , B. R . , Hydraulic Engineer , Corps of Engineers - Army, Cincinnati, Ohio.
Gifford, Rober t T . , T / S g t . , Chanute Air Force Base , Rantoul, Illinois.
Godfrey, Richard G., Hydraulic Engineer, U. S. Geological Survey, Champaign, Illinois.
Goodell, Warren F . , Economic Analyst, Illinois Division of Waterways, Urbana, Illinois.
Goodrich, R. D. , Chief Engineer, Upper Colorado River Commission, Grand Junction, Colorado.
Gottschalk, L. C . , Head, Sedimentation Section, Soil Conservation Service, Washington, D. C.
Gould, William B . , Radio Engineer, Signal Corps Engineering Laboratories, Elberon, N. J.
Granger, Dale W., Hydraulic Engineer, Michigan Water Resources Commission, Lansing, Mich.
Grawe, Oliver R., Chairman, Geology Department, Missour i School of Mines, Rolla, Missouri .
Gray, Horace M. , Professor of Economics, Universi ty of Illinois, Urbana, Illinois.
Gray, Mrs . Horace M., Urbana, Illinois. Grigg, Donald D . , Instructor, Advanced Weather
Equipment, Chanute Air Force Base, Champaign, Illinois.
Grimwood, R i c h a r d , Chanute Air F o r c e Base, Rantoul, Illinois.
Gronfield, R. E . , Vice President of Manufacturing, A. E. Staley Manufacturing Co., Decatur, Ill.
Groustra, Harold A. , Chemical Engineer, Stover Water Softener Co. , West Chicago, Illinois.
Guy, George A. , J r . , Chief, Equipment Development Branch, Headquarters, Air Weather Service, Andrews Air Force Base, Washington 25, D. C.
Guyton, William F . , Consulting Ground-Water Hy-drologis t , White, Guyton & Barnes , Austin, Texas .
Hack, George D . , State Water Survey Division, Urbana, I l l inois .
Hackett, J a m e s E . , Ass i s t an t Geologist , State Geological Survey, Urbana, Illinois.
Hagen, D. S . , Chief Steam and Power Engineer, Corn Products Refinery C o . , Argo, Illinois.
Hahn, Char les L . , Agr icul tura l Engineer, Ohio Department of Natural Resources, Division of Water, Columbus, Ohio.
Hallon, J a m e s C . , M/Sgt . , Advanced Weather, Chanute Air Force Base, Loda, Illinois.
Haltom, C . , S tenographer , State Water Survey Division, Champaign, Illinois.
Hammond, John W., General Sales Manager, F r i e z Instrument Division, Bendix Aviation Corporation, Towson 4, Maryland.
Hansen, Palmer H. , M/Sgt . , Chanute Air Force Base , Rantoul, Illinois.
Hanson, Ross , Associate Engineer , State Water Survey Division, Champaign, Illinois.
Hanson, Mrs . Ross, Champaign, Illinois. -Harnek, Pat r ick J . , Cook Research Laboratory,
Chicago, Illinois. Harrel l , J . H. , J r . , Electronics Engineer, New
Mexico Insti tute of Technology and Mining, Socorro, New Mexico.
Harr is , Ralph C . , M/Sgt., Chanute Air Force Base , Rantoul, Illinois.
Hart, J. Les l i e , Western Sales Manager, U. S. Pipe and Foundry Co . , Chicago 3, Illinois.
Hatfield, Wm. D. , Superintendent, Sanitary Dist r ic t , Decatur, Illinois.
Hathaway, S. D. , Research Assistant, Electr ical Engineering Department, University of Illinois, Champaign, Illinois.
Hawkins, Ken, Turbine Pump Salesman, Harry Alter & Sons, Davenport, Iowa.
Hay, R. C., Professor of Soil and Water Engineering, University of Illinois, Urbana, Illinois.
Hayden, Austin J . , Division Field Superintendent, Green Giant Company, Le Sueur, Minnesota.
Hays, Ralph M., lst Lt . , U . S . A . F . , Urbana, Ill. Hazen, Richard, Consulting Engineer, New York 17,
New York. Healy, E. R . , Supervising Engineer , Northern
Il l inois Water C o r p . , Champaign, Illinois. Healy, Mrs . E. R., Champaign, Illinois. Heffernen, John C . , S/Sgt . , Chanute Air Force
Base, Rantoul, Illinois. Henley, Laurel M., Assistant Chemist, State Water
Survey Division, Champaign, Illinois, Henley, M r s . Laurel M. , Champaign, Illinois. Hertz, Raymond F . , Student, University of Illinois,
Urbana, Illinois. Hiatt, William E . , Chief, Hydrologic Services Di
vision, U. S. Weather Bureau, Washington, D. C.
Hill, Edward F . , J r . , Electronics Project Engineer, The Glenn L. Martin Co. , Baltimore 3, Maryland.
Hill, Harold H., T/Sgt., 3349th Squadron (Weather), Chanute Air Force Base, Rantoul, Illinois.
Hiser, Homer W., Meteorologist, State Water Survey Division, Chicago 37, Illinois.
Hitschfeld, W. , Lec tu re r , R e s e a r c h Associate, Physics Department, McGill University, Montreal, Ontario, Canada.
Hodgson, Wm. J . , Chief Engineer, Pekin Water Works C o . , Pekin, I l l inois.
Holmes, Henry R. , T/Sgt . , U . S . A . F . , Chanute Air F o r c e Base, Rantoul, Il l inois.
331
Hoover, Albert M. , T /Sg t . , Chanute Air Force Base, Rantoul, Illinois.
Horrigan, Philip A. , Graduate College, University of Illinois, Urbana, Illinois.
Houmes, Robert E . , M/Sgt . , Chanute Air Force Base , Illinois.
Howe, J. W., Head, Dept. Mech. and Hydr., State University of Iowa, Iowa City, Iowa.
Howson, L. R., Consulting Engineer, Chicago, Ill. Howson, Mrs. L. R., Chicago, Illinois. Hsu, H. C . , Research Associa te , University of
Iowa, Iowa City, Iowa. Huber, John R . , Student, University of Illinois,
Urbana, Illinois. Hudson, H. E . , J r . , Head, Engineering Subdivi
sion, State Water Survey Division, Urbana, Ill. Hudson, Mrs. H. E . , Champaign, Illinois. Hughes, Charles E . , J r . , Design Engineer, Warren
& Van Praag, Inc., Decatur, Illinois. Hunter, Robert J . , Student, University of Illinois,
Urbana, Illinois. Huntington, W. C., Professor of Civil Engineering
and Head of the Depar tment , University of Illinois, Urbana, Illinois.
Hurdle, Melvin W., C. K. Willett, Construction Engineers , Polo, Illinois.
Isom, H. H., Chief Engineer, State Women's Reformatory, Dwight, Illinois.
Jacklin, C . , Ass i s t an t Di rec tor of Engineering Research, National Aluminate Corp., Chicago, Illinois.
Jacobs, H a r r y W. , M/Sg t . , Chanute Air Force Base, Paxton, Illinois.
Jedlicka, John J . , Junior Geologist, Argonne National Laboratory, Chicago, Illinois.
Jeffords, R. M., Iowa Geological Survey and U. S. Geological Survey, Iowa City, Iowa.
Jens , S. W. , Consulting Engineer, St. Louis 5, Missouri .
Jens , Mrs . S. W., St. Louis 5, Missouri . Jepson, Carl, Chief Engineer, Elgin Water Depart
ment, Elgin, Illinois. Johnk, Carl T. , Special Research Assistant, Elec
tr ical Engineering Department, University of Illinois, Urbana, Illinois.
Johnson, Lennart C., Student, University of Illinois, Champaign, Illinois.
Jones, Douglas M. A., Assistant Professional Scientist, State Water Survey Division, Urbana, Illinois.
Jones, Eugene G. , Field Engineer, State Water Survey Division, Alton, Illinois.
Jones, Mrs . E. G. , Alton, Illinois. Jorgensen, Roy C., Radar Engineer, Dow Chemical
Company, Freepor t , Texas. Joslyn, Ray O. , Pres ident , Layne Western Co. ,
Kansas City, Missour i .
Kahnemuyopur, Jamshid, Student, University of Illinois, Champaign, Illinois.
Katz, I . , Physicist , Naval Research Laboratory, Washington, D. C.
Keeley, Dean F . , Student, University of Illinois, Champaign, Illinois.
Keezell, David B . , Cap t . , Corps of Engineers , Student Officer, University of Illinois, Champaign, Illinois.
Killebrew, H. F . , Assistant Engineering Division Manager , Socony Vacuum Oil C o . , East St. Louis, Illinois.
Kindsvater, C. E . , Professor of Civil Engineering, Georgia Institute of Technology, Atlanta, Georgia.
King, Robert M. , Assistant Chemist, State Water Survey Division, Champaign, Illinois.
Klaer, Fred H., J r . , Chief, Hydrogeological Division, Ranney Method Water Supplies, Inc . , Columbus, Ohio.
Knodec, Adolph R. , Associate Professional Scient is t , State Water Survey Division, Peoria Heights, I l l inois.
Kuhlmann, Frank H., District Manager, Dearborn Chemical Co., St. Louis, Missouri.
LaDue, Wendell R. , Chief Engineer and Superintendent, Bureau of Water and Sewerage, Akron, Ohio.
LaDue, M r s . Wendell R . , Akron, Ohio. Lane, Russel l W., Chemist , State Water Survey
Division, Champaign, Illinois. Lane, M r s . Russell W., Champaign, Illinois. Langhaar , Henry L . , P r o f e s s o r of Theoret ical
and Applied Mechanics, University of Illinois, Urbana, Illinois.
Lansford, Wallace M. , Professor of Theoretical and Applied Mechanics, University of Illinois, Urbana, Illinois.
Lansford, Mrs. W, M., Champaign, Illinois. Larsen , Henning, Dean, College of Libera l Arts
and Sciences, University of Illinois, Urbana, Illinois.
Larsen, Mrs . Henning, Urbana, Illinois. Larson, Bernt O., Associate Professor of General
Engineering Drawing, University of Illinois, Urbana, Illinois.
Larson, C. C. , Superintendent of Water Purification, Springfield, Illinois.
Larson, Mrs. C. C. , Springfield, Illinois. Larson, Roy F . , Chemist, A. E. Staley Manufac
turing Co., Decatur, Illinois. Larson, T. E. , Head, Chemistry Subdivision, State
Water Survey Division, Champaign, Illinois. Larson, Mrs . T. E . , Urbana, Illinois. Latour, Marinos H., Assistant Research Professor,
University of Flor ida , Gainesville, Flor ida. Laursen, E. M., Research Engineer, Institute of
Hydraulic Research, Iowa City, Iowa.
332
Lawrence, Norman L . , Research Assistant, State Water Survey Division, Champaign, Illinois.
Lem, P. A., 1st Lt., U. S. A. F . , Instructor, Chanute Air Force Base, Rantoul, Illinois.
Lembke, W. D. , Assistant in Agricultural Engineering, University of Illinois, Urbana, Illinois.
Lenz, Arno T . , Professor of Civil Engineering, University of Wisconsin, Madison 5, Wisconsin.
Lenz, Mrs . A. T. , Madison, Wisconsin. Ligda, Myron G. H., Research Assistant, Massa
chusetts Institute of Technology, Concord, Mass . Lin, Pin-Nam, Research Associate, University of
Iowa, Iowa City, Iowa. Lorusso, Michael R., M/Sgt., Weather Forecas ter -
Instructor , U . S . A . F . , Champaign, Illinois.
McAndrews, Francis C, Engineer, Bureau of Aeronautics, Ma-5, Rw2W10, Washington 25, D. C.
McCown, Dorothy, Typist and Stenographer, State Water Survey Division, St. Joseph, Illinois.
McGuire, George E . , J r . , T/Sgt . , 3399th Tech. Tng. Sqdn., Chanute Air Force Base, Ludlow, Illinois.
McLean, C. J . , General Hydraulic Engineer, Public Service Co. , Chicago, Illinois.
McLean, John E . , Student, University of Illinois, Urbana, Illinois.
Margrave, G. E . , Sanitary Engineer, State Health Department, Springfield, Illinois.
Marshall, Charles J., Chief, Search Radar Branch, Wright Air Development Center, Dayton 9, Ohio.
Marshal l , J . S . , Associate Professor , Physics Depar tmen t , McGill Universi ty, Montreal , Ontario, Canada.
Mason, Pa t r i c i a , Secretary, State Water Survey Division, Urbana, Illinois.
Mathews, C. K. , P a r t n e r , Burns & McDonnell Engineering Co. , Kansas City, Missouri .
Maxim, Wilson A . , Meteorologist (Electronic) , Wright Air Development Center, ARDC, Wright-Patterson Air Force Base, New Carlisle, Ohio.
Maynard, Harry W., State Water Survey Division, Champaign, Illinois.
Mead, Chas . H . , Chief Engineer , Illinois State Normal University, Normal, Illinois.
Merz, H. S. , Superintendent, City Water Department, Rockford, Illinois.
Milanski, Edwin V., Student, University of Illinois, Champaign, Illinois.
Miller, David R., Sanitary Engineer, U. S. Navy, Ninth Naval District, Great Lakes, Illinois.
Miller, L. W. , Sales Representat ive, American Cyanamid Co . , Chicago, Illinois.
Millis, John B . , Field Engineer, State Water Survey Division, Chicago 49, Illinois.
Mills, Harlow, Chief, State Natural History Survey, Urbana, Illinois.
Mills, Mrs . Harlow, Urbana, Illinois. Mitchell, Max L . , Hydraulic Engineer , Indiana
Flood Control and Water Resources Commission, Indianapolis, Indiana.
Mitchell, W. D. , Hydraulic Engineer, U. S. Geological Survey, Champaign, Illinois.
Miyamoto, Owen, Student, University of Illinois, Champaign, Illinois.
Moehrl, Kenneth E . , Director of Research, Layne & Bowler, Inc. , Memphis, Tennessee.
Mohr, Alice, Typist, State Water Survey Division, Urbana, Illinois.
Mohundro, J. E . , Process Engineer, Socony Vacuum Oil Co . , East St. Louis, Illinois.
Monke, Edwin J . , Instructor, Agricultural Engineer ing Depar tment , Universi ty of Illinois, Urbana, Il l inois.
Montgomery, John A., Assistant All Weather Aids Officer, Naval Air Test Center, NAS, Patuxent River, Maryland.
Moore, Ruth, Chicago Sun-Times, Chicago, Illinois. Moore, V. H. , Engineer , Warren & Van Praag ,
I n c . , Decatur, Illinois. Moors, A. J . , Engineer, Corps of Engineers, Cin
cinnati 31, Ohio. Morgan, J. H., District Engineer, U. S. Geological
Survey, Champaign, Illinois. Morgan, Martin W., Sales Engineer, Wallace &
Tiernan Co . , Chicago, Ill inois. Moses, Harry, Associate Meteorologist, Argonne
National Laboratory, Chicago 80, Illinois. Mueller, Henry F . , Research Assistant, State Water
Survey Division, Champaign, Illinois. Mueller, James M., Captain, Corps of Engineers,
U. S. Army, Champaign, Illinois. Muirheid, Ben F . , Extension Agricultural Engi
nee r , Agricultural Engineering Department, University of Illinois, Champaign, Illinois.
Musselman, Ray C. , T/Sgt. , U. S . A . F . , A . W . S . , 3346 Student Squadron, Chanute Air Force Base, Illinois.
Myers, Fran, Champaign News-Gazette, Champaign, Illinois.
Naffah, Ned, Lt., U. S. Navy, VX-4 NAS, Patuxent River, Maryland.
Nebolsine, Ross, President, Hydrotechnic Corp . , New York, New York.
Neill, James C. , Meteorologist, State Water Survey Division, Champaign, Illinois.
Newton, Chester W., Meteorologist, University of Chicago, Chicago 37, Illinois.
Newton, Harriet R. , Meteorologist, Argonne National Laboratory, Chicago, Illinois.
Nikelly, John, Student, Un ive r s i ty of Illinois, Urbana, Illinois.
Ockerman, John W., Chief, Topographic Section, Wisconsin Conservation Department, Madison, Wisconsin.
O'Donnell, E. T . , Captain, Corps of Engineers , Student, University of Illinois, Champaign, Ill.
333
Ongman, Harry D., Research Assistant in Chemical Engineering, University of Illinois, Urbana, Illinois.
Opperman, David R., Instructor, Chanute Air Force Base , Rantoul, Illinois.
Owen, W. M . , Research Assis tant Professor of Theoretical and Applied Mechanics, University of Illinois, Champaign, Illinois.
Pappmeier, Louis S., Owner, Pappmeier Engineering Co., Galesburg, Illinois.
Pappmeier, J. H., Engineer, Pappmeier Engineering Co., Galesburg, Illinois.
Parlet t , Russell C., Water Chemist, Illinois Cent ra l Railroad, Mattoon, Illinois.
P a r v i s , Merle , Associate Professor of Highway Engineering and Research Engineer, JHRP, Purdue University, ' West Lafayette, Indiana.
Patterson, J. R., Chief Designing Engineer, Russell and Axon, Construction Engineers, Webster Groves, Missouri .
Paulsen, Wilbur H., Research Scientist (Mr.) , Air Force Cambridge Research Center, Cambridge, Massachusetts .
Payden, Nel T . , Beling Engineering Consultants, Moline, Illinois.
Per rey , J. I . , Chief Engineer, Indiana Flood Cont ro l and Water Resources Commission, Indianapolis, Indiana.
Picton, Walter L . , Water and Sewage Works Adv i s e r , Defense Product ion Administration, Washington 25, D. C.
Plank, Vernon G., Meteorologist, Air Force Cambridge Research Laboratories, Walpole, Mass.
Plummer, Ray B . , Student, University of Illinois, Urbana, Illinois.
Posey, C. J . , Professor and Head, Department of Civil Engineering, State University of Iowa, Iowa City, Iowa.
Postlethwaite, R. C., Engineer, Portland Cement Association, Chicago, Illinois.
Powell, Ralph W., Professor of Mechanics, Ohio State University, Columbus 1, Ohio.
Powers, Thomas J . , Manufacturing Chemists Association, Water Pollution Abatement Comm., Midland, Michigan.
P r i ce , F. Carr , Chief Engineer, Victor Chemical Works, Chicago Heights, Illinois.
Printy, Mrs. Wilma L . , Assistant Chemist, State Water Survey Division, Urbana, Illinois.
Printy, Glenn, Urbana, Illinois.
Quigley, Kenneth G., Weather Equipment Technician, Chanute Air Force Base, Bartley, Neb.
Randall, J. S., Field Engineer, State Water Survey Division, Joliet, Illinois.
Rao, Nutulapaty U. , Bacteriologist , State Water Survey Division, Champaign, Illinois.
Ravegnani, D. A., Director, Purchases and Finance, Springfield, Illinois.
Reed, Paul W., Senior Sanitary Engineer, U. S. Public Health Service, Chicago, Illinois.
Rees , O. W., Chemist, Illinois Geological Survey, Champaign, Illinois.
Reiter,. David D., Electronic Scientist, Wright Air Development Center, Dayton, Ohio.
Restivo, Joe S., Instructor, Department of Weather, Chanute Air Force Base, Rantoul, Illinois.
Reynolds, S. E . , Research Physicist, New Mexico School of Mines, Socorro, N. M.
Rimbach, Ted, Lane Machinery Co. , St. Louis 1, Missouri.
Roberts, Claude M., District Geologist, U. S. Geological Survey, Indianapolis, Indiana.
Rober ts , P. E . , Illinois Society of Professional Engineers , Champaign, Illinois.
Rober t s , Rober t E . , Ass i s tan t Engineer , State Water Survey Division, Urbana, Illinois.
Roberts, Mrs . Robert E . , Urbana, Illinois. Roberts, W. J . , Associate Engineer, State Water
Survey Division, Champaign, Illinois. Roberts, Mrs . W. J . , Champaign, Illinois. Rodebush, W. H. , Head, Department of Physical
Chemistry, University of Illinois, Urbana, Ill. Rodebush, Mrs. W. H., Urbana, Illinois. Rogers , Ruby M. , Assistant F i sca l Clerk, State
Water Survey Division, Champaign, Illinois. Rorabaugh, M. I . , District Engineer, U. S. Geo
logical Survey, Ground Water, Louisville 2, Kentucky.
Roschke, W. H., J r . , Engineering Assistant, State Water Survey Division, Urbana, Illinois.
Rottman, Arnold R., Student, University of Illinois, Champaign, Illinois.
Rulison, John G., Hydrogeologist, Michigan Geological Survey, Lansing, Michigan.
Russell, Charles E., Vice President, General Fi l ter Company of Amer ica , St. Char les , Illinois.
Russel l , Lillian A. , Assis tant Professional Scientist, State Water Survey Division, Champaign, Illinois.
Sanderson, Earl E. , Principal Hydraulic Engineer, Ohio Department of Natural Resources, Division of Water, Columbus 12, Ohio.
Sasman, Robert T . , Engineering Assistant, State Water Survey Division, Urbana, Illinois.
Sasman, Mrs . Robert T . , Urbana, Illinois. Scarr i t t , E. W., Vice Pres ident , Elgin Softener
Corporation, Elgin, Illinois. Schluack, R. C. , Engineer, J. P. Miller Artesian
Well Co., Brookfield, Illinois. Schmidt, M. O., Associate Professor of Civil Engi
neering, University of Illinois, Urbana, Illinois. Schneller, M. P . , Aurora Pump Co. , Aurora, Ill. Schreiber, Robert, Student, University of Illinois,
Champaign, Illinois.
334
Schwedock, Bernard, Development Engineer, General Electric Co. , Albany 9, New York.
Schwenter, George E. , Lt. , U.S. N., Fleet Airborne Electronics Training Unit, Norfolk, Va.
Sever, Ralph J . , M/Sgt., Chanute Air Force Base, Rantoul, Illinois.
Shaffer, Paul R., Associate Professor of Geology, University of Illinois, Champaign, Illinois.
Shankwiler, Alfred D. , T/Sgt., Chanute Air Force Base, Rantoul, Illinois.
Shiota, Tetsuo, Special Research Assistant, State Water Survey Division, Champaign, Illinois.
Smith, Cha r l e s E . , R e s e a r c h Fel low, Sanitary Engineering, Graduate School, Purdue Univers i ty , West Lafayette, Indiana.
Smith, Edwin F . , District Manager, Layne-Western Co., Kirkwood, Missouri.
Smith, H. F . , Engineer, State Water Survey Division, Urbana, Illinois.
Smith, Mrs. H. F . , Urbana, Illinois. Smith, James T., Student, Chanute Air Force Base,
Rantoul, Illinois. Smith, L. G. , Department of Meteorology, Uni
vers i ty of Chicago, Chicago 37, Illinois. Smith, Richard A., Eng. Radio P-3 , formerly Signal
Corps Engineering Laboratories, Champaign, Illinois.
Snider, Robert G., Vice President, Conservation Foundation, New York 16, N. Y.
Snow, Bever ly C . , J r . , Major, C . E . , U .S .A . , Corps of Engineers Student Officer, University of Illinois, Urbana, Illinois.
Snowden, James R., Instructor in Mechanics, University of Illinois, Urbana, Illinois.
Soaky, Robert B . , U . S . A . F . , Chanute Air Force Base, Rantoul, Illinois.
Spafford, H. A., Sanitary Engineer, Illinois Department of Public Health, Springfield, Illinois.
Spaulding, Charles H. , Consultant, Engineer Research and Development Laboratories, Urbana, Illinois.
Spaulding, Mrs . Charles H. , Urbana, Illinois. Spaulding, Sally, Urbana, Illinois. Stall, John B . , Ass is tant Engineer, State Water
Survey Division, Urbana, Illinois. Stauffer, R. S., Associate Professor of Soil Physics ,
University of Illinois, Urbana, Illinois. Stewart, Leon T . , Instructor, Dept. of Weather,
Chanute Air Force Base, Champaign, Illinois. Stewart , Ph i lbe r t G . , Meteorologis t in Charge,
Weather Bureau, T e r r e Haute, Indiana. Stipp, John R. , Hydraulic Engineer, U. S. Geo
logical Survey, Champaign, Illinois. Stone, Melvin L . , Electronic Engineer, Weather
Radar, Massachusetts Institute of Technology, Medford, Mass.
Storm, Robert R. , Executive Secretary, National Water Well Association, Champaign, Illinois.
Stout, Glenn E . , Meteorologist, State Water Sur
vey Division, Champaign, Illinois. Straub, F. G . , Research Professor of Chemical
Engineering, University of Illinois, Champaign, Illinois.
Suter, Max, Head, Engineering Research Subdivision, State Water Survey Division, Urbana, Ill.
Suter, Mrs . Max, Urbana, Illinois. Sutton, Paul F . , Section Director for Illinois, U.S.
Weather Bureau, Springfield, Illinois. Swingle, Donald M., Physicist, Signal Corps Engi
neering Laboratories, Neptune, N. J.
Ta lmage , Donald B . , A e r o Resea rch Scientist, National Advisory Committee for Aeronautics, Washington, D. C.
Taylor, Paul, Communications Engineer, Center Power and Light Co. , Corpus Christi , Texas.
Tice, Leroy E'., Electronic Engineer, Cook Resea rch Labora tor ies , Chicago, Ill inois.
Toch, Ar thur , R e s e a r c h Ass i s tan t , Institute of Hydraulic Research, Iowa City, Iowa.
Tomes, W. W., Vice President , Cochrane Engineering Corporation, Chicago 6, Illinois.
Tschupp, Lowell A . , 3346 Student Training Sqdn., Chanute Air Force Base, Illinois.
Tykociner, J. T . , Resea rch Professor of Elect r i c a l Eng inee r ing , Univers i ty of Illinois, Urbana, Illinois.
Uhlig, H. H., Associate Professor, Massachusetts Insti tute of Technology, Cambridge, Mass.
Valach, James S . , Graduate Student, University of Illinois, Champaign, Illinois.
Van Meter, M. Irene, Research Instructor, State Water Survey Division, Urbana, Illinois.
Vanoni, Vito A., Associate Professor of Hydraulics, California Institute of Technology, Pasadena 4, California.
Van Praag, Alex, Warren & Van Praag, Inc., Consulting Engineers, Decatur, Illinois.
Veatch, N. T., Black & Veatch, Construction Engineers, Kansas City, Missouri.
Victor, Alfred H., Capt., U.S.A. , Corps of Engineers , Student Officer, University of Illinois, Champaign, Illinois.
Vogel, Orville W., Assistant Chemist, State Water Survey Division, Pekin, Illinois.
Wagner, Harry W., Student, University of Illinois, Champaign, Illinois.
Wall, F. T. , Acting Dean, Graduate College, University of Illinois, Urbana, Illinois.
Wall, Mrs . F. T. , Urbana, Illinois. Walton, William C, Hydraulic Engineer, U.S. G . S . ,
Ground Water Division, Madison, Wisconsin. Wasson, R. H., Manager, Pump Department, F a i r
banks, Morse & Co. , Chicago, Illinois. Watt, A. K. , Geologist, Ontar io Department of
335
Mines, Toronto, Ontario. Webb, H. D . , Assis tant P ro fe s so r of Electr ical
Engineering, University of Illinois, Urbana, Illinois.
Weisbruch, Theodore J . , Service - Sales, Dearborn Chemical Co. , Decatur, Illinois.
Werst , Haro ld J . , L t . , U. S. Navy, Naval Air Station, Patuxent River, Maryland.
West, James, State Water Survey Division, Champaign, Illinois.
Wexler, R . , Research Meteorologist, Mt. Washington Observatory, Cambridge, Mass.
White, F r a n k C . , Ai r T r a n s p o r t Association, Washington, D. C.
White, George W., Head, Department of Geology, Urbana, Illinois.
White, H. L . , Superintendent of Sanitation and Safety, University of Illinois, Urbana, Illinois.
White, P a u l G. , Ins t ruc tor , Chanute Air Force Base , Rantoul, I l l inois .
White, Richard, Manager, Electronic Engineering, Trans World Airlines, Kansas City 2, Mo.
Whitnah, Donald R. , Analysist, State Water Survey Division, Champaign, Illinois.
Whitney, Robert McL., Associate Professor of Dairy Technology, University of Illinois, Urbana, Ill.
Whysong, J. L . , Engineer, Public Service Co. of Northern Illinois, Chicago, Illinois.
Wilkes, John F . , Technical Di rec to r , Railroad Dept., Dearborn Chemical Company, Chicago 54, Illinois.
Willey, B. F . , Ind. Sales Manager, Elgin Softener Corp., Elgin, Illinois.
Williams, D. R., LCDR, U. S. Navy, Commander Operational Development Force , Naval Base,
Norfolk, Virginia. Williams, Edwin L. , J r . , Project Engineer, CPS-9
Radar, Raytheon Mfg. Co . , Concord, Mass . Wilson, Al, A s s i s t a n t Dis t r i c t Engineer , U. S.
Geological Survey, Jackson, Mississippi. Wilson, Albert L . , Student, University of Illinois,
Fithian, Illinois. Wilson, R. D., Partner, Wilson & Anderson, Engi
neers , Champaign, Illinois. Wise, R o b e r t s . , Director, Technical Service Cool
ing Water, National Aluminate Corporation, Chicago 38, Ill inois.
Wisegarver, Virginia, Engineering Assistant, State Water Survey Division, Peor ia , Illinois.
Wisely, W. H . , Secre tary-Edi tor , Federation of Sewage and Industrial Wastes Assns . , Champaign, Illinois.
Wisler, C. O. , Ann Arbor, Michigan. Wolmsky, Joseph, Student, University of Illinois,
Urbana, Illinois. Woltmann, J. J . , Consulting Engineer, Blooming-
ton, Illinois. Woltmann, Mrs . J. J . , Bloomington, Illinois. Woodruff, T. E., Fairbanks, Morse & Co., Chicago,
Illinois.
Young, George A. , Instructor in Civil Engineering, University of Illinois, Champaign, Illinois.
Youngquist, C. V., Chief, Division of Water, State of Ohio, Columbus, Ohio.
Youngquist, Mrs. C. V., Columbus, Ohio.
Zappulla, Sebastian, Capt., U. S.A. F . , Washington, D. C.
B U L L E T I N S
ISSUED BY
STATE WATER SURVEY DIVISION
No.
1-9 OUT OF PRINT. 10 Chemical and Biological Survey of the Waters of Illinois. Report for 1912.
198 pp., 19 cuts. 11 Chemical and Biological Survey of the Waters of Illinois. Report for 1913.
473 pp. , 106 cuts. 12 Chemical and Biological Survey of the Waters of Illinois. Report for 1914.
261 pp., 32 cuts. 13 Chemical and Biological Survey of the Waters of Illinois. Report for 1915.
381 pp., 36 cuts. 14 Chemical and Biological Survey of the Waters of Illinois. Report for 1916.
922 pp., 40 cuts. 15 Chemical and Biological Survey of the Waters of Illinois. Report for 1917.
136 pp., 8 cuts. 16 Chemical and Biological Survey of the Waters of Illinois. Report for 1918
and 1919. 280 pp. , 36 cuts. 17 Index to Bulletins 1-16. 1921. 17 pp. 18 Activated Sludge Studies. 1920-22. 150 pp. , 31 cuts. OUT OF PRINT. 19 Solubility and Rate of Solution of Gases . Bibliography. 1924. 49 pp. 20 Comparison of Chemical and Bacteriological Examinations Made on the
Illinois River during a Season of Low Water and a Season of High Water . 1923-1924.
A Preliminary Notice of a Survey of the Sources of Pollution of the St reams of Illinois. 1924. 59 p p . , 8 cuts $0 .25
21 Public Ground Water Supplies in Illinois. 1925. 710 pp . , 11 cuts . . . . $1 .00 Supplement I, 1938. 378 pp $0 .75 Supplement II, 1940. 44 pp $0.30
22 Investigations of Chemical Reactions Involved in Water Purification. 1920-1925. 130 pp. , 17 cuts $0. 50
23 The Disposal of the Sewage of the Sanitary Distr ict of Chicago. 1927. 195 pp . , 30 cuts $1.00
24 Pollution of Streams in Illinois. 1927. 35 pp. , 21 watershed maps. . . . $0. 25 25 Bioprecipitation Studies, 1921-1927. 94 p p . , 27 cuts $0 .50 26 Depth of Sewage Fi l te rs and Degree of Purification. 1928. 100 pp. , 19
cuts $0. 50 27 A Study of Fac to r s Affecting the Efficiency and Design of F a r m Septic'
Tanks. 1927. 45 p p . , 25 cuts $0.50 28 Illinois River Studies, 1925-1928. 127 pp . , 15 cuts $0 .75 29 Studies on Two-Stage Sludge Digestion, 1928-1929. 92 pp . , 27 cuts . . . $0 .50 30 Laboratory Studies of Sludge Digestion. 84 pp. , 5 cuts $0. 50 31 Prel iminary Data on Surface Water Resources, 1937. 157 pp $0.50 32 Anaerobic Fermentat ions. 1939. 193 pp . , 25 cuts $0 .75 33 Water Resources in Peor ia-Pekin District, 1940. 114 pp $0 .35 34 Sandstone Water Supplies of the Joliet Area, 1941. 128 pp $0.35 35 Ground Water Supplies of the Chicago-Joliet-Chicago Heights Area, 1943.
285 pp $1 .00 36 Ground Water Supplies in Northern Cook and Northern DuPage Counties.
1945. 119 pp $0. 75 37 The Causes and Effects of Sedimentation in Lake Decatur. 1947. 62 pp. . $0. 60 38 Hydrology of Five Illinois Water Supply Reservoi r s . 1948. 260 pp. . . $1.50 39 Ground Water in the Peor ia Region. 1950 $1.00 40 Public Ground-Water Supplies in Illinois, 1950. 1375 pp $8.00