Embed Size (px)
Citation preview

INDUSTRYCOMMISSION
WATER RESOURCESAND
WASTE WATER DISPOSAL
REPORT NO. 2617 JULY 1992
Australian Government Publishing ServiceCanberra

© Commonwealth of Australia 1992ISBN 0 644 25500 5
This work is copyright. Apart from any use as permitted underthe Copyright Act 1968, no part may be reproduced by anyprocess without prior written permission from the AustralianGovernment Publishing Service. Requests and inquiriesConcerning reproduction and rights should be addressed tothe Manager, Commonwealth Information Services,Australian Government Publishing Service,GPO BOX 84, Canberra ACT 2601.
Printed in Australia by P . J . GRILLS, Commonwealth Government Printer, Canberra
INDUSTRYCOMMISSION
17 April 1992
The Honourable J Dawkins, M PTreasurerParliament HouseCANBERRA ACT 2600
Dear Treasurer
In accordance with Section 7 of the Industry Commission Act 1989, we have pleasure insubmitting to you the Commission’s final report on Water Resources and Waste WaterDisposal.
Yours sincerely
M L ParkerPresiding Commissioner
T J Hundloe D R ChapmanCommissioner Associate Commissioner
COMMISSIONER
Benjamin Offices, Chan Street,Belconnen ACT Australia
PO BOX, Belconnen ACT 2616Telephone: 06 264 1144Facsimile: 06 253 1662

WATER RESOURCES& WASTE WATERDISPOSAL
IV
Acknowledgment
The commission wishes to thank those staff members who contributed to this report.

CONTENTS V
CONTENTS
PageABBREVIATIONS ix
PART I : MAIN REPORT
TERMS OF REFERENCE xix
OVERVIEW AND RECOMMENDATIONS 1
1. THE INQUIRY 21
1.1 Scope of the inquiry 21
1.2 The water sector 22
1.3 The Commission’s approach 27
2. PRICING PRACTICES AND PERFORMANCE 31
2.1 Pricing of urban WSD services 31
2.2 Pricing of irrigation water 40
2.3 Participants’ views on shortcomings in current pricing 43
2.4 Institutional arrangements affect pricing policies 46
3. ARE COSTS OF SERVICE PROVISION TOO HIGH? 47
3.1 Sources of cost reductions 47
3.2 Comparisons of costs across authorities 53
3.3 Institutional arrangements affect the costs of service provision 55
3.4 The gains from more cost-effective service provision 59
WATER RESOURCES& WASTE WATERDISPOSAL
VI
4. PRICING REFORM FOR URBAN WATER SERVICES 61
4.1 Promoting better investment decisions 61
4.2 New investments in urban infrastructure 62
4.3 Pricing structures 64
4.4 What costs should be covered by prices? 70
4.5 Phasing in cost recovery on existing assets 79
5. PRICING OF IRRIGATION WATER AND DRAINAGE 85
5.1 General issues 85
5.2 Bulk water 87
5.3 Charges for in-system water distribution and drainage 90
5.4 The Burdekin Irrigation Area 92
6. OTHER PRICING ISSUES 93
6.1 Property based access charges 93
6.2 Developer provided assets and charges 99
6.3 Funding community service obligations 100
6.4 Calculation of capital charges 103
6.5 Dividend policies 109
6.6 Capital subsidies 112
7. INSTITUTIONAL AND ADMINISTRATIVE ARRANGEMENTS 115
7.1 Opportunities for introducing competition 115
7.2 General principles for administrative and institutional reform 116
7.3 Urban water and sewerage provision 116
7.4 Corporatisation of urban WSD service providers 126
7.5 Privatisation of urban WSD service providers 129
7.6 Urban drainage 130
7.7 Irrigation water and drainage 132
CONTENTS VII
8. WATER ENTITLEMENTS 137
8.1 Current allocation systems 137
8.2 The value of water entitlements 138
8.3 Improving the system of water entitlements 142
8.4 Auctioning of water entitlements 150
9. ENVIRONMENTAL PRICING AND REGULATION 153
9.1 Sustainability and water use 155
9.2 Using markets to secure better outcomes 157
9.3 Regulatory reform 165
9.4 Monitoring and enforcement issues 173
10. RESOURCE MANAGEMENT AND OTHER ISSUES 177
10.1 Institutional reform 177
10.2 Non-price measures can encourage conservation 184
10.3 Research and extension 186
PART II : RURAL WATER
R1 RURAL WATER ISSUES 193
R2 COMMISSION’S RURAL WATER FINDINGS 204
R3 PACE OF RURAL REFORM 207
R4 BURDEKIN RIVER IRRIGATION AREA : CASE STUDY 211
R5 KIMBERLEY PIPELINE PROPOSAL 225

WATER RESOURCES& WASTE WATERDISPOSAL
VIII
APPENDICES
A INFORMATION SOURCES 231
B INSTITUTIONAL ARRANGEMENTS 239
C PRICING AND COMMUNITY SERVICE
OBLIGATIONS 271
D ECONOMY-WIDE GAINS FROM PRODUCTIVITY IMPROVEMENTS 295
E RURAL WATER ARRANGEMENTS AND ISSUES:
STATE SUMMARIES 301
REFERENCES 345
ABBREVIATIONS IX
ABBREVIATIONS
Abbreviations used for inquiry participants who made a written submission are given in AppendixA. Other abbreviations used in the report are listed below.
ABS Australian Bureau of Statistics
ANZECC Australian and New Zealand Environment and Conservation Council
AWRC Australian Water Resources Council
BAT Best Available Technology
BATEA Best Available Technology Economically Achievable
BOD Biological/Biochemical Oxygen Demand
BRIA Burdekin River Irrigation Area
CBD Central Business District
CMC Catchment Management Committee
CMT Catchment Management Trust
COWSIP Country Towns Water Supply Improvement Program
CPI Consumer Price Index
CSO Community Service Obligation
DASET Department of Arts, Sport, Environment and Territories
EC Electrical Conductivity
EPA Environment Protection Authority
EWS Engineering and Water Supply Department
FWRAP Federal Water Resources Assistance Program
GBE Government Business Enterprise
HEC Hydro-Electric Commission
HIA Highland Irrigation Area
ICM Integrated Catchment Management

WATER RESOURCES& WASTE WATERDISPOSAL
X
LWRRDC Land and Water Resources Research and Development Corporation
MDBMC Murray-Darling Basin Ministerial Council
MEA Modern Equivalent Asset
NHMRC National Health and Medical Research Council
NPV Net Present Value
NRMS Natural Resources Management Strategy
NSCP National Soil Conservation Program
PAWA Power and Water Authority
QWRC Queensland Water Resources Commission
RAS Rural Adjustment Scheme
RCMC Regional Catchment Management Committee
RRR Real Rate of Return
RWC Rural Water Corporation
RWSC Rivers and Water Supply Commission
SCMCC State Catchment Management Co-ordinating Committee
SCS Soil Conservation Service
SDS Salinity and Drainage Strategy
SEPP State Environment Protection Policies
TCM Total Catchment Management
TWE Transferable Water Entitlements
VDWR Victorian Department of Water Resources
WSD Water, Sewerage and Drainage

ABBREVIATIONS XI
CONVERSION TABLE:
Gigalitre (GL) = 1 000 ML = 1 000 000 KL = 1 000 000 000 Litres
Megalitre (ML) = 1 000 KL = 1 000 000 Litres
Kilolitre (KL) = 1 000 Litres

XIII
PART I: MAIN REPORT
TERMS OF REFERENCE
OVERVIEW AND RECOMMENDATIONS
1 THE INQUIRY
2 PRICING PRACTICES AND PERFORMANCE
3 ARE COSTS OF SERVICE PROVISION TOO HIGH?
4 PRICING REFORM FOR URBAN WATER SERVICES
5 PRICING OF IRRIGATION WATER AND DRAINAGE
6 OTHER PRICING ISSUES
7 INSTITUTIONAL AND ADMINISTRATIVE ARRANGEMENTS
8 WATER ENTITLEMENTS
9 ENVIRONMENTAL PRICING AND REGULATION
10 RESOURCE MANAGEMENT AND OTHER ISSUES

WATER RESOURCES& WASTE WATERDISPOSAL
XIV
TERMS OF REFERENCE
I, JOHN CHARLES KERIN, in pursuance of my powers under Section 7 of the Industry
Commission Act 1989, hereby:
1. refer water resources and waste water disposal for inquiry and report within twelve months ofthe date of receipt of this reference;
2. specify that the Commission report on institutional, regulatory or other arrangement subject toinfluence by governments in Australia which lead to unsustainable and inefficient resource useand advise on how these institutional, regulatory or other arrangements might be revised;
3. specify that the Commission in dealing with Item 2 is to have regard to the establishedeconomic, social and environmental objectives of governments; and
4. specify that the Commission is to avoid duplication of any recent substantive studiesundertaken elsewhere.
JOHN KERIN18 JULY 1991

OVERVIEW ANDRECOMMENDATIONS
1
OVERVIEW AND RECOMMENDATIONS
Water, sewerage and drainage (WSD) services are vital to the health and well-being of Australians.The challenge facing governments around Australia is to provide services to the current generationwhile ensuring that quality water supplies are maintained for future generations.
This report seeks to promote more efficient and sustainable water use. It recognises the strengthsof the reforms already underway; it builds on the current foundation of public ownership of serviceproviders; and it accepts that a mix of market incentives and regulation is required.
Reform is urgent. The problems now confronting Australia in the water area demand an end to thepolitical expediency which has so often thwarted worthwhile reforms in the past.
Sustainability of Australia’s water use
Water required for household supply and waste water disposal accounts for around 10 per cent ofwater use in Australia. Most of the remainder is used to irrigate crops and pasture.
Most of Tasmania and parts of northern Australia have abundant water supplies. However, inmany of the major population centres and in the Murray-Darling Basin, the continued availabilityof quality water is under threat.
Salinity and waterlogging in many irrigation areas are major environmental problems and recentoutbreaks of toxic blue green algae have highlighted the adverse impacts of nutrient contaminationof rivers and water storages. In urban centres, there are problems of disposing of sewage, tradewaste and stormwater without excessive impacts on the environment and at reasonable cost.
Developing new water supplies is extremely costly. And in any event, water storages and theregulation of river flows generally affect ecosystems and environmental amenity. Thus, makingbetter use of water is becoming ever more important.

WATER RESOURCESAND WASTE WATERDISPOSAL
2
Undercharging for water and waste water disposal has been a major contributor to many water-related environmental problems. But policies of cost recovery need to be tied in with other policiesto promote sustainable water use. The twin goals of efficiency and sustainability can be broughtcloser together.
Efficiency of service provision
Governments and water authorities throughout Australia are seeking to improve the efficiency withwhich WSD services are provided. A major thrust in many areas has been to link charges moreclosely to the cost of services provided -- the so called user-pays philosophy. At the same time,WSD authorities are being increasingly called upon to reduce their costs.
While these changes have produced appreciable benefits, the reform process still has a long way togo. Prices charged in most parts of Australia do not cover all the costs of making water servicesavailable. Government acceptance of cost under-recovery has not only encouraged excessivedemand for water services, but has reduced the pressure on water agencies to resist those demands.It has therefore contributed to premature augmentation of systems and to investment which has hadlittle prospect of providing a worthwhile return to the community.
By the standards of the past, water authorities are more efficient and client oriented. However,most are frustrated by the unclear and sometimes conflicting objectives under which they operate.Many of them have not been publicly accountable for poor performance. This has reduced theirincentive to provide appropriate levels of service at the lowest possible cost.
It has to be asked whether Australians can any longer afford the problems that follow from poorlyspecified and sometimes conflicting objectives or the political expediency which has so oftenprevailed over commercial good sense in the provision of water services.

OVERVIEW ANDRECOMMENDATIONS
3
Pricing reform
Like any good or service, demand for water will depend on the price charged. At the same time,consumers’ responses to price signals convey information to water authorities on the value that theyplace on those services.
Improved pricing of WSD services will therefore help ensure that scarce water is not wasted and indoing so promote better environmental outcomes. Improved pricing is also necessary to guide thetiming and nature of investments in WSD works. Excessive investment in, and prematureaugmentation of those works, has cost the community dearly. A vast amount of capital -- over $50billion -- is tied up in providing these services. In future, all of the costs of providing both urbanand irrigation water services should be recovered from customers (see Recommendations 1, 7 and9).
Cost recovery is complex. For example, it should not be pursued solely through price increases.Pressure must be placed on water agencies to reduce their costs. Care is also needed to ensure thatwhen urban customers are added to the network, they are not charged twice for the developmentcosts of supplying the services. And, for large parts of the public irrigation network, water demandmay be insufficient to permit the costs of capital to be fully recovered (see Recommendations 6, 8,10 and 11).
As well as pricing to fully cover costs, users should pay for each litre of water consumed (seeRecommendation 2). Giving households a ‘free’ water allowance in return for the payment of afixed charge to gain access to services, or charging irrigators for their allocation of waterirrespective of whether they use it, provides no incentive to use water wisely. Substantialreductions in water consumption are observed where users are charged directly for every litre. Thismeans that expensive system augmentations can be deferred and the costs of treating wastewater,and the environmental impacts of wastewater discharges, can be reduced. Pay-for-use pricing alsoincreases the incentives to re-use water.
Pay-for-use pricing can extend to sewerage services and to the treatment of industrial trade waste(see Recommendations 4 and 5). It can also involve higher prices for water during drier months(see Recommendation 3). Dispensing with property-based charges for WSD services is yet anotheraspect of pay-for-use pricing (see Recommendation 12).

WATER RESOURCESAND WASTE WATERDISPOSAL
4
Pricing reform should extend to the payment of dividends to governments. Just as interestpayments on borrowed funds are a cost of making water services available, so too is a payment onthe community’s investments in water undertakings. Entitlements to dividends should reside withthe legal owners of water assets (see Recommendation 17). In some cases this may be LocalGovernment.
The Commission has also examined how community service obligations imposed on waterauthorities by governments should be funded; and how long-lived water assets should be valued(see Recommendations 13, 14, 15 and 16).
Taken as a package, the pricing reforms proposed by the Commission will result in higher chargesfor many water users.
However, the required increases will vary considerably across authorities. Where authorities arealready recovering most of the costs of their capital, or where there is considerable scope toimprove performance by reducing costs, aggregate price increases will be small. By contrast, inmany irrigation schemes and in some country towns, significant water price increases will berequired.
Pricing reform will also have uneven impacts within particular communities. For example, whilethe phase-out of property-based charges for WSD services will reduce the water bills of manycommercial and some domestic customers, for other domestic customers charges will rise sharply.But adverse impacts for some water users is not a reason to delay necessary pricing reforms.Disadvantaged groups can be protected using the sort of explicit assistance measures already inplace to reduce the costs of WSD services to pensioners and other low income earners.
While the reforms will mean increased prices for many water customers, higher returns on thecommunity’s investments in the water sector will reduce government calls on other sources ofrevenue.
It is of course important to ensure that revenue needs do not drive governments to increase pricesbeyond efficient levels. Accordingly, the Commission has discussed how dividends paid togovernments on behalf of the community should be determined in order to prevent water pricesbeing used as a tax.

OVERVIEW ANDRECOMMENDATIONS
5
What institutional changes are required?
In most parts of the economy, competition between suppliers can be relied upon to promoteefficient service provision. In the water sector, competition from private contractors is possible formany inputs used by WSD agencies. However, at the present time, WSD services are most cheaplyprovided through single networks.
The issue is not simply whether water services should be provided by regulated public or privatemonopolies. Effective management of catchments, rivers and other water bodies is also required.The challenge is to find the right incentives and institutional arrangements to pursue these multipleobjectives. A blanket model of reform is not appropriate, if only because of the diversearrangements which already exist throughout Australia.
Urban services
Unclear and conflicting objectives, insufficient accountability for performance and governmentinterference are often regarded as inevitable consequences of government ownership. Countriessuch as the United Kingdom and France have responded by giving the private sector responsibilityfor providing water services.
Privatisation and the profit motive would undoubtedly provide a commercial edge to certainaspects of service provision, and add to incentives for both cost recovery and cost containment.
However, the overseas experience suggests that there would also be costs to the community, not theleast of which would be a need for even greater regulation of WSD providers to preventovercharging of customers and unwarranted reductions in the quality of service provided.
There is considerable scope to improve arrangements for the provision of urban water serviceswhile maintaining government ownership. The Commission has therefore attempted to build onthe current foundation of public ownership in a way which does not preclude an increased role forthe private sector in the future, should that prove desirable.

WATER RESOURCESAND WASTE WATERDISPOSAL
6
Governments must put in place administrative structures which will give WSD authorities a strongcommercial focus. This is necessary to promote full cost recovery; allow charges which aredirectly linked to the costs of services received by users; and ensure that authorities seek to reducethe costs of service provision. Providing water agencies with clear goals, giving them greaterfreedom to pursue those goals and making them accountable for their performance are central tomore efficient service provision (see Recommendations 18, 19, 20, and 22). But, because ofdifferences in the way that urban WSD services are provided, these broad principles cannot bepursued in a uniform way Australia-wide.
Amalgamation of some small country urban service providers in the eastern States may help toreduce the costs of service provision (see Recommendation 23). Particularly for larger waterauthorities, corporatisation may be a logical progression from the process of commercialisation(see Recommendation 24).
The many problems associated with urban run-off call for changes that will better integratedrainage with the whole water cycle of towns and cities (see Recommendation 25).
Irrigation
In the irrigation sector, pricing reform to achieve higher levels of cost recovery is the immediatepriority (see Recommendations 9, 10 and 11). However, the necessary reforms extend tomanagement and ownership.
Action is underway in most States to refurbish run-down public irrigation distribution systems. Yetdecisions on refurbishment have been taken with little regard to the viability of those systems in theface of commercial pricing for water and of expanded trade in the rights to use water. And in manylocalities, there is the added complication that the full extent of waterlogging and salinity problemshas yet to emerge. There is thus the risk that more taxpayers’ money will be directed intounproductive and unsustainable irrigation investments.
The management of government irrigation systems can be devolved to regional bodies. This hasbegun in New South Wales and is soon to commence in Victoria. Devolution to the regions willprovide those paying for services with a greater say in their management, and is therefore a way ofbringing a more commercial focus to bear.
OVERVIEW ANDRECOMMENDATIONS
7
However, devolution will not reduce the pressure on governments to maintain a financialcommitment to non-commercial irrigation infrastructure. In the Commission’s view, privatisationof irrigation distribution schemes is the only way to ensure that decisions to maintain and refurbishexisting works are based on commercial realities (see Recommendation 26 ).
Making service providers more accountable
While a strong commercial focus is needed in the provision of WSD services, measures are alsorequired to ensure that service providers do not seek to improve their commercial performance bymisusing their monopoly power to increase prices or reduce service quality. With continuedgovernment ownership, monitoring is also necessary to ensure that services are provided costefficiently and that there is proper analysis of proposed new investments.
Better specification of objectives and performance targets in business plans will make WSDauthorities much more accountable for their performance. However, some external monitoring ofperformance covering prices, costs, investment performance and service quality is also required(see Recommendation 21).
Water management and environmental goals
Responsibility for water management and related environmental controls is typically fragmented.For example, some 20 bodies have roles affecting water quality and use in the Brisbane River.
Fragmentation inhibits co-ordination of policy, with resulting duplication of effort, and onoccasion, the absence of effective control. The requirement to deal with a range of bodies increasesthe costs for firms, WSD agencies and the general public in discharging their environmentalobligations.
As well as lowering costs, rationalisation of functions would allow integration of policiesgoverning the use of water and land. Land use practices often have important implications forwater quality.

WATER RESOURCESAND WASTE WATERDISPOSAL
8
While consolidation of related water management functions is desirable, it is equally important thatresponsibility for setting environmental standards is not left to the agencies which provide waterservices. Environmental goals must be pursued through regulated standards, supplemented byexternal monitoring of service providers to ensure that any failures to meet standards are madepublic (see Recommendation 34).
Although environmental regulation is crucial, there is a complementary role for marketmechanisms. For example, in appropriate circumstances, tradeable discharge permits can reducethe cost of meeting pollution targets (see Recommendation 32).
Major investments are required to deal with water-related environmental damage. For example, theSydney Water Board is to spend $600 million over the next 10 years to improve the quality ofeffluent discharged into the Nepean Hawkesbury River System. Combatting salinity andwaterlogging in many irrigation areas will also be very expensive. Water users should meet thecosts of these investments to ensure that expenditure on any particular environmental restorationinitiative is not excessive.
Giving equal weight to the costs and benefits of enhanced environmental outcomes should be anintegral part of the process for setting environmental and water quality standards (seeRecommendation 33).
Integrated (or total) catchment management is a recent initiative to involve the community indecisions affecting the quality of local water resources and the management of catchments. It is animportant trial which warrants support from both governments and the community.
However, community involvement through integrated catchment management will not deal withthe fundamental trade-off between current and future use of water resources. How the needs ofcurrent and future generations for access to quality water resources should be reconciled is anethical judgment which must ultimately be made by governments.
Tradeable water entitlements
Tradeable water entitlements are another means of bringing together efficiency gains and moresustainable water use.
OVERVIEW ANDRECOMMENDATIONS
9
In many of Australia’s irrigation systems, demand for water at current prices exceeds supply. AllStates, other than Western Australia, have water entitlements systems which allow for limited tradein water between irrigators. The aim is to ensure that available supplies are used in the way whichmaximises the benefits to the community.
In New South Wales alone, the limited use of tradeable water entitlements has increased the valueof irrigated agriculture by more than $40 million over seven years.
However, current arrangements can be significantly improved. In most areas, transfers of watercan only be made for one season at a time. Allowing permanent as well as temporary watertransfer would provide greater certainty to purchasers about the availability of water in subsequentseasons and therefore a greater incentive for beneficial trades to occur. Permanent transfer wouldalso facilitate the retirement of highly saline or waterlogged irrigation land (see Recommendation27).
Even greater gains will be made if there is provision to allow the transfer of water currently usedfor irrigation to metropolitan and environmental uses (see Recommendation 28). Indeed,formalising water allocations for environmental purposes is crucial if efficiency and sustainabilityconsiderations are to be integrated (see Recommendation 31). Provision should also be made toallow irrigators to carry-over unused water entitlements into the subsequent season through‘continuous accounting’ and for the auction of new water entitlements (see Recommendations 29and 30).
Gains from more efficient water use
The Australian Water Resources Council estimates that reductions in the operating costs of waterauthorities would provide an annual saving of about $180 million. Cost savings of this order wouldpermanently increase Gross Domestic Product by some $270 million. Even greater cost savingsare realisable as current asset systems are replaced through the adoption of cost lowering newtechnology.
These productivity gains are clearly valuable. Even so, they represent only part of the availablegains. The effects of many other improvements are much harder to quantify -- for instance, the

WATER RESOURCESAND WASTE WATERDISPOSAL
10
efficient pricing of water services and reforms which allow water to be moved to its mostproductive uses. On top of this are the environmental benefits that the Commission’s proposalswould bring.
What are the priorities?
The pace of reform must be increased even though for some in the community -- particularly therural sector -- the adjustment pressures will be significant. The challenge facing governments is toensure that a concern to minimise adjustment pressures does not unduly delay change.
The Commission’s recommendations are very much a package to enhance efficiency andsustainability across the sector as a whole.
However, within this package there are a number of priority areas. Pricing reform and increasedcost recovery are crucial to improving the efficiency and sustainability of Australia’s water use.Making WSD service providers more accountable is necessary to ensure that cost recovery targetsare not achieved by exploiting water users or by a loss of environmental amenity.
Inaction will mean that the benefits of improved national income are forgone, governments willcontinue to invest in poorly performing assets and the environment will be placed in furtherjeopardy. In areas such as the Murray-Darling Basin, the magnitude of the problems is only nowbecoming apparent. If the pace of reform is not increased, the resulting environmental degradationwill force more significant and disruptive adjustment in the future. In the urban centres too, manygovernments have been reluctant to directly link charges to the costs of services provided. Harddecisions must be taken now to avoid imposing even bigger costs in the future.

OVERVIEW ANDRECOMMENDATIONS
11
Recommendations
Pricing of urban water services
Section 4.2
1. Except where subsidisation of costs is an explicit government policy, investment in new urbanWSD infrastructure should be premised on full cost recovery, including the designated rate ofreturn on capital. The authority concerned should consider whether the willingness to pay ofcustomers who will benefit would be sufficient to permit full cost recovery, if differentialcharges could be set for those customers.
Section 4.3
2. Urban authorities should pursue full cost recovery on the provision of water through a two parttariff, comprising an access charge plus a usage charge for each KL of water supplied. Theusage charge should be set to cover the costs of making additional water available plus aloading to ration supply when capacity in the system is scarce. The access charge should be setso that, in total, the desired revenue yield is achieved over the life of an asset system.
3. WSD authorities should investigate the benefits and costs of seasonal water pricingarrangements and time of day pricing. The effects of seasonal pricing could be captured eitherthrough charges which vary over the year or through tiered usage charges.
4. WSD authorities should consider charging for sewerage services according to the percentage ofwater returned to the sewerage system.
5. WSD authorities which are faced with significant trade waste discharges should have in placecharges based on the quantity and strength of the waste discharged.

WATER RESOURCESAND WASTE WATERDISPOSAL
12
Section 4.4
6. Prices for urban WSD services should be sufficient to cover operating, maintenance,administration and depreciation costs and to provide the designated rate of return on theadjusted asset base. Where quantifiable and attributable, the costs of environmental damageassociated with the use of these services should be reflected in prices.
Some flexibility should be provided to authorities to increase their rates of return over time asusage of systems increases, subject to the requirement that they earn the designated rate overthe life of asset systems.
When calculating the rate of return component, the value of assets used to provide communityservice obligations which are not fully funded by government, should be written down bycapitalising the resulting on-going losses to the authority and deducting them from existingasset values. Similar adjustments to asset values should be made to account for poorinvestment decisions. The basis for adjustments to authorities’ asset bases should bedocumented in their financial statements.
When calculating capital charges, authorities’ asset bases should include assets provided bydevelopers or funded through developer charges. However, the rate of return earned on thoseassets should be refunded to customers in new sub-divisions in the form of lower accesscharges for water services.
7. The target real rate of return for investments in urban WSD infrastructure should generally be 5per cent. This target should be adjusted in the future if there is a significant change in the reallong term bond rate. If an authority can publicly demonstrate that a particular investmententails a significant element of risk, a higher rate of return should be sought.
Section 4.5
8. Urban WSD authorities earning less than 5 per cent real rate of return, should progressivelyincrease their rate of return, at a pace determined in negotiation with owner governments (andtheir regulatory authorities), until such time as the 5 per cent rate is achieved. The price

OVERVIEW ANDRECOMMENDATIONS
13
increases necessary to achieve the agreed increase in the rate of return should be determinedtaking into account the scope for productivity improvements. An annual increase of 0.5 of apercentage point in an authority’s RRR would be a useful starting point for these negotiations.
The negotiated annual increase in an authority’s charges should have regard to the need forimproved cost recovery on existing assets, and the need to ensure that, for new investments,there is full cost recovery over the life of the asset systems in question.
Once an authority has achieved 5 per cent real rate of return on its (adjusted) asset base, furtherprice increases should be subject to a negotiated revenue cap.
Pricing of irrigation water and drainage
Section 5.1
9. Public investment in new irrigation schemes should only proceed if the authority concerned canpublicly demonstrate that demand for water will support prices sufficient to fully cover costs,including a return on capital. The minimum real rate of return should be 5 per cent. A higherrate should apply if the project involves a significant degree of risk.
Section 5.2
10. Prices for irrigation water supplied from existing bulk water systems should at least coverirrigators’ share of the costs of operating and maintaining those systems, including dams andstorages. For systems where demand for water is sufficiently strong, a return on capital shouldalso be sought. Where quantifiable and attributable, the costs of environmental damage causedby irrigation should be reflected in prices.
Irrigators’ share of the full costs of refurbishments to existing bulk water supply systems,including a minimum 5 per cent real return on capital, should be factored into bulk watercharges.
WATER RESOURCESAND WASTE WATERDISPOSAL
14
11. Bulk water suppliers should immediately increase the price of water to a commercial level.Depending on the strength of demand, this would require them to earn a real rate of return ofbetween 0 and 5 per cent. For an interim period, prices charged to irrigators may need to besubsidised.
The rate of price increases faced by irrigators, and the combination of price increases and costreductions required to provide a commercial rate of return, should be determined bynegotiations between governments and bulk water suppliers.
Until such time as charges to irrigators are sufficient to provide commercial rates of return, theshortfalls in revenues should be directly funded by the owner government.
General pricing issues
Section 6.1
12. WSD agencies should phase out property based access charges for water and sewerage. In thelonger term, access charges should be directly linked to the size of the connections provided.
Section 6.3
13. Community service obligations imposed on water authorities should be directly funded in fullby the government concerned.
14. The Australian Water Resources Council should formulate and disseminate guidelines forvaluing Community Service Obligations in the water sector. Underlying these guidelinesshould be a valuation method which estimates the long run avoidable cost of meeting theobligation less the revenue received from beneficiaries.
OVERVIEW ANDRECOMMENDATIONS
15
Section 6.4
15. Water agencies should generally value their assets for pricing purposes according to theAustralian Water Resources Council’s Modern Equivalent Asset methodology. However, ifthere is a need to write down asset values to account for unfunded Community ServiceObligations or poor investment decisions, the resultant reduction in the earnings potential of theassets in question should be the basis for the revaluation.
The Australian Water Resources Council should initiate discussions with the accountingprofession and the relevant areas of government to secure any changes necessary to generalaccounting requirements.
16. Through the Australian Water Resources Council, water agencies should further investigate themerits of renewals accounting in the Australian water sector.
Section 6.5
17. Returns to equity earned on the provision of WSD services should be payable to the legalowners of the assets used to provide those services.
Institutional arrangements
Section 7.3
18. Governments should ensure that providers of WSD services are commercially focussed.Responsibilities should be clearly set out; relationships between water management, serviceprovision and regulatory functions clarified; and processes for resolving conflicts clearlydefined.
19. Governments should establish clear lines of accountability for their WSD agencies and ensurethat performance results are made publicly available.

WATER RESOURCESAND WASTE WATERDISPOSAL
16
20. All WSD agencies should be required to prepare publicly available corporate plans and annualreports, indicating commercial and other objectives. Any major changes to the corporate planshould be reported publicly.
21. All WSD agencies should submit to their relevant State body their achievements against anagreed list of performance indicators. This information should then be published by theAustralian Water Resources Council.
22. WSD service providers should be free to use inputs offering the best value, whether they be in-house or external to the agency. Accounting systems should be modified, as required, to allowa comparison of the costs of acquiring inputs in-house or from outside contractors.
23. Governments should look for ways to realise economies of size in the provision of their countryurban WSD services. In some cases this may warrant amalgamation of service providers.
Section 7.4
24. Governments should consider corporatisation of WSD service providers on a case by casebasis, to assess whether there are gains to be had beyond administrative reforms.
Section 7.6
25. State Governments should ensure that Local Governments are accountable for stormwater andother run-off leaving their boundaries.

OVERVIEW ANDRECOMMENDATIONS
17
Section 7.7
26. Management of public irrigation distribution systems should be devolved to regional bodieswith a view to their privatisation. Transfer of ownership should occur before refurbishment ofassets.
Tradeable water entitlements
Section 8.3
27. Permanent water transfers should be introduced in all irrigation systems, for both groundwaterand surface water. Where feasible, provision should be made to allow for permanent transfer ofwater between schemes.
28. Arrangements to allow the transfer of water from irrigation to other uses should beimplemented in all States.
29. States should introduce continuous accounting within the release sharing system. In systemswhere security of supply is an issue, States should consider whether capacity sharing wouldprovide a superior form of risk management.
Section 8.4
30. Entitlements to any new water supplies should be auctioned and the scope for bulk watersuppliers to act as brokers of existing supplies should be investigated.

WATER RESOURCESAND WASTE WATERDISPOSAL
18
Environmental matters
Section 9.2
31. The States should formalise water entitlements for environmental purposes. Where systems arefully, or close to fully committed, water for the environment should be purchased from licenceholders.
32. Governments should investigate the application of tradeable discharge permits.
Section 9.3
33. Regulators, before setting standards, should undertake an assessment of benefits and costs,including an assessment of alternative technologies. This process should explicitly canvassconsumers’ willingness to pay for improved environmental outcomes. Such analysis would beone input into a decision-making process which would also embrace issues of sustainability andintergenerational equity.
Section 9.4
34. Environmental monitoring by an agency or authority other than the service provider isnecessary to ensure that failures to meet standards are made public. Summary results ofmonitoring should be released in a form readily accessible to the media.
The Commission draws attention to its comments on:
• developer charges (Sections 4.4 and 6.2);
• charges for water distribution in government irrigation systems, pending privatisation of those
systems (Section 5.3);
• the income distribution effects of pay for use pricing (Section 6.1);
• the taxation treatment of maintenance and new capital investment (Section 6.4);
• the basis for determining dividends (Section 6.5);

OVERVIEW ANDRECOMMENDATIONS
19
• capital subsidies (Section 6.6);
• ways of facilitating the privatisation of public irrigation distribution systems (Section 7.7)
• dam capacity sharing (Section 8.3);
• pricing to promote better environmental outcomes (Section 9.2);
• charging for works designed to restore the environment (Section 9.3);
• integrated catchment management (Section 10.1);
• non-price measures to encourage water conservation (Section 10.2);
• water research and extension (Section 10.3);
• the likelihood of recouping public investment in the Burdekin River Irrigation Area (Section
R4); and
• the Kimberly pipeline proposal (Section R5).

THE INQUIRY 1.21
1 THE INQUIRY
For both economic and environmental reasons, the importance of using Australia’s water resourceswisely is beyond dispute.
Yet, for much of our history, little thought has been given to the efficient provision and use ofwater resources or to the impact of water use on the environment. The legacy has been muchwasteful investment in water infrastructure, charging arrangements that do little to encouragepeople to use water services efficiently and a host of water-related environmental problems.
But things are now changing. There is increasing recognition that improved practices in the watersector will provide significant benefits to the community. In many parts of Australia, new policiesare being put in place in an effort to rectify the mistakes of the past.
However, many problems still remain. The reform process has generally been slow and progresshas varied markedly between and within States and across individual water services. Worthwhilechanges continue to be thwarted by the outcomes of past policies and the attitudes that thosepolicies have engendered in both water users and government. And, as evidenced by problemssuch as river pollution, there are major challenges for policy makers in reconciling the oftencompeting interests of the environment and those using and disposing of water.
Against this background, the Commission has been asked to report on institutional, regulatory orother arrangements subject to influence by governments in Australia which lead to unsustainableand inefficient resource use and advise on how these arrangements might be revised. TheCommission’s terms of reference are set out at the beginning of the report.
1.1 Scope of the inquiry
This inquiry is very broad. The activities under reference include:
• the supply of water to households and to industrial, commercial and agricultural users, and tothe environment;
• waste water disposal, encompassing sewage and liquid trade waste disposal services;
• drainage, encompassing systems or watercourses draining both urban and irrigation lands; and
• the management of Australia's water resources.

WATER RESOURCESAND WASTE WATERDISPOSAL
1.22
In preparing this report, the Commission has drawn on information from a variety of sources. Itreleased an issues paper early in the inquiry (IC 1991b) and received evidence in submissions andat an initial round of public hearings. The Commission released its draft report in March 1992 andreceived comments on it in further submissions and at a second round of public hearings. Morethan 220 submissions have been made to the inquiry (see Appendix A). The Commission alsoheld informal discussions with government interests (Commonwealth, State and Local), water andenvironmental agencies, irrigators, professional associations and private environmental interests(see Appendix A). Two consultancies were arranged: one to examine the international experiencewith private provision of water services and the other to investigate the distributional effects ofpay-for-use water pricing (London Economics 1992, Tasman Economic Research 1992).
1.2 The water sector
The resource1
Low rainfall in many areas of Australia, the highly seasonal nature of precipitation in others andgenerally high rates of evaporation combine to limit Australia’s available water resources. As aconsequence, much effort and money has been spent on harvesting the country’s available supplies.Australians derive their water from both surface and groundwater supplies.
Surface water provides around 86 per cent of water used in Australia for consumption purposes(see below). Very large dams have been built in all States except South Australia. While many ofthese have a range of purposes including the generation of hydro-electric power, flood mitigationand recreation, they are the major sources of water for domestic use and irrigated agriculture.
Australia-wide, only 13 per cent of estimated available surface water is used.
However, this aggregate figure hides wide variations in usage between regions. In Tasmania, theeastern coastal region of Queensland, the Gulf of Carpentaria and the Timor Sea drainage division(in northern Western Australia and the Northern Territory), which together account for nearlythree-quarters of estimated exploitable surface water, on average, only 1.5 per cent of the availablesupply is used. By contrast, in the Murray-Darling Basin within which some 75 per cent of totalsurface water use in Australia occurs, the level of commitment is estimated at 85 per cent. In theSouth Australian Gulf drainage division, the figure is around 33 per cent.
1 Most of the data in this section is drawn from Department of Resources and Energy 1983.

THE INQUIRY 1.23
Groundwater is available throughout much of Australia. The bulk of it is in sedimentary basins, thelargest of which -- the Great Artesian Basin -- has an area of about one-fifth of Australia.
Groundwater is also found in shallow unconsolidated sediments and fractured rocks. In aggregate,exploitation of groundwater supplies is much lower than that of surface water -- only 3.5 per centof available groundwater is used. Again, however, aggregate figures conceal wide variations inusage. For example, in arid parts of Australia, groundwater is often the only source of water. Inthe South Australian Gulf drainage division, usage is well in excess of sustainable yields.
Data on potential yields of water bodies also abstract from the major capital expenditures oftennecessary to bring new supplies on stream. Around many of the major population centres inAustralia -- particularly those on the east coast -- readily available water supplies have already beentapped. In these areas, and in the Murray-Darling Basin where irrigation places heavy demands onavailable water sources, an increasingly important issue is how to make better use of existingsupplies. With this in mind, there is growing interest in the potential to trade water -- that is, toallow water users to buy and sell entitlements to a supply of water. Trade in water is also a way ofintegrating the competing demands of water users and the environment.
The data on potential yields also abstract from the quality of the water concerned. Salinity andeutrophication2 are major environmental problems threatening the quality of a significant portion ofAustralia’s water supplies. And, while groundwater in many areas is of good quality, there isgrowing evidence of pollution from agricultural activities, urban run-off and sewage.
Patterns of water use
Water can be used either for consumption or non-consumption purposes. Use for consumptionincludes domestic water and sewerage services, water for industrial and commercial concerns andrural use, including irrigation. Non-consumption uses include the provision of environmental flowsand habitats for native flora and fauna, recreation and generation of hydro-electric power.
Irrigation accounts for around three-quarters of consumption water used in Australia. Mostirrigation activity occurs in the Murray-Darling Basin. When account is taken of supplies used towater stock, rural usage accounts for an estimated 82 per cent of total water use.
2 Eutrophication occurs when a water body becomes enriched with nutrients, such as phosphates, resulting inexcessive plant and algal growth. In turn, this reduces the capacity of the water body to provide for the needsof humans, fish, bird and animal life.
WATER RESOURCESAND WASTE WATERDISPOSAL
1.24
Over half of Australia’s irrigated land is used for fodder production -- much of it to feed dairycattle. The other main irrigated crops in Australia are rice, oilseeds, cotton, sugar and horticulturalcrops. The annual value of irrigated agriculture is around $4.6 billion or about one quarter of totalagricultural output in Australia.
Non-rural water use is divided between the provision of water and sewerage services to households(10 per cent of total use), industrial and commercial use (7 per cent) and other urban use (1 percent). Reticulated water supplies are available to households in all but the most remote areas ofAustralia. On the other hand, significant population centres, including parts of Perth, have septicsystems as opposed to full sewage treatment.
Water infrastructure
A vast amount of capital is tied up in providing water services in Australia. Although it is difficultto value this infrastructure precisely, the estimate of a written down replacement value of $50billion for water, sewerage and irrigation assets (IC 1990) is widely accepted. Investment indrainage infrastructure, though substantial, has not been valued on an Australia-wide basis.
Although dams, pumping stations, water treatment works, sewage treatment plants and sewageoutfalls -- commonly referred to as headworks -- are major capital assets, their total value is smallerthan that of the pipes (or mains) and channels required to transport water, sewage and stormwater.Evans and Reynolds estimate that mains account for more than 70 per cent of the total value ofwater and sewerage assets (IC 1990, p 44). The Sydney Water Board alone owns and operates 39000 kilometres of water, wastewater and drainage pipes and channels.
Reflecting the dominance of mains in the sector’s capital base, the large majority of assets (88 percent) are used in the provision of services to households, industrial and commercial users. Whileirrigation accounts for three-quarters of consumption water used in Australia, it accounts for only12 per cent of the sector’s capital assets (IC 1990, p 44).
Employment
Direct employment in the provision of water, sewerage and drainage services in Australia has beenestimated at around 35 000 (Watson 1990).
However, the Water Industry Training Association estimated that when account is taken of thoseemployed in areas such as water management and monitoring, plumbing, trade waste treatment andthe manufacture of equipment used in the sector, employment would be of the order of 250 000.Various farming organisations also pointed to the employment associated with irrigated agriculture.

THE INQUIRY 1.25
The institutions
Resource management
The management of water resources and the provision of water, sewerage and drainage (WSD)services is primarily a State or Local Government responsibility. The Commonwealth’s role hasbeen mainly limited to: providing broad policy direction; providing information and promotingresearch into water-related issues through bodies such as the Australian Water Resources Council(AWRC); performing hydrometeorological services through the Bureau of Meteorology; providingfinancial assistance for water infrastructure in country towns and for water projects considered tobe in the national interest; and coordinating the management of water resources that transcend Stateboundaries, through, for example, the Murray-Darling Basin Ministerial Council (MDBMC) andthe Murray-Darling Basin Commission (MDBC).
At the State and Territory level, responsibility for managing the use of water resources usually restswith single departments or agencies.
However, management functions can be delegated to other State Government departments andregional and local bodies. In New South Wales, Victoria, Queensland and Tasmania, manymanagerial functions are devolved from the central agency to those departments, authorities andlocal government bodies responsible for the provision of services. In the Australian CapitalTerritory (ACT), water management functions are split between several government departments.By contrast, in Western Australia, South Australia and the Northern Territory, the single agencieswhich are responsible for the provision of water services throughout these jurisdictions alsoundertake most water management functions.3
Some management functions call for cooperation between State Governments. New South Wales,Victoria, Queensland and South Australia along with the Commonwealth are joint participants inthe Murray-Darling Basin Ministerial Council and Commission.4 A joint New South Wales andQueensland body is responsible for providing advice on the sharing of water in the border rivers ofthese two States as well as the construction of water conservation, flow regulation and distributionworks. A similar arrangement applies to the management of groundwater located across the borderof Victoria and South Australia.
3 In Western Australia, the Waterways Commission and the Swan River Trust have responsibility formanagement of certain public waterways.4 Queensland is not a formal participant in the Salinity and Drainage Strategy designed to reduce the salinityof Murray River water flowing into South Australia (see Appendix B).

WATER RESOURCESAND WASTE WATERDISPOSAL
1.26
Service provision
There are marked differences between the States in the arrangements for the provision of waterservices.
The metropolitan centres of Sydney, Melbourne, Perth, Newcastle, Canberra and Darwin areserviced by statutory authorities. In the Brisbane region services are provided by the Brisbane CityCouncil and a number of adjoining city councils, while in Hobart services are provided by anumber of city councils purchasing bulk water from the Hobart Regional Water Board. Adelaide isserviced by a government department.
Arrangements also vary between the States for country urban services. In New South Wales,Queensland and Tasmania, local councils and shires generally provide services often from locallyoperated storages, although some purchase bulk water from government agencies with State-wideresponsibility for water resource management. In Victoria, service provision is split between localcouncils, the Rural Water Corporation and numerous regional water boards. In South Australia,Western Australia, and the Northern Territory, country services are provided by the same singleagencies responsible for the provision of metropolitan services.5
There are also diverse institutional arrangements for public irrigation schemes. In New SouthWales, irrigation water is supplied by that State’s Department of Water Resources via regionalIrrigation Management Boards. Water for irrigation is also released from the Snowy MountainsHydro-Electric Scheme. In Victoria, Queensland and Tasmania, water is directly supplied toirrigators by each State’s rural-based Water Commission or Corporation. In Tasmania, the Hydro-Electric Commission also supplies water for irrigation use. In South Australia and WesternAustralia, irrigation services are predominantly provided by the same agency responsible for urbanservices. An exception is the Loxton scheme in South Australia which is owned by theCommonwealth but managed by that State’s Engineering and Water Supply Department. In allStates, each irrigator’s entitlement to an allocation of water is specified in a licensed water right.Licences are administered by the State agencies responsible for distributing bulk irrigation water.
Sewerage services are generally provided by the same authorities responsible for the provision ofurban water services. In Victoria and Western Australia, however, some authorities supplysewerage services only.
Disposal of toxic wastes which cannot legally be disposed of in sewers is undertaken by bothgovernment and private concerns. In areas where sewerage is not provided, the pumping of septictanks is also shared between the government and private sectors.
5 In Western Australia, water services to the towns of Bunbury and Busselton are provided by separatestatutory water boards.

THE INQUIRY 1.27
Stormwater drainage in urban areas is provided mainly by local councils. Off-farm irrigationdrainage is generally provided by, or under the control of, the State-based agencies responsible forthe provision of irrigation water.
Environmental control
Control over water-related environmental matters rests mainly with State and TerritoryGovernments. Local Governments are empowered to impose additional controls but these can beoverruled by State Governments.
Policies, programs and regulations addressing the environmental impact of water use, water qualityetc are variously administered by Commonwealth, State and Local Government agencies. Themain Commonwealth or joint Commonwealth/State bodies are the Department of Arts, Sport,Environment and Territories (DASET) incorporating the recently formed CommonwealthEnvironment Protection Agency, the Department of Primary Industries and Energy, the AWRC, theLand and Water Resources Research and Development Corporation, the MDBMC and MDBC, theSnowy Mountains Council, the Australian and New Zealand Environment and ConservationCouncil, CSIRO and the National Health and Medical Research Council. At the State level, anarray of statutory authorities and government departments are usually involved, the notableexception being South Australia where the agency responsible for the provision of water servicesalso administers environmental control. In New South Wales, Victoria and Western Australia,Environmental Protection Authorities (EPAs) have been established to coordinate environmentalpolicy and enforcement in a range of areas including water use. An EPA has also been proposedfor South Australia.
A recent initiative which embraces both water use and environmental issues is integrated or totalcatchment management. It recognises that land use and water availability and quality areinterconnected and that local communities should have a say in how catchments are managed. Theapproach has been formalised in New South Wales, where legislation provides for the formation ofregionally-based catchment committees, comprising community, landholder and water agencyrepresentation, to provide advice on the management of water resources within defined catchmentboundaries. Similar, although non-legislated, arrangements have been introduced in some of theother States.
Details of the institutional arrangements in the water industry are in Appendices B and E of thereport.
1.3 The Commission’s approach
This reference extends the Industry Commission’s examination of goods and services provided bythe government sector.

WATER RESOURCESAND WASTE WATERDISPOSAL
1.28
Many of the lessons that have emerged from the Commission’s previous reports into governmentbusiness enterprises -- such as the need for a more commercial focus in these enterprises -- areclearly relevant to the water sector. Indeed, the impetus for many of the reforms now occurring inthe sector is a recognition by governments that past policies, which have isolated consumers andservice providers from commercial realities and channelled taxpayers’ funds into investments withlittle prospect of providing a worthwhile return to the community, have served Australia badly.
Characteristics of the water sector
There are specific features of the water sector which are relevant to the nature and/or pace of futurereform:
• at least in the short to medium term, the prospect for competition between suppliers of coreWSD services appears limited. Thus within specific localities, water services will continue tobe provided by single suppliers, resulting in the sector being dominated by `natural monopoly'provision;
• the absence of competition means that irrespective of whether WSD suppliers are publicly orprivately owned, monitoring and regulation of performance will be crucial to encourageefficient outcomes;
• public health benefits provided by WSD services have implications for levels of serviceprovision and how services should be funded;
• a considerable amount of irrigation infrastructure has little commercial value, so that attemptsto fully cover costs could see that infrastructure lie idle; and
• the environmental effects of water use and waste water disposal are critically influenced by theway `rights' to use water are specified and the price at which water services are supplied. Thussustainable water use and efficient service provision are linked.
The water sector is also characterised by diversity across regions and States in institutionalarrangements for both service provision and water management. The nature of problems faced andprogress in overcoming those problems also varies widely. This means that future reform measuresmust often be tailored to suit the circumstances of individual regions or States.
What are the important issues?
In looking at efficiency of service provision and water management, the Commission has focussedon those areas where reforms hold out the prospect of the biggest gains; namely the pricing ofwater services, institutional arrangements governing service provision and better systems forallocating water between competing uses. Pricing regimes which more closely link charges toservices provided are central to improving the information available to suppliers on the value to

THE INQUIRY 1.29
users of water services. Reforms in this area help avoid much of the wasteful investment in waterinfrastructure that has occurred in the past. Institutional change is important not only in facilitatingpricing reform, but also in promoting more cost-efficient service delivery. Improved water rightssystems will help ensure that water is directed to its highest value uses.
In looking at the sustainability of water use in Australia, problems such as eutrophication ofwaterways, salination and waterlogging in irrigation districts, sewage pollution in rivers andoceans, and degradation of groundwater systems loom large.
However, the scientific and technical issues associated with these problems are outside theCommission’s area of expertise. So too are the technical considerations which underlie thedetermination of water quality standards.
Accordingly, the Commission has looked at the scope for improving environmental outcomesthrough improved water rights and more efficient pricing of water services. It has also examinedhow the processes for developing regulations governing water use and land use in catchments couldbe improved, and the scope to better coordinate environmental policy in the water area.
The Commission’s policy guidelines
In keeping with its policy guidelines, the Commission has adopted an economy-wide view. That is,it has looked beyond the immediate interests of water users as consumers of water, to consider theimpact of policies on other groupings in the community such as taxpayers and on the environment.
The Commission’s guidelines also require it to have regard to the need to facilitate adjustment tochange and to ease social and economic hardships arising from such change. For some in thecommunity, the adjustment pressures from reform in the water sector are likely to be significant.This is particularly so where rural communities have come to rely on cheap supplies of water orunsustainable water use practices. However, pricing reform will also see some residentialcustomers and some industries paying more for WSD services.
Some aspects of reform in the water sector inevitably involve an element of gradualism -- it isunrealistic to expect that problems built-up over many years can be addressed overnight. Thechallenge facing governments is to ensure that a concern to minimise adjustment pressures does notunduly delay change and deny the wider community the significant benefits that reform in thewater sector will deliver.

WATER RESOURCESAND WASTE WATERDISPOSAL
1.30
The structure of the report
The remainder of the report looks first at the way WSD services are supplied. Chapter 2 examinescurrent pricing regimes and identifies some shortcomings while Chapter 3 identifies ways in whichthe costs of making services available could be reduced. Chapters 4 and 5 look at some specificpricing reforms required in the urban and irrigation sectors, while Chapter 6 examines more generalpricing issues such as the valuation and depreciation of water assets and dividend policies. Therole of institutional reform and performance monitoring in improving efficiency is examined inChapter 7. Water right issues are considered in Chapter 8. Issues relating to sustainable water use,the management of Australia’s water resources and research and extension are discussed inChapters 9 and 10.
Part II of the report draws together the Commission’s findings and recommendations in regard torural water, examines developments in the Burdekin River Irrigation Area in Queensland andcomments on the Kimberly pipeline proposal.
PRICING PRACTICESAND PERFORMANCE
2.31
2 PRICING PRACTICES AND PERFORMANCE
Throughout Australia, water agencies are increasing the commercial focus of water servicesdelivery. Some changes have been directed at more closely linking charges to services provided --the user pays philosophy. Others have been directed at reducing the costs of providing thoseservices, and ensuring that investments in new assets are determined in a more commercial fashion.To ensure that better use is made of available water supplies, there have also been changes to‘water rights’ governing the allocation of irrigation water.
This chapter examines current pricing regimes for water, sewerage and drainage (WSD) services.
2.1 Pricing of urban WSD services
Cost recovery
Charges for urban water and sewerage services in most areas of Australia are designed to coveroperating, maintenance and administration costs, the cost of interest on borrowings and, to varyingextents, depreciation on assets/the cost of asset refurbishments.
Where levied, depreciation charges are generally based on historical asset values. However, anumber of the metropolitan agencies have moved to set depreciation charges on the basis of currentreplacement costs, as have a few agencies operating in country areas -- the Campaspe RegionWater Authority in Victoria is one example.
Only some of the major metropolitan agencies make explicit provision for other capital costs in theform of a return on government equity in water assets. Requirements to pay dividends togovernment currently apply to Melbourne Water Corporation, the Sydney Water Board (SWB), theHunter Water Corporation (HWC) and ACT Electricity and Water (ACTEW). The WaterAuthority of Western Australia (WAWA) is required to pay a portion of its revenue in lieu of adividend.
Where services are provided by local councils, net revenues from water and sewerage services areoften appropriated by local governments as a de facto dividend. The Victorian Government saidthat this practice is actively discouraged in Victoria and any such transfers are identified in theannual audit of councils’ WSD undertakings. However, it acknowledged that these de factodividend payments are still made.
The level of cost recovery on urban water and sewerage services is indicated by the AustralianWater Resources Council’s (AWRC) interagency performance review. Tables 2.1 and 2.2 below

WATER RESOURCESAND WASTE WATERDISPOSAL
2.32
reproduce the AWRC’s estimates of real rates of return (RRR)1 for both metropolitan and countryurban water and sewerage for 1988-89.
The RRR is calculated as income less operations, administration and maintenance costs togetherwith replacement cost depreciation, divided by the written down replacement value of assets. It iscalculated before deducting interest on debt. Thus a zero RRR means that, at current levels ofcharging, the service provider has no capacity to service debt or pay a return on equity withoutrunning down its asset base.
Care is required in interpreting RRRs. As discussed later in the report, measured rates of return arelikely to increase over the life of a system as demand growth absorbs excess capacity.Uncertainties about how water assets should be valued and the question of whether asset bases usedfor the rate of return calculation should include assets provided at no cost to authorities bydevelopers or funded by developer charges, serve to further complicate the exercise.
However, Table 2.1 indicates that, with the exception of the ACTEW, in 1988-89, all the majormetropolitan authorities had some capacity to service debt and/or pay a return on equity.
Table 2.1: Real rates of returna for metropolitan water and sewerage, 1988-89(per cent)
Service NSW Vic Qld WA SA ACT AverageHWB
bSWB MMBWc BCC
dWAWA EWS
eACTEW
Water 1.1 2.1 1.5 2.8 4.3 3.0 0.6 1.8
Sewerage 3.9 3.3 6.0 2.3 3.7 1.3 -0.8 4.0
Total 2.5 2.4 3.4 2.6 4.0 2.2 -0.1 2.8
a For the purposes of these calculations, authorities’ asset bases (valued using the Modern Equivalent Asset methodology - see Chapter6) include assets provided at no cost to authorities by developers and assets funded by developer charges. Exclusion of these assets fromasset bases would increase the rates reported in the Table.b Hunter Water Board - now the Hunter Water Corporation.c Melbourne and Metropolitan Board of Works - now Melbourne Water Corporation.d Brisbane City Council.e Engineering and Water Supply Department.Source: AWRC 1991, pÿ6
For country urban water and sewerage services there is considerable variation between States in thelevel of cost recovery (see Table 2.2). In Victoria and New South Wales, local authorities andregional water boards are, on average, earning a RRR not greatly different from the metropolitanagencies.
1 The real rate of return, as distinct from the nominal rate of return, adjusts for the effects of inflation.

PRICING PRACTICESAND PERFORMANCE
2.33
Of course, these State-wide figures conceal under-recovery of costs by some local authorities. Forexample, in Broken Hill, water users (other than the mining industry) meet less than 60 per cent oftotal costs, with the resulting deficit jointly funded by the State Government and miningcompanies.
Table 2.2: Real rates of returna for country urban water and sewerage, 1988-89(per cent)
Service NSW Vic Qld WA SA TAS Average
Water 2.9 1.7 0.0 -1.8 -1.7 1.0 0.2
Sewerage 2.6 3.1 1.6 1.5 -1.2 na 2.1
Total 2.8 2.3 0.5 -1.3 -1.7 na 0.8
a As for footnote (a) to Table 2.1.In some States, for example New South Wales, no account is taken of administrative and advisory services provided to local wateragencies free of charge by State Government bodies. Inclusion of the costs of these services would result in a minor reduction in therates reported in the Table.Source: AWRC 1991, p 7
In South Australia and Western Australia, where country users are supplied by the single agencyresponsible for providing metropolitan services, government policy is that total charges for a givenlevel of service should be roughly the same, irrespective of the location of users relative to bulksupplies etc.2 As a result of the higher costs of supply, charges to country consumers for water inboth States (as well as sewerage in South Australia) fall well short of covering operating costs anddepreciation. Hence maintenance of the asset base in the country areas of these States requiresongoing subsidies funded either by government or from charges levied on metropolitan customers.Common tariffs also apply across the Northern Territory. While the AWRC’s 1991 InteragencyComparison did not provide RRR data for the Power and Water Authority in the Territory, theAuthority’s submission to this inquiry suggests that the RRR is negative for water and possibly forsewerage.
In most jurisdictions the costs of providing stormwater drainage are met from general rates andthus the level of cost recovery cannot be determined. Melbourne Water Corporation, which is oneof the few authorities to levy a specific drainage charge (WAWA and the SWB are two others),said that it more than covers operating costs and depreciation.
Many WSD authorities which deal with discharges of trade wastes levy specific charges to reflectthe additional demands placed on sewerage systems by those wastes. Separate charges may alsoapply to the disposal of toxic wastes which cannot legally be disposed of in sewers.
2 The structure of charges nonetheless varies between city and country areas in these States.

WATER RESOURCESAND WASTE WATERDISPOSAL
2.34
The degree of cost recovery on trade waste services varies across jurisdictions but under-recoveryis common. The Geelong and District Water Board said that industry had been undercharged in thepast. The Brisbane City Council said that its charges for both trade waste and liquid waste disposalare insufficient to provide a rate of return on the investments necessary to provide those services.In Adelaide, no charges for the disposal of trade wastes are levied.
Tariff structures
Water
Charging structures for urban water depend on the type of property receiving the water --residential, business or industrial -- and whether supplies are metered.
For metered supplies to residential properties, most water authorities levy an access charge basedon property value, which usually entitles the user to an allowance of water for which no additionalcharge per KL is levied. In some instances the size of the base allowance is linked to the propertybased charge -- that is, owners of higher value properties who pay a larger access charge get abigger allowance.
Charges applied to water use above the base allowance may be either uniform or block-based. Forexample, in the ACT a uniform charge for ‘excess’ usage of 56 cents per KL applies. In Perthcharges increase from 51.4 cents per KL for usage between 151 and 350 KL to 96 cents per KL forusage over 1950 KL.
Whether uniform or block, usage charges seldom reflect the effects on costs of supply of distancefrom the source of water supply. Similarly, prices are not varied to reflect the increased demandsplaced on supplies at particular times of the day or year, nor to reflect increased scarcity duringperiods of drought. Rather, non-price mechanisms such as water rationing are used to allocatescarce supplies.
Although property charges and base allowances continue to dominate charging arrangements, therehas been a move towards so-called ‘user-pays’ tariffs. As early as 1978, WAWA moved to reducebase allowances for customers in Perth and to set a uniform access charge for all residentialcustomers. In the early 1980s, the then Hunter District Water Board abolished base allowances andproperty based access charges, and replaced them by access charges related to the size of the waterconnection provided and a usage charge for all units of water supplied. Authorities such as theGeelong and District Water Board have followed the Hunter’s pricing strategy, while MelbourneWater Corporation, the SWB and the Shepparton Water Board, amongst others, have dispensedwith base allowances. Other authorities have progressively reduced base allowances and plan toeliminate them in the future.
In spite of these initiatives, the move away from reliance on property charges has been slow. Forexample, it has taken Melbourne Water Corporation five years to reduce the share of property

PRICING PRACTICESAND PERFORMANCE
2.35
based charges in total revenues from 86 per cent to 69 per cent. And, in contrast to the trendtowards pay-for-use pricing, a new system recently introduced in Adelaide retains property basedaccess charges and a base water allowance (see Appendix C).
For non-metered residential properties, charges for water are generally levied on the basis ofproperty value. However, in some jurisdictions, for example the Johnstone Shire in Queensland, aflat charge per household is levied.
The reliance on property based charges is even more pronounced for commercial customers.Although there is notionally a pay-for-use component in charges levied on most commercialcustomers, the majority do not exceed the basic water allowances which accompany property basedaccess charges.
The reliance on property based charging for commercial properties, in conjunction with therelatively high value of those properties, means that businesses pay a very high average price forthe water they use. Melbourne Water Corporation provided information which indicates that theeffective price per KL of water for some business users in Melbourne’s Central Business District(CBD) is around 15 times higher than the price to residential users (see Table 2.3).
Table 2.3: Price of water by type of property, Melbourne, 1990-91
Type of Property $ per KL
House 0.66
Flat 0.91
Suburban shop 4.27
Office tower (CBD) 10.16
International hotela
0.57
Large chemical manufacturer 0.57
a While typically located in the CBD, international hotels and motels use much more water than is provided with the property basedaccess charge. Accordingly, the ‘average’ price they pay for water is effectively determined by the charge applying to consumption inexcess of the base allowance.Source: Melbourne Water Corporation
In Perth, these disparities are even more pronounced. Data compiled by WAWA indicate that, in1990-91, effective water prices per KL for a house, a suburban shop and a CBD office tower were$0.60, $5.76 and $10.90 respectively.
In some jurisdictions, high charges for commercial properties are used to offset losses made onsupplying residential services. For example, the SWB said that under-recovery of costs of $273million on residential services was partly offset by overcharging of non-residential customers to the

WATER RESOURCESAND WASTE WATERDISPOSAL
2.36
extent of $157 million.3 Similarly, the Western Australian Chamber of Commerce and Industrysaid that non-domestic customers in Perth provide 40 per cent of WAWA’s metropolitan waterrevenue, but use only 25 per cent of total water consumed.
In contrast to commercial users, industrial users are not greatly disadvantaged by property basedcharges for water. This is because industrial users are usually located in areas where land ischeaper, and they use large volumes of water. Penrice Soda Products, a soda ash producer whichpurchases about 1 per cent of all reticulated water in Adelaide, said that the base allowanceattached to its property-based access charge is insignificant in terms of its total water usage. As aconsequence, the usage charge applying to excess consumption (85 cents per KL) effectivelyapplies to all water purchased. Authorities in some jurisdictions negotiate specific contracts withbulk industrial users.
Sewerage and drainage
For sewerage services, most WSD authorities levy a single charge. This is generally based onproperty values combined with a minimum charge. However, ACTEW, the Campaspe RegionWater Authority and the Brisbane City Council (BCC) (for residential properties only), amongothers, impose a uniform charge.
As in the case of water, there have been some attempts to relate sewerage charges to the demandsthat users place on the system. For example, the Hunter Water Corporation levies an access chargerelated to the size of the connection and a usage charge based on the percentage of water suppliedpresumed to be returned to the sewerage system.4 The Geelong and District Water Board intendsto introduce the same system at the beginning of 1993. Charges for multiple pedestals apply insome jurisdictions.
Special environmental levies are included in sewerage charges in some places. In Sydney, an $80annual charge is payable for specific purpose upgrading such as ocean outfalls. In South Australia,10 per cent of the sewerage charge represents a levy to assist in financing works to upgrade thestandard of sewage treatment. A property-based environmental levy applies in Geelong to upgradesewage treatment works. And, in the ACT, sewerage charges include a $25 component earmarkedfor environmental improvement projects such as the design and construction of grease traps and oilinterception facilities.
3 Based on a notional 4 per cent RRR. Figures include both water and sewerage. The non-residential sectorincludes both commercial and industrial users.4 For domestic users, a constant 50 per cent of water supplied is presumed to be returned to the seweragesystem. For non-domestic users, the percentage applied is either 25, 50, 75 or 100 per cent, depending on thetype of user.

PRICING PRACTICESAND PERFORMANCE
2.37
Where specific stormwater drainage charges are levied, they are almost exclusively linked toproperty values. The SWB does, however, levy a flat access charge for residential and non-residential premises as well as a property-based charge.
Trade waste
Trade waste charges (when they exist) are generally based on both the quantity and the quality ofthe waste discharged. In most instances volumes of discharge are metered, although in the case ofthe BCC volumes are based on an agreed percentage of water supplied to the premises concerned.
Typically the per KL charge is based on the cost of treating trade wastes of the same strength asdomestic sewage. Any loading for additional costs that stronger wastes place on a sewerage systemis usually related to the biological/biochemical oxygen demand (BOD) of the waste and sometimesto particular solid materials it contains.
Augmentations and new works
A feature of the water industry in Australia is the increasing reliance on assets provided by landdevelopers. Typically, developers are required to provide water and sewerage reticulation withinnew subdivisions and to transfer these assets to the relevant water authority without charge at thetime of land sale. Developers recoup their costs through the price charged for the land. Aroundone-eighth of assets in the water sector have been provided in this way (AWRC 1991).
In addition to a component for the cost of providing reticulation within a subdivision, prices fordeveloped land usually include a component to reflect charges levied on developers as a (partial)contribution to the costs of extending water and sewerage systems to new developments -- forexample, trunk main extensions. However, in Tasmania, local councils have no power to levydeveloper charges.
Unlike charges for the supply of water and the disposal of sewage, developer charges sometimesreflect differences in the cost of providing extensions of services to different areas in a region. Forexample, the SWB said that terrain and strata in water supply zones and catchments have asignificant bearing on its charges to developers for major works. These range from $43 700 perhectare in Campbelltown to $96 100 per hectare in West Pennant Hills.
In most areas, including the major metropolitan areas, charges levied on developers recoup lessthan the full cost of system augmentations. The SWB said that, despite increases in charges sincethe mid 1980s, it only recovers around 88 per cent of extension costs. Moreover, it indicated that itrecoups only about 2 per cent of the cost of major headworks required for system augmentations.Additional charges of between $14 000 and $36 000 per hectare would be required to cover thesecosts, excluding dams. The Western Australian Chamber of Commerce and Industry estimated thatdeveloper charges in Perth only recover 33 per cent of extension costs.

WATER RESOURCESAND WASTE WATERDISPOSAL
2.38
Community service obligations
Like many other government agencies engaged in providing goods and services, WSD authoritiesare often directed to provide non-commercial services or to price services at less than cost inaccordance with social and developmental objectives of government. These requirements arecommonly referred to as community service obligations (CSOs). Where water authorities arerequired to fund CSOs internally, this may result in the collection of ‘excess’ charges from otherusers. This practice is commonly referred to as cross subsidisation.
As discussed in Appendix C, identification of what constitutes a CSO is open to interpretation.That said, a range of mandated non-commercial practices relating to the provision of urban WSDservices can be identified.
One important type is mandated uniform pricing arrangements across areas with significantlydifferent costs of supply.
The most notable examples are the State-wide uniform pricing arrangements for water andsewerage in South Australia, Western Australia and the Northern Territory. South AustralianGovernment policy, for example, endorses the view that ‘equal services be charged equally’irrespective of the proximity of the customer to bulk supplies or treatment facilities. These uniformState-wide charging policies help to explain the low or negative RRRs reported in Table 2.2 forcountry water and sewerage in South Australia and Western Australia.
The Shepparton Water Board argued that a requirement to engage in non-commercial uniformpricing is part of the Victorian Government’s policy of merging small water authorities with largerones. It said that:
A principle objective of the Victorian Government in merging small, high cost water authorities with largerregional bodies is to reduce the cost of water and sewerage services in those small communities, through crosssubsidisation from the larger authority.
Such explicit Government policy forces the amalgamating authority to incur additional business operating costsand to spread those costs over its customer base. No commercial orientated organisation willingly accepts suchcost impediments to its efficiency -- but what choice does the public authority have?
This claim was disputed by the Victorian Government. It acknowledged that under a previouspolicy, cross subsidies had been negotiated on an ad hoc basis to encourage voluntaryamalgamation. However, it went on to argue that the policy applying over the last 12 months,which provides for compulsory amalgamations, does not require, or indeed encourage, uniformpricing across merged authorities:

PRICING PRACTICESAND PERFORMANCE
2.39
The principle objective to mergers among non-metropolitan urban authorities is to reduce the cost of serviceprovision and/or improve the quality of service provided to the smaller community. ...
Obviously, the immediate attraction for the smaller community is reduced rates and the decision to rate uniformlyis often taken by the new authority as a matter of policy. However, there have also been a number of instances inwhich rates have not been charged uniformly. In these cases, the smaller communities have still benefitedsignificantly through somewhat reduced rates and/or improved service delivery.
The provision of rebates or concessions to pensioners is government policy in all States andTerritories. The rates of subsidy are provided in Appendix C. Some authorities also provideassistance to low income earners. Churches, hospitals, nursing homes, child care centres andgovernment departments receive free or heavily subsidised WSD services in some jurisdictions,and some authorities provide free water for use in parks and other municipal areas.5
The costs of this group of CSOs are significant. For example, pensioner rebates in Sydney andMelbourne alone total around $30 million and $20 million per annum, respectively.
With the exception of pensioner rebates, direct government funding is not generally provided tomeet the cost of these CSOs. For pensioner rebates, the level of government funding varies being,for example, close to 100 per cent in Victoria but only 50 per cent in New South Wales (seeAppendix C).
There are also requirements to extend services to areas which it would not be sensible to supply oncommercial grounds alone. In some instances, this is achieved without commercial penalty toWSD authorities through the payment of capital subsidies (see Chapter 3). However, in otherinstances authorities have been required to fund non-commercial augmentations. The HunterWater Corporation, for example, is required by the New South Wales Government to extendsewerage services to fringe areas. While this CSO is now fully funded, prior to the recentcorporatisation of the authority, its existing customers met 50 per cent of the cost.
Property based charges for WSD services are sometimes thought of as a CSO in the sense that, at abroad level, they redistribute income from business to households, from wealthy households topoor households etc.
The extent to which the use of property based charging reflects a direction from government isunclear. At least in Victoria, there are no requirements for WSD authorities to pursue incomeredistribution through this form of charging. As the Latrobe Regional Commission stated:
5 As discussed in Appendix C, it is unclear whether some of these concessions are mandated or provided atthe discretion of the authorities concerned.

WATER RESOURCESAND WASTE WATERDISPOSAL
2.40
The Water Act [in Victoria] enables water authorities to charge prices which reflect payment for use, so cross-subsidies which derive from rate based pricing are voluntary rather than compulsory obligations.
However, the many property based charging systems still existing in that State can be seen as alegacy of legislation applying until 1990 requiring that property value be the sole determinant ingeneral pricing arrangements.
The SWB said that government concerns about redistributive impacts meant that water authoritiesin New South Wales had not been able to phase out property based charging at the speed whichthey desired. And, as noted earlier, Adelaide’s new water pricing policy relies heavily on propertybased charges.
While property based charging has some CSO characteristics, it also has a number of redistributiveimpacts seemingly at odds with the concept of a CSO. For example, a small business usingrelatively little water will pay a much higher price per unit than will say a large motel in the CBD(see Table 2.3). Similarly, occupants of flats and home units may be required to subsidise thewater use of more or equally affluent people residing on standard suburban blocks. Thedistributional impacts of property based charging are discussed in Chapter 6.
Capital subsidies
Subsidies provided for infrastructure in country areas are another factor influencing the price ofwater services. Capital subsidies are discussed in the following chapter.
2.2 Pricing of irrigation water
Cost recovery
Current pricing practices for irrigation water and drainage are largely an outcome of pastgovernments’ social and development policies, rather than sound commercial practices. As theRicegrowers’ Association of Australia stated:
Political water pricing was sometimes based on reasonably commercial principles but in many years politicalexpediency overruled commercial judgement.
The legacy is charges which, although sometimes covering the direct costs of operating andmaintaining irrigation and drainage systems, generally make little provision for depreciation ofassets, let alone any return on the capital invested in dams and irrigation networks. Also chargesmake little or no allowance for the costs of countering salinity and waterlogging in a number ofAustralia’s irrigation areas.

PRICING PRACTICESAND PERFORMANCE
2.41
The low level of cost recovery Australia-wide is reflected in the AWRC’s estimates of RRRs onirrigation services (see Table 2.4).
The cost shortfalls underlying the negative RRR figures in Table 2.4 were discussed by the ruralwater agencies in their submissions to the Commission.
Table 2.4: Real rates of returna for irrigation and rural drainage services, 1988-89(per cent)
Service NSW Vic Qld WA SA TAS
Gravity irrigation -3.5 -1.2 -2.0 - -5.2 -1.7
Pumped irrigation -3.8 -1.6 -1.9 -3.2 -1.3 -
Private diversions -1.9 -0.9 -1.5 - - -
Drainage -3.2 -2.2 -2.4 -5.0 - -
a For the purposes of these calculations, assets are valued using the Modern Equivalent Asset methodology (see Chapter 6).Source: AWRC 1991, pp 31-35
In New South Wales, where a new irrigation water pricing policy introduced in 1989 placesemphasis upon user pays, substantial under-recovery remains. The costs of metered waterdiversions by private river pumpers and the costs of distributing water within the Irrigation Areasand Districts,6 including depreciation costs, are now recovered. Irrigators also pay for 70 per centof the costs of running the rivers -- that is, the cost of delivering water from the dams to the pointwhere it is diverted from the river. The remaining 30 per cent is met by the Government ‘inrecognition of the public benefits they generate’. However, the costs of operating and maintainingthe dams continue to be fully met by the Government. It has also waived all debt previouslyincurred on the operations of the Irrigation Areas and Districts and has agreed to meet 50 per centof the cost of asset rehabilitation necessary to maintain current levels of service. The New SouthWales Department of Water Resources (1990) estimated that the implementation of fullycommercial pricing, including a return on capital, would require increases of the order of 50 percent. The MIA Council of Horticultural Associations said that if irrigators were required to pay thefull costs of capital replacement and a 5 per cent return on assets, price increases of around 250 percent would be required.
The Rural Water Corporation (RWC) in Victoria said that it recovers less than 50 per cent of itstotal costs excluding superannuation benefits to RWC employees and costs of overdraft facilities.These costs, and the costs of refurbishments or enhancements, are met by the State Government orthrough borrowing. The RWC estimated that the loss to the Victorian Government on itsoperations, including the forgone return on equity, was more than $130 million in 1988.
6 Regions serviced by government irrigation schemes.

WATER RESOURCESAND WASTE WATERDISPOSAL
2.42
The magnitude of this shortfall was disputed by the Victorian Farmers’ Federation. Drawing oninformation presented in the McDonald Report on the future of the RWC (Gutteridge Haskins andDavey 1992), the Federation claimed that in 1990-91 the shortfall in revenue was only $45 million.However, this estimate does not appear to include any provision for a return on government equityin Victoria’s irrigation assets.
The Queensland Government estimated that to move to a zero RRR would require average waterprice increases of 150 per cent, while to earn a 4 per cent RRR an increase of 470 per cent wouldbe required.
Similarly, WAWA (1990) estimated that irrigation charges in Western Australia would have toincrease by at least 90 per cent to achieve a zero RRR. For the Ord River Scheme, which onlyrecovers about 25 per cent of operating costs, far bigger increases would be required.
Tariff structures
Tariff structures for irrigation water vary considerably throughout Australia.
In New South Wales, charges within the Irrigation Areas and Districts comprise three components:a service delivery charge to cover 70 per cent of the costs of running rivers downstream from dams;a water distribution charge to cover the costs of distribution and drainage within each irrigationdistrict; and an asset rehabilitation levy. River pumpers on regulated streams pay the same deliveryservice charge as Area and District irrigators together with a metering charge.
In Victoria, charges in public irrigation systems comprise a fixed charge for the volume of waterallocated to a particular block of land and a variable charge for any additional water used.Licensed private diverters pay a uniform rate per megalitre (ML).
In Queensland, a flat charge per ML is levied on irrigators for water use within nominal allocations.In schemes where existing supplies are fully committed, or close to fully committed, increasingblock tariffs apply to use above announced allocations. Separate drainage charges, based on thearea of land serviced, apply in those areas where publicly funded drainage infrastructure has beenprovided.
In South Australia, uniform volumetric charges for water use within allocations also apply, with anincreasing block tariff applying to water use above allocation in all the irrigation areas. Separatedrainage charges apply where relevant.
Western Australia has a range of charges. In the Harvey, Waroona/Collie and Carnarvon schemes,there is a fixed charge based on the area of land irrigated together with a volumetric charge. In thePreston Valley, only a volumetric charge is levied, and in the Ord Irrigation Scheme all revenue isderived from a fixed charge based on area irrigated.

PRICING PRACTICESAND PERFORMANCE
2.43
In Tasmania, a flat per ML charge is levied on government irrigators for their water allocation anda volumetric charge for usage in excess of that allocation. There are no charges levied on privatediverters.
In all States charges vary between irrigation schemes. For example, per unit charges in Victoria in1989-90 ranged from $13 per ML in the Goulburn Murray Irrigation District to $62 per ML in theWerribee District.
Within irrigation schemes there is little differentiation in charges. This may partly reflect the factthat differentiation can be administratively costly. However, uniformity in charges also reflectsnon-commercial objectives. The Queensland Government said that internal cross subsidisationthrough charging regimes is commonplace to promote regional stability and development.
A commercial approach to setting charges could be expected to result in some differentiation,particularly when different crops are grown. In New South Wales, the requirement to fully covercosts within the Irrigation Areas and Districts has led the Murrumbidgee Management Board toincrease charges substantially for small farms (horticulture) in recognition of the higher levels ofservice required relative to large area farms.
In some States, irrigation pricing regimes include a minimum charge which means that water mustbe paid for even if it is not used. In Victoria and Tasmania, minimum charges are based on anirrigator’s full allocation of water, while in South Australia, the minimum charge is based on 50 percent of the allocation. In Queensland, a minimum charge is based on between 50 and 100 per centof the nominal allocation, depending on the scheme.
Individual irrigators in all States other than Western Australia, have the option to purchaseentitlements to additional water from other irrigators. Trade in water and the basis on which waterentitlements are allocated is discussed in Chapter 8.
2.3 Participants’ views on shortcomings in current pricing
As discussed in later chapters, establishing what are efficient prices for WSD services is a complexmatter, involving difficult and sometimes contentious conceptual and implementation issues.
But these difficulties notwithstanding, participants argued that there are a number of inefficienciesin current pricing arrangements for WSD services in Australia. For some WSD services, includingpublicly funded irrigation and water and sewerage in many country towns, charges do not cover

WATER RESOURCESAND WASTE WATERDISPOSAL
2.44
operating and maintenance costs and depreciation, let alone any return on the investment requiredto provide infrastructure. Even so, there is the implicit assumption that these schemes will continueto operate.
Some participants argued that cost under-recovery, in conjunction with inappropriate usage charges(see below), makes it difficult for WSD authorities to make appropriate decisions on when to investin infrastructure and what level of service to provide. They claimed that this is because the normalrole of market prices -- that of conveying information to consumers on the costs of various supplyoptions and transmitting information back to authorities on the value that consumers place onservices -- is muted. The Victorian Government said:
... suppliers have lacked information to make investment decisions in the best interests of their consumers and thebroader community. Tariffs not related to consumption tell suppliers nothing about the price/volume tradeoffsconsumers would be prepared to make if given choice. Nor do they provide any indication of the willingness ofconsumers to pay for the products of the water utility.
In a similar vein, the Western Australian Department of Agriculture said that:
The Water Authority has been left with the problem of determining what level of investment in infrastructurereplacement is warranted and how it can be paid for. It has done this with no direct information on the value tofarmers of the water that would be saved (because there is no user pays) so that it becomes very difficult for theWater Authority to make decisions on the appropriate level of investment.
Some participants also argued that the subsidies resulting from cost under-recovery provide anartificial advantage to factories or farms which use WSD services in their production processes.WAWA said:
It can be argued that, as commercial enterprises, irrigation farmers should be meeting the full cost of providingservices. For example, irrigated dairy farms in the South-West of Western Australia are receiving a subsidy thatnon-irrigated farms do not receive, to no obvious benefit to the community. Unless such farms can competewhile paying full cost of irrigation services, the community would be better off not renewing irrigation assets.
Participants said that the structure of water charges is deficient in many jurisdictions.
Of chief concern were the arrangements which make available an allowance of water in return forthe charge for access to the service. Many argued that such arrangements provide no incentive toavoid wasteful use of water. The HWC noted that its move to user pays pricing, including theabolition of base allowances, has reduced overall consumption by 30 per cent and peak demand byeven more. The Campaspe Region Water Authority said that user pays pricing had reduced peakwater consumption in the Rochester area by more than 20 per cent between 1985 and 1992, despitean increase in the number of properties serviced over the period.
Over-use of water can bring forward the need for expensive augmentations to systems -- new dams,pumping stations etc. The HWC said that its introduction of user pays pricing has permitted thedeferment of major works including the construction of a large dam by about 30 years.

PRICING PRACTICESAND PERFORMANCE
2.45
The need for sewerage and drainage facilities is directly related to water use. Consequently, someparticipants said that unnecessary environmental degradation and/or the need for prematureinvestment in sewage treatment facilities are often adverse consequences of the failure to imposeappropriate usage charges. In criticising the arrangement in Victoria where irrigators pay for theirfull allocation of water irrespective of whether they use it, the Victorian Government said that:
... the Tragowel Plains, Campaspe and Shepparton Region draft Salinity Management Plans have all pointed outthat the present irrigation tariff structures encourage irrigation inefficiency or ‘over watering’. Additionalpressure on drainage systems and groundwater levels result when volumes greater than plant requirements areapplied.
Some participants argued that subsidised water encourages the inefficient use of inputs. TheWestern Australian Department of Agriculture said, for example, that cheap water:
... discourages adoption of alternative sources of water (eg on-farm supplies) which might be lower cost [and] ...discourages adoption of water saving technology (eg drip irrigation), efficient scheduling techniques and methodsof production in which other inputs might substitute for water (eg grain feeding dairy cattle).
Many saw the lack of direct funding for most CSOs performed by WSD authorities as anotherproblem with current pricing arrangements, in that it may require cross subsidisation by other users.However, the South Australian Government said that caution is required in advancing thisargument because few water services fully recover costs (including a rate of return on equity). Inrelation to its mandated uniform pricing arrangements for water and sewerage it observed:
... a financial loss is incurred on country water supply compared with a financial surplus in the metropolitan area.
... [But] this is not a conventional cross subsidy from metropolitan to country customers because metropolitancustomers are paying less than true costs.
Finally, many participants said that property based charging systems are inefficient. They arguedthat, in addition to the problems associated with the provision of ‘free’ water which typicallyaccompanies property based access charges, this form of charging involves a cross subsidy fromcommercial/industrial customers to residential users. As noted earlier, the SWB identifiedsubstantial ‘overcharging’ of business customers as a consequence of its property based charges.
At the draft report hearing a different view was taken by the South Australian Government. Itargued that for commercial premises, property based water charges are a reasonable proxy for thevalue of the insurance benefits provided by a fire fighting capability. The South AustralianGovernment also contended that property based charges for sewerage can be justified as:

WATER RESOURCESAND WASTE WATERDISPOSAL
2.46
... a way of collecting money through a taxation base for what can be regarded as a system which providesgeneral community benefit rather than immediate benefit user by user.
2.4 Institutional arrangements affect pricing policies
The efforts of WSD authorities to price in a more commercial fashion are inhibited by currentinstitutional arrangements.
To cushion the impact of pricing reform on users, State Governments have imposed constraints onprice increases for water services. Generally price increases to individual customers have beenlimited to the level of increase in the Consumer Price Index. Such constraints also apply to a rangeof other services provided by government enterprises. Participants said that these constraints haveseverely curbed the scope for WSD authorities to restructure charging regimes and, in particular, toreduce their dependence on property based charges.
Even where no explicit pricing constraint exists, water authorities have been sensitive to theconcern of State Governments to limit price increases. ACTEW indicated that its perception of thepolitical sensitivity of water pricing means that substantial increases, even if justified on economicgrounds, would not be acceptable, at least in the short term. The SWB said that politicalconsiderations prevent it setting developer charges which fully reflect the cost of extending systemsto new developments.
Representatives on regional water boards and local councils are elected, rather than appointed onthe basis of their commercial expertise. The Brisbane City Council said that this places furtherconstraints on commercially warranted pricing reform:
None of the administrations governing the City for many years has explicitly made a public connection betweenthe costs and prices of providing water supply and sewerage to each premise. There has no doubt been arecognition that prices should more than cover costs on a cash basis, but the over-riding consideration indetermining pricing policies has clearly been one of electoral acceptance.
In summary, the various constraints on pricing reform illustrate the consequences of the lack of anarms-length relationship between government and water authorities.

ARE COSTS OFSERVICE PROVISIONTOO
HIGH?
3.47
3 ARE COSTS OF SERVICE PROVISION TOO
HIGH?
Part of the reform process is to ensure that water services are provided in the least cost fashion.
The Commission received a wealth of information on the ways in which individual water, sewerageand drainage (WSD) agencies determine levels of service provision and investment in new assets,and the safeguards in place to ensure proper decision making.
The major water agencies in particular provided evidence of efficiency gains achieved in recentyears through administrative reforms. These include heightening the commercial focus of theiroperations through, for example, greater use of outside contractors, removing inefficient workpractices, flattening management structures and improving asset management.
Nevertheless, there is considerable potential to further reduce costs.
3.1 Sources of cost reductions
Improved labour and management practices
Improved labour market practices are important in lowering the costs of service provision. TheSydney Water Board (SWB) said that work classifications (particularly in semi-skilled areas) limitmulti-skilling and flexible working arrangements. For instance, the Board said the traditionalspread of hours of work and the accompanying penalty rates inhibit its ability to respond tocustomer demands. ACT Electricity and Water (ACTEW) identified cost savings from reducingthe number of unions involved in its operations and moving to an enterprise award. These savingswould stem from fewer demarcation problems, streamlined work practices, lower administrativecosts and greater flexibility in the deployment of staff. Melbourne Water Corporationacknowledged that work practices are a source of inefficiency, citing its experience with the SouthEastern Purification Plant. It said that the plant had been designed and built as a fully automatedsystem but has been manned as if it were not automated. Full recognition of the plant’s designcapabilities and the contracting out of much of the maintenance work could reduce staffing levelsfrom 280 to about 130.
A number of participants commented on the scope for cost savings from flatter managementstructures. The National Farmers Federation, for example, was critical of top heavy organisationalstructures which it said result in excessive overheads in the supply of irrigation water. Otherparticipants referred to the gains achieved in some of the major authorities through eliminatinglevels of management.
WATER RESOURCES& WASTE WATERDISPOSAL
3.48
Irrigators argued that more devolution of management responsibilities to the regions would reducethe cost of supplying irrigation water. The NSW Irrigators Council said that the impetus for therecent creation of irrigation management boards in New South Wales had been the concern toregionalise and localise management. Participants commented favourably on the steps alreadytaken to regionalise the operations of the Department of Water Resources (DWR) in New SouthWales. The New South Wales experience and recent devolution initiatives in Victoria arediscussed in Chapter 7.
Better asset management
A number of participants referred to the ‘gold plating’ of assets. The SWB said that a recent reviewby the Australian Water Resources Council (AWRC) of small scale sewerage options concludedthat it would be possible to halve costs with little loss of functionality by installing less costlyplants. The Public Works Department of New South Wales (PWD) indicated that further savingsare available through setting lower sewer design standards, using smaller diameter and lower gradepiping, reducing trench width and using off the shelf equipment. The Department said that savingscould also be made to the cost of providing water to small communities by, among other things,maintaining less reservoir storage and stand-by capacity. Mr French from the University of NewEngland argued that from the perspective of safety, dams have been over-engineered in the past,and that structural modifications continue to exhibit this tendency. However, this claim wasdisputed by the Australian National Committee on Large Dams which is responsible for thepublication of guidelines on dam safety.
Efficient service provision requires that assets are neither replaced prematurely nor belatedly.Indeed, the AWRC’s 1991 interagency comparison pointed to:
... the importance of careful economic evaluation of new capital works and the need to pay greater attention tomonitoring the age conditions of assets and their likely replacement schedules. The whole question of assetmanagement is clearly a major issue for the 1990s in the water industry. (AWRC 1991, p 20)
The need for asset refurbishments in many of Australia’s metropolitan water and sewerage systemsis well known. The Townsville City Council argued that asset replacement is the greatest singleproblem facing local authorities in Queensland. The SWB said that a major program of assetrenewals is required to maintain service delivery standards in the Sydney area. The run-downcondition of assets in government irrigation schemes around Australia is well documented andmajor investments are required in the Murray-Darling Basin to deal with problems of waterloggingand salinity.
While infrastructure in some major cities is in need of refurbishment, it is not clear that the bulk ofthis asset replacement has been excessively delayed at least in terms of providing existing levels ofservice. Whether sewerage services etc, need to be upgraded is a separate issue.

ARE COSTS OFSERVICE PROVISIONTOO
HIGH?
3.49
However, many participants said that the depleted condition of much of Australia’s irrigationinfrastructure is largely a reflection of the failure of pricing policies to make provision for assetrefurbishment. The Salinity Program Advisory Council said that:
... the lack of maintenance over the last 100 years has resulted in an infrastructure which requires enormouscapital injection to bring it up to a satisfactory standard. ... The policy not to collect satisfactory depreciationcharges was a Government policy ...
Similarly, some participants claimed that the underpricing of country urban services has led tounwarranted delays in asset replacement. The Shepparton Water Board said that:
Asset run-down we suggest, can be readily found in many water authorities around Victoria. Some authoritiescontinue to stay in business by consuming their assets, ie preventative maintenance is inadequate,depreciation is unfunded (often at Government direction to reduce rates) and in other instances water andsewerage revenue is being hived off to fund other areas of Local Government activity.
In urban systems, there is scope to prolong asset lives through better asset monitoring andimproved maintenance procedures. In an unpublished AWRC paper, Manoel and Reynolds (1989)argue that recent innovations in condition monitoring and maintenance management systems,together with improved maintenance technology, could feasibly increase the lives of tanks andstorages and pumping stations by 15 per cent. For tanks and storages this equates to about 11years. The authors also argue that WSD authorities have been overly conservative in theirestimates of the lives of small and medium diameter water and sewerage mains. They estimatethat, in total, these factors could increase prospective asset life by 30 per cent. This would equateto about 20 years for sewer mains and 24 years for water mains. Information provided by theAWRC updates these figures (see Section 3.4).
More contracting out
In addition to WSD assets provided by developers as part of new subdivisions, major constructionworks are typically contracted out. In some jurisdictions, contracting out extends to such things asdesign engineering, legal and computing services, vehicle maintenance and meter reading. InMelbourne and Sydney, build, own, operate and transfer schemes which involve the private sectorin the design, construction and operation of infrastructure, are now in place. The Rouse Hilldevelopment1 in Sydney’s west is a notable example. However, typically, the operation andmaintenance of water and sewerage schemes is undertaken in-house.
1 In Rouse Hill a consortium will fund and project manage the provision of water, sewerage and drainage
services. All costs are to be recovered from developers, including headworks, major works and financialservicing costs. The SWB will receive ownership of the assets constructed by the consortium in return for arefund of developer contributions.

WATER RESOURCES& WASTE WATERDISPOSAL
3.50
There is widespread recognition of the scope for efficiency improvements from greater use ofcontracting out. The Geelong and District Water Board said that:
Downsizing of an organisation may, based on economic considerations promote greater efficiencies andbetter concentration on the core activities of the business. Fundamentally, service and management ofactivities should be the main objective of an authority, particularly in metropolitan type areas, where privatecontract services are readily available. A downsizing of the organisation by contracting out will not only havethe benefits of reducing the work force but reducing associated overheads. Overheads are a large impositionfor any organisation ... Moreover any initial attempt to downsize an organisation will have a secondary effect inthat administrative practices and needs should also be lessened.
Similarly the SWB said that it:
... has for some time recognised the advantages that can be obtained by contracting out much of its activitieswhich it previously performed ‘ in house’. With the Government’s demands for efficiency in the delivery ofservices and diminishing available resources to meet the demands of the community, contracting out hasenabled the organisation to overcome the lack of fiscal resources by the more efficient use of resources.
A number of participants provided estimates of the gains from contracting out. The Hunter WaterCorporation (HWC) said that contracting out all of its major construction projects had led to costsavings of 30 to 40 per cent. The VFF claimed that cost reductions of the order of 30 per centcould be achieved by extending contracting out in Victorian irrigation systems to include routinemaintenance and water distribution.
Evans and Reynolds (IC 1990, p 51) argue that significant reductions in the cost of assetreplacement are possible from the use of contractors ‘partly because contracting provides theopportunity for the accelerated introduction of improved technology’. They cite evidence from theUK which suggests that trenchless pipelaying techniques have the potential to reduce urban mainslaying costs by around 30 per cent, and estimates by the SWB that the margin between in-houseand contract mains laying costs can be of the order of 15 to 20 per cent. Evans and Reynoldssuggest that these estimates are confirmed by the fact that authorities which exclusively usecontractors for asset replacement (for example, ACTEW) are able to replace mains at asubstantially lower cost than other authorities. The South Australian Government acknowledgedthat the Engineering and Water Supply Department (EWS) would have difficulty in competingwith private contractors in this work, especially in the provision of small diameter water andsewerage mains.
While acknowledging the potential for greater contracting out, a common view was that someservices are supplied most efficiently in-house. The Local Government Engineers Association ofQueensland, for example, suggested that some construction activities are most cost effectivelyundertaken by local councils. Some participants spoke of the opportunity for WSD authorities toprofitably contract-in -- the DWR in New South Wales has entered the market for a number of

ARE COSTS OFSERVICE PROVISIONTOO
HIGH?
3.51
contract technical support functions. Participants also spoke of the need to maintain in-housecapabilities to supervise private contractors, while Melbourne Water Corporation spoke of theimportance of comparing in-house and out-house costs over a period of time rather than on a singlejob or item basis.
Some participants, particularly in country areas, referred to the poor quality of some workperformed by contractors and the difficulties of attracting private operators to remote areas. TheShepparton Water Board, for example, stated:
It is becoming increasingly difficult to attract good contractors outside of the capital cities, particularly fordifficult and dangerous sewer construction work.
Many of the contractors today have extremely poor business management skills, are under-capitalised, havepoor standards of workmanship and appalling attitudes to occupational health and safety standards, requiringan excessive and costly amount of onsite supervision by the principal.
Amalgamation of authorities
Consolidation of small WSD authorities is another source of potential cost reduction.
In Victoria, the number of water authorities has been reduced from 400 to around 120 over the lastdecade, and further amalgamations are in train. The Victorian Government said that:
... a fragmented industry structure has created the untenable situation where a number of water utilities acrossthe state are unviable without ongoing government assistance because of their small rating bases and lack ofscale economies.
According to the Victorian Government, amalgamations have provided important benefitsincluding:
• savings of up to $150 for the average household on combined water and sewerage bills;
• greater scope for system augmentation and investments to improve water quality;
• improved customer services -- for example, 24 hour emergency services; and
• a more integrated approach to water resource planning.
Melbourne Water Corporation said that, until recently, there had been 16 authorities providingWSD services around Port Phillip Bay and that this had led `to duplication of functions andactivities, little or no competition and a complex and interwoven network of boundaries with noapparent logical definition'. Melbourne Water Corporation has since absorbed the functions of sixadjoining water authorities and is now responsible for providing services to 80 per cent of the PortPhillip region.
Some participants also saw benefits in amalgamations of water agencies in New South Wales,Queensland and Tasmania. The Tasmanian Government said that fragmentation of services in that

WATER RESOURCES& WASTE WATERDISPOSAL
3.52
State is a major source of inefficiency with some of the 68 regional water schemes and 80 sewerageschemes servicing less than 100 people. The Johnstone Shire Council suggested that jointwater/sewerage systems for adjoining local authorities in Queensland could provide major savingsto ratepayers.
However, a number of participants questioned whether the savings from amalgamations observedin Victoria would be replicated in other States. The PWD said that amalgamations in New SouthWales in the late 1970s had reduced the number of country councils from over 170 to 125. Itargued that the current arrangements in country New South Wales, under which WSD services areprovided by 122 general purpose councils in conjunction with six county council-run regionalwater supply schemes, are highly cost-efficient. In support, the PWD pointed to a rate of return onservices in country New South Wales which is not greatly different from rates achieved in anumber of the major metropolitan authorities (see Table 2.2) and to an average operating cost perhead of population for water and sewerage services of $97 which also compares favourably withthe metropolitan agencies (see Table 3.1 below). The Department acknowledged that both theabove calculations exclude the cost of administrative and advisory services that it provides to localcouncils free of charge.2 Also, low operating costs may in part reflect overly capital intensivewater and sewerage systems, encouraged by the availability of significant capital subsidies (seeSection 3.3).
The PWD’s stance on the cost effectiveness of local council provision of WSD services, wasendorsed by a number of local government bodies. For example, the Narranderra Shire Councilsaid that, for geographic reasons, the provision of services to small country towns entails someinefficiencies which would not be reduced by amalgamation. It said that:
... amalgamations will [not] improve efficiencies in areas of administration, technical and financial services.Local government bodies now have in place adequate facilities for provision and operation of these servicesand for collecting revenue for maintaining them; amalgamation of supply authorities into a separateorganisation will duplicate these facilities, create additional bureaucracy, and increase costs.
A number of participants also pointed to a range of other advantages from local governmentprovision, including the ability to better co-ordinate the provision of sewerage and drainageservices and the greater accountability of service providers to local communities. These issues arediscussed in Chapter 7.
2 The PWD estimated that the inclusion in operating costs of the cost of managing the Country Towns WaterSupply and Sewerage Program ($7.7 million in 1991-92) would have the effect of reducing the average RRRfor New South Wales country authorities by about 0.1 of a percentage point.
ARE COSTS OFSERVICE PROVISIONTOO
HIGH?
3.53
Urban consolidation
CSIRO referred to savings in infrastructure costs that would accompany greater urbanconsolidation. According to the CSIRO, savings would arise from:
• the ability to take advantage of excess capacity in established networks;
• economies of serving higher density areas; and
• lower maintenance costs through, for example, reduced travelling times.
CSIRO referred to studies conducted for Melbourne and Sydney which indicate that consolidationwould reduce infrastructure costs by several thousand dollars per lot. These cost savings areunderpinned by the potential to use surplus capacity in existing systems and an assumption thattechnologies used in developed areas are also used in fringe developments. CSIRO said thatalternatives such as localised sewage treatment would make fringe development more costeffective.
Research and development
A number of participants argued that research and development into improved water and seweragetechnologies offers the prospect of significant cost savings.
On the urban front, participants spoke of the potential cost savings from the development of local sewagetreatment systems and more water efficient appliances.
Irrigators drew attention to the potential cost savings from improved on-farm water use practices. TheAustralian Irrigators Council stated:
On-farm water use efficiency varies widely; from as low as 30% to as high as 90%. Very real gains have beenmade over the past 25 years through the adoption of better management and application technologies. ...
However, adoption of the better application technologies and advanced irrigation schedulingmethods has by no means reached an optimum level and much still remains to be done.
There are still significant gaps in the research effort towards better technologies.
Research and development in the water sector is discussed further in Section 10.3.
3.2 Comparisons of costs across authorities
AWRC data on the cost per head of providing urban water and sewerage services in metropolitanand non-metropolitan regions across Australia are provided in Table 3.1. To improve compatibilitybetween agencies, these costs include a notional 4 per cent RRR on assets.
The AWRC's data show very large variations in the cost of service provision.

WATER RESOURCES& WASTE WATERDISPOSAL
3.54
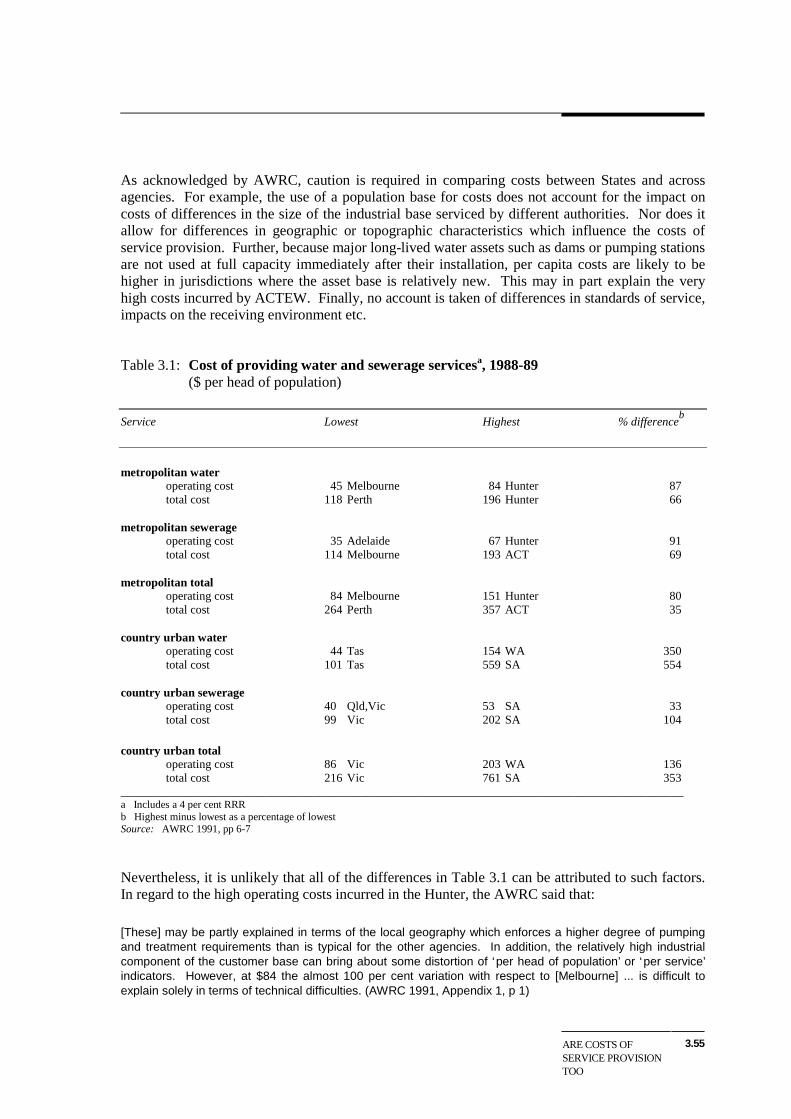
ARE COSTS OFSERVICE PROVISIONTOO
HIGH?
3.55
As acknowledged by AWRC, caution is required in comparing costs between States and acrossagencies. For example, the use of a population base for costs does not account for the impact oncosts of differences in the size of the industrial base serviced by different authorities. Nor does itallow for differences in geographic or topographic characteristics which influence the costs ofservice provision. Further, because major long-lived water assets such as dams or pumping stationsare not used at full capacity immediately after their installation, per capita costs are likely to behigher in jurisdictions where the asset base is relatively new. This may in part explain the veryhigh costs incurred by ACTEW. Finally, no account is taken of differences in standards of service,impacts on the receiving environment etc.
Table 3.1: Cost of providing water and sewerage servicesa, 1988-89($ per head of population)
Service Lowest Highest % differenceb
metropolitan wateroperating cost 45 Melbourne 84 Hunter 87total cost 118 Perth 196 Hunter 66
metropolitan sewerageoperating cost 35 Adelaide 67 Hunter 91total cost 114 Melbourne 193 ACT 69
metropolitan totaloperating cost 84 Melbourne 151 Hunter 80total cost 264 Perth 357 ACT 35
country urban wateroperating cost 44 Tas 154 WA 350total cost 101 Tas 559 SA 554
country urban sewerageoperating cost 40 Qld,Vic 53 SA 33total cost 99 Vic 202 SA 104
country urban totaloperating cost 86 Vic 203 WA 136total cost 216 Vic 761 SA 353
______________________________________________________________________________________________a Includes a 4 per cent RRRb Highest minus lowest as a percentage of lowestSource: AWRC 1991, pp 6-7
Nevertheless, it is unlikely that all of the differences in Table 3.1 can be attributed to such factors.In regard to the high operating costs incurred in the Hunter, the AWRC said that:
[These] may be partly explained in terms of the local geography which enforces a higher degree of pumpingand treatment requirements than is typical for the other agencies. In addition, the relatively high industrialcomponent of the customer base can bring about some distortion of ‘per head of population’ or ‘per service’indicators. However, at $84 the almost 100 per cent variation with respect to [Melbourne] ... is difficult toexplain solely in terms of technical difficulties. (AWRC 1991, Appendix 1, p 1)

WATER RESOURCES& WASTE WATERDISPOSAL
3.56
A feature in Table 3.1 is the very high cost of country water services provided by WAWA inWestern Australia and the EWS in South Australia. While this is in part explained by topography,the AWRC said the figures also reflect the cost of maintaining extensive networks with relativelysmall customer bases (AWRC 1991, Appendix 1, p.9).
The AWRC estimated that if all metropolitan authorities could reduce their operating costs to thelevel achieved in Melbourne, the average RRR for metropolitan authorities would increase from2.8 per cent to 3.7 per cent (AWRC 1991 p 12).
3.3 Institutional arrangements affect the costs of service provision
Lack of a commercial focus
Until recently, there have been few disciplines on WSD authorities to behave in a commercialfashion. Participants said that one outcome has been that many smaller authorities and councilshave limited knowledge of the assets they control. The Queensland Government stated that:
There is a general lack of accurate information within Local Authorities regarding assets (less than 20 per centhave effective asset registers) and their reserve capacities and current levels of service.
The Queensland Government indicated that a lack of accountability has allowed WSD authoritiesand governments alike to ignore the problem:
It is only in recent years that valuation of assets has become an issue in itself. Since there were norequirements for contributions to sinking funds (even based on book value), nor formal financial performanceindicators, the issue of asset values and valuation methods was not considered to be important.
The Tasmanian Government said that asset valuation in Tasmania is in its infancy. The mainproblem is to determine the condition of assets.
Participants also argued that lack of accountability has reduced the incentive for WSD authoritiesto investigate ways of reducing the cost of service provision.
Acceptance of performance monitoring as a means of improving the performance of WSD serviceproviders is a recent phenomenon. To date, detailed monitoring has been mainly confined to themajor metropolitan and regional water authorities, although in New South Wales, the PWD hascompiled State-wide performance indicators for local council WSD operations since 1986.
According to participants, efforts to implement more commercial provision of WSD services areoften frustrated by legacies of the past. The Water Authorities Association of Victoria, forinstance, said that the state of asset registers in many Victorian authorities will delay their responseto a State Government request to submit financial returns using current cost accounting techniques.

ARE COSTS OFSERVICE PROVISIONTOO
HIGH?
3.57
And, it appears that the accounting systems used by many WSD agencies do not allow for theproper comparison of the costs of undertaking work in-house and of employing private sectoroperators. The Murray River Management Board stated that:
The inability of the existing accounting systems to clearly cost the comparisons between contract andemployee based functions has been a serious impediment to developing contracting (p 13).
The South Australian Government acknowledged that accounting methods used by the EWS arenot designed to produce ‘equitable’ cost comparisons with private contractors.
Irrigators claimed that the lack of accountability of WSD authorities means that water users havelittle opportunity to influence the type of services provided and the way in which these services aredelivered. In regard to the Burdekin Dam, the Burdekin Dam Landowners Committee said that:
The point must be made that the public subsidisation of the Queensland project is really subsidisation of the[Water Resources] Commission’s inefficient use of manpower and waste of money in over-designed non-commercial reticulation construction. These inflated costs are then being applied as irrigation charges andcapital costs that farmers are expected to pay under the glowing philosophy of ‘user pays’ which is fine if theuser had sufficient say in what was being spent in the first place.
Government imposed constraints
Under the current institutional arrangements, governments have considerable discretion to imposenon-commercial requirements on WSD authorities.
Many participants said that the requirement that WSD authorities observe public service labourmarket conditions and conventions imposes significant cost penalties. For example, WAWAstated:
The Authority is ... required to conform to rigid public sector employment practices developed by agenciessuch as the Public Service Commission and the Department of Productivity and Labour Relations. Thisrequirement acts as a significant constraint to the ability of the Authority to achieve targeted productivity gains(p 12).
In a similar vein, the Murrumbidgee Irrigation Management Board argued:
The speed of change in work practices continues to be hindered by the Public Service unions and the archaicstructure they have erected to stifle change. Even the NSW Government is powerless.
The close working relationship between government and WSD agencies is also viewed as animpediment to overcoming general inefficiencies in working arrangements -- for example,fragmented union coverage. Melbourne Water Corporation said that greater separation fromgovernment would provide it with the opportunity to:
• negotiate enterprise awards specifically tailored to match the nature of the organisation and its work

WATER RESOURCES& WASTE WATERDISPOSAL
3.58
• significantly reduce the number of unions [with which it deals]
• foster a more commercial `mindset' with staff
• reinforce management prerogatives and speed up the appointment process by, for example, eliminatingunnecessary long term acting arrangements engendered by the public service appeals system
• provide greater autonomy in industrial relations decisions
• offer flexible rewards based on performance, thus gaining enhanced commitment. (p 19)
The Australian Federation of Construction Contractors said that the maintenance of non-commercial day labour teams reduces the use of more efficient outside contractors.
Like other government utilities, water authorities are subject to borrowing restrictions. Someauthorities commented that these restrictions inhibit commercial decision making. The SheppartonWater Board, for example, stated:
Authorities generally are constrained in establishing their desired mix of borrowed and internally generatedfunds, through Government and Loan Council borrowing constraints. As far as the Victorian Government isconcerned, it will not approve of any new authority borrowings whilst that authority has reserves of any kind,regardless of the purpose for which these funds have been generated.
That said, such constraints appear to have been a lesser problem for WSD authorities than for someother government utilities. This is because much infrastructure has been funded either by internallygenerated funds or directly by government. According to some participants, governmentconstraints on price increases, which have reduced the ability of WSD authorities to generateinvestment funds, have therefore been more of a problem. The Mosman Council in Sydney arguedthat:
With existing rate pegging, and the demand for a wide range of services by ratepayers on Local Government,financial resources are limited to such an extent, that upgrading of stormwater lines will be carried out at anunacceptably slow rate.
The Brisbane City Council said that because of financial constraints it has not been able toimplement improvements in areas such as metering at the optimal rate.
Capital subsidies
In some country areas, the costs of water infrastructure are subsidised by either State orCommonwealth Governments.
At the State level, the New South Wales Government provides capital grants to local authorities forup to 50 per cent of the capital cost of approved new works after deducting developercontributions. Assistance is means tested to exclude some larger regional cities. In Queensland,subsidies of 20 per cent are payable for dams, bores, pumping stations, treatment plants, trunk
ARE COSTS OFSERVICE PROVISIONTOO
HIGH?
3.59
delivery mains, sewerage treatment and effluent disposal works and 10 per cent for urbanstormwater drainage. Subsidies are not provided on components of the works funded from othergrants or developer contributions. There is also provision for assistance through mechanisms suchas interest holiday loans. In Tasmania, subsidies are provided on municipal borrowings for waterand sewerage infrastructure. Operating costs of smaller authorities are also subsidised.
As discussed in Appendix B, through the Country Towns Water Supply Improvement Program(COWSIP), the Commonwealth provides financial assistance to State and Local Governments toimprove the quality and quantity of water supplies for communities of fewer than 5000 people.Some $5 million was expended under the program in 1990-91.
Some COWSIP funds are spent on developing and improving Aboriginal water supplies underpriorities determined by State and Territory Governments. Additional Commonwealth funds forthis purpose are available under the Aboriginal and Torres Strait Islander Commission’s (ATSIC)community infrastructure programs. Since 1988-89, more than 30 water supply systems and 23sewerage systems have been funded.
While many participants acknowledged that capital subsidies had been important in promotingregional, social and public health objectives, there was disagreement as to whether these subsidieshad encouraged efficient investments in water infrastructure.
The PWD argued that, in New South Wales, close scrutiny of proposed capital works incombination with limited government funds has ensured that capital subsidies have not led towasteful investment in infrastructure.
In contrast, the Victorian Government argued that the availability of subsidies had encouragedinvestment in non-economic facilities and over-engineering of systems. It said that:
There has been little incentive to search for lowest cost solutions since the subsidy and grants schemes haveguaranteed that a large proportion of initial and ongoing costs would be picked up by government. As a resultmany schemes were overdesigned or oversized since water authorities knew that their consumers would bebuffered from meeting the full cost of service provision (p 26).
The Victorian Government observed that capital subsidies have also contributed to thefragmentation of the industry in Victoria:
The widespread availability of subsidies to the non-metropolitan sector was one the main reasons for theproliferation of often tiny water and sewerage utilities across the State. Cheap money in the past meant thatthere was little incentive for small towns to seek service provision from larger authorities in the area in order toachieve economies of scale in operations and thereby reduce total costs.
The Tasmanian Government said that capital subsidies tend to encourage complacency in themanagement of schemes. It argued that because consumers do not have to meet the full cost ofsubsidised schemes, the discipline on management to improve efficiency is diminished.

WATER RESOURCES& WASTE WATERDISPOSAL
3.60
3.4 The gains from more cost-effective service provision
As input to this inquiry, the Commission sought updated information from the AWRC on potentialcost savings in the WSD industry.3 In contrast to the earlier work which estimated savings forurban water only, the information supplied by the AWRC to this inquiry separately identifiespotential cost savings for five sub-groups within Australia’s WSD industry -- metropolitan water,metropolitan sewerage, non-metropolitan water, non-metropolitan sewerage and irrigation.
The information focuses on the savings from reducing asset replacement costs and from loweringoperations, maintenance and administration costs.
Given that capital represents around two-thirds of the cost of providing WSD services, assetreplacement costs have a major bearing on the overall cost of service provision. The potentialreductions in asset replacement costs identified by the AWRC are:
• 30 per cent for most medium and small size water and sewerage mains;
• 15 per cent for service reservoirs and water and sewerage pumping stations in metropolitanareas;
• 10 per cent for large water and sewerage mains, treatment plants and dams; and
• 5 per cent for irrigation channels (see Appendix D).
The differences in the estimated cost savings reflect: the varying extent to which projectmanagement and control is already applied in the different types of construction work; the extent towhich competitive tendering for asset replacement is used; and whether emerging technologiessuch as trenchless main laying and replacement are applicable.
The greatest scope for savings lies in reducing the replacement costs of medium and small sizemains. These are still frequently installed by agencies themselves. While such mains areindividually small capital items compared to say a dam, collectively they account for around half oftotal water and sewerage assets.
Overall, these individual cost reductions translate to an average 18 per cent decline in thereplacement cost of water and sewerage assets. Based on 1989-90 asset values, this equates to anannual saving of close to $390 million (see Appendix D).
Of course these savings can only be realised at the time of asset replacement. As discussed below,it will therefore be many years before the full savings can be realised.
3 Earlier work is reported in IC 1990 (Chapter 5) and Manoel and Reynolds 1989.
ARE COSTS OFSERVICE PROVISIONTOO
HIGH?
3.61
The AWRC information also identifies possible cost savings of around 10 per cent from improvedstaffing practices in the administrative and maintenance areas. This equates to an annual saving ofaround $180 million. These savings would be available immediately the reforms are introduced.The SWB commented that, in its view, the AWRC had underestimated the potential for costsavings in this area. The Board said that if awards and agreements continue to give increasedflexibility at the current rate, savings of up to 15 per cent in some urban authorities could berealised in the next few years.
When the flow-on effects to the wider economy are accounted for, the benefits of more cost-effective WSD service provision are even more significant. Using its ORANI model of theAustralian economy, the Commission estimates that reducing costs in the water sector by $570million -- the total saving identified by the AWRC -- would permanently increase Gross DomesticProduct (GDP) by 0.21 per cent, worth around $800 million (in 1990-91 dollars). Around two-thirds of this gain comes from reducing the cost of metropolitan WSD services (see Appendix D).
However, as discussed in Appendix D, the majority of current assets will not be replaced for 25 to45 years. Indeed, some recently installed storage dams may continue in operation for more than acentury. Accordingly, the economy-wide gains associated with reduced asset replacement costs,worth around $530 million, will not be fully realised until the end of the 21st century. Moreover,the AWRC indicated that the water sector is currently in a period of relatively low investment inasset replacement. Asset replacement in the sector is not expected to return to its long-run normuntil about 2010. This suggests that only a fraction of the gains from reduced asset replacementcosts are potentially realisable in the next 20 years.
Given the above, the principal source of savings over the next few years would come from theidentified reductions in operating costs. These savings are simulated to lead to an increase in GDPof around $270 million.

PRICING REFORM FORURBAN WATERSERVICES
4.61
4 PRICING REFORM FOR URBAN WATER
SERVICES
Despite the reform initiatives of recent years, pricing and charging arrangements for WSD servicescan be improved.
As discussed in Chapter 2, inefficient pricing has been associated with institutional arrangementswhich have not required, or even encouraged, WSD authorities to adopt a commercial approach tothe provision of services. Institutional reforms in the water sector will therefore provide a spur tomore efficient pricing (see Chapter 7).
However, pricing reform is important in its own right. There is much that can be done to improvepricing and charging practices in the WSD sector, as part of, or even before, institutional change.This chapter considers reforms to the pricing of urban WSD services.
4.1 Promoting better investment decisions
Like any good or service, the level of demand for water services will depend on the prices charged.At the same time, consumers’ responses to price signals convey important information on the valuethat they place on those services.
Appropriate pricing is therefore necessary to ensure that the best use is made of existing systemsand to guide the timing and nature of investments to augment system capacity. Given the very highcost of augmenting urban water systems, this latter function of pricing is crucial.
However, determining what constitutes efficient pricing of water services raises conceptual andimplementation issues. For the reasons set out below, in practice, ‘efficient’ pricing regimes mustinevitably depart from some aspects of text-book rules. A significant element of pragmatism iscalled for.
A starting point is to ask whether it is efficient to fully recover the costs of making WSD servicesavailable. Given the monopoly power of service providers (see Chapter 7), the long lives of waterassets, the large increases in capacity which typically accompany system augmentations, and publichealth benefits, this is a very complex issue.
Moreover, once water assets are in place they rarely have alternative uses. Thus, it can be efficientto use those assets provided that charges at least cover operating costs. If an additional charge torecoup the cost of capital meant that assets lie idle, this would be inefficient.

WATER RESOURCES& WASTE WATERDISPOSAL
4.62
Some would also argue that provided the expected benefits from an investment in waterinfrastructure exceed the expected costs, then it should go ahead irrespective of whethergovernments or users pay the capital costs.
But, as a general principle, this argument is deficient. It fails to account for the way governmentfunding of infrastructure affects demand for WSD services. If people in a particular region or cityknow that a significant part of the costs of their infrastructure will be borne by taxpayers as awhole, they will have an incentive to demand a level of service which exceeds their truewillingness to pay. Just as importantly, where governments pick up the bill, water authorities havefew incentives to resist unreasonable demands.
The general consensus amongst both water agencies and governments is that past governmentacceptance of cost under-recovery has been the main reason for the plethora of ill-judgedinvestments in infrastructure in the Australian water sector.
For this reason, the Commission considers that, as a general principle, WSD service provisionshould be underpinned by an objective of cost recovery.
As discussed in Chapter 5, some modification of this general principle is required in the irrigationsector given the substantial amount of irrigation works with little or no commercial value.
But non-commercial infrastructure is not a significant problem in the large majority of urbansystems. Most continue to be augmented both to serve more customers and to provide higherlevels of service. To promote better decision making on the level and timing of future investmentsin capacity and quality enhancement, pursuit of cost recovery (including a return on capital) isparamount.
4.2 New investments in urban infrastructure
One important step in achieving cost recovery is to place new investment decisions on acommercial footing. In its draft report, the Commission proposed that except where subsidisationof costs is an explicit government policy, new investment in urban WSD infrastructure should beundertaken only if the authority concerned can publicly demonstrate that there is a reasonableexpectation that customer charges will be sufficient to cover costs, including the designated rate ofreturn on capital.
While most urban authorities supported this proposal, two concerns were raised.
A number of participants argued that provision should be made for circumstances where aninvestment has significant environmental benefits or costs. For example, ABARE commented:

PRICING REFORM FORURBAN WATERSERVICES
4.63
The IC has specified that infrastructure investment should achieve a ... real rate of return. However, the ICshould also outline what criteria infrastructure investment proposals should satisfy to meet the dual objectives ofeconomic and ecological sustainability.
As discussed below, a policy of full cost recovery would, in principle, require that prices for urbanWSD services include a component for any environmental damage associated with the use of thoseservices.
Who should pay for investments to restore or promote the environment is a complex question. Aversion of the user pays principle -- the polluter pays -- suggests that those who have causedenvironmental damage should pay to remedy it. However, there are sometimes problems insheeting home responsibility for pollution. Moreover, in urban centres, the community at large isoften both the polluter and the beneficiary of environmental investments (eg enhanced sewagetreatment facilities). In these circumstances, environmental levies are an appropriate way ofensuring full cost recovery on the investment concerned (see Chapter 9).
The Townsville City Council argued that a requirement for full cost recovery on new investmentswould be detrimental to growth:
Infrastructure extensions at marginal cost in lieu of average costs has not been the financing logic upon which theexisting infrastructure has been developed. To introduce such a new investment policy excluding subsidisation ofcosts would suggest the cost of infrastructure extension will rise inordinately with subsequent adverse effects ongrowth ...
In the Commission’s view, a desire to encourage growth is no justification for subsidisinginfrastructure costs. As noted above, extensive subsidisation in the past has been a majorcontributor to investment in non-commercial water assets. There is also the question of whethergovernments should be encouraging new development at the fringes or looking to closer settlementof existing urban areas.
However, the comments made by the Townsville City Council raise the important issue of how toensure cost recovery on new investments to enhance or expand existing systems, when thosesystems are not fully covering costs (including a commercial rate of return on capital). Thisproblem arises because charges do not typically differentiate between customers in different partsof a city or town. Once an investment to extend services to a new area has occurred, for thepurposes of calculating customer charges, the assets concerned are amalgamated with the pre-existing asset base.
In the Commission’s view, this feature of current pricing systems does not remove the need toundertake a cost benefit analysis of proposed new investments. Such analysis should assesswhether the willingness to pay of those customers who will benefit would be sufficient to permitfull cost recovery, including the designated rate of return on capital, if differential charging werepossible. Beyond this, the Commission suggests that the need to ensure full cost recovery on newinvestments be explicitly accounted for during the transition to full cost recovery on existing assetsystems. As discussed later in the chapter, this would require adjustments to the caps placed on thepermissible increases in authorities’ charges or revenues to account for new investments.

WATER RESOURCES& WASTE WATERDISPOSAL
4.64
Except where subsidisation of costs is an explicit government policy, investment in new urbanWSD infrastructure should be premised on full cost recovery, including the designated rate ofreturn on capital. The authority concerned should consider whether the willingness to pay ofcustomers who will benefit would be sufficient to permit full cost recovery, if differentialcharges could be set for those customers.
4.3 Pricing structures
In pursuing cost recovery, prices must also have regard to the marginal costs of supplying services.As noted earlier in the report, marginal (usage) charges are the key determinant of how much wateris demanded and therefore how intensively existing water infrastructure is used. Responses tochanges in usage charges are crucial in signalling consumer valuations of additional services andthus in guiding the timing of new investment.
Accordingly, efficient pricing of urban WSD services is about finding a system of charges whichgives a reasonable prospect of cost recovery on sound investments, while at the same timesignalling to users the ‘opportunity cost’ of additional water services.
A number of alternatives can be considered including marginal cost pricing and two part tariffs.
Marginal cost pricing
Under a marginal cost pricing regime, a single price would be charged for services equal to the costof supplying an additional unit of water or removing and treating extra sewage etc. Immediatelyafter investments in new system capacity had been made, marginal charges would only coverongoing operating costs and therefore make no contribution towards capital costs. But as demandincreased over time, capacity constraints would signal an increase in the opportunity cost ofsupplying services using existing infrastructure and therefore the need to increase charges. That is,scarce capacity would be rationed through higher prices. This is in contrast to currentarrangements where non-price rationing methods, such as restrictions on garden watering, aretypically used.
In principle, marginal cost pricing has the advantage of ensuring that prices reflect the trueopportunity cost of services and therefore that consumers’ use of services is optimal. For soundinvestments it would also mean that, by the time the expected benefits of the next augmentation incapacity exceed the expected costs, an initial period of losses would have been followed by aperiod of surpluses associated with the price rationing of scarce capacity. Full cost recovery overthe investment cycle would be possible.

PRICING REFORM FORURBAN WATERSERVICES
4.65
However, while marginal cost pricing has theoretical appeal, it has drawbacks. Determining themarginal cost of supplying individual water services is complicated because many costs incurredby WSD authorities are ‘common’ -- that is, they cannot readily be split between, say, water andsewerage or between customers in different locations. Further, as Paterson has argued:
Unfortunately, reality always complicates the application of the marginal rules and we are then transported fromthe world of science to the world of art. This is because any real world system of production and distribution hasliterally scores of variables in its production function and hundreds of marginals. ... We must choose, at most, ahandful of these to price on. In that choice we express a quite subjective vision of what is to be considered bothimportant and suitable for the exercise of consumer choice. (Paterson 1991, p. 1)
Further, unacceptably high costs of metering in small municipalities may preclude any form ofmarginal charging.
Also, marginal cost pricing would involve significant price fluctuations. This is because systemsare generally expanded through the addition of large blocks of capacity -- for example theconstruction of a new dam -- while demand grows more evenly over time. This means that aftereach new augmentation there is surplus capacity and hence under marginal cost pricing, priceswould fall sharply. Thus consumers who did not accurately foresee future price increases, wouldbe encouraged by low prices to develop and maintain gardens, only to have water rationed throughprice increases when the next capacity constraint was approached. Following new investment incapacity, water would again return to a low price. ACTEW said that such fluctuations would leadto customer confusion:
For all members of the community, it means adjusting their lifestyle which takes years of reinforcement. ... Mostmembers of our community are not economists and do not understand why water prices should vary so greatly.They will resent being forced to change their lifestyle to conserve water only to discover later that water is nolonger scarce.
The problems created by periodic price rationing of sewerage services would be even morepronounced.
Experience suggests that, for these sorts of reasons, governments will not allow WSD agencies toration services solely by means of price even though this may be desirable on efficiency grounds.Typically, as capacity constraints emerge the response has been to augment systems. If thishappens, marginal cost pricing abandoned at full capacity would not avoid the problem ofpremature system augmentation and would be an ineffective tool for pursuing cost recovery. AsMelbourne Water Corporation commented:

WATER RESOURCES& WASTE WATERDISPOSAL
4.66
... at best we can approach marginal cost pricing in a muted sense because if you look at it in a purely theoreticalsense, you’re looking at pricing spikes that can’t be achieved in reality ... marginal cost pricing ... as it’s set out intheory [is] unworkable.
Two part tariffs
In view of the problems with pure marginal cost pricing of water, authorities have looked to pricingsystems which retain a central role for marginal or usage charges but which avoid undue pricefluctuations. In particular, a number of agencies have introduced two part tariff arrangementscomprising a consumption charge and an access charge. The Victorian Government summarisedthe rationale for, and the basis of, one version of this charging system:
The consumption charge covers the short run marginal costs (ie the day to day running expenses) of the authorityas well as the marginal capacity costs of the authority’s next investment.
As the authority moves closer to the need for augmentation works, the marginal capacity cost component of thetariff increases as a proportion of the total price faced by consumers. This effectively signals to consumers thecost of the authority’s next investment. They in turn, through their consumption responses, allow the supplier todetermine the timing and scale of the supply augmentation.
The service charge component of the tariff is aimed at addressing the deficit problem associated with decreasingaverage costs and natural monopolies. The charge is calculated as a residual to achieve an independentlydetermined revenue yield. Because it does not depend on consumption, it is a non-distortionary method of raisingthe required revenue to meet the remainder of short run average costs not covered by the consumption component(eg capital servicing costs).
Under a two part tariff arrangement, the usage charge increases over time in much the same way asunder a pure marginal cost pricing system.
However, while the usage charge increases, the access charge will remain stable or perhaps evendecline1. Thus total water bills will show less volatility over time than under the pure marginalcost pricing approach. In fact, for those with below average consumption, water bills may decline(in real terms) over time -- rewarding them for their frugality as capacity constraints areapproached or realised. On the other hand, those with above average consumption may see theirbills rise, encouraging them to economise.
Greater stability in total water bills in turn eases political pressure to build new capacity as soon asmarginal costs begin to rise in response to capacity constraints. Thus premature augmentation ofsystems is likely to be less of a problem than under the pure marginal cost pricing approach.
1 If an authority seeks to maintain a roughly constant revenue yield over the life of a system, then increasedusage charges over time must necessarily be offset by reduced access charges. This effect is reinforced bythe addition of new customers to the network. If, however, charges are structured to provide increasing totalrevenues over the life of the system as utilisation increases, it may be that access charges are simply heldconstant.

PRICING REFORM FORURBAN WATERSERVICES
4.67
On balance, the Commission believes that for urban water, two part tariffs represent the mostpractical way of marrying the need for cost recovery on infrastructure and the requirement thatusage charges are related to the opportunity costs of making water available.
A desirable characteristic of any two part tariff arrangement is the requirement for consumers topay for every unit of water used. That is, there should be no water allowance provided in return forthe payment of an access charge.
It is true that demand for ‘inside’ water for drinking and washing is less price responsive thandemand for ‘outside’ water for gardens etc. However, there is scope for households to economiseon their use of inside water, given the availability of water saving devices such as shower roses anddual flush toilets. Decisions to install such devices should have regard to the value/cost of thewater saved.
Reductions in the use of inside water stemming from pay-for-use pricing will in turn reduce thecosts of sewage treatment. This effect has been observed in a number of jurisdictions including theHunter and Toowoomba.
Urban authorities should pursue full cost recovery on the provision of water through a twopart tariff, comprising an access charge plus a usage charge for each KL of water supplied.The usage charge should be set to cover the costs of making additional water available plus aloading to ration supply when capacity in the system is scarce. The access charge should beset so that, in total, the desired revenue yield is achieved over the life of an asset system.
Variations to the usage charge are possible. As noted in Chapter 2, a number of authorities alreadyhave in place increasing block tariffs for water.
The usage charge can be linked to other initiatives such as seasonal or time of day pricing of water.In its draft report, the Commission proposed that WSD authorities introduce a seasonal differentialin per KL water charges. The rationale was that increased water demand during drier monthscontributes to the need for expensive system augmentations and entails costly excess capacity inwetter months and wet years. The Commission argued therefore that prices charged for waterduring drier months should reflect the additional demand placed on systems, particularly as there issome discretionary element involved in the use of water on gardens etc.
At the draft report hearings some participants supported the concept, but said that the same effectcould be achieved through tiered usage charges in combination with seasonal billing, as opposed todifferent charges at different times of the year. Melbourne Water Corporation said that it:

WATER RESOURCES& WASTE WATERDISPOSAL
4.68
... supports the principle of higher charges in summer to reflect the higher cost of supply. However, differenttariffs for different seasons are not necessary if the tariff structure includes an increasing price step and readingand billing are conducted at least twice a year to coincide with the high and low demand periods.
Other participants were more cautious about the benefits of seasonal pricing. The Geelong andDistrict Water Board pointed out that while residential consumption may vary in response toseasonal factors, commerce and industry have much more stable demand. The Western AustralianWater Authority (WAWA) referred to a study suggesting that the cost differential of providingwinter and summer water for Melbourne is only 5 cents per KL (Dixon and Baker 1992), and to theadministrative costs of implementing seasonal pricing:
Changing to seasonal pricing would require all meters to be read in a relatively short time period, so as tocorrectly capture summer and winter consumption. This would involve either a completely different meterreading procedure or alternatively installation of meters that could record time of year consumptions. Bothoptions, at the current stage of labour practices and technology would involve an increase in costs.
ACTEW, amongst others, argued that seasonal tariffs may be ineffective because there is a lagbetween consumption, meter reading and billing.
However, implementation costs and difficulties notwithstanding, there was widespread agreementthat seasonal pricing could be valuable in some circumstances. WAWA said that seasonal pricingcould be desirable ‘in some country schemes which confront real supply scarcity and high potentialaugmentation costs’, and the Townsville City Council stated:
We would see some advantage in putting a seasonal differential in ... October, November, December, where ourpeak daily consumptions occur ... and show up all of the inadequacies of our distribution system.
Given the different circumstances applying in various parts of Australia, the Commission considersthat individual authorities should investigate the benefits and costs of seasonal water pricingimplemented either through seasonal charges or through tiered usage charges. Both approacheswould require seasonal billing. The investigation could usefully extend in larger centres to time ofday pricing. This already applies to services such as electricity. Melbourne Water Corporation isinvestigating time of day pricing in relation to the significant impact on system capacity ofconsumption between 5pm and 9pm. More even consumption throughout the day would thereforereduce the pressures for system augmentation. The Corporation is currently trialling the automaticmeter reading technology which would be required to implement time of day pricing.

PRICING REFORM FORURBAN WATERSERVICES
4.69
WSD authorities should investigate the benefits and costs of seasonal water pricingarrangements and time of day pricing. The effects of seasonal pricing could be capturedeither through charges which vary over the year or through tiered usage charges.
The preceding discussion presumes that customers are metered. However, the costs of meteringsome communities may be high relative to the efficiency gains available from the implementationof pay for use pricing. This could be the case in those areas where available water supplies aremore than adequate to meet demand in the foreseeable future. In such cases, access charges set tofully cover an authority’s costs over the life of a system would be appropriate.
Pricing arrangements for other urban services
Sewage disposal
Demand for domestic sewerage services is unlikely to be influenced by price to the same degree asdemand for water. This is because, as noted above, households have less scope to adjust their useof ‘inside’ water for cleaning and toilet flushing etc in response to price changes, than to adjust‘discretionary’ use of water for gardens etc. This observation led the Commission to conclude in itsdraft report that fixed charges for sewerage services are compatible with the efficient pursuit ofcost recovery.
This conclusion was challenged by a number of participants at the draft report hearings. TheGeelong and District Water Board, for example, argued that volumetric charges for sewagedisposal will enhance the efficiency gains available from pay-for-use water pricing. It stated that avolumetric system:
... brings home to the customer the consequences of excessive usage and the needs and costs for properenvironmental disposal.
The Board is soon to introduce the type of pay-for-use sewerage charge applying in the Hunter.There, a usage charge is imputed based on a percentage of water inflow presumed to be returned tothe sewerage system. The Board rejected the concept of a usage charge related to the number ofpedestals claiming that the link between the number of plumbing fixtures and usage is weak,particularly in the domestic sector.
There is some scope to influence the level of waste water disposal through the sort of imputedusage charge levied in the Hunter, and thereby to enhance the efficiency gains available from pay-for-use water pricing. However, calculation of the fraction of water supplied presumed to bereturned to the sewerage system could prove contentious, given differences in patterns of water usebetween households.
WATER RESOURCES& WASTE WATERDISPOSAL
4.70
WSD authorities should consider charging for sewerage services according to the percentageof water returned to the sewerage system.
Drainage
As discussed in Chapter 2, in most parts of Australia, there are no specific charges for urbandrainage. Rather, drainage works are funded from local government rate collections.
The interconnection between specific drainage works and drainage provided as part of the roadnetwork, is a significant constraint on the scope to levy stand alone drainage charges. Even wherespecific charges can be levied to cover the cost of separately identifiable drainage works, it isdebatable whether a workable pay-for-use charging system could be devised. Relating charges tothe size of the property drained would be one possibility. However, as pointed out by the LocalGovernment Engineers Association of Queensland, the benefits of drainage are more closelyrelated to a property’s location -- high or low lying etc -- than to its size. Institutional change ratherthan pricing reform is the key to dealing with urban drainage problems (see Chapter 7).
Trade waste
As set out in Chapter 2, many WSD authorities impose specific trade waste charges linked to thequantity and the strength of wastes discharged. This is an appropriate response to the additionaldemands placed on sewerage systems by trade wastes.
However, many authorities faced with major trade waste discharges have yet to implement pricingsystems which recognise the differential impacts of trade wastes and standard sewage discharges.Without such differentiation, an unfair cost burden is placed on other users of the sewerage system.
WSD authorities which are faced with significant trade waste discharges should have in placecharges based on the quantity and strength of the waste discharged.
4.4 What costs should be covered by prices?
This issue is best approached by asking what is the cost to a water authority of doing business. Ifthese services were to be provided on a continuing basis by a private operator, that operator wouldneed to generate sufficient revenue to cover operating, maintenance and administration costs,

PRICING REFORM FORURBAN WATERSERVICES
4.71
depreciation of infrastructure and debt servicing requirements and to pay a satisfactory return onequity funds. A private operator might, of course, incur losses when utilisation of new waterinfrastructure is relatively low. However, over the life of that infrastructure, the private operator’sobjective would be to earn a commercial rate of return.
The need to recoup operations, maintenance and administration expenses, depreciation and acomponent to meet interest charges is widely accepted by WSD agencies.
However, the need to earn a return on government or community equity in infrastructure is morecontentious. Much of this contention concerns who should receive the return on equity rather thanwhether such a return should be sought. This issue is canvassed in Chapter 6. At least among themajor authorities, there is general recognition that a return on equity is a cost of making waterservices available.
How should capital costs be calculated?
One issue is whether interest and equity costs should be directly calculated or whether they shouldbe implicitly covered by setting charges which will provide a prescribed rate of return on anauthority’s asset base after operating expenses and depreciation have been accounted for.
In principle, direct calculation of debt and equity costs would be preferable. It would make iteasier, for example, to adjust charges to reflect short term fluctuations in the costs of capital, and toreflect the impact of differing debt equity ratios on the ‘average’ cost of capital to individualauthorities.
However, in practice, direct calculation of capital costs is not possible, because with governmentownership, there is no direct market assessment of the cost to an authority of equity funds.Accordingly, the Commission sees little alternative to authorities setting prices to achieve anoverall rate of return on their assets.
But there are significant drawbacks with this approach.
As discussed below, a number of adjustments must be made to authorities’ asset bases to ensurethat owner governments rather than customers bear the consequences of bad investment decisionsand that customers are not charged twice for assets provided by developers or funded by developercharges. These adjustments are not without their problems.
Further, given the long-lived nature of water assets, asset valuation in general is a contentious issue(see Chapter 6). Yet asset valuations are central to the rate of return approach.
Also, under a rate of return approach, it may be difficult to provide flexibility in levels of costrecovery over the life of systems. As noted above, in a commercial environment, it is conceivablethat losses would be incurred in the years immediately following the installation of major new

WATER RESOURCES& WASTE WATERDISPOSAL
4.72
capital equipment. What is important is not whether the required rate of return is achieved in anyparticular year, but rather that (for sound investments) it is achieved over the full life of the assetsystems in question. Of course, the addition of new customers to the network will naturally operateto increase an authority’s rate of return over time. Increases in usage charges when capacityconstraints are approached will have the same effect.
What adjustments to authorities’ asset bases are required?
As noted above, a number of adjustments to authorities’ asset bases must be made to ensure thatcustomers do not pay unwarranted capital charges.
In its draft report, the Commission proposed that asset bases be adjusted to exclude assets with nocommercial value and assets provided by developers or funded through developer charges.
Assets with limited or no commercial value
Two groups of assets with limited or no commercial value can be identified.
First, there are assets used to provide community service obligations for which no governmentfunding is provided, or which are funded at a level insufficient to allow an authority to fully coverits costs, including the designated rate of return on capital. A requirement for an authority to earnthe designated rate of return on an asset base which included these assets, would implyovercharging on remaining assets.
Second, where poor investment decisions have been made, it may not be possible for an authorityto set charges to fully cover costs without unduly exploiting its monopoly power. Thus, forexample, where demand projections have proved overly optimistic, full cost recovery may requireexcessive access or usage charges.
A number of government agencies and major authorities supported the approach of adjusting assetbases to make provision for assets with limited or no commercial value when setting capitalcharges. Melbourne Water Corporation said that the exclusion of assets used to deliver CSOs is thecurrent practice.
WAWA, while supporting the thrust of the Commission’s approach, argued that adjustments fornon-commercial assets should be made on a consistent basis across authorities to facilitateperformance comparisons. It went on to suggest that:
... the AWRC may be the appropriate body to develop a definition as to what constitutes an ‘asset with nocommercial value’.
The New South Wales Treasury argued that a practice of netting out assets with no commercialvalue potentially conflicts with a related Commission proposal to value assets using the ModernEquivalent Asset methodology. As discussed in Chapter 6, this approach values an asset with

PRICING REFORM FORURBAN WATERSERVICES
4.73
reference to the lowest cost of replicating its service potential. However, the New South WalesTreasury supported the exclusion of assets necessary to meet community service obligations forwhich there is no expectation of a financial return.
The Commission sees no need to alter the broad thrust of its draft proposal for the treatment of non-commercial assets.
However, provisions for asset write down would give authorities wide scope to achieve therequired rate of return and it is therefore important to consider how these adjustments might bemade to minimise the potential for misuse.
For assets used to provide CSOs, a policy of government funding to make up the shortfall inrevenue, including the designated rate of return on capital, would obviate the need for anyadjustment to the authority’s asset base. In Chapter 6, the Commission has recommended thatCSOs be fully funded by the government concerned. And while it suggests that the methodologyused to estimate the cost of a CSO should be determined on a case by case basis, the basic thrust ofthe Commission’s approach is that the valuation should approximate long run avoidable cost. Thiswould generally include a capital component.
If, however, funding for a CSO is not provided, or is insufficient to cover capital costs, the assetsrequired to meet the obligation could be written down to a level which reflects their actual earningcapacity. In essence, these assets would be revalued by capitalising the resulting on-going losses tothe authority and deducting them from existing asset values.
The same sort of adjustment could be made to the value of asset systems installed as a result ofpoor investment decisions. However, the need for such adjustments in urban systems will be rare.
Of course the danger with this approach is that authorities could conceal poor performance bysimply making adjustments to their asset bases, or write down asset values to reflect governmentprice caps. In one sense, any asset system which is not earning a satisfactory rate of return forwhatever reason, could be regarded as non-commercial. Clearly, adjustments of this sort woulddefeat the objectives underlying a requirement for authorities to earn the designated rate of returnon assets under their control.
There is no easy solution.
A requirement for authorities to publicly document and explain adjustments to asset bases, will gosome way to preventing misuse of such provisions. There might also be a role for a body such asthe AWRC to develop industry guidelines on what constitutes an asset with limited or nocommercial value.
WATER RESOURCES& WASTE WATERDISPOSAL
4.74
Owner governments would also have strong financial incentives to ensure that unwarranted assetwrite downs do not occur. A write down in asset values would automatically reduce an ownergovernment’s entitlement to dividends. Indeed, given that interest costs on assets funded by debtmust be met even if the value of the assets is subsequently written down, all of the costs of thewrite down would reside with the equity holder.
Developer provided and funded assets
The Commission’s proposal to exclude assets provided by developers or funded from developercharges from authorities’ asset bases was the subject of much debate at the draft report hearings.The proposal was based on the argument that consumers pay for these assets when they buy land,and accordingly a WSD authority incurs no liability to service a debt on these assets or pay a returnon equity. Thus their inclusion in the asset base used to determine capital charges would representdouble charging.
The South Australian and Victorian Governments and Melbourne Water Corporation argued thatall commercially viable assets under the control of an authority should earn a rate of return,irrespective of how their purchase was funded. The Victorian Government, for example, stated:
The only difference between developer-funded assets and those funded through rates and charges are that theformer are paid for up-front rather than over time. Consequently, it is no more double charging to earn a rate ofreturn on developer funded assets than it is on assets funded through rates and charges.
The South Australian Government concluded that:
... it is difficult to sustain the view that double charging is implicit in a combination of developer fundedinfrastructure provision with economically efficient service pricing practices. It would also follow that there maybe no justification for reducing the asset base by the amount of developer provided or funded assets in order tomeasure rates of return. [s7.14]
WAWA drew a distinction between those assets provided by developers or funded by developercharges which an authority has an obligation to maintain and replace, and those for which no suchobligation exists. It argued that in the former case, efficient pricing would require that bothdepreciation and a rate of return be charged on the assets concerned, but that in the latter case,netting out from the authority’s asset base would be efficient. In support WAWA contended that:
This difference of obligations, must be reflected in differences in the required treatment of capital contributionswhich directly relate to increases in service obligations. Where a developer contributes assets or funds assets byway of headworks contributions, then the developer is obtaining a right to an ongoing level of service, for theproperties involved. The right obtained, it is the authority’s continuing obligation to provide the standard level ofservice, in respect to the properties concerned, into perpetuity.

PRICING REFORM FORURBAN WATERSERVICES
4.75
As such, the capital contributed adds to the authority’s underlying stock of physical assets available to maintainthese services. As the value of the assets diminish over time through depreciation, this additional capacity shouldbe retained within an authority by way of an Asset Replacement Provision or Reserve...
This is the accounting rationale for charging depreciation on assets contributed by developers and for these assetsto form part of the capital base of an authority when assessing ROI.
The NSW Treasury claimed that the Commission’s draft recommendation was inconsistent withaccounting standards which require that all assets controlled by an organisation be treated equally.Other participants expressed strong support for the position taken by the Commission in the draftreport. The Geelong and District Water Board argued that:
Clearly, developer provided assets have been handed over "free of charge" and apart from replacement (viadepreciation) should not be expected to provide further return.
The Board went on to say that if depreciation is not charged on developer provided assets,fluctuations in prices would increase when asset renewals are required. The SWB acknowledged apotential problem of double dipping, although it argued that this is not a problem in practice,because developer charges do not meet the full costs of extending systems to new areas.
In assessing the merits of the competing arguments, it is important to separate the question ofwhether depreciation should be charged on assets provided or funded by developers from thequestion of whether authorities should seek a return on the capital costs of those assets.
The Commission considers that depreciation charges should apply to developer provided or fundedassets. The primary reason for this is to allow authorities to make gradual provision for thereplacement of these assets in the future. If depreciation is not provided for, replacement would befunded by up-front capital charges or through borrowings. In the former case, the volatility ofWSD charges would increase. In the latter case, customers would finance depreciation as the loanis paid off.
Despite contrary arguments, the Commission remains of the view that, in principle, it isunnecessary for authorities to seek a rate of return on developer provided or funded assets.
A rate of return is designed to provide an authority with sufficient revenue to service its debt and topay the community a return on equity in a WSD authority. In this sense, equity holders are onlyentitled to a return on the capital they have contributed (directly or through retained earnings) to theauthority. In the Commission’s view, capital provided to authorities free of charge by developersor through developer charges does not change the wider community’s equity in that authority.

WATER RESOURCES& WASTE WATERDISPOSAL
4.76
Accordingly, the addition to an authority’s asset base of this capital -- which has been fully paid forby customers purchasing serviced land -- does not necessitate an increase in capital charges.
However, the Commission accepts that this approach would see similar assets treated differentlydepending on the source of funding, and might thus contravene accepted accounting standards.Moreover, given the regionally aggregated billing arrangements that apply in the water sector,netting out assets provided by developers or funded by developer charges would see all customersbenefit from lower charges, rather than only those in new sub-divisions.
An alternative, and in the Commission’s view preferable, approach would require authorities toearn a return on assets provided by developers or funded by developer charges, but to refund thatreturn to the customers who have funded these assets through lower (access) charges. In effect,customers in new sub-divisions would become equity holders and receive their dividends throughreduced charges for water services. While involving possibly higher administrative costs, thissystem would ensure that only those customers who pay for their capital in the price of servicedland, benefit from lower charges.
Should prices include a component for environmental damage?
A policy of cost recovery requires that prices for urban WSD services include a component for anyenvironmental damage caused through water use or waste water disposal.
To some degree this already happens. For example, environmental levies to upgrade sewagetreatment works etc apply in a number of Australian cities. Where the community as a whole isboth the polluter and the beneficiary of such environmental works, the Commission supports theuse of environmental levies.
As discussed in Chapter 9, conceptual and methodological problems make it very difficult tocalculate a component for environmental damage which could be incorporated in the price chargedfor the provision of WSD services.
However, considerable research effort is being devoted to finding better ways of measuringenvironmental damage. As progress is made in the future in quantifying and attributingresponsibility for water-related environmental damage, water authorities should respond byincreasing their prices for services accordingly.

PRICING REFORM FORURBAN WATERSERVICES
4.77
Prices for urban WSD services should be sufficient to cover operating, maintenance,administration and depreciation costs and to provide the designated rate of return on theadjusted asset base. Where quantifiable and attributable, the costs of environmental damageassociated with the use of these services should be reflected in prices.
Some flexibility should be provided to authorities to increase their rates of return over timeas usage of systems increases, subject to the requirement that they earn the designated rateover the life of asset systems.
When calculating the rate of return component, the value of assets used to providecommunity service obligations which are not fully funded by government, should be writtendown by capitalising the resulting on-going losses to the authority and deducting them fromexisting asset values. Similar adjustments to asset values should be made to account for poorinvestment decisions. The basis for adjustments to authorities’ asset bases should bedocumented in their financial statements.
When calculating capital charges, authorities’ asset bases should include assets provided bydevelopers or funded through developer charges. However, the rate of return earned onthose assets should be refunded to customers in new sub-divisions in the form of lower accesscharges for water services.
What is an appropriate rate of return?
The appropriate target rate of return for WSD assets is another contentious issue.
In its draft report, the Commission argued that, unlike many other government business enterprises,water authorities currently face no competition from either other government enterprises or privatesector operators and that accordingly, the risk to investors is commensurately lower. TheCommission concluded that the target rate of return could be set equal to the long term bond rate --or around 5 per cent real -- with little risk of encouraging over-investment in WSD infrastructure.It also said that this target could be adjusted in the future if there are significant changes in thebond rate.
At the draft report hearings, participants variously argued that the proposed rate of 5 per cent wastoo high, too low or about right.
Those arguing that the rate was too high were concerned about the price increases for services itwould entail and about the difficulty of securing this level of return on investments directed atenvironmental enhancement. The South Australian Government said that:
Actions by government to either reduce pollution impacts of waste water treatment or to improve drinking waterquality in accordance with public health standards require large capital investment. It is not clear that it will beeasy to achieve improved rates of return on such investments given that the same basic general service is stillbeing provided.

WATER RESOURCES& WASTE WATERDISPOSAL
4.78
Those arguing that the rate was too low said that the Commission had underestimated the risksfaced by WSD operators. Some said that uncertainties about the imposition of more stringentenvironment controls increase the risks of doing business, given that regulations governing pricingmay not allow cost pass-through. Melbourne Water Corporation said that the risk faced by anauthority could not be assessed in isolation from the regulations governing increases in prices,revenues etc. It said that in the UK, the actions of the regulator constitute the greatest risk toinvestors in the privatised water authorities.
In the light of these sorts of risks, the SWB argued that the target rate of return should be 6 percent, while the Victorian Government argued that a rate of 8 per cent is appropriate. A rate of 8 percent is also specified in guidelines recently issued by the Commonwealth Department of Finance(1992) for cost-benefit analyses for Commonwealth Government projects. These guidelines do,however, make provision for a lower rate to be used in circumstances ‘when the intended actionhas a cash flow which is known with virtual or complete certainty and is not subject to anysignificant amount of risk ...’
Melbourne Water Corporation argued that while 5 per cent was too low, it is inappropriate to set auniform target across the water sector. It said that:
The target rate of return for any business should reflect that business’ cost of capital which is the opportunity costof funds employed in the business.
Each business has different risk, both financial and operational. To prescribe a universal rate of return is toignore the individual circumstances of a business. The application of a universal rate of return target in the waterindustry therefore depends on whether or not the component businesses have similar risk profiles.
The Commission rejects the argument that 5 per cent is too high. In approximating the real longterm bond rate, it represents the premium required on a riskless investment. From this perspective,5 per cent should generally be viewed as the baseline return for WSD services. Of course, someprojects which provide benefits extending beyond direct water users (for example, projects whichprovide significant environmental or public health benefits), may warrant some governmentsubsidy. In such cases, explicit government payments to an authority to cover the shortfall inrevenue should be made. That is, such projects should be treated in the same way as communityservice obligations.
As to the argument that a 5 per cent real rate of return is too low, the Commission accepts that theprovision of WSD services is not risk free. While suppliers do not face competition, governmentcontrols on prices and/or revenues have the potential to squeeze operators in the face of more

PRICING REFORM FORURBAN WATERSERVICES
4.79
stringent environmental requirements etc. And there is also some risk associated with populationmovement between cities and regions.
However, in the Commission’s view these risks are not large. The introduction of environmentallevies in a number of Australian cities demonstrates a willingness on the part of governments tointroduce specific charges to fund environmental enhancements. At least in major cities, the riskthat population outflow will lead to chronic excess system capacity is very small.
There is an argument for tailoring rates of return to the circumstances of individual authorities andof individual investments. For example, investments needed to supply a major industry are likelyto be more risky than those required to supply households. Thus it would be inappropriate topreclude the possibility of a rate of return above the general benchmark in some circumstances.
The Commission concludes that 5 per cent real should be regarded as the baseline rate of return forinvestments in urban WSD assets. Where an authority can demonstrate that an investment is risky,a higher rate of return could be appropriate. However, this is unlikely to be the case for mostinvestments in urban systems.
The target real rate of return for investments in urban WSD infrastructure should generallybe 5 per cent. This target should be adjusted in the future if there is a significant change inthe real long term bond rate. If an authority can publicly demonstrate that a particularinvestment entails a significant element of risk, a higher rate of return should be sought.
4.5 Phasing in cost recovery on existing assets
The preceding discussion abstracts from the rate at which cost recovery on existing assets shouldproceed. Also, the scope for improved cost-efficiency (of service provision) to contribute to higherrates of return has been put to one side.
Of the metropolitan authorities, Melbourne Water Corporation currently achieves a RRR of 5.8 percent, which suggests that Melbourne water consumers as a group may be overcharged. Realisationof the potential cost savings identified in Chapter 3 would allow some of the other metropolitanagencies to achieve a 5 per cent real rate of return without the need for price increases.
Of course, improving the cost-efficiency of service provision takes time. Indeed, the savingspotentially available from reduced asset replacement costs will take many years to fully materialise.Best practice is also a moving target -- new sources of savings continue to emerge. Thus in thoseareas where charges for water services are not sufficient to provide a 5 per cent real rate of return,price increases should not be delayed until all identified cost savings have been achieved. This is

WATER RESOURCES& WASTE WATERDISPOSAL
4.80
particularly important in many country urban systems, where charges will have to rise quitesignificantly to achieve a 5 per cent real rate of return, even after adjustments to asset bases havebeen made and cost savings realised.
The issue is therefore how best to marry necessary price increases with the need to encourageauthorities to look to cost savings to improve their commercial performance.
One approach is to set limits on the rate at which WSD authorities can increase prices. Most wateragencies in Australia already face explicit or implicit price caps. As discussed in Chapter 2, thecap is typically set equal to the rate of inflation.
As currently applied, these price caps relate to both prices as a whole and prices charged toindividual customers. That is, authorities are often not permitted to increase charges to anycustomer by more than the rate of inflation. This places significant constraints on their efforts torestructure patterns of charging -- for example, to reduce dependence on property based charges.
A slightly different approach is to impose a cap on the permissible increase in an authority’s totalrevenues. This is very similar to a price cap on the overall basket of services provided by anauthority. Indeed, in systems where there is no demand growth, or where the revenue capexplicitly accounts for the addition of new customers to the network, the two mechanisms may beidentical.
Like price caps applied at the individual customer level, revenue caps encourage authorities topursue the required rate of return by reducing costs as well as increasing prices. They also giveauthorities much greater flexibility to restructure charges and thereby improve the efficiency oftheir pricing regimes.
But revenue caps are not without problems. Like price caps, they make it more difficult to usehigher prices to ration scarce capacity as the next system augmentation is approached. And, as thepotential cost savings associated with asset replacement will not be realised for many years, there isthe danger that the imposition of stringent revenue caps will see the move to full cost recoveryproceed too slowly. Conversely, generous revenue caps will reduce the discipline on authorities toreduce costs.
In its draft report, the Commission argued that, despite these shortcomings, revenue caps would bean acceptable way of permitting necessary increases in prices, while at the same time putting adiscipline on WSD authorities to reduce their costs.
There was a mixed response to this proposal.
A number of participants, drew attention to implementation problems. For example, the Geelongand District Water Board argued that revenue caps should make explicit provision for a range ofcircumstances:
PRICING REFORM FORURBAN WATERSERVICES
4.81
... revenue caps should be established having regard to the need for systems improvements, levels of service andoperating conditions etc. and should be developed for each agency as appropriate. Such an approach would besimilar to that of the CPI plus k factor imposed upon British authorities.
A similar view was expressed by the Victorian Government which went on to argue that a businessplan approach is more appropriate.
In the opinion of the Victorian Government, a more effective tool to protect the ratepayers is the business plan.In Victoria, business plans for non-metropolitan urban water authorities separately identify revenue, prices, costsand rates of return each year...
The use of a revenue cap within a business plan was supported by the Colac District Water Board.The SWB argued that revenue caps cannot be set in isolation from a time frame for achieving thetarget rate of return. It went on to suggest that the Commission ‘should be more forthright insuggesting a suitable timeframe for attaining the target return’. The Board also drew attention tothe important issue of how new and existing investments should be treated within the revenue capgiven the Commission’s draft proposal that new investments only proceed if they can generate thetarget rate of return.
The arguments put by participants have convinced the Commission that a simple revenue cap is notappropriate.
While it is possible to build considerable flexibility into a revenue cap to make provision for annualchanges in the consumption of water, the need for environmental enhancements etc, a morefundamental problem is the relationship between a revenue cap and the time frame for achievingthe target rate of return. If a time frame is not specified, much of the discipline on an authority toreduce costs is lost. The outcome would be to simply increase the time taken to achieve the targetrate of return.
One approach would be to require all urban WSD service providers to achieve the 5 per cent targetrate of return within a specified period.
However, given the current spread of rates of return across authorities, this approach has majorshortcomings. A time frame based on some notion of the current position of the average WSDauthority, could put too much pressure on those authorities with very low rates of return and reducethe pressure on those authorities already achieving a rate of return close to the 5 per cent target.
An alternative, and in the Commission’s view preferable, approach is to require all authorities toincrease their rates of return by an agreed percentage each year, until the target rate is achieved.The combination of price increases and productivity improvements required to deliver theincreased rate of return each year, would be left to authorities and their owner governments (andany other price setting tribunals) to negotiate within the sort of business planning frameworkoperating in Victoria. Negotiations on productivity improvements could have regard to the

WATER RESOURCES& WASTE WATERDISPOSAL
4.82
achievements of other authorities in reducing costs. By introducing an element of ‘yardstick’competition, the pressure on authorities to improve productivity would be determined, in the firstinstance, by best practice in the sector.
The experience of two metropolitan authorities provides one indication of the magnitude of theannual increase in the rate of return which might be required under this sort of arrangement. In thelate 1980s, the then Hunter Water Board increased its RRR by around 0.8 per cent over two yearswhile holding the rate of increase in its charges below the CPI. Melbourne Water Corporation’sRRR has increased from around 4 per cent in 1988-89 to 5.8 per cent currently, again within theconstraints of a CPI-based price cap.
While other authorities may have less scope to improve their productivity, the possibility of realincreases in charges should be considered. Indeed, for authorities with very poor commercialperformance, price increases well above the increase in the CPI are almost certainly warranted.Information provided by the AWRC indicates that to increase average RRRs for urban services by0.5 per cent through price increases alone, would require real increases of 6 per cent formetropolitan water, 5 per cent for metropolitan sewerage, 9 per cent for country urban water and 6per cent for country urban sewerage.
Under an arrangement where the required annual increase in an authority’s rate of return isnegotiated with the owner government, it is important that explicit provision be made for newinvestments to extend or augment the network. As set out in Section 4.2, such investments shouldonly proceed if customers’ willingness to pay would be sufficient to provide a 5 per cent RRR, ifseparate charging were possible.
But under the regionally aggregated charging systems and uniform tariffs which apply across thewhole of cities such as Sydney, assets necessary to augment systems, once installed, are simplyadded to the asset base for pricing purposes. While some differentiation of charges between areasin cities such as Sydney would be feasible, separate charging for many new investments will not bepossible.
Accordingly, the Commission considers that, in setting annual limits on permissible increases in anauthority’s prices or revenues, the owner government should have regard to both the need forimproved cost recovery on existing assets and the need to ensure that, for new investments, there isfull cost recovery over the life of the asset systems in question.
Finally, there is the question of how to maintain a discipline on authorities to improve productivityonce the target rate of return of 5 per cent has been achieved. That is, a mechanism is required toensure that potential productivity improvements are realised and passed on to customers.
The Commission considers that a standard revenue cap is appropriate in these circumstances. Thecap would be negotiated between an individual authority and its owner government (or the relevant

PRICING REFORM FORURBAN WATERSERVICES
4.83
price setting authority) taking into account such things as levels of demand, increases in the priceof inputs, scope for productivity gains and the need for new investments. Again, such a cap couldbe determined within a business planning environment.
Urban WSD authorities earning less than 5 per cent real rate of return, should progressivelyincrease their rate of return, at a pace determined in negotiation with owner governments(and their regulatory authorities), until such time as the 5 per cent rate is achieved. The priceincreases necessary to achieve the agreed increase in the rate of return should be determinedtaking into account the scope for productivity improvements. An annual increase of 0.5 of apercentage point in an authority’s RRR would be a useful starting point for thesenegotiations.
The negotiated annual increase in an authority’s charges should have regard to the need forimproved cost recovery on existing assets and the need to ensure that, for new investments,there is full cost recovery over the life of the asset systems in question.
Once an authority has achieved 5 per cent real rate of return on its (adjusted) asset base,further price increases should be subject to a negotiated revenue cap.
PRICING OFIRRIGATION WATERAND
5.85
5 PRICING OF IRRIGATION WATER AND
DRAINAGE
5.1 General issues
The principles underlying the pricing of irrigation water and drainage are similar to those relevantto urban water. In particular, prices charged for commercially sound irrigation systems should besufficient to fully cover costs, including a return on the capital invested.
The Commission rejects the argument advanced by irrigators that the wider benefits provided byirrigation justify subsidisation of water costs. Typifying this argument were the views expressedby the National Farmers Federation:
Irrigators recommend that the Commission, in its report, make the widest possible assessment of the benefits ofirrigation to recognise the major and pervasive contribution irrigation makes to the economy generally, and inparticular to our export income, regional economies and property values; and the substantial benefits flowing tothe community by way of rates and taxes.
All activities have linkages with other parts of the economy and therefore generate flow-on benefitsor ‘multiplier’ effects. But these flow-on effects do not equate to increases in economic welfare.This is because multipliers do not address the question of whether the benefits of increased activityin one area outweigh the costs. Nor do they evaluate the economic merits of other investmentoptions. Reliance on multipliers to direct investments could see Australia’s pattern of economicactivity even more heavily focussed on activities at the end of the production chain, simply becausethey have more linkages or multiplier effects.
General acceptance of the ‘wider beneficiaries’ arguments advanced in this inquiry in respect ofirrigation would see all productive inputs in the economy subsidised. But most subsidies, like otherforms of industry assistance, divert resources from more productive uses and thereby reducecommunity well being. Thus just as the Commission has argued that high tariff assistance for someAustralian manufacturers is detrimental to Australia’s economic interests, so too will be a policy ofcontinuing subsidies for irrigated agriculture through artificially cheap water.
This is not to suggest that the multipliers associated with irrigated agriculture have no policyrelevance. They provide important information on the significance of irrigated agriculture tosurrounding regions and are therefore one indication of the likely adjustment costs from changes toarrangements governing the provision of irrigation water. Communities such as Leeton andGriffith are highly dependent on irrigated agriculture. But the benefits that these areas derive fromsubsidised water prices must be set against the costs of subsidies to the wider community. Thusmultipliers tell only part of the story.
WATER RESOURCES& WASTE WATERDISPOSAL
5.86
As in urban areas, it is therefore important that any future public investments in new irrigationschemes only proceed if the government authority concerned can demonstrate that demand for thewater will support prices sufficient to cover costs, including a return on capital. While investmentin irrigation systems is not risk free, the Commission considers that 5 per cent should be the basereal rate of return. As in urban systems, if the investment entails a significant element of risk, ahigher rate of return should be built into prices.
Public investment in new irrigation schemes should only proceed if the authority concernedcan publicly demonstrate that demand for water will support prices sufficient to fully covercosts, including a return on capital. The minimum real rate of return should be 5 per cent. Ahigher rate should apply if the project involves a significant degree of risk.
Setting efficient prices for existing irrigation assets is complicated by the fact that much of thepublic investment in the sector would not have proceeded had irrigators been required to meet thefull costs, including the costs of capital. Given that these past investments have been made -- theyqualify as what economists call ‘sunk costs’ -- it will be economically efficient to continue tosupply water provided that charges are at least sufficient to cover operating costs. Of course,irrigators would have to be able to pay higher prices to justify refurbishment of these assets.
The pricing of irrigation water is further complicated by the link between prices for water and thevalue of ‘water rights’. Trade in water rights is progressing in most States (see Chapter 8). Pricingpolicies for irrigation water are also bound up with questions of charging for asset refurbishmentand who should own irrigation systems.
Against this background, the question of appropriate future pricing arrangements for irrigationwater is best separated into the pricing of bulk water to irrigation systems and private diverters andthe pricing of water distribution. The former is concerned with prices to cover the costs ofoperating and maintaining storages, ‘running’ the rivers and metering water extraction from therivers. The latter is concerned with the costs of distributing water within irrigation systems whichdraw water from a river, the costs of providing drainage facilities for those systems and pricing tocover those costs. Of course, the distinction between bulk water supply and in-system distributionis not always clear cut.
PRICING OFIRRIGATION WATERAND
5.87
5.2 Bulk water
Prices for bulk irrigation water currently fall well short of fully covering costs. In most cases, thecapital costs of dams, weirs and other regulating structures are not included in prices. Someoperating and maintenance costs are typically borne by the taxpayer. For example, in New SouthWales, while irrigators are required to meet 70 per cent of the costs of ‘running’ rivers, they makeno contribution to the costs of operating dams and storages. Also, bulk water prices do not includea component for the costs of the environmental damage associated with irrigation.
In the Commission’s view, prices for bulk irrigation water should, at the very least, cover irrigators’share of the costs of operating and maintaining (including as appropriate refurbishment) all parts ofbulk water supply systems. It rejects the argument advanced by the NSW Irrigators’ Council andothers that the costs of operating and maintaining storages should be met by taxpayers because:
... the benefits of the headworks storages are spread widely and diffusely across the community generally andespecially throughout the regions concerned.
As the major user of water in these storages, there is no reason why irrigators should not pay theirshare of the costs of operating and maintaining these structures.
Implicit in the preceding discussion is the notion that irrigators should not have to pay for thebenefits provided by water sources to other users. Recognition of multiple beneficiaries underliesthe New South Wales policy of charging irrigators only 70 per cent of the cost of running regulatedrivers. The remaining 30 per cent is borne by taxpayers.
A number of participants criticised the approach taken in New South Wales to the ‘multiplebeneficiaries’ issue. The Victorian Government was critical of what it saw as the arbitraryallocation of benefits. Many irrigators argued that the 70 per cent share of benefits allocated tothem in New South Wales is too high. The Victorian Government contended that in a commercialenvironment, the New South Wales approach would require an on-going government subsidy to thebulk water supplier to cover the 30 per cent of costs not charged for directly. Its preferredapproach is to formally identify beneficiaries and charge accordingly.
There are arguments on both sides. The Victorian approach is more rigorous but considerableeffort would be required to identify all beneficiaries. The cost-effectiveness of charging somebeneficiaries -- for example, recreational water users -- is also open to question. Nevertheless, bothapproaches aim to ensure that irrigators are charged only in proportion to the benefits they receive.
In specifying that charges for bulk water should at least cover the costs of operating andmaintaining bulk supply systems, the Commission does not rule out the possibility of provision fora rate of return on the community’s investments. This may be feasible in some systems, dependingon the strength of demand for water.

WATER RESOURCES& WASTE WATERDISPOSAL
5.88
As noted above, investments in new bulk water supply systems should only proceed where waterdemand will support prices sufficient to provide at least a 5 per cent real rate of return on capital.Similarly, the full cost of refurbishments to existing bulk supply systems, including the designatedreturn on capital, should be factored into bulk water charges.
Again there is the issue of whether bulk water prices should include a component forenvironmental damage. As in urban systems, there are numerous difficulties in identifying andevaluating environmental damage caused by irrigation. However, as progress is made in the futurein quantifying and attributing responsibility for this damage, bulk water agencies should respond byincreasing their prices accordingly.
Prices for irrigation water supplied from existing bulk water systems should at least coverirrigators’ share of the costs of operating and maintaining those systems, including dams andstorages. For systems where demand for water is sufficiently strong, a return on capitalshould also be sought. Where quantifiable and attributable, the costs of environmentaldamage caused by irrigation should be reflected in prices.
Irrigators’ share of the full costs of refurbishments to existing bulk water supply systems,including a minimum 5 per cent real return on capital, should be factored into bulk watercharges.
Phasing in higher charges for bulk water
One approach for moving to an efficient level of cost recovery for existing bulk water supplysystems, would be to progressively increase prices subject to a price or revenue cap to ensure thatthere is discipline on suppliers to reduce costs. Price increases would continue until such time asrevenues were sufficient to cover irrigators’ share of the costs of operating and maintaining systemsand, where demand is sufficiently strong, to provide a return on capital. The Commission proposedthis approach in the draft report.
At the draft report hearings, participants raised concerns about the application of revenue caps inthe irrigation sector. The Rural Water Corporation in Victoria said that major fluctuations in waterdemand due, for example, to climatic factors, would make it extremely difficult to set a revenuecap prior to the commencement of an irrigation season. Many irrigators argued that prices shouldbe based on the cost levels that would prevail after water agencies have realised all potential costsavings.
In the Commission’s view, pricing reform cannot be left until such time as best practice is achieved.Indeed, as noted in the previous chapter, best practice is a moving target. To adopt such anapproach would run the risk of stalling necessary price reform indefinitely.

PRICING OFIRRIGATION WATERAND
5.89
However, a revenue cap approach would leave unspecified the finishing point of the phasingprocess. That is, the process could continue until individual systems were delivering real rates ofreturn anywhere between 0 and 5 per cent. Further, as discussed in the previous chapter, the use ofa revenue cap without a timeframe for achieving the target rate of return, would remove much ofthe discipline on suppliers to reduce their costs. That is, a revenue cap may simply increase theperiod that an authority takes to achieve the required rate of return, rather than making it workharder at reducing its costs.
An alternative is to immediately lift the bulk water price to a commercial level, but subsidiseirrigators in the short term by means of an explicit government payment to the bulk water supplier.This subsidy would be progressively withdrawn over time. To provide the supplier with anincentive to reduce costs, permissible charges to irrigators would increase over time by less thanthe reduction in the government subsidy. Thus to achieve the required rate of return, bulk watersuppliers would have to reduce their costs.
In the Commission’s view, this approach has a number of advantages.
It would impose a discipline on water agencies and owner governments to evaluate what rate ofreturn, if any, is feasible in a particular bulk water supply system. This is in contrast to the currentsystem where no end point for increased cost recovery is specified. Specification of a target rate ofreturn for each bulk water system would assist irrigators to make informed decisions on such thingsas the merits of greater use of on-farm storages, the benefits of a shift to dry land farming etc. Itwould also facilitate the more efficient operation of tradeable water entitlements (see Chapter 8).
There would also be much stronger incentives for governments to ensure that the move tocommercial pricing for bulk water is not unduly delayed by excessive caution regarding irrigators’capacity to pay. This is because the shortfalls in revenue necessary to bridge the gap between theagreed commercial rate of return for a bulk supply system and the return obtained from charges toirrigators’ would be treated as a community service obligation. Thus governments would berequired to explicitly fund their authorities to the extent of the revenue shortfall.
While it is often claimed that irrigators have little capacity to pay more for water, this sitsuncomfortably with the significant value that water entitlements have in many irrigation systems.As discussed in Section 8.2, there are a number of reasons why prices paid at auction for new waterentitlements or to transfer existing supplies will not reflect the additional value of water, over andabove prices charged, across the irrigation sector as a whole. Nonetheless, prices paid for waterentitlements indicate that, at least in some systems, there is capacity to increase prices without

WATER RESOURCES& WASTE WATERDISPOSAL
5.90
undermining the viability of the irrigated activity concerned. Moreover, freeing up the watertransfer system would allow water to move to higher value uses (see Chapter 8) and furtherincrease the scope to raise prices. Indeed, some of the perceptions about the inability of irrigatorsto pay more for water reflect the previous absence of transfer mechanisms and the consequentfailure to direct water to its most profitable use. Overall, there is a strong case for more significantincreases in prices than have occurred in the past.
As noted above, a requirement for governments to explicitly fund the revenue shortfalls of theirbulk water suppliers, should ensure that the move to commercial pricing occurs as quickly as isreasonably possible. The Australia-wide increase in revenue required to achieve a zero RRR onbulk water supplied to private diverters, would be around $40 million annually. To achieve 4 percent, the required revenue increase would be around $120 million. Revenue increases of the sameorder would be required for bulk water supplied to public irrigation schemes.1
Bulk water suppliers should immediately increase the price of water to a commercial level.Depending on the strength of demand, this would require them to earn a real rate of return ofbetween 0 and 5 per cent. For an interim period, prices charged to irrigators may need to besubsidised.
The rate of price increases faced by irrigators, and the combination of price increases andcost reductions required to provide a commercial rate of return, should be determined bynegotiations between governments and bulk water suppliers.
Until such time as charges to irrigators are sufficient to provide commercial rates of return,the shortfalls in revenues should be directly funded by the owner government.
5.3 Charges for in-system water distribution and drainage
It would be possible to develop a pricing policy to recover the costs of in-system water distributionand drainage in public irrigation schemes, along the lines of the scheme for bulk water proposed bythe Commission.
However, such a pricing system would be bedevilled by the longstanding problem of who shouldpay for the refurbishment of irrigation distribution systems which have been run-down as a resultof the failure of past governments to make proper provision for maintenance.
Not surprisingly, irrigators are of the view that they should not have to pay for the mistakes of thepast. Typifying this view was the NSW Irrigators’ Council:
1 Based on information supplied by the AWRC.

PRICING OFIRRIGATION WATERAND
5.91
... users in government constructed irrigation distribution systems should not be required to pay assetrefurbishment/replacement costs in respect of any part of the past life of those assets which governments made noprovision for depreciation funding...
From an efficiency perspective there is no basis to this argument. Investment to refurbish a systemis little different from investment to build a new system. Indeed, building a new system could beviewed as a substitute for refurbishing an existing system. In both cases, efficiency considerationswould demand that the investment only proceed if charges for water will be sufficient to cover allcosts, including a return on the capital investment.
Thus the debate on who should pay for refurbishment is mainly concerned with questions ofintergenerational equity and capacity of irrigators to pay. As discussed in Part II of the report,State and Commonwealth Governments have ostensibly accepted these arguments for assistance,and are heavily subsidising refurbishment costs.
In some instances, assistance to refurbish appears to have been provided without considering eitherthe viability of the system with commercial water prices and an expanded system of tradeablewater rights in place, or to the emerging environmental damage. There is thus the risk that thecurrent round of refurbishment expenditures will do little to address the problem of an on-goinggovernment commitment to non-commercial and/or unsustainable systems.
As discussed in Chapter 7, the Commission sees the privatisation of public irrigation distributionand drainage systems as the only sure way to disentangle governments from a commitment tomaintain non-commercial infrastructure.
Once irrigation distribution and drainage systems are privatised, charging arrangements would be amatter for the irrigators concerned to determine. The charges might well vary between usersaccording to the volume of water received and the frequency of service required.
However, it may be a long time before some systems are privatised and therefore continued pricingreform in the interim period is important.
The Commission considers that, pending privatisation of systems, the following broad principlesshould govern pricing policies for water distribution and drainage:
• the current rate of increase in cost recovery should be accelerated;
• irrigators should contribute to the cost of any asset rehabilitation undertaken prior toprivatisation; and
• tariff structures for in-system water distribution should be modified to better link charges tolevels of service received. This would mean, for example, an end to the practice of chargingirrigators for their full water allocations even if those allocations are only partly used.

WATER RESOURCES& WASTE WATERDISPOSAL
5.92
5.4 The Burdekin Irrigation Area
The Burdekin River Irrigation Area in Queensland is significant in that government development ofirrigated land is still occurring. In that scheme, cost recovery is being pursued through acombination of the sale of irrigated land and water charges which include a capital component.The Burdekin Scheme is discussed in Part II of the report. There, the Commission suggests thatfinancing of the purchase of properties in the Burdekin Scheme should be transferred to privatefinancial institutions.

OTHER PRICINGISSUES
6.93
6 OTHER PRICING ISSUES
6.1 Property based access charges
As discussed in Chapter 2, access charges based on property value apply in most parts of Australia.However, many authorities are now looking to reduce or eliminate their dependence on propertybased access charges on the grounds that they entail cross subsidies both within customer classes(eg residential) and between classes of customers (eg commercial and residential).
In its draft report, the Commission argued that if property valuations were only used to determineaccess charges for residential WSD services, the adverse efficiency implications would be small.This is because the level of the access charge (within the bounds implied by property basedcharging) is unlikely to affect consumers’ decisions on whether to connect to these services.1 Inthis area, property based charging is primarily a redistributive mechanism.
However, the Commission went on to argue that the cross subsidy from the business sector todomestic customers that is typically evident under property based access charges, in effectconstitutes a tax on production.2 Accordingly, the Commission proposed that WSD agenciesdispense with property based access charges as soon as practicable.
While many participants supported this proposal, the South Australian Government argued thatproperty based access charges constitute an efficient tax for funding the public health benefitsprovided by sewerage. It also contended that, for commercial properties, a property based fixedcharge for water is a good way of appropriating the value to business of insurance provided by thecapability to fight fires.
Clearly sewerage services have public health benefits which extend beyond individuals. A broadlybased property tax to subsidise access to these services may well be less distortionary than someother taxing instruments. However, government subsidies are only necessary if sole reliance ondirect funding from user charges would lead to under-provision. This is unlikely to be the caseoutside small rural communities.
The argument that property based access charges are an appropriate way of paying for theprovision of firefighting capacity also has merit. The need for very large water mains in business
1 In any event, building and health regulations may require connection to these services.2 Of course, commercial land prices would tend to rise if this tax on business users were eliminated.

WATER RESOURCES& WASTE WATERDISPOSAL
6.94
areas is in part a reflection of the water pressure required to fight fires in high rise establishments.Thus property based access charges for commercial properties may well bear some relationship tothe cost of providing a fire fighting capability and therefore to the value of the implicit insurancepremium.
However, the relationship between the actuarial value of firefighting insurance and the spread ofcharges under a property based charging system is unclear. It raises a number of questions aboutthe correlation between property values and the type of building. For example, there may be littledifference in the cost of providing a firefighting capability to a high rise building in the CBD and tothe same type of building located on cheaper land in the suburbs.
The key reform to pricing structures for urban WSD services is to install appropriate usage chargesfor water. Ending the provision of the often substantial ‘free’ water allowances which typicallyaccompany property based access charges is therefore crucial.
Nonetheless, as noted above, property based access charges for WSD services constitute a tax ofdubious merit on the business sector as a whole. The costs of providing firefighting capability tobusiness should be more directly targeted through access charges which are correlated to the size ofthe mains servicing commercial premises. In this way, discriminatory charges between similarbuildings in different locations can be avoided.
The income redistribution benefits associated with property based access charges come at the costof greater administrative expenses and therefore higher overall charges for customers. Apart fromthe additional costs for authorities of calculating and processing a different access charge for eachcustomer, periodic changes in property values make the process of setting access charges to deliverfull cost recovery over the life of an asset system more complex and uncertain. On these groundsalone, there is a case for WSD authorities to dispense with property based charges across the board.However, there is clearly widespread concern about the redistributive impacts of a move awayfrom property based access charges. The political sensitivity of the issue has meant that initiativesto reduce dependence on property based charges have proceeded very slowly in most jurisdictions.
To assess whether these concerns are valid, the Commission engaged a consultant to report on theeffects of dispensing with property based charging in Melbourne.
The consultant’s report, which has been separately published by the Commission (TasmanEconomic Research 1992), confirms that the distributional impacts would be significant for somegroups.
The report is based on a sample of 421 Melbourne households drawn from the ABS 1985-86Income Distribution Survey, supplemented with information on charges and water consumption forindustry and commerce drawn from Melbourne Water Corporation’s Annual Reports. Water use

OTHER PRICINGISSUES
6.95
for households in the sample was projected using a regression equation estimated for Melbourne(Aitken et at 1991) which relates water consumption to the number of household residents andproperty value.
The first scenario modelled assumed no change in usage charges. Rather a single uniform accesscharge was determined which would provide the same revenue for Melbourne Water Corporationas the present system of property based access charges. Separate distributional effects werecalculated with the uniform access charge applied only to households, and to both households andindustry and commerce.
A second scenario modelled a reduction in the access charge to the current minimum forMelbourne ($60) in combination with an increase in the usage charge to provide a revenue neutraloutcome for Melbourne Water Corporation assuming no change in water consumption. But, ofcourse, users would respond to a higher usage charge by reducing their consumption. This in turnwould deliver them a saving on their water bills. The consultant did not spell out the implicationsof this reduction in consumption for Melbourne Water Corporation’s revenue and hence its rate ofreturn performance. One effect would be to delay the timing of the next augmentation in capacity.Again separate results were reported with this scenario applied only to households and to bothhouseholds, and industry and commerce.3
The results of the two scenarios are set out in Table 6.1.
According to the data in Table 6.1, an across-the-board shift to uniform access charges would havemajor impacts on some groups. For home owners in the lowest income quintile, the averageincrease in the annual water bill would amount to $61, for low income renters $58, and for soleparents $72. Even larger projected increases for pensioners and other welfare beneficiaries couldbe cushioned to some degree by pensioner rebates. All but the wealthiest householders wouldfinish up paying more, with industry and commerce as a whole experiencing an offsetting reductionof 30 per cent in its total water bill.
The data in Table 6.1 suggest that the adverse effects on householders could be reduced if the moveto dispense with property based access charges was accompanied by greater reliance on usagecharges. But as noted above, the immediate effects of a decision to place greater reliance on usagecharges on Melbourne Water Corporation’s total revenue and hence commercial performance, isunclear.
3 A further scenario modelled the replacement of Melbourne Water Corporation’s two tier usage charge witha single usage charge designed to produce a revenue neutral outcome for the authority.

WATER RESOURCES& WASTE WATERDISPOSAL
6.96
Table 6.1 Distributional impacts of dispensing with property charging in Melbourne, by demographic group(per cent change in water bills)
Scenario 1 Scenario 2
Households only users Households only All users
Home owners and buyersby gross income quintiles
First 17 38 -4 2Second 8 26 6 0Third -3 12 -11 -5Fourth 2 18 -7 0Fifth -15 -4 -10 0All home owners -1 15 -10 -4
Renters by income classLow 14 34 -4 2High -4 10 -11 -5Total renters 4 21 -8 -2
Households bydemographic class
sole parent 23 43 7 14single person living alone -13 2 -24 -19childless couple -9 6 -18 -12one child family 2 18 -7 0two child family 14 32 5 12three child family -7 5 -2 10four child family -13 -4 -11 0single pensioner 63 97 20 26couple pensioner 21 43 2 8single beneficiary 46 75 12 19couple beneficiary 32 55 12 19household of single people 7 26 -7 -1All households 0 16 -10 -4
Industry and commerce(all properties) 0 -30 0 -27
Source: Tasman Economic Research 1992
In its response to the consultant’s report, Melbourne Water Corporation concluded that:
... the analysis is far too simplistic and, as a result, the impacts on various customer groups are significantlyunderstated.

OTHER PRICINGISSUES
6.97
It argued, amongst other things, that the household sample used in the study is too small; theregression equation used by the consultant to estimate water demand explains only 50 per cent ofthe observed variance in water consumption; the analysis fails to identify the diversity of effectswithin the industrial and commercial sector; and the analysis incorrectly assumes that those peoplerenting accommodation pay water rates.
Melbourne Water Corporation submitted alternative projections for the scenarios modelled by theconsultant. In those projections, households are classified on the basis of property value rather thanincome quintiles (see Table 6.2). A summary of the Corporation’s response is included with theseparately published consultant’s report.
Table 6.2 Distributional impacts of dispensing with property based charges in Melbourne, by value of property(per cent change in water bills)
Tasman Scenario 1(households only) consumption (KL)
100 200 270b
300 400 500 600
Net annual property valuea ($)
2000 91.4 64.0 52.9 49.2 36.6 27.2 21.73000 55.0 40.8 34.6 32.5 24.8 18.9 15.34000 19.7 15.5 13.5 12.8 10.2 8.0 6.54878b -0.3 -0.2 -0.2 -0.2 -0.1 -0.1 -0.15000 -2.5 -2.1 -1.8 -1.7 -1.4 -1.1 -1.06000 -17.8 -15.0 -13.5 -13.0 -10.8 -8.8 -7.57000 -28.9 -24.9 -22.7 -21.9 -18.5 -15.4 -13.28000 -37.4 -32.8 -30.2 -29.2 -25.1 -21.1 -18.29000 -44.0 -39.1 -36.3 -35.2 -30.6 -26.1 -22.710 000 -49.4 -44.4 -41.4 -40.3 -35.4 -30.4 -26.7
Tasman Scenario 2(households only) consumption (KL)
100 200 270b 300 400 500 600_________________________________________________________
Net annual property valuea ($)
2000 57.1 60.0 61.2 61.5 48.6 31.9 22.03000 27.2 37.4 41.8 43.4 35.8 23.3 15.64000 -1.8 12.7 19.7 22.1 19.8 11.9 6.8487
b-18.1 -2.6 5.2 8.1 8.6 3.6 0.2
5000 -20.0 -4.4 3.5 6.4 7.2 2.5 -0.76000 -32.5 -17.1 -8.9 -5.8 -3.0 -5.5 -7.27000 -41.6 -26.7 -18.6 -15.5 -11.4 -12.3 -12.98000 -48.6 -34.4 -26.4 -23.3 -18.5 -18.2 -18.09000 -54.1 -40.6 -32.9 -29.9 -24.5 -23.3 -22.510 000 -58.5 -45.7 -38.3 -35.4 -29.7 -27.9 -26.5
a This is the assessed unimproved value of land.b Average for MelbourneSource: Melbourne Water Corporation

WATER RESOURCES& WASTE WATERDISPOSAL
6.98
The bigger percentage changes reported in Table 6.2 are partly a function of the larger number ofhousehold groupings used by Melbourne Water Corporation. Thus, for example, under Scenario 1where total access charges collected from households are held constant, the variance in impactscalculated for individual household groups must necessarily depend on the extent to which thehousehold sector is disaggregated. Significantly, both sets of projections indicate that thedistributional impacts of dispensing with property based access charges will be very significant forsome households.
Incidence analysis on the impact of moving to uniform access charges conducted by the PublicWorks Department (PWD) in New South Wales is reported in Table 6.3. Consistent with thefindings for Melbourne, the data in the table suggest some customers would face significantincreases in their water bills. However, according to the PWD’s projections, these effects could bemitigated by replacing single consumption charges with a two tiered usage tariff. Again the impactof a change in tariff structures on agency revenues is not spelt out.
Table 6.3 Distributional impacts of dispensing with property charging in country New SouthWales
Maximum increase in the average water
bill for an individual customer classa (per cent)
Uniform access charge plus a Uniform access charge plus\single per KL consumption charge two tiered per KL consumption charge
Inland town 37 13Large regional scheme 29 7Inland city 49 31
a Based on annual consumption of water.Source: Information provided by the PWD
The preceding discussion illustrates that the move to dispense with property based access chargeswill have significant distributional effects. But despite these effects, some authorities have beenable to accomplish this reform in a relatively short time. Significant distributional effects oftenaccompany worthwhile reforms. The Commission also observes that the impacts reported in thepreceding analysis are little different from the sort of changes that some customers experience intheir general rate bills when property revaluations occur. Nevertheless, the Commission acceptsthat, in many areas, dispensing with property based charging will take a number of years tocomplete.

OTHER PRICINGISSUES
6.99
WSD agencies should phase out property based access charges for water and sewerage. Inthe longer term, access charges should be directly linked to the size of the connectionsprovided.
6.2 Developer provided assets and charges
Water and sewerage reticulation and drainage in new sub-divisions is typically provided bydevelopers as part of land servicing arrangements. Costs are recouped by developers in the price ofserviced land. The price of serviced land also usually reflects a charge levied on developers byWSD authorities for the costs incurred in extending systems to new sub-divisions. Theinvolvement of developers in the provision of water infrastructure has the advantage of ensuringfull cost recovery on assets within sub-divisions, and allowing authorities to avail themselves of thesavings from contracting out construction activity.
As discussed earlier, the Commission recommends that returns earned on assets provided bydevelopers or funded by developer charges should be returned to the customers concerned throughlower (access) charges for water services. This is one way of ensuring that customers in new sub-divisions are not charged twice for these assets.
However, as noted in Chapter 2, charges levied on developers often do not include a component forthe cost of any new headworks required to service new subdivisions. The cost of these headworksis shared between new and existing customers.
But just as part of the cost of headworks required to service new areas is met by customerselsewhere, the ongoing water bills of residents in new developments will include a component tofinance infrastructure used to provide services to pre-existing customers.
Resolving whether customers in new sub-divisions pay too much or too little to gain access towater services is important as these access costs will influence decisions on whether to cater forpopulation growth in cities through urban expansion as opposed to, say, consolidation withinexisting developments. Patterns of land development will also be influenced by the degree towhich developer charges reflect differences in the costs of extending services to different areas ofcities and towns.
The impact of developer charges on patterns of land development is being considered in detail inthe Commission’s concurrent reference into land use planning. Therefore, the Commission doesnot propose to make recommendations on the structure of developer charges in this inquiry.
It notes, however, that as part of its advisory role to councils in New South Wales, the PWD hasdeveloped a formula for calculating developer charges which attempts to ensure that residents innew subdivisions pay only for that infrastructure necessary to provide the services they receive. It
WATER RESOURCES& WASTE WATERDISPOSAL
6.100
does so by adjusting developer charges downwards by an amount equal to the contribution thatcustomers in new sub-divisions will make to servicing a water agency’s existing debt. The PWDsaid that an important corollary in the formula is the provision to charge customers in new sub-divisions their share of the full cost of any headworks necessary to supply new areas. In theCommission’s view, the PWD’s approach merits further investigation.
6.3 Funding community service obligations
As discussed in Chapter 2, CSOs which are not fully funded by government contribute to costunder-recovery in the water sector. Like other subsidies, CSOs may have adverse efficiencyeffects, although the incentives they provide to increase consumption must be weighed against anydistributional benefits they provide. Some CSOs may also have a role in promoting improvedpublic health.
Given their likely efficiency costs, it is desirable that governments scrutinise their existing CSOs tosee whether the underlying objectives remain valid and, if so, whether there are better, or lesscostly, ways of meeting those objectives.
In the event that governments continue to provide some CSOs through their WSD authorities, theseconcessions should be directly funded in full by the governments concerned. Direct fundingalready applies, at least in part, to pensioner concessions. It ensures that the adverse efficiencyimpacts of subsidies are not multiplied by a requirement to fund the concessions by overchargingother users. Direct funding is also important in making assistance transparent.
Direct funding may also obviate the need to write down the values of assets used to deliver CSOs.As discussed in Chapter 4, such asset write downs are fraught with difficulty.
Identification of CSOs will not always be clear cut. As the Victorian Government argued:
At present, there is a tendency in the water industry to assume certain activities are CSOs that are, in reality costsof doing business, good corporate citizenship or meeting accepted environmental standards.
And, as pointed out by the Public Sector Research Centre, amongst others, there is the danger thatthe concept of a CSO can be applied to any loss making activity and therefore used to cover uppoor performance by a WSD agency.
But as discussed in Chapter 2 and Appendix C, grey areas notwithstanding, there are somerequirements which can be clearly categorised as CSOs. Pensioner rebates and State-wide uniformpricing policies applying in Western Australia and South Australia are two examples.

OTHER PRICINGISSUES
6.101
Community service obligations imposed on water authorities should be directly funded in fullby the government concerned.
As noted by the Geelong and District Water Board, the source of government funding will dependon the nature of the CSO:
... pension rebates, applicable on a whole of State basis are, and should be funded by the Government, as part ofits social justice, income redistribution policies...
However, ... concessional rates for parks and gardens, are a cost to be borne by the community within the sphereof operation of that agency and should be borne by the community. This is the only acceptable outcome giventhe wide disparity of so called concessional charges from agency to agency.
A policy of directly funding CSOs requires agreement between governments and their authoritieson how those obligations should be valued. This is a contentious issue and one that is far fromresolved.
The major basis for debate is whether valuation should be premised on ‘avoidable cost’ or ‘fullydistributed cost’. At the heart of the debate is the issue of whether system-wide costs which cannotbe readily attributed to individual customers should be accounted for in the valuation of the CSO.Significant common costs characterise many government goods and services including WSD.
Under the ‘avoidable cost’ approach, the CSO is valued on the basis of the additional costs ofdelivering the concession (less revenue received from the beneficiaries). In cases where the CSOrequires investment in new infrastructure, the cost of this infrastructure would be included in thevaluation. However, where the beneficiaries of the CSO use an existing network, the avoidablecost approach would exclude any contribution to the capital costs of that network.
In contrast, the ‘fully distributed’ cost approach includes the beneficiaries’ share of common systemcosts in the valuation. It will therefore generally place a higher value on the obligation.
However, given the regionally aggregated charging systems for water services, the reverse maysometimes be true. Consider, for example, a situation in which the cost of capital required toservice a remote community is much greater than the average cost of capital needed to servicecustomers in the network. The avoidable cost approach to valuation would reflect this difference.But under the fully distributed cost approach, the differential would disappear because the cost ofcapital required to service the remote community would be estimated on the basis of averagesystem-wide costs.
In the Commission’s view, what the valuation of a CSO should try to estimate is the long run cost --both capital and operating -- of meeting the obligation. As WAWA stated:
Where a CSO involves an ongoing use of capacity, the long-term cost of capacity augmentation needs to beconsidered in assessing the avoidable cost.

WATER RESOURCES& WASTE WATERDISPOSAL
6.102
WAWA went on to distinguish three situations: one in which chronic overcapacity exists in asystem, a second where system capacity is only temporary, and a third where augmentation isalmost due. It argued that in the first case, the avoidable cost approach should be used to value aCSO, as a fully distributed cost valuation would include the capital cost of carrying unwarrantedadditional capacity. In the second case, however, it argued that the use of short-run avoidable costto value the CSO would be erroneous if that CSO is to be ongoing because:
... [it] would send the wrong pricing signal to Government in that CSOs would be seen as easily or cheaplysatisfiable.
In the third situation, WAWA argued that if provision of the CSO were to trigger augmentation, theshort-run avoidable cost approach would provide the best measure of the resource costs. It wouldnormally exceed long run avoidable cost and so deter government from introducing the obligationuntil after augmentation had taken place on its normal timetable.
In essence, WAWA’s approach says that if a system is uneconomic because of chronicovercapacity, it will not be replicated at the end of its life. In the interim, it will be sensible to addcustomers to the system provided that charges, or government funding, at least cover operating (orshort-run avoidable) costs.
But where a system is commercially viable, charges for the service should be sufficient to cover allcosts including a return on capital. If the valuation method used to determine funding for the CSOdoes not include a capital component, then given a constraint of full cost recovery, non-beneficiaries will have to meet all of the capital costs of the network. Cross-subsidisation wouldtherefore be required. Yet a policy of identifying and directly funding CSOs is designed to avoidcross-subsidisation in service provision.
The Commission agrees with WAWA’s assessment that a case by case approach is required, havingregard to the sort of considerations outlined above. The underlying principle should be that thevaluation method estimate the long run avoidable cost of meeting the CSO (less the revenuereceived from beneficiaries). If this approach is followed, funding will generally be sufficient toobviate the need for cross subsidisation by non-beneficiaries and/or revaluation of the assets usedto provide the CSO (see Chapter 4).
Commonality in the approach to valuing different types of CSOs across authorities is desirable tofacilitate performance comparisons. The Commission considers that the AWRC would be anappropriate body to formulate guidelines to achieve this.

OTHER PRICINGISSUES
6.103
The Australian Water Resources Council should formulate and disseminate guidelines forvaluing Community Service Obligations in the water sector. Underlying these guidelinesshould be a valuation method which estimates the long run avoidable cost of meeting theobligation less the revenue received from beneficiaries.
6.4 Calculation of capital charges
Given the objective of fully covering the costs of water service provision, proper asset valuationand provision for depreciation are crucial.
However, there is no commonly agreed basis for valuing the sort of long lived assets thatcharacterise the water sector or for setting depreciation charges. It is an issue on which much hasbeen written but which has yet to be satisfactorily resolved.
Asset valuation4
Outside the major metropolitan WSD authorities, water assets are typically valued by agencies onthe basis of the purchase price. This is commonly referred to as historical cost accounting.
However, the worth of an asset to a WSD agency may bear little relationship to its purchase price.As Graham and Xavier observe:
It has long been recognised that, particularly where inflation is significant, accounts drawn up on historical costconventions are misleading especially where assets are long-lived. Balance sheet figures of original cost do notrepresent the values of assets to the business, profits and financial trends are misrepresented. If accounts are toshow resource use and economic performance they must allow for general inflation, fluctuations in specific pricesand costs, and for technological progress resulting in changes to the value of capital equipment. (Graham andXavier 1987, p. 19)
Given the long-lived nature of many water assets, the use of historic cost accounting to value waterassets is likely to understate the cost of capital employed in providing services.
It is true that many private companies in other sectors use historic cost accounting to value theirassets. But competition between firms imposes important checks and balances which promoteappropriate pricing of goods and services and penalise poor investment decisions. Assetrevaluations are common in the private sector.
In contrast, the absence of competition in the provision of WSD services means that, under the sortof pricing regimes currently used and those proposed by the Commission, valuation of assetstranslates directly to the level of charges. Thus deficiencies in historic cost accounting techniquesare much more critical than in a competitive market environment.
4 For a more detailed discussion of these issues see Temple-Heald 1991.

WATER RESOURCES& WASTE WATERDISPOSAL
6.104
In response to the deficiencies in historic cost accounting, some WSD authorities have revaluedtheir assets on the basis of current market values. This is commonly referred to as current costaccounting. In the Commission’s view, the use of current cost accounting in all water agencies isan essential pre-requisite for setting efficient capital charges.
Ideally, the current worth of water assets would be based on the market price of similarlydepreciated assets -- that is, what other service providers would be prepared to pay for them. Butthe absence of markets for used water assets precludes this approach.
Two approaches have been put forward to value water assets. The discounted future income streamapproach estimates the value of asset systems with reference to the present value of the expectedfuture income those systems will generate for their owners. In essence, this approach tries toestimate what a market price for these assets would be, if a market existed. The replacement costapproach estimates the cost of replicating the service potential of current assets.
The discounted future income stream approach
Conceptually, the discounted income stream approach has a number of advantages. In particular, itaccounts directly for poor investment decisions:
... when a poor investment is made in durable assets which have little or no value in alternative uses, thepurchase price is a sunk cost and the project may only continue operation because receipts from the assets do justcover operating costs ... The asset value would then be more appropriately the value reflecting its earningspotential in its current use if managed and operated efficiently. (Department of the Treasury 1990, p. 52)
However, the discounted income stream approach is not without its problems. In particular, thereis the difficulty of estimating earnings potential in the presence of uncertainty about the willingnessof users to pay for water services, future government regulation of prices for WSD services,environmental controls etc and about the likely improvements in the cost efficiency of serviceprovision. Indeed, as noted in Chapter 4, there is an element of ‘circularity’ in the use of thediscounted income stream approach to asset valuation. The value of an asset is imputed residuallyfrom expected revenues and the discount rate. Low asset values arrived at using this techniquemay therefore partly reflect poor asset management and/or pricing policies which do not fullyrecoup costs. Thus if the purpose of the asset valuation is to determine what an efficient capitalcharge would be, then only when assets are being used to their best advantage will it be sensible tovalue them on the basis of future expected earning capacity.

OTHER PRICINGISSUES
6.105
The replacement cost approach
The alternative of valuing assets at their (written down) replacement cost is also deficient becauseit ignores technological improvements which reduce the costs of providing services, and fails todirectly account for ill-judged investments.
The former problem is overcome by the Modern Equivalent Asset (MEA) method of replacementcost valuation used by the AWRC in undertaking its interagency performance comparisons. Inessence, the technique relies upon estimating the costs of replicating the service potential ofexisting assets, ‘given the latest technology available in the normal course of business’.
Asset valuations using the MEA approach could be lower than those based on (written-down)replacement costs.5 This is because the MEA technique mimics the role of market competition inforcing down prices if cheaper ways of producing water services emerge.
The Commission’s view
Widespread cost under-recovery in the supply of urban WSD services means that the use of thediscounted future income stream approach to value assets for the purposes of determining anefficient capital charge, will generally be inappropriate. Given that, through the AWRC, a starthas been made in valuing assets using the MEA methodology, the Commission believes that thismethodology should generally be the basis for future asset valuation in the water sector.
The Commission notes comments made by the Geelong and District Water Board and theTownsville City Council, among others, that the MEA approach may not be fully consistent withcurrent accounting requirements for public sector entities. Thus implementation of thisrecommendation will require co-operative action by the water industry, the accounting professionand the relevant areas of government.
The Commission also notes that where write downs to an authority’s assets are required to takeaccount of unfunded CSOs or poor investment decisions (see Chapter 4), the revaluations shouldreflect the reduced earnings potential of the assets in question. However, provided thatgovernments fully fund their CSOs, there will rarely be a need to write down the values of urbanWSD assets.
5 The relationship between historical asset values and those calculated using MEA will depend on the extentto which cost savings from technological change offset asset price escalation over time due to inflation.

WATER RESOURCES& WASTE WATERDISPOSAL
6.106
Water agencies should generally value their assets for pricing purposes according to theAustralian Water Resources Council’s Modern Equivalent Asset methodology. However, ifthere is a need to write down asset values to account for unfunded Community ServiceObligations or poor investment decisions, the resultant reduction in the earnings potential ofthe assets in question should be the basis for the revaluation.
The Australian Water Resources Council should initiate discussions with the accountingprofession and the relevant areas of government to secure any changes necessary to generalaccounting requirements.
It would be impractical to revalue all of an authority’s assets using the MEA approach each year.One possibility proposed by the Department of Finance (1988) is that all assets be revalued everyfive years with inflation adjustments in the intervening period. An alternative would be to revaluea portion of the asset base each year and adjust the value of the remainder on the basis of theinflation rate.
In the Commission’s view, the latter approach has the advantage of permitting immediateadjustments to part of the asset base if cost-lowering new technology becomes available. It istherefore likely to remove some of the lumpiness in changes in asset values that would arise underthe Department of Finance proposal.
Depreciation charges
The function of depreciation has been the subject of some dispute between economists andaccountants. Depreciation has variously been viewed as a way of amortising the costs ofinvestments over time, as a charge for capital ‘consumed’ in the production process and as a sinkingfund to provide for asset replacement and refurbishment (see, for example, Temple-Heald 1991).
There is also considerable uncertainty about the effective lives of many long-lived water assets, andthe impact of local conditions on those lives. Moreover, in the water sector it is more sensible tothink about depreciation of asset systems rather than individual mains etc. Accordingly,prescribing depreciation schedules for individual asset types is fraught with difficulty.
Finally, the economic life of an asset depends, in part, on the level of maintenance performed.Thus maintenance and depreciation are inter-related. In the past, authorities have made decisionson whether assets should be restored or allowed to deteriorate on the basis of productive value.However, with the move to corporatisation in the Hunter and elsewhere, liability for tax may seeauthorities increase their maintenance of assets. This is because, in the presence of inflation, theAustralian taxation system can encourage firms to prolong asset life rather than allow assets to rundown (see Jones 1990).

OTHER PRICINGISSUES
6.107
Renewals accounting
In response to the difficulties of applying conventional depreciation regimes to water assets, asystem known as renewals accounting has been introduced in the British water industry.
Renewals accounting starts from the position that core infrastructure is to be maintained inperpetuity. These core assets are recorded as being non-depreciable, with all the costs of renewal(ie maintenance and replacement of parts of the system) being treated as charges to operatingexpenditure. In effect, capital investments to replace parts of the system are treated as fullydepreciable in the year of installation.
Proponents of renewals accounting argue that it sidesteps the difficult problem of settingdepreciation schedules for long lived assets. That is ‘renewals’ expenditure is presumed to equateto the economic consumption of capital in the delivery of services.6
However, in the UK, to avoid lumpiness in charges when major parts of systems are renewed, anaverage expected renewals charge is levied. The problem of determining depreciation schedules istherefore replaced by one of determining average expected renewals expenditure. The need toforecast how assets are likely to deteriorate over time increases the complexity of renewalsaccounting and brings it much closer to a conventional depreciation system.
Critics of renewals accounting argue that it is inappropriate for uneconomic systems that should notbe continued in their present form, and that it is difficult to apply where networks are expanding toprovide services to new locations.
In the UK system, a distinction is made between enhancement expenditure (capital) and renewalsexpenditure (recurrent). Enhancement expenditure is expenditure which is expansionary in nature,for example, provision of services to new customers, improvements in efficiency or providing agreater level of service. Renewals expenditure is incurred for the purpose of preserving orrestoring the condition of the system. It includes the ongoing maintenance work undertaken on anyrenewable asset system together with the replacement of any of its elements.
Similarly, the problem of uneconomic systems does not appear to constitute an insurmountableobjection to renewals accounting. Elements of a system which should be allowed to run-down or
6 As practised in the UK, renewals accounting differentiates between infrastructure assets and other assets.The former include networks comprising underground systems, channels, major storage service reservoirs,dams and major outfall sewers. The latter include above ground assets such as treatment plants, pumpingstations and buildings etc. Conventional depreciation provisions apply to the latter asset group. However,there have been suggestions that the renewals approach should be extended to all network assets (LondonEconomics 1992, p 20).

WATER RESOURCES& WASTE WATERDISPOSAL
6.108
should be maintained at a lower level of service potential simply require identification. Thus in thecontext of, say, irrigation, renewals accounting need not presume that existing systems will bemaintained in their present form in perpetuity.
Inquiry participants had mixed views on the merits of renewals accounting.
The South Australian Government said that a major advantage of the system is that it treats thewhole of a network as the asset. The Murrumbidgee Irrigation Management Boards concludedthat:
... there are more advantages than disadvantages from the use of the renewals accounting concept in dealing withlong life, constantly maintained infrastructure such as that existing in the irrigation industry.
Other participants were less enamoured with the system. For example, Melbourne WaterCorporation said that it has:
... carried out a review of renewal accounting as part of an Urban Water Research Association project on thevaluation of assets. This review concluded that there was little to gain from the implementation of renewalaccounting.
A number of irrigation interests, including the Condamine Balonne Water Board, argued that adepreciation sinking fund is preferable to a renewal charge for funding asset maintenance andrefurbishment. However, in principle, a sinking fund appears to the Commission to be littledifferent from some form of average renewals charge. The preference for a sinking fund seeminglyreflects a perception that the costs of refurbishing run-down irrigation systems would be borne byirrigators under a renewals system but by the community under a sinking fund approach.
The Commission sees considerable merit in the renewals accounting approach, particularly ifapplied in its pure form -- renewals expenditure is charged up as it occurs rather than on someaverage basis.
That said, pure renewals accounting would introduce an element of lumpiness to WSD charges,particularly in those jurisdictions where the age profile of assets is not evenly spread. The extent ofthe lumpiness problem is also likely to be a function of the size of networks. That is, the larger thenetwork, the smaller will be the impact of renewal of individual parts of the system.
Without further investigation, the Commission is unwilling to unequivocally endorse theintroduction of renewals accounting in the Australian WSD sector. Rather it believes that theapplicability of the system should be further examined by water agencies.
Through the Australian Water Resources Council, water agencies should further investigatethe merits of renewals accounting in the Australian water sector.

OTHER PRICINGISSUES
6.109
6.5 Dividend policies
As discussed earlier, the inclusion in prices for WSD services of a rate of return on assets employedis important in signalling to users the true costs of providing services.
However, this leads to the further question of whether a return on equity in WSD agencies shouldbe appropriated as a dividend by government on behalf of the community.
Many non-metropolitan water agencies argued strongly that local communities and not StateGovernments own their water infrastructure and that consequently any payment to StateGovernments is simply a tax. Their views were typified by the Shepparton Water Board whichstated that:
The real rate of return concept, based on current cost accounting, is being widely imposed in the public sector, byGovernments, as the basis for the payment of substantial public authority dividend taxes into consolidatedrevenue.
... Government equity in the Shepparton Water Board is not significant, and continues to decline as the system isreplaced and expanded from internally generated funds. It is therefore a "fallacy" to claim that the assets of theBoard and its customers are the assets of the State and that the State is therefore entitled to a dividend or return onits investment. (pp. 9-10)
Government funding of infrastructure for urban systems has declined in recent years and, for manyestablished authorities, has been non-existent.
But in the past, governments have not received any return on the equity they have invested in WSDauthorities. It could be argued that governments have retained previous dividend entitlements inthose authorities. As the Victorian Government argued:
As in any business, after the initial injection of funds by the owners, assets are routinely replaced, refurbished andexpanded with a combination of equity funds and borrowings. The equity may be in the form of additionalinjections of capital or retained earnings. In either case, ownership does not change simply because the asset basehas been embellished from the retained proceeds of doing business.
While concurring with the thrust of the Victorian Government’s arguments, the Commission doubtsit would now be possible to determine whether State Governments were the sole equitycontributors at the time many authorities were established. This means that a more practicalsolution is required.
In its draft report, the Commission proposed that returns to equity earned on the provision of WSDservices should be payable to the legal owners of the assets used to provide those services. Notsurprisingly, participants’ views on this proposal depended on the interests they represented. TheGeelong and District Water Board said that it:

WATER RESOURCES& WASTE WATERDISPOSAL
6.110
... welcomes and endorses the Commission’s recommendations that dividends should be payable to the legalowners of those assets. In our opinion that includes the community as ratepayers who are thus entitled to receivesuch benefits.
The Victorian Government stated that:
... the ultimate owner of water sector assets in Victoria is in all the cases the State Government as custodian forthe community.
The view that local councils, or the authorities themselves should be recipients of any dividend ... isa nonsense argument.
The Colac District Water Board went so far as to suggest:
The proposal ... that returns to equity should be payable to the legal owner is supported as long as the legal owneris the Board and its customers.
It would be unfortunate if disputes over who should receive dividends were to jeopardise theunderlying and important reform -- namely that prices for WSD services include a component toreflect the cost of equity capital. Getting this component into prices is necessary to signal to waterusers the true costs of the services they receive.
However, positions on this issue will inevitably be determined by financial self-interest rather thaneconomic efficiency. Indeed, there is a risk that water authorities and other GBEs could be treatedas milch cows by State Governments under the banner of promoting economic efficiency. Thusapart from reiterating that entitlements to dividends should reside with the legal owners of waterassets, the Commission sees no point in recommending hard and fast rules to sort out entitlementsto dividends in individual cases. Rather it expects that entitlements will have to be negotiatedbetween water authorities and State and Local Governments.
Returns to equity earned on the provision of WSD services should be payable to the legalowners of the assets used to provide those services.
The question of how dividends should be set is another complex and contentious issue.
Because of the low level of cost recovery in some country urban systems and in the supply of bulkirrigation water, many agencies would not currently have the capacity to pay dividends. Indeed, itmay be a number of years before some agencies are able to do so.
As a general rule, dividends should only be payable once an authority is in a position to meet itsoperating expenses, to make proper provision for depreciation and to pay interest on debt. That is,as in the private sector, ‘owners of the firm’ should have the last call on funds, otherwise so-calleddividends are nothing more than a tax.
In its draft report, the Commission proposed that liability for dividend payments should be basedon the level of equity capital in an authority’s asset base, not the whole of the asset base as is
OTHER PRICINGISSUES
6.111
sometimes suggested. Apart from an adjustment for developer provided or funded assets, theCommission proposed that a further reduction to the asset base be made to net out borrowedcapital.
Some participants questioned the basis for such adjustments. For example, the SWB argued thatassets funded by debt should not be excluded from the dividend calculation as:
Any accretion in asset value should ... reside with the shareholders and they should be entitled to a return inrespect of it.
And, as discussed in Chapter 4, a number of participants argued that a return on equity should besought on assets provided by developers or funded by developer charges.
In the Commission’s view, the broad thrust of its draft report proposal remains valid. As discussedearlier, it sees no reason why consumers should pay twice for assets provided by developers orfunded by developer charges. However, rather than deducting these assets from an authority’s totalasset base, it now proposes that the rate of return earned on them be returned to customers in newsub-divisions in the form of lower access charges for water services. For infrastructure funded byexternal borrowing, a rate of return is provided for in the cost of servicing the debt. As this cost ispassed on to customers, there is no efficiency reason to seek a further dividend. This is equivalentto saying that with the target rate of return calculated prior to the payment of interest costs, thereturn to equity holders is the amount left over after debt has been serviced.
That said, the Commission accepts the argument put by the SWB that increases (or decreases) inthe value of assets funded by borrowed capital should accrue to equity holders.
Of course, the practicalities of striking dividends are likely to be more complex than these simpleguidelines would suggest. In particular, there is the question of whether dividends should beautomatically appropriated, or whether there should be provision for authorities to retain earnings.Retained earnings are an important source of funds for expansion in the private sector. AsMelbourne Water Corporation commented:
... dividends should only be payable out of current year profits or retained earnings ... the decision on how muchdividend to pay should be based on the objectives of the owners of business and in line with the owners’ businessstrategies. The dividend payout will be between zero and the level of retained earnings, the exact amount beingdetermined in light of: capital expenditure plans, liquid funds availability, owners’ requirements, businessviability and the overall business strategies and financial performance targets.
In the Commission’s view, flexibility is very important, provided there are safeguards to ensure thatany retained earnings are accounted for. Some form of net revenue sharing arrangement may beappropriate to ensure that owner governments receive some dividend, while at the same time givingwater authorities more certainty about their capacity to fund expansions from retained earnings.Any such arrangement could be documented in an authority’s business plan (see Chapter 7).
WATER RESOURCES& WASTE WATERDISPOSAL
6.112
6.6 Capital subsidies
Capital subsidies have been instrumental in ensuring that minimum public health standards inrespect of water and sewerage are met in small communities.
However, as discussed in Chapter 3, a number of participants argued that capital subsidies haveencouraged investment in non-economic facilities in many country urban areas, and have providedincentives for the over-engineering, or gold plating, of systems.
While the PWD denied these effects in New South Wales, in the Commission’s view, it would besurprising if subsidies had not had adverse efficiency impacts. Indeed, the primary rationale forthese subsidies -- to enable the provision of services at an ‘affordable’ cost -- is premised on equitynot efficiency.
Equity considerations, along with public health arguments, are clearly important. Nonetheless, it isimportant that capital subsidies be administered in a way which will reduce the accompanyingadverse impacts.
First and foremost, no further subsidies should be paid to establish or expand irrigation schemes.Such developments cannot be justified on equity grounds. As proposed earlier, any future publicinvestment in new irrigation schemes should only proceed if the water agency concerned canpublicly demonstrate that water demand will be sufficient to support charges that cover all costs,including a minimum 5 per cent real rate of return on capital.
In the Commission’s view, capital subsidies for WSD infrastructure are mainly relevant where itwould otherwise be impossible to achieve acceptable standards of public health at an affordableprice. This will sometimes be the case in smaller communities. In this sense, capital subsidiesshould simply be regarded as a CSO.
However, these subsidies should be delivered in a way which minimises their cost to the widercommunity. Thus it is important to assess whether amalgamations of small water agencies wouldlessen or obviate the need for capital subsidies.
The question also arises as to whether it is sensible to build the same types of systems as are usedin larger population centres. The Western Australian Department of Health said that substantialwater and sewerage treatment infrastructure in some remote communities has not been properlymaintained because it has not been possible to set charges which cover operating and maintenancecosts. In such circumstances, less elaborate and therefore cheaper and more easily maintainedsystems, may ultimately deliver better public health outcomes. Consideration of alternatives tofully reticulated and treated water supplies will be relevant in some cases.

OTHER PRICINGISSUES
6.113
Where it is difficult to recoup the costs of environmental works through charges on beneficiaries,subsidies may also be warranted. However, as discussed in Chapter 9, in many situationsmechanisms such as environmental levies provide a means for the recovery of the costs ofenvironmental investments.
In summary, capital subsidies to promote efficiency are only warranted where minimum acceptablepublic health standards could not otherwise be achieved, or where a project provides significantenvironmental benefits for which it is impossible to charge. Capital subsidies to enable theprovision of services at an ‘affordable cost’ should be treated in the same way as other CSOs.

INSTITUTIONAL ANDADMINISTRATIVEARRANGEMENTS
7.115
7 INSTITUTIONAL AND ADMINISTRATIVE
ARRANGEMENTS
Pricing reforms discussed in the preceding chapters, would do much to improve efficiency.However, complementary administrative and institutional changes are required to reinforce thosepricing initiatives, to ensure that costs of provision are minimised and the practices of WSDproviders are compatible with society’s goals for water quality and the environment.
7.1 Opportunities for introducing competition
In the right circumstances, competition can be the best incentive for improved performance. Firmswhich do not provide consumers with the products they want at competitive prices do not survive.
Typically WSD services have been provided by single suppliers, operating as regional monopolies.The perception has been that with available technologies, a single, vertically-integrated supplierresponsible for operating dams right through to distribution of water to households, is the most costefficient form of provision.
The monopoly nature of service provision is reinforced by the lack of substitutes in consumptionfor water. This is in contrast to the energy sector, for example, where consumers often have achoice between forms of power.
However, for some elements of WSD service provision, technologies are changing. For example,services using locally self-contained systems for treating and disposing of waste water are likely tobecome cheaper. Until recently, alternatives to large-scale sewage treatment, such as septic tanks,often had adverse environmental impacts -- pollution of groundwater is one example. Newerdevelopments are more environmentally friendly.
As new technologies emerge, so do possibilities for introducing competition through structuralbreak-up of some parts of the WSD sector. For example, for sewage treatment it may soon bepossible for small firms to provide services to particular customers or groups within the existingnetwork. For new areas, it may soon be more efficient to provide sewage treatment services asself-contained units, without the need for connection to existing sewerage networks.
For water supply, there remain significant cost advantages from integrated provision. These arelikely to more than offset any benefits from structural break-up.
An alternative way to introduce competition is to franchise out the rights to supply services.Franchising operates in France. This option is discussed further in Section 7.5.

WATER RESOURCES& WASTE WATERDISPOSAL
7.116
Competition at the boundaries of systems may be another avenue for injecting a degree ofcompetition. In the United Kingdom, there has been competition between regional suppliers toprovide water to major industrial concerns. Private sector competition to supply the many inputsrequired by WSD authorities is also an important source of competitive discipline.
Nevertheless, mechanisms other than direct competition are needed to ensure efficient delivery ofservices. This chapter concentrates on two means by which this may be achieved -- changes toinstitutional arrangements to enhance commercial focus and accountability; and performancemonitoring.
7.2 General principles for administrative and institutional reform
The concern should be to introduce incentives which will encourage water authorities to intensifytheir efforts to allocate resources efficiently. Two aspects of reform, need to be developed intandem. One is encouraging service providers to be more commercially focussed. The other isproviding safeguards against misuse of monopoly power.
These two requirements are best met by institutional arrangements which ensure:
• specification of clear objectives -- commercial and non-commercial;
• arms length from government;
• greater accountability;
• the use of competition to discipline performance wherever feasible; and
• limits on the misuse of monopoly power, through performance monitoring and regulation.
A range of institutional structures could be compatible with these principles. Indeed, given theinstitutional diversity, approaches must be tailored to suit the circumstances of individual agencies.
7.3 Urban water and sewerage provision
Efficiency gains can be achieved within the existing administrative framework providedmanagement has autonomy and authority to make decisions and is accountable for the performanceof the business.
However, poorly specified or conflicting objectives can lead to poor performance and/or make iteasier for governments to interfere arbitrarily in the operations of their authorities.

INSTITUTIONAL ANDADMINISTRATIVEARRANGEMENTS
7.117
Providing clear objectives and functions
There should be a clear understanding between governments and their WSD providers on theobjectives which the owner government wishes pursued. Where objectives conflict, there needs tobe clear guidance on the trade-offs to apply and/or criteria and procedures for resolving thoseconflicts.
The tasks for governments are: to reconcile a commercial focus with the multiple objectives thatsociety and governments have for water bodies; and to define how the roles of the State as a watermanager, owner, service provider and regulator are to be handled.
Commercial objectives
In Chapters 4 to 6, the Commission outlines the major commercial obligations which should be metby WSD service providers and some of the ways by which conflicting obligations can be removedso that managers can concentrate on commercial targets. For example, requirements to providesubsidised services to some consumers can be separately identified and funded by the governmentconcerned. And revenue caps, or like measures, can be used to encourage WSD providers to lookto productivity improvements as a source of improved commercial performance.
Resource management, service provision and regulation
Conflicts of interest are inevitable where the functions of WSD service provider are combined withthe roles of water resource manager and/or regulator of environmental and financial performance.For example, there can be tensions between providing services cheaply and managing waterresources to ensure their long term sustainability.
Governments must decide whether to make WSD service providers also responsible for water (andland) resource management. Opinions differ on this. One view is that in combining thesefunctions, it is easier for integrated decisions to be made. The contrary view is that resourcemanagement and service provision goals can conflict, and it is only by keeping them separate thatthe community can be sure that services are not provided at the expense of resource degradation.There is also the related question of whether water resource management and regulatory functionsshould be assigned to separate bodies.
The degree of separation of functions differs quite markedly across the water sector. For example,the Hunter Water Corporation (HWC) is primarily a provider of water and sewerage services,whereas Melbourne Water Corporation is responsible for maintaining the quality of waterways aswell as providing bulk supply.
The appropriate degree of separation is under review in a number of States. The South AustralianGovernment acknowledges that its Engineering and Water Supply Department (EWS) is requiredto deal with conflicting objectives, but considers that the EWS has been able to do thissuccessfully:
WATER RESOURCES& WASTE WATERDISPOSAL
7.118
It is responsible for bringing together policy advice to Government on all aspects of water management, it carriesout all State imposed regulatory action for inland water resources, it is the State’s major provider of water supplyand urban sewerage services and it is the largest single operator of irrigation schemes. Naturally this breadth offunctions has the potential to internalise many conflicting objectives. It has been possible, nonetheless, for theEWS to operate successfully.
Some separation of these roles is under active consideration. This relates to the changes needed to allow the SAGovernment to create a viable environmental protection agency (EPA) and in no way reflects any conclusion thatthe present form of EWS is inefficient or ineffective.
In Western Australia, corporatisation of the Water Authority of Western Australia (WAWA) isunder consideration. There too, the problem is to clarify the separate roles of the organisation.WAWA said that it:
... is currently undertaking a review of its existing role and responsibilities. The objective is to identify the
institutional framework which best meets the following requirements:
• clear independence between resource management, regulatory and utility roles within the industry
• effective vertical integration of water resource management activities, particularly strategic water planning,
with water service provision
• integration of natural resource management activities at a State level
• administrative efficiency with minimal duplication of infrastructure and resources.
In its submission to the draft report hearings, WAWA said:
... the existing combination of water resource management and water service provision functions in one agencyhas significant advantages and that corporatisation should not necessarily involve the separation of theseresponsibilities. Should both functions be retained in a single corporatised agency, it would, of course, benecessary to establish mechanisms which provide for clear independence and accountability in decision-makingwith respect to water resource management issues.
The Northern Territory has dealt with some of the potential conflicts from overlappingresponsibilities by having legislation for delivery of water supply and sewerage separate from thatof management of water resources, even though both are administered by the same authority. TheGovernment of the Northern Territory, said:
New legislation ... maintains this position and keeps the issue of overall water resource management at arm'slength from the provision of commercial water supply and sewerage services.
Notwithstanding the confidence of some State Governments that a range of objectives can behandled successfully within one organisation, it is important to at least clarify how these variousobjectives are to be reconciled. Even if these bodies retain their current roles, there is still scope tomake service provision more commercially oriented.

INSTITUTIONAL ANDADMINISTRATIVEARRANGEMENTS
7.119
Governments should ensure that providers of WSD services are commercially focussed.Responsibilities should be clearly set out; relationships between water management, serviceprovision and regulatory functions clarified; and processes for resolving conflicts clearlydefined.
Improving accountability, transparency and autonomy
At issue here is the best way to make suppliers accountable to those who pay for and use WSDservices. This raises questions about who WSD authorities report to and what they are accountablefor.
Accountability and transparency
In its draft report, the Commission proposed that water agencies should report to appointed boards(endowed with sufficient technical and commercial expertise), to ensure greater autonomy inmeeting goals (or social and regulatory objectives) set by State Governments or Local Councils.There was a mixed response to this proposal. A number of participants said that accountability canbe achieved without disturbing current institutional arrangements. For example, in the easternStates, efforts are being made to increase the surveillance of the performance of Local Councils,and provide technical and commercial expertise through co-ordinating or central agencies.
In New South Wales, the Local Government Act is being revised with a view to making proceduresand operations more commercial, accountable and transparent (see Box 1). Queensland is currentlyamending the administrative and legislative framework governing provision of services by LocalCouncils, making them more accountable.
The Local Government Engineers’ Association of Queensland, argued that Local Councils are fullyaccountable:
The analogy is drawn to private enterprise in that firms which do not provide consumers with the products theywant at competitive prices do not survive. The same holds for Local Authorities providing WSD services. ...The consumer, if not satisfied with the prices and standard of service received has the option to dispense with theBoard of Directors - the Elected Members - at every election and replace it with a Board of Directors which itfeels reflects more properly the standards of service and prices that the community requires. ... The communitytherefore does have a direct control over the standards provided and the costs associated with the standards in acontinuing sense.
The City of Townsville argued that the anticipated introduction of performance indicators forQueensland Local Councils, will mean that as much accountability will be achieved through LocalCouncil provision as through provision of services by an authority with an appointed board.

WATER RESOURCES& WASTE WATERDISPOSAL
7.120
The problem with this argument is that voters choose a package of policies and may trade-offinappropriate WSD service provision against other gains.
Box 1: Reform of Local Government in New South Wales
Proposed revision to the New South Wales Local Government Act will require Councils to prepare annually managementplans, statements of revenue policy and annual reports on their activities. In the case of water supply and sewerage, themanagement plans will be for a minimum period of 10 years. Copies of plans must be made available to the public forinformation and comment.
General Managers will be required to report to their Councils every three months on the extent to which performancetargets in the management plan have been met.
In annual reports, Councils will be required to compare actual performance against projected performance in themanagement plans, and document reasons for any differences between the two. Annual reporting requirements willinclude performance indicators and other information on which the public and State Government can assess theperformance of Councils.
Councils must keep proper accounts which are to be audited annually. Financial reports will be accessible to the public.Full accrual accounting will be introduced with current cost valuation of water and sewerage assets. Appropriate chargesfor current cost depreciation will be included in the new operating statements.
For services such as water and sewerage, a strong emphasis will be placed on user-pays and full cost recovery.
All certified positions in Local Governments will be abolished and Councils will be able to establish new structures andchange employment practices within a flexible organisational framework.
The reforms are expected to take effect from the beginning of January 1993.
In principle, the Commission favours management of WSD provision by appointed boards.However, the changes in a number of States to ensure greater accountability and transparency ofLocal Council service provision may prove adequate. Performance monitoring (see below) willhelp to assess this.
Indeed, whatever the institutional arrangements, some form of regulation and/or monitoring ofservice providers is required. This is because WSD authorities are not subject to the normal marketchecks on poor performance. Accordingly, without oversight, there is scope for WSD providers tooverprice, inflate costs and/or achieve commercial performance targets through reducing thequality of service and environmental amenity.
There are a number of ways in which this overview can be provided. One is to rely primarily onperformance monitoring by independent agencies. Another is to use corporate or business plans toestablish performance objectives for an authority and to specify the consequences of failing to meetthose objectives. And, generally applicable regulation can be used to ensure appropriateenvironmental outcomes.

INSTITUTIONAL ANDADMINISTRATIVEARRANGEMENTS
7.121
In some respects, performance monitoring by independent bodies and corporate or managementplans are substitutes. Greater reliance on objective setting and monitoring within corporate planswould reduce the need for independent performance monitoring. Getting the appropriate balance,between these instruments, is an emerging issue in the water industry and for government businessenterprise (GBE) reform generally.
Governments should establish clear lines of accountability for their WSD agencies and ensurethat performance results are made publicly available.
The precise mix of instruments required will very much depend on individual circumstances.Hence, the Commission has simply commented below on the potential of these instruments topromote better outcomes.
Corporate plans and annual reports
One way to clarify objectives and increase accountability is to set out objectives in a statement ofcorporate intent, published as part of a corporate or business plan.
Most of the major WSD authorities and many of the smaller Water Boards and Local Councilsalready prepare corporate plans. Apart from the requirements in Victoria and New South Wales,referred to above, For example, under its amended Local Government Act,the QueenslandGovernment requires all Local Governments to prepare detailed budgets and annual reportscontaining indicators of financial and non-financial performance. In Victoria, authorities arerequired to submit corporate or business plans to the State Government; and Tasmanian WaterAuthorities are required to prepare corporate plans and report to Parliament via annual reports.
The Victorian Government stressed the importance of corporate or business planning for all WSDservice providers:
Business plans are sometimes thought only to be important to major authorities. However, with increasingawareness of issues such as water quality (including blue-green algae), drought and floodplain management andeffluent disposal, all authorities have to be able to strategically manage these issues. Business plans are apowerful tool in focussing even the smallest authorities on these issues, so they can plan for them, rather thanmerely react to them.
Not only are business plans critical in identifying, avoiding and resolving conflicts, they are also an importantplanning tool for authorities to reduce costs, achieve pricing reform and ensure better investment decisions. Interms of benefits to the State, business plans enable Department of Water Resources to monitor the performanceof individual authorities and the industry as a whole. They are also an input in policy analysis and assist inestimating global borrowing requirements and debt management of the industry.
Business plans are also a critical link in the chain of accountability. In Victoria, the annual reports of non-metropolitan authorities are currently being aligned with their business plans so that the projected results in thelatter may be compared with actual results in the former.
The following are key areas that should be covered by corporate plans.

WATER RESOURCES& WASTE WATERDISPOSAL
7.122
• pricing behaviour
There is the potential for authorities to increase rates of return by simply increasing their prices.Consequently, it is important to have information on prices and the rate at which they will beincreased over the period of the plan.
Part of pricing reform is to better link charges to the cost of services provided to individualcustomers. Thus the corporate plan should also deal with initiatives to improve the structure ofprices through, for example, dispensing with free water allowances and phasing out property-based access charges (see Chapters 4 to 6).
• cost performance
Owner governments and the wider community have an obvious interest in improving the costefficiency of service provision. In addition to the range of indicators that might be used toidentify cost efficiency, the Commission’s recommendations in Chapter 4 would require aformal link between price increases, cost reductions and rate of return performance to be speltout in corporate plans.
• investment performanceCorporate plans can help to ensure that proper investment appraisal is undertaken. Thecorporate plan should make provision for the public to comment on all major proposedinvestments and to see what alternatives have been assessed, their impacts on the environment,their expected rates of return and their costs and benefits.
The rate of return hurdle test for new investments, proposed in Chapter 4, and the assessment ofalternatives (see Box 2) are both integral parts of investment appraisal. this process. Publiccomment should be sought on major proposed investments.
• service quality
In order to ensure that improved commercial performance is not achieved through unwarrantedrun-down in service quality, corporate plans should establish quality of service targets and setout the consequences if an authority fails to meet those targets. For example, in the UnitedKingdom, the Customer Charter allows domestic customers to claim A$10 against the utilityeach time it fails o meet a performance target.
In this area there is overlap with environmental regulations covering permissible discharges intowater bodies etc. Such regulations will necessarily overlay an authority's corporate plan.

INSTITUTIONAL ANDADMINISTRATIVEARRANGEMENTS
7.123
Box 2: Assessing investment alternatives
The Sydney Water Board said that:
In the past there was a tendency to merely develop engineering solutions to complex environmental problems that permeated the whole water and sewerage system. These problems actually required a multi-faceted approach.
The Australian Conservation Foundation (ACF) referred to the importance of processes to assess new and evolvingtechnologies. In reference to a proposed new dam on the Shoalhaven River, the ACF said:
This dam is only necessary if the major elements of pricing, population, water use, water re-use [and] urban planning cannot be integrated. This dam is an important test case and its construction will mean not only destructionof the Shoalhaven River but also a failure of water use planning and management in Australia.
The Institute for Science and Technology Policy (ISTP) at Murdoch University contended that existing institutionalarrangements are not well placed to assess technologies which are not compatible with existing systems, such as theinstallation of point-of-entry or point-of-use technologies for treating water and sewage. ISTP pointed out that 20 percent of total investment in sewerage treatment is spent on treatment and 80 per cent on reticulation, especially the mainpipes. It argued that the ratio of investments could be changed if sewage were treated locally with more spent ontreatment using emerging technologies such as wetland or solar-aquatic systems.
Melbourne Water Corporation, while acknowledging that current practices are less than perfect, said that it does canvassalternative technologies. It noted that there are implementation problems associated with grafting new technologies ontoexisting systems:
... one of the troubles with having long-term investment in such major capital areas is if there’s a significant change in technology which allows you to build small localised plants that are very clean and sensitive to the local environment ... it raises an issue of how you would maintain the economies of scale by using the big plants.
Given the nature of the water industry, many aspects of business planning are long term and thusthe period for which a corporate plan should apply will depend on individual circumstances. Anymajor changes to the plan, and the reasons for them, should be made explicit and reported publicly.
All WSD agencies should be required to prepare publicly available corporate plans andannual reports, indicating commercial and other objectives. Any major changes to thecorporate plan should be reported publicly.
Independent performance monitoring
Independent performance monitoring, particularly if conducted at a national level, is an importantsource of information to governments on the performance of not only their own authorities, but alsoauthorities elsewhere. It will thus assist in the formulation of corporate plans and ensure that anelement of ‘yardstick’ competition is brought to bear.

WATER RESOURCES& WASTE WATERDISPOSAL
7.124
As indicated above, state-based performance monitoring occurs to varying degrees -- somevoluntary, some mandatory. Much of it is undertaken in-house and reported to the relevantMinister or Local Authority, without regular public scrutiny.
National and independent performance monitoring of WSD authorities is undertaken by theAustralian Water Resources Council (AWRC). Through its interagency performance review, theAWRC documents and compares a range of financial performance criteria for the major waterauthorities. At a more aggregated level, it also monitors performance in the country urban andirrigation sectors.
The AWRC’s role in this area should be expanded. It should be the body responsible for compilingand publishing a national register of performance results submitted by State Governments for allwater authorities.
As national monitoring of WSD service provision is already in place, it is well placed to provideuseful insights for the broader GBE national performance monitoring exercise, occurring as part ofthe agreement reached between the Commonwealth, State and Territory Governments. Co-ordination between the two will also be necessary to avoid unnecessary duplication of effort.
All WSD agencies should submit to their relevant State body their achievements against anagreed list of performance indicators. This information should then be published by theAustralian Water Resources Council.
Because of the wide variations across regions in geography, weather patterns and demography, it islikely that a divergence in results for many of the indicators will be consistent with efficient servicedelivery. Monitoring results must therefore be used with care. If wide variations in performanceacross authorities are observed, it will be important to look first for explanations due to regionaldifferences.
If States all agreed to implement national performance monitoring, the AWRC would need toconsult with all States over how to set up procedures for collecting data, ensuring consistency andmaking results public. They would also need to agree on which indicators are to be included.
Regulating trade practices
Restrictive trade practices regulation in Australia is designed to deter anti-competitive behaviour byfirms with a significant level of market power. While the legislation establishing the HWC makesthe Corporation subject to the Trade Practices Act and the New South Wales Fair Trading Act, ingeneral, GBEs are exempt. This exemption is the subject of discussions between theCommonwealth and the States, and is likely to be reviewed later in 1992.
INSTITUTIONAL ANDADMINISTRATIVEARRANGEMENTS
7.125
Encouraging effective competition in the supply of inputs
WSD service providers should not be advantaged nor disadvantaged in purchasing inputs by virtueof their government ownership. There is a wide range of ancillary service inputs (such as plant,design, electrical engineering, construction, metering, accounting services) which can be providedby the private sector.
A number of authorities are seeking The Sydney Water Board (SWB) is embarking onincreasedprivate sector involvement through having private consortiums both develop and operate WSDprojects. For example, as noted in Chapter 3, a private consortium is to design, construct andoperate WSD and other infrastructure in the Rouse Hill area of Sydney.
Greater freedom in setting employment conditions, unencumbered by public service labour marketrequirements, and in using outside contractors is an important part of reforms necessary to allowWSD service providers to operate in a commercial fashion.
Changes to accounting systems may be required to allow a proper comparison of the costs of inputsprovided in-house or by private contractors.
WSD service providers should be free to use inputs offering the best value, whether they bein-house or external to the agency. Accounting systems should be modified, as required, toallow a comparison of the costs of acquiring inputs in-house or from outside contractors.
Achieving economies of size
A feature of the provision of country urban services in the eastern States is the small populationsserviced by many authorities. Some water and sewerage schemes service less than 100 people.To the extent that fragmentation is a source of inefficiency, amalgamation would allow realisationof economies of size, especially in administration, technical and financial services, and to a lesserdegree in operations. As discussed in Chapter 3, amalgamations in Victoria over the last decadehave produced substantial efficiency gains.
In its draft report, the Commission proposed that amalgamation of country urban water servicesshould be pursued in all the eastern States.
Support for this draft recommendation came from a number of Victorian participants. TheTasmanian Government and some Queensland participants said that amalgamation could bebeneficial in some areas of their States.
Others pointed to physical and geographical constraints on amalgamations such as the spread ofpopulation in the outback of New South Wales and Queensland. Participants from Queensland andNew South Wales were also concerned that amalgamation would remove responsibility for WSDprovision from Local Government.

WATER RESOURCES& WASTE WATERDISPOSAL
7.126
The PWD argued that because many of the schemes in New South Wales are small, they are bestoperated at a local level in conjunction with other community services. The PWD said furtheramalgamation of WSD services would result in duplication of administrative, technical andfinancial services already undertaken by Local Councils.
Narrandera Shire Council in New South Wales said that there are administrative models whichwould reap some of the benefits associated with amalgamation, while at the same time retainingLocal Government control:
... franchising areas to other supply authorities, purchasing the raw product from other sources and deliveringthrough its own system, or by entering into any other arrangement with other authorities as may be mutuallyattractive. Any such arrangement would allow the local government body to control its own destiny inaccordance with the wishes of its ratepayers.
The system in New South Wales is an example of this sort of arrangement. Similarly inQueensland, bulk water boards supply a number of individual WSD operations.
Given the diversity in geographic, demographic and institutional conditions, the need foramalgamation does not apply equally well throughout Australia.
Whatever the present institutional forms, there would be benefits from greater realisation ofeconomies of size. This could mean formal amalgamations to form regional WSD authorities. Orit could involve franchising areas to supply other authorities. Or it could entail the approachalready used in parts of New South Wales and Queensland, where bulk regional water boards orcouncils supply a number of Local Councils.
Governments should look for ways to realise economies of size in the provision of theircountry urban WSD services. In some cases this may warrant amalgamation of serviceproviders.
In looking at the optimal size of region for WSD provision, water management concerns as well ascost efficiency are relevant. The ACF said:
... Local Government appears to be too small a unit to deal efficiently with catchments and State Governmentstoo big a unit. There is an opportunity in the move towards regionalisation of water services ... to bring in, innatural resource management only, a regional scale.
Issues in relation to catchment management are discussed in Chapter 10.
7.4 Corporatisation of urban WSD service providers
While much can be achieved within existing administrative structures, there will be benefits from amore arms length relationship between governments and their water authorities. Corporatisation isone way of achieving greater day-to-day autonomy. However, the term corporatisation is oftenused without a clear idea of what it entails.
The Public Bodies Review Committee of the Victorian Parliament (Government of Victoria 1991)listed 27 different interpretations of ‘corporatisation’. Sly and Weigall offer the followingdefinition:
INSTITUTIONAL ANDADMINISTRATIVEARRANGEMENTS
7.127
The term corporatisation is defined widely. In a legal sense, corporatisation means the creation of a limitedliability company incorporated under the Corporations Law, and the transfer of the business conducted by theGovernment (perhaps already commercialised) to that company. A GBE can alternatively be constituted in itsown corporate form by legislation. The ownership and control of the company remain with the FederalGovernment or relevant State Government.
The assets and liabilities are owned and borne by the company and the company makes the profits or incurs thelosses, but the Government indirectly controls the company by virtue of its share ownership. (Sly and Weigall1992, p 14)
These differing interpretations are already evident in the different models of corporatisation beingexamined within the States. Important features of the Hunter Water Corporation (HWC) -- the onlycorporation fully operational in the water sector -- are described in Box 3.
Box 3: Corporatisation of Hunter Water
In corporatising the Hunter Water Board in 1991, the New South Wales Government followed the approach used tocorporatise GBEs in New Zealand. It involved the creation of a new legal entity.
The HWC has been issued with an operating licence which specifies, among other things, a cap on increases in revenuesand prices and standards for quality of service. If the Corporation fails to comply with the licence it can be fined up to$150 000 or even have its licence cancelled, whereby the assets and undertakings of HWC would be vested in the Crownor a new service provider. The Corporation’s obligations to customers are specified in a customer contract between theorganisation and property owners in the area.
The responsibility for ensuring that the HWC meets its obligations resides in a board. The New South WalesGovernment is required to provide any special directions in writing, and has agreed to directly fund community serviceobligations.
Dividends are paid to the shareholder - the New South Wales Government. The two voting shareholders of theCorporation are the Premier and the Minister for Housing. They own the corporation on behalf of the people of NewSouth Wales. In its role as shareholder, the Government is responsible for ensuring sound commercial performance,constrained by the requirements of the other arms of government. The HWC pays the State Government money in lieu ofsales tax and income tax.
Water resource management and catchment management are vested in the Department so that ownership of waterresources will be retained bythe Crown. Licences to extract water are issued by the Department of Water Resources.
Environmental and health matters are separately regulated by the Environment Protection Authority, and the New SouthWales Department of Health.
The aim of separation of responsibilities is to allow each arm of government to pursue a clear objective, unhindered byother conflicting interests.
The approach taken for the HWC satisfies the reform principles listed in section 7.2. Objectiveshave been stated clearly. In order to reduce conflicts of interest, the HWC has been given thecommercial responsibility for providing WSD services, while the key roles of regulation and
WATER RESOURCES& WASTE WATERDISPOSAL
7.128
resource management, have been placed in the hands of separate arms of government. The Boardof the HWC has been given the responsibility and independence to conduct the business on acommercial basis, but under clearly defined constraints. Performance is being measured and madepublic. And agreements have been made which specifically address potential areas of abuse ofmonopoly power -- prices and service quality.
Incorporation under Corporations Law means that the obligations on principals and directors areclearly spelt out, including their responsibilities to shareholders and creditors, and these areenforced by the Australian Securities Commission. Without this, some discipline on directors anddistance from government is lost.
An alternative approach based on that used by the Commonwealth for Telecom is being used in thecorporatisation of Melbourne Water Corporation.1 In contrast to the approach adopted for theHunter, directors will not be subject to Corporations Law.
As the system is not yet up and running, it is too early to judge whether it will provide the sort ofarms length embodied in the Hunter approach. However, the Victorian approach currently lackssome of the explicit accountability instruments used in the Hunter such as an operating licence andcustomer contract. Moreover, objectives do not appear to be clearly spelt out. Rather these will bedetermined through the three-year corporate plan. It seems that the Victorian Government intendsto have significant involvement in the Corporation:
In matters of expenditure or policy direction the Minister becomes a powerful figure in the operation of thelegislation. (Victoria Parliament Legislative Council 1992)
Corporatisation along the lines of the Hunter model, can provide a more commercial edge to theoperations of WSD authorities than can be achieved solely with administrative reforms. It canplace greater pressure on governments to clearly spell out the circumstances in which departuresfrom commercial practice are required. And, the process of corporatisation can, in itself, help tofocus authorities and their governments on setting priorities; establishing accountability; anddevising ways to deal with potentially conflicting functions.
While corporatisation offers some efficiency benefits in addition to those available throughmodification of existing administrative structures, it can have drawbacks. For example, by makingWSD authorities liable to pay tax, it will encourage them to substitute asset maintenance for assetreplacement. This is because the tax system provides more favourable treatment to maintenance(see Chapter 6).
Corporatisation, particularly, for larger authorities, should be considered on a case by case basis.
1 The Victorian Government corporatised the agency formed from the amalgamation of the Melbourne and
Metropolitan Board of Works and six adjacent water authorities in July 1992.

INSTITUTIONAL ANDADMINISTRATIVEARRANGEMENTS
7.129
Governments should consider corporatisation of WSD service providers on a case by casebasis, to assess whether there are gains to be had beyond administrative reforms.
7.5 Privatisation of urban WSD service providers
Should commercially-oriented WSD authorities remain in government hands? Water services areprivately provided in a number of countries. For example, in the United Kingdom, waterauthorities operate as highly regulated private monopolies. In France, while infrastructure remainsgovernment owned, services are provided through private franchises.
However, given the natural monopoly characteristics of the sector, change of ownership does notobviate the need for extensive government involvement. Thus in the United Kingdom, extensiveeconomic regulation is imposed through the Office of Water Services (OFWAT), including thesetting of tariffs, reviewing financial performance, assessing levels of service and monitoringinvestment and asset condition. Consumers have added representation through Customer ServiceCommittees. Environmental and water quality controls are regulated by the National RiversAuthority, the Drinking Water Inspectorate and Her Majesty’sthe Inspectorate of Pollution (seeLondon Economics 1992, for further details).
A number of problems have been encountered with privatisation in the UK. For example, undercurrent rules, the costs of capital augmentation are passed on to consumers. Some observersconsider that this removes much of the discipline on authorities to properly assess the need for newinvestments. It appears that OFWAT will be less lenient in allowing ‘pass through’ in the future.Also, there has been a continuing tension in the price setting arrangements between the need toprotect consumers from unwarranted price increases and the need to allow water authorities toappropriate some of the benefits of cost saving initiatives.
In France, franchise contracts rarely change hands. As London Economics states:
... while it is widely acknowledged that bidding for the initial contract is fiercely competitive, it is doubtful thatthe subsequent renewal of contract is subject to any significant competitive pressure, ...
Participants had differing views on the merits of privatisation. The SWB considered that:
The experience of some of the privatised UK Water Authorities suggest that there may be a number of importantbenefits to be gained from privatisation.
... Overseas models of privatisation which reportedly result in heavy costs, especially associated with theregulatory environment, would not necessarily need to be replicated in Australia.
WATER RESOURCES& WASTE WATERDISPOSAL
7.130
However, Melbourne Water Corporation, in commenting on its own consultancy provided byLondon Economics, concluded that:
On the basis of international evidence, and given the natural monopoly status of the major services involved, noclear advantage in efficiency could be gained associated with the transferral of the ownership of MelbourneWater from the public to the private sector. The report reinforces the approach that the most significantefficiency gains are most likely to derive from the stimulation of genuine competition for particular activitiesundertaken while still retaining overall control and accountability with a single organisation.
In the Commission’s view, privatisation of urban service provision is not a high priority at thisstage. It is preferable to build on the current foundation of public ownership in a way which wouldnot preclude the possibility of privatisation at a later date, should that prove desirable. In someareas, a requirement for WSD authorities to behave in a more commercial fashion could providethe means by which the industry and regulators learn how a successful private system could work,and thus constitute a staging post for privatisation at some stage in the future.
7.6 Urban drainage
Across all States, drainage services in urban areas are predominantly a Local Government function.However, some major urban water authorities own and maintain the main stormwater trunk drainsinto which the various locally operated drainage systems discharge. The States have evolveddifferent ways to manage drainage functions across Local Council jurisdictions, and a number arereassessing their approaches.
The challenge is to devise ways by which to co-ordinate drainage across an ‘urban catchment’,while at the same time providing incentives for both the efficient provision of drainageinfrastructure and to make those responsible bear the costs of any ‘downstream’ effects. At present,the water and sewerage authorities sometimes find that their investments in sewerage treatment(aimed at improving environmental outcomes) are undermined by the effects of drainage.
As environmental concerns have emerged, pressures have increased for the integration of drainageinto the whole water management cycle. Otherwise, drainage discharges can frustrate attempts toimprove water quality throughout an urban area.
In Western Australia, drainage services are currently provided in a ‘negotiated partnership’ betweenLocal Government and WAWA. WAWA is reviewing its role and objectives for drainage. Whileno decisions have been made, its likely preferred role will be to provide strategic planning so thatdrainage services and the development of infrastructure are co-ordinated. This will leave theconstruction of infrastructure and the provision of drainage services to Local Government. In thiscase:

INSTITUTIONAL ANDADMINISTRATIVEARRANGEMENTS
7.131
... the Authority’s utility role, [may] ... be limited to those schemes where water resource management objectivesof sub-regional significance are paramount.
Examples might be schemes to control the impact of urban development on the water balance of regionallysignificant wetlands, or drainage of development that might impact on public groundwater resources. This wouldbe distinct from "urban flood protection" schemes where the management issues are more straight forward andlocal in nature.
Melbourne Water Corporation has significant responsibility for drainage in metropolitanMelbourne. It is investigating ways to meet its expanded responsibility for the greater part of thePort Phillip Bay catchment. For example, it is considering putting litter traps in drains at thecouncil boundaries so that the cost of litter is borne by the community responsible for it.Melbourne Water Corporation said that the pollution of major waterways is largely attributable tothe drainage system.
The Water Authorities Association of Victoria raised the likelihood that a study into the 32 waterboards supplying the south-west of the State will result in fewer boards which will be given theadded responsibility for river management, floodplain management and drainage.
In South Australia, the provision of drainage services other than irrigation is primarily theresponsibility of Local Government. However, the State Government is considering usingstormwater as a resource to be used for industrial, environmental and recreational purposes. It isinvestigating the appropriate institutional structures to manage this. Five alternatives are underexamination, including a partnership agreement involving a new stormwater authority.
In Sydney, perhaps more than in any other Australian city, Local Council provision of drainageservices has created significant environmental problems. Local Council boundaries often do notalign with natural catchment areas, so that it is difficult to sheet home responsibility for the adverseenvironmental effects to the Local Councils concerned. Local Councils are responsible for theprovision of drainage services, but it is the SWB which is judged on the condition of thewaterways. The SWB contends that its efforts to improve the condition of waterways throughimproved sewage treatment are impaired by the effects of drainage.
The SWB is considering ways to improve outcomes, including:
• charging Local Councils for their discharges into the trunk drainage system, in the samemanner in which the Board licenses and charges industrial users to discharge into its drains;
• physically integrating the sewerage system with the drainage system;
• countering Local Council fragmentation by assisting Local Government to prepare a regionalwaste-water management strategy as part of the wider water cycle management strategy forSydney;

WATER RESOURCES& WASTE WATERDISPOSAL
7.132
• in new areas, such as Rouse Hill, vesting ownership of drainage infrastructure with the SWB,so that infrastructure can be built in the most effective place in the catchment; and
• having the EPA set standards for and monitor discharges from Local Council drains.
There are advantages in having Local Councils provide drainage services. Savings can be achievedthrough the joint use of administrative and financial services and because it is often technicallydesirable to install drainage as a physical part of road construction. Narrandera Shire Council andother participants argued that since drainage is physically linked with road construction andmaintenance, it is illogical to separately charge for this work. Where Councils are also responsiblefor sewerage, they have the option of integrating these two functions.
However, in the major cities, problems stemming from Local Council provision of drainage arelikely to be ongoing. One option is to physically integrate drainage with sewerage. Alternatively,treating Local Councils as if they were industrial users may be an innovative approach, requiringless investment in large-scale infrastructure and therefore, worth trialling. Underlying this latterapproach is the principle that Local Governments should be accountable for drainage run-offleaving their boundaries. This principle has much wider application. Even where LocalGovernment provision of WSD services enables co-ordination of sewerage and drainage, LocalGovernments should still be made accountable for discharges that affect other regions.
State Governments should ensure that Local Governmentsand other urban water agencieswith drainage responsibilities are accountable for stormwater and other run-off leaving theirboundaries.
7.7 Irrigation water and drainage
There has been action taken in most States to improve the efficiency of both bulk water supply andthe distribution of water and provision of drainage within government irrigation systems. Perhaps,the most significant of these reforms is the devolution of management of irrigation systems.
In New South Wales, the management of Irrigation Areas and Districts has been devolved toirrigator-dominated management boards. This has led to cost savings through, for example, greateruse of outside contractors in performing maintenance work, flatter management structures andmore flexible labour market arrangements. Greater input into the decision making process fromthose paying for services underlies these savings.
The New South Wales Government intends that eventually the management and control of theIrrigation Areas and Districts will be entirely separate from central administration. This will

INSTITUTIONAL ANDADMINISTRATIVEARRANGEMENTS
7.133
achieve the separation of the function of water resource manager from service provider. In theJemalong-Wyldes Plains Irrigation Area (Lachlan Valley) and the Coleambally Irrigation Area(Murrumbidgee Valley), final details of private management are being negotiated. Options beingconsidered include full privatisation, corporatisation and the creation of public subsidiarycompanies, where the irrigation infrastructure would remain in government ownership.
The South Australian Government also favours devolution of management to the regions:
The concept of Regional Management Boards is supported and already included as an interim step betweenGovernment and self management. The South Australian Government Highland Irrigation Districts have beenmoving towards a greater management involvement for the Irrigation Advisory Boards for service levelrequirements, developing and monitoring budgets, developing policy and considering annually the price of water.
... Devolution to regional bodies reduces administration and management levels whilst improving the ability tomake decisions quickly and close to the customer base.
The Victorian Parliament recently passed a bill to devolve management of rural water to fiveregional boards, operating within the one organisation, renamed the Rural Water Corporation (seePart II of this Report). Bulk water supply and distribution assets will continue to be owned andcontrolled by a public authority.
However, the VFF questioned the degree of independence to be given the regions:
It is critical to the success of the reforms that Regional Organizations have full autonomy in relation to decisionson levels of service, pricing, borrowing and expenditures. A structure in which regions have managementauthority, so long as their decisions are consistent with the policies of a strong Central Corporation, is notregionalisation at all.
In the Commission’s view, devolution of the management of public irrigation systems to theregions will improve the efficiency of irrigation services. It will allow those responsible for serviceprovision to concentrate on achieving commercial goals, while meeting externally imposedconstraints regarding water quality etc.
The Salinity Program Advisory Council described how regional decision-making combined withthe responsibility to pay for choices, can produce sound solutions:
If you look at surface drainage which is part of the salinity management plan, ... we are doing everything possibleto reduce the cost of the construction and the bridges because we have got to pay the depreciation in the future. ...
... if we had continued with the way that the drainage program was being extended across the region, it was goingto be a $400 000 000 bill in 1986 dollars. ... by reducing the standard in more community drainage, we havereduced the total bill to $170 000 000 in today’s dollars.
In the process of devolution, it would be necessary to clarify the separate roles of bulk water supplyand management of systems. Devolution to the regions raises the question of how the remaining

WATER RESOURCES& WASTE WATERDISPOSAL
7.134
service provision functions of central agencies -- for example, the supply of bulk water to regionalirrigation bodies, towns and industry, maintaining dams and storages, running the rivers, theenvironmental impact of drainage practices -- should be organised. This must be made clear andnegotiated before devolution of management or ownership to regions.
Devolution is a useful interim measure. However, in the Commission’s view, so long as ownershipof irrigation assets remains in public hands, a government commitment to maintain and refurbishpotentially uneconomic systems is likely to remain. As discussed in Part II of the report, in someStates an open-ended program of asset refurbishment has commenced with little regard to theviability of systems under commercial water pricing (see Chapter 5) and an expanded system oftradeable water rights (see Chapter 8). In the Commission’s view, the only sure way to placecommercial discipline on the refurbishment process and to disentangle government from anongoing commitment to non-commercial infrastructure is to privatise the public irrigationdistribution schemes.
Where schemes have yet to be refurbished, cash payments may be required as an incentive forirrigators to accept ownership of assets. This is because in their current state, and with commercialprices for bulk water in place, the assets concerned may have no commercial value. However, cashpayments are preferable to across-the-board refurbishment, prior to privatisation. It means thatdecisions on whether or not to refurbish will be taken by irrigators (or groups of irrigators) inaccordance with commercial self interest -- having regard to the viability of their systems in anenvironment of commercial pricing for bulk water and a much expanded system of tradeable waterrights. Where refurbishment proceeds, it will be arranged and paid for by irrigators, partly from thecash transfer from government at the time of privatisation.
Some irrigators may decide that their system will not be commercially viable even if refurbished.For these systems, the cash transfers accompanying privatisation will provide adjustment assistanceto the irrigators concerned.
The cash transfer to facilitate privatisation should be determined on a case by case basis. Forschemes that have yet to be refurbished, it should not exceed 50 per cent of the estimatedrefurbishment costs. For schemes that have already been refurbished a lesser cash transfer wouldbe appropriate.
The Murray-Darling Basin Commission estimates that the cost of rehabilitating irrigationinfrastructure in the Basin over the next 15 years is about $600 million. With a 50 per centcontribution from government, this suggests that privatisation of irrigation distribution systems inthe main irrigation region in Australia could be achieved at a public cost of $300 million.

INSTITUTIONAL ANDADMINISTRATIVEARRANGEMENTS
7.135
Management of public irrigation distribution systems should be devolved to regional bodieswith a view to their privatisation. Transfer of ownership should occur before refurbishmentof assets.

WATERENTITLEMENTS
8.137
8 WATER ENTITLEMENTS
In many parts of Australia demand for water at current prices exceeds supply. This means thatwater has a value to users above the price charged for its provision. This is particularly evident insome parts of the irrigation sector. It also occurs immediately prior to augmentation in urbansystems when non-price methods are used to ration scarce supplies.
Where demand exceeds supply, a system of water entitlements could ration demand and help toensure that water is directed to its most valuable use. Water entitlements do not necessarily requirethat ownership of water resides with private individuals. Under Australian water entitlementssystems, the ownership of water remains with the State authorities. Water entitlements are simplydesigned to give the owner the ‘right’ to use a specified amount of water in the way that he or shesees fit. Thus water may be used by the owner of the entitlement or sold to another user.
The way in which water entitlements are specified will determine how efficiently scarce water isallocated.
This chapter discusses existing systems of transferable water entitlements (TWEs) and examinesways in which the specification of water rights could be improved.
8.1 Current allocation systems
Irrigation water is allocated to users by public agencies in each State through licensing systems.Generally, these entitlements are allocated free of charge, although some new allocations inVictoria and Queensland have been auctioned.
Until recently, allocations were tied to land rather than to the irrigator. This constrained transfer ofwater to more profitable irrigation activities and, indeed, to non-irrigation uses such as urban watersupply or environmental enhancement. The Western Australian Department of Agricultureremarked:
... the absence of a mechanism to allow a market for irrigation water to develop ... impedes access to additionalwater by higher value agricultural users and efficient water users and provides no incentive to facilitate watertransfer to soils which are more productive, or from soils which are marginally saline.
In recent years, most States have introduced transferable water entitlements. New South Wales andSouth Australia were the first to do so in 1983, followed subsequently by Queensland, Victoria andTasmania. Western Australia permitted experimental transfers in the Collie and Harvey irrigationdistricts in 1987-88 and is currently giving consideration to a general policy of TWEs.

WATER RESOURCES& WASTE WATERDISPOSAL
8.138
For the most part, water can only be transferred on a temporary basis. An exception is SouthAustralia, where permanent transfers are permitted in both government and private irrigation areas.Permanent transfers are also permitted for private diversions on regulated rivers in New SouthWales and the Bundaberg irrigation district in Queensland. Provision for permanent transfer inVictoria and in government irrigation schemes in New South Wales is expected shortly.
As set out in Table 8.1, all States regulate TWEs. For example, most only permit transfers withinthe same supply systems. There are also restrictions to mitigate negative effects of transfer on thirdparties and the environment.
Where water resources are overcommitted, reduction factors sometimes apply to transfers. Forexample, in South Australia transfers between irrigators are subject to a 10 per cent reduction in thevolume entitlement, while transfers to industrial users are subject to a 70 per cent reduction.
To date, water transfers in most regions have generally represented a small proportion of totalwater allocated -- less than 5 per cent. However, in the government schemes in New South Wales,more than 20 per cent of allocations were transferred in 1987-88.
8.2 The value of water entitlements
Water entitlements will have value if the value of the water to an irrigator exceeds its cost. Hence,the value of water entitlements is one indicator of irrigators’ capacity to pay more for water. Thereare two sources of information on the value of water entitlements: prices paid for water transferand prices paid at auction for new water entitlements.
The Department of Water Resources (DWR) said that, in New South Wales, the prices paid fortemporary water transfer appear to be in the range of $2 to $4 per ML. For permanent transfersbetween private diverters, prices have been much higher reflecting, amongst other things, thepremium placed on the on-going availability of the water concerned. There have also beensignificant variations in price between regions reflecting differences in the use of irrigated waterand the reliability of supply in the system, and whether an embargo on the issue of new licencesexists. In the Barwon region, transactions have apparently occurred at $60 to $450 per ML; in theLachlan and Murray regions at $100 to $150 per ML; in the Murrumbidgee region from nominal toover $400 per ML; and in the Macquarie-Western region at a weighted average of around $200 perML.

139
Tab
le 8
.1:
Fea
ture
s of
tra
nsfe
rabl
e w
ater
ent
itle
men
ts, b
y St
ate
Stat
eW
hen
& w
here
Len
gth
ofT
rans
fers
Spat
ial
Vol
umet
ric
Pro
tect
ion
for
Spec
ial
Age
ncy
fee
Pri
cein
trod
uced
tran
sfer
sbe
twee
nre
stri
ctio
nsre
stri
ctio
nsth
ird
part
ies
cond
ition
sde
term
inat
ion
New
Sou
th
1983
One
-yea
r on
lyIr
riga
tors
W
ithin
set
Tot
alA
genc
y ca
nM
ust n
ot$7
5 pe
rN
egot
iate
dW
ales
Sta
te-w
ide
in g
over
nmen
ton
ly f
orzo
nes
of s
ame
allo
cati
onre
fuse
tran
sfer
si
gnif
ican
tly
tran
sfer
for
betw
een
buye
rsc
hem
es;
tem
pora
ryri
ver
syst
emtr
ansf
erab
leif
thir
d pa
rty
affe
ct s
uppl
yan
nual
; $25
0an
d se
ller
perm
anen
t for
tran
sfer
s;an
d be
twee
nw
ith
prov
isio
nef
fect
s si
gnif
ican
tch
anne
lpe
r tr
ansf
erpr
ivat
e ir
riga
tors
syst
ems
but
for
capa
city
or
for
perm
anen
tdi
vers
ions
and
othe
rsu
bjec
t to
lim
itat
ion
onen
viro
nmen
tus
ers
for
cons
ider
atio
n of
case
-by-
case
perm
anen
tth
ird
part
yba
sis
tran
sfer
sef
fect
son
a c
ase-
by-
case
bas
is
Vic
tori
a19
87-8
8O
ne-y
ear
only
Irri
gato
rs
With
in s
ame
No
volu
met
ric
Age
ncy
can
Mus
t not
$70
per
Neg
otia
ted
Gou
lbur
n-on
lysu
pply
sys
tem
lim
it o
nre
fuse
tran
sfer
sign
ific
antl
ytr
ansf
erbe
twee
n bu
yer
Mur
ray,
only
tran
sfer
s of
if th
ird
part
yaf
fect
del
iver
yan
d se
ller
Mac
alis
ter,
irri
gati
on w
ater
, ef
fect
s si
gnif
ican
tan
d dr
aina
geC
ampa
spe
&bu
t mus
t ret
ain
chan
nel c
apac
ity
all p
riva
test
ock
and
or s
alin
ity
dive
rtio
nsdo
mes
tic
allo
cati
on
Que
ensl
and
1987
-88
Per
man
ant i
nIr
riga
tors
With
in s
ame
10%
of
No
expl
icit
In B
unda
berg
,In
any
yea
r,N
egot
iate
dB
orde
r R
iver
s;B
unda
berg
;on
lysu
pply
sy
stem
orig
inal
pr
ovis
ions
wri
tten
$1
00 f
or
betw
een
buye
r19
88-8
9on
e ye
ar o
nly
only
nom
inal
co
nsen
tfi
rst t
rans
fer,
and
sell
er.
St G
eorg
e &
else
whe
real
loca
tion
for
of m
ortg
agee
$150
for
sec
ond,
B
unda
berg
Bun
dabe
rg;
for
perm
anen
t$2
00 f
or th
ird
none
tr
ansf
ers
and
so o
nel
sew
here

140
Tab
le 8
.1 (
Con
tinu
ed)
Stat
eW
hen
& w
here
Len
gth
ofT
rans
fers
Spat
ial
Vol
umet
ric
Pro
tect
ion
for
Spec
ial
Age
ncy
fee
Pri
cein
trod
uced
tran
sfer
sbe
twee
nre
stri
ctio
nsre
stri
ctio
nsth
ird
part
ies
cond
ition
sde
term
inat
ion
Wes
tern
T
empo
rary
Aus
tral
iatr
ansf
ertr
iall
ed in
1987
-88
in th
eC
olli
e an
d H
arve
yIr
riga
tion
Dis
tric
ts
Sou
th
1982
-83
Per
man
ent
For
wat
erN
one
on R
iver
In
NA
P, 1
0%A
genc
y ca
nM
ust n
ot$8
.50
per
ML
Neg
otia
ted
Aus
tral
iaR
iver
Mur
ray
and
draw
n by
M
urra
y re
duct
ion
refu
se tr
ansf
ersi
gnif
ican
tly
tran
sfer
red
betw
een
buye
rpr
ivat
ete
mpo
rary
priv
ate
dive
rter
spr
ovid
ed n
oof
ori
gina
lif
thir
d pa
rty
affe
ct d
eliv
ery
and
sell
erdi
vert
ers;
tran
sfer
s be
twee
nef
fect
on
rive
r;al
loca
tion
effe
cts
sign
ific
ant
and
drai
nage
1984
-85
NA
Pa
irri
gato
rs a
ndN
AP
zon
ed
if to
ano
ther
chan
nel c
apac
ity
grou
ndw
ater
;ot
her
user
s;to
pre
vent
irri
gato
r;or
sal
init
y;19
88-8
9in
gov
ernm
ent
tran
sfer
s to
70%
red
uctio
n if
priv
ate
irri
gato
rsR
iver
Mur
ray
irri
gati
on a
reas
, ce
ntra
l cor
e to
oth
er s
ecto
rne
ed to
pro
vide
an
Publ
ic I
rrig
atio
n A
reas
with
in th
e sa
me
of d
epre
ssio
nap
prop
riat
e ir
riga
tion
area
onl
ym
anag
emen
t pla
n
Tas
man
ia19
89-9
0O
ne y
ear
only
Irri
gato
rs
With
inN
one
App
licat
ion
Tra
nsfe
rs
Non
e ch
arge
din
Win
nale
ahon
lyW
inna
leah
appr
oved
onl
yar
rang
ed b
yin
tria
lIr
riga
tion
Irri
gatio
nif
con
side
red
agen
cy o
nly
Sch
eme
Sch
eme
only
to b
e in
bes
t int
eres
tof
the
sche
me
a N
orth
Ade
laid
e Pl
ains
Sour
ce:
Sub
mis
sion
s

WATERENTITLEMENTS
141
Prices for water entitlements recently auctioned in the St George and Goondiwindi regions inQueensland were $300 to $600 per ML and $310 to $650 per ML respectively. In Victoria, anauction of 2000 ML of water from the River Loddon in 1988 realised prices of between $175 perML and $775 per ML. In March 1991, an auction of 6000 ML of new entitlements in Gippslandrealised between $160 and $200 per ML.
At the draft report hearings, irrigators and others criticised the Commission’s use of the value ofwater entitlements as an indicator of irrigators’ capacity to pay more for water.
One argument was that these values relate to the most efficient irrigators, rather than to theirrigation sector as a whole. For example, the New South Wales Irrigator’s Council said that:
There may indeed be some instances where prices paid for the permanent transfer of water entitlements mightsuggest that higher water prices can be afforded by a particular purchaser. But this should not be taken asevidence of the levels of charges that the rank and file irrigator can afford.
Another argument was that prices for small parcels of water do not reflect the general value ofwater. The Rural Water Corporation (RWC) in Victoria said that the value of water:
... depends not only on the demand situation but also the supply. 6000 megalitres is really quite a small amountof water to auction. If it were 60 000, the prices wouldn’t be the same.
Others said that prices for water transfer often reflect the need for small parcels of water to finish aparticular crop. For example, the Murray Irrigation and Districts Management Board argued that:
It’s worth paying a couple of hundred dollars per megalitre to finish a crop that you would have lost ... you canafford to pay a fair bit for those last couple of megalitres and it doesn’t really reflect the value of water.
Further, many argued that the value of water will vary between regions and across crops.
As the Commission acknowledged in the draft report, caution is required in using the value ofwater entitlements to indicate irrigators’ capacity to pay higher prices across the board. The currentvalue of water entitlements varies considerably between regions reflecting such things asdifferences in crops grown and the underlying viability of irrigated agriculture. To some extentthese differences are due to the absence of TWEs in the past. With a system of freely operatingwater transfers in place, geographical and technological constraints, along with restrictions ontransfers to limit environmental effects, will prevent equalisation of the value of water entitlements.
There will also be situations when small quantities of water are needed to meet urgent short termrequirements. As such situations are likely to coincide with high water demand, the high pricesobserved for transfer may not indicate ‘typical’ or average willingness to pay for additional water.

WATER RESOURCES& WASTE WATERDISPOSAL
142
However, these qualifications do not undermine the general proposition that some irrigators valuewater over and above the price charged for its provision. The question is one of degree rather thanprinciple. Indeed, irrigators’ perception that prices for water entitlements do not indicate capacityto pay, can in part be attributed to past constraints on transfers which have precluded water flowingto those irrigators who derive the most value from it. As trade in water develops, the value ofentitlements will increasingly become a more reliable indicator of capacity to pay higher prices.
While higher prices for irrigation water would reduce the value of a water right to an irrigator, inthe Commission’s view, pricing reform is unlikely to render water rights valueless. Indeed, ifprovision is made to allow water transfer from irrigation to other uses (see below), the value ofwater entitlements could conceivably increase.
8.3 Improving the system of water entitlements
There is widespread support for a system of TWEs in the irrigation sector. For example, theAustralian Irrigation Council said that:
[It] strongly supports the emphasis given by the Industry Commission to the adoption of transferable waterentitlements. Efficiencies in management and use of water will increase as the practice in more widely adoptedand the real value of water is realised. Sustainable use practices become more attractive when the returns fromefficient use are high.
Recent moves to permit water transfer have produced modest efficiency gains. The DWR in NewSouth Wales estimated that since their introduction in 1983, TWEs have increased the value ofirrigation output in that State by $42.5 million, with an annual peak of $17 million in 1987-88.Gerrish (1984) estimated that the transfer of 1 per cent of allocations in Victoria would increaseirrigated output by $2.5 million in that State each year (in 1990 dollars). The Australian Bureau ofAgricultural and Resource Economics (1991) estimated that the more widespread use of transfersin the Murray-Darling Basin would increase output by around $40 million annually.
However, there is much that can be done to improve the current TWE arrangements.
Permanent transfer
Transfers of water on a temporary basis can bring efficiency gains. But uncertainty about theavailability of that water in future seasons will constrain transfer and hence the efficiency gainsavailable under a system that allows only temporary transfers. This is reflected in the fact that theprice paid for temporary water transfers in New South Wales has been considerably lower than animputed annual price of permanent transfer. For example, using a discount rate of 10 per cent, aprice of $300 per ML for permanent transfer equates to an annualised value of $30 per ML. This

WATERENTITLEMENTS
143
compares to the $2 to $4 per ML commonly paid by irrigators for a temporary entitlement. Theredistribution of production within the irrigation sector which accompanies permanent transfer islikely to deliver much larger gains than have so far been achieved through temporary transfers.This is not to deny the benefits that temporary transfers can bring. It is important to have bothavenues available.
A further benefit of permanent transfer is that it provides farmers with greater flexibility in theiroperations. For example, if irrigation activity becomes less profitable, irrigators have the option tosell part of their entitlement and convert the capital into other farm investments. The ability to sell‘excess’ water will also reinforce the incentives for irrigators to introduce more cost efficientirrigation practices such as drip systems.
With permanent water transfers, a marginal irrigator can convert to dry land farming withouthaving to buy new land or losing the value of the water allocation. A system allowing permanenttransfer provides ‘compensation’ to those vacating irrigation activity. However, given that theintroduction of permanent water transfers is likely to result in a one-off fall in the value of irrigatedland, it is important not to overstate the value of such ‘compensation’. In effect, the value of the‘compensation’ provided will principally reflect the difference in the value of the water to the buyerand its continued use by the seller.
Permanent transfers may also facilitate the retirement of saline or waterlogged irrigation land.1
Most irrigators support permanent transfer. The Australian Irrigation Council said:
Both temporary and permanent transfers of water entitlements have a place in developing more efficient use ofwater and recommendations proposing that permanent transfers be introduced to all irrigation systems aresupported.
The First Mildura Irrigation Trust went even further suggesting that:
The Trust fully supports this recommendation but would go further. The commodity pricing aspects of waterdistribution should permit growth of purchase, lease, put and call options, spot and futures markets ... subject toauthority having input into and approving the transfer. Only in this way can the Trust and other WSDs utiliseasset infrastructures to deliver a commodity with an independently verifiable marketable value, so that the Trustwill in turn have a marketable value which growers and other investors may look to for capital appreciation ordividend income.
The benefits from permanent transfers do not come costlessly. The administration of waterentitlements becomes more complex given, for example, the need for arrangements to moderate orprohibit transfer in circumstances where there could be adverse ‘downstream’ or environmentaleffects. At least until such time as adequate environmental regulations are in place governing theuse of water generally, transfer should be subject to restrictions which would prevent the use of the
1 It may be desirable to retain some water for environmental purposes.
WATER RESOURCES& WASTE WATERDISPOSAL
144
water in environmentally damaging ways. In some instances, it may even be necessary to prohibitwater transfers to areas already badly affected by salinity and waterlogging. As documented inTable 8.1, various restrictions apply to transfers in most States to cater for such effects.
Another concern is that the permanent transfer of water away from a particular region could add tothe costs of those remaining in an area. For example, capital costs would be spread among fewerirrigators. The Australian Irrigation Council argued that a capital contribution to those irrigatorsfrom the sale price may be an acceptable way to deal with this effect.
However, a similar effect arises even without permanent transfers where some irrigators convert todry land farming. The issue is a more general one -- how to facilitate adjustment in the irrigationsector. The Commission’s proposals in Chapter 7 for the privatisation of water distribution assets,would encourage irrigators to take a collective view on the future viability of their system at thetime the transfer of ownership occurs. This should help to promote orderly adjustment. With apermanent transfer system in place, adjustment difficulties will be eased by the returns on the saleof entitlements.
Arrangements for the transfer of water should also extend to groundwater. To date, only SouthAustralia has made provision for permanent groundwater transfer. New South Wales permitstemporary transfers.
The arguments in favour of permanent groundwater transfers are the same as for surface water,namely, that it helps to ensure that the water is used by those who value it the most. Additionalflexibility could be achieved by introducing mechanisms which would allow for the temporarysubstitution of surface water rights by equivalent volumes of groundwater. In some places it mightbe appropriate to encourage groundwater use in order to create air space and draw down watertables or reduce pressure in deeper aquifers. Environmental regulations on groundwater transfersshould be similar to those applying to the transfer of surface water.
Careful groundwater monitoring of hydrological conditions will be of particular importance forinter-basin transfers. In the North Adelaide Plains, where current allocations of groundwater arethree times greater then recharge rates, transfers can only be made away from the central core ofthe depression. Also, as noted above, transfers are subject to a reduction in the volume ofentitlements.
Permanent water transfers should be introduced in all irrigation systems, for bothgroundwater and surface water. Where feasible, provision should be made to allow forpermanent transfer of water between schemes.

WATERENTITLEMENTS
145
Intersectoral transfer
The benefits of allowing the transfer of water to other sectors are likely to exceed those from theintroduction of permanent transfer within the irrigation sector. Given the costs of augmentingsupplies in many urban areas, transfer of irrigation water to cities may provide major benefits. TheVictorian Government has pointed to the potentially large benefits of allowing water transfers fromthe irrigation districts to metropolitan Melbourne:
Most Victorians don’t realise that nearly 80 per cent of Victoria’s water use occurs in irrigation areas, mostly innorthern Victoria. The majority of this water is sold to irrigators at about $16 per megalitre.
Less than ten per cent of Victoria’s water use occurs in the Melbourne Metropolitan area. The price for an extramegalitre of water in Melbourne is $570 ...
The financial, social and environmental costs of [developing new water sources to meet growing demand] ... areenormous. Probably close to $60 billion in the cost of building new dams alone ...
Bolte’s divide has cost Victoria hundreds of millions of dollars to date in extra costs. (Crabb 1991, pp 3-4)
Of course major capital investment would be required to deliver water to Melbourne from north ofthe divide. Nevertheless, the differences between the price of water in Melbourne and northernVictoria indicate the potential gain from transfers. Large transfers to the cities could also reduceproblems of waterlogging and salinity in irrigation areas.
Allowing transfers between sectors could also facilitate the use of water for environmentalpurposes. Indeed, the Commission sees this initiative as crucial if efficiency and sustainabilityissues are to be integrated. While pricing reform has an important role to play in improvingenvironmental outcomes, providing the environment with rights to water offers the prospect ofgreater certainty in controlling environmental effects. However, as discussed in Chapter 9, therewould be a number of important implementation issues, including the need for a ‘sponsor’ withresources to acquire entitlements on behalf of the environment.
Controls similar to those applying to transfers between irrigation systems would be required toensure that intersectoral transfers do not have adverse environmental or ‘downstream’ effects.Integrated catchment management committees could give consideration to the impact of proposedtransfers (see Chapter 10).
Although some irrigators acknowledge the potential benefits from transfers between sectors, thereis concern about the impact on rural communities. The Australian Irrigation Council said that:
The transfer of water entitlements to other sectors is supported provided that the vendors and their localcommunity of interest receive a genuine compensation sufficient to cover all the losses in a broader context.
WATER RESOURCES& WASTE WATERDISPOSAL
146
The much higher value of water in urban areas would mean that rural communities would becompensated for reductions in irrigation activity. Adjustment in the irrigation sector is a necessaryoutcome of more efficient pricing and allocation of water. Adjustment problems are best dealt withdirectly rather than by putting artificial constraints on the adjustment process.
Arrangements to allow the transfer of water from irrigation to other uses should beimplemented in all States.
The denomination of water entitlements
Release sharing
In all States water entitlements are denominated in terms of ‘release shares’. Release sharingdefines entitlements in terms of a notional volume of delivered water. However, whether there issufficient water to provide that allocation in any year depends on both available supplies and thelevel of demand. It is up to the operator of the storage, or other source of irrigation water, todecide the amount of water available for licence holders in any season and the amount to be carriedover, bearing in mind such things as seepage and evaporation losses. Thus, historically basedsecurity of supply indicators are typically attached to water entitlements.2
Release sharing provides few incentives to conserve water. This is because, as currently practised,it does not allow users to carry-over unused entitlements for future use. Water which is carriedover is shared among all users of the storage in the following year. The benefits of responsiblerationing by one user are appropriated by other users. According to the DWR, the current processof release sharing in New South Wales operates to redistribute water underuse before the end of theseason. The DWR said that:
In the Lachlan, Murrumbidgee and Murray River systems in particular, the long-standing practice of DWRincreasing allocations progressively throughout the season to redistribute under-use by some irrigators ...precludes the operation of what could be a legitimate and effective transfer market.
Release sharing is therefore likely to contribute to water wastage, overwatering and the relatedenvironmental problems.
The other major problem with release sharing is that an individual’s security of supply is affectedby the number of the licences issued and, in some circumstances, by the actions of other users. Inheavily committed storages, the issue of new licences is a major concern of irrigators. TheNational Farmers Federation said:
2 For example, a 70 per cent security level means that an irrigator can expect to receive the full allocation of
water in seven years out of ten.

WATERENTITLEMENTS
147
The viability of ... investments should not be at the mercy of an irresponsible government, prepared to satisfyfurther applicants by resorting to over-allocation of present resources ... The fear is that they [the government]will take the easy but irresponsible course of meeting demands for water by ... stretching the present resourcesbeyond their reasonable limits.
The Salinity Program Advisory Council argued that existing rights to water should be protected andnoted that:
The recent investigations into Melbourne’s future water needs has identified the Big River as one of the mostsuitable sites for diverting 100 000 ML per year to sustain Melbourne’s growth. This water is currently beingused by irrigators, town suppliers and the environment.
It will not be new water and if the water is to be diverted then Melbourne Water should be required to pay marketvalue or opportunity cost to the present users.
More generally, a number of participants expressed concerns over the amount of discretion thatgovernment exercises in relation to water licences. The Condamine-Balonne Water Committeeargued that the ability of government to change licensing policy without compensation means thatthere is not much accountability involved.
Continuous accounting
Within the confines of the release sharing system, incentives to conserve water can be providedthrough a continuous (long term) water accounting system.
This system already operates on a limited scale in some parts of Australia. In the northernirrigation valleys of New South Wales and Queensland irrigators are permitted to carry-over a partof their entitlement into the next season. However, carry-over has been limited to avoid thepossibility of dam capacity being exceeded. Also in several areas of South Australia, groundwaterusers are able to carry-over a part of their entitlements.
Victoria and New South Wales now apply continuous accounting to water from the River Murray.This allowed the New South Wales Murray region irrigators to access 50 per cent of their 1992-1993 allocation during the 1991-1992 season. So far provisions have not been made to allow forthe carry over of unused water.
There is considerable support for continuous accounting among irrigators. For example, theAustralian Irrigation Council said that:
The introduction of continuous accounting of water allocations will tend to encourage the efficient use ofresources. The current release sharing systems can tend to reward the wasteful user at the expense of the prudent.Allocation systems assume that the volume of water required to irrigate a particular hectare of crop is constantand does not vary from year to year. ... Significant economic on-farm gains are available if continuous accountingallows carrying forward of unused allocation or limited borrowing from next year.
WATER RESOURCES& WASTE WATERDISPOSAL
148
Capacity sharing
While continuous accounting would provide greater incentives to carry over unwanted water, asdiscussed below, this system would not always be fully efficient in this regard. There remains theproblem of attenuation of supply security through the issue of new licences.
Capacity sharing is a different way of specifying water rights. The Victorian Water Act providesfor capacity sharing, but the conversion of release shares to capacity shares has not yet occurred.
Under capacity sharing each owner of a share has a right to water at the source rather than at thepoint of delivery as is the case with release sharing. By estimating net inflows (ie inflows minusseepage and evaporation losses) the capacity share holder would be able to estimate futureavailable water supply.
Capacity sharing resolves the problem of reduced supply through the issue of new licences. Quitesimply, it is not possible to allocate more than 100 per cent of a storage.
Advocates of capacity sharing claim that, in contrast to release sharing, supply security is notinfluenced by the decisions of other users of a storage to carry over water etc. Further, they suggestthat the system provides benefits through reducing the decision making functions of reservoirmanagers. For example, the Centre for Water Policy Research said:
It [capacity sharing] provides users with clear information on the probabilities of future supply. ... Under releasesharing, users need to know the release policies ... of the reservoir managers in order to estimate supplyprobabilities.
The Commission’s view
In the Commission’s view there is a need to modify the current system of property rights for waterto ensure that, as far as possible, those who choose to carry over water are able to reap the benefitsof that decision. This is an important part of improving the general security of supply attached towater licences.
Continuous accounting would go a long way to meeting this requirement, although in somecircumstances, it would be less than fully efficient. For example, where carry-overs cause damoverspill, individual licence holders may not receive even their full nominal allocation in thesubsequent season.
This attenuation of water rights due to the actions of others increases the difficulty and, therefore,the cost to users of managing risk. Such attenuation of rights is less of a problem under capacitysharing.
However, the New South Wales system of ‘high’ and ‘low security’ licences could provide greatersecurity to holders of ‘high security’ licences than a simple capacity sharing system. Under thatsystem, two security levels are available to private diverters, industries and towns drawing waterfrom regulated rivers. ‘High security’ entitlements are serviced ahead of ‘normal security’

WATERENTITLEMENTS
149
entitlements. Rather than simply receiving a known share of storage capacity, ‘high security’licence holders would know in advance in most years exactly how many megalitres of water theywould receive. Of course this increased security is achieved at the expense of reduced security fornormal licence holders.
This illustrates that there are a number of ways of dealing with security of supply issues. Thesituation is further complicated by the impact of allowing expanded trade in water. Trade in watermay go a long way to overcoming the problems inherent in even the simple release sharing model.An expanded system of TWEs would provide increased opportunities for users to deal withfluctuations in security by buying and selling water. Thus, the importance of carry-over provisionsmay diminish. Of course, this additional instrument for managing risk has its drawbacks. Forexample, greater security of supply may come at the cost of less certainty about water prices. Theprice of water on the transfer market is likely to fluctuate with climatic conditions.
Nonetheless, given an expanded tradeable water rights system, the Commission is not convincedthat a shift to capacity sharing is warranted at this stage. In systems where supply is relativelysecure, administrative costs would clearly mitigate against change. As the RWC stated:
In many cases, the additional benefits don’t ... justify the additional cost, time and effort not only initially butoperationally from that point on of keeping the records necessary to ensure the system [of capacity sharing]works. ... Ninety per cent of the benefits can be gained without going to that degree of precision...
Where supply security is more of a problem, it is not clear whether it would be practical to operatecapacity sharing at the individual irrigator level even if the in principle case for its introduction wasstrong. Thus, if the implementation of continuous accounting within the release sharing system,possibly supplemented by high security licences, proves to be inadequate in fully committedsystems, then more work will need to be done before capacity sharing could become operational.
Continuation of the release sharing system would mean that government policy towards the issue ofnew licences, where supplies are fully or close to fully committed, would remain an issue.
It is desirable that the responsible water authority make clear its policy on new licence applications.Any abuse of the flexibility inherent in the current arrangements will tend to undermine thedevelopment of markets in water and the efficiency gains those will deliver. Concern about theissue of new licences might also encourage farmers to shifts into crops which can withstand morevariation in water availability, again with resulting efficiency losses.

WATER RESOURCES& WASTE WATERDISPOSAL
150
States should introduce continuous accounting within the release sharing system. In systemswhere security of supply is an issue, States should consider whether capacity sharing wouldprovide a superior form of risk management.
8.4 Auctioning of water entitlements
Water entitlements have been auctioned in Victoria and Queensland.
Under an auction system, water will be purchased by those who value it most highly. Thusauctioning ensures that water is directed to its best possible use. Where an effective system ofTWEs is in place, an efficient distribution of water will also be achieved even if initial entitlementswere allocated free of charge.
The major advantage of auction or tender is that the value of new water entitlements is captured bygovernment. Apart from equity considerations, up front charging for new water supplies willfurther constrain investments in infrastructure which have little prospect of providing thecommunity with a reasonable return.
In its draft report, the Commission proposed that all new supplies be auctioned. There was inprincipal support for this draft recommendation, but a number of participants drew attention toimplementation issues. For example, Melbourne Water said:
[The] recommendation is supported with the provision that the infrastructure be adequate to accommodateadditional impacts of supply. This will include both land capacity, eg. salinity and water logging as well as thetransfer and distribution capacity.
The Salinity Program Advisory Council referred to a recent auction in Victoria where water wasbought for use in an area already subject to salinity. It said that:
... there should be some small environmental-type study made of areas that are going to have water on them forthe first time, because these people will be looking for some sort of drainage, subsurface drainage assistance inthe very near future.
Some environmental guidelines already apply to auctions in Victoria. For example, buyers have todemonstrate that drainage is adequate to manage the increased water use.If environmental controls governing water use as a whole were adequate, there would not be theneed for special regulations covering auctioning of water. Auctioned water would be treated thesame as any other allocation. However, in the same way that environmental controls on watertransfer are currently required, controls on auctioned water to prevent its use in environmentallydamaging ways are also necessary.

WATERENTITLEMENTS
151
The auction system could also be extended to allow bulk water suppliers to buy and sellentitlements on behalf of individual irrigators. The objective would not be to appropriate the valueof existing entitlements but to allow central agencies to act as water brokers.
Entitlements to any new water supplies should be auctioned and the scope for the bulk watersuppliers to act as brokers of existing supplies should be investigated.

ENVIRONMENTALPRICING ANDREGULATION
9.153
9 ENVIRONMENTAL PRICING AND
REGULATION
Australia faces a host of water-related management and environmental problems. Salinity andwaterlogging are major problems in many of Australia’s irrigation districts. There are also drainageproblems in parts of tropical north Queensland. Land degradation due to, amongst other things,salinity and waterlogging, costs the Australian community as much as $600 million annually (DPIE1989). In the Murray-Darling Basin, lost production alone is estimated at about $65 million peryear. DWR NSW transcript
Toxic blue-green algae outbreaks in recent years have focussed community attention on theconsequences of nutrient contamination of inland water bodies. Nutrient contamination andsedimentation due to, amongst other land uses, sugar cane cultivation, are causing damage tocoastal ecosystems and possibly to the Great Barrier Reef. In the major population centres theproblem is disposal of sewage, trade waste and stormwater without excessive impacts on theenvironment and at reasonable cost. Groundwater contamination is yet another problemconfronting not only country water users, but also residents in cities such as Perth and Adelaide.
Natural phenomena have made these problems more difficult to manage. For example, thegeological characteristics of the Murray-Darling Basin make it prone to salinity and waterlogging.The extent to which nutrient contamination of rivers leads to algal blooms is heavily dependent onriver flows and water temperature, and hence on climatic factors. The impact of sewerage effluenton the environment depends much on the topography and geography of inland localities and, whereocean disposal is used, on the pattern of water currents.
The cost of overcoming these problems and enhancing water quality is significant. Large sums ofmoney are being invested to ameliorate salinity and waterlogging in many of Australia’s irrigationdistricts and to overcome the adverse impacts of the degradation of water resources on agriculturalproducers, urban water users and the environment. The CSIRO said that the Australian WaterResources Council (AWRC) Water Technology Committee has estimated that new investment ofmore than $2.5 billion in urban sewage treatment assets would be required to provide limitedimprovements in nutrient removal. The Sydney Water Board (SWB) alone is to spend $600million over the next 10 years to improve the quality of the effluent discharged to the Nepean-Hawkesbury River system.
To offset these costs it is all the more important to achieve the savings in service provision costsidentified in earlier chapters. Furthermore, it is important to ensure that net benefits accrue to thecommunity from expenditure on environmental enhancement and that alternative ways ofimproving environmental outcomes are investigated.

WATER RESOURCES& WASTE WATERDISPOSAL
9.154
Issues relating to water service provision and wider resource management cannot be divorced.This is reflected in the terms of reference for this inquiry which ask the Commission to look atfactors which lead to inefficient and unsustainable resource use.
The water sector can be viewed as comprising two forms of capital -- natural capital represented bythe basic resource, and the man-made capital used to harvest and provide water services. Thebenefits derived from the water capital stock will be influenced by the conditions attaching to theownership and use of that capital -- that is, the allocation and/or specification of ‘waterentitlements’ (see Chapter 8).
The key issue is how to ensure that the provision of services and questions of broader resourcemanagement are considered in an integrated framework so that all the benefits and costs ofparticular water use practices are taken into account. However, water resources managers face adifficult task in identifying and quantifying the environmental benefits and costs associated withwater use.
Water use practices have implications for land use (and vice versa) and cannot be seen in isolation.As the Victorian Government remarked:
[In] contemporary styles of water planning ... the environment is treated in an holistic way and planners can startto understand the diverse links which are crucial to the survival of most species. The environment can no longerbe treated as a piecemeal externality, to be dealt with only after a deal to develop has already been sealed.
The many scientific and technical issues associated with problems such as algal blooms and salinityfall outside the Commission’s area of expertise, as do the technical considerations associated withwater quality standards. However, there are important links between environmental outcomes andthe arrangements governing the provision of water, sewerage and drainage (WSD) services.Indeed, a major thrust of this report is that efficient pricing of water services can make a substantialcontribution to the sustainable use of water resources.
This chapter looks at the complementary roles of market forces and regulation in promotingsustainable water use. It examines the operation of some specific market-based initiatives such aspollution taxes and tradeable discharge permits, and sets out some procedural principles for moreco-ordinated and efficient development of environmental regulation. Better monitoring andenforcement of that regulation is also considered.
ENVIRONMENTALPRICING ANDREGULATION
9.155
9.1 Sustainability and water use
General background
The issue of sustainability or sustainable development has been widely examined since it wasbrought to prominence by the Brundtland Report (WCED 1987). A recent focal point for debate inAustralia has been a Cabinet discussion paper (Commonwealth of Australia 1990) which formed astarting point for Working Groups to examine ecologically sustainable development in ninedifferent sectors of the economy. The definition of ecologically sustainable development adoptedby the Working Groups was:
Ecologically sustainable development means using, conserving and enhancing the community’s resources so thatecological processes, on which life depends, are maintained, and the total quality of life, now and in the future,can be increased (Commonwealth of Australia 1990).
Some participants said that sustainable resource use is a question for scientific resolution.However, as definitions of sustainability and sustainable development abound, it is unlikely that auniversally accepted definition will be found. But without a clear definition, irrespective ofscientific advances, it will not be possible to conclude with certainty whether a resource is beingused sustainably. Thus, much of the value in the concept lies in the process of examination anddebate that it engenders -- highlighting relevant information and analysis, examining communityvalues and trade-offs that need to be considered, and choices that must be made.
While information and analysis are vital to support the decision-making process, in theCommission’s view, sustainability is an ethical issue, which can only be resolved throughcommunity awareness, debate and decision -- in other words through the political process.
Much of the debate on the sustainability of water use concerns the difficulty of taking the needs offuture generations into account. Future generations are affected by current decisions to consume orconserve resources but have no way of expressing their preferences. A market system driven bythe preferences of the current generation would be deficient in allocating water resources betweencurrent and future generations. That said, there are a number of practical, market driven initiativesthat can be taken, which, while not necessarily addressing the prescription for sustainability laiddown by the Brundtland Report and others, will lead to improved environmental outcomes. Theseare among the matters on which the Commission has focussed.
Market failure and the environment
To date, regulation has been the primary method for pursuing environmental objectives. Apartfrom the difficulty of catering for future generations, where the environment is concerned, marketswill not always reflect the current generation’s preferences or willingness to pay, or ensure that

WATER RESOURCES& WASTE WATERDISPOSAL
9.156
those who damage the environment are required to pay for that damage. However, marketmechanisms can sometimes complement regulation in promoting better environmental decisions onwater use.
External effects
The efficient operation of markets requires, amongst other things, that those who impose costs onothers through, say, polluting activity, pay for the damage they cause. Some forms of waterpollution can be traced to individuals or firms -- for instance industrial effluent, or effluent fromfeedlots.
However, in cases of non-point sources of pollution -- for example agricultural run-offcontaminated with salt, fertiliser, or pesticides -- it is extremely difficult to isolate the contributionof individuals, much less recoup the costs. The fact that such ‘externalities’ are not reflected inprices means that, without some other form of control, there will be excessive polluting activity.Provision of water for natural ecosystems
An area in which the market is likely to be deficient is in the provision of water for themaintenance of natural ecosystems. This is because the benefits of these ecosystems extendbeyond particular individuals and also because future generations will benefit from theirmaintenance. These benefits are not reflected in market prices.
Yet, natural aquatic ecosystems play an important role in pollution control and in maintaininggenetic diversity. Significant benefits can be lost if streams or wetlands are allowed to dry upbecause of changes in either quantity or quality of flows due to upstream dams or other relateddevelopment. The Riverland Fishermen’s Association, the Southern Fishermen’s Association andthe Lakes and Coorong Professional Fishermen’s Association (Sub 144 and 145)said that reducedfresh water flows reaching the mouth of the Murray River at critical times during the year havedeleterious effects on fish migration and breeding. According to some commentators, changes inthe seasonal patterns of flows in many rivers and tributaries in the Murray-Darling Basin arethreatening the long term survival of nearby forests and aquatic and riparian habitats (Maunsell1991).
However, the effects on the environment of water use are not all negative. As the AustralianIrrigation Council pointed out:
Wetlands, wildlife and recreation benefit from the availability of water which has been stored for irrigation. Sub163.
In the ACT the construction of Lake Burley Griffin created Jerrabombera Wetlands, which havebecome a major habitat for waterfowl and other aquatic life, in an otherwise relatively dryenvironment.

ENVIRONMENTALPRICING ANDREGULATION
9.157
Measurement issues
Some environmental costs and benefits are difficult to identify, let alone value. While a number ofmethods have been developed to value the services provided by the environment, many people areuncomfortable expressing these in money terms. Typifying this concern, the EnvironmentalProtection Authority of Western Australia said:
For many environmental considerations there is no ready way of deriving valuations which can meaningfully becompared with the ‘hard’ dollar costs and prices applying elsewhere in the economy. Indeed, it is doubtful thatthe nominal ‘valuations’ derived can be meaningfully compared with each other to provide ordinal information.(Sub 152)
Some would argue that the value of environmental assets is infinite, making economic techniqueslike cost-benefit analysis irrelevant.
When attempts at valuation are made, future costs and benefits are discounted. This is becausethey are valued from the point of view of the preferences of the current generation, who arepresumed to prefer services now rather than later.
Environmentalists often call for a lowering of the discount rate to zero. This is because positivediscount rates mean that long lasting adverse impacts on the environment are ascribed relativelylow value in present value terms. Of course, positive discount rates have the same effects on longlasting benefits. Some economists, such as Pearce, Markandya and Barbier (1989), argue that as analternative to adjusting discount rates, the rights of future generations should be determined bygovernments. This is their solution to the ethical issues involved in ecologically sustainabledevelopment. Normal project appraisal can then be undertaken within those constraints.
Uncertainty and irreversibility
Uncertainty about environmental impacts means that all resource use decisions are taken in anenvironment of risk. But the consequences of a particular resource use decision can be irreversible.For instance, the construction of dams and reservoirs, the draining of wetlands and contaminationof groundwater aquifers are as good as irreversible. Many would argue that market drivensolutions will not give appropriate weighting to such risks. Indeed, some environmental groupsadvocate an approach that is so conservative as to be almost completely risk free.
9.2 Using markets to secure better outcomes
It follows from the previous discussion that if ownership of rivers and groundwater systems werevested in the hands of self-interested private individuals, unfettered private markets would notgenerate efficient and sustainable environmental outcomes. This provides the rationale forgovernments to involve themselves in water management and environmental matters associatedwith water use.

WATER RESOURCES& WASTE WATERDISPOSAL
9.158
However, governments face a number of problems in ensuring that their intervention results inefficient and sustainable water use. Paramount among these are the very same informationdeficiencies and uncertainties which detract from the operation of private markets. In some cases,imperfect markets may result in better outcomes than imperfect governments.
Accordingly, a mix of market forces and government intervention is appropriate. There is acontinuing and important role for regulation, both in establishing standards and in controllingpotentially damaging water use. But much improvement can be achieved within a marketframework. As the Australian Conservation Foundation (ACF) said:
If our economic policy framework is to begin to change the structure of the Australian economy to accommodate[ecologically sustainable development], considerable changes are required. However fears that such a shift ineconomic policy must involve a move away from a market-based economy are groundless. Rather most of thesechanges involve the formal recognition of those economic costs and values associated with natural resources andthe environment which are currently unaccounted for.
The remainder of this section looks at ways in which markets can be used to improveenvironmental outcomes or to achieve environmental goals at lower cost.
User pays pricing
In previous chapters the Commission has proposed that all water be charged for on a per unit basis.The impact of this proposal will be varied. In the many parts of Australia where residentialcustomers currently receive a ‘free’ water allowance as part of the charge for access to waterservices, this initiative would see a substantial fall in water use. As noted earlier in this report, theintroduction of pay-for-use pricing in the Hunter Valley reduced average water consumption byaround 30 per cent.
In rural areas, there is considerable evidence that the low prices for water have encouragedoverwatering by irrigators. This has had the effect of aggravating salinity and waterloggingproblems. Furthermore, water in excess of plant needs is sometimes applied to flush out salts fromthe root zone. These salts, together with any dissolved fertilisers and pesticides, end up in riversand waterways, exacerbating downstream problems.
Higher charges for irrigation water, combined with payment for water used, will increase theincentive for farmers to invest in water-saving technology and in other means of combattingsalinity and waterlogging. They are also likely to cause some irrigators to leave the industry orchange to dry-land farming.

ENVIRONMENTALPRICING ANDREGULATION
9.159
In turn, reduced consumption will reduce the costs of treating waste water and possibly the level ofenvironmental degradation. Higher prices will also make reuse and recycling more attractive, aswell as provide an incentive for consumers to install water saving devices such as shower roses anddual flush toilets and for authorities to investigate alternative sewage treatment technologies.
Some environmental costs are already incorporated in prices, for instance in sewerage and tradewaste charges. In the future, as work on quantifying and attributing water-related environmentaldamage proceeds, more environmental costs will be reflected in prices for services. This willfurther reduce consumption, with additional beneficial effects for the environment. However,pricing reform may cause some problems. The Australian Bureau of Agricultural and ResourceEconomics (ABARE) argued that increased prices will encourage the retention of water on thefarm for re-use, instead of draining back into the system, with consequent deleterious effects fordownstream uses and natural ecosystems. A suite of measures is therefore required.
As noted above, higher user charges for water would increase the incentives to investigate waterreuse. Treated effluent is already used for the watering of parks, golf courses, and irrigatedfeedlots, and a number of water authorities have established experimental tree plantations. TheHamilton Water Board (in western Victoria) has installed a secondary distribution system to supplytreated waste water for a variety of non-potable uses. A dual water supply system involving therecycling of water for non-potable use is part of the Rouse Hill development in Sydney’s west.Australian Steel Mill Services uses up to 6 ML a day of treated sewerage effluent to cool moltenslag, which can then be used as a construction material.Fin Review Other options are the recyclingof water within industrial premises, and the use of stormwater to establish wetlands and rechargeaquifers.
As noted in Chapter 2, many WSD service providers do not levy specific charges for trade wastedisposal. Also, some local government authorities allow industries to discharge potentially toxiceffluent into drains and local waterways. In 1984 more than 33 000 GL of industrial wastes weredischarged to sewers and drains in Australia (ABS, 1992). The major dischargers were the food,textiles, chemicals and paper industries.
The Commission has proposed that those authorities which do not already have a trade wastepolicy introduce trade waste charges. Apart from ensuring that producers pay fully for servicesreceived, this would have environmental benefits by changing producer behaviour. The BrisbaneCity Council said:
The results [of pricing according to the cost of treatment and disposal] have been varied -- some generators havegone out of business, others have installed their own pre-treatment facilities to substantially reduce the waste tobe treated, others have amended their processes to provide for greatly increased internal recycling.
WATER RESOURCES& WASTE WATERDISPOSAL
9.160
Urban run-off, so far as the Commission is aware, is seldom regulated, and in most places notmonitored. Yet, the heavy metals, nutrients, oil and grease, organic material and suspended solidsin the urban run-off, increasingly pose an environmental problem. In Melboune, urban stormwateris the major source of bacterial contamination and litter in the lower Yarra -- a river whichconsistently fails to meet State Environment Protection Policy (SEPP) standards for swimming.The SWB is examining techniques for charging local councils for their discharges into the trunkdrainage system in the same manner in which it licenses and charges industrial users to dischargeinto its sewerage system.
In existing urban drainage systems it is difficult to identify ‘users’. In most areas drains cross localgovernment boundaries and it is not possible to attribute environmental damage to any particularcouncil when the run-off finally flows into trunk drains, rivers or oceans. The Commission hasrecommended that State Governments should take steps to ensure that local governments areaccountable for run-off leaving their boundaries (see Chapter 7).
Extending current water entitlements
In most States, transfers of water are only permitted between irrigators and, in most cases, only ona temporary basis (see Chapter 8). Such limitations reduce the efficiency with which water isallocated between uses and, in so doing, reduce the potential of trade in water to promote betterenvironmental outcomes.
The lack of permanent transferability in many States (or any transferability in Western Australia)reduces the opportunity for transferring water from highly saline or waterlogged soils to lessdegraded and therefore more productive soils. Also, the opportunities for selling unwanted waterare diminished. This is likely to reinforce the incentives for overwatering inherent in current pricestructures. The Commission has proposed that permanent transfers be introduced in all States.
As discussed in the previous chapter, the current way of denominating rights to water reduces theincentives for irrigators to conserve water. This is because any water savings made by anindividual user will be shared by all other users in the subsequent irrigation season. This is yetanother incentive to overwater. While an expanded system of transferable water entitlementswould greatly reduce this problem by providing a market for unwanted water, the Commission hasalso proposed that continuous accounting, already in place to a limited extent in New South Wales,be extended to other States.
The Commission has proposed that water be transferable to other sectors and uses, including theenvironment.
An example where tradeable water entitlements might help the environment is in South Australia inthe backwaters of the River Murray. Fish and crustaceans have been harvested there since early

ENVIRONMENTALPRICING ANDREGULATION
9.161
settlement. Recreational fishing is also popular. However, the fishing industry in the area isheavily dependent on periodic flooding, in order to provide a habitat for fish breeding andrecruitment. Upstream allocations from the river for irrigation reduce water flows, causing adeterioration in the aquatic habitat, affecting fish stocks. Minimum flow requirements could beestablished and water entitlements allocated. Since this is a matter of maintaining a habitat for anatural resource, the entitlements should probably be allocated to the environment rather than to thefishing industry in the area.
The allocation of water to the environment would entail decisions about who should be responsiblefor holding and allocating environmental entitlements. One option would be resource managers.Where systems are fully utilised, entitlements for the environment should be purchased.Government funding for purchases should be explicit. Such purchases would also provideadjustment assistance to irrigators.
The extension of tradeable water entitlements to environmental uses would not avoid the need forjudgements on the value of environmental uses relative to consumption. Such judgements wouldbe central to the decision on what funds to allocate to the purchasing agency and hence its capacityto purchase water for environmental purposes. That said, a system where an environmental agencycould buy and sell water entitlements would generate a more disciplined approach to evaluating theenvironmental benefits of different water flows.
There is the contentious question of the initial allocation of water to the environment. Someconsidered that the current environmental allocation should be used as a base and that furtherallocations should be purchased from other holders. However, there are currently few formalenvironmental water entitlements in place. The ACF suggested that all currently unallocated watershould be allocated to the environment.
The Victorian Government and Melbourne Water Corporation expressed concern at the dearth ofknowledge about environmental water needs, and the Queensland Government said that:
Whereas consumptive water entitlements can usually be defined in terms of a specific annual volume, anenvironmental allocation could have special delivery or operating requirements such as the flushing of algalblooms from time to time or only making a release at a particular stage of a flooding event. As a result, it isconsidered that it may be difficult to interchange environmental allocations with consumptive entitlements as theymay not be calculated in comparable ways. Sub 201, p. 21
The Commonwealth Department of Primary Industries and Energy, while supporting the concept oftradeable water for the environment, said that the responsibility for developing policy andstructures lies with the State Governments but that the Murray-Darling Basin Ministerial Counciland the AWRC could play co-ordinating roles.

WATER RESOURCES& WASTE WATERDISPOSAL
9.162
The States should formalise water entitlements for environmental purposes. Where systemsare fully, or close to fully committed, water for the environment should be purchased fromlicence holders.
Trades of a slightly different kind could perhaps help resolve competing claims on water fromcatchments. For example, water yields in the Thompson catchment are depressed followinglogging and replanting, because mature trees consume less water than young regrowth. Thisreduces the quantity of water available from the catchment to Melbourne consumers. A studyjointly funded by the Victorian Department of Conservation and Environment, and MelbourneWater Corporation, found that the status quo does not maximise the total value of timber and wateroutputs from the catchment (Read, Sturgess and Associates 1992). The study recommended arange of changes to catchment management policies. Alternatively, such problems could beresolved if Melbourne Water Corporation were allowed to pay timber producers not to log, oralternatively, if timber producers were required to compensate Melbourne users for reduced wateryields. Determining who should be assigned the initial entitlements in such situations would be anissue for government to resolve.
Tradeable discharge permits
Tradeable discharge permits could, in the right circumstances, be used to reduce the cost ofmeeting environmental goals. As far as the Commission is aware, they have not been trialled inAustralia.
In essence a permit system involves setting a quality standard for the whole receiving environmentand issuing or auctioning permits entitling discharge of waste or effluent. The number of permitsissued is set to ensure that the overall standard is met.
By allowing trade in discharge permits, the system can take advantage of the different costs forproducers of reducing discharges. Producers with relatively high abatement costs will gain bybuying permits rather than treating their waste. Producers with relatively low abatement costs willtreat their own waste and sell permits to those whose treatment costs are higher. This means thatthe total cost of meeting the standard set for the receiving environment will be lower than (or equalto) when non-tradeable discharge limits are set for each producer.1
This market-based mechanism does not replace regulation, but rather complements it. For thesystem to function properly, standards must be established and discharges monitored. Also, amethod to allocate permits must be determined. Thus tradeable pollution entitlements are bestviewed as a cost saving initiative operating within the broad regulatory framework.
1 For a formal proof see Pearce and Turner (1990).
ENVIRONMENTALPRICING ANDREGULATION
9.163
Despite their conceptual attraction, the use of tradeable discharge permits has been limited on aworld-wide basis (IC 1991d). Where industries are discharging similar types of waste, or wherethe concern is to control only one type of pollutant, then tradeable permits may be feasible. Buteven with similar substances there can be problems, because the chemical form in which asubstance occurs can affect the damage it causes to the environment. For instance, the Murray-Darling Basin Commission (MDBC) said that the phosphorus in sewerage effluent is immediatelyavailable for algal growth, unlike much of the phosphorus from catchments.
It is not uncommon for industries to discharge a range of complex effluents into a water body, allor most of which need to be controlled. In such circumstances it may be difficult to devise a permitsystem which allows effective trading. One reason is that discharges of any individual pollutantmay be insufficient to support trade in that pollutant. Kimberly-Clark suggested that a way roundthis problem would be to specify discharge entitlements in terms of toxicology. Biological oxygendemand is already used by water authorities as a basis for charging customers for effluenttreatment.
Another reason for the limited use of tradeable permits may be the cost and/or difficulty ofmonitoring discharges and therefore of enforcing the conditions attaching to permits. If permitscannot be enforced, the foundations of the tradeable permit system are destroyed. However,Kimberly-Clark said that, at least for point-source pollution, measurement technology is available.There have been operational successes with tradeable discharge permit systems. The ColoradoState Government instituted a plan to stem discharges of phosphorus into the waters of the DillonReservoir, which included, among other things, trading of discharge entitlements. Trading cateredfor both point and non-point sources of phosphorus discharges (Hahn and Hester 1989).
In Australia the Salinity and Drainage Strategy formulated in 1989 within the Murray-DarlingBasin Commission to manage the Basin’s river salinity, land salinisation and waterloggingproblems, may provide a foundation for future trading in salinity credits. The aim of the Strategy isto reduce the level of salinity at Morgan, South Australia by a net 80 EC (units of electricalconductivity) through salt interception schemes to be funded by the States and the Commonwealth.In return for their contribution, New South Wales and Victoria each receive 15 EC salinity creditsenabling them to discharge saline drainage into the river system. Additional salinity mitigationundertaken by the States, earns extra salinity credits. Penalties will be imposed for salinity levelsabove the agreed baseline.
The homogeneity of salt discharges, and the relative ease of monitoring salt levels, at least at Stateboundaries, suggests that there is considerable potential for trade in salinity credits between NewSouth Wales and Victoria. If the cost of salt reduction varies between the two States, tradingwould reduce the cost of meeting overall discharge targets. A system of intrastate trade in saltcredits is under consideration by the Department of Water Resources in New South Wales.

WATER RESOURCES& WASTE WATERDISPOSAL
9.164
In summary, the scope for using tradeable discharge permits in the water area will generally belimited to circumstances where discharges are relatively homogeneous and where the sources ofthose discharges can be identified and quantified. This is not to deny the potential of tradeabledischarge permits as a mechanism for environmental control. In certain circumstances they maysignificantly reduce the costs of meeting environmental standards.
Governments should investigate the application of tradeable discharge permits.
Pollution taxes
Pollution taxes have been advocated by some as a way of reflecting environmental damage in theprice of goods or services. A pollution tax would charge for all environmental damage. This is incontrast to the ‘acceptable standards’ approach whereby no charge is levied up to the levelprescribed. In this sense, pollution taxes are a form of user pays pricing, although the revenueraised need not be used to clean up pollution. If not used for restoration, it can be viewed ascompensation to the community for reductions in environmental amenity. A number of countriesin Europe have pollution taxes in place.
Application of this approach could see a tax on irrigation water to control the associated salinityand waterlogging problems. In the context of algal blooms arising from eutrophication ofwaterways, there is the possibility of placing a tax on agricultural fertilisers. Other candidates for atax could be pesticides, insecticides or household detergents and washing powders containingphosphates.
However, there are practical drawbacks with pollution taxes. In principle the level of tax should berelated to the damage caused. Yet, estimating damage caused by a particular product or activitywill often be extremely difficult. For example, the MDBC said that local conditions will influencethe extent of eutrophication resulting from fertiliser use. In irrigation areas, where drains areweedy, some of the phosphorus will be taken up by weeds. But in areas of high salinity no weedsgrow in drains and more phosphorus passes through to end up in streams. The amount of damagewill also depend on such things as soil and topographical characteristics, proximity to water bodiesand the nature of those water bodies (eg a fast flowing river vis a vis a reservoir).
With reference to the environmental damage caused by irrigation water, the NSW Irrigators’Council said:
... there [is] firstly the difficulty of readily and reliably tracing the origins of raised salinities observed in streamsor aquifers and attributing these to particular landholders. There [is] also the problem of judging the extent towhich such saline inflows [are] part of natural processes or, on the other hand, how much they [are] caused byirrigation. Then there [is] the difficulty of measuring all salt transfers between one property and another andbetween a property and its nearby drains, streams and groundwaters.

ENVIRONMENTALPRICING ANDREGULATION
9.165
Also to be considered, when judging the impact of saline effluents from irrigated areas, [is] the question of theirtiming. A relatively large salt content may have virtually no adverse impact upon the receiving stream or drain ifit occurs at a time of relatively high flow, whereas a much smaller salt flow at a time of low flow may have amajor effect.
Under an ideal pollution tax, each polluter would have to be assessed individually according to thedamage caused. Even if this were possible, the administrative costs could be high.
A uniform tax, while administratively cheap, does not take account of the differential impacts ofeach polluter. Nevertheless it may provide useful efficiency gains.
For example, Quiggin (1988) modelled the response of irrigators in the Murray River system todifferent sets of incentives, constraints and property rights structures, including a uniform increasein water charges. Effects on salinity, water use, the pattern of land use, and asset values wereestimated. He found that a crude approach of uniform increases in water charges would result notonly in reduced water use and salinity, but also in a better pattern of land use.
The Commission considers that in some situations pollution taxes can assist to reduce the adverseenvironmental impacts on water use and waste water disposal.
9.3 Regulatory reform
While there is scope for greater use of market-based measures to promote better water use practicesand environmental outcomes, there is clearly a continuing need for regulation.
The process of setting environmental standards draws on a range of expertise and must have regardto a range of interests. The following section discusses some principles which the Commissionbelieves should be observed in setting standards for environmental quality and for water resources.The scope for improving the current institutional arrangements is considered in Chapter 10.
The form of regulation
Regulatory measures essentially come in two forms: process-oriented regulation and outcome-oriented regulation. The first specifies how effluents must be produced and reduced, while thesecond specifies the acceptable standard of the effluent.

WATER RESOURCES& WASTE WATERDISPOSAL
9.166
Process-oriented regulation can prescribe or prohibit certain production technologies or the use ofcertain substances, or it can prescribe the equipment to be used for pollution control. Therequirement for secondary or tertiary sewage treatment in various jurisdictions is an example of animportant process-oriented regulation in the water sector. Process-oriented regulation canvariously specify the use of some variant of ‘Best Available Technology’ (BAT), ‘Best PracticableMeans’ (BPM), or ‘Best Available Technology Economically Achievable’ (BATEA).
A major disadvantage of process-oriented regulation is its inflexibility. It does not allow wateragencies to choose the method of achieving the underlying policy goals. Because of thisinflexibility, the incentive for producers to seek out more efficient ways of achievingenvironmental goals is removed. The SWB said:
An example of over-regulation is found in situations where environmental regulators seek to intervene in choicesabout levels of technologies used by suppliers, rather than setting the standards and leaving the managementdecisions as to how this is to be achieved to the most appropriate authority, the supplier.
BAT type measures pay no regard to the cost of achieving environmental enhancements. That is,rather than setting an overall standard after due consideration of the benefits and costs involved,BAT type measures are predicated on the view that the best available technology is necessarilyappropriate.
BATEA does take into account costs, but its focus on ability to pay might mean that environmentalrequirements imposed on producers are set too low. One interpretation is that marginal producersneed not be asked to install pollution abatement equipment. However, the New South Wales EPAdisagreed with this assessment, stating that the basis for determining BATEA is not the capacity ofan individual polluter to pay for a particular technology, but an independent assessment of thecost/benefit trade-offs in a particular environment.
Where there are a number of polluters all discharging the same types of waste, process-orientedregulation is administratively simple and relatively cheap. As noted by the New South Wales EPA,with the equipment in place, the need for monitoring is reduced. There will be occasions when it isthe preferred approach. As the South Australian Government argued:
If ... a regulatory regime is established only on the basis of outcomes, then for every polluter, an assessment mustbe made of the link between the polluter’s processes and the environmental outcomes. When there are a numberof potential polluters whose processes and potential environmental impacts are sensibly similar, then little isserved by repeating this analysis exercise individually for each, only to repeat the determination of the sameanswer. In such cases, process regulation may be an efficient and convenient alternative. In South Australia, thecontrols on wastes from wineries and metal finishers are generally defined on a process basis ...

ENVIRONMENTALPRICING ANDREGULATION
9.167
Similarly, in the case of existing sewage treatment plants, specification of primary, secondary orsome form of tertiary level of treatment may be appropriate. However, there are alternativetechnologies, either already available or in the development phase. One option being considered bythe SWB is to return the effluent to a storage to be treated and recycled as drinking water. Wherenew sewage treatment facilities are proposed, it may be more sensible to specify minimumacceptable discharge standards so that the most cost-effective technology can be selected.
The New South Wales EPA argued that it is impossible for a regulator to set standards and thenignore how they are met. It gave two reasons for this:
• Current pollution control laws prohibit the discharge of any pollutants to receiving watersunless the discharge is licensed. The provision of a licence implies that the regulating authorityhas agreed to the discharge subject to certain conditions. Hence there is an obligation on theregulator to approve of the polluting activity only if suitable practices are followed whichguarantee adequate protection.
• It is impossible for a regulatory agency to mount fully comprehensive audit or compliancemonitoring programs for all the polluting activities it licenses.
However, the Victorian Government said that the tendency for agencies to specify both the resultsand the means of achieving the results makes it difficult to assign responsibility in cases of non-compliance.
The Victorian Government was also critical of state-of-the-art solutions prescribed withoutconsideration of the physical circumstances of the waste or the receiving environment. Forexample, it said such solutions could lead to the prohibition of ocean discharges of secondary ormore highly treated sewerage effluent in favour of land disposal with potentially higherenvironmental costs.
Outcome-oriented regulation, as the term implies, sets water quality goals for the receivingenvironment and then prescribes the quantity or concentration of pollutants which may bedischarged during a certain period.
In contrast to process-oriented regulation, outcome-oriented regulation is based on the relationshipbetween the pollutants discharged and their effect on environmental quality. It therefore targets theunderlying environmental goal more directly. In addition, dischargers have more flexibility in theprocesses used to achieve the regulated standard. That said, circumstances will determine the mostappropriate approach.
Regional variation
Appropriate outcomes will, of course, vary across regions and with local conditions. This isbecause the natural water quality varies region by region and also because the assimilative capacityof the environment is not uniform. For instance, fast flowing rivers are better capable of flushingout nutrients than are wetlands with little water movement. Groundwater aquifers can takehundreds of years to recover from any kind of contamination.
WATER RESOURCES& WASTE WATERDISPOSAL
9.168
It appears that such differences are often ignored in standard setting. For instance, a number ofparticipants said that standards for sewerage effluent discharged into the ocean are unnecessarilystringent in some places and underestimate the assimilative capacity of the oceans.
The Northern Territory Government was concerned about the possibility of national criteria:
... the sewerage outfall to a marine environment from a major city in NSW cannot be "automatically" aligned withdischarge of relatively benign mascerated domestic effluents into our northern waters with its 7 metre high tidalinterchange. The appropriateness or otherwise of the local situation must remain to be judged in light of technicalevidence assembled for the specific issue, and not dictated by some worthy "catchall".
The recent tightening of effluent quality requirements in some regions has resulted in some waterauthorities considering land disposal of treated sewerage effluent. But land disposal may not beappropriate in all areas, for instance where high water tables increase the risk of waterlogging. Insome cases, disposal of tertiary treated sewerage effluent to waterways may be beneficial, if ithelps to maintain flows during dry periods or dilutes other contaminants present.
In looking at alternative disposal methods, costs and benefits need to be properly assessed. Forexample, tertiary treated effluent is for the most part water with a very low concentration ofcontaminants. Transporting large quantities of very dilute effluent for land disposal at somedistance from a treatment plant, rather than into the sea or a river, is costly. As well as the directcosts of transporting the effluent, there may be environmental and disamenity costs from landdisposal. There is also the problem of finding areas which can handle the volumes of effluentinvolved.
The process of standard setting should also recognise differences in community preferences.Where a reduction in economic activity is likely to occur as a result of more stringent standards,those affected through the loss of jobs may prefer to trade lower environmental quality for themaintenance of their livelihood. Of course, this raises the problem discussed earlier of how toaccount for the preferences of future generations. The possibility that other producers orconsumers in the same locality might benefit from tighter environmental control further clouds thistrade-off.
In summary, the desirable form of regulation to control pollution discharges will depend onindividual circumstances. As well as ensuring flexibility in the form of regulation used, it isimportant that there is flexibility to reflect different circumstances.

ENVIRONMENTALPRICING ANDREGULATION
9.169
Setting standards
The need to cater for regional variations in environmental problems is part of the more generalissue of ensuring that the standard setting process takes into account both benefits and costs.
A variety of criteria are used by regulatory agencies to determine standards. For example, inVictoria, standards for water quality are derived from the State Environment Protection Policy(SEPP) for The Waters of Victoria and for Port Phillip Bay, and are based on ‘beneficial use’.2 Thethen Australian and New Zealand Environment Council (ANZEC)3 based its National WaterQuality Guidelines on a set of ‘protected environmental values’, while the New South WalesGovernment has developed a set of ‘protection categories’ for its water resources.
In some cases the costs of achieving improvements in water quality can be very high. For instance,Melbourne Water Corporation said that nutrient standards could become so stringent in Port PhillipBay that it may be forced to construct a new outfall into the ocean at a cost of at least $700 million.There are concerns that more stringent standards are being imposed without sufficient attentiongiven to economic consequences, or to limits set by State Governments on price increases for waterservices. This will make it that much more difficult to increase cost recovery on service provisionto commercial levels, and to provide funding for infrastructure improvements.
There are clearly grounds for such concerns. Many of the regulatory bodies responsible for settingenvironmental standards do not appear to be required to take sufficient account of the costs ofachieving more stringent environmental standards. For example, the Western Australian EPA saidthat while it has an interest in economic matters, it has no economic brief and is not required toreport on economic matters. The Commonwealth Department of Primary Industries and Energysaid that regulatory systems are ‘concerned with environmental conservation and protection as astrategic objective rather than optimising resource use’.
Notwithstanding community consultation on environmental enhancement issues, the community israrely adequately informed on the costs and benefits, nor about the alternative technologiesavailable for achieving desired outcomes. Public consultation on environmental standards isnormally concerned with general policy rather than with environmental standards for specificactivities. For instance, in Victoria the community participates in the development of SEPPs, but
2 The term beneficial use refers to the quality of the environment - in this case a water body - which needs tobe maintained for a particular use. Waste disposal is generally considered to be something from which waterbodies must be protected. Hence, all States (except Western Australia) exclude waste disposal from theircategories of beneficial uses.3 Now known as the Australian and New Zealand Environment and Conservation Council.

WATER RESOURCES& WASTE WATERDISPOSAL
9.170
specific standards are set by the EPA consistent with the SEPP. Water authorities are required toimplement the new standards regardless of the cost. Melbourne Water Corporation said that this isa major problem and that a process needs to be set in place to give the community the opportunityto consider whether it is prepared to pay those costs.
Some participants questioned whether the community is sufficiently well informed about theenvironmental and health effects of many substances to make rational decisions about water qualitystandards. Clearly, if the community is to make informed judgements, it is important thatinformation is made available to allow more knowledgeable and open debate. Governments haverecognised this and a range of policies have been implemented to give effect to this, including ICM(see Chapter 10).
Some agencies go to considerable lengths to gather information on the costs of environmentalenhancement and make it public. For example, the SWB has undertaken a study of willingness topay for various levels of water quality. In another example, the citizens of the Gold Coast wereinformed of the respective costs of ocean outfall versus land disposal of sewerage effluent. TheCommission sees considerable merit in this approach.
Regulators, before setting standards, should undertake an assessment of benefits and costs,including an assessment of alternative technologies. This process should explicitly canvassconsumers’ willingness to pay for improved environmental outcomes. Such analysis would beone input into a decision-making process which would also embrace issues of sustainabilityand intergenerational equity.
In the discussion above the focus was on making standards more stringent. However, as moreinformation becomes available, it may become evident that some standards should be relaxed. Thesame community consultation processes can assist this process.
Of course, community consultation and the pursuit of transparency is not costless. The benefits interms of a better informed community, greater acceptance of government decisions, and improvedenvironmental quality must be weighed against those costs.
Environmental restoration
Many of the standards now being promulgated are designed to assist the process of restoring theenvironment. Such initiatives are being supported by specific works to at least partially restore theenvironment to its former condition. Like any other investment, such projects should only goahead if net benefits result. In earlier chapters, the Commission has gone to some lengths tosuggest ways to improve decision-making on investment to extend WSD networks or enhanceservice quality. Similar disciplines are required for government investment in environmentalrestoration.
ENVIRONMENTALPRICING ANDREGULATION
9.171
However, this raises the question of who should pay. Two principles are relevant. One is thebeneficiary pays principle, the other is the polluter pays principle. Better economic outcomes willusually result from application of the polluter pays principle; that is, the cost of environmentaldamage is borne by those causing the damage. However, it is often difficult to sheet homeresponsibility for pollution to individuals, and impossible where the damage was caused byprevious generations. Where the costs cannot be recouped from polluters, the beneficiaries ofenvironmental enhancement should contribute in proportion to the benefits they receive.
Of course, many argue that it is not equitable to make the beneficiaries pay. The South AustralianFishing Industry Council said:
... the commercial fishing industry ... are essentially victims, and victims ... should not be paying. They wouldnot be expected to pay in the case of common law.
A number of participants said that it is wrong to make the present generation of irrigators pay fordamage caused in the past. The NSW Irrigators’ Council said:
Mitigating environmental damage resulting from the failure of the past New South Wales Governments toconstruct drainage infrastructure to serve some government irrigation distribution systems at the time when theywere first developed must now be accepted as the financial responsibility of the State.
But what happened in the past is reflected in current land values and crop yields etc. The benefitsof environmental restoration will be largely reflected in increased land values through moreproductive land, and higher incomes for landholders. Shifting the burden of environmentalrestoration to the community will therefore amount to a transfer of resources from the communityto the beneficiaries. To the extent that the community benefits, eg in terms of improvedenvironmental amenity and improved water quality, the community -- or governments on its behalf-- should pay. But to the extent that landholders benefit, they should pay.
Making beneficiaries contribute is crucial if assessment of willingness to pay and therefore thebenefits of environmental enhancements are to be correctly assessed. Just as the failure to fullyrecover costs of service provision has contributed to wasteful investment in WSD infrastructure, sotoo would a policy of wholesale subsidisation for environmental works be fraught with problems.
The principle of shared costs already applies in some rural areas, where projects are underway tocombat salinity and waterlogging. Benefits accrue to landholders and also to local governmentauthorities through reduced damage to roads and public works, and to the community throughimproved environmental amenity. This range of beneficiaries is reflected in the funding ofdrainage works and other salinity abatement programs. For example, the cost of the SheppartonIrrigation Region Land and Water Salinity Management Plan is to be shared between the Victorianand Commonwealth Governments (25 per cent each), Local Councils (8.5 per cent) andlandholders (41.5 per cent).

WATER RESOURCES& WASTE WATERDISPOSAL
9.172
Application of the beneficiaries pay principle has seen ‘environmental levies’ imposed in someurban areas in Australia to raise funds for such works. For instance, Sydney households pay anenvironmental levy of $80 a year (for five years), to upgrade sewage treatment plants, clean upbeaches and renovate stormwater systems. This is an appropriate way to finance such works.Specific purpose levies inform the community of the cost to individuals of environmentalenhancement as well as the use to which their contribution is applied. This places greaterdiscipline on agencies to ensure that the environmental enhancement is in accordance with thecommunity’s wishes and that the works are carried out in a cost effective way.
Of course, issues of intergenerational equity and sustainability mean that decisions on whether toinvest in environmental enhancements cannot be based solely on the willingness of currentgenerations to pay for those enhancements. However, an assessment of willingness to pay as partof the investment appraisal process is very important. In particular, it will serve to illustrate theextent of the required benefits (if any) to future generations to justify a project proceeding.
Where action to restore the environment is necessary, it is also important that alternative strategiesare evaluated. The ACF argued that tree planting programs have been successfully used in Israel tocombat salinity and high water tables, but that such strategies have largely been ignored inAustralia. Western Australian research has indicated that there are several fast-growing, high wateruse, eucalypt species, which also give commercially promising yields, making them attractive tofarmers. The Western Australian Department of Conservation and Land Management funded 840hectares of timberbelt sharefarming in 1991 and plans to fund another 1250 hectares of planting in1992 (Bartle, personal communication 1992). The intention is to demonstrate to landholders andthe paper industry that programs to combat salinity can be combined with viable timber stands.
Tax deductions for specific activities is another way to encourage environmental restoration.Friends of the Earth suggested that expenditures to establish natural vegetation strips along riversand watercourses should be made tax deductible. The Income Tax Assessment Act alreadyprovides for immediate deductibility for works that combat land degradation. Because of the linksbetween land use and water quality, some activities aimed at combatting land degradation may alsobe effective in improving water quality. These would presumably already be eligible. TheCommission sees merit in making certain works for environmental restoration tax deductible. Taxdeductibility provides an incentive for landholders to carry out water quality improvement works.It also means that the community bears some of the cost in terms of tax revenue foregone.

ENVIRONMENTALPRICING ANDREGULATION
9.173
Finally, where significant environmental damage is likely to persist for as long as an activity isundertaken, there may be grounds for encouraging shifts in land use. The MDBC said thatsignificant salt load increases are inevitable in the Basin, and that significant land retirement isalready occurring and is expected to continue.
In considering the possibility of phasing out some areas of irrigation, Alexandra (1992) said:
... this would need to be done with due respect for the social implications through the adoption of strategies whichensure minimal disruption. It may well be most efficient to use money now being sunk into salinity managementto assist in the relocation of enterprises such as dairy farming back to the high rainfall areas from whence it wasdrawn with the attraction of cheap water and subsequent production.
The Commission’s proposals for pricing reform and the extension of TWEs would provideincentives for irrigators in highly saline or waterlogged areas to leave the industry.
9.4 Monitoring and enforcement issues
Effective monitoring and enforcement is a necessary part of any pollution control regime. Butmonitoring -- the taking of samples and analysing them -- can be costly and time consuming. Inthe case of pollution from diffuse sources, it can be virtually impossible to determine the source.
Such costs place obvious limits on the degree of monitoring which it is sensible to undertake.Testing for substances which occur frequently, or which are relatively toxic, should be carried outmore often than testing for relatively harmless substances or those not often encountered.
Who should undertake monitoring?
Monitoring of water quality etc is a part of self-imposed performance monitoring for many WSDauthorities. Water authorities need to monitor industrial effluent to ensure that, after treatment, itcomplies with the standards set. Some States, eg Victoria and Queensland, require their waterauthorities to report on compliance with quality criteria guidelines formulated by either the WorldHealth Organisation or the Australian Water Resources Council in co-operation with the NationalHealth and Medical Research Council. In New South Wales, reporting of compliance with theabove guidelines and with effluent discharge licences for sewage treatment works is voluntary.
Without some external monitoring, there would be scope and incentive for authorities to suppressepisodes of non-compliance. Most participants (including some water authorities) support externalmonitoring of performance. The Geelong & District Water Board (GDWB) argued that monitoring
WATER RESOURCES& WASTE WATERDISPOSAL
9.174
should be the responsibility of the authority which sets the standards, but that in-house testing isalso appropriate where in-house expertise exists and because water authorities are responsible forthe environment on which they impact. The ACT Electricity & Water Authority considered thatself-monitoring should be combined with periodic audits by the regulator. The ACF said that itwas appropriate to apply the principle of separation of powers to environmental and financialmonitoring and that it might be desirable for the federal EPA to take on the environmentalmonitoring.
Much water related monitoring requires specialised knowledge. Accordingly, outside the waterauthorities, monitoring generally falls either to some government agency like an EPA or to aspecialist contractor.
Community involvement in monitoring is possible where the task is simple, for example where thepollutant is easy to detect. In 1987, over 300 Victorian schools participated in a pilot program of‘SaltWatch’, in which adults and children collected and analysed water samples from creeks, rivers,streams and bores. In Western Australia, school students are participating in monitoring by takingwater samples from the Swan-Avon Rivers in the Ribbons of Blue Project.
Publishing the results of monitoring
The results of monitoring are generally published in some form, often in annual reports, but thecommunity does not always have ready access. The GDWB said that in Victoria the results ofmonitoring are also published in public notices.
Making public the results of environmental monitoring is likely to improve the community’sknowledge of water-related issues. Moreover, the bad publicity associated with failure to complywith standards constitutes an important discipline on WSD authorities to perform effectively in thisarea.
However, where an authority is consistently meeting standards, the frequent publication of testresults may be a cost with little associated benefit. A blanket requirement to publish all monitoringresults is unlikely to be efficient.
Environmental monitoring by an agency or authority other than the service provider isnecessary to ensure that failures to meet standards are made public. Summary results ofmonitoring should be released in a form readily accessible to the media.
Enforcement
Incentives to comply with standards are generally provided through fines for non-compliance.Some participants argued that penalties for non-compliance are usually not high enough.Infrequent monitoring may make it worthwhile for polluters to risk illegally discharging effluents.

ENVIRONMENTALPRICING ANDREGULATION
9.175
To encourage compliance with standards, penalties for violation should exceed the cost of treatingthe effluent. Penalties should be as high as the expected gains from non-compliance. Accordingly,the less frequent the monitoring, the higher the penalty should be.

RESOURCEMANAGEMENT &OTHER ISSUES
10.177
10 RESOURCE MANAGEMENT AND OTHER
ISSUES
The management of water resources in Australia is characterised by a complex network ofdecision-making across many departments and agencies (see Appendix B), some withresponsibility for specific aspects of water, others with responsibility for land uses not directlyrelated to water but which nevertheless impact on water quality.
Responsibility for water related functions lies with the States and is implemented by both State andLocal Governments. No formal national framework exists for managing Australia’s naturalresources. The main Commonwealth role is to contribute to a national perspective and, at times,seek some complementarity in outcomes. The main mechanism used has been joint State-Commonwealth ministerial councils such as the Murray-Darling Basin Ministerial Council and andAustralian Water Resources Council.
The success of initiatives such as the Murray-Darling Basin Commission (MDBC) suggests thatwith co-operation much can be achieved within the current institutional framework. A number ofthe recommendations in this report, for example national performance monitoring, will similarlyrequire co-operation between the States with the Commonwealth acting in a co-ordinating capacity.This chapter considers some of the problems at the State and Local Government level, where therecontinues to be a lack of co-ordination between agencies involved in land and water resourcemanagement. New initiatives such as integrated catchment management (ICM) can help, togetherwith institutional reforms, education, research and other non-price measures.
10.1 Institutional reform
Over the years, governments have set up a complex network of departments, agencies andauthorities to deal with service provision and environmental issues. Each is likely to have its ownobjectives which in turn can conflict with the objectives of others.
In examining the current institutional arrangements the Commission found that there are somefunctions in water resources management which should be consolidated. In other areas, to avoidconflicts of interest, functions should be separated.
Consolidation of like functions
Participants provided examples of complex and overlapping decision making in watermanagement. The Brisbane City Council said that in excess of 20 authorities and organisationshave some direct responsibility concerning the Brisbane River. Similarly, the Nature ConservationFoundation of New South Wales said:

WATER RESOURCES& WASTE WATERDISPOSAL
10.178
... the Hawkesbury-Nepean is governed by ... 12-plus acts of parliament, nine ministerial portfolios, numerousbureaucracies, ... 32 members of parliament, and 20-plus local governments and something like 160 aldermen andcouncillors. These are all the decision-makers for this one small area ...
The boundaries of authorities providing water services are more often determined by the historicaldevelopment of communities and townships than by the natural watershed and catchmentboundaries. This can be an impediment to environmental management because the activities ofwater users covered by one authority can have adverse effects on users elsewhere in the samecatchment. An obvious example of this is urban drainage. The unco-ordinated nature of urbandrainage systems contributes to the failure of authorities to deal effectively with urban run-off.Because of the links between urban run-off and waste water management it is essential that bothsystems are developed in a co-ordinated fashion. Mechanisms to achieve this were canvassed inChapter 7.
The fragmented nature of water management functions contributes to problems in policy co-ordination, duplication of effort and, on occasion, the absence of effective control. The waste ofbureaucratic resources alone is likely to be considerable, and to this must be added the costs anduncertainties which firms, the public and water, sewerage and drainage (WSD) agencies face indealing with a host of bodies.
Apart from cost reduction, consolidation of like functions would permit clearer specification ofpolicy goals and allow more of the competing considerations to be resolved within fewer and moreresponsible agencies. And policies relating to the use and control of water resources could beintegrated with those relating to land use. A number of water authorities said that they had little orno input or control over development decisions in catchment areas.
Detailing the consolidation necessary goes beyond this inquiry. However, efforts to consolidatefunctions are already being made by the States. For instance, whole-catchment river managementauthorities are being established in Victoria.
The Australian Conservation Foundation (ACF) referred to reforms of natural resourcemanagement in New Zealand. There, a large number of statutes have been replaced by theResource Management Act 1991, and 705 local authorities have been reorganised into 93catchment based regional councils and territorial authorities.
In Australia, further co-operation between the States in environmental matters is foreshadowed inthe Intergovernmental Agreement on the Environment. The National Environment ProtectionAuthority (NEPA) will be established with a Minister from each of the States, Territories and theCommonwealth. Its responsibilities will include:
• establishing nationally applied measures for environment protection; and
• developing national environmental quality standards, goals and guidelines for air and waterquality.

RESOURCEMANAGEMENT &OTHER ISSUES
10.179
Another recent initiative is the National Landcare Program which will bring together policies andprograms for community action on land, water and vegetation issues and encourage communitygroups to develop integrated landcare strategies. (DPIE)It is not clear how this will fit in withexisting ICM programs (see below).
Separation of management, regulatory and service delivery functions
Notwithstanding the need to consolidate bodies with responsibility for like areas of watermanagement and environmental control, the roles of WSD service provider and regulator should bekept separate. Without this separation, conflicting objectives can result in unacceptablecompromises. For instance, the requirement to meet commercial objectives might be met by costcutting in water treatment. Separation is also important to allow independent monitoring.
Many water authorities supported separation of service provision and environmental regulation.The Sydney Water Board (SWB) said:
It is sensible to separate the operator and the environmental regulator providing the environmental monitoringprograms ... are operated appropriately.
The ACT Electricity & Water Authority (ACTEW) said:
Water supply and sewerage bodies should not have responsibility for setting environmental objectives. To havemultiple goals reduces the likelihood of performing well in the fundamental objectives of water supply and wastewater treatment.
Separation of the environmental regulatory function from the service delivery function is not todeny the important role that water authorities should have in the development of environmentalstandards. In particular, it is essential that information on the costs of achieving new standards beobtained from water authorities prior to the promulgation of those standards. Input from waterauthorities into land use planning procedures is also advisable. Some water authorities said thattheir lack of input or control over development decisions in catchment areas has contributed to adeterioration in the quality of water in reservoirs. For instance, the Ballarat Water Board said thatthe Melton Reservoir is affected by significant algal blooms, partly due to the increase in hobbyfarms in the catchment.
The Commission believes that there would be advantages in each State having a central bodyresponsible for environmental regulation. The Western Australian Environment ProtectionAuthority argued that some regulatory functions can be delegated, and that it had found it expedientand appropriate to delegate some responsibilities to the Western Australian Water Authority(WAWA) -- ‘they are the people on the ground in touch with the situation’. However, it said itneeds to maintain separation from WAWA in setting regulations for that body.

WATER RESOURCES& WASTE WATERDISPOSAL
10.180
Whether the water management and service delivery functions should be separated is less clear. Afeature of the reform in New Zealand is the separation of resource management functions withinlocal government from the provision of services involving the use of natural and physicalresources. In New South Wales, a three tier structure is proposed, separating the functions ofresource management, service provision and environmental control. The Victorian approachcombines the resource management and service provision functions but assigns the regulatoryfunction to that State’s EPA. The different approaches reflect different priorities. Total separationis based on the perception that it is best to let the service provider focus on just that. An integratedapproach is based on the premise that there are interconnections between functions which cannoteasily be separated. The Western Australian EPA said that separation of resource management andservice provision could possibly make effective demand management by resource managers moredifficult because the link with consumers would be broken.
Local circumstances and conditions will continue to influence whether or not service provision andresource management functions are combined. At the very least, it is important that the functionsare clearly specified.
Integrated catchment management
The philosophy behind ICM is that the management of natural resources should be catchmentbased. It also incorporates the concept that communities should be involved in determining theenvironmental quality of local water resources and should have a say in how catchments aremanaged to maintain that quality. It accepts the need to balance social, economic and ecologicalissues within the resource management process. It accepts that changes in land use and lifestylescan impact on water quality, and that all interested parties should be represented in decisionsregarding such changes.
Most State Governments are implementing ICM, but only New South Wales, where it is known astotal catchment management (TCM), has enacted catchment management legislation. While thereare differences in approach between the States, all rely heavily on community involvement to helpestablish standards and to participate in program development, implementation and monitoring.Catchment management committees form the backbone of ICM programs. The New South WalesCatchment Management Act 1989 provides that the majority of committee members arelandholders. It further provides that persons with ‘an interest in environmental matters within thecatchment area’, persons nominated by local government authorities, and persons who are officersof government departments or authorities ‘having responsibility for natural resource use ormanagement within the catchment area’ are represented on committees. Individuals can nominatethemselves or others as committee members.

RESOURCEMANAGEMENT &OTHER ISSUES
10.181
In New South Wales any individual or government agency can initiate a committee. The earlycommittees were established on the initiative of government agencies, but the initiative is nowcoming more and more from the community. In Sydney, the SWB has been instrumental in settingup committees, approaching local councils, landowners and other community groups with requestsfor nominations.
The functions of TCM committees include the preparation and implementation (after approval hasbeen given by the Minister) of catchment management strategies. A strategy can identify whataction is necessary, and the agency best qualified to carry it out. For information and research,committees have access to the resources of government agencies. They can apply for funds toimplement strategies.
The New South Wales legislation also provides for Catchment Management Trusts which aresimilar in composition and functions to committees, but in addition they have the power to raisefunds through a land rate levied on all landholders.
In Victoria there is no specific legislation or prescribed procedure for ICM. The VictorianGovernment said that, rather than relying on co-ordinating groups, the Act concentrates onestablishing regional authorities with rating and other powers necessary for the long termmanagement of catchments. Sub 216 Vic GovDespite the absence of a legislative base, there are anumber of local catchment committees operating in Victoria.
Under the Queensland strategy, released in October 1991, existing community action groups areencouraged to promote and adopt an integrated approach to the management of land and water.Where existing groups cannot adequately address such issues, the strategy provides for CatchmentCare Groups to link the activities of landholders, community action groups and governmentagencies. Catchment Care Groups focus on relatively clear-cut issues, providing a forum forcommunity discussion and a means to foster co-operative development of solutions to localcatchment issues. More formal Catchment Co-ordinating Committees will be established underlegislation to address more complex catchment management issues which involve a significantnumber of community groups and government agencies. Catchment management strategies are notlegally binding, but provide guidelines, recommended policies and action plans which landholdersand government agencies are encouraged to use. There is a State ICM Co-ordinating Committee tooverview and guide the development and implementation of the ICM program in Queensland.
The Western Australian Government sees ICM as the prime means of natural resource managementin the State. Existing legislation is used to implement ICM. An Office of Catchment Management(OCM) oversees the process. The Western Australian Government said that although communityinterests are directly represented on ICM groups, local government representation is critical to thesuccess of ICM because of its powers to control land use; in setting catchment objectives, the viewsof some communities outside the catchment may also be relevant.

WATER RESOURCES& WASTE WATERDISPOSAL
10.182
In South Australia, ICM is being implemented as part of a natural resources management strategy.The South Australian Government said that representation of local interests on bodies whichmanage the ICM process is important to avoid the perception that it is ‘the domain of thebureaucrat’.
The Tasmanian Government said that its environmental problems are due not so much to aninadequate legislative framework, but to the failure of resource management authorities todischarge their responsibilities under the legislation. A comprehensive ICM policy is not seen tobe a solution to this problem. Rather, the Government is reviewing the legislation with a view toencourage agencies to more closely co-ordinate land and water use decisions.
The MDBC can be seen as an example of integrated catchment management, where the catchmentextends across State borders. Queensland became a full member on 1 July 1992. The Murray-Darling Basin Salinity and Drainage Strategy was developed after extensive public consultationand has helped to co-ordinate State efforts to control salinity and waterlogging in the Basin. Morerecently, the MDBMC has agreed to develop an Irrigation Management Strategy. Communityconsultation is through a Community Advisory Committee.
Some participants were critical of the way ICM is being implemented. Others said it was too earlyto judge its effectiveness.
The CSIRO was concerned that:
... not enough attention is being paid to the technical viability or efficiency of catchment management programs.There has been a lack of focus on truly worthwhile and achievable environmental improvements, and oftenenthusiastic action has preceded the basic technical work needed to develop viable action plans. Proper technicaland economic analysis is needed in order to avoid inefficient conservation efforts.
The Victorian Government said that water quality is generally declining, particularly as regardsnutrient contamination. The complexity of catchment management is poorly dealt with by the ‘cultof co-ordination’ in which everyone is involved and no-one is responsible:
The best of these [catchment co-ordinating] groups have improved communication between the Governmentagencies and the community groups but they have failed to demonstrate tangible improvements in catchmentmanagement.
The Victorian program is in a very early stage of development, and it is not clear how it will meshwith existing and proposed river management authorities. The Association of Victorian RiverManagement Authorities said it had initiated four of the five catchment management groups inVictoria.
The Ricegrowers’ Association of Australia said:

RESOURCEMANAGEMENT &OTHER ISSUES
10.183
The biggest impediments to [ICM’s] success appear to be the reluctance to recognise and use existingcommunities of common concern and the tendency for Government Departments to want to preserve theirexisting responsibilities and functions in the catchment.
The ACF agreed. It said that although the agencies themselves set up the committees, theirentrenched practices are the greatest impediments to an integrated approach. Of the New SouthWales model the ACF said:
In our view the move in New South Wales has merely added another layer to a confusing set of institutionalarrangements, rather than rationalising the existing institutions.
Melbourne Water Corporation said that there are significant benefits to be achieved from ICM andthat control over the whole of a catchment can prevent upstream users from impacting adversely onthose downstream. The Geelong & District Water Board (GDWB) raised the possibility ofcatchment management authorities taking responsibility for urban drainage.
The Department of Water Resources in New South Wales, while indicating that localrepresentation has been restricted in some large catchments, argued that TCM may assist resourcemanagement in two ways:
• by encouraging a more holistic approach to the management of human activities which enables the complexrelationships between ecological and biophysical systems and processes to be recognised and provided for inall decision-making and management activities. ... The challenge is to get the commitment and resources ofagencies working together on joint policies and programs; and
• by encouraging better co-ordination between resource managers and users -- greater community participationthrough networks addressing natural resource management issues and needs within catchment areas. Thechallenge here is to focus the committees at both a biophysically and socially meaningful scale andrepresentation.
However, it said that restrictions on local government representation have been a drawback. Localgovernment involvement in ICM was also strongly supported by a number of other participants.Land use zoning is a local government function and inappropriate development within catchmentscan impact unfavourably on water quality. The Local Government and Shires Associations ofNSW said that although there are councillors or aldermen on TCM committees, they are notempowered to formally represent local government interests.
Clearly ICM is being implemented in different ways between States as well as within States. Thedifferent approaches may be one reason for the different perceptions about its effectiveness.Because it is so new, and because the problems differ significantly from catchment to catchment,there are advantages in a flexible approach.
In the Commission’s view, ICM is a worthwhile way to involve the community in catchmentmanagement issues, providing that ICM committees have access to adequate information.Representation on water authorities’ boards of management could be helpful.

WATER RESOURCES& WASTE WATERDISPOSAL
10.184
The case for addressing environmental problems from an integrated viewpoint does not conflictwith the argument that separation of responsibilities for environmental regulation, serviceprovision, and regulation and resource management is desirable. The functions of ICM committeesare primarily advisory. They can act as a community watchdog and think-tank, without having thepower to implement changes. If the concept is successful at this level, it could evolve into amechanism for making decisions. Indeed, the MDBC said that ICM can be a success providedcommittees can set priorities on issues to be tackled and governments can delegate decision-making.
It is too early to gauge the quality of policy input emanating from catchment committees, its impacton policy makers, or the cost effectiveness of the process. At this stage, ICM is perhaps bestviewed as an important trial to be modified, as appropriate, as a better picture is gained of itsprecise role.
10.2 Non-price measures can encourage conservation
Pricing reforms are an important part of an overall strategy to encourage the conservation of waterand to address environmental issues. However, pricing reform alone may not be sufficient toensure efficient water use. Indeed, some in the water industry use the term ‘demand management’to refer exclusively to non-price influences on water consumption.
Non-price measures include educational and water awareness campaigns, multiple billing,encouraging the purchase of water efficient appliances by water efficiency rating, the fixing ofleaks, changes in urban planning (eg the use of rainwater tanks) and the planting of low water usetrees, shrubs and plants.
As part of its drive to make residents more aware of the amount of water they consume, theBrisbane City Council encourages residents to read their own meters. To date about 90 per cent of(metered) customers do this. Quarterly billing has been introduced by some water authorities in anattempt to make people more aware of seasonal peaks in their water usage.
The GDWB provided information on a public awareness campaign conducted in conjunction withits progressive implementation of user pays water pricing. The Board said that public awareness ofthe costs of wasting water and of the community benefits to be derived from the new tariffstructures is an essential and complementary part of gaining consumer acceptance of pricingreforms.
In Melbourne, water conservation programs, begun during the 1982-83 drought, have, along withpricing reforms, reduced the annual increase in water use from 2.9 per cent to 2.2 per cent (MWRR1992). However, water use in Melbourne is still growing faster than the population. TheMelbourne Water Resources Review Panel has recommended that Melbourne Water Corporationspend up to 1 per cent of its revenue on a demand management program, involving: education(especially to reduce the use of water on domestic gardens); the promotion of water efficientappliances; and recycling waste water.

RESOURCEMANAGEMENT &OTHER ISSUES
10.185
In the absence of pricing reforms, some attempts to change behaviour through improvingawareness have not been successful. The ACTEW recently evaluated the effectiveness of itslongstanding public education program on water conservation. While public awareness of the needto conserve water has increased, this has not led to a discernible decline in consumption.
Watson, Murphy and Moore, while acknowledging a role for awareness campaigns, found that‘green’ attitudes may inadvertently lead to increased water consumption. This is because theperceived need to maintain an ecological balance will result in efforts to maintain trees andvegetation. While water used for other purposes may be conserved, the use of water to grow plantsand trees will be seen as consistent with other measures to conserve water.
The Master Plumbers & Mechanical Services Association of Victoria referred to the scope toincorporate water saving products and technology at the design stage for houses and officebuildings. It claimed that water used in a 30 storey office building can be reduced by over 100ÿ000KL per annum, or the equivalent of the consumption of about 300 domestic premises. The extradesign and material costs would of course have to be weighed against savings in water use over thelife of the building.
Similarly, the Institute for Science and Technology at Murdoch University pointed to the savingsthat are achievable through use of water efficient technologies such as dual-flush toilets and showerroses. The Institute estimated that there would be a 20 per cent reduction in the waste water goingto treatment plants by shifting to dual flush toilets over a 20 year period. However, with therelatively low price of water at present in many localities, there is little financial incentive to adoptthe technology. For similar reasons (eg climate, planning covenants), rainwater tanks in the ACTare considered to have a payback period of almost 100 years.
In the Commission's view, pricing policies which reflect the costs of supply should be the primarymechanism used to provide information on the value of water. However, at the same time, there isscope for a wide range of complementary activities such as public awareness campaigns to makeknown to consumers the costs of wasting water. Indeed such campaigns may be a necessary part ofpricing reform and may well be the best way to influence the water use practices of those notdirectly affected by pay-for-use pricing. Children, residents of flats without individual meters, andoffice workers are but some examples. The aim of these campaigns should not be to reduceconsumption or to encourage recycling as such, but rather that consumers' decisions on water useare taken with a better appreciation of all the costs involved.

WATER RESOURCES& WASTE WATERDISPOSAL
10.186
10.3 Research and extension
There is a wide range of Commonwealth, State and private organisations involved in water andwater-related R&D. A fairly clear distinction can be drawn between organisations involved in ruralor urban-related water research. The National Irrigation Research Fund (NIRF) estimated thatsome $13 million was spent on generic irrigation research in 1990-91. The Urban Water ResearchAssociation of Australia (UWRAA) estimated that between $20 million and $40 million is spent onR&D into urban issues and technologies.
The Land and Water Resources Research and Development Corporation (LWRRDC) is the mainbody responsible for funding and co-ordinating R&D activities in relation to Australia’s land, waterand related vegetation resources. Its focus is on funding research which impacts on primaryindustries. The Corporation’s activities are funded solely by the Commonwealth Government.Other Commonwealth bodies involved in water R&D include the MDBC, the NIRF and theCSIRO. The MDBC is responsible for funding research into Murray-Darling Basin managementproblems. The NIRF is charged with funding and co-ordinating generic irrigation research andfacilitating technology transfer in the irrigation sector.
The CSIRO conducts a wide range of water-related research, principally under contract to variousCommonwealth, State and private sector organisations. It spends about $20 million per annum onsuch research, which is focussed mainly on the development of new technologies and resourcemanagement issues. The Commonwealth is also jointly involved with various major waterauthorities and private companies in a number of Co-operative Water Research Centres aroundAustralia.
The various State departments of agriculture, and rural water authorities, fund and/or undertakemuch of the rural-related water R&D. Urban water R&D is predominantly funded and/orundertaken in-house by the major urban water authorities. The major urban authorities alsoprovide seed funding for urban water research through the UWRAA. Much of the research fundedby the UWRAA is potentially of benefit to the smaller urban authorities.
Rural and urban water research is also undertaken by universities and a number of private R&Dand industry organisations.
Extension services for water R&D, essentially to encourage the adoption of ‘best practice’techniques in the WSD industry, are provided by a range of Commonwealth, State and privateorganisations including the LWRRDC, the National Soil Conservation Program (NSCP), Landcaregroups, Greening Australia, the MDBC, various Commonwealth and State departments andagencies, and the research institutions themselves.

RESOURCEMANAGEMENT &OTHER ISSUES
10.187
More detailed information on the institutional arrangements for water R&D in Australia is providedin Appendix B.
A number of participants claimed that the current R&D effort is insufficient to ensure sustainableand efficient water resource use. The CSIRO, the Australian Irrigation Council (AIC) and theNIRF all referred to the relatively low level of funding and research and the slow adoption of newand alternative technologies by water agencies and irrigators. The CSIRO said that:
Historically, the industry has utilised relatively simple technology for water delivery and for waste watertreatment and disposal. Technological change has been relatively slow. Investment in R&D as a percentage ofturnover has been very low (less than 1 per cent) ... [However] ... this experience is not limited to Australia.
Both the AIC and the NIRF claimed that there is under-investment in generic irrigation research(ie. water research that extends beyond the individual commodity level), of the order of $9 millionper annum.
To rectify the perceived problem, and to address funding imbalances which were said to lead toresearch being biased towards State, regional and local issues, both the NIRF and the AIC soughtthe Commission’s support for a statute-backed levy on irrigators, with contributions matched dollarfor dollar by the Commonwealth. The levy concept was also supported by the South AustralianGovernment.
In accepting the need for all irrigators to strive for maximum efficiency, but rejecting theCommission’s emphasis in its draft report on increased water pricing to achieve this, the NSWIrrigators Council said that:
In many cases, this [efficiency] improvement can be accomplished by the adoption of better water managementmethods such as, for example, the recently developed methods for the better scheduling of irrigation. ...Improvement of performance by individual irrigators is best promoted by educating those who lack understandingof their deficiencies and are not fully aware of the problems they are helping to cause. Education needs to besupported by adequate research to fill knowledge gaps and search for better ways to irrigate.
The CSIRO also argued that increased funding for water and related research is essential to achievethe efficiency and productivity gains and environmental goals sought by the Commission andothers. However, the CSIRO stressed the need for local water agencies to support and exploittechnical advances resulting from research in the private and public sectors -- for performance, costminimisation and export potential reasons. It also suggested that demands for greater economicefficiency and increased environmental needs will compel the industry to review its activities andto search for more efficient and environmentally benign methods, structures and policies.
Some participants questioned the current focus of R&D funding in the water industry. Forinstance, the SWB was critical of an apparent bias in Commonwealth and State Governmentresearch funding towards the irrigation sector, at the expense of research into urban issues such asdrinking water quality.

WATER RESOURCES& WASTE WATERDISPOSAL
10.188
The Commission acknowledges the importance of R&D in complementing the many institutional,pricing and resource management reforms it has proposed elsewhere in this report. As alreadynoted, the scope for efficiency and productivity gains in the WSD industry is significant. R&D andextension activities will help ensure these gains are realised. Increased standards of urban watersupply quality and the introduction of more stringent environmental standards will require cost-effective and innovative solutions if they are not to place enormous demands on the community’sinvestment funds.
Similarly, in the irrigation sector, incentives for more efficient water use and the need to addressthe issues of salinity, waterlogging and nutrient run-off etc, will require innovative solutions, aswell as effective extension mechanisms. Research on the need for environmental flows, valuationof the environment, the costs and benefits of total catchment management etc, is also important.
ABARE asked the Commission to spell out a list of research priorities for the WSD industry.However, such a task is best left for negotiation between governments, researchers and the widerindustry. An indication of the research priorities already set by some R&D organisations is givenin Appendix B.
In this inquiry it is neither possible nor appropriate to assess whether there is enough R&Dundertaken in the rural and/or urban sectors of the WSD industry. Such an assessment wouldproperly be made as part of a much more general review of funding of research in Australia.
That said, the extent of in-house and private sector R&D undertaken by WSD agencies suggeststhat many of the costs of undertaking water R&D can be recouped from customer charges. In theseareas government funding is unnecessary. The same cannot necessarily be said for research of aninformational or resource management nature. Here, the case for government funding is muchstronger. Further, even if the level of investment is too low, to what extent is it due to features ofthe current arrangements which reduce the incentives for water users to commit resources to R&Dactivities? The claimed under-investment and slow adoption rates for new technology may reflectfactors such as plentiful water supply in some areas, inefficient pricing regimes, and otherinstitutional impediments which provide little or no incentive for conservation or costminimisation, and thus for research into supplying and using water more efficiently, andsustainably. The CSIRO noted that:
There are exciting possibilities for developing water, waste water and related environmental control technologiesin Australia that will lead to a significant export industry. ... It is possible that corporatisation of the large waterauthorities could aid this process, in part because it would open up their horizons to the full range of trading andinvestment possibilities. In the field of R&D and technology, suitably structured corporations could have moreincentive to take risks and pursue process and product developments and research opportunities, that in the pastwould have been irrelevant given legislative and associated administrative responsibilities.

RESOURCEMANAGEMENT &OTHER ISSUES
10.189
The reforms proposed in this report should provide an incentive for governments, users andbeneficiaries to invest more resources in R&D. Levies to fund R&D may be worth furtherinvestigation. Levies mean that those who benefit pay the cost. Again, however, it is impossible toassess the case for levies in the context of this inquiry, particularly as it has not been establishedcategorically that there is under-investment in water R&D.

RURAL WATER 191
PART II: RURAL WATER
R1 RURAL WATER ISSUES
R2 COMMISSION’S RURAL WATER FINDINGS
R3 PACE OF RURAL REFORM
R4 BURDEKIN RIVER IRRIGATION AREA: CASE STUDY
R5 KIMBERLEY PIPELINE PROPOSAL

WATER RESOURCES& WASTE WATERDISPOSAL
192
RURAL WATER 193
R1 RURAL WATER ISSUES
Part I of this report discussed the overall use and management of water resources in Australia --urban and rural water alike.
The purpose of Part II is to bring together rural issues and the Commission’s findings.
A State by State summary of institutional arrangements, recent developments and participants’views on rural water issues of particular relevance to each State is provided in Appendix E.
Water use in rural Australia
Rural industries account for the bulk of all water use in Australia. Irrigation alone uses aroundthree quarters and when account is taken of water for ‘stock and domestic’ purposes, the ruralsector makes up over 80 per cent of total use.
Water for stock and domestic purposes is in some instances provided by State-wide rural waterauthorities. In Victoria, for example, the Rural Water Corporation (RWC) provides water in theWimmera and Mallee regions for filling farm dams. In Western Australia, piped supplies areprovided by the Water Authority of Western Australia (WAWA) to about 25 per cent of farms inthe cereal and sheep districts of the south-west. Elsewhere in Australia, water for stock anddomestic purposes is pumped from rivers or bores, or comes from on-farm dams or local suppliesof groundwater.
The mean annual water use for irrigation is of the order of 16 million ML, of which half is appliedto pasture (see Table R.1).
Surface irrigation, for example flood and furrow, is the main method of applying irrigation water.However, there is growing use of pressurised systems, such as spray, micro-spray and drip,especially for horticultural production.
The bulk of irrigation is in New South Wales, Victoria and Queensland. Irrigated production ofbroad-acre crops such as oilseeds, cotton, sugarcane and rice, comes mainly from New SouthWales and Queensland. Most irrigated pasture is in New South Wales and Victoria. Orchard,vineyard and other horticultural crops, together with livestock, account for most of the value ofirrigated production in South Australia, Western Australia and Tasmania (see Table R.2).
Output per hectare of irrigated land is relatively high. While the area under irrigation in Australiarepresents less than 5 per cent of the area under crop and pasture, in 1988-89, the value of irrigatedproduction of $4.6 billion, was almost one quarter of the farm-gate value of Australia’s entireagricultural production.

WATER RESOURCES& WASTE WATERDISPOSAL
194
In regard to water use efficiency, the Australian Irrigation Council (AIC) said:
Most surface irrigation systems constructed in the past twenty years have been laser-graded along with some 30per cent of pre-existing layouts. Laser-grading provides uniform watering, improved drainage and regular shapedfields which are easier to work. The outcomes are less water wasted to surface drains and to groundwater, bettercrops and higher returns. The use of recirculation systems, off-river storages and laser-grading can lead to veryhigh water use efficiencies such as are relatively common for good cotton irrigators. There has been a big changein irrigated horticulture from less efficient application methods to under-tree micro-irrigation which also canachieve efficiencies in the order of 85-90 per cent.
Table R.1: Mean annual water use for irrigation, 1989-90
Percentage used on:
State/Territory Water use Pasture Crops Horticulture
(’000 ML) (%) (%) (%)
New South Wales 8 300 41 46 13Victoria 5 200 81 6 13Queensland 1 200 8 82 9Western Australia 338 55 19 26South Australia 723 58 3 39Tasmania 97 47 48 4Northern Territory 10 10 90 0
Total 15 868 50 35 15
Source: AWRC 1992a
Table R.2: Value of irrigated production, 1988-89($million)
Trees, Vegetables & Cereals, Livestock Oilseeds, Totalvines other rice pastures cotton,
State/Territory horticulture sugar
New South Wales 332 185 212 285 390 1 404Victoria 75 333 2 468 4 1 182Queensland 181 382 25 54 467 1 109Western Australia 62 121 <1 20 <1 203South Australia 286 157 <1 53 <1 496Tasmania 31 109 - 39 - 179Northern Territory <1 7 <1 <1 - 7Australian Capital Territory - <1 - <1 - -
Australia 1 267 1 294 239 919 861 4 580
Source: Submissions

RURAL WATER 195
There are many private irrigation schemes in Australia -- usually co-operatively owned by thelandholders. In the Macquarie Valley in New South Wales, for example, where cotton is thedominant crop, most irrigation is by private diversion.
Much of the public investment in rural water supplies has been funded by Commonwealth andState Governments in the name of regional development. This has frequently meant that publicinvestment has been undertaken with scant regard to economic and environmental outcomes. Thelegacy has been poorly maintained assets, relatively low farm incomes and damage to theenvironment.
Environmental costs
The relatively high levels of productivity under irrigation have come at a cost in terms of thenatural environment.
Alteration of the natural seasonal flow of water down the major river systems, due to riverregulation, has its own effect on ecosystems. Examples frequently quoted are the adverse effectson flora (such as redgum forests along the River Murray) due to the substantial reduction in theincidence of flooding; and the reduction in native fish stocks because river regulation has reducedthe favourable conditions for reproduction.
Irrigation is also a contributor to salinity and high water tables in the immediate vicinity of manyirrigation areas and, through its impact on river flows, on the nutrient and salt loading of riversystems.
The major part of Australia’s irrigated production comes from the Murray-Darling Basin, which isseverely affected by salinity and waterlogging. Since the turn of the century, water tables in theShepparton area, for example, have risen from 25 metres below the surface to only 2 metres below.Production losses in the Basin are already estimated to be $65 million annually.
Natural phenomena and the structure of the Basin are at the root of many of the problems ofenvironmental degradation. But damage has been hastened and reinforced by the ways in whichwater has been supplied and used by farmers. The full extent of the problem has yet to emerge. Aspointed out by the Murray-Darling Basin Ministerial Council:
In recent years, monitoring of groundwater systems has confirmed alarmingly high salinities and rising watertables over much of the Basin. In many cases, this is not yet evident at the land surface. This deterioratingsituation is largely in response to broadscale clearing of native vegetation and inappropriate irrigation practices.The implications for future land degradation and stream salinities are extremely serious. The relatively highfunding levels for this category reflect the priority placed upon developing an understanding of the processesinvolved. (Murray-Darling Basin Ministerial Council 1990).

WATER RESOURCES& WASTE WATERDISPOSAL
196
The Murray-Darling Basin Commission (MDBC) said that the area of shallow water tables in theirrigation areas of the southern Murray-Darling Basin will increase from 59 per cent in 1990 toapproach 100 per cent of the irrigated area in 2010. In the Riverine Plains area alone, economiclosses due to salinity are estimated by the MDBC to increase from $44 million per year now to$123 million per year in 2040 if no remedial action is taken. However, there will be a significantsalt load increase for the Basin’s rivers with or without drainage.
In recent years, considerable efforts have been made to protect the productivity of irrigation areasagainst rising water tables. In the Shepparton area, 95 ground water pumps provide absoluteprotection for horticulture. The water is disposed of to the River Murray or reused for irrigation.Elsewhere, saline water is pumped to one of 94 evaporation basins.
Irrigation is also a source of nutrients in rivers. In wet years when there is widespread run-off fromcatchments, diffuse sources are the major source of phosphorus. The MDBC referred to problemareas within irrigation, particularly in areas where high levels of salinity reduce the growth ofweeds which would otherwise absorb some of the phosphorous within drainage channels. In dryyears, urban communities are the dominant source of nutrients through their discharge of sewerageeffluent and stormwater. There are 148 towns that discharge secondary treated effluent within theBasin.
The MDBC pointed out that high water tables need not mean a significant reduction inproductivity, providing that salinity levels are low:
... to protect a hectare of land in Tragowel Plains or Kerang you could expect, to provide complete protection, tohave to export 30 to 50 tonnes of salt per hectare per year. At Shepparton, to protect the same hectare of land youwould need to export between 1 to 3 tonnes of salt per hectare per year.
As noted above, natural phenomena are at the root of many of the environmental problems, butthese problems are exacerbated by:
• the absence of arrangements that would allow irrigation water to be diverted from marginal ordegraded land; and
• the pricing of irrigation water well below the full cost of its provision.
The link between irrigation practices and environmental problems was most forcefully put by NSWAgriculture:
The primary reason for the land degradation problems in the irrigated regions is the excessive use of waterbeyond plant requirements, which leads to accessions to groundwater, rising watertables and the resultantproblems of salinity and waterlogging. ... Not only have water pricing policies encouraged high consumptionrates but allocation policies, such as providing as high a reliability of supply as possible, have also contributed tothe environmental problems by not reflecting the true scarcity of the water resource.

RURAL WATER 197
Tradeable water entitlements
Until comparatively recently, there was no mechanism to redistribute water to its most productiveor highest value use. Together with the lack of pricing incentives to use water efficiently, thiscontributed to overuse of water in some regions, adding to environmental degradation in the formof increased salinity and waterlogging.
In the 1970s, faced with both increasing demands for water and increasing costs of augmentingsupplies, State Governments made tentative moves away from a strict regulatory approach to watermanagement. Tradeable water entitlements, at least on a temporary basis, have since beenintroduced in all States except Western Australia. The current arrangements in each State aresummarised in Chapter 8.
The evidence to date indicates that tradeable water entitlements, especially permanent transfer, canbring substantial benefits. Transferability allows greater choice of response to changing marketconditions and input costs, including increased water charges. By assigning a market price, tradingprovides signals to conserve water for sale to other users who can put it to more productive ends.And by providing a mechanism for irrigators to top up their water allocation if required, it alsocontributes to risk management.
In New South Wales, some 714 000 ML of entitlement were transferred between 1983 and 1990,increasing rural income in that State by an estimated $42 million over the period. In WesternAustralia, where the bulk of water in the South-West Irrigation Scheme is used on pastures, theDepartment of Agriculture said that the marginal value of irrigation water is around $30 per ML fordairy farming and that horticultural crops might more profitably use the water on suitable soiltypes. However, this adjustment is not occurring -- in part because of the absence of transferablewater entitlements in that State.
A further advantage of permanent water transfer is the adjustment assistance it provides. The saleof water entitlements can enable landholders to move more easily out of irrigation and into drylandfarming. Previously, entitlements had to be forfeited or property sold. However, as discussed inChapter 8, the initial separation of the water right from the irrigated land will result in a one-off fallin the value of that land. Thus, in broad terms, the assistance provided will reflect the difference inthe value of the water to the buyer and the seller.
At present, most trade in water is restricted to river pumpers within a catchment, and in mostinstances, only on a temporary (annual) basis. Such limitations reduce the efficiency with whichwater is allocated between uses, and reduce the potential of a trade in water to promote betterenvironmental outcomes. For example, with transfers only on a temporary basis, efficiency isconstrained by uncertainty about the availability of water in future seasons. In due course, trade inwater could be between rural and urban users, and the environment, to the benefit of all.
WATER RESOURCES& WASTE WATERDISPOSAL
198
Water pricing and cost recovery
The importance of improved water pricing for efficient management of water resources isacknowledged at all levels of government in Australia. The Commonwealth Department ofPrimary Industries and Energy said:
Payment by all resource users of the full economic cost of their resource is fundamental to efficient resourcemanagement. With respect to water users, charges must include not only current and capital costs of delivery, butalso the opportunity cost of water. Where water is supplied by government agencies, this outcome should be amatter of policy; ...
That said, prices for irrigation water have fallen short of full cost recovery throughout the history ofirrigation in Australia.
Water is variously priced from $2 to more than $70 per ML for regulated flows. The NationalIrrigation Research Fund estimated that the average price is of the order of $10-$12 per ML. Inmany instances, water charges do not cover operating and maintenance costs and depreciation, letalone any return on the investment required to provide infrastructure.
Government acceptance of cost under-recovery has encouraged considerable public investment inirrigation infrastructure which has little commercial value. It has also provided a disincentive forinvestment in on-farm storages.
Because new public investment in irrigation is unlikely to be widespread, pricing questions forrural water are primarily concerned with charging to make proper use of existing infrastructure.Even so, poorly informed assessments of the capacity of farmers to pay and to adjust to highercharges, together with political expediency, continue to thwart moves to increase charges to anefficient level.
Conflicting objectives of governments have also played a part. For example, the South AustralianGovernment said that in considering the recovery of total costs from current customers it:
... will not jeopardise the State’s competitive position nor any existing development which has become dependenton affordable WSD services.
And, in commenting on the problems of achieving a commercial return, it said:
The inability of governments to correct the situation through charges reflects a decision that the capacity of thecommunity to pay and interstate competitiveness are more important objectives than the achievement ofcommercial rates of return. (No. .., p.22)
The Queensland Government said:
Queensland believes that governments must retain the right to decide what they see as the benefits frominvestment of irrigation schemes and regional development. Governments must be free to weigh up the socialand economic benefits to the community from investment in irrigation schemes.

RURAL WATER 199
There was considerable agreement on the part of irrigators that charges for water have beeninsufficient to provide funds for the perpetual replacement of irrigation works. However, there wasalso a consensus that today’s irrigators should not have to pay to make up for the non-contributionof the irrigators of past decades.
Irrigators indicated conditional support for a user pays approach to water pricing. However, theyargued that pricing reforms should be pursued only after the operational efficiency of the waterauthorities providing rural water has been improved; that all ‘beneficiaries’ should contribute to thecosts of supplying water; and that prices for water should be set with regard to the capacity ofirrigators to pay. Irrigators also argued that governments should meet a major part of the cost ofrefurbishing public irrigation assets.
Efficiency within rural water authorities
The operational efficiency of many of Australia’s rural water authorities has come under scrutiny inrecent years. For example, in New South Wales, options for restructuring the Department of WaterResources (DWR) are under consideration, including separation of the resource management andoperational functions, and privatisation of the operational function. In Victoria, the RWC wasrecently broken up into five Regional Management Boards responsible for all aspects of servicedelivery in their regions, and a small central corporation to provide strategic direction.1
The expectation is that changes to the structure of rural water authorities could significantly reducethe costs of providing services. Irrigator organisations referred to substantial cost reductionsachieved in New South Wales following the creation of regional Irrigation Management Boards.
The Macquarie Valley Irrigators Association said that irrigator interest in privatisation is due todissatisfaction with the slow pace of improvements in workforce productivity in the publicschemes. It said that the lower operating costs of private schemes are due to the reduced need foraccounting and reporting to government; fewer and better motivated staff; greater irrigatorcooperation in operation and maintenance activities; and fewer structures to operate and maintain.
Cost savings from improvements in rural water authorities’ performance would reduce themagnitude of required price increases. However, improving the cost efficiency of service provisiontakes time and reform on the pricing front should not wait on the achievement of cost savings. Inany event, even after identified cost savings have been realised, prices will still have to risesignificantly if irrigators are to pay to maintain the service potential of existing systems in thefuture.
1 The RWC was corporatised on 1 July 1992. The five Regional Mangagement Boards are expected tocommence operating on 1 September 1992.

WATER RESOURCES& WASTE WATERDISPOSAL
200
Beneficiaries of water use
Many participants argued that the subsidised provision of water is justified by the community-widebenefits which irrigation brings. The benefits were variously expressed in terms of the contributionwhich irrigated agriculture makes to Australia’s export earnings; the stability of food prices; and theregional and national stimulus to economic activity generally. For instance, the Macquarie ValleyIrrigators’ Association said:
Irrigated production for domestic consumption assists in stabilising food supplies and prices and without it, priceswould be erratic and supply unreliable. (No. 71, p.2)
The NSW Irrigators’ Council said:
Irrigators, along with primary producers generally, know that they make an important contribution to Australia’seconomy. They know that they belong to the minority part of the workforce which produces Australia’s wealth,as against the remainder whose role is redistributive rather than creative. (No. 13, p.6)
There was considerable support for the argument that the multiplier effects associated withirrigated agriculture bring disproportionate benefits to the wider community, and that the widercommunity should therefore contribute to the cost of supplying water.
The Commission does not accept that these arguments justify subsidised water prices. The benefitsof public irrigation infrasturcture provision accrue primarily to water users. For instance, growersreceive higher prices for ‘out of season’ production made possible by irrigation. Consumers alsobenefit and this is reflected in their willingness to pay the higher price. There is no point inrequiring the community to subsidise water use merely to increase exports. The effect is to taxother sectors and jeopardise their competitiveness, and hence their capacity to generate exports.Water subsidies, like other forms of industry assistance, impose costs elsewhere in the economywhich can result in a net loss for Australia.
And, as pointed out in Chapter 5, all activities have linkages with parts of the economy andtherefore generate flow-on benefits or ‘multiplier’ effects. But multipliers do not address thequestion of whether the benefits of increased activity in one area outweigh the costs, nor do theyevaluate the economic merits of other investment options. Thus, while multipliers provide someindication of the importance of irrigated agriculture to surrounding regions, and therefore anindication of some of the likely adjustment costs following changes to pricing arrangements, theysay nothing about the efficiency of resource use.
However, the Commission recognises that where a dam or river provides, say, recreational ortourist services as well as irrigation water, it is not appropriate to charge irrigators for the full costof maintaining that water source. This approach has formal recognition in New South Wales whereirrigators pay a ‘delivery service charge’ to cover 70 per cent of all costs associated with ‘runningthe rivers’. The other 30 per cent is met by the State Government in recognition of public benefits.

RURAL WATER 201
Capacity to pay
The argument that irrigators are limited in their capacity to pay higher prices for water was put veryforcefully by irrigators. For example, the NSW Irrigators’ Council said that a typical mixed farm(including rice) in the Murrumbidgee Irrigation Area has average annual water charges of $19 000or more, which represent about 20 to 25 per cent of farm variable costs. In this case, the Councilargued that:
The net income from such a farm for 1990-91 will have been only some $30 000, so the scope for absorbingincreases in water costs is very limited.
... While not all irrigators’ profits have as much sensitivity to water costs ... most would be severely affected byany move by a Government to require recovery of capital and interest or to call for dividend payments.(Submission No. 13, p.6)
The effect of higher water prices will depend in part on how irrigators respond. They may reduceapplication rates, adopt water saving technologies, reduce the area under irrigation, change crops,move to dryland production or otherwise change their irrigation operations. Some may leavefarming altogether.
The DWR has estimated that water accounts for about 13 per cent of on-farm operating costs ofrice production in New South Wales. The proportion is much lower for other crops -- citrus 5 percent, fruit 3 per cent and cotton 1 per cent.
Apart from rice, these estimates suggest that higher prices for water would not necessarily threatenthe viability of many forms of irrigated agriculture. The adjustment costs could nevertheless behigh. One reason is that the benefits of low water prices are often capitalised into land values.Consequently, higher prices for water would cause capital losses.
The effect of higher prices on the use of water will depend on the sensitivity of demand to pricechanges. The Western Australian Department of Agriculture said that for dairy farming in thatState, the ‘price elasticity’ of demand for irrigation water is as high as-0.6. This means that a doubling in the price of irrigation water would reduce demand by 60 percent. One reason for this significant sensitivity is that hay and grain feeding can substitute forirrigated pasture. By contrast, the Department noted that a recent survey undertaken in threegovernment irrigation areas in the south-west of Western Australia found that a 50 per centincrease in water charges from their 1989-90 levels would not change irrigation water usage, whilea doubling of price would likely result in 25 per cent of farmers ceasing irrigation.
In Victoria, about 85 per cent of water for irrigation is applied to pastures for dairying and thefattening of cattle and sheep. There has been a decline in milk production in the Gippsland region,which has a relatively high rainfall, and a corresponding expansion around Shepparton whereirrigation is prominent. This suggests that higher prices for water might favour a return to drylandgrazing. However, the VFF said that the marginal value of irrigation water in Victoria is quite high

WATER RESOURCES& WASTE WATERDISPOSAL
202
-- perhaps $60 per ML for some commodities in some years. With water prices currently at $15 perML, the residual value was said to be embodied in land values. Accordingly, the VFF argued thatthe main effect of higher water prices would be a fall in land values. Activities such as sheep andcattle fattening, for which the marginal value of water is low, could be directly affected butirrigated pasture would continue to be used for dairying.
The fact that cheap irrigation water has been capitalised into land values is not an argument for theindefinite retention of subsidies. As pointed out by Lloyd (1986), people who bought irrigationfarms in earlier years have already received years of subsidisation, and those who bought farmsrecently would have been aware of the debate about water charges, and should have factored thisinto their negotiations.
The concept of ‘capacity to pay’ has obviously influenced the pricing policies of the rural waterauthorities, but it is not clear how they have assessed the capacity of particular groups of irrigatorsto pay.
Surveys of farm incomes typically find a spread of incomes even within categories of irrigatedfarming. To the extent that attention has been focussed upon marginally viable farms, adjustmentmay have been unduly postponed by the reluctance to increase water prices. However, attitudes arechanging. The DWR said that there is scope to further recover costs in New South Wales throughsubstantial increases in water charges -- for example, by users in the Irrigation Areas and Districtspaying higher service delivery charges.
One indication of the capacity to pay is the value of water entitlements on the transfer market. Theprices that have been paid in some States for water transfers and new water entitlements suggestthat there is considerable capacity in parts of the irrigation sector to pay higher charges. In March1991, an auction of new entitlements was held in the Gippsland region of Victoria. All 6000 ML ofwater were sold at a price of $160 to $200 per ML. This indicates that water has an annualisedvalue of around $20 per ML over and above current charges to private diverters in this area. Newallocations auctioned in Queensland, at St George and Goondiwindi, brought average prices inexcess of $350 per ML.
Some participants questioned the worth of transfer prices as an indicator of irrigators’ capacity topay. The NSW Irrigators’ Council, for example, said:
There may indeed be instances where prices paid for the permanent transfer of water entitlements mightsuggest that higher water prices can be afforded by a particular purchaser. But this should not be taken asevidence of the levels of charges that the rank and file irrigator can afford.
As discussed in Chapter 8, the Commission accepts that transfer prices provide only limitedinformation on the value of water across irrigation as a whole. However, this does not negate thegeneral proposition that some irrigators value water in excess of the price charged for its provision.The question is one of degree rather than principle. As constraints on transfers are removed so thatwater can freely move to its highest value use, the value of entitlements will increasingly become amore reliable indicator of irrigators’ capacity to pay higher prices.

RURAL WATER 203
Asset refurbishment
Most public irrigation systems in Australia are aging and in need of refurbishment. Moreover,problems of waterlogging and salinity mean that there is now a call for additional outlays to protectthe existing investment in irrigation. According to the National Irrigation Research Fund:
Inadequate surface and subsurface drainage for removing excess irrigation water and stormwater is becoming amajor barrier to more efficient water use. This is especially true in irrigation regions developed in the past 50years where no provision was made for drainage at the time of development. (No. 16, Attachment, p.3)
The viewpoint of many irrigators is reflected in proposals put forward by the VFF for debt write-off and a significant injection of public funds to bring Victoria’s irrigation assets up to a reasonablecondition and to remove a significant backlog of maintenance. The VFF argued that:
... These capital injections can be seen as an appropriate government contribution on behalf of the broaderbeneficiaries of Victoria’s rural water systems.
In all States, further public investment in irrigation infrastructure is now conditional upon somecapital contribution from irrigators, or a levy incorporated in water charges. With salinitymitigation works, governments tend to pay a proportion of the costs in acknowledgement of theintergenerational problems that would otherwise bedevil a solution.
The NSW Irrigators’ Council, among others, was critical of the approach in New South Waleswhereby the cost of constructing drainage schemes is now being borne in the ratio 2:2:1 by theCommonwealth, the State and irrigators. The Council said that:
The irrigators feel somewhat disadvantaged by not having had the drainage as part of the original irrigationscheme, as was the case with irrigation development in some neighbouring State-constructed schemes and as isaccepted good practice. These irrigators, in having to now contribute to have the construction take place thusbelatedly, feel that in the above-described context their contribution represents an abnormally generous measureof "user pays" on their part. (NSW Irrigators’ Council, No. 13, p.9)
NSW Agriculture, however, said that there is a strong case for irrigators to financially contribute todrainage schemes because irrigators are generally the primary beneficiaries.
The various rural water authorities have taken different approaches to refurbishment. In NewSouth Wales, the intention is to move quickly to corporatise/privatise the Irrigation ManagementBoards and to progressively move irrigation infrastructure from direct government control andDWR management. The DWR indicated that, within the next five years, all of the Irrigation Areas

WATER RESOURCES& WASTE WATERDISPOSAL
204
in New South Wales will be privatised, corporatised or encouraged to operate in some commercialmode. Where privatisation occurs, there will no longer be an open-ended community commitmentto replace assets as has often been the case in the past. Rather, decisions on refurbishment will bethe responsibility of irrigators and will therefore be based on commercial criteria.
Given that an important rationale for transfer of ownership is to give those paying for services moresay on the levels of service etc they require, it will be preferable to allow them to decide on whatrefurbishments are appropriate. By negotiating the transfer prior to refurbishment, governments arealso freed from involvement in the operation of these systems at an earlier date.
Governments generally see a need to refurbish assets to an acceptable standard or provide otherincentives for groups of irrigators to take over their parts of the system. However, the dilemma isthat while government funding of rehabilitation continues, privatisation will not be an attractiveoption for irrigators in areas requiring major rehabilitation.
In Victoria, for example, privatisation of the public irrigation system is not on the agenda and theState Government has begun what appears to be an open-ended task of asset refurbishment. Theproblem is not avoided by the recent change to corporatise the RWC and regionalise its operations.Even with responsibility for maintaining assets residing with the five regional boards, the assetsremain the property of the State.
Self management of public irrigation schemes is favoured by the South Australian Government andirrigators. It has been agreed that the capital which irrigators contribute to refurbishment shouldentitle them to assume the management and ownership of government irrigation assets, should theyagree to do so.
R2 COMMISSION’S RURAL WATER FINDINGS
The view that cost recovery is an appropriate objective for the Australian water industry is nowshared by most governments, and the water authorities in all States are keen to implement reform.Reform of the rural water sector has nevertheless not been high on political agendas.
If evidence were needed of the sorts of problems that arise when users of water are not required topay the full costs of services received, it is to be found in the plethora of ill-judged investments inpublic irrigation schemes.
RURAL WATER 205
As Australia’s most recent large-scale public irrigation project, the Burdekin River Irrigation Areascheme in Queensland might have been expected to avoid the shortcomings of earlier schemes.The scheme is only half way through the development phase, yet the Commonwealth Government’scontribution of some $130 million towards the cost of the Burdekin Dam has already been writtenoff. The likelihood that the Queensland Government will recoup its investment in developingirrigation land in the Burdekin is discussed in section R4.
When taking investment decisions, governments clearly must have regard to a broad spectrum ofconsiderations. However, there are many examples where public investment in irrigation hasmeant a loss of community amenity and a continuing drain on the public purse. It has to be askedwhether Australians can any longer afford the problems that follow when regional policies orpolitical expediency prevail over commercial good sense.
As some safeguard for the future, the Commission has proposed in Chapter 5 that publicinvestments in new irrigation schemes and investments in asset refurbishment be subject to thesame rate of return hurdle as proposed for new investments in the urban sector -- that is, aminimum of 5 per cent real.
However, the public irrigation assets already in place stem from earlier investments which had littleregard to commercial outcomes. Some of these assets should be regarded as ‘sunk’ costs not to berecovered in prices charged to current users of water. Even so, water pricing policy should aim forfull recovery of operating costs, and irrigators should expect to pay higher prices to justifyrefurbishment of these assets.
In Chapter 5, the question of future pricing arrangements for irrigation water is discussed in termsof the pricing of bulk water and the pricing of water distribution. The Commission concludes thatprices for bulk irrigation water should, at the very least, cover irrigators’ share of the costs ofoperating and maintaining all parts of bulk water supply systems, including storages. For systemswhere demand for water is sufficiently strong, a return on capital is appropriate. Consistent witharrangements in the urban sector, the Commission recommends that where the costs ofenvironmental damage directly attributable to irrigation can be quantified, charges for bulk watershould be increased accordingly.
The scope for cost savings in the delivery of bulk water is discussed in Chapter 3. These savingscan reduce the magnitude of price increases, but they will not obviate the need for significantincreases in the charges for bulk irrigation supplies. Higher levels of cost recovery call for bothprice increases and simultaneous cost saving initiatives by bulk water suppliers.
The Commission recommends that the price of bulk water be lifted immediately to a commerciallevel, while continuing to subsidise irrigators in the short term by means of an explicit governmentpayment to the bulk water supplier. Among the advantages, discussed in Chapter 5, would be thediscipline imposed on water agencies and their owner governments to evaluate what rate of return,if any, is feasible in a particular bulk water supply system.

WATER RESOURCES& WASTE WATERDISPOSAL
206
The pricing of water distribution and drainage services is made more complex by the question ofwho should pay for the refurbishment of these systems. There is considerable pressure ongovernments to refurbish systems without adequately addressing the problem of an on-goinggovernment commitment to maintain non-commercial systems.
In Chapter 7, the Commission argues that privatisation of public irrigation distribution and drainagesystems is necessary, and recommends that the transfer of ownership should occur prior to furtherrefurbishment of distribution and/or drainage systems.
Once privatised, charging arrangements for irrigation distribution and drainage systems become amatter for the irrigators themselves to decide. They can also decide on the appropriate standards ofrefurbishment.
But the arguments for privatisation go much further than this. They stem from the concern thatgovernments at present are taking decisions to refurbish existing assets without sufficient regard tothe changes yet to come -- not the least of which will be much higher prices for bulk irrigationwater and provision for water to be moved to higher value uses. On both commercial andenvironmental grounds, some parts of the public irrigation systems (developed in quite differentcircumstances) will not warrant refurbishment.
Those who see value in across-the-board refurbishment of existing irrigation assets seem to haveignored the contingent requirements for drainage and salinity control measures. In many localitiesthere is the added complication that the full extent of waterlogging and salinity problems has yet toemerge. As noted by the MDBC, the area of shallow water tables in the irrigation areas of thesouthern Murray-Darling Basin will soon approach 100 per cent of the irrigated area.
In the longer term, there is no reason why the broad pricing principles for rural water should differfrom those relevant to urban WSD services. However, in the rural sector, pricing reforms need togo hand in hand with reforms which give those paying for services more say on the levels ofservice, etc they require. Pending privatisation, management of the distribution and drainagecomponents of public irrigation systems should be devolved to regional bodies. Steps in thisdirection are being taken in all of Australia’s major irrigation areas.
The package of rural water reforms should extend to improvements in the system of transferablewater entitlements, allowing water to be used to its best advantage. In Chapter 8, the Commissionrecommends that:
• permanent water transfers should be introduced in all irrigation systems;

RURAL WATER 207
• where feasible, provision should be made for permanent transfers between schemes; and
• arrangements to allow the transfer of water from irrigation to other uses should be implementedin all States.
There is also a need to change the way in which water entitlements are specified. Currentarrangements provide few incentives to conserve water because irrigators cannot carry over unusedentitlements for future use or sale. This contributes to water wastage, overwatering and the relatedenvironmental problems.
The inflexibilities in the current arrangements can be avoided to a significant degree where waterstorages are operated on a continuous accounting basis. Here, users of the storage are given creditsfor any part of their allocation which they choose to preserve. Another option is dam capacitysharing, whereby each user is allocated a percentage of empty reservoir capacity and a percentageof new inflows. Again, users who chose to preserve water would receive the benefits of thatdecision in subsequent seasons. These options are discussed in Chapter 8.
R3 PACE OF RURAL REFORM
The Commission's recommendations should come as no surprise to most of the rural waterauthorities in Australia. They have advocated similar reforms for many years and some have madeprogress in implementing parts of the package. Governments too, should not be surprised since therecommendations merely give content to the maxims which governments themselves placed beforethis inquiry.
There is close to unanimous agreement on the part of governments as to the need for rapid change,and the direction of change. However, in most jurisdictions, the `in principle' commitment toefficient and sustainable use of water resources has to date fallen short of decisive action. Onereason is that governments, water authorities, irrigators and the community generally seem to havemisjudged the pace at which reforms can and should be progressed.
Participants generally acknowledged the need for reforms and recognised that there will beconstraints on ways in which resources are used in future. The DWR, for example, pointed out thatthe pursuit of sustainability objectives:
... will inevitably impose additional constraints on resource use and development (to redress costs which will beborne by present and future resource users and the community generally). However, it does so on theunderstanding that a decline in the condition of the resource leads to increasing and potentially worse costs for allindividuals involved with that resource.

WATER RESOURCES& WASTE WATERDISPOSAL
208
Many parts of the reform package recommended in this report have the support of irrigators. Forexample, the AIC expressed strong support for the adoption of transferable water entitlements.
However, the social implications of reforms in the rural water sector are of major concern to manyparticipants. This is to be expected since many communities and industries owe their existence toabundant and cheap supplies of water for irrigation. In the Lower Murray-Darling Basin, inparticular, whole communities rely upon water supplied in liberal quantities, with high reliabilityand at a subsidised price. In these circumstances, the United Farmers and Stockowners of SouthAustralia rightly point out that the future of Australia’s public irrigation schemes will be determinednot only by social, economic and environmental objectives, but by the political influences exertedon water managers.
The trade-offs between efficient resource use and social cohesion were seen by the SouthAustralian Government in the following terms:
The rural support objective would no longer be promoted to stimulate development, but it remains relevant forexisting development partly to protect existing rural investment and its economic contribution to the State, andalso to maintain social justice. The viability of rural communities is also important because otherwise thesepeople would increase pressure on metropolitan development. (No. .., p.15)
The reforms needed in the rural water economy go well beyond higher water charges. But it is thehigher charges which will have the most immediate effect upon both irrigators and ruralcommunities. On the one hand, higher charges and a reduction in water usage may mean acontraction in irrigation in some areas and consequent dislocation for local communities. On theother hand, the restructuring could allow an expansion of some crops in particular areas, and theenvironmental benefits could be widespread.
The inevitable shifts in income distribution will be resisted by those adversely affected, in waysalready familiar to the water authoritiesy. As described by the DWR:
Pricing policies were developed on several occasions through the 1980s and, in 1984, a 22 per cent increase inirrigation charges was introduced. The reaction from the irrigation community, particularly in the south of theState, resulted in a "no pay" campaign and subsequently in a deferral in price increases for the next two years.
Further refinements to the water pricing policy were canvassed with the rural community in 1986 and 1987 andthese led to further angry reactions. On this occasion, rural towns drawing water from the State’s regulatedstreams led a campaign against the imposition of charges. These towns previously did not pay for bulk water.
Many of the benefits from reform will be dispersed and appear as incremental gains to thecommunity over many years, whereas the dislocation which accompanies structural change tends tobe obvious, is concentrated and generally immediate, and the individuals and communities affectedhave reason to resist change. This dispersion of benefits and concentration of costs characterises

RURAL WATER 209
virtually all microeconomic reform initiatives. It means that governments have the difficult task ofminimising adjustment pressures on individuals and communities, and doing so in ways that do notunduly delay change.
The penalties of deferring reforms in rural water are large. Delays mean that the benefits ofimproved national income are forgone (see Chapter 3); opportunities for orderly adjustment arelost; governments continue to invest in and refurbish poorly performing assets; and theenvironment is placed further in jeopardy.
The severity of the looming environmental problems was portrayed in stark terms by the MDBCand the Centre for Water Policy Research (CWPR). The Centre argued that the pace and nature ofthe changes required in the Lower Murray-Darling Basin will be:
... more extreme than is commonly anticipated by those who tend to look to, or expect, that technologicalsolutions will be adequate.
To safeguard the environment and at the same time bring orderly adjustment within the irrigationindustries and communities, the CWPR advocated establishment of an irrigation adjustmentauthority which would purchase water (at full cost) for resale to irrigators at a subsidised price. Bythis means, support for the industry would be transparent, the subsidy could be phased out, and theauthority could advise on strategies to help the irrigation industry adjust.
Following the release of the draft report, the CWPR expressed support for the Commission’s reformpackage but reiterated its concern that the capital loss to owners of assets, and the reduction inincomes which could follow from implementation of the proposals, could lead to significantpressures for structural change in the lower Murray-Darling Basin. It stressed the need forplanning, oversight and coordination of the adjustment process.
An important step in the direction of coordinated adjustment was taken in May 1992 when theMurray-Darling Basin Ministerial Council agreed to develop an Irrigation Management Strategy‘to achieve an economically and environmentally sustainable and self-sufficient irrigation industryin the southern Murray-Darling Basin by the year 2010’.
The policy and program initiatives, when developed, are to be tested in four regions:
• the Murrumbidgee Irrigation Area in New South Wales;
• pump irrigation districts in the Mallee regions of Victoria and South Australia;
• the Goulburn Valley in Victoria; and
• the Kerang region, including Tragowel Plains, in Victoria.
The Commission's recommendations for rural water (included with other recommendations in theOverview) should underpin much of the work of the Irrigation Management Strategy. Included inthose recommendations are measures aimed at moderating the adjustment pressures likely to befaced by some irrigators and rural communities. For instance:

WATER RESOURCES& WASTE WATERDISPOSAL
210
- although the recommendations call for an immediate increase in the price of bulk water tocommercial levels, irrigators would be subsidised in the short term by means of an explicitgovernment payment to the bulk water supplier (see Chapter 5);
- the rate of return sought (if any) on existing bulk water supplies should depend on thestrength of demand for water (see Chapter 5);
- in its privatisation proposal, the Commission has recognised that there may be a need forgovernments to hand over money to provide groups of irrigators with an incentive to acceptownership (see Chapter 7); and
- an improved system of transferable water entitlements would provide a modicum ofadjustment assistance to those irrigators who sell their water entitlements (see Chapter 8).
The Commission’s recommendations should be seen as a package aimed at bringing togetherefficiency gains and more sustainable water use. The pace of change should be considerably fasterthan at present.
Apart from the adjustment measures built into the package, adjustment assistance would beavailable to irrigators through the Rural Adjustment Scheme (RAS). Under the RAS, assistancecan be provided in the form of interest rate subsidies, loans and/or grants to farmers experiencingfinancial difficulties beyond their control. The RAS is intended to assist farmers to improve theirperformance by helping them to increase the size of their farms, to restructure their liabilities,improve their managerial and financial skills, or adopt better practices and technology. After allother options have been exhausted, the RAS helps eligible farmers without prospects to leave theindustry.
The restructuring which is inevitable in the older irrigation areas calls for RAS funding whichlooks beyond the situation of individual farmers. Decisions to assist individuals should be takenwith full regard to the rapidly changing circumstances and prospects for farming areas, and indeedwhole regions.

RURAL WATER 211
R4 BURDEKIN RIVER IRRIGATION AREA:
CASE STUDY
The Burdekin River Irrigation Area (BRIA) project was established to expand irrigated agriculturallands in the fertile areas of the lower Burdekin extending from the north bank of the BurdekinRiver to the Haughton River, and from the south bank to the Elliot River. Prior to the scheme, thearea was used for grazing and some irrigation drawing upon groundwater supplies and a series ofsmall dams and weirs.
The principal objective of the project was to provide water supplies for the irrigation of new sugarcane, rice and other crops to promote economic growth in the region. Other objectives were toprovide water for:
• the irrigation of existing cane assignments along the Haughton river with the aim of stabilisingand increasing production of these holdings;
• urban and industrial use in the major centres of the region, in particular,Townsville/Thuringowah; and
• the future installation of a 500 megawatt hydro-electric power station at the Burdekin Falls.
The Burdekin River was dammed at the Burdekin Falls in 1984. The dam impounds the largestbody of fresh water in Queensland, and is capable of supplying over one million megalitres (ML)of water each year to the irrigation area.
Before the commencement of the scheme, a study was prepared by the Burdekin ProjectAssessment Committee to assess the viability of the project. The report (QWRC 1980), released inMarch 1980, made use of conventional cost benefit analysis.
The 1980 study
Two development possibilities for the Burdekin basin were assessed. The first involved a 1.75million ML dam that would supply water to irrigate 45 125 hectares of crop and for urban use inand adjacent to the basin. The other involved an 8.5 million ML dam which would allowagricultural development identical to that for the smaller scheme and, in addition, would permit theconstruction of a hydro-electric power station.
While a future potential for hydro-electric power generation was identified, it was not consideredlikely to be economically feasible in the short to medium term. The report concentrated on themajor water resource requirements associated with agriculture and urban development based on thesmaller scheme.
WATER RESOURCES& WASTE WATERDISPOSAL
212
Streams of benefits and costs were derived for project lives of 50 and 75 years. At that stage, thecost of the smaller project was estimated to be $155 million (in 1977 dollars). The scheme wasexpected to provide for irrigation of an additional 45 000 hectares annually at full development bywhich time about 660 new farms would be served.
Farm budgets for a range of property sizes and farming systems to cover the major soil types in theirrigation area were examined to assess farm viability. Agricultural benefits were estimated for thetype, quantity and price of crops grown within the proposed area. Estimates of the increase inincomes for existing sugar cane growers in the project area were also assessed.
The report argued that the primary benefits which would accrue from the scheme would include:
• direct revenue resulting from the surplus of water and drainage charges and land rentals overannual costs of operation, maintenance and administration; and
• a further increase in net revenue in the event that Townsville city obtained part of its watersupply from the Burdekin River.
Given the assumptions used about future costs, prices and productivity, the analysis indicated thatthe smaller scheme would be `a highly attractive investment' and provide an internal rate of returnon the total investment of about 10 per cent. The smaller scheme was eventually built.
The 1990 study
In 1989-90, the Queensland Government directed the Water Resources Commission of Queensland(QWRC) and the Department of Primary Industries to review the progress in the BRIA and topropose future strategies for the project. The report (Noonan and McNee 1990), released in April1991, noted that investigations had shown that the areas considered suitable for viable agriculturewere significantly less than the initial estimates of 1980 and that the BRIA scheme had not realisedearlier expectations.
The report examined the benefits and costs of the scheme under three development scenarios. Thethree scenarios assumed that development would be completed over 15 years, nine years and fiveyears respectively. The starting point for each scenario was the project aim of developing 50 000hectares of irrigation farm land which would support some 45 000 hectares of crop and releaseabout 500 farms. The principle assumptions are summarised in Box R.1.
For each scenario, the net present value (NPV) was calculated as the difference between the presentvalue of the benefits and associated costs over the life of the project. The benefits were assumed tobe gross value of farm output less farm costs. The main emphasis of valuation was on sugar caneproduction, although a combination of crop rotations was stipulated for each scenario. The costswere taken to be the net public costs invested -- that is, the cost of public investment in thescheme and its operation less water charges. The discount rate used in the calculation of NPVs isnot reported, but the Commission understands that a real rate of interest of 7 per cent was assumed.
RURAL WATER 213
Box R.1 Burdekin development scenarios and assumptions
Scenario 1 : Development over 15 years
The sugar industry in the Burdekin is assumed to expand only marginally faster than the State average. For rice, theindustry target of 100 000 tonnes of paddy production per year is assumed to be achieved by a steady expansion from 30000 tonnes per year. Horticulture is assumed to expand to some 4500 hectares.
Scenario 2 : Development over 9 years
The Burdekin is assumed to take up the sugar expansion rights from all mill areas which have little or no room to expandeconomically. The expansion of rice is curtailed to 50 000 tonnes of paddy per year. Horticulture is assumed to expandas in Scenario 1.
Scenario 3 : Development over 5 years
Under this scenario, it is assumed that the sugar industry is significantly deregulated, world demand remains high, andsugar expansion in the Burdekin is twice that in Scenario 2. Rice and Horticulture are assumed to expand less rapidlythan in Scenario 2.
Source: Noonan and McNee 1990, p. 29.
In all scenarios, the analysis returned a positive NPV with Scenario 3 returning the highest (seeTable R.3). Based on these findings, the report concluded that the scheme was a very attractiveinvestment and would bring considerable benefits to the farmers, the Burdekin region and the State(Noonan and McNee 1990, p. 32).
The fast development scenario (Scenario 3) has since been abandoned because of the difficulty inkeeping up with the stipulated time frame of development. The QWRC now believes that currentdevelopment roughly approximates Scenario 2.
The current development program allows for $15-$20 million of annual expenditure which couldgenerate 30 to 40 farms in most years.
Table R.3: Burdekin development: Net Present Value as calculated in the 1990 study
Scenario Term of development Net present value
(Years) ($ million)1 15 4.12 9 27.93 5 34.7
Source: Noonan and McNee 1990, p. 29.

WATER RESOURCES& WASTE WATERDISPOSAL
214
Participants’ comments
At the initial public hearing in Townsville, submissions were received from a number of growerswho have taken up blocks within the BRIA and farmers outside the scheme. Participants expressedconcerns about resumption and private development matters associated with the development of theBRIA.
As part of the process of compulsory resumption of land for the scheme, existing property ownershave been offered a ‘home’ farm of about 100 hectares. Depending upon the size of the propertyresumed, they have the right to retain one or more ‘retention’ blocks on payment of a charge whichthe Queensland Government said reflects the difference between irrigated and dry land values inthe region. At this stage, the charge is expected to average about $1800 per hectare. Whenresuming properties the QWRC, acting in its capacity as a land developer, has sought to recoup forthe community any windfall gains attributable to the existence of the scheme -- for example, anyadditional value which a property derives from the improved security of water supplies. This hasbeen resented by some property owners, particularly those who had either begun to develop, orplanned to develop private irrigation schemes prior to notification of resumption.
DAVCO said that it had demonstrated its own self sufficiency in water prior to the announcementof the Burdekin Falls Dam and that it has subsequently been penalised by the resumption of land‘regardless of current use or tenure’ and by charges for water which attempt to extract ‘the fullincrease in the value of the land attributable to the advent of irrigation’.
Several participants whose properties have been resumed said that they have received lessfavourable treatment when acquiring a retention block than growers who have purchased blocks atauction. They pointed to the ‘up-front’ charge they have to pay for a retention block compared withthe attractive terms available to purchasers of new farms at auction -- a deposit of 15 per cent, 10equal annual repayments and an interest rate of 12 per cent.
While acknowledging that they are entitled to bid for retention blocks at auction -- thereby takingadvantage of the favourable terms of sale -- they argued that the scope to purchase a contiguousblock can be thwarted by financial constraints if the land is put to auction before final agreementhas been reached on the terms of resumption.
Many growers have taken up blocks with inadequate capital for further development. At the publichearing in Townsville, participants suggested that the terms of sale should be restructured to haveregard to the low levels of cash flow on newly developed properties. The user-pays approach wassaid to be inappropriate in a public irrigation scheme in which users have had no input into the typeof system developed. Arguments were also put that non-farm beneficiaries of the scheme shouldbe required to contribute.

RURAL WATER 215
Participants referred to poor accountability and the absence of any affordable avenue of appeal, andproblems stemming from the delays in resuming land and resolving questions of compensation.The Burdekin Dam Project Landowners Committee (No. 110, p. 5) said that the threat ofresumption, together with actions of the QWRC, has deterred bank funding, depressed the value ofexisting properties, removed the incentive for landholders to undertake further development andblocked private irrigation development. The Committee said that:
The proclamation of the government irrigation scheme and intended resumption brought land use restrictions thateroded confidence and virtually froze all development activity ...
Restrictions on farm size and the regulations governing sugar cane production were also of concernto participants. DAVCO provided information which suggests that a sugar cane farm of around100 hectares, with a 65 hectare assignment, has average costs roughly 50 per cent greater than afarm twice the size, and that average costs continue to fall until farms reach around 700 hectares insize.
The claim that farm sizes in the Burdekin are too small was disputed by the QueenslandGovernment which said:
The current policy bases farm size in terms of the minimum areas of suitable soils as follows:
- 100 ha for sugar cane farms
- 40 ha for horticulture farms
- 300 ha for farms suitable only for rice.
This policy was originally developed in conjunction with the Department of Primary Industries and further workconfirmed the farm sizes in 1987. The Burdekin River Project Advisory Committee has strongly supported theadopted farm sizes.
Some participants argued that the BRIA is being developed in ways which preclude privatedevelopment and subdivision on a larger scale. However, the Queensland Government said thatsince 1989 it has been prepared to consider the possibility of existing landholders developingirrigation land as an alternative to the QWRC. For a landholder to be permitted to develop a largeparcel of land without resumption and resubdivision, the landholder must pay a capital contributiontowards the cost of the State’s works in recognition of the enhanced land value. The Governmentsaid that each case would be individually negotiated, but subject to conditions requiring amongother things that:
• the parcel of land to be developed must meld acceptably with the surrounding subdivisions in terms of farmsize, shape, topography, etc; and
• all works within the parcel would be the responsibility of the developer and all such works must beconstructed to a minimum standard similar to those employed by the Commission in the design of farms.This would ensure any land developed, subdivided and sold by the developer would be of similar standardsof infrastructure to blocks normally disposed of by the Commission.

WATER RESOURCES& WASTE WATERDISPOSAL
216
A number of participants were critical of the design and construction of roads and the irrigation anddrainage works undertaken by the QWRC. The Burdekin Dam Project Landowners Committee, forexample, argued that over-design and problems in location of the irrigation and drainage systems:
... add up to a cost structure that is common in Government schemes and not seen in any large commercialirrigation systems in NSW and other states.
Invicta Canegrowers (transcript p. 1972)and other participants expressed concern that high capitalcosts of the Scheme contribute to high user charges for water.
The Lower Burdekin Rice Producers Co-operative Association claimed that water charges and theexpectation of increases in those charges are holding back development of the BRIA. About 56 percent (2100 hectares) of the rice produced in Queensland is from the BRIA, and a further 10 per cent(350 hectares) from the earlier Burdekin irrigation scheme. The Association pointed out that some16 500 hectares of land within the BRIA are suitable for grain production, predominantly rice.
The Queensland Government’s response
The above comments from participants were included in the Commission’s draft report, along withthe Commission’s view that the resentment expressed by some participants seems to have beenstrengthened by a breakdown in communication with officers of the QWRC.
The Queensland Government’s response included the following:
The DAVCO claim of water self sufficiency for all his landholdings without the project cannot be supported byhydrology or demonstrated achievement. It is a fact that until the project was implemented it was not possible togrant extra allocations in the Burdekin. That is not to deny, however, the efforts made on a water distributionscheme by DAVCO albeit without a regulated supply to underpin its investment.
However, that effort has been more than recognised by the Queensland Government in negotiating terms andconditions for land and water availability with DAVCO.
Landholders claiming auction purchasers have a better deal than retention farmers have failed to acknowledgethree factors:
(i) the cost of the first retention farm, by Government policy to date, has been at its original dry land value,not irrigated value, thereby providing a substantial windfall capital gain to the land holder;
(ii) generally, additional retention farms are paid for from the proceeds of the resumption claim and are nettedfrom that claim -- it would be an additional windfall gain to those landholders if the Government paidthem compensation in cash and then supported their retention farms with an interest subsidy. TheIndustry Commission should note in this regard that the Land Court has generally supported theresumption values offered by this Government where they have been contacted by landholders;

RURAL WATER 217
(iii) retention farms are not subject to competition at auction when the final cost may be significantly abovethe upset price.
The claim that "the user pays approach was said to be inappropriate in a public irrigation scheme in which usershad no input into the type of system developed" is a denial of the role of the Government agency as a developerof the scheme. In reality, large scale irrigation development of those lands would never have been possible oradvanced without Government backing to create an Irrigation Area. Having decided to so invest, the Governmenthad to determine how it would apportion the benefits which would accrue to individuals from the project. Itdetermined that those benefits could be best distributed by resumption and settlement along the "viable familyfarm" concept.
Thus, as the developer, the Government had to place a product onto the market which it believed was the mostappropriate. In determining that, it looked very carefully at life cycle costs of the works, balancing capital againstrecurrent costs for optimum outcome. It also looked very carefully at the balance between public and privatecosts.
Having done so, it placed a product on the open market with more associated information about the product thanhad ever been presented before. Along this path, respected industry advice was formally accepted through aProject Advisory Committee to ensure that the product would be suitable -- in addition a constituted FarmInspection Committee reviews all aspects of farm layout and water/drainage servicing for each block.
Purchasers have then bid at auction for these blocks. Surely the Government can expect that investors who areprepared to commit themselves to such purchases have taken the effort to review the product prior to purchase.
With the above in mind, the Industry Commission should recognise the role of the Government agency as aprovider of a product in the market place, and note that the provider has taken on board many customersuggestions. However, it must still maintain the standard of its product so it can be confident of performanceover time.
In this context, the claims of "a breakdown in communication" between some participants and WRC would morecorrectly be reported as a situation where the market provider refuses to further modify its product for the shortterm good of the individual at the long term cost of the project and community.
The question of farm size in a development irrigation area is always contentious, but the comments in the draftreport about economies of scale miss the point. The increasing economies of scale that are claimed for farms ofup to 700 ha in size would not be achieved by farming one large 700 ha paddock. Practical farmingconsiderations indicate that even in the most favourable topographical situations, individual blocks greater than100 ha would be most unlikely.
The benefits of managing larger areas come largely from efficient use of machinery and manpower. In a largefarm, this would be achieved by working a series of smaller farms of 100 ha or less. Any grower can achieve thisin the BRIA by purchasing multiple blocks at auction. Of course, purchasing multiple 100 ha blocks would costmore than one large block if normal valuation principles are followed. However, given that the Government setout to spread the benefits to individuals in this scheme, each purchaser will need to determine whether theeconomies of scale warrant such expansion.

WATER RESOURCES& WASTE WATERDISPOSAL
218
The demand for one purchaser to secure adjacent blocks at auction has not been overwhelming. At the sametime, to test the market demand, blocks up to 250 ha have been made available. That demand has not beendemonstrated to date in auction biddings.
However, the Queensland Government has and will continue to regularly review the farm size offered.
The Commission is not in a position to adjudicate between landholders and the QWRC, but hasfocused upon questions of cost recovery.
Cost recovery in the BRIA
Public investments in irrigation should generally be made only if there is a reasonable expectationthat the returns will enable the full recovery of costs, including the capital investment. However,once in place, it is sensible to continue to use irrigation infrastructure so long as returns at leastcover operating and maintenance costs. That said, there can be little economic rationale for furtherinvestment in the BRIA unless there is reasonable expectation of a return on the capital yet to beinvested.
An investment project such as the BRIA involves a stream of outlays and a stream of benefits overan extended period. Normally, capital costs will be incurred in the first few years after which therewill be an annual flow of revenue and operating costs. Cost benefit analysis measures benefitsrelative to costs by aggregating all the costs and benefits over time in monetary terms. Thus in thecase of the BRIA, a complete time profile of costs and benefits is the basic information required fora cost benefit analysis. This would typically show construction costs bunched in the early years,operating and maintenance costs continuing and perhaps increasing as the system ages and benefitsrising as farms are established.
For the BRIA, however, a large component (two-thirds) of the project investment is in place. TheCommonwealth and Queensland Governments have each contributed around $130 million inestablishing the BRIA including the Burdekin Falls Dam. Capital outlays totalling over $220million are still to be made by the Queensland Government to complete the scheme. The eventualcost of the project is estimated to be $480 million.
1990 financial analysis
The starting point for the 1990 BRIA project analysis undertaken by Noonan & McNee (1990) wasinvestment analyses of pattern or model farms, based on budgets for individual farms. Differentfarming systems with different crop rotations were assumed. The study also examined thepreferred farm size for different crops, ranging from 100 hectares for sugar farms to 300 hectaresfor rice farms.
The analysis took into account the future costs of completing the project and compared them withthe gross benefits from the whole project (not with the incremental stream of net benefits from theadditional investment in the project). In other words, on the cost side, the Commonwealthcontribution to the scheme totalling $130 million was not part of the assessment.

RURAL WATER 219
If the Commonwealth contribution is taken into account, the estimated net present values becomenegative in all scenarios. This suggests (with hindsight) that the decision to invest in the schemewas ill judged (at least under existing arrangements in the sugar industry -- see below). However,the issue now is whether it is sensible for the Queensland Government to invest more money indeveloping irrigation land in the scheme.
In assessing the various scenarios for BRIA development, the 1990 review made use of a financialmodel of the State’s direct income and expenditure for the project. Having excluded theCommonwealth Government’s contribution to the dam and ancillary works, the review concludedthat ‘in all scenarios the Scheme can be expected to recoup the capital expenditure for the Stateafter some 35 years of indebtedness. The longer term position is a healthy return on the State’sinvestment’ (p. 32).
The parameters used in the 1990 analysis are considered below.
Costs
The presumption is that costs will be recouped through the sale of developed land and throughwater and interest charges over time.
The Queensland Government estimated that capital expenditure of over $220 million will berequired to complete the project. As noted above, the current development program allows for$15-20 million of annual expenditure which could produce 30 to 40 farms in most years. It wasassumed that capital works completed in one year would allow farm sales in the next financial year.
Land sales
Most developed land in the BRIA is sold by auction. Reserve prices are set to reflect the marketvalue of comparable farms. However, existing landholders are entitled to a retention farm withoutneeding to participate in the auction process. The 100 hectare retention land is a type ofcompensation given to existing landholders.
The prices paid for new farms have varied with their size, location, soil types and the extent of on-farm improvements. Farms with an area of 100 hectares or more have returned an average of$2200 per hectare. According to the Queensland Government, current development costs borne bythe QWRC are in the order of $6000 to $6600 per hectare. This is an amalgamated cost comprisingconnections to existing channels plus major new channel developments.

WATER RESOURCES& WASTE WATERDISPOSAL
220
The Queensland Government said that the QWRC’s financial model indicates that the $4000 perhectare shortfall will be bridged over a 35 year period through a margin over and above operatingcosts in its charge for water.
Operation and maintenance costs and water charges
Water charges have increased steadily in the BRIA over recent years from $17.24 per ML in 1983to the current level of $29 per ML, in 1989 dollars. The present policy is that for water supplied bychannels and pipelines to farm boundaries in irrigation areas, prices should raise revenue sufficientto cover operating, maintenance and administration costs, plus a capital contribution. The intentionis that charges be indexed to the consumer price index, thus remaining at $29 per ML in real terms.However, the pricing policy for water supplied by the QWRC is under review.
Other sources of revenue from the scheme include charges of $10.45 per ML for water suppliedfrom the Burdekin river for upstream farms; $16 per ML for waste water diverted from drains; oneoff capital contributions of $100 per ML for all allocations of water in excess of 800 ML forriparian irrigators, and $250 per ML over 800 ML for water supplied from the channel system.Sugar mills also contribute.
The QWRC’s estimates suggest that operation and maintenance costs per ML of water supplied willdecrease with the progress of development. The conclusion that the State will cover its costs after35 years assumes that water charges can be maintained at a level which will provide a substantialmargin over and above operating costs as a contribution to capital costs.
The 35 years payback period derived by the QWRC from its financial model depended heavily onits projected revenue from three sources:
• water supplied from the channel system;
• water sales to Townsville/Thuringowah; and
• water sales to riparian and groundwater irrigators.
However, the revenues from Townsville/Thuringowah users and from riparian and groundwaterirrigators are not dependent on further capital investment in the scheme. In other words, these salescan be made without any further capital expenditure. It is therefore inappropriate to include themin the analysis.
The Commission amended the QWRC's financial model to net out these projected revenues.Further adjustments were made to the QWRC's accumulated deficit on the Burdekin scheme,reducing it by an amount equal to the outstanding interest costs on identifiable capital used toservice Townsville/Thuringowah.
RURAL WATER 221
The effect of these adjustments, with land prices maintained at current levels in real terms, isto increase the payback period for Scenario 2 from 35 years to around 73 years.
Deregulation of sugar would benefit the BRIA
The first new farms were auctioned in March 1988. To date, 53 farms have been sold at auction orby negotiation, the majority to existing Burdekin growers. In October 1991, some farms with 50hectares of sugar cane assignment were offered for sale. However, only three of the 13 farmsoffered were sold. A further farm was sold in June 1992.
The low demand for land and the low prices paid at the Burdekin auctions could well reflect thecurrent low prices for sugar and the poor season in 1991. It would also reflect the regulatorycontrols imposed on the Queensland sugar industry.
The regulations include restrictions on the land available for cane growing and legislativeprovisions which allow the Queensland Sugar Corporation to compulsorily acquire and market allraw sugar produced in Queensland.
In its 1992 report on the Australian Sugar Industry, the Industry Commission found that the effectof the regulations is to:
• tax new production and exports by the application of a fixed 12 per cent payment differential infavour of established growers;
• help perpetuate a scale of cane growing which is below that required to realise the availableeconomies of size;
• impede producers from responding to changes in market conditions;
• reduce competitive disciplines on the Queensland Sugar Corporation to see the highest marketreturns and to minimise costs; and
• discourage growers from pursuing agronomic practices.
The Commission recommended the progressive dismantling of all Queensland production andmarketing controls on raw sugar. The principal social consequences of implementing therecommendations were considered to be an expansion of economic activity in cane growing areas,particularly in the Burdekin, Herbert River, Proserpine and Tully regions.
If sugar industry regulations were removed, the increased profitability of sugar cane growing in theBRIA would presumably be reflected in greater interest in land offered, and consequently higherprices. The Commission has therefore estimated the effects that sugar industry deregulation wouldhave on the price of land in the BRIA.
WATER RESOURCES& WASTE WATERDISPOSAL
222
Prior to the recent auction, some farms had been purchased by existing cane growers who thentransferred cane assignment to the new blocks. In some cases, cane assignment has been purchasedfrom other growers.
While cane assignment has been offered as part of the auction, it has been limited to 50 hectares.Thus, as noted above, farmers intending to grow cane have had to acquire assignment from othersources. In addition, any cane grown on this land would only attract the Pool 2 cane price which is12 per cent lower than the Pool 1 price. Some participants commented that new growers have littlehope of establishing a viable cane farm under these conditions and that blocks could only befarmed in conjunction with an existing property. The Queensland Sugar Corporation, in itsevidence to the sugar inquiry, said that two of the three farms sold in the October 1991 auctionwere bought by neighbouring canegrowers seeking to extend their holdings.
If new growers were able to obtain the average price rather than the lower Pool 2 price, it would beexpected that this additional margin would be reflected in the price bid for land. Based on a sugarprice of US10 cents per pound and discount rates of 10 and 15 per cent, the Commission estimatesthat this margin would be worth an additional $2300 or $1500 per hectare respectively.
The impact on land prices of removing the need for cane assignment is more difficult to estimate.There is some evidence that the value of assignment for No 2 Pool in the Burdekin region in thesecond half of 1991 was of the order of $1000 per hectare. However, the Commission understandsthat the value has since fallen due to the expansion in available assignment.
Whatever the value of assignment, the thrust of the Commission’s analysis is that deregulation ofthe sugar industry could increase land prices in the Burdekin from the current level of about $2200per hectare to at least $4000 per hectare.
At a land value of $4000 per hectare, the payback period for the scheme would be reducedfrom 73 years to 48 years.
Conclusion
As Australia’s most recent large-scale public irrigation project, the BRIA scheme might have beenexpected to avoid the shortcomings of earlier schemes. Yet the scheme is only half way throughthe development phase and the Commonwealth Government’s contribution of some $130 milliontowards the cost of the Burdekin dam has been written off.
In a submission to the inquiry, the Queensland government rejected the notion that theCommonwealth contribution is written off since ‘it will be recovered by the Commonwealththrough many benefits of the development’.

RURAL WATER 223
In the Commission’s view, this sort of reasoning has been used for too long to discount the cost tothe community of poorly performing investments. Underlying the BRIA project has been the 1980assessment that it was a highly attractive investment -- with a direct financial return to all fundsinvested in the scheme. That assessment was presumably influential in the decision to invest in theproject rather than in competing avenues of public expenditure. In the 1990 review theCommonwealth Government’s outlay was not part of the assessment (on the cost side), although itclearly contributed to the finding at that stage, that there would be a healthy return to the State’sinvestment.
To now argue that the Commonwealth’s investment has not been written off because there will bebroad community benefits from the project, is to ignore the likelihood that funds invested in moreproductive ways would have generated even greater benefits for the wider community.
Two-thirds of the proposed investment in the BRIA is in place and can be regarded as a ‘sunk-cost’.Consequently, the issue at this stage is whether or not there can be a reasonable expectation of areturn on the investment (over $220 million) yet to be made by the Queensland Government tocomplete the scheme.
At present, the QWRC recoups only about one-third of its land development costs from land sales.The intention is that the shortfall will be bridged through a capital margin included in the price ofirrigation water.
The financial model of the QWRC (amended as above) suggests that the payback period for theQueensland Government’s investment in the BRIA is around 73 years. Whether this is realiseddepends crucially on the ability of the QWRC to maintain water charges in real terms throughconsumer price indexing. The QWRC will have the politically difficult task of maintaining acapital charge for a long time after the scheme has been completed.
Of course, the prices which growers are willing to pay for land are not independent of water pricingpolicies. Future land prices are likely to fall if current land prices are based on the expectation thatwater prices will fall in line with reduced operating costs, rather than maintained in real terms.This could increase the payback period.
The analysis in this section suggests that the viability of future government investment in the BRIAwould be greatly enhanced by deregulation of the Queensland sugar industry. If the assignmentsystem and two-pool pricing system were removed, the Commission estimates that land priceswould increase from the current level of $2200 per hectare to at least $4000 per hectare. Thiswould imply a payback period, with no return on Commonwealth Government funding, of about 48years (as opposed to 73 years under the current arrangements) assuming a real rate of return of 7per cent.

WATER RESOURCES& WASTE WATERDISPOSAL
224
The model used by the Queensland Government to develop the BRIA involves public installationand ownership of infrastructure, family-size holdings, and generally restrictive land developmentpolicies. The opportunity to establish farms exploiting economies of size has been limited -- notthe least by the production and marketing controls on cane. Less restrictive policies would increasethe incentive for landholders to undertake private irrigation development, and thus could increasedemand for water from the Burdekin. This could further increase the possibility that Queenslandtaxpayers will eventually recoup their investment in the scheme.
In any event, the Commission suggests that in future the financing of land purchases in theBurdekin be left to the private sector. This is to remove the political risk that with financingundertaken by the Queensland Government, payments due on land might sometimes be waived. Itwould also end the small interest rate subsidy to land purchasers provided by Queenslandtaxpayers.
Finally, any consideration of cost recovery must have regard to the environment, since there aremany examples of unsustainable resource use in Australia’s irrigation schemes. With fewexceptions, the public schemes have reached a point where substantial outlays on drainage andother works have been needed to avoid further environmental damage.
The 1980 report on the establishment of the BRIA concluded that the proposed scheme would haveno major adverse effect on the environment (QWRC 1980, p.191). It is now clear that there is aneed to manage groundwater to prevent waterlogging and salinity, and to avoid damage to marineecosystems, such as flushing prawns from the river system.
In a submission discussing coastal degradation from land runoff in the Great Barrier Reef region,the Great Barrier Reef Marine Park Authority (GBRMPA) said:
Progress towards [integrated catchment management] in Queensland is taking place, albeit slowly, but much ofthe research and investigatory work into alternative land management practices is lacking and a system fororganising such research not yet in place. GBRMPA has an active program examining the effects of land runoffon coastal ecosystems but the lack of a complementary program to examine causes of such runoff and irrigationmethods negates much of the value of the program.
As in other systems, it is important that the costs of environmental damage be quantified andincluded in prices. The impact that this would have in extending the period of cost recovery for theBRIA makes deregulation of the sugar industry all the more important for the best interests ofQueensland taxpayers.
RURAL WATER 225
R5 KIMBERLEY PIPELINE PROPOSAL
For a number of years, there has been concern about how to meet the future demand for water inthe Perth region including the Goldfields and Agricultural Water Supply Systems. According tothe WAWA, current total water demand may exceed the region’s water resources soon after the turnof the century. One of the supply options being proposed to meet demand growth is to transferwater into the region from areas of the State with surplus water resources.
Several recent studies on the future water supply options for the Perth region have been undertaken.One proposal which has been a subject of these studies is the development of a pipeline to supplythe Perth region with fresh water from the Kimberley. In May 1988 a report examining the issuessurrounding the proposed pipeline was prepared. (Binnie and Partners 1988)
The Binnie Report considered three pipeline options for delivering water to Perth: the inland route,the Pilbara route and the coastal route. In addition, the report considered the possibility oftransporting water to Perth from the Kimberley using large tanker ships. Consideration was alsogiven to a scheme which would supply water to both Adelaide and Perth.
The report’s main conclusion was that:
If economic analysis of alternative water supply schemes were adopted as the main criteria for selecting a futuresource of water for Perth, then a scheme from the Kimberleys would not proceed.
The report said that the economic (unit) cost of water delivered to Perth was high compared to thecheapest alternative sources (Binnie and Partners 1988, p.6).
In November 1988, another study was undertaken by the Western Australian Water ResourcesCouncil (WAWRC) to investigate the long-term options for water supply to Perth and the south ofthe State, and to show how the area’s growing water requirements can continue to be met in thefuture (WAWRC 1988).
The WAWRC looked at a number of options including the pipeline proposal (see Table R.4). Arange of hypothetical scenarios was examined to identify any conditions under which Kimberleywaters might be developed to jointly serve long-term growth in Perth and demands en-route.
The study confirmed that from a technical point of view, the project was feasible and concludedthat a 1400 mm diameter inland pipeline appeared to be the most economical supply scenario.

WATER RESOURCES& WASTE WATERDISPOSAL
226
Table R.4: Ranked water supply options for Perth
Source Yield Cost a
(million m3/year) ($/m
3)
Forest thinning 29 0.05Excess drainage 40 0.30-0.55South West sources 810 0.53
Moore subregion groundwaterb
110 0.54Brackish water 37 1.00Reuse of waste water 43 0.70-1.70Sea-water desalination >500 1.80Tanking (from the Kimberley) >300 3.30Pilbara pipeline 210 4.90-5.10Kimberley pipeline 870 5.35
a Cost in January 1988 dollars, at 6 per cent discount rateb not for domestic useSource: WAWRC 1988.
The estimated cost of water supplied to Perth was between $3.50 and $5.40 per cubic metre (m3)compared with sea water desalination at $1.80 and water supplied from the South West at $0.53(see Table R.4). The South West option would involve piping water to Perth from rivers andgroundwater reserves.
The report’s main conclusion was that Perth was beyond the economically competitive range foruse of Kimberley water and that there were insufficient benefits to outweigh the high costs of aKimberley-Perth pipeline (WAWRC 1988, p.16).
In 1990, the Infrastructure Development Corporation (IDC) undertook another study of theviability of the pipeline proposal (IDC 1990). The study came up with an estimate of the cost ofwater to Perth of $3.40 per cubic metre. The Corporation also estimated the cost of the wholeproject to be in the vicinity of $8-9 billion.
As part of its brief, the IDC looked at the direct economic impact of the proposed investment on theState’s economy and at the additional or multiplier flow-on effects. The multiplier effect includedindirect effects on suppliers and induced effects in service industries.
The Corporation concluded that there appears to be no significant potential for economic activity ordevelopment resulting from the Kimberley-Perth water pipeline.
On the question of the benefits obtained en-route, the IDC concluded that:
… a pipeline system designed primarily to deliver to an end terminal has variable capacity for intermediate offtake depending on a number of factors relating to capacity and demand. Therefore, to supply a significantintermediate load, sustainable over the life of the project would necessarily entail a commensurate increase incapital and operating costs. At best this would have no benefit in terms of unit cost to Perth consumers. (IDC1990, p.3)

RURAL WATER 227
In 1991, the Western Australian Government commissioned the Chase Manhattan Bank ofAustralia (CMBA) to undertake yet another study into the financial feasibility of the pipelineproposal (CMBA 1991). The Bank recommended that an independent feasibility study look intothe economic, environmental, social, technical and engineering aspects of the proposal beforeconsidering methods of financing the project.
The CMBA concluded that if the proposal were to be found economically feasible, there aresources of finance available in Australia for national infrastructure projects of this type, forexample, accumulated reserves of the superannuation funds.
The Commission understands that an Advisory Board has been set up by the Western AustralianMinister for Water Resources to look into the feasibility of the proposal, taking into account themultiplier effects of the project. There is a view that water’s role in inland development, creatingjobs in the ‘downstream processing’ industries and in ‘adding value’ to mineral exports from thePilbara, need to be considered. The Board is made up of representatives of major mining and othercompanies, and Aboriginal and environmental groups.
In its submission to this inquiry, the Chamber of Commerce and Industry of Western Australiacommented that:
... it seems unbelievable that the Government has established a Kimberley Pipeline Taskforce with responsibilityfor overseeing a further Kimberley Pipeline Feasibility Study ... which will cost $3 million. It is hard to explainhow the State Government can seriously contemplate piping water nearly 3000 kilometres costing at the least$3.45 per cubic metre when there is a viable alternative from the South West for $0.53 per cubic metre.
The Chamber recommended that the Kimberley Pipeline Taskforce be disbanded and the proposalabandoned once and for all, given the large body of evidence which rejects the feasibility of theproject.
In the Commission’s view, there is no justification for constructing or spending further resources inassessing the feasibility of the pipeline proposal.
The Kimberley rivers may well make an important contribution in the long term to the economicgrowth of Australia. However, the plethora of studies already undertaken demonstrate that Perth isbeyond the economically competitive range for use of Kimberley rivers and that there are muchmore efficient water supply options available for the Perth area.
The economic feasibility studies undertaken (eg WAWRC 1988) indicate that the Perth region willbe able to meet expected water demand in the medium term. Those studies show that in the longerterm, the most economical supply option for Perth is to transfer water from the South West region.The South West region could meet Perth’s water needs well into the middle of the next century.
WATER RESOURCES& WASTE WATERDISPOSAL
228
Proponents of the pipeline proposal argue that there is mounting community disquiet about theenvironmental costs of damming the remaining South West rivers and the development of newborefields throughout the region. However, given the costs of piping water from the Kimberleys,environmental costs would have to be quite massive to see the pipeline proposal proceed inpreference to the South West option. Even if environmental concerns were a major issue, thedesalination option would be less than half the cost of the pipeline.
The argument that the pipeline would have multiplier (or spill-over) effects to the communityshould carry little weight. It ignores the fact that the capital invested in more productive andprofitable activities would generate even greater multiplier effects for the community.
The community’s investment in the Ord River dam is now sunk. This does not justify further biginvestments with no prospect of a return, simply to use some of that water. The likelihood that theWestern Australia Government would be prepared to charge in excess of $5.00 a cubic metre forKimberley water is remote. Hence, if the project proceeded, major government subsidies would beinevitable. Australians can no longer afford the loss of welfare that this would entail.

INFORMATIONSOURCES
229
APPENDICES
A INFORMATION SOURCE
B INSTITUTIONAL ARRANGEMENTS
C PRICING AND COMMUNITY SERVICE OBLIGATIONS
D ECONOMY-WIDE GAINS FROM PRODUCTIVITY IMPROVEMENTS
E RURAL WATER ARRANGEMENTS AND ISSUES: STATE SUMMARIES

230 WATER RESOURCES& WASTE WATERDISPOSAL

INFORMATIONSOURCES
231
APPENDIX A: INFORMATION SOURCES
The Commission received its terms of reference on 18 July 1991. An issues paper was releasedshortly after receipt of the reference to assist people to prepare their submissions. Some 140submissions were received in response to the issues paper from a wide range of interested parties.The Commission held public hearings to discuss these submissions in: Melbourne on 1 and 2October, Adelaide 8 October, Perth 10 and 11 October, Brisbane 16 October, Sydney 23 to 25October, Moama 31 October and 1 November, Canberra 6 to 8 November and Townsville 18 and19 November 1991.
The Commission released its draft report in March 1992. It received a further 86 submissionscommenting on the draft and held a second round of hearings in Adelaide on 5 May, Perth 6 May,Melbourne 14 and 15 May, Sydney 19 and 20 May, Townsville 21 and 22 May, Shepparton 26 and27 May and Canberra 18 June 1992.
Participants that made written submissions to the inquiry are listed in section A.1 below.Abbreviations used to identify participants in the report are shown in square brackets.
The Commission also consulted the interested parties listed in section A.2.
The Commission also engaged two consultants. London Economics was engaged to reviewinternational experiences with the private provision of WSD services -- with a view to identifyingissues that would be of relevance to any future privatisation in the Australian water industry(London Economics 1992). Tasman Economic Research was engaged to investigate thedistributional impacts on water users of a move to pay for use water pricing (Tasman EconomicResearch 1992). Copies of the consultants’ reports are available, on request, from the Commission.
A.1 Inquiry participants
Aboriginal and Torres Strait Islander Commission [ATSIC] *ACT Electricity and Water [ACTEW] (102, 140, 197)ACT Planning Authority (106)Appleby, Ms S (136)Aquatec-Maxcon Pty Ltd (26)Association of Victorian River Management Authorities (87, 180, 225)Australian Bureau of Agriculture and Resource Economics [ABARE] (192)Australian Conservation Foundation, [ACF] Queensland (25)Australian Conservation Foundation, IACF] Shoalhaven Branch (212)Australian Conservation Foundation, IACF] Victoria (36, 127, 159)Australian Conservation Foundation, IACF] Western Australia (54)Australian Federation of Construction Contractors (92)Australian Institute of Marine Science (117)Australian Irrigation Council [AIC] (163)Australian National Committee on Large Dams (165)

232 WATER RESOURCES& WASTE WATERDISPOSAL
Australian Paper Manufacturers (38)Australian Radiation Laboratory, Department of Community Services & Health (24)Australian Water and Wastewater Association, Victorian Branch (58)Australians for an Ecologically Sustainable Pop., New South Wales Branch (81, 178)Ballarat Regional Board (95)Ballarat Water Board (19)Banana Shire Council (132)Barcza, J & L. D (221)Becke, Mr A J (109)Benalla Water Board (22)Bendigo Water Board (46)Brisbane City Council [BCC] (59)Broken Hill Water Board (79)Bundaberg City Council (124)Bundaberg Sugar Company Limited (43)Burdekin Dam Project Landowners Committee (110)Bureau of Meteorology (12)Cairns District Cane Growers’ Executive (108)Campaspe Region Water Authority (168)Canegrowers (70)Canegrowers, Herbert River District (112)Centre for Water Policy Research, University of New England [CWPR] (63, 189)Chamber of Commerce and Industry, Western Australia (208)Christensen Family (113)City of Horsham (47)City of Launceston (11)City of Marion (18)City of Shepparton (61)City of Werribee (191)Colac District Water Board (39, 151)Commonwealth Department of Primary Industries & Energy [DPIE] (101, 210, 220, 226)Condamine Balonne Water Committee (182)Consulting Environmental Engineers (3)Council of the City of Thuringowa (131)Council of the Municipality of Mosman (10)CSIRO (57)CSR Sugar Mills (30)Davco Farming (107, 129, 183)Department of Agriculture, Western Australia (123)Department of Mineral Resources, New South Wales (76)Department of Water Resources, [DWR] New South Wales (80)Dwyer Leslie Pty Limited (104)Environment Standing Committee of the Aust. Institute of Environmental Health (40)Environmental Protection Authority, [EPA] Western Australia (152)Federal Bureau of Consumer Affairs (198)First Mildura Irrigation Trust (164)Ford, Mr N *French, Mr R, University of New England (15)Friends of the Earth (173)Geelong and District Water Board [GDWB] (34, 175)Glen Echo (84)

INFORMATIONSOURCES
233
Great Barrier Reef Marine Park Authority (44, 206)Greenfield, Dr P, Dept of Chemical Engineering, University of Queensland (20)Griffith City Council (184)Grigg, Dr T J, Graduate School of Management, University of Queensland (64)Hacienda International Motor Inn, Sale (139)Hamilton Water Board (146)Hawkesbury River Environment Protection Society Inc. (114)Hay Shire Council (1)Health Department, Western Australia (55)Heidecker, Dr E, University of Queensland, Department of Geology & Mineralogy (7)Howell, Mr D *Hunter Water Corporation [HWC] (73)Institute of Science & Technology Policy, Murdoch University (153, 204)Invicta Canegowers *Johnstone Shire Council (31)Kelly Farming Company (111)Kimberly-Clark Australia Pty Ltd (42, 116, 172)Latrobe Regional Commission (8)Latrobe Region Water Authority (66)Local Government Association of New South Wales and Shires Association of New South Wales (94, 218)Local Government Engineers’ Association of Queensland Inc. (90, 176)Londonderry R.A.G.E. (85, 185)Lower Burdekin Rice Producers Co-operative Association Limited (119)Macquarie Valley Irrigators Association (71)Master Builders’ Association of Western Australia (126)Master Plumbers’ & Mechanical Services Association of Victoria [MPMSAV] (48)Max Motel, Nambucca Heads (138)McInnes, Ms S (207)Melbourne Water Corporation [MWC] (29, 157, 179, 211)Memtec Ltd (6)MIA Council of Horticultural Association (177)Mid Goulburn River Management Board (91, 181)Migmaplas Pty Ltd (82, 141)Ministry for the Environment, New South Wales (77)Municipality of Circular Head (188)Murray-Darling Basin Commission [MDBC] (213)Murray River Management Board (32)Murray River Management Board and Murray Irrigation Area and Districts Management Board (167)Murray Valley League (224)Murrumbidgee Irrigation Management Boards (33, 169, 223)Murrumbidgee Valley Water Users’ Association (9)Musgrave, Prof W, Centre for Water Policy Research, University of New England (199)Narrandera Shire Council (174)National Farmers’ Federation [NFF] (88, 97)National Health & Medical Research Council (Water Quality Panel) [NHMRC] (56)National Irrigation Research Fund [NIRF] (16)Nature Conservation Council of New South Wales (162)Neutron Probe Services Pty Ltd (142)New South Wales Department of Agriculture (78)New South Wales Environment Protection Authority (194)
234 WATER RESOURCES& WASTE WATERDISPOSAL
New South Wales Government (72)New South Wales Irrigators’ Council (13, 156)New South Wales Treasury (195)North & South Burdekin Water Boards (93)North Queensland Conservation Council (122)North-West Catchment Management Committee (62)Northern District Sugar Industry Productivity Group (27, 118, 120)Northern Lower Goulburn Flood Committee (190)Northern Territory Government (103)Office of Catchment Management, Western Australia (215)Ord Development Council (35)Patterson, Mr R A, Department of Resource Engineering, Uni. of New England (128)Penrice Soda Products Pty Ltd (28)Phillips, Mr J (154)Portland Water Board (68)Public Sector Research Centre, University of New South Wales (201)Public Works Department, [PWD] New South Wales (75, 161, 216)Pulp & Paper Manufacturers Federation of Australia Ltd (96, 121, 205)Queensland Dairyfarmers’ Organisation (202)Queensland Government (69, 134, 200)Ricegrowers’ Association of Australia (2, 60, 219)River Basin Management Society (Inc) (17)Riverland Fishermens Association (144)Rochester Water Board (5)Rockhampton City Council (125)Salinity Program Advisory Council (65, 155)Shepparton Water Board (37)Shire of Cranbourne (67, 166)Shire of Kaniva (143)Simmonds and Bristow Pty Ltd (149)Snowy Mountains Council [SMC] (14)Snowy Mountains Hydro-Electric Authority [SMHEA] (41, 137)South Australian Fishing Industry Council Inc. (147)South Australian Government (52, 115, 148, 214)South Burdekin Water Board (170)Southern Fishermens Association and Lakes and Coorong Professional Fishermens Association (145)Sunraysia Water Board (83, 99, 150)Sydney Water Board [SWB] (74, 196)Tasmanian Government (98)Thomas, Mr J F (135)Thompson, Mr R (193)Townsville City Council (105, 171)Trade Practices Commission [TPC] (222)United Farmers and Stockowners of South Australia Inc. (187)Urban Water Research Association of Australia [UWRAA] (209)Victorian Farmers’ Federation [VFF] (23, 100, 160)Victorian Government (49, 130, 158, 217)Victorian University of Technology (4)Water Authorities Association of Victoria Inc. (86)Water Authority of Western Australia [WAWA] (51, 186)Water Industry Training Association (Queensland) Inc. (21)

INFORMATIONSOURCES
235
Waterways Commission (53)Watson, Mr R; Murphy, Ms M; and Moore, Dr S (89)West Moorabool Water Board (50)Western Australia Treasury (203)Whyte, Mr J V (45)Wright, Dr H, Kimberly-Clark Australia Pty Ltd (133)
* Provided verbal evidence at a hearing only( ) Submission number(s)
A.2 Informal discussions
The Commission held informal discussions with the following organisations and individuals:
New South Wales
Australian Federation of Construction ContractorsAustralian Water and Wastewater AssociationDepartment of Public WorksDepartment of Water ResourcesHunter District Water BoardLocal Government and Shires AssociationMinistry for the EnvironmentNew South Wales Farmers’ FederationNew South Wales Irrigators’ CouncilState Pollution Control CommissionSydney Water Board
Victoria
Association of Professional Engineers, AustraliaBendigo Water BoardDepartment of Conservation and EnvironmentEnvironmental Protection AuthorityGeelong and District Water BoardGoulburn Regional Advisory CouncilMelbourne Water CorporationMelbourne Water Resources Review PanelMurray Valley (Cobram) Irrigation Advisory CommitteeDepartment of Water ResourcesPatterson, Dr J and Anderson, Mr DRodney Shire CouncilRural Water CorporationRural Water Corporation, SheppartonSalinity Program Advisory CouncilShepparton Water BoardVictorian Conservation CouncilVictorian Farmers’ Federation

236 WATER RESOURCES& WASTE WATERDISPOSAL
Queensland
South East Queensland Water BoardBrisbane City CouncilDavco FarmingQueensland Water Resources Commission
Western Australia
CSIRO, Division of Water ResourcesDepartment of AgricultureEnvironment Protection AgencyGardiner, Mr (consultant/farmer)Ord Irrigators CouncilOrd Development Co-opOrd Development CouncilState TreasuryWater Authority of Western AustraliaWaterways Commission
South Australia
Department of Engineering and Water SupplyDepartment of Environment and Planning (Environment Protection Council)
Tasmania
City of Clarence CouncilCity of Hobart CouncilDepartment of Environment and PlanningDepartment of HealthDepartment of Primary IndustryHydro-Electric CommissionLaunceston City CouncilMunicipality of SorellRivers and Water Supply CommissionTasmanian Government
Northern Territory
Conservation CommissionDepartment of Health and Community ServicesDepartment of Industry and DevelopmentDepartment of Land and HousingDepartment of Mines and Energy (Mining Environment Directorate)Department of Primary Industries and FisheriesPower and Water AuthorityState TreasuryWork Health Authority

INFORMATIONSOURCES
237
Australian Capital Territory
ACTEWDepartment of Primary Industries and EnergyLower Molonglo Water Quality Control CentreMurray-Darling Basin CommissionResource Assessment Commission
Other
London EconomicsMaruia Society, New ZealandYorkshire Water Board

238 WATER RESOURCES& WASTE WATERDISPOSAL

INSTITUTIONALARRANGEMENTS
B.239
APPENDIX B: INSTITUTIONAL
ARRANGEMENTS
This appendix provides an overview of the institutional arrangements for the provision of urbanwater, sewerage and drainage (WSD) services, water resources management, related environmentalactivities, research and development (R&D) and extension services. It also reviews variousrelevant government initiatives and programs in these areas. Institutional arrangements, programsand initiatives for irrigation and other rural services are, with the exception of R&D and extensionmatters, detailed in Appendix E.
B.1 Commonwealth Government involvement
Under the Australian Constitution, the Commonwealth has direct powers in two water-relatedareas: the Australian Fisheries Zone and meteorological activities. The right to manage andcontrol the use of surface and groundwater resources remains primarily with the States.
However, because the development and management of water resources in the States has animportant bearing on the Commonwealth’s broad interests in economic management, resourceallocation, distribution of income etc it participates in a range of water resource activities.
In 1984, the Commonwealth announced three major water policy objectives:
• the availability of water, adequate in quantity and quality, for all beneficial uses;
• the adoption of measures which improve the efficiency and effectiveness of water supply anduse; and
• the development of a comprehensive approach to interrelated water and land managementissues.
In working to achieve these objectives, the Government said, in 1989, that it will:
• support and encourage State initiatives through the Australian Water Resources Council and the Murray-Darling Basin Ministerial Council
• pursue the development of pricing policies which will encourage efficient water use and help preventenvironmental degradation
• take greater account of the inter-relationship between land use management - whether it be for agricultural,domestic or industrial purposes - and its effect on our water resources. (Commonwealth of Australia 1989, p45)
It is mainly through co-operation with the States that the Commonwealth is able to pursue theseobjectives. This is facilitated directly through bodies such as the Australian Water ResourcesCouncil (AWRC), the Murray-Darling Basin Ministerial Council (MDBMC) and the Land and

WATER RESOURCES& WASTE WATERDISPOSAL
B.240
Water Resources Research and Development Corporation (LWRRDC), and indirectly through theprovision of financial assistance to the States and Territories for water resources development andmanagement initiatives. Financial assistance is provided primarily through the Federal WaterResources Assistance Program (FWRAP). The Commonwealth also provides financial assistanceto supply water to remote communities (including aboriginal communities) either through theCountry Towns Water Supply Improvement Program (COWSIP) or through the Aboriginal andTorres Strait Islander Commission’s (ATSIC) community infrastructure programs.
The Commonwealth Government’s involvement in water resources matters also extends to theprovision and funding of information and research; natural disaster relief; and, to coordination ofenvironmental issues that transcend State boundaries.
The power to legislate and regulate on environmental matters rests mainly with the State andTerritory Governments.1 The Commonwealth’s direct environmental powers derive mainly fromthe World Heritage Properties Conservation Act 1983 and the Environment Protection (Impact ofProposals) Act 1974. Under these Acts, the Commonwealth can restrict development in worldheritage areas and can require that an Environmental Impact Statement be prepared during theformulation of certain development proposals. However, the Commonwealth has also used variousconstitutional powers to influence water resources management, including:
• the power to regulate interstate trade and commerce, which the Commonwealth used to justifyits membership of the Murray-Darling Basin Commission;
• the national defence power, which was used to support the establishment of the SnowyMountains Hydro-Electric Scheme in 1949;
• the external affairs power, which was used to stop the Gordon Dam in Tasmania because it wasin an area which had received World Heritage listing;
• provisions which allow the Commonwealth to grant financial assistance to a State on suchterms and conditions as it thinks fit, have been used to provide considerable Commonwealthfunding for water infrastructure; and
• other miscellaneous powers, such as the meteorological observations power, taxation powers,and the territories power. (Mulligan and Pigram, 1989)
Peak Commonwealth and joint Commonwealth/State bodies concerned with the environmentalimpact of WSD services are the Departments of Arts, Sport, Environment and Territories (DASET)and Primary Industries and Energy (DPIE), the AWRC and the LWRRDC. Other bodies involvedin this area include the MDBMC, Snowy Mountains Council (SMC), the Commonwealth Scientificand Industrial Research Organisation (CSIRO) and the National Health and Medical ResearchCouncil (NHMRC).
1 Local Governments are also empowered by State Local Government Acts to impose additional controls,although State Governments have the power to overrule Local Government decisions.
INSTITUTIONALARRANGEMENTS
B.241
The Commonwealth Environment Protection Agency has been formally approved and is currentlyoperating within DASET.
Commonwealth and joint Commonwealth/State water bodies
The major bodies through which the Commonwealth pursues its water policy objectives and thoseresponsible for the delivery of its water-related programs are outlined below.
Department of Primary Industries and Energy
DPIE is primarily responsible for water policy co-ordination matters, information, research policyand coordination, and funding of assistance to certain types of water resource projects. TheDepartment also provides secretariat services to the AWRC and the LWRRDC.
According to DPIE, the Commonwealth’s involvement in water is two-dimensional. First, it seeksto promote the economic and sustainable management of water. Second, it is concerned with wateruse and allocations as an important influence on the economic performance and on-going viabilityof Australia’s rural industries. The Department stated that the Commonwealth’s water policyobjectives are a component of broader integrated natural resource management policies and aredesigned to achieve:
• the long term productivity of Australia's water resources;
• community, industry and government partnerships in the management of water resources;
• institutional arrangements which encourage sustainable resource use;
• the resolution of conflict over access to resources by competing users; and
• global resource management strategies which meet Australia's responsibilities and needs.
Australian Water Resources Council
The AWRC is the water industry's peak forum and comprises Commonwealth, State and TerritoriesMinisters who have primary responsibility for water resource management. It is chaired by theCommonwealth Minister for Primary Industries and Energy. The Council's terms of reference areto:
• provide a forum for consultation, co-operation and liaison for the development of waterindustry policy at international, Federal, State and Local levels;
• initiate and direct collaborative Commonwealth/State programs of investigations and datacollection/dissemination;

WATER RESOURCES& WASTE WATERDISPOSAL
B.242
• promote relevant water research; and
• enhance the long term management of the water industry and water resources for the benefit ofthe community.2
The Council is supported by a Standing Committee, comprising permanent heads of relevant Stateauthorities and DPIE. The CSIRO and the Bureau of Meteorology are also represented andMinisters can nominate additional representatives in accordance with the requirements of theagenda for each meeting. The Standing Committee is serviced by a number of advisorycommittees and the Council can also establish ad hoc task groups for advice on particular topics.
In recent years the AWRC has extended its work to industry-wide issues such as pricing andfinancial policies (including inter-agency performance comparisons), resource management,technology, and organisational management and strategy. Since 1989, the Council has, as apriority, focussed its attention on a national approach to the management of water quality. This hasinvolved the development of a framework for water quality management in co-operation with,amongst others, the Australian and New Zealand Environment and Conservation Council(ANZECC), and the drafting of national guidelines for drinking water quality with the NHMRC.Guidelines are also proposed for sewerage systems, water quality management in the ruralenvironment, groundwater protection and urban stormwater systems.
The AWRC's activities are jointly funded by the Commonwealth and State Governments, and themajor water authorities.
Land and Water Resources Research and Development Corporation
The role of the LWRRDC is to stimulate, co-ordinate and fund research and development activitiesin relation to the nation's land, water and related vegetation resources. Further information on theLWRRDC's activities is given in section B.10 of this Appendix.
Murray-Darling Basin Ministerial Council
Under the Murray Darling Basin Initiative and relevant agreements, the primary role of theMDBMC, which was established in 1985, is to promote and co-ordinate planning and managementstrategies for the sustainable use of the basin's land, water and environmental resources. It consistsof Ministers with land, water and environmental responsibilities from the Commonwealth, NewSouth Wales, Victorian, South Australian and Queensland3 Governments.
2 There is a Commonwealth-initiated proposal to merge the AWRC with the Australian Soil ConservationCouncil to form a national land and water resources council.
3 The Queensland Government commenced its participation on 1 July 1992. The other four governments arefoundation members of the MDBMC.

INSTITUTIONALARRANGEMENTS
B.243
In 1989, the Council released two key strategies:
• a Natural Resources Management Strategy (NRMS), which provides a framework to achievesustainable resources use through planning and management programs and joint communityand government action; and
• as part of the NRMS, a Salinity and Drainage Strategy (SDS) to:
- improve water quality in the River Murray for all beneficial uses;
- control existing land degradation, prevent further land degradation and, where possible,rehabilitate land resources to ensure sustainable use; and
- conserve the natural environment of the Basin and preserve sensitive ecosystemswith respect to salinity.
Murray-Darling Basin Commission
The MDBC (formerly the River Murray Commission, which had operated since 1917), wasestablished in 1988. It comprises eleven Commissioners, two each from New South Wales,Victoria, South Australia, Queensland and the Commonwealth, and an independent president.
The Commission is responsible for:
• managing the flow and quality of water in the Murray River and, administering theconstruction, operation, maintenance and control of works, involving some $2 billion of assets;
• advising the MDBMC on major policy questions relating to water, land and environmentalissues of common interest to the Governments involved;
• implementation of the Salinity and Drainage Strategy; and
• funding research into Basin management problems.
It is effectively Australia's largest integrated catchment management authority.
After deducting Queensland's $150 000 contribution, administration costs incurred by the MDBC,which totalled $4.2 million in 1991-92, are shared equally by the Commonwealth, New SouthWales, Victorian, and South Australian Governments -- as are construction, research andinvestigation costs. Any Queensland Government contribution to these latter activities is made ona case by case basis. Operations and maintenance costs are shared equally by New South Wales,Victoria and South Australia. The Queensland Government is currently not a party to any salinityagreements.
An Irrigation Management Strategy is currently being developed by the MDBC for approval by theMDBMC at its May 1993 Council meeting.

WATER RESOURCES& WASTE WATERDISPOSAL
B.244
The annual budget for on-going programs in the Murray-Darling Basin is currently $71 million ofwhich some $41 million is dispensed through the Commission.
Bureau of Meteorology
As the national hydrometeorological authority, the Bureau of Meteorology plays an important rolein the assessment, planning and development of Australia’s water resources. It contributes, forexample, through its operation of the national hydrometeorological observation networks and databank, and its provision of flood forecasting and warning, water resource assessment andhydrometeorological consultative services. In some instances, the cost of these activities is sharedwith State/Local Government agencies.
Snowy Mountains Council
The SMC, which was established in 1959, has responsibility for the control and direction of theSnowy Mountains Scheme. The water in the scheme has a dual purpose, being used for thegeneration of electricity as well as providing a regulated water supply for downstream irrigationand other uses. The Council’s members include representatives from New South Wales, Victoria,the Commonwealth and the Snowy Mountains Hydro-Electricity Authority.
The Commonwealth recently initiated a joint review of the Snowy Mountains Scheme to examinethe financial and institutional arrangements under which the Scheme is operated. The SMC saidthat the interim report recommended, among other things, corporatisation of the Scheme.Apparently a final report on this matter is unlikely to be released publicly. And whilecorporatisation remains a priority issue the Commission understands that it is unlikely to beentertained until other more fundamental institutional arrangements are resolved. In this regard,the Commonwealth Government has offered to buy out the contracts for supplying water andelectricity currently held by the New South Wales and Victorian Governments.
Commonwealth Scientific and Industrial Research Organisation
The CSIRO conducts a wide range of water-related research. The Division of Water Resources hasa total staff of more than 200 with laboratories in Perth, Adelaide, Griffith and Canberra. TheDivision’s task is to develop new and improved practices for the definition, use and management ofAustralia’s water resources. Other divisions involved in water-related research include the Divisionof Chemicals and Polymers, the Centre for Environmental Mechanics, the Division of FuelTechnology and the Division of Soils. CSIRO is also a partner with the LWRRDC, the MDBC andthe Albury-Wodonga Development Corporation in the Murray-Darling Freshwater Research Centreat Albury, New South Wales.
CSIRO spends about $20 million per annum on water-related research.
INSTITUTIONALARRANGEMENTS
B.245
National Health and Medical Research Council
The NHMRC has, since 1980, been jointly responsible with the AWRC for setting nationaldrinking water guidelines. These guidelines are advisory only. Individual local health and waterauthorities are responsible for setting quality standards in individual jurisdictions. Authorities maychoose to meet other standards set, for instance, by the World Health Organisation or ANZECC.
Commonwealth and joint Commonwealth/State water resources programs
Federal Water Resources Assistance Program
Since 1984-85, Commonwealth assistance to the States and Territories for water-related purposeshas mainly been provided through the FWRAP. Assistance under this program has been providedfor projects judged to further Commonwealth water policy objectives, to be of nationalsignificance, or to represent a special case warranting Commonwealth support (eg health and damsafety). Assistance for approved projects is by way of concessional loans and grants, and isprovided only for headworks, research and information dissemination purposes.
In 1990-91, FWRAP payments to the States and Territories totalled $25 million ($21 million hasbeen allocated for 1991-92) provided under six sub-programs, namely:
• urban and industrial water supplies, including the COWSIP scheme (see below);
• agricultural water supplies;
• floodplain management;
• salinity reduction and drainage;
• water conservation and efficiency improvement; and
• water planning.
Details of Commonwealth payments to the States under FWRAP for the period 1984-85 to 1991-92, are set out in Table B.1. Over the period, some 63 per cent of expenditure was committed toinfrastructure projects; mostly dams for irrigation development, as well as urban and industrialwater supply projects. Other major expenditures have been on structural and non-structuralapproaches to salinity and floodplain management.
According to DPIE, the emphasis on capital works funding has declined recently due to a shift inpriority away from government regional development objectives towards sustainable resourcedevelopment and efficiency of resource use.

WATER RESOURCES& WASTE WATERDISPOSAL
B.246
Table B.1: Water-related Commonwealth payments to the States and Territories, 1984-85to 1991-92($’000)
Type of Payment 84-85 85-86 86-87 87-88 88-89 89-90 90-91 91-92
FWRAP Payments to the StatesWater resource assessment 6 780 6 865Salinity mitigation 1 378 981 1 160 1 250 5 446 9 845 972 430MDB salinity mitigation 5 295 5 225 6 233 4 689 3 560 4 449 1 429 1 130Floodplain management 5 429 6 440 5 566 5 607 6 910 8 101 7 161 7 804Western Sydney flooding 970COWSIP 1 656 3 233 4 919 6 197 4 362 5 052 4 955Agricultural water supply 26 700 30 000 34 007 20 500 6 150 4 728 3 381Water conservation 125 125 190 445 1 270 1 272Water planning 206 563 753 623 486 207 521 864Urban & ind. water supply 14 740 10 297 11 250 6 164 5 750 5 250 5 250 3 500
Total 60 528 62 027 62 327 43 877 34 689 37 387 25 036 20 925
Murray Darling Basin InitiativeAdministration 207 316 313 359 430 672 822 967Community Advisory Committee 71 77Salinity investigations 231 193 217 263 509 407 286Investigations & construction 1 095 1 828 1 922 1 345 663 687 1 650 1 026Salinity construction 1 710 2 881 1 325 1 998MDB Drainage Program 4 278 5 509NRMS interstate 886 1 224 1 850NRMS intrastate 1 041 4 431 5 150
Total 1 302 2 375 2 428 1 921 3 066 6 676 14 208 16 863
Payments to Commonwealth authorities 382 306 466 437 398 183 206 260Water research programs 467 598 3 333 6 182 7 300 7 017 2 376Land and Water R&D Corporation 8 894 10 785Sewerage research 200
TOTAL WATER PROGRAM 62 679 65 306 68 554 52 417 45 453 51 463 50 720 48 833
Source: DPIE submission
Country Towns Water Supply Improvement Program
COWSIP was introduced in 1983-84 under the Community Employment Program and has sincebeen continued as a sub-program under FWRAP. Under COWSIP, the Commonwealth providesfinancial assistance to the Northern Territory and State and Local Governments to improve thequality and quantity of water supplies for communities of fewer than 5000 people which wouldotherwise not be able to afford the capital works. The DPIE said that the provision of capitalsubsidies under this program reflects the limited ability of the local community to fundimprovements which overcome water supply deficiencies and aims to encourage the adoption ofalternative and low cost approaches to water supply. The Department also said that a key elementof project formulation is to ensure that communities can afford to maintain the upgraded systemonce in place.
INSTITUTIONALARRANGEMENTS
B.247
COWSIP expenditure in 1990-91 totalled $5 million (see Table B.1). A proportion of this has beenspent on developing water supplies for Aboriginal communities. The priority to assist Aboriginalcommunities within COWSIP is determined by the individual State and Territory Governments.Apparently, virtually all of the Northern Territory’s allocation goes towards infrastructuredevelopment for Aboriginal communities.
Aboriginal and Torres Strait Islander Social Advancement Program
Funds to develop Aboriginal water supplies are also provided under ATSIC’s Social AdvancementProgram. The aim of this program is to improve the health and social well being of Aboriginalsand Torres Strait Islanders to a standard commensurate with that of the general Australiancommunity. The program covers, among other things, funding for community infrastructure suchas power and water supplies and sewage disposal.
In 1989-90, expenditure on this program was $915 million. Included in the program is a paymentfor the Priority Communities Development Strategy, a sub-program which has provided more than30 water supply systems to priority disadvantaged communities since 1988-89.
Murray-Darling Basin Initiative
The Murray-Darling Basin Initiative includes a suite of programs designed to promote equitable,efficient and sustainable use of the water, land and environmental resources of the Basin.
The Commonwealth allocated $15.8 million in 1991-92 for a range of projects, includinginvestigations and construction for salinity mitigation and drainage, and the NRMS (see Table B.1).These programs are administered through the MDBC.
A key program in the initiative is the SDS, developed to address the Basin’s river salinity, landsalinisation and waterlogging problems.
The cost of salt to downstream urban, industrial and agricultural users has been put at around $37million a year, while an estimated value of production forgone from land salinisation andwaterlogging in the Basin is $65 million annually (Young, Cocks and Humphries 1990, p 3). In theRiverine Plains area alone, the MDBC said that economic losses due to salinity are estimated toincrease from $44 million per annum now to $123 million per annum in 2040 if no remedial actionis taken.
The SDS provides a framework to improve the quality of water in the Murray River through asystem of debits or credits to New South Wales’ and Victoria’s salinity accounts. The aim of the

WATER RESOURCES& WASTE WATERDISPOSAL
B.248
strategy is to reduce the level of salinity at Morgan, South Australia by a net 80 EC (units ofelectrical conductivity) through salt interception schemes to be funded by the States and theCommonwealth. In return for their contribution, New South Wales and Victoria will each receive15 EC salinity credits, enabling them to discharge saline drainage into the river system. Additionalsalinity mitigation undertaken by the States, will earn additional salinity credits. Penalties will beimposed for salinity levels above the agreed baseline.
At this stage, interception and management programs are underway with salinity credits availableon a pro rata basis according to the completion of effective salt interception works.
B.2 New South Wales
Administration
Water resources in New South Wales are controlled and managed by the Department of WaterResources (DWR), which reports to the Minister for Natural Resources.
The DWR’s main responsibilities are to:
• co-ordinate policies and programs of State and Local Government authorities providing watersupplies and other water services;
• plan for future water needs;
• operate the rural water supply networks;
• control the use and management of surface and ground water resources through water licensingand transfer systems;
• provide floodplain management and flood mitigation services in non-tidal areas;
• provide for wetlands, wild and scenic rivers and in-stream or environmental water needs;
• improve water quality;
• control salinity;
• maintain water resource assessment programs; and
• effectively manage the State's water infrastructure.
Many other government agencies have an interest in and effect on decisions made by the DWR. In1989, the New South Wales Government established the Water Resources Council to co-ordinatethis input. The Council's main responsibilities relate to forward planning and, conflictidentification and resolution. Membership consists of an independent part-time Chairman and the

INSTITUTIONALARRANGEMENTS
B.249
chief executives of the DWR, Sydney Water Board (SWB), Hunter Water Corporation (HWC),Soil Conservation Service (SCS), Public Works Department (PWD), Environment ProtectionAuthority (EPA), NSW Agriculture, NSW Fisheries, Local Government and Shires Association,New South Wales Irrigators’ Council, New South Wales Farmers Association and the NatureConservation Council. The Council reports to the Minister for Natural Resources.
Urban services
Major metropolitan water supplies, wastewater services and some drainage services are managedby central bodies at Sydney and Newcastle. The SWB, which covers the Sydney, Blue Mountainsand Illawarra areas, is a statutory authority which reports to the Minister for Housing. The HWC,which encompasses Newcastle and the surrounding Hunter Valley region, is a state-ownedcorporation.
Drainage services in these metropolitan areas are, in the main, the responsibility of local MunicipalCouncils. For instance, the SWB’s role in urban drainage is currently limited to some 100 trunkdrains (servicing 300ÿ000 properties) that are directly under its control.
In country towns of New South Wales, prime responsibility for provision of WSD services restswith some 122 general purpose Local Government Councils and six County Councils. In the main,the former provide services using their own-developed water supply systems and otherinfrastructure. Some however, purchase bulk water supplies from the DWR, for example, wherethe townships are linked to irrigation schemes, or from the County Councils which operate andmanage regional water supply schemes. Schemes owned and operated by the Councils providereticulated water to more than 1.5 million people in 375 towns and reticulated waste water to 1.3million people in 264 towns.
Councils are assisted by the PWD which also operates two bulk water supply schemes -- the FishRiver and South-West Tablelands Water Supply Undertakings. In addition, the Departmentadministers the State's subsidy scheme for water supply and sewerage construction, and alsoconstructs infrastructure on behalf of local governments.
A new Local Government Act, which proposes wide ranging reforms that will impact on themanagement and operation of Local Councils' water and sewerage services, is expected to beoperational in New South Wales from 1 January 1993. In its draft report submission, the PWD saidthat:
The new Local Government Act emphasises the need for management plans, annual performance reporting andcommercial decision making by councils. In the event of continued unsatisfactory performance, the Governmentwould have a number of options for improving service provision, including transfer of responsibility to anadjoining local government council or using the private sector to provide services.
WATER RESOURCES& WASTE WATERDISPOSAL
B.250
Apart from Local Council operations, there are two statutory water authorities in country NewSouth Wales, namely the Broken Hill Water Board, which provides a water supply and waste waterservice to the city of Broken Hill and surrounding area, and the Cobar Water Board, whichprovides bulk water supply to Cobar Shire Council and mines.
The bulk of the water supply and sewerage assets in country New South Wales have beenconstructed in the last 20-30 years and have an estimated current replacement value in excess of $6billion.
Financial and technical assistance is provided to Councils under the Country Towns Water andSewerage Program. The program provides up to 50 per cent of the capital cost of approved newworks, after deducting developer contributions. Financial assistance is subject to a means test andconsequently, some larger regional cities do not qualify for assistance. The PWD said that, due todiseconomies of small scale, subsidies are required to serve small communities to ensure thatreasonable levels of service can be provided at an affordable cost, and may also be warranted toprotect the environment and public health, and to assist Councils forced into water treatment bydeclining water quality or forced into higher quality sewerage treatment due to increased standardsfor effluent quality. In addition to the financial assistance provided for capital works, the cost ofmanaging the program totalled $7.7 million in 1991-92.
Water resources management and environmental activities
Waterlogging and salinity problems are handled by several authorities: the DWR, the scs, NSWAgriculture and NSW Fisheries. The ‘Salt Action Plan’ is an interdepartmental program which alsoinvolves landholders and is co-ordinated through regional river basin management committees.
The administration of drainage and floodplain activities also involves a number of differentauthorities. Several authorities are often responsible for managing parts of the same drainagebasin, while floodplain management is divided between the DWR in non-tidal areas, the PWD intidal areas, and Local Government.
Similarly, a number of agencies have either a direct or indirect interest in aspects of water qualitymanagement, including the EPA, DWR, SWB, HWC, PWD, Maritime Services Board and theDepartments of Planning; Conservation and Land Management; and Health; and the National Parksand Wildlife Service. Water Boards and Councils providing water supply and sewerage servicesalso have effluent discharge responsibilities.
While the DWR has general responsibility for water quality in the State, including impacts on otherStates, environmental matters are now regulated by the EPA which sets classifications for inflowsto waterways and licenses discharges accordingly. Local Councils also have the power to setenvironmental regulations, although they can be overruled by the State Government.

INSTITUTIONALARRANGEMENTS
B.251
On 1 March 1992, the New South Wales Government established the EPA to replace and expandon the role of the State Pollution Control Commission. It brings together core elements of existingenvironmental, pollution, waste and hazardous substances control, policies and regulatoryprograms.
The New South Wales Government said that the EPA will take a positive role in pollutionprevention and control, and in waste minimisation and regulation. This will include establishmentof water quality goals and benchmarks for assessing control strategies as well as promotion ofimproved land-use planning provisions for catchment areas and areas adjacent to critical waterresources. As noted above, it also licenses discharges into water bodies. Penalties of up to $1million for illegal industrial pollution apply.
A number of special environmental programs are run by individual water authorities. For example,the Sydney Water Board’s programs include the improvement of the quality of streams and rivers,and greater wetlands protection. Other such programs relate to controlling and ensuring the qualityof urban run-off, recycling of sludge, reuse of effluent strategies (including pilot projects), andtrade waste policies.
Total Catchment Management (TCM) initiative
Since 1984, the New South Wales Government has progressively sought to take account of thevarious interests of water users and land holders in catchment management. This process wasformalised through the recently enacted Catchment Management Act. The Act is jointlyadministered by the DWR and the SCS.
A key objective of TCM is to involve the community in identifying solutions to natural resourceproblems and actively bringing about these solutions. Funds are provided to enhance catchmentmanagement through programs such as the National Soil Conservation Program, the NRMS, theOne Billion Trees Program and the National Tree Program.
Institutional arrangements under the Act include the establishment of a State CatchmentManagement Co-ordinating Committee (SCMCC) with general community, landholder and agencyrepresentation to manage the initiative. Seven regional Catchment Management Committees(CMCs) have been established, covering the whole of the State west of the Great Dividing Range.A number of smaller TCM committees have been established or are mooted in coastal areas. Thesecommittees comprise representatives from landholders/landusers, Local Government,environmental groups (or individuals with environmental concerns), and government agencies.The first group has a legislated majority. The actual composition of these committees variesbetween regions, depending on the range of issues apparent within individual river catchments orsub-catchments. The legislation also provides for the establishment of Catchment ManagementTrusts (CMTs) to raise revenue from ratepayers in an area and to provide, construct, operate ormanage, and maintain catchment works and buildings. So far only two trusts have been set up.The TCM initiative is closely linked with the Landcare initiative; a linkage that is being developedto reduce duplication of government effort and public confusion.
WATER RESOURCES& WASTE WATERDISPOSAL
B.252
The regional CMC’s functions include, to:
• promote and co-ordinate the implementation of TCM policies and programs;
• advise on and co-ordinate the natural resource management activities of authorities, groups andindividuals;
• identify catchment needs and prepare strategies for implementation;
• co-ordinate the preparation of programs for funding;
• monitor, evaluate and report on progress and performance of TCM strategies and programs;
• provide a forum for resolving natural resource conflicts and issues; and
• facilitate research into the cause, effect and resolution of natural resource issues.
The SCMCC comprises 16 members whose responsibilities include, to:
• co-ordinate the implementation of TCM strategies;
• monitor and evaluate these strategies;
• advise the responsible Minister or other Ministers on any aspect related to TCM; and
• co-ordinate the functioning of CMCs and CMTs, and to maintain liaison with CMTs.
B.3 Victoria
Administration
Water resources in Victoria are administered by two major agencies: the Victorian Department ofWater Resources (VDWR) and the Rural Water Corporation (RWC). However, there are a numberof other government agencies with significant involvement in water management and water quality,including the Departments of Health, Conservation and Environment, Planning and Housing and,Agriculture; the Land Conservation Council; and Melbourne Water Corporation (MWC).
The VDWR is the central policy and planning agency providing advice to the Minister for WaterResources on matters of State-wide interest. It is also responsible for the Water IndustryConsultative Committee, which provides a forum for the main bodies to resolve matters ofcommon or conflicting interest.

INSTITUTIONALARRANGEMENTS
B.253
The RWC, a recently corporatised government business enterprise, has overall responsibility forwater resources management and the provision of water-related services for irrigation, stock anddomestic, commercial, industrial, recreational, environmental and other beneficial uses in ruralareas of Victoria.
Urban services
The largest urban authority in Victoria is the MWC, which provides WSD services to metropolitanMelbourne and near areas, covering some 80 per cent of the Port Phillip Bay catchment.
There are currently some 117 water agencies in country Victoria involved in the provision of WSDservices. About two-thirds are Local Council-based operations. The remainder are statutoryauthorities, which often have Local Council representatives on their management Boards. Twooperate sewerage-only services, with water supply being provided by the RWC. Some 55 urbanwater authorities purchase/receive bulk water from the RWC’s channel systems.
Drainage services in urban areas of Victoria are generally provided by Local Councils. However,in metropolitan Melbourne and most other established urban areas now covered by the MWC, theCorporation owns and maintains the main stormwater trunk drains into which various municipality-owned drainage systems discharge. The only exception is the recently acquired area coveredpreviously by the Dandenong and Western Port Authority, where virtually all drainage services areprovided solely by the MWC. The Corporation said that this ‘acquired’ policy is to be applied infuture to all new developments within its boundaries.
The Victorian Government has been active in promoting structural reform since the early 1980swhen the State’s Public Bodies Review Committee first commenced inquiring into the water sector.
Since then, the Victorian Government has reduced the number of water institutions from around400 to some 117. This has been achieved through one-off amalgamations and the formation ofregionally based multi-function water authorities. For example, the Latrobe Region WaterAuthority, the MWC and the Mid-Goulburn Regional Water Board, have together absorbed 18smaller bodies. Investigations of possibilities for further amalgamations at the regional level areproceeding. Some of the benefits that these amalgamations have delivered are discussed in Chapter3 of this report.

WATER RESOURCES& WASTE WATERDISPOSAL
B.254
Water resources management and environmental activities
Virtually all WSD authorities and Local Councils with WSD responsibilities in Victoria undertakea similar range of trade waste, waterways, parks and open space, and environmental managementactivities. There is significant duplication of functions and activities, and overlappingmanagement responsibilities within most catchment or river basin areas. Overlaid on this structureare the activities of some 23 River Management Authorities, which are semi-autonomous statutorybodies charged with responsibility for the care of waterways within their respective districts. Theyare predominantly State Government funded and are managed by Boards of volunteer memberswho arrange for and undertake erosion control, stream revegetation and fencing work, communityeducation, research and planning activities.
While the VDWR oversights the management activities of all water authorities, the RWC hasoverall responsibility for water resources management in Victoria and undertakes specificmanagement tasks that are of State-wide interest (eg water resources assessment, floodplainmanagement). As indicated earlier, the activities of a number of other State Government agenciescan have implications for the management, planning and development activities of the RWC andthe individual service provision agencies.
There are no formal arrangements for integrated catchment management (ICM) activities inVictoria. However, a few Catchment Co-ordinating Groups have been formed by localcommunities under the auspices of the Victorian Water Act. Current examples of ICM in Victoriainclude the Gippsland Lakes Implementation Committee, the Wimmera River Catchment Co-ordination Group and about 15 salinity management groups. According to the VictorianGovernment, while devolving decision-making about catchment management to the regional orcatchment level has improved the coordination and responsiveness of government agencies (withcatchment management responsibilities) to meet community needs, it has failed to produce tangibleimprovements in catchment management. There has also been limited success in better aligningdecision-making responsibilities with the flow of benefits and costs of the decisions made.
The Victorian Government also suggested that the current arrangements were inherently unstablebecause:
• the devolution of decision-making relies on the agreement and cooperation of manyorganisations, which is often hard to achieve, particularly when difficult decisions are to bemade; and
• the heavy dependence on government funds to finance ICM activities results in groups notaccepting responsibility for the `hard' decisions, supporting uneconomic regional projectswhere the benefits flow to the region but the costs don't, and spending a large proportion oftheir effort lobbying government for more money.

INSTITUTIONALARRANGEMENTS
B.255
Community consultation concerns are also being addressed by a network of Advisory Committeesthat provide advice and feedback on local management and environmental issues to the regionally-based water authorities (eg Latrobe Region Water Authority).
Drinking water quality management problems have to a large degree been contained in Victoriadue to the operation of a closed catchment policy.
The Environment Protection Authority (EPA) is the Victorian agency responsible forenvironmental quality standards, the regulation of waste treatment and disposal, and more generallyfor ensuring that there is an environmentally sound waste management system within the State.There are a number of regulatory tools at its disposal for the control of direct emissions:
• State Environment Protection Policies;
• works approvals and licences;
• Pollution Abatement Notices; and
• Industrial Waste Management Policies.
Traditionally the EPA has not regulated trade waste discharges to sewers. Rather, this has been leftas the responsibility of sewerage authorities.
B.4 Queensland
Administration
The overall management of water resources in Queensland is the responsibility of the WaterResources Commission of Queensland (QWRC), a statutory authority reporting to the Minister forPrimary Industries. The Commissioner for Water Resources exercises control over surface andground water through the licensing of all artesian bores, sub-artesian bores within districts declaredfor the purpose, and works for the conservation and use of surface water, together with the issuingof permits for domestic and stock water use.
The Commission is required by legislation to:
• prepare a complete description and keep a record of naturally occurring surface and groundwater;
• take steps to protect the quality and quantity of the State's water resources;
• investigate and survey any natural water resource;
• co-ordinate the investigation, evaluation and development of plans for the control offloodwaters and mitigation of flood damage;

WATER RESOURCES& WASTE WATERDISPOSAL
B.256
• construct infrastructure and manage waters for the conservation, replenishment, utilisation anddistribution of water;
• provide advice to local authorities in relation to water supply, sewerage, drainage, floodmitigation and swimming pools; and
• provide an extension and design service for on-farm development of water resources.
The QWRC develops, manages, operates and maintains all State-owned water conservation works.
Urban services
Urban water supply and sewerage services in metropolitan and country areas of Queensland areprovided by 134 Local Councils, the largest being the Brisbane City Council. In total, LocalCouncils operate 360 water supply schemes and 220 sewerage schemes. Some of the Councils inthe more remote areas service populations of less than 100. There are also some 31 AboriginalCouncils operating water supply schemes.
Many Local Councils operate integrated water supply schemes, while some obtain bulk suppliesfrom State Government schemes operated and maintained by the QWRC. Where more than oneLocal Council draws water from the same source, joint arrangements are in place to provide bulksupplies -- regional water boards or agreements where smaller authorities adjoining major cities aresupplied by the larger authority are the main approaches used. For instance, in south eastQueensland, bulk raw water is provided by a statutory authority, the South East Queensland WaterBoard, and subsequent treatment and distribution of water is subject to a variety of agreementsbetween Local Councils. According to the Queensland Government, regional water boards aredesigned to reduce the costs and complexity of setting up agreements between local authoritiesdrawing supply from the same source.
The Queensland Government commented that, in general, boards established under mechanismsother than their own specific legislation have suffered from the following disabilities:
• boards of parochial representatives unable to plan regionally;
• organisations tied too closely to the Queensland Government;
• difficulties in transferring asset ownership from existing local authority owner; and
• an inability for local authorities to engage in deficit financing.
The Queensland Government said that some 87 of the State's 134 local authorities contain morethan one urban centre and 41 of these have amalgamated their water supply services to the extentthat they charge a common rate to operate a common fund. A further nine have undertaken theamalgamation of some of their schemes.
INSTITUTIONALARRANGEMENTS
B.257
Some Local Councils also operate sewerage services in conjunction with other local authorities inthe same region. Drainage services in urban areas are also primarily the responsibility of individualLocal Councils.
Proposed amendments to the Local Government Act would, if enacted, introduce significantadministrative and financial reforms for local authorities in their provision of WSD services.Further, the Queensland Government said that, through the Departments of Primary Industries(DPI) and Housing and Local Government (DHLG), it has recently been developing and promotinga ‘Total Management Plan’ approach to the planning and management of WSD infrastructure,embracing performance, emerging issues, objectives and strategies for each scheme.
The majority of local councils do not require any subvention from the government for serviceprovision costs. Funding assistance is predominantly provided for capital works projects throughthe Local Bodies Capital Works Loan Subsidy Scheme. Subsidies of up to 20 per cent are payablefor water supply and sewerage headworks and up to 10 per cent for urban stormwater drainage.The subsidies exclude components of works funded from other grants or developer contributions.They are not generally provided for urban reticulation works. The subsidy component of capitalexpenditure on WSD infrastructure in Queensland is estimated to make up approximately five percent of total asset value.
A review of the impact of Local Government boundaries on planning and management of urbaninfrastructure has recently been completed by the Queensland Government. Although the changesrecommended were unrelated to the concepts of water catchments or river basins, the Commissionunderstands that, if accepted, the boundary changes will result in the bringing together of up to 17pre-existing Local Councils within any one new Local Government Area. The QueenslandGovernment said that the existence of certain cross-boundary inefficiencies was also identified inthe recent boundaries review and that, as a result, it has called upon the nominated local authoritiesto take steps to address these inefficiencies, or face possible amalgamation.
Water resources management and environmental activities
In addition to the QWRC, the Department of Environment and Heritage (DEH), and the Land Useand Fisheries Group (LUFG) of the DPI, are involved in water resources management and water-related environmental activities.
The DEH is the agency responsible for conservation and management of the Queenslandenvironment. It licenses discharges to water courses and monitors the discharge and the watercourse against environmental standards set. According to the Queensland Government, the DEH iscurrently preparing a new environment policy for water which will result in an increased emphasison minimum levels of treatment, assimilative capacity and technology.

WATER RESOURCES& WASTE WATERDISPOSAL
B.258
The LUFG is responsible for freshwater and marine fisheries.
Other State government agencies that can impact on water management activities of the QWRCand individual Local Council operations include the Departments of Health; DHLG; Business,Industry and Regional Development; Premier, Economic and Trade Development; and DPI(through the Queensland Forest Service). Also, the Great Barrier Reef Marine Park Authority, aCommonwealth statutory authority, has a major interest in the activities of sewerage authorities innorth east Queensland.
Some participants argued that water and land use management responsibilities in Queensland areunnecessarily fragmented. CSR Sugar noted that some 18 State government departments, divisionsor authorities, one Federal government department and 10 Local Councils impact on themanagement of the Brisbane River, resulting in extensive delays in dealing with water resourcemanagement problems.
All Local Councils have trade waste and land use planning responsibilities. However, only some16 of the 134 local authorities have established trade waste policies. Major land use changes in‘declared’ catchment areas must be approved by the Commissioner for Water Resources.
There is no specific legislation for floodplain management and responsibility is fragmented. LocalCouncils have primary responsibility for flood prevention and control. However, as noted by theQueensland Government, Local Government boundaries are not aligned with catchments orfloodplains. Thus, co-operation between Councils is required.
The Queensland Government said that it was currently in the process of developing new strategiesfor conservation, ICM, water quality and water resources management. With regard to ICM, pilotstudies have been established in the Johnstone River catchment and in the Lockyer Valley.However, there is no formal structure or legislation.
B.5 Western Australia
Administration
The vast majority of water resources legislation in Western Australia is administered by a State-wide statutory monopoly, the Water Authority of Western Australia (WAWA). An eleven-memberBoard of Management controls the Authority’s operations. It reports to the Minister for WaterResources. Overlaying the activities of WAWA is the Western Australian Water ResourcesCouncil, which provides independent advice to the Western Australian Government on watermanagement issues.

INSTITUTIONALARRANGEMENTS
B.259
Urban services
WAWA is responsible for the operation and maintenance of the following urban WSD services:
• water supply, sewerage and arterial drainage services in the Perth metropolitan area;
• water supply schemes in the majority of country towns -- the exceptions being the Bunbury andBusselton schemes, which are run by statutory water boards, and a few schemes operated bymining companies; and
• sewerage and arterial drainage services in several country towns.
Local Councils across the State generally have responsibility for feeder drains due to theirintegration with road infrastructure, while some 17 small towns have their sewerage servicesprovided by local authorities. WAWA said that it was currently reviewing its role and objectives inits metropolitan drainage business, with the likely outcome being that it will concentrate more on astrategic and co-ordinated stormwater management planning approach, rather than outrighttakeover of all drainage service activities.
All up, WAWA provides WSD services to a population of over 1.5 million in more than 300communities throughout Western Australia. Metropolitan and country areas are supplied from bothsurface and ground water. The supplies are received through 12 regional and 108 local schemes.Further, the Authority operates 71 sewerage plants. It is also responsible for providing water andsewerage services to a number of remote Aboriginal communities. The capital cost of these latterworks are fully reimbursed by ATSIC and the Aboriginal Affairs Planning Authority (AAPA).During 1990-91, ATSIC and AAPA together provided $5.4 million for upgrading, maintenance andconstruction of water supply and sewerage facilities for 88 town-based and remote Aboriginalcommunities.
Water resources management and environmental activities
WAWA is responsible for managing and regulating the use of all surface and ground waterresources in Western Australia. It also jointly monitors drinking water quality with the Departmentof Health. The Department is also required to approve projects for the reuse of sewage effluent andhas an interest in how catchments are managed. Drinking water catchments in Western Australiaare subject to land use constraints which are more stringent than those applying to othercatchments. WAWA said that, given the often conflicting roles it has as both service provider andresource manager, it has initiated a review to identify the form of institutional arrangements whichwill best meet the future needs of the community and the water industry in Western Australia.
There are a number of State Government agencies with an interest in catchment managementactivities including the Departments of Agriculture; Planning and Urban Development; and,Conservation and Land Management. Local Government Councils also have a significant interest
WATER RESOURCES& WASTE WATERDISPOSAL
B.260
through their powers to control land uses. There are also two principal river and estuarine agenciesin Western Australia, the Waterways Commission and the Swan River Trust. The WaterwaysCommission is charged with the responsibility for overall management of the State’s publicwaterways that are in ‘declared management areas’, while the Swan River Trust was specificallyestablished to manage the Swan and Canning Rivers. The Office of Catchment Management(OCM) is charged with the responsibility of bringing these Departments and authorities together tomake sure they reach agreements to solve problems for the management of a catchment. OCM alsohas policy and technical roles to play. For instance, it is currently involved in developing ‘Codesof Practice’ for a range of land use activities, to ensure environmentally acceptable operation.
ICM has been established in Western Australia under existing environmental and planninglegislation. There are already some 130 Land Conservation District Committees undertakingLandcare activities, but progress in establishing community-based Catchment Co-ordinatingGroups to develop Catchment Management Plans has been much slower. At the State level, anIntegrated Catchment Management Coordinating Group, a Chief Executive Officers ICM Groupand a Cabinet Sub-Committee on ICM have all been established to progress ICM in WesternAustralia.
The EPA of Western Australia has the responsibility of providing the State Government withindependent advice on the protection of the environment and administering legislation to controlpollution. With regard to WSD activities it is involved in:
• assessing proposals for the development of new water supplies;
• assessing policies and strategies for water supply;
• assessing new proposals for irrigated agriculture;
• assessing and licensing waste water treatment plants;
• assessing and licensing proposals for the management of industrial waste water; and
• developing policies for the disposal of drainage waters and the acceptability of on-site sewagedisposal.
Within `declared management areas', the EPA has delegated its responsibilities for pollutioncontrol to the Waterways Commission and the Swan River Trust.

INSTITUTIONALARRANGEMENTS
B.261
B.6 South Australia
Administration
All major water resources and most public water supply schemes in South Australia areadministered by the Engineering and Water Supply Department (EWS), which reports to theMinister for Water Resources.
The EWS’s operations are influenced by its operation as a department rather than a separateauthority. For example, until recently, Treasury required the EWS to pay all its revenues into theState’s Consolidated Account, which meant that all of the Department’s expenditures were subjectto appropriation by Parliament. The Department now controls its own finances.
Urban services
The EWS is responsible for the provision of water supply services State-wide and sewerageservices in major urban centres. Drainage services in urban areas are under the control of LocalCouncils. However, the South Australian Government said that recognition of the potential valuein stormwater as a resource may have an impact on future institutional structures to managemetropolitan drainage.
The Department is also responsible for water supply to townships within Government IrrigationAreas along the River Murray.The current replacement cost value of total WSD assets in South Australia is estimated to be $3.5billion.
Capital grants are provided by the State Government to assist the development of local governmentstormwater drainage and common effluent disposal schemes.
Water resources management and environmental activities
Overlaying the EWS’s role in water resources management is the South Australian WaterResources Council, which was set up to provide independent advice to the South AustralianGovernment on overall management policies, and eight regional Water Resources AdvisoryCommittees, set up to facilitate community participation in providing advice to the Minister on themanagement of specific water resources. The composition of these committees depends on therange of management issues in any one region.
Other government agencies that can impact on EWS’s activities include the Departments ofAgriculture, Environment and Planning, Lands, and Mines and Energy. A National ResourcesManagement Committee, comprising the heads of relevant agencies, has recently been set up tobetter co-ordinate the input of these agencies.

WATER RESOURCES& WASTE WATERDISPOSAL
B.262
Central to the EWS’s management role is its total control of water resources and associated land useplanning in 25 ‘proclaimed’ areas. In these areas it has the power to prohibit certain land useactivities and to set special environmental conditions (eg buffer zones in catchment areas).
While a trade waste charging regime has yet to be formalised in South Australia, a 10 per centenvironmental levy is included in sewerage charges to assist in financing works to upgrade thestandard of sewage treatment across the State.
The South Australian Government said it is taking steps towards the adoption of an integratedcatchment management regime. It currently has trial ICM schemes running in the Mount LoftyRange and the Murray Valley. A program called Community Action for the Rural Environmentwas recently launched to bring together the environmental issues for river and agricultural environsinto one program.
An Environment Protection Council advises the Minister for Environment and Planning onenvironmental policy matters. However, the EWS currently sets and monitors its own waterquality standards and discharge licence conditions. An EPA has been proposed for South Australiawhich would, amongst other things, absorb the environmental functions presently undertaken bythe EWS.
B.7 Tasmania
Administration
The Rivers and Water Supply Commission (RWSC), a statutory authority reporting to the Ministerfor Resources and Energy, has primary responsibility for the management of surface waterresources in Tasmania. Its functions include:
• measurement, assessment and allocation of water resources;
• supervision of Local Government bodies (except cities) in their management of local WSDworks; and
• authorising the construction of dams, other than Hydro-Electric Commission (HEC) and miningdams.
The Commission owns assets which have a written-down replacement value of about $150 million(including irrigation assets).
Tasmania's groundwater resources are administered by the Water Resources Division of theDepartment of Resources and Energy.

INSTITUTIONALARRANGEMENTS
B.263
The HEC, which also reports to the Minister for Resources and Energy, has managementresponsibility for approximately one-third of the total exploitable water yield in Tasmania forpower generation. It controls most of the water supply headworks in the State. However, once thiswater has passed through the HEC’s turbines, control of the resource generally reverts to theRWSC.
Urban services
The reticulation and sale of water supplies to urban consumers in Tasmania is primarily theresponsibility of 46 individual municipalities. These municipalities operate 68 water schemesservicing populations ranging from less than 100 to 31 000, and 80 sewerage schemes.
In the Hobart region, water is supplied in bulk to municipalities by the Hobart Regional WaterBoard (HRWB). Municipalities are fully responsible for the cost and management of reticulationwithin their Municipal Water Districts. In the Tamar Valley, municipalities generallypurchase/receive bulk water from RWSC-owned regional water schemes. However, onemunicipality, Beaconsfield, operates the West Tamar Water Scheme as an agent for theCommission, while the ‘old’ City of Launceston has its own bulk supply and reticulation workswhich it operates and maintains. On the North West Coast, water is supplied in bulk toMunicipalities by the North West Regional Water Authority (NWRWA), with local governmentauthorities again being responsible for reticulation. In municipalities not serviced by the HRWB,the RWSC or the NWRWA, the supply of water is totally a function of the local municipal council.
Sewerage and drainage services are also provided by Local Councils. Councils have to seekRWSC approval to construct sewerage and drainage facilities and also need to obtain anenvironmental licence from the Department of Environment and Planning.
The RWSC administers a subsidy scheme which assists Municipal Councils to meet the operatingcosts of their WSD services. Municipalities are required to raise a minimum revenue to qualify forassistance. The cash deficit remaining after allowable expenses, forms the subsidy, provided itdoes not generally exceed 25 per cent of the operating costs for water schemes and 30 per cent forsewerage schemes. Capital subsidies are also provided under the COWSIP scheme. In addition,the State Government makes an annual contribution to the HRWB and the North Esk RegionalWater Authority to meet interest payments on specific loan borrowings.
Water resources management and environmental activities
The RWSC has primary responsibility for water resources management activities in the State.However, a number of other State authorities have some powers over aspects of the approval andmanagement of land and water uses -- in some cases specifically in relation to protection of waterquality. They include the Forestry Commission; Parks, Wildlife and Heritage; Public Health; theInland Fisheries Commission; and the Divisions of Environmental Management (DEM), Planningand Sea Fisheries.

WATER RESOURCES& WASTE WATERDISPOSAL
B.264
The DEM is the main environmental policy and regulatory agency in Tasmania. However, LocalCouncils can also set standards and monitor them.
The Tasmanian Government said that integrated catchment management was not appropriate forTasmania.
B.8 Northern Territory
Administration
The Power and Water Authority (PAWA), a statutory authority reporting to the Minister for Lands,Water and the Environment, is responsible for the assessment, planning and management of surfaceand ground water resources throughout the Northern Territory.
Urban Services
PAWA owns, operates and maintains infrastructure for the provision of water supply and sewerageservices to Darwin, the majority of country towns and many aboriginal communities in theTerritory. Drainage services are primarily the responsibility of Local Councils.
Water resources management and environmental activities
As noted above, PAWA is responsible for the management of the Territory’s water resources.However, separate legislation exists which designates a Controller of Water Resources and aCommissioner of Water Development such that the responsibility for overall water resourcesmanagement is kept at arm’s length from the provision of commercial water supply and sewerageservices.
The Authority is responsible for flood prevention and control, trade waste disposal, water qualityand pollution control, environmental assessments of water and related developments, and theadministration of permits and licences.
The water interests of a number of other government agencies often overlap with those of PAWA.The Northern Territory Conservation Commission oversees an administrative arrangement withPAWA to co-ordinate waste management and pollution control. It is also concerned with therecreational, aesthetic and in-stream values of water conservation, the management of aquatic fauna

INSTITUTIONALARRANGEMENTS
B.265
and catchment management on a case by case basis. WSD infrastructure development requiresinput from the Public Works Commission and the Department of Lands and Housing, which alsoregulates land use in catchment areas. The Department of Health and Community Services(DHCS) is involved with setting health standards for drinking and recreational water quality.DHCS’s responsibilities also extend to effluent disposal and identifying health hazards andenvironmental pollution. The Department of Mines and Energy, through its Mining EnvironmentDirectorate, has a monitoring and management role in regard to water availability and pollutionlevels at mines in the Northern Territory. The Directorate sets its own standards (under powersdelegated to it by PAWA), conducts mine audits of water use and output, and seeks to enforcethese standards through either caveats to mining leases or the Mines Management Act. Given thatthe Commonwealth has reserve powers over aboriginal affairs, the environment, and uranium andother mining activities in the Territory, there is potential for overlap between the activities of theTerritory and Commonwealth agencies in these areas.
B.9 Australian Capital Territory
Administration
Water resources in the Australian Capital Territory (ACT) are vested with the ACT Electricity andWater Authority (ACTEW), a statutory authority reporting to the Minister for Urban Services.ACTEW was to be corporatised on 1 January 1992 but this did not proceed following a change ofgovernment.
Urban services
ACTEW is responsible for the provision of water supply and sewerage services to the Territory andalso supplies bulk water to the City of Queanbeyan, in New South Wales. The Authority owns,operates and maintains all the associated storages and infrastructure required to provide theseservices. Drainage, however, is the responsibility of the Department of Urban Services, althoughthe drains themselves are maintained under contract by ACTEW.
ACTEW has water and sewerage assets of about $1 billion, calculated on written downreplacement value. It receives a Specific Purpose Payment annually from the Commonwealth ascompensation for having to operate an unusually expensive sewage treatment plant.

WATER RESOURCES& WASTE WATERDISPOSAL
B.266
Water resources management and environmental activities
In the ACT, there is an effective split of water resource management, operations and environmentalregulatory functions between various arms of the ACT Government. Although ACTEW does havesome resource management functions, it is predominantly set up as a service provider. TheDepartment of Environment, Land and Planning brings together all of the agencies havingresponsibility for land and water resources planning, management and regulation, namely: the ACTPlanning Authority which is responsible for land and water planning; the Environment andConservation Division, which is responsible for conservation, land management, environmentalprotection and environment policy; and the Land Division, which is responsible for leasing andland development. The Department therefore provides a forum for a co-ordinated approach to land,water and environmental issues.
ACTEW does not have control over its catchments but maintains communications with theauthorities responsible for the Territory Plan and with the DWR in New South Wales in regard tothe Googong Dam.
B.10 Research and development (R&D) and extension services
There is a wide range of Commonwealth and State Government departments, authorities andagencies, as well as a number of private organisations involved in promoting, funding, co-ordinating and/or delivering research into water and water-related issues, or in developing newwater and waste water treatment and disposal technologies for commercial adoption. In mostinstances, there is a clear demarcation between those organisations involved in R&D into rural-related water matters and those concerned solely with urban water R&D. The National IrrigationResearch Fund (NIRF) estimated that some $13 million was spent on generic irrigation research in1990-91, while the Urban Water Research Association of Australia (UWRAA) estimated that R&Dinto urban issues and technologies totals some $20-40 million per annum. Investment in R&Drepresents less than 1 per cent of turnover in each of these sectors.
The AWRC, the peak water industry forum, is charged with, among other things, the promotion ofrelevant water research. This involves mainly the dissemination of information relating to the needfor and gains from R&D. For instance, CSIRO said that the AWRC’s Water TechnologyCommittee has estimated that the urban sector of the industry might achieve productivity gains ofup to 20 per cent, over a period of years, through technology-neutral management changes, mainlyin the asset management area, and particularly in the improved management and operation ofsmall-diameter pipes in water and sewerage systems. It also noted that the Committee hasindicated that increased standards of urban water supply quality could require a 300 per centincrease in water treatment assets (valued at $854 million in 1989) and that, due to the introduction

INSTITUTIONALARRANGEMENTS
B.267
of more stringent environmental standards, urban sewerage treatment assets might have to beincreased by some 30 per cent (valued at $2611 million in 1989), mainly to provide limitedimprovements in nutrient removal from existing plants. Similarly, in respect of the irrigationsector, salinity, waterlogging and nutrient run-off issues require solutions of both a managementand technological nature.
The LWRRDC, a statutory authority formed in July 1990 to replace the research component of theNational Soil Conservation Program (NSCP) and the activities of the former Australian WaterResearch Advisory Council (AWRAC), is the main Commonwealth body involved in thedistribution of research funds and commissioning of water research projects. It is managed by aBoard of seven directors, appointed by the Minister for Primary Industries and Energy on the basisof their technical and commercial skills, and a Commonwealth Government representative. TheCorporation’s main functions are to investigate, evaluate, co-ordinate, fund, monitor and report onR&D activities in relation to Australia’s land, water and related vegetation resources, and tofacilitate the dissemination, adoption and commercialisation of that R&D.
In broad terms, the LWRRDC’s main focus is on funding land, water and related vegetation R&Dwhich contributes to sustainability of resource use, increased land productivity, improved land andwater quality, a better understanding of ecological processes, and better management andconservation of these resources. The Corporation has indicated that in future it will actively seek toincrease funding of activities which integrate land, water and vegetation R&D in addressingresource and management issues.
Unlike many other Commonwealth-initiated R&D corporations and councils, funding is providedsolely by the Commonwealth Government. However, it can increase its funding base by variousmeans such as recovering costs for certain services, commercialising research results and solicitingdonations. In 1990-91, Commonwealth funding totalled $11.1 million, of which $10.4 million wasspent on some 230 research projects. Given a normal 3-year funding cycle, the LWRRDC expectsto fund new projects annually worth about $3 million.
Funding has, in the main, been directed towards research projects that impact on primaryindustries. However, the Corporation has also provided funds, under certain conditions, for urban,estuarine and, air and atmospheric R&D. Accountability provisions under its Act, require theLWRRDC to prepare five year R&D plans and Annual Operational Plans for approval by theMinister for Primary Industries and Energy. When preparing R&D plans, it is also required toreport on performance and consult with: the Australian Conservation Foundation; the NationalAssociation of Forest Industries; the National Farmers’ Federation; the Soil Conservation Advisory

WATER RESOURCES& WASTE WATERDISPOSAL
B.268
Committee; and the Standing Committee of the AWRC.4 From 1991-92, applicants for projectfunding have been required to outline their proposed methods for ensuring effective disseminationand uptake of their research results, and the funds necessary to implement these strategies.
There are three other main Commonwealth related or initiated bodies involved in water R&D,namely the CSIRO, the MDBC and the NIRF.
CSIRO is the Commonwealth’s main research delivery agent, conducting a wide range of waterrelated research, both self-funded and under contract to various Commonwealth and Stategovernment agencies and private sector organisations. It spends about $20 million per annum onsuch research. In the main, CSIRO’s water interests are focussed on the development of newtechnologies and resource management approaches.
The MDBC, through its Murray Darling Basin Initiative, is responsible for funding research intoBasin management problems. Its main focus recently has been on salinity mitigation research andin developing a computer model for the total Basin.
The NIRF, which was initiated in 1987 by the AWRAC to address a perceived imbalance inirrigation research, has two broad objectives:
• to accelerate and coordinate irrigation research in Australia; and
• to improve irrigation technology transfer.
The Fund is managed by a Board of Directors, comprising eight members: six from Stateagricultural and rural water agencies and two from irrigator organisations. Since 1988-89,Commonwealth funding has been provided through the AWRAC and subsequently, the AWRC($150 000 per annum), with a largely matching contribution by water and agricultural agencies inNew South Wales, Victoria, Queensland, South Australia and Western Australia (the lattercontributing only from 1991-92). The NIRF said that due to its membership and fundingarrangements, most research is concentrated on State regional and local issues without a view to thebroader national perspective. As a result of its recently completed National Irrigation ResearchStrategy, the NIRF has set the following four broad areas as future research priorities: sustainableirrigated cropping systems; water use efficiency; drainage pollution; and, salinity.
Water and water-related research is also funded or undertaken, to varying degrees, by a number ofother Commonwealth organisations including: various primary industry commodity-basedresearch corporations or councils; DASET; and, the Australian Science and Technology Council.The latter two organisations are concerned mainly with water-related environmental issues.
4 The Queensland Government commenced its participation on 1 July 1992. The other four governments arefoundation members of the MDBMC.

INSTITUTIONALARRANGEMENTS
B.269
At the State level, much of the rural-related water research is either funded or undertaken (often onbehalf of the above Commonwealth organisations) by State Departments of agriculture and primaryindustries, and the various rural water authorities and commissions. Other delivery agents for ruralwater research include tertiary institutions and a number of private R&D and industryorganisations.
Conversely, urban water and waste water disposal R&D is predominantly funded and/orundertaken in-house by the major urban water authorities, or by various private companies doingmainly technology-driven commercial R&D projects. Available information indicates that, in1990-91, R&D expenditure by the major urban water authorities ranged from 0.3 per cent(WAWA) to 2.3 per cent (SWB) of their gross revenues.
There are also a number of Co-operative Water Research Centres (CWRCs) around Australia.They are the result of joint venture agreements between the Commonwealth Government, majorwater authorities and various private companies. For example, the CWRC set up at the Universityof New South Wales is jointly funded by the Commonwealth, the SWB and Memtec Pty Ltd.
Seed funding for urban water research is also provided by the UWRAA. The Association’s budgetfor 1992-93 is $800 000, with funds being contributed mainly by the major urban water authorities.Prior to the 1992-93 funding year, some $400 000 plus per annum was provided by the LWRRDC.Research funded by the UWRAA is said to be both commercially oriented and have wideapplication. As such, the results of this research are also of benefit to smaller urban authorities.
Technology transfer and general research adoption mechanisms are an integral part of any researcheffort. In recognition of this, many agencies funding water R&D require applicants to identify theadoption/transfer/commercialisation processes they intend to pursue as a condition. Extensionservices for water research are variously provided by a wide range of organisations including theLWRRDC, the AWRC, the NSCP, Landcare groups, Greening Australia, the MDBC, a wide rangeof State Departments and organisations (including water authorities), and the research institutionsthemselves.
PRICING ANDCOMMUNITYSERVICE
C.271
APPENDIX C: PRICING AND COMMUNITY
SERVICE OBLIGATIONS
C.1 Introduction
As discussed in the body of the report, there are a range of inefficiencies in the pricing of water,sewerage and drainage (WSD) services in most parts of Australia.
One important source of inefficiency is the failure to directly link charges to individuals’consumption of water. As shown in Table C.1, in most jurisdictions, the payment of an accesscharge entitles the consumer to a significant allowance of water for which no additional per KLcharge is levied.
Another potential source of inefficiency is the imposition of non-commercial functions orcommunity service obligations (CSOs) on WSD authorities. Authorities providing WSD servicesare being increasingly urged by governments to operate in a commercial fashion. But, at the sametime, they are still required to perform a range of non-commercial functions which are generallynot directly funded by governments. This appendix looks at CSOs in the water sector.
C.2 What are CSOs?
Governments have perennially used charges for water and sewerage services to meet wider socialand development objectives.
However, these objectives have not always been made clear. As a result, legislative requirementsoften have to be interpreted by WSD authorities.
The charter of the Sydney Water Board (SWB) provides one example of loosely specified goals.The Board’s Act specifies that it is responsible for:
• Ensuring water and related resources within the Board's area of operation are allocated and used in wayswhich are consistent with environmental requirements and provide the maximum long-term benefit for thearea and the State;
• Providing water and related services to meet the needs of users in a commercial manner consistent with theoverall policies of the Government.
In carrying out its functions, the Water Board pays particular attention to, [among other things]:
• Public interest and community needs ... (SWB 1991)

WATER RESOURCES& WASTE WATERDISPOSAL
C.272
Such implicit or vaguely specified legislative requirements leave much discretion to authorities asto how to satisfy government policy objectives. For instance, the SWB’s Act does not specify whatphrases such as ‘public interest and community needs’ mean. Similar, and equally imprecise,language is found in many other authorities’ charters.
The need to translate institutional goals into something meaningful at the operational level and toresolve potential conflicts, can create a number of problems for authorities. For example, the NewSouth Wales Department of Water Resources (DWR) stated in its 1989-90 Annual Report that:
... our ability to deliver business services to our private client-base is often limited by our obligation to exerciseour social/regulatory role. For example, in sharing available water supplies we must balance the concepts ofcommercial efficiency and social equity. We are also at times limited by our obligations under inter-state watersharing agreements to which New South Wales is a signatory. (DWR 1990, p 10)
Similarly, the SWB stated that:
The current pricing system is commercially indefensible. The Board cannot effectively serve an increasingnumber of customers at a price below cost and meet Government and community expectations such as dividendpayments, appropriate rates of return, welfare payments, maintenance and renewal of infrastructure, environmentprotection and provision of serviced residential land.
Poorly defined non-commercial objectives often lead to confusion about who should pay for CSOs.For example, the Geelong and District Water Board (GDWB), which has historically been requiredto provide free water to local councils in its region, argued that:
Clearly, it is not the role of the Board to provide a subsidy to municipalities ... to water parks and gardens. Themunicipalities should pick up the true costs of watering parks and gardens, so the community the municipalitiesserve recognises the true costs of having beautiful green gardens in our environment.
Many WSD authorities are now seeking to separate CSOs from their other activities, with a view tomaking them more transparent and to permit direct funding by governments. Direct funding is seenby WSD authorities as important so that they can operate on a more commercial basis.
But this raises questions of what exactly is a CSO, how to identify it, and how should it be valued.
Definitions
Defining what constitutes a CSO is a complex issue. In its report on Rail Transport, theCommission adopted the following definition:

PRICING ANDCOMMUNITYSERVICE
C.273
A Community Service Obligation arises when a government requires a public enterprise to carryout activities which it would not elect to provide on a commercial basis, or which could only beprovided commercially at higher prices. (IC 1991c)
There are three characteristics of this definition:
• legislative or ministerial direction to WSD authorities to provide a specific service or functionincluding specification of the conditions under which it is to be supplied;
• the specified service provides an identifiable community or social benefit; and
• the service or function would not otherwise be supplied, under the same conditions, in acommercial environment.
A government directive
The first characteristic of the definition may seem relatively straightforward. In practice, however,directives for WSD authorities to provide community services have not always been made explicitor public. In some cases, CSOs may be based on historical obligations which are no longer currentgovernment objectives. For example, providing free or subsidised WSD services to institutionssuch as churches, hospitals and schools is a long established practice, even if no formalrequirement now exists to do so. In this regard, ACT Electricity and Water (ACTEW) said that:
The policy of half-price excess water to schools and certain other bodies of a like type, and half-price sewerageservices to bodies such as churches, schools, and hospitals, reflects political decisions taken long ago and whichhave "rolled on" to be carried by ACTEW. ...
It is doubtful that these concessions can be characterised as Community Service Obligations ... because noexplicit direction to ACTEW remains afoot to continue them and with limited exceptions there is no statutoryobligation requiring that they be continued.
Melbourne Water Corporation proposed that this uncertainty be dealt with as follows:
... if government require that the activity continue at a subsidised level, it should be considered a CSO. If theauthority decides to continue on the same basis, it must be judged a commercial decision reflected in its financialperformance.
Some non-metropolitan water authorities in Victoria are intending to move away from providingconcessional water to certain organisations such as schools, hospitals, public parkes and gardensetc. The SWB already charges for water and sewerage services used by State Departments andauthorities.
Social policy objective
The second characteristic of a CSO is that the service or function provide an identifiable social orcommunity benefit that would not otherwise be met. Again application of this criterion is notwithout problems. There is the fundamental question of what constitutes an identifiable

WATER RESOURCES& WASTE WATERDISPOSAL
C.274
community or social benefit. While many would see the provision of subsidised water topensioners and other disadvantaged groups as clearly meeting this test, does the provision of free orsubsidised water to churches, public institutions etc provide a social or community benefit? Also,should the concept of community benefit be limited to those receiving services, or should it alsoinclude those employed in providing services? Thus, for example, should preferences given byWSD authorities to in-house labour, which might otherwise be unemployed, be regarded as a CSO?
Non-commercial activity
The criterion related to non-commercial activity raises two problems: how to distinguish betweennon-commercial impositions on WSD authorities and poor performance by those authorities; andhow to determine what is commercial behaviour and what is not.
The absence of competition and performance monitoring in the water sector has given WSDauthorities scope to pursue non-commercial objectives, with little or no concern for their associatedcosts and hence impact on commercial performance. That is, costs can simply be passed on toother users. The SWB said that:
Water authorities, because of government controls have been notorious for using their monopoly position toachieve distributional aims and objectives.
It is therefore important that the CSO tag not be used to excuse substandard commercialperformance or to validate poor investment decisions.
There is also the problem of determining what concessions would be provided by a commerciallyorientated organisation for ‘good commercial reasons’.
Many private sector organisations engage in pricing practices which, if carried out by a governmentutility, would be targeted as a CSO. For example, private enterprises often offer concessions tochildren, students and pensioners. It is true that the marginal cost of allowing additional customersto use privately provided services such as air transport is relatively small before full capacity isreached. Thus, even at ‘subsidised’ prices, there is a net contribution to revenue. Such behaviour istherefore nothing more than rational price discrimination on the part of the operator. Accordingly,such concessions need not impose any cost on the operator and/or other customers. A similarargument could be used to justify subsidised access to water networks where there is excesscapacity. However, as discussed in Chapter 6, care is required here because the addition of newcustomers is likely to pull forward the timing of the next augmentation in system capacity.
The cost of fine tuning pricing regimes may mean that it is not commercially sensible to chargedifferent prices to users in different locations. It is also common practice in the private sector forfirms to engage in ostensibly non-commercial practices to promote a ‘good corporate citizen’image.
PRICING ANDCOMMUNITYSERVICE
C.275
These examples serve to illustrate that in the absence of a commercial test, there are necessarilyuncertainties about what is a commercial practice and what is not. In the case of the WSD sector,such uncertainty is reinforced by the fact that the charters under which many authorities operate donot clearly spell out their obligations in this area.
Not surprisingly therefore, efforts by WSD authorities to identify CSOs have raised manyproblems. For instance, the South Australian Government said that:
The issue [of formally identifying and evaluating CSOs] is not perceived as one of identifyingcross subsidies as such -- it is more to do with evaluation of the impact of specific Governmentpolices on the capacity of services to be provided on a commercial basis.
and further that:
Indeed for a government to direct its WSD authority to remove all [cross subsidies or differences in financialreturns on investment] would impose unwarranted administrative costs which could themselves be regarded asCSOs.
In a similar vein, the GDWB said that many cross-subsidies are not CSOs but rather soundcommercial practice. The Board stated that:
It would be grossly inefficient to try to identify all cross-subsidies associated with current pricing structuresand/or to regard them as CSO’s. ... Similarly, there will be cross-subsidisation in commercial areas due to lengthsof mains, capacity use of the system, different standards of effluent etc. The cost of gathering that information inorder to set subsidy free prices, would be very high indeed and very difficult.
C.3 CSOs in the water sector
Information provided by WSD authority participants on the nature, funding arrangements and,where available, the annual cost of their CSOs is set out in Table C.2. The Commission has notattempted to assess whether all of the CSOs reported in the table would meet the criteria set outabove.
However, despite the above-mentioned uncertainties and difficulties, some requirements imposedon water authorities by governments can clearly be regarded as CSOs.
Subsidies to specific users or groups of consumers
One group of CSOs comprises the provision of subsidised water and sewerage services to specificusers or groups of consumers. For example, subsidies to pensioners in the form of concessionalwater and sewerage rates are government policy in all States and Territories. The level of thesesubsidies varies from region to region. For example, in New South Wales country areas, watercharges to pensioners are 50 per cent of the standard charges, while in Brisbane they are 40 percent of the standard charges.

WATER RESOURCES& WASTE WATERDISPOSAL
C.276
The cost of this group of CSOs is significant. For example, pensioner rebates in Sydney andMelbourne alone are worth around $30 million and $20 million per annum, respectively.
As detailed in Table C.2, the funding arrangements for pensioner rebates also vary across Statesand Territories. Governments in Victoria, South Australia, and the Australian Capital Territory,directly fund 99 per cent of the cost, with the remainder (administration costs) being borne by theWSD authorities. In New South Wales, the State Government funds only 50 per cent of the rebate.As noted above, many WSD authorities also provide free or heavily subsidised WSD services tochurches, hospitals, nursing homes, child care centres and government departments. Someauthorities provide free water for use in parks and other municipal areas. However, as discussedearlier, there is some uncertainty about whether these services are mandatory or not. Typically nodirect government funding is provided to meet the cost of these concessions.
Provision of non-commercial services
The second group of CSOs comprises mandated requirements to extend services to areas whichwould not be supplied on commercial grounds alone. For example, the provision of water andsewerage systems in remote country towns and Aboriginal communities could be classed as CSOswhere governments subsidise the capital cost of the infrastructure.
However, from the perspective of operational efficiency, the more interesting group are decreedaugmentations to systems which are not directly funded by government and which must thereforebe paid for either by raising charges to existing users of those systems or by taxpayers taking alower rate of return on their equity in the authorities concerned. For example, prior to its recentcorporatisation, the then Hunter Water Board was only funded for 50 per cent of the cost ofmandated extensions of sewerage services to fringe areas.
Uniform pricing arrangements
The third important group of CSOs in the water sector are mandated uniform pricing arrangementsacross large areas which have significantly different costs of supply.
Within towns, and perhaps even cities, the efficiency benefits of setting different charges for usersaccording to their proximity to water sources, treatment works etc, are likely to be outweighed bythe additional administrative costs of doing so, with the consequence that uniform pricing may becommercially rational. For example, the Brisbane City Council said that:
PRICING ANDCOMMUNITYSERVICE
C.277
There are clearly cross-subsidies occurring across the City between customers within the one grouping, e.g.,customers in all sewerage catchments are charged the same rate irrespective of the capital and operating costs ofthe catchments, and remote parts of the water supply system are treated in the same way as those nearer thetreatment plants. In this regard, the Council sees the City as a single community of interest, and is not preparedto consider differential annual charges on the basis of location. Such a pricing system would be expensive andadministratively complex.
However, as the region serviced becomes larger, uniform pricing is less likely to be a commercialproposition. Indeed, the Hunter Water Corporation said that it is looking at the possibility ofdifferential charging across its operating regions. The SWB imposes different developer chargesacross Sydney.
Yet, in other areas of Australia, WSD authorities are required by government to charge uniformprices across very big regions. The most notable examples are the State-wide uniform pricingarrangements for water and sewerage services in South Australia, Western Australia, and theNorthern Territory. South Australian Government policy, for example, endorses the view that‘equal services be charged equally’ irrespective of the proximity of bulk supplies or treatmentfacilities. As discussed in Chapter 2, these uniform State-wide charging policies largely explain thelow or negative real rates of return for country water and sewerage services in South Australia,Western Australia and the Northern Territory.
Also, it seems clear that uniform pricing across amalgamated authorities in Victoria goes beyond acommercial response to the setting of charges in the face of administrative costs. The BendigoWater Board said that:
... smaller communities will never have a safe drinking water supply if they have to fund [WSD infrastructure]themselves. For them, a subsidy is the only way, whether it be by provision of a one-off capital grant fromgovernment, or an amalgamation of smaller communities with larger ones. Both options entail different types ofsubsidy either of which may be viewed as a community service obligation ...
The Victorian Government acknowledged that in the past cross subsidies had been negotiated toencourage voluntary amalgamation. However, it went on to argue that the current policy does notrequire, or indeed encourage, uniform pricing across merged authorities. It said that:
... the current minister has indicated his preparedness to take action for restructuring [amalgamation] on acompulsory basis, and in a number of those areas you will find that there is no move to force uniform pricing orcross-subsidisation, but simply to pass on to all the communities the benefits of a larger organisation with betterfinancial leverage, lower administrative costs, better expertise, etcetera, and the pricing levels being charged in anumber of districts that were formerly smaller authorities have changed because of that rather than because of aconscious cross-subsidisation policy.

WATER RESOURCES& WASTE WATERDISPOSAL
C.278
Other CSOs
Other activities which are categorised by some participants as CSOs include catchment policy andmanagement, flood mitigation and flood plain management, environmental and water qualitymanagement (including salinity reduction, water conservation strategies and water research), theprovision of picnic facilities and other recreational facilities around water catchment areas, andwater advisory services. The cost of these activities is usually met by the Commonwealth and/orState governments.
Property based charging
Property based charging for WSD services is also sometimes thought of as a CSO, in that it broadlyredistributes income from business to households, and from wealthy to poor households.
But the extent to which property based charging reflects a directive from government is unclear.At least in Victoria there is no explicit government requirement for WSD authorities to continue tobase charges on property values. The Latrobe Regional Commission said that:
Distortions caused through pricing structures which produce cross-subsidies are not imposed on the industry byGovernments. The [Victorian] Water Act enables water authorities to charge prices which reflect payment foruse, so cross-subsidies which derive from rate based pricing are voluntary rather than compulsory obligations.
However, the many property based charging systems still existing in that State can be seen as thelegacy of legislation applying until 1990 requiring that property value be the sole determinant ingeneral pricing arrangements.
Further, some WSD authorities said that government discourages any immediate attempt todispense with property based charging. For example, the SWB argued that:
... most of the water authorities have been trying to move on to user pays but have not been able to get rid of theirproperty tax bases either at the speed which they desire or [are] effectively positively discouraged by theirgovernments to move at the speed at which they desire.
Similarly, Melbourne Water Corporation argued that:
Given the existing incidence of property based charges and political sensitivity to the impact of change,movement off the rate base may be at a slower rate than that desired by the authority.
And, South Australia’s new water pricing policy relies heavily on property charges.
While, property-based charges have some CSO characteristics, they also have a number ofredistributive impacts seemingly at odds with the generally accepted goals of wealth distribution.There is no clear link between ability to pay and the economic circumstances of individual users.For example, small businesses using relatively little water may pay a much higher price than, say, alarge motel in the CBD does. Similarly, occupants of flats and home units may subsidise the wateruse of more, or equally, affluent people residing on standard suburban blocks. The distributionalimpact of property based charging is discussed in detail in Chapter 6.

PRICING ANDCOMMUNITYSERVICE
C.279
C.4 Funding arrangements
From an efficiency perspective, the way in which CSOs are funded is critically important. TheCommission has recommended that all CSOs should be directly funded in full by the governmentsconcerned. Direct funding ensures that the adverse efficiency effects of subsidies are notmultiplied by a requirement to fund concessions by overcharging other users. Direct funding isalso important in making assistance transparent.
If direct funding of CSOs is to be implemented, a method for valuing obligations needs to beestablished.
Valuing CSOs in the water sector raises a number of problems. One problem raised by the WaterAuthority of Western Australia (WAWA) is the costing of CSOs where water and seweragecharges are based on property values. WAWA said that:
Property values for establishments owned by [charities, sport clubs, religious bodies, various other non-profitgroups, State Government and local authorities] are not available to the Water Authority from the same source asfor rated properties. As a consequence it is not easily possible to assess the fixed charges that would be payable ifsuch customers were treated in the same way as rated non-residential customers. Although a number ofapproaches are possible to quantify the benefits provided, all involve significant implementation costs.
A much more significant problem is how common (or joint) costs should be treated for valuationpurposes. Many of the costs incurred by WSD agencies can only arbitrarily be split between say,water and sewerage or between different groups of customers. The main issue here is whether ornot common costs should be apportioned across all users, including the beneficiaries of CSOs.
The Commission’s views on the appropriate basis for valuing CSOs are discussed in Chapter 6 of
this report.
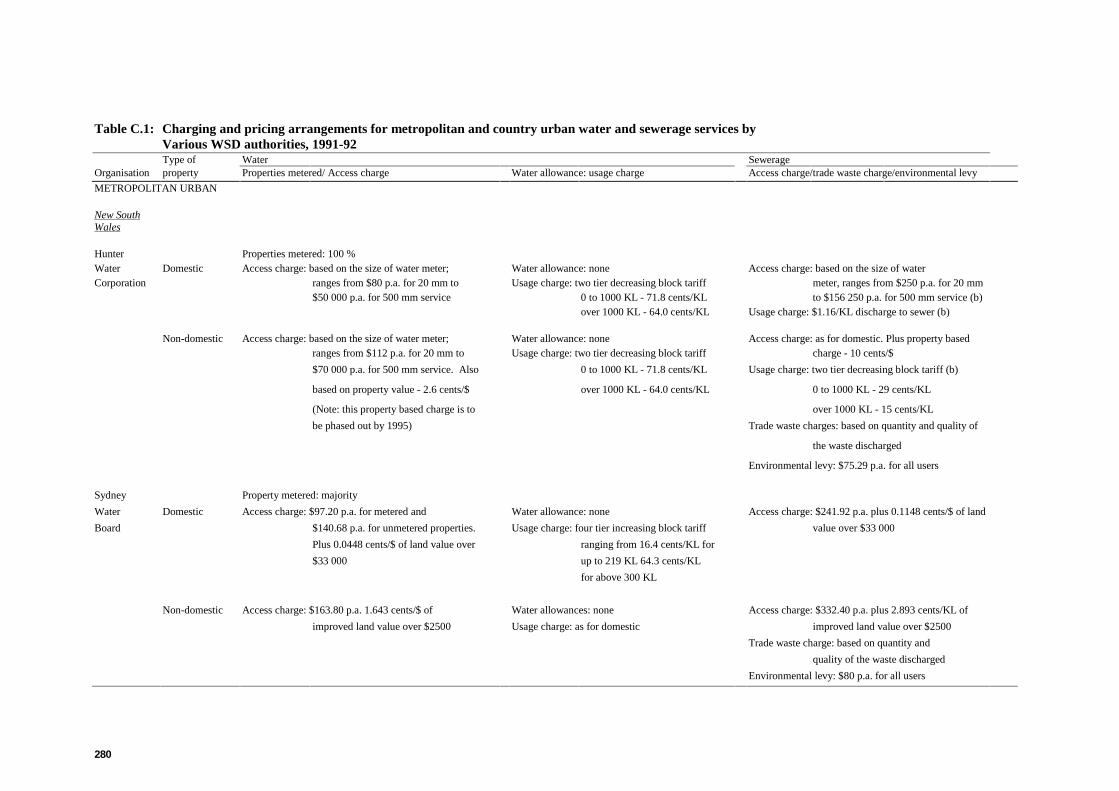
280
Table C.1: Charging and pricing arrangements for metropolitan and country urban water and sewerage services byVarious WSD authorities, 1991-92Type of Water Sewerage
Organisation property Properties metered/ Access charge Water allowance: usage charge Access charge/trade waste charge/environmental levy
METROPOLITAN URBAN
New SouthWales
Hunter Properties metered: 100 %Water Domestic Access charge: based on the size of water meter; Water allowance: none Access charge: based on the size of waterCorporation ranges from $80 p.a. for 20 mm to Usage charge: two tier decreasing block tariff meter, ranges from $250 p.a. for 20 mm
$50 000 p.a. for 500 mm service 0 to 1000 KL - 71.8 cents/KL to $156 250 p.a. for 500 mm service (b)over 1000 KL - 64.0 cents/KL Usage charge: $1.16/KL discharge to sewer (b)
Non-domestic Access charge: based on the size of water meter; Water allowance: none Access charge: as for domestic. Plus property basedranges from $112 p.a. for 20 mm to Usage charge: two tier decreasing block tariff charge - 10 cents/$
$70 000 p.a. for 500 mm service. Also 0 to 1000 KL - 71.8 cents/KL Usage charge: two tier decreasing block tariff (b)
based on property value - 2.6 cents/$ over 1000 KL - 64.0 cents/KL 0 to 1000 KL - 29 cents/KL
(Note: this property based charge is to over 1000 KL - 15 cents/KL
be phased out by 1995) Trade waste charges: based on quantity and quality of
the waste discharged
Environmental levy: $75.29 p.a. for all users
Sydney Property metered: majority
Water Domestic Access charge: $97.20 p.a. for metered and Water allowance: none Access charge: $241.92 p.a. plus 0.1148 cents/$ of land
Board $140.68 p.a. for unmetered properties. Usage charge: four tier increasing block tariff value over $33 000
Plus 0.0448 cents/$ of land value over ranging from 16.4 cents/KL for
$33 000 up to 219 KL 64.3 cents/KL
for above 300 KL
Non-domestic Access charge: $163.80 p.a. 1.643 cents/$ of Water allowances: none Access charge: $332.40 p.a. plus 2.893 cents/KL of
improved land value over $2500 Usage charge: as for domestic improved land value over $2500
Trade waste charge: based on quantity and
quality of the waste discharged
Environmental levy: $80 p.a. for all users
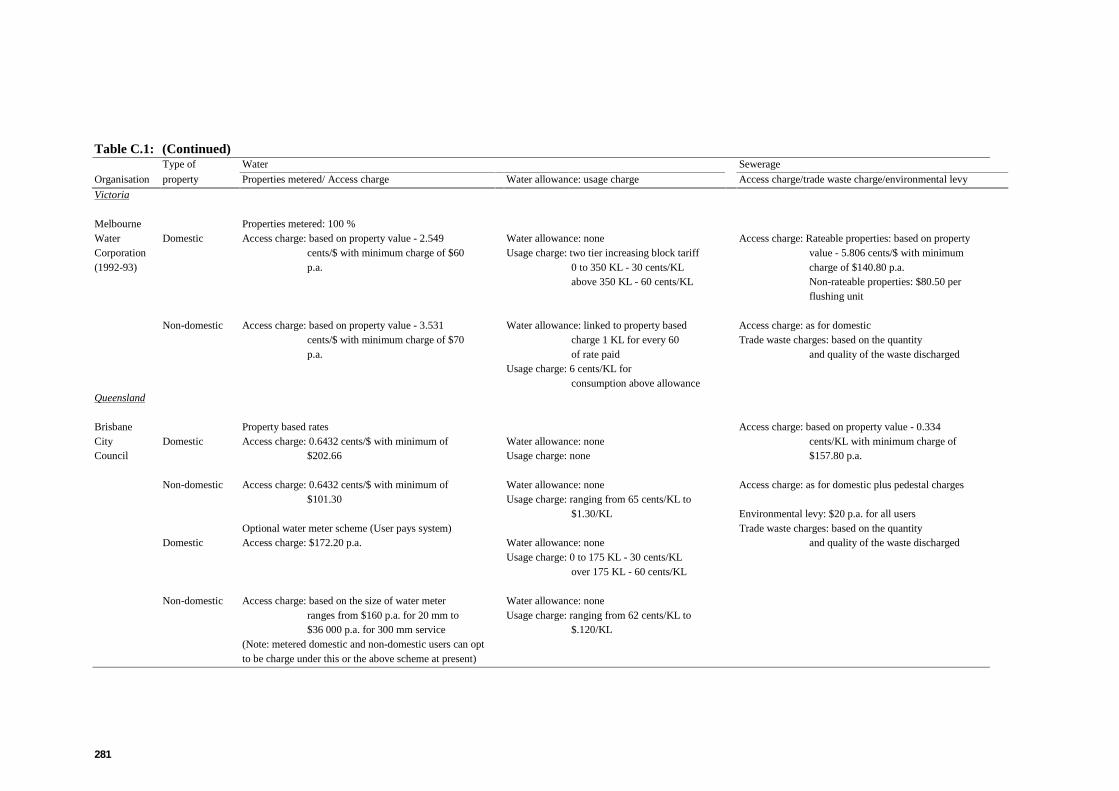
281
Table C.1: (Continued)Type of Water Sewerage
Organisation property Properties metered/ Access charge Water allowance: usage charge Access charge/trade waste charge/environmental levy
Victoria
Melbourne Properties metered: 100 %Water Domestic Access charge: based on property value - 2.549 Water allowance: none Access charge: Rateable properties: based on propertyCorporation cents/$ with minimum charge of $60 Usage charge: two tier increasing block tariff value - 5.806 cents/$ with minimum(1992-93) p.a. 0 to 350 KL - 30 cents/KL charge of $140.80 p.a.
above 350 KL - 60 cents/KL Non-rateable properties: $80.50 perflushing unit
Non-domestic Access charge: based on property value - 3.531 Water allowance: linked to property based Access charge: as for domesticcents/$ with minimum charge of $70 charge 1 KL for every 60 Trade waste charges: based on the quantityp.a. of rate paid and quality of the waste discharged
Usage charge: 6 cents/KL forconsumption above allowance
Queensland
Brisbane Property based rates Access charge: based on property value - 0.334City Domestic Access charge: 0.6432 cents/$ with minimum of Water allowance: none cents/KL with minimum charge ofCouncil $202.66 Usage charge: none $157.80 p.a.
Non-domestic Access charge: 0.6432 cents/$ with minimum of Water allowance: none Access charge: as for domestic plus pedestal charges$101.30 Usage charge: ranging from 65 cents/KL to
$1.30/KL Environmental levy: $20 p.a. for all usersOptional water meter scheme (User pays system) Trade waste charges: based on the quantity
Domestic Access charge: $172.20 p.a. Water allowance: none and quality of the waste dischargedUsage charge: 0 to 175 KL - 30 cents/KL
over 175 KL - 60 cents/KL
Non-domestic Access charge: based on the size of water meter Water allowance: noneranges from $160 p.a. for 20 mm to Usage charge: ranging from 62 cents/KL to$36 000 p.a. for 300 mm service $.120/KL
(Note: metered domestic and non-domestic users can optto be charge under this or the above scheme at present)

282
Table C.1: (Continued)Type of Water Sewerage
Organisation property Properties metered/ Access charge Water allowance: usage charge Access charge/trade waste charge/environmental levy
WesternAustralia
Water Properties metered: majorityAuthority of Domestic Access charge: $113.40 p.a. Water allowance: 150 KL p.a. Access charge: based on property value ranging fromWestern Usage charge: five tier increasing block tariff 6.92 cents/$ for value to $4900 toAustralia for consumption above allowance 4.50 cents/$ for value over $13 000.
ranging from 51.4 cents/KL for Minimum charge is $127 p.a.151 to 350 KL to 96.0 cents/KLfor over 1950 KL
Non-domestic Access charge: based on property value from Water allowance: linked to property based Access charge: based o property value ranging from4.68 cents/$ for value over charge - access charge plus 10% 4.48 cents/$ for value up to $8000 to$1.6 million. Minimum charge is $250 divided by 0.528 4.45 cents/$ for value over $1.6 million.p.a. Usage charge: two tier increasing block tariff Minimum charge is $250 p.a.
for consumption above allowance Trade waste charge: based on quantity andup to 600 KL - 52.8 cents/KL quality of the waste dischargedover 600 KL - 58.9 cents/KL
SouthAustralia
Engineering Properties metered: majorityand Water Domestic Access charge: based on property value - 0.08% of Water allowance: 136 KL p.a. Access charge: based on property value - 0.2% ofSupply Capital value over $117 000 with Usage charge: 85 cents/KL for capital value with minimum charge ofDepartment Minimum charge of $116 p.a. consumption above allowance $162 p.a.
(Note: domestic water pricing is currently under review)Non-domestic Access charge: based on property value - 0.183% of Water allowance: linked to property based Access charge: as for domestic
of capital value with minimum charge - 1 KL for every 85charge of $116 p.a. cents of rate paid Environmental levy: 10 per cent of the sewerage
Usage charge: as for domestic charge for all propertiesTasmaniaLocal Domestic and Properties metered: varies between municipalities Water allowance: where metered generally Access charge: based on land value ranging from 1.5Government non-domestic Access charge: based on land value ranging from above 360 KL p.a. cents/$ t 5.2411 cents/$ with
1 cents to 5.57 cents in the dollar with minimum charge of $135 to $271 p.a.minimum charge of $130 to $300 p.a.
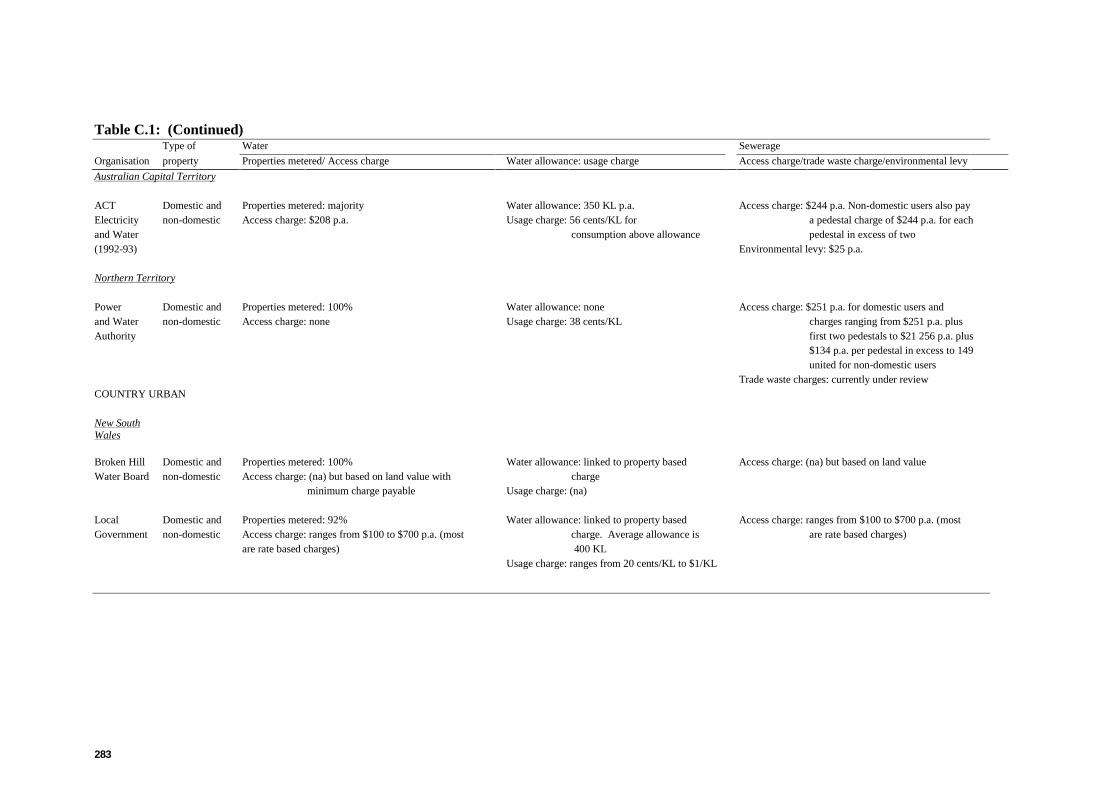
283
Table C.1: (Continued)Type of Water Sewerage
Organisation property Properties metered/ Access charge Water allowance: usage charge Access charge/trade waste charge/environmental levy
Australian Capital Territory
ACT Domestic and Properties metered: majority Water allowance: 350 KL p.a. Access charge: $244 p.a. Non-domestic users also payElectricity non-domestic Access charge: $208 p.a. Usage charge: 56 cents/KL for a pedestal charge of $244 p.a. for eachand Water consumption above allowance pedestal in excess of two(1992-93) Environmental levy: $25 p.a.
Northern Territory
Power Domestic and Properties metered: 100% Water allowance: none Access charge: $251 p.a. for domestic users andand Water non-domestic Access charge: none Usage charge: 38 cents/KL charges ranging from $251 p.a. plusAuthority first two pedestals to $21 256 p.a. plus
$134 p.a. per pedestal in excess to 149united for non-domestic users
Trade waste charges: currently under reviewCOUNTRY URBAN
New SouthWales
Broken Hill Domestic and Properties metered: 100% Water allowance: linked to property based Access charge: (na) but based on land valueWater Board non-domestic Access charge: (na) but based on land value with charge
minimum charge payable Usage charge: (na)
Local Domestic and Properties metered: 92% Water allowance: linked to property based Access charge: ranges from $100 to $700 p.a. (mostGovernment non-domestic Access charge: ranges from $100 to $700 p.a. (most charge. Average allowance is are rate based charges)
are rate based charges) 400 KLUsage charge: ranges from 20 cents/KL to $1/KL

284
Table C.1: (Continued)Type of Water Sewerage
Organisation property Properties metered/ Access charge Water allowance: usage charge Access charge/trade waste charge/environmental levy
Victoria
Ballarat Properties metered: (na)Water Domestic Access charge: (na) but based on property value with Water allowance: linked to property based Access charge: (na)Board minimum charge payable charge and rages from 300 KL
to 800 KL p.a.Usage charge: (na)
Non-domestic Access charge: (na) but based on property value with Water allowance: (na)minimum charge payable Usage charge: (na)
Benalla Domestic and Properties metered: 100% Water allowance: linked to property based Access charge: (na) but based o property valueWater non-domestic Access charge: (na) but based on property value chargeBoard Usage charge: (na)
Bendigo Domestic and (c) (c) Access charge: (na) but based on property valueWater non-domestic with minimum charge payableBoard Trade waste charge: (na)
Colac District Domestic and Properties metered: 99 % Water allowance: linked to property based Access charge: (na)Water Board non-domestic Access charge: (na) but based on property value charge Trade waste charge: based on quality of
(Note: from July 1992, the Board will introduce a Usage charge: none sewerage dischargednew tariff structure which includes: an access chargebased on connection size; a fixed water allowance;and a usage charge for consumption that exceedsfixed allowance)

285
Table C.1: (Continued)Type of Water Sewerage
Organisation property Properties metered/ Access charge Water allowance: usage charge Access charge/trade waste charge/environmental levy
Geelong and Domestic Properties metered: 98% Water allowance: none Access charge: (na) but based on property valueDistrict Access charge: based on the size of the connection Usage charge: two tier increasing block tariffWater Board ranging from $75 p.a. for 25 mm to 0 to 500 KL - 44 cents/KL
$7500 p.a. for 200 mm service above 500 KL -57 cents/KL
Non-domestic Properties metered: majority Water allowance: none Access charge: (na) but based on property valueAccess charge: based on the size of the connection Usage charge: 57 cents/KL Environmental levy: based on property value and
ranging from $164 p.a. for 25 mm to ranges from about $70 p.a. to $120 p.a.$16 400 p.a. for 200 mm service for all users
Portland Domestic and Properties metered: (na) Water allowance: (na) Access charge: based on property value - 4.36 cents/$Water non-domestic Access charge: based on property value - 4.78 cents/$ Usage charge: (na) with minimum charge payableBoard (1989-90) with minimum charge payable Trade waste charge: based on quality of
sewerage discharged
Roachester Domestic and Properties metered: 100% Water allowance: none Access charge: $220 p.a. per propertyWater non-domestic Access charge: $100 p.a. per property Usage charge: three tier increasing block tariff $90 p.a. for vacant landBoard (d) $90 p.a. for vacant land 0 to 200 KL - 12 cents/KL
201 to 500 KL - 41 cents/KLabove 500 KL - 51 cents/KL
Shepparton Properties metered: 95%Water Domestic and Access charge: based on property value - 1.85 cents/$ Water allowance: (na) Access charge: based on property value - 2.01 cents/$Board non-domestic with minimum charge payable Usage charge: 24.4 cents/KL Trade waste charge: based on quantity and
quality of sewage discharged
Sunraysia Domestic and Properties metered: 100% Water allowance: (na) Access charge: (na) but based on property valueWater non-domestic Access charge: (na) but based on property value Usage charge: 26 cents/KL forBoard consumption above allowance
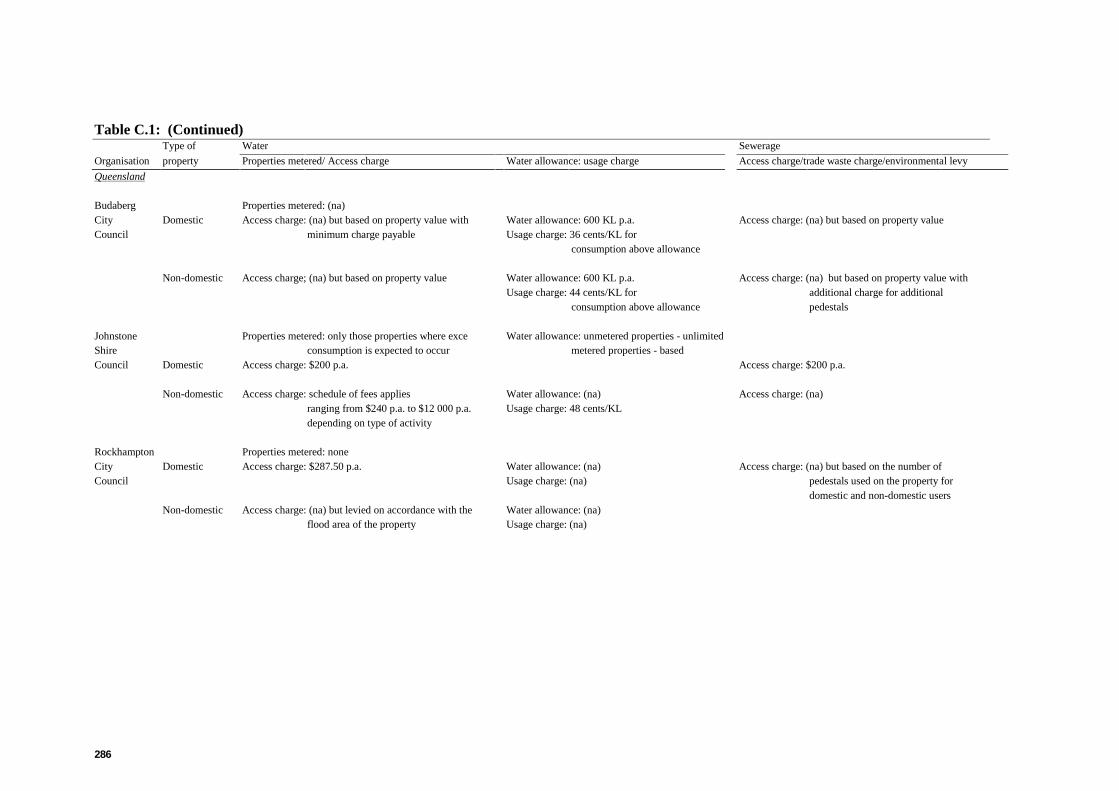
286
Table C.1: (Continued)Type of Water Sewerage
Organisation property Properties metered/ Access charge Water allowance: usage charge Access charge/trade waste charge/environmental levy
Queensland
Budaberg Properties metered: (na)City Domestic Access charge: (na) but based on property value with Water allowance: 600 KL p.a. Access charge: (na) but based on property valueCouncil minimum charge payable Usage charge: 36 cents/KL for
consumption above allowance
Non-domestic Access charge; (na) but based on property value Water allowance: 600 KL p.a. Access charge: (na) but based on property value withUsage charge: 44 cents/KL for additional charge for additional
consumption above allowance pedestals
Johnstone Properties metered: only those properties where exce Water allowance: unmetered properties - unlimitedShire consumption is expected to occur metered properties - basedCouncil Domestic Access charge: $200 p.a. Access charge: $200 p.a.
Non-domestic Access charge: schedule of fees applies Water allowance: (na) Access charge: (na)ranging from $240 p.a. to $12 000 p.a. Usage charge: 48 cents/KLdepending on type of activity
Rockhampton Properties metered: noneCity Domestic Access charge: $287.50 p.a. Water allowance: (na) Access charge: (na) but based on the number ofCouncil Usage charge: (na) pedestals used on the property for
domestic and non-domestic usersNon-domestic Access charge: (na) but levied on accordance with the Water allowance: (na)
flood area of the property Usage charge: (na)

287
Table C.1: (Continued)Type of Water Sewerage
Organisation property Properties metered/ Access charge Water allowance: usage charge Access charge/trade waste charge/environmental levy
Townsville Properties metered: majorityCity Domestic Access charge: $269.36 p.a. Water allowance: 776 KL p.a. Access charge: $316.24 p.a. per pedestal (includesCouncil Usage charge: 61.26 cents/KL for charge for refuse collection)
Consumption above allowanceNon-domestic Access charge: $27.60 per 10 square meters Water allowance: linked to the size of Access charge: $356.32 p.a. per pedestal (includes
of total floor area of all buildings on Property charge for refuse collection)the land or 0.728 cents/$ of Usage charge: 93.38 cents/KL forthe unimproved value of the land, consumption above allowancewhichever is greater, with minimumcharge of $202.18 p.a.
Western Australia
Water Domestic and Properties metered: majority Water allowance: (na) Access charge: based on property value - 0.252Authority non-domestic Access charge: based on property value - 0.183 Usage charge: 85 cents/K: (e) cents/$ with minimum charge of $162of Western cents/$ with minimum charge of p.a.Australia $116 p.a.
South Australia
Engineering Domestic and Properties metered: majority Water allowance: (na) Access charge: based on property value -0.252and Water non-domestic Access charge: based on property value - 0.183 Usage charge: 85 cents/KL (e) cents/$ with minimum charge of $162Supply cents/$ with minimum charge of p.a.Department $116 p.a.
Tasmania
Local Domestic and Properties metered: varies between municipalities Water allowance: where metered, generally Access charge: based on land value ranging from 1.5Governments non-domestic Access charge: based on land value ranging from about 360 KL p.a. cents to 5.2411 cents/$ with
1 cent to 5.57 cents in the dollar with Usage charge: (na) minimum charge of $135 to $271 p.a.minimum charge of $130 to $300

288
Table C.1: (Continued)Type of Water Sewerage
Organisation property Properties metered/ Access charge Water allowance: usage charge Access charge/trade waste charge/environmental levy
Launceston Properties metered: (na)City Domestic Access charge: (na) but based on property value with Water allowance: 365 KL p.a. Access charge: (na) but based o property value withCouncil minimum charge payable Usage charge: (na) minimum charge payable
Non-domestic Access charge: (na) but based on property value with Water allowance: 28 litres per dollar Access charge: (na) but based on property value withminimum charge payable of property value minimum charge payable
Usage charge: (na)
Northern Territory
Power Domestic and Properties metered: (na) Water allowance: none Access charge: $251 p.a. for domestic users andand Water non-domestic Access charge: (na) Usage charge: 38 cents/KL charges ranging from $251 p.a. for theAuthority first two pedestals to $21 256n p.a. plus
$134 p.a. per pedestal in excess of 149units for non-domestic users
(na) Not available - information not provided in source documentsa Information provided is for 1991-92, unless otherwise indicated.b Sewer charge is subject to discharge factor - the assessed percentage of water usage disposed of through the sewerc The Board is only responsible for sewerage services. The Rural Water Commission provides water supply to the area.d The Rochester Water Board recently amalgamated with Elmore Water Board and Echuca Water Board to form the new Campaspe Region Water Authority. The pricing regime refers to
Rochester and Lockington regions only.e Except for the Streaky Bay region where a charge of $1.70 applies for water used in excess of 360 KL p.a.Source: AWRC 1992b, submissions and Annual Reports of various WSD authorities.

289
Table C.2: Community service obligations undertaken by various WSD authorities, 1989-90 (a)
Organisation Nature of CSOs Estimated cost Funding method
($’000)
New South Wales
Hunter Pensioner rebate scheme (b) 2596 New South Wales Government funds 50% of the pensionerWater Hardship relief scheme 2 rebates. Remaining 50 % and other CSOs areCorporation internally funded(1990-91)
Sydney Extensive - includes:Water Board Pensioner rebate scheme (b) 30 450 New South Wales Government funds 50% of
Exemptions from access charges for local governments, parks, hospitals, 32 500 pensioner rebates. Remaining 50 % and otherchurches and charitable institutions CSOs are internally funded
Hardship relief scheme (b) 150First home buyers’ scheme (b) (c) 97Administration of the Government’s Special Environmental Programme nsc(Note: the Board is currently reviewing its COSs)
Victoria
Melbourne 50% pensioner rebate scheme up to a maximum of $67.50 for both water 18 000 Victorian Government funds 99% of pensioner rebateWater and sewerage charges scheme
Free water to institutions (eg hospitals, churches, schoolsand government departments) 4000 Internally funded
Administration of rate waiver scheme (b) 132 ) Victorian Government reimburses the Board the value of theAdministration of retro-fits scheme (b) 30 ) rates waived. The administrative costs are internally fundedDrainage and planning rate exemptions 705 Internally funded
Queensland
Brisbane 40 % pensioner rebate scheme 6100 Majority internally fundedCity Council Lowering and raising of sewerage manholes in residential properties 800 with some minor compensation
Maintenance of fire hydrants 750 provided by the Queensland GovernmentAdvice to households nscFree water supply to parks and recreational areas nsc
METROPOLITAN AREA

290
Table C.2: (Continued)
Organisation Nature of CSOs Estimated cost Funding method
($’000)
Western Australia
Water Pensioner scheme rebate (b) 12 000 Internally fundedAuthority of Concession on water and sewerage charges to non-rated government 5000Western properties, charities etc (b)Australia Apprentice training at a level above the needs of the Authority 1000(1990-91) Water resources management 9000
Infill sewerage 13 000Cross subsidies to country operations:
Water, sewerage, drainage and irrigation services 40 000Shortfall in replacement cost depreciation 26 000
South Australia
Engineering Rebates to particular organisations and public institutions (b) 9400 Internally fundedand Water Pensioner remission scheme (b)Supply remission grants 11 500 ) Funded (except for administration costs) by the Department ofDepartment (e) administration 220 ) Family and Community Services
Community service undertakings such as water resource management;flood mitigation; apprentice training; River Murray diversions;liquid waste disposal; Brukunga Acid Neutralisation Plant 20 600 ) An agreed (minor) contribution from the South Australian
Social justice initiatives such as provision of water and sewerage 1200 ) Government, with the remainder internally fundedservices to remote Aboriginal communities
Uniform pricing nsc ) Internally fundedWater conservation advisory service nsc )

291
Table C.2: (Continued)
Organisation Nature of CSOs Estimated cost Funding method
($’000)
Tasmania
Hobart Free water supplies to the City of Hobart for hospitals, houses for the 137 )Regional aged, child care centres and homes etc ) Not identifiedWater Board Free water supplies to the Royal Tasmanian Botanical Gardens in 20 )
Hobart and the Southern Regional Lawn Cemetery at Kingston
Northern Territory
Power Remote community water and sewerage services 11 081 Funded by the Commonwealth Governmentand Water Uniform pricing nsc Internally fundedAuthority (e) Pensioner rebate scheme (b) nsc )(1990-91) Baseline data collection and processing for both surface and ) Pensioner rebate schemes and water resource
ground water nsc ) management activities are funded directly byFloodplain management nsc ) the Northern Territory GovernmentRural advisory services nsc )Identification of water resources for potential horticultural nsc )
Development )Projects to assist development of the mining industry nsc )
Australian CapitalTerritory
ACT 50 % pensioner rebate scheme 899 Pensioner rebate scheme is funded by the ACT Housing andElectricity 50 % concession on excess water and sewerage charges to bodies nsc Community Services Bureau. Other CSOs are internallyand Water such as churches, schools and hospitals (f) funded(1990-91)
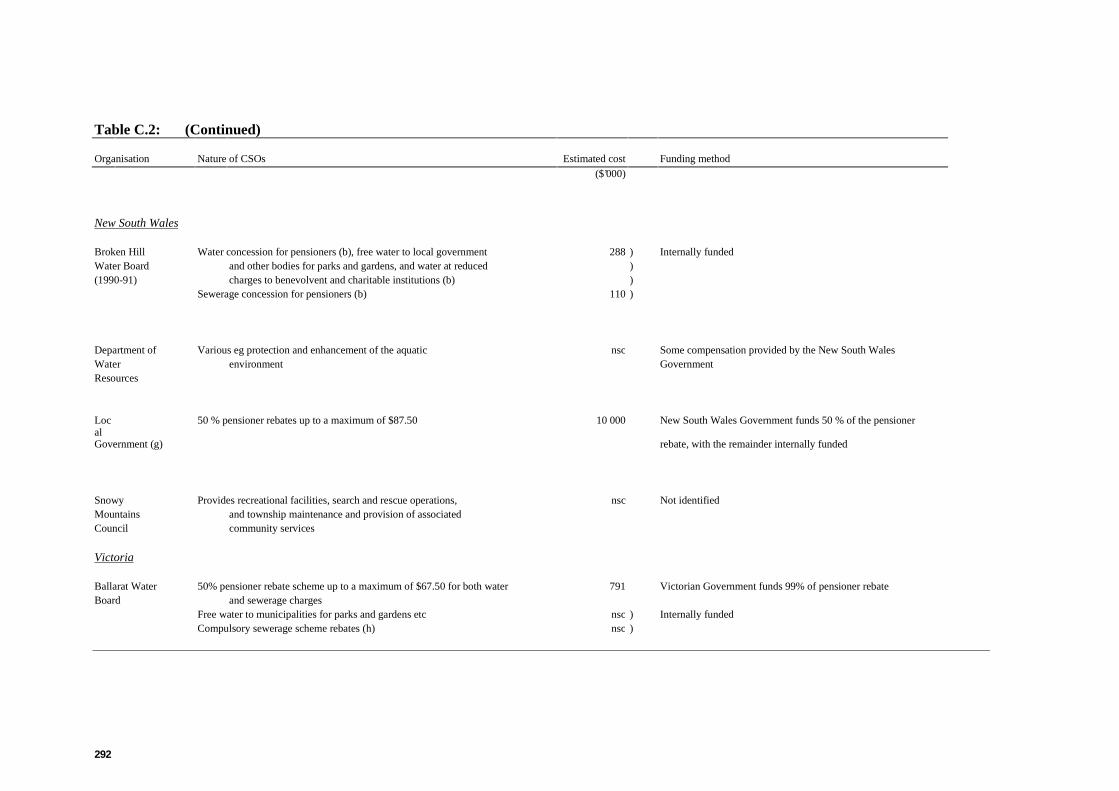
292
Table C.2: (Continued)
Organisation Nature of CSOs Estimated cost Funding method
($’000)
New South Wales
Broken Hill Water concession for pensioners (b), free water to local government 288 ) Internally fundedWater Board and other bodies for parks and gardens, and water at reduced )(1990-91) charges to benevolvent and charitable institutions (b) )
Sewerage concession for pensioners (b) 110 )
Department of Various eg protection and enhancement of the aquatic nsc Some compensation provided by the New South WalesWater environment GovernmentResources
Local
50 % pensioner rebates up to a maximum of $87.50 10 000 New South Wales Government funds 50 % of the pensioner
Government (g) rebate, with the remainder internally funded
Snowy Provides recreational facilities, search and rescue operations, nsc Not identifiedMountains and township maintenance and provision of associatedCouncil community services
Victoria
Ballarat Water 50% pensioner rebate scheme up to a maximum of $67.50 for both water 791 Victorian Government funds 99% of pensioner rebateBoard and sewerage charges
Free water to municipalities for parks and gardens etc nsc ) Internally fundedCompulsory sewerage scheme rebates (h) nsc )

293
Table C.2: (Continued)
Organisation Nature of CSOs Estimated cost Funding method
($’000)
Bendigo Water 50% pensioner rebate scheme up to a maximum of $67.50 for both water nsc Victorian Government funds 99% of pensioner rebateBoard and sewerage charges
Subsidy to churches and other specified charitable organisations (b) nsc ) Internally fundedCompulsory sewerage scheme rebates (h) nsc )
Colac District 50% pensioner rebate scheme up to a maximum of $67.50 for both water nsc Victorian Government funds 99% of pensioner rebateWater Board and sewerage charges
Compulsory sewerage scheme rebates (h) nsc Internally funded
Geelong and 50% pensioner rebate scheme up to a maximum of $67.50 for both water nsc Victorian Government funds 99% of pensioner rebateDistrict Water and sewerage chargesBoard Subsidised water to pubic parks, gardens and playgrounds - 23% off water nsc ) Internally funded
usage charge and a 34% off a connection charge. )Subsidised water to benevolent institutions - 61% off water usage charge nsc )
and a 34% off a connection charge
Hamilton 50% pensioner rebate scheme up to a maximum of $67.50 for both water 91 Victorian Government funds 99% of pensioner rebateWater Board and sewerage charges
Subsidies for small urban centresFree water to the City of Hamilton for parks, gardens and public reserves nsc Internally funded
Latrobe 50% pensioner rebate scheme up to a maximum of $67.50 for both water nsc Victorian Government funds 99% of pensioner rebateRegional Water and sewerage chargesAuthority Recreational facilities nsc ) Internally funded
Flood warning system nsc )
Portland Water 50% pensioner rebate scheme up to a maximum of $67.50 for both water 92 Victorian Government funds 99% of pensioner rebateBoard and sewerage charges(1990-91) Compulsory sewerage scheme rebates (h) 3 Internally funded
Rochester 50% pensioner rebate scheme up to a maximum of $67.50 for both water 32 Victorian Government funds 99% of pensioner rebateWater Board (i) and sewerage charges

294
Table C.2: (Continued)
Organisation Nature of CSOs Estimated cost Funding method
($’000)
Rural Water Various, eg flood warning systems, water industry research and water 11 500 Funded by the Victorian GovernmentCommission (1988-89) testing for water boards etc
Shepparton 50% pensioner rebate scheme up to a maximum of $67.50 for both water nsc Victorian Government funds 99% of pensioner rebateWater Board and sewerage charges(1990-91) Compulsory sewerage scheme rebates (h) 22 Internally funded
Queensland
Water Resources Not identified (j)Commission
Tasmania
Hydro-Electric Provides special lake levels and river flows in lakes, streams nsc Not identifiedCommission and water courses under its control, for leisure and
recreational purposes. The Commission isrequired to ensure adequate provision of water, free of charge,for stock, domestic and irrigation needs
nsc Not separately costed.a Information provided is for 1989-90, unless otherwise indicated.b Subsidy rate not specified.c The First Home Buyers scheme is being phased out.d This exemption is not mandated by the Victorian Government.e The authority also supplies water and sewerage services to country areas.f These concessions are not mandated by the ACT Government.g Includes local councils providing WSD services to country urban centres in NSW that are not serviced by the Sydney, Hunter, Broken Hill, Cobar, Gosford and Wyong Water Boards.h Under the compulsory sewerage scheme rebate, Victorian Water Boards are required to provide rebates of 50% of the annual sewerage charges, up to a maximum each year of 10%
of the capital costs paid by the landowner. The rebates apply for a period of up to 10 years and are internally funded by theBoards.
i Rochester Water Board recently amalgamated with Elmore Water Board and Echuca Water Board to form the new Campaspe Region Water Authority. The figures reported refer toRochester and Lockington regions only.
j Identification of CSOs is currently proceeding.Sources: IAC 1989, submissions and Annual Reports of various WSD authorities

PRICING ANDCOMMUNITYSERVICE
295
WATER RESOURCES& WASTE WATERDISPOSAL
D.296
APPENDIX D: ECONOMY-WIDE GAINS FROM
PRODUCTIVITY IMPROVEMENTS
The likely economy-wide effects of improved performance through better asset replacementmethods and staffing practices are quantitatively assessed in this appendix. To do this, theCommission used a version of the ORANI model which was specially developed for this inquiry.These productivity improvements are considered in isolation from other possible reforms, such asprice adjustments to achieve a desired rate of return target.
D.1 Potential cost savings
The productivity improvements considered in the simulations are based on information supplied tothis inquiry by the AWRC. This material updates earlier work on potential industry-wide costsavings reported in IC 1990 and Manoel and Reynolds 1989 and disaggregates the estimates acrossfive water and sewerage sub-industries.
Around two-thirds of the cost of providing water and sewerage services is accounted for by thecosts of infrastructure: dams, pumping stations, treatment plants, water and sewerage mains, andirrigation channels. Thus higher productivity in the areas of construction, operation andmaintenance has the potential to bring about significant reductions in the overall cost of providingWSD services.
Table D.1 summarises the AWRC’s estimates of the potential savings in asset replacement costs.The biggest cost reduction -- 30 per cent -- is available for medium and small size water andsewerage mains. In 1989-90, medium and small diameter mains accounted for around one half ofthe estimated replacement value of water and sewerage assets ($82 billion).
The differences in the estimated cost savings reported in Table D.1 reflect the varying extent towhich project management and control is already applied in different types of construction activity;the extent to which competitive tendering for asset replacement is already used; and whetheremerging technologies, such as trenchless main laying and replacement, are applicable.Traditionally, cost saving iniatives have focussed on the planning and construction of strategicassets, such as dams and large mains. For example, contracting out is already used extensively formost strategic assets. However less costly assets, such as medium and small size mains, are stillfrequently installed by agencies’ own labour. According to the AWRC, re-evaluation of thematerials used in these assets and a total quality control approach could potentially be verybeneficial.

ECONOMY-WIDEGAINS FROMPRODUCTIVITYIMPROVEMENTS
D.297
Table D.1: Distribution of asset costs and potential savings, 1989-90
Asset Feasiblevalue ($m) reduction in
asset cost (%)______________________________________ ___________________________
Assets Metro Non-Metro Irrigation Total Metro Non-Metro Irrigation
Large mainswater 4 953 3 415 183
a8 551 10 10 10a
sewerage 2 756 1 230 - 3 986 10 10 -
Medium mainswater 3 660 10 245 - 1 3905 30 23 -sewerage 2 982 1 331 - 4 313 30 30 -
Small mainswater 9 100 - - 9 100 30 - -sewerage 9 870 4 406 - 1 4276 30 30 -
Pumping stationswater 719 429 55 1 203 15 10 10sewerage 1 013 397 - 1 410 15 10 -
Treatment plantswater 1 245 581 - 1 826 10 10 -sewerage 3 891 1 500 - 5 391 10 10 -
Storage dams 3 208 3 195 4 596 10 999 10 10 10
Reservoirs/tanks 1212 804 - 2 016 15 10 -
Irrigation channels - - 4 187 4 187 - 5
Inlet/service structures - - 751 751 - 10
Total 44 609 27 533 9 772 81 914
a All mainsSource: Information supplied by the AWRC
The savings identified in Table D.1 would only be realised once the existing assets have come tothe end of their economic lives and need replacing. The estimated economic lives and average ageof assets currently in place Australia-wide are presented in Table D.2.
Table D.2 shows that most assets are around a third to half way through their economic lives. Thetimeframe within which the cost reductions identified are likely to be achievable is: 25 to 45 yearsfor mains, pumping stations, treatment plants, reservoirs, irrigation channels and inlet structures;and around 80 years for dams. Thus, most of the asset related cost savings could be achievedwithin 45 years.
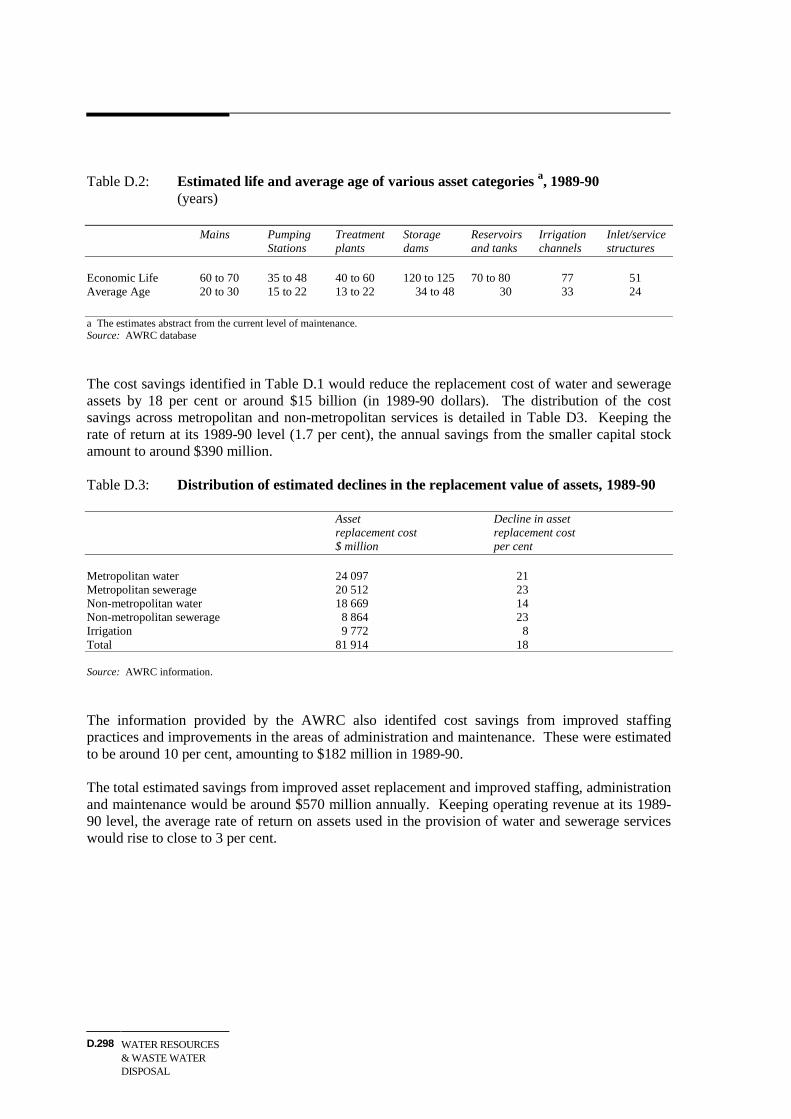
WATER RESOURCES& WASTE WATERDISPOSAL
D.298
Table D.2: Estimated life and average age of various asset categories a, 1989-90(years)
Mains Pumping Treatment Storage Reservoirs Irrigation Inlet/serviceStations plants dams and tanks channels structures
Economic Life 60 to 70 35 to 48 40 to 60 120 to 125 70 to 80 77 51Average Age 20 to 30 15 to 22 13 to 22 34 to 48 30 33 24
a The estimates abstract from the current level of maintenance.Source: AWRC database
The cost savings identified in Table D.1 would reduce the replacement cost of water and sewerageassets by 18 per cent or around $15 billion (in 1989-90 dollars). The distribution of the costsavings across metropolitan and non-metropolitan services is detailed in Table D3. Keeping therate of return at its 1989-90 level (1.7 per cent), the annual savings from the smaller capital stockamount to around $390 million.
Table D.3: Distribution of estimated declines in the replacement value of assets, 1989-90
Asset Decline in assetreplacement cost replacement cost$ million per cent
Metropolitan water 24 097 21Metropolitan sewerage 20 512 23Non-metropolitan water 18 669 14Non-metropolitan sewerage 8 864 23Irrigation 9 772 8Total 81 914 18
Source: AWRC information.
The information provided by the AWRC also identifed cost savings from improved staffingpractices and improvements in the areas of administration and maintenance. These were estimatedto be around 10 per cent, amounting to $182 million in 1989-90.
The total estimated savings from improved asset replacement and improved staffing, administrationand maintenance would be around $570 million annually. Keeping operating revenue at its 1989-90 level, the average rate of return on assets used in the provision of water and sewerage serviceswould rise to close to 3 per cent.

ECONOMY-WIDEGAINS FROMPRODUCTIVITYIMPROVEMENTS
D.299
D.2 The ORANI model
Model details
Simulations of the economy wide impacts of these cost savings were carried out using a version ofORANI1 developed for this inquiry: ORANI-WATER. In this version of the model, five WSDsub-industries are separately identified: Metropolitan water, Metropolitan sewerage, Non-metropolitan water, Non-metropolitan sewerage and Irrigation.
The economic environment
The effects of reform, as estimated by the model, can depend heavily on the chosen economicenvironment. In the analyses conducted for this report, the behaviour of households, firms andgovernment represents a response over the long run. The main features of this long runenvironment are as follows.
• investment and fixed capital
The capital stock for industries other than those in the WSD sector adjusts through investmentand inter-industry capital flows to maintain base period after-tax rates of return.
Aggregate real investment is in fixed proportion to the aggregate stock of capital. To achievethis, the economy-wide average rate of return on capital varies in response to changes in thecomposition of the capital stock.
• labour market
Changes in aggregate demand for labour are reflected in adjustments to real wages. Aggregatelabour supply responds to changes in real disposable income. The unemployment rate is heldfixed.
• public sector
The public sector borrowing requirement is held fixed in real terms. Changes in aggregategovernment revenue and expenditure are reflected in across-the board changes in the rates oftax on labour (household) and non-labour (corporate) incomes.
1 ORANI is a large multisectoral model of the Australian economy. It captures the interdependencies
between industries that arise from the purchase of each others outputs of goods and services; competitionfor available resources, such as labour and capital; and other constraints that operate generally (eg thebalance of trade). In short, the ORANI model provides considerable detail on individual industries withinan economy-wide framework.

WATER RESOURCES& WASTE WATERDISPOSAL
D.300
D.3 The simulations
The productivity improvements simulated arise from the cost savings estimated from informationsupplied by the AWRC. The improvements associated with lower asset replacement costs wererepresented as delivering the same level of service with a smaller capital stock than at present - ie’doing the same with less’. Savings of 10 per cent on operating, maintenance and administrationcosts industry-wide, were modelled as a reduction in the water and sewerage industry’s labourrequirements.
In the simulations it was assumed that water and sewerage charges remain unchanged. Instead thecost savings are assumed to increase the capacity of water agencies to pay a return on governmentequity. As, by assumption, the public sector borrowing requirement remains unchanged, increasedpayments by the water authorities lead to reductions in general tax rates. An alternativeinterpretation of this tax reduction is that consumers pay lower fixed charges for water andsewerage services.
The simulated effects of more cost-effective service provision by the authorities will depend to alarge extent on the cost structure of the industry and on who benefits from the tax savings madepossible by lower water and sewerage costs. In 1989-90, metropolitan water and sewerage eachaccounted for around 30 per cent of total industry costs, while non-metropolitan water, non-metropolitan sewerage and irrigation represented 22, 12 and 4 per cent of total costs, respectively.
The results are summarised in Table D.4. Improved productivity in the water and sewerageindustries is estimated to permanently increase GDP by 0.21 per cent. This gain would have beenworth around $800 million in 1990-91. Around one third of the rise in GDP ($270 million) is dueto productivity gains arising from improved staffing practices. The remaining two thirds of theGDP increase ($530 million) is due to reduced asset replacement costs.
Table D.4: Estimated long-run effects of improved productivity(per cent changes)
Improved Improvedasset staffingreplacement practices Total
GDP 0.14 0.07 0.21Real consumption 0.21 0.12 0.33Real investment 0.23 0.05 0.28Consumer price index 0.02 0.00 0.02Import volumes 0.16 0.07 0.23Export volumes - 0.06 0.01 - 0.05
Balance of tradea
- 0.04 - 0.01 - 0.05Pre-tax nominal wage 0.11 0.06 0.17General tax rates - 0.94 - 0.57 1.51
a Expressed as a percentage of base period GDP.Source: Commission estimates using ORANI-WATER.

ECONOMY-WIDEGAINS FROMPRODUCTIVITYIMPROVEMENTS
D.301
The main contribution to the 0.21 per cent rise in GDP comes from the metropolitan water andsewerage industries, contributing 0.07 and 0.08 per cent, respectively. Together these account forover two-thirds of the estimated economy-wide gains. The importance of the contribution made bymetropolitan water and sewerage reflects the large share of total assets employed in this part of theindustry and the greater scope for cost savings.
Lower cost structures made possible by the productivity gains enhance the ability of WSDauthorities to pay a return on government equity. As the public sector borrowing requirement isheld fixed, this allows a reduction in tax rates of 1.5 per cent. Reductions in tax rates forhouseholds lead to higher disposable incomes, which in turn lead to a 0.33 per cent increase in realconsumption. Lower company tax rates contribute to the simulated 0.28 per cent increase in realinvestment.
The consumption and investment led growth in domestic demand is estimated to result in a 0.23 percent increase in imports and a 0.15 per cent increase in real wages. The CPI would remain virtuallyunchanged. The real wage rise leads to a decline in the international competitiveness of exportingindustries. Exports are simulated to contract slightly (0.05 per cent). The balance of trade alsodeteriorates slightly.
As noted earlier, it will take from 25 to 45 years before all the savings arising from improved non-storage dam asset replacement could be realised. In the case of storage dam assets, the savingscould not be realised for around 80 years on average. Accordingly, the economy-wide gainsassociated with reduced asset replacement costs will not be realised until well into the 21st century.Moreover, the AWRC said that the water industry is currently going through a period of relativelylow replacement investment. Asset replacement investment is not expected to return to its long-runnorm until about 2010. This suggests that only a fraction of the gains from reduced assetreplacement costs are potentially realisable in the next twenty years. Given this, the principalsource of cost savings over the next decade would come from reductions in operations,maintenance and administration expenditure.
WATER RESOURCES& WASTE WATERDISPOSAL
E.302
APPENDIX E: RURAL WATER ARRANGEMENTS
AND ISSUES: STATE SUMMARIES
This appendix provides summaries for each State of the institutional arrangements for the provisionof rural water and drainage services, recent developments and participants’ views on a range ofrural water issues.
E.1 New South Wales
The overall management of water resources in New South Wales is the responsibility of theDepartment of Water Resources (DWR). The Department also provides water to about 75 000customers who include irrigators in Irrigation Areas and Districts, private irrigators (riverpumpers), stock and domestic users, country towns and industries. However, in country towns ofNew South Wales, prime responsibility for provision of services rests with local governmentcouncils.
Irrigation contributes about 25 per cent of the value of agricultural production in New South Wales.Apart from public irrigation schemes there are a number of private schemes, principally in theMurray and Macquarie Valleys. The major crops irrigated are oilseeds, cotton, rice, vegetables andother horticulture, together with pastures.
Water allocation
All but one of the major rivers flowing west from the Great Dividing Range are controlled by atleast one large dam -- some have two or three storages. The DWR said that additional dams couldyield only a small increment in water supply at a high economic cost and, in most cases, withsubstantial social and environmental consequences.
There is an embargo on new licences to use water on most regulated streams in New South Wales.However, in the Lachlan, Murrumbidgee and Murray River systems, in particular, it has been along standing practice of the DWR to increase allocations from the river progressively throughoutthe season to redistribute under-use by some irrigators. The DWR said:
In some cases, the present embargoes and low levels of use combine to provide an extremely high, and perhapseconomically unjustifiable, security of supply to current entitlement holders. In these cases, the embargo couldbe lifted and auction/tender used to allocate some of the existing resource.
For ‘normal’ security entitlements (see below), security was said to be close to 80 per cent for theMurray and Murrumbidgee Valleys, but less than 50 per cent for the most northern valleys.Irrigators expressed concern that the level of security could decline as a result of further allocationsof water.

RURAL WATERARRANGEMENTSAND ISSUES
E.303
The NSW Irrigators’ Council referred to the additional flexibility provided by the arrangement inthat State whereby irrigators can overdraw or use part of the following year’s entitlement in thecurrent year.
Tradeable water entitlements
The temporary transfer of water entitlements has been permitted since 1983. Permanent transferarrangements have been available for private diverters since 1989. Permanent transfers are allowedat individually negotiated prices. The DWR imposes a transfer fee and approves a transfer only ifthere are no significant third party effects and supply channel capacity and the environment are notsignificantly affected. Provisions for permanent transfer in public irrigation systems are expectedshortly.
The DWR said that irrigators are becoming more familiar with the concept of permanent transfersand the recession may encourage more users to sell entitlement or portions of entitlements.Intensive use of the transfer arrangements have been confined to specific areas. Even so, some714 000 ML of entitlement had been transferred by 30 June 1990. A peak of 342 000 ML wastransferred in the drought year of 1987-88. The arrangements are estimated to have increased thevalue of irrigation output in New South Wales by $42.5 million. The DWR attributed the unevenincidence of transfers to the perception of irrigators that by purchasing water entitlements, they willjeopardise their chances of being allocated additional water at the end of the season at no cost.
The DWR is giving consideration to transfer arrangements which might apply to unregulatedstreams, groundwater and off-allocation entitlements -- as well as inter-valley/basin transfers ofsurface water.
Asset refurbishment
Rural water supply infrastructure under the control of the DWR has a current replacement value ofaround $4 billion. Much of this has been poorly maintained. The Murray-Darling BasinCommission pointed out that the cost of rehabilitating irrigation infrastructure in the New SouthWales component of the Basin alone would be of the order of $220 million over the next 15 years.
Investment in irrigation infrastructure is largely confined to asset refurbishment, upgrades to meetdam safety standards and outlays on the State’s salinity and drainage program. The DWR said thatwhere infrastructure upgrading will directly benefit users, partial user funding is now sought. Forexample, irrigators serviced by the Dumaresq-Macintyre system on the Queensland border haveaccepted a fourfold increase in water prices as part of an agreement with the New South WalesGovernment to enlarge Pindari Dam at a capital cost of $80 million. Irrigators will contribute some$37 million by way of higher charges over a period of 17 years.

WATER RESOURCES& WASTE WATERDISPOSAL
E.304
The New South Wales Government and irrigators in the Irrigation Areas and Districts agreed in1989 to a joint funding proposal to accelerate asset rehabilitation over the subsequent five years.Water charges now include an asset rehabilitation levy of $0.55 per ML. The $1.5 million raisedfrom irrigators will be matched by additional government funds for asset refurbishment and appliedin accordance with a program developed in consultation with water users. The refurbishmentfunded in this way is additional to the normal level of government grant funding (some $9 million)that goes into refurbishment. The DWR also requires local communities to contribute to works insupport of the Salinity and Drainage Strategy of the Murray-Darling Basin Ministerial Council.
Much of the discussion at the public hearings in Sydney, Moama and Shepparton concernedquestions of refurbishment: who should pay; what should be the pace of refurbishment; what partswarrant refurbishment; is the community justified in making the investment when there is littleprospect of a real rate of return?
The NSW Irrigators’ Council argued that:
... since the assets of most systems are now at an advanced age, irrigators’ contributions will not raise sufficientfunds to fully provide for the surge in replacement costs expected over several years. The substantialdepreciation funds which should have accumulated over the past life of the assets to meet this need do not exist.The Government’s five year plan cannot make good that deficiency. Irrigators are already contributing at the fairrate, the rate that covers depreciation indefinitely if starting afresh. It would be unjust for them to be expected tocontribute at a greater rate to make up for the non-contribution of the irrigators of past decades.
Any decision to refurbish the system should ideally have regard to changes yet to come -- not theleast of which might be higher prices for water including provision for depreciation, a return onfunds invested in refurbishment and payments for water supplied through the Snowy MountainsScheme. It is these considerations, amongst others, that will influence the future demand for water,and hence the value of refurbishment.
The approach of the DWR is to move quickly to corporatise/privatise the water boards. It isintended that all irrigation infrastructure will be removed progressively from direct governmentcontrol and DWR management. The DWR will then become the bulk supplier of water to thesupply take-off point for each Irrigation Area or District. The DWR put forward the view thatwithin five years all of the Irrigation Areas will have been privatised, corporatised or encouraged tooperate in some commercial mode.
Privatisation of the Jemalong-Wyldes Plains Irrigation District and the Coleambally Irrigation Areawas not achieved by the target date of 1 July 1992. Broadly held doubts about the pace ofprivatisation were summarised by the Ricegrowers’ Association of Australia:

RURAL WATERARRANGEMENTSAND ISSUES
E.305
While it is the current N.S.W. Government’s intention to corporatise or privatise all public irrigation schemes inthe next five years, the reality is this may not happen because irrigators and Government may not be able toresolve hand-over terms or a change in Government could see privatisation removed from the agenda.
Landholder interest in privatisation is related to the age and condition of the water supply anddrainage infrastructure. Many argue that governments will need to refurbish some assets to anacceptable standard or provide other incentives for groups of irrigators to take over the system. Onthe other hand, while government funding of rehabilitation continues, privatisation will not be anattractive option for irrigators in areas requiring major rehabilitation.
To the extent that privatisation is achieved, the community’s commitment to replace assets in futurewill not be open-ended as it now is. And decisions on refurbishment are more likely to have regardto commercial outcomes.
A number of irrigation schemes already operate commercially in New South Wales as privatelyowned co-operatives. One of these, the Narromine-Trangie scheme in the Macquarie Valley is saidto have provided a model for the Jemalong-Wyldes Plains proposal.
Water charging and pricing
Successive governments in New South Wales have regarded the capital costs of storages as ‘sunk’costs and have not attempted to recover this capital in any form. The DWR said that there isgeneral recognition of the need to recover operation and maintenance costs of storages and rivers.However, at present the cost of maintaining dams is totally met by government ‘in recognition ofthe fact that major storages are ‘national’ works from which public benefits are derived’. The samepolicy does not apply to metropolitan storages.
For rural users of water, charges are linked to the government’s ‘running the rivers’ policy. Underthis policy, 70 per cent of the total cost of delivering water from dams to the point where it isdiverted from the river, on a State-wide average basis, is to be recovered from irrigators, towns andindustry. The New South Wales Government meets the remaining 30ÿper cent of costs, again inrecognition of the public benefits.
The DWR said that the current pricing policy should not be seen as a final position, rather that it:
... is evolving and represents only the current status in long term negotiation and development between theDepartment, the Government and users. The policy will continue to be refined through the 1990s to take betteraccount of costs, including possibly the operation and maintenance costs of storages.
WATER RESOURCES& WASTE WATERDISPOSAL
E.306
The DWR said that there is full cost recovery from river pumpers. Diversions are metered for thepurpose of billing. For water distributed within Irrigation Areas and Districts, the policy is also toachieve full cost recovery. However, water charges at present fall well short of this level.
As a one-off subsidy, the New South Wales Government wrote off ‘sunk’ capital in storages in theearly 1980s.
And, in relation to water distribution infrastructure in the Irrigation Areas and Districts, assetsexisting at 1 July 1984 are regarded as fully depreciated. This means that an adjustment is made toasset values for calculating depreciation. The amount of the adjustment is a government subsidy tooperating expenses.
Irrigators in the Irrigation Areas and Districts have recently been required to contribute, throughlevies and charges, to alleviation of waterlogging and salinity problems. However, water chargeshave not generally had a component to cover environmental damage. The New South WalesGovernment said that reforms in the water sector are leading in a direction whereby theenvironmental effects of water use will be reflected in the prices paid by polluters ‘and in anintegrated pollution control regime based on market and regulatory mechanisms’.
There is no provision in water charges for a financial return on public funds invested in irrigation.During the public hearings in Sydney, the DWR said that, headworks aside, the target is to breakeven on expenditure with no component for interest. The real rate of return estimates compiled forthe Australian Water Resources Council showed an average of -3.5 per cent for gravity irrigation,and -3.8 for pumped irrigation in 1988-89. However, given the water policies adopted since then,the real rate of return would have increased.
The failure to include in water charges the maintenance costs of storages could present difficultiesshould the Snowy Mountains Hydro-Electricity Authority be corporatised. The Authorityexpressed the view that downstream water users should pay for water released from its storages. Ifagreed, any such charge would have to be imposed by the relevant water authorities.
As pointed out by the DWR, there is scope to open up pricing policy so that specific componentsare more visible -- whether or not governments then chose to apply a full user pays approach:
... the prices we charge for water for industry should reflect that full cost -- the dam and all the headworks shouldbe in the business equation and should reflect that cost to industry and other major commercial users. Ifgovernment wishes to subsidise ... the irrigation industry, that is a matter for government policy. But I think thatit is important that we show the full business equation in how we operate and everyone can then see just wherethe costs of the operation go.
RURAL WATERARRANGEMENTSAND ISSUES
E.307
The DWR, in common with rural water authorities elsewhere in Australia, expressed concern thatrapid increases in water charges have the potential to cause social upheaval in rural communities.The DWR also acknowledged the need for better definition of the costs of its own operations andmore efficient delivery of its services.
One indicator of irrigators’ capacity to pay is the going price for water transfers. For example,prices for permanent transfers in the Murrumbidgee region have ranged from nominal to $400 perML. Using a 10 per cent discount rate, this latter figure gives an equivalent annualised price of upto $40 per ML.
In the Irrigation Areas and Districts, the pricing of water is now a function of irrigationmanagement boards. The boards are required to operate in a commercial manner. According to theDWR, this means that prices should cover operation and maintenance costs and a contribution tothe replacement of assets. However, the management boards have discretion to determine the leveland structure of charges. Agreements currently in place and being negotiated provide forincreasing water charges to generate funds for investment in drainage schemes.
The charging structure within the Areas and Districts is complex. The traditional chargingstructure has been a decreasing block tariff. The Lower Murray-Darling Management Board hasadopted an increasing two-tier structure (ie a higher charge per ML for water use above 12ÿML perhectare). The Murray and Lachlan Management Boards have retained the two-tier decreasingblock structure, but within the Murray Irrigation Area and Districts a two-part tariff is beingimplemented with a $2 per ML access charge and a flat usage charge. The overall price in thelatter case is now $9-$10 per ML plus the asset levy of 93 cents per ML.
The devolution of pricing decisions to the management boards has not avoided disputation inregard to the apportionment of costs, particularly where there are several categories of irrigatorssuch as horticulturalists and rice growers within the one scheme.
Within the Murrumbidgee Irrigation Areas and Districts there are high security irrigation users(horticulturalists), normal security users (large area irrigators) and miscellaneous users (townsupplies, stock and domestic, and large residential holdings). Operation and maintenance costs arenow apportioned between the various groups of users. To raise the required amount from large areausers (ricegrowers), the Irrigation Management Board applies a price matrix whereby charges perML vary according to large area water deliveries. The matrix for 1991-92 is:
Usage 750000ML 800000ML 850000ML
Areas $10.15 per ML$9.50 per ML$8.95 per ML
Districts $ 6.35 per ML$5.95 per ML$5.60 per ML
In describing the matrix, the Ricegrowers' Association of Australia said:

WATER RESOURCES& WASTE WATERDISPOSAL
E.308
In a year like 1991-92 when the D.W.R. announced resource availability at 120 per cent of allocation, if aricegrower in an Irrigation Area used 120 per cent of his allocation (and few did because of the strictenvironmental controls on ricegrowing) he would pay $8.95 for every megalitre used...
The [Irrigation Management Board] is currently investigating further changes to the matrix principle whereby anirrigator using more than his farm allocation would pay a higher price than that in the matrix for the additionalmegalitres. The price for the additional megalitres would be the average price inclusive of the fixed, up-frontcharges.
Since 1989, a number of changes have been made to reduce cross subsidies in the provision ofwater:
• regional delivery service charges now apply to river pumpers;
• there are now significant differences in charges for water according to the level of security.Two levels of security are specified. `High security' users are assured of receiving their fullentitlement, except in periods of drought. Remaining water is then distributed to holders of`normal security' entitlements;
• some cross subsidies have been avoided within the Irrigation Areas and Districts. TheMurrumbidgee Management Board, for example, has increased its charges for small farms(horticulture) to offset the high level of service that was previously partly cross subsidised bycharges on large area farms;
• towns which were previously entitled to draw water from regulated rivers without charge nowpay a delivery service charge at the `high security' rate; and
• towns drawing from the channel supply system in the Irrigation Areas and Districts previouslypaid the same water distribution charges as irrigators. They now pay a delivery service chargeat the `high security' rate as well as the asset rehabilitation levy.
Corporatisation/privatisation
The New South Wales Government proposes to separate the regulatory and advisory functions ofthe DWR. This will involve separating storage and river operations from resource management. Itwill also involve separating Irrigation Area and District management from government. As a firststep, irrigation management boards have been established for the four main groupings of IrrigationAreas and Districts. The members are irrigators. The Minister may delegate specific powers ofdecision, but at this stage, the Boards' responsibilities are to advise over the full range ofmanagement issues.
The DWR said that options being considered for storage and river operations in the medium terminclude:
• commercialisation, but no structural change;
• separation of the resource management and operational functions, and corporatisation of theoperational function; and

RURAL WATERARRANGEMENTSAND ISSUES
E.309
• privatisation of the operational function.
The DWR argued that:
In the short term, there is a strong case for having all river regulation, including operation of all storages whichaffect flows to a significant degree, controlled directly by the resource manager.
The task of separating the regulator and operator functions of the DWR has been carried a stepfurther with the recent establishment of the Environment Protection Authority in New South Wales.The NSW Irrigators' Council expressed support for the decentralisation/regionalisation which hasalready occurred and said that economies were appearing in costs, particularly overheads. TheDWR is encouraging the irrigation management boards to move in the direction ofcorporatisation/privatisation. As noted above, the Jemalong-Wyldes Plains Irrigation Districts andColeambally Irrigation Area are expected to be the first to privatise. The New South WalesGovernment said that the structures under which separation will occur are to be developed as partof a review of privatisation of Irrigation Areas and Districts. The options being considered includefull privatisation, corporatisation, and creation of public subsidiary companies which remain ingovernment ownership. There will remain a degree of Ministerial involvement in the pricing ofwater supplied to the management boards by the DWR. The DWR will retain control of headworksand the run-of-the-river `at least until the operating environment is more conducive to furtherseparation'.
Managing the environment
Environmental protection in New South Wales was discussed by the Ministry for the Environmentin terms of the trade-offs needed between conflicting industries -- as where one form of agriculturevies against another. For example, water used in the production of cotton can wash into rivers andaffect export beef cattle operations downstream. Another trade-off highlighted was betweenproductive sectors and sewage treatment. Some 250 local councils in New South Wales outside themajor urban areas dispose of their sewage to the aquatic environment. The Ministry for theEnvironment argued that the current New South Wales regulatory approach has worked well forpoint sources of pollution. Nevertheless:
There is a pressing need to reduce the nutrient level of the effluent from many of the sewage treatment plants inNew South Wales.
The Ministry for the Environment pointed out that the regulatory approach has inadequatelycontrolled diffuse sources of pollution. Diffuse pollution was also highlighted by the DWR:
Diffuse source pollution remains probably the most significant cause of water quality degradation in NSW andthe most difficult to address. Land-use policies have yet to deal with this issue effectively.
WATER RESOURCES& WASTE WATERDISPOSAL
E.310
The DWR said that water authorities have the task of managing water resources but do not havecontrol over land-use planning decisions.
Agricultural land planning and management historically has been dominated by advisory activities which haveconcentrated on farm-level production and on-site erosion. Implications to broader catchment processes, such asthe water cycle and the movement of pollutants etc, have yet to be addressed adequately.
Both the Ministry for the Environment and the DWR placed emphasis upon institutional reforms indealing with resource degradation.
The issue is really about the adequacy of existing management objectives and mechanisms -- wherever they maylie -- to protect the full range of natural resources and ecological and catchment processes, and whether policyand management across administrative boundaries can be more effectively coordinated to deal with the full rangeof resource issues.
The DWR pointed to improvements needed in agricultural production to reduce the application andexport of nutrients from cropped areas and to contain and recycle tailwater. However, itemphasised the need for action to protect or restore the capabilities of the natural system, forexample:
• the buffer and filtering functions of healthy riparian strips along watercourses and wetlands;
• the presence and health of wetlands as natural stores and nutrient cycles; and
• the maintenance and restoration of natural drainage networks and associated vegetation belts.
NSW Agriculture argued that although salinity has been the focus of media attention, the financiallosses due to waterlogging are often more significant. The Department stressed the extent to whichenvironmental problems can be traced back to inefficiencies in the provision and use of water. Itargued that:
The primary reason for the land degradation problems in the irrigated regions is the excessive use of waterbeyond plant requirements, which leads to accessions to groundwater, rising watertables and the resultantproblems of salinity and waterlogging.
Not only have water pricing policies encouraged high consumption rates but allocation policies, such as providingas high a reliability of supply as possible, have also contributed to the environmental problems by not reflectingthe true scarcity of the water resource.
The argument that underpricing of water has contributed to over-irrigation, rising water tables andattendant salinity and environmental problems was discounted by irrigators. The NSW Irrigators’Council said:
Irrigators absolutely reject this proposition. When all costs including their pumping costs, their labour costs forirrigating and their on-farm irrigation investment are taken into account, obtaining water for irrigation is far fromcheap. For this very reason irrigators certainly do not ignore opportunities to become more efficient in theirirrigating and reduce their costs.

RURAL WATERARRANGEMENTSAND ISSUES
E.311
NSW Agriculture recommended a number of ways to improve the allocation of water resources(marginal cost pricing, transferable water entitlements, optimal supply reliabilities). TheDepartment argued that with the reforms in place, water would be used in its most efficient uses,and some environmental problems would be alleviated. However, it said that on their own thereforms would not lead to socially optimal water management by irrigators because of:
... the existence of external effects, in particular rising watertables, waterlogging and salinity. This results in thesituation where the objective of society and the objective of the individual farmer do not coincide. In general,irrigation farmers will ignore the off-site costs in making their own decisions since they do not bear them andthey are not held responsible for or accountable for them.
NSW Agriculture saw the solution partly in terms of community involvement in catchmentmanagement and the development of regional action plans. Total Catchment Management (TCM)was described as a means of broadening the perspective of all natural resource users.
The Ministry for the Environment and the DWR also highlighted the contribution which TCM canmake to improved water quality.
The Catchment Management Act (1989) establishes a State Catchment Management CoordinatingCommittee and provides for the establishment of regional or local catchment committees or trusts.The committees have advisory and coordinating roles while the trusts -- there are two at present --have operational and rating powers.
Catchment management is discussed further in Chapter 10, while details of the TCM arrangementsin New South Wales are given in Appendix B.
E.2 Victoria
The Rural Water Corporation (RWC), a recently corporatised (see below) government businessenterprise, is responsible for the provision of water and related services to rural Victoria. TheRWC is accountable to the Minister for Water Resources. Along with the Melbourne WaterCorporation, non-metropolitan water and sewerage authorities and river management authorities,the RWC is required to submit business plans to the Minister for Water Resources.
In the Wimmera and Mallee regions, the rural water system (stock and domestic) provides water onan annual basis for filling farm dams. However, the bulk of water supplied through the rural watersystem is for public and private irrigation schemes. Private irrigation accounts for 7 per cent of thearea under irrigation. Most private irrigation is of single farm units, but there are somecooperatives (principally along the lower River Murray) which involve common distribution worksto individual farms.

WATER RESOURCES& WASTE WATERDISPOSAL
E.312
About 25 per cent of the value of irrigated production in Australia comes from Victoria. Orchard,vineyard and other horticultural crops, along with irrigated pasture, account for the bulk ofproduction. About 85 per cent of water for irrigation is applied to pastures for dairying and thefattening of cattle and sheep. Irrigated agriculture contributed $755 million (at the farm gate) to thenorthern Victorian economy in 1989-90. Milk production was the largest component, contributingsome 37 per cent, followed by horticulture 25 per cent and meat cattle 18 per cent.
Water allocation
Irrigators in Victoria enjoy a high security of water entitlement. The traditional approach has beento allocate water on a pro rata or formula basis. However, commencing in the mid-1980s, waterthat became available on the Loddon, King and Goulburn Rivers was put to auction. Thecompletion of the Dartmouth Dam was one source of new entitlements. The additional waterbrought prices between $150 and $775 per ML. The Victorian Government referred to theimportance of auctions in changing perceptions amongst rural water users:
The debates and discussions before and since the auctions have brought home the message that water users willhave to pay the full costs, including all environmental costs ... (No. 49, p4)
At an auction of new entitlements held in Gippsland in March 1991, all 6000 ML of water weresold at a price of $160 to $200 per ML.
Tradeable water entitlements
Water for irrigation purposes is not scarce in Victoria and hence the incentives to transfer water arelimited.
The temporary transfer of water entitlements was introduced in Victoria in the 1987-88 irrigationseason. Temporary transfers were available for three gravity supplied irrigation districts(Goulburn-Murray, Campaspe and Macalister), private diversion licences throughout the State, andfor irrigation under annual permits in the Horsham area. Other features included:
• prohibition on transfers in the five River Murray pumped districts engaged in horticulturebecause their water allocations were based on plant requirements;
• transfers negotiated between individuals;
• a minimum of 30 per cent of water right to be retained on any holding (this requirement waslater removed);
• transfers subject to approval by the RWC to ensure that supply, capacity, drainage, and salinitycriteria were met; and

RURAL WATERARRANGEMENTSAND ISSUES
E.313
• the consent of both the owner and any lessee or share farmer was required before water couldbe transferred from a property.
The new Water Act provides for both temporary and permanent transferability of waterentitlements. Permanent transfers will be permitted between owners of holdings within andbetween prescribed irrigation districts, or to the RWC. A similar, although separate, provisionallows for permanent transfer by private diverters. No provision has yet been made forintersectoral transfers of water. Permanent transfers are expected to commence shortly.
The new Act also allows for rights to water to be specified in capacity sharing terms. TheVictorian Government has begun the task of analysing different management arrangements on thesupply side and is investigating the effects of water trading and pricing. A programming model canconvert existing water entitlements into a system of `capacity sharing'.
Corporatisation
Major changes to the structure of the RWC were introduced on 1 July 1992. The aim is tounbundle and regionalise the Corporation's activities so as to enhance the role of customers indecision making and facilitate adoption of modern business practices including contracting and/orfranchising all or part of service delivery.
The restructuring involves the creation of five Regional Management Boards (RMBs) responsiblefor all aspects of service delivery in their regions and a small central corporation to providestrategic direction. The RMBs are expected to be operational on 1 September 1992.
At the draft report hearing, the VFF said that a central corporation should be a transitional measureonly. The VFF argued that the Victorian Government's approach does not meet its concept ofindependent regional organisations:
It is critical to the success of the reforms that Regional Organizations have full autonomy in relation to decisionson levels of service, pricing, borrowing and expenditures. A structure in which regions have managementauthority, so long as their decisions are consistent with the policies of a strong Central Corporation, is notregionalisation at all.
The VFF proposed full devolution to the regions through the formation of autonomous andindependent regional water corporations. These corporations would have the power to delegate orcontract out operational, maintenance, renewal or construction functions. Further, the VFF saidthat:
The regions would have the responsibility to set their own level of service and structure of tariffs and pricing.Regions which wished to pursue common tariff policies, with a strong egalitarian slant, could do so. Otherregions which were happy to have the underlying costs of water reflected in the delivery price could also chooseto do so. (No. 23, p.8)

WATER RESOURCES& WASTE WATERDISPOSAL
E.314
According to the VFF, its proposal could reduce the cost of providing rural water and associatedservices by around 40 per cent or $60 million per annum, and would result in additional savings of$10-15 million over and above the model enacted. These savings, it said, would be achievedmainly by greater clarity of purpose, extensive contracting out and better work practices -- thelatter being enhanced under the VFF proposal by the creation of ‘greenfield’ organisations.
Asset refurbishment/privatisation
There is a major maintenance backlog in Victoria’s irrigation systems. The RWC said thatcurrently it is investing at least 30 per cent less than that required to keep all assets up to currentservice levels or past service levels. The RWC’s business plan specifies an increase in capitalinvestment from $22 million per year in 1989-90 to $63 million by 1994-95. The Murray-DarlingBasin Commission provided information that the cost of rehabilitating irrigation infrastructure inthe Victorian component of the Basin could be $300 million over the next 15 years.
Because much of the irrigation in Victoria has been encouraged by the public provision ofsubsidised water, the value to the community of refurbishing the system is not clear cut. Given thata more commercial approach is now to apply, it is possible that some parts of the system do notwarrant refurbishment. A user-pays approach, together with transferable water entitlementsimplies a reduction in the demand for irrigation water, with consequent implications for theamount, location and type of infrastructure required.
Questions of asset refurbishment go beyond irrigation channels and structures. Decisions whichhave the effect of carrying forward the existing irrigation systems must also have regard to thecontingent requirement for additional drainage and salinity control measures. The Commissionunderstands that in the Goulburn Valley, for example, at least 40 per cent of the area is not drained.If parts of the system were privatised, decisions to refurbish the existing assets would have regardto the likely outcomes under more commercial pricing arrangements. However, privatisation is noton the agenda.
Under legislation setting up the new RWC, ownership of all water supply assets remains vestedwith the central corporation, although it can delegate responsibility for distribution assets to theRMBs. Thus, the assets will be owned and controlled by a public authority. There is no strategyfor privatisation of the distribution system, but this need not rule out the formation of irrigator co-operatives. The RMBs are to have the task of assessing service levels in relation to cost. To date,no part of the existing system has been discontinued, but at the cost recovery levels currentlysought (zero rate of return), parts of the system do not appear to be viable. With decision makingat the local level, systems might be retained as is, or discontinued, or irrigators might be preparedto pay for improved services and improved assets.

RURAL WATERARRANGEMENTSAND ISSUES
E.315
The RWC said that the future of irrigators needs to be linked to community planning in relation tosalinity mitigation, rural adjustment and land tenure arrangements generally.
... it is not tenable to continue to irrigate some soils that are basically unsuitable for irrigation and where thepeople really can’t make a business out of irrigation anyway.
It seems to the Commission that the Victorian Government has begun a potentially open-ended taskof asset refurbishment. Such an outcome is not avoided by the VFF’s proposal that reforms involvefull devolution to regional water corporations accountable to water users and the State Government.The proposal called for debt write-off and a significant injection of public funds for maintenanceand refurbishment of assets. Responsibility for maintaining assets would rest with the regionalwater corporations, but the assets would remain the property of the State.
Water charging and pricing
Charges for irrigation water comprise:
• a fixed annual charge per ML of water allocated and registered as a water right attached to ablock of land, and
• a charge per ML for water used above the water right.
The arrangements provide an allocation of water in return for a fixed fee, regardless of whether thatamount is required by irrigators. Consequently, there is no incentive to reduce water consumptionbelow the water right. The VFF pointed out some of the effects of the present arrangements:
Fruit growers have a particular problem with the current block tariff structure because it reduces the incentive forthe installation of micro-irrigation systems. The Northern Victoria Fruitgrowers’ Association argue the conversionof old orchards from flood to micro-irrigation systems has been slow as a consequence.
The Victorian Government said that:
... the Tragowel Plains, Campaspe and Shepparton Region draft Salinity Management Plans have all pointed outthat the present irrigation tariff structures encourage irrigation inefficiency or ‘over-watering’. Additionalpressure on drainage systems and groundwater levels result when volumes greater than plant requirements areapplied. (No. 49, p.25)
The Australian Conservation Foundation argued that the subsidisation of irrigation water hasinhibited the development of higher rainfall agricultural land as well as on-farm irrigation schemes.
Notwithstanding a $350 million write off of RWC debt in 1985, the charges for irrigation water fallwell short of full cost recovery. The Victorian Government pointed out that, in 1989-90, RWCcustomers met only 43 per cent of the full costs of irrigation, stock and domestic water supplies:

WATER RESOURCES& WASTE WATERDISPOSAL
E.316
The RWC scarcely covers its direct cost of operations, let alone any contribution to replace worn out andobsolescent capital works. RWC costs do not include superannuation benefits to RWC employees or the cost ofoverdraft facilities.
The Victorian Government disagreed with the approach in New South Wales whereby irrigators areonly required to meet 70 per cent of the costs of ‘running the rivers’. It said that full cost recoveryshould be pursued:
Any instances of Government services being performed should be individually agreed to and the cost provided byGovernment in line with an agreed service contract.
There is no mechanism at present to bring to account the costs of the Department of Conservationand Environment in managing streams in the rural areas of Victoria.
Real rate of return estimates compiled for the Australian Water Resources Council show an averageof -1.2 per cent for gravity irrigation, and -1.6 per cent for pumped irrigation in 1988-89.
The Victorian Government has announced pricing reforms to be phased in from this year. Theseare expected to involve two-part tariffs: a fixed component covering overheads and access costs,and a volumetric component.
The Victorian Government said that it is determined that the two largest bodies in the water sector(Melbourne Water Corporation and the RWC) should strive to achieve specified target rates ofreturn. It went on to argue that the rate of return should be dictated by the market and that:
... the appropriate target rate of return at present should be greater than 5 per cent. The water sector is competingfor funds which would commonly earn 8 per cent elsewhere and so it is reasonable for the equity holders in thewater sector to expect a commensurate return, having regard to the level of risk and often long-term nature ofinvestment in the water industry.
Against this background, the RWC has been set the target of achieving a zero real rate of returnover a 14 year period. In the absence of productivity gains, real charges for irrigation will have toincrease.
The VFF questioned the validity of the real rate of return approach:
If the government is entitled to a return on equity then it should be related to the current market value of theassets, not the written down current replacement value. Given the asserted high levels of subsidy necessary tokeep the system operating, and the poor state of repair of the major assets indicated by the RWC’s own hugeestimates of required refurbishment expenditures, it is debatable whether the assets have a significant marketvalue at all. (No. 23, p. xviii)
These are issues discussed in Part I of this report.

RURAL WATERARRANGEMENTSAND ISSUES
E.317
Use of rural adjustment funds
In Victoria, rural adjustment funds are administered by the Rural Finance Corporation.
Under Part A of the Rural Adjustment Scheme (RAS), assistance is provided in the form of interestsubsidies, loans or grants to farmers assessed as having prospects of long-term profitability, butwho are experiencing short term financial difficulty. Payments to Victorian irrigators under Part A,in 1991-92, amounted to nearly $8 million, which was 36 per cent of the total available funds.
Part B of the RAS involves funds for carry-on purposes for farmers assessed as having prospectsfor long-term profitability, but experiencing a short-term downturn through economic and/orclimatic factors beyond their control. There has recently been no assistance provided to irrigators inVictoria under Part B.
Part C provides assistance to farmers who have been assessed as being without prospects of areturn to profitable operation. Payments to irrigators in Victoria in 1991-92 under Part C amountedto $2.6 million or 25 per cent of the total available.
Rural adjustment funds paid to Victorian irrigators in recent years are shown in Table E.1.
Table E.1: Rural Adjustment Scheme funds paid to Victorian irrigators
RAS categorya
Year Irrigators Assistance
Part A (no.) ($’000)
Loansb for farm 1989-90 86 4 300
build-up, better 1990-91 90 5 900irrigation systems etc 1991-92 117 6 900
Subsidies for interestrelief on existing 1989-90 78 449borrowings, debt 1990-91 154 1 227reconstruction 1991-92 163 1 081
Part C
Aggregate household 1989-90 na 272support 1990-91 na 1 270
1991-92 na 1 600
Farmers who left 1989-90 4 107
the industryc
1990-91 24 6201991-92 35 1 000
a No assistance was provided under Part B.b The Rural Finance Corporation issues three or four times as much in commercial loans.c The maximum a farmer can receive is $30 000. All farmers who received assistance had less than $30 000 in assets. Most of thosewho left the industry were dairy farmers.Source: Rural Finance Corporation

WATER RESOURCES& WASTE WATERDISPOSAL
E.318
Managing the environment
Environmental problems attributable to rising water tables and consequential salinity areparticularly acute across northern Victoria. The VFF said that 34 per cent of land in the Sheppartonregion is salt affected and that this is forecast to increase to 62 per cent by the year 2040. TheKerang area is more severely affected. The VFF concluded that:
Salinity problems will increasingly require farmers to face the prospect of changes to existing farm managementpractices and, in the extreme, cessation of irrigation farming altogether. Overall, salinity and other environmentalpressures, combined with economic pressures, point to significant structural adjustment within irrigated areas ofthe State. (No. 23, p.88)
There is growing pressure for the diversion of some irrigation water resources to urban andindustrial uses, and for environmental flows. There are also constraints on any augmentation ofsupplies. The Victorian Land Conservation Council has identified a number of ‘wilderness’ areasand ‘heritage’ rivers including the Mitta-Mitta, Owens, Big, Mitchell, Wonangatta and SnowyRivers. The Council has recommended that any new water diversions on these rivers not impairtheir environmental and heritage values.
Participants expressed considerable support for reforms which will allow the competing demandsfor water to be brought within a market framework. The VFF said that it strongly recommendsmarket solutions to meeting competing demands for water rather than political intervention. TheVictorian Government argued that the proper approach is to raise the shadow prices to reflect thegrowing relative and absolute scarcity of environmental amenity.
The Government supported the Commission’s draft recommendation that the States shouldformalise water entitlements for environmental purposes, and that any additional water for theenvironment should be purchased.
The Australian Conservation Council (ACC) argued that the management of land and naturalresources in Victoria is in need of review, and suggested that Victoria might look to new legislationalong the lines of the New Zealand Natural Resources Act.
Whilst on the one hand we are faced with the imperative to address the very serious (and worsening) problems ofwater management in Victoria, we are obstructed by a confusing mass of legislation and an equally confusingdiversity of state, local and quasi government authorities. Problems in land use and natural resource managementare by no means confined to water.
The Department of Conservation and Environment is responsible for streamside management inVictoria. However, the care and maintenance of some of Victoria’s major rivers and creeks is inthe hands of 24 River Management Authorities (RMAs) -- statutory bodies operating under theWater Act, 1989 and managed by Boards and volunteer community members. They undertakeerosion control, stream revegetation and fencing work, community education, research andplanning.

RURAL WATERARRANGEMENTSAND ISSUES
E.319
The RMAs have been working towards the care of streams across whole catchments. This hasbrought increasing involvement in the work of Landcare and other land conservation groups. SomeRMAs are members of Catchment Co-ordinating Groups that encourage all land and watermanagers and the various interest groups in their catchments to work together. The Association ofVictorian River Management Authorities argued that a strong River Management Authority may bea prime requirement for integrated catchment management (ICM), as well as support from a centralpolicy body. ICM initiatives in Victoria are detailed in Appendix B.
E.3 Queensland
The Water Resources Commission of Queensland (QWRC) provides water for urban, rural andindustrial purposes (see Table E.2). Through the QWRC, the Queensland Government owns andoperates eight Irrigation Areas, 17 Irrigation Projects, and three Water Supply Schemes. TheBurdekin River Irrigation Area project is examined in detail in section R4 of Part II of this report.
Table E.2: QWRC rural water supply, 1989-90
Type of supply Consumers Outlets Allocation
(no.) (no.) (ML)Rural irrigation- channel system 1 954 3 744 503 088- private diversion 2 326 3 503 433 922- groundwater 1 062 1 477 208 554- waterharvesting - - -
Rural urban- towns or shires 51 83 69 747- individual consumers 220 220 -
Rural industrial- mining 16 18 33 128- power 5 6 16 683- other 14 32 3 587
Stock and domestic 305 305 981
Hydro-electricity 1 1 44 530
Total 5 984 9 429 1 314 220
Source: Queensland Government submission
WATER RESOURCES& WASTE WATERDISPOSAL
E.320
Irrigation Areas are typified by delivery of water to the farm boundary by a pipeline or channel;either by gravity from the main storage, by pumping from regulating and reregulating weirs, or acombination of both.
Irrigation Projects are typified by the maintenance of regulated supply in a stream from whichwater is diverted to farms by private works.
Water Supply Schemes involve pipelines from regulated streams and other works from whichwater is delivered to several classes of user; predominantly major industry and power generation.
All three types of scheme are multi-purpose. Irrigation Areas and Projects also supply urban andindustrial demands, and Water Supply Schemes meet some rural stock and domestic requirements.
Some schemes have reached full development, but irrigation activity is expanding as schemescurrently under construction are completed. Most existing schemes have uncommitted land andwater resources available for further irrigation.
There are 41 water and drainage boards of various types constituted under the Water Resources Act1989 which is administered by QWRC. In addition, there are four water boards that are notstatutory bodies and 51 bore water boards administered wholly by the QWRC.
The water and drainage boards are essentially cooperative private group schemes operating undervarying degrees of supervision by the QWRC. They comprise a government representative and asmall number of landholders. Board operations are funded by charges on landholders. Waterboards also receive government subsidies to the value of 25 per cent of the capital costs ofdomestic and stock-watering works. The subsidy does not apply to irrigation works. Drainageboards receive a 10 per cent subsidy on capital works.
Of the 18 water boards, five provide private water for irrigation purposes from surface watersupplies or supplement groundwater supplies by artificial recharge. Included in this category arethe North and South Burdekin Water Boards which were set up to artificially recharge thegroundwater supplies of the Burdekin River delta from surface water supplies. The remaining 13provide water for stock and domestic purposes (as do the four non-statutory boards).
The six bore water boards (one inactive) were set up to provide water for stock and domesticpurposes. They each serve from three to six properties.
The 21 drainage boards are intended to provide improved local drainage. All but one are situatedin the wet tropical regions and drain from four to 85 farms.
Several participants referred to the scope for improved productivity (notably for sugar) throughdrainage of non-irrigated land in the wet tropics. The Northern District Sugar Industry Productivity

RURAL WATERARRANGEMENTSAND ISSUES
E.321
Group favoured an integrated catchment management approach to harness community support fordrainage and flood mitigation works. The Group sought funding for catchment management worksin the wet tropics equivalent to the funding for drainage and flood mitigation typically associatedwith public irrigation projects.
In 1989-90, there were about 70 000 operative licences and permits to take water. About 8000were waterworks licences within Irrigation Areas and Projects. The remainder were largelylicences to draw from unregulated streams and groundwater and permits for domestic and stockpurposes. Irrigation areas make up less than 30 per cent of the area of crop under irrigation.
In addition to State Government funding, Queensland’s major public irrigation schemes have beendeveloped with capital grants from the Commonwealth. Projects for which payments have beenmade to Queensland under the Federal Water Resources Assistance Program include theBundaberg and Eton irrigation schemes and the Burdekin Dam. In the eight years commencing1984-85, Queensland received 42 per cent of grants made under that program.
Water allocation
In the past, water allocations were formally tied to the irrigated land. They could not be soldseparately and could be used only on the land to which they were attached. Allocations weregranted without charge, other than in Irrigation Areas where land was sold after development bythe QWRC.
Since April 1990 the policy has been to sell all new and increased allocations from existing andnew works under construction and from all new schemes at the planning stage. Sales have been byauction, public tender or at a price set by the Minister to reflect the market-place value of newallocations. Where holdings in new irrigation areas (such as the Burdekin scheme) are being sold,the allocations may be included as part of the total land package.
Traditionally, water supplies in Queensland have been allocated on a high security basis andallocations are generally in line with or greater than normal annual use. The QueenslandGovernment said:
As schemes become increasingly fully committed, the WRC is moving on a case by case basis (after extensiveconsultation with existing clients/users) from the previously very safe/conservative allocation policy to a moreflexible policy with respect to risk.
Within any one QWRC scheme, a uniform reliability applies to all irrigators apart from those withlicences to ‘harvest’ water or divert ‘out of allocation’ flows. With the exception of the lowercharge for water harvesting, the QWRC has had no explicit policy to provide water at differentlevels of reliability for irrigation purposes, nor of charging different prices based on reliability.Higher charges and higher reliabilities have applied for some urban and other non-irrigationsupplies although the link between price and reliability has not always been explicit.

WATER RESOURCES& WASTE WATERDISPOSAL
E.322
There are now moves to provide for different levels of risk and reliability.
There are various arrangements for the carryover of water. Arrangements range from the carryoverof current year’s allocation for a period up to two months, to the carryover of an allocationequivalent to the extent of air space in an applicant’s farm storage at the end of a water year.Carryover entitlements are set aside if the headworks storage fills.
The Queensland Government said that advance draws have been introduced in some irrigationschemes:
Essentially, water that is drawn as an advance on the next water year’s entitlement is charged at the basic rate anddebited against the next year’s announced allocation entitlement. The debit is zeroed if the headworks storagefills.
Tradeable water entitlements
Transferable water entitlements were not an issue in Queensland until recently because waterresources were generally not fully committed. Transfers are now possible under the followingconditions:
i) Free grant water allocations
• temporary transfers and retransfers only;
• for 12 months at QWRC discretion based on system constraints and externalities;
• history of beneficial use necessary; and
• licensees pay the fixed charges and clients pay for all water used.
ii) Purchased water allocations
• transfer and retransfer on temporary or permanent bases by negotiation with the QWRC.
Permanent transfer directly between users is not permitted under Queensland legislation.Intersectoral transfers are determined by the QWRC.
Asset refurbishment
The written down replacement value of the irrigation component of QWRC schemes was about$2.3 billion as at June 1990.
Concern about asset refurbishment is comparatively recent. Asset replacement has been largelyfunded by special appropriation from State funds. The expenditure generally has not beenrecovered through water charges and there has been no requirement for contributions to sinkingfunds. There is now concern that infrastructure is depreciating without provision being made for

RURAL WATERARRANGEMENTSAND ISSUES
E.323
major asset refurbishment or replacement. Financial arrangements whereby asset replacementcosts can be met by water charges are under investigation as part of the QWRC’s water pricingpolicy review. In the meantime, the Government has said that refurbishment of older schemes willbe conditional upon a capital contribution from irrigators.
Water charging and pricing
In 1989-90, revenue from water, drainage and other charges in the Irrigation Areas and Projectsexceeded recurrent expenditure by $3.4 million, before providing for depreciation, debt servicing,or substantial components of head office and regional/district office overheads.
The Queensland Government said that the following principles apply to QWRC water charges:
• for water supplied by channels and pipelines to farm boundaries in Irrigation Areas the pricescharged are designed to raise revenue sufficient to cover operation, maintenance andadministration costs, plus some contribution towards asset replacement where possible;
• the charges set for water diverted by private landholders from regulated supplies are set ataround 25-50 per cent of the base rate for channel supplies in recognition of the lower costincurred by QWRC, and the higher costs incurred by the landholder;
• private diversions from unregulated streams, with a few exceptions, do not attract annualcharges. Private diversions from unregulated flows within a regulated stream attract muchlower charges in recognition of the very much lower level of reliability associated with waterharvesting; and
• water from groundwater resources attracts charges where infrastructure has been provided toinduce artificial recharge of the aquifer, or where overcommitment requires some form ofregulation.
Charges are set by water and drainage boards to fully recover their direct expenditure.
The Queensland Government pointed out that charges for irrigation water would need to increaseby over 450 per cent on average to achieve a 4 per cent real rate of return. However, such increasesare not compatible with the State Government's current commitment to limit increases to no morethan the increase in the CPI.
The inability to cover all costs in water charges (because it could render the use of waterunprofitable) casts doubt on the viability of the State's irrigation systems. This is a problemcommon to public irrigation projects throughout Australia. It is of added concern in Queenslandwhere much of the infrastructure has been constructed in the last 10 years and where the StateGovernment remains committed to regional development involving public investment in irrigation.

WATER RESOURCES& WASTE WATERDISPOSAL
E.324
Irrigators pay a minimum charge based on a fixed percentage of their nominal allocation. Thefixed percentage varies between 50 per cent and 100 per cent of nominal allocation across thevarious schemes. There is a basic minimum charge of around $340 in Irrigation Areas and less inIrrigation Projects.
For water supplied by channels and pipes to farm boundaries in Irrigation Areas, the price withinthe nominal allocation varies from $18.40 to $33 per ML. In schemes where existing supplies arefully committed or approaching full commitment, increasing block charge structures apply for useabove announced allocations. With the exception of the Mareeba-Dimbulah Irrigation Area, thereis no difference in price based on crop type.
The QWRC is developing a multi-part tariff structure with an access or allocation charge reflectingthe cost of maintaining schemes in a state of readiness to supply, and a usage component reflectingthe added costs of supplying water.
In the Mareeba-Dimbulah Irrigation Area, a three-part tariff has been piloted whereby:
• a connection tariff covers such things as the administration of the account, stream, drain andmeter maintenance and catchment land management;
• an allocation tariff covers fixed costs related to the nominal allocation of water to a property;and
• a consumption tariff covers the variable costs associated with each holding's metered water useeach year. It relates to the cost of delivering the water actually used.
Charges under the three-part tariff are designed to recover direct operation, maintenance andadministration expenditure and a small contribution to asset replacement. They do not at this stagesystematically provide for depreciation or a real rate of return.
The Queensland Government said that the extension of multi-part tariffs to other schemes willdepend on the outcome of the review of the State's overall water pricing policy. The review willalso consider the question of a return on assets and dividend arrangements that might apply toQWRC activities.
The Government argued that even under the existing system, there is generally an incentive toconserve water even though the minimum charge includes a substantial volume which is paid forwhether it is used or not. This, it said, is because:
• in many schemes (e.g. cotton growing areas and the sugar growing area of the Burdekin), annual water usewill inevitably be above the minimum volume and users are fully aware of the mounting costs of wastedwater.

RURAL WATERARRANGEMENTSAND ISSUES
E.325
• in many schemes throughout Queensland, water is repumped by irrigators e.g. through travelling irrigators.Thus, water used has a considerable added cost to the irrigator.
• drainage charges are levied to recover the costs associated with operating and maintaining the drainagesystem. In 1989-90, drainage charges of $12.50 per hectare of land served were levied in five of the eightIrrigation Areas.
As in the other States, the expansion of irrigated farming in Queensland has been influenced by thesubsidised provision of water in public irrigation schemes. The resulting pattern of farming is nowa constraint on the pace of pricing reform. Even so, the Queensland Government noted that thereare indications for many of the schemes that the capacity to pay is higher than existing charges.Prices for water entitlements recently auctioned in St George and Goondiwindi regions were $300to $600 per ML and $310 and $650 per ML respectively. These prices suggest a capacity to pay atleast $30 per ML more than current charges.
At the public hearings in Townsville, the Condamine-Balonne Water Committee, along with manyother participants, argued that water authorities should recognise the widespread beneficiaries ofwater use and not single out irrigators when considering cost recovery mechanisms.
An unusual feature of water pricing policy in Queensland is the contribution required from sugarmills. The Bundaberg Sugar Company criticised the concept of a secondary industry paying for aresource used by a related primary industry. The Company said that the mill levy is collectedregardless of whether cane growers use the water, or whether water is applied to crops other thancane.
Groundwater management
The QWRC is responsible for the management of artesian groundwater resources throughoutQueensland and sub-artesian groundwater in Declared Districts.
The Great Artesian Basin underlies about 65 per cent of Queensland. Poorly maintained boreshave meant that discharge from the Basin is extremely wasteful and diminishing. The QueenslandGovernment noted that 86 per cent of the water discharged is wasted, mainly by evaporation. Thedischarge peaked in 1914 at approximately 1600 ML per day. Currently the discharge is some 700ML per day and this is expected to decline to 590 ML per day by 2010.
Approximately 750 bores are not controlled. The Queensland Government, through the QWRC,has commenced a rehabilitation program to control these bores and encourage landholders toreticulate bore water by pipe rather than open drains. The estimated cost of the bore rehabilitationscheme is $15 million over 15 years. The funding arrangements are 40 per cent CommonwealthGovernment, 40 per cent State Government and 20 per cent landholder.

WATER RESOURCES& WASTE WATERDISPOSAL
E.326
In Declared Districts, the QWRC is responsible for the licensing of bores and the allocation ofwater entitlements. The Queensland Government said that the uncontrolled use of groundwater forirrigation has resulted in over-exploitation and/or quality deterioration in some areas.
In declared groundwater areas, allocations are volumetric but are only metered in areas of intensivegroundwater use. Where there are no capital works to augment/replace groundwater supplies,water charges are based on allocation. Where capital works have been constructed to artificiallyrecharge groundwater supplies or replace groundwater use with regulated surface water supplies,water from groundwater sources is charged for according to use.
Corporatisation/privatisation
The Queensland Government is considering its policy on the corporatisation of State Governmentbusiness enterprises. The Government said that privatisation of the QWRC is not an option.However, consideration will be given to placing the water production and water managementactivities of the QWRC on a more commercial footing. Commercial in this context is said to meanclear, consistent financial objectives, commercial accounting and management principles and anemphasis on the delivery of products and services to customers.
E.4 Western Australia
The Water Authority of Western Australia (WAWA) is responsible for the provision of water-related services and for the management of water resources throughout Western Australia. TheAuthority is accountable to the Minister for Water Resources.
The service provided by WAWA includes urban and country urban water supply, sewerage, maindrainage and irrigation. The Authority serves a population of 1.5 million in more than 300 townsand communities throughout the State, the exception being areas served by the Bunbury andBusselton Water Boards, and sewerage services provided to 17 small towns by local authorities.Metropolitan and country areas are supplied from both surface and groundwater sources.
There are financial transfers between urban and rural users of water services in Western Australia.They come about from the deficits incurred on WAWA’s country operations, which are no longerfunded from consolidated revenue. The services include reticulated water supplies in countryareas; sewerage schemes in some country areas; rural drainage; and irrigation. The financialtransfers are reflected in the estimated returns on WAWA’s assets employed on metropolitan andcountry operations (see Table E.3).

RURAL WATERARRANGEMENTSAND ISSUES
E.327
Table E.3: Estimated real rates of return for WSD services in Western Australiaa, 1989-90(per cent)
WSD services Metropolitan Country
Water 4.8 -1.0Sewerage 4.0 1.8Drainage 3.9 -1.4Irrigation na -10.4
Total 4.4 -1.5
na not applicablea Figures not strictly comparable with figures for 1988-89 reported in Chapter 2.Source: WAWA (1990).
A feature of the water sector in Western Australia is the provision of stock and domestic water,under pressure, to towns and rural properties in the South-West, Great Southern, Central andGoldfields Regions. The scheme provides a subsidised piped water supply to about 25 per cent offarmers in the cereal and sheep districts.
WAWA also operates irrigation districts at Waroona, Collie, Harvey, Preston Valley, Carnarvonand the Ord River. Irrigators have an allocation, the security of which varies from year to year withthe state of the storage. The availability of supply in the south-west of the State has increased inline with the reduced demand for irrigation supplies in recent years.
The prices charged for irrigation, stock and domestic water do not cover costs and in somesituations fall short of meeting operating and maintenance costs. The Authority is extendingreplacement cost depreciation to its country assets but full replacement cost depreciation is notexpected to be achieved for 10 to 15 years. It was achieved for metropolitan assets in 1984.
Stock and domestic water
One effect of the subsidised provision of stock and domestic water is that farmers are discouragedfrom investing in alternative sources of water.
The Western Australian Department of Agriculture estimates that the cost of on-farm supplies isonly 25 per cent of the cost of scheme water. However, in areas already serviced by the schemethere is little incentive for farmers to develop on-farm supplies, other than for paddocks remotefrom the reticulation main. Farmers in adjacent areas are also discouraged from developing on-farm supplies because of the expectation that the subsidised piped supplies may be extended. TheDepartment pointed to the further effect that access to the scheme, or the expectation that thescheme may be extended, may discourage the development of low cost community supplies and thetrade in on-farm supplies.

WATER RESOURCES& WASTE WATERDISPOSAL
E.328
There is considerable farmer interest in extending the scheme and the Commission understands thatthere are Ministerial initiatives for extensions in localised areas. The capital costs of extension arebelieved to be of the order of $300 000 per farm. The Department of Agriculture said that farmershave recently been willing to pay up to 30 per cent of costs for a piped connection that wouldsupply water at half the flow rate traditionally provided by WAWA.
The disincentive to develop on-farm supplies is reinforced insofar as farmers can truck water fromspecial sources provided in areas that are declared water deficient. It is government policy that allfarmers should have access to water within 40 kilometres of farms.
Water charging and pricing
The area under irrigation in Western Australia (24 000 hectares) represents about 1.5 per cent oftotal irrigation in Australia. Orchards, vineyards and other horticultural crops make up the bulk ofthe value of irrigated production along with dairying.
On the whole, prices charged for irrigation water do not cover operation and maintenance costs.The full cost of operation is currently only recovered in the Preston Valley, a relatively newscheme. In 1989-90, WAWA’s operating deficit on irrigation was $8.8 million. This is reflected inthe negative real rate of return on irrigation assets (see Table E.3).
A range of charging systems apply in government irrigation schemes. For example, in the Harvey,Waroona/Collie and Carnarvon regions fixed charges are based on the area of property irrigatedwith a volumetric charge applying to water used in excess of the annual allocation. In the PrestonValley, charges are based solely on the volume of water used, while in the Ord River schemecharges are entirely property based.
WAWA referred to a history of subsidisation of water for irrigation. The level of cost recovery hasbeen increasing in response to improved operating efficiency and higher charges, but in somecases:
... proposals for increased charges have been effectively resisted by farming communities on the basis of hardshipand on the basis that existing charges are already reducing total water purchases made by the irrigators.
WAWA was itself critical of the current pricing arrangements:
... the irrigation districts in the South West are using water resources that could be utilised at a greater value in thefuture to support urban and industrial development.
RURAL WATERARRANGEMENTSAND ISSUES
E.329
The Authority went on to argue that unless farms can compete while paying the full cost ofirrigation services, the community would be better off not renewing irrigation assets. However, itsaid that the pace of reform must ultimately be determined by government.
Asset refurbishment
The infrastructure for irrigation schemes has been largely, and in most cases wholly, funded bygovernment. Many of the structures are reaching or have exceeded their design life and re-investment may now be required. The problem is to determine the extent to which refurbishmentof assets is warranted, and how it might be funded.
A study by WAWA of public irrigation in the south west of the State has shown that:
• farm water use declined by about 25 per cent over the five years to 1988-89, and WAWA
revenue similarly declined;
• revenue from the scheme would have to increase by at least 90 per cent if the users were to
fully pay for maintaining the service over the next 30 years; and
• the economic justification for re-investment in the scheme is dependent on the degree and cost
of salinity mitigation strategies necessary to maintain agricultural productivity.
The Department of Agriculture said that the marginal value of irrigation water in Western Australiais around $30 per ML for dairy farms:
Consequently it would not pay to invest in expensive ways of replacing infrastructure (egwidespread replacement of supply channels to prevent seepage loss) because benefits from savingthe water would be less than costs.
Privatisation would be one way to arrive at a commercial view of the value of refurbishment.
Management of public irrigation systems
Since 1987, WAWA has operated on a regionalised basis with two regions in the Perthmetropolitan area and six regions encompassing the remainder of the State. The latter regions areresponsible for service provision to both urban and rural customers.
The Western Australian Government has announced its intention to examine the corporatisation ofgovernment trading enterprises such as WAWA. Privatisation is not on the agenda.
The potential benefits of corporatisation were seen by WAWA to be:
• a genuine arm's length relationship between government and the water authority;

WATER RESOURCES& WASTE WATERDISPOSAL
E.330
• further reform of pricing and tariffs to better align charges with the costs of service provision;
• streamlining of existing accountability and regulatory frameworks; and
• acceptance by government that all investment decisions must be consistent with the commercialobjectives of maximising value and achieving target real rates of return.
WAWA argued that there is a need for greater flexibility in the management of its humanresources. At present, WAWA is required to conform to public sector employment practices. Itsaid that this is a significant constraint on productivity gains.
With or without corporatisation, the future management of the irrigation service in the South-West,Carnarvon and Ord Irrigation Districts is under review. In reference to a South-West IrrigationStrategy Study, WAWA said:
A range of options from full privatisation of the irrigation distribution system, to maintenance of the currentregionalized service by the Water Authority are being considered. An intermediate case is also being discussed.This involves the establishment of a "management body", responsible to the current Water Authority Board butwith power to recommend levels of service, maintenance programs and pricing arrangements that ensure that thedistribution scheme is run as a financially viable business.
In support of privatisation, the Department of Agriculture said:
Even if the Carnarvon and South-West Schemes were leased to the farmers at token cost, the Water Authoritywould be better off because it would not have to meet the operating and maintenance loss and infrastructurereplacement cost.
The Department identified other advantages of privatisation. For example:
In the Carnarvon Scheme, problems such as water stealing may be better resolved by farmers acceptingresponsibility for management of the resource. It may help to impress on farmers that water is not stolen from theGovernment, but from each other.
Transferable water entitlements
The use of transferable water entitlements in irrigation districts and proclaimed groundwater areashas been under consideration by the Western Australian Water Resources Council. TheDepartment of Agriculture said that significant gains are possible by transferring water from lowvalue uses. The Department pointed to significant differences in the marginal value of water evenbetween farmers:
Greater differences are likely to be found between cattle and horticultural enterprises in the South-West, betweendifferent kinds of horticultural enterprises at Carnarvon, and between farms on different soil types in the South-West. Farmers currently watering marginally saline or poorly structured soils may have an incentive to sell orlease water to other farmers.
The Department of Agriculture considered that channel and pipe capacities could limit the use oftransferable water rights in some areas unless beneficiaries were willing to pay the cost ofincreasing that capacity. However, it said that the temporary transfer of water entitlements couldallow for a more flexible response to seasonal variations in the Carnarvon and South-WestIrrigation Schemes.
RURAL WATERARRANGEMENTSAND ISSUES
E.331
In its submission following the release of the draft report, WAWA said that the most economicoutcome for irrigation in the South-West region may be to gradually scale down the area suppliedover a 10 to 15 year period by 40 to 50 per cent. In considering the administrative structure thatmight promote such a change, WAWA said:
The establishment of a market that promoted transfer of water between farmers but particularly transfer betweensectors of the water industry is one favoured approach.
Integrated catchment management
An Office of Catchment Management (OCM) has been established as a focus for integratedcatchment management (ICM). The OCM also acts as secretariat for the Integrated CatchmentManagement Co-ordinating Group, consisting of senior officers from all State agencies involved inland and water management.
Statutory environmental limits (or firm management targets) are being set on a catchment basis --for instance for the Peel-Harvey coastal catchment where nutrient management is essential inreversing environmental degradation.
The OCM argued that corporatisation of the major agencies has contributed to the withdrawal ofresources from areas such as stream monitoring and advice to regional ICM groups:
The contraction occurring in all government agencies at present means that the amount of ground betweenagencies is increasing, the gaps are getting wider and the ability of agencies to bridge those gaps is being reduced.
Ord River Scheme
Irrigation on the first farms in the Ord River Scheme began in 1963 but the main dam was notcompleted until 1971. Some 14 000 hectares have been released in Stages 1 and 2 of the Schemewhich was initially intended to cover 72 000 hectares.
Water released from the Ord dam is raised by a diversion dam to provide gravity fed water to amajor part of the system. Horticultural farms along the river bank pump directly from LakeKununurra or the Ord River below the diversion dam. Pumps on Lake Kununurra raise water toirrigate a further section where irrigators pay more for water than do broad acre farmers elsewherein the Scheme.
There are now 102 farmers, the majority of whom produce horticultural crops. Sixty-four farmshave an area of 2-20 hectares and 38 have 65-400 hectares.

WATER RESOURCES& WASTE WATERDISPOSAL
E.332
The major crops are bananas, vegetables, hybrid seed, culinary grains, stockfeed grains, hay,mangoes and leucaena pastures for cattle fattening. The Department of Agriculture said thatirrigators are successfully responding to niche markets for horticultural crops, but field cropping isonly marginally profitable. In 1990, the gross on-farm return was about $25 million.
The Ord Development Council said that there are opportunities for major expansion of bananaproduction and cattle fattening, and for a sugar industry. A privately funded mini-mill for theproduction of sugar was purchased in 1991.
Water from the Scheme supplies two diamond mines, and the installation of a hydro-electric powerstation is planned to commence during 1992 to supply the Argyle diamond mine. The Ord Schemehas also encouraged tourism in the region.
The concerns raised by the Ord Development Council were similar to those voiced by irrigationgroups elsewhere in Australia, notably:
• the need for greater efficiency on the part of the water authority leading to lower maintenanceand operating costs (a review of the operations of WAWA is to be undertaken in 1992); and
• concern that the benefits of irrigation to the whole community should be recognised and that allbeneficiaries should contribute to cost recovery (the concept of `beneficiary pays' is discussedin Section R1 of Part II of this report).
The Ord Development Council also sought Commonwealth and State Government funding forfurther development of the Scheme, and said that WAWA has a responsibility to stimulatedevelopment in the expectation of increasing revenue from additional users of water.
Like many other irrigation systems, there is little prospect of the community recovering itsinvestment in the Ord River Scheme. The issue now is how to achieve the best outcome for thecommunity from a scheme which is unlikely to have gone ahead had there been a requirement forfull cost recovery.
From time to time, major structures or sections (perhaps valves and spillway gates) may need to bereplaced. Such refurbishments are only warranted if the expected benefits exceed the cost of thereplacement and the expenditure can be recovered in user charges. Otherwise it would be efficientto forego the expenditure and allow the system to deteriorate or be truncated.
Costs in relation to drainage, sedimentation of the dam and catchment regeneration are also part ofthe equation. The Department of Agriculture said that with the present rate of sedimentationdeposition, there will be security of supply of water for irrigation farming well beyond 100 years.However, rising groundwater and salinity problems commonly emerge after some years ofirrigation. The demise of the rice industry in the Ord Scheme may have retarded the rate of

RURAL WATERARRANGEMENTSAND ISSUES
E.333
groundwater recharge, but the Department of Agriculture said that it is likely that the supply anddrainage infrastructure is having a major effect on groundwater tables. Groundwater mounds havebeen identified and the Department referred to the possibility that remedial works will be necessaryin the medium term. Monitoring by the Mines Department, WAWA and the Department ofAgriculture all contribute to the current cost of maintaining the Scheme.
The costs of operating and maintaining the Ord Scheme (excluding the above add-ons) are of theorder of $2 million per annum of which the current users of water meet less than half. In 1990-91,total revenue was $727 000 of which $477 000 was paid by irrigators as water rates and servicecharges and the remainder by the mining industry as water sales.
WAWA has been moving to recover a higher proportion of its operating costs, and increased watercharges by 15 per cent for 1991-92. The Ord Development Council indicated some expectation onthe part of irrigators that water prices will be increased to recover costs. In keeping with therecommendations in Part I of this report, it is important that after the forthcoming review of theoperations of WAWA, every effort be made to progressively recover from users of water the fulloperating and maintenance costs of the Ord Scheme.
But what of new industries or expansions of the area under irrigation involving additionalinfrastructure?
WAWA said that it would expect such developments to be on a full cost recovery basis -- unlessthere was a government decision ‘to treat it as a community service obligation in support ofregional development’.
Having regard to the inefficiencies (in terms of both economic and environmental outcomes) whichhave followed from public investments in the name of regional development, the Commission canonly reiterate its concern that any initiatives leading to further areas of irrigation, or publicinvestment in irrigated agriculture, be on a fully commercial basis with water charged at full cost.A proposal to pipe Kimberley water to Perth is discussed in Section R5 of this report.
E.5 South Australia
In South Australia, the Engineering and Water Supply Department (EWS) has responsibility for allaspects of water resources management. It carries out all State regulatory functions for inlandwater resources; it is the major provider of water supply and urban sewerage services; and it is thelargest single operator of irrigation schemes. Some separation of these roles is under considerationand it is likely that a future Environmental Protection Agency will become responsible for licensingof discharges to water courses.
WATER RESOURCES& WASTE WATERDISPOSAL
E.334
The major water systems, being based on the River Murray, are inherently secure from drought as aresult of the regulation of such a large catchment and the need for flushing flows to be maintainedto control salinity. The main transfer and storage systems have a significant degree of sparecapacity. As downstream users of the water, South Australians are very dependent upon inter-government co-operation in management of the river under the Murray-Darling Basin Agreement.
Production from private and public irrigation schemes contributes about 20 per cent of the value ofagricultural output in South Australia. More than half of the water is applied to pasture, but thebulk of the value of production comes from orchards, vineyards and other horticultural crops.
The EWS is required to provide and maintain facilities for supplying and distributing water withinthe government irrigation areas. It is also responsible for the construction, operation andmaintenance of the schemes.
Water allocation
Any person using water from a proclaimed area in South Australia requires a licence. There arethree proclaimed water courses (the Murray and Little Para rivers and Bolivar Outfall Channel) andten proclaimed groundwater regions. More than half of the State’s irrigation water is fromgroundwater resources, most of which are proclaimed.
The Murray River is the most important single source of irrigation water. The volume of watertaken for irrigation is determined by allocations for both private irrigators and those in governmentirrigation areas. The Highland Irrigation Areas (HIA) established on this watercourse account forabout 14 per cent of total irrigation water used. Private irrigation schemes and individuals pumpingfrom the Murray use a further 24 per cent. New allocations have been severely restricted since1968.
About 68 per cent of the irrigation water pumped in the HIAs in 1991-92 was supplied under lowpressure. About 10 per cent was high pressure and 22 per cent open channel.
About two-thirds of HIA irrigators are metered and others are billed per hour of supply. The SouthAustralian Government proposes to introduce metering for all irrigators as rehabilitation of theolder irrigation areas proceeds. Each entitlement has the same security of supply, although in theNorth Adelaide Plains, differences arise due to location.
Transferable water entitlements
Transferability of water entitlements was introduced in 1983 for private diverters on the MurrayRiver; in 1984 for groundwater users in the Northern Adelaide Plains groundwater basin; and in1989 for the government irrigation areas along the Murray. Both permanent and temporarytransfers are permitted and both are used.

RURAL WATERARRANGEMENTSAND ISSUES
E.335
Between 1983-84 and 1990-91, approximately 23 000 ML of water was transferred along theMurray and about 2000 ML in the North Adelaide Plains. Transfers represented about 0.8 per centof allocations in the Murray area and 0.3 per cent in the North Adelaide Plains in 1989-90. Fromthis perspective, transfers have not been extensive. Even so, the Government argued that:
The availability of a free market transfer mechanism is an ... instrument for the government policy of encouragingstructural adjustment in the State’s agricultural sector. ... The experience to date is that a significant proportion ofthe water so far transferred has been previously unused entitlement; so called ‘sleeper’ water. That this is nowput to productive use is a gain in efficiency.
On the River Murray, two systems apply:
• Where water is drawn under licence (private) from the river, allocations are generallytransferable along the length of the river within the State, with some conditions applying toensure that there is no land degradation due to salinity or drainage.
• Within the government irrigation areas, under some conditions, water can be transferredbetween users within each government system. The limitation is on the capacity of the supplysystem to deliver water between locations. There is no transferability between governmentirrigation systems or across State borders.
The advice of Regional Water Resource Committees is sought before authorising transfers. Fewapplications have been refused. The Government referred to the need for constraints on transfers insome circumstances:
On the River Murray, transfers are not permitted where they will lead to a significant increase in river salinity orwhere they will be a nuisance to neighbouring properties. In reality every transfer, because it is likely to be usingwater which previously was not used, will aggravate the salinity problem. ...
Because there is overuse of the groundwater [in the North Adelaide Plains] each transfer is subject to a reductionin the size of the allocation. At present, transfers between irrigators are subject to a 10 per cent reduction andtransfers to industrial use are subject to a 70 per cent reduction. The difference ensures that if there is a long termtrend to industrial use, it will be at sustainable levels.
The Government indicated its support for intersectoral transfers (eg from irrigation to metropolitanuse). To date little water has been transferred from one productive use to another, but it said that:
In some cases, irrigators have sold their entire water entitlement and pursued another land based developmentsuch as subdivision for rural living or marina development.
At the draft report hearing, the South Australian Government said that the main intent of thetransfer system is to enable diversion licences along the river to change hands -- rather than thetransfer of water within and from irrigation districts. There is currently no opportunity for transferfrom government irrigation areas to private diversion or vice versa, or between irrigators indifferent government irrigation areas even though they obtain water from the same source, theRiver Murray.

WATER RESOURCES& WASTE WATERDISPOSAL
E.336
Within irrigation districts, the South Australian Government said that the emphasis was on:
... structural adjustment involving amalgamation of land holdings into larger entities that can be formed moreeconomically. Generally that has taken precedence over any consideration of movement of the water.
Water charging and pricing
A fixed charge per irrigator is applied by the EWS for irrigation water supplied in the governmentschemes. The charge is calculated by multiplying half the yearly water allowance by the prevailingprice for water in the irrigation area. Currently the charge is $47.60 per ML. A volumetric chargeapplies for water used above the allowance. It doubles and quadruples for water used above 100per cent and 120 per cent of allocation, respectively. The price penalty for excess water useensures that allocations are rarely exceeded.
The base charge is applied whether the water is used or not. This is said to encourage irrigators tosell water allocations which they are not able to use. It may also lead to overwatering. TheGovernment proposes that charges should eventually be volumetric and based on long run marginalcost.
Private irrigators are not charged for their allocation. A penalty of $800 per ML applies for waterused above the annual entitlement, but the majority of private irrigation farms are not metered.
In some cases, a small depreciation charge, based on historical asset costs, is collected fromirrigators, but in the majority of cases irrigators contribute nothing to the capital costs of serviceprovision. In South Australia, as elsewhere, water services have been provided by governments asa means of stimulating regional development. The Government said that this is no longer thepolicy, but maintaining services irrespective of their commercial prospects remains a consideration.
The South Australian Government is giving consideration to rate of return targets for its publicauthorities, including the EWS. Estimates compiled by the Australian Water Resources Councilshow that in 1988-89 the real rate of return to gravity irrigation in South Australia was -5.2 percent, and for pumped irrigation -1.3 per cent. The increase in irrigation charges which would berequired for an 8 per cent return on assets was estimated by the Government to be of the order of415 per cent. The inability to recover full costs ‘let alone a shadow price for the externalities’ wassaid to be an impediment to structural adjustment within irrigated agriculture.

RURAL WATERARRANGEMENTSAND ISSUES
E.337
Asset refurbishment
The infrastructure in public irrigation systems is old and in need of refurbishment. As in otherStates, funds have not been accumulated for refurbishment and the Government is now faced withdecisions on which schemes to refurbish in circumstances in which many irrigators presentlycontribute nothing to infrastructure costs.
The problems generated by earlier subsidised developments were described by the South AustralianGovernment as follows:
Now the development is too poor to pay at levels required to operate the existing infrastructure on a commercialbasis and too valuable socially and in terms of regional economies to abandon. The existing investment willprobably need to be treated as a sunk cost. The expected cost recovery should ideally be limited to cover aredefined level of infrastructure investment which is capable of viable performance.
The United Farmers and Stockowners of South Australia expressed similar concerns:
In a narrow, commercial sense, looking at irrigation alone, refurbishment of those systems may not be economic.However, there are ... very significant social and political objectives to be considered, as well as wider economicissues, reflecting the contribution of those areas to regional social infrastructures and economies.
There are currently nine Government HIAs along the River Murray. A program to replaceinefficient channel networks was begun in the 1960s but ceased in 1985 after five of the Areas hadbeen modernised.
The intention now is to rehabilitate the four Areas still supplied by concrete channels.Contributions from irrigators, the State Government and Commonwealth Government are proposedin the ratio 20:40:40.
The package of proposals has the agreement of a growers’ negotiating committee elected torepresent the nine Areas. As part of the package, the charges levied on growers for irrigationservices from 1991-92 are intended to cover:
• the full cost of operations, administration, minor construction, and contributions to an assetreplacement fund designed to cover all future asset replacement following the completion of theprogram; and
• the contributions of growers to the rehabilitation program.
It is further proposed that the South Australian Government assume responsibility for some $50million of debt incurred prior to the commencement of the program.
The estimated cost of the program is of the order of $39 million. The work required for thecomplete rehabilitation of the supply network of HIAs has been programmed into three separatethree year periods. The objective in the first period is the rehabilitation of the Moorook IrrigationArea and the Nookamka Division of the Cobdogla Irrigation Area. A total of $13.5 million isrequired, with a projected grower contribution of $2.7 million.
WATER RESOURCES& WASTE WATERDISPOSAL
E.338
At the time of the first round of public hearings for this inquiry, the Commonwealth Governmenthad committed $500 000. The Department of Primary Industries and Energy said it was seekingfurther analysis of regional viability, including drainage and environmental impacts:
We are in the process of reaching agreement with the South Australians whereby they will develop a strategydemonstrating that the economics, for example, of partial rehabilitation as opposed to complete rehabilitation ofthe highlands area to see whether or not the economics are better and indeed in our view partial rehabilitation isthe only thing that is economic in some areas of the highlands.
In July 1992, the Department of Primary Industries and Energy advised the Commission that theforthcoming Commonwealth Budget is expected to contain financial assistance for a three-yearpackage of works in areas which are accepted as economically viable and sustainable:
Commonwealth commitment to a second and third phase of rehabilitation will be considered in light of theperformance of the first three year program as well as the outcome of further significant investigations which willin part, identify sites considered unsuitable for rehabilitation.
The viewpoint that some parts of the system might not be rehabilitated was not apparent in theapproach described by the South Australian Government.
The South Australian Government said that refurbishment of the remaining 33 per cent of assets isto be completed during the period 1992-1999. The Government argued that full refurbishment isnecessary because:
• four of the eight districts (6 per cent by area) have been refurbished;
• all areas are required to contribute to the completion of refurbishment;
• there is a uniform water price in all districts and because refurbished areas have lower operatingcosts, the operating surplus in the refurbished areas offsets the operating deficit in theunfurbished areas; and
• it would be inequitable if unfurbished areas had to bear their full operating costs when otherareas were fortunate to be refurbished before them and could enjoy reduced operating costs.
This seems to the Commission to be a very questionable basis on which to undertake fullrefurbishment. To date no area has been excluded.
The South Australian Government said that the rate of return on public investment in the HIAsbefore rehabilitation is of the order of -1 per cent. After rehabilitation the projected rate of return is-0.5 per cent. The Government said that the motivation to spend State and Commonwealth moneyon rehabilitation is:

RURAL WATERARRANGEMENTSAND ISSUES
E.339
... to facilitate the self management of the irrigation schemes and in doing so, remove in perpetuity, operatingdeficits from this sector.
Governments have clearly placed a premium on the ability for irrigators in the future to influence their ownlivelihoods, an outcome that is best achieved through self management of current government irrigationinfrastructure. As argued previously, this is not possible without refurbishment.
To the extent that irrigation infrastructure is refurbished, current irrigators are the beneficiaries. As Governmentfunds represent eighty (80) percent of the finance for this work taxpayers, including those irrigators that pay tax,contribute the finance. There are, however, benefits from the work that accrue to the broader communityincluding any flow on of increased irrigator incomes to the local community (not included in any cost benefitanalysis to date), reduced salt degradation of the river and reduced operational deficits.
The Loxton Irrigation Area, which is owned by the Commonwealth and operated by the SouthAustralian Government, is not included in the proposal to refurbish the HIAs.
Corporatisation/privatisation
The EWS now operates ‘off budget’ and, subject to other changes, is expected to offer services on acommercial basis. The South Australian Government said that corporatisation is not accepted asnecessary for reform:
Rather government is seeking to achieve reform through vigorous commercialisation within the existingdepartmental framework. ...
Just as corporatisation is not under consideration, nor is any change in the basis for establishing conditions ofemployment, although much is being done to make the conditions themselves more flexible through awardrestructuring.
The Government said that privatisation is not a necessary precondition for the efficient operation ofpublic agencies, but that self management of irrigation schemes is favoured by the Government andirrigators.
As part of the package to rehabilitate the HIA, it has been agreed that the capital contributed bygrowers should entitle them to assume the management and ownership of government irrigationassets, should they agree to do so on an individual basis.
In recent years, irrigator elected district boards have been given increased responsibility inoperations and management decisions. The South Australian Government said that in the period1992 to 1994, boards will be restructured to achieve grower autonomy and responsibility and tocomplete the transition to full commercialisation through the adoption of business plansempowering a regional board to set service levels, budget and the price of water within governmentguidelines.
The intention is that 1998 should see full privatisation, with irrigators responsible for all operationsbeyond the point of bulk supply. The Government said that corporatisation is not an essential stepbetween regional management and self management. It is intended that a self managedorganisation will operate under a proposed Irrigation Management Act.

WATER RESOURCES& WASTE WATERDISPOSAL
E.340
Managing the environment
The South Australian Government expressed concern at the delays in bringing about the co-ordination needed for sustainable use of land and water resources. Co-ordination is presentlysupervised by a Natural Resources Management Committee comprising heads of the relevantagencies. Its expansion into a Natural Resources Council is under consideration.
An integrated catchment management approach has been adopted in the Mt Lofty Ranges and theMurray Valley. Based on the limited experience to date, the Government said that to be successfulthe process needs to be comprehensively organised and funded. For the Mt Lofty Ranges, the mainwater issue has been the load of nutrients entering water supply reservoirs. For the Murray Valley,salinity is said to be reasonably well controlled, but nutrient loads and the link between theregulated flow regime and the ecological health of the backwater and riverine plains are newlyemerging issues.
As part of the rehabilitation of the HIA, existing irrigation channels will be replaced by pipes. Thiswill eliminate channel spills and leakages and contribute to better irrigation practices -- therebylessening environmental degradation.
Apart from localised loss of artesian pressure, deterioration of water resources of the GreatArtesian Basin is said to be slow.
The South Australian Fishing Industry Council was highly critical of the continuing contaminationof waterways, and water flow management which gives little or no consideration to the impactupon fish stocks. The Council referred to a ‘tyranny of small decisions which result in the overalldegradation of the resource and its associated systems’.
A State Environment Protection Authority is to be established during 1992.
E.6 Tasmania
The Rivers and Water Supply Commission (RWSC), together with the Water Resources Divisionin the Department of Resources and Energy, is responsible for the management of water services inTasmania. The RWSC owns six dams, treatment plants, bulk mains, pumping stations andchannels, with a written-down asset value of $150 million.

RURAL WATERARRANGEMENTSAND ISSUES
E.341
The Hydro-Electric Commission (HEC) controls approximately 95 per cent of Tasmania’s waterresources for electricity generation purposes. Generally within hydro electricity water districts, allwater resources are vested in the HEC. Once the water passes through the turbines, control of theresource goes to the RWSC.
A small amount of irrigation comes under the control of local government and there are fourgovernment irrigation schemes operated and maintained by the RWSC. The TasmanianGovernment said that 5 per cent of the water used for irrigation is from subsidised governmentschemes. In 1990-91, 69 properties irrigating 2300 hectares were serviced by the public schemes.Other irrigators draw from on-farm dams or divert straight from streams. The RWSC isresponsible for issuing licences for on-farm water supplies.
Although more than half of the area irrigated is for pasture, the value of irrigated production comeslargely from horticulture. The predominant technique is spray irrigation. By mainland standards,the public irrigation schemes in Tasmania are of very recent origin. They nevertheless fall wellshort of full cost recovery.
Water allocation
Water allocation within the State Government irrigation schemes is undertaken by the RWSC onthe following basis:
• 1 ML of water for every hectare of land fit for irrigation by gravity; or
• 1 ML for every 1.5 hectares of land fit for irrigation in the whole of the holding, whichever isthe greater, with a minimum allocation of 12 ML.
Irrigation Rights are attached to the land and not to the owners. Riparian rights also exist. TheHEC is required to release water to meet riparian rights `for all reasonable requirements'.
In August each year, irrigators are invited to advise whether they wish to increase or reduce theirIrrigation Right for the coming season and their final entitlements are then determined. The ratesfor Irrigation Rights are paid at the start of each season. Irrigation Rights in Tasmania have a 95per cent reliability of supply. Additional inflow into storage headworks in any year is sold asexcess water to irrigators who request additional supplies.
Transferable water entitlements
Temporary (one year) entitlement transfers have operated for the last three years in the WinnaleahIrrigation District since a shortage of irrigation water was identified in that scheme. Allarrangements are administered by the RWSC. There have been no shortages in other State-runschemes. The Tasmanian Government said that:

WATER RESOURCES& WASTE WATERDISPOSAL
E.342
Temporary transfers allow those irrigators who wish to irrigate additional crops to do so and allow other irrigatorswho do not intend to use all of their entitlement to ‘free up’ that water and to also obtain what in effect is a raterebate. (No. 98, p23)
Water charging policies
The RWSC sets the charges for government irrigation schemes. In the South East and WinnaleahIrrigation Schemes the charge is $40 per ML for the Irrigation Right and $40 for all water taken inexcess of the Right. A pumping charge also applies to Stage 2 of the South East Scheme. In theCressy-Longford Irrigation Scheme, the charge is $15.25 per ML of Irrigation Right and $13.50 perML for all water used.
There is no charge for water which is pumped from streams by farmers. Water is released withoutcharge by the HEC. Farmers only pay a licence fee when constructing a dam on their property.
There is a provision for HEC to sell water. The Tasmanian Government said that:
Charges are made for water released to other authorities (for irrigation or industrial use, etc) where, as a result ofthe release, the HEC loses the water for its core business of electrical energy production. The charges made aredetermined to cover the current value of the water had it been utilised to produce electrical energy. (No. 98, p4)
Charges in the government irrigation schemes are intended to cover operational costs but notcapital costs. Capital investment is subsidised through borrowing concessions and StateGovernment subsidies for interest and principal repayments on borrowings. In 1990-91, $2.7million was provided by way of subsidy for the three newer irrigation schemes (the South East,Winnaleah and Meander Schemes) and $90 000 for the Cressy/Longford irrigation scheme. TheTasmanian Government said that new irrigation schemes will only be established on a full costrecovery basis.
Further, the HEC is effectively subsidising some irrigators on the Ouse, Shannon and Lake Riverswhere, in order to exploit the potential to generate power, it has entered into undertakings to supplyunlimited amounts of free water. Additional capital works have been required. The TasmanianGovernment expressed concern that the open ended commitment given by the HEC in 1964continues to be a financial burden to it and a source of embarrassment:
The HEC cannot easily extricate itself from this situation because the supply of free water to the irrigators alongthe Shannon, Ouse and Lake Rivers has come to be regarded as a legal right.
The Tasmanian Government said that to achieve a 4 per cent real rate of return the annual chargesfor water would have to increase three to five times. Referring to policies which have required theusers of water to meet only a small part of the cost, the Government said:

RURAL WATERARRANGEMENTSAND ISSUES
E.343
The consequence is that there are irrigation schemes which would not be viable without low costs of watersupplies and there are then the political problems for Governments seeking to increase charges. (No. 98, p19)
Unlike irrigation, the State-owned bulk water authorities are moving to achieve a minimum 4 percent return on assets.
Asset refurbishment
Infrastructure within public irrigation schemes in Tasmania is very young. The Governmentindicated that the need for refurbishment has been minimal, but no provisions have been made forfuture asset replacement:
... the disparity between the true cost of water and the current pricing policy will result in an inability of theseschemes to generate reserves.
The community needs to be made aware of the true cost of services and pricing policies adopted which will avoidmajor funding difficulties in the future. (No. 98, p17)
The Government said that asset valuation in Tasmania is in its infancy and that:
... the main problem is not the theoretical approach to how assets should be valued but rather the practicalproblem of determining the condition of assets. (No. 98, p20)
Corporatisation/privatisation
All water and drainage authorities (including the RWSC) under the control of the StateGovernment have been ‘commercialised’, and new legislation has been enacted which will requirecertain performance standards from the local councils supplying urban water, sewerage and bulkwater allocation. Institutional changes in the irrigation area do not appear to be on the agenda.Managing the environment
The Tasmanian Government said that the legislative and institutional framework is adequate toprovide ‘sustainable’ resource management. However, it identified the following broad areas ofneglect:
• degraded river water qualities due to excessive chemical and sediment loads and bacterial contamination.
• increasing evidence of rising water tables and dryland salinity.
• possible groundwater aquifer contamination.
• inadequate floodplain control.
• structurally, ecologically and aesthetically degraded rivers and streams.

WATER RESOURCES& WASTE WATERDISPOSAL
E.344
The Government argued that Integrated Catchment Management is not an appropriate solution toenvironmental problems given the small size of Tasmania. Rather, it considers that a planning andzoning approach:
... would ensure that decisions on water and land use were taken in an integrated manner and could also takeaccount of the necessary water quality. Such an approach would be based upon catchment management plans (ortheir equivalents) and result from a consultation process, coordinating the needs and desires of various authoritiesand the community.
REFERENCES 347
REFERENCES
ABARE (Australian Bureau of Agricultural and Resource Economics) 1991, Management ofIrrigation Water in the Murray-Darling Basin, Discussion Paper 91.6, Canberra, June.
ABS (Australian Bureau of Statistics) 1992, Australia’s Environment: Issues and Facts, ABSCatalogue No. 4140.0, Canberra.
ACTEW (ACT Electricity and Water) 1991, Annual Report 1990-91, Canberra.
Aitken, C.K., Duncan, H. and McMahon, T.A. 1991, ‘A Cross Sectional Regression Analysis ofResidential Water Demand in Melbourne, Australia’, Applied Geography, 11:157-165. ch 6 p 3
Alexandra, J. 1992, ‘Political, Social, Economic and Environmental Issues in Australian WaterManagement’, in Pigram, J. & Hooper, B. (eds), Water Allocation for the Environment,Proceedings of an International Seminar and Workshop, 27-29 November 1991, Centre forWater Policy Research, Uiversity of New England, Armidale, pp 111-121.
AWRC (Australian Water Resources Council) 1991, Interagency Performance Review, Canberra,March. Chapter 1
----- 1992a, Demand Management in Rural Water Supply, A background discussion paper preparedfor a workshop of the AWRC Planning Committee, Canberra, February. [DN: Max]
----- 1992b, Pricing Systems for Major Water Authorities in Australia, Occasional Paper FCMCNo. 2, Edition 2, Canberra, May.
Bartle, J. 1992, Manager, Vegetation and Tree Planting Advisory Service, Department ofConservation and Land Management, Perth, personal communication, January. Chapter 9
Binnie and Partners (Pty Ltd) 1988, Water for the South West in the Twenty-First Century: Waterfrom the Kimberley, Perth.
CMBA (Chase Manhattan Bank Australia Limited) 1991, Financing Options Study - Kimberleys toPerth Water Pipeline, December.
Commonwealth of Australia 1989, Our Country Our Future, Statement on the Environment, theHon. R.J.L. Hawke, A.C., Prime Minister of Australia, AGPS, Canberra, July. Appendix B p 1
----- 1990, Ecologically Sustainable Development, A Commonwealth Discussion Paper, Canberra,August. Chapter 9

348 WATER RESOURCES& WASTE WATERDISPOSAL
Crabb, Steve 1991, Water Victoria: The Next 100 Years, Minister’s Industry Statement, Melbourne,10 October. Chapter 6
Department of Finance (Commonwealth) 1988, Draft Guidelines for Asset Valuation inGovernment Business Enterprises, Canberra, July. Chapter 5
----- 1992, Benchmark discount rate to be used in cost-benefit analysis, Finance Circular No.1992/3, Ref 91/0304, Canberra. Chapter 5
Department of Resources and Energy (Commonwealth) 1983, Water 2000, AGPS, Canberra.Chapter 1
Department of the Treasury (Commonwealth) 1990, Financial Monitoring of Government BusinessEnterprises: An Economic Framework, Treasury Economic Paper No. 14, AGPS, Canberra.Chapter 5
Dixon, Peter B. and Baker, David J. 1992, Optimal Prices for Urban Water: A General EquilibriumModel Applied to Melbourne, Melbourne, February. Chapter 4 p 8
DWR (New South Wales Department of Water Resources) 1990, Annual Report 1989-90,Parramatta. CSO App
DPIE (Commonwealth Department of Primary Industries and Energy) 1989, Third NationalConservation Report, AGPS, Canberra. Chapter 7
Engineering and Water Supply Department (South Australia) 1990, Annual Report for the financialyear ending June 1990, Adelaide.App C
Gerrish, W.C. 1984, Investigation into possibility of introduction of a policy of transferability ofwater entitlements into Victoria, Paper presented at the Joint Australian Water ResourcesCouncil/Australian Agricultural Economics Society Seminar on Transferable Water Rights,Melbourne, 11 December. Chapter 6
Government of Victoria 1991, Corporatisation of Government Business Enterprises, A PolicyDiscussion Paper prepared by the Government Commercial and Trading Enterprises Committeechaired by the Hon. Theo Theophanous, M.L.C., Melbourne, December.
Graham, B. and Xavier, P. 1987, Financial targets and dividend requirements for Commonwealthgovernment business enterprises, Paper presented to the 16th Conference of Economists,Surfers Paradise, Queensland, 23-27 August. Chapter 5
Gutteridge Haskins & Davey 1992, Future Management Review: Rural Water Commission, FinalReport to the Steering Committee, 15 January.
Hahn, R.W. and Hester, G.W. 1989, ‘Marketable Permits: Lessons for Theory and Practice’,Ecology Law Quarterly, 16(2), pp 361-406. Chapter 7
Hamilton Water Board 1991, Annual Report 1991, Hamilton.

REFERENCES 349
Hobart Regional Water Board 1990, Annual Report 1989-90, Hobart.App C
Hunter Water Board 1991, Annual Report 1990-91, Newcastle. App C
IAC (Industries Assistance Commission) 1989, Government (Non-Tax) Charges, Report No. 422,AGPS, Canberra, September. CSO App
IC (Industry Commission) 1990, Measuring the Performance of Selected Government BusinessEnterprises, Canberra, August. Chapter 1
----- 1991a, Energy Generation and Distribution, Report No. 11, AGPS, Canberra, May. Chapter 1
-----1991b, Water Resources and Waste Water Disposal, Issues Paper, Canberra, July. Issues paper,chapter 1
----- 1991c, Rail Transport, Volume I: Report, AGPS, Canberra, 21 August.
-----1991d, Annual Report 1990-91, AGPS, Canberra. Chapter 7
IDC (Infrastructure Development Corporation) 1990, Development of a Water Pipeline, Kimberleyto Perth, Preliminary Feasibility and Economic Appraisal Study for the Water Authority ofWestern Australia, Perth, May.
Jones, Robert 1990, Taxation, Inflation and Investment in Tradeables, Paper presented at EPACSeminar on Inflation, Canberra, 6 December. Chapter 5
Lloyd, A.G. 1986, ‘Introduction: Agricultural Industry Perspectives’, in AWRC, Proceedings of theJoint AWRC-AAEX Seminar on Transferable Water Rights, AGPS, Canberra. [DN: Max]
London Economics 1992, International Experience of Private Provision in Water, Sewerage andDraining Services, Report to the Industry Commission, London, June.
Manoel, P. and Reynolds, H. 1989, Cost Sensitivity in Australia’s Urban Water Industry, AWRC,unpublished, November. Chapter 3
Maunsell Pty Ltd 1991, Barmah-Millewa Forests Water Management Plan, Final Report,Canberra, July. Chapter 7
Mulligan, H.K. and Pigram, J.J. 1989, Water Administration in Australia: Agenda for Change,Occasional Paper No. 4, Centre for Water Policy Research, University of New England,Armidale. App B p 2
Murray-Darling Basin Ministerial Council 1990, Natural Resources Strategy, August.
MWRR (Melbourne Water Resources Review) 1992, Water For Our Future, Interim Report, April.
Noonan, P.J. and McNee, D.K. 1990, Development Strategies for the Burdekin River IrrigationArea, Queensland Department of Primary Industries, Brisbane.

350 WATER RESOURCES& WASTE WATERDISPOSAL
Paterson, John 1991, Water Utilities and Water Resources, Paper presented at EPAC Symposiumon Resource Pricing, 15 November. Chapter 5
Pearce, David W., Markandya, Anil and Barbier, Edward B. 1989, Blueprint for a Green Economy,Earthscan, London. Chapter 7
Pearce, D.W. and Turner, R.K. 1990, Economics of Natural Resources and the Environment,Harvester Wheatsheaf, Sydney. Chapter 7
Power and Water Authority (Northern Territory) 1990, Annual Report 1989-1990, NorthernTerritory.
----- 1991, Annual Report 1990-1991, Northern Territory.
Quiggin, John 1988, ‘Murray River Salinity -- An Illustrative Model’, American Journal ofAgricultural Economics, Vol. 70, No. 3, August 1988, pp 635-645.
QWRC (Queensland Water Resources Commission) 1980, Report on the Establishment ofBurdekin River Project Undertaking, March. [DN: Deo]
Read, Sturgess and Associates 1992, Evaluation of the Economic Values of Wood and Water forthe Thomson Catchment, Report prepared for the Department of Conservation andEnvironment, and Melbourne Water, Melbourne, June.
Sly and Weigall 1992, Corporatisation and Privatisation in Australia, Second Edition, March,Melbourne. Ch 7 footnote
SWB (Sydney Water Board) 1990, 102nd Annual Report, 1989-90, Sydney. App C
----- 1991, Corporate Plan, Sydney. CSO app
Tasman Economic Research 1992, Distributional Effect of Cost Based Pricing, Report prepared forthe Industry Commission Inquiry into Water Resources and Waste Water Disposal, Melbourne,June.
Temple-Heald, S. 1991, The Importance of Asset Valuation and Implications for PerformanceMonitoring of GTEs, Research Unit Working Paper No. 1, Industry Commission, Canberra,November. Chapter 5
Victoria Parliament Legislative Council 1992, Daily Hansard, Wednesday 10 June.
Watson, B. 1990, ‘An Overview of Water Sector Issues and Initiatives in Australia’, in Pigram,John J. and Hooper Bruce P. (eds), Transferability of Water Entitlements, Proceedings of aninternational seminar and workshop, Centre for Water Policy Research, University of NewEngland, Armidale, July. Chapter 1.
WAWA (Water Authority of Western Australia) 1990, Annual Report for the year ended 30 June1990, Perth. Chapter 2
----- 1991, Annual Report for the year ended 30 June 1991, Perth. App C

REFERENCES 351
WCED (World Commission on Environment and Development) 1987, Our Common Future,Oxford University Press, Oxford. Chapter 7
WAWRC (Western Australian Water Resources Council) 1988, Water for the Twenty-FirstCentury, Volumes 1 and 2, Perth, November.
Young, M.D., Cocks, K.D. and Humphries, S.E. 1990, Australia’s Environment and its Natural
Resources: an Outlook, CSIRO, Institute of Natural Resources and Environment, Canberra.
App B p 8