Embed Size (px)
Citation preview
WATER RATES AND RATESTRUCTURES IN OKLAHOMA
October 1981
By
Terri G. Sparks, Planning Assistant
OKLAHOMA WATER RESOURCES BOARD
•
•
•
WATER RATES AND RATE STRUCTURES
IN OKLAHOMA
by
Terri G. Sparks, Planning AssistantPlanning and Development Division
October 1981
OKLAHOMA WATER RESOURCES BOARD
•
..
•
ACKNOWLEDGEMENTS
Special thanks go to Terri G. Sparks, Natural Resources Planning
Assistant, for researching the available data and compiling this report
for distribution to water suppliers in Oklahoma.
Acknowledgement is also given to Reese Daugherty, Engineering
Consultant, for compiling preliminary data utilized in this report, and
to Art Cotton, Planning Assistant, for initial research on the project.
The report was reviewed and edited by Michael R. Melton, Assistant
Director, and Rick A. Smith, Planning and Development Division Chief,
and most patiently typed and produced in final form by Kathy Mason,
Division Secretary.
James R. Barnett, Executive DirectorOKLAHOMA WATER RESOURCES BOARD
ii
WATER RATES AND RATE STRUCTURESIN OKLAHOMA
TABLE OF CONTENTS
Background and Introduction
Rate Structures in Oklahoma
2
5
Summary of Water Rates . . . . . . . . . . . . . . . . . . . . . .. 7
Alternative Rate Structures and Water Conservation . . . . . . . .. 9
Concluding Remarks . . . . . . . . . . . . . . . . . . . . . . . .. 13
Appendices
A - Cost Allocations of Water Revenues
B - Survey Summaries
15
17
C - Average Monthly Costs per Family 20
References . . . . . . . . . . . . . . . . . . . . . . . . . . . . . 23
•
WATER RATES AND RATE STRUCTURES
IN OKLAHOMA
Background and Introduction
In the earlier history of the United States, charges for water
service were flat rate charges, many times based on physical features of
the customer's premises such as number of rooms and fixtures. Though
various forms of flat rates are still utilized by communities, the
introduction of water meters made possible the development of charges
based upon the amount of water used. Subsequent water use technology
paved the way for development of charges recognizing costs in proportion
to the amount and characteristics of use.
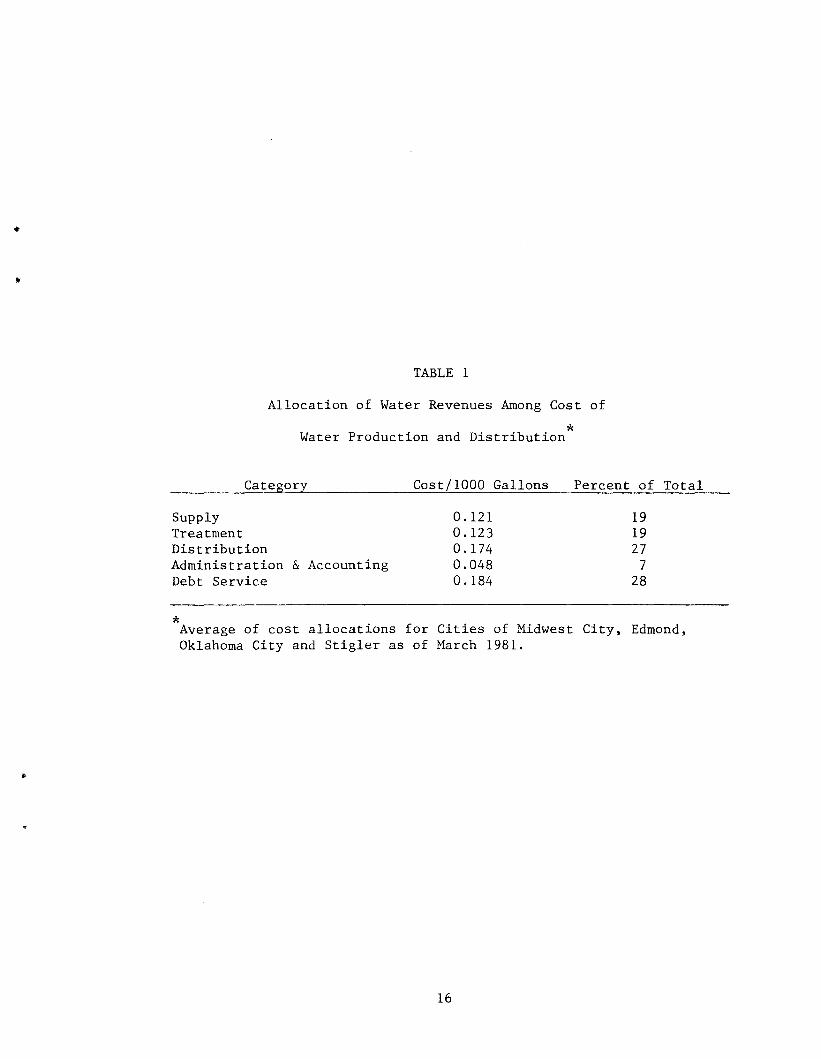
Most water utilities are solely in the business of supplying water,
with water sales being their most important source of receipts. Among
utility systems, the division of revenues from the sale of water is
allocated among water supply, treatment, distribution, administration
and accounting, and debt service (example: see Appendix A, Table 1).
Because of escalating costs, many water utilities in Oklahoma are
discovering that production and distribution costs are exceeding the
price charged for water and have turned to revising rates regularly to
obtain increased revenue.
A successful water rate structure must be carefully constructed and
analyzed and then reviewed regularly as a continuing program of any
water utility
suppliers.
a matter that is often overlooked by many water
2
Rate structures are too often copied from other cities, and as long
as gross revenues are more than expenses, nothing more is expected. A
water utility sometimes justifies a rate increase because a neighboring
•utility is charging a higher price for water. Many times a water
utility will find expenses rising faster than revenues and try to remedy
the problem by simply increasing existing rates without first examining
all factors involved, such as costs incurred versus prices charged,
costs of providing service to customers during average load periods
versus peak load periods, and benefits of continuing with the current
rate structure versus adopting an alternative rate structure.
Many of the smaller water suppliers fail to recognize that
efficient waterworks accounting and record maintenance can be invaluable
tools for reviewing rate structures. Smaller cities sometimes neglect
waterworks accounting and, consequently, know little of production
costs, leading to loss of revenues and many complaints. A record of
activities and pertinent events should be made an integral part of
accounting procedures for use in analyzing historical trends.
With the rising costs involved in supplying water to customers, the
need for water suppliers to adopt realistic rate structures and create a
regular review program should be emphasized.
The principle goals in setting water rates are to obtain sufficient
revenue to offset costs, to be equitable to all classes of users and to
discourage waste. The rate charged for water should provide an annual
return sufficient to maintain financial security for the water supplier.
Rates should distribute the burden of water costs as equitably as
possible among various classes of users -- residential, commercial and
industrial -- according to the demands they place upon the system.
3
Information necessary to design a reasonable rate structure includes
such items as: the money value of the utility; the cost of doing
•
business, including all operation, maintenance and capital charges; and
the volume of water that may be sold .
This report will furnish ideas for comparable rate schedules for
each of the Oklahoma Water Resources Board's Planning Regions.
Over recent months, Oklahoma Water Resources Board staff compiled a
survey of water rates currently utilized by many Oklahoma public water
suppliers, based on information obtained from: personal interviews
conducted with rural water officials prior to publication of the Board's
Rural Water Systems in Oklahoma (1980); applications submitted to the
Board for financial assistance; and a recent telephone survey to
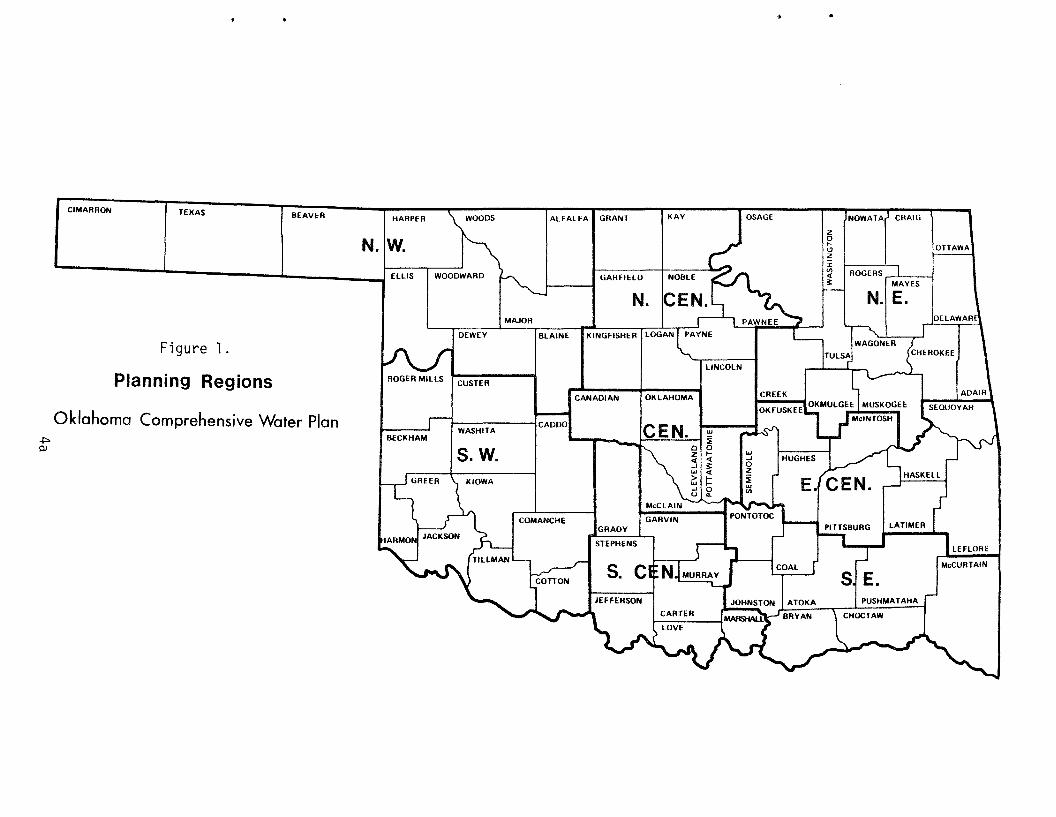
selected communities in Oklahoma. Preliminary to the development of the
Oklahoma Water Resources Board's Oklahoma Comprehensive Water Plan, the
planning guide for managing Oklahoma's water resources through the year
2040, the state was divided into eight planning regions composed of
counties naturally grouped and demonstrating similarity of climate,
hydrology, geography, economics and demography. The survey results in
this report are delineated by planning region, with each planning region
representing those counties as shown in Figure 1. It should be noted
that the results obtained were from an informal survey, based solely on
information as related to Board personnel, and therefore many communties
could very well differentiate from the information presented here.
However, the methodologies contained in the report should be applicable
to most public water supply systems.
Based on the survey of water rates and a brief analysis of rate
structures, the information provided should help to establish a
4
• •
....-------..ll ll-------1 ELLIS
Oklahoma Comprehensive Water Plan
PUSHMATAHA
CHOCTAW
SJ E.
NOWATA" CRAIGI
Z0.... I I IOTTAWAl:lZIU) IROGERS<{it IMAYES
N. E.NOBLE
KAY
GARFiElD
N.
ALFALFA I GRANTHARPER
MAJORI
DEWEY I BLAINE
ROGER MillS 'CUSTERI I ~
.CANADIAN OKLAHOMA I CREEK
BECKHAMI WASHITA ,------S. W.
~0 0Z ....<{ <{-' itw <{
a'; ~-' 0
......U 0-
McCLAIN
COMANCHEIGRAOY
-I GARVIN
STEPHENS
N.IW.
BEAVERTEXAS
Figure 1.
Planning Regions
CIMARRON
oj:::>OJ
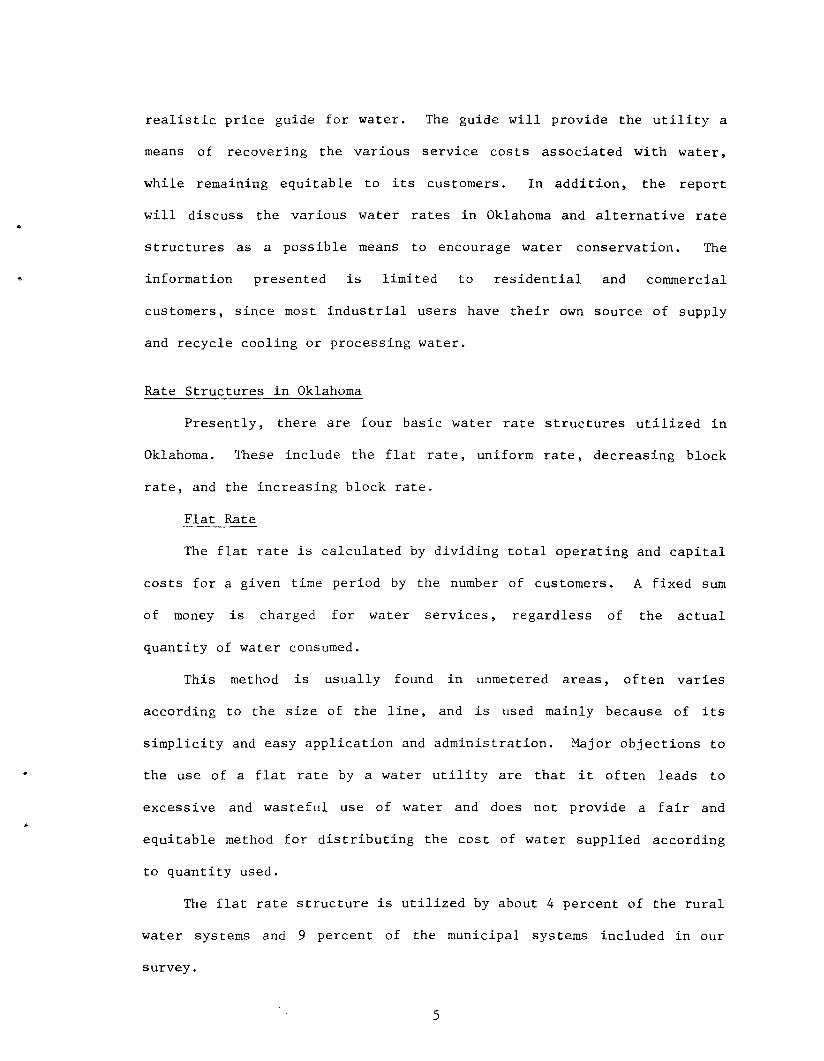
realistic price guide for water. The guide will provide the utility a
means of recovering the various service costs associated with water,
while remaining equitable to its customers. In addition, the report
will discuss the various water rates in Oklahoma and alternative rate
structures as a possible means to encourage water conservation. The
information presented is limited to residential and commercial
customers, since most industrial users have their own source of supply
and recycle cooling or processing water.
Rate Structures in Oklahoma
Presently, there are four basic water rate structures utilized in
Oklahoma. These include the flat rate, uniform rate, decreasing block
rate, and the increasing block rate.
Flat Rate
The flat rate is calculated by dividing total operating and capital
costs for a given time period by the number of customers. A fixed sum
of money is charged for water services, regardless of the actual
quantity of water consumed.
This method is usually found in unmetered areas, often varies
according to the size of the line, and is used mainly because of its
simplicity and easy application and administration. Major objections to
the use of a flat rate by a water utility are that it often leads to
excessive and wasteful use of water and does not provide a fair and
equitable method for distributing the cost of water supplied according
to quantity used.
The flat rate structure is utilized by about 4 percent of the rural
water systems and 9 percent of the municipal systems included in our
survey.
5
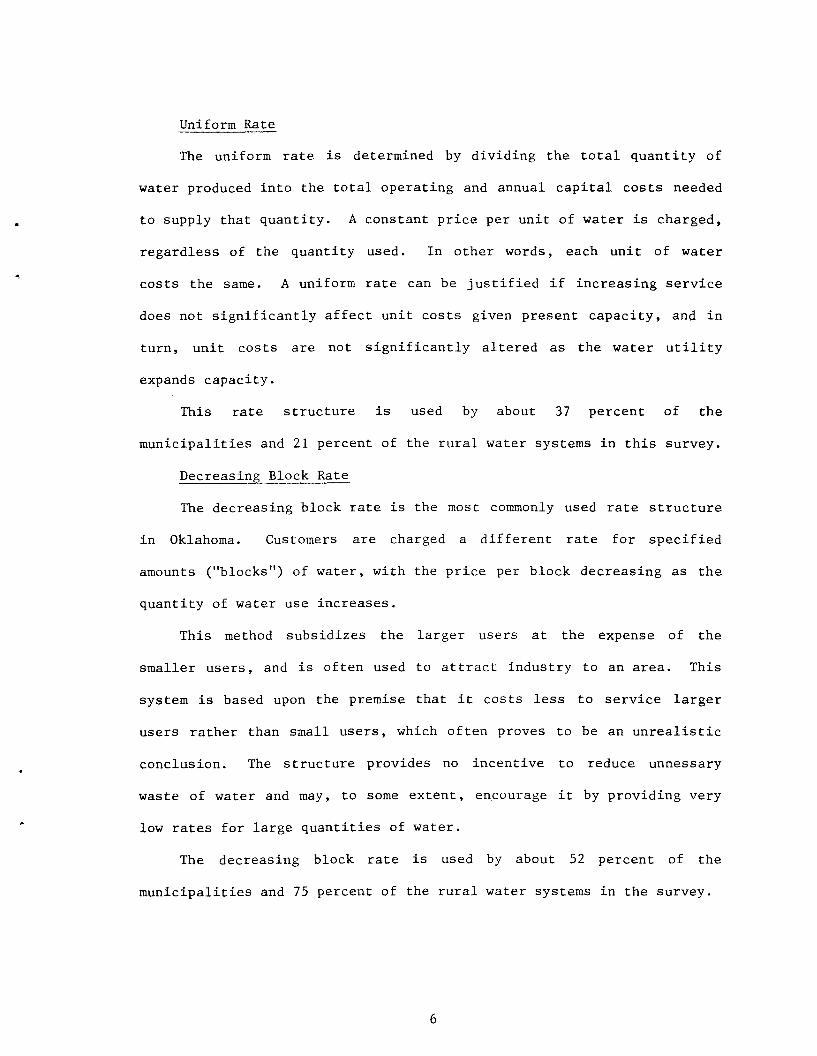
Uniform Rate
The uniform rate is determined by dividing the total quantity of
water produced into the total operating and annual capital costs needed
to supply that quantity. A constant price per unit of water is charged,
regardless of the quantity used. In other words, each unit of water
costs the same. A uniform rate can be justified if increasing service
does not significantly affect unit costs given present capacity, and in
turn, unit costs are not significantly altered as the water utility
expands capacity.
This rate structure is used by about 37 percent of the
municipalities and 21 percent of the rural water systems in this survey.
Decreasing Block Rate
The decreasing block rate is the most commonly used rate structure
in Oklahoma. Customers are charged a different rate for specified
amounts ("blocks") of water, with the price per block decreasing as the
quantity of water use increases.
This method subsidizes the larger users at the expense of the
smaller users, and is often used to attract industry to an area. This
system is based upon the premise that it costs less to service larger
users rather than small users, which often proves to be an unrealistic
conclusion. The structure provides no incentive to reduce unnessary
waste of water and may, to some extent, encourage it by providing very
low rates for large quantities of water.
The decreasing block rate is used by about 52 percent of the
municipalities and 75 percent of the rural water systems in the survey.
6
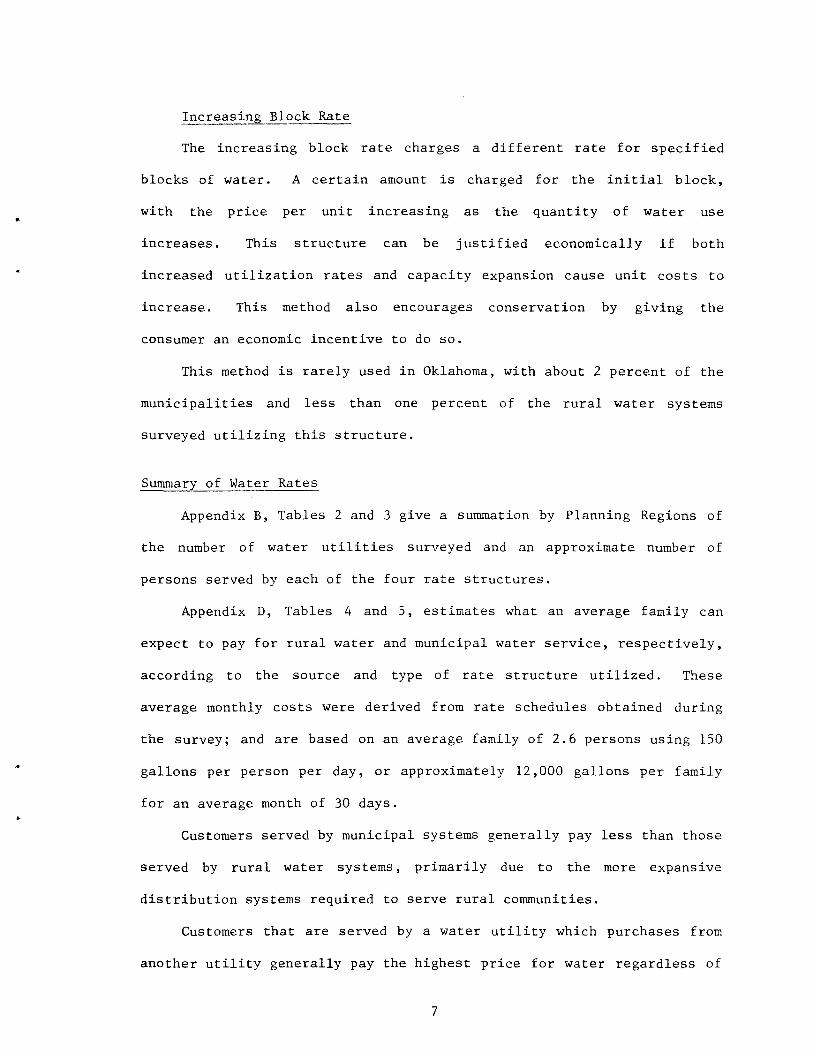
Increasing Block Rate
The increasing block rate charges a different rate for specified
blocks of water. A certain amount is charged for the initial block,
with the price per unit increasing as the quantity of water use
increases. This structure can be justified economically if both
increased utilization rates and capacity expansion cause unit costs to
increase. This method also encourages conservation by giving the
consumer an economic incentive to do so.
This method is rarely used in Oklahoma, with about 2 percent of the
municipalities and less than one percent of the rural water systems
surveyed utilizing this structure.
Summary of Water Rates
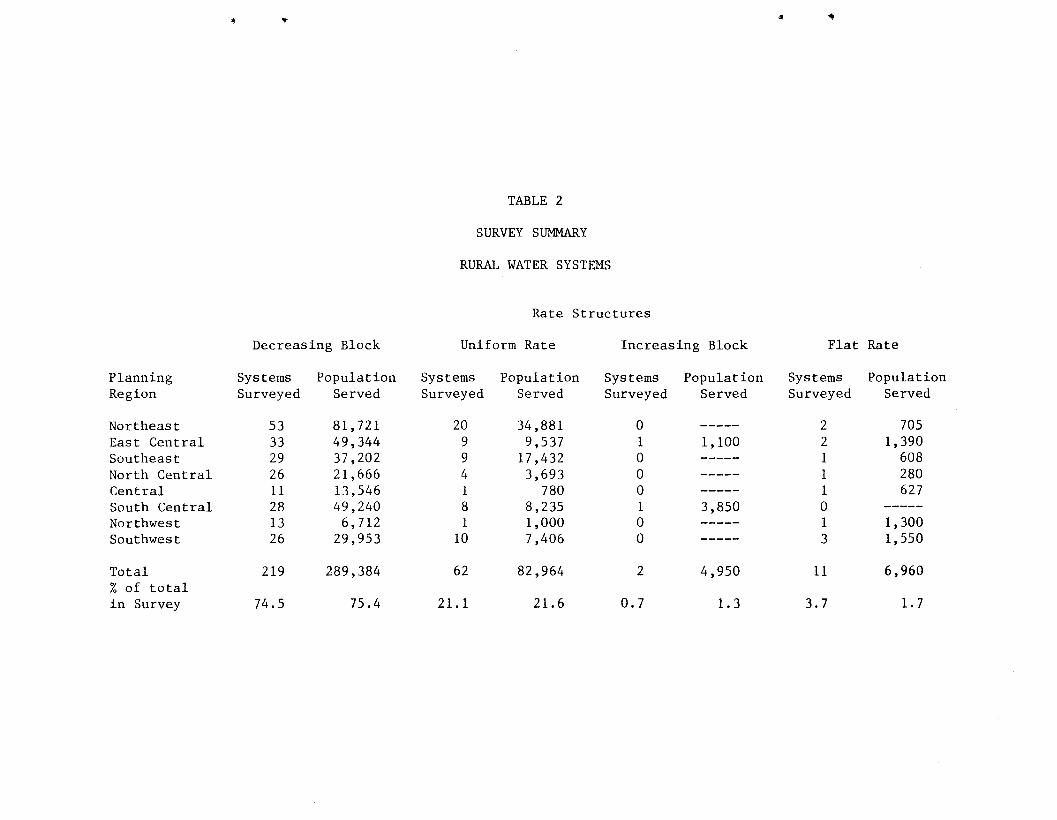
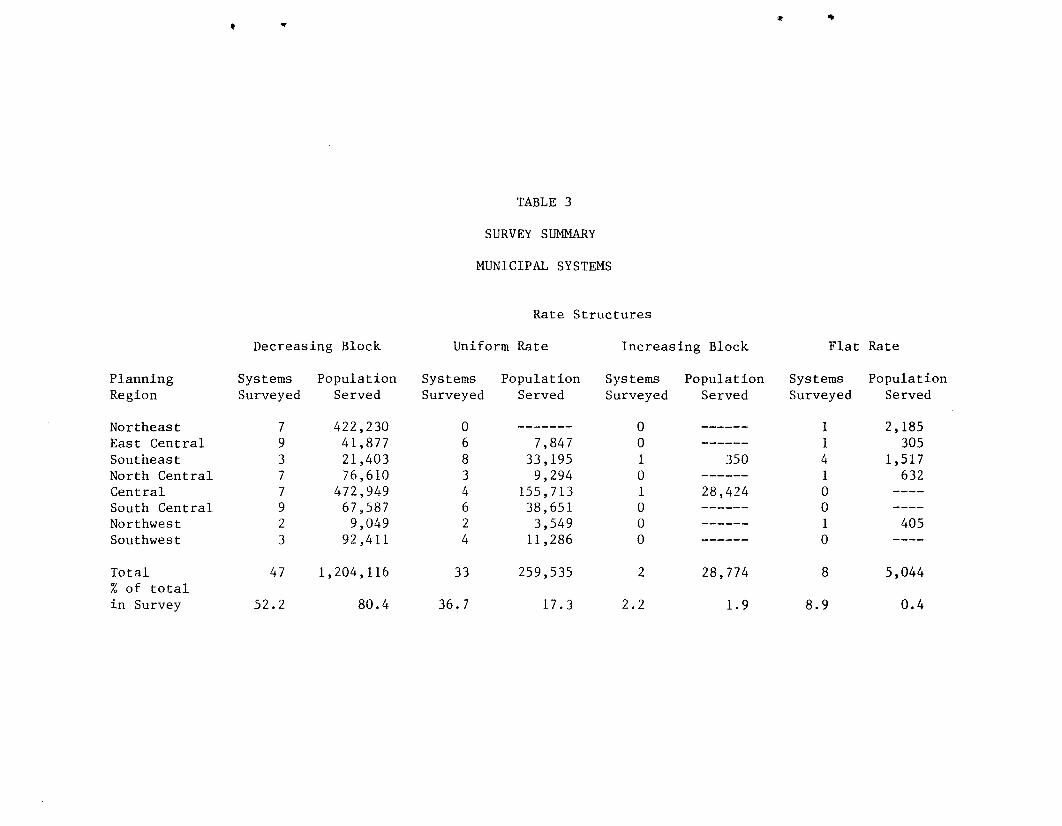
Appendix B, Tables 2 and 3 give a summation by Planning Regions of
the number of water utilities surveyed and an approximate number of
persons served by each of the four rate structures.
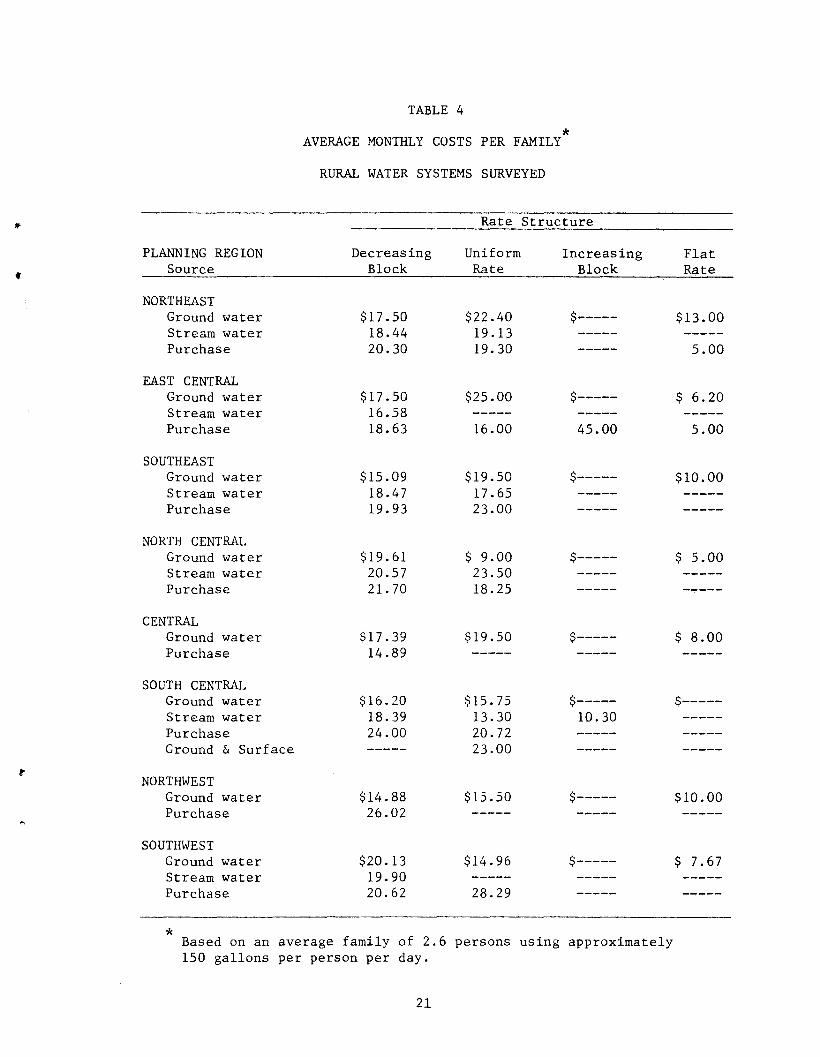
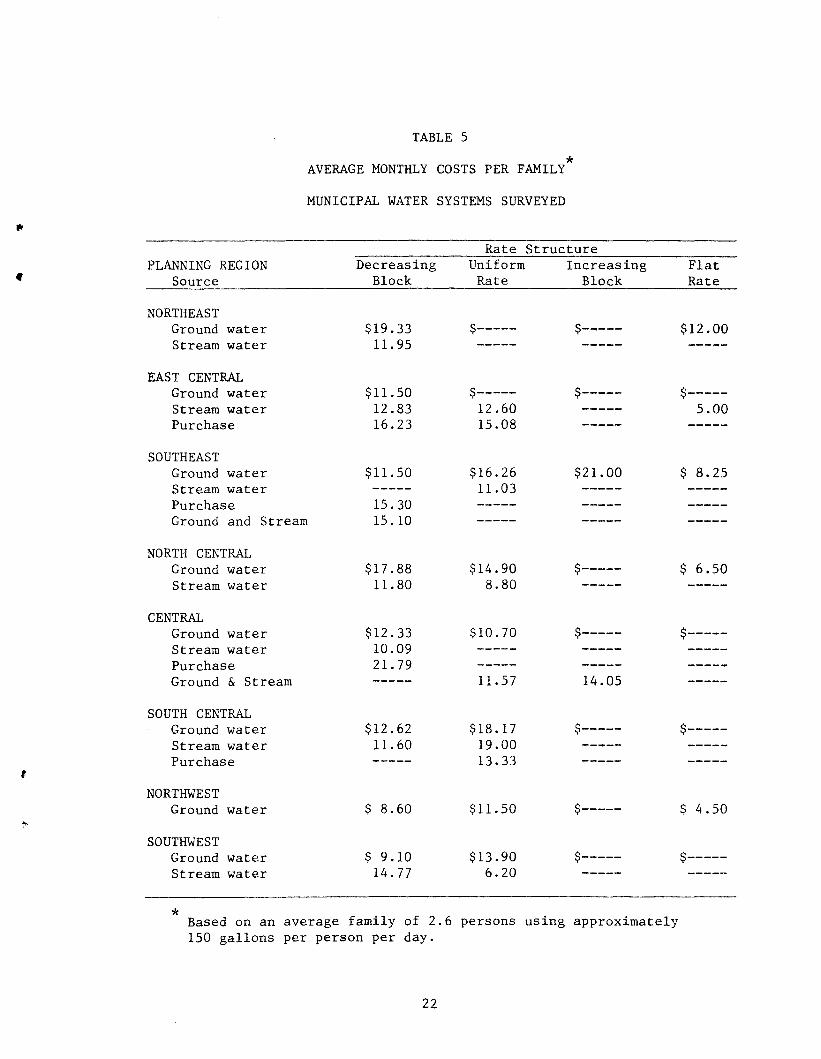
Appendix D, Tables 4 and 5, estimates what an average family can
expect to pay for rural water and municipal water service, respectively,
according to the source and type of rate structure utilized. These
average monthly costs were derived from rate schedules obtained during
the survey; and are based on an average family of 2.6 persons using 150
gallons per person per day, or approximately 12,000 gallons per family
for an average month of 30 days.
Customers served by municipal systems generally pay less than those
served by rural water systems, primarily due to the more expansive
distribution systems required to serve rural communities.
Customers that are served by a water utility which purchases from
another utility generally pay the highest price for water regardless of
7
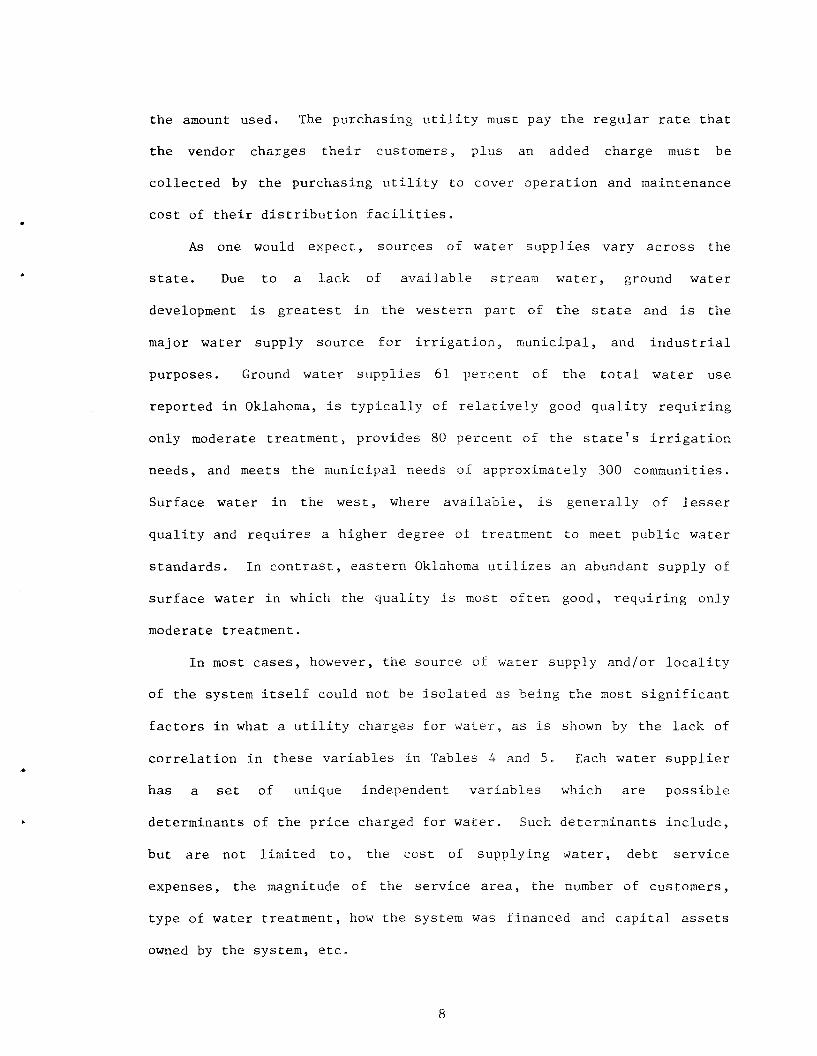
the amount used. The purchasing utility must pay the regular rate that
•
the vendor charges their customers, plus an added charge must be
collected by the purchasing utility to cover operation and maintenance
cost of their distribution facilities .
As one would expect, sources of water supplies vary across the
state. Due to a lack of available stream water, ground water
development is greatest in the western part of the state and is the
major water supply source for irrigation, municipal, and industrial
purposes. Ground water supplies 61 percent of the total water use
reported in Oklahoma, is typically of relatively good quality requiring
only moderate treatment, provides 80 percent of the state's irrigation
needs, and meets the municipal needs of approximately 300 communities.
Surface water in the west, where available, is generally of lesser
quality and requires a higher degree of treatment to meet public water
standards. In contrast, eastern Oklahoma utilizes an abundant supply of
surface water in which the quality is most often good, requiring only
moderate treatment.
In most cases, however, the source of water supply and/or locality
of the system itself could not be isolated as being the most significant
factors in what a utility charges for water, as is shown by the lack of
•correlation in these variables in Tables 4 and 5. Each water supplier
has a set of unique independent variables which are possible
determinants of the price charged for water. Such determinants include,
but are not limited to, the cost of supplying water, debt service
expenses, the magnitude of the service area, the number of customers,
type of water treatment, how the system was financed and capital assets
owned by the system, etc.
8
All Oklahoma water rate structures (except the flat rate) have
incorporated a charge for the initial block (or quantity) of water used,
generally the first 1,000 to 3,000 gallons. This initial charge is
traditionally used to cover operation and maintenance cost, annual
requirements for replacements, minor extensions of service, and minor
improvements. Provisions for major improvements are usually funded by
sales tax, through the revenue obtained by the sale of bonds, and from
federal or state funding programs.
Alternative Rate Structures and Water Conservation
Increases in per capita consumption and population are creating
demands that exceed the capacities of existing supply and/or
distribution facilities for many water systems, expecially during the
peak load summer months. Every year a number of Oklahoma communities
and rural water districts ration, while many others engage in
contingency planning to prepare for such emergencies. Most rate
schedules currently in use do not provide the capital required to expand
and operate facilities to meet increasing demands, thus conservation
becomes mandatory for many systems.
Water conservation is an effective and efficient means of solving
various water supply problems. A program to promote conservation of
water can have many benefits for the customer as well as for the water
utility. Water conservation practices can help a system over a
short-term shortage, may eliminate or postpone the need to expand
existing facilities or develop new sources and can also reduce the
operating costs while aiding a system through a water supply emergency.
Pricing, or changing the water rates to encourage users to conserve
to save money, is a cost effective program which can earn extra revenues
9
even as consumption drops and is, therefore, a logical consideration if
lack of revenues is a problem. Pricing is a mandatory program that
encourages conservation through higher costs to the consumer.
•
Generally, as the price for a product goes up, the demand for that
product goes down. This economic relationship holds true for water--as
the price for water increases, it is logical to assume that users will
reduce their use.
If a utility chooses a pricing program, a new water rate will have
to be designed. Usually a change in both price level (price per unit of
water) and price structure (price level variations according to the
quantity used or time of use) are necessary. The price level is the
most important part. The new price must be high enough to encourage the
needed use reduction, must cover the total cost of service, and minimize
adverse impacts.
A major concern of most utilities is that when a rate structure to
reduce water consumption is considered, an undesirable reduction in
revenues will occur. Water suppliers basically depend upon a stable and
predictable budgeting process for efficient operation. Therefore,
skillful advance planning must be initiated prior to adopting a new
water rate for pricing, which could well consist of the following steps:
Express your percentage reduction goal numerically; estimate how much
water use will drop after the price goes up; determine percent of change
in price needed to achieve the goal; determine what the new revenues
will be as a result of the new price level; and compare the new revenues
with your costs, remembering that variable costs will drop as water use
drops. If the revenues are too low, you may need a higher price; if the
revenues are too high, you may need a lower price.
10
•
The rate structures discussed below essentially require the
consumer to absorb the increased costs required to meet higher demands,
while simultaneously encouraging water conservation.
The summer surcharge system seasonally raises the minimum rate
during the summer months (March through October) to meet the increased
demand, which is usually highest during these months of the year. Other
efforts include a service charge based upon the meter size, which
increases the minimum rate and remains in effect all year. Metering
•
insures system efficiency by accurately accounting for all water used.
An excess use charge would require a significantly higher price level
for all water used above average, usually determined by winter use.
The lifeline rate provides a certain amount of water for essential
needs at rates that will benefit the low and moderate income user.
Rates are increased at the discretion of the water utility above the
"lifeline" amount. This method is best for reducing the average use per
customer.
A marginal cost prici~ structure considers the facilities required
to meet the average daily demand, the maximum daily demand, and some
allowances for projected growth in the service area. A rate structure
is developed that would require the users who contribute to peak loads
to pay for the additional facilities required .
The sliding scale system utilizes a price level per unit for all
water used, with increases based on average daily consumption. This
method is best used for reducing the average (and sometimes peak) use.
A daily peak load method, instrumental in reducing peak usage,
institutes a higher price level during hours of peak use (i.e. 6 a.m.
to 6 p.m.).
11
The most conservationally oriented rate structure is the increasing
block rate. This method charges a different rate for specified amounts
("blocks") of water, with a certain amount being charged for the initial
•block and the rate increasing for each succeeding block. This system
"
reduces the average (and sometimes peak) use and is very effective in
encouraging water conservation.
Another conservation-oriented structure is that of tax incentives.
Communities and rural water districts could give tax credits or bill
reductions when users have implemented other conservation devices.
(i. e. flow restrictors, water displacement bags). This method offers
an incentive for voluntary conservation practices and is most effective
in reducing either peak or average use.
From the standpoint of conservation, the key to an effective water
pricing policy is to make it clear to the user that hel she can save
money by minimizing water use. Therefore, the increase in water costs
(for quantities above the reasonable minimum required) must be great
enough to become a factor in a customer's operating expenses. Pricing
systems offer an opportunity to increase the awareness of the
relationship between the quantity used and the cost.
There will, of course, be a certain amount of public opposition to
a pro~osed rate increase . Efforts should be made to estimate the
•response of the users to the new price and inform the public of the need
for such changes as well as the rationale for the proposed rate
schedule.
Water utilities that have implemented new rate structures found
that raising water rates has had little or negligible effect on overall
consumption. It must be noted that only a few water utilities have
12
attempted to implement a conservation-oriented rate structure, thus the
results cannot be fully evaluated. Several reasons have been offered
•
for this minimal response, and are discussed in the following
paragraphs.
As per capita income increases, water consumption increases. More
water-using appliances (dishwashers, garbage disposals, etc. ) are found
in the home as income rises, which actually have more effect on total
consumption than the number of persons living in the home. There is
more discretionary income available to be devoted to lawns, shrubs, and
trees (all big water users) as the low cost of water becomes a
relatively smaller portion of the total family budget.
Low income families are generally less affected by rate increases
because they use the minimum amount needed. Most existing rate
structures, and the proposed conservation-oriented structures, charge a
reasonable rate for a quantity of water sufficient for essential needs.
Despite this rather paradoxical trend, it is only logical to assume
that at some level a rate increase will be sufficient to encourage users
to reduce, if not eliminate, unnecessary use and waste of water.
Concluding Remarks
In Oklahoma I s public water systems, consumer demands exemplify
dramatic seasonal variation, with the peak demand occurring within the
summer months. Consumption during this time requires the greatest use
of facilities (treatment plants, pumping stations, lines, etc.) in
relation to other periods in the year. Consumers have made decisions on
underpriced (peak) water, and have thus increased their consumption
beyond the marginal point where the cost and the value of output are in
balance.
13
Any water rate has the ability to recover the total cost of service
if the price level is high enough. It is important that only one price
hike be necessary within a short period, otherwise the utility may be
faced with tremendous opposition, making another rate hike virtually
certain to be an uphill battle.
It seems worthwhile to note that regardless of how a new rate
structure is designed, there is likely to be some opposition.
Educational programs explaining the need for the rate increase will help
to buffer the negative responses. This type of program could also
explain ways to conserve (as a means for keeping bills low) as well as
establish a meanS for developing consumer confidence.
A new water rate structure, if handled correctly, can meet the
principle goals of providing water utilities with needed revenues to
meet increasing production and distribution costs, as well as being
equitable to all consumers and discouraging waste.
In order to develop a realistic and equitable water rate structure,
the Oklahoma Water Resources Board encourages each water supplier to
adopt a carefully planned rate review program, aimed at assessing both
short- and long-term needs, based on the unique circumstances
characteristic of the utility's operations and the community served.
Any water utility official wishing technical assistance in
reviewing their current water rate structure or desiring further
information on water rate planning in general may contact:
Oklahoma Water Resources BoardPlanning and Development Division
P.O. Box 53585Oklahoma City, OK 73152
PH: (405) 271-2555
14

•
•
A P PEN D I X A
•
TABLE 1
Allocation of Water Revenues Among Cost of
*Water Production and Distribution
Category
SupplyTreatmentDistributionAdministration & AccountingDebt Service
Cost/1000 Gallons
0.1210.1230.1740.0480.184
Percent of Total
191927
728
*Average of cost allocations for Cities of Midwest City, Edmond,Oklahoma City and Stigler as of March 1981.
16

•
•
A P PEN D I X B
.. ".. <It
TABLE 2
SURVEY SUMMARY
RURAL WATER SYSTEMS
Rate Structures
Decreasing Block Uniform Rate Increasing Block Flat Rate
Planning Systems Population Systems Population Systems Population Systems PopulationRegion Surveyed Served Surveyed Served Surveyed Served Surveyed Served
Northeast 53 81,721 20 34,881 0 ----- 2 705East Central 33 49,344 9 9,537 1 1,100 2 1,390Southeast 29 37,202 9 17,432 0 ----- 1 608North Central 26 21,666 4 3,693 0 ----- 1 280Central 11 13 ,546 1 780 0 _._--- 1 627South Central 28 49,240 8 8,235 1 3,850 0Northwest 13 6,712 1 1,000 0 ----- 1 1,300Southwest 26 29,953 10 7,406 0 ----- 3 1,550
Total 219 289,384 62 82,964 2 4,950 11 6,960% of totalin Survey 74.5 75.4 21.1 21.6 0.7 1.3 3.7 1.7
, .,. ., "It
TABLE 3
SURVEY SUMMARY
MUNICIPAL SYSTEMS
Rate Structures
Decreasing Block Uniform Rate Increasing Block Flat Rate
Planning Systems Population Systems Population Systems Population Systems PopulationRegion Surveyed Served Surveyed Served Surveyed Served Surveyed Served
Northeast 7 422,230 0 ------- 0 ------ 1 2,185East Central 9 41,877 6 7,847 0 ------ 1 305Southeast 3 21,403 8 33,195 1 350 4 1,517North Central 7 76,610 3 9,294 0 ------ 1 632Central 7 472,949 4 155,713 1 28,424 0South Central 9 67,587 6 38,651 0 ------ 0Northwest 2 9,049 2 3,549 0 ------ 1 405Southwest 3 92,411 4 11 ,286 0 ------ 0
Total 47 1,204,116 33 259,535 2 28,774 8 5,044% of totalin Survey 52.2 80.4 36.7 17.3 2.2 1.9 8.9 0.4

,
A P PEN D I X C
..
TABLE 5
*AVERAGE MONTHLY COSTS PER FAMILY
MUNICIPAL WATER SYSTEMS SURVEYED
PLANNING REGIONSource
DecreasingBlock
Rate StructureUniform Increasing
Rate BlockFlatRate
t
NORTHEASTGround waterStream water
EAST CENTRALGround waterStream waterPurchase
SOUTHEASTGround waterStream waterPurchaseGround and Stream
NORTH CENTRALGround waterStream water
CENTRALGround waterStream waterPurchaseGround & Stream
SOUTH CENTRALGround waterStream waterPurchase
NORTHWESTGround water
SOUTHWESTGround waterStream water
*
$19.3311. 95
$11. 5012.8316.23
$11. 50
15.3015.10
$17.8811.80
$12.3310.0921. 79
$12.6211.60
$ 8.60
$ 9.1014.77
$-----
$-----12.6015.08
$16.2611.03
$14.908.80
$10.70
11.57
$18.1719.0013.33
$11.50
$13.906.20
$-----
$-----
$21.00
$-----
$-----
14.05
$-----
$-----
$-----
$12.00
$-----5.00
$ 8.25
$ 6.50
$-----
$-----
$ 4.50
$-----
Based on an average family of 2.6 persons using approximately150 gallons per person per day.
22
•,.
REFERENCES
An Empirical Analysis of Water-Price Determinants in SmallMunicipalities. Kenneth W. Hollman and Wayne E. Boyet,September, 1974.
Before the Well Runs Dry: A Handbook for Designing a Local WaterConservation Plan, U.S. Department of Interior, Geological Survey,October, 1980.
Economics of Water Delivery System in Rural Oklahoma. Bulletin B-745.Agricultural Experiment Station, Oklahoma State University,July, 1979.
Increasing Water and Sewer Rate Schedules: A Tool for Conservation.Robert S. McGarry and John M. Brusnighan, September, 1979.
"Municipal and Industrial Water Rates," American Water Works AssociationJournal. Peter K. MacEwen, October, 1977.
Oklahoma Comprehensive Water Plan. Publication 94, Oklahoma WaterResources Board, April 1, 1980.
Predicting the Municipal Demand for Water. Dale W. Berry and Gilbert W.Bonem, December, 1974.
"Rate Philosophy," American Water Works Association Journal. Robert C.Hyle, September, 1974.
Rural Water Systems in Oklahoma. Publication 98, Oklahoma WaterResources Board, September, 1980.
Water Rates: An Assessment of Current Issues. Steve H. Hanke, May,1975.
Water Rates Manual: American Water Works Association Manual MI .American Water Works Association, 1972.
Water Supply Engineering. Harold E. Babbitt, et al., 6th Edition, 1967.
Water Supply and Sewerage. Terence J. McGhee and E. W. Steel,5th Edition, 1979.
23