Embed Size (px)
Citation preview

Wednesday July 29, 2020, WQA Webinar
What Building Owners, Managers, Health Officials and Occupants do to Reduce the Risk of Waterborne Disease Outbreaks
Water Quality Variancesin Multiple Locations of a Home
Andrew J. Whelton, Ph.D.
(765) 494-2160

The study:An investigation of spatial and temporal drinking water quality variation in green residential plumbing, 2019Building and Environment
https://doi.org/10.1016/j.buildenv.2019.106566
1. Water quality entering the building varied
seasonally.
2. For 10.3% time, water entering the building did
not contain a detectable chlorine disinfectant
residual.
3. Inside the building, stagnation time varied
seasonally and across fixtures. Water at the
kitchen sink in the Summer had different
characteristics than water in the Winter.
4. Water pH also consistently and significantly
increased in the plumbing from 7.5 to 9.4, and
TTHM levels increased up to 89%.
5. Great carbon variability was found inside the
building for cold (0.4-61.0 mg/L) and hot water
(0.5-4.7 mg/L).
Buildings on municipal water supply
Wednesday July 29, 2020, WQA Webinar
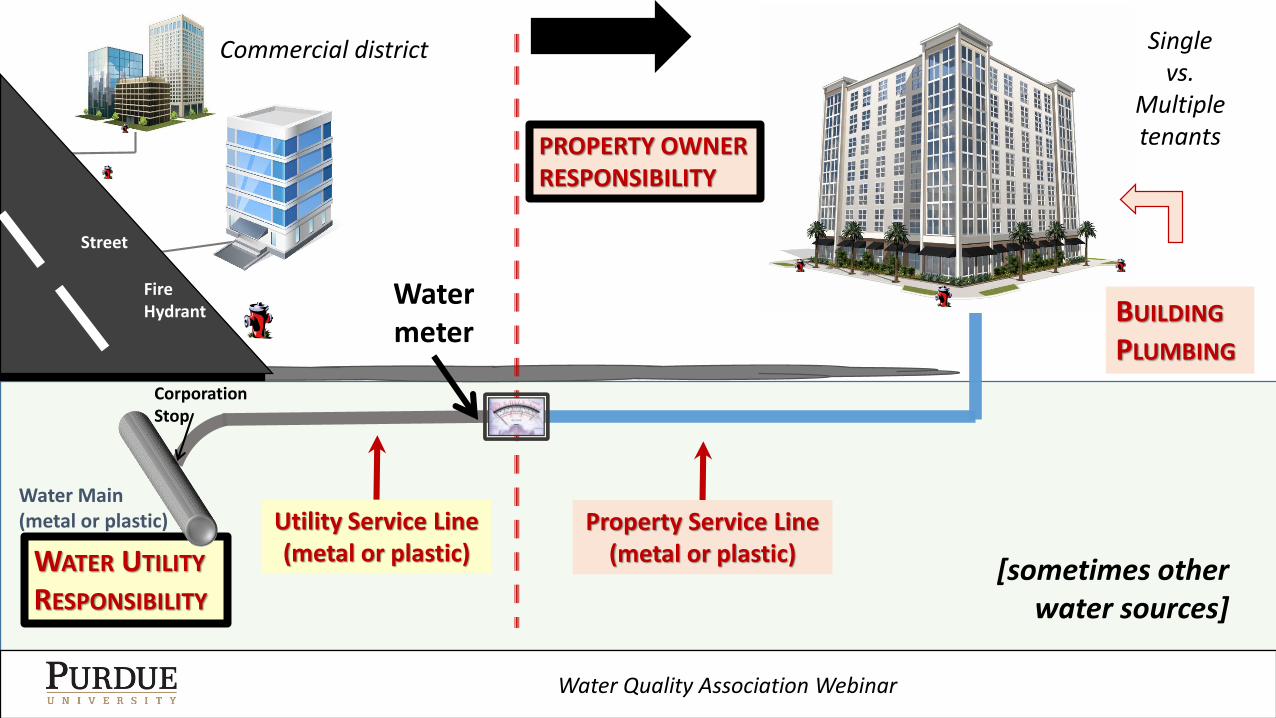
Corporation Stop
Water Main(metal or plastic)
Watermeter
WATER UTILITY
RESPONSIBILITY
Utility Service Line (metal or plastic)
Street
Fire Hydrant
[sometimes other water sources]
4
Property Service Line (metal or plastic)
Commercial district
BUILDING
PLUMBING
Singlevs.
MultipletenantsPROPERTY OWNER
RESPONSIBILITY
Water Quality Association Webinar

The home where water was tested
Wednesday July 29, 2020, WQA Webinar
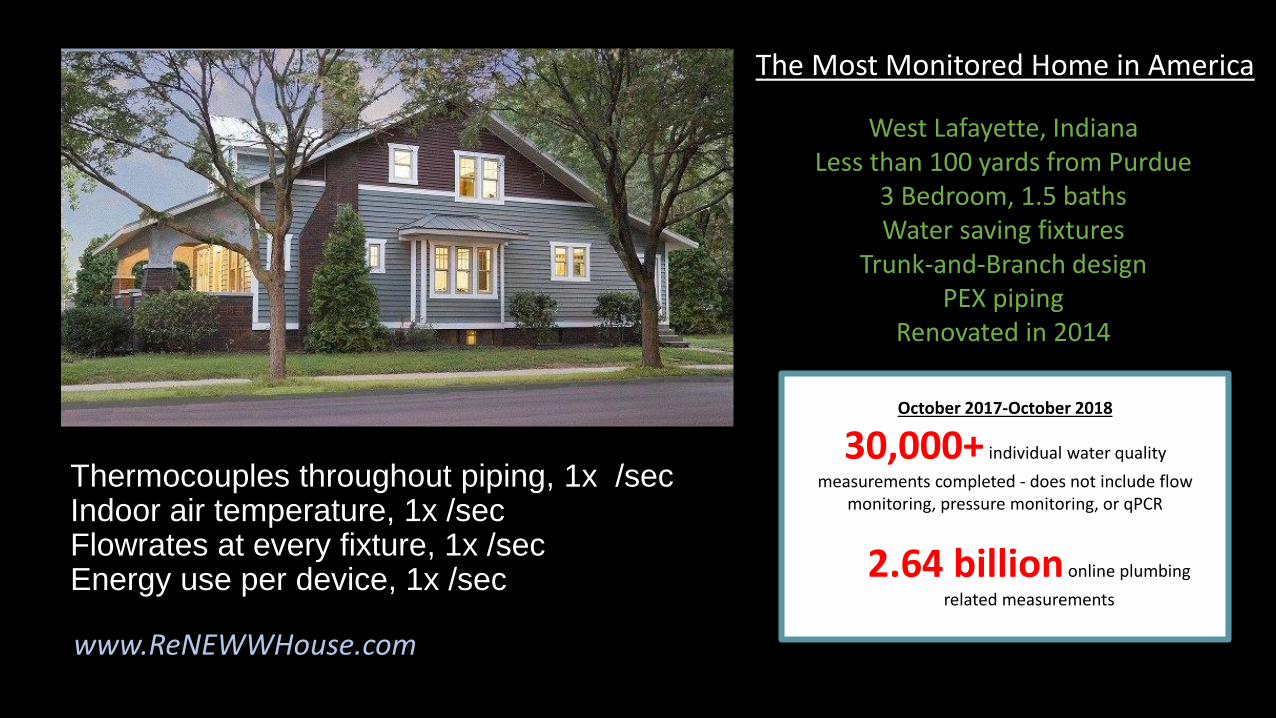
Thermocouples throughout piping, 1x /sec Indoor air temperature, 1x /sec Flowrates at every fixture, 1x /sec Energy use per device, 1x /sec
West Lafayette, IndianaLess than 100 yards from Purdue
3 Bedroom, 1.5 bathsWater saving fixtures
Trunk-and-Branch designPEX piping
Renovated in 2014
The Most Monitored Home in America
www.ReNEWWHouse.com
October 2017-October 2018
30,000+ individual water quality
measurements completed - does not include flow monitoring, pressure monitoring, or qPCR
2.64 billion online plumbing
related measurements

October 2017-November 2018
25+ people worked on this
Continuous monitoring of water flow, air and water temperature at service line and all plumbing components = 2.64 billion data points
Pressure monitoring continuous during water sampling, 2-3 week periods
More than 222,223 labor hours for water sampling and analysis (does not include data interpretation, reporting and other activities)
58 sampling events, 5 locations, hot and cold water, 7am, 12pm, 3pm
This will be the integrative water quality-hydraulic model for a single-family home
2014, building plumbing renovated with new
PEX, trunk and branch design; low flow
fixtures
Drinking water source:
Public water system: Groundwater, treated
with free chlorine residual and a corrosion
inhibitor, PVC and Iron water mains7

Where are we headed?
Wednesday July 29, 2020, WQA Webinar
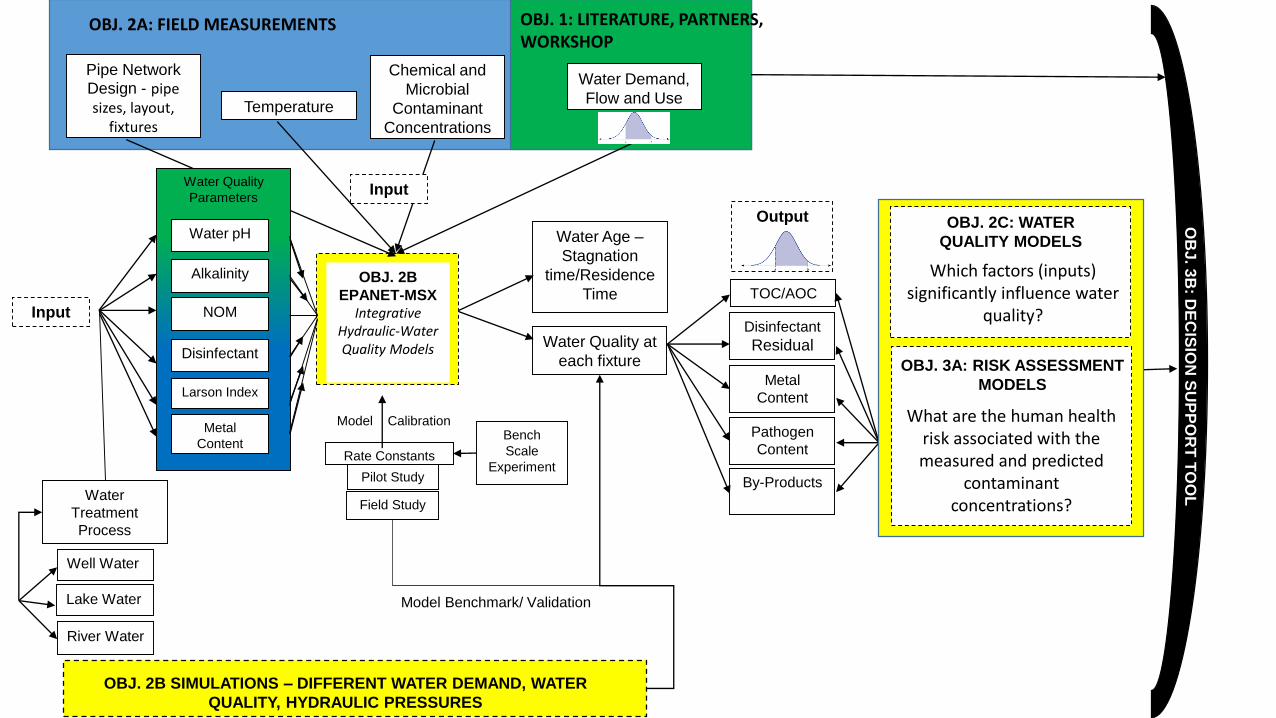
Pipe Network Design - pipe sizes, layout,
fixtures
Water Demand,
Flow and UseTemperature
Chemical and
Microbial
Contaminant
Concentrations
OBJ. 2B
EPANET-MSXIntegrative
Hydraulic-Water Quality Models Water Quality at
each fixture
Water Age –
Stagnation
time/Residence
Time
Water Quality
Parameters
Water pH
Alkalinity
NOM
Disinfectant
Larson Index
Water
Treatment
Process
Well Water
Lake Water
River Water
Metal
Content
Input
Bench
Scale
ExperimentPilot Study
Field Study
Rate Constants
Output
TOC/AOC
Disinfectant
Residual
Metal
Content
Pathogen
Content
By-Products
Model Calibration
Model Benchmark/ Validation
OBJ. 2A: FIELD MEASUREMENTS OBJ. 1: LITERATURE, PARTNERS, WORKSHOP
OBJ. 2B SIMULATIONS – DIFFERENT WATER DEMAND, WATER
QUALITY, HYDRAULIC PRESSURES
OBJ. 3A: RISK ASSESSMENT
MODELS
What are the human health risk associated with the measured and predicted
contaminant concentrations?
Which factors (inputs) significantly influence water
quality?
OBJ. 2C: WATER
QUALITY MODELS
Input
OB
J. 3
B: D
EC
ISIO
N S
UP
PO
RT
TO
OL
Maryam Salehi, Tolu Odimayomi, Kyungyeon Ra, Christian Ley, Ryan Julien, A. Pouyan Nejadhashemi
J. Sebastian Hernandez-Suarez, Jade Mitchell, Amisha D. Shah, Andrew J. Whelton
Department of Civil Engineering
University of Memphis
Lyles School of Civil Engineering, Division of Ecological and
Environmental Engineering & School of Mechanical Engineering
Purdue University
Department of Biosystems and Agricultural Engineering &
Department of Plant, Soil and Microbial Sciences
Michigan State University
Study Authors
Wednesday July 29, 2020, WQA Webinar
Wednesday July 29, 2020, WQA Webinar
What Building Owners, Managers, Health Officials and Occupants do to Reduce the Risk of Waterborne Disease Outbreaks
Water Quality Variancesin Multiple Locations of a Home
Andrew J. Whelton, Ph.D.
(765) 494-2160