Embed Size (px)
Citation preview
Water Quality of the Waikato and Waipa Rivers
Technical Leaders Group
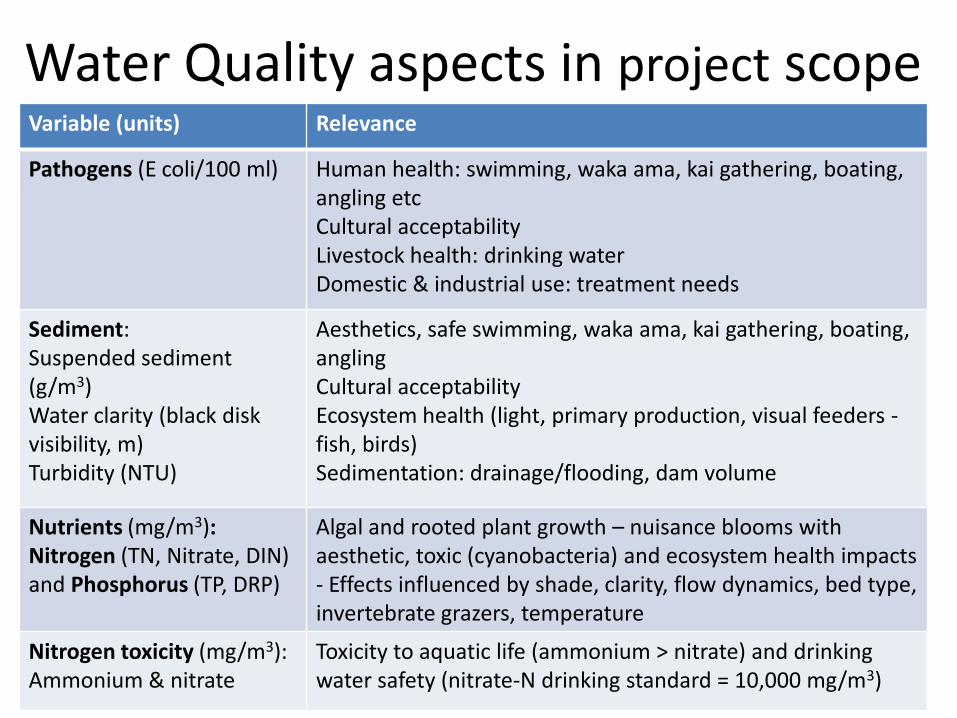
Water Quality aspects in project scope Variable (units) Relevance
Pathogens (E coli/100 ml) Human health: swimming, waka ama, kai gathering, boating, angling etc Cultural acceptability Livestock health: drinking water Domestic & industrial use: treatment needs
Sediment: Suspended sediment (g/m3) Water clarity (black disk visibility, m) Turbidity (NTU)
Aesthetics, safe swimming, waka ama, kai gathering, boating, angling Cultural acceptability Ecosystem health (light, primary production, visual feeders - fish, birds) Sedimentation: drainage/flooding, dam volume
Nutrients (mg/m3): Nitrogen (TN, Nitrate, DIN) and Phosphorus (TP, DRP)
Algal and rooted plant growth – nuisance blooms with aesthetic, toxic (cyanobacteria) and ecosystem health impacts - Effects influenced by shade, clarity, flow dynamics, bed type, invertebrate grazers, temperature
Nitrogen toxicity (mg/m3): Ammonium & nitrate
Toxicity to aquatic life (ammonium > nitrate) and drinking water safety (nitrate-N drinking standard = 10,000 mg/m3)
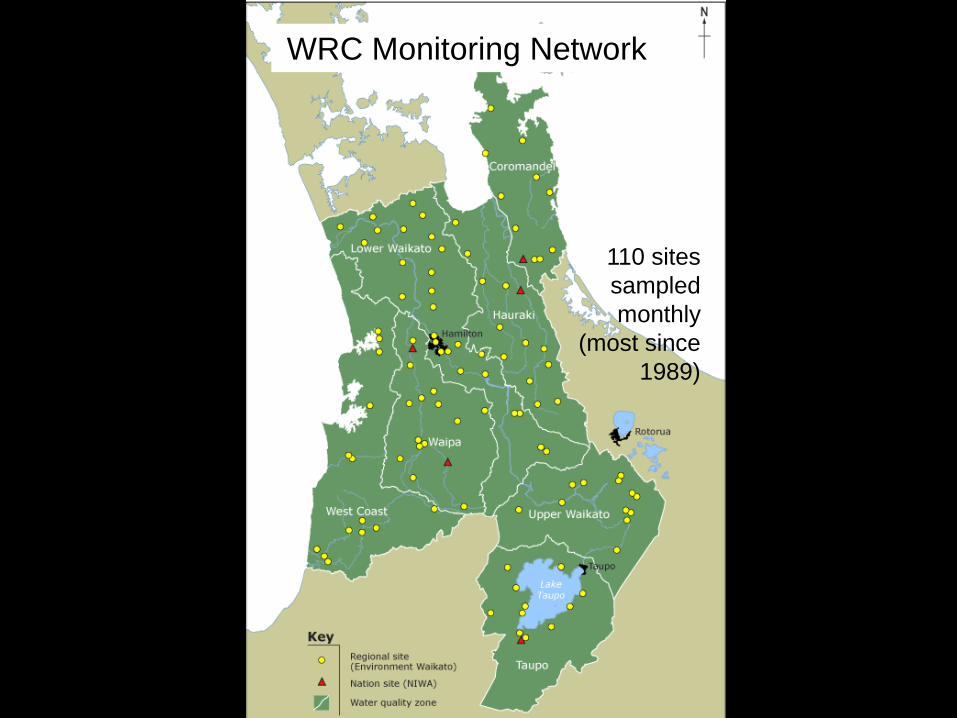
110 sites
sampled
monthly
(most since
1989)
WRC Monitoring Network
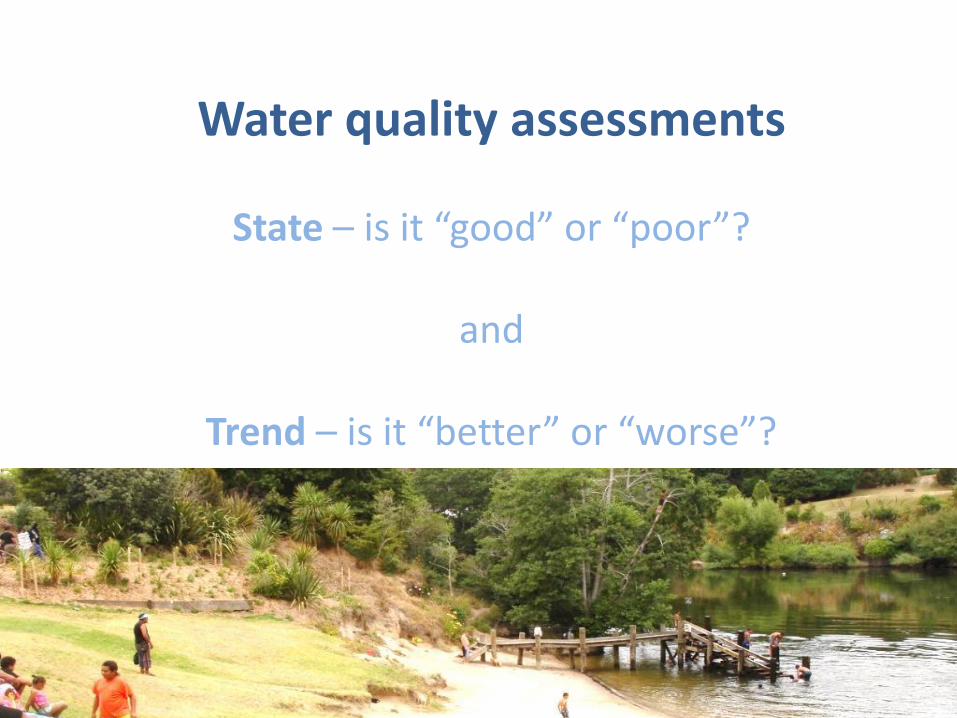
Water quality assessments
State – is it “good” or “poor”?
and
Trend – is it “better” or “worse”?
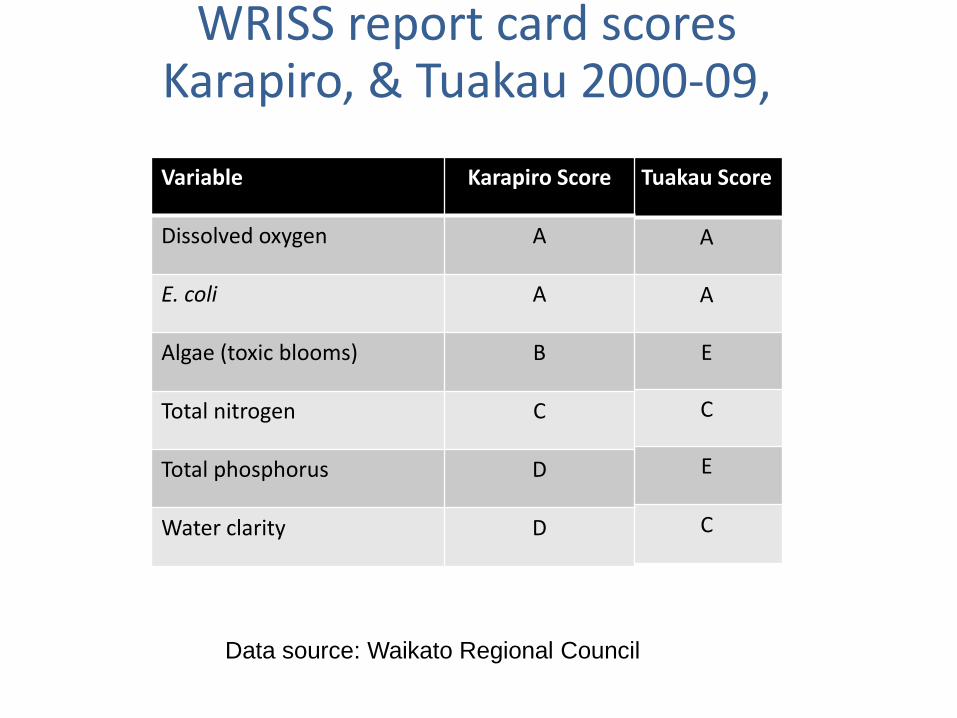
WRISS report card scores Karapiro, & Tuakau 2000-09,
Variable Tuakau Score
Dissolved oxygen A
E. coli A
Algae (toxic blooms) E
Total nitrogen C
Total phosphorus E
Water clarity C
Variable Karapiro Score
Dissolved oxygen A
E. coli A
Algae (toxic blooms) B
Total nitrogen C
Total phosphorus D
Water clarity D
Data source: Waikato Regional Council
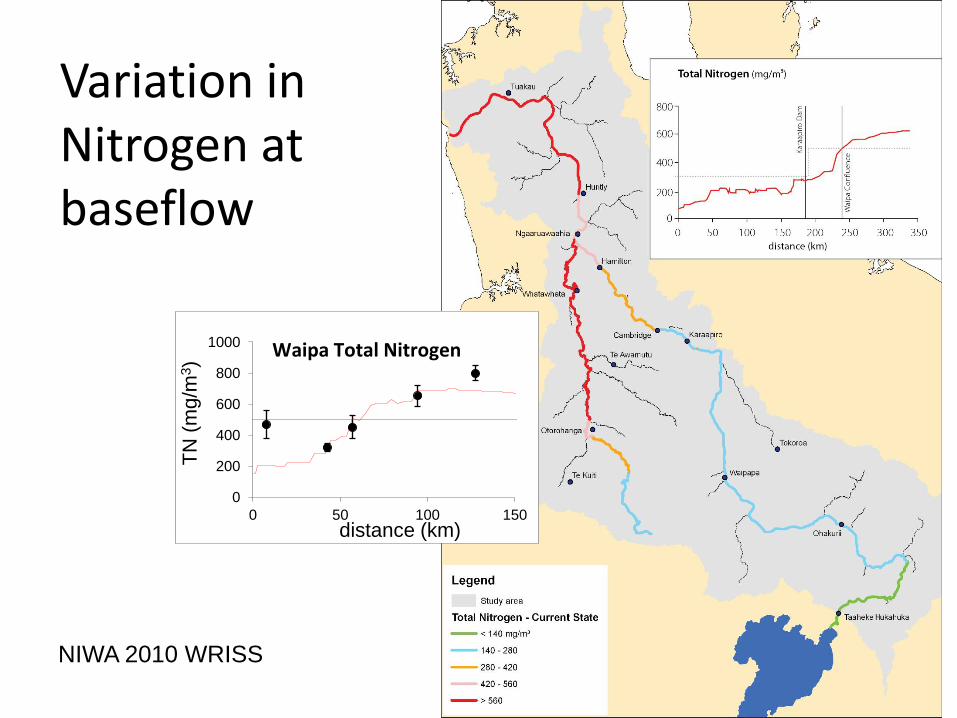
Variation in Nitrogen at baseflow
0
200
400
600
800
1000
0 50 100 150
TN
(m
g/m
3)
distance (km)
Waipa Total Nitrogen
NIWA 2010 WRISS
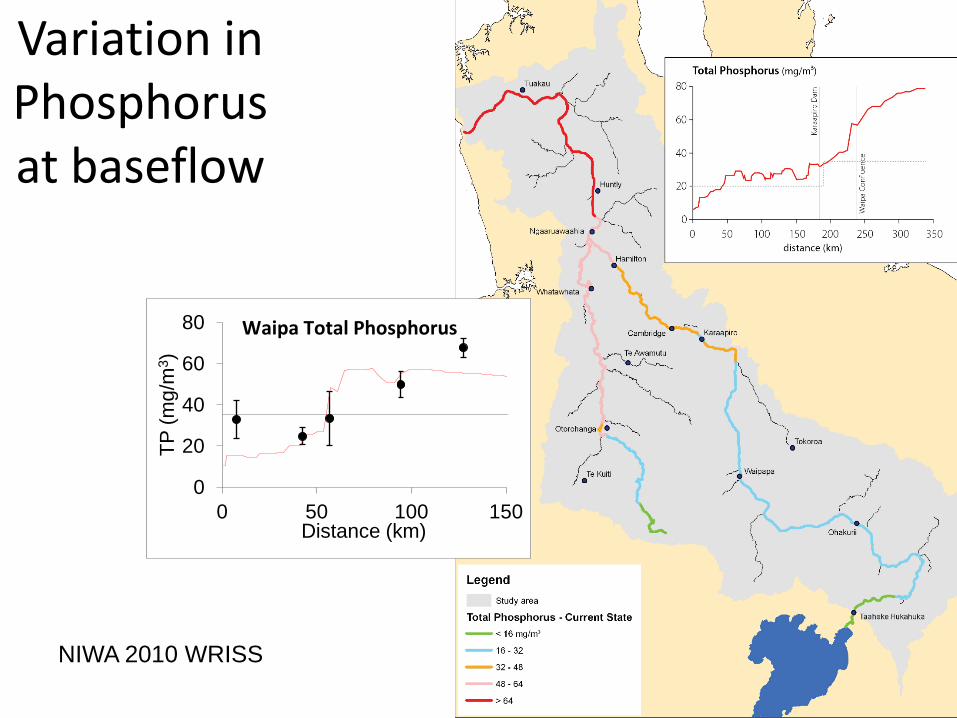
Variation in Phosphorus at baseflow
0
20
40
60
80
0 50 100 150
TP
(m
g/m
3)
Distance (km)
Waipa Total Phosphorus
NIWA 2010 WRISS
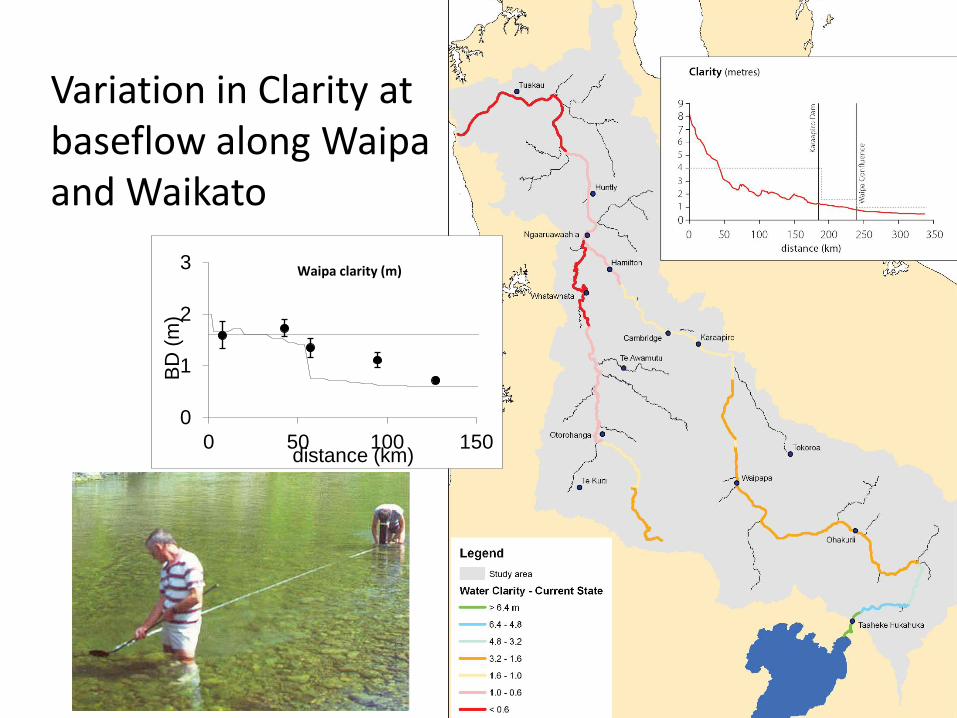
Variation in Clarity at baseflow along Waipa and Waikato
0
1
2
3
0 50 100 150
BD
(m
)
distance (km)
Waipa clarity (m)
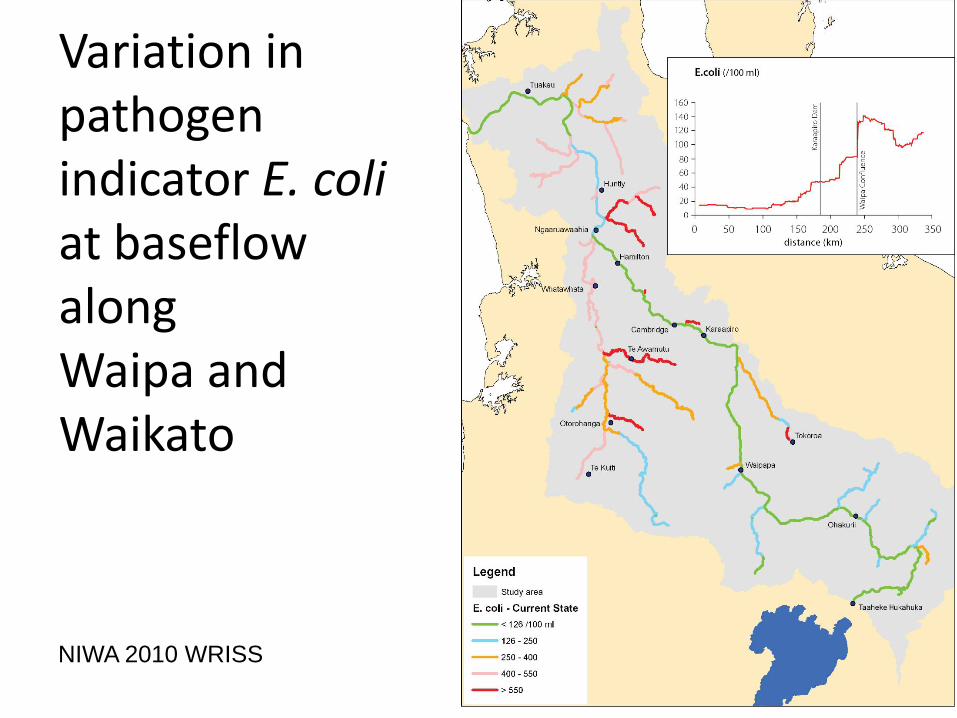
Variation in pathogen indicator E. coli at baseflow along Waipa and Waikato
NIWA 2010 WRISS
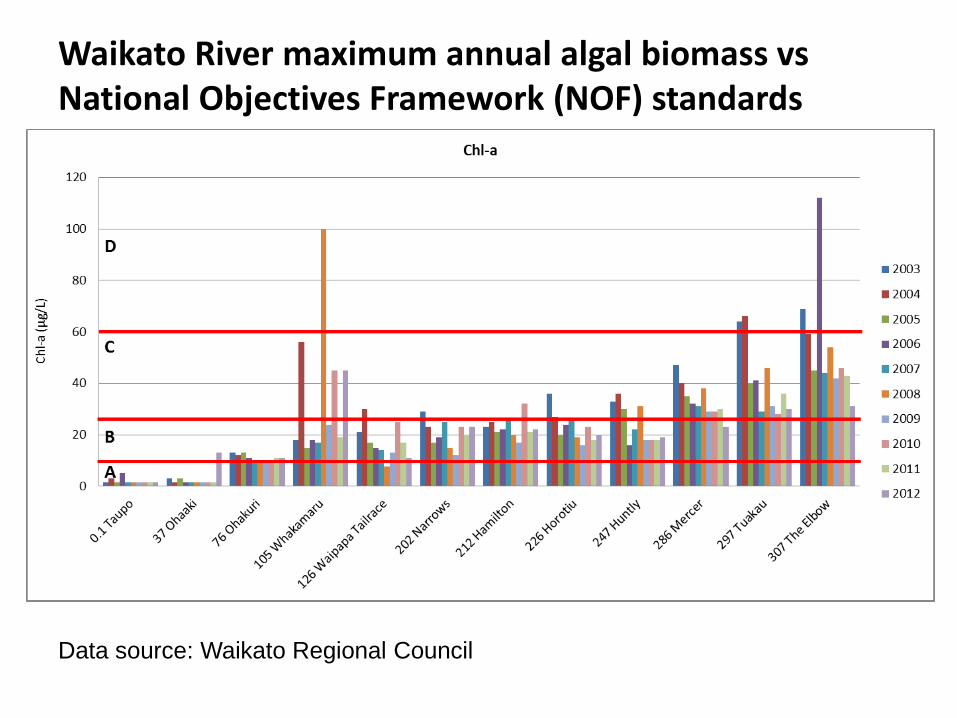
Waikato River maximum annual algal biomass vs National Objectives Framework (NOF) standards
Data source: Waikato Regional Council
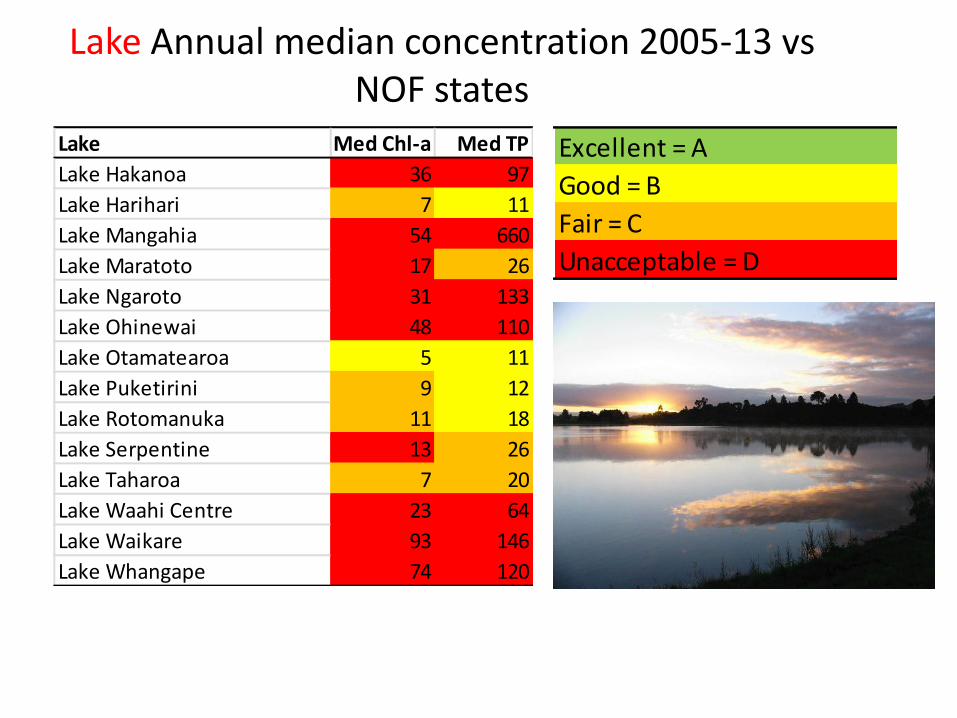
Lake Annual median concentration 2005-13 vs NOF states
Lake Med Chl-a Med TP
Lake Hakanoa 36 97
Lake Harihari 7 11
Lake Mangahia 54 660
Lake Maratoto 17 26
Lake Ngaroto 31 133
Lake Ohinewai 48 110
Lake Otamatearoa 5 11
Lake Puketirini 9 12
Lake Rotomanuka 11 18
Lake Serpentine 13 26
Lake Taharoa 7 20
Lake Waahi Centre 23 64
Lake Waikare 93 146
Lake Whangape 74 120
Excellent = A
Good = B
Fair = C
Unacceptable = D
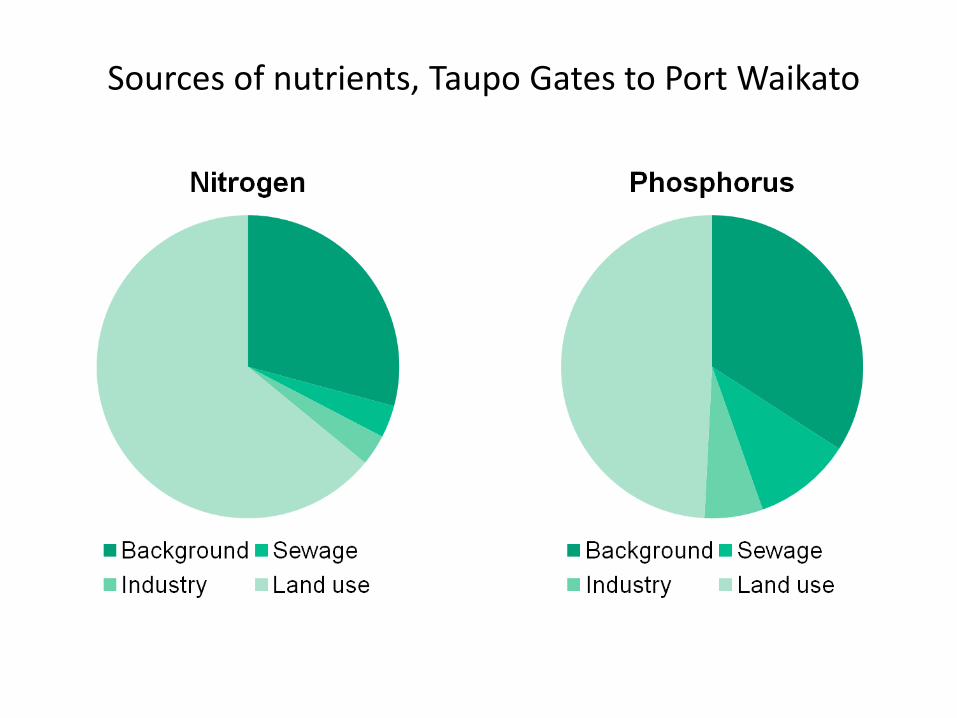
Sources of nutrients, Taupo Gates to Port Waikato
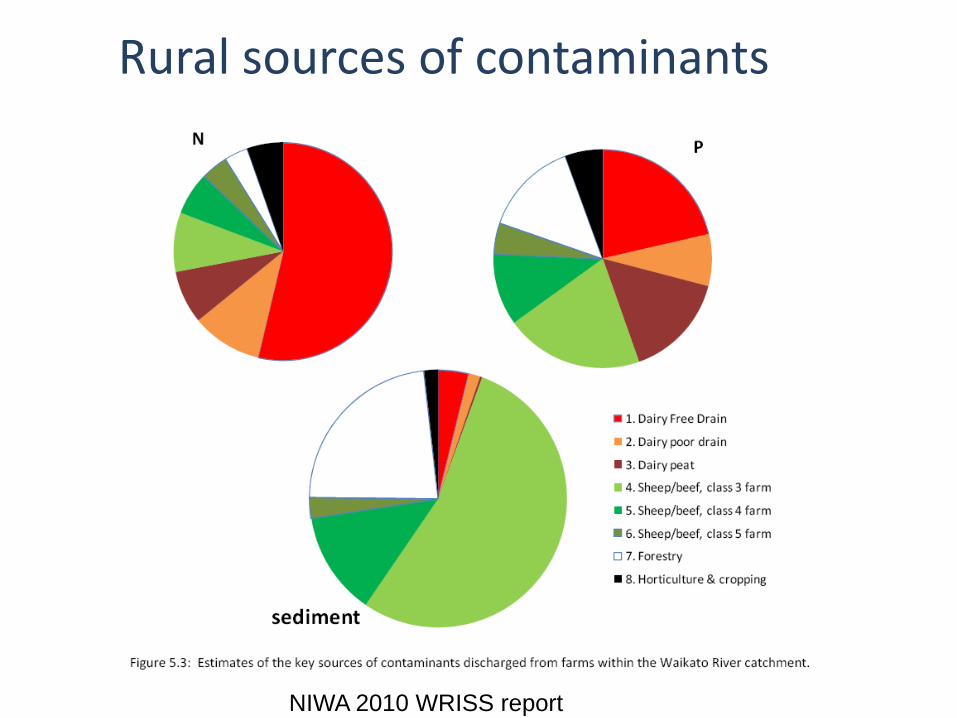
Rural sources of contaminants
NIWA 2010 WRISS report
Summary: current state
• excellent in places, poor in others—lowland lakes very poor
• conditions are often “at least satisfactory for desired uses”
– differences between zones (e.g. Waipa c.f. Lower Waikato mainstem c.f. Riverine lakes)
– these broadly reflect differing intensity of land use, geography and residence time in dams
Trends
Direction of change – improvement or deterioration
Rate of change – slight (<1% pa) or important (>1% pa)
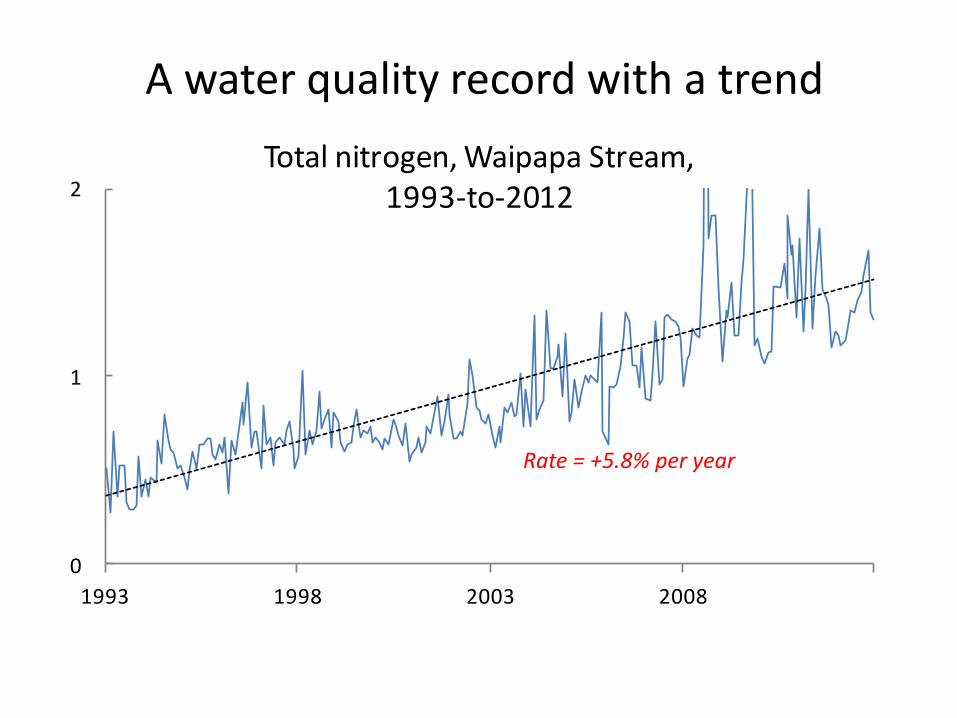
A water quality record with a trend
0
1
2
1993 1998 2003 2008
Total nitrogen, Waipapa Stream, 1993-to-2012
Rate = +5.8% per year
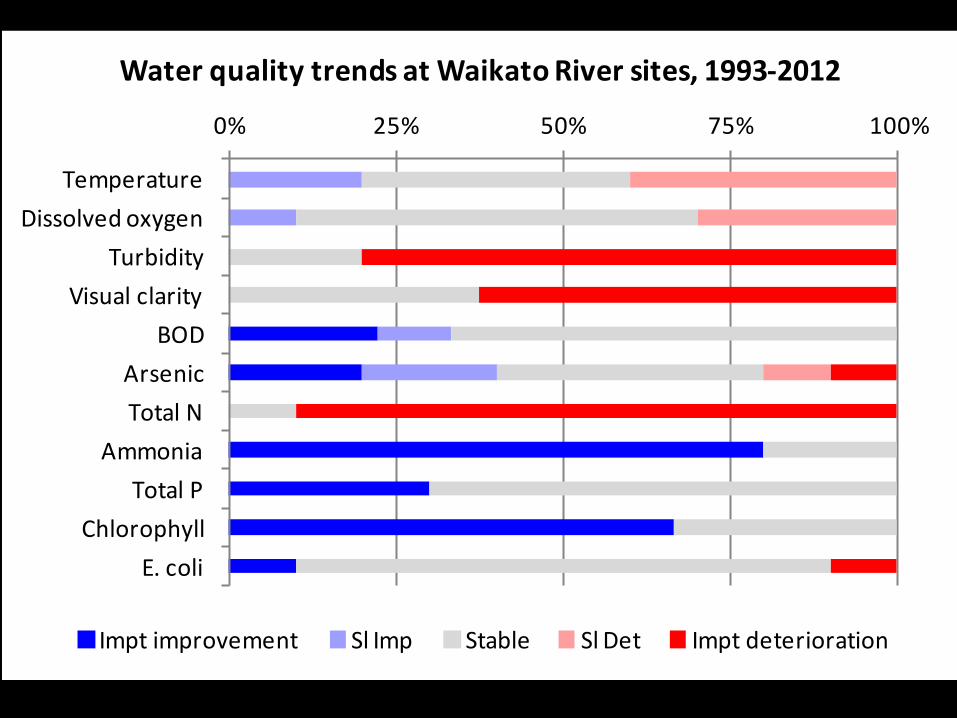
0% 25% 50% 75% 100%
Temperature
Dissolved oxygen
Turbidity
Visual clarity
BOD
Arsenic
Total N
Ammonia
Total P
Chlorophyll
E. coli
Water quality trends at Waikato River sites, 1993-2012
Impt improvement Sl Imp Stable Sl Det Impt deterioration
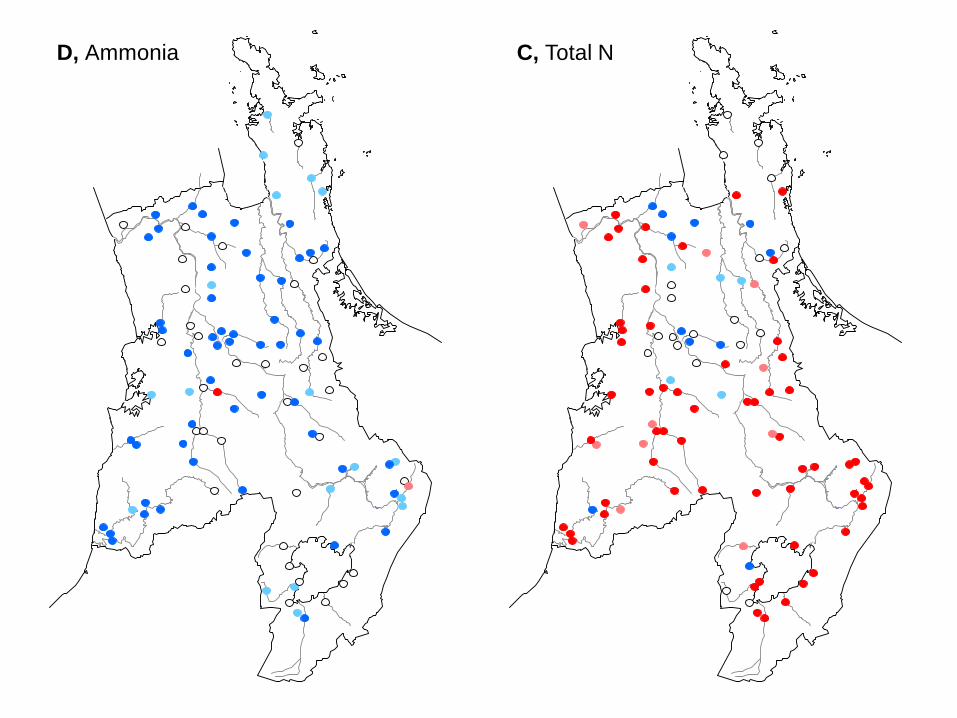
D, Ammonia
1
C, Total N
1
Summary: trends 1993-2012
• Some improvement (ammonia, chlorophyll);
• Some deterioration (turbidity, nitrogen)
• Pastoral agriculture likely to be the cause of much of the increase in nitrogen
• Groundwater lags likely to influence future trends (N load to come)
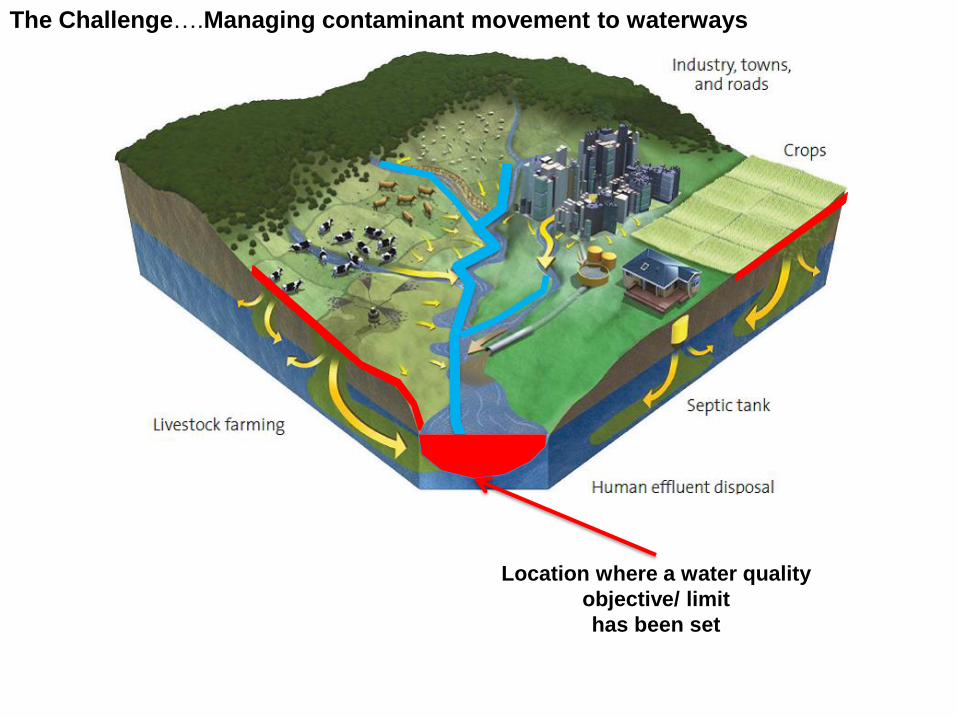
Location where a water quality
objective/ limit
has been set
The Challenge….Managing contaminant movement to waterways
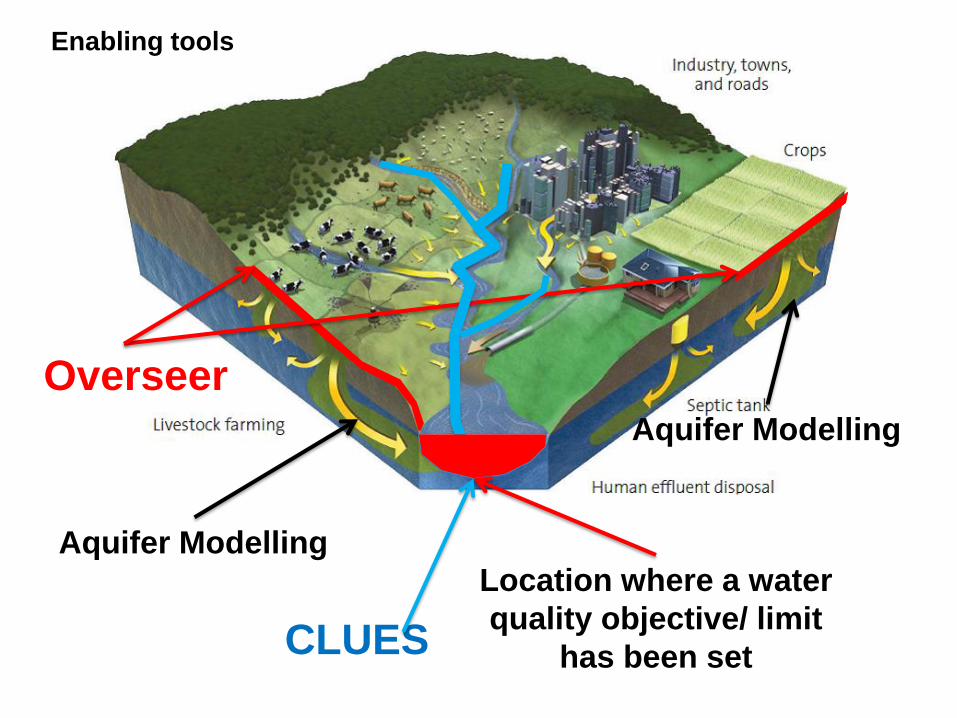
Location where a water
quality objective/ limit
has been set CLUES
Overseer
Aquifer Modelling
Aquifer Modelling
Enabling tools
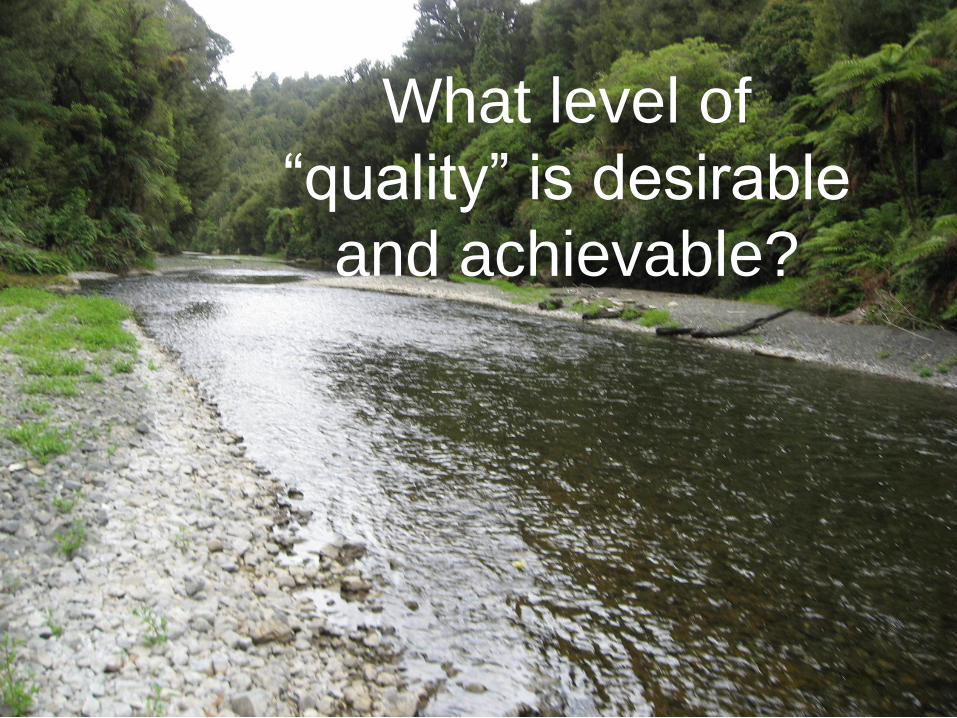
What level of
“quality” is desirable
and achievable?
Time to address CSG’s written
questions
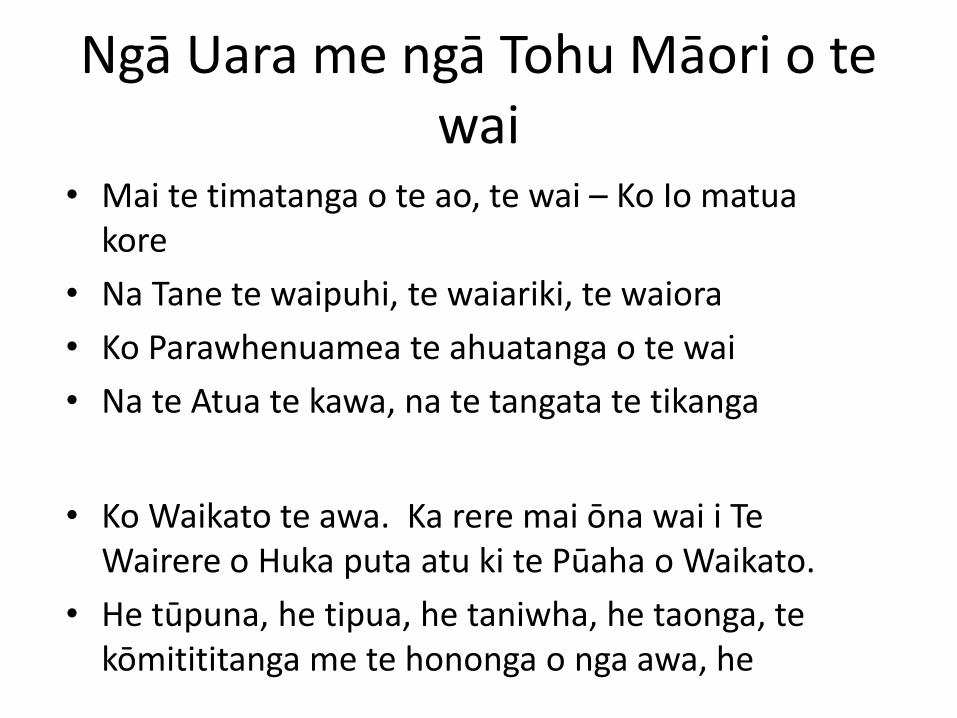
Ngā Uara me ngā Tohu Māori o te wai
• Mai te timatanga o te ao, te wai – Ko Io matua kore
• Na Tane te waipuhi, te waiariki, te waiora
• Ko Parawhenuamea te ahuatanga o te wai
• Na te Atua te kawa, na te tangata te tikanga
• Ko Waikato te awa. Ka rere mai ōna wai i Te Wairere o Huka puta atu ki te Pūaha o Waikato.
• He tūpuna, he tipua, he taniwha, he taonga, te kōmitititanga me te hononga o nga awa, he

Ngā Uara me ngā Tohu Māori
• Nga wāhanga waiora ki Waikato
– Mahinga kai
– The integrity and knowledge of significant sites
– Access to / abundance of taonga species
– Recreation – swimming, paddling, fishing
– Wai – identity, cultural practise and activities, knowledge, discrete and collective importance of bodies of water
Technical Questions from CSG#2
ANTOINE and LIZ
• I think the largest challenge is to communicate the evidence/facts on sources/results of the contaminants to:
– CSG (Collaborative Stakeholder Group)
– Healthy Rivers decision makers
– Stakeholders who have to make a change.
Technical Questions from CSG#2
MIKE
• How long does it take for N in ground water to reach water bodies?
• How much understanding is there about flows & direction of aquifers at different depths and direction of diffuse losses?
GRAEME
• How much work has been done on milk urea nitrogen levels as a catchment tool?
• JOHN
• What is the amount of nutrient that a fully “natural system” either loses directly through leaf drop, soil movement or diffuse loss? (eg. Fiordland)
• What is the natural (native) NP within the catchment not related to urban, industry & agriculture?
GRAEME
• How can the modelling done for this process be useful over longer time to assist with continuous management and improvement?
• Who will be doing the whole farm modelling? What tools will they use?
• How will the economic analysis of farm level impacting thru to regional/national impacts be done?
• Do we have sound information that can link possible changes/tools that might be applied with their economic impact on the communities where this would be done?