Embed Size (px)
Citation preview
FINAL REPORT
WATER QUALITY MONITORING PROGRAM FOR THE CIENEGA DE SANTA CLARA
UNIVERSITY OF ARIZONA PROJECT No. Y450277
Karl W. Flessa Department of Geosciences
University of Arizona PO Box 210077
Tucson, Arizona 85721 [email protected]
SUBCONTRACTOR:
Jaqueline García-Hernández Environmental Sciences Lab CIAD
Carr. Al Varadero Nal. Km 6.6 A.P. 284 Guaymas, Sonora
854580 Mexico
DECEMBER 15, 2007
1

EXECUTIVE SUMMARY We conducted a 14 month survey (August, 2006 – September, 2007) of water quality in the Cienega de Santa Clara, a large wetland on the eastern side of the Colorado River Delta, located in Sonora, Mexico. The survey was conducted to evaluate the effect of the 10% capacity, three-month trial run (March-May, 2007) of the Yuma Desalting Plant (YDP) on water quality in the Cienega de Santa Clara (CSC). The major source of water for this ecologically important habitat is brackish groundwater from the Wellton-Mohawk Irrigation and Drainage District, delivered to the CSC by the Mohawk Outlet Drain Extension (MODE canal). The YDP used MODE water during its trial run. Sixteen stations, located at inflows, in the vegetated zone, and along the rim of the Cienega de Santa Clara were sampled monthly before, during and after the trial run of the YDP. We measured temperature, electrical conductivity, salinity, total dissolved solids, dissolved oxygen and pH in the field. We also collected water samples for laboratory analyses of nutrients, hardness, turbidity and selenium. Water samples were also collected for analyses of deuterium and oxygen isotopes in order to detect the influence of tidal mixing on salinity in CSC. Salinity is likely the most important aspect of water quality because it affects the growth of cattail, the dominant vegetation in the CSC. Extensive stands of cattail provide shelter and are the base of the food chain for aquatic invertebrates and vertebrates as well as for the migratory and resident birds that inhabit the CSC (including the endangered Yuma clapper rail). The three-month, 10%-capacity, test-run of the YDP did not significantly affect water quality in the Cienega de Santa Clara. Salinity levels in the CSC during the test-run were not significantly different from salinity levels before and after the test-run. Because there was no significant response in water quality to the 10% capacity test-run, we cannot predict changes in water quality that would result from longer duration or higher capacity operations of the YDP. Salinity in the vegetated portion of the CSC is controlled by the salinity of inflow from the MODE and Riito canals. Tidal exchange does not affect salinity in the vegetated portion of the CSC. We recommend continued monitoring of water quality, especially salinity, in the CSC in order to: (1) establish baseline variation in water quality, especially for the months of the trial run of the YDP; (2) determine variation in the volume and quality of inflows from the Riito and MODE drains; and (3) relate the volume and quality of inflow to the extent of the critical vegetated portion of the Cienega de Santa Clara.
2

PURPOSE
The purpose of this project was to determine if a 10% capacity, trial run of the Yuma desalting Plant (YDP) during March, April and May, 2007 would significantly affect water quality in the Cienega de Santa Clara (CSC). This report identifies sources of water for the CSC and documents water quality before, during and after the 3-month test-run of the YDP.
INTRODUCTION The Colorado River basin is in the eighth year of a serious drought. The possibility of water shortages has forced Arizona water managers to consider re-starting the long-dormant Yuma Desalting Plant (YDP). The plant would treat brackish ground water from the Wellton-Mohawk Irrigation and Drainage District of Arizona that is currently being diverted to the Colorado River delta in Sonora, Mexico. Since 1977, when the water was first diverted, an ecologically important wetland, the Cienega de Santa Clara, has developed in the delta. Ecological value of the Cienega de Santa Clara The Cienega de Santa Clara is the largest wetland on the Mexican portion of the Colorado River Delta. The CSC has expanded from several hundred acres in 1977 to nearly 40,000 acres today. The wetland hábitat consists of 14,000 acres of dense marsh vegetation, mainly cattails (Typha domengensis) interspaced with 25,000 acres of open water habitat. The CSC is situated along the Pacific Flyway and is critical habitat for migratory birds, including ducks and geese, and for resident marsh birds, including the largest population of the endangered Yuma clapper rail. In the winter, the most abundant bird species are the greater white-fronted goose, Canada goose, and snow goose. These birds use the inner lagoons, salt grass flats and adjacent agricultural fields. Northern shoveler, northern pintail, cinnamon teal and American white pelican are numerous in the inner lagoons. The most common summer species are western sandpipers, dowitchers, and red-necked phalaropes, which forage on the mudflats. The most abundant breeding shorebirds are black-necked stilts and killdeer. Of the eight species of marshbirds, the Yuma clapper and Virginia rails, American coots and least bitterns are most common; black rails and American bitterns are present in low numbers. Long-legged waders also use the CSC, including white-ibises, snowy egrets and great egrets (Hinojosa-Huerta, et al., 2004). Endangered desert pupfish also inhabit the CSC. The CSC is also important for the economy of the local community, Ejido Johnson. Residents have established ecotourism cooperatives based on the biological richness and beauty of the marsh. Some of the Ejido members have assisted scientific field work such as bird surveys and monitoring of water quality. Water budget The wetland was created in 1977 with brackish drainage water from the MODE (Main Outlet Drain Extension). This water is pumped from underneath farm fields of the Wellton-Mohawk Irrigation and Drainage District in the lower Gila River valley, AZ. The MODE is the largest source of water for the CSC. Agricultural surface runoff water from the San Luis agricultural district in Mexico also drains into the CSC via the Riito canal. Both sources of
3

water are present year-round with variations in flow and salinity depending on crop cycles. In addition to these two main water sources, the CSC also receives small amounts of water from precipitation, tidal inflows, and fresh water springs at the landward edges of the delta (Fig. 1). Water leaves the CSC largely through evapotranspiration from vegetation or directly through evaporation, especially in the unvegetated portions. Little water drains directly from the CSC into the adjacent Gulf of California. The amount of water lost to groundwater seepage is unknown.
Riito
MODE
Tides
Springs
EvapotranspirationEvaporation
Precip
Cienega de Santa ClaraSchematic Water Budget
Vegetated zone Margins Figure 1: Schematic water budget for the Cienega de Santa Clara with major water sources from the MODE and Riito drains, and minor sources from tides, springs, and precipitation (precip.). Cienega de Santa Clara vegetation and water quality The extent of the marsh vegetation in the Cienega de Santa Clara is closely related to the quality and quantity of water from these sources. Marsh vegetation, dominated by cattail ((Typha domengensis), provides habitat (feeding areas, nesting areas, shelter from predation) for birds and the decaying vegetation supplies the organic detritus that is important to the aquatic invertebrates that are part of the CSC’s food web. The optimal salinity for growth of cattail, the dominant plant, is 1.1 ppt (Fig. 2). As salinity increases, cattail growth rates decline. At 3.2 ppt salinity, cattail’s growth is 50% of its optimal (highest) growth rate. The vegetation disappears as salinity levels reach critical limits; the upper salinity limit of cattail is 6 ppt (Glenn et al. 1995).
4

Incr
easi
ng g
row
thra
te
Increasing salinity (ppt)
Optimal growth
No growth
1.1 3.2 6
Figure 2: Effect of salinity on growth of cattail (Typha domengensis), the dominant plant species in the Cienega de Santa Clara. Salinity of 3.2 ppt marks growth rates that are 50% of the maximum rate.
METHODS Water quality was monitored at 16 stations, including the CSC inflows (MODE and Riito),
the marsh rim, and the vegetated core of the wetland (Figure 3; Table 1). The Riito drain was measured at points close to its entrance into the CSC. The MODE was sampled under the last bridge before entering the CSC. The vegetated and inflow stations were monitored monthly from August 2006 to September 2007, except for December 2006 and February 2007, when monitoring was not possible due to logistical problems. Nutrients wemeasured monthly from September 20
re 06 to
ber 2007.
to sample water quality stations.
3. Monitoring stations in the Cienega de Santa
Septem During the test-run (March 1-May 31, 2007), water quality at these stations was sampled twice a month. Because several rim sites are not flooded year-round, it was not always possibleat the rim
Figure Clara. See Table 1 for exact locations.
5

We measured temperature, electrical conductivity, salinity, total dissolved solids, dissolved oxygen and pH in the field using a YSI® probe (YSI Inc. Yellow Spring, OH; Model 556 SN 03K1388AD) We took two readings at each monitoring station. We also collected water samples for nutrients, hardness and turbidity. Nutrients, hardness and turbidity were analyzed in the laboratory with a La Motte® kit and spectrometer. We collected water samples for selenium On March 21, 2007. The selenium samples were kept at pH < 2. Selenium was analyzed using hydride generation in an atomic absorption spectrometer at Weck Laboratories Inc. We collected water samples for stable isotope analyses on April 23, 2007. The covariation of isotopes of hydrogen and oxygen serve to distinguish brackish water that is the result of the mixture of seawater and riverwater from brackish water that results only from the evaporation of riverwater. Table 1. Location of sampling stations in the Cienega de Santa Clara
Station Num. Category UTM X UTM Y
Station Num. Category UTM X UTM Y
1 Rim 720505 3519840 9 Inflow -- Riito 693638 35538282 Rim 702360 3546099 10 Rim 694074 35490233 Rim 703425 3544125 11 Rim 694583 35429874 Rim 704660 3542620 12 Vegetated 697994 35463965 Rim 698603 3548756 13 Vegetated 699503 35462356 Inflow-- MODE 698385 3548547 14 Vegetated 698925 35455857 Inflow -- Riito 697918 3549079 15 Vegetated 700964 35450608 Inflow -- Riito 693638 3553828 16 Vegetated 701606 3543651
RESULTS AND DISCUSSION
Salinity and nutrients in the vegetated zone and in the MODE and Riito inflows Figure 4 shows the average salinity level in the vegetated zone of the CSC and at the MODE inflow throughout the 14-month study-period. Salinity levels in the vegetated zone were slightly higher than at the MODE inflow. This may be because the water spreads out in the vegetated zone, allowing for more evaporation, thus concentrating salts. Throughout the entire study-period, salinity levels at both the MODE inflow and in the vegetated zone were higher than 1.1 ppt, the optimal growth condition for cattail. However, at no point during the study, did salinity at the MODE inflow exceed 3.2 ppt, the level at which cattail growth rates decrease by 50% (Glenn et al., 1995). Average salinity levels in both the vegetated zone and at the MODE inflow were below 3.2 ppt during the 3-month test-run of the YDP, (March 3.0 ppt, April 2.5 ppt and May 2.7 ppt). At no point during the study, did salinity in either the MODE or in the vegetated portion of the CSC exceed 6 ppt, the point at which cattail no longer grows (Figure 4).
6

Figure 4: Average salinity levels in the vegetated zone of the Cienega de Santa Clara and at the MODE inflow during the 14-month study period. The 3-month period of the YDP test-run is shaded in light blue. Cattail (T. domengensis) growth rates are optimal at 1.1 ppt salinity. The orange horizontal line at 3.2 ppt salinity represents the point at which cattail growth declines to 50% of its optimal growth rate. The horizontal red line at 6 ppt salinity represents the salinity level at which cattail no longer grows. Salinity varied during the study period. Normal variations in salinity levels (i.e. not due to the YDP test-run) at the inflows may be due to crop cycles and irrigation regimes. For example, at the Rio Hardy Drain on the western side of the delta, return flows increased from 0.5 m3/s in January to 0.9 m3/s in March and 1.2 m3/s in April and decreased again in June to 0.7 m3/s of 2004 (CONAGUA, 2004). This annual cycle is due to irrigation of wheat, a common crop in the Mexicali Valley. Increased surface irrigation can result in more salts being washed from fields into the drains. Temperature variation did not affect salinity. Salinity concentrations from Aug. 2006 to Sept. 2007 at the points of inflow were not correlated with temperature (r2 = 0.06, from a simple linear regression). Our results indicate that there was no significant increase in salinity at either the MODE or Riito inflows or in the vegetated zone of the Cienega de Santa Clara during the 3-month, 10% capacity test-run of the Yuma Desalting Plant. Salinity levels in the MODE, Riito and vegetated zones during the 3-month test-run were not significantly different from levels in the periods before and after the test run (Figures 5-7).
7

Figure 5: Salinity levels in the vegetated zone of the Cienega de Santa Clara during 3 months before, during and after the 10% test-run of the YDP. Values are means with 95% confidence intervals.
Figure 6: Salinity levels at the MODE inflow during 3 months before, during and after the 10% test-run of the YDP. Values are means with 95% confidence intervals.
Figure 7: Salinity levels at the Riito inflow during 3 months before, during and after the 10% test-run of the YDP. Values are means with 95% confidence intervals.
8

Ammonia concentrations at the Riito and MODE inflows and vegetated zones were similar throught the study period (Figure 8). The increase during the time of the trial run is not a result of the operation of the YDP because the Riito values show a similar increase. Fluctuations in ammonia concentrations are likely due to variation in fertilizer input during the study period.
Figure 8: Ammonia in the MODE, Riito, and vegetated zone if the Cienega de Santa Clara (Veg) throughout the study-period. The period of the test-run is shaded in blue. Nitrates also varied through the study period, but the lack of pre-trial run samples from the MODE do not allow any conclusions regarding the trial run’s effects.
Figure 9: Nitrates in the MODE, Riito, and vegetated zone of the Cienega de Santa Clara (Veg Ave) throughout the study-period. The period of the test-run is shaded in blue. Rim Stations and role of tidal exchange of water Previous work had suggested that the MODE accounts for 88% of water in the Cienega, the Riito 10% and additional sources account for 2% (Zamora-Arroyo et al. 2005). However, the contribution of seawater through tidal exchange was not known. We examine the salinity at
9

rim stations and isotopic variation of CSC water to evaluate the effect, if any, of tidal exchange on salinity. We selected 6 stations outside the vegetated area in order to determine if there was a tidal influence on salinity in the CSC (Table 1). Station 1, almost 20 km from the inflows and adjacent to the Gulf of California was selected in order to detect tidal influence. Station 11, located on the west side of the CSC is not always flooded; water there could be sampled only from August to October 2006. Stations 3 and 4 are on the south-eastern fringe of the CSC. These areas are mudflats inundated with 10 to 15 cm of water and small patches of short-statured cattails. Station 5 is 200 m east from the MODE drain. It is a backwater from the CSC that has been spreading to the north-east. Station 2 is at the entrance of a canal and is a shallow area vegetated with juncos. Station 10 is on the west side of the Riito drain. This area was flooded in 2005 but was dry during our surveys in 2006 and 2007; no sampling was possible. Figure 10 is a Landsat satellite image of the CSC taken on August 25, 2006 during one of the highest high tides of the year. We sampled the rim sites three days later on August 28, 2006. We observed high salinities at rim sites 1 and 11 (Appendix 1). This indicates the presence of tidal water at these sites. However, we did not observe water from the vegetated portion mixing with the tidal water and salinity values in the vegetated portion of the CSC did not increase during the high tide. This strongly suggests that salinity levels in the vegetated portion of the Cienega de Santa Clara are not influenced by tides. Figure 10: Landsat image of the Cienega de Santa Clara, August 25, 2007 (photo courtesy of Alejandro Hinojosa).
10
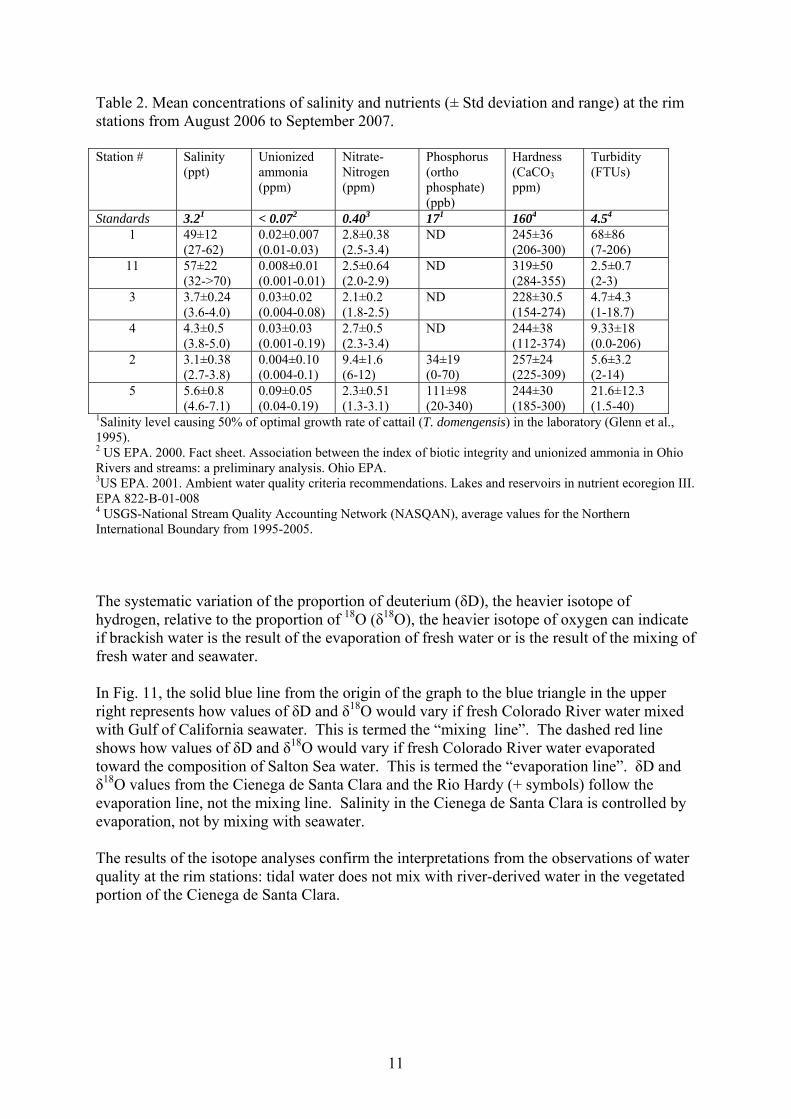
Table 2. Mean concentrations of salinity and nutrients (± Std deviation and range) at the rim stations from August 2006 to September 2007. Station # Salinity
(ppt) Unionized ammonia (ppm)
Nitrate- Nitrogen (ppm)
Phosphorus (ortho phosphate) (ppb)
Hardness (CaCO3 ppm)
Turbidity (FTUs)
Standards 3.21 < 0.072 0.403 171 1604 4.54 1 49±12
(27-62) 0.02±0.007 (0.01-0.03)
2.8±0.38 (2.5-3.4)
ND 245±36 (206-300)
68±86 (7-206)
11 57±22 (32->70)
0.008±0.01 (0.001-0.01)
2.5±0.64 (2.0-2.9)
ND 319±50 (284-355)
2.5±0.7 (2-3)
3 3.7±0.24 (3.6-4.0)
0.03±0.02 (0.004-0.08)
2.1±0.2 (1.8-2.5)
ND 228±30.5 (154-274)
4.7±4.3 (1-18.7)
4 4.3±0.5 (3.8-5.0)
0.03±0.03 (0.001-0.19)
2.7±0.5 (2.3-3.4)
ND 244±38 (112-374)
9.33±18 (0.0-206)
2 3.1±0.38 (2.7-3.8)
0.004±0.10 (0.004-0.1)
9.4±1.6 (6-12)
34±19 (0-70)
257±24 (225-309)
5.6±3.2 (2-14)
5 5.6±0.8 (4.6-7.1)
0.09±0.05 (0.04-0.19)
2.3±0.51 (1.3-3.1)
111±98 (20-340)
244±30 (185-300)
21.6±12.3 (1.5-40)
1Salinity level causing 50% of optimal growth rate of cattail (T. domengensis) in the laboratory (Glenn et al., 1995). 2 US EPA. 2000. Fact sheet. Association between the index of biotic integrity and unionized ammonia in Ohio Rivers and streams: a preliminary analysis. Ohio EPA. 3US EPA. 2001. Ambient water quality criteria recommendations. Lakes and reservoirs in nutrient ecoregion III. EPA 822-B-01-008 4 USGS-National Stream Quality Accounting Network (NASQAN), average values for the Northern International Boundary from 1995-2005. The systematic variation of the proportion of deuterium (δD), the heavier isotope of hydrogen, relative to the proportion of 18O (δ18O), the heavier isotope of oxygen can indicate if brackish water is the result of the evaporation of fresh water or is the result of the mixing of fresh water and seawater. In Fig. 11, the solid blue line from the origin of the graph to the blue triangle in the upper right represents how values of δD and δ18O would vary if fresh Colorado River water mixed with Gulf of California seawater. This is termed the “mixing line”. The dashed red line shows how values of δD and δ18O would vary if fresh Colorado River water evaporated toward the composition of Salton Sea water. This is termed the “evaporation line”. δD and δ18O values from the Cienega de Santa Clara and the Rio Hardy (+ symbols) follow the evaporation line, not the mixing line. Salinity in the Cienega de Santa Clara is controlled by evaporation, not by mixing with seawater. The results of the isotope analyses confirm the interpretations from the observations of water quality at the rim stations: tidal water does not mix with river-derived water in the vegetated portion of the Cienega de Santa Clara.
11

Gulf of California
Figure 11: Variation of δD with δ18O in Colorado River water and Gulf of California water (triangle in upper right). Samples labeled as “Flessa507” are from the Cienega de Santa Clara and Rio Hardy. Microbial analyses We collected samples in September 2006 for microbiological analysis at the inflows and near the dock of the Cienega de Santa Clara – near Ejido Johnson, an area that is frequently used for recreational purposes. Water temperatures were high (Table 4), similar to the summer conditions in CSC. Total coliform bacteria was high at Riito, low at the MODE and lowest in the vegetated zone. This suggests that household and farm waste may drain into the Riito. The low concentrations of total coliform in the MODE may dilute the Riito concentrations, but biological activity in the CSC vegetation is probably very important in further reducing total coliform levels. E. coli concentrations were higher at the MODE inflow than at the Riito inflow. However, at all stations, E. coli concentration was lower than the maximum allowable for public use -- none of these values present a problem for outdoor activities at the Cienega de Santa Clara. Table 4. Microbial analysis of water sampled in September 2006.
Station Water T °C
Total coliform (MPN/100 ml)
Escherichia coli (MPN/100 ml)
Guidelines 2401 7 – Riito inflow 31.2 198,630 5.2 5 – Veg zone 29.9 22,470 13 6 – MODE inflow 30.0 46,110 12.2
1Norma Oficial Mexicana NOM-003-ECOL-1997 establishes maximum allowable limits of contaminants for treated effluents re-used for public use.
12
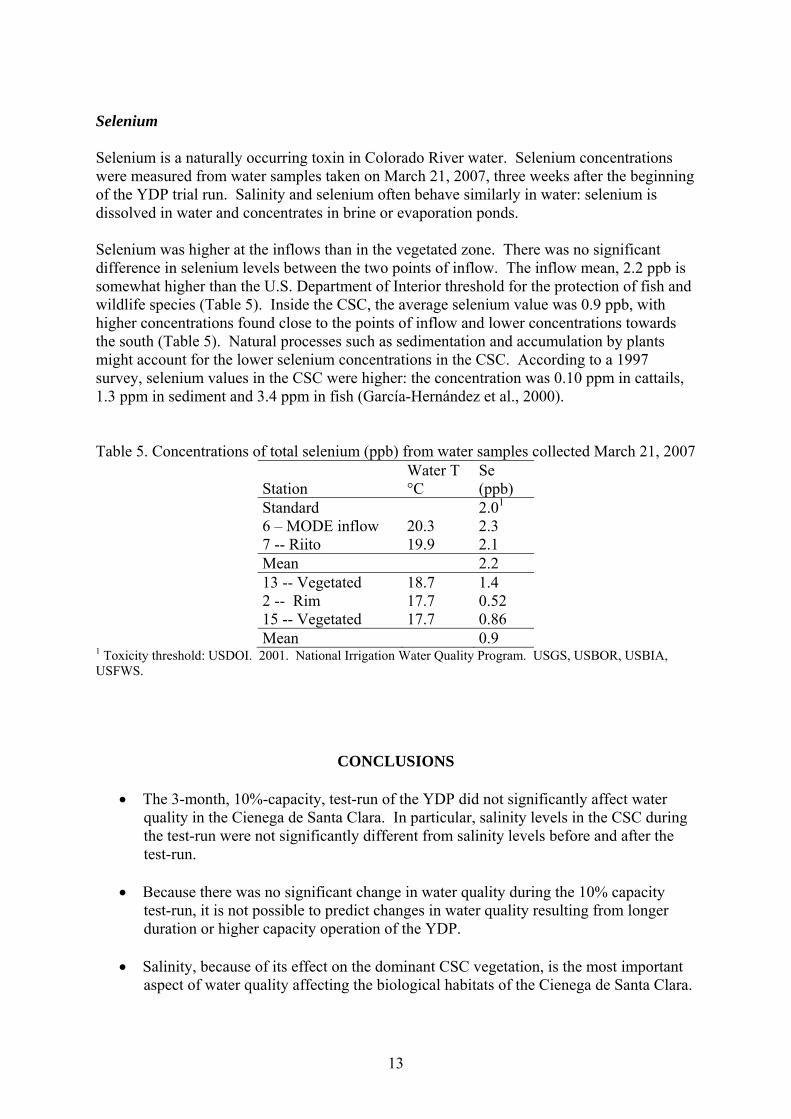
Selenium Selenium is a naturally occurring toxin in Colorado River water. Selenium concentrations were measured from water samples taken on March 21, 2007, three weeks after the beginning of the YDP trial run. Salinity and selenium often behave similarly in water: selenium is dissolved in water and concentrates in brine or evaporation ponds. Selenium was higher at the inflows than in the vegetated zone. There was no significant difference in selenium levels between the two points of inflow. The inflow mean, 2.2 ppb is somewhat higher than the U.S. Department of Interior threshold for the protection of fish and wildlife species (Table 5). Inside the CSC, the average selenium value was 0.9 ppb, with higher concentrations found close to the points of inflow and lower concentrations towards the south (Table 5). Natural processes such as sedimentation and accumulation by plants might account for the lower selenium concentrations in the CSC. According to a 1997 survey, selenium values in the CSC were higher: the concentration was 0.10 ppm in cattails, 1.3 ppm in sediment and 3.4 ppm in fish (García-Hernández et al., 2000). Table 5. Concentrations of total selenium (ppb) from water samples collected March 21, 2007
Station Water T °C
Se (ppb)
Standard 2.01 6 – MODE inflow 20.3 2.3 7 -- Riito 19.9 2.1 Mean 2.2 13 -- Vegetated 18.7 1.4 2 -- Rim 17.7 0.52 15 -- Vegetated 17.7 0.86 Mean 0.9
1 Toxicity threshold: USDOI. 2001. National Irrigation Water Quality Program. USGS, USBOR, USBIA, USFWS.
CONCLUSIONS
• The 3-month, 10%-capacity, test-run of the YDP did not significantly affect water quality in the Cienega de Santa Clara. In particular, salinity levels in the CSC during the test-run were not significantly different from salinity levels before and after the test-run.
• Because there was no significant change in water quality during the 10% capacity
test-run, it is not possible to predict changes in water quality resulting from longer duration or higher capacity operation of the YDP.
• Salinity, because of its effect on the dominant CSC vegetation, is the most important
aspect of water quality affecting the biological habitats of the Cienega de Santa Clara.
13

• Salinity in the vegetated portion of the Cienega de Santa Clara is controlled by the salinity of inflow from the MODE and Riito canals. Tidal exchange does not affect salinity in the vegetated portion of the CSC.
RECOMMENDATIONS
• Continued water quality monitoring is essential because it will establish a baseline of the normal variation in water quality in the Cienega de Santa Clara. It will be particularly important to establish the normal baseline water quality during March-May, the period of the YDP test-run. While water quality, in particular salinity, was not different before and after the test-run, we do not know if water quality during the period of the test-run differed from the same period in previous years.
• Continued monitoring of volume and water quality of the principal inflows is essential
because the Riito and MODE inflows are the dominant controls on CSC water quality.
• Continued, focused monitoring of salinity within the vegetated zone is necessary to permit prediction of how changes in inflow will affect the size of the vegetated zone. The size of the vegetated zone is regulated by salinity and the size of the vegetated zone is critical to the quality of wildlife habitat of the Cienega de Santa Clara.
14

REFERENCES CITED Garcia-Hernandez, J., Glenn E.P., Artiola J., Baumgartner, D. 2000. Bioaccumulation of Selenium (Se) in the Cienega de Santa Clara Wetland, Sonora, Mexico. Ecotoxicology and Environmental Safety 45: 298-304. Glenn, E. P., Thompson, T.L., Frye, R., Riley, J. Baumgartner, D. 1995. Effects of salinity on growth and evapotranspiration of Typha domingensis. Perspectives in Aquatic Botany. 52:75-91. Hinojosa-Huerta, O., DeStefano, S., Shaw W.W. 2004. Waterbird communities and associated wetlands of the Colorado River delta, Mexico. Studies in Avian Biology 27: 52-60. Loebeck, J. 2007. Yuma desalting plant test run to help determine if it can help meet area´s water needs. Yuma Sun, March 20. Norma Oficial Mexicana NOM-003-ECOL-1997 (establishes maximum allowable limits of contaminants for treated effluents re-used for public use.) NASQAN, average water quality values from water samples at the Northern International Boundary from 1995-2005. National Stream Water Quality Network. USGS. US EPA. 2000. Fact sheet. Association between the index of biotic integrity and unionized ammonia in Ohio Rivers and streams: a preliminary analysis. Ohio EPA. US EPA. 2001. Ambient water quality criteria recommendations. Lakes and reservoirs in nutrient ecoregion III. EPA 822-B-01-008 Zamora-Arroyo, F., Pitt, J., Cornelius, S., Glenn, E. Hinojosa-Huerta, O., Moreno M., García, J., Nagler, P., de la Garza, M., and Parra, I., 2005. Conservation Priorities in the Colorado River Delta, Mexico and the United States. Prepared by the Sonoran Institute, Environmental Defense, University of Arizona, Pronatura Noroeste Dirección de Conservación Sonora, Centro de Investigación en Alimentación y Desarrollo, and World Wildlife Fund—Gulf of California Program. 103 pp.
15

APPENDIX
Table 1. Temperature, conductivity (EC), salinity, total dissolved solids (TDS), dissolved oxygen (DO) and pH. Table 2. Nutrients, hardness, turbidity, and phosphates. Table 3. Isotopic analyses of water from Colorado River, Cienega de Santa Clara, Rio Hardy and Gulf of California.
16
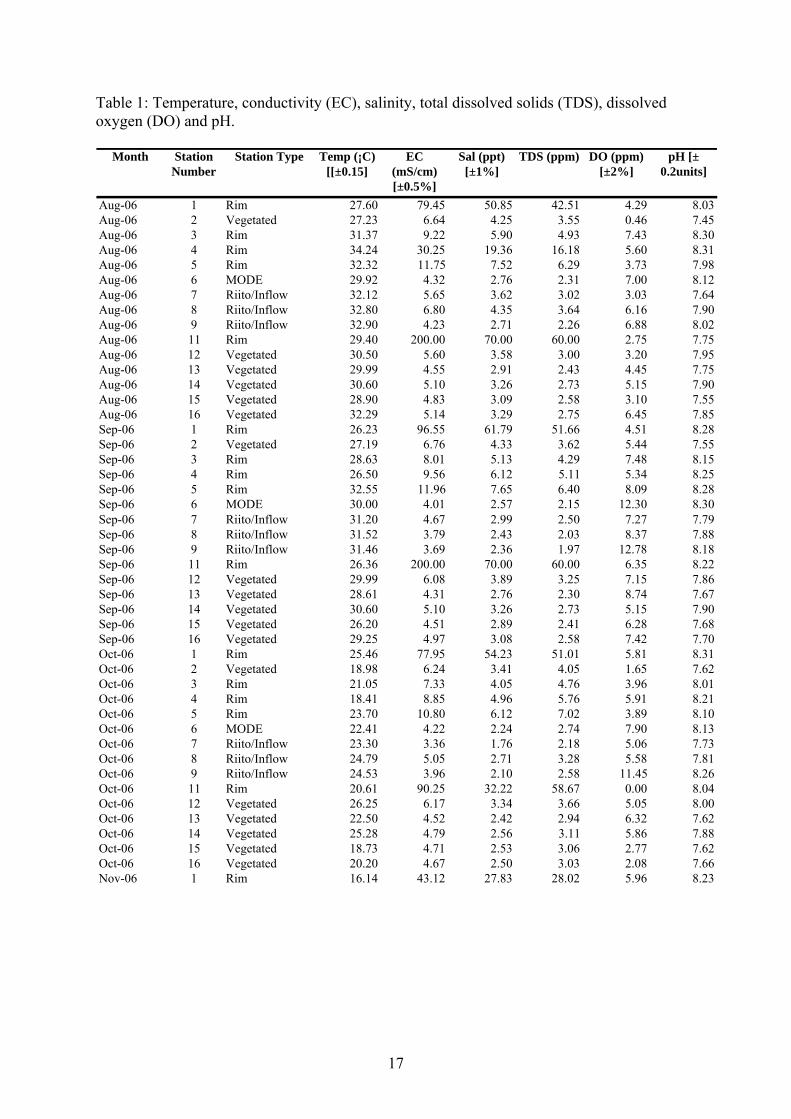
Table 1: Temperature, conductivity (EC), salinity, total dissolved solids (TDS), dissolved oxygen (DO) and pH.
Month Station Number
Station Type Temp (¡C) [[±0.15]
EC (mS/cm) [±0.5%]
Sal (ppt) [±1%]
TDS (ppm) DO (ppm) [±2%]
pH [± 0.2units]
Aug-06 1 Rim 27.60 79.45 50.85 42.51 4.29 8.03Aug-06 2 Vegetated 27.23 6.64 4.25 3.55 0.46 7.45Aug-06 3 Rim 31.37 9.22 5.90 4.93 7.43 8.30Aug-06 4 Rim 34.24 30.25 19.36 16.18 5.60 8.31Aug-06 5 Rim 32.32 11.75 7.52 6.29 3.73 7.98Aug-06 6 MODE 29.92 4.32 2.76 2.31 7.00 8.12Aug-06 7 Riito/Inflow 32.12 5.65 3.62 3.02 3.03 7.64Aug-06 8 Riito/Inflow 32.80 6.80 4.35 3.64 6.16 7.90Aug-06 9 Riito/Inflow 32.90 4.23 2.71 2.26 6.88 8.02Aug-06 11 Rim 29.40 200.00 70.00 60.00 2.75 7.75Aug-06 12 Vegetated 30.50 5.60 3.58 3.00 3.20 7.95Aug-06 13 Vegetated 29.99 4.55 2.91 2.43 4.45 7.75Aug-06 14 Vegetated 30.60 5.10 3.26 2.73 5.15 7.90Aug-06 15 Vegetated 28.90 4.83 3.09 2.58 3.10 7.55Aug-06 16 Vegetated 32.29 5.14 3.29 2.75 6.45 7.85Sep-06 1 Rim 26.23 96.55 61.79 51.66 4.51 8.28Sep-06 2 Vegetated 27.19 6.76 4.33 3.62 5.44 7.55Sep-06 3 Rim 28.63 8.01 5.13 4.29 7.48 8.15Sep-06 4 Rim 26.50 9.56 6.12 5.11 5.34 8.25Sep-06 5 Rim 32.55 11.96 7.65 6.40 8.09 8.28Sep-06 6 MODE 30.00 4.01 2.57 2.15 12.30 8.30Sep-06 7 Riito/Inflow 31.20 4.67 2.99 2.50 7.27 7.79Sep-06 8 Riito/Inflow 31.52 3.79 2.43 2.03 8.37 7.88Sep-06 9 Riito/Inflow 31.46 3.69 2.36 1.97 12.78 8.18Sep-06 11 Rim 26.36 200.00 70.00 60.00 6.35 8.22Sep-06 12 Vegetated 29.99 6.08 3.89 3.25 7.15 7.86Sep-06 13 Vegetated 28.61 4.31 2.76 2.30 8.74 7.67Sep-06 14 Vegetated 30.60 5.10 3.26 2.73 5.15 7.90Sep-06 15 Vegetated 26.20 4.51 2.89 2.41 6.28 7.68Sep-06 16 Vegetated 29.25 4.97 3.08 2.58 7.42 7.70Oct-06 1 Rim 25.46 77.95 54.23 51.01 5.81 8.31Oct-06 2 Vegetated 18.98 6.24 3.41 4.05 1.65 7.62Oct-06 3 Rim 21.05 7.33 4.05 4.76 3.96 8.01Oct-06 4 Rim 18.41 8.85 4.96 5.76 5.91 8.21Oct-06 5 Rim 23.70 10.80 6.12 7.02 3.89 8.10Oct-06 6 MODE 22.41 4.22 2.24 2.74 7.90 8.13Oct-06 7 Riito/Inflow 23.30 3.36 1.76 2.18 5.06 7.73Oct-06 8 Riito/Inflow 24.79 5.05 2.71 3.28 5.58 7.81Oct-06 9 Riito/Inflow 24.53 3.96 2.10 2.58 11.45 8.26Oct-06 11 Rim 20.61 90.25 32.22 58.67 0.00 8.04Oct-06 12 Vegetated 26.25 6.17 3.34 3.66 5.05 8.00Oct-06 13 Vegetated 22.50 4.52 2.42 2.94 6.32 7.62Oct-06 14 Vegetated 25.28 4.79 2.56 3.11 5.86 7.88Oct-06 15 Vegetated 18.73 4.71 2.53 3.06 2.77 7.62Oct-06 16 Vegetated 20.20 4.67 2.50 3.03 2.08 7.66Nov-06 1 Rim 16.14 43.12 27.83 28.02 5.96 8.23
17

Table 1, continued:
Month Station Number
Station Type Temp (¡C) [[±0.15]
EC (mS/cm) [±0.5%]
Sal (ppt) [±1%]
TDS (ppm) DO (ppm) [±2%]
pH [± 0.2units]
Nov-06 2 Vegetated 17.80 5.03 2.74 3.27 2.62 7.53Nov-06 3 Rim 16.51 6.78 3.74 4.41 5.29 7.84Nov-06 4 Rim 13.41 7.03 3.88 4.57 6.48 8.23Nov-06 5 Rim 19.23 10.59 6.02 6.89 6.53 8.20Nov-06 6 MODE 19.86 4.19 2.23 2.72 0.00 8.08Nov-06 7 Riito/Inflow 19.52 5.31 2.87 3.48 6.37 7.79Nov-06 8 Riito/Inflow 20.69 6.31 3.45 4.12 10.50 7.74Nov-06 9 Riito/Inflow 20.56 3.92 2.08 2.55 12.08 8.13Nov-06 12 Vegetated 21.20 5.57 3.02 3.62 8.16 8.09Nov-06 13 Vegetated 20.34 4.34 2.32 2.85 9.47 7.79Nov-06 14 Vegetated 20.86 4.62 2.48 2.99 7.97Nov-06 15 Vegetated 16.28 4.57 2.46 2.72 4.99 7.64Nov-06 16 Vegetated 19.62 4.67 2.51 3.06 5.31 7.76Dec-06 1 Rim 13.54 8.38Dec-06 2 Vegetated 7.41 7.74Dec-06 3 Rim 11.3 8.33Dec-06 4 Rim 13.43 8.48Dec-06 5 Rim 10.89 8.43Dec-06 6 MODE 12.57 8.1Dec-06 7 Riito/Inflow 8.7 8.04Dec-06 8 Riito/Inflow 9.95 8.15Dec-06 9 Riito/Inflow 8.99 8.12Dec-06 12 Vegetated 8.68 8.47Dec-06 13 Vegetated 8.71 8.43Dec-06 14 Vegetated 8.46 8.29Dec-06 15 Vegetated 7.25 8.1Dec-06 16 Vegetated 8.97 7.75Jan-07 1 Rim 11.13 73.12 50.00 47.53 8.24Jan-07 2 Vegetated 7.57 6.93 3.80 4.50 7.88Jan-07 3 Rim 15.59 6.49 3.57 4.22 8.11Jan-07 4 Rim 18.70 7.65 4.25 4.97 8.26Jan-07 5 Rim 11.42 11.64 6.66 7.56 8.45Jan-07 6 MODE 13.39 4.46 2.39 2.90 7.63Jan-07 7 Riito/Inflow 9.55 6.20 3.39 4.03 9.34Jan-07 8 Riito/Inflow 11.73 4.46 2.39 4.81 8.22Jan-07 9 Riito/Inflow 11.83 4.44 2.38 2.89 8.19Jan-07 12 Vegetated 8.88 5.79 3.16 3.77 7.41Jan-07 13 Vegetated 8.50 4.63 2.50 3.02 7.93Jan-07 14 Vegetated 8.77 5.14 2.78 3.33 7.92Jan-07 15 Vegetated 7.85 4.79 2.57 3.11 8.02Jan-07 16 Vegetated 11.79 4.64 2.50 3.02 7.59Mar-07 2 Vegetated 13.89 6.75 3.72 4.35 7.46Mar-07 2 Vegetated 17.70 6.75 3.71 4.38 4.99 7.70Mar-07 5 Rim 16.60 12.14 6.98 7.89 8.09Mar-07 5 Rim 20.07 12.48 7.18 8.10 7.76Mar-07 6 MODE 18.27 5.32 2.88 3.46 8.16
18

Table 1, continued:
Month Station Number
Station Type Temp (¡C) [[±0.15]
EC (mS/cm) [±0.5%]
Sal (ppt) [±1%]
TDS (ppm) DO (ppm) [±2%]
pH [± 0.2units]
Mar-07 6 MODE 20.28 4.85 2.61 3.15 8.02 8.21Mar-07 7 Riito/Inflow 15.38 6.20 3.40 4.03 7.92Mar-07 7 Riito/Inflow 19.90 6.09 3.34 3.97 5.85 7.81Mar-07 8 Riito/Inflow 16.61 6.85 3.78 4.45 7.93Mar-07 8 Riito/Inflow 19.96 6.89 3.80 4.48 4.49 7.94Mar-07 9 Riito/Inflow 17.35 4.72 2.55 3.08 7.93Mar-07 9 Riito/Inflow 20.70 4.70 2.53 3.06 6.80 8.02Mar-07 12 Vegetated 17.06 6.40 3.52 4.14 8.11Mar-07 12 Vegetated 19.02 6.71 3.71 4.39 7.01 8.06Mar-07 13 Vegetated 15.32 5.02 2.72 3.27 7.86Mar-07 13 Vegetated 18.77 5.39 2.94 3.51 6.47 7.94Mar-07 14 Vegetated 16.84 5.57 3.04 3.62 8.13Mar-07 14 Vegetated 18.28 5.91 3.23 3.84 6.60 7.93Mar-07 15 Vegetated 12.90 5.05 2.73 3.18 7.46Mar-07 15 Vegetated 17.70 5.36 2.91 3.48 7.01 7.80Mar-07 16 Vegetated 15.10 5.05 2.73 3.28 7.27Mar-07 16 Vegetated 19.57 5.33 2.89 3.47 6.01 7.80Apr-07 2 Vegetated 20.45 5.43 2.94 3.53 11.06 8.22Apr-07 2 Vegetated 19.54 5.55 3.01 3.61 8.22Apr-07 5 Rim 26.70 9.21 5.16 5.99 7.93 8.60Apr-07 5 Rim 23.21 9.43 5.29 6.13 8.90Apr-07 6 MODE 24.60 3.61 1.90 2.35 10.95 9.03Apr-07 6 MODE 22.86 3.81 2.01 2.48 9.04Apr-07 7 Riito/Inflow 23.92 4.90 2.63 3.18 7.99 8.44Apr-07 7 Riito/Inflow 21.07 5.16 2.78 3.35 8.42Apr-07 8 Riito/Inflow 22.86 4.68 2.50 3.04 4.11 8.63Apr-07 8 Riito/Inflow 21.49 5.84 3.18 3.80 8.02Apr-07 9 Riito/Inflow 23.45 4.08 2.16 2.65 4.12 8.58Apr-07 9 Riito/Inflow 22.26 3.96 2.10 2.58 7.63Apr-07 12 Vegetated 22.41 5.65 3.06 3.67 4.95 8.61Apr-07 12 Vegetated 20.90 5.77 3.13 3.75 8.37Apr-07 13 Vegetated 21.31 4.23 2.26 2.75 3.35 8.39Apr-07 13 Vegetated 19.56 4.34 2.32 2.82 8.57Apr-07 14 Vegetated 21.70 4.84 2.61 3.15 6.59 8.51Apr-07 14 Vegetated 20.07 4.91 2.65 3.19 8.39Apr-07 15 Vegetated 19.03 4.22 2.25 2.74 10.82 8.27Apr-07 15 Vegetated 17.31 4.23 2.26 2.75 8.44Apr-07 16 Vegetated 21.47 4.38 2.34 2.84 4.44 8.49Apr-07 16 Vegetated 21.50 4.39 2.35 2.86 8.37May-07 2 Vegetated 22.80 5.43 2.94 3.55 12.68 8.06May-07 2 Vegetated 23.23 5.53 3.00 3.62 8.27May-07 5 Rim 30.23 9.36 5.20 6.08 8.39 8.53May-07 5 Rim 29.36 9.09 5.05 5.93 9.72 8.61May-07 6 MODE 28.33 4.18 2.20 2.71 5.80 8.72May-07 6 MODE 27.08 4.16 2.20 4.16 7.85 8.86May-07 7 Riito/Inflow 28.19 5.46 2.93 3.55 5.01 7.63
19

Table 1, continued:
Month Station Number
Station Type Temp (¡C) [[±0.15]
EC (mS/cm) [±0.5%]
Sal (ppt) [±1%]
TDS (ppm) DO (ppm) [±2%]
pH [± 0.2units]
May-07 7 Riito/Inflow 27.49 5.42 2.91 3.53 10.50 8.53May-07 8 Riito/Inflow 28.71 6.27 3.41 4.08 3.15 8.33May-07 8 Riito/Inflow 28.53 5.76 3.10 3.74 5.42 7.92May-07 9 Riito/Inflow 29.50 3.88 2.03 2.52 8.41May-07 9 Riito/Inflow 28.37 3.74 1.96 2.43 2.73 8.20May-07 12 Vegetated 26.95 5.90 3.19 3.84 2.75 8.65May-07 12 Vegetated 26.36 6.03 3.27 3.96 10.00 8.62May-07 13 VegetatedMay-07 13 Vegetated 25.47 4.73 2.53 3.08 10.31 8.80May-07 14 Vegetated 25.62 5.15 2.76 3.35 2.92 8.60May-07 14 Vegetated 25.60 5.36 2.89 3.49 8.75 8.61May-07 15 Vegetated 20.73 4.59 2.46 2.98 3.26 7.85May-07 15 Vegetated 21.99 4.68 2.51 3.04 8.33May-07 16 Vegetated 25.56 4.73 2.53 3.08 2.34 7.80May-07 16 Vegetated 25.43 4.90 2.62 3.18 7.78 8.45Jun-07 2 Vegetated 25.97 5.10 2.73 3.29 6.79 8.13Jun-07 5 Rim 29.90 8.85 4.91 5.75 7.71 8.99Jun-07 6 MODE 27.43 3.91 2.06 3.91 3.39 8.81Jun-07 7 Riito/Inflow 29.21 4.85 2.58 3.15 7.45 8.50Jun-07 8 Riito/Inflow 28.91 5.25 2.81 3.41 4.03 8.36Jun-07 9 Riito/Inflow 28.81 3.78 1.98 2.46 6.24 8.55Jun-07 12 Vegetated 30.03 5.87 3.16 3.81 7.21 8.90Jun-07 13 Vegetated 28.79 4.27 2.26 2.78 8.64Jun-07 14 Vegetated 29.06 4.73 2.51 3.07 4.57 8.53Jun-07 15 Vegetated 24.97 4.41 2.35 2.87 4.77 8.25Jun-07 16 Vegetated 29.13 4.57 2.42 2.97 5.44 8.70Jul-07 2 Vegetated 28.07 5.16 2.76 3.62 6.34 8.51Jul-07 5 Rim 31.38 8.40 4.62 5.93 9.08Jul-07 6 MODE 29.95 3.48 2.26 4.16 8.81Jul-07 7 Riito/Inflow 31.50 4.89 2.59 3.53 3.90 8.40Jul-07 8 Riito/Inflow 32.56 5.93 3.18 3.74 2.70 8.51Jul-07 9 Riito/Inflow 31.43 3.74 1.94 2.43 1.71 8.37Jul-07 12 Vegetated 32.97 5.68 3.04 3.96 2.54 9.04Jul-07 13 Vegetated 31.78 4.28 2.25 3.08 2.35 8.91Jul-07 14 Vegetated 32.63 4.43 2.33 3.49 8.86 8.79Jul-07 15 Vegetated 27.54 4.33 2.30 3.04 2.32 8.38Jul-07 16 Vegetated 29.40 4.59 2.44 3.18 1.33 8.55Aug-07 2 Vegetated 29.81 5.47 2.93 3.53 8.95Aug-07 5 Rim 32.53 8.45 4.65 5.93 9.33Aug-07 6 MODE 30.76 3.81 1.99 4.16 8.94Aug-07 7 Riito/Inflow 32.26 4.70 2.48 3.53 8.78Aug-07 8 Riito/Inflow 31.48 5.11 2.72 3.74 8.79Aug-07 9 Riito/Inflow 31.63 3.50 1.82 2.43 8.87Aug-07 12 Vegetated 31.88 5.30 2.82 3.44 8.53Aug-07 13 Vegetated 31.11 4.19 2.20 2.72 8.76Aug-07 14 Vegetated 31.17 4.27 2.25 2.77 8.58 Table 1, continued:
20

Month Station Number
Station Type Temp (¡C) [[±0.15]
EC (mS/cm) [±0.5%]
Sal (ppt) [±1%]
TDS (ppm) DO (ppm) [±2%]
pH [± 0.2units]
Aug-07 15 Vegetated 28.55 4.30 2.28 2.80 8.74Aug-07 16 Vegetated 31.67 4.60 2.43 2.99 8.85Sep-07 2 Vegetated 20.40 5.53 3.05 2.55 2.16 7.51Sep-07 5 Rim 23.83 8.99 5.00 4.18 4.50 8.38Sep-07 6 MODE 23.60 3.70 1.93 1.61 5.25 8.17Sep-07 7 Riito/Inflow 23.32 5.51 2.97 2.48 3.71 7.80Sep-07 8 Riito/Inflow 22.81 6.65 3.62 3.03 2.97 7.81Sep-07 9 Riito/Inflow 24.00 4.39 2.29 1.91 3.94 7.84Sep-07 12 Vegetated 23.47 6.02 3.25 2.72 1.96 7.69Sep-07 13 Vegetated 21.70 4.22 2.24 1.87 3.72 7.87Sep-07 14 Vegetated 22.40 4.43 2.35 1.96 2.02 7.65Sep-07 15 Vegetated 20.16 4.36 2.30 1.92 3.58 7.65Sep-07 16 Vegetated 22.30 4.48 2.37 1.98 3.59 7.74
21

Table 2: Nutrients, hardness, turbidity, and phosphates.
MonthStation
Number Station TypeNitrates (ppm)
Ammonia-nitrogen (ppm)
Unionized ammonia
Hardness (ppm)
Turbidity (FTU)
Phosphates (ppb)
Sep-06 8 Riito/Inflow 10 0.2162 0.009 250 3.00Sep-06 9 Riito/Inflow 42 0.2318 0.019 374 1.00Oct-06 8 Riito/Inflow 48 0.4025 0.014 279 5.00Oct-06 9 Riito/Inflow 12 0.335 0.027 260 3.50Nov-06 8 Riito/Inflow 10 0.38 0.007 193 6.00Nov-06 9 Riito/Inflow 28.75 0.3925 0.019 204 5.00Dec-06 8 Riito/Inflow 13 0.41 0.009 318 8.00Dec-06 9 Riito/Inflow 47.5 0.41 0.009 279 6.00Jan-07 8 Riito/Inflow 11 0.73 0.021 250 8.25Jan-07 9 Riito/Inflow 21 0.705 0.020 242 8.00Mar-07 8 Riito/Inflow 12 0.65 0.014 244 7.60 30Mar-07 8 Riito/Inflow 12 0.63 0.013 248 12.00 20Mar-07 9 Riito/Inflow 34.3 0.75 0.023 235 7.00 30Mar-07 9 Riito/Inflow 50.3 0.64 0.020 248 8.60 0Apr-07 8 Riito/Inflow 11 0.7 0.078 227 4.00 40Apr-07 8 Riito/Inflow 9.6 1.01 0.039 248 5.00 30Apr-07 9 Riito/Inflow 51.6 0.76 0.085 271 6.00 10Apr-07 9 Riito/Inflow 46 1.06 0.017 263 9.60 10May-07 8 Riito/Inflow 8 0.8 0.080 234 7.60 40May-07 8 Riito/Inflow 10 0.53 0.022 214 1.00 20May-07 9 Riito/Inflow 14 0.74 0.091 241 9.30 80May-07 9 Riito/Inflow 12 0.48 0.039 232 9.00 40Jun-07 8 Riito/Inflow 9 0.52 0.052 227 3.00 0Jun-07 9 Riito/Inflow 12 0.5 0.075 241 8.30 50Jul-07 8 Riito/Inflow 9 0.59 0.088 211 0.00 40Jul-07 9 Riito/Inflow 12 0.43 0.064 242 1.00 90Aug-07 8 Riito/Inflow 11 0.63 0.094 213 1.00 70Aug-07 9 Riito/Inflow 13 0.72 0.108 221 4.00 20Sep-07 8 Riito/Inflow 13 0.68 0.017 203 7.00 100Sep-07 9 Riito/Inflow 13 0.87 0.021 219 10.00 50Sep-06 6 MODE 44 0.232 0.023 268 2.50Oct-06 6 MODE 22.75 0.28 0.013 252 9.25Nov-06 6 MODE 41 0.32 0.012 308 13.00Dec-06 6 MODE 43.25 0.5625 0.013 212 8.75Jan-07 6 MODE 12 0.4125 0.003 240 18.25Mar-07 6 MODE 35.6 0.65 0.039 260 3.60 30Mar-07 6 MODE 30.6 0.76 0.045 257 5.30 60Apr-07 6 MODE 33 0.6 0.067 260 3.60 10Apr-07 6 MODE 41 1.1 0.123 243 3.30 40May-07 6 MODE 11 0.53 0.079 232 7.00 20May-07 6 MODE 10 0.39 0.058 229 3.60 50Jun-07 6 MODE 12 0.21 0.031 243 7.60 50Jul-07 6 MODE 10 0.52 0.078 205 4.00 50Aug-07 6 MODE 13 0.59 0.088 170 2.00 40Sep-07 6 MODE 11 0.84 0.040 254 4.00 20Sep-06 7 Riito 9 0.3847 0.013 181 2.00
22
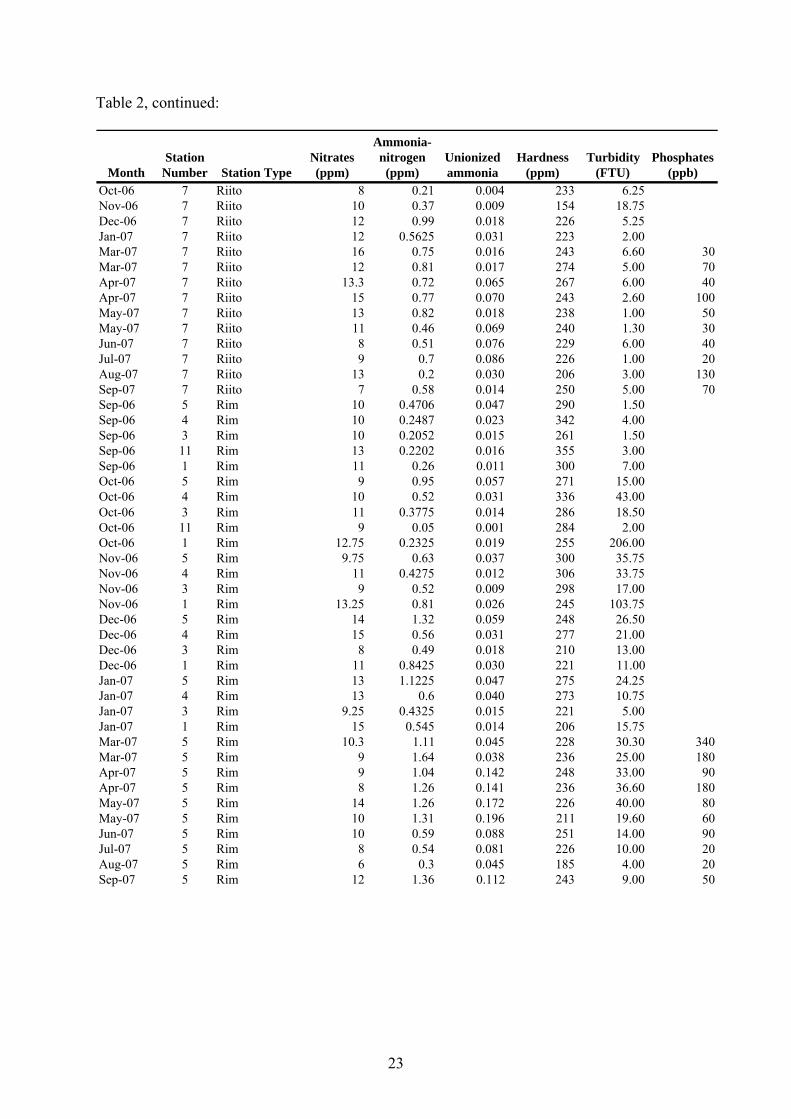
Table 2, continued:
MonthStation
Number Station TypeNitrates (ppm)
Ammonia-nitrogen (ppm)
Unionized ammonia
Hardness (ppm)
Turbidity (FTU)
Phosphates (ppb)
Oct-06 7 Riito 8 0.21 0.004 233 6.25Nov-06 7 Riito 10 0.37 0.009 154 18.75Dec-06 7 Riito 12 0.99 0.018 226 5.25Jan-07 7 Riito 12 0.5625 0.031 223 2.00Mar-07 7 Riito 16 0.75 0.016 243 6.60 30Mar-07 7 Riito 12 0.81 0.017 274 5.00 70Apr-07 7 Riito 13.3 0.72 0.065 267 6.00 40Apr-07 7 Riito 15 0.77 0.070 243 2.60 100May-07 7 Riito 13 0.82 0.018 238 1.00 50May-07 7 Riito 11 0.46 0.069 240 1.30 30Jun-07 7 Riito 8 0.51 0.076 229 6.00 40Jul-07 7 Riito 9 0.7 0.086 226 1.00 20Aug-07 7 Riito 13 0.2 0.030 206 3.00 130Sep-07 7 Riito 7 0.58 0.014 250 5.00 70Sep-06 5 Rim 10 0.4706 0.047 290 1.50Sep-06 4 Rim 10 0.2487 0.023 342 4.00Sep-06 3 Rim 10 0.2052 0.015 261 1.50Sep-06 11 Rim 13 0.2202 0.016 355 3.00Sep-06 1 Rim 11 0.26 0.011 300 7.00Oct-06 5 Rim 9 0.95 0.057 271 15.00Oct-06 4 Rim 10 0.52 0.031 336 43.00Oct-06 3 Rim 11 0.3775 0.014 286 18.50Oct-06 11 Rim 9 0.05 0.001 284 2.00Oct-06 1 Rim 12.75 0.2325 0.019 255 206.00Nov-06 5 Rim 9.75 0.63 0.037 300 35.75Nov-06 4 Rim 11 0.4275 0.012 306 33.75Nov-06 3 Rim 9 0.52 0.009 298 17.00Nov-06 1 Rim 13.25 0.81 0.026 245 103.75Dec-06 5 Rim 14 1.32 0.059 248 26.50Dec-06 4 Rim 15 0.56 0.031 277 21.00Dec-06 3 Rim 8 0.49 0.018 210 13.00Dec-06 1 Rim 11 0.8425 0.030 221 11.00Jan-07 5 Rim 13 1.1225 0.047 275 24.25Jan-07 4 Rim 13 0.6 0.040 273 10.75Jan-07 3 Rim 9.25 0.4325 0.015 221 5.00Jan-07 1 Rim 15 0.545 0.014 206 15.75Mar-07 5 Rim 10.3 1.11 0.045 228 30.30 340Mar-07 5 Rim 9 1.64 0.038 236 25.00 180Apr-07 5 Rim 9 1.04 0.142 248 33.00 90Apr-07 5 Rim 8 1.26 0.141 236 36.60 180May-07 5 Rim 14 1.26 0.172 226 40.00 80May-07 5 Rim 10 1.31 0.196 211 19.60 60Jun-07 5 Rim 10 0.59 0.088 251 14.00 90Jul-07 5 Rim 8 0.54 0.081 226 10.00 20Aug-07 5 Rim 6 0.3 0.045 185 4.00 20Sep-07 5 Rim 12 1.36 0.112 243 9.00 50
23

Table 2, continued:
MonthStation
Number Station TypeNitrates (ppm)
Ammonia-nitrogen (ppm)
Unionized ammonia
Hardness (ppm)
Turbidity (FTU)
Phosphates (ppb)
Sep-06 13 Veg 10 0.1974 0.005 259 1.00Sep-06 14 Veg 11 0.313 0.013 301 2.00Sep-06 2 Veg 10 0.2358 0.005 292 2.00Sep-06 15 Veg 9 0.0572 0.002 338 6.00Sep-06 16 Veg 9 0.2156 0.006 316 4.00Sep-06 12 Veg 9 0.2644 0.011 331 1.00Oct-06 13 Veg 15 0.29 0.005 267 3.25Oct-06 14 Veg 12.5 0.3 0.013 273 9.75Oct-06 2 Veg 9 0.3 0.005 282 5.00Oct-06 15 Veg 9 0.2325 0.004 287 2.00Oct-06 16 Veg 8.75 0.23 0.004 287 3.50Oct-06 12 Veg 11 0.38 0.015 308 6.00Nov-06 13 Veg 12.5 0.36 0.009 251 6.00Nov-06 14 Veg 18 0.37 0.014 251 6.75Nov-06 2 Veg 8 0.47 0.006 248 4.25Nov-06 15 Veg 14 0.4275 0.005 258 3.00Nov-06 16 Veg 11 0.4925 0.011 248 5.75Nov-06 12 Veg 12 0.4175 0.016 259 4.00Dec-06 13 Veg 23 0.5525 0.025 235 4.50Dec-06 14 Veg 27.5 0.63 0.023 275 3.50Dec-06 2 Veg 12 0.52 0.005 228 3.75Dec-06 15 Veg 13 0.4075 0.009 233 4.00Dec-06 16 Veg 15 0.745 0.009 227 2.25Dec-06 12 Veg 15 1.14 0.063 228 5.75Jan-07 13 Veg 18 0.59 0.009 186 2.50Jan-07 14 Veg 19.75 0.48 0.012 251 6.00Jan-07 2 Veg 8 0.6125 0.009 253 3.00Jan-07 15 Veg 17 0.415 0.008 246 2.00Jan-07 16 Veg 19.5 0.515 0.004 262 2.00Jan-07 12 Veg 12 0.72 0.005 197 3.75Mar-07 13 Veg 55.6 0.49 0.010 231 3.00 20Mar-07 13 Veg 11 0.74 0.015 266 10.00 10Mar-07 14 Veg 23.3 0.65 0.022 239 8.00 30Mar-07 14 Veg 10 0.97 0.033 235 13.30 0Mar-07 2 Veg 10 0.63 0.004 309 4.00 30Mar-07 2 Veg 9 1.12 0.022 251 6.00 20Mar-07 15 Veg 16 0.76 0.004 242 5.00 10Mar-07 15 Veg 11 0.5 0.012 247 3.00 0Mar-07 16 Veg 13 0.79 0.004 266 3.00 10Mar-07 16 Veg 10 0.6 0.015 241 9.00 30Mar-07 12 Veg 11 0.65 0.026 213 2.30 40Mar-07 12 Veg 9 1.19 0.047 225 6.60 30Apr-07 13 Veg 11 0.62 0.051 262 11.00 30Apr-07 13 Veg 15 0.87 0.097 242 12.00 10Apr-07 14 Veg 12 0.73 0.082 250 10.30 20Apr-07 14 Veg 12 0.92 0.079 254 12.60 40
24
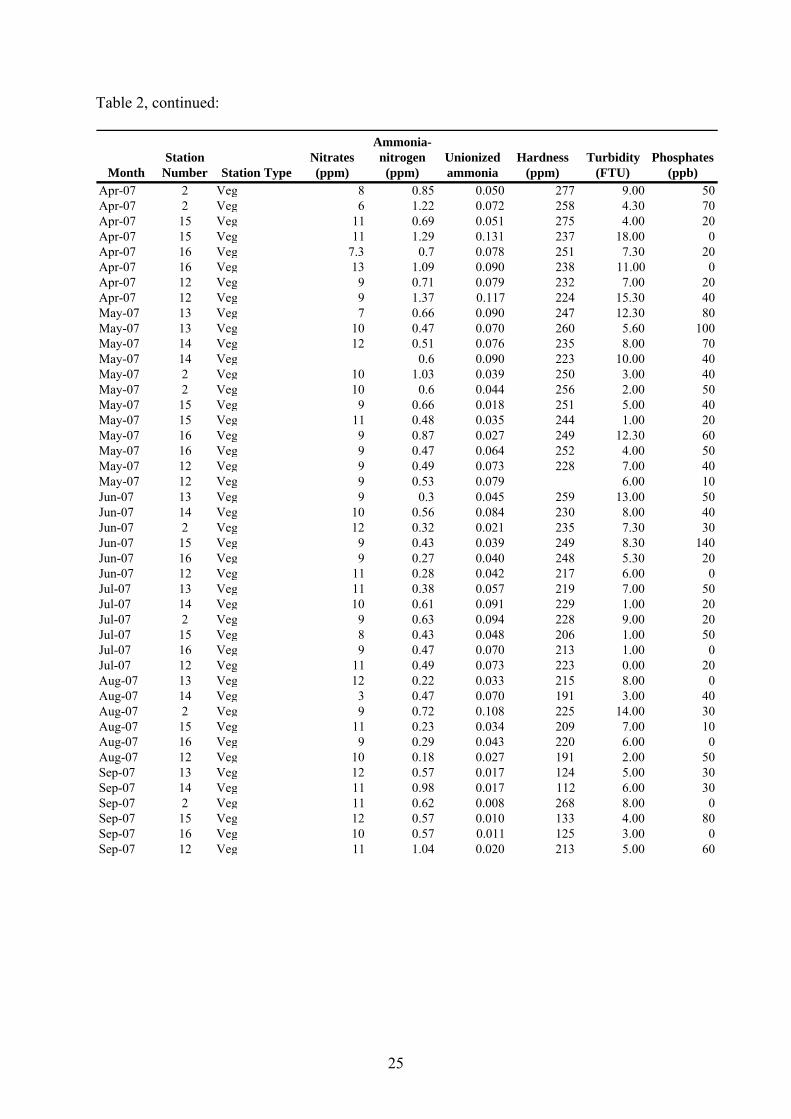
Table 2, continued:
MonthStation
Number Station TypeNitrates (ppm)
Ammonia-nitrogen (ppm)
Unionized ammonia
Hardness (ppm)
Turbidity (FTU)
Phosphates (ppb)
Apr-07 2 Veg 8 0.85 0.050 277 9.00 50Apr-07 2 Veg 6 1.22 0.072 258 4.30 70Apr-07 15 Veg 11 0.69 0.051 275 4.00 20Apr-07 15 Veg 11 1.29 0.131 237 18.00 0Apr-07 16 Veg 7.3 0.7 0.078 251 7.30 20Apr-07 16 Veg 13 1.09 0.090 238 11.00 0Apr-07 12 Veg 9 0.71 0.079 232 7.00 20Apr-07 12 Veg 9 1.37 0.117 224 15.30 40May-07 13 Veg 7 0.66 0.090 247 12.30 80May-07 13 Veg 10 0.47 0.070 260 5.60 100May-07 14 Veg 12 0.51 0.076 235 8.00 70May-07 14 Veg 0.6 0.090 223 10.00 40May-07 2 Veg 10 1.03 0.039 250 3.00 40May-07 2 Veg 10 0.6 0.044 256 2.00 50May-07 15 Veg 9 0.66 0.018 251 5.00 40May-07 15 Veg 11 0.48 0.035 244 1.00 20May-07 16 Veg 9 0.87 0.027 249 12.30 60May-07 16 Veg 9 0.47 0.064 252 4.00 50May-07 12 Veg 9 0.49 0.073 228 7.00 40May-07 12 Veg 9 0.53 0.079 6.00 10Jun-07 13 Veg 9 0.3 0.045 259 13.00 50Jun-07 14 Veg 10 0.56 0.084 230 8.00 40Jun-07 2 Veg 12 0.32 0.021 235 7.30 30Jun-07 15 Veg 9 0.43 0.039 249 8.30 140Jun-07 16 Veg 9 0.27 0.040 248 5.30 20Jun-07 12 Veg 11 0.28 0.042 217 6.00 0Jul-07 13 Veg 11 0.38 0.057 219 7.00 50Jul-07 14 Veg 10 0.61 0.091 229 1.00 20Jul-07 2 Veg 9 0.63 0.094 228 9.00 20Jul-07 15 Veg 8 0.43 0.048 206 1.00 50Jul-07 16 Veg 9 0.47 0.070 213 1.00 0Jul-07 12 Veg 11 0.49 0.073 223 0.00 20Aug-07 13 Veg 12 0.22 0.033 215 8.00 0Aug-07 14 Veg 3 0.47 0.070 191 3.00 40Aug-07 2 Veg 9 0.72 0.108 225 14.00 30Aug-07 15 Veg 11 0.23 0.034 209 7.00 10Aug-07 16 Veg 9 0.29 0.043 220 6.00 0Aug-07 12 Veg 10 0.18 0.027 191 2.00 50Sep-07 13 Veg 12 0.57 0.017 124 5.00 30Sep-07 14 Veg 11 0.98 0.017 112 6.00 30Sep-07 2 Veg 11 0.62 0.008 268 8.00 0Sep-07 15 Veg 12 0.57 0.010 133 4.00 80Sep-07 16 Veg 10 0.57 0.011 125 3.00 0Sep-07 12 Veg 11 1.04 0.020 213 5.00 60
25

33892 Colorado River Mitry Lake/Betty s Kitchen 4/25/2007 32 deg 49 155 min 114 deg 29 122 min 4
Table 3. Isotopic analyses of water from Colorado River, Cienega de Santa Clara, Rio Hardy and Gulf of California
Lab# Site Additional descriptor Date Latitude Longitude δ18O ‰ δD ‰33881 Colorado River Imperial dam 4/25/2007 32 deg 52.970 min 114 deg 27.567 min -11.3 -9133882 Colorado River Yuma Bridge 4/24/2007 32 deg 43.707 min 114 deg 36.915 min -11.2 -9033883 MODE Paso de inundado 4/23/2007 32 deg 03.886 min 114 deg 54.329 min -4.4 -5933884 Cienega de Santa Clara Laguna Sur/El Flor 4/23/2007 32 deg 00.773 min 114 deg 51.342 min -9.6 -8333885 Cienega de Santa Clara Mojonera II 4/23/2007 32 deg 01.340 min 114 deg 53.640 min -7.2 -7033886 Gulf of California Santa Isabel Channel 4/24/2007 31 deg 47.582 min 114 deg 41.347 min 1.3 233887 El Doctor wetland Artesian well 4/25/2007 31 deg 51.170 min 114 deg 38.304 min -6.9 -6533888 El Doctor wetland North of shrimp farm 4/25/2007 31 deg 49.017 min 114 deg 36.399 min -3.9 -4833889 Gulf of California Pelican Island Southeast 4/24/2007 31 deg 45.068 min 114 deg 35.829 min 0.8 133890 MODE 4/23/2007 32 deg 03.859 min 114 deg 54.280 min -10.4 -8633891 Cienega de Santa Clara El Troque 4/23/2007 -9.6 -8233892 Colorado River Mitry Lake/Betty 's Kitchen 4/25/2007 32 deg 49 155 min . 114 deg 29 122 min -8 4 -77 . -8. -7733893 Santa Clara Drain 4/23/2007 32 deg 06.323 min 114 deg 56.930 min -10.3 -8433894 Cienega de Santa Clara Laguna Norte/El Flor 4/23/2007 32 deg 01.531 min 114 deg 52.360 min -10.0 -8433895 Cienega de Santa Clara Entrada El Bocanito 4/23/2007 32 deg 01.840 min 114 deg 53.640 min -8.7 -7833896 Riito Drain Norte 4/23/2007 32 deg 06.339 min 114 deg 56.921 min -10.0 -8333941 Rio Hardy Above El Tapon 5/2/2007 -7.5 -7633942 Rio Hardy Below El Tapon IV max 5/2/2007 32 deg 02.008 min 115 deg 07.601 min -7.0 -7033943 Rio Hardy Below El Tapon III At CR. 5/2/2007 32 deg 02.228 min 115 deg 38.269 min -9.0 -8133944 Rio Hardy Below El Tapon 5/2/2007 32 deg 03.127 min 115 deg 11.162 min -1.5 -4733945 Rio Hardy Below El Tapon II 5/2/2007 32 deg 02.711 min 115 deg 09.515 min -8.0 -7433946 Rio Hardy Below El Tapon V 5/2/2007 32 deg 01.741 min 115 deg 07.610 min -7.1 -72
Analytical Precision, 1-sigma 0.08 0.9