Embed Size (px)
DESCRIPTION
Water Quality Monitoring on Larkin Creek St. Francis County, AR. JL Bouldin RA Warby Arkansas State University. Background. Larkin Creek is a tributary of the L’Anguille River dominated by row crop agriculture. - PowerPoint PPT Presentation
Citation preview

Water Quality Monitoring on Larkin Creek
St. Francis County, AR
JL Bouldin
RA Warby
Arkansas State University

Background
• Larkin Creek is a tributary of the L’Anguille River – dominated by row crop agriculture.
• L’Anguille River is a tributary of the St. Francis River in eastern Arkansas in the Delta ecoregion
• ADEQ authorized the St. Francis County Conservation District to implement BMPs to reduce pollutant loading to L’Anguille

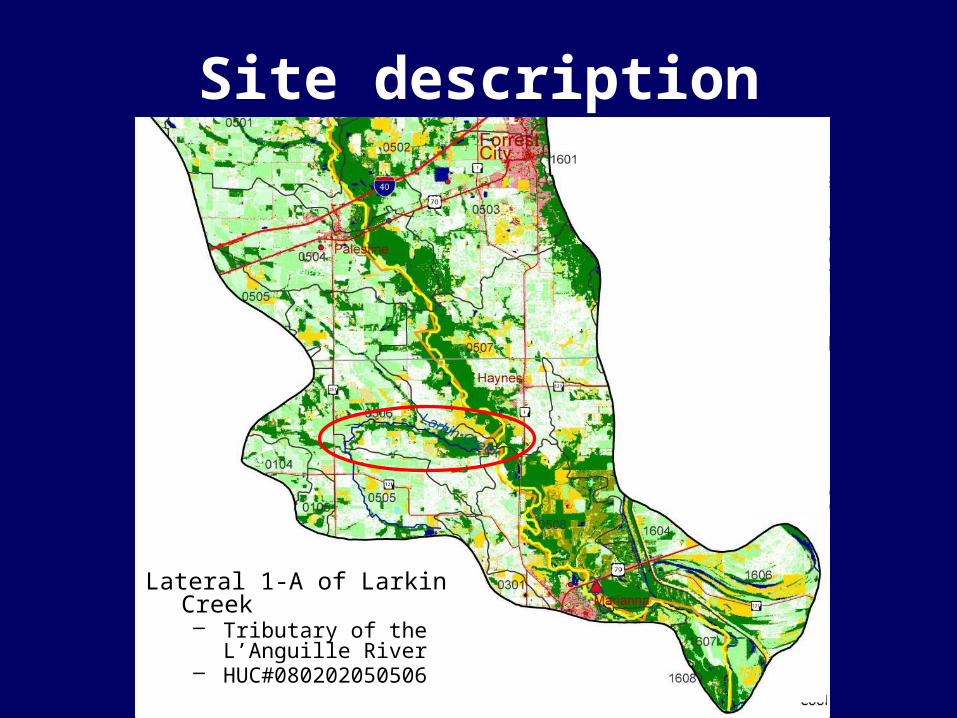
Site description
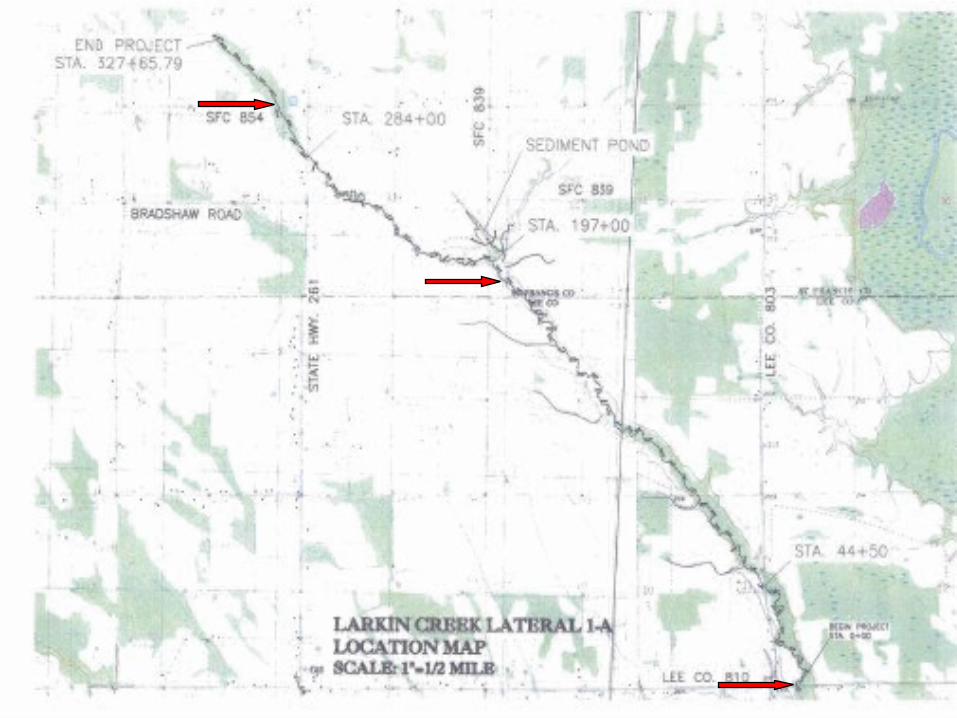
Lateral 1-A of Larkin Creek– Tributary of the
L’Anguille River– HUC#080202050506
St. Francis County

Site description
St. Francis County
Site description
Lateral 1-A of Larkin Creek– Tributary of the
L’Anguille River– HUC#080202050506
BMPs
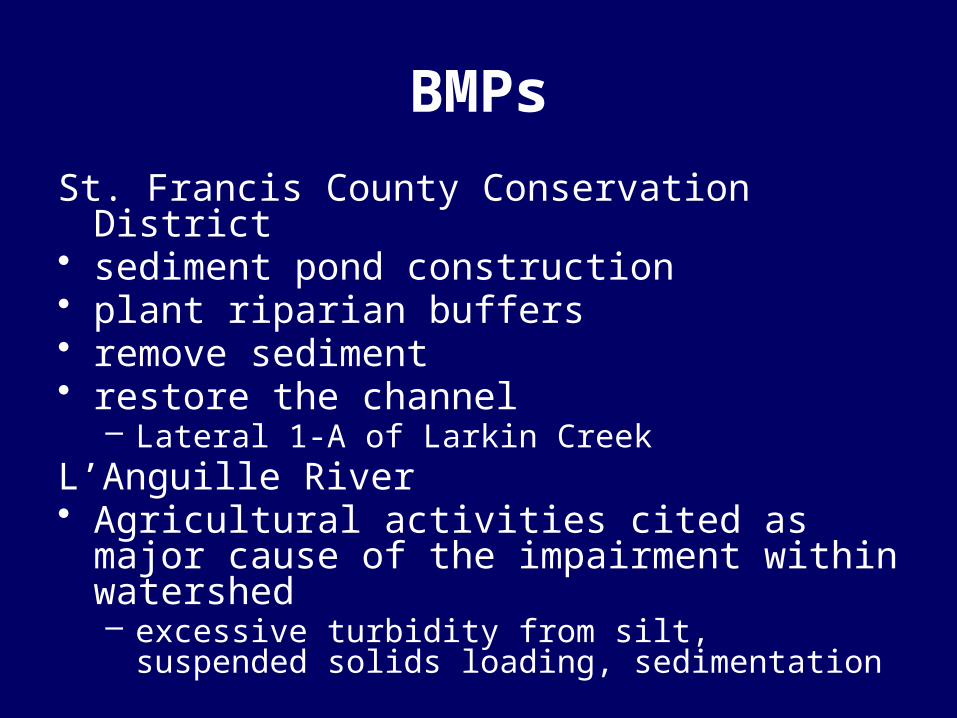
St. Francis County Conservation District • sediment pond construction• plant riparian buffers• remove sediment• restore the channel
– Lateral 1-A of Larkin CreekL’Anguille River• Agricultural activities cited as major cause of the
impairment within watershed– excessive turbidity from silt, suspended solids
loading, sedimentation

Objectives
• Determine baseline data prior to BMP implementation
• Weekly grab samples• Total Suspended Solids• pH• Dissolved Oxygen• Nutrients
– Nitrate, Nitrite, Orthophosphate


Upper Larkin Creek site
Upstream Downstream
TSS
0
5
10
15
20
25
30
35
6/9/10
6/16/10
6/23/10
6/30/10
7/7/10
7/14/10
7/21/10
7/28/10
8/4/10
8/11/10
8/18/10
8/25/10
9/1/10
9/8/10
9/15/10
mg/
L
pH
6.70
6.80
6.90
7.00
7.10
7.20
7.30
6/9/10
6/16/10
6/23/10
6/30/10
7/7/10
7/14/10
7/21/10
7/28/10
8/4/10
8/11/10
8/18/10
8/25/10
9/1/10
9/8/10
9/15/10
DO
0.0
2.0
4.0
6.0
8.0
10.0
12.0
14.0
6/9/10
6/16/10
6/23/10
6/30/10
7/7/10
7/14/10
7/21/10
7/28/10
8/4/10
8/11/10
8/18/10
8/25/10
9/1/10
9/8/10
9/15/10
mg/
L

Middle Larkin Creek site
Upstream Downstream
TSS
0
100
200
300
400
500
600m
g/L
pH
6.606.807.007.207.407.607.808.008.208.40
DO
0.0
5.0
10.0
15.0
20.0
25.0
mg/
L

Lower Larkin Creek site
Upstream Downstream
TSS
0
2
4
6
8
10
12
14
mg/
L
pH
0.001.002.003.004.005.006.007.008.009.00
6/9/10
6/16/10
6/23/10
6/30/10
7/7/10
7/14/10
7/21/10
7/28/10
8/4/10
8/11/10
8/18/10
8/25/10
9/1/10
9/8/10
9/15/10
DO
0.02.04.06.08.0
10.012.014.016.018.0
6/9/10
6/16/10
6/23/10
6/30/10
7/7/10
7/14/10
7/21/10
7/28/10
8/4/10
8/11/10
8/18/10
8/25/10
9/1/10
9/8/10
9/15/10
mg/
L
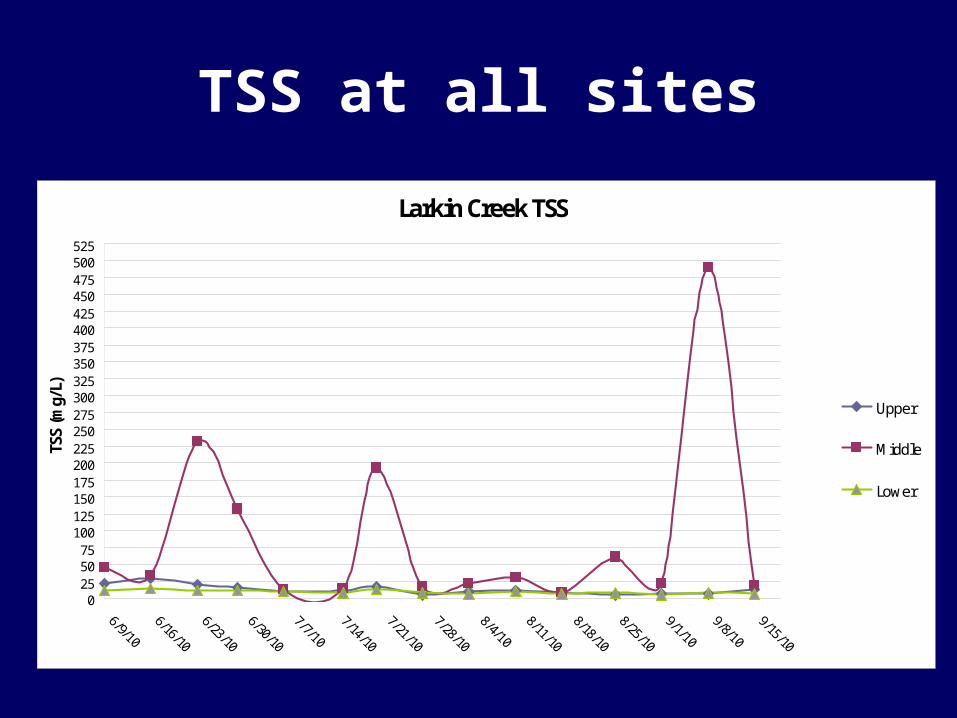
TSS at all sites
Larkin Creek TSS
0255075
100125150175200225250275300325350375400425450475500525
6/9/10
6/16/10
6/23/10
6/30/10
7/7/10
7/14/10
7/21/10
7/28/10
8/4/10
8/11/10
8/18/10
8/25/10
9/1/10
9/8/10
9/15/10
TSS
(mg/
L)
Upper
Middle
Lower
Preliminary results
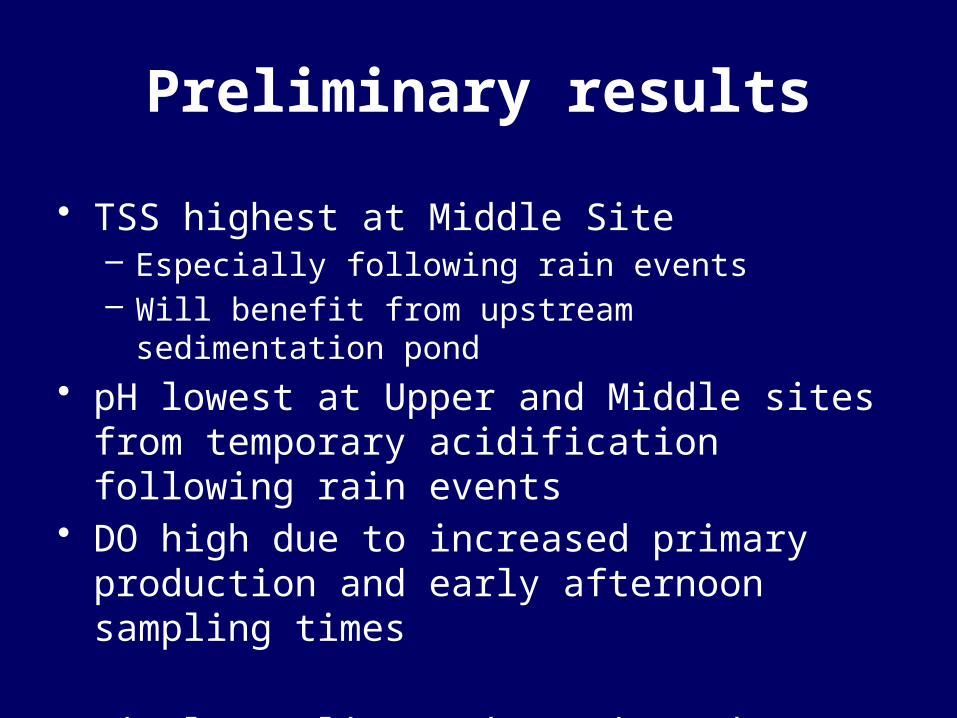
• TSS highest at Middle Site– Especially following rain events– Will benefit from upstream sedimentation pond
• pH lowest at Upper and Middle sites from temporary acidification following rain events
• DO high due to increased primary production and early afternoon sampling times
• Final sampling and nutrient data pending

Questions?
Upper Larkin Creek Lower Larkin CreekMiddle Larkin Creek