Embed Size (px)
Citation preview

457
SNA RESEARCH CONFERENCE - VOL. 48 - 2003
Water Quality & Management
Samuel O. DennisSection Editor and Moderator
458 Water Quality & Management Section
SNA RESEARCH CONFERENCE - VOL. 48 - 2003 SNA RESEARCH CONFERENCE - VOL. 48 - 2003
Sources of Water and Acreage in Irrigation for Nursery Plants, Turfgrass Sod, Sprigs or Plugs and Other Horticultural Crops:
Data for Thirteen Southern States
Enefiok Ekanem, Safdar Muhammad, Fisseha Tegegne, and Surendra SinghCooperative Agricultural Research Program
Tennessee State University, Nashville, Tennessee 37209
Index Words: Water, Acres in Crop Irrigation, Nursery Plants, Turfgrass Sod, Sprigs, Plugs, Horticultural Specialties, and Southern States Nature of Work: Water is critically important in sustaining life on earth, and more so for the agricultural sector which is the largest user of water in the United States (Noel, Quinby, and Aillery, 2002). Water is indispensable for plant production, human consumption, and almost all key industrial processes. A report examining issues of challenges of water scarcity acknowledged the importance of this resource and noted that, “…When supplies of water have dwindled or access to fresh water declines, environmental degradation, social and political instability, and economic well-being can all be adversely affected” (PECC, 2001: 6). In the United States, surface water from rivers, streams, and lakes supplied water for 22 million irrigated acres in 1998. On-farm surface water source supplied water for almost 7 million acres, being the sole source of supply for 4.2 million of these acres. Off-farm water supplies provided water for all of over 10 million acres and part of the needs of 4.8 million acres. About 95% of the water supplied by off-farm water supplies came from surface water sources (Noel, Quinby, and Aillery, 2002). Using data from the 1998 US Census of Horticultural Specialties, this paper summarizes information on the sources of water and area irrigated in horticultural production in thirteen southern states.
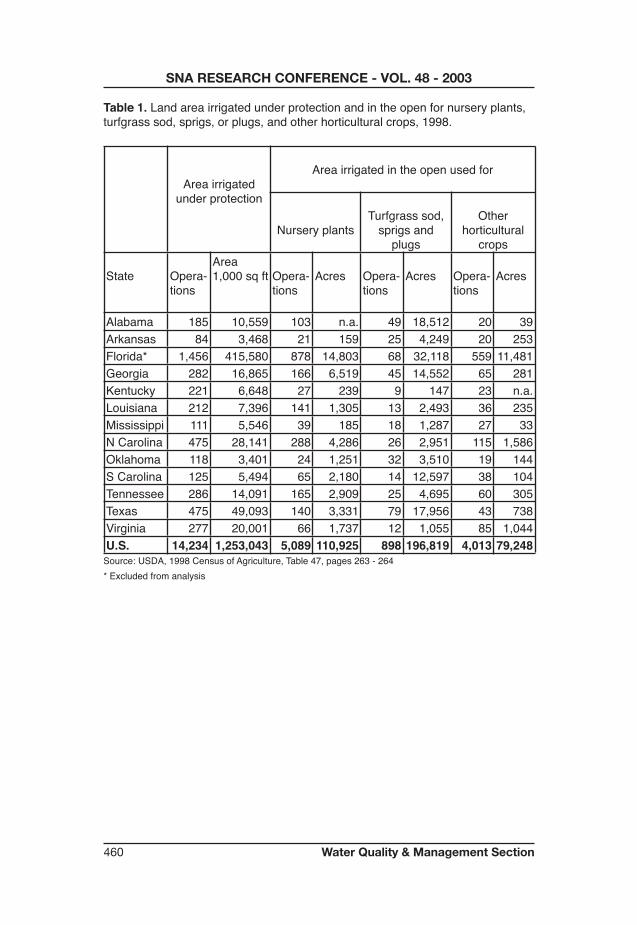
Results and Discussion: According to the Census of Horticultural Specialties, there were 14,234 operations (1.253 billion square feet), under protection that were irrigated in 1998. In the open, there were 5,089 nursery plant operations covering 110,925 acres that were irrigated. A total of 898 acres used for turfgrass sod, sprig, or plug were irrigated in the open compared to 4,013 operations (79,248 acres) devoted to other horticultural crops (Table 1). Excluding Florida, North Carolina and Texas were the top states for the most number of operations and area irrigated under protection. Although both states had 475 operations in this category, North Carolina had a total area of 28.14 million square feet compared to Texas' 49.09 million square feet. Data for area irrigated in the open showed that Georgia had the most number of nursery plant acres (6,519) irrigated in the open. This acreage was represented by 166 operations. This was followed by North Carolina with 4,286 acres (288 operations), Texas with 3,331 acres (140 operations), and Tennessee with 2,900 acres (165 operations). A total of 18,512 acres irrigated in the open in Alabama were used for turfgrass sod, sprig or plugs. This represented the most acres irrigated in the open for any of the thirteen states. Second to Alabama was Texas with 17,956 acres followed by Georgia with 14,552 acres, 12,597 acres in South Carolina for the same category of products, and Tennessee with 4,695 acres (Table 1). The Census data also shows the number of operations using ground water, on-farm surface
SNA RESEARCH CONFERENCE - VOL. 48 - 2003
Water Quality & Management Section 459
SNA RESEARCH CONFERENCE - VOL. 48 - 2003
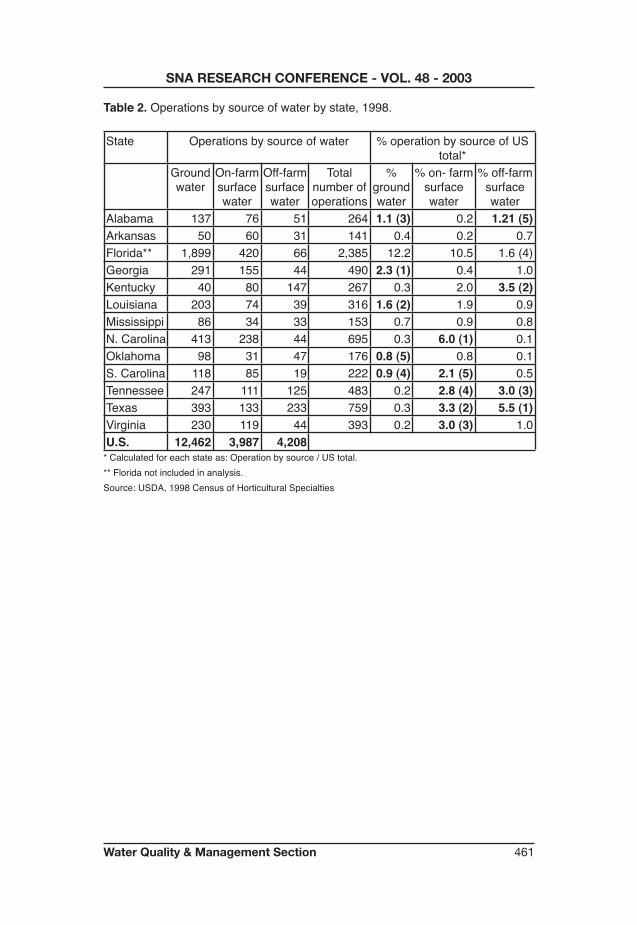
water, and off-farm surface water (Table 2). According to the data, the states with the highest percentages of operations using ground water were: Georgia (2.3%), Louisiana (1.6%), Alabama (1.1%), South Carolina (0.9%), and Oklahoma (2.1%). The top five states (with the most number of operations) using on-farm and off-farm surface water are also presented in Table 2. About 6% of operations in North Carolina used on-farm surface water in their operations, making it the number one state in this category followed by Texas, Virginia, Tennessee and South Carolina. In the off-farm surface water category, Texas led the other states followed by Kentucky, Tennessee, Alabama, and Georgia and Virginia (tied).
Significance to the Industry: Water is an important resource. Information on the source of water and the number of operations depending on these sources for irrigation should be of interest to the nursery industry. This information would be useful in guiding nursery managers in selecting effective and efficient water management strategies.
Literature Cited:1. Pacific Economic Cooperation Council (PECC). 2001. “Pacific Food System
Outlook 2001 – 2002: Meeting the Challenge of Water Scarcity”. PECC.2. Gollehon, Noel, William Quinby, and Marcel Aillery. 2002, Agricultural
Resource and Environmental Indicators: Water use and Pricing in Agriculture. ERS Agricultural Resources and Environmental Indicators No. AH722, April, http://www.ers.usda.gov/publications/arei2001/arei2_1/DBGen.htm.
3. USDA. US Census of Agriculture, 1998 Census of Horticultural Specialties, Table 46, page 262 – 263. US Department of Agriculture, Washington DC.
460 Water Quality & Management Section
SNA RESEARCH CONFERENCE - VOL. 48 - 2003 SNA RESEARCH CONFERENCE - VOL. 48 - 2003
Table 1. Land area irrigated under protection and in the open for nursery plants, turfgrass sod, sprigs, or plugs, and other horticultural crops, 1998.
Area irrigated under protection
Area irrigated in the open used for
Nursery plantsTurfgrass sod,
sprigs and plugs
Other horticultural
crops
State Opera-tions
Area 1,000 sq ft Opera-
tionsAcres Opera-
tionsAcres Opera-
tionsAcres
Alabama 185 10,559 103 n.a. 49 18,512 20 39Arkansas 84 3,468 21 159 25 4,249 20 253Florida* 1,456 415,580 878 14,803 68 32,118 559 11,481Georgia 282 16,865 166 6,519 45 14,552 65 281Kentucky 221 6,648 27 239 9 147 23 n.a.Louisiana 212 7,396 141 1,305 13 2,493 36 235Mississippi 111 5,546 39 185 18 1,287 27 33N Carolina 475 28,141 288 4,286 26 2,951 115 1,586Oklahoma 118 3,401 24 1,251 32 3,510 19 144S Carolina 125 5,494 65 2,180 14 12,597 38 104Tennessee 286 14,091 165 2,909 25 4,695 60 305Texas 475 49,093 140 3,331 79 17,956 43 738Virginia 277 20,001 66 1,737 12 1,055 85 1,044U.S. 14,234 1,253,043 5,089 110,925 898 196,819 4,013 79,248
Source: USDA, 1998 Census of Agriculture, Table 47, pages 263 - 264* Excluded from analysis
SNA RESEARCH CONFERENCE - VOL. 48 - 2003
Water Quality & Management Section 461
SNA RESEARCH CONFERENCE - VOL. 48 - 2003
Table 2. Operations by source of water by state, 1998.
State Operations by source of water % operation by source of US total*
Ground water
On-farm surface water
Off-farm surface water
Total number of operations
% ground water
% on- farm surface water
% off-farm surface water
Alabama 137 76 51 264 1.1 (3) 0.2 1.21 (5)Arkansas 50 60 31 141 0.4 0.2 0.7Florida** 1,899 420 66 2,385 12.2 10.5 1.6 (4)Georgia 291 155 44 490 2.3 (1) 0.4 1.0Kentucky 40 80 147 267 0.3 2.0 3.5 (2)Louisiana 203 74 39 316 1.6 (2) 1.9 0.9Mississippi 86 34 33 153 0.7 0.9 0.8N. Carolina 413 238 44 695 0.3 6.0 (1) 0.1Oklahoma 98 31 47 176 0.8 (5) 0.8 0.1S. Carolina 118 85 19 222 0.9 (4) 2.1 (5) 0.5Tennessee 247 111 125 483 0.2 2.8 (4) 3.0 (3)Texas 393 133 233 759 0.3 3.3 (2) 5.5 (1)Virginia 230 119 44 393 0.2 3.0 (3) 1.0U.S. 12,462 3,987 4,208
* Calculated for each state as: Operation by source / US total.** Florida not included in analysis.Source: USDA, 1998 Census of Horticultural Specialties
462 Water Quality & Management Section
SNA RESEARCH CONFERENCE - VOL. 48 - 2003 SNA RESEARCH CONFERENCE - VOL. 48 - 2003
Container Systems for Reducing Overhead Irrigation Application Rates
Richard C. Beeson, Jr1, John J. Haydu1, Thomas H. Yeager2, Gary W. Knox3,
Dorota Haman4, Jean Caron5
1MREC, IFAS, University of Florida, Apopka, FL2Dept. Environmental Horticulture, IFAS,
University of Florida, Gainesville, FL 3NFREC, IFAS, University of Florida, Quincy, FL
4Dept. Agr. & Bio. Engineering, IFAS, University of Florida, Gainesville, FL5Dept. des Sols, Université Laval, Ste-Foy, Quebec, Canada R-09656
Index Words: Container Irrigation, Water Conservation Systems, Irrigation Efficiency
Nature of Work: Overhead irrigation of young container plants is most efficient when containers are set pot-to-pot in a triangular or alternating pattern. Once spaced to produce quality plants, application efficiency declines quadratically (Furuta, 1976; Beeson and Knox, 1991, Weatherspoon, 1980). At a pot diameter apart, most container sizes occupy about 20% of a production area. Thus if irrigation is applied overhead, 80% of that applied is unavailable for plant growth. Where irrigation is monitored and limited by permits, the loss of 80% or more of the water pumped will limit production and/or slow remaining plant growth. Where nursery irrigation is not yet limited, associated pumping cost reduces profits.
With nearly all nursery irrigation in Florida limited by consumptive use permits, studies were conducted from 1997 through 2001 to compare irrigation requirements of many existing and experimental systems. In most evaluations, liners of Viburnum odoratissimum, sweet viburnum, were transplanted into #1 black polyethylene containers (010, Lerio Corp., Kissimmee, Fla.) using a 70% fine pine bark: 30% Florida sedge peat: 10% sand substrate amended with micronutrients and dolomitic limestone. In some experiments, liners of other species were included and similarly treated. All treatments were replicated three or four times and each set of experiments contained a Control treatment in which plants were irrigated at 0.6 inch (15 mm) daily. Time required and associated irrigation volumes to achieve 92% or better marketable plants (based on Florida Grades and Standards, DPI) for the Control was used as a benchmark against which experimental systems were compared.
Results and Discussion: Elevated Drain Hole (EDH) containers were fabricated from Lerio aquatic containers [010 (holeless), Lerio Corp. Kissimmee, Fla.] by punching four - 1⁄2 inch (12.7 mm) holes in the sidewalls 1 inch (25.4 mm) above the bottom. Over a three-year period, plants of comparable or better quality to the Control were produced with 0.3 inch (7.5 mm) daily compared to the 0.6 inch Control application rate.
Eight-inch (20 cm) azalea containers (BP85, Lerio Corp.) were commercially available. These represented containers in which width was wider than height. On an average rainfall year, these required 0.18 inch (4.6 mm) daily to match the
SNA RESEARCH CONFERENCE - VOL. 48 - 2003
Water Quality & Management Section 463
SNA RESEARCH CONFERENCE - VOL. 48 - 2003
0.6 inch Control plants. On the El Nino year of 1997, 0.3 inch daily were required to match the Control.
The third prototype of a Funnel container (UF patent) matched the theoretical application efficiency of near 100% within the production bed, requiring 0.18 inch daily to match the 0.6 inch Control. These consisted of a square, relatively flat funnel temporarily attached to the top of a container. While Squat pots produced similar plants with the same irrigation rate, only Funnel containers captured most of the water (irrigation and rainfall) that fell between containers.
Three other successful systems used sub-irrigation. Each was, in essence, a micro-collection basin, capturing water that fell between containers and channeling it into the bottoms of containers. For all, blow-molded containers with a bottom drain hole worked better then those with solid bottoms.
In 2001, an outdoor capillary mat was evaluated. This consisted of a bottom layer which contained and re-distributed the water, and a top spongy material layer that limited evaporation but compressed to form a continuous water column underneath a container. At 0.3 inch daily, plant growth exceeded that of the growth of 0.6 inch Control plants, suggesting further reductions in application rates could be achieved. This capillary mat is commercially available as Aquamat (Soleno, Montreal, Que. Canada).
In 2000, Landmark Plastics' (Akron, Ohio) WaterSaver Tray™ was tested. Like the Aquamat capillary mat, growth rates exceeded those of Control plants for 3 of the 4 species evaluated, suggesting further reductions in the irrigation amounts applied. This occurred with application rates of 0.24 inch (6.1 mm) compared to the 0.6 inch of the Control treatment. Because the WaterSaver Tray™ was pre-molded, spacing was not optimal for landscape plant production. The small trays were a bit difficult to place on a windy day. However, quality plants were produced and container blow over due to storms was substantially reduced compared to the Control.
The third system consisted of a large shallow tray (43 x 60 x 1 inch) produced by Better Plastics (Kissimmee, FL) for subirrigation of greenhouse grown pot plants. Drain holes were drilled along the side, 3/8 inch (9.5 mm) above the bottom of a tray. Plants were irrigated with 0.15 inch (3.8 mm) daily. Like the other subirrigation systems, growth rates exceeded that of the Control plants, reaching marketable size and quality 6 to 8 weeks earlier, depending on species. Although containers stood in shallow water most of the production period, there was no evidence of root disease and roots filled the entire container volume, except for root matting commonly observed at the bottom of a root ball.
Significance to Industry: As irrigation volumes for nursery irrigation become limited and/or the cost of water increases, nurseries will have to adopt more efficient methods of container irrigation or contend with reduced profits resulting from reduced growth rates. The systems described herein reduced by half or more the amount of overhead irrigation water needed to produce commercially marketable plants. Some are currently available, and most are economically feasible under current cost for water (value of 1 KW of electricity per 1000 gal
464 Water Quality & Management Section
SNA RESEARCH CONFERENCE - VOL. 48 - 2003 SNA RESEARCH CONFERENCE - VOL. 48 - 2003
pumped). One system will not likely fulfill all needs, however, most situations with small containers should be covered.
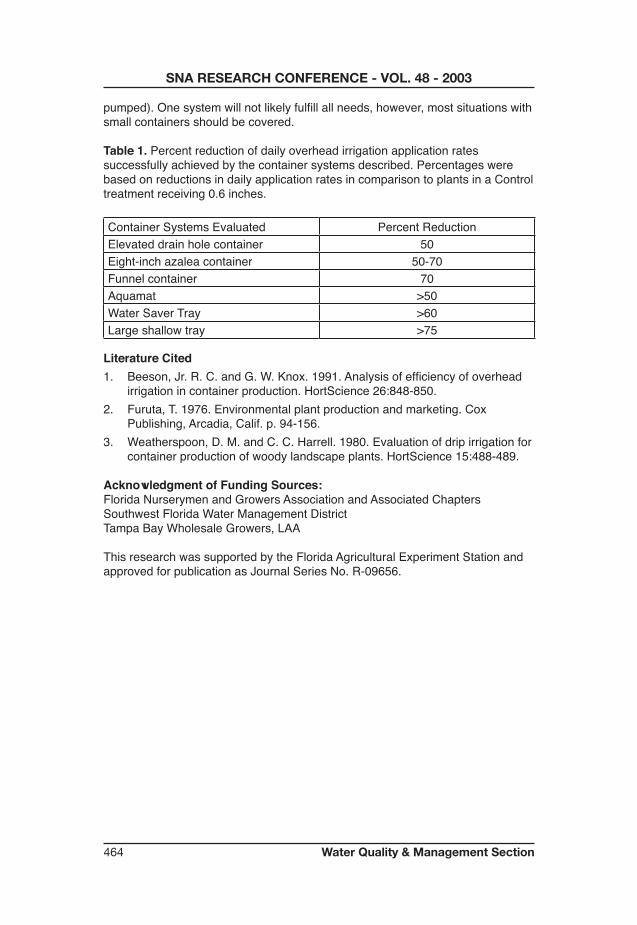
Table 1. Percent reduction of daily overhead irrigation application rates successfully achieved by the container systems described. Percentages were based on reductions in daily application rates in comparison to plants in a Control treatment receiving 0.6 inches.
Container Systems Evaluated Percent Reduction Elevated drain hole container 50Eight-inch azalea container 50-70Funnel container 70Aquamat >50Water Saver Tray >60Large shallow tray >75
Literature Cited1. Beeson, Jr. R. C. and G. W. Knox. 1991. Analysis of efficiency of overhead
irrigation in container production. HortScience 26:848-850.2. Furuta, T. 1976. Environmental plant production and marketing. Cox
Publishing, Arcadia, Calif. p. 94-156. 3. Weatherspoon, D. M. and C. C. Harrell. 1980. Evaluation of drip irrigation for
container production of woody landscape plants. HortScience 15:488-489.
Acknowledgment of Funding Sources:Florida Nurserymen and Growers Association and Associated ChaptersSouthwest Florida Water Management DistrictTampa Bay Wholesale Growers, LAA
This research was supported by the Florida Agricultural Experiment Station and approved for publication as Journal Series No. R-09656.
SNA RESEARCH CONFERENCE - VOL. 48 - 2003
Water Quality & Management Section 465
SNA RESEARCH CONFERENCE - VOL. 48 - 2003
Nutrient Removal from Simulated Nursery Runoff in Gravel-based Constructed Wetlands
Established with Different Plant Species
Milton D. Taylor1, Sandra L. Knuteson1, Stephen J. Klaine1, and Ted Whitwell2
1Clemson Institute of Environmental Toxicology, Clemson University, Pendleton, SC 29670
2Department of Horticulture, Clemson University, Clemson, SC 29632
Index Words: Nutrient contaminants, Constructed wetlands, Wetland ornamentals, Canna hybrida (L.) 'Yellow King Humbert', Acorus gramineus (Sol), Pontederia cordata (L.), Typha latifolia (L.)
Nature of Work: A few large-scale commercial nurseries have constructed wetlands to remove nutrient contaminants from runoff water that is in excess of their recapture needs and discharge it off-site into nearby streams and wetlands. We have monitored a constructed wetland system for the past 15 months that performs quite well for nitrate and nitrite remediation. However, there are numerous other designs that might also work and may require less space or function optimally at loading and flow rates more typical of small and medium sized nurseries. Wilson (1999) described the use of gravel-based, subsurface flow wetlands for simazine and metalaxyl remediation. The same system was used to evaluate the seasonal changes in remediation efficiency for nitrogen and phosphorus. Pairs of constructed wetlands with a 14.6 m flow path were either planted with a Typha latifolia monoculture or an equal mixture of three ornamental plant species including Canna hybrida (L.) 'Yellow King Humbert', Acorus gramineus (Sol), and Pontederia cordata (L.) or left unplanted. They were dosed with a commercial 20-10-20 peat-lite soluble fertilizer during summer, winter, and spring seasons and changes in nutrient loading for each treatment were monitored for 56 days.
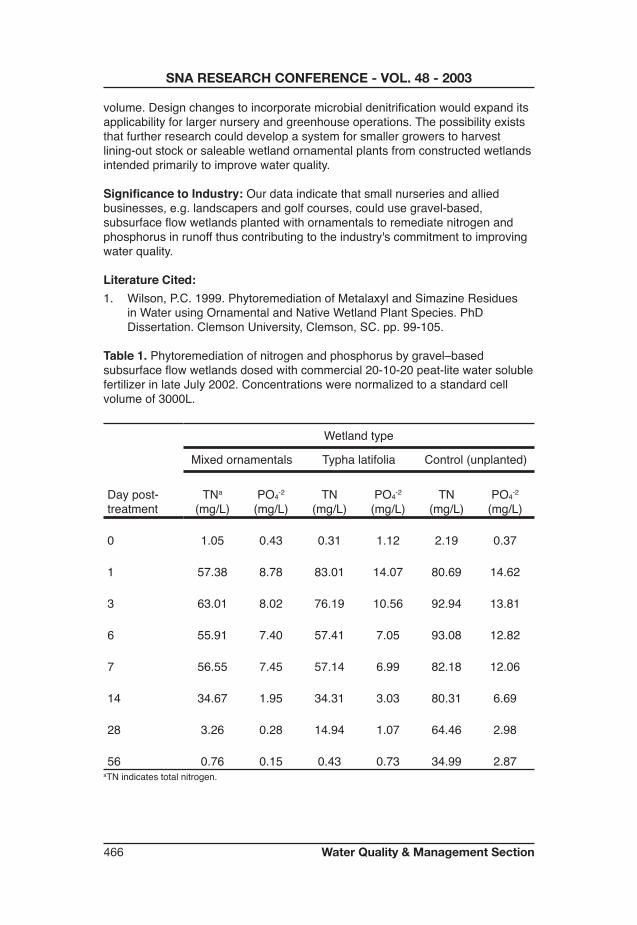
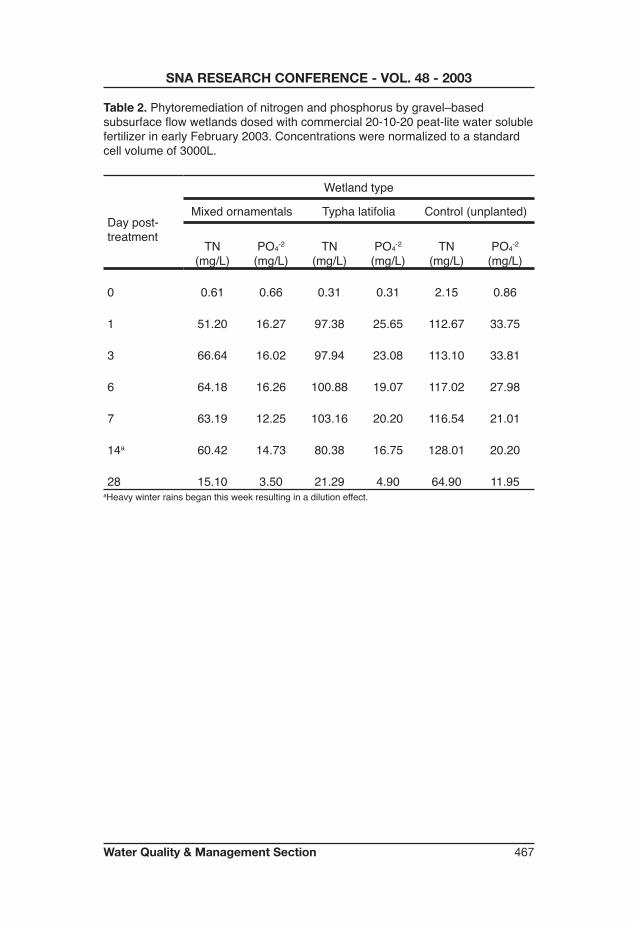
Results and Discussion: During the summer season, nitrogen and phosphorus declined rapidly to near background levels by Day 28 in the mixed ornamental treatment. Nitrogen and phosphorus declined more slowly in the T. latifolia treatment but reached background levels by Day 56. Nitrogen levels in controls declined by 70% due to rainfall dilution and a heavy proliferation of green algae. However, phosphorus declined at a similar rate to the treatment groups but remained well above background levels. For the winter season, there was no difference between treatments; decreases in phosphorus and nitrogen could be attributed to dilution from heavy winter rainfall. During the spring season, nitrogen levels declined by nearly 40% within 22 days in the mixed ornamental treatment, 25% in the T. latifolia treatment and remained constant in the gravel control. Thus, phytoremediation of nutrient contaminants in subsurface flow constructed wetlands is strongly seasonal with the greatest remediation occurring during warm summer months. However, the rate of remediation in this system requires excessive retention time and so would be effective only for small nurseries and landscape businesses. The system could be useful for equipment rinse pads at landscape companies, golf courses, and greenhouses with limited runoff
466 Water Quality & Management Section
SNA RESEARCH CONFERENCE - VOL. 48 - 2003 SNA RESEARCH CONFERENCE - VOL. 48 - 2003
volume. Design changes to incorporate microbial denitrification would expand its applicability for larger nursery and greenhouse operations. The possibility exists that further research could develop a system for smaller growers to harvest lining-out stock or saleable wetland ornamental plants from constructed wetlands intended primarily to improve water quality.
Significance to Industry: Our data indicate that small nurseries and allied businesses, e.g. landscapers and golf courses, could use gravel-based, subsurface flow wetlands planted with ornamentals to remediate nitrogen and phosphorus in runoff thus contributing to the industry's commitment to improving water quality.
Literature Cited:1. Wilson, P.C. 1999. Phytoremediation of Metalaxyl and Simazine Residues
in Water using Ornamental and Native Wetland Plant Species. PhD Dissertation. Clemson University, Clemson, SC. pp. 99-105.
Table 1. Phytoremediation of nitrogen and phosphorus by gravel–based subsurface flow wetlands dosed with commercial 20-10-20 peat-lite water soluble fertilizer in late July 2002. Concentrations were normalized to a standard cell volume of 3000L.
Day post-treatment
Wetland type
Mixed ornamentals Typha latifolia Control (unplanted)
TNa
(mg/L)PO4-2
(mg/L)TN
(mg/L)PO4-2
(mg/L)TN
(mg/L)PO4-2
(mg/L)
0 1.05 0.43 0.31 1.12 2.19 0.37
1 57.38 8.78 83.01 14.07 80.69 14.62
3 63.01 8.02 76.19 10.56 92.94 13.81
6 55.91 7.40 57.41 7.05 93.08 12.82
7 56.55 7.45 57.14 6.99 82.18 12.06
14 34.67 1.95 34.31 3.03 80.31 6.69
28 3.26 0.28 14.94 1.07 64.46 2.98
56 0.76 0.15 0.43 0.73 34.99 2.87aTN indicates total nitrogen.
SNA RESEARCH CONFERENCE - VOL. 48 - 2003
Water Quality & Management Section 467
SNA RESEARCH CONFERENCE - VOL. 48 - 2003
Table 2. Phytoremediation of nitrogen and phosphorus by gravel–based subsurface flow wetlands dosed with commercial 20-10-20 peat-lite water soluble fertilizer in early February 2003. Concentrations were normalized to a standard cell volume of 3000L.
Day post-treatment
Wetland type
Mixed ornamentals Typha latifolia Control (unplanted)
TN(mg/L)
PO4-2
(mg/L)TN
(mg/L)PO4-2
(mg/L)TN
(mg/L)PO4-2
(mg/L)
0 0.61 0.66 0.31 0.31 2.15 0.86
1 51.20 16.27 97.38 25.65 112.67 33.75
3 66.64 16.02 97.94 23.08 113.10 33.81
6 64.18 16.26 100.88 19.07 117.02 27.98
7 63.19 12.25 103.16 20.20 116.54 21.01
14a 60.42 14.73 80.38 16.75 128.01 20.20
28 15.10 3.50 21.29 4.90 64.90 11.95aHeavy winter rains began this week resulting in a dilution effect.
468 Water Quality & Management Section
SNA RESEARCH CONFERENCE - VOL. 48 - 2003 SNA RESEARCH CONFERENCE - VOL. 48 - 2003
Use of a Constructed Wetland System to Mitigate Nutrient Contaminants in Offsite Drainage from a Commercial Nursery
Milton D. Taylor1, Stephen J. Klaine1, and Ted Whitwell2
1Clemson Institute of Environmental Toxicology, Clemson University, Pendleton, SC 29670
2Department of Horticulture, Clemson University, Clemson, SC 29632
Index Words: Nutrient contaminants, Constructed wetlands, Remediation, Nursery runoff, Nitrogen, Phosphorus, Water quality
Nature of Work: Container-grown plants at commercial nurseries require large amounts of water and nutrients during the production cycle. Nutrients may be delivered through incorporation in potting media, by top-dressing, by injection into irrigation water, or some combination of these methods. Typically, water from wells, impounded surface water, or water from both sources is applied using overhead sprinklers or by drip irrigation to sloped production areas. Water application rates are sufficient to ensure leaching of soluble salts resulting in substantial runoff. Thus, mitigation of offsite movement of nutrients in runoff is a serious concern. In 1996, Wight Nurseries of Monrovia Growers located in Cairo, Georgia recognized that the future held more stringent water quality standards including total maximum daily load (TMDL) requirements for traditional non-point source dischargers, viz. nurseries and greenhouses, and began proactive planning to meet those regulations. By 1997, Wight Nurseries had installed 9.3 acres (3.77 ha) of planted wetlands to receive direct runoff in excess of recapture needs from a 120 acre (48.6 ha) drainage basin and excess water diverted from retention ponds used to retain water for adjacent watersheds. Water flows though trench drains between wetland cells and eventually into stilling ponds before exiting the property. The wetlands are now entering their seventh year of operation. A monitoring program was started in the spring of 2002 to assess the effectiveness of these wetland systems and to answer questions regarding size and nutrient loading. Wight Nurseries are not in the business of growing wetlands, therefore, they want to minimize space needed for new wetland construction while continuing to meet or exceed water quality standards set by the State. Water flow currently ranges from 1.6 to 2.2 million liters (423,280 to 582,011 gallons) per day. Water samples were taken early each month for 15 months from approx. 50 locations throughout the wetland systems and analyzed for chloride, nitrate, nitrite, phosphate, and sulfate using a Dionex AS50 ion chromatograph with an AS50 autosampler. Additional data on water temperature, DO (dissolved oxygen), conductivity, nonpurgable organic carbon (NPOC), pH, and total nitrogen (TN) were taken from September 2002 through May 2003. Nonpurgable organic carbon and total nitrogen were analyzed with a Shimadzu Total Organic Carbon analyzer with TN measuring unit.
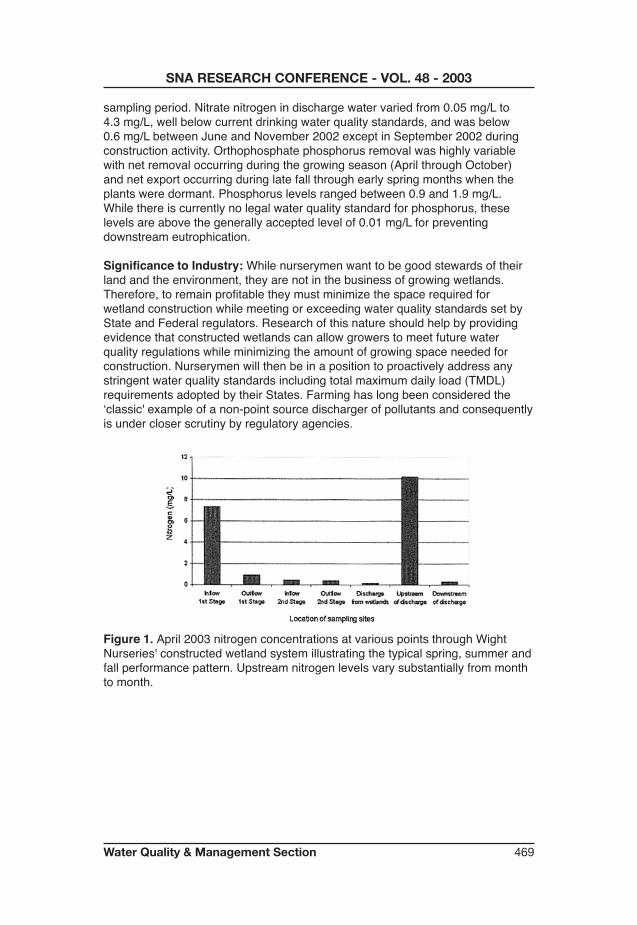
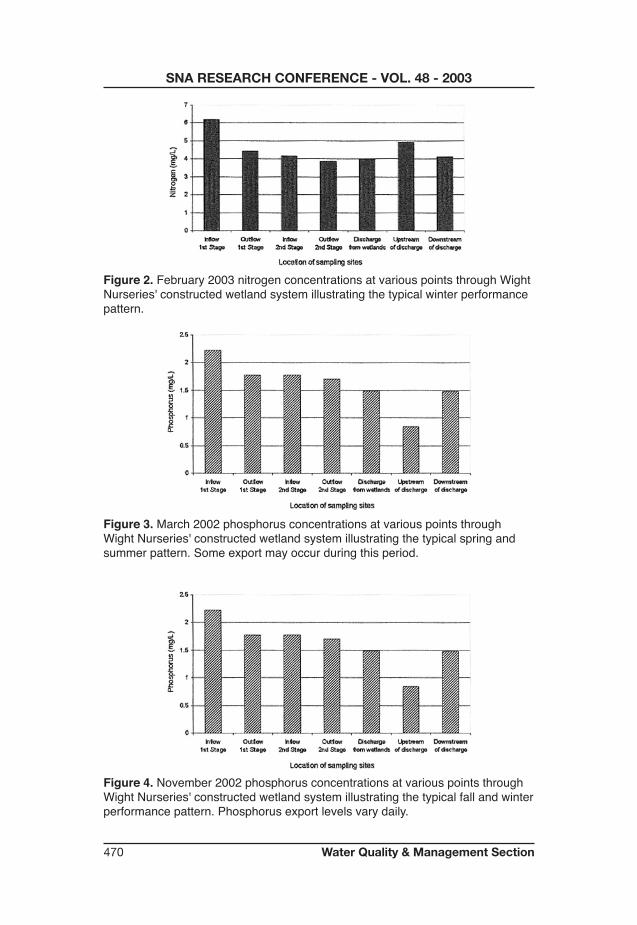
Results and Discussion: The monitoring data demonstrates strong seasonal differences in nitrogen and phosphorus removal efficiencies (Figs. 1-4). Nitrogen removal between late March and early November 2002 averaged 93.8% while removal from early December 2002 through early February 2003 averaged only 47.6%. However, wetland efficiency improved to approx. 92% by early March 2003. No nitrite was found in discharge from the wetlands for any
SNA RESEARCH CONFERENCE - VOL. 48 - 2003
Water Quality & Management Section 469
SNA RESEARCH CONFERENCE - VOL. 48 - 2003
sampling period. Nitrate nitrogen in discharge water varied from 0.05 mg/L to 4.3 mg/L, well below current drinking water quality standards, and was below 0.6 mg/L between June and November 2002 except in September 2002 during construction activity. Orthophosphate phosphorus removal was highly variable with net removal occurring during the growing season (April through October) and net export occurring during late fall through early spring months when the plants were dormant. Phosphorus levels ranged between 0.9 and 1.9 mg/L. While there is currently no legal water quality standard for phosphorus, these levels are above the generally accepted level of 0.01 mg/L for preventing downstream eutrophication.
Significance to Industry: While nurserymen want to be good stewards of their land and the environment, they are not in the business of growing wetlands. Therefore, to remain profitable they must minimize the space required for wetland construction while meeting or exceeding water quality standards set by State and Federal regulators. Research of this nature should help by providing evidence that constructed wetlands can allow growers to meet future water quality regulations while minimizing the amount of growing space needed for construction. Nurserymen will then be in a position to proactively address any stringent water quality standards including total maximum daily load (TMDL) requirements adopted by their States. Farming has long been considered the ʻclassic' example of a non-point source discharger of pollutants and consequently is under closer scrutiny by regulatory agencies.
Figure 1. April 2003 nitrogen concentrations at various points through Wight Nurseries' constructed wetland system illustrating the typical spring, summer and fall performance pattern. Upstream nitrogen levels vary substantially from month to month.
470 Water Quality & Management Section
SNA RESEARCH CONFERENCE - VOL. 48 - 2003 SNA RESEARCH CONFERENCE - VOL. 48 - 2003
Figure 2. February 2003 nitrogen concentrations at various points through Wight Nurseries' constructed wetland system illustrating the typical winter performance pattern.
Figure 3. March 2002 phosphorus concentrations at various points through Wight Nurseries' constructed wetland system illustrating the typical spring and summer pattern. Some export may occur during this period.
Figure 4. November 2002 phosphorus concentrations at various points through Wight Nurseries' constructed wetland system illustrating the typical fall and winter performance pattern. Phosphorus export levels vary daily.
SNA RESEARCH CONFERENCE - VOL. 48 - 2003
Water Quality & Management Section 471
SNA RESEARCH CONFERENCE - VOL. 48 - 2003
Response of Anthurium to Irrigation Method
Tom Yeager, Claudia Larsen, and Gisele MartinsDept. of Environmental Horticulture, IFAS, University of Florida, Gainesville, FL 32611
Index words: container plants
Nature of Work: About 50% of the nurseries producing plants in Florida are within one mile of urban centers (2). Consequently, plants must be produced using production practices compatible with the environment while sharing water resources with urban residents. The majority of Florida nurseries utilize freshwater for irrigation and in 1995, average daily agricultural freshwater irrigation withdrawals were 3.2 billion gallons per day (1). The St. Johns River Water Management District (3) projects that agricultural water use based on an average rainfall year will not increase through 2020 even as the industry expands in northeast and central Florida. This will likely be the scenario for all of the state, particularly in areas with dense population. Thus, Florida nurseries must utilize their current water resources more efficiently.
Irrigation water in greenhouse nurseries is usually applied to container plants by overhead sprinklers that have low application efficiencies due to space between containers or microirrigation systems. Microirrigation systems provide for the delivery of water directly to each container and results in less water applied than overhead systems. However, microirrigation systems do not prevent loss of water exiting the container unless reservoirs are placed under each container. Capillary mat irrigation systems provide a reservoir of water under the container and allow water to move upwards by capillarity to the container substrate as needed by the plant. This minimizes leaching and maximizes plant water use.
Multiple branched Anthurium sp.`Tropic Fire' grown in 6-inch diameter containers in a naturally vented greenhouse in central Florida were transplanted on 20 Aug. 2001 to 8-inch diameter containers with a common peat-based substrate used for greenhouse crops. A total of 216 plants were uniformly spaced on each of three open wire surface greenhouse benches 6 x 72 feet flanked by similar plants. Each bench received one of three irrigation treatments that included: 1) irrigation applied via two microirrigation emitters per container, 2) subirrigation applied via capillary mat (Bottom Up Irrigation Pty Ltd., Australia) covering the bench surface, or 3) irrigation applied via two microirrigation emitters per container with container bottom resting in a 9-inch diameter leachate collection reservoir. Plants were irrigated or fertilized (≈ 200 ppm N) as needed and the applied volume was monitored using a meter on water supply line of each bench. On each of the three treatment benches, 16 plants uniformly spaced throughout the bench were measured approximately every three weeks for three months. Measurements were taken five times by recording plant height, widest width, and perpendicular width. A growth index was calculated as height plus average width.
Results and Discussion: The irrigation treatments resulted in similar growth indices. Water volumes applied were 913, 489, and 592 gallons for microirrigation, capillary mat, and microirrigated containers with leachate

472 Water Quality & Management Section
SNA RESEARCH CONFERENCE - VOL. 48 - 2003 SNA RESEARCH CONFERENCE - VOL. 48 - 2003
collection reservoirs, respectively. The ratios of gallons of water applied per unit of growth index increase (cm) during the three months were 40:1, 29:1, and 30:1 for microirrigation, capillary mat, and microirrigated containers with leachate collection reservoirs, respectively.
Significance to Industry: These data indicate a reduction in water applied of about 46% and 35% for plants irrigated with capillary mat and microirrigation with leachate collection reservoir, respectively, compared to standard microirrigation. The water savings would be even greater compared to overhead irrigation.
Literature Cited:1. Marella, R. L. 1999. Water withdrawals, use, discharge, and trends. U.S.
Geological Survey Water-Resources Investigations Report 99-4002.2. Thorp, R. N. 1995. Study of the Sustainable Agricultural Practices of the
Commercial Wholesale Nursery Industry of Florida. MS Thesis Univ. of Fla. (Presentation by M.E. Swisher, October 1994).
3. Vergara, B. (editor) 1998. Water supply assessment 1998. St. Johns River Water Management District executive summary, Palatka, Florida.
Acknowledgement: This research was supported by the Florida Agricultural Experiment Station, grant from Florida Department of Agriculture and Consumer Services, grant from the National Foliage Foundation and approved for publication as Journal Series No. N-02396. Trade names and companies are mentioned with the understanding that no endorsement is intended or discrimination for similar companies or products not mentioned.
SNA RESEARCH CONFERENCE - VOL. 48 - 2003
Water Quality & Management Section 473
SNA RESEARCH CONFERENCE - VOL. 48 - 2003
The Importance of Testing Reclaimed Water Used in Nurseries
Frank MeltonManatee County Extension, University of Florida, Palmetto, FL 34221-2934
Index Words: reclaimed water, irrigation, nutrition, salt tolerance
Nature of Work: Some nurseries in Manatee County, a coastal county in Florida, are using reclaimed water because it is available and is cheaper than using potable water. Manatee County, Florida government needs to dispose of reclaimed water, so it encourages its use.
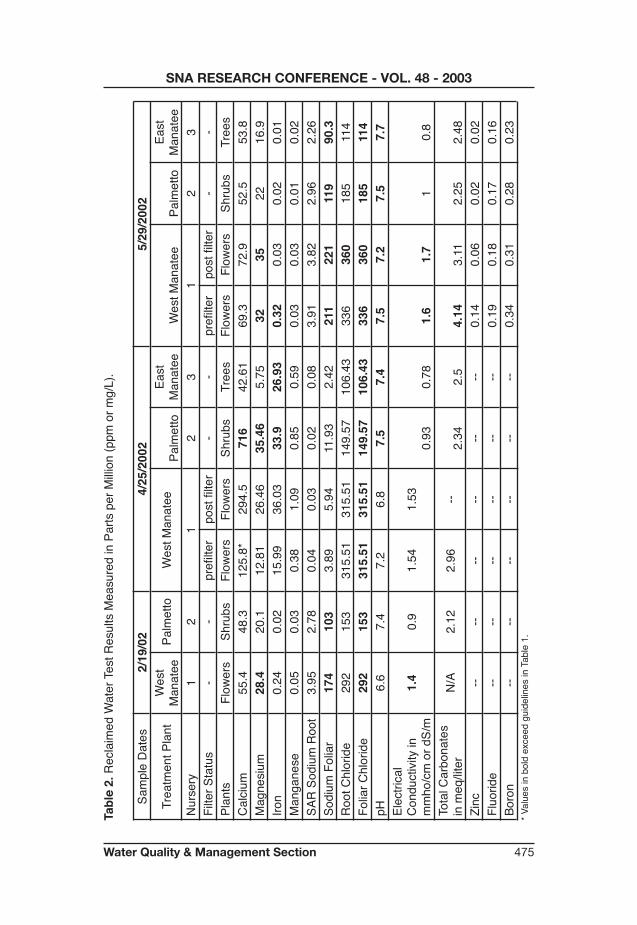
The nurseries using reclaimed water were having problems with some of their plants. As a result, reclaimed water samples were taken at the nurseries to compare reclaimed water quality with published guidelines (1,2), presented in Table 1.
Water from three nurseries was assayed. Nursery 1 grows flowering and foliage crops. In this nursery, water was assayed before and after passing through a sand filter. The wastewater treatment plant that supplies this nursery is within one mile of Sarasota Bay, in west Bradenton, Manatee County. Nursery 2 is a woody ornamental shrub container nursery in the City of Palmetto, Manatee County, Florida. This nursery is supplied with reclaimed water from the Palmetto wastewater treatment plant, within one-quarter mile of Terra Ceia Bay, Manatee County. Nursery 3 is a container tree grower in east Manatee County, served by a wastewater treatment plant about ten miles from Sarasota Bay. Samples were taken over a one-year period.
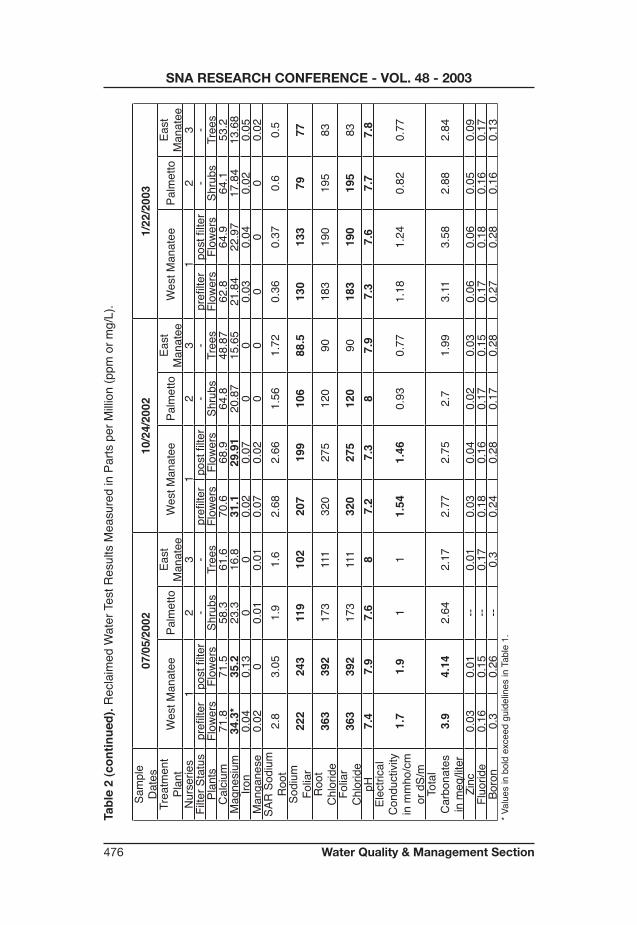
Results and Discussion: The results of the study are in Table 2. There was some variation in reclaimed water quality. This depended on which wastewater treatment plant served the nursery tested, and the date the reclaimed water was sampled, how close the treatment plant is to the coast or bay, and whether other water is mixed with it. Sodium, chloride, alkalinity and pH were usually high. Electrical conductivity was relatively high in samples tested, and should be considered when evaluating which fertilizer to use to grow a crop. Some of the earlier tests showed high iron values, which was caused by the Manatee County wastewater treatment plant mixing in wastewater from a phosphate plant. Mixing from that source has been discontinued. Usually, people who encourage the use of reclaimed water use examples of inland treatment plants that produce better quality reclaimed water, and they show water tests that indicate how safe it is for humans. The problem for growers is that not all treatment plants produce the same quality reclaimed water, and safety for humans does not mean it is good for plants.
Significance to the industry: Reclaimed water used by nurseries should be monitored regularly for quality based on the standards cited. Nursery managers need to ask for data on safety to humans and for tests of elements that affect plant growth. When reclaimed water is recommended, based on its previous use on plants, growers need to ask upon which species of plant the water has been
474 Water Quality & Management Section
SNA RESEARCH CONFERENCE - VOL. 48 - 2003 SNA RESEARCH CONFERENCE - VOL. 48 - 2003
used. Some species are more salt tolerant than others. Nurseries will probably need to adjust their fertilizer type and applications based on their water quality. In some cases, reclaimed water will not be an acceptable source of irrigation water.
Literature Cited:1. Yeager, T., T. Bilderback, D. Fare, C. Gilliam, A. Niemiera, and K.Tilt. 1997.
Best Management Practices: Guide for Producing Container-Grown Plants. Atlanta, Georgia: Southern Nursery Association.1
2. Tayama, H. 1991. Growing Trends: Test Irrigation Water to Ensure Acceptable pH, Alkalinity Levels Greenhouse Manager. October: 119.
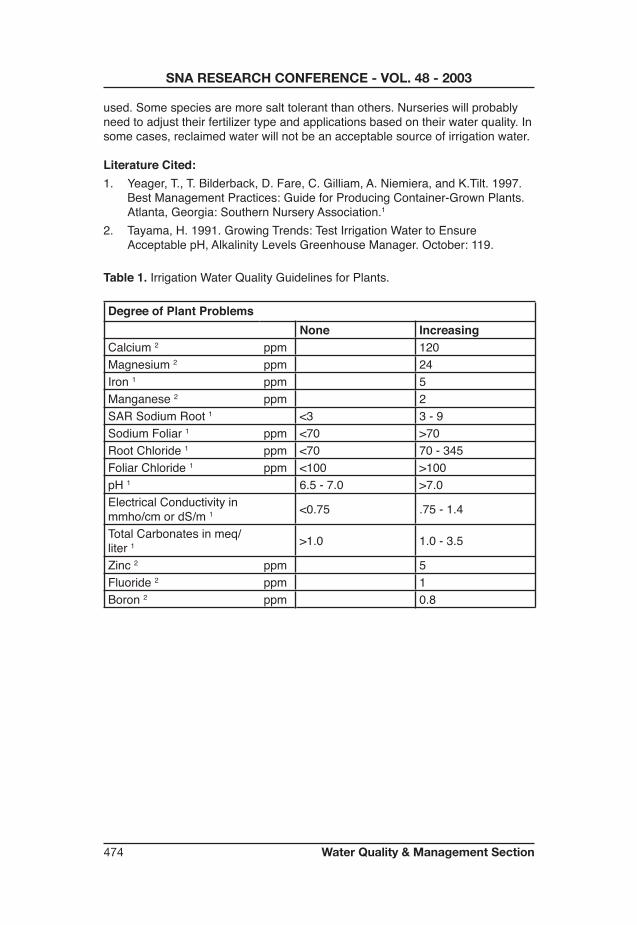
Table 1. Irrigation Water Quality Guidelines for Plants.
Degree of Plant ProblemsNone Increasing
Calcium 2 ppm 120Magnesium 2 ppm 24Iron 1 ppm 5Manganese 2 ppm 2SAR Sodium Root 1 <3 3 - 9Sodium Foliar 1 ppm <70 >70Root Chloride 1 ppm <70 70 - 345Foliar Chloride 1 ppm <100 >100pH 1 6.5 - 7.0 >7.0Electrical Conductivity in mmho/cm or dS/m 1 <0.75 .75 - 1.4
Total Carbonates in meq/liter 1 >1.0 1.0 - 3.5
Zinc 2 ppm 5Fluoride 2 ppm 1Boron 2 ppm 0.8
SNA RESEARCH CONFERENCE - VOL. 48 - 2003
Water Quality & Management Section 475
SNA RESEARCH CONFERENCE - VOL. 48 - 2003
Tabl
e 2.
Rec
laim
ed W
ater
Tes
t Res
ults
Mea
sure
d in
Par
ts p
er M
illion
(ppm
or m
g/L)
.
Sam
ple
Dat
es2/
19/0
24/
25/2
002
5/29
/200
2
Trea
tmen
t Pla
ntW
est
Man
atee
Palm
etto
Wes
t Man
atee
Palm
etto
East
M
anat
eeW
est M
anat
eePa
lmet
toEa
st
Man
atee
Nur
sery
12
12
31
23
Filte
r Sta
tus
--
prefi
lter
post
filte
r-
-pr
efilte
rpo
st fi
lter
--
Plan
tsFl
ower
sSh
rubs
Flow
ers
Flow
ers
Shru
bsTr
ees
Flow
ers
Flow
ers
Shru
bsTr
ees
Cal
cium
55
.448
.312
5.8*
294.
571
642
.61
69.3
72.9
52.5
53.8
Mag
nesi
um
28.4
20.1
12.8
126
.46
35.4
65.
7532
3522
16.9
Iron
0.24
0.02
15.9
936
.03
33.9
26.9
30.
320.
030.
020.
01M
anga
nese
0.
050.
030.
381.
090.
850.
590.
030.
030.
010.
02SA
R S
odiu
m R
oot
3.95
2.78
0.04
0.03
0.02
0.08
3.91
3.82
2.96
2.26
Sodi
um F
olia
r 17
410
33.
895.
9411
.93
2.42
211
221
119
90.3
Roo
t Chl
orid
e 29
215
331
5.51
315.
5114
9.57
106.
4333
636
018
511
4Fo
liar C
hlor
ide
292
153
315.
5131
5.51
149.
5710
6.43
336
360
185
114
pH
6.6
7.4
7.2
6.8
7.5
7.4
7.5
7.2
7.5
7.7
Elec
trica
l C
ondu
ctiv
ity in
m
mho
/cm
or d
S/m
1.
40.
91.
541.
530.
930.
781.
61.
71
0.8
Tota
l Car
bona
tes
in m
eq/li
ter
N/A
2.12
2.96
--2.
342.
54.
143.
112.
252.
48Zi
nc
----
----
----
0.14
0.06
0.02
0.02
Fluo
ride
----
----
----
0.19
0.18
0.17
0.16
Boro
n --
----
----
--0.
340.
310.
280.
23* V
alue
s in
bol
d ex
ceed
gui
delin
es in
Tab
le 1
.
476 Water Quality & Management Section
SNA RESEARCH CONFERENCE - VOL. 48 - 2003 SNA RESEARCH CONFERENCE - VOL. 48 - 2003
Tabl
e 2
(con
tinue
d). R
ecla
imed
Wat
er T
est R
esul
ts M
easu
red
in P
arts
per
Milli
on (p
pm o
r mg/
L).
Sam
ple
Dat
es07
/05/
2002
10/2
4/20
021/
22/2
003
Trea
tmen
t Pl
ant
Wes
t Man
atee
Palm
etto
East
M
anat
eeW
est M
anat
eePa
lmet
toEa
st
Man
atee
Wes
t Man
atee
Palm
etto
East
M
anat
eeN
urse
ries
12
31
23
12
3Fi
lter S
tatu
spr
efilte
rpo
st fi
lter
--
prefi
lter
post
filte
r-
-pr
efilte
rpo
st fi
lter
--
Plan
tsFl
ower
sFl
ower
sSh
rubs
Tree
sFl
ower
sFl
ower
sSh
rubs
Tree
sFl
ower
sFl
ower
sSh
rubs
Tree
sC
alci
um71
.871
.558
.361
.670
.668
.964
.848
.87
62.8
64.9
64.1
53.2
Mag
nesi
um34
.3*
35.2
23.3
16.8
31.1
29.9
120
.87
15.6
521
.84
22.9
717
.84
13.6
8Iro
n0.
040.
130
00.
020.
070
00.
030.
040.
020.
05M
anga
nese
0.02
00.
010.
010.
070.
020
00
00
0.02
SAR
Sod
ium
R
oot
2.8
3.05
1.9
1.6
2.68
2.66
1.56
1.72
0.36
0.37
0.6
0.5
Sodi
um
Folia
r22
224
311
910
220
719
910
688
.513
013
379
77R
oot
Chl
orid
e36
339
217
311
132
027
512
090
183
190
195
83Fo
liar
Chl
orid
e36
339
217
311
132
027
512
090
183
190
195
83pH
7.4
7.9
7.6
87.
27.
38
7.9
7.3
7.6
7.7
7.8
Elec
trica
lC
ondu
ctiv
ity
in m
mho
/cm
or
dS/
m
1.7
1.9
11
1.54
1.46
0.93
0.77
1.18
1.24
0.82
0.77
Tota
l C
arbo
nate
s in
meq
/lite
r3.
94.
142.
642.
172.
772.
752.
71.
993.
113.
582.
882.
84
Zinc
0.03
0.01
--0.
010.
030.
040.
020.
030.
060.
060.
050.
09Fl
uorid
e0.
160.
15--
0.17
0.18
0.16
0.17
0.15
0.17
0.18
0.16
0.17
Boro
n0.
30.
26--
0.3
0.24
0.28
0.17
0.28
0.27
0.28
0.16
0.13
* Val
ues
in b
old
exce
ed g
uide
lines
in T
able
1.
SNA RESEARCH CONFERENCE - VOL. 48 - 2003
Water Quality & Management Section 477
SNA RESEARCH CONFERENCE - VOL. 48 - 2003
Sawdust Effect on Soil pH Under Low Water Application: Part II
1Sam O. Dennis, 2Sunnie A. Aburime and 3Richard Buggeln1Cooperative Agricultural Research Program,
Tennessee State University, Nashville, TN 372092Department of Engineering, Clark Atlanta University, Atlanta, GA 30314
3Center for Industrial Services, The University of Tennessee, Knoxville, TN 37996
Index Words: Sawmill, wood fibers, organic carbon, water management.
Nature of Work: When sawdust is properly utilized it can be of great value to growers especially to acid- requiring plants such as blueberries and azaleas. Sawdust is relatively high in organic carbon therefore has the potential to increase soil organic matter with time (Dennis et al., 2002). Organic matter can increase the water holding capacity of soils as well as serve as the main source of food and energy for soil organisms (Tan, 1999). Sawdust application to soil can cause nitrogen deficiency in plants because of the high Carbon/Nitrogen ratio of sawdust materials. The symptoms resulting from nitrogen deficiency can be corrected with proper nitrogen and water management applications. However, there is an old wives tale among some growers that “sawdust makes the soil acid.” It is worth mentioning that, in many instances, the soils in question are acidic to start with. In a previous study in which the sawdust was applied on the surface of the soil, it was shown that the effect of sawdust on soil pH was dependent on initial soil pH and the initial pH of the sawdust (Dennis et al., 2002). Based on that study the goal of this study was to disk the sawdust into the soil and then monitor the effects on soil pH under low water application. The study was conducted in the laboratory using soil columns constructed from polyvinyl chloride (PVC) tubes as shown in Dennis et al., 2002. Four different soil types designated in the study as A, B, C, D were used to pack the soil columns to a bulk density of 1.25 gm/cm3. Two different types of sawdust were used in the study. One was a one-year-old sawdust (Osd) while the other was a one-day-old sawdust (Nsd).The sawdust was disked into the soil to a depth of 5.1 cm (2-inches) with a 3-prong hand held garden cultivator. Water was applied with a customized water application device (Harrison 2002, unpublished data) at the rate of 50 ml per day, three times a week throughout the experiment. The pH (soil/water ratio 1:2) of the soil solution was taken at 30, 60, and 90 days after the initial soil pH was taken. The pH and the organic carbon of the two sawdust samples used in the experiment were determined. Organic carbon was determined with an OI Analytical™ Solids TOC (total organic carbon) analyzer.
Results and Discussion: Some chemical properties of the sawdust used in the experiment are shown in Table 1. The effects of the disked in old sawdust and the new sawdust on soils' pH are shown in Table 2 and 3 respectively. There is little or no quantitative data in published literature on the effect of sawdust on soil pH. Our results show that the effect of the disk-in sawdust on soil pH was dependent on initial soil pH and the initial pH of the sawdust. As shown in Table 2 and 3, the effect of the disk-in sawdust on soil pHs tested was minimal. A comparison of the data with that of the 2002 data in which the sawdust was surface applied
478 Water Quality & Management Section
SNA RESEARCH CONFERENCE - VOL. 48 - 2003 SNA RESEARCH CONFERENCE - VOL. 48 - 2003
(Dennis et al., 2002), shows no apparent differences in both method (disk-in vs. surface applied) of sawdust applications.. There is much gradual change in pH in soil type A with old sawdust due to the nearness of the initial soil pH to the pH of the old sawdust. The lower effect of the new sawdust on soil type A could be due to the neutralization reaction within the first 30 days. Additionally, new sawdust is relatively higher in lignin (Brady and Weil, 2002) and decomposes slower than the old saw dust, thus resulting in a slight or no change in the pH of soil type A.
Significance to Industry: Sawdust can be used as soil amendments and mulches by nursery crop growers and landscapers to manage acid tolerant ornamentals, such as Azaleas. The nitrogen deficiency associated with the use of sawdust can be mitigated with additional source of nitrogen and proper water management strategy.
Literature Cited:1. Brady N. C, and R. R. Weil. 2002. Practical nutrient management. In The
nature and properties of soils, P. 697. Prentice Hall, Upper Saddle River, NJ.2. Dennis S. O, S .A. Aburime, R Buggeln and S.K. Rotich. 2002. Sawdust
effect on soil pH under low water application. Proc.SNA Res. Conf. 47: 590-593.
3. Tan K. H 1994. Organic constituents In Environmental soil science. P. 52. Marcel Dekker, Inc. New York, NY.
4. Harrison R. E. 2002. Cooperative Agricultural Research Program, Tennessee State University, Nashville TN.
Acknowledgements: Portions of this research were supported through USDA/CSREES Evans-Allen Funds and through US EPA Sustainable Development Grant #SD974017-00-0.
Table 1. Some chemical characteristics of the sawdust used in the experiment.
Sawdust Type* pH % Organic CarbonOld 4.53 36.50
New 7.78 35.12*Old sawdust )Osd) is 1 year old. New sawdust (Nsd) is 1 day old.
Table 2. Effects of disk-in sawdust (old) on pH of soils used in the experiment.
Initial soil pH Soil pH Soil pH Soil pHSoil Type Day 0 Day 30 Day 60 Day 90
A 5.03a* 4.95a 4.93a 4.68aB 5.70a 5.66a 5.45a 5.27aC 6.65a 6.45a 6.20a 6.04aD 6.28a 6.11a 5.75a 5.60a
*Means within row followed by the same letter are not significantly different at p=0.05 by Duncans.

SNA RESEARCH CONFERENCE - VOL. 48 - 2003
Water Quality & Management Section 479
SNA RESEARCH CONFERENCE - VOL. 48 - 2003
Table 3. Effects of disk-in sawdust (new) on pH of soils used in the experiment.
Soil TypeInitial pH
Day 0pH
Day 30pH
Day 60pH
Day 90A 5.03a 5.00a 4.90a 4.86aB 5.70a 5.70a 5.60a 5.48aC 6.65a 6.54a 6.35a 6.19aD 6.28a 6.16a 6.05a 6.00a

480 Water Quality & Management Section
SNA RESEARCH CONFERENCE - VOL. 48 - 2003