Embed Size (px)
Citation preview
Water-Quality Effects of Stormwater Runoff into Sand Pits on Ground Water in
Sedgwick County, Kansas: Phase II – Kingston Cove and Pine Bay Pits, and
Comparison with Phase I Results
A report for the Groundwater Quality Task Force, including
Equus Beds Groundwater Management District No. 2 Wichita Area Builders Association
Kansas Department of Agriculture, Division of Water Resources Kansas Department of Health and Environment
and Sedgwick County
Donald O. Whittemore
Aerial photograph of Pine Bay Estates pit and location of the three monitoring wells
(from Sedgwick County Department of Environmental Resources report of June 2005)
Kansas Geological Survey The University of Kansas
Lawrence, Kansas April, 2008
Kansas Geological Survey Open-file Report No. 2008-4
KANSAS GEOLOGICAL SURVEY OPEN-FILE REPORT
>>>>>>>>>> NOT FOR RESALE <<<<<<<<<<
Disclaimer
The Kansas Geological Survey made a conscientious effort to ensure the accuracy of this report. However, the Kansas Geological Survey does not guarantee this document to be completely free from errors or inaccuracies and disclaims any responsibility or liability for interpretations based on data used in the production of this document or decisions based thereon. This report is intended to make results of research available at the earliest possible date, but is not intended to constitute formal publication.
TABLE OF CONTENTS Page
Acknowledgments ........................................................................................................................ ii
Executive Summary ..................................................................................................................... 1
Introduction ................................................................................................................................. 3 USGS Water Sampling and Analysis Procedures ........................................................................ 8 USGS Chemical Data .................................................................................................................. 9 Discussion of Chemical Data – Water ....................................................................................... 20 Chemical Properties and Inorganic Constituents ................................................................ 20 Bacteriological Analysis ..................................................................................................... 42 Pesticide and Degradate Compounds ................................................................................. 43 Organic Compounds Other than Pesticides ........................................................................ 46 Discussion of Chemical Data – Sediment .................................................................................. 49 Comparison of Results for Northwest and Southern Wichita Pits ............................................. 52 Assessment of Sand-Pit and Ground-Water Interaction ............................................................ 55 Comparison with Early 1990s Study ......................................................................................... 56 Conclusions ............................................................................................................................... 58 Recommendations ...................................................................................................................... 60 References ............................................................................................................................... 61 Appendix A. CD of complete USGS analytical data.................................................................. 63
ii
ACKNOWLEDGMENTS Individuals involved in the study planning, determination of the sand pits for detailed study, monitoring well installation and logistics, and other activities leading to this report included Thomas Huntzinger and Lane Letourneau, Division of Water Resources of the Kansas Department of Agriculture (KDA), Susan Erlenwein, Caroline Hosford, Jo Oliver, and Joe Renfro, Sedgwick County Department of Environmental Resources (SCDER), Andrew Megrail, Sedgwick County Conservation District, Donald Carlson, Kansas Department of Health and Environment (KDHE), Michael Dealy, Equus Beds Groundwater Management District No. 2 (GMD2), David Warren and Brian Fisher, the City of Wichita, Wess Gaylon, Wichita Area Builders Association (WABA), John Gage and Mike McNamee, U.S. Bureau of Reclamation, Andrew Ziegler and Larry M. Pope, U.S. Geological Survey (USGS), Debra Baker, Kansas Water Office (KWO), and Lawrence Skelton, Kansas Geological Survey (KGS). The USBR provided the drilling and well installation as a service. Funding for the sampling and analysis of the waters and sediment at the sand-pit sites by the USGS was as follows: the KDHE, KWO, Sedgwick County, KDA, GMD2, WABA, and the City of Wichita provided funds for phase I, KDHE provided funds for phase II, and the USGS included a cost share for both phases. Rex Buchanan, KGS, Lane Letourneau, KDA, Donald Carlson, KDHE, and Susan Erlenwein, SCDER, provided review comments on the report.
EXECUTIVE SUMMARY In December 2002, Equus Beds Groundwater Management District No. 2 and representatives of the Wichita Area Builders Association formed a Groundwater Quality Task Force to address issues regarding use of sand pits for stormwater flow management. In April 2004, the Kansas Legislature passed and the Governor approved Senate Bill 364 that amended laws on the appropriation of water in sand and gravel pits. The bill introduced a new section that included studying and developing recommendations regarding the pollution control and flood control impacts of diverting water runoff into sand and gravel pits. State and local agencies already involved in the sand pit task force developed a plan of study on the impacts of runoff into sand pits. Sedgwick County Department of Environmental Resources organized and conducted much of the efforts to select the six sand pits to study in more detail. Four of the study sites are in northwest Wichita; three of these are in residential areas and the other is surrounded by cropland. Two of the sites are in southern Wichita; one is in a more densely populated residential (mainly apartments) and commercial area, the other is in a residential location with a golf course. The study group obtained assistance from the U.S. Bureau of Reclamation to install three monitoring wells around each of the six sites selected for study. Funds were obtained for the U.S. Geological Survey (USGS) to sample and analyze surface water from the pits, ground water from the monitoring wells, and pit bottom sediment at the four sites in northwest Wichita in 2006, and at the two sites in southern Wichita in 2007. The USGS analyzed the water samples for 18 physical and chemical properties, five bacteriological values, 40 inorganic constituents, 118 pesticide and degradate compounds, and 134 organic compounds other than pesticides. The USGS analyzed the sediments for five physical and chemical properties, 45 inorganic constituents, and 32 organic compounds. This report discusses the results of the chemical analyses for the waters from the two pit sites in southern Wichita and for the sediments from all six sites. The report also includes a comparison of the water chemistry at all of the sites. Surface waters sampled from the two sand pits in southern Wichita contained several different organic compounds of concern for drinking waters. However, none of the concentrations measured exceeded drinking water standards or recommended levels, and all of the organic compounds for which standards or health advisories exist for water consumption were present at levels substantially below the standards and advisories. The organics for which there are drinking water standards or health advisories and that occurred in the surface waters of both pits were the herbicides atrazine, metolachlor, and tebuthiuron, and the solvent isophorone. These compounds were also found in some of the well-water samples at the two sites. In comparison, surface waters from the three residential pits in northwest Wichita contained a wider range of pesticide compounds. Also, the concentrations of the triazine herbicides were greater in the pit waters from the residential sites in northwest Wichita than in the southern part of the city. Ground waters at the sand-pit site within a more densely populated area of southern Wichita that included commercial land use in the vicinity contained many volatile organic compounds (VOCs), and the concentrations of three of these (chlorinated ethenes) exceeded primary drinking water standards and the presence of five others (chlorinated hydrocarbons and benzene) exceeded the maximum contaminant level goal of zero for drinking water. None of these VOCs were detected in the surface or ground waters of the other five study sites. The source of these VOCs is not expected to have been runoff into the pit but surface infiltration of the chemicals to the ground water outside the immediate pit area.
The only inorganic constituent that exceeded a primary drinking water standard was arsenic, which was found at a level slightly above the standard in a well water downgradient of the pit in a more densely populated area of southern Wichita. An arsenic concentration at the same value of this standard was found in one of the well waters at one of the residential pits in northwest Wichita. Just as for the four study sites in northwest Wichita, the surface and ground waters at the two sites in southern Wichita had total dissolved solids (TDS) contents that exceeded the recommended drinking water standard. The high TDS levels are primarily natural and result from the interaction of saline Arkansas River water, and possibly deeper saline ground water, with the alluvial aquifer and sand-pit water. Dissolved iron content exceeded the recommended drinking-water standard in two and dissolved manganese concentration exceeded the recommended standard in all of the samples from the six monitoring wells at the two sites in southern Wichita. Concentrations of these two constituents also exceeded the recommended levels in some of the waters of the northwest Wichita sites. All of the surface waters sampled from both pits in southern Wichita contained measurable or estimable contents of E. coli, fecal coliform, and total coliform bacteria but not at levels of concern to contact recreation. Similar to the study sites in northwest Wichita, the contents of these bacteria in the monitoring well samples for the southern Wichita sites were generally less than those in the surface waters. The bottom sediments of the six sand pits did not have heavy or semi-metal concentrations that exceeded the assessment guidelines for probable toxic effects on freshwater ecosystems. However, the maximum concentrations of arsenic, cadmium, chromium, copper, lead, nickel, and zinc observed in some of the bottom sediments exceeded one or more of different threshold or possible toxic effects levels for ecosystems. The insecticide DDT, four of its degradates, and PCBs were found in the sediment at the sand pit in the more densely populated area of southern Wichita. The concentration of DDT, two of its degradates, and of PCBs exceeded threshold levels for exotoxicological effect on freshwater ecosystems. The presence of DDT and PCBs at this site and not at the other pits probably reflects the greater age of the pit and the residential development at this location compared to the other study sites, because these chemicals were no longer produced in the U.S. after 1972 and 1977, respectively. The insecticide chlordane was detected in the sediment of one of the residential pits in northwest Wichita even though this chemical was banned in the U.S. in 1988. The chlordane and DDT presence at two sand pits indicates the persistent nature of these insecticides. The concentration distributions of pesticides and organics other than pesticides at the four northwest Wichita sites, as well as the general pattern in iron, manganese, and ammonium ion concentrations in the downgradient well waters relative to the upgradient well and pit waters, indicate that surface water in the sand pits enters the ground water in the southeast to south-southeast direction of the ground-water flow at the study sites. The evidence for connection between the surface and ground waters at the two southern Wichita sites is not as strong as for the four northwest Wichita sites, although the distribution of some compounds and chemical properties does support the movement of pit water to ground water. The entrance of contaminants from stormwater runoff into the ground water would be expected to occur most prominently when runoff into the pits increases the hydraulic gradient between the pit surface level and adjacent ground-water levels.
2

INTRODUCTION In December 2002, Equus Beds Groundwater Management District No. 2 (GMD2) and representatives of the Wichita Area Builders Association (WABA) agreed to form a Groundwater Quality Task Force to address issues regarding use of sand pits for stormwater flow management. The stated purpose of the task force was summarized in a letter of December 24, 2002, from the manager of GMD2 to the Kansas Department of Health and Environment [KDHE]:
“1. Determining the utility of groundwater pits as stormwater runoff management system. 2. Determining surface-water and ground-water impacts from the use of such stormwater
runoff management systems. 3. Identifying best management practices that protect the quality of ground water and
allowing the use of ground-water pits as a stormwater runoff management system. 4. Reviewing existing permitting requirements and procedures for such systems in
determining the effectiveness of such permitting requirements and procedures. 5. Developing either statewide or District-wide best management practices for use of
ground-water pits as a stormwater runoff management system.”
The letter indicated that the task force included members from the following areas of interest: a Wichita developer, Bureau of Water in the KDHE, Division of Water Resources (DWR) of the Kansas Department of Agriculture, Kansas Geological Survey (KGS), Kansas Water Office (KWO), Kansas Society of Professional Engineers, GMD2, City of Wichita - Stormwater Pollution Section, and the Sedgwick County Commission. The initial task force meeting was scheduled for January 8, 2003. The task force has been chaired by Senator Carolyn McGinn (Sedgwick County Commissioner in January 2003) of Wichita. In April 2004, the Kansas Legislature passed and the Governor approved Senate Bill 364 that amended laws on the appropriation of water in sand and gravel pits. The Bill also introduced a new section into K.S.A. 82a-734 that addressed studies and recommendations related to sand and gravel pit issues:
“New Sec. 2. The chief engineer of the division of water resources of the department of agriculture and the state geological survey shall study and develop recommendations regarding: (a) The use of water banking as it pertains to sand and gravel pits; (b) calculation of evapotranspiration and its effects on consumptive use from sand and gravel pits, with special emphasis on salt cedar (tamarisk); and (c) the pollution control and flood control impacts of diverting water runoff into sand and gravel pits. …”
The DWR and KDHE arranged meetings and conference calls for discussion of plans for the study of the pollution impacts of stormwater runoff into sand pits in response to part (c) in Section 2 of Senate Bill 364. The participants included several state and local agencies (including the DWR, KDHE, KGS, KWO, GMD2, Sedgwick County offices, and the City of Wichita) and the WABA. The KDHE awarded a Local Environmental Protection Program (LEPP) grant to Sedgwick County in May 2004 “for the purposes of initiating stormwater management policies for urban development activities in Sedgwick County with the primary focus on sensitive groundwater areas” (Sedgwick County Department of Environmental
3
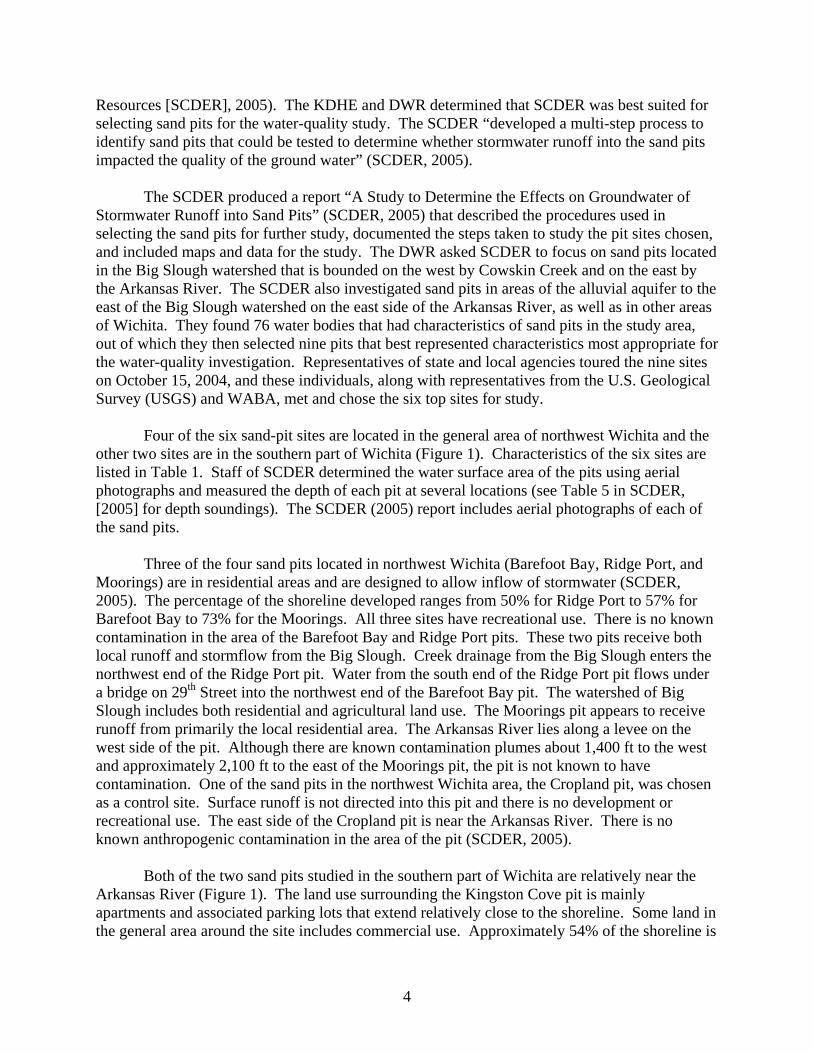
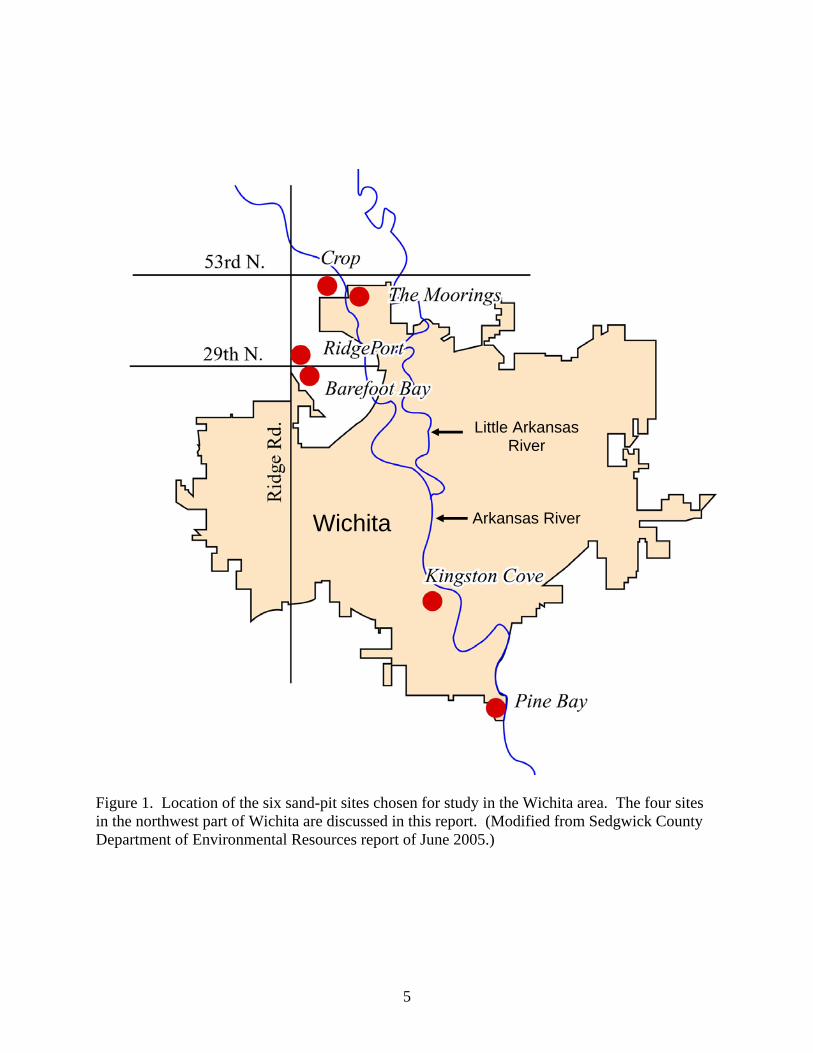
Resources [SCDER], 2005). The KDHE and DWR determined that SCDER was best suited for selecting sand pits for the water-quality study. The SCDER “developed a multi-step process to identify sand pits that could be tested to determine whether stormwater runoff into the sand pits impacted the quality of the ground water” (SCDER, 2005). The SCDER produced a report “A Study to Determine the Effects on Groundwater of Stormwater Runoff into Sand Pits” (SCDER, 2005) that described the procedures used in selecting the sand pits for further study, documented the steps taken to study the pit sites chosen, and included maps and data for the study. The DWR asked SCDER to focus on sand pits located in the Big Slough watershed that is bounded on the west by Cowskin Creek and on the east by the Arkansas River. The SCDER also investigated sand pits in areas of the alluvial aquifer to the east of the Big Slough watershed on the east side of the Arkansas River, as well as in other areas of Wichita. They found 76 water bodies that had characteristics of sand pits in the study area, out of which they then selected nine pits that best represented characteristics most appropriate for the water-quality investigation. Representatives of state and local agencies toured the nine sites on October 15, 2004, and these individuals, along with representatives from the U.S. Geological Survey (USGS) and WABA, met and chose the six top sites for study. Four of the six sand-pit sites are located in the general area of northwest Wichita and the other two sites are in the southern part of Wichita (Figure 1). Characteristics of the six sites are listed in Table 1. Staff of SCDER determined the water surface area of the pits using aerial photographs and measured the depth of each pit at several locations (see Table 5 in SCDER, [2005] for depth soundings). The SCDER (2005) report includes aerial photographs of each of the sand pits. Three of the four sand pits located in northwest Wichita (Barefoot Bay, Ridge Port, and Moorings) are in residential areas and are designed to allow inflow of stormwater (SCDER, 2005). The percentage of the shoreline developed ranges from 50% for Ridge Port to 57% for Barefoot Bay to 73% for the Moorings. All three sites have recreational use. There is no known contamination in the area of the Barefoot Bay and Ridge Port pits. These two pits receive both local runoff and stormflow from the Big Slough. Creek drainage from the Big Slough enters the northwest end of the Ridge Port pit. Water from the south end of the Ridge Port pit flows under a bridge on 29th Street into the northwest end of the Barefoot Bay pit. The watershed of Big Slough includes both residential and agricultural land use. The Moorings pit appears to receive runoff from primarily the local residential area. The Arkansas River lies along a levee on the west side of the pit. Although there are known contamination plumes about 1,400 ft to the west and approximately 2,100 ft to the east of the Moorings pit, the pit is not known to have contamination. One of the sand pits in the northwest Wichita area, the Cropland pit, was chosen as a control site. Surface runoff is not directed into this pit and there is no development or recreational use. The east side of the Cropland pit is near the Arkansas River. There is no known anthropogenic contamination in the area of the pit (SCDER, 2005). Both of the two sand pits studied in the southern part of Wichita are relatively near the Arkansas River (Figure 1). The land use surrounding the Kingston Cove pit is mainly apartments and associated parking lots that extend relatively close to the shoreline. Some land in the general area around the site includes commercial use. Approximately 54% of the shoreline is
4
Little Arkansas River
Wichita Arkansas River
Figure 1. Location of the six sand-pit sites chosen for study in the Wichita area. The four sites in the northwest part of Wichita are discussed in this report. (Modified from Sedgwick County Department of Environmental Resources report of June 2005.)
5
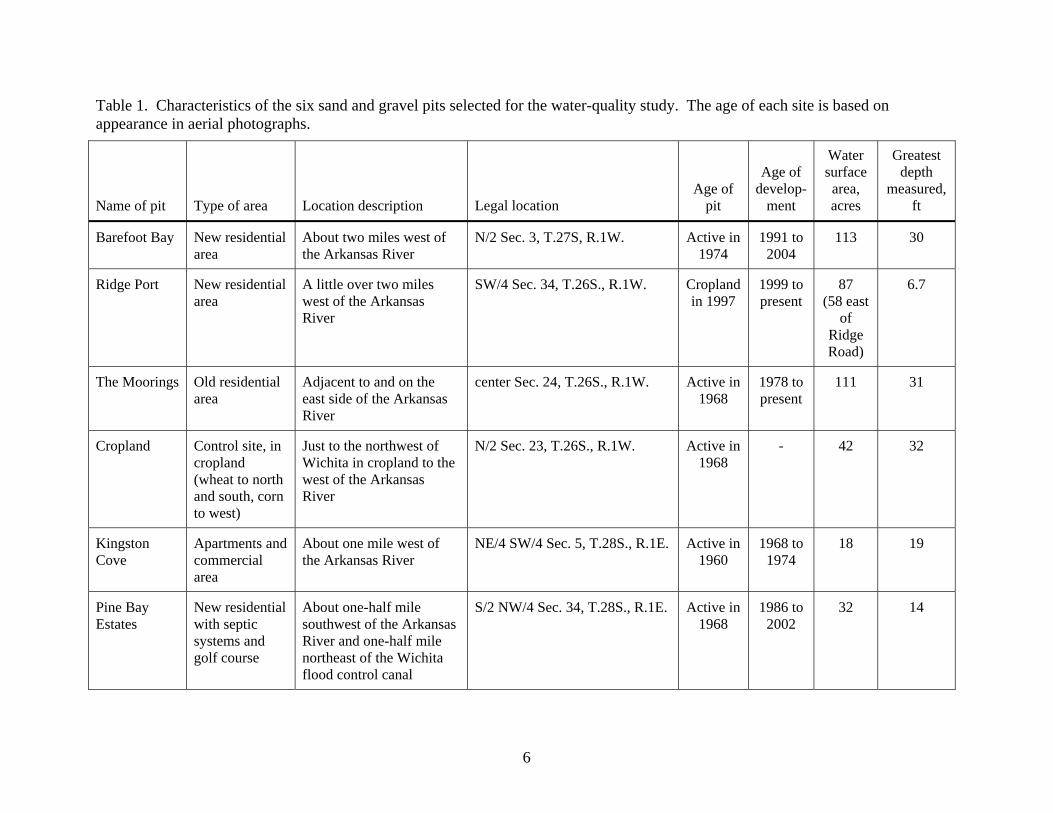
Table 1. Characteristics of the six sand and gravel pits selected for the water-quality study. The age of each site is based on appearance in aerial photographs.
Name of pit
Type of area
Location description
Legal location
Age of pit
Age of
develop-ment
Water surface area, acres
Greatest depth
measured, ft
Barefoot Bay New residential area
About two miles west of the Arkansas River
N/2 Sec. 3, T.27S, R.1W. Active in 1974
1991 to 2004
113 30
Ridge Port New residential area
A little over two miles west of the Arkansas River
SW/4 Sec. 34, T.26S., R.1W. Cropland in 1997
1999 to present
87 (58 east
of Ridge Road)
6.7
The Moorings Old residential area
Adjacent to and on the east side of the Arkansas River
center Sec. 24, T.26S., R.1W. Active in 1968
1978 to present
111 31
Cropland Control site, in cropland (wheat to north and south, corn to west)
Just to the northwest of Wichita in cropland to the west of the Arkansas River
N/2 Sec. 23, T.26S., R.1W. Active in 1968
- 42 32
Kingston Cove
Apartments and commercial area
About one mile west of the Arkansas River
NE/4 SW/4 Sec. 5, T.28S., R.1E. Active in 1960
1968 to 1974
18 19
Pine Bay Estates
New residential with septic systems and golf course
About one-half mile southwest of the Arkansas River and one-half mile northeast of the Wichita flood control canal
S/2 NW/4 Sec. 34, T.28S., R.1E. Active in 1968
1986 to 2002
32 14
6
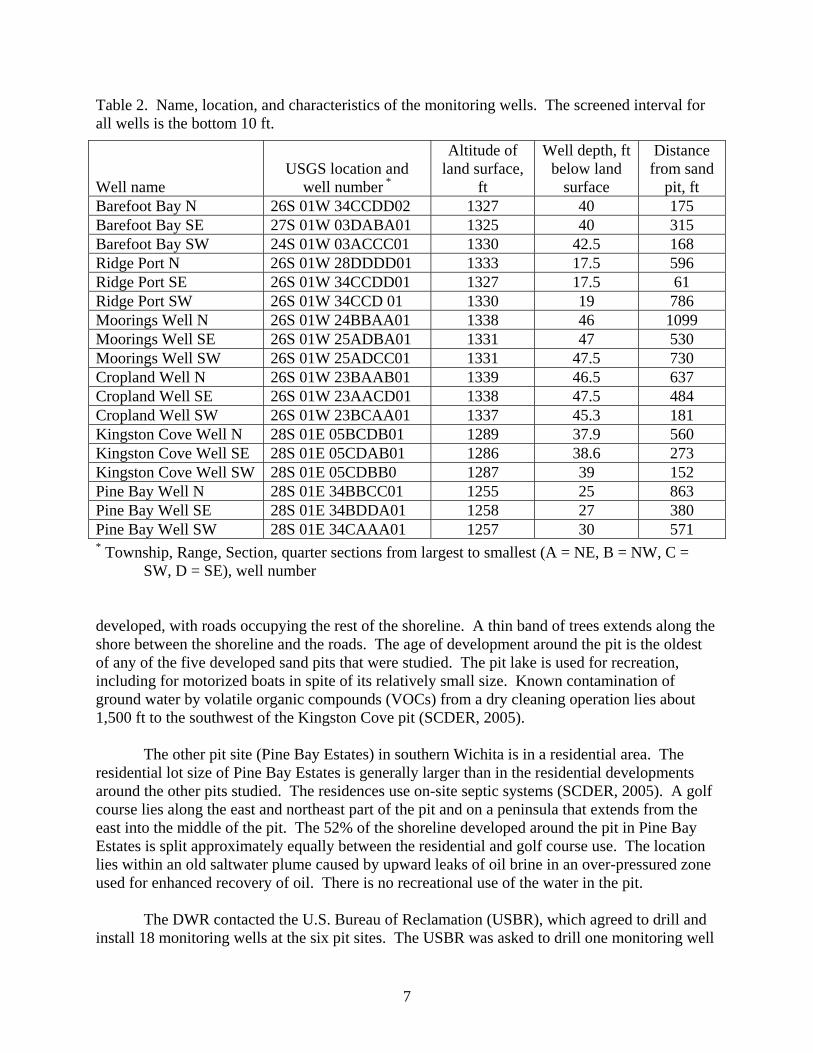
Table 2. Name, location, and characteristics of the monitoring wells. The screened interval for all wells is the bottom 10 ft.
Well name
USGS location and
well number *
Altitude of land surface,
ft
Well depth, ft below land
surface
Distance from sand
pit, ft Barefoot Bay N 26S 01W 34CCDD02 1327 40 175 Barefoot Bay SE 27S 01W 03DABA01 1325 40 315 Barefoot Bay SW 24S 01W 03ACCC01 1330 42.5 168 Ridge Port N 26S 01W 28DDDD01 1333 17.5 596 Ridge Port SE 26S 01W 34CCDD01 1327 17.5 61 Ridge Port SW 26S 01W 34CCD 01 1330 19 786 Moorings Well N 26S 01W 24BBAA01 1338 46 1099 Moorings Well SE 26S 01W 25ADBA01 1331 47 530 Moorings Well SW 26S 01W 25ADCC01 1331 47.5 730 Cropland Well N 26S 01W 23BAAB01 1339 46.5 637 Cropland Well SE 26S 01W 23AACD01 1338 47.5 484 Cropland Well SW 26S 01W 23BCAA01 1337 45.3 181 Kingston Cove Well N 28S 01E 05BCDB01 1289 37.9 560 Kingston Cove Well SE 28S 01E 05CDAB01 1286 38.6 273 Kingston Cove Well SW 28S 01E 05CDBB0 1287 39 152 Pine Bay Well N 28S 01E 34BBCC01 1255 25 863 Pine Bay Well SE 28S 01E 34BDDA01 1258 27 380 Pine Bay Well SW 28S 01E 34CAAA01 1257 30 571 * Township, Range, Section, quarter sections from largest to smallest (A = NE, B = NW, C =
SW, D = SE), well number developed, with roads occupying the rest of the shoreline. A thin band of trees extends along the shore between the shoreline and the roads. The age of development around the pit is the oldest of any of the five developed sand pits that were studied. The pit lake is used for recreation, including for motorized boats in spite of its relatively small size. Known contamination of ground water by volatile organic compounds (VOCs) from a dry cleaning operation lies about 1,500 ft to the southwest of the Kingston Cove pit (SCDER, 2005). The other pit site (Pine Bay Estates) in southern Wichita is in a residential area. The residential lot size of Pine Bay Estates is generally larger than in the residential developments around the other pits studied. The residences use on-site septic systems (SCDER, 2005). A golf course lies along the east and northeast part of the pit and on a peninsula that extends from the east into the middle of the pit. The 52% of the shoreline developed around the pit in Pine Bay Estates is split approximately equally between the residential and golf course use. The location lies within an old saltwater plume caused by upward leaks of oil brine in an over-pressured zone used for enhanced recovery of oil. There is no recreational use of the water in the pit. The DWR contacted the U.S. Bureau of Reclamation (USBR), which agreed to drill and install 18 monitoring wells at the six pit sites. The USBR was asked to drill one monitoring well
7
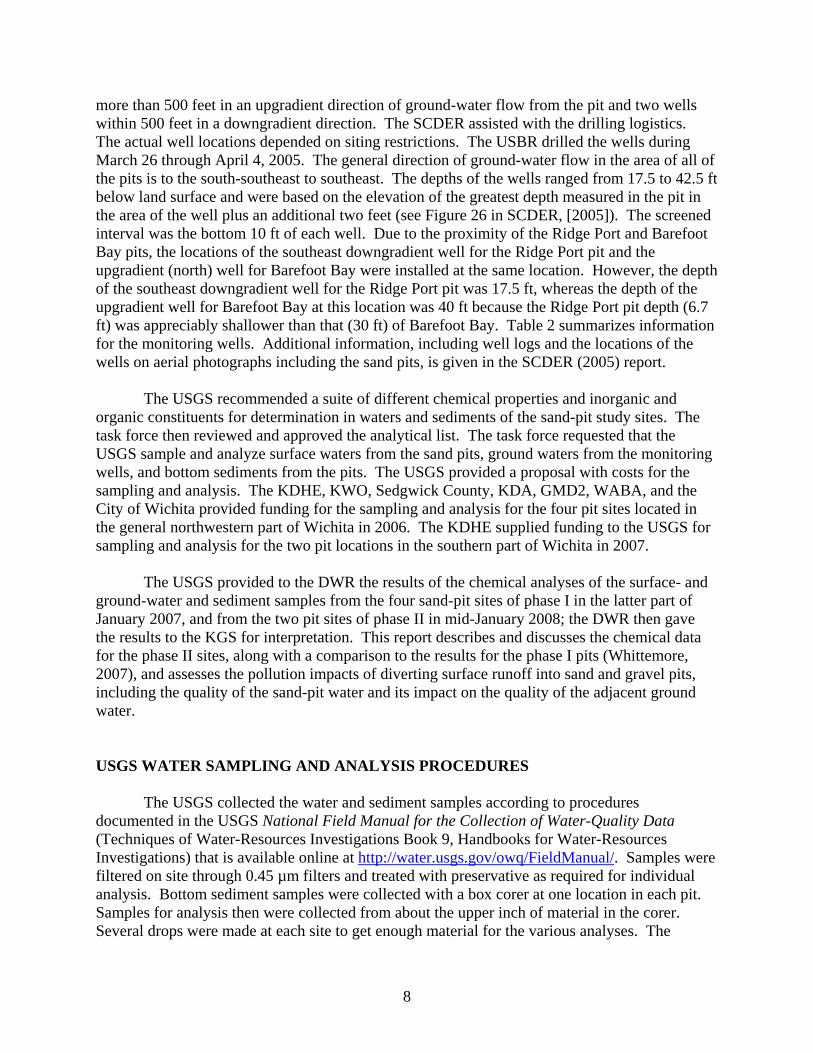
more than 500 feet in an upgradient direction of ground-water flow from the pit and two wells within 500 feet in a downgradient direction. The SCDER assisted with the drilling logistics. The actual well locations depended on siting restrictions. The USBR drilled the wells during March 26 through April 4, 2005. The general direction of ground-water flow in the area of all of the pits is to the south-southeast to southeast. The depths of the wells ranged from 17.5 to 42.5 ft below land surface and were based on the elevation of the greatest depth measured in the pit in the area of the well plus an additional two feet (see Figure 26 in SCDER, [2005]). The screened interval was the bottom 10 ft of each well. Due to the proximity of the Ridge Port and Barefoot Bay pits, the locations of the southeast downgradient well for the Ridge Port pit and the upgradient (north) well for Barefoot Bay were installed at the same location. However, the depth of the southeast downgradient well for the Ridge Port pit was 17.5 ft, whereas the depth of the upgradient well for Barefoot Bay at this location was 40 ft because the Ridge Port pit depth (6.7 ft) was appreciably shallower than that (30 ft) of Barefoot Bay. Table 2 summarizes information for the monitoring wells. Additional information, including well logs and the locations of the wells on aerial photographs including the sand pits, is given in the SCDER (2005) report. The USGS recommended a suite of different chemical properties and inorganic and organic constituents for determination in waters and sediments of the sand-pit study sites. The task force then reviewed and approved the analytical list. The task force requested that the USGS sample and analyze surface waters from the sand pits, ground waters from the monitoring wells, and bottom sediments from the pits. The USGS provided a proposal with costs for the sampling and analysis. The KDHE, KWO, Sedgwick County, KDA, GMD2, WABA, and the City of Wichita provided funding for the sampling and analysis for the four pit sites located in the general northwestern part of Wichita in 2006. The KDHE supplied funding to the USGS for sampling and analysis for the two pit locations in the southern part of Wichita in 2007. The USGS provided to the DWR the results of the chemical analyses of the surface- and ground-water and sediment samples from the four sand-pit sites of phase I in the latter part of January 2007, and from the two pit sites of phase II in mid-January 2008; the DWR then gave the results to the KGS for interpretation. This report describes and discusses the chemical data for the phase II sites, along with a comparison to the results for the phase I pits (Whittemore, 2007), and assesses the pollution impacts of diverting surface runoff into sand and gravel pits, including the quality of the sand-pit water and its impact on the quality of the adjacent ground water. USGS WATER SAMPLING AND ANALYSIS PROCEDURES The USGS collected the water and sediment samples according to procedures documented in the USGS National Field Manual for the Collection of Water-Quality Data (Techniques of Water-Resources Investigations Book 9, Handbooks for Water-Resources Investigations) that is available online at http://water.usgs.gov/owq/FieldManual/. Samples were filtered on site through 0.45 µm filters and treated with preservative as required for individual analysis. Bottom sediment samples were collected with a box corer at one location in each pit. Samples for analysis then were collected from about the upper inch of material in the corer. Several drops were made at each site to get enough material for the various analyses. The
8
material was composited, homogenized, and subsampled to meet each analytical requirement (L. Pope, USGS, personal communication). All constituents for surface and ground water samples were analyzed at the USGS National Water-Quality Laboratory, Denver, CO, except for the following:
Triazine screen; USGS Organic Research Lab, Lawrence, KS. Bacteria samples; USGS Wichita Field Office, processed within 6 hrs of collection. Coliphage; USGS Ohio Microbiological Lab; Columbus, OH. Suspended sediment; USGS Sediment Laboratory, Iowa City, IA. Cyanide; Severn-Trent Laboratory, Denver, CO.
All constituents for bottom sediment samples were analyzed at the USGS National Water-Quality Laboratory, Denver, CO, except for the following:
Bulk density, percent moisture, percent sieve diameter <0.063 mm, and percent sieve diameter <2.0 mm; USGS Kansas Water Science Center Laboratory, Lawrence, KS.
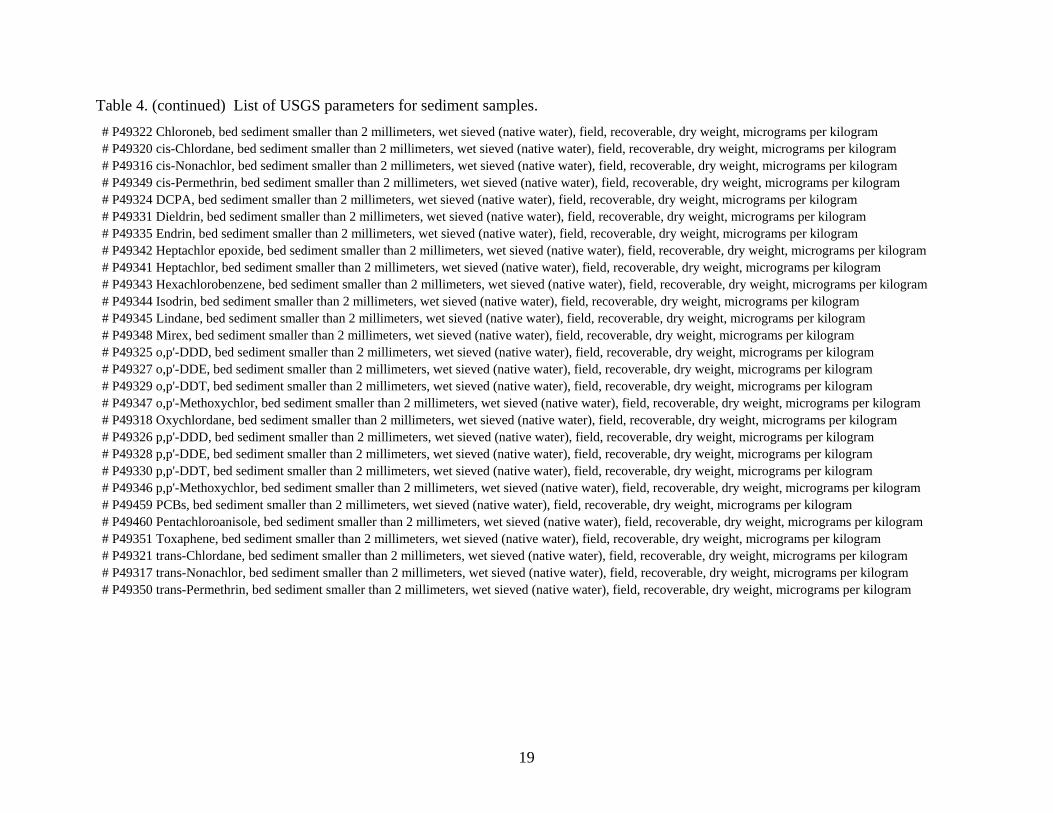
USGS CHEMICAL DATA The USGS determined physical and chemical properties (for example, temperature, specific conductance, pH, oxidation-reduction potential, alkalinity) on site in the surface- and ground-water samples. These properties also included transparency and chlorophyll content of the surface waters in the pits. Analyses in the laboratory included measurement of bacteriological content (for example, fecal and total coliform bacteria ), dissolved concentrations of major, minor, and trace inorganic constituents, and radioactivity. The laboratories determined the presence or concentration of a large number of pesticides in filtered samples and organic compounds other than pesticides in unfiltered samples. Table 3 lists all of the physical and chemical properties (18 parameters), bacteriological values (five parameters), inorganic constituents (40 parameters), pesticide compounds (119 parameters – 118 pesticides and degradates and an atrazine screen), and organic compounds other than pesticides (134 parameters) measured either on site or in the laboratory, along with information on the sampling site, such as depth to the bottom of the sand pit at the surface-water sample location, elevation of the pit water surface, and depth to and elevation of ground-water table in the monitoring wells for the water samples. Table 4 lists all of the physical and chemical properties (five parameters), carbon content and inorganic constituents (45 parameters), and organic compounds (33 parameters, primarily persistent pesticides and also chlorinated aromatic compounds) that the USGS determined in the bottom-sediment samples. The KGS requested and received from the USGS electronic files for the surface- and ground-water and sediment data. The Excel files are included on a CD in Appendix A of this report and contain the data for all six of the sites studied. The KGS examined the analytical data for the water and sediment samples to determine which physical and chemical properties and inorganic and organic constituents were of particular value for characterizing the study sites and determining the pollution impact of runoff into the pits. Tables 5 and 6 list, for the surface and ground water samples, respectively, from the
9
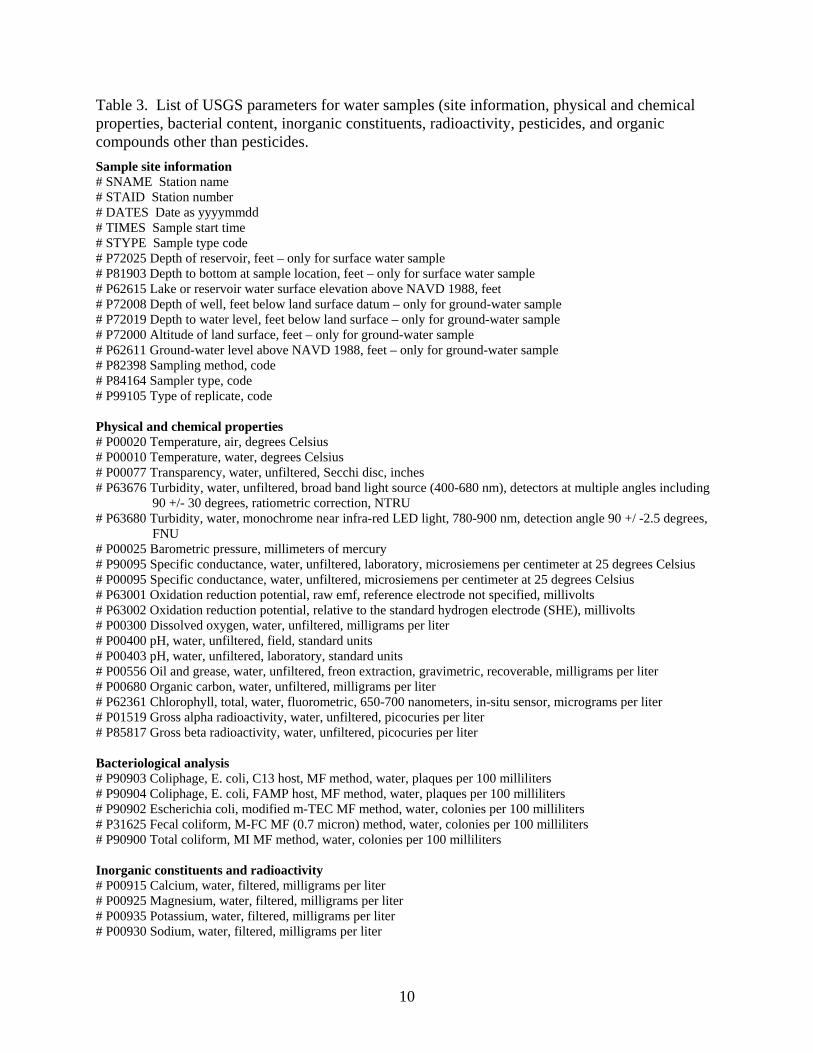
Table 3. List of USGS parameters for water samples (site information, physical and chemical properties, bacterial content, inorganic constituents, radioactivity, pesticides, and organic compounds other than pesticides. Sample site information # SNAME Station name # STAID Station number # DATES Date as yyyymmdd # TIMES Sample start time # STYPE Sample type code # P72025 Depth of reservoir, feet – only for surface water sample # P81903 Depth to bottom at sample location, feet – only for surface water sample # P62615 Lake or reservoir water surface elevation above NAVD 1988, feet # P72008 Depth of well, feet below land surface datum – only for ground-water sample # P72019 Depth to water level, feet below land surface – only for ground-water sample # P72000 Altitude of land surface, feet – only for ground-water sample # P62611 Ground-water level above NAVD 1988, feet – only for ground-water sample # P82398 Sampling method, code # P84164 Sampler type, code # P99105 Type of replicate, code Physical and chemical properties # P00020 Temperature, air, degrees Celsius # P00010 Temperature, water, degrees Celsius # P00077 Transparency, water, unfiltered, Secchi disc, inches # P63676 Turbidity, water, unfiltered, broad band light source (400-680 nm), detectors at multiple angles including 90 +/- 30 degrees, ratiometric correction, NTRU # P63680 Turbidity, water, monochrome near infra-red LED light, 780-900 nm, detection angle 90 +/ -2.5 degrees, FNU # P00025 Barometric pressure, millimeters of mercury # P90095 Specific conductance, water, unfiltered, laboratory, microsiemens per centimeter at 25 degrees Celsius # P00095 Specific conductance, water, unfiltered, microsiemens per centimeter at 25 degrees Celsius # P63001 Oxidation reduction potential, raw emf, reference electrode not specified, millivolts # P63002 Oxidation reduction potential, relative to the standard hydrogen electrode (SHE), millivolts # P00300 Dissolved oxygen, water, unfiltered, milligrams per liter # P00400 pH, water, unfiltered, field, standard units # P00403 pH, water, unfiltered, laboratory, standard units # P00556 Oil and grease, water, unfiltered, freon extraction, gravimetric, recoverable, milligrams per liter # P00680 Organic carbon, water, unfiltered, milligrams per liter # P62361 Chlorophyll, total, water, fluorometric, 650-700 nanometers, in-situ sensor, micrograms per liter # P01519 Gross alpha radioactivity, water, unfiltered, picocuries per liter # P85817 Gross beta radioactivity, water, unfiltered, picocuries per liter Bacteriological analysis # P90903 Coliphage, E. coli, C13 host, MF method, water, plaques per 100 milliliters # P90904 Coliphage, E. coli, FAMP host, MF method, water, plaques per 100 milliliters # P90902 Escherichia coli, modified m-TEC MF method, water, colonies per 100 milliliters # P31625 Fecal coliform, M-FC MF (0.7 micron) method, water, colonies per 100 milliliters # P90900 Total coliform, MI MF method, water, colonies per 100 milliliters Inorganic constituents and radioactivity # P00915 Calcium, water, filtered, milligrams per liter # P00925 Magnesium, water, filtered, milligrams per liter # P00935 Potassium, water, filtered, milligrams per liter # P00930 Sodium, water, filtered, milligrams per liter
10
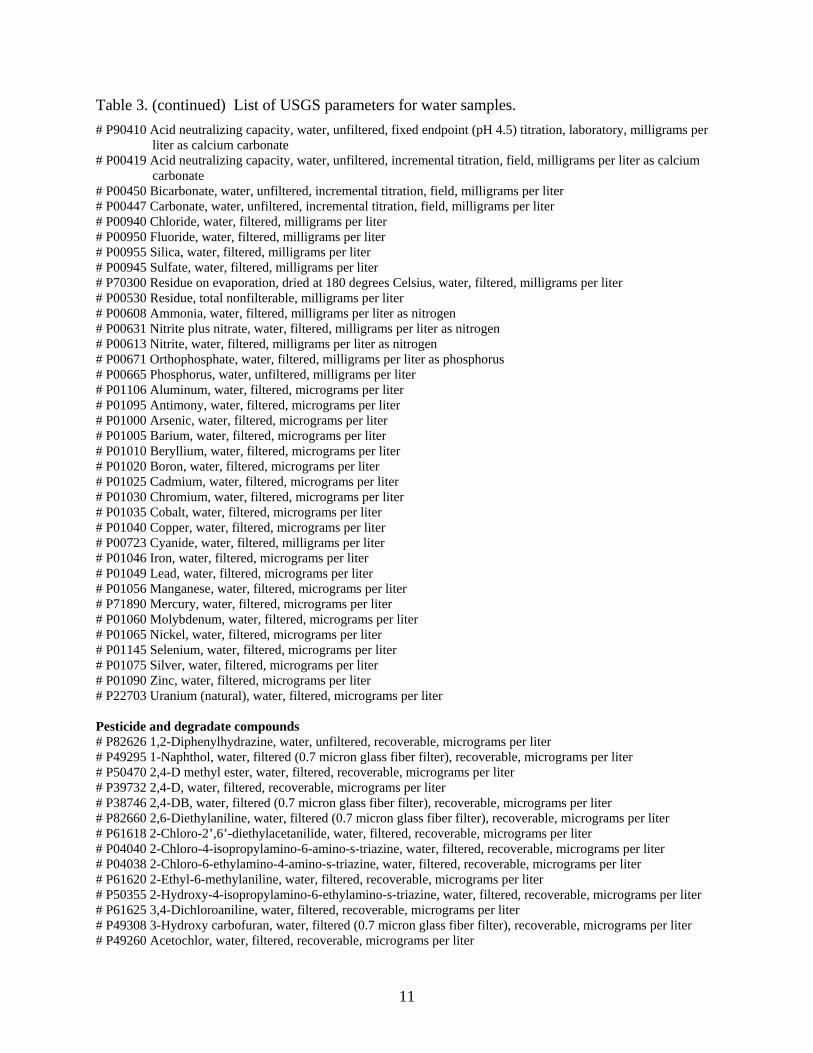
Table 3. (continued) List of USGS parameters for water samples. # P90410 Acid neutralizing capacity, water, unfiltered, fixed endpoint (pH 4.5) titration, laboratory, milligrams per liter as calcium carbonate # P00419 Acid neutralizing capacity, water, unfiltered, incremental titration, field, milligrams per liter as calcium carbonate # P00450 Bicarbonate, water, unfiltered, incremental titration, field, milligrams per liter # P00447 Carbonate, water, unfiltered, incremental titration, field, milligrams per liter # P00940 Chloride, water, filtered, milligrams per liter # P00950 Fluoride, water, filtered, milligrams per liter # P00955 Silica, water, filtered, milligrams per liter # P00945 Sulfate, water, filtered, milligrams per liter # P70300 Residue on evaporation, dried at 180 degrees Celsius, water, filtered, milligrams per liter # P00530 Residue, total nonfilterable, milligrams per liter # P00608 Ammonia, water, filtered, milligrams per liter as nitrogen # P00631 Nitrite plus nitrate, water, filtered, milligrams per liter as nitrogen # P00613 Nitrite, water, filtered, milligrams per liter as nitrogen # P00671 Orthophosphate, water, filtered, milligrams per liter as phosphorus # P00665 Phosphorus, water, unfiltered, milligrams per liter # P01106 Aluminum, water, filtered, micrograms per liter # P01095 Antimony, water, filtered, micrograms per liter # P01000 Arsenic, water, filtered, micrograms per liter # P01005 Barium, water, filtered, micrograms per liter # P01010 Beryllium, water, filtered, micrograms per liter # P01020 Boron, water, filtered, micrograms per liter # P01025 Cadmium, water, filtered, micrograms per liter # P01030 Chromium, water, filtered, micrograms per liter # P01035 Cobalt, water, filtered, micrograms per liter # P01040 Copper, water, filtered, micrograms per liter # P00723 Cyanide, water, filtered, milligrams per liter # P01046 Iron, water, filtered, micrograms per liter # P01049 Lead, water, filtered, micrograms per liter # P01056 Manganese, water, filtered, micrograms per liter # P71890 Mercury, water, filtered, micrograms per liter # P01060 Molybdenum, water, filtered, micrograms per liter # P01065 Nickel, water, filtered, micrograms per liter # P01145 Selenium, water, filtered, micrograms per liter # P01075 Silver, water, filtered, micrograms per liter # P01090 Zinc, water, filtered, micrograms per liter # P22703 Uranium (natural), water, filtered, micrograms per liter Pesticide and degradate compounds # P82626 1,2-Diphenylhydrazine, water, unfiltered, recoverable, micrograms per liter # P49295 1-Naphthol, water, filtered (0.7 micron glass fiber filter), recoverable, micrograms per liter # P50470 2,4-D methyl ester, water, filtered, recoverable, micrograms per liter # P39732 2,4-D, water, filtered, recoverable, micrograms per liter # P38746 2,4-DB, water, filtered (0.7 micron glass fiber filter), recoverable, micrograms per liter # P82660 2,6-Diethylaniline, water, filtered (0.7 micron glass fiber filter), recoverable, micrograms per liter # P61618 2-Chloro-2’,6’-diethylacetanilide, water, filtered, recoverable, micrograms per liter # P04040 2-Chloro-4-isopropylamino-6-amino-s-triazine, water, filtered, recoverable, micrograms per liter # P04038 2-Chloro-6-ethylamino-4-amino-s-triazine, water, filtered, recoverable, micrograms per liter # P61620 2-Ethyl-6-methylaniline, water, filtered, recoverable, micrograms per liter # P50355 2-Hydroxy-4-isopropylamino-6-ethylamino-s-triazine, water, filtered, recoverable, micrograms per liter # P61625 3,4-Dichloroaniline, water, filtered, recoverable, micrograms per liter # P49308 3-Hydroxy carbofuran, water, filtered (0.7 micron glass fiber filter), recoverable, micrograms per liter # P49260 Acetochlor, water, filtered, recoverable, micrograms per liter
11
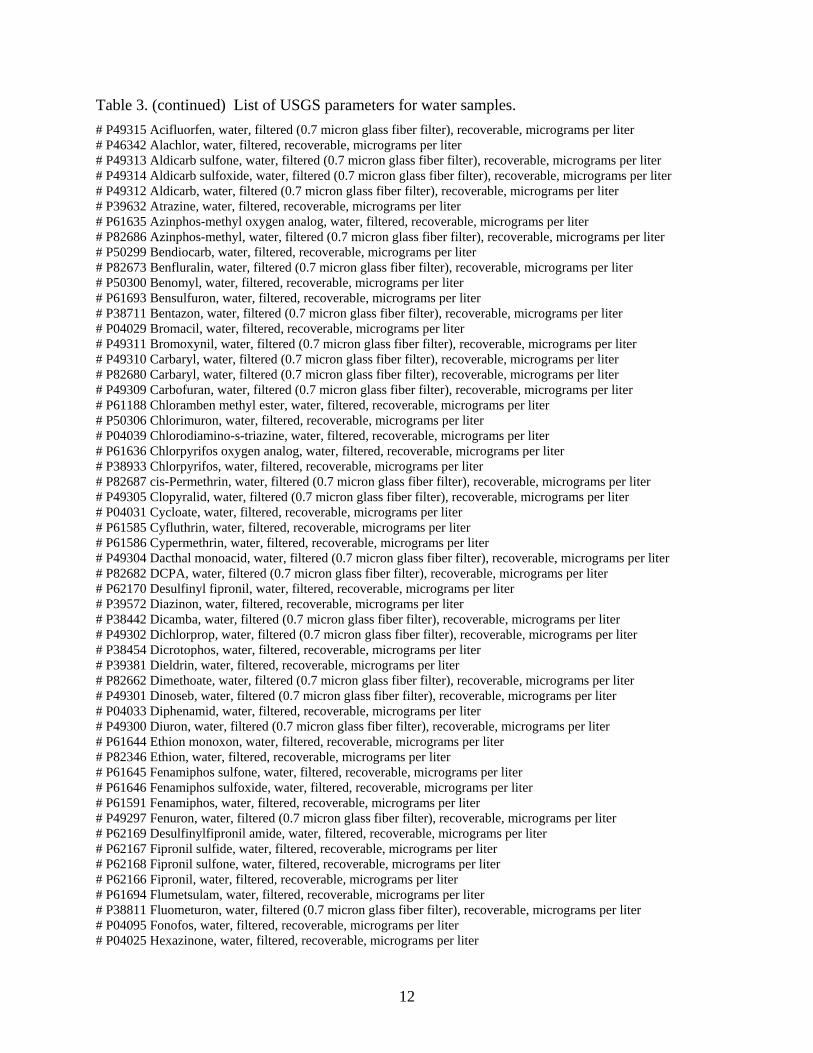
Table 3. (continued) List of USGS parameters for water samples. # P49315 Acifluorfen, water, filtered (0.7 micron glass fiber filter), recoverable, micrograms per liter # P46342 Alachlor, water, filtered, recoverable, micrograms per liter # P49313 Aldicarb sulfone, water, filtered (0.7 micron glass fiber filter), recoverable, micrograms per liter # P49314 Aldicarb sulfoxide, water, filtered (0.7 micron glass fiber filter), recoverable, micrograms per liter # P49312 Aldicarb, water, filtered (0.7 micron glass fiber filter), recoverable, micrograms per liter # P39632 Atrazine, water, filtered, recoverable, micrograms per liter # P61635 Azinphos-methyl oxygen analog, water, filtered, recoverable, micrograms per liter # P82686 Azinphos-methyl, water, filtered (0.7 micron glass fiber filter), recoverable, micrograms per liter # P50299 Bendiocarb, water, filtered, recoverable, micrograms per liter # P82673 Benfluralin, water, filtered (0.7 micron glass fiber filter), recoverable, micrograms per liter # P50300 Benomyl, water, filtered, recoverable, micrograms per liter # P61693 Bensulfuron, water, filtered, recoverable, micrograms per liter # P38711 Bentazon, water, filtered (0.7 micron glass fiber filter), recoverable, micrograms per liter # P04029 Bromacil, water, filtered, recoverable, micrograms per liter # P49311 Bromoxynil, water, filtered (0.7 micron glass fiber filter), recoverable, micrograms per liter # P49310 Carbaryl, water, filtered (0.7 micron glass fiber filter), recoverable, micrograms per liter # P82680 Carbaryl, water, filtered (0.7 micron glass fiber filter), recoverable, micrograms per liter # P49309 Carbofuran, water, filtered (0.7 micron glass fiber filter), recoverable, micrograms per liter # P61188 Chloramben methyl ester, water, filtered, recoverable, micrograms per liter # P50306 Chlorimuron, water, filtered, recoverable, micrograms per liter # P04039 Chlorodiamino-s-triazine, water, filtered, recoverable, micrograms per liter # P61636 Chlorpyrifos oxygen analog, water, filtered, recoverable, micrograms per liter # P38933 Chlorpyrifos, water, filtered, recoverable, micrograms per liter # P82687 cis-Permethrin, water, filtered (0.7 micron glass fiber filter), recoverable, micrograms per liter # P49305 Clopyralid, water, filtered (0.7 micron glass fiber filter), recoverable, micrograms per liter # P04031 Cycloate, water, filtered, recoverable, micrograms per liter # P61585 Cyfluthrin, water, filtered, recoverable, micrograms per liter # P61586 Cypermethrin, water, filtered, recoverable, micrograms per liter # P49304 Dacthal monoacid, water, filtered (0.7 micron glass fiber filter), recoverable, micrograms per liter # P82682 DCPA, water, filtered (0.7 micron glass fiber filter), recoverable, micrograms per liter # P62170 Desulfinyl fipronil, water, filtered, recoverable, micrograms per liter # P39572 Diazinon, water, filtered, recoverable, micrograms per liter # P38442 Dicamba, water, filtered (0.7 micron glass fiber filter), recoverable, micrograms per liter # P49302 Dichlorprop, water, filtered (0.7 micron glass fiber filter), recoverable, micrograms per liter # P38454 Dicrotophos, water, filtered, recoverable, micrograms per liter # P39381 Dieldrin, water, filtered, recoverable, micrograms per liter # P82662 Dimethoate, water, filtered (0.7 micron glass fiber filter), recoverable, micrograms per liter # P49301 Dinoseb, water, filtered (0.7 micron glass fiber filter), recoverable, micrograms per liter # P04033 Diphenamid, water, filtered, recoverable, micrograms per liter # P49300 Diuron, water, filtered (0.7 micron glass fiber filter), recoverable, micrograms per liter # P61644 Ethion monoxon, water, filtered, recoverable, micrograms per liter # P82346 Ethion, water, filtered, recoverable, micrograms per liter # P61645 Fenamiphos sulfone, water, filtered, recoverable, micrograms per liter # P61646 Fenamiphos sulfoxide, water, filtered, recoverable, micrograms per liter # P61591 Fenamiphos, water, filtered, recoverable, micrograms per liter # P49297 Fenuron, water, filtered (0.7 micron glass fiber filter), recoverable, micrograms per liter # P62169 Desulfinylfipronil amide, water, filtered, recoverable, micrograms per liter # P62167 Fipronil sulfide, water, filtered, recoverable, micrograms per liter # P62168 Fipronil sulfone, water, filtered, recoverable, micrograms per liter # P62166 Fipronil, water, filtered, recoverable, micrograms per liter # P61694 Flumetsulam, water, filtered, recoverable, micrograms per liter # P38811 Fluometuron, water, filtered (0.7 micron glass fiber filter), recoverable, micrograms per liter # P04095 Fonofos, water, filtered, recoverable, micrograms per liter # P04025 Hexazinone, water, filtered, recoverable, micrograms per liter
12
Table 3. (continued) List of USGS parameters for water samples. # P50356 Imazaquin, water, filtered, recoverable, micrograms per liter # P50407 Imazethapyr, water, filtered, recoverable, micrograms per liter # P61695 Imidacloprid, water, filtered, recoverable, micrograms per liter # P61593 Iprodione, water, filtered, recoverable, micrograms per liter # P61594 Isofenphos, water, filtered, recoverable, micrograms per liter # P38478 Linuron, water, filtered (0.7 micron glass fiber filter), recoverable, micrograms per liter # P61652 Malaoxon, water, filtered, recoverable, micrograms per liter # P39532 Malathion, water, filtered, recoverable, micrograms per liter # P38482 MCPA, water, filtered (0.7 micron glass fiber filter), recoverable, micrograms per liter # P38487 MCPB, water, filtered (0.7 micron glass fiber filter), recoverable, micrograms per liter # P50359 Metalaxyl, water, filtered, recoverable, micrograms per liter # P61596 Metalaxyl, water, filtered, recoverable, micrograms per liter # P61598 Methidathion, water, filtered, recoverable, micrograms per liter # P38501 Methiocarb, water, filtered (0.7 micron glass fiber filter), recoverable, micrograms per liter # P49296 Methomyl, water, filtered (0.7 micron glass fiber filter), recoverable, micrograms per liter # P61664 Methyl paraoxon, water, filtered, recoverable, micrograms per liter # P82667 Methyl parathion, water, filtered (0.7 micron glass fiber filter), recoverable, micrograms per liter # P39415 Metolachlor, water, filtered, recoverable, micrograms per liter # P82630 Metribuzin, water, filtered, recoverable, micrograms per liter # P61697 Metsulfuron, water, filtered, recoverable, micrograms per liter # P61599 Myclobutanil, water, filtered, recoverable, micrograms per liter # P61692 N-(4-Chlorophenyl)-N'-methylurea, water, filtered, recoverable, micrograms per liter # P49294 Neburon, water, filtered (0.7 micron glass fiber filter), recoverable, micrograms per liter # P50364 Nicosulfuron, water, filtered, recoverable, micrograms per liter # P49293 Norflurazon, water, filtered (0.7 micron glass fiber filter), recoverable, micrograms per liter # P49292 Oryzalin, water, filtered (0.7 micron glass fiber filter), recoverable, micrograms per liter # P38866 Oxamyl, water, filtered (0.7 micron glass fiber filter), recoverable, micrograms per liter # P82683 Pendimethalin, water, filtered (0.7 micron glass fiber filter), recoverable, micrograms per liter # P61666 Phorate oxygen analog, water, filtered, recoverable, micrograms per liter # P82664 Phorate, water, filtered (0.7 micron glass fiber filter), recoverable, micrograms per liter # P49291 Picloram, water, filtered (0.7 micron glass fiber filter), recoverable, micrograms per liter # P04037 Prometon, water, filtered, recoverable, micrograms per liter # P04036 Prometryn, water, filtered, recoverable, micrograms per liter # P82676 Propyzamide, water, filtered (0.7 micron glass fiber filter), recoverable, micrograms per liter # P49236 Propham, water, filtered (0.7 micron glass fiber filter), recoverable, micrograms per liter # P50471 Propiconazole, water, filtered, recoverable, micrograms per liter # P38538 Propoxur, water, filtered (0.7 micron glass fiber filter), recoverable, micrograms per liter # P38548 Siduron, water, filtered, recoverable, micrograms per liter # P04035 Simazine, water, filtered, recoverable, micrograms per liter # P50337 Sulfometuron, water, filtered, recoverable, micrograms per liter # P82670 Tebuthiuron, water, filtered (0.7 micron glass fiber filter), recoverable, micrograms per liter # P04032 Terbacil, water, filtered, recoverable, micrograms per liter # P61674 Terbufos oxygen analog sulfone, water, filtered, recoverable, micrograms per liter # P82675 Terbufos, water, filtered (0.7 micron glass fiber filter), recoverable, micrograms per liter # P04022 Terbuthylazine, water, filtered, recoverable, micrograms per liter # P34756 Triazine screen, water, filtered, enzyme link immuno sorbent assay, recoverable, micrograms per liter as atrazine # P61610 Tribuphos, water, filtered, recoverable, micrograms per liter # P49235 Triclopyr, water, filtered (0.7 micron glass fiber filter), recoverable, micrograms per liter # P82661 Trifluralin, water, filtered (0.7 micron glass fiber filter), recoverable, micrograms per liter # P77041 Carbon disulfide, water, unfiltered, micrograms per liter # P38775 Dichlorvos, water, filtered, recoverable, micrograms per liter
13
Table 3. (continued) List of USGS parameters for water samples. Organic compounds other than pesticides # P34621 2,4,6-Trichlorophenol, water, unfiltered, recoverable, micrograms per liter # P34601 2,4-Dichlorophenol, water, unfiltered, recoverable, micrograms per liter # P34606 2,4-Dimethylphenol, water, unfiltered, recoverable, micrograms per liter # P34616 2,4-Dinitrophenol, water, unfiltered, recoverable, micrograms per liter # P34611 2,4-Dinitrotoluene, water, unfiltered, recoverable, micrograms per liter # P34626 2,6-Dinitrotoluene, water, unfiltered, recoverable, micrograms per liter # P34581 2-Chloronaphthalene, water, unfiltered, recoverable, micrograms per liter # P34586 2-Chlorophenol, water, unfiltered, recoverable, micrograms per liter # P34657 2-Methyl-4,6-dinitrophenol, water, unfiltered, recoverable, micrograms per liter # P34591 2-Nitrophenol, water, unfiltered, recoverable, micrograms per liter # P34631 3,3'-Dichlorobenzidine, water, unfiltered, recoverable, micrograms per liter # P34636 4-Bromophenyl phenyl ether, water, unfiltered, recoverable, micrograms per liter # P61633 4-Chloro-2-methylphenol, water, filtered, recoverable, micrograms per liter # P34452 4-Chloro-3-methylphenol, water, unfiltered, recoverable, micrograms per liter # P34641 4-Chlorophenyl phenyl ether, water, unfiltered, recoverable, micrograms per liter # P34646 4-Nitrophenol, water, unfiltered, recoverable, micrograms per liter # P34381 9H-Fluorene, water, unfiltered, recoverable, micrograms per liter # P34205 Acenaphthene, water, unfiltered, recoverable, micrograms per liter # P34200 Acenaphthylene, water, unfiltered, recoverable, micrograms per liter # P34220 Anthracene, water, unfiltered, recoverable, micrograms per liter # P34526 Benzo[a]anthracene, water, unfiltered, recoverable, micrograms per liter # P34247 Benzo[a]pyrene, water, unfiltered, recoverable, micrograms per liter # P34230 Benzo[b]fluoranthene, water, unfiltered, recoverable, micrograms per liter # P34521 Benzo[ghi]perylene, water, unfiltered, recoverable, micrograms per liter # P34242 Benzo[k]fluoranthene, water, unfiltered, recoverable, micrograms per liter # P34292 Benzyl n-butyl phthalate, water, unfiltered, recoverable, micrograms per liter # P34278 Bis(2-chloroethoxy)methane, water, unfiltered, recoverable, micrograms per liter # P34273 Bis(2-chloroethyl) ether, water, unfiltered, recoverable, micrograms per liter # P34283 Bis(2-chloroisopropyl) ether, water, unfiltered, recoverable, micrograms per liter # P39100 Bis(2-ethylhexyl) phthalate, water, unfiltered, recoverable, micrograms per liter # P50305 Caffeine, water, filtered, recoverable, micrograms per liter # P34320 Chrysene, water, unfiltered, recoverable, micrograms per liter # P34556 Dibenzo[a,h]anthracene, water, unfiltered, recoverable, micrograms per liter # P34336 Diethyl phthalate, water, unfiltered, recoverable, micrograms per liter # P34341 Dimethyl phthalate, water, unfiltered, recoverable, micrograms per liter # P39110 Di-n-butyl phthalate, water, unfiltered, recoverable, micrograms per liter # P34596 Di-n-octyl phthalate, water, unfiltered, recoverable, micrograms per liter # P34376 Fluoranthene, water, unfiltered, recoverable, micrograms per liter # P39700 Hexachlorobenzene, water, unfiltered, recoverable, micrograms per liter # P34386 Hexachlorocyclopentadiene, water, unfiltered, recoverable, micrograms per liter # P34403 Indeno[1,2,3-cd]pyrene, water, unfiltered, recoverable, micrograms per liter # P34408 Isophorone, water, unfiltered, recoverable, micrograms per liter # P34447 Nitrobenzene, water, unfiltered, recoverable, micrograms per liter # P34438 N-Nitrosodimethylamine, water, unfiltered, recoverable, micrograms per liter # P34428 N-Nitrosodi-n-propylamine, water, unfiltered, recoverable, micrograms per liter # P34433 N-Nitrosodiphenylamine, water, unfiltered, recoverable, micrograms per liter # P39032 Pentachlorophenol, water, unfiltered, recoverable, micrograms per liter # P34461 Phenanthrene, water, unfiltered, recoverable, micrograms per liter # P34694 Phenol, water, unfiltered, recoverable, micrograms per liter # P34469 Pyrene, water, unfiltered, recoverable, micrograms per liter # P77562 1,1,1,2-Tetrachloroethane, water, unfiltered, recoverable, micrograms per liter # P34506 1,1,1-Trichloroethane, water, unfiltered, recoverable, micrograms per liter # P34516 1,1,2,2-Tetrachloroethane, water, unfiltered, recoverable, micrograms per liter
14
Table 3. (continued) List of USGS parameters for water samples. # P77652 1,1,2-Trichloro-1,2,2-trifluoroethane, water, unfiltered, recoverable, micrograms per liter # P34511 1,1,2-Trichloroethane, water, unfiltered, recoverable, micrograms per liter # P34496 1,1-Dichloroethane, water, unfiltered, recoverable, micrograms per liter # P34501 1,1-Dichloroethene, water, unfiltered, recoverable, micrograms per liter # P77168 1,1-Dichloropropene, water, unfiltered, recoverable, micrograms per liter # P49999 1,2,3,4-Tetramethylbenzene, water, unfiltered, recoverable, micrograms per liter # P50000 1,2,3,5-Tetramethylbenzene, water, unfiltered, recoverable, micrograms per liter # P77613 1,2,3-Trichlorobenzene, water, unfiltered, recoverable, micrograms per liter # P77443 1,2,3-Trichloropropane, water, unfiltered, recoverable, micrograms per liter # P77221 1,2,3-Trimethylbenzene, water, unfiltered, recoverable, micrograms per liter # P34551 1,2,4-Trichlorobenzene, water, unfiltered, recoverable, micrograms per liter # P77222 1,2,4-Trimethylbenzene, water, unfiltered, recoverable, micrograms per liter # P82625 1,2-Dibromo-3-chloropropane, water, unfiltered, recoverable, micrograms per liter # P77651 1,2-Dibromoethane, water, unfiltered, recoverable, micrograms per liter # P34536 1,2-Dichlorobenzene, water, unfiltered, recoverable, micrograms per liter # P32103 1,2-Dichloroethane, water, unfiltered, recoverable, micrograms per liter # P34541 1,2-Dichloropropane, water, unfiltered, recoverable, micrograms per liter # P77226 1,3,5-Trimethylbenzene, water, unfiltered, recoverable, micrograms per liter # P34566 1,3-Dichlorobenzene, water, unfiltered, recoverable, micrograms per liter # P77173 1,3-Dichloropropane, water, unfiltered, recoverable, micrograms per liter # P34571 1,4-Dichlorobenzene, water, unfiltered, recoverable, micrograms per liter # P77170 2,2-Dichloropropane, water, unfiltered, recoverable, micrograms per liter # P77275 2-Chlorotoluene, water, unfiltered, recoverable, micrograms per liter # P77220 2-Ethyltoluene, water, unfiltered, recoverable, micrograms per liter # P78109 3-Chloropropene, water, unfiltered, recoverable, micrograms per liter # P77277 4-Chlorotoluene, water, unfiltered, recoverable, micrograms per liter # P77356 4-Isopropyltoluene, water, unfiltered, recoverable, micrograms per liter # P81552 Acetone, water, unfiltered, recoverable, micrograms per liter # P34215 Acrylonitrile, water, unfiltered, recoverable, micrograms per liter # P34030 Benzene, water, unfiltered, recoverable, micrograms per liter # P81555 Bromobenzene, water, unfiltered, recoverable, micrograms per liter # P77297 Bromochloromethane, water, unfiltered, recoverable, micrograms per liter # P32101 Bromodichloromethane, water, unfiltered, recoverable, micrograms per liter # P50002 Bromoethene, water, unfiltered, recoverable, micrograms per liter # P34413 Bromomethane, water, unfiltered, recoverable, micrograms per liter # P34301 Chlorobenzene, water, unfiltered, recoverable, micrograms per liter # P34311 Chloroethane, water, unfiltered, recoverable, micrograms per liter # P34418 Chloromethane, water, unfiltered, recoverable, micrograms per liter # P77093 cis-1,2-Dichloroethene, water, unfiltered, recoverable, micrograms per liter # P34704 cis-1,3-Dichloropropene, water, unfiltered, recoverable, micrograms per liter # P32105 Dibromochloromethane, water, unfiltered, recoverable, micrograms per liter # P30217 Dibromomethane, water, unfiltered, recoverable, micrograms per liter # P34668 Dichlorodifluoromethane, water, unfiltered, recoverable, micrograms per liter # P34423 Dichloromethane, water, unfiltered, recoverable, micrograms per liter # P81576 Diethyl ether, water, unfiltered, recoverable, micrograms per liter # P81577 Diisopropyl ether, water, unfiltered, recoverable, micrograms per liter # P73570 Ethyl methacrylate, water, unfiltered, recoverable, micrograms per liter # P81595 Ethyl methyl ketone, water, unfiltered, recoverable, micrograms per liter # P34371 Ethylbenzene, water, unfiltered, recoverable, micrograms per liter # P39702 Hexachlorobutadiene, water, unfiltered, recoverable, micrograms per liter # P34396 Hexachloroethane, water, unfiltered, recoverable, micrograms per liter # P77424 Iodomethane, water, unfiltered, recoverable, micrograms per liter # P78133 Isobutyl methyl ketone, water, unfiltered, recoverable, micrograms per liter # P77223 Isopropylbenzene, water, unfiltered, recoverable, micrograms per liter
15
16
Table 3. (continued) List of USGS parameters for water samples. # P81593 Methyl acrylonitrile, water, unfiltered, recoverable, micrograms per liter # P49991 Methyl acrylate, water, unfiltered, recoverable, micrograms per liter # P81597 Methyl methacrylate, water, unfiltered, recoverable, micrograms per liter # P50005 Methyl tert-pentyl ether, water, unfiltered, recoverable, micrograms per liter # P85795 m-Xylene plus p-xylene, water, unfiltered, recoverable, micrograms per liter # P34696 Naphthalene, water, unfiltered, recoverable, micrograms per liter # P77103 n-Butyl methyl ketone, water, unfiltered, recoverable, micrograms per liter # P77342 n-Butylbenzene, water, unfiltered, recoverable, micrograms per liter # P77224 n-Propylbenzene, water, unfiltered, recoverable, micrograms per liter # P77135 o-Xylene, water, unfiltered, recoverable, micrograms per liter # P77350 sec-Butylbenzene, water, unfiltered, recoverable, micrograms per liter # P77128 Styrene, water, unfiltered, recoverable, micrograms per liter # P50004 tert-Butyl ethyl ether, water, unfiltered, recoverable, micrograms per liter # P78032 Methyl tert-butyl ether, water, unfiltered, recoverable, micrograms per liter # P77353 tert-Butylbenzene, water, unfiltered, recoverable, micrograms per liter # P34475 Tetrachloroethene, water, unfiltered, recoverable, micrograms per liter # P32102 Tetrachloromethane, water, unfiltered, recoverable, micrograms per liter # P81607 Tetrahydrofuran, water, unfiltered, recoverable, micrograms per liter # P34010 Toluene, water, unfiltered, recoverable, micrograms per liter # P34546 trans-1,2-Dichloroethene, water, unfiltered, recoverable, micrograms per liter # P34699 trans-1,3-Dichloropropene, water, unfiltered, recoverable, micrograms per liter # P73547 trans-1,4-Dichloro-2-butene, water, unfiltered, recoverable, micrograms per liter # P32104 Tribromomethane, water, unfiltered, recoverable, micrograms per liter # P39180 Trichloroethene, water, unfiltered, recoverable, micrograms per liter # P34488 Trichlorofluoromethane, water, unfiltered, recoverable, micrograms per liter # P32106 Trichloromethane, water, unfiltered, recoverable, micrograms per liter # P39175 Vinyl chloride, water, unfiltered, recoverable, micrograms per liter
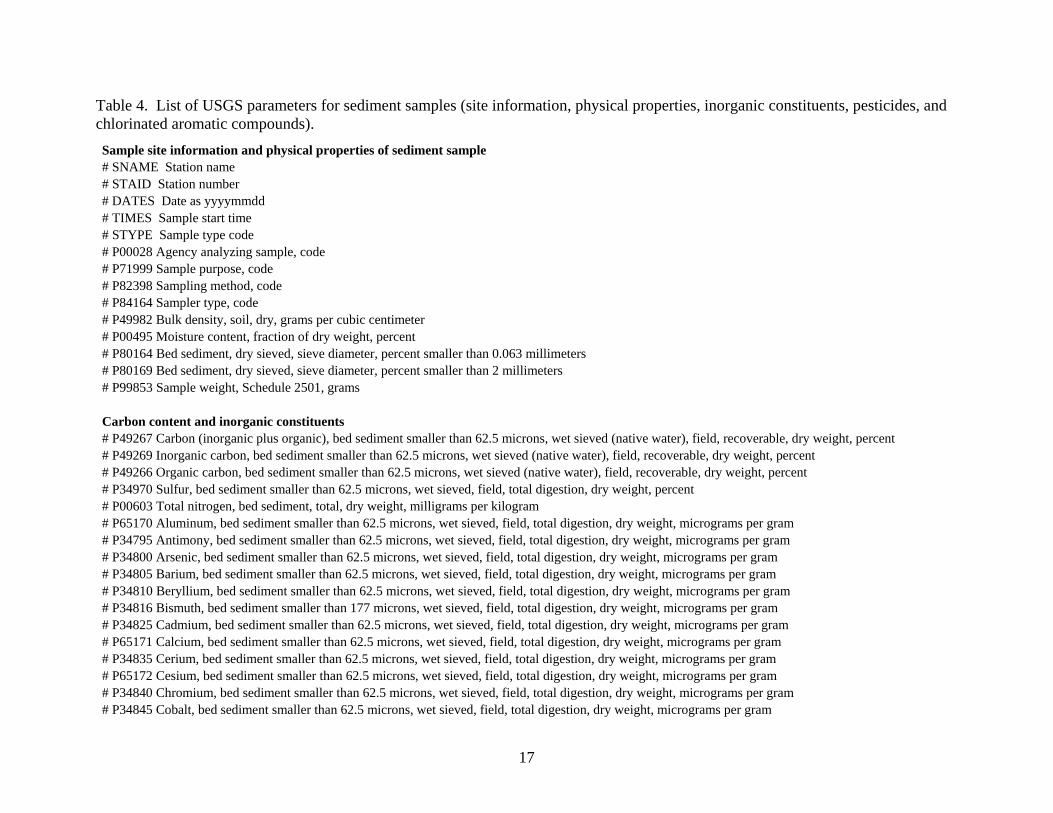
Table 4. List of USGS parameters for sediment samples (site information, physical properties, inorganic constituents, pesticides, and chlorinated aromatic compounds). Sample site information and physical properties of sediment sample # SNAME Station name # STAID Station number # DATES Date as yyyymmdd # TIMES Sample start time # STYPE Sample type code # P00028 Agency analyzing sample, code # P71999 Sample purpose, code # P82398 Sampling method, code # P84164 Sampler type, code # P49982 Bulk density, soil, dry, grams per cubic centimeter # P00495 Moisture content, fraction of dry weight, percent # P80164 Bed sediment, dry sieved, sieve diameter, percent smaller than 0.063 millimeters # P80169 Bed sediment, dry sieved, sieve diameter, percent smaller than 2 millimeters # P99853 Sample weight, Schedule 2501, grams Carbon content and inorganic constituents # P49267 Carbon (inorganic plus organic), bed sediment smaller than 62.5 microns, wet sieved (native water), field, recoverable, dry weight, percent # P49269 Inorganic carbon, bed sediment smaller than 62.5 microns, wet sieved (native water), field, recoverable, dry weight, percent # P49266 Organic carbon, bed sediment smaller than 62.5 microns, wet sieved (native water), field, recoverable, dry weight, percent # P34970 Sulfur, bed sediment smaller than 62.5 microns, wet sieved, field, total digestion, dry weight, percent # P00603 Total nitrogen, bed sediment, total, dry weight, milligrams per kilogram # P65170 Aluminum, bed sediment smaller than 62.5 microns, wet sieved, field, total digestion, dry weight, micrograms per gram # P34795 Antimony, bed sediment smaller than 62.5 microns, wet sieved, field, total digestion, dry weight, micrograms per gram # P34800 Arsenic, bed sediment smaller than 62.5 microns, wet sieved, field, total digestion, dry weight, micrograms per gram # P34805 Barium, bed sediment smaller than 62.5 microns, wet sieved, field, total digestion, dry weight, micrograms per gram # P34810 Beryllium, bed sediment smaller than 62.5 microns, wet sieved, field, total digestion, dry weight, micrograms per gram # P34816 Bismuth, bed sediment smaller than 177 microns, wet sieved, field, total digestion, dry weight, micrograms per gram # P34825 Cadmium, bed sediment smaller than 62.5 microns, wet sieved, field, total digestion, dry weight, micrograms per gram # P65171 Calcium, bed sediment smaller than 62.5 microns, wet sieved, field, total digestion, dry weight, micrograms per gram # P34835 Cerium, bed sediment smaller than 62.5 microns, wet sieved, field, total digestion, dry weight, micrograms per gram # P65172 Cesium, bed sediment smaller than 62.5 microns, wet sieved, field, total digestion, dry weight, micrograms per gram # P34840 Chromium, bed sediment smaller than 62.5 microns, wet sieved, field, total digestion, dry weight, micrograms per gram # P34845 Cobalt, bed sediment smaller than 62.5 microns, wet sieved, field, total digestion, dry weight, micrograms per gram
17
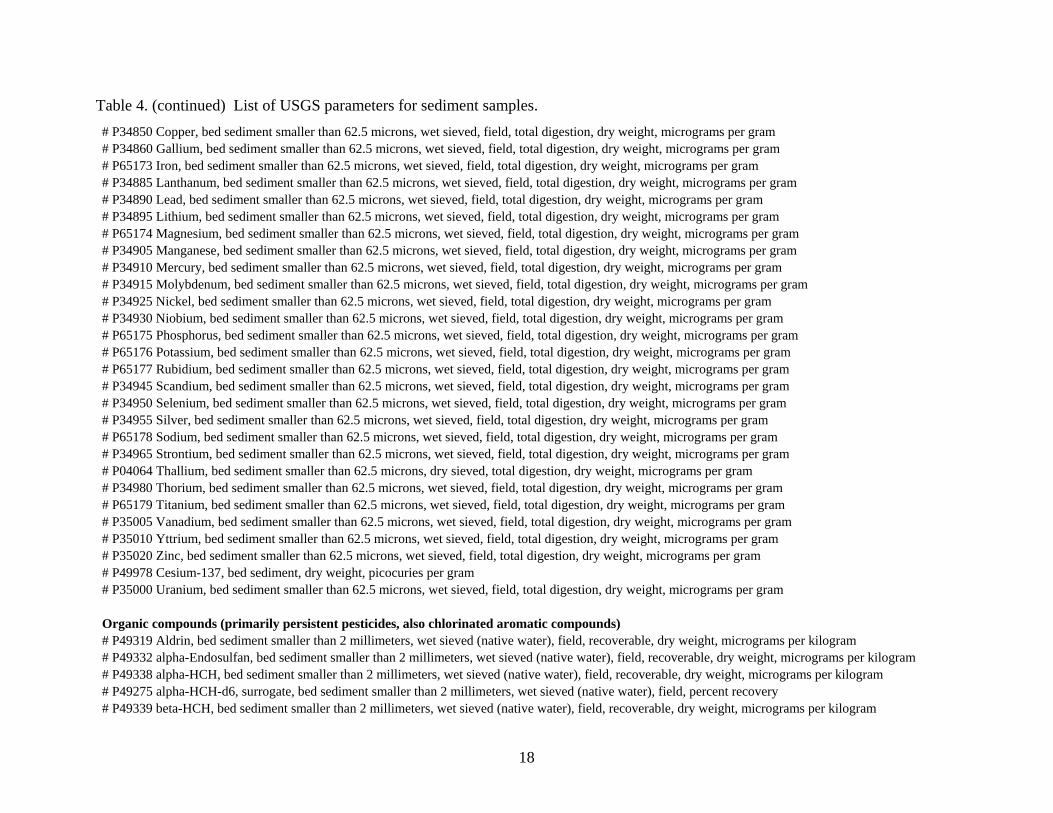
Table 4. (continued) List of USGS parameters for sediment samples. # P34850 Copper, bed sediment smaller than 62.5 microns, wet sieved, field, total digestion, dry weight, micrograms per gram # P34860 Gallium, bed sediment smaller than 62.5 microns, wet sieved, field, total digestion, dry weight, micrograms per gram # P65173 Iron, bed sediment smaller than 62.5 microns, wet sieved, field, total digestion, dry weight, micrograms per gram # P34885 Lanthanum, bed sediment smaller than 62.5 microns, wet sieved, field, total digestion, dry weight, micrograms per gram # P34890 Lead, bed sediment smaller than 62.5 microns, wet sieved, field, total digestion, dry weight, micrograms per gram # P34895 Lithium, bed sediment smaller than 62.5 microns, wet sieved, field, total digestion, dry weight, micrograms per gram # P65174 Magnesium, bed sediment smaller than 62.5 microns, wet sieved, field, total digestion, dry weight, micrograms per gram # P34905 Manganese, bed sediment smaller than 62.5 microns, wet sieved, field, total digestion, dry weight, micrograms per gram # P34910 Mercury, bed sediment smaller than 62.5 microns, wet sieved, field, total digestion, dry weight, micrograms per gram # P34915 Molybdenum, bed sediment smaller than 62.5 microns, wet sieved, field, total digestion, dry weight, micrograms per gram # P34925 Nickel, bed sediment smaller than 62.5 microns, wet sieved, field, total digestion, dry weight, micrograms per gram # P34930 Niobium, bed sediment smaller than 62.5 microns, wet sieved, field, total digestion, dry weight, micrograms per gram # P65175 Phosphorus, bed sediment smaller than 62.5 microns, wet sieved, field, total digestion, dry weight, micrograms per gram # P65176 Potassium, bed sediment smaller than 62.5 microns, wet sieved, field, total digestion, dry weight, micrograms per gram # P65177 Rubidium, bed sediment smaller than 62.5 microns, wet sieved, field, total digestion, dry weight, micrograms per gram # P34945 Scandium, bed sediment smaller than 62.5 microns, wet sieved, field, total digestion, dry weight, micrograms per gram # P34950 Selenium, bed sediment smaller than 62.5 microns, wet sieved, field, total digestion, dry weight, micrograms per gram # P34955 Silver, bed sediment smaller than 62.5 microns, wet sieved, field, total digestion, dry weight, micrograms per gram # P65178 Sodium, bed sediment smaller than 62.5 microns, wet sieved, field, total digestion, dry weight, micrograms per gram # P34965 Strontium, bed sediment smaller than 62.5 microns, wet sieved, field, total digestion, dry weight, micrograms per gram # P04064 Thallium, bed sediment smaller than 62.5 microns, dry sieved, total digestion, dry weight, micrograms per gram # P34980 Thorium, bed sediment smaller than 62.5 microns, wet sieved, field, total digestion, dry weight, micrograms per gram # P65179 Titanium, bed sediment smaller than 62.5 microns, wet sieved, field, total digestion, dry weight, micrograms per gram # P35005 Vanadium, bed sediment smaller than 62.5 microns, wet sieved, field, total digestion, dry weight, micrograms per gram # P35010 Yttrium, bed sediment smaller than 62.5 microns, wet sieved, field, total digestion, dry weight, micrograms per gram # P35020 Zinc, bed sediment smaller than 62.5 microns, wet sieved, field, total digestion, dry weight, micrograms per gram # P49978 Cesium-137, bed sediment, dry weight, picocuries per gram # P35000 Uranium, bed sediment smaller than 62.5 microns, wet sieved, field, total digestion, dry weight, micrograms per gram Organic compounds (primarily persistent pesticides, also chlorinated aromatic compounds) # P49319 Aldrin, bed sediment smaller than 2 millimeters, wet sieved (native water), field, recoverable, dry weight, micrograms per kilogram # P49332 alpha-Endosulfan, bed sediment smaller than 2 millimeters, wet sieved (native water), field, recoverable, dry weight, micrograms per kilogram # P49338 alpha-HCH, bed sediment smaller than 2 millimeters, wet sieved (native water), field, recoverable, dry weight, micrograms per kilogram # P49275 alpha-HCH-d6, surrogate, bed sediment smaller than 2 millimeters, wet sieved (native water), field, percent recovery # P49339 beta-HCH, bed sediment smaller than 2 millimeters, wet sieved (native water), field, recoverable, dry weight, micrograms per kilogram
18
19
Table 4. (continued) List of USGS parameters for sediment samples. # P49322 Chloroneb, bed sediment smaller than 2 millimeters, wet sieved (native water), field, recoverable, dry weight, micrograms per kilogram # P49320 cis-Chlordane, bed sediment smaller than 2 millimeters, wet sieved (native water), field, recoverable, dry weight, micrograms per kilogram # P49316 cis-Nonachlor, bed sediment smaller than 2 millimeters, wet sieved (native water), field, recoverable, dry weight, micrograms per kilogram # P49349 cis-Permethrin, bed sediment smaller than 2 millimeters, wet sieved (native water), field, recoverable, dry weight, micrograms per kilogram # P49324 DCPA, bed sediment smaller than 2 millimeters, wet sieved (native water), field, recoverable, dry weight, micrograms per kilogram # P49331 Dieldrin, bed sediment smaller than 2 millimeters, wet sieved (native water), field, recoverable, dry weight, micrograms per kilogram # P49335 Endrin, bed sediment smaller than 2 millimeters, wet sieved (native water), field, recoverable, dry weight, micrograms per kilogram # P49342 Heptachlor epoxide, bed sediment smaller than 2 millimeters, wet sieved (native water), field, recoverable, dry weight, micrograms per kilogram # P49341 Heptachlor, bed sediment smaller than 2 millimeters, wet sieved (native water), field, recoverable, dry weight, micrograms per kilogram # P49343 Hexachlorobenzene, bed sediment smaller than 2 millimeters, wet sieved (native water), field, recoverable, dry weight, micrograms per kilogram # P49344 Isodrin, bed sediment smaller than 2 millimeters, wet sieved (native water), field, recoverable, dry weight, micrograms per kilogram # P49345 Lindane, bed sediment smaller than 2 millimeters, wet sieved (native water), field, recoverable, dry weight, micrograms per kilogram # P49348 Mirex, bed sediment smaller than 2 millimeters, wet sieved (native water), field, recoverable, dry weight, micrograms per kilogram # P49325 o,p'-DDD, bed sediment smaller than 2 millimeters, wet sieved (native water), field, recoverable, dry weight, micrograms per kilogram # P49327 o,p'-DDE, bed sediment smaller than 2 millimeters, wet sieved (native water), field, recoverable, dry weight, micrograms per kilogram # P49329 o,p'-DDT, bed sediment smaller than 2 millimeters, wet sieved (native water), field, recoverable, dry weight, micrograms per kilogram # P49347 o,p'-Methoxychlor, bed sediment smaller than 2 millimeters, wet sieved (native water), field, recoverable, dry weight, micrograms per kilogram # P49318 Oxychlordane, bed sediment smaller than 2 millimeters, wet sieved (native water), field, recoverable, dry weight, micrograms per kilogram # P49326 p,p'-DDD, bed sediment smaller than 2 millimeters, wet sieved (native water), field, recoverable, dry weight, micrograms per kilogram # P49328 p,p'-DDE, bed sediment smaller than 2 millimeters, wet sieved (native water), field, recoverable, dry weight, micrograms per kilogram # P49330 p,p'-DDT, bed sediment smaller than 2 millimeters, wet sieved (native water), field, recoverable, dry weight, micrograms per kilogram # P49346 p,p'-Methoxychlor, bed sediment smaller than 2 millimeters, wet sieved (native water), field, recoverable, dry weight, micrograms per kilogram # P49459 PCBs, bed sediment smaller than 2 millimeters, wet sieved (native water), field, recoverable, dry weight, micrograms per kilogram # P49460 Pentachloroanisole, bed sediment smaller than 2 millimeters, wet sieved (native water), field, recoverable, dry weight, micrograms per kilogram # P49351 Toxaphene, bed sediment smaller than 2 millimeters, wet sieved (native water), field, recoverable, dry weight, micrograms per kilogram # P49321 trans-Chlordane, bed sediment smaller than 2 millimeters, wet sieved (native water), field, recoverable, dry weight, micrograms per kilogram # P49317 trans-Nonachlor, bed sediment smaller than 2 millimeters, wet sieved (native water), field, recoverable, dry weight, micrograms per kilogram # P49350 trans-Permethrin, bed sediment smaller than 2 millimeters, wet sieved (native water), field, recoverable, dry weight, micrograms per kilogram
Kingston Cove and Pine Bay Estates sites only the chemical properties and inorganic constituent concentrations discussed in the next section of this report. Tables 7 and 8 list all of the bacteriological parameters for these two sites. Tables 9 and 10 list only those pesticide compounds that were detected or for which concentrations were measured or estimated in at least one sample from the two sites. Tables 11 and 12 list only those organic compounds other than pesticides that were detected or for which concentrations were measured or estimated in at least one sample from the two sites. Table 13 lists physical and chemical properties of the bottom-sediment samples collected from the sand pits, along with the concentrations of metals for which screening values exist for ecotoxicological assessment for potential threat to aquatic life and of persistent organic compounds detected in at least one of the samples. Table 13 also includes data for the other four pits because the ecotoxicological assessment for metals was expanded for these study sites in this phase II report. DISCUSSION OF CHEMICAL DATA – WATER The USGS collected surface-water samples from the sand pits for chemical properties and inorganic constituent concentrations on three different dates (Table 5), and for bacteriological analyses on four different dates (Table 7) in April and May, 2007, for the Kingston Cove and Pine Bay Estates sites. The sample collection depth below the water surface ranged from 5 to 10 ft for Kingston Cove and 4 to 5 ft for Pine Bay for the samples analyzed for inorganic constituents, and from 1 to 7 ft for Kingston Cove and 1 to 5 ft for Pine Bay for the samples measured for bacteriological content. The USGS collected surface-water samples from each of the Kingston Cove and Pine Bay pits on May 9, 2007, for analyses of pesticides and organics other than pesticides (Tables 9 and 11, respectively). They also conducted an atrazine screen on one of the same dates from Kingston Cove and two of the same dates from Pine Bay and as for the sample collection for inorganic constituents, as well as on May 3, 2007, from Kingston Cove (Table 9). The USGS collected ground-water samples from each of the monitoring wells for determination of chemical properties, bacteriological content, and concentrations of inorganic constituents, pesticides, and organic compounds other than pesticides on May 29, 2007, at the Kingston Cove site and on May 30, 2007, at the Pine Bay site (Tables 6, 8, 10, and 12). Chemical Properties and Inorganic Constituents The data for chemical properties (including radioactivity) and concentrations of inorganic constituents for which there are drinking water standards are listed, along with oxidation-reduction potential and organic carbon and ammonia contents, for the surface- and ground-water samples in Tables 5 and 6, respectively, for the Kingston Cove and Pine Bay sites. A drinking-water standard also exists for thallium but thallium was not determined in the water samples. Table 14 summarizes the highest concentrations of inorganic constituents and the highest radioactivity measured in the surface and ground waters, along with maximum contaminant levels (MCL) and secondary maximum contaminant levels (SMCL). The MCL is the highest level of a constituent that is allowed in drinking water according to public water supply regulations. The SMCL is a recommended level that is not regulated.
20
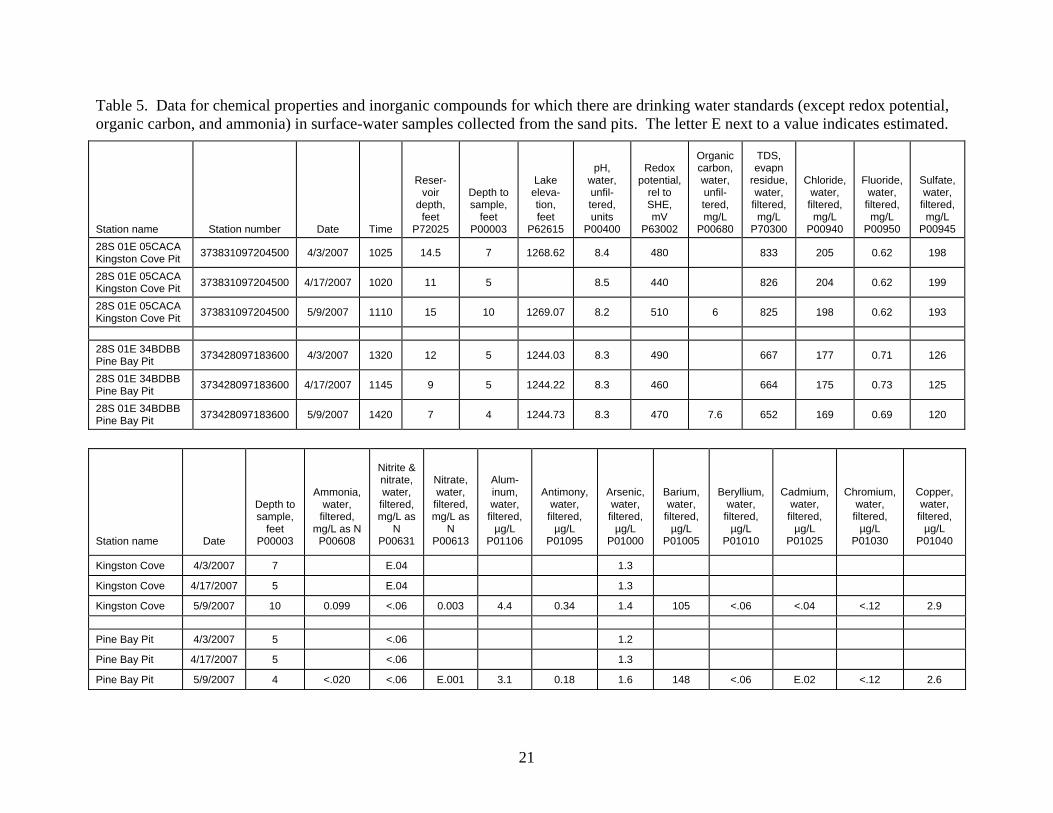
Table 5. Data for chemical properties and inorganic compounds for which there are drinking water standards (except redox potential, organic carbon, and ammonia) in surface-water samples collected from the sand pits. The letter E next to a value indicates estimated.
Station name
Station number
Date
Time
Reser-voir
depth, feet
P72025
Depth to sample,
feet P00003
Lake eleva-tion, feet
P62615
pH,
water, unfil-tered, units
P00400
Redox
potential, rel to SHE, mV
P63002
Organic carbon, water, unfil-tered, mg/L
P00680
TDS, evapn
residue, water,
filtered, mg/L
P70300
Chloride, water,
filtered, mg/L
P00940
Fluoride, water,
filtered, mg/L
P00950
Sulfate, water,
filtered, mg/L
P00945 28S 01E 05CACA Kingston Cove Pit 373831097204500 4/3/2007 1025 14.5 7 1268.62 8.4 480 833 205 0.62 198
28S 01E 05CACA Kingston Cove Pit 373831097204500 4/17/2007 1020 11 5 8.5 440 826 204 0.62 199
28S 01E 05CACA Kingston Cove Pit 373831097204500 5/9/2007 1110 15 10 1269.07 8.2 510 6 825 198 0.62 193
28S 01E 34BDBB Pine Bay Pit 373428097183600 4/3/2007 1320 12 5 1244.03 8.3 490 667 177 0.71 126
28S 01E 34BDBB Pine Bay Pit 373428097183600 4/17/2007 1145 9 5 1244.22 8.3 460 664 175 0.73 125
28S 01E 34BDBB Pine Bay Pit 373428097183600 5/9/2007 1420 7 4 1244.73 8.3 470 7.6 652 169 0.69 120
Station name
Date
Depth to sample,
feet P00003
Ammonia, water,
filtered, mg/L as N P00608
Nitrite & nitrate, water,
filtered, mg/L as
N P00631
Nitrate, water,
filtered, mg/L as
N P00613
Alum-inum, water,
filtered, µg/L
P01106
Antimony, water,
filtered, µg/L
P01095
Arsenic, water,
filtered, µg/L
P01000
Barium, water,
filtered, µg/L
P01005
Beryllium, water,
filtered, µg/L
P01010
Cadmium, water,
filtered, µg/L
P01025
Chromium, water,
filtered, µg/L
P01030
Copper, water,
filtered, µg/L
P01040
Kingston Cove 4/3/2007 7 E.04 1.3
Kingston Cove 4/17/2007 5 E.04 1.3
Kingston Cove 5/9/2007 10 0.099 <.06 0.003 4.4 0.34 1.4 105 <.06 <.04 <.12 2.9 Pine Bay Pit 4/3/2007 5 <.06 1.2
Pine Bay Pit 4/17/2007 5 <.06 1.3
Pine Bay Pit 5/9/2007 4 <.020 <.06 E.001 3.1 0.18 1.6 148 <.06 E.02 <.12 2.6
21
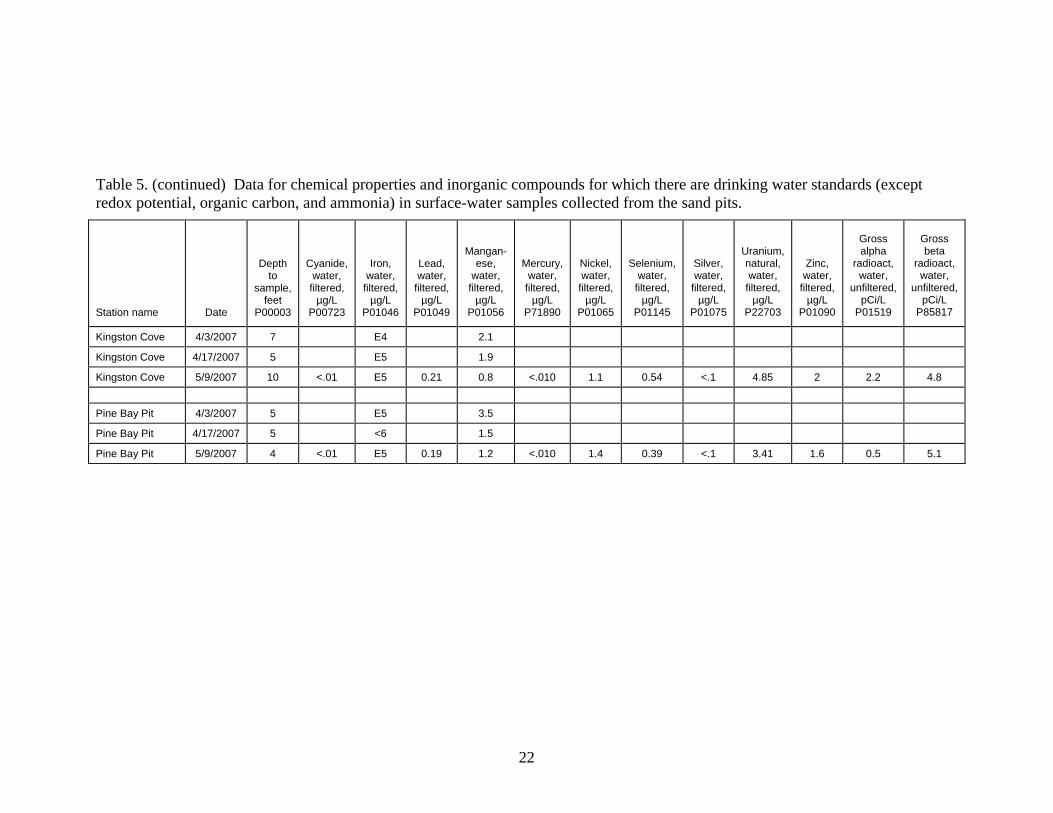
Table 5. (continued) Data for chemical properties and inorganic compounds for which there are drinking water standards (except redox potential, organic carbon, and ammonia) in surface-water samples collected from the sand pits. Station name
Date
Depth to
sample, feet
P00003
Cyanide, water,
filtered, µg/L
P00723
Iron, water,
filtered, µg/L
P01046
Lead, water,
filtered, µg/L
P01049
Mangan-ese,
water, filtered,
µg/L P01056
Mercury, water,
filtered, µg/L
P71890
Nickel, water,
filtered, µg/L
P01065
Selenium, water,
filtered, µg/L
P01145
Silver, water,
filtered, µg/L
P01075
Uranium, natural, water,
filtered, µg/L
P22703
Zinc, water,
filtered, µg/L
P01090
Gross alpha
radioact, water,
unfiltered, pCi/L
P01519
Gross beta
radioact, water,
unfiltered, pCi/L
P85817
Kingston Cove 4/3/2007 7 E4 2.1
Kingston Cove 4/17/2007 5 E5 1.9
Kingston Cove 5/9/2007 10 <.01 E5 0.21 0.8 <.010 1.1 0.54 <.1 4.85 2 2.2 4.8
Pine Bay Pit 4/3/2007 5 E5 3.5
Pine Bay Pit 4/17/2007 5 <6 1.5
Pine Bay Pit 5/9/2007 4 <.01 E5 0.19 1.2 <.010 1.4 0.39 <.1 3.41 1.6 0.5 5.1
22
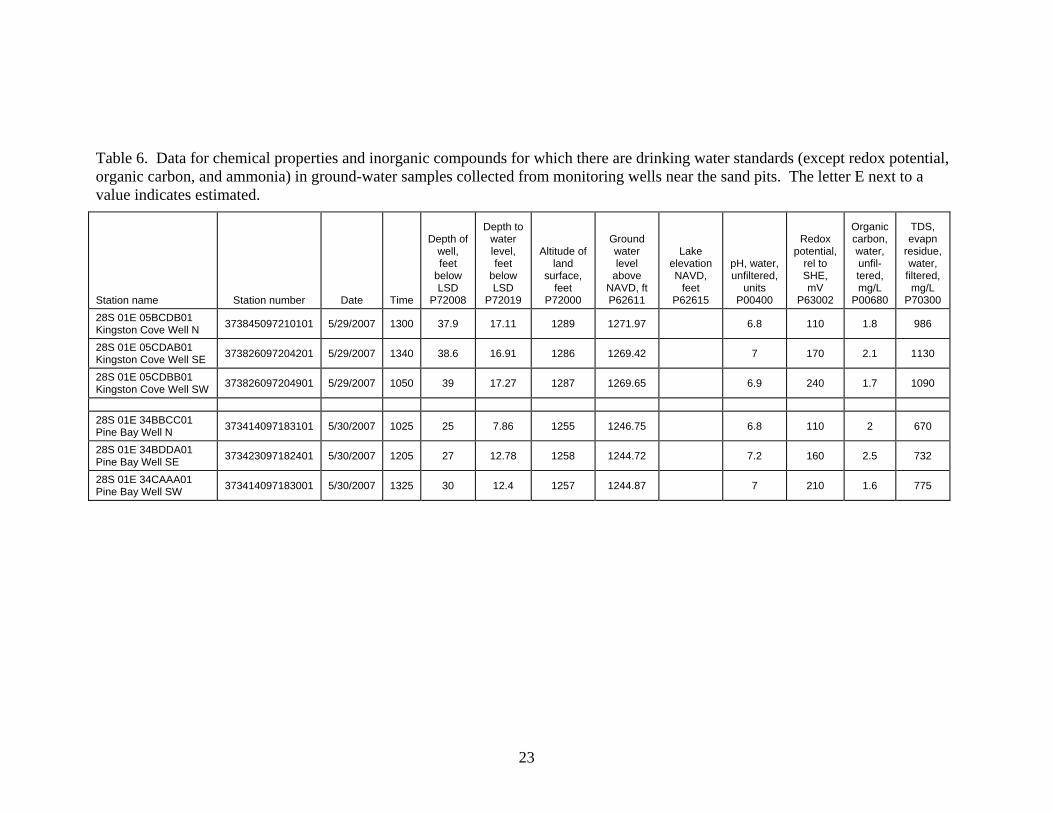
Table 6. Data for chemical properties and inorganic compounds for which there are drinking water standards (except redox potential, organic carbon, and ammonia) in ground-water samples collected from monitoring wells near the sand pits. The letter E next to a value indicates estimated.
Station name
Station number
Date
Time
Depth of
well, feet
below LSD
P72008
Depth to water level, feet
below LSD
P72019
Altitude of land
surface, feet
P72000
Ground water level
above NAVD, ft P62611
Lake elevation NAVD,
feet P62615
pH, water, unfiltered,
units P00400
Redox
potential, rel to SHE, mV
P63002
Organic carbon, water, unfil-tered, mg/L
P00680
TDS, evapn
residue, water,
filtered, mg/L
P70300 28S 01E 05BCDB01 Kingston Cove Well N 373845097210101 5/29/2007 1300 37.9 17.11 1289 1271.97 6.8 110 1.8 986
28S 01E 05CDAB01 Kingston Cove Well SE 373826097204201 5/29/2007 1340 38.6 16.91 1286 1269.42 7 170 2.1 1130
28S 01E 05CDBB01 Kingston Cove Well SW 373826097204901 5/29/2007 1050 39 17.27 1287 1269.65 6.9 240 1.7 1090
28S 01E 34BBCC01 Pine Bay Well N 373414097183101 5/30/2007 1025 25 7.86 1255 1246.75 6.8 110 2 670
28S 01E 34BDDA01 Pine Bay Well SE 373423097182401 5/30/2007 1205 27 12.78 1258 1244.72 7.2 160 2.5 732
28S 01E 34CAAA01 Pine Bay Well SW 373414097183001 5/30/2007 1325 30 12.4 1257 1244.87 7 210 1.6 775
23
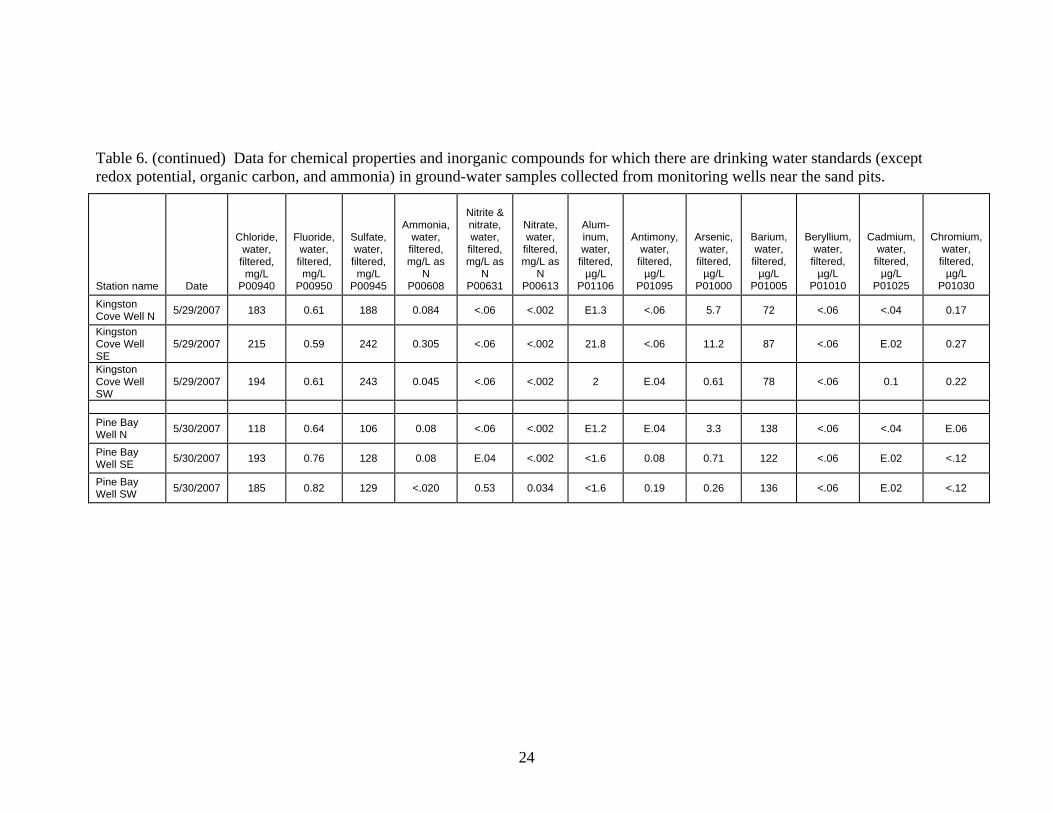
Table 6. (continued) Data for chemical properties and inorganic compounds for which there are drinking water standards (except redox potential, organic carbon, and ammonia) in ground-water samples collected from monitoring wells near the sand pits.
Station name
Date
Chloride, water,
filtered, mg/L
P00940
Fluoride, water,
filtered, mg/L
P00950
Sulfate, water,
filtered, mg/L
P00945
Ammonia, water,
filtered, mg/L as
N P00608
Nitrite & nitrate, water,
filtered, mg/L as
N P00631
Nitrate, water,
filtered, mg/L as
N P00613
Alum-inum, water,
filtered, µg/L
P01106
Antimony, water,
filtered, µg/L
P01095
Arsenic, water,
filtered, µg/L
P01000
Barium, water,
filtered, µg/L
P01005
Beryllium, water,
filtered, µg/L
P01010
Cadmium, water,
filtered, µg/L
P01025
Chromium, water,
filtered, µg/L
P01030
Kingston Cove Well N 5/29/2007 183 0.61 188 0.084 <.06 <.002 E1.3 <.06 5.7 72 <.06 <.04 0.17
Kingston Cove Well SE
5/29/2007 215 0.59 242 0.305 <.06 <.002 21.8 <.06 11.2 87 <.06 E.02 0.27
Kingston Cove Well SW
5/29/2007 194 0.61 243 0.045 <.06 <.002 2 E.04 0.61 78 <.06 0.1 0.22
Pine Bay Well N 5/30/2007 118 0.64 106 0.08 <.06 <.002 E1.2 E.04 3.3 138 <.06 <.04 E.06
Pine Bay Well SE 5/30/2007 193 0.76 128 0.08 E.04 <.002 <1.6 0.08 0.71 122 <.06 E.02 <.12
Pine Bay Well SW 5/30/2007 185 0.82 129 <.020 0.53 0.034 <1.6 0.19 0.26 136 <.06 E.02 <.12
24

Table 6. (continued) Data for chemical properties and inorganic compounds for which there are drinking water standards (except redox potential, organic carbon, and ammonia) in ground-water samples collected from monitoring wells near the sand pits.
Station name
Date
Copper, water,
filtered, µg/L
P01040
Cyanide, water,
filtered, µg/L
P00723
Iron, water,
filtered, µg/L
P01046
Lead, water,
filtered, µg/L
P01049
Mangan-ese,
water, filtered,
µg/L P01056
Mercury, water,
filtered, µg/L
P71890
Nickel, water,
filtered, µg/L
P01065
Selenium, water,
filtered, µg/L
P01145
Silver, water,
filtered, µg/L
P01075
Uranium, natural, water,
filtered, µg/L
P22703
Zinc, water,
filtered, µg/L
P01090
Gross alpha
radioact, water,
unfiltered, pCi/L
P01519
Gross beta
radioact, water,
unfiltered, pCi/L
P85817
Kingston Cove Well N 5/29/2007 E.35 <.01 1350 <.12 313 <.010 0.68 0.1 <.1 4.67 3.5 2 4
Kingston Cove Well SE
5/29/2007 1.1 <.01 184 0.12 1240 <.010 2.6 E.04 <.1 2.98 2.9 -0.1 4
Kingston Cove Well SW
5/29/2007 2.3 <.01 18 0.28 269 <.010 2.7 0.15 <.1 4.38 5 7 3.6
Pine Bay Well N 5/30/2007 2.7 <.01 2370 0.19 500 <.010 1.4 <.08 <.1 4.46 11.3 9 3.9
Pine Bay Well SE 5/30/2007 0.49 <.01 124 <.12 93 <.010 1.8 0.1 <.1 1.36 0.61 -1.2 4.3
Pine Bay Well SW 5/30/2007 0.77 <.01 E5 <.12 65.9 <.010 1.5 1.5 <.1 4.7 1.8 2.3 6
25

Table 7. Data for bacteriological analyses for surface-water samples collected from the sand pits. The letter E next to a value indicates estimated. Station name
Station number
Date
Time
Reservoir depth, feet
P72025
Depth to sample,
feet P81903
Lake elevation,
NAVD, feet
P62615
Coliphage,
E. coli, C13 host,
plaques per 100 mL P90903
Coliphage,
E. coli, FAMP host, plaques per
100 mL P90904
E. coli, colonies per 100
mL P90902
Fecal
coliform, colonies per 100
mL P31625
Total
coliform, colonies per 100
mL P90900
28S 01E 05CACA Kingston Cove Pit 373831097204500 4/3/2007 1026 14.5 7 1268.62 E12 E14
28S 01E 05CACA Kingston Cove Pit 373831097204500 4/17/2007 1021 11 5 E5 E4
28S 01E 05CACA Kingston Cove Pit 373831097204500 4/19/2007 1050 11 1 1268.62 14 23 E1200
28S 01E 05CACA Kingston Cove Pit 373831097204500 5/9/2007 1111 15 1 1269.07 <1 <1 76 97 930
28S 01E 34BDBB Pine Bay Pit 373428097183600 4/3/2007 1321 12 5 1244.03 E2 E9
28S 01E 34BDBB Pine Bay Pit 373428097183600 4/17/2007 1146 9 5 1244.22 E6 E16
28S 01E 34BDBB Pine Bay Pit 373428097183600 4/19/2007 1215 9 1 1244.25 E3 E5 300
28S 01E 34BDBB Pine Bay Pit 373428097183600 5/9/2007 1421 7 1 1244.73 <1 <1 2 6 37
26
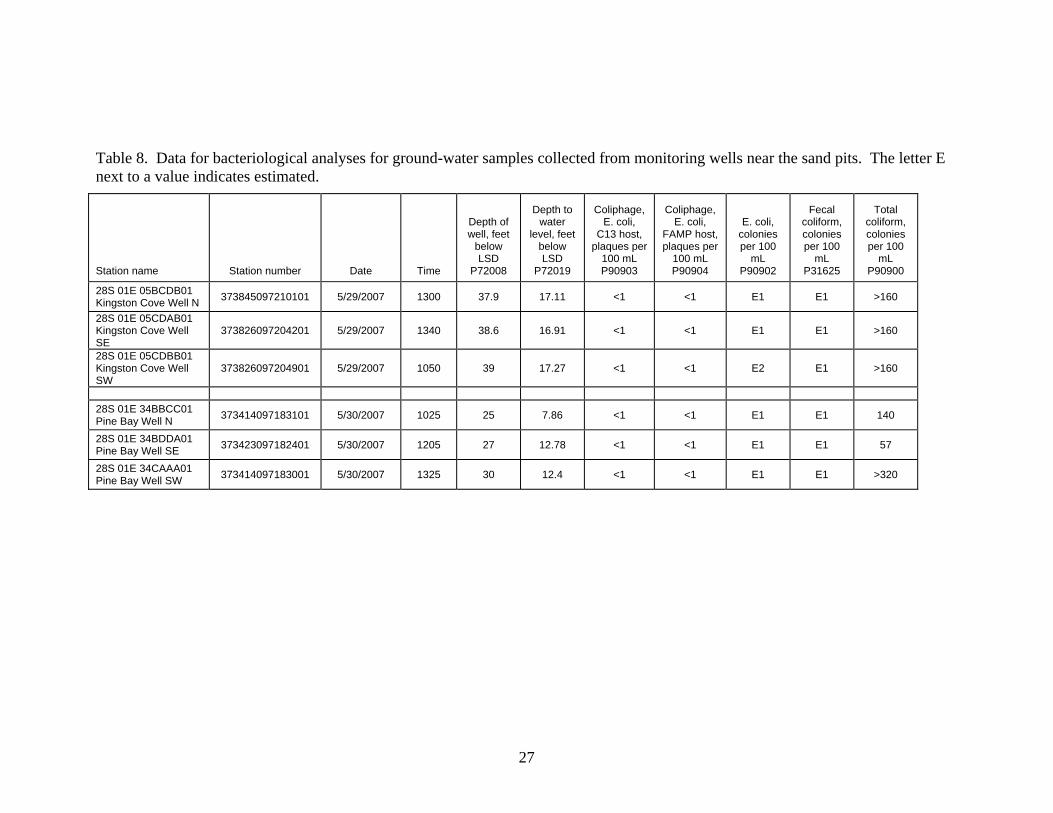
Table 8. Data for bacteriological analyses for ground-water samples collected from monitoring wells near the sand pits. The letter E next to a value indicates estimated. Station name
Station number
Date
Time
Depth of well, feet
below LSD
P72008
Depth to
water level, feet
below LSD
P72019
Coliphage,
E. coli, C13 host,
plaques per 100 mL P90903
Coliphage,
E. coli, FAMP host, plaques per
100 mL P90904
E. coli, colonies per 100
mL P90902
Fecal
coliform, colonies per 100
mL P31625
Total
coliform, colonies per 100
mL P90900
28S 01E 05BCDB01 Kingston Cove Well N 373845097210101 5/29/2007 1300 37.9 17.11 <1 <1 E1 E1 >160
28S 01E 05CDAB01 Kingston Cove Well SE
373826097204201 5/29/2007 1340 38.6 16.91 <1 <1 E1 E1 >160
28S 01E 05CDBB01 Kingston Cove Well SW
373826097204901 5/29/2007 1050 39 17.27 <1 <1 E2 E1 >160
28S 01E 34BBCC01 Pine Bay Well N 373414097183101 5/30/2007 1025 25 7.86 <1 <1 E1 E1 140
28S 01E 34BDDA01 Pine Bay Well SE 373423097182401 5/30/2007 1205 27 12.78 <1 <1 E1 E1 57
28S 01E 34CAAA01 Pine Bay Well SW 373414097183001 5/30/2007 1325 30 12.4 <1 <1 E1 E1 >320
27
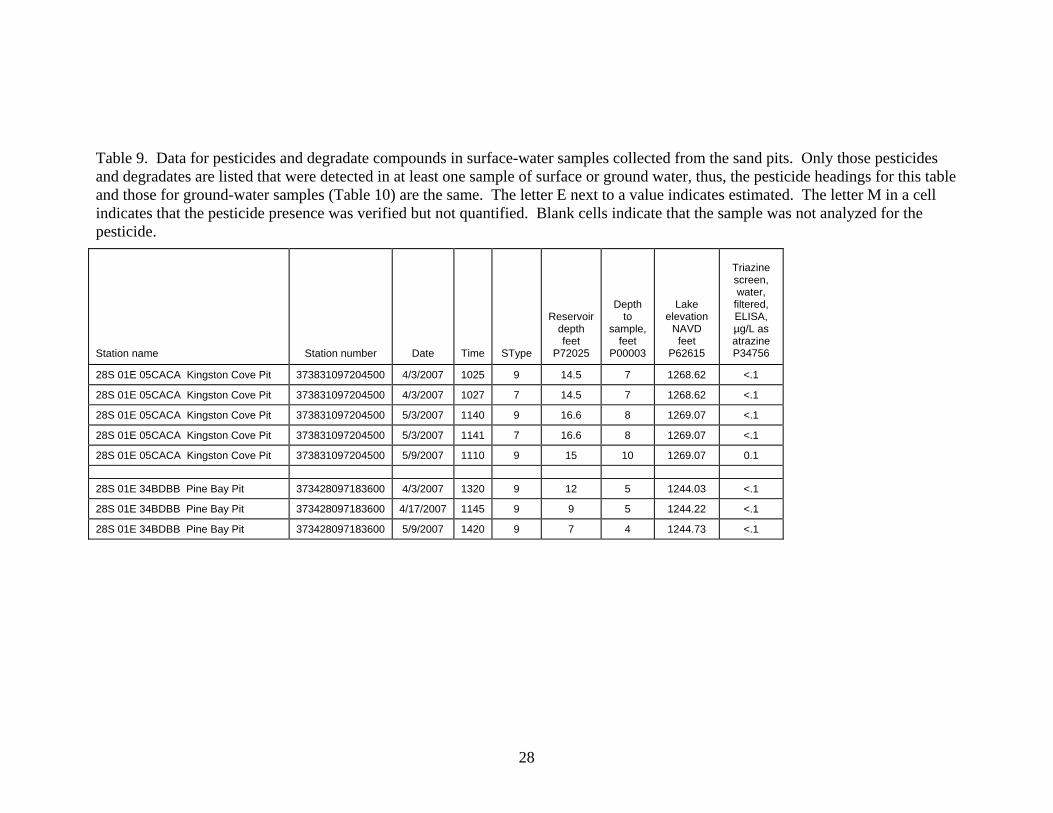
Table 9. Data for pesticides and degradate compounds in surface-water samples collected from the sand pits. Only those pesticides and degradates are listed that were detected in at least one sample of surface or ground water, thus, the pesticide headings for this table and those for ground-water samples (Table 10) are the same. The letter E next to a value indicates estimated. The letter M in a cell indicates that the pesticide presence was verified but not quantified. Blank cells indicate that the sample was not analyzed for the pesticide. Station name
Station number
Date
Time
SType
Reservoir depth feet
P72025
Depth to
sample, feet
P00003
Lake elevation
NAVD feet
P62615
Triazine screen, water,
filtered, ELISA, µg/L as atrazine P34756
28S 01E 05CACA Kingston Cove Pit 373831097204500 4/3/2007 1025 9 14.5 7 1268.62 <.1
28S 01E 05CACA Kingston Cove Pit 373831097204500 4/3/2007 1027 7 14.5 7 1268.62 <.1
28S 01E 05CACA Kingston Cove Pit 373831097204500 5/3/2007 1140 9 16.6 8 1269.07 <.1
28S 01E 05CACA Kingston Cove Pit 373831097204500 5/3/2007 1141 7 16.6 8 1269.07 <.1
28S 01E 05CACA Kingston Cove Pit 373831097204500 5/9/2007 1110 9 15 10 1269.07 0.1 28S 01E 34BDBB Pine Bay Pit 373428097183600 4/3/2007 1320 9 12 5 1244.03 <.1
28S 01E 34BDBB Pine Bay Pit 373428097183600 4/17/2007 1145 9 9 5 1244.22 <.1
28S 01E 34BDBB Pine Bay Pit 373428097183600 5/9/2007 1420 9 7 4 1244.73 <.1
28
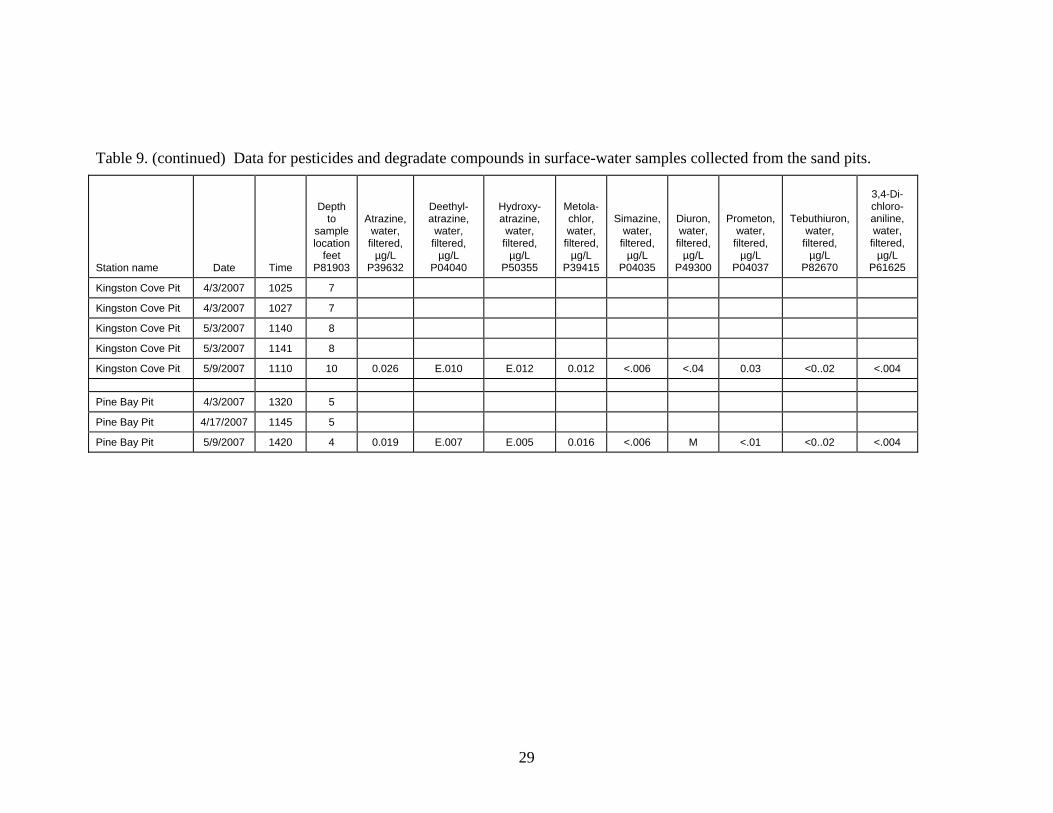
Table 9. (continued) Data for pesticides and degradate compounds in surface-water samples collected from the sand pits. Station name
Date
Time
Depth to
sample location
feet P81903
Atrazine, water,
filtered, µg/L
P39632
Deethyl- atrazine,
water, filtered,
µg/L P04040
Hydroxy- atrazine,
water, filtered,
µg/L P50355
Metola- chlor, water,
filtered, µg/L
P39415
Simazine, water,
filtered, µg/L
P04035
Diuron, water,
filtered, µg/L
P49300
Prometon, water,
filtered, µg/L
P04037
Tebuthiuron, water,
filtered, µg/L
P82670
3,4-Di- chloro- aniline, water,
filtered, µg/L
P61625
Kingston Cove Pit 4/3/2007 1025 7
Kingston Cove Pit 4/3/2007 1027 7
Kingston Cove Pit 5/3/2007 1140 8
Kingston Cove Pit 5/3/2007 1141 8
Kingston Cove Pit 5/9/2007 1110 10 0.026 E.010 E.012 0.012 <.006 <.04 0.03 <0..02 <.004 Pine Bay Pit 4/3/2007 1320 5
Pine Bay Pit 4/17/2007 1145 5
Pine Bay Pit 5/9/2007 1420 4 0.019 E.007 E.005 0.016 <.006 M <.01 <0..02 <.004
29
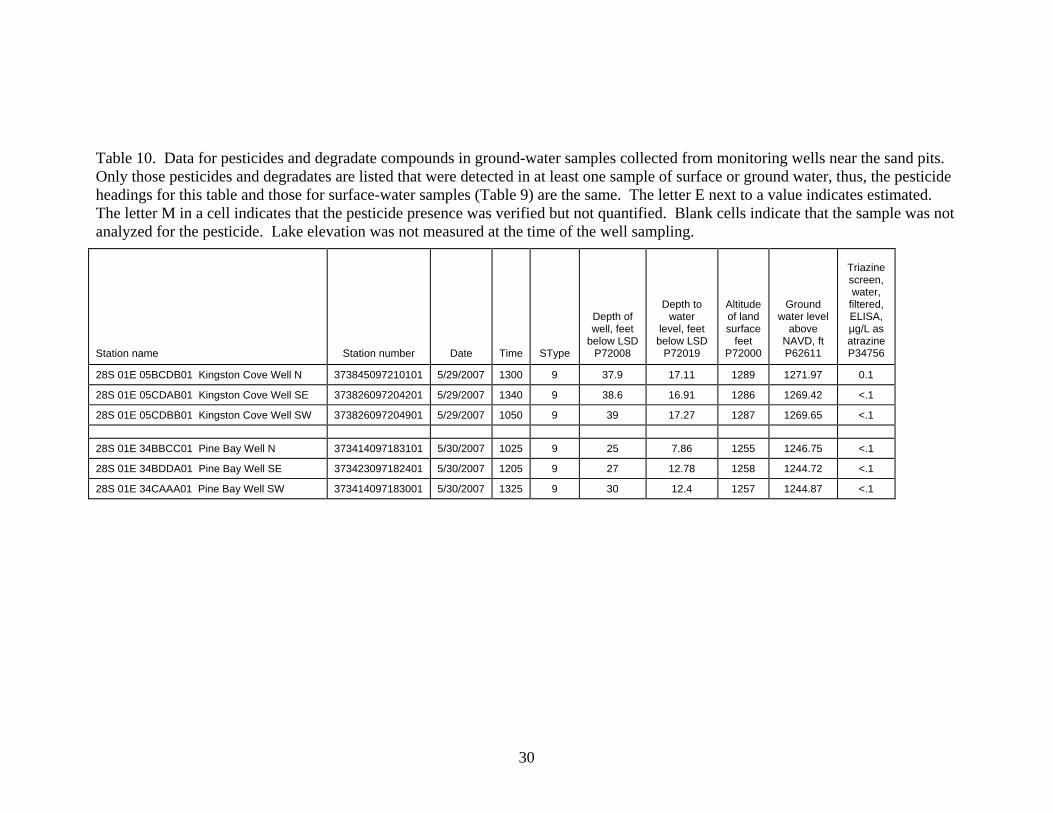
Table 10. Data for pesticides and degradate compounds in ground-water samples collected from monitoring wells near the sand pits. Only those pesticides and degradates are listed that were detected in at least one sample of surface or ground water, thus, the pesticide headings for this table and those for surface-water samples (Table 9) are the same. The letter E next to a value indicates estimated. The letter M in a cell indicates that the pesticide presence was verified but not quantified. Blank cells indicate that the sample was not analyzed for the pesticide. Lake elevation was not measured at the time of the well sampling. Station name
Station number
Date
Time
SType
Depth of well, feet
below LSD P72008
Depth to water
level, feet below LSD
P72019
Altitude of land surface
feet P72000
Ground water level
above NAVD, ft P62611
Triazine screen, water,
filtered, ELISA, µg/L as atrazine P34756
28S 01E 05BCDB01 Kingston Cove Well N 373845097210101 5/29/2007 1300 9 37.9 17.11 1289 1271.97 0.1
28S 01E 05CDAB01 Kingston Cove Well SE 373826097204201 5/29/2007 1340 9 38.6 16.91 1286 1269.42 <.1
28S 01E 05CDBB01 Kingston Cove Well SW 373826097204901 5/29/2007 1050 9 39 17.27 1287 1269.65 <.1 28S 01E 34BBCC01 Pine Bay Well N 373414097183101 5/30/2007 1025 9 25 7.86 1255 1246.75 <.1
28S 01E 34BDDA01 Pine Bay Well SE 373423097182401 5/30/2007 1205 9 27 12.78 1258 1244.72 <.1
28S 01E 34CAAA01 Pine Bay Well SW 373414097183001 5/30/2007 1325 9 30 12.4 1257 1244.87 <.1
30
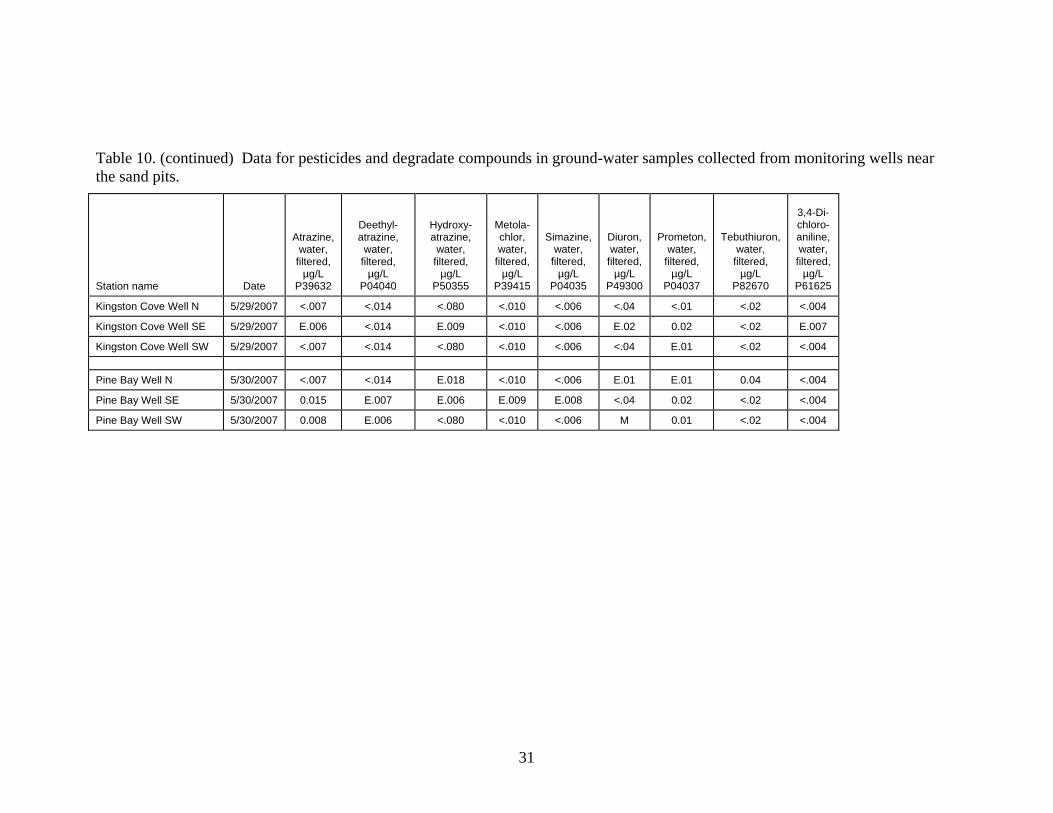
Table 10. (continued) Data for pesticides and degradate compounds in ground-water samples collected from monitoring wells near the sand pits. Station name
Date
Atrazine, water,
filtered, µg/L
P39632
Deethyl- atrazine,
water, filtered,
µg/L P04040
Hydroxy- atrazine,
water, filtered,
µg/L P50355
Metola- chlor, water,
filtered, µg/L
P39415
Simazine, water,
filtered, µg/L
P04035
Diuron, water,
filtered, µg/L
P49300
Prometon, water,
filtered, µg/L
P04037
Tebuthiuron, water,
filtered, µg/L
P82670
3,4-Di- chloro- aniline, water,
filtered, µg/L
P61625
Kingston Cove Well N 5/29/2007 <.007 <.014 <.080 <.010 <.006 <.04 <.01 <.02 <.004
Kingston Cove Well SE 5/29/2007 E.006 <.014 E.009 <.010 <.006 E.02 0.02 <.02 E.007
Kingston Cove Well SW 5/29/2007 <.007 <.014 <.080 <.010 <.006 <.04 E.01 <.02 <.004 Pine Bay Well N 5/30/2007 <.007 <.014 E.018 <.010 <.006 E.01 E.01 0.04 <.004
Pine Bay Well SE 5/30/2007 0.015 E.007 E.006 E.009 E.008 <.04 0.02 <.02 <.004
Pine Bay Well SW 5/30/2007 0.008 E.006 <.080 <.010 <.006 M 0.01 <.02 <.004
31
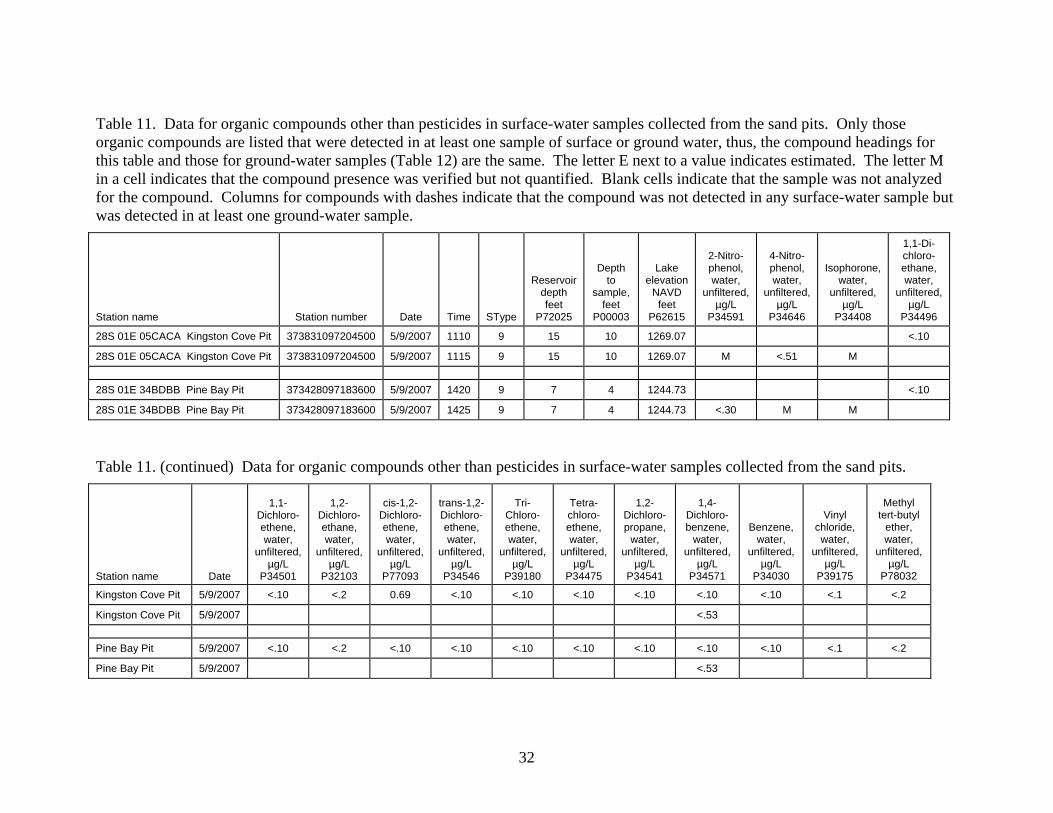
Table 11. Data for organic compounds other than pesticides in surface-water samples collected from the sand pits. Only those organic compounds are listed that were detected in at least one sample of surface or ground water, thus, the compound headings for this table and those for ground-water samples (Table 12) are the same. The letter E next to a value indicates estimated. The letter M in a cell indicates that the compound presence was verified but not quantified. Blank cells indicate that the sample was not analyzed for the compound. Columns for compounds with dashes indicate that the compound was not detected in any surface-water sample but was detected in at least one ground-water sample.
Station name
Station number
Date
Time
SType
Reservoir depth feet
P72025
Depth to
sample, feet
P00003
Lake elevation
NAVD feet
P62615
2-Nitro- phenol, water,
unfiltered, µg/L
P34591
4-Nitro- phenol, water,
unfiltered, µg/L
P34646
Isophorone, water,
unfiltered, µg/L
P34408
1,1-Di- chloro- ethane, water,
unfiltered, µg/L
P34496
28S 01E 05CACA Kingston Cove Pit 373831097204500 5/9/2007 1110 9 15 10 1269.07 <.10
28S 01E 05CACA Kingston Cove Pit 373831097204500 5/9/2007 1115 9 15 10 1269.07 M <.51 M 28S 01E 34BDBB Pine Bay Pit 373428097183600 5/9/2007 1420 9 7 4 1244.73 <.10
28S 01E 34BDBB Pine Bay Pit 373428097183600 5/9/2007 1425 9 7 4 1244.73 <.30 M M
Table 11. (continued) Data for organic compounds other than pesticides in surface-water samples collected from the sand pits. Station name
Date
1,1-
Dichloro- ethene, water,
unfiltered, µg/L
P34501
1,2-
Dichloro- ethane, water,
unfiltered, µg/L
P32103
cis-1,2-
Dichloro- ethene, water,
unfiltered, µg/L
P77093
trans-1,2-Dichloro-ethene, water,
unfiltered, µg/L
P34546
Tri-
Chloro- ethene, water,
unfiltered, µg/L
P39180
Tetra- chloro- ethene, water,
unfiltered, µg/L
P34475
1,2-
Dichloro- propane,
water, unfiltered,
µg/L P34541
1,4-
Dichloro- benzene,
water, unfiltered,
µg/L P34571
Benzene, water,
unfiltered, µg/L
P34030
Vinyl chloride, water,
unfiltered, µg/L
P39175
Methyl
tert-butyl ether, water,
unfiltered, µg/L
P78032
Kingston Cove Pit 5/9/2007 <.10 <.2 0.69 <.10 <.10 <.10 <.10 <.10 <.10 <.1 <.2
Kingston Cove Pit 5/9/2007 <.53 Pine Bay Pit 5/9/2007 <.10 <.2 <.10 <.10 <.10 <.10 <.10 <.10 <.10 <.1 <.2
Pine Bay Pit 5/9/2007 <.53
32
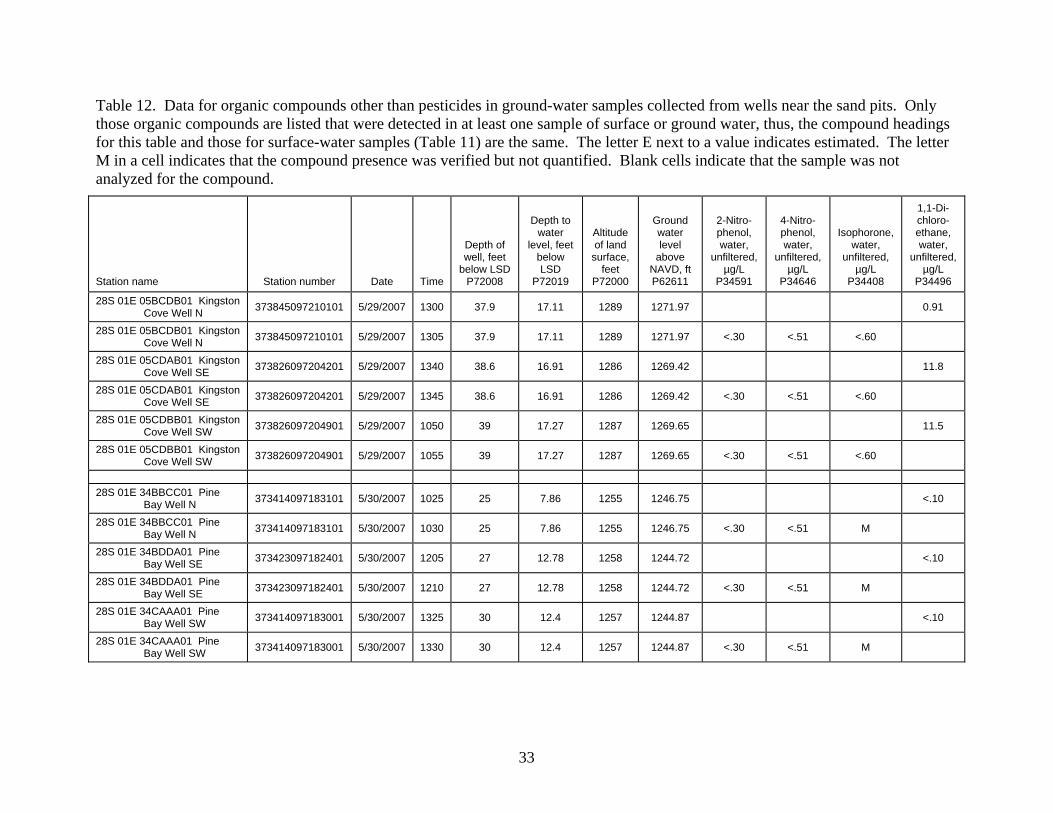
Table 12. Data for organic compounds other than pesticides in ground-water samples collected from wells near the sand pits. Only those organic compounds are listed that were detected in at least one sample of surface or ground water, thus, the compound headings for this table and those for surface-water samples (Table 11) are the same. The letter E next to a value indicates estimated. The letter M in a cell indicates that the compound presence was verified but not quantified. Blank cells indicate that the sample was not analyzed for the compound.
Station name
Station number
Date
Time
Depth of well, feet
below LSD P72008
Depth to
water level, feet
below LSD
P72019
Altitude of land
surface, feet
P72000
Ground water level
above NAVD, ft P62611
2-Nitro- phenol, water,
unfiltered, µg/L
P34591
4-Nitro- phenol, water,
unfiltered, µg/L
P34646
Isophorone, water,
unfiltered, µg/L
P34408
1,1-Di- chloro- ethane, water,
unfiltered, µg/L
P34496
28S 01E 05BCDB01 Kingston Cove Well N 373845097210101 5/29/2007 1300 37.9 17.11 1289 1271.97 0.91
28S 01E 05BCDB01 Kingston Cove Well N 373845097210101 5/29/2007 1305 37.9 17.11 1289 1271.97 <.30 <.51 <.60
28S 01E 05CDAB01 Kingston Cove Well SE 373826097204201 5/29/2007 1340 38.6 16.91 1286 1269.42 11.8
28S 01E 05CDAB01 Kingston Cove Well SE 373826097204201 5/29/2007 1345 38.6 16.91 1286 1269.42 <.30 <.51 <.60
28S 01E 05CDBB01 Kingston Cove Well SW 373826097204901 5/29/2007 1050 39 17.27 1287 1269.65 11.5
28S 01E 05CDBB01 Kingston Cove Well SW 373826097204901 5/29/2007 1055 39 17.27 1287 1269.65 <.30 <.51 <.60
28S 01E 34BBCC01 Pine
Bay Well N 373414097183101 5/30/2007 1025 25 7.86 1255 1246.75 <.10
28S 01E 34BBCC01 Pine Bay Well N 373414097183101 5/30/2007 1030 25 7.86 1255 1246.75 <.30 <.51 M
28S 01E 34BDDA01 Pine Bay Well SE 373423097182401 5/30/2007 1205 27 12.78 1258 1244.72 <.10
28S 01E 34BDDA01 Pine Bay Well SE 373423097182401 5/30/2007 1210 27 12.78 1258 1244.72 <.30 <.51 M
28S 01E 34CAAA01 Pine Bay Well SW 373414097183001 5/30/2007 1325 30 12.4 1257 1244.87 <.10
28S 01E 34CAAA01 Pine Bay Well SW 373414097183001 5/30/2007 1330 30 12.4 1257 1244.87 <.30 <.51 M
33
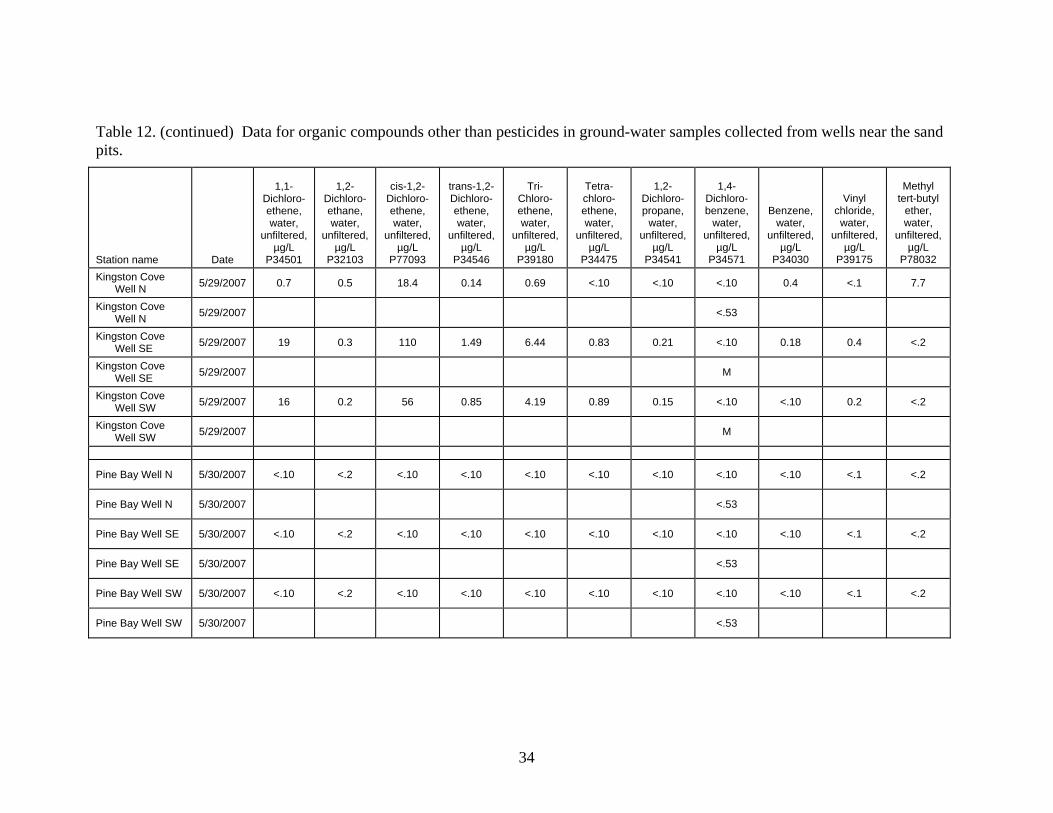
Table 12. (continued) Data for organic compounds other than pesticides in ground-water samples collected from wells near the sand pits. Station name
Date
1,1-
Dichloro- ethene, water,
unfiltered, µg/L
P34501
1,2-
Dichloro- ethane, water,
unfiltered, µg/L
P32103
cis-1,2-
Dichloro- ethene, water,
unfiltered, µg/L
P77093
trans-1,2-Dichloro-ethene, water,
unfiltered, µg/L
P34546
Tri-
Chloro- ethene, water,
unfiltered, µg/L
P39180
Tetra- chloro- ethene, water,
unfiltered, µg/L
P34475
1,2-
Dichloro- propane,
water, unfiltered,
µg/L P34541
1,4-
Dichloro- benzene,
water, unfiltered,
µg/L P34571
Benzene, water,
unfiltered, µg/L
P34030
Vinyl chloride, water,
unfiltered, µg/L
P39175
Methyl
tert-butyl ether, water,
unfiltered, µg/L
P78032 Kingston Cove
Well N 5/29/2007 0.7 0.5 18.4 0.14 0.69 <.10 <.10 <.10 0.4 <.1 7.7
Kingston Cove Well N 5/29/2007 <.53
Kingston Cove Well SE 5/29/2007 19 0.3 110 1.49 6.44 0.83 0.21 <.10 0.18 0.4 <.2
Kingston Cove Well SE 5/29/2007 M
Kingston Cove Well SW 5/29/2007 16 0.2 56 0.85 4.19 0.89 0.15 <.10 <.10 0.2 <.2
Kingston Cove Well SW 5/29/2007 M
Pine Bay Well N 5/30/2007 <.10 <.2 <.10 <.10 <.10 <.10 <.10 <.10 <.10 <.1 <.2
Pine Bay Well N 5/30/2007 <.53
Pine Bay Well SE 5/30/2007 <.10 <.2 <.10 <.10 <.10 <.10 <.10 <.10 <.10 <.1 <.2
Pine Bay Well SE 5/30/2007 <.53
Pine Bay Well SW 5/30/2007 <.10 <.2 <.10 <.10 <.10 <.10 <.10 <.10 <.10 <.1 <.2
Pine Bay Well SW 5/30/2007 <.53
34
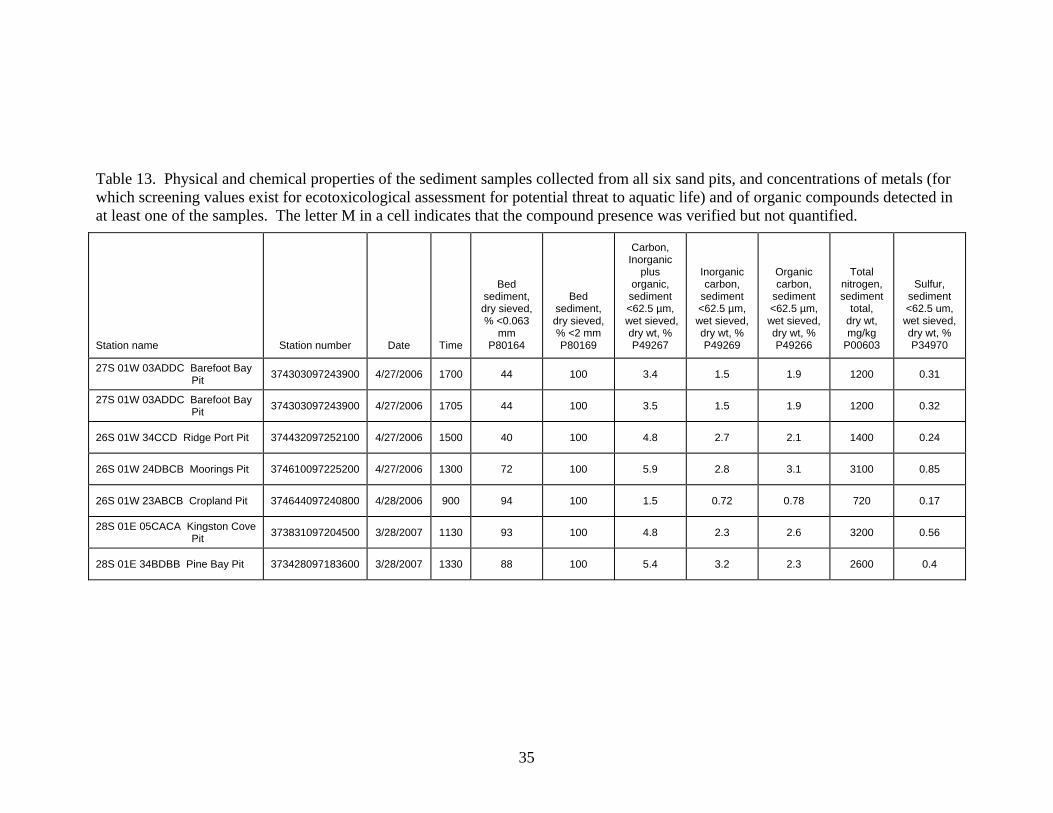
Table 13. Physical and chemical properties of the sediment samples collected from all six sand pits, and concentrations of metals (for which screening values exist for ecotoxicological assessment for potential threat to aquatic life) and of organic compounds detected in at least one of the samples. The letter M in a cell indicates that the compound presence was verified but not quantified.
Station name
Station number
Date
Time
Bed sediment, dry sieved, % <0.063
mm P80164
Bed sediment, dry sieved, % <2 mm P80169
Carbon, Inorganic
plus organic, sediment <62.5 µm,
wet sieved, dry wt, % P49267
Inorganic carbon,
sediment <62.5 µm, wet sieved, dry wt, % P49269
Organic carbon,
sediment <62.5 µm, wet sieved, dry wt, % P49266
Total nitrogen, sediment
total, dry wt, mg/kg
P00603
Sulfur, sediment <62.5 um, wet sieved, dry wt, % P34970
27S 01W 03ADDC Barefoot Bay Pit 374303097243900 4/27/2006 1700 44 100 3.4 1.5 1.9 1200 0.31
27S 01W 03ADDC Barefoot Bay Pit 374303097243900 4/27/2006 1705 44 100 3.5 1.5 1.9 1200 0.32
26S 01W 34CCD Ridge Port Pit 374432097252100 4/27/2006 1500 40 100 4.8 2.7 2.1 1400 0.24
26S 01W 24DBCB Moorings Pit 374610097225200 4/27/2006 1300 72 100 5.9 2.8 3.1 3100 0.85
26S 01W 23ABCB Cropland Pit 374644097240800 4/28/2006 900 94 100 1.5 0.72 0.78 720 0.17
28S 01E 05CACA Kingston Cove Pit 373831097204500 3/28/2007 1130 93 100 4.8 2.3 2.6 3200 0.56
28S 01E 34BDBB Pine Bay Pit 373428097183600 3/28/2007 1330 88 100 5.4 3.2 2.3 2600 0.4
35
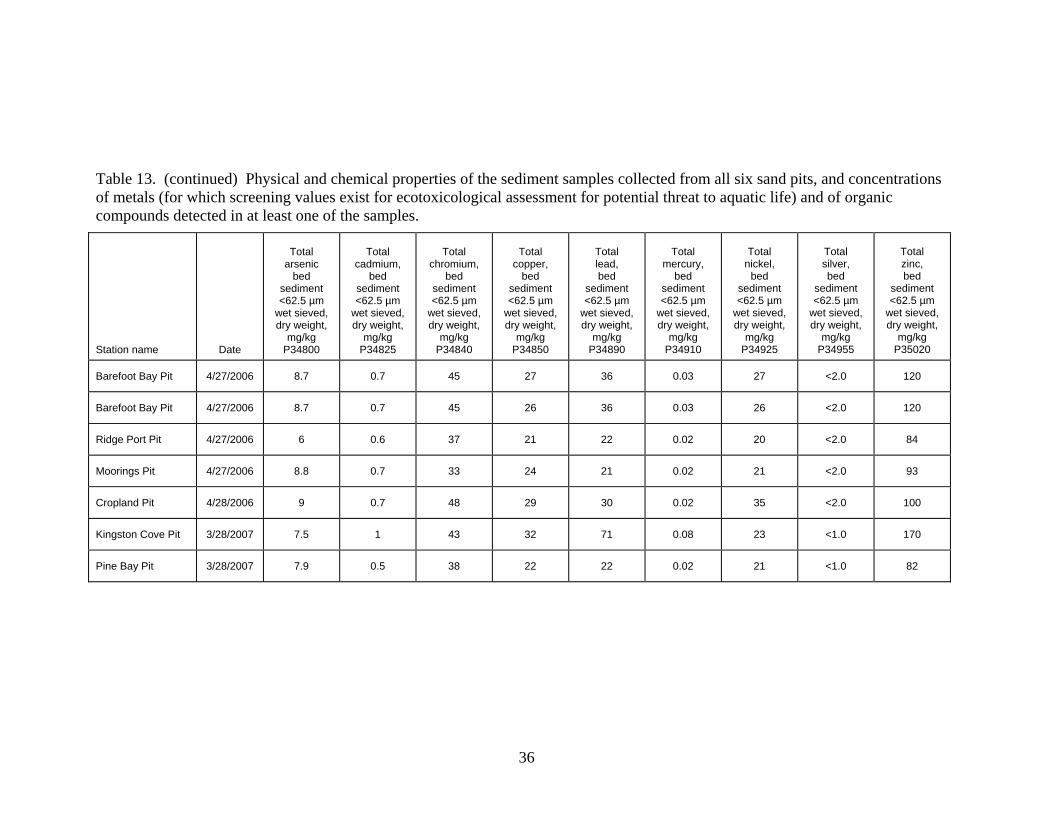
Table 13. (continued) Physical and chemical properties of the sediment samples collected from all six sand pits, and concentrations of metals (for which screening values exist for ecotoxicological assessment for potential threat to aquatic life) and of organic compounds detected in at least one of the samples. Station name
Date
Total
arsenic bed
sediment <62.5 µm
wet sieved, dry weight,
mg/kg P34800
Total
cadmium, bed
sediment <62.5 µm
wet sieved, dry weight,
mg/kg P34825
Total
chromium, bed
sediment <62.5 µm
wet sieved, dry weight,
mg/kg P34840
Total
copper, bed
sediment <62.5 µm
wet sieved, dry weight,
mg/kg P34850
Total lead, bed
sediment <62.5 µm
wet sieved, dry weight,
mg/kg P34890
Total
mercury, bed
sediment <62.5 µm
wet sieved, dry weight,
mg/kg P34910
Total
nickel, bed
sediment <62.5 µm
wet sieved, dry weight,
mg/kg P34925
Total silver, bed
sediment <62.5 µm
wet sieved, dry weight,
mg/kg P34955
Total zinc, bed
sediment <62.5 µm
wet sieved, dry weight,
mg/kg P35020
Barefoot Bay Pit 4/27/2006 8.7 0.7 45 27 36 0.03 27 <2.0 120
Barefoot Bay Pit 4/27/2006 8.7 0.7 45 26 36 0.03 26 <2.0 120
Ridge Port Pit 4/27/2006 6 0.6 37 21 22 0.02 20 <2.0 84
Moorings Pit 4/27/2006 8.8 0.7 33 24 21 0.02 21 <2.0 93
Cropland Pit 4/28/2006 9 0.7 48 29 30 0.02 35 <2.0 100
Kingston Cove Pit 3/28/2007 7.5 1 43 32 71 0.08 23 <1.0 170
Pine Bay Pit 3/28/2007 7.9 0.5 38 22 22 0.02 21 <1.0 82
36
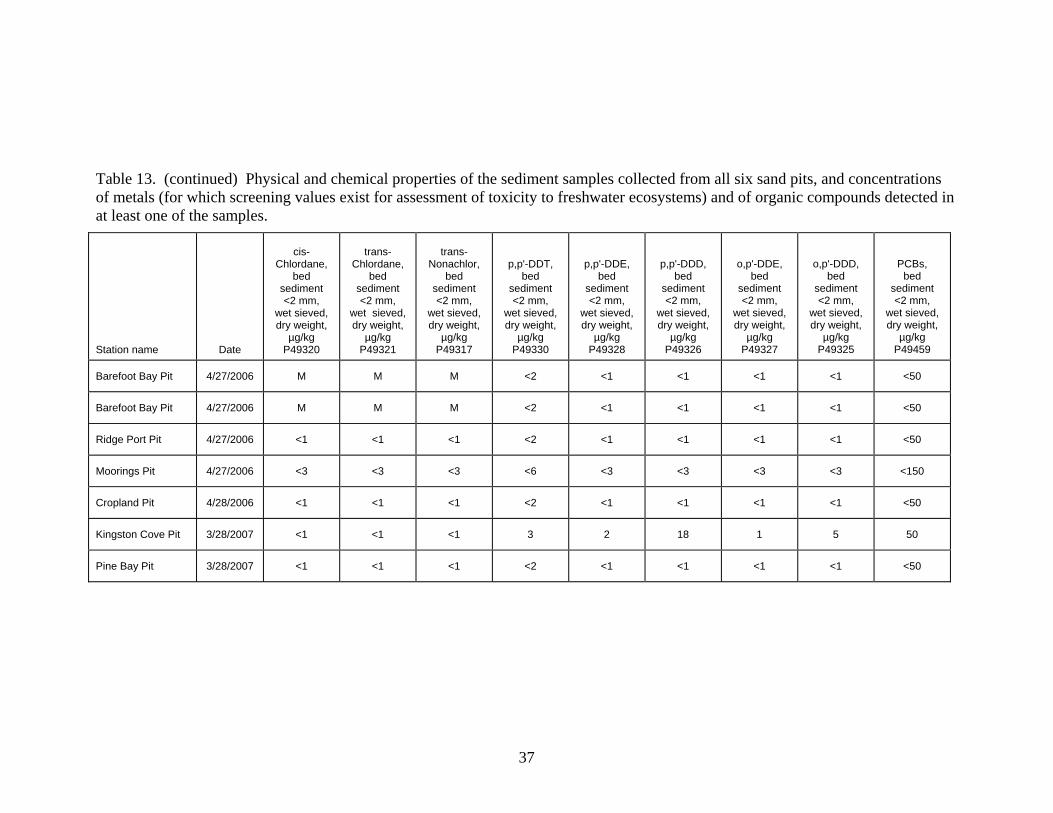
37
Table 13. (continued) Physical and chemical properties of the sediment samples collected from all six sand pits, and concentrations of metals (for which screening values exist for assessment of toxicity to freshwater ecosystems) and of organic compounds detected in at least one of the samples. Station name
Date
cis-
Chlordane, bed
sediment <2 mm,
wet sieved, dry weight,
µg/kg P49320
trans-
Chlordane, bed
sediment <2 mm,
wet sieved, dry weight,
µg/kg P49321
trans-
Nonachlor, bed
sediment <2 mm,
wet sieved, dry weight,
µg/kg P49317
p,p'-DDT, bed
sediment <2 mm,
wet sieved, dry weight,
µg/kg P49330
p,p'-DDE, bed
sediment <2 mm,
wet sieved, dry weight,
µg/kg P49328
p,p'-DDD, bed
sediment <2 mm,
wet sieved, dry weight,
µg/kg P49326
o,p'-DDE, bed
sediment <2 mm,
wet sieved, dry weight,
µg/kg P49327
o,p'-DDD, bed
sediment <2 mm,
wet sieved, dry weight,
µg/kg P49325
PCBs, bed
sediment <2 mm,
wet sieved, dry weight,
µg/kg P49459
Barefoot Bay Pit 4/27/2006 M M M <2 <1 <1 <1 <1 <50
Barefoot Bay Pit 4/27/2006 M M M <2 <1 <1 <1 <1 <50
Ridge Port Pit 4/27/2006 <1 <1 <1 <2 <1 <1 <1 <1 <50
Moorings Pit 4/27/2006 <3 <3 <3 <6 <3 <3 <3 <3 <150
Cropland Pit 4/28/2006 <1 <1 <1 <2 <1 <1 <1 <1 <50
Kingston Cove Pit 3/28/2007 <1 <1 <1 3 2 18 1 5 50
Pine Bay Pit 3/28/2007 <1 <1 <1 <2 <1 <1 <1 <1 <50
The pH ranges for the surface and ground waters from the two pit sites were 8.2-8.5 and 6.8-7.2, respectively (Tables 5 and 6). Both of these ranges are typical for surface and ground waters in Kansas. The ground waters have lower pH values than the surface waters due to the generation of carbon dioxide from organic matter decomposition in the subsurface. The carbon dioxide dissolves and forms carbonic acid that equilibrates with the water primarily as bicarbonate ion within the near neutral pH range of the waters. The surface waters have higher pH because carbon dioxide generated from organic matter oxidation is lost to the atmosphere during the process of equilibrating with the partial pressure of the gas in the atmosphere. The national secondary drinking water standard (recommended but not mandatory value) for pH is that the water should have a value within the range 6.5-8.5. The total dissolved solids (TDS) concentration of all the surface and ground waters of the Kingston Cove and Pine Bay sites exceeded the SMCL of 500 mg/L (Tables 5 and 6). Water in the Arkansas River between the confluence with Rattlesnake Creek (upstream of Hutchinson) and Wichita is saline. The salinity source is primarily natural based on geochemical studies by the KGS (see for example, Whittemore [2003]). Saltwater derived from the dissolution of rock salt (halite, NaCl) in the Permian bedrock underlying the eastern part of the Great Bend Prairie and the western part of the Equus Beds intrudes into the overlying High Plains aquifer and discharges into Rattlesnake Creek and other streams and the Arkansas River when the stream and river levels are low. Stream-aquifer interactions in the area between Wichita and Hutchinson cause saline Arkansas River water to increase the salinity of ground water in the alluvial aquifer adjacent to the river. Upward movement of deeper saline water also increases the TDS content of shallow ground water in the alluvial aquifer. Pumping of ground water from large capacity wells, such as for irrigation and the City of Wichita water supply, increases the distance that saline water in the alluvial aquifer travels in the subsurface outward from the Arkansas River. Surface water and shallow ground water in the area are also affected by evapotranspiration concentration whereby water is lost to the atmosphere leaving residual salts dissolved in a smaller amount of water. Both the entire Kingston Cove and Pine Bay sites are located within one mile of the Arkansas River. Thus, the high TDS concentrations of the pit and monitoring well waters of these two study sites are expected for the area. The TDS concentration of the surface and ground waters at the Kingston Cove site are greater than those at the Pine Bay site even though the distance from the Arkansas River for both pits is about the same and both pits are on the west side of the river. Pine Bay lies about five miles to the south-southeast of Kingston Cove. It is possible that fresher water in the additional small drainages that enter the river between the sites have diluted the surface and ground waters. In addition, the proximity (within a half mile) of the Wichita floodway to the southwest of Pine Bay could have resulted in some dilution of the ground water at that location during high precipitation and runoff events. The ground-water levels at the monitoring wells surrounding Kingston Cove were 16.9 to 17.3 ft below the land surface when sampled in comparison to 7.9 to 12.8 ft at wells surrounding Pine Bay. Thus, evapotranspiration of shallow ground water does not appear to be an explanation for the TDS difference between the two sites. The TDS concentration of the surface waters ranged little at each of the two pits during the three collection dates from early April to early May. The TDS content was approximately 150 to 300 mg/L lower in the surface water than the ground water at Kingston Cove and about 10
38
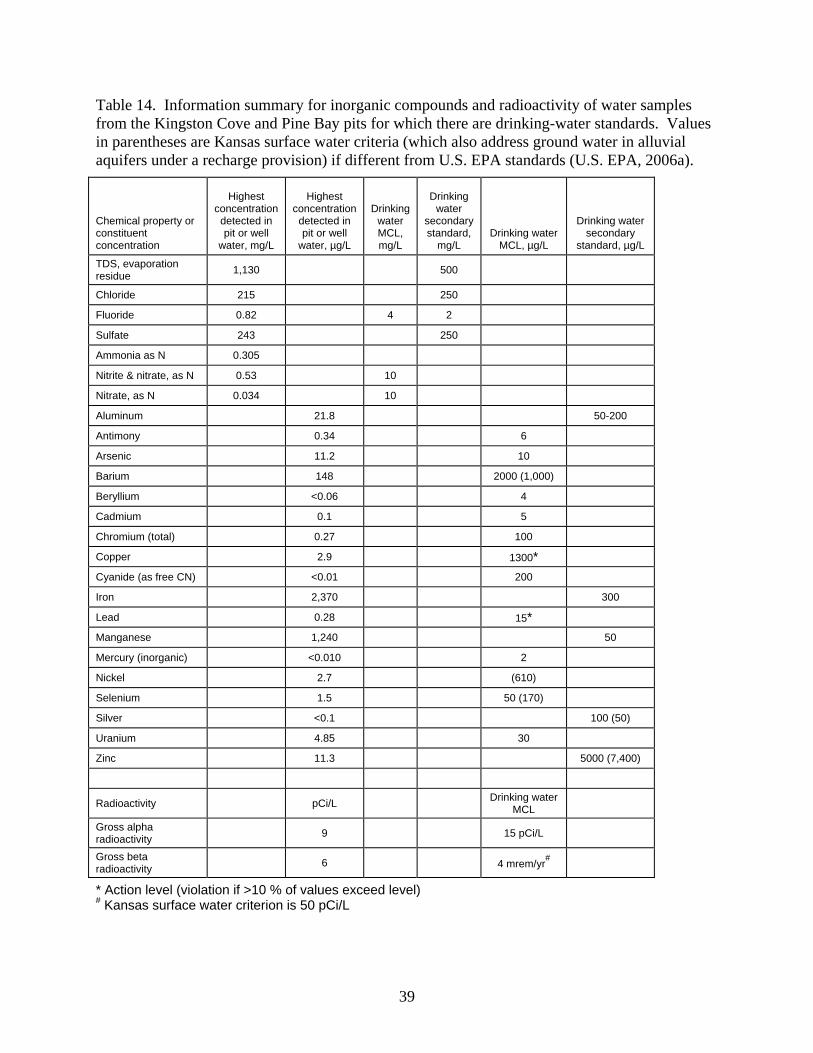
Table 14. Information summary for inorganic compounds and radioactivity of water samples from the Kingston Cove and Pine Bay pits for which there are drinking-water standards. Values in parentheses are Kansas surface water criteria (which also address ground water in alluvial aquifers under a recharge provision) if different from U.S. EPA standards (U.S. EPA, 2006a). Chemical property or constituent concentration
Highest
concentration detected in pit or well
water, mg/L
Highest
concentration detected in pit or well
water, µg/L
Drinking water MCL, mg/L
Drinking
water secondary standard,
mg/L
Drinking water MCL, µg/L
Drinking water secondary
standard, µg/L
TDS, evaporation residue 1,130 500
Chloride 215 250
Fluoride 0.82 4 2
Sulfate 243 250
Ammonia as N 0.305
Nitrite & nitrate, as N 0.53 10
Nitrate, as N 0.034 10
Aluminum 21.8 50-200
Antimony 0.34 6
Arsenic 11.2 10
Barium 148 2000 (1,000)
Beryllium <0.06 4
Cadmium 0.1 5
Chromium (total) 0.27 100
Copper 2.9 1300*
Cyanide (as free CN) <0.01 200
Iron 2,370 300
Lead 0.28 15*
Manganese 1,240 50
Mercury (inorganic) <0.010 2
Nickel 2.7 (610)
Selenium 1.5 50 (170)
Silver <0.1 100 (50)
Uranium 4.85 30
Zinc 11.3 5000 (7,400)
Radioactivity pCi/L Drinking water MCL
Gross alpha radioactivity 9 15 pCi/L
Gross beta radioactivity 6 4 mrem/yr#
* Action level (violation if >10 % of values exceed level) # Kansas surface water criterion is 50 pCi/L
39
to 120 mg/L lower in the surface water than the ground water at Pine Bay. The lower TDS level in the surface water than in the ground water might be explained by substantially greater rainfall than average received during March 2007 and the somewhat greater rainfall than average of April 2007. The larger TDS difference between the surface and ground waters at the Kingston Cove than the Pine Bay site could be related to the greater depth of the wells and of the sample interval below the water table at Kingston Cove, meaning that the low TDS water from precipitation recharge did not reach as deeply at Kingston Cove than at Pine Bay after the substantial rains. The TDS content was greater in the ground water to the south of each of the pits compared to the ground water from the north well at each site, just as was found for the other four pit sites in northwest Wichita. Based on the regional ground-water flow direction generally towards the southeast at the study sites, evaporative concentration of dissolved solids in the surface water of the pits during dry summer months might be a possible explanation for this observation. The naturally saline surface water in the Arkansas River is usually sodium-chloride in chemical type (when there are not high flows of sodium-calcium-sulfate type water from Colorado that reach Wichita), as is the ground water in the adjacent alluvial aquifer. Most of the dissolved chloride in the surface and ground waters of the Kingston Cove and Pine Bay sites is expected to be derived from natural sources, although some chloride at Pine Bay could be related to the oil-brine plume known in the area. However, the sulfate/chloride ratios of the surface and ground waters at Pine Bay Estates are not low as occur in subsurface oil brine in the area, suggesting that the contribution of oil brine to the total chloride is relatively small. The chloride contents of the surface waters of Kingston Cove and Pine Bay lie within the range of the ground waters from the surrounding monitoring wells at each site. None of the surface and ground waters at Kingston Cove and Pine Bay exceeded the recommended drinking-water limit of 250 mg/L for chloride, whereas most of the waters at the four pits studied in northwest Wichita did exceed the limit. The lower chloride may result from the dilution of Arkansas River, and of the ground water adjacent to the river through stream-aquifer interactions, by the fresher water of the Little Arkansas River and smaller drainages that enter the Arkansas River downstream of the four study sites in northwest Wichita and upstream of the two southern Wichita sites. The saltwater in the Permian bedrock that is the primary source of dissolved solids in the Arkansas River water and the adjacent alluvial aquifer contains high concentrations of sulfate because gypsum (CaSO4 · 2H2O) and anhydrite (CaSO4) are associated with the salt deposits that dissolve to produce the saltwater. In addition, high flows of Arkansas River water from Colorado that reach Wichita have high sulfate concentrations. Some of the dissolved sulfate in the pit and well waters is expected to come from interactions of ground water in the alluvial aquifer with Arkansas River water. Some sulfate is probably derived more locally from the surface or from interaction with underlying bedrock from which rock salt has been completely dissolved but that still includes some gypsum or anhydrite that is dissolving. As for dissolved chloride, the sulfate content of the surface waters of Kingston Cove and Pine Bay lie within the range of the ground waters from the surrounding monitoring wells at each site. None of the sulfate concentrations exceeded the SMCL of 250 mg/L for drinking water at the Kingston Cove and Pine Bay sites.
40
The highest concentrations of minor inorganic and trace metal constituents and of radioactivity observed in all except one of the pit and well waters listed in Tables 5 and 6 for the Kingston Cove and Pine Bay sites, and for which there are MCLs (Table 14), are substantially lower than their respective drinking water standards. The ground-water sample collected from the monitoring well southeast of Kingston Cove slightly exceeded the MCL of 10 µg/L for arsenic. The dissolved manganese concentration in all of the ground waters at the two sites and the dissolved iron from the ground waters from the north wells at both sites exceeded their respective secondary standards. The SMCLs for iron and manganese, 0.3 and 0.05 mg/L (300 and 50 µg/L), respectively, were established to prevent problems such as staining of plumbing and clothing, undesirable water taste, scaling in pipes, and deterioration of water-softener exchange media. For dissolved iron and manganese concentrations to be great enough to exceed the SMCLs, either the oxidation-reduction potential or the pH must be low, or both must be somewhat low. The pH values for the sand pit and well waters are in the near neutral to slightly alkaline range. For this pH range, the oxidation-reduction potential must therefore be low for high dissolved iron and manganese concentrations to occur. In general, the lower the oxidation potential was in the ground waters (Table 6), the greater were the dissolved iron and manganese concentrations. The lower oxidation potentials in the alluvial aquifer are expected to result primarily from consumption of dissolved oxygen by the oxidation of dissolved organic matter in recharge as well as solid organic matter in the fine-grained alluvial sediments. The chemically reducing conditions can reduce iron and manganese in oxyhydroxide coatings and particles in the subsurface sediment to release dissolved iron and manganese in the form of ferrous (Fe2+) and manganous (Mn2+) ion species. Dissolution of iron and manganese oxyhydroxides can release arsenic adsorbed on these minerals. In general, the ground waters with the higher concentrations of dissolved iron and manganese contained greater arsenic content. The ground-water sample with the highest arsenic concentration, which exceeded the drinking-water MCL, had the highest manganese content. This sample also contained the greatest ammonium ion concentration of all the Kingston Cove and Pine Bay ground waters, which is also an indicator of chemically reducing conditions. Although the concentration of organic matter was greater in the pit waters of Kingston Cove and Pine Bay than in the ground waters at these two sites, the distribution of iron, manganese, and ammonium concentrations in the ground waters around the pits was not as suggestive of the impact of dissolved organic matter from the pit water as for the sand-pit sites in northwest Wichita. For example, the greatest dissolved iron concentrations occurred in the north, upgradient wells at these two sites. For the northwest Wichita sites, the generally greater concentrations of iron, manganese, and ammonium ion in the ground waters at the downgradient wells, and the higher concentration of organic matter in the pit than the well samples, suggests that runoff with dissolved organic matter that entered the pits and flowed in the subsurface to the well locations explained part of the reducing conditions observed at these study sites. Local sources of organics, either in the sediment or from contamination of the aquifer water by past surface disposal of solvents or other organic chemicals (especially in the Kingston Cove area), could be a stronger control on reducing conditions in the ground waters at the Kingston Cove and Pine Bay sites than the flow of pit water to the ground water.
41
Bacteriological Analysis The MCL for bacteria in public drinking water supplies in Kansas is “based on the presence or absence of total coliforms in a sample, rather than coliform density” (Code of Federal Regulations, Chapter 40, Section 141.63 as adopted by KDHE). This section states “For a system which collects at least 40 samples per month, if no more than 5.0 percent of the samples collected during a month are total coliform-positive, the system is in compliance with the MCL for total coliforms. For a system which collects fewer than 40 samples/month, if no more than one sample collected during a month is total coliform-positive, the system is in compliance with the MCL for total coliforms. Any fecal coliform-positive repeat sample or E. coli-positive repeat sample, or any total coliform-positive repeat sample following a fecal coliform-positive or E. coli-positive routine sample constitutes a violation of the MCL for total coliforms.” The KDHE also has water-quality standards for surface waters used for recreation. Although Kingston Cove and Pine Bay are not considered as classified water bodies with regard to regulation of bacterial content for contact recreation, comparison of the bacterial count in the Kingston Cove surface water to these standards is informative because the pit lake is used for recreation. Tables 1i and 1j in the Kansas Surface Water Quality Standards, Tables of Numeric Criteria (available from the KDHE at http://www.kdheks.gov/water/download/swqs_numeric_criteria.pdf) list standards for E. coli bacteria for classified stream segments and classified surface waters other than classified stream segments, respectively. The criteria for class B (public access open to and accessible by law or written permission of the landowner) of primary contact recreation for classified stream segments are geometric means of 262 E. coli colony forming units per 100 mL (CFU/100 mL) during the recreation season (April 1 to October 31) and 2,358 CFU/100 mL during the non-recreation season (November 1 to March 31). The criteria for public access to primary contact recreation in classified surface waters other than classified stream segments are a geometric mean of 262 E. coli CFU/100 mL and a single sample maximum of 1,198 CFU/100 mL for the recreation season. For restricted access during the recreation season, the criteria are a geometric mean of 427 CFU/100 mL and a single sample maximum of 1,950 CFU/100 mL. The criteria for public and restricted access during the non-recreation season are substantially higher values than for the recreation season. The geometric mean calculation is for a minimum of five water samples, each collected on a different day within a 30-day period. The USGS analyzed the surface- and ground-water samples from the pit sites for E. coli coliphage, E. coli (Escherichia coli), fecal coliform, and total coliform bacteria content (Tables 7 and 8). Coliphage are bacteriophage that infect E. coli. Although they are indicators for sewage, their detection does “not indicate that pathogenic viruses also will be detected in the water; rather, the coliphage detection is more an indication of the potential for the transport of other viruses into the subsurface” (USGS, 2006). Coliphage were not detected in any of the surface- and ground-water samples from Kingston Cove and Pine Bay analyzed for this parameter (Tables 7 and 8). E. coli was estimated or measured in all of the pit and ground-water samples, although the estimated values for the ground waters were at or near the detection limit of 1 CFU/100 mL. The concentration of E. coli was higher in the late April and early May 2007 samples than in the early and mid-April samples
42
43
from the Kingston Cove pit in comparison with consistently low values for the Pine Bay pit water. None of the values observed exceeded the lowest geometric mean criterion of 262 CFU/100 mL for class B of primary contact recreation for the spring and summer period for a classified stream segment. Fecal coliform bacteria were estimated or measured in all of the pit and well waters from the Kingston Cove and Pine Bay sites, although the values for all of the ground waters were at the detection limit of 1 CFU/100 mL. Total coliform bacteria counts were either estimated or measured at levels of 37 colonies per 100 mL or greater in all of the surface-water samples from Kingston Cove and Pine Bay analyzed for this parameter. Total coliform were less than a detection limit of 160 colonies per 100 mL in all of the ground waters at the Kingston Cove site, and were measurable in the 57-140 colonies per 100 mL range in the north and southeast well waters and less than the detection limit of 320 colonies per 100 mL for the southwest well at Pine Bay Estates. In general, the levels of all bacterial parameters were lower in the ground water than in the surface waters at the sites. Therefore, the sediments in the alluvial aquifer appear to filter any high levels of bacteria in pit surface waters that enter the subsurface and flow to the downgradient wells. The coliform bacteria observed in the well waters might be related to the bacterial content of surface or drilling waters that entered the subsurface during well installation or of microbial communities present in the subsurface at the well locations. Pesticide and Degradate Compounds There are detections, estimates, or concentration values for nine different pesticide or degradate compounds (out of the 118 compounds for which the USGS analyzed the samples) in at least one surface or ground water at the Kingston Cove and Pine Bay sites (Tables 9 and 10). This is less than half the number of 20 pesticides or degradates that were detected, estimated, or measured in the water at the four study sites in northwest Wichita. Only one pesticide, tebuthiuron, was detected in the waters of the two southern Wichita sites but not in any of the samples from the four northwest Wichita sites. Table 15 lists the highest concentrations of the pesticide compounds detected in either the surface or ground waters at the Kingston Cove and Pine Bay sites along with water-quality standards related to human health. All of the pesticides or degradate compounds that were detected in the surface-water samples were also found in at least one of the ground waters of the two sites. One pesticide, simazine, was detected in one ground-water sample (the southeast well at Pine Bay Estates) but not in any of the surface water samples of the two pits. In general, the concentrations of the pesticides and degradates detected in the water samples from all six study sites were lower in the samples from the Kingston Cove and Pine Bay sites than in the samples from the four northwest Wichita sites. Atrazine and two of its degradates (deethylatrazine and hydroxyatrazine), metolachlor, and tebuthiuron were detected or measured in the surface-water samples from both Kingston Cove and Pine Bay (Table 9). The atrazine concentrations in the surface waters from Kingston Cove and Pine Bay (0.026 µg/L and 0.019 µg/L, respectively) were well below the drinking water MCL of 3 µg/L (Table 15). Concentrations of the atrazine degradates were lower than the atrazine content in each pit. The concentrations of the degradates were higher in the pit water with the greater atrazine content (Kingston Cove). The concentration range for metolachlor was 0.012-0.016 µg/L. Metolachlor is a pesticide registered by the U.S. Environmental Protection
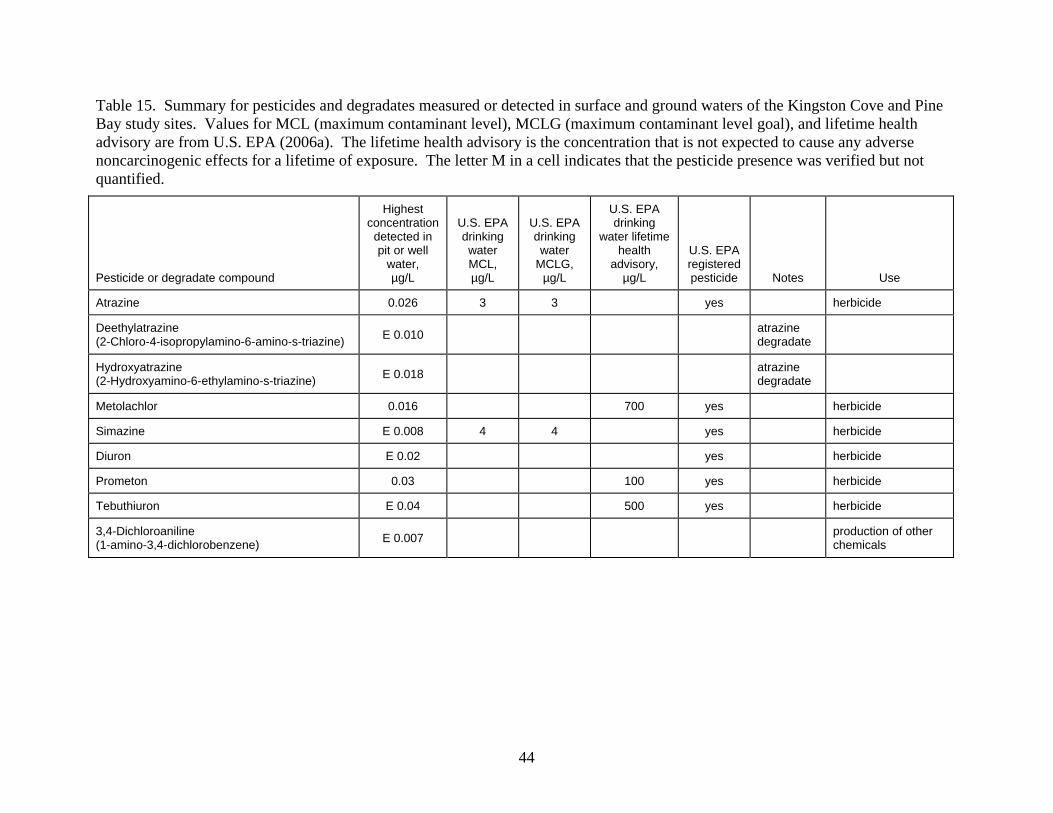
Table 15. Summary for pesticides and degradates measured or detected in surface and ground waters of the Kingston Cove and Pine Bay study sites. Values for MCL (maximum contaminant level), MCLG (maximum contaminant level goal), and lifetime health advisory are from U.S. EPA (2006a). The lifetime health advisory is the concentration that is not expected to cause any adverse noncarcinogenic effects for a lifetime of exposure. The letter M in a cell indicates that the pesticide presence was verified but not quantified.
Pesticide or degradate compound
Highest concentration detected in pit or well
water, µg/L
U.S. EPA drinking water MCL, µg/L
U.S. EPA drinking water
MCLG, µg/L
U.S. EPA drinking
water lifetime health
advisory, µg/L
U.S. EPA registered pesticide
Notes
Use
Atrazine 0.026 3 3 yes herbicide
Deethylatrazine (2-Chloro-4-isopropylamino-6-amino-s-triazine) E 0.010 atrazine
degradate
Hydroxyatrazine (2-Hydroxyamino-6-ethylamino-s-triazine) E 0.018 atrazine
degradate
Metolachlor 0.016 700 yes herbicide
Simazine E 0.008 4 4 yes herbicide
Diuron E 0.02 yes herbicide
Prometon 0.03 100 yes herbicide
Tebuthiuron E 0.04 500 yes herbicide
3,4-Dichloroaniline (1-amino-3,4-dichlorobenzene) E 0.007 production of other
chemicals
44
Agency (EPA) and has a lifetime health advisory level of 700 µg/L but does not currently have a drinking water MCL. The tebuthiuron levels estimated in the surface waters were about five orders of magnitude below the lifetime health advisory level of 500 µg/L. Prometon was measured in the sample from Kingston Cove and diuron was detected in the sample from Pine Bay; the concentrations were <0.1 µg/L. None of the pesticides or degradates were detected in all of the well water samples for both the Kingston Cove and Pine Bay sites. Atrazine and one of its degradates, and diuron, prometon, and 3,4-dichloroaniline were found in the sample from the southeast well at the Kingston Cove site. Prometon was the only pesticide detected in the southwest well, and no pesticides were found in the samples from the north well at the Kingston Cove site. Hydroxyatrazine, diuron, prometon, and tebuthiuron were detected in the ground water from the monitoring well north of Pine Bay. Atrazine and two of its degradates, and metolachlor, simazine, and prometon were detected in the sample from the well to the southeast, whereas, atrazine and one of its degradates, and diuron, and prometon were found in the sample from the well to the southwest of Pine Bay. The simazine content estimated in the one well-water sample was less than a percent of the drinking-water MCL of 4 µg/L for this pesticide. The pesticides atrazine, metolachlor, and simazine are herbicides usually used for weed control for agricultural crops. However, they are also sometimes used for control of weeds along roads and in selected lawn grasses. For example, a Kansas State University (KSU) publication “Turfgrass pesticide selection guide for professional applicators” (Fagerness et al., 2001) lists atrazine for pre-emergent control of annual bluegrass and winter annual broadleaf weeds in dormant bermuda grass, simazine for pre-emergent control of annual bluegrass and winter annual broadleaf weeds in bermuda and zoysia lawns, and metolachor for pre-emergent control of crabgrass, goosegrass, foxtails, and annual bluegrass in established bermuda and zoysia. The guide also lists atrazine in a mixture with the pesticide bentazon for post-emergent control of winter and summer annual broadleaf weeds in bermuda and zoysia lawns. Diuron is a herbicide used to control a variety of annual and perennial broadleaf and grassy weeds, as well as mosses. Prometon is a triazine herbicide used to control weeds and grasses, usually in urban areas. Tebuthiuron is a substituted urea herbicide used for control of broadleaf and woody weeds, grasses, and brush, such as along roadways. The compound 3,4-dichloroaniline is used to produce other chemicals, including pesticides, and also is a degradation product of diuron. The presence of atrazine and hydroxyatrazine in the ground water from the southeast well but not the north or southwest well at the Kingston Cove site, and the occurrence of atrazine, hydroxyatrazine, and deethylatrazine in the ground waters in the southeast and southwest wells but not the north well at the Pine Bay site, fit the general pattern of entrance into the ground water from the pit. However, the degradate hydroxyatrazine was also found in the water from the north well at the Pine Bay site. In general, the evidence for contamination of the ground waters at the Kingston Cove and Pine Bay sites by the movement of pesticides from the pit waters is less substantial than for the three residential pits studied in northwest Wichita (Barefoot Bay, Ridge Port, and Moorings) due to the lower concentrations and the less clear distribution patterns of atrazine and its degradates, as well as for other triazine pesticides, at the Kingston Cove and Pine Bay sites compared to the other three sites.
45
46
Organic Compounds Other than Pesticides Four organic compounds other than pesticides were detected in the surface-water samples and 13 compounds were found in the ground-water samples at the Kingston Cove and Pine Bay study sites (Tables 11 and 12) out of a total of 134 compounds for which the USGS conducted analyses. Isophorone was the most commonly detected of these compounds, being found (verified but not quantified) in the sand-pit surface waters of Kingston Cove and Pine Bay and in all of the well-water samples at the Pine Bay site. Isophorone is an industrial chemical used as a solvent in some printing inks, paints, lacquers, and adhesives (ATSDR, 1999a). It is also used as an intermediate in the production of certain chemicals. Although isophorone is an industrial chemical, it also occurs naturally in cranberries. The EPA lifetime health advisory level and the recommended level for consumption of water and organisms related to human health for isophorone in drinking water are 100 µg/L and 35 µg/L, respectively (Table 16). The USGS detection limit for isophorone in the water samples was 0.6 µg/L (Table 12). Thus, the detected amount (indicated by the M in Tables 11 and 12) for isophorone is expected to be substantially below both the health advisory and recommendation. The compound 2-nitrophenol was detected in surface water from the Kingston Cove pit and 4-nitrophenol was found in the sample from Pine Pay (Table 11). These chemicals were not detected in any of the wells at the two study sites (Table 12). These nitrophenols do not have any current drinking-water standards or health advisories, although 2-nitrophenol is on the priority pollutant list in the U.S. EPA national recommended water quality criteria (U.S. EPA, 2006b). These are manufactured compounds and do not occur naturally in the environment (ATSDR, 1995a). Many volatile organic compounds (VOCs) that are regulated for drinking water use were measured or detected in the ground-water samples from the three monitoring wells at Kingston Cove (Table 12). The VOCs included 1,1-dichloroethene (also known as 1,1-dichloroethylene), 1,2-dichloroethane, cis-1,2-dichloroethene (cis-1,2-dichloroethylene), trans-1,2-dichloroethene (trans-1,2-dichloroethylene), trichloroethene (trichloroethylene), tetrachloroethene (tetrachloroethylene), 1,2-dichloropropane, 1,4-dichlorobenzene (p-dichlorobenzene), benzene, and vinyl chloride. All of these VOCs were measurable or detected in the southeast monitoring well, all except benzene were found in the southwest well, and all except tetrachloroethene, 1,2-dichloropropane, and vinyl chloride were measurable in the north well at Kingston Cove. In addition, measurable quantities of the following VOCs, for which there are currently no drinking water criteria, were observed in ground-water samples from the Kingston Cove site: 1,1-dichloroethane in all three wells and methyl tertiary butyl ether (MTBE) in the north well. Only one of the VOCs, cis-1,2-dichloroethene, was found in the surface water of Kingston Cove (Table 11). None of these VOCs were detected in any of the surface or ground waters of the Pine Bay site. The concentrations of 1,1-dichloroethene, cis-1,2-dichloroethene, and trichloroethene in the sample from the southeast well at Kingston Cove exceeded the MCLs for drinking water (Table 16). The 1,1-dichloroethene content of the water from the southwest well also exceeded the drinking-water MCL, and the trichloroethene level in this sample was close to the MCL but
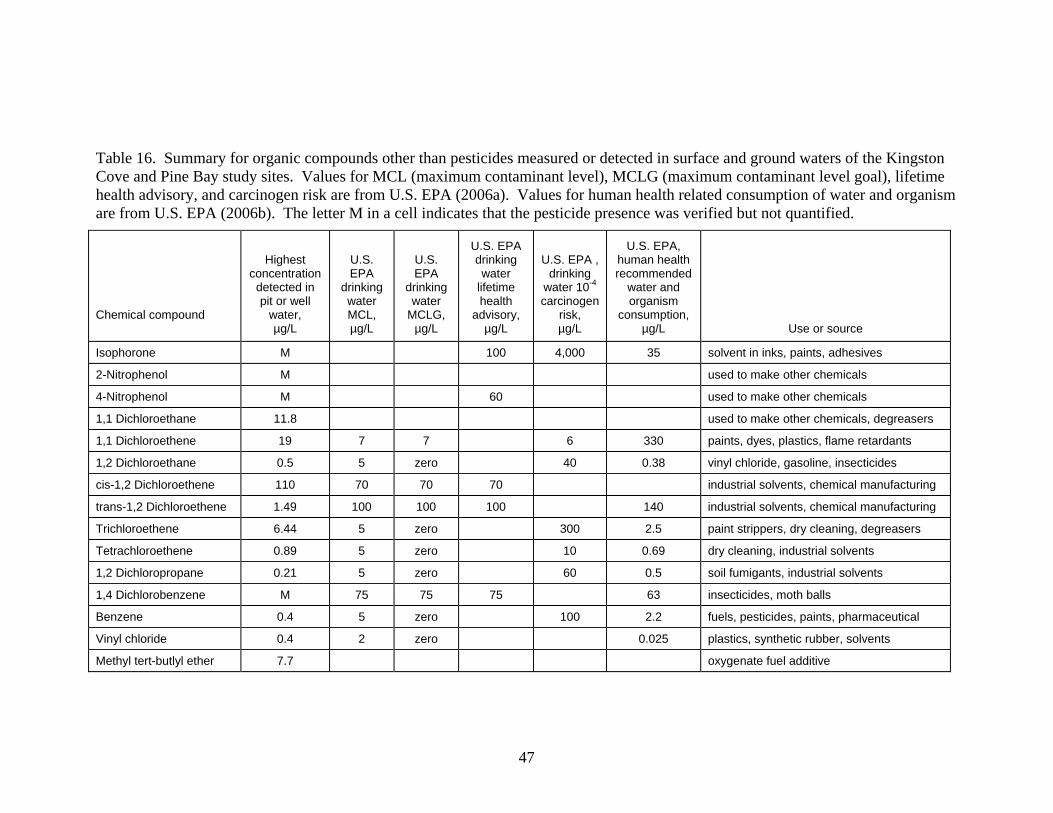
Table 16. Summary for organic compounds other than pesticides measured or detected in surface and ground waters of the Kingston Cove and Pine Bay study sites. Values for MCL (maximum contaminant level), MCLG (maximum contaminant level goal), lifetime health advisory, and carcinogen risk are from U.S. EPA (2006a). Values for human health related consumption of water and organism are from U.S. EPA (2006b). The letter M in a cell indicates that the pesticide presence was verified but not quantified.
Chemical compound
Highest
concentration detected in pit or well
water, µg/L
U.S. EPA
drinking water MCL, µg/L
U.S. EPA
drinking water
MCLG, µg/L
U.S. EPA drinking water
lifetime health
advisory, µg/L
U.S. EPA ,
drinking water 10-4 carcinogen
risk, µg/L
U.S. EPA, human health recommended
water and organism
consumption, µg/L
Use or source
Isophorone M 100 4,000 35 solvent in inks, paints, adhesives
2-Nitrophenol M used to make other chemicals
4-Nitrophenol M 60 used to make other chemicals
1,1 Dichloroethane 11.8 used to make other chemicals, degreasers
1,1 Dichloroethene 19 7 7 6 330 paints, dyes, plastics, flame retardants
1,2 Dichloroethane 0.5 5 zero 40 0.38 vinyl chloride, gasoline, insecticides
cis-1,2 Dichloroethene 110 70 70 70 industrial solvents, chemical manufacturing
trans-1,2 Dichloroethene 1.49 100 100 100 140 industrial solvents, chemical manufacturing
Trichloroethene 6.44 5 zero 300 2.5 paint strippers, dry cleaning, degreasers
Tetrachloroethene 0.89 5 zero 10 0.69 dry cleaning, industrial solvents
1,2 Dichloropropane 0.21 5 zero 60 0.5 soil fumigants, industrial solvents
1,4 Dichlorobenzene M 75 75 75 63 insecticides, moth balls
Benzene 0.4 5 zero 100 2.2 fuels, pesticides, paints, pharmaceutical
Vinyl chloride 0.4 2 zero 0.025 plastics, synthetic rubber, solvents
Methyl tert-butlyl ether 7.7 oxygenate fuel additive
47
exceeded the recommended level related to human health for consumption of water. Although the concentration of 1,2-dichloroethane in the north and southeast well samples, and of tetrachloroethene and vinyl chloride in the southeast and southwest well waters did not exceed the drinking-water MCL, the values were higher than the recommended levels related to human health for consumption of water. The maximum contaminant level goal (MCLG) for 1,2 dichloroethane, trichloroethene, tetrachloroethene, 1,2 dichloropropane, benzene, and vinyl chloride is zero. Thus, the occurrence of these VOCs in the water samples exceeds the MCLG. There are no health criteria for drinking water for 1,1-dichloroethane, and the Department of Health and Human Services, the International Agency for Research on Cancer, and the U.S. EPA have not classified this compound for carcinogenicity (ATSDR, 1999b). The Office of Water of the U.S. EPA “has concluded that available data are not adequate to estimate potential health risks of MTBE at low exposure levels in drinking water but that the data support the conclusion that MTBE is a potential human carcinogen at high doses. Recent work by EPA and other researchers is expected to help determine more precisely the potential for health effects from MTBE in drinking water” (http://www.epa.gov/mtbe/water.htm). The U.S. EPA has placed MTBE on the drinking water Contaminant Candidate List for further evaluation to determine whether or not regulation with a National Primary Drinking Water Regulation is necessary. Although MTBE has no health-based advisory, there is a taste threshold advisory of 40 µg/L and an odor threshold advisory of 20 µg/L for drinking water (U.S. EPA, 2006a). The one ground-water sample (north well) in which MTBE was found had a concentration that did not exceed either of these advisories. The VOCs found in the water samples from the Kingston Cove site have a range of industrial and commercial uses, including as solvents of various types (such as removing grease and paint), for dry cleaning, in plastics, in fuels, and in producing other chemicals (Table 16). The presence of the 12 VOCs in the ground water and of only one of these in the surface water at Kingston Cove, the primary presence of residences (apartments) along the shoreline of the Cove, and the indication that there are no storm drains directed into Kingston Cove (according to a map in SCDER [2005] suggest that the sources are probably not surface runoff into the pit. The primary sources could be surface infiltration of the VOCs from industrial and commercial facilities to the ground-water table in the general area of the pit and migration of the water within the underlying alluvial aquifer in response to the hydraulic head gradient. The greater number and concentrations of VOCs measured in the downgradient monitoring wells (southeast and southwest) at the Kingston Cove are expected to be related more to the location of ground-water contamination sites and local ground-water flow directions than to the influence of the pit. For example, a known contamination site, where dry cleaning VOCs have impacted ground-water quality, was approximately 1,500 ft to the southwest of the pit (SCDER, 2005). Based on the measurements of water levels in the monitoring wells (Table 6), the ground-water flow at the time of well sampling was generally to the southeast in the site area. This suggests that a possible source location of the VOC contaminants could be to the northwest. However, the generally lower number and concentration of VOCs in the sample from the north monitoring well than in the waters from the downgradient wells suggest that the flow from the source(s) might not have been directly past this well. The actual directions of local ground-water flow are unknown and could be influenced by a range of local factors, including river-aquifer
48
interactions, recharge from the pit into the ground water (during substantial rainfall) and discharge into the pit (during periods of high evaporation), ground-water pumping, and runoff/recharge heterogeneity caused by buildings and pavement in contrast to vegetated and bare soils. DISCUSSION OF CHEMICAL DATA – SEDIMENT A table of metals for which there are guidelines for aquatic life was not included in the phase I report (Whittemore, 2007) on the sand-pit study sites, although a statement was made indicating that the metals concentrations of the bottom sediments did not exceed the probable effects levels (PELs) listed in Burton and Pitt (2002). This report considers the following screening values for metals: the threshold effects levels (TELs) and the PELs listed in freshwater sediments in the first National Sediment Quality Survey of the U.S. EPA (1997), consensus-based threshold effects concentrations (TECs) and probable effects concentrations (PECs) published in MacDonald et al. (2000), and effects concentrations according to the logistic regression model used in the second edition of the National Sediment Quality Survey (U.S. EPA, 2004). These publications were also used to evaluate the ecotoxicological effect of organic compounds detected in the sediments. The particle size of all of the sediment in the samples collected from the bottoms of the sand pits was <2 mm, the upper limit of the range for classification as sand (Table 13). The sediments at the Kingston Cove and Pine Bay sites were primarily fine-grained particles (<0.063 mm, smaller than the lower limit for the sand classification). Sediment from these two sites contained inorganic and organic carbon and sulfur contents in the fine-grained sediment and total nitrogen that were in the general range of those for the other residential pits. The total nitrogen and sulfur contents of the sediment were approximately proportional to the organic carbon concentration in all the samples, suggesting a similar composition of organic matter in the sediment at all of the pits. The USGS analyzed the sediments for inorganic constituents, including heavy metals (Table 13). Table 17 lists the highest concentration observed in the bottom sediments from the six pits, along with the screening values for assessing the toxic effects on freshwater ecosystems. The possible and probable effects values based on the logistic regression model represent effects at the 25 and 50 percent probability levels, respectively (U.S. EPA, 2004). The maximum content of mercury and silver determined in the bottom sediments did not exceed any of the screening levels for ecotoxicological effects. The maximum concentrations of arsenic and copper exceeded the TEL but not the PEL, TEC, PEC, or either LRM values (after rounding of the screening values to the same number of significant digits as for the measurements). The maximum cadmium was greater than the TEL and LRM25 values. The maximum chromium concentration was higher than the TEL and TEC levels. The maximum lead, nickel, and zinc contents exceeded the TEL, TEC, and LRM25 values. The greatest concentrations of cadmium, copper, lead, mercury, and zinc occurred in the bottom sediment from Kingston Cove (Table 13). However, the levels of these metals did not exceed a factor of two times the highest concentrations of the respective metals in the other pit
49
50
sediments. The greater metals contents in the Kingston Cove sediment could either reflect that the location is closest to a industrial and commercial area or is the oldest of any of the pits. The highest arsenic, chromium, and nickel contents were found in the sediment from the Cropland pit, although the values were not substantially greater than the maximum concentrations of these metals in the other pits. The Cropland pit was chosen to represent a background site. The lower contents of arsenic, chromium, and nickel in the sediments of the other pits might indicate dilution of the natural sediment by particulates with higher organic matter content, as indicated by the greater concentrations of carbon, nitrogen, and sulfur in the residential pit sediments. The USGS also analyzed the sediments for toxic organic compounds, primarily persistent pesticides, but also chlorinated aromatic compounds such as PCBs. The analyses were for 32 organic compounds. The USGS included a determination for an organic surrogate compound (alpha-HCH-d6) added to the sediment as a test of the percentage recovery of organochlorine compounds. The percent recovery for the seven sediment samples ranged from 66 to 87% and averaged 74%. The USGS detected nine out of the 32 organic compounds determined in the sediment samples. Three of the organic compounds detected in the sediment (Table 13) are found in the mixture of chemicals in technical grade chlordane, which was used as an insecticide in the U.S. from 1948 to 1988 (ATSDR, 1995). The U.S. EPA banned the use of chlordane in 1988 due to its damaging impact on human health and the environment. The USGS found (presence verified but not quantified) chlordane and an associated compound only in the two bottom sediment samples from the Barefoot Bay pit. The detection level for the three chlordane compounds in the sediment samples from the other five pits ranged from <1 to <3 µg/kg (<0.001 to <0.003 mg/kg) dry weight. The lowest screening value for toxic effect in aquatic ecosystems is the TEL (2.26 µg/kg or 0.00226 mg/kg, Table 17). The data suggest that the chlordane compounds detected might be close to the TEL. However, they are below the other screening levels for ecotoxicological effects. Six of the organic compounds were detected only in the pit bottom sediment from Kingston Cove. Five of these compounds are one isomer of DDT and four of its metabolites (Table 13). DDT (dichlorodiphenyltrichloroethane) is a pesticide once widely used to control insects in agriculture and insects that carry diseases (ATSDR, 2002). The isomer measured by the USGS laboratory (p,p’-DDT) is the one in greatest concentration in commercially produced DDT. The U.S. banned DDT use in 1972 because of damage to wildlife. DDE (dichlorodiphenyldichloroethylene) and DDD (dichlorodiphenyldichloroethane) are compounds similar to DDT that were found as contaminates in commercial DDT preparations and are also degradates of DDT. Although DDT, DDE, and DDT are rapidly degraded by sunlight, they adsorb strongly on and break down slowly in sediment (potentially for hundreds of years [ATSDR, 2002]). The concentration of p,p’-DDT and one of its degradates (p,p’-DDD) in the Kingston Cove sediment exceeded the TEL for exotoxicological effect on freshwater ecosystems (Table 17). The degradate p,p’-DDD also exceeded the PEL, consensus-based TEC, and the LRM25 values for this compound. The presence of DDT and its degrades in the sediment at Kingston Cove and not at the other pits probably reflects the age of the pit and the urban location. The Kingston Cove pit was active in 1960 and the development around the pit occurred during 1968 to 1974 (Table 1), which included the period when DDT was still used in the U.S.
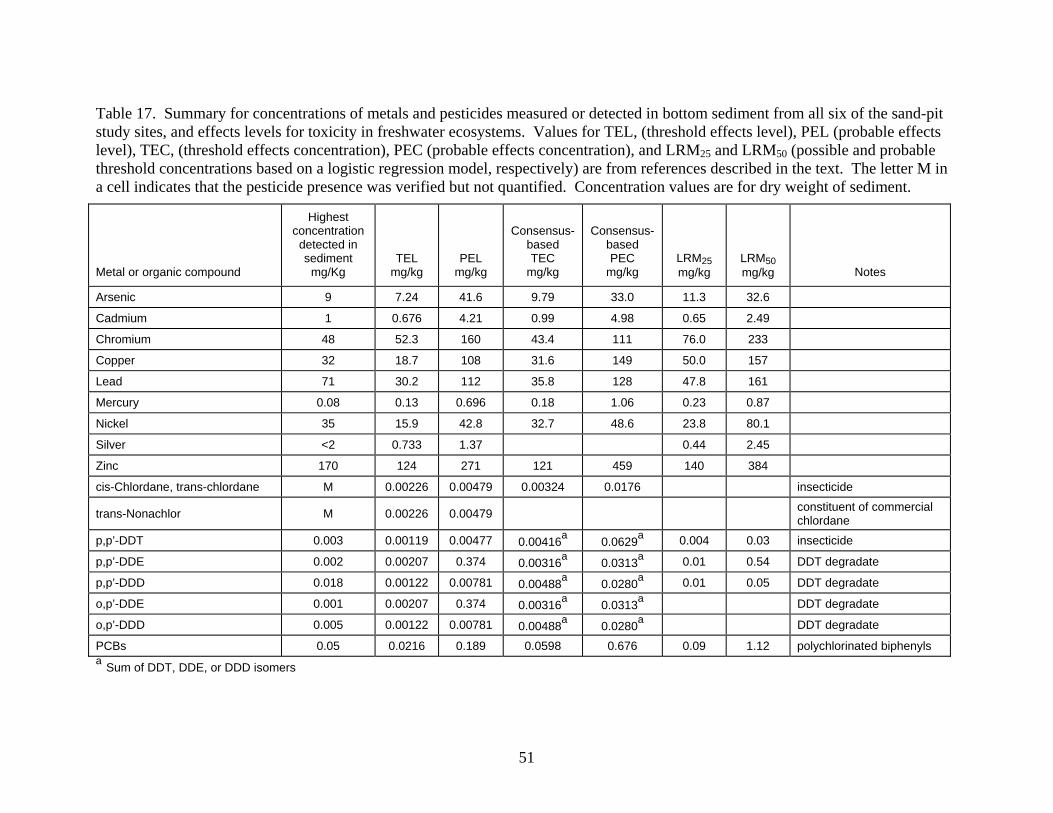
Table 17. Summary for concentrations of metals and pesticides measured or detected in bottom sediment from all six of the sand-pit study sites, and effects levels for toxicity in freshwater ecosystems. Values for TEL, (threshold effects level), PEL (probable effects level), TEC, (threshold effects concentration), PEC (probable effects concentration), and LRM25 and LRM50 (possible and probable threshold concentrations based on a logistic regression model, respectively) are from references described in the text. The letter M in a cell indicates that the pesticide presence was verified but not quantified. Concentration values are for dry weight of sediment.
Metal or organic compound
Highest concentration detected in sediment
mg/Kg
TEL mg/kg
PEL mg/kg
Consensus-
based TEC
mg/kg
Consensus-
based PEC
mg/kg
LRM25
mg/kg
LRM50
mg/kg
Notes
Arsenic 9 7.24 41.6 9.79 33.0 11.3 32.6
Cadmium 1 0.676 4.21 0.99 4.98 0.65 2.49
Chromium 48 52.3 160 43.4 111 76.0 233
Copper 32 18.7 108 31.6 149 50.0 157
Lead 71 30.2 112 35.8 128 47.8 161
Mercury 0.08 0.13 0.696 0.18 1.06 0.23 0.87
Nickel 35 15.9 42.8 32.7 48.6 23.8 80.1
Silver <2 0.733 1.37 0.44 2.45
Zinc 170 124 271 121 459 140 384
cis-Chlordane, trans-chlordane M 0.00226 0.00479 0.00324 0.0176 insecticide
trans-Nonachlor M 0.00226 0.00479 constituent of commercial chlordane
p,p’-DDT 0.003 0.00119 0.00477 0.00416a 0.0629a 0.004 0.03 insecticide
p,p’-DDE 0.002 0.00207 0.374 0.00316a 0.0313a 0.01 0.54 DDT degradate
p,p’-DDD 0.018 0.00122 0.00781 0.00488a 0.0280a 0.01 0.05 DDT degradate
o,p’-DDE 0.001 0.00207 0.374 0.00316a 0.0313a DDT degradate
o,p’-DDD 0.005 0.00122 0.00781 0.00488a 0.0280a DDT degradate
PCBs 0.05 0.0216 0.189 0.0598 0.676 0.09 1.12 polychlorinated biphenyls a Sum of DDT, DDE, or DDD isomers
51

The oldest age of pit excavation and start of residential development at the other pits were 1968 and 1978, respectively. Polychlorinated biphenyls (PCBs) were also found in the Kingston Cove sediment. The concentration was at the detection limit for this group of chemicals (Table 13). PCBs are a mixture of chemicals that are no longer produced in the U.S. but are still found in the environment due to their slow breakdown rate (ATSDR, 2001). There are no known natural sources of these chemicals. PCBs were used as coolants and lubricants in transformers, capacitors, and other electrical equipment. The U.S. stopped manufacturing PCBs in 1977 because of evidence that they build up in the environment and can cause harmful health effects. Products made before 1977 that may contain PCBs include old fluorescent lighting fixtures and electrical devices containing PCB capacitors, and old microscope and hydraulic oils (ATSDR, 2001). PCBs adsorb strongly to organic particles and bottom sediments. The concentration of PCBs detected in the Kingston Cove sediment exceeded the TEL screening level for assessment of toxic effect on freshwater ecosystems (Table 17). The presence of this persistent compound at Kingston Cove is probably also related to the greater age of this pit than of the other pits. COMPARISON OF RESULTS FOR NORTHWEST AND SOUTHERN WICHITA PITS The TDS content of the surface waters in the six study pits ranged from 652 to 1,140 mg/L and exceeded the recommended drinking water limit of 500 mg/L. The TDS concentrations in the ground waters at the six sites ranged from 525 to 1,210 mg/L. The TDS levels in all of the surface and ground waters at the Moorings pit site were higher than 1,000 mg/L when sampled, a classification level dividing freshwater and slightly saline water. In general, the lowest TDS contents were found at the Pine Bay pit. The chloride concentrations in the surface and ground waters at the six site ranged from 65 to 462 mg/L. As for TDS, the highest chloride contents were found at the Moorings site and the lowest generally occurred at the Pine Bay site. The chloride concentrations in all of the surface-water samples from the four study sites in northwest Wichita (Barefoot Bay, Moorings, Ridge Port, and Cropland pits) and in all three of the monitoring well waters at the Barefoot Bay, Moorings, and Cropland sites and in one of the well waters at Ridge Port exceeded the recommended drinking water limit of 250 mg/L. None of the surface- and ground-water samples from the Kingston Cove and Pine Bay sites exceeded the secondary standard for chloride. The lower TDS and chloride concentrations at the southern Wichita sites probably result from the dilution of the Arkansas River, and of the ground water adjacent to the river through stream-aquifer interactions, by the fresher water of the Little Arkansas River and smaller drainages that enter the Arkansas River downstream of the four study sites in northwest Wichita and upstream of the two southern Wichita sites. The only water sample from any of the six study sites that exceeded a primary drinking water standard was collected from the monitoring well southeast of Kingston Cove. The arsenic content of this sample (11.2 µg/L) slightly exceeded the MCL of 10 µg/L. The sample from the southeast Ridge Port well had the next highest arsenic concentration, which was the same as the MCL of 10 µg/L. Dissolved iron concentrations exceeded the secondary standard of 0.3 mg/L (300 µg/L) for drinking water in samples from a monitoring well at each of the Ridge Port, Kingston Cove, and Pine Bay sites. Dissolved manganese contents were greater than the
52
secondary standard of 0.05 mg/L (50 µg/L) in two of the Moorings pit samples, one of the Cropland pit samples, and in all but two of the ground waters from the 18 monitoring wells of the six sites. In general, the ground waters with higher concentrations of dissolved iron and manganese contained greater dissolved arsenic levels. Ground waters with measurable ammonium ion contents also tended to be associated with higher dissolved iron and manganese concentrations at the study sites, indicating chemically reducing conditions. The distribution of iron, manganese, and ammonium concentrations in the ground waters around the southern Wichita pits was not as suggestive of the impact of dissolved organic matter from the pit water as for the sand-pit sites in northwest Wichita. The greatest dissolved iron concentrations occurred in the north, upgradient wells rather than the downgradient wells at the Kingston Cove and Pine Bay sites. Local sources of organics, either in the sediment or from contamination of the aquifer water by past surface disposal of solvents or other organic chemicals (especially in the Kingston Cove area), could be a stronger control on reducing conditions in the ground waters at the Kingston Cove and Pine Bay sites than the flow of pit water to the ground water. Coliphage were not detected in any of the surface- and ground-water samples from the six study sites. E. coli was estimated or measured in all of the pit samples but only in the ground waters at the Kingston Cove and Pine Bay sites, although the estimated values for the ground waters were at or near the detection limit. Fecal coliform bacteria were estimated or measured in all of the pit water samples except the April 2006 sample from Barefoot Bay, and were present in waters from three of the 12 wells at the northwest Wichita sites and in all six well waters from the Kingston Cove and Pine Bay sites, although the values for the ground waters at the southern Wichita sites were at the detection limit. Total coliform bacteria counts were >200 colonies per 100 mL in most of the surface-water samples from the six study pits but in only two of the monitoring well waters (southwest wells at the Cropland and Pine Bay sites). In general, the levels of bacterial parameters were lower in the ground water than in the surface waters at all of the sites. A greater number and generally greater concentrations of pesticides were detected or measured in the waters at the northwest Wichita (20 compounds) than at the southern Wichita sites (nine compounds). The pesticide atrazine and its degradates deethylatrazine and hydroxyatrazine were present at measured or estimated concentrations in the surface waters from all six study pits. Atrazine was also found in the ground waters from all 12 of the wells at the northwest Wichita sites and in half of the six wells at the southern Wichita sites. Deethylatrazine was present in all of the well samples from the northwest Wichita sites and in two of the Pine Bay wells. Hydroxyatrazine was found in all but two of the wells (north and southwest Cropland wells) at the northwest Wichita sites and in half of the wells at the southern Wichita sites. The concentrations of atrazine and it degradates were generally greater in the waters at the northwest than at the southern Wichita sites. The pesticide metolachlor was measured in the surface-water samples from all pits, and measured or estimated in the ground waters from nine of the monitoring wells at the northwest Wichita sites and from one of the six wells at the southern Wichita sites. Simazine was measurable in all six pits at the northwest Wichita sites but none of the southern Wichita pits, and was present in water from eight of the 12 wells at the northwest Wichita sites but from only one of the southern Wichita sites. The herbicides diuron and prometon were detected in the
53
water samples from some of the pits and ground waters of both the northwest and southern Wichita pit sites. Only one pesticide, tebuthiuron, was detected in the waters of the Kingston Cove and Pine Bay sites but not in any of the samples from the four northwest Wichita sites. In comparison, the compounds deisopropyl s-atrazine, hexazinone, 2,4-D methyl ester, 2,4-D, acetochlor, alachlor, benomyl, desulfinyl fipronil, desulfinyl fipronil amide, myclobutanil, siduron, and carbon disulfide were detected in one or more surface-water samples from the three residential pits (Barefoot Bay, Ridge Port, Moorings) but not in any samples from the two southern Wichita pits. The compound 3,4-dichloroaniline was detected in waters from three of the six wells at the Barefoot Bay and Ridge Port sites and from one well at the Kingston Cove site. Six different organic compounds other than pesticides for which the USGS conducted analyses were found in the surface waters of the northwest and southern Wichita sites; two of these six compounds occurred in at least one of the sites in each area. The chemical 2,4-dimethylphenol was detected in pit samples from Barefoot Bay and Ridge Port, and pentachlorophenol was detected in one of two duplicate samples from the Moorings pit. The compound 4-nitrophenol was found in the Pine Bay pit and cis-1,2-dichloroethene in the Kingston Cove pit. The compound 2-nitrophenol was detected in the Barefoot Bay and Kingston Cove pits. Isophorone was found in the surface waters of all six pits, as well as in the ground waters from four of the nine wells at the residential sites in northwest Wichita and from all three wells at Pine Bay. The major difference in the chemistry of trace organics at the six sites was the discovery of 12 different VOCs in the ground waters at the Kingston Cove site. One of these 12 is a monochlorinated ethene (vinyl chloride), seven are dichlorinated ethane, ethene, propane, and benzene compounds, one is a trichlorinated ethene, and another is a tetrachlorinated ethene. The other two chemicals are benzene and MTBE. None of these compounds were detected at the other five study sites. The maximum measured concentrations of 1,1-dichloroethene, cis-1,2-dichloroethene, and trichloroethene exceeded the MCLs for drinking water. MCLGs of zero exist for these three compounds as well as for 1,2-dichloroethane, tetrachloroethene, 1,2-dichloropropane, benzene, and vinyl chloride, which were measured in all or most of the well waters from the Kingston Cove site. The location of Kingston Cove in a more commercial and industrial area than the other pits, as well in a downgradient direction of ground-water from this type of area, and the presence of known ground-water contamination in the vicinity are the logical explanations for the presence of these VOCs in the ground water. Sediment from the five residential pit sites contained inorganic and organic carbon, nitrogen, and sulfur contents that were in the same general range. The Cropland pit sediment had lower contents of these substances. The greatest concentrations of cadmium, copper, lead, mercury, and zinc occurred in the bottom sediment from Kingston Cove (Table 13). However, the levels of these metals did not exceed a factor of two times the highest concentrations of the respective metals in the other pit sediments. The highest arsenic, chromium, and nickel contents were found in the sediment from the Cropland pit, although the values were not substantially greater than the maximum concentrations of these metals in the other pits. The Cropland pit was chosen to represent a background site. The lower contents of arsenic, chromium, and nickel in the sediments of the other pits might indicate dilution of the natural sediment by particulates with
54
higher organic matter content, as indicated by the greater concentrations of carbon, nitrogen, and sulfur in the residential pit sediments. The persistent pesticide chlordane and an associated compound were detected in the two bottom sediment samples from the Barefoot Bay pit. The persistent pesticide DDT and four degradates (two isomers each of DDE and DDD) were found in the pit bottom sediment from Kingston Cove. Polychlorinated biphenyls (PCBs) were found in the Kingston Cove sediment, although the concentration was at the detection limit. The presence of DDT and its degrades and of PCBs in the sediment at Kingston Cove and not at the other pits probably reflects the age of the pit and the urban location. DDT was banned in 1972 and the manufacture of PCBs stopped in 1977. The Kingston Cove pit was active in 1960 and the development around the pit occurred during 1968 to 1974, which included the period when DDT and PCBs were still used in the U.S. The oldest age of pit excavation and start of residential development at the other pits was 1968 and 1978, respectively. ASSESSMENT OF SAND-PIT AND GROUND-WATER INTERACTION Water-level data collected for the wells and the pit at the four pit study sites in northwest Wichita (Table 6 in the phase I report, Whittemore [2007]) indicated that the ground-water flow direction was towards the southeast to south-southeast. The ground-water flow direction was generally towards the southeast for the Kingston Cove and Pine Bay sites based on the water-level measurements (Table 6 in the current report). The water-level elevation in all four of the northwest Wichita pits was between the elevations of the upgradient and downgradient wells. Unfortunately, although the pit water levels were measured during sampling of surface waters at Kingston Cove and Pine Bay, they were not measured during the sampling of ground waters from the wells at these sites. The dates of the well sampling, as well of ground-water level measurements at these two sites, were 20 to 21 days after the pit water levels were last recorded. Thus, the pit-water levels relative to the ground-water levels are not known for the ground-water sampling dates. The following conditions clearly indicated flow of surface water from the pits into ground water at the four northwest Wichita sites: 1) the generally higher concentration of pesticide and pesticide degradate compounds in the sand-pit waters than in the monitoring well samples, 2) usually higher concentrations of pesticides and degradates in the downgradient well samples than in the upgradient wells at the residential pit sites, including the highest content commonly occurring in the southeast well, and 3) the detection of organic compounds other than pesticides generally in one or two of the downgradient wells but not in the upgradient well samples at the residential pit sites. The surface- and ground-water interaction is also supported by the generally greater concentrations of iron, manganese, and ammonium ion in the ground waters at the downgradient wells, along with the higher concentration of organic matter in the pit than the well samples, which suggests that higher dissolved organic matter that entered the pits and flowed in the subsurface to the well locations explains part of the reducing condition found at the downgradient wells. The movement of surface water into the subsurface is expected to occur primarily when storm runoff raises the water level in the pits to an elevation higher than that of the ground water. During periods when evapotranspiration consumes water in the pits
55
and lowers the pit water level, ground water could flow into the pits. This is supported by the fact that the chloride concentration is substantial in the pit waters; the expected source is stream-aquifer interaction with saline Arkansas River water and possibly upward flow of deeper saline ground water. The concentrations of atrazine found in the water samples from the three residential pit sites in northwest Wichita provide a good example of the surface-water and ground-water connection. The atrazine contents in the June 2006 pit samples were 0.234, 0.094, and 0.456 µg/L at the Barefoot Bay, Ridge Port, and Moorings sites, respectively. The atrazine contents in the June 2006 samples from the north upgradient wells were 0.030, E0.006, and 0.144 µg/L, respectively, at these same sites, where E indicates a USGS estimate. The atrazine levels in the June samples from the southwest wells at these sites were 0.203, E0.008, and 0.255 µg/L, respectively, in comparison with the even greater concentrations of 0.207, 0.069, and 0.301 µg/L, respectively, in the southeast wells at these sites. The concentration patterns of the atrazine degradates deethylatrazine and hydroxyatrazine in the well water samples are generally similar to that for atrazine. The evidence for connection between the surface and ground waters at the two southern Wichita sites is not as strong as for the four northwest Wichita sites. However, the presence of atrazine and hydroxyatrazine in the ground water from the southeast well but not the north or southwest well at the Kingston Cove site, and the occurrence of atrazine, hydroxyatrazine, and deethylatrazine in the ground waters in the southeast and southwest wells but not the north well at the Pine Bay site, fit the general pattern of entrance into the ground water from the pit. The degradate hydroxyatrazine was also found in the water from the north well at the Pine Bay site, which might possibly be from the entrance of surface water from pits to the northwest of Pine Bay into the subsurface. Two sand pits are located within a half mile and four more pits within another half mile to the northwest of Pine Bay. The presence of these pits just upgradient of Pine Bay, as well as the source of ground-water contamination by organic compounds at Kingston Cove, appears to obscure the pattern of dissolved iron, manganese, and ammonium ion in the ground waters resulting from the generation of greater reducing conditions by organic carbon in the pit water. However, the Kingston Cove and Pine Bay pits do contain greater organic carbon content than the ground waters and the redox potentials are lower in the ground waters of the downgradient wells than in the upgradient wells at these two sites. COMPARISON WITH EARLY 1990S STUDY The KGS, GMD2, and the Wichita-Sedgwick County Department of Community Health (WSCDCH) conducted a study in the early 1990s to assess the impact on ground-water quality in the Equus Beds aquifer of stormwater recharge from unlined earthen pits (Whittemore et al., 1993). Two sites were studied that were at or near the north boundary of Wichita and south of Valley Center. One site received drainage from a new residential area (Fox Meadows, located in N/2 Sec 13, T. 26 S., R. 1 W.) and the other (Miles sand pit, SW/4 Sec. 19, T. 26 S., R. 1 E.) drained a more urban area that included the heavily traveled Meridian Street. The Fox Meadows stormwater retention area is about 1.5 mile north and the Miles sand pit approximately 0.5 mile east of the Moorings pit. In cooperation with the City of Wichita Water Department, GMD2
56
installed three monitoring wells at different locations around the Fox Meadows pit and three wells at two locations (two shallow and one deeper well at one location) next to the Miles sand pit. The WSCDCH collected water samples according to EPA sampling protocols and sent them to the KGS for measurement of dissolved inorganic constituents and to GTEL Environmental Laboratories, Inc., in Wichita for determination of selected volatile organic compounds and triazine herbicides (Whittemore et al., 1993). The sampling sites included the six observation wells, the two stormwater pits, a road ditch routing drainage to the Miles sand pit, and snow melt in a roadside puddle. The sampling period was August 8, 1991, to July 7, 1992. Like the Moorings pit site, surface water in the Miles sand pit and the adjacent ground waters were saline. The Fox Meadows site is far enough to north and east of the Arkansas River, and also closer to the Little Arkansas River, that the ground waters were fresh, with chloride concentrations that were always below 100 mg/L. The surface waters sampled from the Fox Meadow retention area were always fresh but varied substantially in dissolved solids content. Ground waters at the Fox Meadows site contained a higher nitrate concentration (3.6-8.1 mg/L as nitrate-N) than the those at the Miles sand pit and the six pit sites discussed in Whittemore (2007) and this current report. Whittemore et al. (1993) attributed the source of greater nitrate as agricultural activities that occurred prior to the residential development of the area. The dissolved concentrations of the metals copper, lead, and manganese in all the surface and ground waters sampled at the two sites were below MCL or SMCL levels. Two out of the 35 samples in which arsenic was determined contained 11 µg/L, near the recently revised MCL of 10 µg/L for this constituent. The other arsenic concentrations were generally well below the MCL. The highest arsenic level found in the ground waters from the six Wichita sites examined in the current study was also 11 µg/L (the southeast well at Kingston Cove). The highest arsenic observed in the surface- and ground-water samples from the other five pits examined in the current study were 2.5 and 10 µg/L, respectively. The analysis for volatile organic compounds in the early 1990s study was based on modified method 8240 of the U.S. EPA. The analysis included 38 compounds, mainly chlorinated hydrocarbons and simple aromatic hydrocarbons of concern for drinking water supplies. No concentrations of the compounds determined were found to be above the practical quantification limits of the methods (Whittemore et al., 1993). Three compounds were detected at levels below the practical quantification limit in the 24 surface- and ground-water samples from the two sites: toluene (one sample of Miles sand pit water), methylene chloride (one sample from a monitoring well to the southeast of Miles sand pit), and acetone (one sample from the Miles sand pit drainage ditch and one sample from the Fox Meadows pond). GTEL Environmental Laboratories analyzed ten samples collected in 1991 for the triazine herbicides atrazine, simazine, and propazine. No samples contained detectable amounts. However, their quantification limits for the compounds were 5 µg/L for eight of the samples and 20 µg/L for two of the samples. These quantification limits are higher than the drinking water MCLs for atrazine (3 µg/L) and simazine (4 µg/L) (Table 15). GTEL sent ten samples collected in 1992 to Pace Incorporated of Lenexa for analysis for atrazine, simazine, propazine, and
57
prometon. Their method detection limit was 1 µg/L. None of these ten samples contained detectable concentrations of these triazines. In comparison, the USGS laboratory that determined triazines in the samples for the current study was able to detect atrazine, simazine, and prometon down to 0.006, 0.005, and 0.01 µg/L, respectively. The USGS did not analyze samples for propazine. The USGS found that all of the atrazine, simazine, and prometon concentrations measurable in the samples of the current study were below the 1 µg/L detection limit of the Pace Incorporated lab. The substantially lower detection limits for the 2006 and 2007 samples in comparison with those for the 1992 samples indicates the improvements in the analytical methods over the 14-year period, as well as the fact that the USGS laboratory is set up for research purposes with generally lower detection limits than for most commercial laboratories. CONCLUSIONS Surface waters sampled from the six sand pits studied contained many organic compounds of concern for drinking waters. However, none of the concentrations measured exceeded drinking water standards or recommended levels, and essentially all of the organic compounds for which standards exist were present at levels substantially below the standards. However, ground waters at the Kingston Cove site contained many VOCs, and the concentrations of three of these (chlorinated ethenes) exceeded the MCLs and the presence of five others (chlorinated hydrocarbons and benzene) exceeded the MCLG of zero for drinking water. The most common organics of interest relative to drinking water at the study sites were pesticide and pesticide degradates, especially triazine compounds used as herbicides. Atrazine and two of its degradates (deethylatrazine and hydroxyatrazine), metolachlor, and simazine occurred in the greatest percentage of samples and generally in the highest concentrations of all of the pit and well water samples. The concentrations of these five compounds were usually greater in the surface and ground waters at the residential pits (Barefoot Bay, Ridge Port, Moorings, Kingston Cove, and Pine Bay) than at the Cropland control pit. In addition, there were fewer pesticides and organics other than pesticides detected in the surface waters at the Cropland than at the residential pit sites. The generally greater occurrence and concentration of organic compounds in the pit waters at the residential sites reflect the use of selected herbicides on lawns, landscaping, and road sides, as well as of insecticides and other organics in urban areas. In addition, the concentrations of the herbicides commonly associated with crops may have been smaller at the Cropland site than at some of the residential sites because the design of some residential pits allows the entry of stormwater runoff, whereas no storm drains are directed into the Cropland pit. The surface waters at Barefoot Bay and Ridge Port may also be affected by herbicides used for agriculture in the watershed upstream of the pits, because the pits receive drainage from Big Slough. The surface and ground waters at all six pit sites had TDS contents that exceeded the recommended or secondary drinking water standard. All of the surface waters and nearly all of the ground waters at the four northwest Wichita sites exceeded the recommended drinking water level for chloride concentration. The high chloride and TDS levels are primarily natural and
58
result from the interaction of saline Arkansas River water, and possibly deeper saline ground water, with the alluvial aquifer and sand-pit water at the sites, primarily when evapotranspiration lowers the pit water level below the adjacent ground-water level to allow discharge of ground-water into the pit. Dissolved iron concentrations exceeded recommended drinking water levels in the ground waters from a few wells, and the dissolved manganese contents were greater than recommended levels in a few of the surface-water samples and in nearly all of the ground-water samples at the six study sites. Only one of the pit or well waters sampled at the study sites had a concentration of an inorganic constituent (arsenic) that exceeded a primary drinking water standard, and the one that did (ground water from the southeast well at Kingston Cove) just barely exceeded the MCL. All of the surface waters sampled at the six pit sites contained measurable or estimable contents of E. coli and total coliform bacteria and all but one of the pit-water samples contained fecal coliform bacteria. One sample of residential pit water (Ridge Port) contained E. coli bacteria that exceeded the KDHE geometric mean criterion for primary contact recreation in a classified stream segment during the spring and summer. However, additional samples would have been necessary to compute the geometric mean necessary for determination of a regulatory exceedance. Most of the monitoring well samples contained measurable total coliform bacteria indicating that they would need to be treated if used for drinking water. The bottom sediments of the six sand pits did not have heavy or semi-metal concentrations that exceeded the assessment guidelines for probable toxic effects on freshwater ecosystems. However, the maximum concentrations of arsenic, cadmium, chromium, copper, lead, nickel, and zinc observed in some of the bottom sediments exceeded one or more of different threshold or possible toxic effects levels for ecosystems. The insecticide chlordane was detected in the sediment of the Barefoot Bay pit. If the presence of chlordane detected is not much greater than the detection limit for the analyses, then the chlordane level is probably not high enough to be of concern to freshwater ecosystems. The insecticide DDT and four of its degradates were found in the sediment at Kingston Cove. The concentration of p,p’-DDT and one of its degradates (p,p’-DDD) in sediment exceeded the threshold level for exotoxicological effect on freshwater ecosystems. The degradate p,p’-DDD also exceeded two different threshold criteria as well as a probable toxic effects level on ecosystems. The chlordane and DDT presence indicates the persistent nature of these insecticides, which were banned by the U.S. in 1988 and 1972, respectively. PCBs were also detected in the sediment at Kingston Cove, and the concentration exceeded a threshold screening level for assessment of toxic effect on freshwater ecosystems. The presence of DDT and its degradates and PCBs in the sediment at Kingston Cove and not at the other pits probably reflects the greater age of the pit and the residential development at this location compared to the other study sites. The concentration distributions of pesticides and organics other than pesticides at the four pit sites in northwest Wichita, as well as the general pattern in iron, manganese, and ammonium ion concentrations in the downgradient well waters relative to the upgradient well and pit waters, indicate that surface water in the sand pits flows into the ground water in the southeast to south-southeast direction of the ground-water flow at the study sites. The evidence for connection between the surface and ground waters at the two southern Wichita sites is not as strong as for the four northwest Wichita sites. However, distribution of some constituents and chemical
59
properties do fit the general pattern of entrance of pit water into the ground water. This would be expected to occur most prominently when surface runoff into the pits increases the hydraulic gradient between the pit surface and ground-water levels. Thus, stormwater runoff containing contaminants can enter ground water through the sand pits and impact ground-water quality. RECOMMENDATIONS Sedgwick County staff indicated that they plan to collect and analyze additional samples from the sand pit sites discussed in this report. They should consider sampling Big Slough stormflow entering the northwest end of the Ridge Port pit, as well as surface water at the southern end of this pit, to determine whether there is a substantial difference in the quality of the Big Slough stormwater and the local residential runoff. It is recommended that they focus on analyses of the pesticides and organic compounds other than pesticides that were detected at the four study sites examined in this report, along with fecal and total coliform bacteria and major inorganic parameters to determine the general chemical character of the waters. As an alternative, they could further focus on collecting more frequent samples for atrazine, metolachlor, and simazine content during different seasons and runoff conditions. Analysis for selected organic compounds rather than the complete suite determined by the USGS for the four study sites would decrease analytical cost and allow a greater number of samples to be analyzed for the same funding. It would be good to include determination of pentachlorophenol in a couple of the samples at Barefoot Bay because the USGS detected this compound in one of the duplicate samples from this pit at a level near the MCL for drinking water. The discovery of VOCs in the ground waters around Kingston Cove at concentrations levels exceeding drinking water MCLs or MCLGs indicates the presence of contamination in the area. The locations of known contamination plumes could be examined to see whether they are impacting the site. Otherwise, the findings may warrant investigation of unknown contamination problems.
60
REFERENCES Agency for Toxic Substances and Disease Registry (ATSDR), 1995a, ToxFAQs for
nitrophenols: U.S. Department of Health and Human Services, http://www.atsdr.cdc.gov/tfacts50.pdf.
Agency for Toxic Substances and Disease Registry (ATSDR), 1995b, ToxFAQs for chlordane:
U.S. Department of Health and Human Services, http://www.atsdr.cdc.gov/tfacts31.pdf. Agency for Toxic Substances and Disease Registry (ATSDR), 1999a, ToxFAQs for isophorone:
U.S. Department of Health and Human Services, http://www.atsdr.cdc.gov/tfacts138.pdf. Agency for Toxic Substances and Disease Registry (ATSDR), 1999b, ToxFAQs for 1,1-
dichloroethane: U.S. Department of Health and Human Services, http://www.atsdr.cdc.gov/tfacts133.pdf.
Agency for Toxic Substances and Disease Registry (ATSDR), 2001, ToxFAQs for
polychlorinated biphenyls: U.S. Department of Health and Human Services, http://www.atsdr.cdc.gov/tfacts17.pdf.
Agency for Toxic Substances and Disease Registry (ATSDR), 2002, ToxFAQs for DDT, DDE,
and DDD: U.S. Department of Health and Human Services, http://www.atsdr.cdc.gov/tfacts35.pdf.
Burton, G.A., Jr., and Pitt, R.E., 2002, Stormwater Effects Handbook: Lewis Publishers, CRC
Press LLC, Boca Raton, FL, 911 p. Fagerness, M.J., Tisserat, N., Bauernfeind, B., and Fry, J.D., 2001, Turfgrass pesticide selection
guide for professional applicators: Kansas State University Agricultural Experiment Station and Cooperative Extension Service, Publication MF-2466, Manhattan, KS, 27 p.
Kansas Department of Health and Environment, 2002, Water quality standards white paper:
Bacteria criteria: KDHE, Topeka, KS, 6 p. MacDonald, D.D., Ingersoll, C.G., and Berger, T.A., 2000, Development and evaluation of
consensus-based sediment quality guidelines for freshwater ecosystems: Archives Environmental Contamination Toxicology 39, 20–31.
Sedgwick County Department of Environmental Resources (SCDER), 2005, A study to
determine the effects on groundwater of stormwater runoff into sand pits: Wichita, Kansas, 48 p. plus 6 appendices.
U.S. EPA, 1996, The incidence and severity of sediment contamination in surface waters of the
United States, Volume 1: National sediment quality survey: U.S. Environmental Protection Agency, EPA 823-R-97-006, Appendix D, Screening values for chemicals evaluated.
61
U.S. EPA, 2004, The incidence and severity of sediment contamination in surface waters of the United States, National sediment quality survey, Second edition: U.S. Environmental Protection Agency, EPA 823-R-04-007, Appendix C, Values used for chemicals evaluated.
U.S. EPA, 2006a, 2006 Edition of the drinking water standards and health advisories: U.S.
Environmental Protection Agency, EPA 822-R-06-013, 15 p., http://www.epa.gov/waterscience/criteria/drinking/dwstandards.pdf
U.S. EPA, 2006b, National recommended water quality criteria: U.S. Environmental Protection
Agency, Office of Science and Technology 4304T, 24 p., http://www.epa.gov/waterscience/criteria/nrwqc-2006.pdf
U.S. Geological Survey, 2006, Microbial quality of the Nation’s ground-water resources, 1993-
2004: USGS Scientific Investigations Report 2006-5290, 34 p. Whittemore, D.O., 2003, TMDL salt assessment and analysis: Chloride impairment in the Gar-
Peace and Cow subbasins of the lower Arkansas River basin: Kansas Geological Survey Open-file Report 2004-5, 67 p., for Kansas Dept. Health and Environment.
Whittemore, D.O., 2007, Water-quality effects of stormwater runoff into sand pits on ground
water in Sedgwick County, Kansas: Phase I – Barefoot Bay, Ridge Port, Moorings, and Cropland pits: Kansas Geological Survey Open-file Report 2007-9, 56 p and data CD.
Whittemore, D.O., Hathaway, L.R., Skelton, L.H., McClain, T.J., Dealy, M.T., Fisher, B., and
Buddemeier, R.W., 1993, Assessment of the impact of stormwater recharge from unlined earthen pits on ground-water quality in the Wichita area: Kansas Geological Survey Open-file Report 93-47, 90 p.
62
63
APPENDIX A The appendix is a CD that contains the complete data set from the U.S. Geological Survey for analyses of surface waters from all six of the sand pits, ground waters from the 18 monitoring wells, and bottom sediment samples from the six sand pits during both 2006 and 2007. The data are in seven worksheets in one Excel file. There are three worksheets each for surface-water and ground-water data, one for physical and chemical properties and inorganic constituent concentrations (inorganics tab), one for pesticide and degradate compounds (pesticides tab), and one for organic compounds other than pesticides (other organics tab). The seventh worksheet contains the data for the bottom sediment samples. At the beginning of each worksheet is a list describing the column headings and analytical parameters for the data part of the worksheet.