Embed Size (px)
Citation preview

ACIDIC PRECIPITATION IN ONTARIO STUDY
WATER QUALITY - CRUSTACEAN PLANKTON
RELATIONSHIPS IN NORTHEASTERN
ONTARIO LAKES
A.P.I.O.S. REPORT No. 002/83
Ministryof theEnvironment


ACIDIC PRECIPITATION IN ONTARIO STUDY
WATER QUALITY - CRUSTACEAN PLANKTON
RELATIONSHIPS IN NORTHEASTERN ONTARIO LAKES
A.P.I.O.S. REPORT
No. 002/83
by
W. KELLER AND J. ROGER PITBLADO
Ontario Ministry of the Environment
199 Larch Street, Sudbury, Ontario, P3E 5P9
and
Geography Department, Laurentian University
Sudbury, Ontario, P3E 2C6
A.P.I.O.S. Coordination Office,
Ontario Ministry of the Environment,
6th Floor, 40 St. Clair West, Toronto, Ontario
Canada, M4V 1M2
Project Coordinator: T. Brydges

Copyright Provisions and Restrictions on Copying:
This Ontario Ministry of the Environment work is protected by Crown copyright (unless
otherwise indicated), which is held by the Queen's Printer for Ontario. It may be
reproduced for non-commercial purposes if credit is given and Crown copyright is
acknowledged.
It may not be reproduced, in all or in part, part, for any commercial purpose except under
a licence from the Queen's Printer for Ontario.
For information on reproducing Government of Ontario works, please contact Service
Ontario Publications at [email protected]

Table of Contents
Summary 2
Introduction 3
The Study Lakes 4
Methods 8
Data Collection 8
Statistical Analysis 9
Results And Discussion 13
General Species Distributions 13
Species Richness And Density 15
Species - Lake Type Associations 19
Interspecific Associations 27
General Community Structure 29
Environmental Influences 35
Conclusions 38
Acknowledgements 40
References 41

SUMMARY
During the summer of 1981, crustacean plankton was sampled in 249 northeastern
Ontario lakes, including a large proportion of acidic lakes. Species cluster analysis
showed that overall, the lakes were typified by a major species group containing B.
longirostris, D. minutus, H. gibberum and M. edax which was common to most lakes.
Two species subgroups most associated with more productive waters (D. retrocurva,
D. oregonensis, T. p. mexicanus and Diaphanosoma sp.) and less productive waters
(D. longiremis, C. scutifer, D. g. mendotae, C. b. thomasi, E. longispina and E.
lacustris) in the study area were identified. Acidic lakes were characterized by reduced
numbers of species related to declines in the importance of cyclopoida, Daphnidae, L.
kindtii and E. lacustris and high relative abundance of D. minutus. The observed
general community alterations (ie. apparent shift from larger (Daphnidae) to smaller
(D. minutus) grazers and scarcity of predatory plankton) may have important
implications to energy cycling in acidic lakes. Stepwise multiple linear regression
analysis of physico-chemical lake characteristics against percent composition of
individual species failed to explain much of the variation in species proportions,
accounting for on average, only 11% of the variation among near-neutral lakes and
25% in highly or slightly acidic lakes. Of the limnological characteristics considered,
variables related to lake thermal structure were most frequently the primary correlates
with species proportions in near-neutral lakes while in acidic lakes the best statistical
predictors of species percent composition were most often variables directly related to
lake acidity.
-2-

INTRODUCTION
Although on a broad geographical scale glacial history may influence lentic zooplankton
communities, (Carter et al. 1980; Roff et al. 1981) regional studies in Ontario (Carter
1971; Patalas 1971; Sprules 1975 and Sprules 1977) have demonstrated general
relationships between lake chemistry and/or morphometry and crustacean species
assemblages.
Hydrogen ion has long been recognized as a factor influencing the structure and
diversity of crustacean plankton communities (Lowndes 1952). Restricted crustacean
faunas have been found in naturally acidic freshwater bodies (Fryer 1980) as well as
in manmade impoundments acidified by acid inputs from coal mining activity (DeCosta
1975; Janicki and DeCosta 1979). Reductions in zooplankton community diversity in
lakes acidified due to acidic precipitation have been identified in Norway (Leivestad et
al. 1976), Sweden (Almer et al. 1974), the USA (Confer, Kaaret and Likens 1983) and
Ontario (Sprules 1975; Roff and Kwiatkowski 1977).
For decades, aquatic environments in the Sudbury, Ontario area have been subjected
to atmospheric inputs of contaminants associated with large-scale, local smelting
activity. Investigations in the greater Sudbury area (Beamish and Harvey, 1972;
Conroy, Hawley and Keller 1978) have documented a large zone of acidified lakes
extending northeast-southwest of Sudbury. Many Sudbury area lakes also exhibit
elevations in trace metal concentrations related to smelting activity (Cu, Ni) or to
increased metal dissolution and mobilization from watersheds under acidic conditions
(Al, Mn).
-3-
This report examines associations between lake water quality and crustacean plankton
communities in 249 lakes, including a large proportion of acidic lakes, within a 250 km
radius of Sudbury (Figure 1).
THE STUDY LAKES
Although predominantly on the Precambrian Shield, the lakes studied vary in
chemistry, morphometry and surficial geological setting, spanning a cross-section of
lake types occurring in northeastern Ontario. Pitblado, Keller and Conroy (1980) have
divided northeastern Ontario lakes into 7 groups based on principal components and
hierarchical cluster analyses of 23 limnological variables. The lake groups derived are
briefly described below.
Group 1
The lakes in this group are near-neutral and are typified by high concentrations of
nitrogen and phosphorus and low Secchi disc transparency in comparison to the other
lake groups. Concentrations of trace metals related to smelting activity (Cu, Ni) are
elevated in the lakes closest to Sudbury.
Groups 2 and 3
Lake groups 2 and 3 include the characteristic highly dilute, near-neutral lakes of the
Precambrian Shield. Differentiation between the groups is based primarily on nutrient
status with Group 3 lakes exhibiting generally lower nutrient concentrations and higher
transparency than Group 2 lakes. Concentrations of trace metals are low in both lake
groups.
-4-

Figure 1. Locations of the study lakes.
-5-

Groups 4, 5 and 6
These groups encompass a related set of clear, nutrient-poor lakes which show impacts
(ranging from severe to minimal) associated with emissions from the Sudbury smelting
industry. Group 4 lakes show slightly elevated concentrations of sulphate and trace
metals indicating a slight impact by Sudbury emissions; however, these lakes are 7
inherently more buffered and more productive than lakes in groups 5 and 6 reflecting
high assimilation capacity for acidic inputs. Group 6 lakes are very clear, poorly
buffered and slightly acidic. Trace metal concentrations related to smelter emissions
(Cu, Ni) are often slightly elevated. Group 5 contains the lakes which have been most
strongly influenced by Sudbury emissions. Group 5 lakes are typically extremely clear
and highly acidic with elevated concentrations of trace metals related to watershed
inputs (Al, Mn). Concentrations of Cu and Ni are very high in the lakes closest to
Sudbury due to smelter emissions.
Group 7
These lakes show atypically high (for the study area) ionic strength related to
occurrence of calcareous bedrock/overburden or inputs of urban runoff and exhibit
wide variation in trophic state and trace metal concentrations.
Table 1 summarizes the average physico-chemical characteristics of the study lakes on
the basis of the above groups. Although based on water chemistry, the grouping
system also provides some discrimination of physical lake characteristics (Table 1)
since in general, lake trophic status and thermal structure are related to morphometry.
-6-

TABLE 1. Average values of physico-chemical variables for lake groups defined by water chemistry.
Lake Group (n)1(23) 2(49) 3(59) 4(22) 5(32) 6(57) 7(8)
Area (ha) a 3974 656 786 496 273 1391 2281Depth (m) b 11 14 28 18 21 21 13pH 6.6 6.5 6.6 6.9 4.7 5.9 7.9Conductivity (µS/cm) 55 41 42 66 50 45 210Alkalinity (mg/L as CaCO3)
c 9.03 5.37 5.71 13.71 -1.31 2.03 73.88Calcium (mg/L) 5.0 3.7 3.8 6.8 3.4 4.0 20.6Magnesium (mg/L) 1.64 1.02 1.10 1.87 0.98 1.14 6.77Sodium (mg/L) 1.7 1.3 1.1 1.2 1.9 1.1 5.2Potassium (mg/L) 0.67 0.50 0.43 0.54 0.43 0.43 0.77Sulphate (mg/L) 11.1 8.9 9.4 12.0 13.5 12.8 15.9Silica (mg/L) 0.90 1.31 1.06 1.32 0.90 0.92 0.97Chloride (mg/L) 1.88 1.25 0.91 0.90 3.00 1.02 9.52Total Nitrogen (µg/L) 508 356 242 303 215 200 273Total Phosphorus (µg/L) 19 10 6 10 5 5 9Total Zinc (µg/L) 5 3 3 3 18 8 2Total Copper (µg/L) 4 1 1 3 27 3 4Total Nickel(µg/L) 15 3 2 9 61 15 23Total Iron (µg/L) 153 134 45 87 95 62 45Total Aluminum (µg/L) 60 53 31 62 310 60 44Total Manganese (µg/L) 52 37 18 23 185 60 9Color (Hazen) 34.2 31.4 14.3 21.2 10.6 7.7 6.1Secchi disc (m) 3.1 3.7 6.8 4.6 10.6 7.1 7.4Epilimnion thickness (m) 3.3 3.8 5.1 4.3 5.0 4.6 4.4Hypolimnion thickness (m) 2.6 4.9 15.9 7.9 8.0 9.0 3.2Deep-water temperature (EC) d 12.9 11.0 7.7 9.2 11.8 9.8 11.3
a excluding 5 very large lakes with AO >10,000 hab depth at sampling stationc total inflection point alkalinityd temperature at the top of the hypolimnion or 1m above the lake bottom in shallow lakes
-7-

METHODS
DATA COLLECTION
Each lake was sampled once at a central location during the period June 15th to August
14th, 1981. Sampling visits were scheduled such that lakes within a given geographical
portion of the study area were sampled at different times throughout the study.
Crustacean plankton samples were collected as single vertical net (12.5 cm diameter;
76 p mesh) hauls from one m above bottom to surface in each lake. Two hundred and
six lakes were sampled with a flow-meter-equipped net, allowing calculation of
filtration efficiency. The remaining lakes (n = 43) were sampled with a non-metered
net. Samples were immediately preserved with 5% buffered formalin. Identification
and enumeration procedures followed those outlined in Yan and Strus (1980).
Water samples were collected as water column composites by the tygon tube method
(Ministry of the Environment (MOE) 1979). Nutrient samples were collected through
the euphotic zone estimated as twice the Secchi disc transparency plus one m.
Samples for other chemical analyses were taken to the lower limit of the metalimnion,
defined as the depth below the region of greatest temperature change at which the
observed temperature decrease was less than or equal to 0.5EC/m. Points of inflection
of lake temperature profiles and respective temperatures were measured with a YSI
Model 43TD telethermometer.
Samples were placed in sample-rinsed containers (250 ml polystyrene for nutrients;
500 ml acid washed polyethylene for trace metals - HNO3 preserved; and 500 ml
polystyrene for pH and major ion analyses) for transportation to the laboratory.
Conductivity, pH and alkalinity (total inflection point) determinations were completed
at the Sudbury MOE laboratory on the day following collection (after overnight
-8-

refrigeration). Other analyses were carried out at the MOE Laboratories in Toronto
following procedures outlined in MOE (1981).
STATISTICAL ANALYSIS
The data array examined for this paper consisted of 35 physico-chemical variables and
39 zooplankton species for each of the 249 study lakes. Statistical analyses of the data
were done at Laurentian University using the SPSS package of computer routines (Nie
et al. 1975; Hull and Nie 1981) and a number of FORTRAN programs written by JRP.
The major statistical approaches that were employed are outlined below.
The relative abundance of species in a lake formed the major part of the zooplankton
portion of the data array. The number of individuals of a particular species found in a
lake was expressed as a percentage of the total number of individuals (excluding
nauplii) of all zooplankton species, with calanoid and cyclopoid copepodids (only
identified to suborder) apportioned according to the relative abundance of their adult
forms in the respective groups of Copepoda. Zooplankton densities were computed,
expressed as the number of individuals per litre for each species, and summed to
obtain total densities for individual lakes. Density computations were undertaken only
for the 206 lakes sampled by metered hauls.
Examination of the zooplankton data set for any biases introduced by the sampling
format (i.e. single samples over a 2 month period) indicated the data did accurately
reflect changes in community composition across the range of lake types. Comparison
of the present data with data for 187 of the lakes which were sampled more frequently
(2 - 7 times) during 1974-76 (Keller 1981) showed similar lake group averages for
species occurrence and percent composition. Linear regression analyses of species
richness, density and percent composition against sampling date did not show any
-9-

significant correlations, and inspection of the scattergrams did not reveal any
non-linear relationships between attributes of the zooplankton communities and time.
In an earlier paper (Pitblado et al. 1980), 187 lakes of the Sudbury area were
classified, as indicated previously, using 23 physico-chemical variables, reduced to four
components using principal components analysis. Ninety percent of the variance
between the lakes could be explained by these components, labeled as: Nutrient
Status, Buffering Status, Atmospheric Deposition Status and Sodium-Chloride Status.
The classification procedure used in that study involved the computation of factor
scores for each of the lakes for each of the four components and then using those
scores in a series of cluster analysis, multiple discriminant analysis, and multivariate
analysis of variance.
For the present study, using the same 23 variables and the earlier factor score
coefficient matrix, factor scores were computed for the 249 lakes. Then the assignment
procedure of the SPSS multiple discriminant analysis routine was employed to classify
the current study lakes. The only departure from this approach was our overriding
assignment of all lakes with pH <5.0 to Group 5, and lakes with pH between 5.0 and
5.5 to Group 6, a step undertaken to hold the influence of pH (considered a major
variable potentially influencing biotic systems) relatively constant. Although this
resulted in reassignment of a small number of lakes this departure had very little
overall effect on the results of the discriminant analysis assignments. Principal
components analysis of the 1981 data using those same 23 variables produced results
consistent with those reported earlier (Pitblado et al. 1980).
In order to guide our analyses of the relationships of species relative abundance with
physico-chemical variables, forward stepwise multiple regression analyses were
-10-

undertaken. The independent variables were initially chosen from those variables that
had high relative loadings on the first three principal components described in more
detail in Pitblado et al. (1980). This list was reduced in number by dropping or
combining variables in order to avoid problems of multicollinearity. Thus, the Nutrient
Status component was represented by total nitrogen (the sum of total Kjeldahl
nitrogen, nitrite, and nitrate), total phosphorus, and Secchi depth; Buffering Status
was represented by pH and alkalinity; and the Atmospheric Deposition component was
represented by copper. Lake morphometry variables important in the earlier study and
included in this step of the analysis were lake surface area and bottom depth.
To this list of 8 independent variables were added aluminum, hypolimnion thickness,
deep-water temperature, and epilimnion thickness. It should be noted that the
temperature-related parameters used provide only a very general indication of
variations in thermal characteristics among the lakes. The latter variables were not
available for the earlier study but were included herein because they potentially play
important roles in influencing the distribution and abundance of zooplankton. Other
variables might also have been added using this criteria, but the overall list of
independent variables was selected by keeping high intercorrelations to a minimum
and thus reducing the chances of spurious multiple correlations being derived due to
multicollinearity.
The final list of independent variables was also arrived at after considering the problem
of bell-shaped or horseshoe-shaped distributions often common to this type of data
(Austin and Noy-Meir 1971; Roff et al. 1981). This was done by inspecting the
scattergrams of each of the independent variables with each of the zooplankton
species, and by undertaking the multiple regression analyses using two sub-sets of
data. The first sub-set included only lakes in Group 5 and Group 6; the second included
the lakes in groups 1, 2, 3, and 4. Examination of the scattergrams indicated that
-11-

species responses were essentially linear within these lake subsets.
Zooplankton community structure was determined using species presence/absence
data in a hierarchical cluster analysis. This approach, using Euclidean distance squared
as a measure of dissimilarity (Sokal and Sneath 1963; Sneath and Sokal 1973; Clifford
and Stephenson 1975), and the Ward's error clustering algorithm (Ward 1963; Frenkel
and Harrison 1974; Mather 1976), clearly differentiated the recurring patterns of the
most common zooplankton species. The less common species were assigned to the
major zooplankton communities using a computer program written to highlight the
coexistence of those species with the major species clusters.
-12-

RESULTS AND DISCUSSION
GENERAL SPECIES DISTRIBUTIONS
A total of 39 species (24 genera) of Crustacea, including 24 representatives of
Cladocera and 15 species of Copepoda were collected from the plankton of the study
lakes (Table 2). Among the Copepoda, 8 calanoid and 7 cyclopoid forms were found.
Diaptomus minutus and Bosmina longirostris were the most frequently occurring
species found in over 80% of the lakes, with Holopedium gibberum, Cyclops
bicuspidatus thomasi, Mesocyclops edax, Diaphanosoma sp., and Daphnia galeata
mendotae slightly less common occurring in 56 to 74% of the lakes. Species present
in 25 to 50% of the lakes included Daphnia retrocurva, Cyclops scutifer, Diaptomus
oregonensis, Daphnia longiremis, Tropocyclops prasinus mexicanus, Epischura
lacustris, and Eubosmina longispina while Eubosmina tubicen, Daphnia catawba,
Daphnia ambigua, Daphnia pulex, Chydorus sphaericus, Daphnia dubia, Leptodora
kindtii, Ceriodaphnia lacustris, Cyclops vernalis, Polyphemus pediculus and Senecella
calanoides were present in 5 to 21%. The remaining species collected (Table 2) were
comparatively rare, occurring in <5% of the lakes.
-13-

TABLE 11. Relative occurrence of crustacean plankton Species in 249 NortheasternOntario Lakes.
% of LakesDiaptomus minutus Lilljeborg 85Bosmina longirostris (O.F.Müller) 84Holopedium gibberum Zaddach 74Cyclops bicuspidatus thomasi (S.A.Forbes) 64Mesocyclops edax (S.A.Forbes) 64Diaphanosoma sp. 61Daphnia galeata mendotae Birge 56Daphnia retrocurva S.A.Forbes 43Cyclops scutifer Sars 41Diaptomus oregonensis Lilljeborg 40Daphnia longiremis Sars 38Tropocyclops prasinus mexicanus Kiefer 35Epischura lacustris S.A.Forbes 33Eubosmina longispina (Leydig) 33Eubosmina tubicen (Brehm) 21Daphnia catawba Coker 19Daphnia ambigua Scourfield 17Daphnia pulex Leydig emend. Richard 14Chydorus sphaericus (O.F.Müller) 13Daphnia dubia Herrick 12Leptodora kindtii (Focke) 10Ceriodaphnia lacustris Birge 8Cyclops vernalis (Fischer) 8Polyphemus pediculus (Linné) 8Senecella calanoides Juday 6Sida crystallina (O.F.Müller) 4Diaptomus sicilis S.A.Forbes 3Limnocalanus macrurus Sars 2Orthocyclops modestus (Herrick) 2Ceriodaphnia pulchella Sars 1Acroperus harpae Baird <1 Alona quadrangularis (O.F.Müller) <1 Diaptomus ashlandi Marsh <1 Diaptomus sanguineus S.A.Forbes <1 Eubosmina coregoni (Baird) <1 Eucyclops agilis (Koch) <1 Latona setifera (O.F.Müller) <1 Ophryoxus qracilis Sars <1 Simocephalus serrulatus (Koch) <1
-14-

Comparison of data from the present study with data from other synoptic surveys in
eastern Canada (Rigler and Langford 1967; Patalas 1971; Brandlova, Brandl and
Fernando 1972; MOE 1973, 1975; Sprules 1976; Pinel-Alloul, Legendre and Magnin
1979; Carter et al. 1980; Jermolajev and Fraser 1982; and Joubert and Tousignant
MS) showed general similarity in species occurrence, with the species most common
in our study generally occurring frequently in other extensive regional surveys. Of the
25 species present in >5% of our lakes, 19, 20, and 24 species respectively occurred
in the ELA lakes of northwestern Ontario (Patalas 1971), lakes in the arctic watershed
of Ontario (MOE 1973, 1975) and Quebec lakes south of the 52nd parallel (Joubert and
Tousignant MS). Ten and 13 of these species are also present in the plankton of the
Great Lakes (Superior and Huron respectively) which adjoin the study area (Watson
1974).
Examination of maps depicting species presence/absence in the study lakes (available
from the authors on request) showed no apparent geographical patterns in species
distributions within our study area.
SPECIES RICHNESS AND DENSITY
Within individual lakes, the total number of crustacean species collected varied from
0 (one lake) to 17 with an overall average of 9.1 species per lake (Figure 2), identical
to the average number of species per lake of 9.1 for single collections from 45 ELA
lakes (Patalas 1971).
-15-

Figure 2. Average and standard deviation of the number of crustacean planktonspecies in lake groups defined by water chemistry. Lake groups arearranged in order of generally increasing trophic status and pH. Group 7lakes have been excluded since they showed widely varying trophicstatus.
-16-

Species richness was much lower in acidic Group 5 lakes (average 4.5 species per lake)
than in lakes within other groups (group averages of 8.5 to 10.5 species per lake)
similar to the results of other investigations within the same portion of Ontario.
Elimination of very scarce species (<0.1% of density in individual lakes) from our data
set only slightly altered average species richness (4.3 species per lake in Group 5; 8.4
to 10.4 species per lake in other groups). Sprules (1975), based on single collections
from 47 LaCloche Mountain lakes, reported 1 to 7 species in lakes with pH<5.0 and 9
to 16 species in lakes with pH >5.0. Yan and Strus (1980) reported averages of 2.9 to
3.9 species per collection from four highly acidic, metal-contaminated lakes near
Sudbury while in the same study average species richness ranged from 7.0 to 14.6
species per collection in 6 near-neutral central Ontario lakes and one near-neutral lake
near Sudbury.
Average crustacean density varied widely (Figure 3), but was greatest in the most
nutrient rich Group 1 lakes (35 animals/L) and least in acidic Group 5 lakes (15
animals/L). Roff and Kwiatkowski (1977) have previously reported low crustacean
densities in acidic lakes. Our average observed densities are similar to the range
reported by Yan and Strus (1980) for 6 near-neutral, oligotrophic lakes (18.2 to 45.5
animals/L). It must be noted that our data are based only on point-in-time, summer
samples while the data of Yan and Strus (1980) represent ice-free period averages for
very frequently collected samples. However, mid-summer collections seem to provide
a reasonable estimate of ice-free period average densities (Yan unpublished data).
-17-

Figure 3. Average crustacean density in lake groups defined by water chemistry.
-18-

SPECIES - LAKE TYPE ASSOCIATIONS
Figures 4 to 7 present the average frequency of occurrence and relative abundance
when present of relatively common (>5% of the study lakes) species utilizing the lake
groups of Pitblado et al. (1980) as integrators of similar physico-chemical conditions.
The groups are arranged in order of generally increasing trophic status and pH.Group7
lakes have been excluded since they exhibited widely varying trophic status. Both
relative abundance when present and frequency of occurrence were chosen for
presentation to allow evaluation of the relative contribution of each of these factors to
general species importance within lake groups. The overall average percent
composition of species in lake groups can be determined from the data given in Figures
4 to 7 by multiplying the percent composition indicated by the frequency of occurrence
expressed as a fraction. In some cases comparatively rare species were numerically
prominent when present; however, in most cases data on species occurrence and
relative abundance are complementary providing a basis for characterization of the
apparent environmental preferences/limitation of species within the study area.
-19-

Figure 4. Frequency of occurrence in lake groups (vertical bars) and average % contribution when present tocrustacean density excluding nauplii (numbers above bars) of common Daphnidae (present in >5% of thestudy lakes).
-20-

Figure 5. Frequency of occurrence and average % contribution when present of common Cladocera (excludingDaphnidae).
-21-

Figure 6. Frequency of occurrence and average % contribution when present of common Calanoida.
-22-

Figure 7. Frequency of occurrence and average % contribution when present of common Cyclopoida.
-23-
Cladocera
Several authors (Almer et al. 1974; Sprules 1975, and others) have reported scarcity
or absence of Daphnia in acidic lakes. Our data support these findings, but indicate
variation in the environmental preferences of the species of Daphnidae collected
(Figure 4). D. catawba and D. ambigua showed variation in importance between lake
groups but demonstrated no obvious declines in acidic lakes (Group 5). Sprules (1975)
indicated that D. catawba occurs primarily at low pH in LaCloche Mountain lakes and
Carter (1971) has documented D. ambigua as the predominant cladoceran in four
acidic (pH 4.0 to 5.0) ponds near Georgian Bay.
Other Daphnidae collected during our study showed markedly reduced importance in
acidic lakes, considering both frequency of occurrence and relative abundance (Figure
4). Of these daphnids, D. longiremis was most common in near-neutral oligotrophic
lakes (Groups 3 and 4) although the species reached highest relative abundance in the
most productive lakes (Group 1). D. g. mendotae was consistently important in
near-neutral lakes of all types but increased slightly in occurrence and relative
abundance among Group 4 and 2 lakes. D. retrocurva was most prominent in the most
productive lakes and showed generally increasing occurrence and relative abundance
with increasing trophic status. D. dubia and D. pulex were most common in nutrient
poor Group 3 lakes but varied widely in relative abundance among the lake groups. C.
lacustris was conspicuously more important in the most productive lakes (Group 1).
B. longirostris, H. gibberum, and Diaphanosoma sp., the most common Cladocera in
the study lakes (Table 2), were important among all lake groups. Although frequency
of occurrence of these species was somewhat reduced among acidic lakes (Group 5),
when present, they contributed substantially to the communities (Figure 5). In the
case of B. longirostris and Diaphanosoma sp. maximum relative abundances were
-24-

reached in acidic lakes. Sprules (1975) has indicated that these species are distributed
essentially without regard to pH in LaCloche Mountain lakes.
E. longispina was most common and abundant among highly oligotrophic lakes,
including acidic lakes, and was much less prominent among more productive lakes
(Groups 4, 2, and 1). E. Tubicen was absent from Group 4 lakes and also from Group
7 lakes (not depicted in Figure 5) which exhibited the hardest waters of our study lakes
(Table 1) confirming the observation of Carter et al. 1980 that this species is restricted
to very soft waters.
C. sphaericus and P. pediculus were present in lakes of all types (with the exception
of Group 1 lakes which contained no P. pediculus) but showed increased importance
among acidic lakes. C. sphaericus has previously been reported as important in acid,
metal-contaminated lakes near Sudbury (Yan and Strus 1980), and Sprules (1975) has
indicated that P. pediculus occurs primarily at low pH in LaCloche Mountain lakes.
L. kindtii showed generally low abundance in our study lakes, similar to results
obtained from surveys of ponds near Georgian Bay (Carter 1971) and the ELA lakes of
northwestern Ontario (Patalas 1971). The particular scarcity of L. kindtii among our
Group 5 lakes generally agrees with the data of Sprules (1975) which indicated
absence from lakes with pH <5.0.
Calanoida
D. minutus was the most common and abundant copepod in the study lakes (Figure
6). The importance of D. minutus was greatest in the most acidic, most oligotrophic
Group 5 lakes where, when present, it comprised on average 74.3% of the crustacean
density (excluding nauplii). Within other lake groups the average contribution of D.
-25-

minutus to density ranged from 30.1% to 48.0%. D. minutus was less common in
productive Group 1 lakes (47.8%) than in lakes of other groups (81.6 to 94.7%). D.
minutus has been previously reported as very important in non-acidic (Schindler and
Noven 1971) and acidic (Sprules 1975) oligotrophic Precambrian Shield lakes. Sprules
(1975) has indicated that D. minutus is the only species which remains in some very
acidic LaCloche Mountain lakes.
In contrast to D. minutus, D. oregonensis was rare in Group 5 lakes, and showed
increasing occurrence and relative abundance with increasing trophic status. D.
oregonensis is the predominant calanoid copepod in eutrophic Kawartha lakes, Ontario
(Hitchin 1976) and it has been shown to replace D. minutus after artificial fertilization
(nitrogen and phosphorus) in a small, near-neutral Sudbury area lake (Yan and
LaFrance 1982). E. lacustris and S. calanoides were conspicuously absent from Group
5 lakes.
Cyclopoida
Studies in Scandinavia (Nilssen 1980), the USA (Confer et al. 1983) and Ontario (Roff
and Kwiatkowski 1977) have reported a general scarcity of cyclopoids in acidic lakes,
agreeing well with our data. Cyclopoids were much less common in Group 5 lakes than
in lakes of other groups (Figure 7). Twenty-eight percent of Group 5 lakes had no
cyclopoids in the collections (group average 0.9 cyclopoid species/lake) while within
other lake groups only from 0 to 5.3% of the lakes contained no cyclopoids with group
averages of 2.2 to 2.6 cyclopoid species/lake. C. scutifer was most prominent in
oligotrophic, slightly acidic to near-neutral lakes (Groups 6 and 3) while T. p.
mexicanus showed an apparent preference for more nutrient rich waters (Groups 2
and 1). Among near-neutral lakes C. b. thomasi and M. edax were important in all lake
groups. C. vernalis occurred much less frequently and was not collected from Group
-26-

5 lakes, although previous sampling in the study area has shown the presence of C.
vernalis in some of these acidic lakes (Keller 1981).
Although showing reductions in occurrence and relative abundance in our acidic lakes,
important populations of cyclopoids do occur at low pH. M. edax and C. vernalis
respectively have been identified as the dominant predatory plankton in acidic Cheat
Lake which is affected by acid mine drainage (Janicki and DeCosta 1979) and
Clearwater Lake which is very close to the Sudbury smelters and has highly elevated
Cu and Ni concentrations in addition to low pH (Yan and Strus 1980).
INTERSPECIFIC ASSOCIATIONS
Cluster analysis (Figure 8) indicated that the study lakes were typified by a single
major species group common to most lakes and containing D. minutus, B. longirostris,
H. gibberum and M. edax. These species were also present in the major recurrent
group defined by Sprules (1975) for LaCloche Mountain lakes which in addition
contained Diaphanosoma sp. and C. b. thomasi. In our analysis, the latter two species
were assigned to different species subgroups (Figure 8). One subgroup was
characterized by D. retrocurva and D. oregonensis in association with T.p. mexicanus
and Diaphanosoma sp. while the other was characterized by D. longiremis and C.
scutifer in association with D.g. mendotae, C.b. thomasi, E. longispina and E. lacustris.
On the basis of the apparent environmental preferences of their constituent species
(Figures 4 to 7) the species subgroups may be generally categorized as groups typical
of more productive waters and less productive waters, respectively.
-27-

Figure 8. Results of species cluster analysis.
-28-
The remaining species shown in Figure 8 were too scarce to permit discrimination by
cluster analysis; however, based on the frequency of their co-occurrence with the
major species in the subgroups, they have been divided into those species which
appear most important in the communities of more productive and less productive
lakes respectively. Often the division between these species was very indistinct.
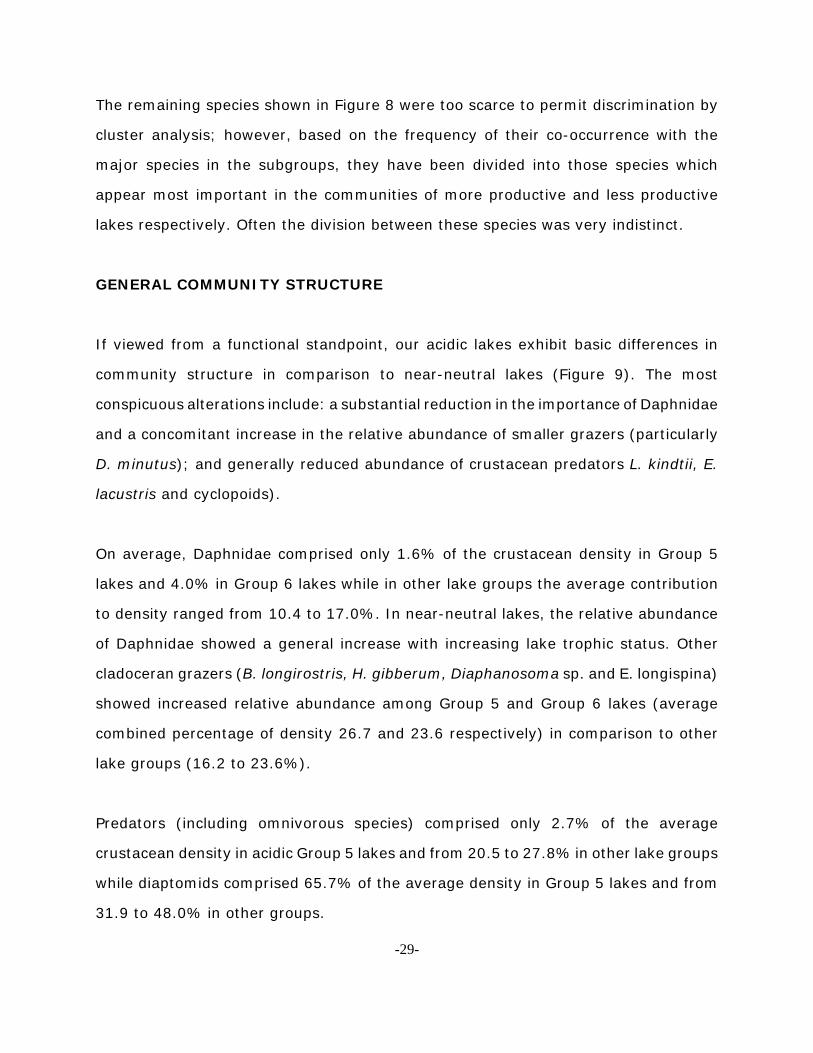
GENERAL COMMUNITY STRUCTURE
If viewed from a functional standpoint, our acidic lakes exhibit basic differences in
community structure in comparison to near-neutral lakes (Figure 9). The most
conspicuous alterations include: a substantial reduction in the importance of Daphnidae
and a concomitant increase in the relative abundance of smaller grazers (particularly
D. minutus); and generally reduced abundance of crustacean predators L. kindtii, E.
lacustris and cyclopoids).
On average, Daphnidae comprised only 1.6% of the crustacean density in Group 5
lakes and 4.0% in Group 6 lakes while in other lake groups the average contribution
to density ranged from 10.4 to 17.0%. In near-neutral lakes, the relative abundance
of Daphnidae showed a general increase with increasing lake trophic status. Other
cladoceran grazers (B. longirostris, H. gibberum, Diaphanosoma sp. and E. longispina)
showed increased relative abundance among Group 5 and Group 6 lakes (average
combined percentage of density 26.7 and 23.6 respectively) in comparison to other
lake groups (16.2 to 23.6%).
Predators (including omnivorous species) comprised only 2.7% of the average
crustacean density in acidic Group 5 lakes and from 20.5 to 27.8% in other lake groups
while diaptomids comprised 65.7% of the average density in Group 5 lakes and from
31.9 to 48.0% in other groups.
-29-

Figure 9. Average % contribution to total density (excluding nauplii) by predators(Cyclopoida, P. pediculus, L. kindtii and E. lacustris), Diaptomids,Daphnidae and other Crustacea in lake groups defined by waterchemistry.
-30-

The general tendency toward increasing importance of smaller crustacean plankters in
acidic lakes is apparent when communities are considered on the basis of average size
class composition (Figure 10). In Group 5 lakes only 5.4% of the average crustacean
density was comprised of species with an adult body length > 1.6 mm while this size
category accounted for 12.9 to 20.0% of the individuals in other lake groups. Species
in the intermediate size ranges (1.0 to 1.59 mm adult body length) were well
represented in all lake groups (52.6 to 68.2% of average density). Of these, species
in the 1.0 to 1.29 mm size range were most prominent in acidic Group 5 lakes (67.3%
of average density) due largely to the inclusion of D. minutus in this category, and
showed decreasing importance (60.3 to 34.3% of average density) with increasing
trophic status. Species in the size range of 1.3 to 1.59 mm (predominantly D.
retrocurva and D. oregonensis) were very unimportant in Group 5 lakes (0.9% of
average density) and increased in importance with increasing trophic status (3.6 to
18.3% of average density). Small species (<1.0mm) comprised on average 26.4% of
the density in Group 5 lakes and 15.7 to 19.2% in other lake groups (excluding Group
1). Interestingly, the highest relative proportion of small (<1.0 mm) species (30.2%)
occurred in the most productive Group 1 lakes.
It is noteworthy that the apparent tendency toward increasing importance of smaller
taxa in acidic lake occurs not only in general, but is manifested within genera i.e. D.
minutus increases in importance in acidic lakes while the larger D. oregonensis declines
and of the daphnids the species which do not appear adversely affected in acidic lakes
(D. catawba, and D. ambigua) are small representatives of the genus.
Although biomass was not measured in our study, the increased importance of smaller
taxa (Figure 10) and low density (Figure 3) in Group 5 lakes indicates reduced
crustacean biomass under acidic conditions.
-31-

Figure 10. Average % contribution to total density by size classes of crustaceanplankton. The four size classes depicted are a condensation of the sixcategories reported by Roff et al. (1981). Assignment of species tocategories followed Roff et al. (1981).
-32-

ENVIRONMENTAL INFLUENCES
The mechanisms of community alteration in acidic lakes are unclear, and may be
diverse. The abrupt declines of some large species (ie. most Daphnia, S. calanoides,
and the predaceous L. kindtii and E. lacustris) in acidic lakes imply direct toxicity by
pH or a related variable, but other lake characteristics may be implicated. The
increased importance of some cladoceran grazers (B. longirostris H. gibberum and
Diaphanosoma sp.) in some acidic lakes suggests a response to reduced competition
from Daphnia. It has been shown that Daphnia can depress Bosmina populations
(DeMott and Kerfoot 1982; Goulden, Henry and Tessier 1982). As suggested by
Sprules (1975) the increased importance of P. pediculus in acidic lakes may reflect
reduced competition from other predatory plankton. The reduction in importance of
Cyclopoida in acidic lakes is confusing since cyclopoids generally seem tolerant of low
pH (Lowndes 1952) and species common in our study area are at least occasionally
important in highly acidic lakes. The generally very low productivity of our acidic study
lakes may be implicated, since Neill and Peacock (1980) demonstrated high springtime
mortality of juvenile c.b. thomasi at low food levels.
Eriksson et al. (1980) have suggested that with acidification and resultant elimination
or reduction of fish predation the zooplankton grazing community shifts to dominance
by larger species (particularly larger Calanoida) with a corresponding decrease in the
importance of smaller Cladocera. These observations do not appear to hold true for our
lakes in which the increased importance of Calanoida (D. minutus) is strongly
associated with declines in the larger Daphnia species, and smaller Cladocera (notably
B. longirostris) remain important. Further, although some large species such as H.
gibberum may be important at low pH, a strong tendency toward dominance by smaller
Crustacea (D. minutus and B. longirostris) remains evident even in the most acidic
lakes which are completely devoid of fish populations.
-33-

Stepwise multiple linear regression analysis of selected (see methods) limnological
variables against the percent contribution of individual species failed to explain much
of the variation in species proportions (Table 3). Within near-neutral lakes (Groups 1,
2, 3, 4) on average only 11% of the variation in species proportions could be explained
by the "best" (based on order of occurrence in the regression equation) five or less
predictive variables for each species. Considering the range of lakes over which the
biological effects of acidification are manifested (Groups 5 and 6) five or fewer
physico-chemical variables accounted for, on average, 25% of the variation in species
proportions. The somewhat enhanced predictive ability in highly and intermediately
acidic lakes may suggest increased importance of abiotic factors as controls on species
composition.
The generally poor statistical resolution of relationships between physio-chemical
variables and species proportions may reflect in part our lack of consideration of
biological influences (fish and invertebrate predation; competition) in the analysis.
However, Roff et al. (1981) generally found little statistical correlation between
zooplankton species abundances and abundance of predatory plankton species and
presence/absence of planktivorous fish and interpreted this to suggest that such
biological controls may not be intense in the larger lakes predominant in their study.
This conclusion, if verified, would be applicable to our lakes which tend to be
reasonably large (Table 1). Alternately, the lack of high statistical resolution in our
data may reflect the difficulties of using only point in time data (particularly for
biological characteristics which may show wide temporal variation) which may not
completely reflect conditions on an individual lake basis.
-34-

TABLE III. Results of stepwise multiple linear regressions of limnological variables against % contribution of common crustaceanplankton species to total density (excluding nauplii).
Speciesa Lake Groups Variables b,c,d Multiple re Species a Lake Groups Variables b,c,d Multiple rD. minutus 1, 2, 3, 4 SD, pH-, Ao, TIA-, TN- 0.34*** T.p. mexicanus 1, 2, 3, 4 DT, TP, pH, SD-, Cu 0.43***
5, 6 SD, Cu-, DT, pH-, TP- 0.62*** 5, 6 DT, pH, TP, ET, TN- 0.40**B. longirostris 1, 2, 3, 4 Cu, SD-, pH, TP, ET- 0.40*** E. lacustris 1, 2, 3, 4 DT-, pH, TN- 0.20*
5, 6 DE-,TN-, Cu, TP, pH- 0.41** 5, 6 TIA, Al-, SD-, Cu-, TN 0.70***H. gibberum 1, 2, 3, 4 DT, ET-, TN, Cu, TP 0.39*** E. longispina 1, 2, 3, 4 SD, DE, TIA-, Ao, TN- 0.49***
5, 6 ET-, HT-, DT-, TIA-, pH 0.43** 5, 6 TN-, DE, HT, TP-, Al 0.49***C. b. thomasi 1, 2, 3, 4 DT-, pH, Al, DE, SD 0.43*** D. catawba 1, 2, 3, 4 pH-, DE-, SD, HT-, TIA- 0.45***
5, 6 pH, DT-, TN, ET, SD- 0.63*** 5, 6 - -M. edax 1, 2, 3, 4 pH-, HT-,TN-, TP, ET 0.35*** D. ambigua 1, 2, 3, 4 - -
5, 6 pH, TN, SD-, DT-, Ao 0.41** 5, 6 TN, DT-, DE-, TIA-, HT- 0.38**Diaphanosoma sp.1, 2, 3, 4 SD-, ET-, Ao-, Cu-, pH- 0.27* D. pulex 1, 2, 3, 4 DT, pH, ET-, Cu- 0.24*
5, 6 DT, Al-, Cu, pH-. TN 0.47*** 5, 6 - -D. g. mendotae 1, 2, 3, 4 pH, TP, Ao, Cu-, SD- 0.27* C. sphaericus 1, 2, 3, 4 pH, DT, TP-, SD-, ET 0.32**
5, 6 TIA, pH, TN, DT-, HT- 0.44*** 5, 6 Cu, Al, pH-, TIA-, ET 0.94**D. retrocurva 1, 2, 3, 4 DE-, TP, SD-, TN, DT 0.34*** D. dubia 1, 2, 3, 4 TN-, pH, TIA-, ET, SD 0.36***
5, 6 TP, pH, DT, TN-, ET- 0.40** 5, 6 pH, TP-, Ao, Cu-, SD- 0.37**C. scutifer 1, 2, 3, 4 SD, Ao, ET, HT, TIA 0.48*** L. kindtii 1, 2, 3, 4 DT, ET 0.18*
5, 6 HT, SD-, TN-, ET-, Cu- 0.60*** 5, 6 Ao, HT-, TP-, Al-, ET 0.50***D. oregonensis 1, 2, 3, 4 ET-, TN, Cu-, pH-, Ao- 0.28** C. lacustris 1, 2, 3, 4 TP, Cu-,TN, pH, Ao- 0.26*
5, 6 TIA, TN, Ao-, pH, DT- 0.42*** 5, 6 TIA, pH, HT-, SD-, Cu- 0.56***D. longiremis 1, 2, 3, 4 DT-, DE, ET-, pH, Al 0.26* P. pediculus 1, 2, 3, 4 -
5, 6 pH, ET, DT-, TIA, SD- 0.56*** 5, 6 SD, ET-, DT, Al, pH- 0.42***S. caianoides 1, 2, 3, 4 HT, pH, DT-, DE, ET 0.34***
5, 6 TIA, Ao-, TN, HT 0.33*
a only species present in >5% of the, study lakes included; E. tubicen and C vernalis are excluded since meaningful statistics could not begenerated for these species
b pH = OH, TIA = alkalinity; Al = Al; Cu = Cu; TN = total nitrogen: TP = total phosphorus: SD = Secchi disc; DE = bottom depth; HT =hypolimnion thickness; ET = epilimnion thickness. Ao = lake area; DT = deep-water temperature
c minus sign indicates variables which exhibited a negative relationship where fewer than five variables are listed additional variables could notbe added end retain significance at P<0.1;
d where no variables are listed no relationships were significant at P<0.1e levels of significance; *** = P<0.01; ** = P<0.05, * = P<0.1
-35-

Although much of the variation in species proportions could not be explained on the
basis of physico-chemical variables, examination of those variables apparently most
important, based on regression analysis, is instructive. Within near-neutral lakes
(Groups 1, 2, 3, 4) a characteristic related to lake thermal structure (epilimnion
thickness, hypolimnion thickness or deep-water temperature) emerged as the best
single predictor of species proportions for 9 out of 21 species. These included H.
gibberum, C. b. thomasi, oregonensis, D. longiremis, T. p. mexicanus, lacustris, D.
pulex, L. kindtii and S. calanoides. Although it has been shown that lake acidification
may result in increased water clarity and attendant changes in thermal structure
(Harvey et al. 1981), among Group 5 and 6 lakes only 4 species (H. gibberum,
Diaphanosoma sp., C. scutifer and T. p. mexicanus) were best correlated with a
thermal characteristic while for 9 species (C. b. thomasi, M. edax, D. g. mendotae, D.
oregonensis, D. longiremis, E. lacustris, D. dubia, C. lacustris and S. calanoides),
including most of the species exhibiting substantial declines in acidic lakes, pH or the
closely related alkalinity (also a measure of lake acidity) appeared as the primary
correlates with percent composition. Lake pH also emerged as the single best correlate
with total number of species (r=0.71; P<0.01) in lake groups 5 and 6.
Considering other variables, in near-neutral lakes the relative proportions of 4, 2, 1
and 1 species, respectively, were best correlated with Secchi disc transparency,
nutrient (total phosphorus, total nitrogen) concentrations, Cu concentrations and lake
depth respectively. Two, 3, 1, 1, and 1 species respectively were best correlated, in
turn, with Secchi disc transparency, nutrient concentrations, Cu concentrations, depth
and area in Group 5 and 6 lakes.
Given the elevated trace metal concentrations in many of our study lakes it is
surprising that trace metal data did little to explain species proportions. Only two
species (B. longirostris and C. sphaericus) both of which have previously been shown
-36-

as important under highly acidic, metal contaminated conditions (Yan and Strus 1980)
showed Cu as a primary correlate, and in both cases the correlation was positive. The
increased relative abundance of B. longirostris in Cu and Ni contaminated lakes
suggests that this species is more tolerant of very high metal concentrations than D.
minutus, the more common acid lake dominant. Although Al has been strongly
implicated in fish mortalities under acidic conditions (Baker and Scofield 1980; Muniz
and Lievestad 1980) total Al concentrations did not emerge as the single best predictor
of percent composition for any species; although Al did occupy second position in the
regression equation for Diaphanosoma sp., E. lacustris and C. sphaericus.
Morphometric characteristics accounted for little of the variation in species percent
composition, suggesting that the generally observed correlations between lake size and
depth and zooplankton communities (Patalas 1971; Sprules 1975) may largely reflect
other factors such as thermal structure and general lake trophic status which are
closely linked to morphometry. It must be noted however, that many of the
morphometry-related changes in zooplankton abundance and community structure
suggested by Patalas (1971) occurred in lakes characteristically much smaller than
those sampled in our study.
-37-

CONCLUSIONS
Crustacean plankton assemblages in northeastern Ontario lakes largely reflect general
water quality, particularly characteristics associated with lake trophic status and degree
of acidification.
Overall, the lakes are characterized by a major group of very common species (B.
longirostris, D. minutus, H. gibberum and M. edax) and two species subgroups which
show apparent lake type preferences. Considering the frequency of occurrence, and
average percent composition of species in lake groups defined by water chemistry, D.
retrocurva, D. oregonensis, T. p. mexicanus and Diaphanosoma sp. comprise a species
subgroup which is most prominent in more productive lakes while a second subgroup
including D. longiremis, C. scutifer, D. g. mendotae, C. b. thomasi, E. longispina and
E. lacustris is most important in less productive lakes. It is important to note that
among near-neutral lakes the observed environmental preferences of species were
manifested as gradual changes in occurrence and relative abundance over a range of
lake types, not as abrupt changes between lake types. Among acidic lakes, which are
common in the study area, crustacean plankton communities showed low density and
reduced numbers of species related to reduced importance of larger grazers
(Daphnidae) and predators (Cyclopoida, L. kindtii and E. lacustris).
Our synoptically collected data shed little light on the actual mechanisms of community
alteration. However, the results of stepwise multiple linear regression analyses of
species proportions against limnological characteristics suggest that of the
physico-chemical variables considered, characteristics related to thermal structure may
be very important in near-neutral lakes while actual lake acidity may be the primary
control in acidified lakes.
-38-

It is hoped that the data provided herein will provide a framework for more detailed
consideration of the influences of acidification on crustacean plankton in Precambrian
shield lakes, and underscore the need for more temporally rigorous, quantitative study.
-39-

ACKNOWLEDGEMENTS
We thank R. Manitouwabi and H. Stahl for assistance in the field and R. Labbé for the
graphics. W. Geiling identified and counted the zooplankton. Staff of the MOE
laboratory in Toronto performed most of the chemical analyses. C. Mentrycki of the
Sudbury MOE laboratory conducted the pH, alkalinity and conductivity measurements.
The critical comments of N. Yan, R. Griffiths, J. MacLean, B. Monroe and K. Nicholls
were greatly appreciated.
-40-

REFERENCES
Almer, B., Dickson, W., Ekstrom, C., Hornstrom, E., and Miller, U. 1974. Effects ofAcidification on Swedish Lakes. Ambio. 3:30 - 36.
Austin, M.P., and Noy-Meir, I. 1971. The problem of nonlinearity in ordination:experiments with two gradient models. J. Ecol. 59:763-773.
Baker, J. P., and Schofield C. L. 1980. Aluminum toxicity to fish as related to acidprecipitation and Adirondack surface water quality. Proc. Int. conf. ecol. impactacid precip. Norway, SNSF project. pp. 292-293.
Beamish, R. J., and Harvey, H. H. 1972. Acidification of the LaCloche Mountain lakes,Ontario and resulting fish mortalities. J. Fish. Res. Board Can. 29:1131-1143.
Brandlova, J., Brandl, Z., and Fernando, C.H. 1972. The Cladocera of Ontario withremarks on some species and distribution. Can. J. Zool. 50:1373-1403.
Carter, J. C. H. 1971. Distribution and abundance of planktonic crustacea in pondsnear Georgian Bay (Ontario, Canada) in relation to hydrography and waterchemistry. Arch. Hydrobiol. 68:204-231.
Carter, J. C. H., Dadswell, M. J., Roff, J. C., and Sprules, W. G. 1980. Distribution andzoogeography of planktonic crustaceans and dipterans in glaciated eastern NorthAmerica. Can. J. Zool. 58:1355-1387.
Clifford, H. T., and Stephenson, W. 1975. An Introduction to Numerical Classification.N.Y.: Academic Press.
Confer, J.L., Kaaret, T., and Likens, G.E. 1983. Zooplankton diversity and biomass inrecently acidified lakes. Can. J. Fish. Aquat. Sci 40:36-42.
Conroy, N. I., Hawley, K., and Keller, W. 1978. Extensive monitoring of lakes in thegreater Sudbury area, 1974-76. Ontario Ministry of the Environment. Tech.Rep.
-41-

De Costa, J. 1975. The crustacean plankton of an acid reservoir. Verh. Internat.Verein. Limnol. 20:532-537.
De Mott, W.R., and Kerfoot, W.C. 1982. Competition among cladocerans: nature of theinteraction between Bosmina and Daphnia. Ecology. 63:1949-1966.
Eriksson, M. O. G., Henrikson, L., Nilsson, B. I., Nyman, G., Oscarson, H. G., Stenson,A. E., and Larsson, K. 1980. Predator-prey relations important for the bioticchanges in acidified lakes. Ambio. 9:248-249.
Frenkel, R. E., and Harrison, C. M. 1974. An assessment of the usefulness ofphytosociological and numerical classificatory methods for the communitybiogeographer. Jrl. of Biogeography. 1:27-56.
Fryer, G. 1980. Acidity and species diversity in freshwater crustacean faunas.Freshwater Biology. 10:41-45.
Goulden, C.E., Henry, L.L., and Tessier, A.J. 1982. Body size, energy reserves andcompetitive ability in three species of Cladocera. Ecology. 63:1780 - 1789.
Harvey, H. H., Pierce, R. C., Dillon, P. J., Kramer, J. R., and Whelpdale, D. M. 1981.Acidification in the Canadian Aquatic Environment. Publication NRCC No. 18475of the Environmental Secretariat, National Research Council of Canada.
Hitchin, G. 1976. The zooplankton of the Kawartha Lakes. 1972. In the KawarthaLakes Water Management Study - Water Quality Assessment (1972-76). OntarioMinistry of the Environment and Ontario Ministry of Natural Resources. Tech.Rept.
Hull, C. H., and Nie, N. H. 1981. SPSS Update 7-9. N.Y.: McGraw-Hill.
Janicki, A., and DeCosta, J. 1979. A multivariate analysis of the crustacean planktoncommunity of an acid reservoir. Arch. Hydrobiol. 85:465-481.
Jermolajev, E., and Fraser, J.M. 1982. Zooplankton in brook trout lakes of AlgonquinPark, Ontario. Ont. Fish. Tech. Rep. Ser. No. 3.
-42-

Joubert, G., and Tousignant, L. (MS). The effect of pH on the distribution of crustaceanzooplankton in 158 Quebec lakes. Manuscript rept.
Keller, W. 1981. Planktonic crustacea in lakes of the greater Sudbury area. OntarioMinistry of the Environment. Tech. Rept.
Leivestad, H., Hendrey, G., Muniz, I. P., and Snekvik, E. 1976. Effects of acidprecipitation on freshwater organisms. In Impact of Acid Precipitation on forestand freshwater ecosystems in Norway. SNSF Res. Rept. 6/76, pp. 87-111.
Lowndes, A. G. 1952. Hydrogen ion concentration and the distribution of freshwaterentomostraca. Ann. Mag. Nat. Hist. 5:58-65.
Mather, P. M. 1976. Computational Methods of Multivariate Analysis in PhysicalGeography. N.Y.: Wiley.
MOE (Ministry of the Environment). 1973. Data for Northern Ontario Water ResourcesStudies 1971. Bull. 1-4. Ontario Ministry of the Environment. Toronto, Ontario.
MOE (Ministry of the Environment). 1975. Data for Northern Ontario Water ResourcesStudies 1972-73. Bull. 1-5. Ontario Ministry of the Environment. Toronto,Ontario.
MOE (Ministry of the Environment). 1979. Determination of the susceptibility toacidification of poorly buffered surface waters. Ontario Ministry of theEnvironment. Tech. Rept.
MOE (Ministry of the Environment). 1981. Outlines of analytical methods. OntarioMinistry of the Environment. Tech. Rept.
Muniz, I. P., and Leivestad, H. 1980. Toxic affects of aluminum on the brown trout,Salmo trutta, L. Proc. Int. conf. ecol. impact. acid precip. Norway, SNSF project.pp. 320-321.
Neill, W.E., and Peacock, A. 1980. Breaking the bottleneck: interactions of invertebratepredators and nutrients in oligotrophic lakes. In W.C. Kerfoot [ed.] Evolution and
-43-

Ecology of Zooplankton Communities. Univ. Press of New England, NewHampshire.
Nie, N. H., Hull, C. H., Jenkins, J. G., Steinbrenner, K., and Bent, D. H. 1975. SPSS:Statistical Package for the Social Sciences. N.Y.: McGraw-Hill.
Nilssen, J. P. 1980. Acidification of a small watershed in southern Norway and somecharacteristics of acidic aquatic environments. Int. Revue ges. Hydrobiol.65:177-207.
Patalas, K. 1971. Crustacean plankton communities in forty-five lakes in theExperimental Lakes Area, northwestern Ontario. J. Fish Res. Board Can.28:231-244.
Pinel-Alloul, B., Legendre, P., and Magnin, E., 1979. Zooplankton limnetique de 46 lasset 17 rivieres du territoire de la baie de James. Can. J. Zool. 57:1693-1709.
Pitblado, J. R., Keller, W., and Conroy, N. I. 1980. A classification and description ofsome northeastern Ontario lakes influenced by acid precipitation. J. Great LakesRes. 6:247-257.
Rigler, F.H. and Langford R.R. 1967. Congeneric occurrences of species of Diaptomusin southern Ontario lakes. Can. J. Zool. 45:81-90.
Roff, J. C., and Kwiatkowski, R. E. 1977. Zooplankton and zoobenthos of selectednorthern Ontario lakes of different acidities. Can. J. Zool. 55:899-911.
Roff, J. C., Sprules, W. G., Carter, J. C. H., and Dadswell, M. J. 1981. The structure ofcrustacean zooplankton communities in glaciated eastern North America. Can.J. Fish. Aquat. Sci. 38:1428-1437.
Schindler, D. W., and Noven, B. 1971. Vertical distribution and seasonal abundance ofzooplankton in two shallow lakes of the Experimental Lakes Area, northwesternOntario. J. Fish. Res. Board Can. 28: 245-256.
-44-

Sneath, P. H. A., and Sokal, R. R. 1973. Numerical Taxonomy: The Principles andPractice of Numerical Classification. San Francisco: Freeman.
Sokal, R. R., and Sneath, P. H. A. 1963. Principles of Numerical Taxonomy. SanFrancisco: Freeman.
Sprules, W. G. 1975. Midsummer crustacean zooplankton communities in acid-stressedlakes. J. Fish. Res. Board Can. 32:389-395.
Sprules, W. G. 1977. Crustacean zooplankton communities as indicators of limnologicalconditions: an approach using principal components analysis. J. Fish. Res.Board Can. 34:962-975.
Ward, J. H. 1963. Hierarchical grouping to optimize an objective function. J. Amer.Statist. Assoc. 58:236-244.
Watson, N. H. F. 1974. Zooplankton of the St. Lawrence Great Lakes - speciescomposition, distribution and abundance. J. Fish. Res. Board Can. 31: 783-794.
Yan, N. D., and Strus, R. 1980. Crustacean zooplankton communities of acidic,metal-contaminated lakes near Sudbury, Ontario. Can. J. Fish. Aquat. Sci.37:2282-2293.
Yan, N. D., and Lafrance, C. 1983. Experimental fertilization of lakes in the Sudburyarea. In Studies of Lakes and Watersheds near Sudbury Ontario: FinalLimnological Report. Ontario Ministry of the Environment. Tech. Rept. (SES009/82).
-45-