Embed Size (px)
Citation preview
WATER-QUALITY CHARACTERISTICS OF URBAN RUNOFF AND ESTIMATES
OF ANNUAL LOADS IN THE TAMPA BAY AREA, FLORIDA, 1975-80
By M. A. Lopez and R. F. Giovannelli
U.S. GEOLOGICAL SURVEY
Water-Resources Investigations Report 83-4181
Prepared in cooperation with the
SOUTHWEST FLORIDA WATER MANAGEMENT DISTRICT,
the cities of CLEARWATER, ST. PETERSBURG, and TAMPA,
and HILLSBOROUGH and PINELLAS COUNTIES
Tallahassee, Florida
1984
UNITED STATES DEPARTMENT OF THE INTERIOR
WILLIAM P. CLARK, Secretary
GEOLOGICAL SURVEY
Dallas L. Peck, Director
For additional information write to:
District ChiefU.S. Geological SurveySuite 3015227 North Bronough StreetTallahassee, Florida 32301
Copies of this report can be purchased from:
Open-File Services Section Western Distribution Branch U.S. Geological Survey Box 25425, Federal Center Denver, Colorado 80225 telephone: C3031 234-58881
CONTENTS
Page
Abstract 1Introduction 2Purpose and scope 3Area description 3
Land features 5Geology 5Urban development 7Climate 7
Data collection 8Watershed features 8
Land use 8Urban-development characteristics 10
Rainfall and runoff 11Water quality 13
Analysis of water-quality data 16Average and range in streamflow and water-quality characteristicsmeasurements 16
Variation of water-quality characteristics with time and discharge 38 Procedure for estimating loads of substances contained in runoff from
ungaged urban watersheds 46Stormwater load 46
Stormwater-runoff volumes 56Base-flow load 61
Base-flow concentrations 61Base-flow discharge 63
Accuracy of load estimates 63Annual loads 65
Comparison of annual loads computed by procedures developed fordifferent regions 69
Evaluating effect of increased development of urban watersheds 71 Summary and conclusions 73 References 75
ILLUSTRATIONS
Page
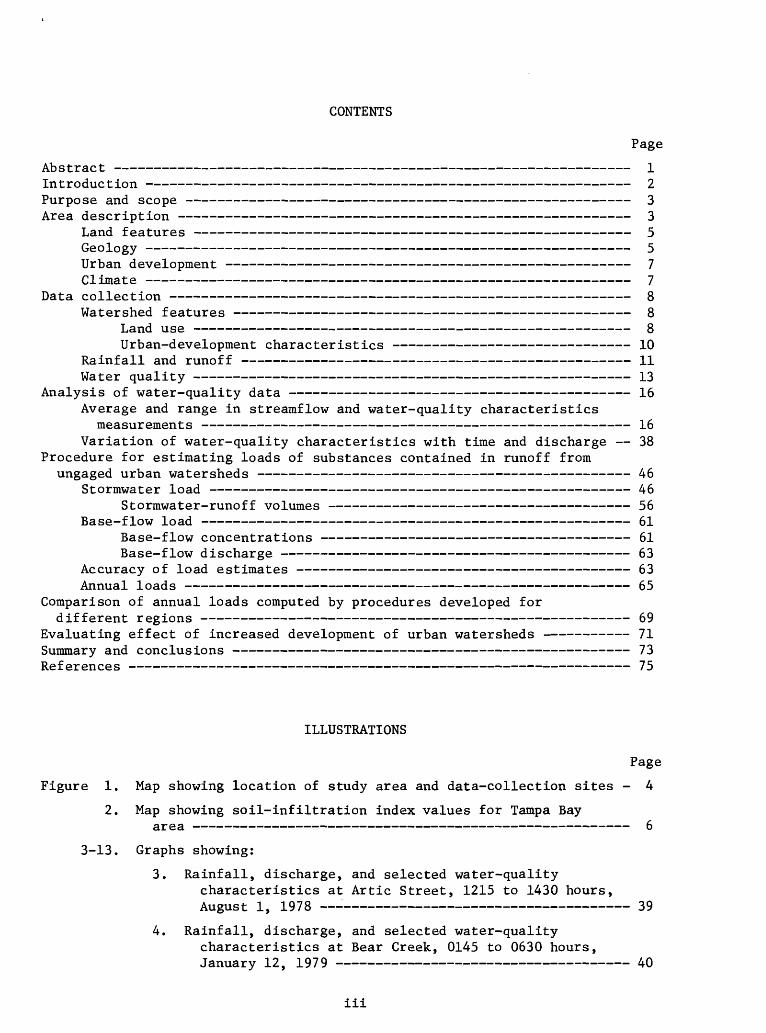
Figure 1. Map showing location of study area and data-collection sites - 4
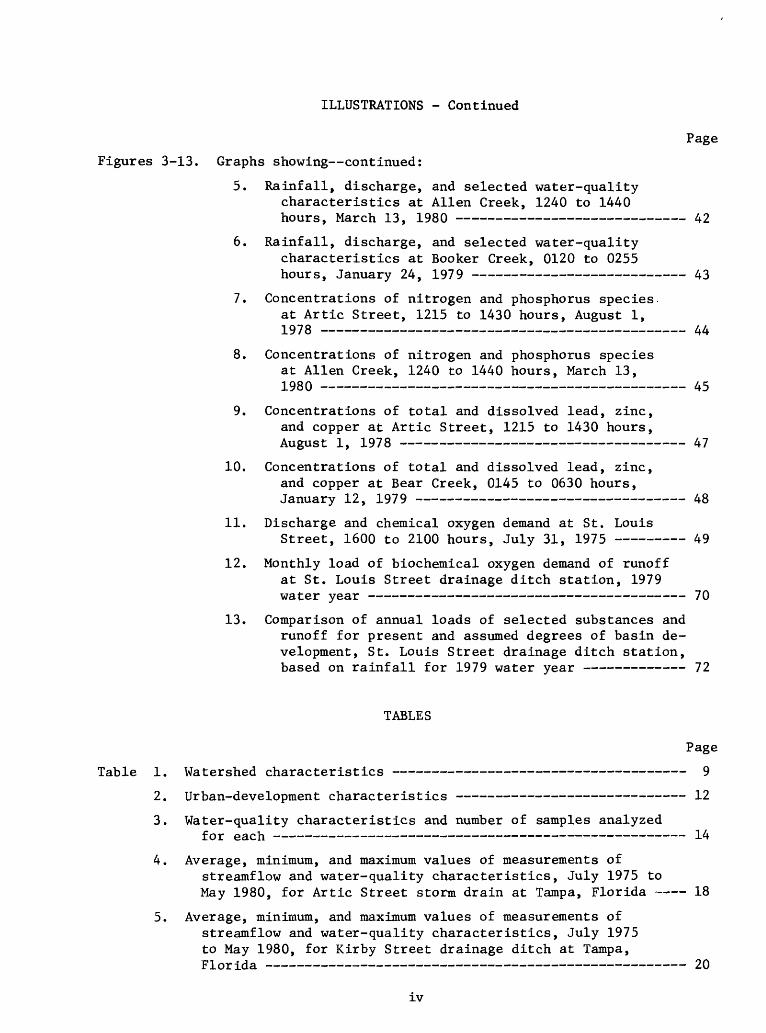
2. Map showing soil-infiltration index values for Tampa Bayarea 6
3-13. Graphs showing:
3. Rainfall, discharge, and selected water-qualitycharacteristics at Artic Street, 1215 to 1430 hours, August 1, 1978 39
4. Rainfall, discharge, and selected water-qualitycharacteristics at Bear Creek, 0145 to 0630 hours, January 12, 1979 40
iii
ILLUSTRATIONS - Continued
Page
Figures 3-13. Graphs showing continued:
5. Rainfall, discharge, and selected water-quality characteristics at Alien Creek, 1240 to 1440 hours, March 13, 1980 42
6. Rainfall, discharge, and selected water-quality characteristics at Booker Creek, 0120 to 0255 hours, January 24, 1979 43
7. Concentrations of nitrogen and phosphorus species at Artic Street, 1215 to 1430 hours, August 1, 1978 44
8. Concentrations of nitrogen and phosphorus species at Alien Creek, 1240 to 1440 hours, March 13, 1980 45
9. Concentrations of total and dissolved lead, zinc, and copper at Artic Street, 1215 to 1430 hours, August 1, 1978 47
10. Concentrations of total and dissolved lead, zinc, and copper at Bear Creek, 0145 to 0630 hours, January 12, 1979 48
11. Discharge and chemical oxygen demand at St. LouisStreet, 1600 to 2100 hours, July 31, 1975 49
12. Monthly load of biochemical oxygen demand of runoff at St. Louis Street drainage ditch station, 1979 water year 70
13. Comparison of annual loads of selected substances and runoff for present and assumed degrees of basin de velopment, St. Louis Street drainage ditch station, based on rainfall for 1979 water year 72
TABLES
Page
Table 1. Watershed characteristics 9
2. Urban-development characteristics 12
3. Water-quality characteristics and number of samples analyzedfor each 14
4. Average, minimum, and maximum values of measurements ofstreamflow and water-quality characteristics, July 1975 toMay 1980, for Artic Street storm drain at Tampa, Florida 18
5. Average, minimum, and maximum values of measurements ofstreamflow and water-quality characteristics, July 1975to May 1980, for Kirby Street drainage ditch at Tampa,Florida 20
iv
TABLES - Continued
Page
Table 6. Average, minimum, and maximum values of measurements ofstreamflow and water-quality characteristics, July 1975 toMay 1980, for St. Louis Street drainage ditch at Tampa,Florida 22
7. Average, minimum, and maximum values of measurements ofstreamflow and water-quality characteristics, July 1975 toMay 1980, for Gandy Boulevard drainage ditch at Tampa,Florida 24
8. Average, minimum, and maximum values of measurements ofstreamflow and water-quality characteristics, July 1975 toMay 1980, for Alien Creek near Largo, Florida 26
9. Average, minimum, and maximum values of measurements ofstreamflow and water-quality characteristics, July 1975 toMay 1980, for Booker Creek at'St. Petersburg, Florida 28
10. Average, minimum, and maximum values of measurements ofstreamflow and water-quality characteristics, July 1975to May 1980, for Bear Creek at St. Petersburg, Florida 30
11. Average, minimum, and maximum values of measurements ofstreamflow and water-quality characteristics, July 1975to May 1980, for Saint Joes Creek at St. Petersburg,Florida 32
12. Average, minimum, and maximum values of measurements ofstreamflow and water-quality characteristics, July 1975 to May 1980, for Turner Street storm drain at Clearwater, Florida 34
13. Average, minimum, and maximum values of measurements ofstreamflow and water-quality characteristics, July 1975 to May 1980, for nine urban watersheds in the Tampa Bay area, Florida 36
14. Water-quality constituent loads for selected storms 50
15. Watershed and land-use variables used in regression analyses of loads and concentrations of selected water-quality con stituents 53
16. Rainfall data used in regression analysis of stormwater-runoff loads 54
17. Regression equations for estimating stormwater-runoff loadsfor selected water-quality constituents 55
18. Rainfall and runoff volumes for selected storms 57
19. Nonlinear-regression equation variables for estimating storm- runoff volume at nine urban watersheds in the Tampa Bay area, Florida 60
20. Comparison of regional estimate and observed storm-runoff vol ume at nine urban watersheds in the Tampa Bay area, Florida - 61
TABLES - Continued
Table 21,
22.
23.
Page
Regression equations for estimating base-flow concentrationsof selected water-quality constituents 62
Data used in regression analysis of base-flow daily discharge - 64
- 66Estimated loads of selected substances in runoff from urban watersheds in the Tampa Bay area, 1979 water year -
ABBREVIATIONS AND CONVERSION FACTORS
Factors for converting inch-pound units to International System of Units (SI)and abbreviation of units
Multiply
inch (in)
foot (ft)
mile (mi)
square mile (mi )
acre
pound (Ib)
cubic~foot per second (ftJ /s)
degree Fahrenheit (°F)
micromho per centimeter at 25°C (umho/cm at 25°C)
By_
25.4
0.3048
1.609
2.590
0.4047
0.4536
0.02832
(°F-32)/1.8
1.000
To obtain
millimeter (mm)
meter Cm)
kilometer (km)2
square kilometer (km )
hectare (ha)
kilogram (kg)
cubic meter per second On /s)
degree Celsius (°C)
microsiemen per centimeter at 25°C (uS/cm at 25°C)
National Geodetic Vertical Datum of 1929 (NGVD of 1929). A geodetic datum de rived from a general adjustment of the first-order level nets of both the United States and Canada, formerly called mean sea level. NGVD of 1929 is referred to as sea level in the text of this report.
vi
WATER-QUALITY CHARACTERISTICS OF URBAN RUNOFF AND ESTIMATES OF ANNUAL LOADS
IN THE TAMPA BAY AREA, FLORIDA, 1975-80
By M. A. Lopez and R. F. Giovannelli
ABSTRACT
Rainfall, runoff, and water-quality data were collected at nine urban watersheds in the Tampa Bay area of west-central Florida from 1975 to 1980. Watershed drainage area ranged from 0.34 to 3.45 square miles. Land use was mixed. Development ranged from a mostly residential watershed with 19 percent impervious surface to a commercial-residential watershed with 61 percent imper vious surface. Average biochemical oxygen demand concentrations of base flow at two sites and of storawater runoff at five sites exceeded treated sewage ef fluent standards. Average colifora concentrations of stormwater runoff at all sites were several orders of magnitude greater than standards for Florida Class III receiving water (for recreation or propagation and management of fish and wildlife). Average concentrations of lead and zinc in stormwater runoff were consistantly higher than Class III standards. Generally, turbidity and constit uent concentrations were higher for rising stages than for falling stages; the contrast between rising and falling stages was greatest for watersheds with highly developed street drainage and sewer systems.
Stormwater-runoff loads and base-flow concentrations of biochemical oxygen demand, chemical oxygen demand, total nitrogen, total organic nitrogen, total phosphorus, and lead were related to runoff volume, land use, urban development, and antecedent daily rainfall by multiple linear regression. Standard error of estimate for the stormwater-runoff load equation ranged from ±41 percent of the mean for chemical oxygen demand to ±65 percent of the mean for total organic ni trogen. Standard error of estimate for the base-flow concentration equation ranged from ±33 percent for chemical oxygen demand to ±60 percent for biochemi cal oxygen demand.
Stormwater-runoff volume was related to pervious area, hydraulically con nected impervious surfaces, storm rainfall, and soil-infiltration index. The regression equation for volume had an average standard error of ±20 percent and correlation coefficient of 0.93. Base-flow daily discharge was related to drainage area and antecedent daily rainfall; the regression equation has a stan dard error of ±45 percent and a correlation coefficient of 0.94.
The flow regression equations of this report were used to compute 1979 water-year loads of biochemical oxygen demand, chemical oxygen demand, total nitrogen, total organic nitrogen, total phosphorus, and total lead for the nine Tampa Bay area urban watersheds. The computed loads were compared with loads derived by use of land-use load factors applicable to urban areas in Broward County, Florida. Results obtained by the two methods differed appreciably in most instances, but were of the same order of magnitude. A similar comparison was made of loads computed by use of the screening procedure formulated by the
U.S. Environmental Protection Agency. Annual loads of total nitrogen, biochemi cal oxygen demand, and total phosphorus were estimated for one of the Tampa Bay area watersheds (St. Louis Street drainage ditch). Loads computed by the screen ing procedure were about the same as the loads computed by the Tampa Bay area re gression equations for total nitrogen, about twice as great for biochemical oxygen demand, and about an order of magnitude smaller for total phorphorus. The Tampa Bay area regression equations presumably reflect the natural high phosphorus con tent of streamflow in the Tampa Bay area and the fallout from phosphate process ing plants on the east shore of Tampa Bay.
INTRODUCTION
Urbanization is the process of constructing roads, houses, and commercial and industrial developments on land that was once in a natural state or rural condition. The major effects of urbanization on water resources are reduced in filtration, increased flood potential, and degradation of the quality of receiv ing bodies of water. Trash and litter deposited on streets and parking lots, erosion of exposed ground due to construction, lawn and landscape maintenance, domestic pet litter, automobile emissions, and atmospheric deposition from indus trial and thermoelectric plants have been identified as sources of urban storm- water loads. These sources of generally distributed substances are grouped to gether under the classification of nonpoint to distinguish them from the more readily identifiable industrial and domestic sewage plant effluents that are called point sources.
The materials from nonpoint sources are concentrated by stormwater-collec- tion systems and transported to the receiving waterbodies. The extent to which these materials affect the quality of water for various uses generally is ap praised by measurement of a suite of water-quality characteristics that describe the condition of the water. Some of the commonly measured characteristics are: temperature, turbidity, specific conductance, biochemical oxygen demand, chemi cal oxygen demand, coliform count, and concentration of chemical constituents. The substances of primary concern because of their impact on water quality are: (1) material related to suspended solids, (2) oxygen-demanding material, (3) nu trients, (4) bacteria, (5) organics (pesticides and other organic toxics), and (6) trace elements (toxics). The impacts of the first five are the most obvious turbidity that inhibits light penetration, depletion of dissolved oxygen that can result in fish kills, enrichment that accelerates the growth of nuisance plants, the presence of pathogens that restrict contact sports and harvesting of certain types of shellfish, and fish kills caused by insecticides or herbi cides. The impacts of trace elements on receiving waterbodies are not immedi ately noticed and may not be noticed for years unless these elements are in the dissolved phase.
Assessment of the urban runoff problem requires extensive data collection and analysis of information on land use, rainfall, runoff rates and volumes, and water quality. Late in 1974, the U.S. Geological Survey in cooperation with the Southwest Florida Water Management District, Hillsborough County, Pinellas County, and the cities of Tampa, St. Petersburg, and Clearwater initiated a study to de termine the effect of urban development on the quality and quantity of stormwater and base-flow runoff in the Tampa Bay area. The objectives of the study were to: (1) assess the quantity and quality of runoff, and (2) relate quantity and qual ity of runoff to land use and intensity of development.
A detailed description of the study area, procedures for selection of watersheds, data-collection sites, data-collection techniques, and a tabula tion of data processed through September 30, 1976, are included in a report by Lopez and Michaelis (1979).
PURPOSE AND SCOPE
The purpose of this report is to describe the water-quality characteristics of urban runoff in the Tampa Bay area and to provide a method for estimating loads of substances contained in runoff from urbanized watersheds under existing and future conditions. A report by Lopez and Woodham (1982) describes procedures for estimating flood-peak discharges on small urban watersheds in the Tampa Bay area.
From 1975 to 1980, an urban-runoff data-collection program, including streamflow, climatic, physiographic, and water-quality data, was established at nine watersheds ranging from beginning to advanced stages of urban development. Gaging stations were installed to monitor rainfall and runoff for each watershed. Physiographic features that consist of size, shape, and slope of the watershed, type of land use, degree of land use, area of impervious surfaces, type of storm drainage, soil types, and surface area of lakes or detention ponds were compiled from aerial photographs, U.S. Geological Survey topographic maps, planning agency data, and field observations.
Water-quality samples were collected during storms to determine the varia tion of water quality within and among individual storms and watersheds. Most samples were obtained during the wet-season months of July through September when the frequency of storms was highest. Base-flow samples were collected to provide data for determining loads of various substances transported between periods of stormwater runoff.
AREA DESCRIPTION
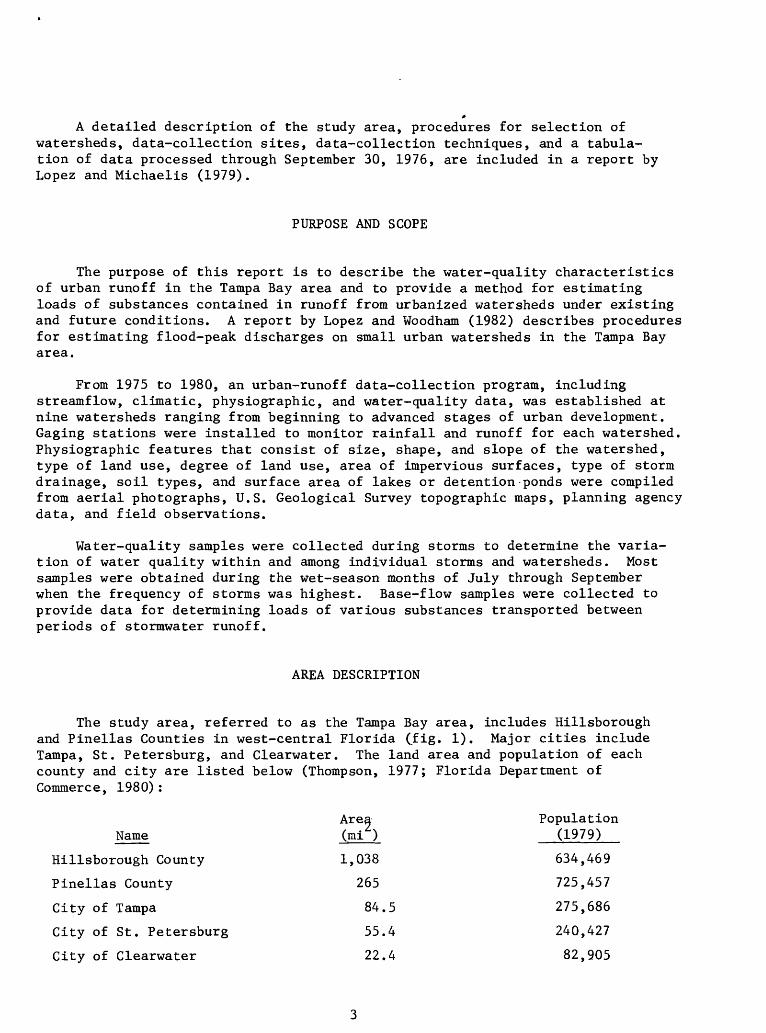
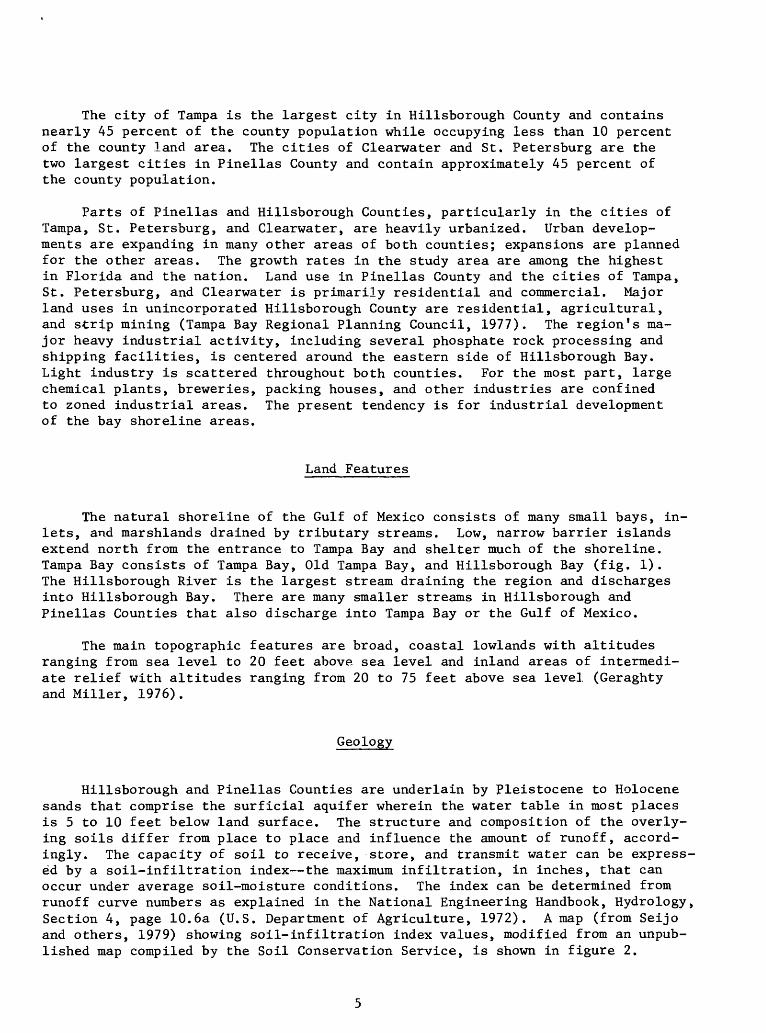
The study area, referred to as the Tampa Bay area, includes Hillsborough and Pinellas Counties in west-central Florida (fig. 1). Major cities include Tampa, St. Petersburg, and Clearwater. The land area and population of each county and city are listed below (Thompson, 1977; Florida Department of Commerce, 1980):
Area Population Name (mi ) (1979)
Hillsborough County 1,038 634,469
Pinellas County 265 725,457
City of Tampa 84.5 275,686
City of St. Petersburg 55.4 240,427
City of Clearwater 22.4 82,905
82° 30'
28°00'
EXPLANATION
EVAPORATION STATIONPASCO COHILLS BOROUGH CO
WATERSHED AND NUMBER
STREAMFLOW. WATER-QUALITY. ATO RAINFALL STATIC*
RAINFALL STATION AND NUMBER
0
PETERSBURG
MANATEE
5 10 MILESSTUDY AREA
5 10 15 KILOMETERS
27*45'
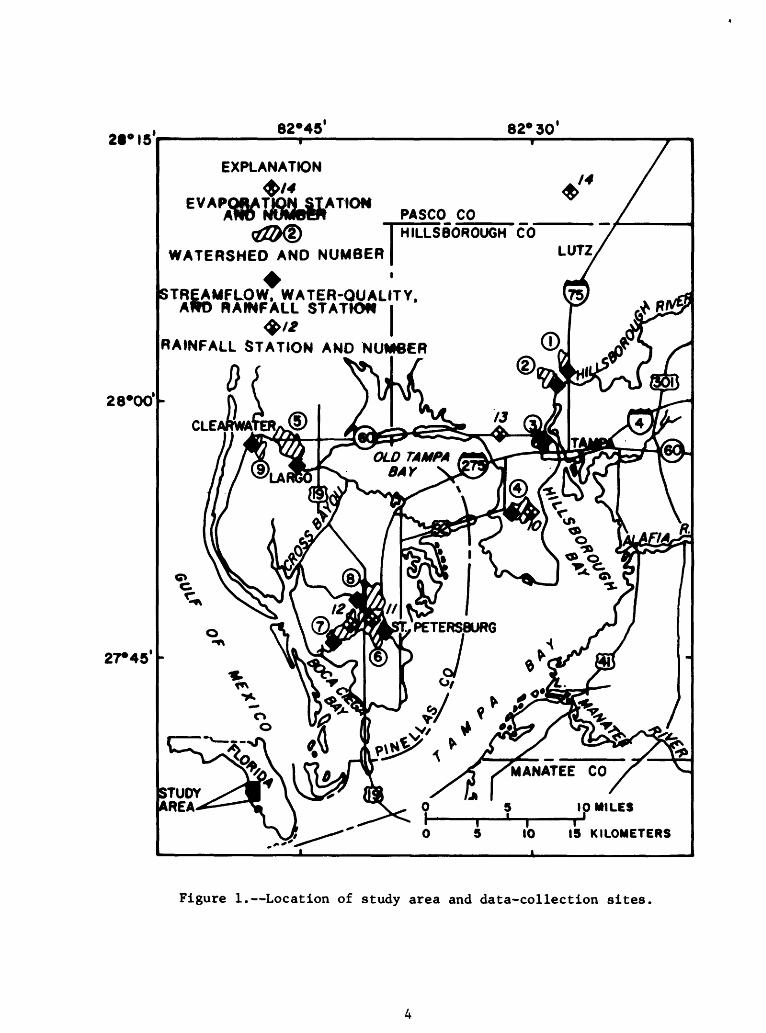
Figure 1. Location of study area and data-collection sites.
The city of Tampa is the largest city in Hillsborough County and contains nearly 45 percent of the county population while occupying less than 10 percent of the county land area. The cities of Clearwater and St. Petersburg are the two largest cities in Pinellas County and contain approximately 45 percent of the county population.
Parts of Pinellas and Hillsborough Counties, particularly in the cities of Tampa, St. Petersburg, and Clearwater, are heavily urbanized. Urban develop ments are expanding in many other areas of both counties; expansions are planned for the other areas. The growth rates in the study area are among the highest in Florida and the nation. Land use in Pinellas County and the cities of Tampa, St. Petersburg, and Clearwater is primarily residential and commercial. Major land uses in unincorporated Hillsborough County are residential, agricultural, and strip mining (Tampa Bay Regional Planning Council, 1977). The region f s ma jor heavy industrial activity, including several phosphate rock processing and shipping facilities, is centered around the eastern side of Hillsborough Bay. Light industry is scattered throughout both counties. For the most part, large chemical plants, breweries, packing houses, and other industries are confined to zoned industrial areas. The present tendency is for industrial development of the bay shoreline areas.
Land Features
The natural shoreline of the Gulf of Mexico consists of many small bays, in lets, and marshlands drained by tributary streams. Low, narrow barrier islands extend north from the entrance to Tampa Bay and shelter much of the shoreline. Tampa Bay consists of Tampa Bay, Old Tampa Bay, and Hillsborough Bay (fig. 1). The Hillsborough River is the largest stream draining the region and discharges into Hillsborough Bay. There are many smaller streams in Hillsborough and Pinellas Counties that also discharge into Tampa Bay or the Gulf of Mexico.
The main topographic features are broad, coastal lowlands with altitudes ranging from sea level to 20 feet above sea level and inland areas of intermedi ate relief with altitudes ranging from 20 to 75 feet above sea level (Geraghty and Miller, 1976).
Geology
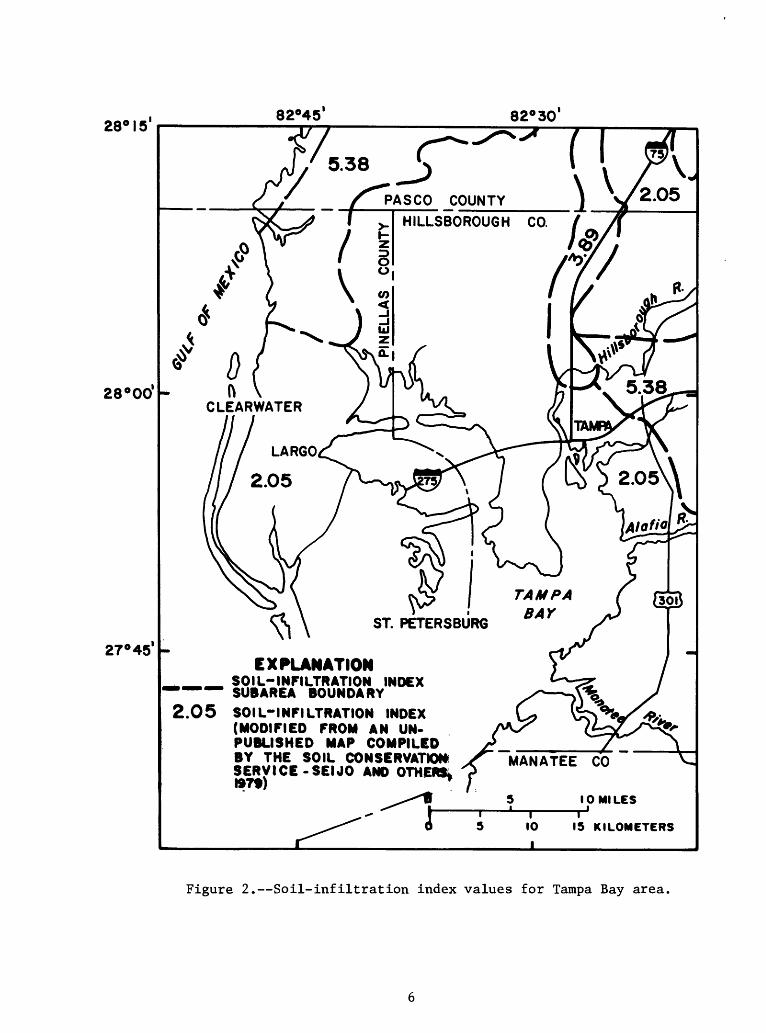
Hillsborough and Pinellas Counties are underlain by Pleistocene to Holocene sands that comprise the surficial aquifer wherein the water table in most places is 5 to 10 feet below land surface. The structure and composition of the overly ing soils differ from place to place and influence the amount of runoff, accord ingly. The capacity of soil to receive, store, and transmit water can be express ed by a soil-infiltration index the maximum infiltration, in inches, that can occur under average soil-moisture conditions. The index can be determined from runoff curve numbers as explained in the National Engineering Handbook, Hydrology, Section 4, page 10.6a (U.S. Department of Agriculture, 1972). A map (from Seijo and others, 1979) showing soil-infiltration index values, modified from an unpub lished map compiled by the Soil Conservation Service, is shown in figure 2.
H-
OQ (D
fo hh
H-
rt H- s H-
0 o H bd
The overlying soils in areas extending north and east of Tampa are general ly fine grained and highly permeable (Florida Department of Administration, 1975). Much of the rainfall in these areas where the indexes are 3.89 and 5.38, respec tively, infiltrates rapidly; a large part of surface runoff enters sinkholes or depression areas. In other parts of the study area where the index is 2.05 or less, rocks and soils tend to be less pervious, and surface runoff moves more rapidly from these areas into stream channels or drainage ditches.
Urban Development
Urbanization of Tampa'Bay area watersheds includes residential developments with paved streets drained by storm-sewer systems and commercial centers and in dustrial parks with large paved parking lots. The impervious surfaces in urban watersheds include roads, sidewalks, driveways, roofs, and parking lots. Resi dential developments have different types of density patterns. Homes in older urban developments are generally smaller and close together, whereas homes in recent suburban developments are larger but are farther apart and thus occupy a smaller percentage of the development. Multifamily residential developments have a high percentage of impervious surface because of parking lots associated with apartment complexes.
As urbanization increases, the area of impervious surface, and the volume of stormwater runoff increase, but the time necessary for runoff to occur (time of concentration) decreases due to channel improvements. Generally, residential roofs are not directly connected to the storm-drainage system, and runoff from them flows over pervious areas before reaching the storm-drainage system. Roofs of commercial or industrial buildings usually drain onto paved parking lots that have storm-sewer inlets directly connected to the drainage system. Some of the stormwater runoff from roofs or impervious surfaces that are not directly con nected to storm sewers or drainage channels is detained as depression storage. In these cases, considerable infiltration and evaporation may occur before over land flow enters a storm-drainage system. Only a small amount of rain that falls on impervious surfaces that are directly connected to a storm-drainage system is retained for surface wetting and depression storage.
Watershed and drainage-system features also affect quality of runoff. Sub stances accummulated on paved surfaces that are directly connected to storm-drain age systems wash off easily during initial phases of a storm. This results in high concentrations of these substances in runoff at the beginning of a storm and decreasing concentrations as runoff continues. Substances adsorbed to or attached to particulate matter that are evenly distributed in a watershed that has a rela tively small area of directly connected impervious surface tend to wash off and move into the stormwater-drainage system at rates proportional to flow velocity; the highest concentrations generally occurring near peak discharge.
Climate
The climate of the Tampa Bay area is characterized by warm, humid summers and mild winters. Temperatures during the summer range from about 70° to 90°F and winter temperatures range from about 32° to 70°F. The normal annual precip itation as recorded at Tampa is about 51 inches. Annual precipitation fluctuates
widely. The lowest yearly total recorded as of 1980 is 28.89 inches, occurring in 1956; the highest is 76.67 inches, occurring in 1959 (Wright, 1974). Most rainfall occurs from June through September as a result of short duration, high intensity, afternoon or evening thundershowers. Rainfall in the fall, winter, and spring generally occurs from less frequent, long duration, frontal-type storms. Hurricanes, tropical storms, and tropical depressions produce heavy rainfall at irregular intervals.
DATA COLLECTION
Nine urban watersheds were selected for the study (fig. 1). Four of these are in the city of Tampa, Hillsborough County, and five are in Pinellas County: three in the city of St. Petersburg, one in the city of Clearwater, and one near the town of Largo, south of Clearwater (fig. 1).
Watershed Features
Land Use
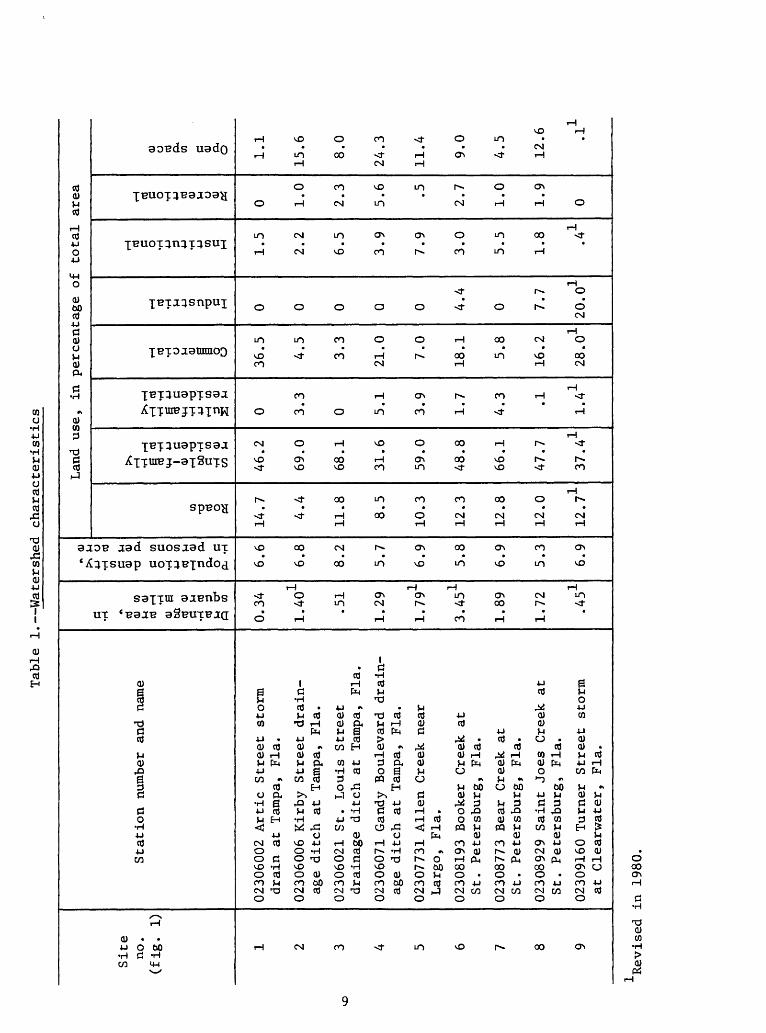
_ Drainage areas of the selected watersheds range in size from Q.34 to 3.45 mi . Drainage areas and land use were field-verified in 1980 and were revised for Kirby Street, Alien Creek, Booker Creek, and Turner Street watersheds. Drainage-area and land-use percentages for these watersheds supercede data pub lished in an earlier data report (Lopez and Michaelis, 1979). Each contains a different mixture of residential, commercial, industrial, and undeveloped areas that is typical of urban development in other parts of the Tampa Bay area. Two of the watersheds (Artic Street storm drain and Kirby Street drainage ditch) have a soil-infiltration index of 3.89 inches. The remaining selected water sheds have a soil-infiltration index of 2.05 inches. Watershed features and land-use characteristics as listed in table 1 are:
Drainage area. Area, in square miles, planimetered from U.S. Geological Survey 7-1/2-minute series topographic maps. Watershed boundaries were delineated on topographic maps; natural divides were modified to include or exclude areas where storm sewers crossed the natural divides, based on information from city and county agencies.
Population density. The number of persons per acre computed by dividing the population within the watershed boundary by the watershed area, in acres. Population was estimated for the period of runoff record from 1970 census data.
Land use
Roads. Percentage of watershed area covered by paved roads;
Single-family residential. Percentage of watershed area covered by single-family homes;
Multifamily residential. Percentage of the watershed area covered by multifamily homes or apartments;
Commercial. Percentage of the watershed area covered by commercial buildings and associated parking lots;
8
Table
1. Watershed ch
arac
teri
stic
s
Sit
en
o.
(fig
. 1)
1 2 3 4 5 6 7 8 9
Sta
tion
num
ber
and
nam
e
0230
6002
A
rtic
S
treet
sto
rmdra
in at
Tam
pa,
Fla
.
0230
6006
K
irb
y S
treet
dra
in
age
dit
ch
at
Tam
pa,
Fla
.
0230
6021
S
t.
Lo
uis
S
treet
dra
inage dit
ch at
Tam
pa,
Fla
.
0230
6071
G
andy
B
oule
var
d d
rain
ag
e dit
ch at
Tam
pa,
Fla
.
0230
7731
A
lien
C
reek
n
ear
Lar
go,
Fla
.
0230
8193
B
oo
ker
C
reek
at
St.
P
ete
rsb
urg
, F
la.
0230
8773
B
ear
Cre
ek at
St.
P
ete
rsburg
, F
la.
0230
8929
S
ain
t Jo
es
Cre
ek at
St.
P
ete
rsburg
, F
la.
0230
9160
T
urn
er S
treet
storm
at
Cle
arw
ate
r,
Fla
.
c rt *
h cd CU
COM
cu
Cd
rH
HCU
g
cm co
<UC
M
rl
cdcd
3
M
C7«
P
CO
0.3
4
1.4
01
.51
1.2
9
1.7
91
3.4
51
1.8
9
1.7
2
.45
1
A
0)
>>
M4-
> O
H
CdCO §
8T
J C
U
C
CO
0
C r
l 0
4->
COcd
M
1-1
<1)3
CX0
.0
C
(X
-H
6.6
6.8
8.2 5.7
6.9 5.8
6.9
5.3 6.9
Lan
d u
se,
in p
erce
nta
ge
of
tota
l ar
ea
CO TJ cd o PS
14.7
4.4
11
.8
8.5
10
.3
12
.3
12
.8
12.0
12. 7
1
?*> rH
H
rHS
"JM
-4
4J
1 C
(1) (1)
iH
T3
60 -
r(C3
CO
r(
<1)CO
}-
l
46
.2
69
.0
68.1
31
.6
59.0
48.8
66
.1
47.7
37. 4
1
f^rH
rH
Cd H
.H
c3
jj
cd
C<M
(1
) H
T
34
J -H
rH
CO3
(1)
a M
0 3.3
Q 5.1
3.9
1.7
4.3 .1
1.4
1
rH cd H o M CU O g O U
36
.5
4.5
3.3
21.0
7.0
18.1
5.8
16.2
28. 0
1
rH cd iH M 4-> CO 3 TJ c M 0 0 0 0 0 4.4
0 7.7
20.
01
rH cd c O
H 4-> 3 4->
H 4J CO c H 1.5
2.2
6.5
3.9
7.9
3.0
5.5
1.8 .4
1
rH C M O H 4-> cd (1) M O (1) (K!
0 1.0
2.3
5.6 .5
2.7
1.0
1.9
0
CD o cd Cu CO c (1) Prf o 1.1
15.6
8.0
24.3
11.4 9.0
4.5
12.6 .I
1
"Rev
ised
in 19
80.
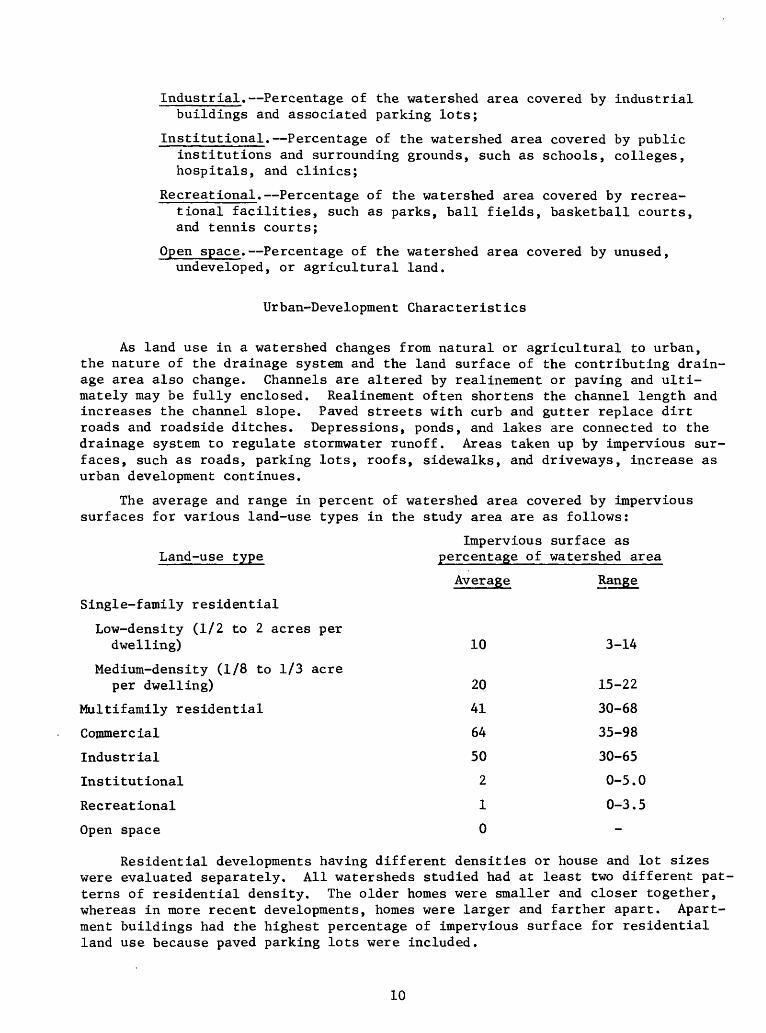
Industrial. Percentage of the watershed area covered by industrial buildings and associated parking lots;
Institutional. Percentage of the watershed area covered by public institutions and surrounding grounds, such as schools, colleges, hospitals, and clinics;
Recreational. Percentage of the watershed area covered by recrea tional facilities, such as parks, ball fields, basketball courts, and tennis courts;
Open space. Percentage of the watershed area covered by unused, undeveloped, or agricultural land.
Urban-Development Characteristics
As land use in a watershed changes from natural or agricultural to urban, the nature of the drainage system and the land surface of the contributing drain age area also change. Channels are altered by realinement or paving and ulti mately may be fully enclosed. Realinement often shortens the channel length and increases the channel slope. Paved streets with curb and gutter replace dirt roads and roadside ditches. Depressions, ponds, and lakes are connected to the drainage system to regulate stormwater runoff. Areas taken up by impervious sur faces, such as roads, parking lots, roofs, sidewalks, and driveways, increase as urban development continues.
The average and range in percent of watershed area covered by impervious surfaces for various land-use types in the study area are as follows:
Impervious surface as Land-use type percentage of watershed area
Average Range
Single-family residential
Low-density (1/2 to 2 acres perdwelling) 10 3-14
Medium-density (1/8 to 1/3 acreper dwelling) 20 15-22
Multifamily residential 41 30-68
Commercial 64 35-98
Industrial 50 30-65
Institutional 2 0-5.0
Recreational 1 0-3.5
Open space 0
Residential developments having different densities or house and lot sizes were evaluated separately. All watersheds studied had at least two different pat terns of residential density. The older homes were smaller and closer together, whereas in more recent developments, homes were larger and farther apart. Apart ment buildings had the highest percentage of impervious surface for residential land use because paved parking lots were included.
10
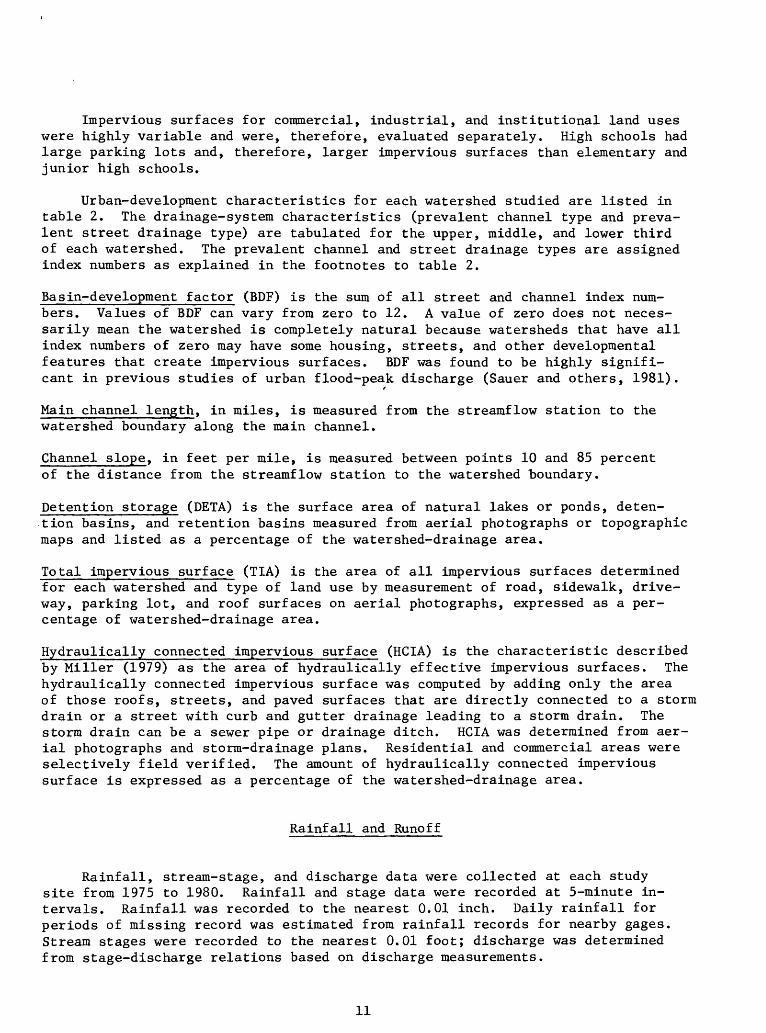
Impervious surfaces for commercial, industrial, and institutional land uses were highly variable and were, therefore, evaluated separately. High schools had large parking lots and, therefore, larger impervious surfaces than elementary and junior high schools.
Urban-development characteristics for each watershed studied are listed in table 2. The drainage-system characteristics (prevalent channel type and preva lent street drainage type) are tabulated for the upper, middle, and lower third of each watershed. The prevalent channel and street drainage types are assigned index numbers as explained in the footnotes to table 2.
Basin-development factor (BDF) is the sum of all street and channel index num bers. Values of BDF can vary from zero to 12. A value of zero does not neces sarily mean the watershed is completely natural because watersheds that have all index numbers of zero may have some housing, streets, and other developmental features that create impervious surfaces. BDF was found to be highly signifi cant in previous studies of urban flood-peak discharge (Sauer and others, 1981).
Main channel length, in miles, is measured from the streamflow station to the watershed boundary along the main channel.
Channel slope, in feet per mile, is measured between points 10 and 85 percent of the distance from the streamflow station to the watershed boundary.
Detention storage (DETA) is the surface area of natural lakes or ponds, deten tion basins, and retention basins measured from aerial photographs or topographic maps and listed as a percentage of the watershed-drainage area.
Total impervious surface (TIA) is the area of all impervious surfaces determined for each watershed and type of land use by measurement of road, sidewalk, drive way, parking lot, and roof surfaces on aerial photographs, expressed as a per centage of watershed-drainage area.
Hydraulically connected impervious surface (HCIA) is the characteristic described by Miller (1979) as the area of hydraulically effective impervious surfaces. The hydraulically connected impervious surface was computed by adding only the area of those roofs, streets, and paved surfaces that are directly connected to a storm drain or a street with curb and gutter drainage leading to a storm drain. The storm drain can be a sewer pipe or drainage ditch. HCIA was determined from aer ial photographs and storm-drainage plans. Residential and commercial areas were selectively field verified. The amount of hydraulically connected impervious surface is expressed as a percentage of the watershed-drainage area.
Rainfall and Runoff
Rainfall, stream-stage, and discharge data were collected at each study site from 1975 to 1980. Rainfall and stage data were recorded at 5-minute in tervals. Rainfall was recorded to the nearest 0.01 inch. Daily rainfall for periods of missing record was estimated from rainfall records for nearby gages. Stream stages were recorded to the nearest 0.01 foot; discharge was determined from stage-discharge relations based on discharge measurements.
11
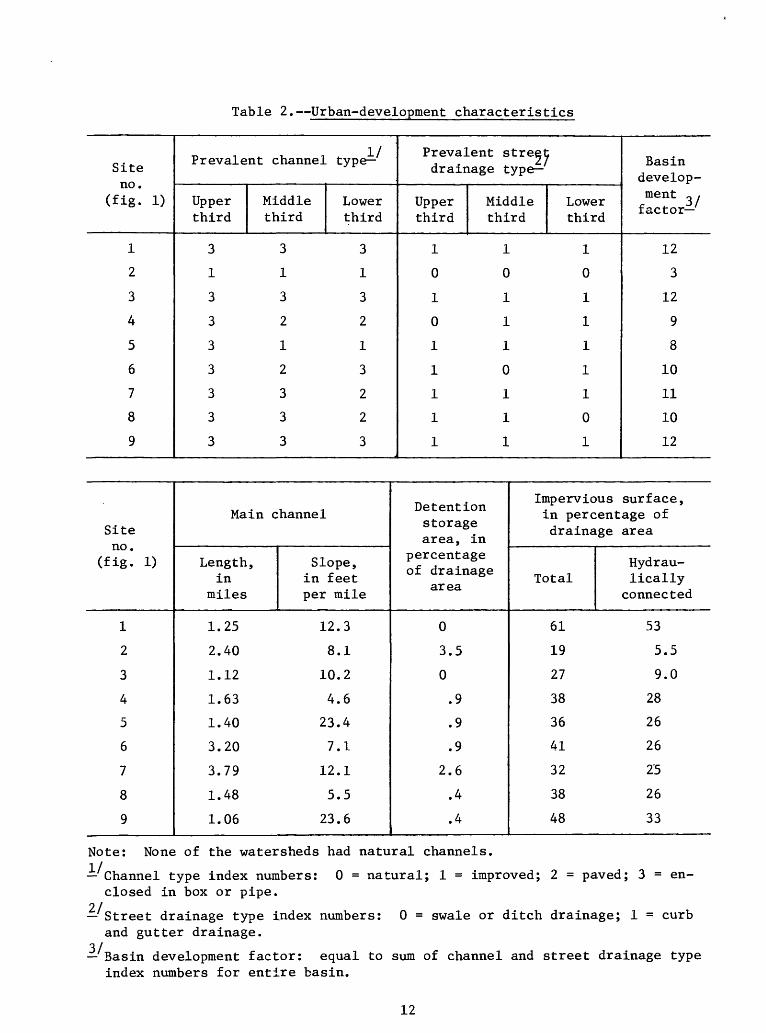
Table 2. Urban-development characteristics
Siteno.
(fig. 1)
1
2
3
4
5
6
7
8
9
Prevalent channel type-
Upper third
3
1
3
3
3
3
3
3
3
Middle third
3
1
3
2
1
2
3
3
3
Lower third
3
1
3
2
1
3
2
2
3
Prevalent street drainage type-
Upper third
1
0
1
0
1
1
1
1
1
Middle third
1
0
1
1
1
0
1
1
1
Lower third
1
0
1
1
1
1
1
0
1
Basin development ~ , factor-7
12
3
12
9
8
10
11
10
12
Siteno.
(fig. 1)
1
2
3
4
5
6
7
8
9
Main channel
Length, in
miles
1.25
2.40
1.12
1.63
1.40
3.20
3.79
1.48
1.06
Slope, in feetper mile
12.3
8.1
10.2
4.6
23.4
7.1
12.1
5.5
23.6
Detention storage area, in
percentage of drainage
area
0
3.5
0
.9
.9
.9
2.6
.4
.4
Impervious surface, in percentage of drainage area
Total
61
19
27
38
36
41
32
38
48
Hydrau- lically
connected
53
5.5
9.0
28
26
26
25
26
33
Note: None of the watersheds had natural channels.
Channel type index numbers: 0 = natural; 1 = improved; 2 = paved; 3 = en closed in box or pipe.
21 Street drainage type index numbers: 0 = swale or ditch drainage; 1 = curband gutter drainage.
3/ Basin development factor: equal to sum of channel and street drainage typeindex numbers for entire basin.
12
Criteria used in selecting sites for rain gages and stage recorders, types and descriptions of the instrumentation, density of the gages, and the process ing and storage of the data are discussed in Lopez and Michaelis (1979).
Water Quality
Water-quality data were collected for a wiHe range of constituents from July 1975 to May 1980. During the period July to October 1975, all sites were intensively sampled to obtain background data. A less intensified sampling sche dule was designed subsequently, using results of background data and recommenda tions of the Tampa Bay Regional Planning Council (1977) for water-quality charac teristics associated with pollution problems in urbanized areas of west-central Florida.
The water-quality sampling program was designed to define temporal and spa tial variations in various characteristics, such as variations within and between storms and among watersheds with different levels of development. Samples were also collected during periods of base flow to examine differences in quality be tween stormwater runoff and base flow. Most samples of stormwater runoff were obtained during the wet season, June through September. The short-duration, high-intensity rainfall associated with thunderstorms during the wet season pro duced well-defined periods of stormwater runoff. The distinction between storm- water runoff and base flow was less apparent during the fall, winter, and spring when rainfall generally was less intense and of longer duration.
Streamflow samples were collected manually at selected time intervals dur ing periods of stormwater runoff to define variations in water quality. Samples for rising stages were taken at relatively short intervals to define flushing characteristics of the watersheds. Samples for falling stages were obtained at longer time intervals. The samples provided data necessary in determining total stormwater-runoff loads. Collection of samples from base flow to peak flow to base flow was not always possible for all storms because of the unpredictable nature of rainfall from thunderstorms. Surveillance methods, including a local radar weather service, were used in attempts to obtain advance notice of possi ble storms suitable for sampling (Lopez and Michaelis, 1979).
All samples were analyzed using standard analytical techniques described by Skougstad and others (1979) and Standard Methods for the Examination of Water and Wastewater by the American Public Health Association and others (1976). Two methods were used to determine coliform concentrations, including the multiple- tube fermentation test and the membrane-filter technique. Results of the multi ple-tube fermentation tests are expressed as "most probable number" (MPN), an index of the probable number of coliform bacteria per 100 milliliters. This test does not give an actual bacteria count. The membrane-filter technique pro vides a measure of coliform densities in a given volume of water (colonies per 100 milliliters). In most cases, results of the multiple-tube fermentation test and the membrane-filter technique are similar.
Water-quality characteristics analyzed are listed in table 3 for both water and bottom material samples. Total and dissolved concentrations were obtained for nutrients and most trace elements, and dissolved concentrations only were de termined for the major ions.
13
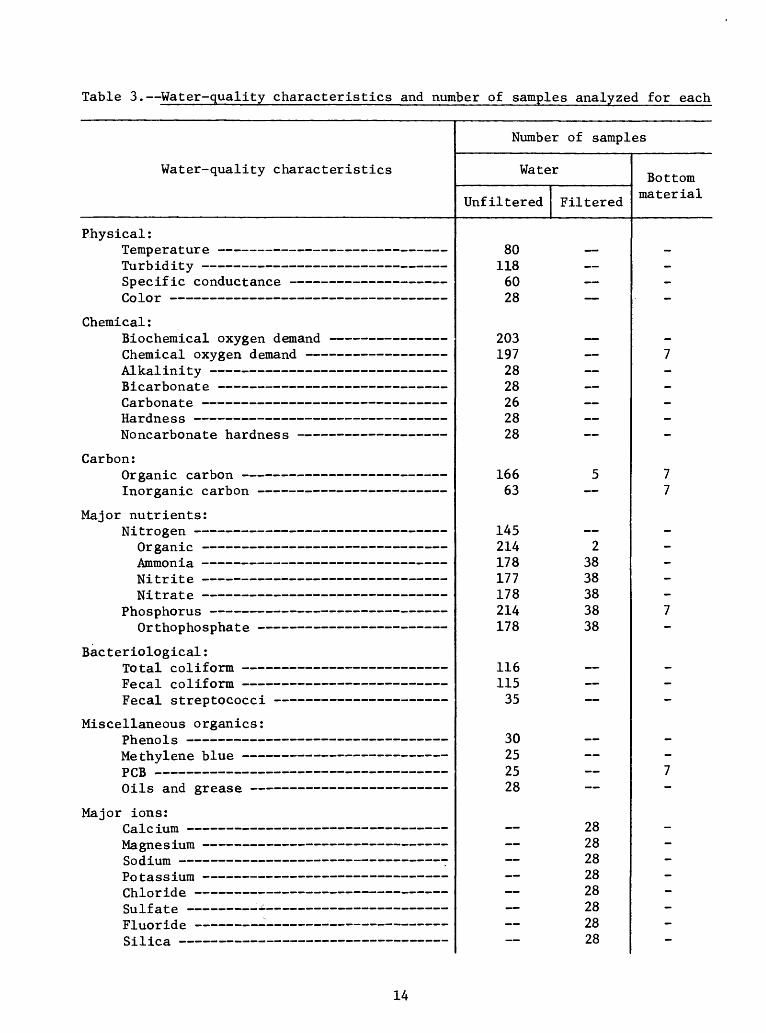
Table 3. Water-quality characteristics and number of samples analyzed for each
Water-quality characteristics
Number of samples
Water
Unfiltered Filtered
Bottom material
Physical:Temperature Turbidity - Specific conductance Color
Chemical:Biochemical oxygen demand Chemical oxygen demand - Alkalinity - Bicarbonate Carbonate Hardness - Noncarbonate hardness
Carbon:Organic carbon - Inorganic carbon -
Major nutrients:Nitrogen
Organic - Ammonia - Nitrite Nitrate -
Phosphorus Orthophosphate
Bacteriological:Total coliform Fecal coliform Fecal streptococci
Miscellaneous organics:Phenols Methylene blue PCB - Oils and grease
Major ions:Calcium Magnesium Sodium Potassium Chloride Sulfate * Fluoride Silica
801186028
2031972828262828
16663
145214178177178214178
11611535
30252528
23838383838
2828282828282828
14
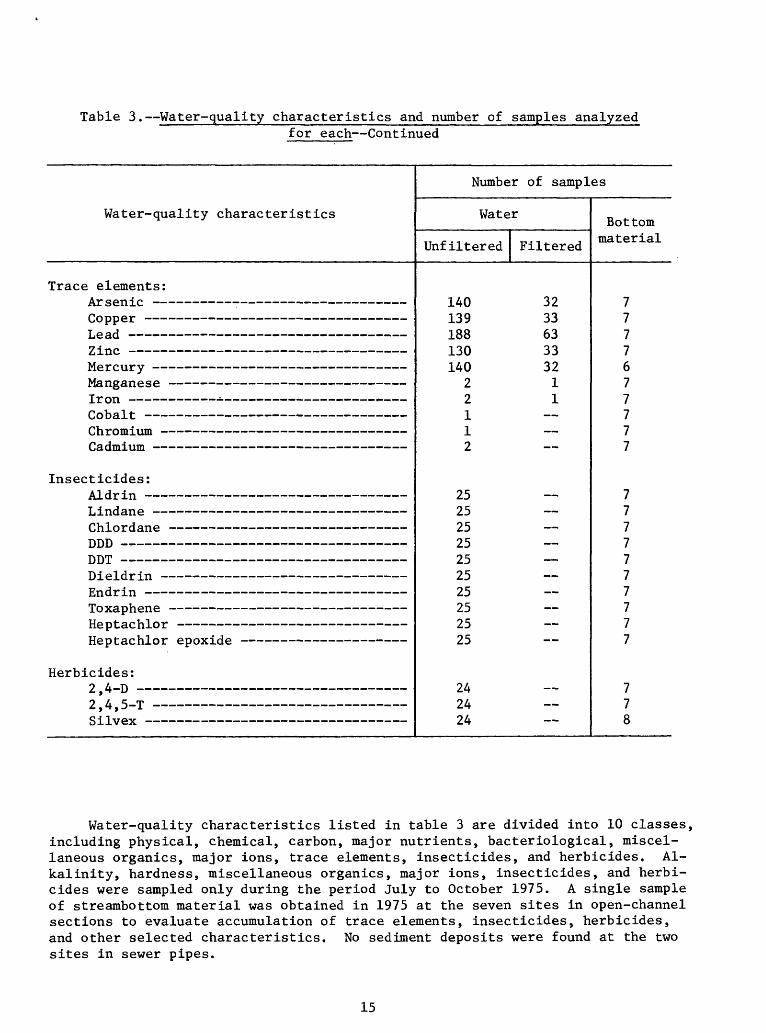
Table 3. Water-quality characteristics and number of samples analyzedfor each Continued
Water-quality characteristics
Trace elements:seme
T oarl - _ _ _
Insecticides:Ax.cnrm Lij _L no. cin e " " ! .
T\T\T\ _ 11:
T\T\T Lf Lf J.
*n-i^lrlY"-in .
n in
Herbicides:2 A T\
2 /1 ^ T
1
Number of samples
Water
Unfiltered Filtered
140 32 139 33 188 63 130 33 140 32
2 1 2 1
25
25 25
24 24
Bottom material
7 7 7 7 6 7 7 7 7 7
7 7 7 7 7 7 7 7 7 7
7 7 8
Water-quality characteristics listed in table 3 are divided into 10 classes, including physical, chemical, carbon, major nutrients, bacteriological, miscel laneous organics, major ions, trace elements, insecticides, and herbicides. Al kalinity, hardness, miscellaneous organics, major ions, insecticides, and herbi cides were sampled only during the period July to October 1975. A single sample of streambottom material was obtained in 1975 at the seven sites in open-channel sections to evaluate accumulation of trace elements, insecticides, herbicides, and other selected characteristics. No sediment deposits were found at the two sites in sewer pipes.
15
ANALYSIS OF WATER-QUALITY DATA
The average and range in measurements of water-quality characteristics can be compared readily with values published in the literature and with recommended water-quality criteria for various water uses. Variability of constituent con centration with time and discharge is a distinctive characteristic of urban run off that can be related to watershed land use and drainage system. These two topics are discussed in the following sections.
Average and Range in Streamflow and Water-Quality
Characteristics Measurements
The average, minimum, and maximum values of water-quality characteristics and corresponding streamflow data for base flow and stormwater runoff at each streamflow station are listed in tables 4 through 12. These data were evaluated in a comparison with water-quality standards for treated sewage effluent and Class III receiving waters, as described later. The data for all nine stations are summarized in table 13. The water-quality characteristics are divided into six categories: physical, chemical, carbon, major nutrients, bacteriological, and trace elements.
Streamflow rates for the samples varied primarily with drainage-area size and are shown in cubic feet per second per square mile in the tables. Base-flow average for all sites was 0.57 (ft /s)/mi (table 13). The minimum base flow ranged from 0.12 to 0.58 (ft /s)/mi , and the maximum base flow at a site ranged from 0.22 to 2.0 (ft /s)/mi . Average stormwater-runoff rates at the nine sta tions were more variable than the base flow, as could be expected. Average storm-water discharge varied from 3.5 to 71 (ft /s)/mi" in the storms sampled.
as a result of the variability
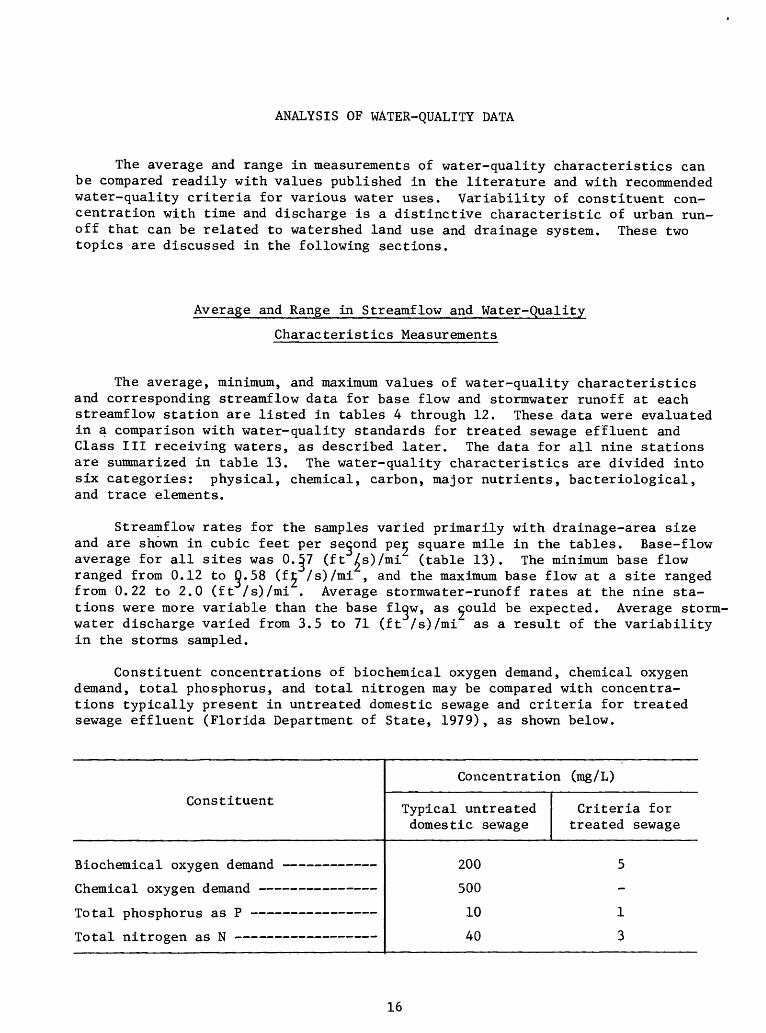
Constituent concentrations of biochemical oxygen demand, chemical oxygen demand, total phosphorus, and total nitrogen may be compared with concentra tions typically present in untreated domestic sewage and criteria for treated sewage effluent (Florida Department of State, 1979), as shown below.
Constituent
Concentration (mg/L)
Typical untreated domestic sewage
Criteria for treated sewage
Biochemical oxygen demand
Chemical oxygen demand
Total phosphorus as P -
Total nitrogen as N -
200
500
10
40
16
The comparison of sample constituent concentrations with the criteria for treated sewage effluent is a commonly used test of the water quality of urban runoff. Biochemical oxygen demand of some base-flow samples at Bear Creek and Saint Joes Creek exceeded the criteria for treated sewage effluent even though the average concentrations were within the criteria. The chemical oxygen de mand for two base-flow samples at Artic Street exceeded the criteria for treated sewage effluent by factors of two and eight. Biochemical oxygen demand concen trations for 75 percent of the stormwater-runoff samples at Artic Street exceed ed 5 mg/L although the concentrations were not as high as for the base-flow sam ples. The biochemical oxygen demand for some of the stormwater-runoff samples at all the sites exceeded the treated sewage-effluent criteria. Flow-weighted average concentrations of biochemical oxygen demand in stormwater runoff at Artic Street, St. Louis Street, Alien Creek, Saint Joes Creek, and Turner Street ex ceeded 5 mg/L.
Average concentration of total phosphorus in base-flow and stormwater-runoff samples was below the 1-mg/L criteria for treated sewage effluent. One base-flow sample at Artic Street and one or more stormwater-runoff samples at St. Louis Street, Alien Creek, Booker Creek, and Saint Joes Creek had phosphorus concentra tions of 1.0 mg/L or greater.
Concentrations of total nitrogen in all base-flow samples were less than 3.0 mg/L except for Kirby Street and Turner Street. Flow-weighted average con centrations ot total nitrogen in stormwater runoff at all sites except St. Louis Street and Saint Joes Creek were less than 3.0 mg/L.
Coliform bacteria carried by urban runoff into the receiving waters, Tampa Bay and the Gulf of Mexico, are of concern to local officials. The receiving waters in Tampa Bay are Class III surface waters for recreation or propagation and management of fish and wildlife. The Florida Department of Environmental Regulation (Florida Department of State, 1979) has set criteria for bacteria concentrations of receiving waters by class and intended use.
The Class III water-quality criteria state that the total coliform bacteria count shall not exceed 2,400 colonies per 100 railliliters (col/100 mL) at any time nor shall the fecal coliform count exceed 800 col/100 mL in any single day in all waters except designated zones of mixing. Concentrations of total and fecal coliforms for two base-flow samples at Kirby Street and St. Louis Street exceeded the Class III water-quality criteria. Average total and fecal coliform concentrations for stormwater-runoff samples at all sites were consistently greater than the specified Class III criteria, generally by several orders of magnitude.
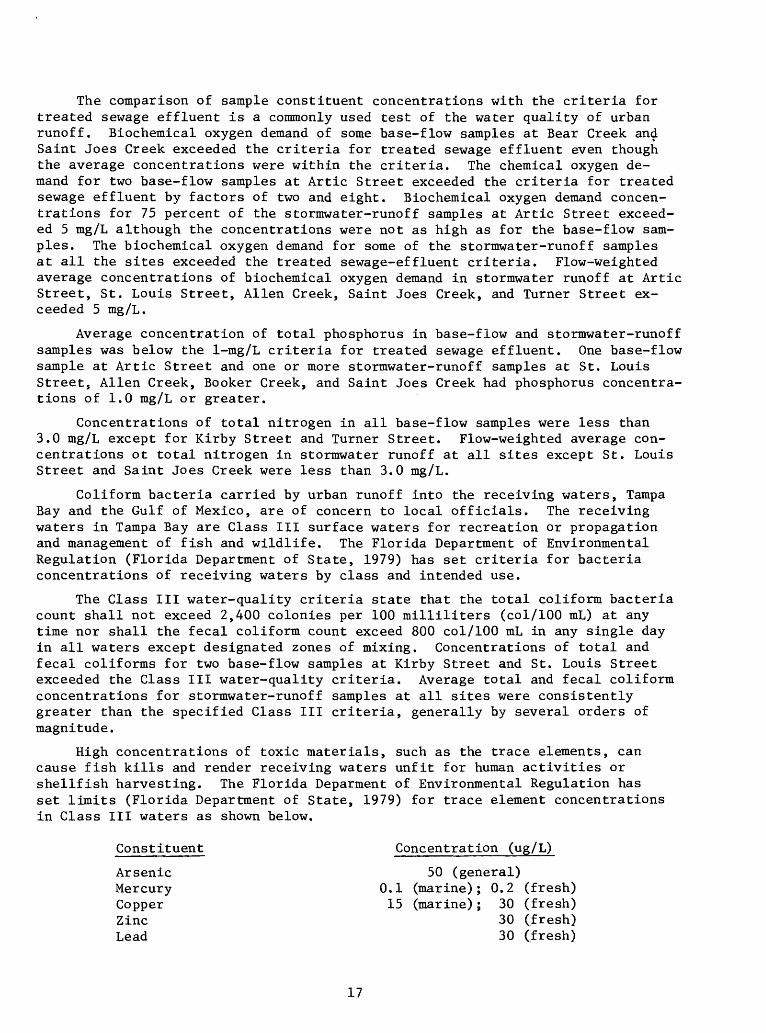
High concentrations of toxic materials, such as the trace elements, can cause fish kills and render receiving waters unfit for human activities or shellfish harvesting. The Florida Deparment of Environmental Regulation has set limits (Florida Department of State, 1979) for trace element concentrations in Class III waters as shown below.
Constituent Concentration (ug/L)
Arsenic 50 (general)Mercury 0.1 (marine); 0.2 (fresh)Copper 15 (marine); 30 (fresh)Zinc 30 (fresh)Lead 30 (fresh)
17
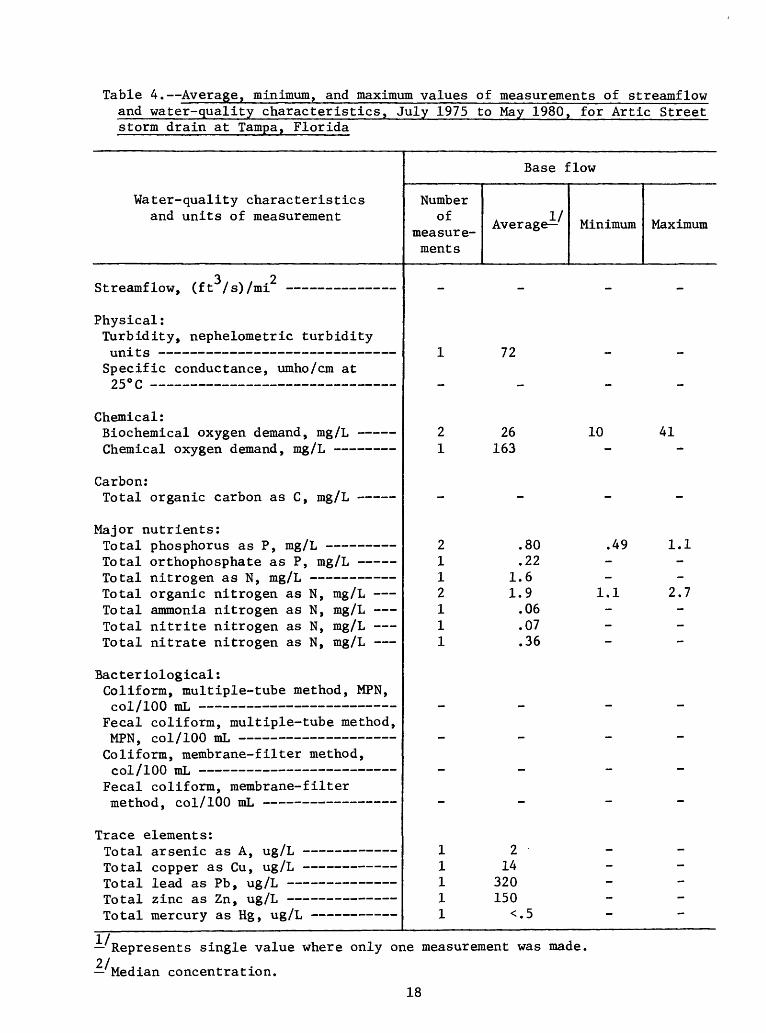
Table 4. Average, minimum, and maximum values of measurements of streamflow and water-quality characteristics, July 1975 to May 1980, for Artic Street storm drain at Tampa, Florida
Water-quality and units of
3Sr-roamf 1 nw f f 1- / G\
characteristics measurement
ArH 2
Number of
measurements
Base f
Average
'low
Minimum Maximum
Physical: Turbidity, nephelometric turbidityunits Specific conductance, umho/cm at 25° C -
Chemical:Biochemical oxygen demand, mg/L - Chemical oxygen demand, mg/L
Carbon: Total organic carbon as C, mg/L
Major nutrients:Total phosphorus as P, mg/L Total orthophosphate as P, mg/L Total nitrogen as N, mg/L Total organic nitrogen as N, mg/L Total ammonia nitrogen as N, mg/L Total nitrite nitrogen as N, mg/L Total nitrate nitrogen as N, mg/L
Bacteriological: Coliform, multiple-tube method, MPN,col/100 mL
Fecal coliform, multiple-tube method,MPN, col/100 mL Coliform, membrane-filter method,col/100 mL
Fecal coliform, membrane-filtermethod, col/100 mL
Trace elements: Total arsenic as A, ug/L - Total copper as Cu, ug/L - Total lead as Pb, ug/L - Total zinc as Zn, ug/L Total mercury as Hg, ug/L
72
26163
.80
.22
.6
.9
.06
.07
.36
214
320150
10 41
.49
1.1
1.1
2.7
Represents single value where only one measurement was made,21 Median concentration.
18
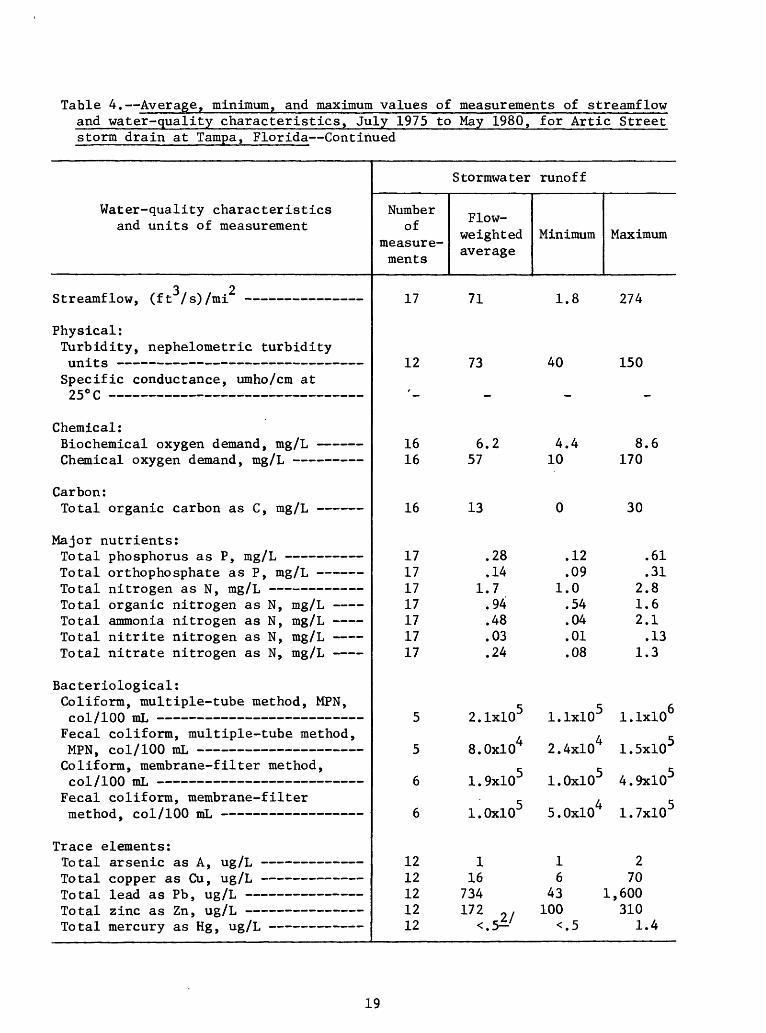
Table 4. Average, minimum, and maximum values of measurements of streamflowand water-quality characteristics, July 1975 to May 1980, for Artic Streetstorm drain at Tampa, Florida Continued
Water-quality characteristics and units of measurement
3 2 Streamflow, (ft /s)/mi
Physical: Turbidity, nephelometric turbidity uni t s Specific conductance, umho/cm at o «; 0 p ________________________________
Chemical: Biochemical oxygen demand, mg/L Chemical oxygen demand, mg/L
Carbon:
Major nutrients:Total phosphorus as P, mg/L Total orthophosphate as P, mg/L Total nitrogen as N, mg/L Total organic nitrogen as N, mg/L - Total ammonia nitrogen as N, mg/L Total nitrite nitrogen as N, mg/L Total nitrate nitrogen as N, mg/L
Bacteriological : Coliform, multiple-tube method, MPN, col/100 mL
Fecal coliform, multiple-tube method,MPN, col/100 mL Coliform, membrane-filter method, col/100 mL
Fecal coliform, membrane-filtermethod, col/100 mL
Trace elements:-LU Ld-L di. odl-l-l* do ** j *-^o / ^-*
Total copper as Cu, ug/L Total lead as Pb, ug/L Total zinc as Zn, ug/L Total mercury as Hg, ug/L
Stormwater runoff
Number of
measure ments
17
12
16 16
16
17 17 17 17 17 17 17
5
5
6
6
12 12 12 12 12
Flow- weighted Mini average
imum Maximum
71 1.8 274
73 40 150
6.2 4.4 8.6 57 10 170
13 0 30
.28 .12 .61
.14 .09 .31 1.7 1.0 2.8 .94 .54 1.6 .48 .04 2.1 .03 .01 .13 .24 .08 1.3
2.1xl05 l.lxlO5 l.lxlO6
S.OxlO4 2.4xl04 l.SxlO5
1.9xl05 l.OxlO5 4.9xl05
l.OxlO5 S.OxlO4 1.7xl05
112 16 6 70
734 43 1,600 172 , 100 310
<.5=-' <.S 1.4
19
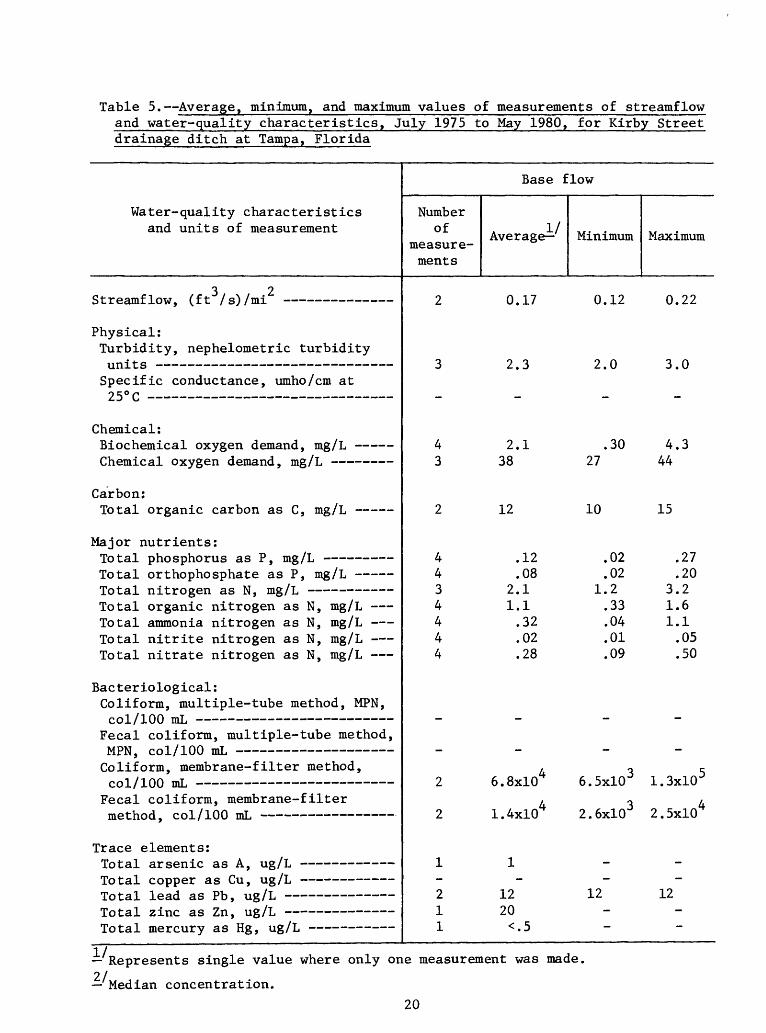
Table 5. Average, minimum, and maximum values of measurements of streamflowand water-quality characteristics, July 1975 to May 1980, for Kirby Streetdrainage ditch at Tampa, Florida
Water-quality characteristics and units of measurement
3 2 Streamflow, (ft /s)/mi
Physical: Turbidity, nephelometric turbidity
Specific conductance, umho/cm at
Chemical: Biochemical oxygen demand, mg/L Chemical oxygen demand, mg/L
Carbon: Total organic carbon as C, mg/L
Major nutrients:Total phosphorus as P, mg/L Total orthophosphate as P, mg/L Total nitrogen as N, mg/L Total organic nitrogen as N, mg/L Total ammonia nitrogen as N, mg/L Total nitrite nitrogen as N, mg/L Total nitrate nitrogen as N, mg/L
Bacteriological: Coliform, multiple-tube method, MPN, col/100 mL
Fecal coliform, multiple-tube method,MPN, col/100 mL Coliform, membrane- filter method,col/100 mL
Fecal coliform, membrane-filtermethod, col/100 mL
Trace elements:JLLJUd_I_ dl. OC11JLC. dO r_ y Ug/ 1-j
Total copper as Cu, ug/L Total lead as Pb, ug/L JLU Ud_L .jJLIlL. do t.11 y **o/ *-*
Total mercury as Hg, ug/L
Base flow
Number°f A I/ Average-
measure ments
2 0.17
3 2.3
4 2.1 3 38
2 12
4 .12 4 .08 3 2.1 4 1.1 4 .32 4 .02 4 .28
2 6.8xl04
2 1.4xl04
1 1
2 12 1 20
Minimum Maximum
0.12 0.22
2.0 3.0
.30 4.3 27 44
10 15
.02 .27
.02 .20 1.2 3.2 .33 1.6 .04 1.1 .01 .05 .09 .50
6.5xl03 1.3xl05
2.6xl03 2.5xl04
12 12
Represents single value where only one measurement was made.2/ Median concentration.
20
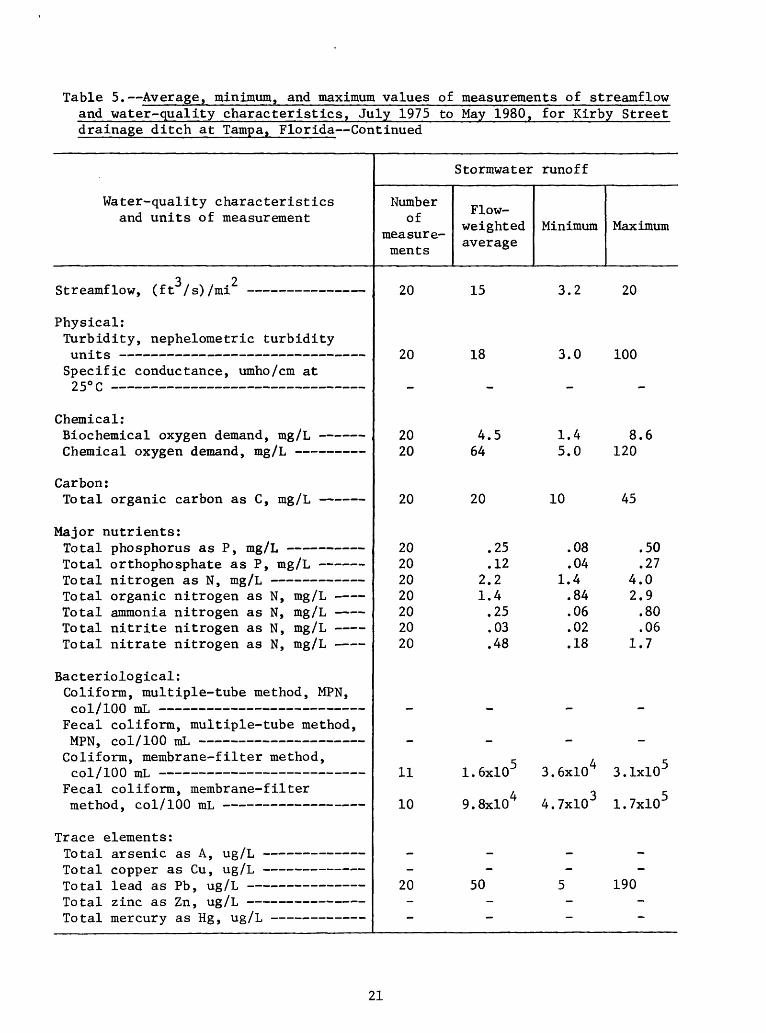
Table 5. Average, minimum, and maximum values of measurements of streamflow and water-quality characteristics, July 1975 to May 1980, for Kirby Street drainage ditch at Tampa, Florida Continued
Water-quality characteristics and units of measurement
Stormwater runoff
Numberof
measure ments
Flow- weighted average
Minimum Maximum
Streamflow, (ft3/s)/mi2 20
Physical: Turbidity, nephelometric turbidityunits 20 Specific conductance, umho/cm at 25° C
Chemical:Biochemical oxygen demand, mg/L 20 Chemical oxygen demand, mg/L 20
Carbon: Total organic carbon as C, mg/L 20
Major nutrients:Total phosphorus as P, mg/L 20Total orthophosphate as P, mg/L 20Total nitrogen as N, mg/L 20Total organic nitrogen as N, mg/L 20Total ammonia nitrogen as N, mg/L 20Total nitrite nitrogen as N, mg/L 20Total nitrate nitrogen as N, mg/L 20
Bacteriological: Coliform, multiple-tube method, MPN,col/100 mL
Fecal colifora, multiple-tube method,MPN, col/100 mL Coliform, membrane-filter method,col/100 mL 11
Fecal coliform, membrane-filtermethod, col/100 mL 10
Trace elements:Total arsenic as A, ug/L Total copper as Cu, ug/L Total lead as Pb, ug/L 20 Total zinc as Zn, ug/L Total mercury as Hg, ug/L
15
18
4.564
20
.25
.122.21.4 .25 .03 .48
50
3.2 20
3.0 100
1.4 5.0
10
.08
.04 1.4 .84 .06 .02 .18
8.6120
45
.50
.274.02.9 .80 .06
1.7
1.6xl05 3.6xl04 3.1xl05
9.8xl04 4.7xl03 1.7xl05
190
21
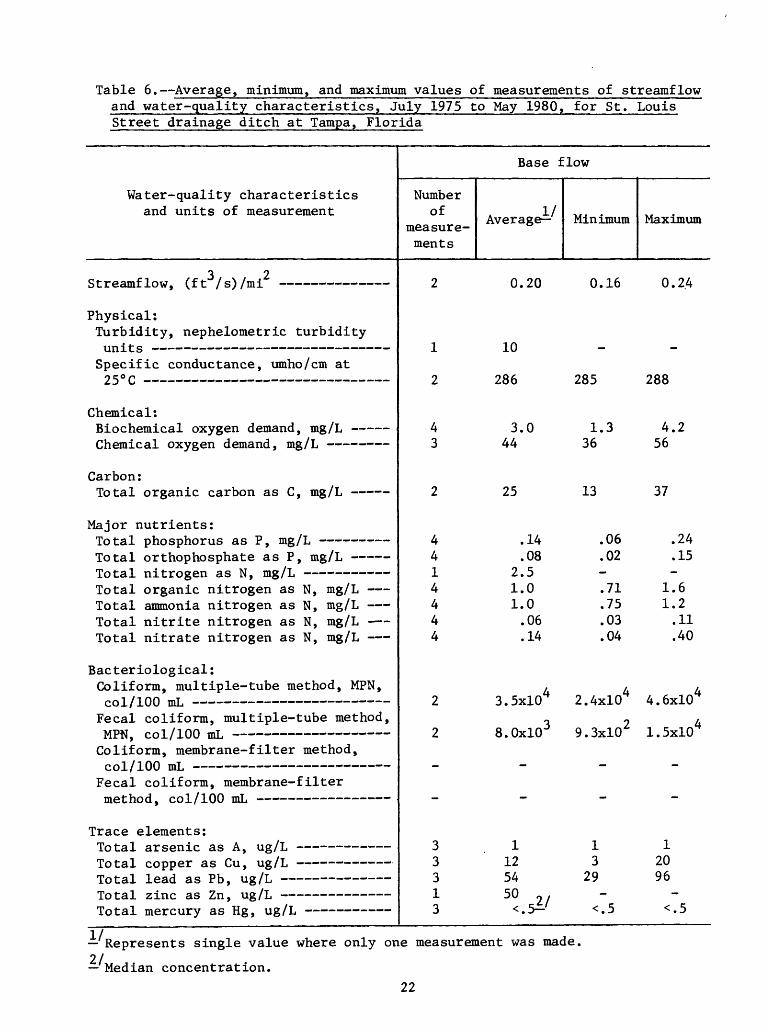
Table 6. Average, minimum, and maximum values of measurements of streamflowand water-quality characteristics, July 1975 to May 1980, for St.Street drainage ditch at Tampa, Florida
Water-quality characteristics and units of measurement
3 2Streamflow, (ft /s)/mi
Physical: Turbidity, nephelometric turbidity
Specific conductance, umho/cm at9S°r __ ____________________________ ____ _ _
Chemical:Biochemical oxygen demand, mg/L Chemical oxygen demand, mg/L -----
Carbon: Total organic carbon as C, mg/L
Major nutrients:Total phosphorus as P, mg/L Total orthophosphate as P, mg/L Total nitrogen as N, mg/L - Total organic nitrogen as N, mg/L Total ammonia nitrogen as N, mg/L Total nitrite nitrogen as N, mg/L Total nitrate nitrogen as N, mg/L
Bacteriological : Coliform, multiple-tube method, MPN,col/100 mL
Fecal coliform, multiple-tube method,MPN, col/100 mL Coliform, membrane-filter method,col/ 100 mL
Fecal coliform, membrane- filtermethod, col/100 mL
Trace elements:J-(J LctX dL ocil-Lt- do rij Ug/ "
Total copper as Cu, ug/L Total lead as Pb, ug/L Total zinc as Zn, ug/L Total mercury as Hg, ug/L
Louis
Base flow
Numberof . I/ ....
Average Minimum measure-ments
2 0.20 0.16
1 10
2 286 285
4 3.0 1.3 3 44 36
2 25 13
4 .14 .06 4 .08 .02 1 2.5 4 1.0 .71 4 1.0 .75 4 .06 .03 4 .14 .04
2 3.5xl04 2.4xl04
2 S.OxlO3 9.3xl02
311 3 12 3 3 54 29 1 50 . 3 <.5^-/ <.5
Maximum
0.2.4
288
4.2 56
37
.24
.15
1.6 1.2 .11 .40
4.6xl04
1.5xl04
1 20 96
<.5
II21Represents single value where only one measurement was made.
Median concentration.
22
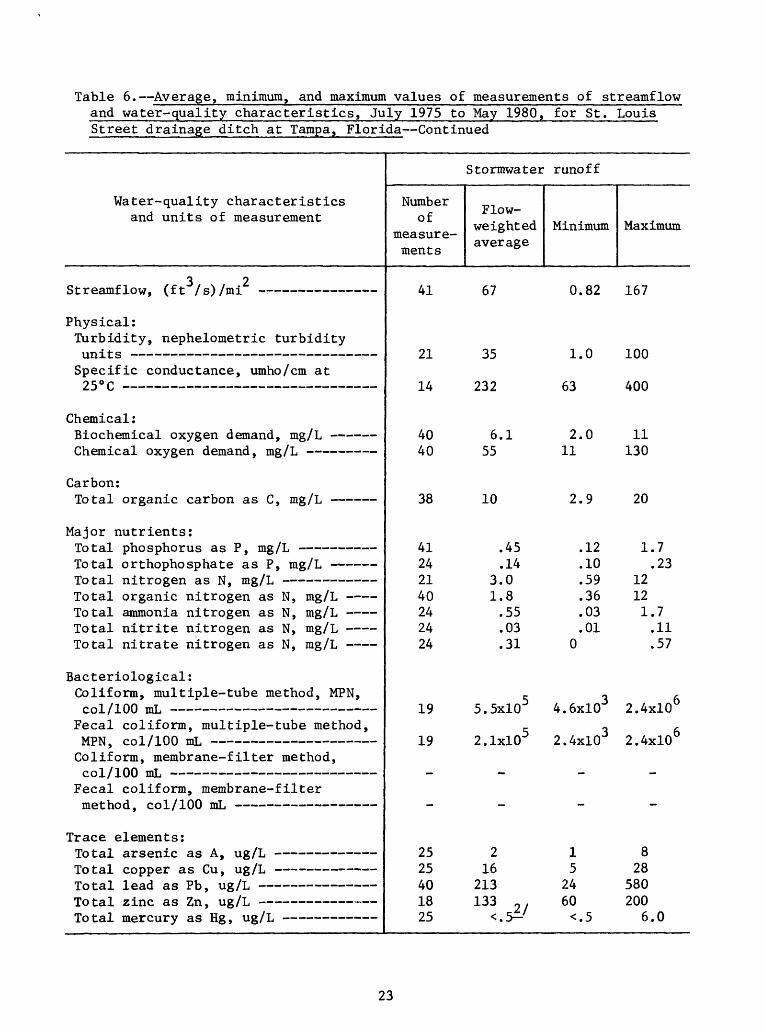
Table 6. Average, minimum, and maximum values of measurements of streamflow and water-quality characteristics, July 1975 to May 1980, for St. Louis Street drainage ditch at Tampa, Florida Continued
Stormwater runoff
Water-quality characteristics and units of measurement
3 2Sl-r-»amf 1 nu ffl- /eWtn-i - _
Number of
measure ments
AT
Flow- weighted average
A7
Minimum
n ft?
Maximum
1 A7
Physical:Turbidity, nephelometric turbidity
Specific conductance, umho/cm ato *° r ________________________________
Chemical:Biochemical oxygen demand, mg/L Chemical oxygen demand, mg/L
Carbon:JLU UdJ- \J i. gCtLlX^ i^cLJ- \J\JLL CtO O 9 iilg / J_j
Major nutrients:Total phosphorus as P, mg/L Total orthophosphate as P, mg/L Total nitrogen as N, mg/L Total organic nitrogen as N, mg/L Total ammonia nitrogen as N, mg/L Total nitrite nitrogen as N, mg/L Total nitrate nitrogen as N, mg/L
Bacteriological :Coliform, multiple-tube method, MPN,col/100 mL
Fecal coliform, multiple- tube method,MPN, col/100 mL Coliform, membrane- filter method,col/100 mL
Fecal coliform, membrane-filtermethod, col/ 100 mL
Trace elements:
Total copper as Cu, ug/L
Total zinc as Zn, ug/L ~ Total mercury as Hg, ug/L
21
14
4040
38
41242140242424
19
19
-
2525401825
35
232
6.155
10
.45
.143.01.8.55.03.31
,.5.5x10^
r2.1x10
-
216
213133 2/
<.5-
1.0 100
f r\ t f\(\63 400
2.0 1111 130
2.9 20
.12 1.7
.10 .23
.59 12
.36 12
.03 1.7
.01 .110 .57
« fi4.6x10 2.4x10
~ fi2.4x10 2.4x10
-
1 85 28
24 58060 200<.5 6.0
23
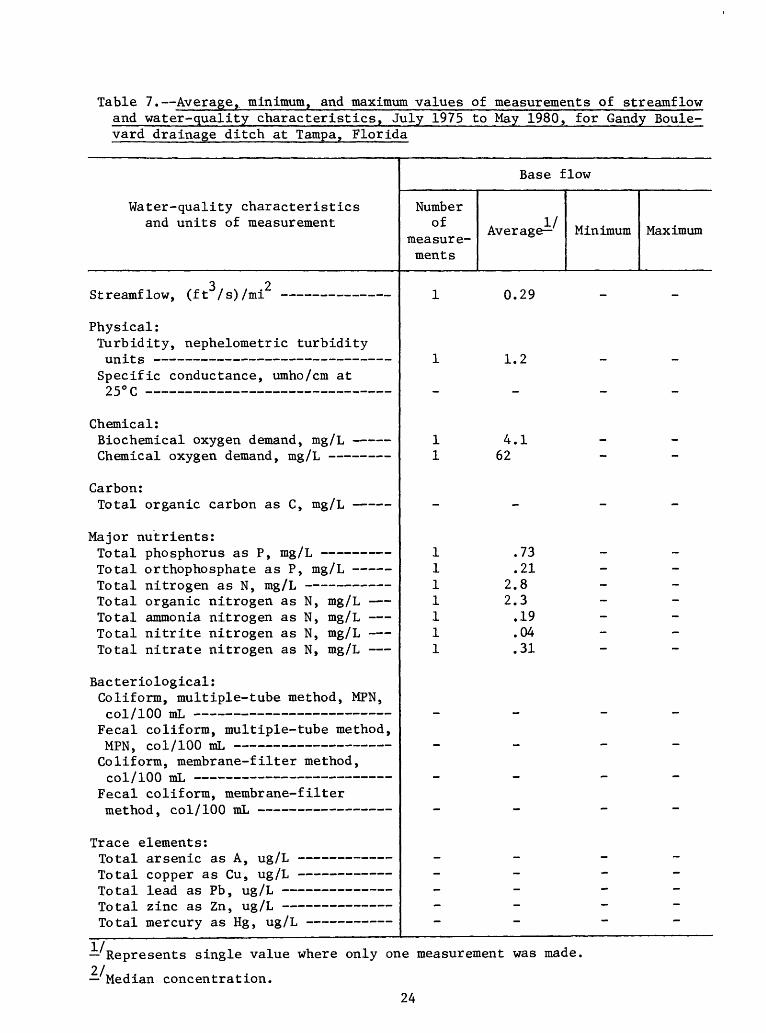
Table 7. Average,, minimum, and maximum values of measurements of streamflow and water-quality characteristics, July 1975 to May 1980, for Gandy Boule vard drainage ditch at Tampa, Florida
Water-quality characteristics and units of measurement
3 .2
Base flow
Number of
measurements
Average- Minimum Maximum
i n 9Q _ _
Physical:Turbidity, nephelometric turbidity units Specific conductance, umho/cm at 25° C
Chemical:Biochemical oxygen demand, mg/L ----- Chemical oxygen demand, mg/L
Carbon: Total organic carbon as C, mg/L
Major nutrients:Total phosphorus as P, mg/L Total orthophosphate as P, mg/L Total nitrogen as N, mg/L Total organic nitrogen as N, mg/L Total ammonia nitrogen as N, mg/L Total nitrite nitrogen as N, mg/L Total nitrate nitrogen as N, mg/L
Bacteriological:Coliform, multiple-tube method, MPN, col/100 mL
Fecal coliform, multiple-tube method, MPN, col/100 mL Coliform, membrane-filter method, col/100 mL
Fecal coliform, membrane-filter method, col/100 mL
Trace elements:Total arsenic as A, ug/L Total copper as Cu, ug/L Total lead as Pb, ug/L Total zinc as Zn, ug/L Total mercury as Hg, ug/L
1.2
4.162
.73
.212.82.3 .19 .04 .31
Represents single value where only one measurement was made,2/ Median concentration.
24
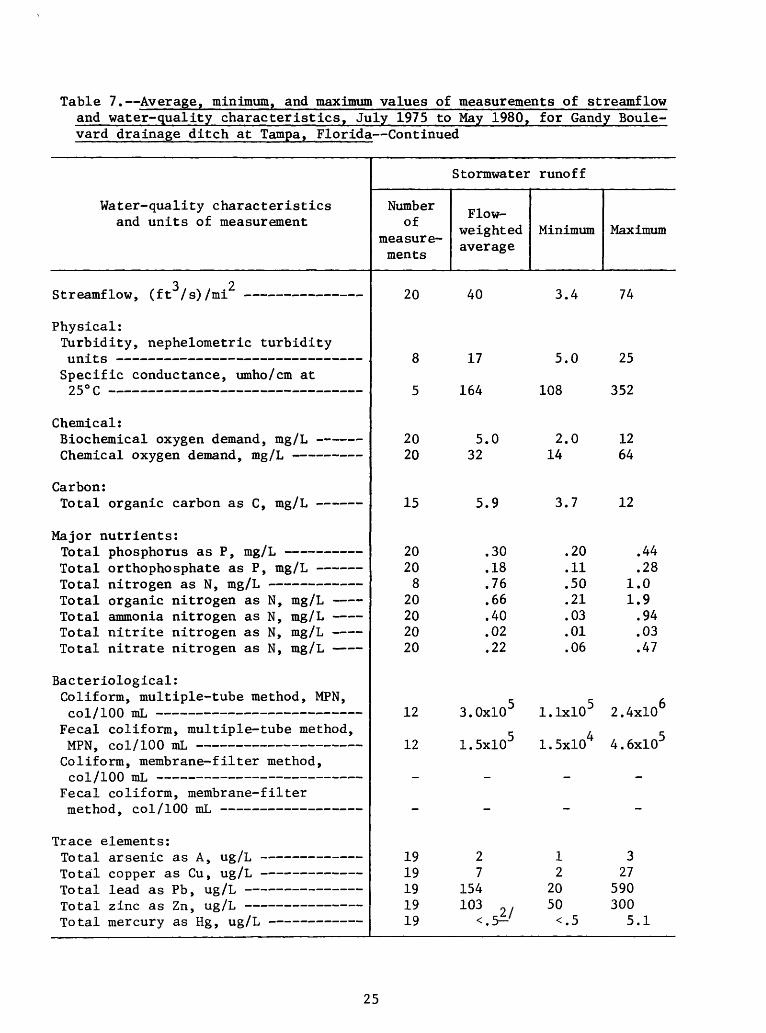
Table 7. Average, minimum, and maximum values of measurements of streamflowand water-quality characteristics, July 1975 to May 1980, for Gandy Boule-vard drainage ditch at Tampa, Florida Continued
Water-quality characteristics and units of measurement
3 ? Streamflow, (ft /s)/mi
Physical: Turbidity, nephelometric turbidity
Specific conductance, umho/cm at
Chemical: Biochemical oxygen demand, mg/L Chemical oxygen demand, mg/L
Carbon: Total organic carbon as C, mg/L
Major nutrients:Total phosphorus as P, mg/L Total orthophosphate as P, mg/L Total nitrogen as N, mg/L Total organic nitrogen as N, mg/L Total ammonia nitrogen as N, mg/L Total nitrite nitrogen as N, mg/L Total nitrate nitrogen as N, mg/L
Bacteriological : Coliform, multiple-tube method, MPN, col/ 100 mL
Fecal coliform, multiple- tube method,MPN, col/ 100 mL Coliform, membrane- filter method, col/100 mL
Fecal coliform, membrane- filtermethod, col/100 mL
Trace elements:
Total copper as Cu, ug/L Total lead as Pb, ug/L Total zinc as Zn, ug/L Total mercury as Hg, ug/L
Stormwater runoff
Number of
measure ments
20
8
5
20 20
15
20 20 8
20 20 20 20
12
12
19 19 19 19 19
Flow- weighted Min: average
imum Maximum
40 3.4 74
17 5.0 25
164 108 352
5.0 2.0 12 32 14 64
5.9 3.7 12
.30 .20 .44
.18 .11 .28
.76 .50 1.0
.66 .21 1.9
.40 .03 .94
.02 .01 .03
.22 .06 .47
3.0xl05 l.lxlO5 2.4xl06
1.5xl05 l.SxlO4 4.6xl05
213 7 2 27
154 20 590 103 9/ 50 300
<.5^-' <.5 5.1
25
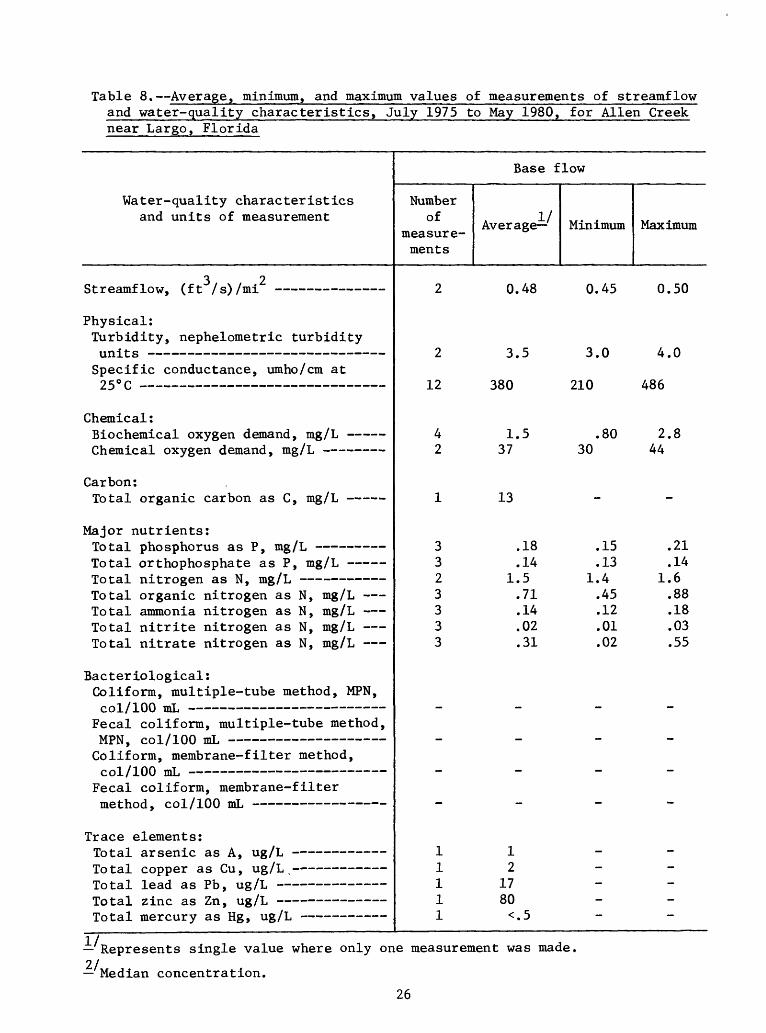
Table 8. Average, minimum, and maximum values of measurements of streamflowand water-quality characteristics, July 1975 to May 1980near Largo, Florida
Water-quality characteristics and units of measurement
3 2Streamflow, (ft /s)/mi
Physical: Turbidity, nephelometric turbidity
Specific conductance, umho/cm at 9S°r - _ _ _ _ _ _ _ _ _
Chemical:Biochemical oxygen demand, mg/L Chemical oxygen demand, mg/L
Carbon:Total organic carbon as C, mg/L
Major nutrients:Total phosphorus as P, mg/L Total orthophosphate as P, mg/L Total nitrogen as N, mg/L Total organic nitrogen as N, mg/L Total ammonia nitrogen as N, mg/L Total nitrite nitrogen as N, mg/L Total nitrate nitrogen as N, mg/L
Bacteriological : Coliform, multiple-tube method, MPN, col/100 mL
Fecal coliform, multiple-tube method,MPN, col/100 mL Coliform, membrane-filter method, col/100 mL
Fecal coliform, membrane-filtermethod, col/100 mL
Trace elements:1O Uci_L ciJu ScIl-LC do £\ 9 Ug/ Lt
Total copper as Cu, ug/L, Total lead as Pb, ug/L louaj. /sine as £n, ug/Lilouax mercury a.s ng, ug/ij
, for Alien Creek
Base flow
Numberof . I/
Average- measure-ments
2 0.48
2 3.5
12 380
4 1.5 2 37
1 13
3 .18 3 .14 2 1.5 3 .71 3 .14 3 .02 3 .31
1 1 1 2 1 17 1 80 1 <.5
Minimum Maximum
0.45 0.50
3.0 4.0
210 486
.80 2.8 30 44
.15 .21
.13 .14 1.4 1.6 .45 .88 .12 .18 .01 .03 .02 .55
Represents single value where only one measurement was made,2/ Median concentration.
26
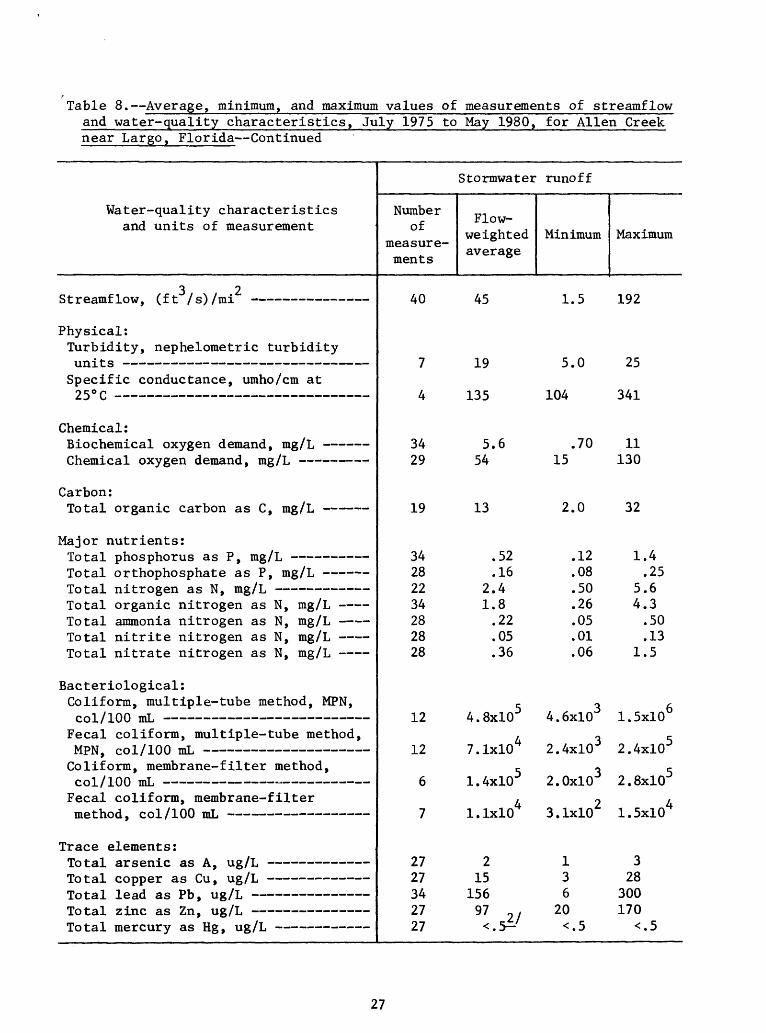
Table 8. Average, minimum, and maximum values of measurements of streamflowand water-quality characteristics, July 1975 tonear Largo, Florida Continued
Water-quality characteristics and units of measurement
3 2Streamflow, (ft /s)/mi
Physical: Turbidity, nephelometric turbidity
Specific conductance, umho/cm at?S°r _______ _ _ _____ _______________
Chemical: Biochemical oxygen demand, mg/L Chemical oxygen demand, mg/L
Carbon: Total organic carbon as C, mg/L
Major nutrients:Total phosphorus as P, mg/L Total orthophosphate as P, mg/L X(J LdJ. L1_LLJ. (JgcLI do IN y U*&/ -Li
Total organic nitrogen as N, mg/L Total ammonia nitrogen as N, mg/L Total nitrite nitrogen as N, mg/L Total nitrate nitrogen as N, mg/L
Bacteriological: Coliform, multiple-tube method, MPN, col/ 100 mL
Fecal coliform, multiple- tube method,MPN, co I/ 100 mL Coliform, membrane-filter method,
Fecal coliform, membrane- filtermethod, col/ 100 mL
Trace elements:HJ LdJ. cti.oc:m.V> do i\, u.g/ Lj
Total copper as Cu, ug/L Total lead as Pb, ug/L
Total mercury as Hg, ug/L
May 1980, for Alien Creek
Stormwater runoff
Number of
measure ments
40
7
4
34 29
19
34 28 22 34 28 28 28
12
12
6
7
27 27 34 27 27
Flow- weighted average
45
19
135
5.654
13
.52
.16 2.4 1.8 .22 .05 .36
4.8xl05
7.1xl04
1.4xl05
l.lxlO4
2 15
1569U'
Minimum
1.5
5.0
104
.70 15
2.0
.12
.08
.50
.26
.05
.01
.06
4.6xl03
2.4xl03
2.0xl03
3.1xl02
1 3 6
20 <.5
Maximum
192
25
341
11 130
32
1.4 .25
5.6 4.3 .50 .13
1.5
1.5xl06
2.4xl05
2.8xl05
1.5xl04
3 28
300 170
<.5
27
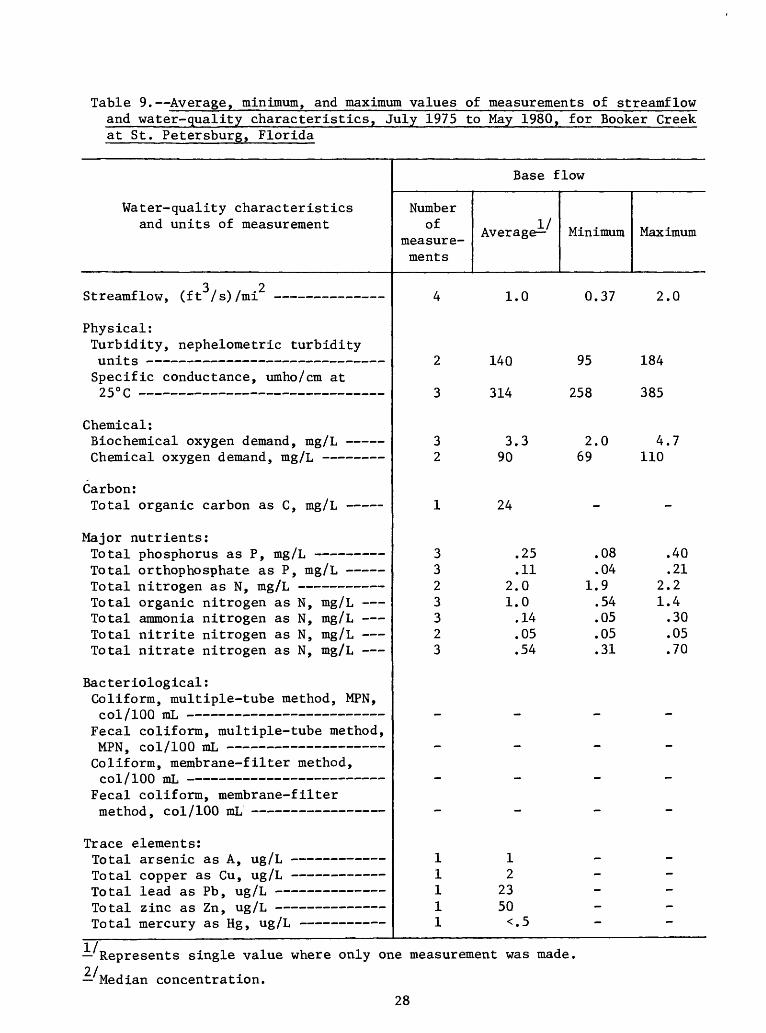
Table 9. Average, minimum, and maximum values of measurements of streamflow and water-quality characteristics, July 1975 to May 1980, for Booker Creek at St. Petersburg, Florida
Water-quality and units of
3St-TPflTTlf 1 OT.T fft- 1 <Z\
characteristics measurement
/ -i 2 _ _ _
Base flow
Number of
measurements
Average- Minimum Maximum
A in n *? 9 n
Physical:Turbidity, nephelometric turbidity unit s - Specific conductance, umho/cm at 25° C -
2 140 95 184
3 314 258 385
Chemical:Biochemical oxygen demand, mg/L Chemical oxygen demand, mg/L
Carbon: Total organic carbon as C, mg/L
Major nutrients:Total phosphorus as P, mg/L Total orthophosphate as P, mg/L
Total organic nitrogen as N, mg/L Total ammonia nitrogen as N, mg/L Total nitrite nitrogen as N, mg/L Total nitrate nitrogen as N, mg/L
Bacteriological : Coliform, multiple-tube method, MPN, col/100 mL
Fecal coliform, multiple-tube method,MPN, col/100 mL Coliform, membrane-filter method, col/ 100 mL
Fecal coliform, membrane-filtermethod, col/100 mL
Trace elements:J.U Lct_L cLL oCllJLL. do «. j Ug/ J-i
Total copper as Cu, ug/L 1(_> Ld-L -LCdU. do I. \J , Ug/J-i
i\J Lct-L Z>JLill~ do fjLl , Ug/J-i
Total mercury as Hg, ug/L
3 2
1
3 3 2 3 3 2 3
1 1 1 1 1
3.3 2.0 4.7 90 69 110
24 - -
.25 .08 .40
.11 .04 .21 2.0 1.9 2.2 1.0 .54 1.4 .14 .05 .30 .05 .05 .05 .54 .31 .70
1 - 2 -
23 - 50 - <.5
Represents single value where only one measurement was made,21 Median concentration.
28
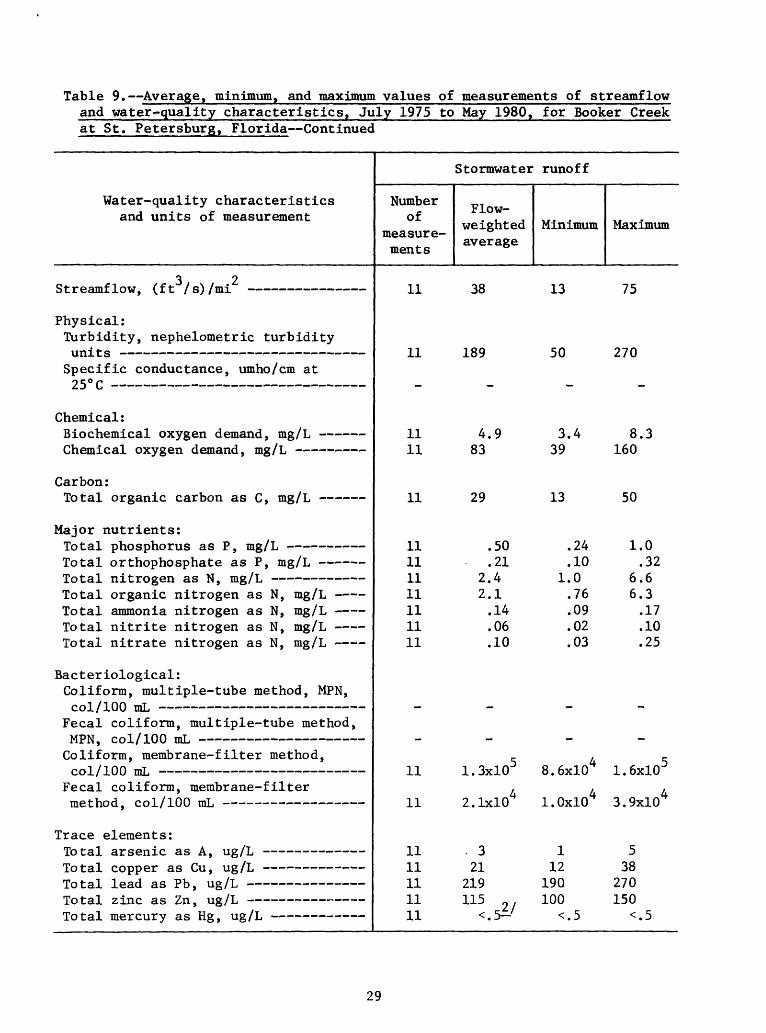
Table 9. Average, minimum, and maximum values of measurements of streamflow and water-quality characteristics, July 1975 to May 1980, for Booker Creek at St. Petersburg, Florida Continued
Water-quality characteristics and units of measurement
i 2CH-r-oamf 1 nw fff / cWm-f - _
Number of
measure ments
1 i
Stormwater
Flow- weighted average
ift
runoff
Minimum
11
Maximum
i^
Physical: Turbidity, nephelometric turbidity
Specific conductance, umho/cm at
Chemical: Biochemical oxygen demand, mg/L Chemical oxygen demand, mg/L
Carbon: Total organic carbon as C, mg/L
Major nutrients:Total phosphorus as P, mg/L Total orthophosphate as P, mg/L Total nitrogen as N, mg/L Total organic nitrogen as N, mg/L Total ammonia nitrogen as N, mg/L Total nitrite nitrogen as N, mg/L Total nitrate nitrogen as N, mg/L
Bacteriological: Coliform, multiple-tube method, MPN, col/100 mL
Fecal coliform, multiple-tube method, MPN, col/ 100 mL Coliform, membrane-filter method, col/100 mL
Fecal coliform, membrane-filtermethod, col/100 mL
Trace elements:J.U L.CLJ. CLJL OC.i.lJ-1* CL& ^-9 *"^o'
Total copper as Cu, ug/L
Total zinc as Zn, ug/L Total mercury as Hg, ug/L
-L.L
11 11
11
11 11 11 11 11 11 11
11
11
11 11 11 11 11
J.O:7 JV £.I\J
4.9 3.4 8.3 83 39 160
29 13 50
.50 .24 1.0
.21 .10 .32 2.4 1.0 6.6 2.1 .76 6.3 .14 .09 .17 .06 .02 .10 .10 .03 .25
1.3xl05 8.6xl04 1.6xl05
2.1xl04 l.OxlO4 3.9xl04
.3 1 5 21 12 38
219 190 270 115 2/ 100 150
29
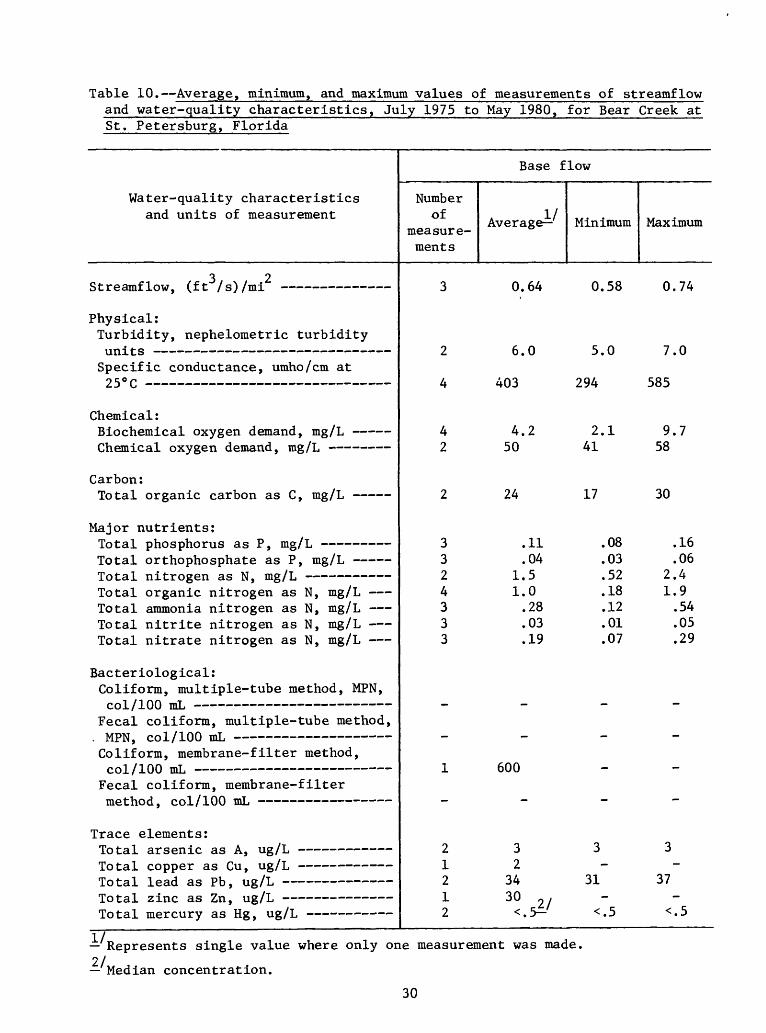
Table 10. Average, minimum, and maximum values of measurements of streamflow and water-quality characteristics, July 1975 to May 1980, for Bear Creek at St. Petersburg, Florida
Water-quality and units of
3Qf-voatnf 1 r»T.T f f 1- / a\
characteristics measurement
Base flow
Number of
measurements
Average- Minimum Maximum
^ n f*L n s« n ~IL
Physical: Turbidity, nephelometric turbidity
Specific conductance, umho/cm at
Chemical :Biochemical oxygen demand, mg/L Chemical oxygen demand, mg/L
Carbon: Total organic carbon as C, mg/L
Major nutrients:Total phosphorus as P, mg/L Total orthophosphate as P, mg/L Total nitrogen as N, mg/L Total organic nitrogen as N, mg/L Total ammonia nitrogen as N, mg/L Total nitrite nitrogen as N, mg/L Total nitrate nitrogen as N, mg/L
Bacteriological: Coliform, multiple-tube method, MPN,col/100 mL
Fecal coliform, multiple-tube method,. MPN, col/100 mL Coliform, membrane-filter method,col/100 mL
Fecal coliform, membrane-filtermethod, col/100 mL
Trace elements:JUJ UdJ. O.L ocllJLL. do A, 'Jif> / J-<
Total copper as Cu, ug/L Total lead as Pb, ug/L Total zinc as Zn, ug/L Total mercury as Hg, ug/L
<£.
4
4 2
2
3 3 2 4 3 3 3
1
2 1 2 1 2
O.U J.W / . W
403 294 585
4.2 2.1 9.7 50 41 58
24 17 30
.11 .08 .16
.04 .03 .06 1.5 .52 2.4 1.0 .18 1.9 .28 .12 .54 .03 .01 .05 .19 .07 .29
600
333 2 - -
34 31 3730 21
Represents single value where only one measurement was made.
Median concentration.
30
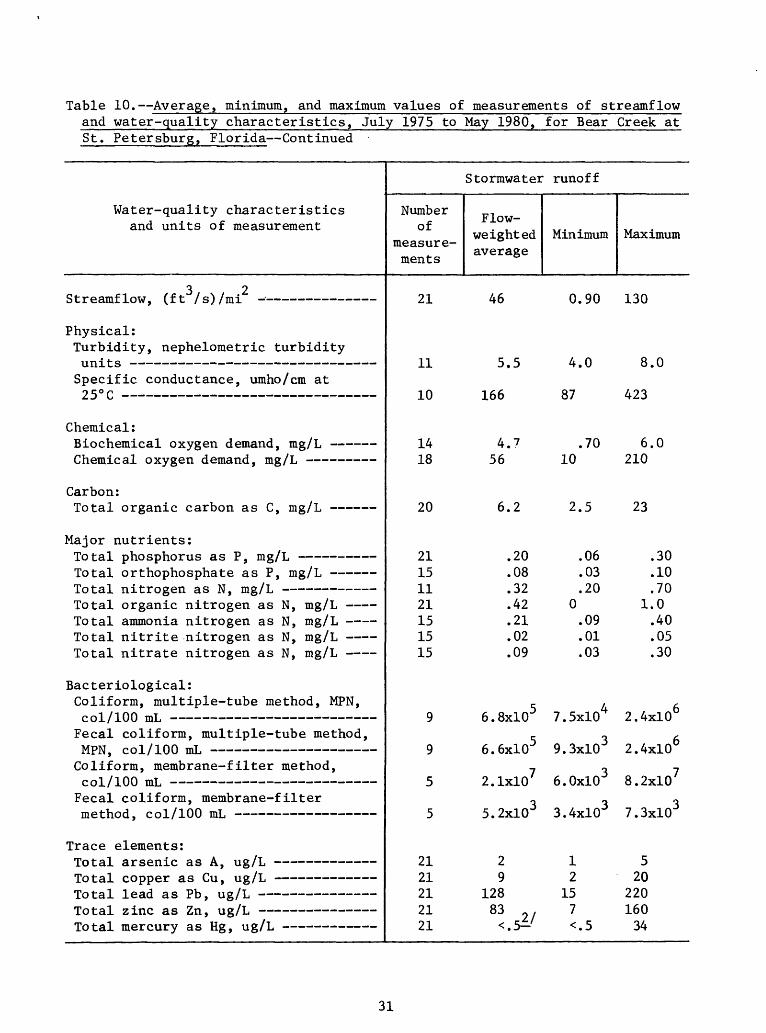
Table 10. Average, minimum, and maximum values of measurements of streamflow and water-quality characteristics, July 1975 to May 1980, for Bear Creek at St. Petersburg, Florida Continued
Water-quality characteristics and units of measurement
Stormwater runoff
Numberof
measure ments
Flow- weighted average
Minimum Maximum
3 2 Streamflow, (ft /s)/mi - 21
Physical: Turbidity, nephelometric turbidityunits 11Specific conductance, umho/cm at25°C 10
Chemical:Biochemical oxygen demand, mg/L 14 Chemical oxygen demand, mg/L 18
Carbon: Total organic carbon as C, mg/L 20
Major nutrients:Total phosphorus as P, mg/L 21Total orthophosphate as P, mg/L 15Total nitrogen as N, mg/L 11Total organic nitrogen as N, mg/L 21Total ammonia nitrogen as N, mg/L 15Total nitrite nitrogen as N, mg/L 15Total nitrate nitrogen as N, mg/L 15
Bacteriological: Coliform, multiple-tube method, MPN,col/100 mL 9 Fecal coliform, multiple-tube method,MPN, col/100 mL 9 Coliform, membrane-filter method,col/100 mL 5 Fecal coliform, membrane-filtermethod, col/100 mL 5
Trace elements: Total arsenic as A, ug/L 21 Total copper as Cu, ug/L 21 Total lead as Pb, ug/L 21 Total zinc as Zn, ug/L 21 Total mercury as Hg, ug/L 21
46
5.5
166
4.756
6.2
.20
.08
.32
.42
.21
.02
.09
0.90 130
4.0
87
.7010
2.5
.06
.03
.200.09 .01 .03
29
12883
12
157
8.0
423
6.0210
23
.30
.10
.70 1.0 .40 .05 .30
6.8xl05 7.5xl04 2.4xl06
6.6xl05 9.3xl03 2.4xl06
2.1xl07 6.0xl03 8.2xl07
5.2xl03 3.4xl03 7.3xl03
520
22016034
31
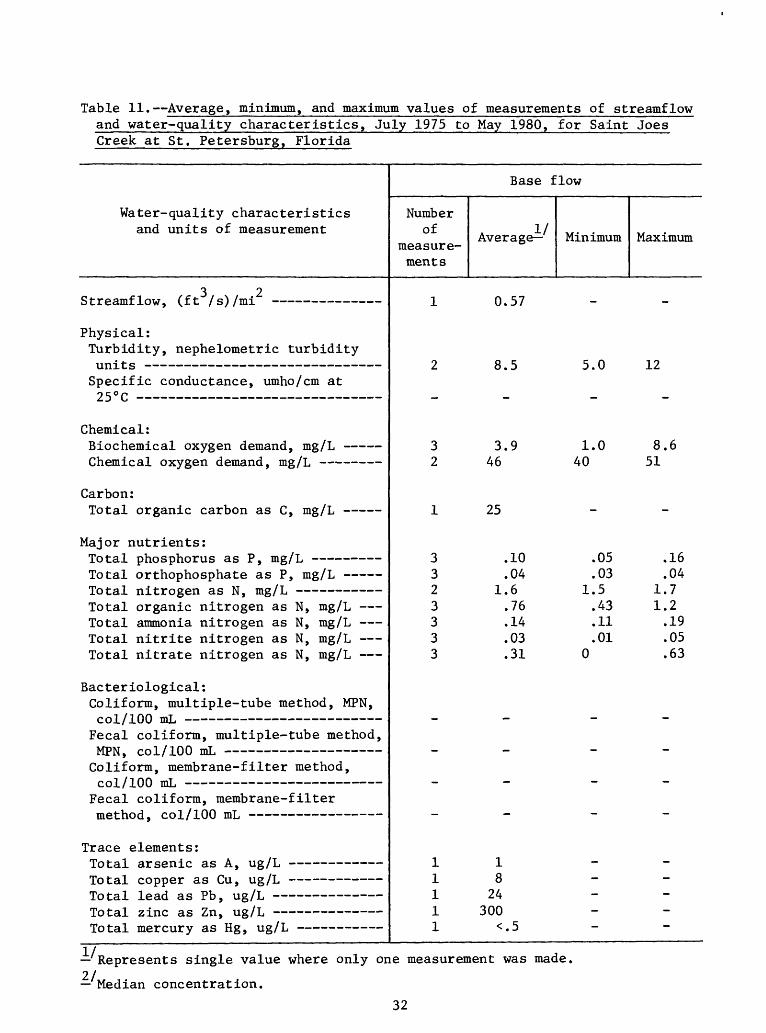
Table 11. Average, minimum, and maximum values of measurements of streamflow and water-quality characteristics, July 1975 to May 1980, for Saint Joes Creek at St. Petersburg, Florida
Water-quality characteristics and units of measurement
3 2
Number of
measurements
i
Base f
Average
n =;?
low
Minimum Maximum
Physical:Turbidity, nephelometric turbidity units - Specific conductance, umho/cm at 25°C -
8.5 5.0 12
Chemical: Biochemical oxygen demand, mg/L Chemical oxygen demand, mg/L -------
Carbon: Total organic carbon as C, mg/L -
Major nutrients:Total phosphorus as P, mg/L Total orthophosphate as P, mg/L Total nitrogen as N, mg/L Total organic nitrogen as N, mg/L Total ammonia nitrogen as N, mg/L Total nitrite nitrogen as N, mg/L - Total nitrate nitrogen as N, mg/L
Bacteriological: Coliform, multiple- tube method, MPN, col/100 mL
Fecal coliform, multiple- tube method,MPN, col/100 mL Coliform, membrane-filter method, col/100 mL
Fecal coliform, membrane- filtermethod, col/100 mL
Trace elements:1O LctJ. cii ofciil-H- do rl j Ug/ ij ""
Total copper as Cu, ug/L Total lead as Pb, ug/L 1U Ud-L & J.J.J.U. do l-ill) ***£>/ J-J
Total mercury as Hg, ug/L
3 3.92 46
1 25
3 .10 3 .04 2 1.6 3 .76 3 .14 3 .03 3 .31
1 1 1 8 1 24 1 300 1 <.5
1.0 8.6 40 51
.05 .16
.03 .04 1.5 1.7 .43 1.2 .11 .19 .01 .05
0 .63
Represents single value where only one measurement was made,21 Median concentration.
32
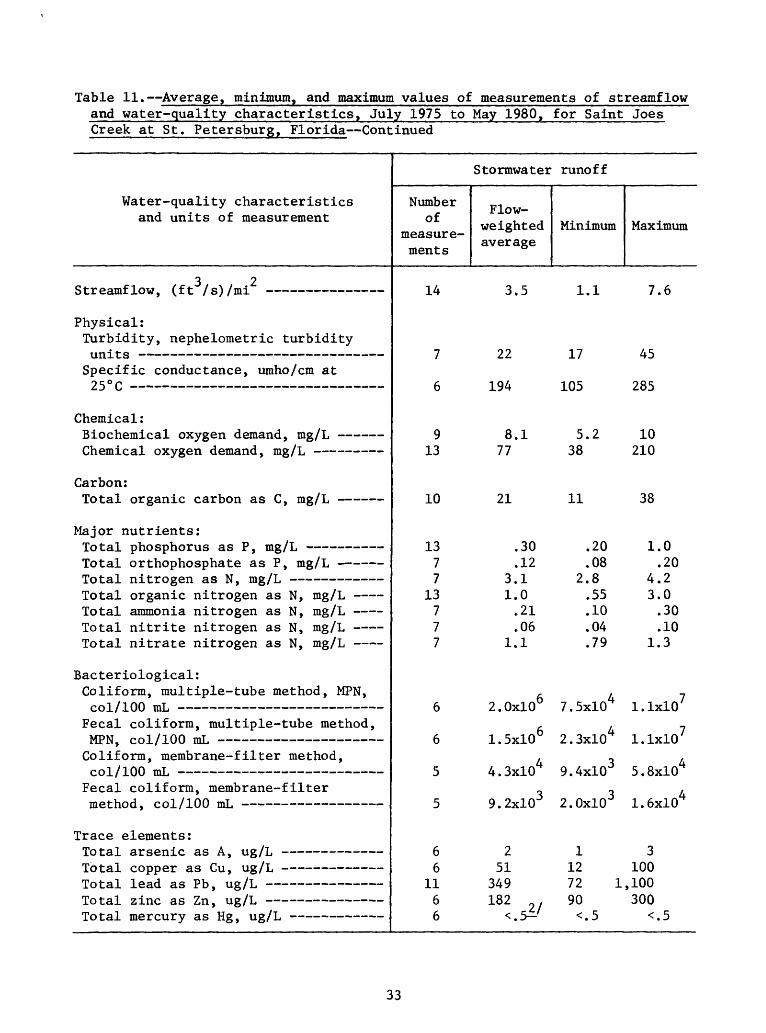
Table 11. Average, minimum, and maximum values of measurements of streamflow and water-quality characteristics, July 1975 to May 1980, for Saint Joes Creek at St. Petersburg, Florida Continued
Water-quality characteristics and units of measurement
Stormwater runoff
Numberof
measure ments
Flow- weighted average
Minimum Maximum
Streamflow, (ft3/s)/mi2 14
Physical: Turbidity, nephelometric turbidityunits 7 Specific conductance, umho/cm at 25 °C 6
Chemical:Biochemical oxygen demand, mg/L 9 Chemical oxygen demand, mg/L 13
Carbon: Total organic carbon as C, mg/L 10
Major nutrients:Total phosphorus as P, mg/L 13Total orthophosphate as P, mg/L 7Total nitrogen as N, mg/L 7Total organic nitrogen as N, mg/L 13Total ammonia nitrogen as N, mg/L 7Total nitrite nitrogen as N, mg/L 7Total nitrate nitrogen as N, mg/L 7
Bacteriological: Coliform, multiple-tube method, MPN,col/100 mL 6
Fecal coliform, multiple-tube method,MPN, col/100 mL 6 Coliform, membrane-filter method,col/100 mL 5
Fecal coliform, membrane-filtermethod, col/100 mL 5
Trace elements: Total arsenic as A, ug/L 6 Total copper as Cu, ug/L 6 Total lead as Pb, ug/L 11 Total zinc as Zn, ug/L 6 Total mercury as Hg, ug/L 6
3.5 1.1 7.6
22
194
8.177
21
.30
.12 3.11.0 .21 .06
1.1
17
105
5.238
11
.20
.08 2.8 .55 .10 .04 .79
45
285
10210
38
1.0 .20
4.23.0 .30 .10
1.3
2.0xl06 7.5xl04 l.lxlO7
1.5xl06 2.3xl04 l.lxlO7
4.3xl04 9.4xl03 5.8xl04
9.2xl03 2.0xl03 1.6xl04
251
349182
1127290
3100
1,100300
33
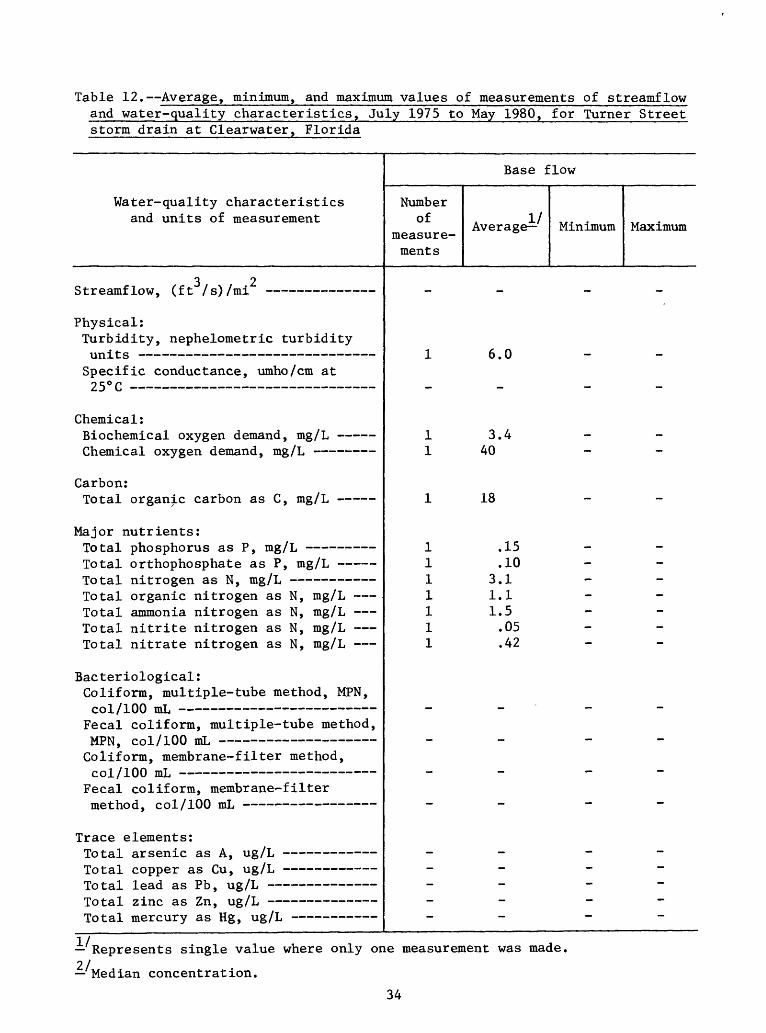
Table 12. Average, minimum, and maximum values of measurements of streamflow and water-quality characteristics, July 1975 to May 1980, for Turner Street storm drain at Clearwater, Florida
Water-quality and units of
3Qf-T-oam-Fl r»T.r (fir 1 o^
characteristics measurement
!^ 2 - _--_-__--_
Number of
measurements
Base f
Average-
low
Minimum Maximum
Physical:Turbidity, nephelometric turbidity units Specific conductance, umho/cm at
Chemical:Biochemical oxygen demand, mg/L Chemical oxygen demand, mg/L
Carbon: Total organic carbon as C, mg/L
Major nutrients:Total phosphorus as P, mg/L Total orthophosphate as P, mg/L Total nitrogen as N, mg/L Total organic nitrogen as N, mg/L Total ammonia nitrogen as N, mg/L Total nitrite nitrogen as N, mg/L Total nitrate nitrogen as N, mg/L
Bacteriological: Colifora, multiple-tube method, MPN,col/100 mL
Fecal coliform, multiple-tube method,MPN, col/100 mL Coliform, membrane-filter method,col/100 mL
Fecal coliform, membrane-filtermethod, col/100 mL
Trace elements:Total arsenic as A, ug/L Total copper as Cu, ug/L Total lead as Pb, ug/L Total zinc as Zn, ug/L Total mercury as Hg, ug/L
6.0
3.440
18
.15
.103.11.11.5
.05
.42
Represents single value where only one measurement was made,21 Median concentration.
34
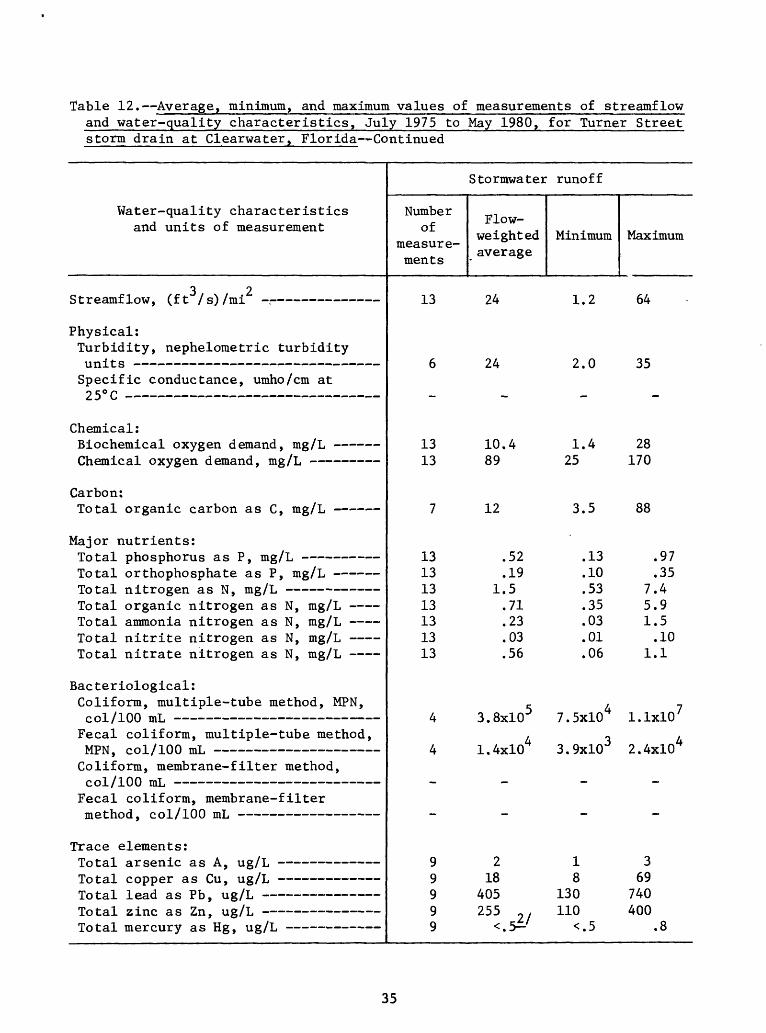
Table 12. Average, minimum, and maximum values of measurements of streamflow and water-quality characteristics, July 1975 to May 1980, for Turner Street storm drain at Clearwater, Florida Continued
Stormwater runoff
Water-quality characteristics and units of measurement
3 2
Number of
measure ments
T*
Flow- weighted average
9A
Minimum
1 9
Maximum
AA
Physical: Turbidity, nephelometric turbidityU Ll-L L 0
Specific conductance, umho/cm at9 S° P _ _ _ _ _ ___ __ _ _
Chemical:Biochemical oxygen demand, mg/L Chemical oxygen demand, mg/L
Carbon:Total organic carbon as C, mg/L
Major nutrients: Total phosphorus as P, mg/L Total orthophosphate as P, mg/L Total nitrogen as N, mg/L Total organic nitrogen as N, mg/L Total ammonia nitrogen as N, mg/L Total nitrite nitrogen as N, mg/L Total nitrate nitrogen as N, mg/L
Bacteriological: Coliform, multiple-tube method, MPN,
Fecal coliform, multiple-tube method,MPN, col/100 mL Coliform, membrane-filter method, col/100 mL
Fecal coliform, membrane-filtermethod, col/100 mL
Trace elements:J. U LdJ. d J- o v£ll-Ll do x\ y U i^/ LJ
Total copper as Cu, ug/L J.U Ld-L J-tJdU. do 1 U y Ug/ J-i
Total zinc as Zn, ug/L Total mercury as Hg, ug/L
u
13 13
7
13 13 13 13 13 13 13
4
4
9 9 9 9 9
£H t. . U J J
10.4 1.4 28 89 25 170
12 3.5 88
.52 .13 .97
.19 .10 .35 1.5 .53 7.4 .71 .35 5.9 .23 .03 1.5 .03 .01 .10 .56 .06 1.1
3.8xl05 7.5xl04 l.lxlO 7
1.4xl04 3.9xl03 2.4xl04
213 18 8 69
405 130 740 255 2/ 110 400
35
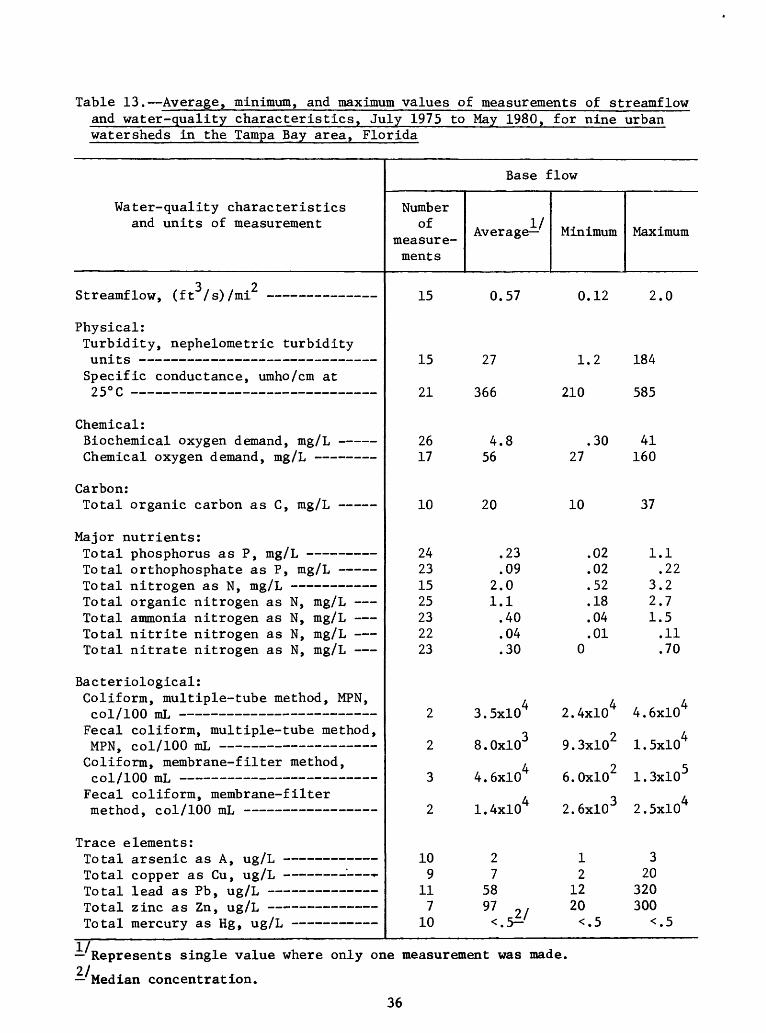
Table 13. Average, minimum, and maximum values of measurements of streamflowand water-quality characteristics, July 1975 towatersheds in the Tampa Bay area, Florida
Water-quality characteristics and units of measurement
3 2 Streamflow, (ft /s)/mi
Physical: Turbidity, nephelometric turbidity
Specific conductance, umho/cm at ?s°r - - -
Chemical : Biochemical oxygen demand, mg/L Chemical oxygen demand, mg/L
Carbon: Total organic carbon as C, mg/L
Major nutrients:Total phosphorus as P, mg/L Total orthophosphate as P, mg/L -Total nitrogen as N, mg/L Total organic nitrogen as N, mg/L Total ammonia nitrogen as N, mg/L Total nitrite nitrogen as N, mg/L Total nitrate nitrogen as N, mg/L
Bacteriological: Coliform, multiple-tube method, MPN, col/100 mL
Fecal coliform, multiple-tube method,MPN, col/100 mL Coliform, membrane- filter method,col/100 mL
Fecal coliform, membrane-filtermethod, col/100 mL
Trace elements:
Total copper as Cu, ug/L ' *-Total lead as Pb, ug/L Total zinc as Zn, ug/L Total mercury as Hg, ug/L
May 1980, for nine urban
Base flow
Number of
measure ments
15
15
21
26 17
10
24 23 15 25 23 22 23
2
2
3
2
10 9
11 7
10
Average Min:Lmum Maximum
0.57 0.12 2.0
27 1.2 184
366 210 585
4.8 .30 41 56 27 160
20 10 37
.23 .02 1.1
.09 .02 .22 2.0 .52 3.2 1.1 .18 2.7 .40 .04 1.5 .04 .01 .11 .30 0 .70
3.5xl04 2.4xl04 4.6xl04
8.0xl03 9.3xl02 1.5xl04
4.6xl04 6.0xl02 1.3xl05
1.4xl04 2.6xl03 2.5xl04
2 13 7 2 20
58 12 320 97 9/ 20 300 <.5=-' <.5 <.5
Represents single value where only one measurement was made.21 Median concentration.
36
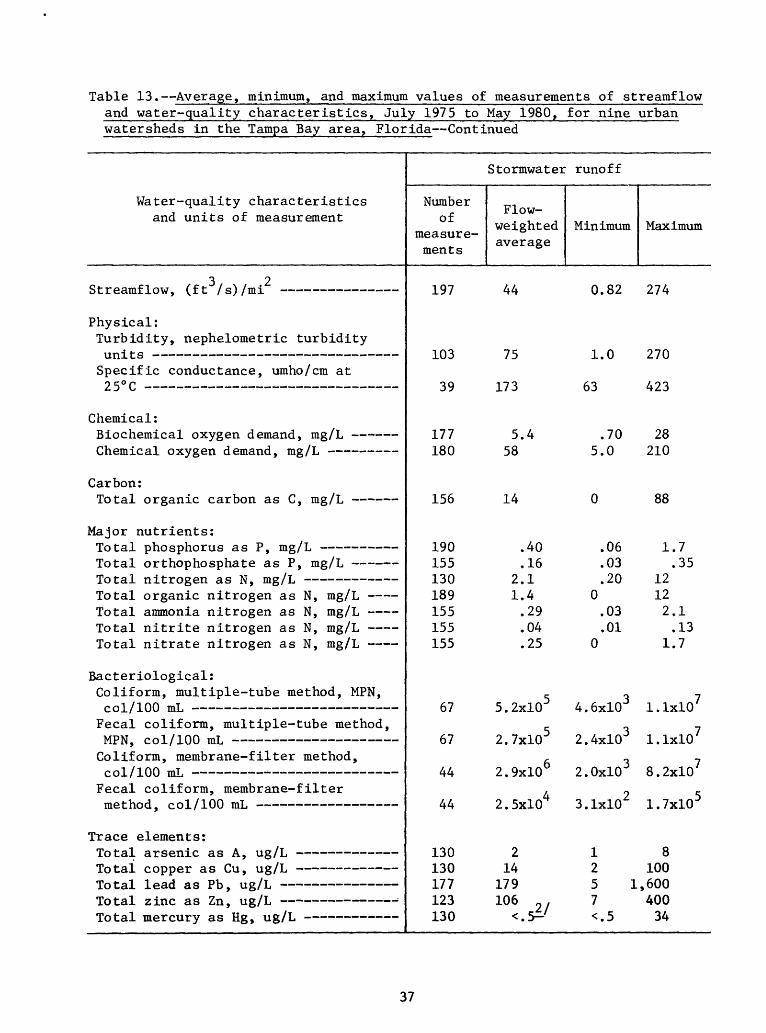
Table 13. Average, minimum, and maximum values of measurements of streamflowand water-quality characteristics, July 1975 to May 1980,watersheds in the Tampa Bay area, Florida Continued
Water-quality characteristics and units of measurement
3 2 Streamflow, (ft /s)/mi
Physical: Turbidity, nephelometric turbidity units Specific conductance, umho/cm at
Chemical:Biochemical oxygen demand, mg/L Chemical oxygen demand, mg/L
Carbon:Total organic carbon as C, mg/L
Major nutrients:Total phosphorus as P, mg/L Total orthophosphate as P, mg/L Total nitrogen as N, mg/L Total organic nitrogen as N, mg/L Total ammonia nitrogen as N, mg/L Total nitrite nitrogen as N, mg/L - Total nitrate nitrogen as N, mg/L
Bacteriological : Coliform, multiple-tube method, MPN, col/100 mL Fecal coliform, multiple- tube method,MPN, col/100 mL Coliform, membrane-filter method, col/100 mL
Fecal coliform, membrane- filtermethod, col/ 100 mL
Trace elements:.LLJ L.CL-L cL J_ O till -LI- do r\ 5 Ulg/ i_i
Total copper as Cu, ug/L Total lead as Pb, ug/L Total zinc as Zn, ug/L ; Total mercury as Hg, ug/L
for nine urban
Storawater runoff
Number _, _ Flow- of . , . , weighted measure- °
average ments
197 44
103 75
39 173
177 5.4 180 58
156 14
190 .40 155 .16 130 2.1 189 1.4 155 .29 155 .04 155 .25
67 5.2xl05
67 2.7xl05
44 2.9xl06
44 2.5xl04
130 2 130 14 177 179 123 106 9 . 130 <.5=-'
Minimum Maximum
0.82 274
1.0 270
63 423
.70 28 5.0 210
0 88
.06 1.7
.03 .35
.20 12 0 12 .03 2.1 .01 .13
0 1.7
4.6xl03 l.lxlO7
2.4xl03 l.lxlO7
2.0xl03 8.2xl07
3.1xl02 1.7xl05
1 8 2 100 5 1,600 7 400 <.5 34
37
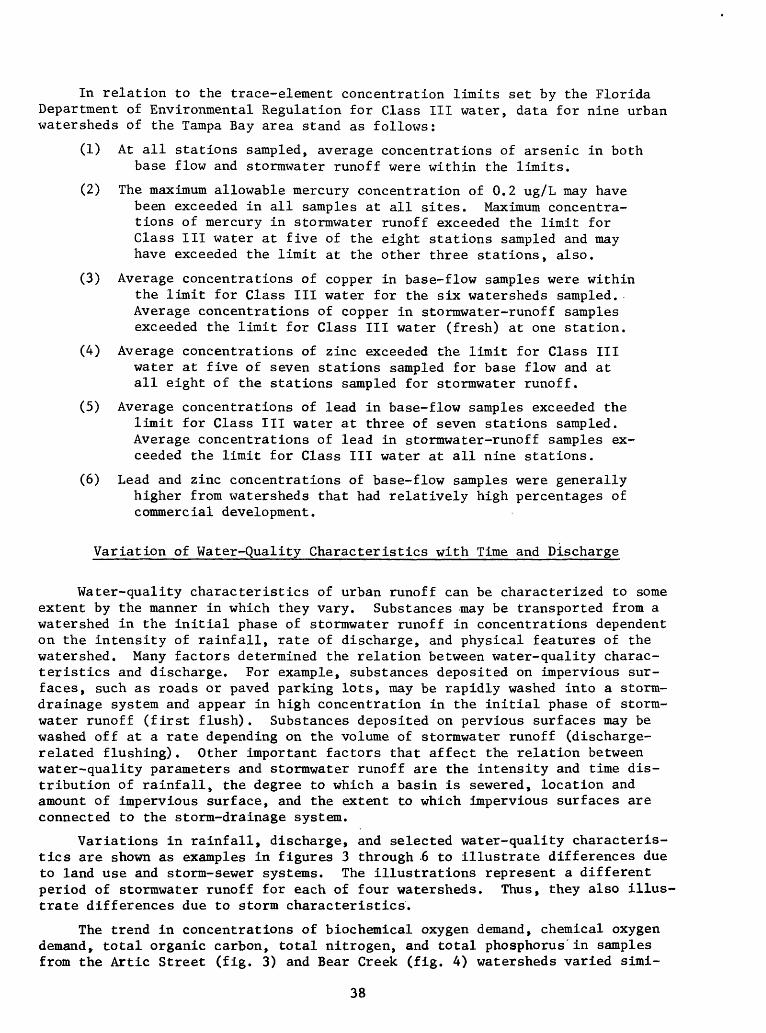
In relation to the trace-element concentration limits set by the Florida Department of Environmental Regulation for Class III water, data for nine urban watersheds of the Tampa Bay area stand as follows:
(1) At all stations sampled, average concentrations of arsenic in both base flow and stormwater runoff were within the limits.
(2) The maximum allowable mercury concentration of 0.2 ug/L may have been exceeded in all samples at all sites. Maximum concentra tions of mercury in stormwater runoff exceeded the limit for Class III water at five of the eight stations sampled and may have exceeded the limit at the other three stations, also.
(3) Average concentrations of copper in base-flow samples were within the limit for Class III water for the six watersheds sampled. Average concentrations of copper in stormwater-runoff samples exceeded the limit for Class III water (fresh) at one station.
(4) Average concentrations of zinc exceeded the limit for Class III water at five of seven stations sampled for base flow and at all eight of the stations sampled for stormwater runoff.
(5) Average concentrations of lead in base-flow samples exceeded the limit for Class III water at three of seven stations sampled. Average concentrations of lead in stormwater-runoff samples ex ceeded the limit for Class III water at all nine stations.
(6) Lead and zinc concentrations of base-flow samples were generally higher from watersheds that had relatively high percentages of commercial development.
Variation of Water-Quality Characteristics with Time and Discharge
Water-quality characteristics of urban runoff can be characterized to some extent by the manner in which they vary. Substances may be transported from a watershed in the initial phase of stormwater runoff in concentrations dependent on the intensity of rainfall, rate of discharge, and physical features of the watershed. Many factors determined the relation between water-quality charac teristics and discharge. For example, substances deposited on impervious sur faces, such as roads or paved parking lots, may be rapidly washed into a storm- drainage system and appear in high concentration in the initial phase of storm- water runoff (first flush). Substances deposited on pervious surfaces may be washed off at a rate depending on the volume of stormwater runoff (discharge- related flushing). Other important factors that affect the relation between water-quality parameters and stormwater runoff are the intensity and time dis tribution of rainfall, the degree to which a basin is sewered, location and amount of impervious surface, and the extent to which impervious surfaces are connected to the storm-drainage system.
Variations in rainfall, discharge, and selected water-quality characteris tics are shown as examples in figures 3 through -6 to illustrate differences due to land use and storm-sewer systems. The illustrations represent a different period of stormwater runoff for each of four watersheds. Thus, they also illus trate differences due to storm characteristics.
The trend in concentrations of biochemical oxygen demand, chemical oxygen demand r total organic carbon, total nitrogen, and total phosphorus in samples from the Artic Street (fig. 3) and Bear Creek (fig. 4) watersheds varied simi-
38
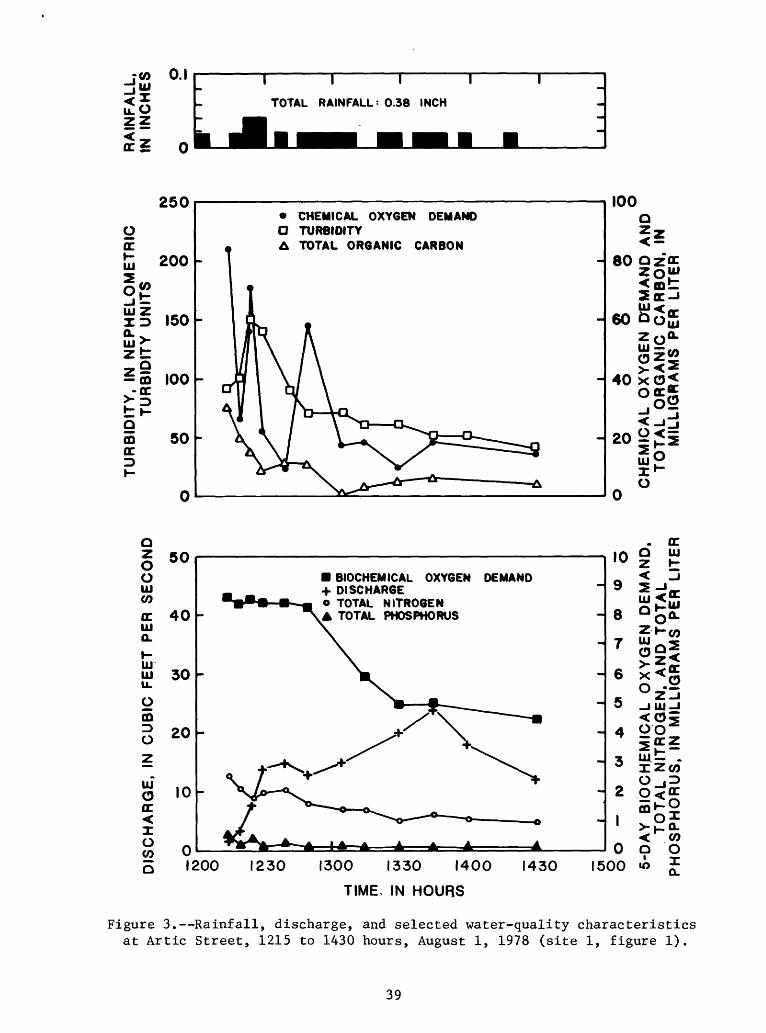
rCO O.I 1 I I
TOTAL RAINFALL: 0.38 INCH
OEh- UJ
250
200
150UJZ ID
i-5 100
Q mOC
50
CHEMICAL OXYGEN DEMANDG TURBIDITYA TOTAL ORGANIC CARBON
100
80
60
40
20|< |0
O
g 50 OUJ CO
cc 40UJ Q.
UJui
OmozUJoOC
XoCO
o
30
20
10
BIOCHEMICAL OXYGEN DEMAND-I- DISCHARGE o TOTAL NITROGEN
TOTAL PHOSPHORUS
1200 1230 1300 1330 1400
TIME, IN HOURS
1430
. OC10 O UJIU Z »-
: 3
1500
z < 2UJ
9
8
7
6
5 -jiu^ ^ O 5
4 O Oi 01 ?
3 xzco"
0 Q oX CL
Figure 3. Rainfall, discharge, and selected water-quality characteristics at Artic Street, 1215 to 1430 hours, August 1, 1978 (site 1, figure 1).
39
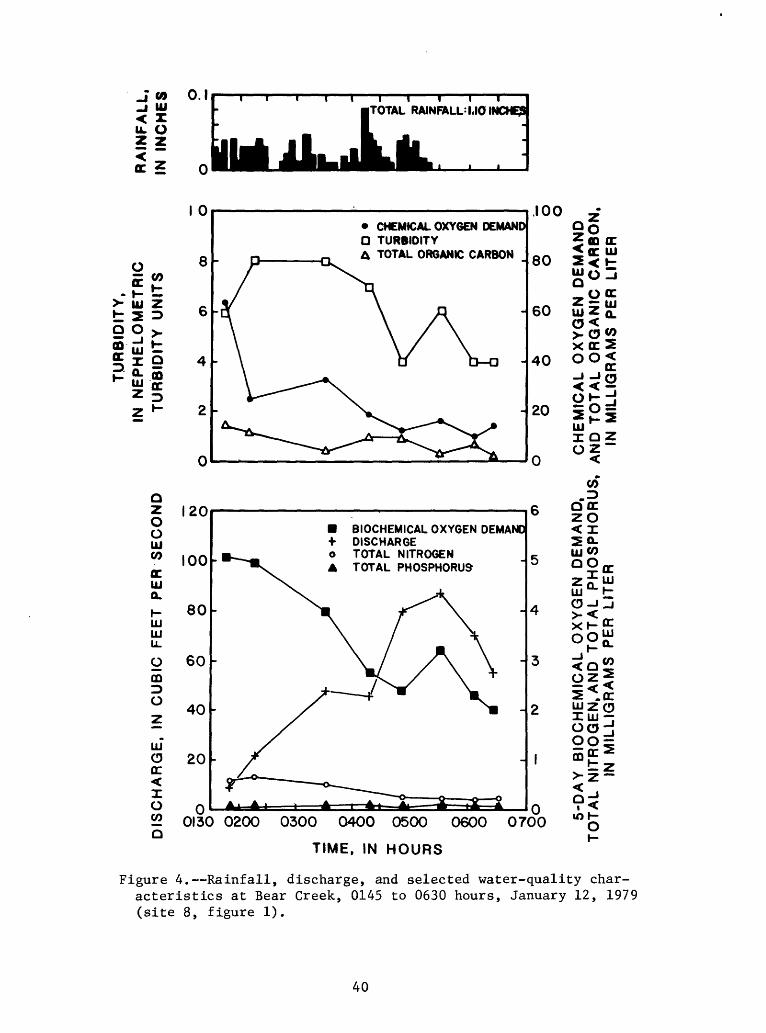
TOTAL RAINFALL: uo INCHES
o
s
QZ OoUJ CO
QCUJ Q.
K UJ UJ LL
O CD
O
Z
uj"
oQC
I O CO
8
20
100
80
60
40
20
CHEMICAL OXYGEN DEMANDD TURBIDITYA TOTAL ORGANIC CARBON
JOO
80
60
40
20
BIOCHEMICAL OXYGEN DEMAND I- DISCHARGEo TOTAL NITROGENA TOTAL PHOSPHORUS
00130 0200 0300 0400 0500 0600
TIME, IN HOURS
00700
°0 5«D QC<ac uj.?<t=-oocZ QJ UJZ Q_o< >o wx oc2 00
QC O
o
UJ IQZ
CO.D
OQCZO
UJCO00
oo£
<0^oz^
IUJ-J
00^
Figure 4. Rainfall, discharge, and selected water-quality char acteristics at Bear Creek, 0145 to 0630 hours, January 12, 1979 (site 8, figure 1).
40
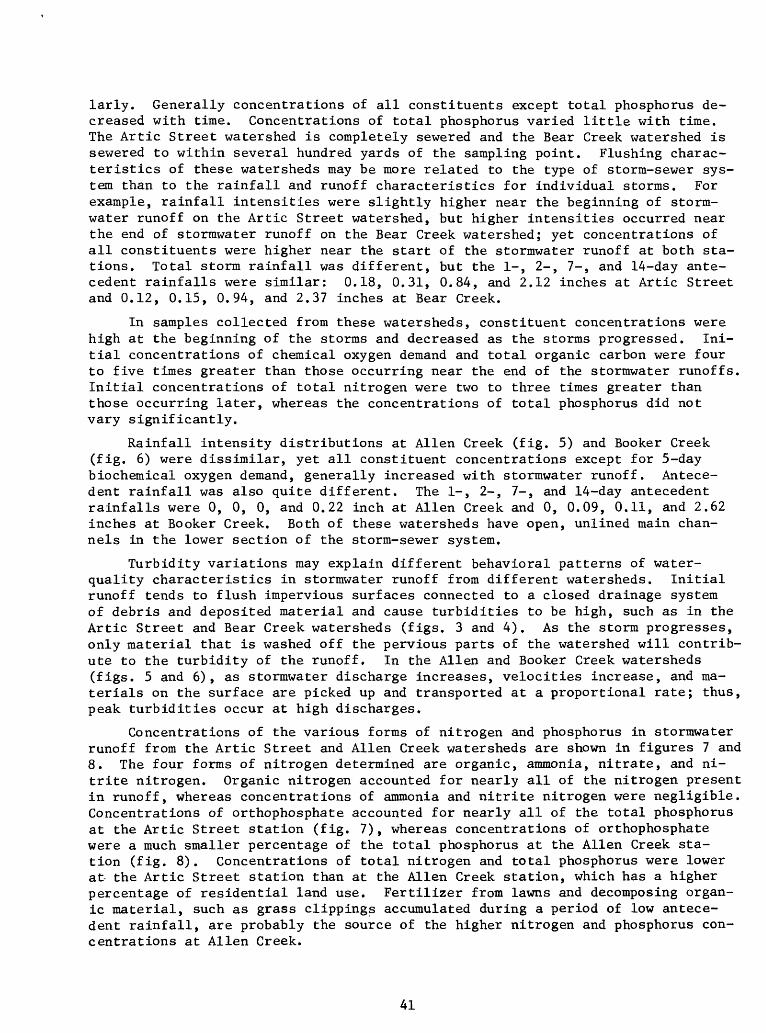
larly. Generally concentrations of all constituents except total phosphorus de creased with time. Concentrations of total phosphorus varied little with time. The Artic Street watershed is completely sewered and the Bear Creek watershed is sewered to within several hundred yards of the sampling point. Flushing charac teristics of these watersheds may be more related to the type of storm-sewer sys tem than to the rainfall and runoff characteristics for individual storms. For example, rainfall intensities were slightly higher near the beginning of storm- water runoff on the Artic Street watershed, but higher intensities occurred near the end of stormwater runoff on the Bear Creek watershed; yet concentrations of all constituents were higher near the start of the stormwater runoff at both sta tions. Total storm rainfall was different, but the 1-, 2-, 7-, and 14-day ante cedent rainfalls were similar: 0.18, 0.31, 0.84, and 2.12 inches at Artic Street and 0.12, 0.15, 0.94, and 2.37 inches at Bear Creek.
In samples collected from these watersheds, constituent concentrations were high at the beginning of the storms and decreased as the storms progressed. Ini tial concentrations of chemical oxygen demand and total organic carbon were four to five times greater than those occurring near the end of the stormwater runoffs. Initial concentrations of total nitrogen were two to three times greater than those occurring later, whereas the concentrations of total phosphorus did not vary significantly.
Rainfall intensity distributions at Alien Creek (fig. 5) and Booker Creek (fig. 6) were dissimilar, yet all constituent concentrations except for 5-day biochemical oxygen demand, generally increased with stormwater runoff. Antece dent rainfall was also quite different. The 1-, 2-, 7-, and 14-day antecedent rainfalls were 0, 0, 0, and 0.22 inch at Alien Creek and 0, 0.09, 0.11, and 2.62 inches at Booker Creek. Both of these watersheds have open, unlined main chan nels in the lower section of the storm-sewer system.
Turbidity variations may explain different behavioral patterns of water- quality characteristics in stormwater runoff from different watersheds. Initial runoff tends to flush impervious surfaces connected to a closed drainage system of debris and deposited material and cause turbidities to be high, such as in the Artic Street and Bear Creek watersheds (figs. 3 and 4). As the storm progresses, only material that is washed off the pervious parts of the watershed will contrib ute to the turbidity of the runoff. In the Alien and Booker Creek watersheds (figs. 5 and 6), as stormwater discharge increases, velocities increase, and ma terials on the surface are picked up and transported at a proportional rate; thus, peak turbidities occur at high discharges.
Concentrations of the various forms of nitrogen and phosphorus in stormwater runoff from the Artic Street and Alien Creek watersheds are shown in figures 7 and 8. The four forms of nitrogen determined are organic, ammonia, nitrate, and ni trite nitrogen. Organic nitrogen accounted for nearly all of the nitrogen present in runoff, whereas concentrations of ammonia and nitrite nitrogen were negligible. Concentrations of orthophosphate accounted for nearly all of the total phosphorus at the Artic Street station (fig. 7), whereas concentrations of orthophosphate were a much smaller percentage of the total phosphorus at the Alien Creek sta tion (fig. 8). Concentrations of total nitrogen and total phosphorus were lower at- the Artic Street station than at the Alien Creek station, which has a higher percentage of residential land use. Fertilizer from lawns and decomposing organ ic material, such as grass clippings accumulated during a period of low antece dent rainfall, are probably the source of the higher nitrogen and phosphorus con centrations at Alien Creek.
41
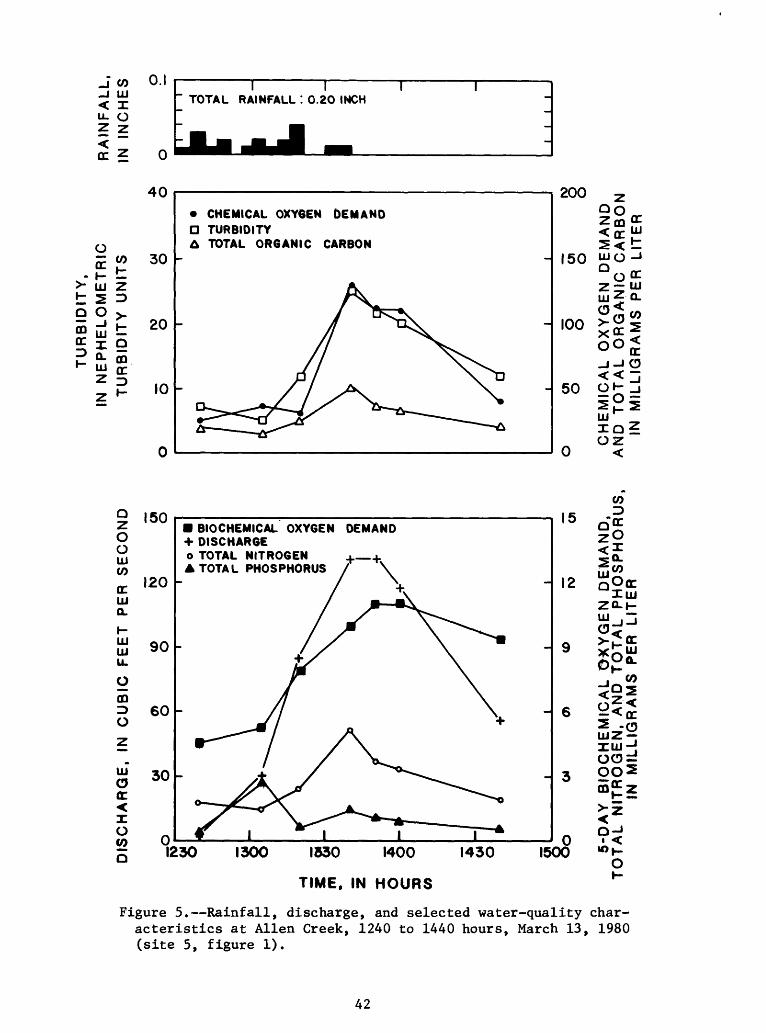
_J CO_J HI< Iu. oz z
O.I I ITOTAL RAINFALL ! 0.20 INCH
? o
40
Or CO 30
{- t iu z
2 u >
00 OC
20
10
CHEMICAL OXYGEN DEMANDO TURBIDITYA TOTAL ORGANIC CARBON
200
QCLLJ
150 "JO
100
50
Q.
CO
oo<-i -JO
oz
CO
o o 111CO
QC111 a.
111 111 LL
O
mD O
111 OQC< I O COo
150
120
90
60
30
0
BIOCHEMICAL OXYGEN DEMAND-I- DISCHARGEo TOTAL NITROGEN +_+A TOTAL PHOSPHORUS / \
1230 1300 1530 1400
TIME, IN HOURS
1430
15
12 S°flcXUJ
1500
o
6 y
3 ^
CO
oI-
Figure 5. Rainfall, discharge, and selected water-quality char acteristics at Alien Creek, 1240 to 1440 hours, March 13, 1980 (site 5, figure 1).
42
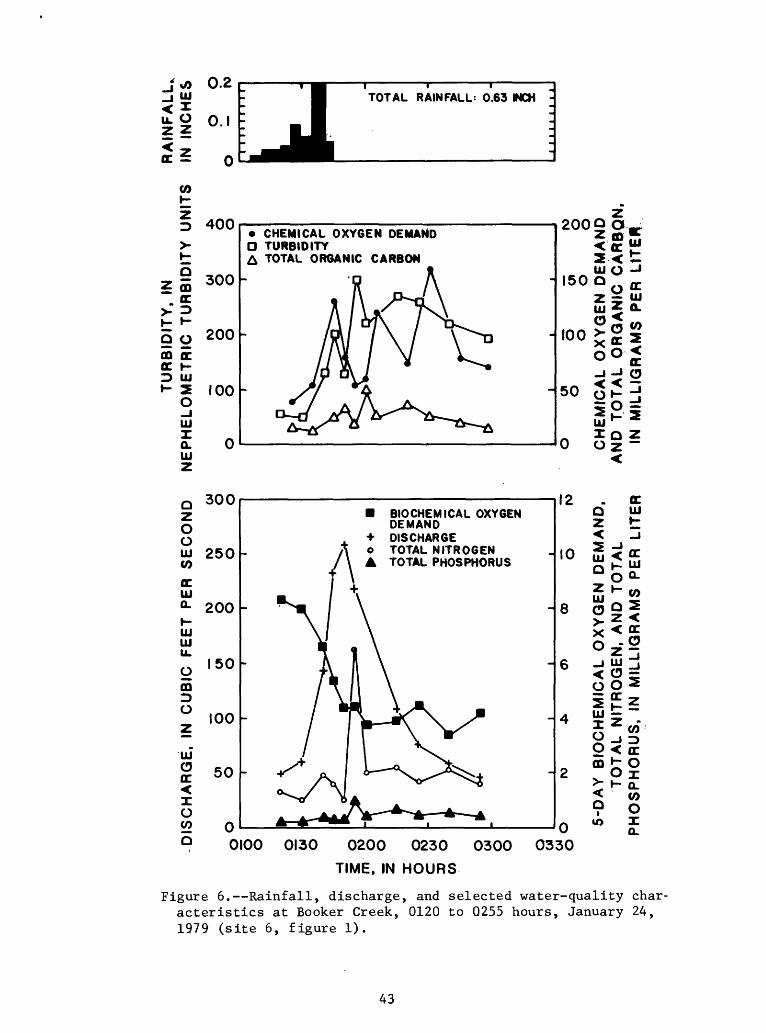
TOTAL RAINFALL: 0.63 INCH
COK
Z
oZ CD
. OC> I>
9 2CD OCOC KD UJ
HiX Q. IllZ
400
= 300
200
100
CHEMICAL OXYGEN DEMANDO TURBIDITY£ TOTAL ORGANIC CARBON
200 0 Oco UJ2 < tuj o -»
H'500 .2 z IfUJ Z Q.O ^
H.00 >S | o o j
si!S K 2 IQ Z0 Z "
<
- 50
OZ O O111CO
QC 111a.K UJ 111u. oCD
O
uiaQC
I oCOo
300
250
200
50
100
50
BIOCHEMICAL OXYGEN DEMAND DISCHARGE TOTAL NITROGEN TOTAL PHOSPHORUS
0100 0130 0200 0230 0300
TIME, IN HOURS
12 . oc O 111z t
10 2 ^CC IO uj < tt
8
0330
oi111I o oCD
Oito
UJ ~\a 02OC rr
CO-I ^< QC
COOI a.
Figure 6. Rainfall, discharge, and selected water-quality char acteristics at Booker Creek, 0120 to 0255 hours, January 24, 1979 (site 6, figure 1).
43
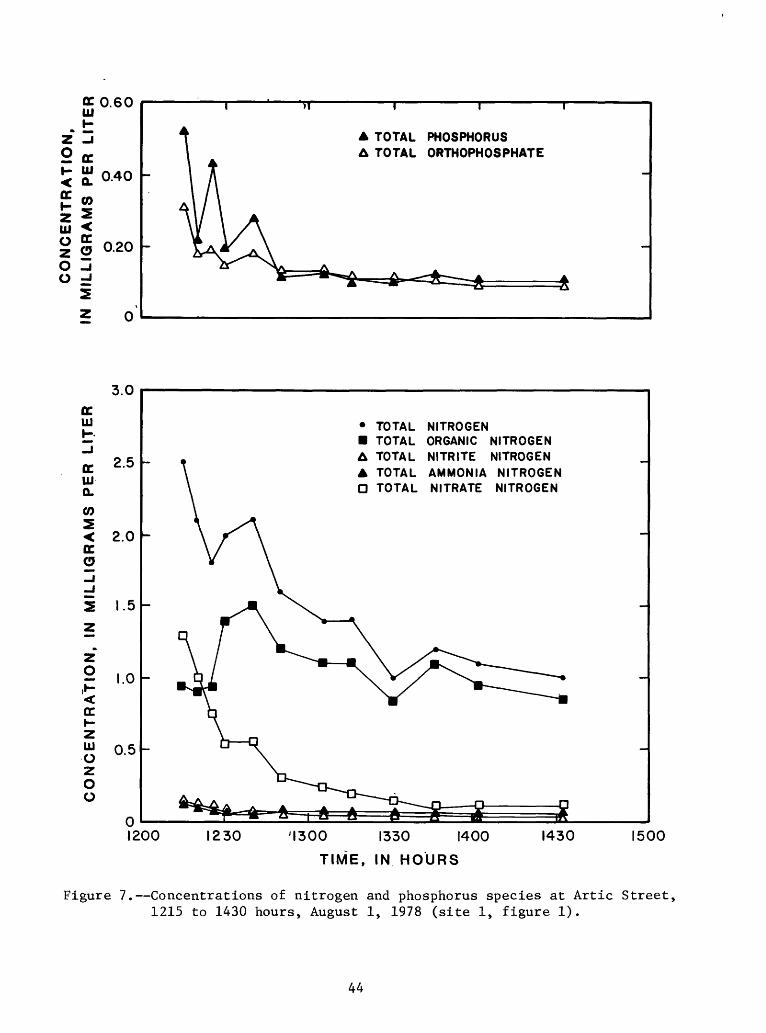
OCQ.60 UJ
z
0-40
2<% 5 0.20O U O =f
S
* o
A TOTAL PHOSPHORUSA TOTAL ORTHOPHOSPHATE
TOTAL NITROGENTOTAL ORGANIC NITROGENTOTAL NITRITE NITROGEN
A TOTAL AMMONIA NITROGEND TOTAL NITRATE NITROGEN
1200 1230 '1300 1330 1400
TIME, IN HOURS
1430 1500
Figure 7. Concentrations of nitrogen and phosphorus species at Artic Street, 1215 to 1430 hours, August 1, 1978 (site 1, figure 1).
44
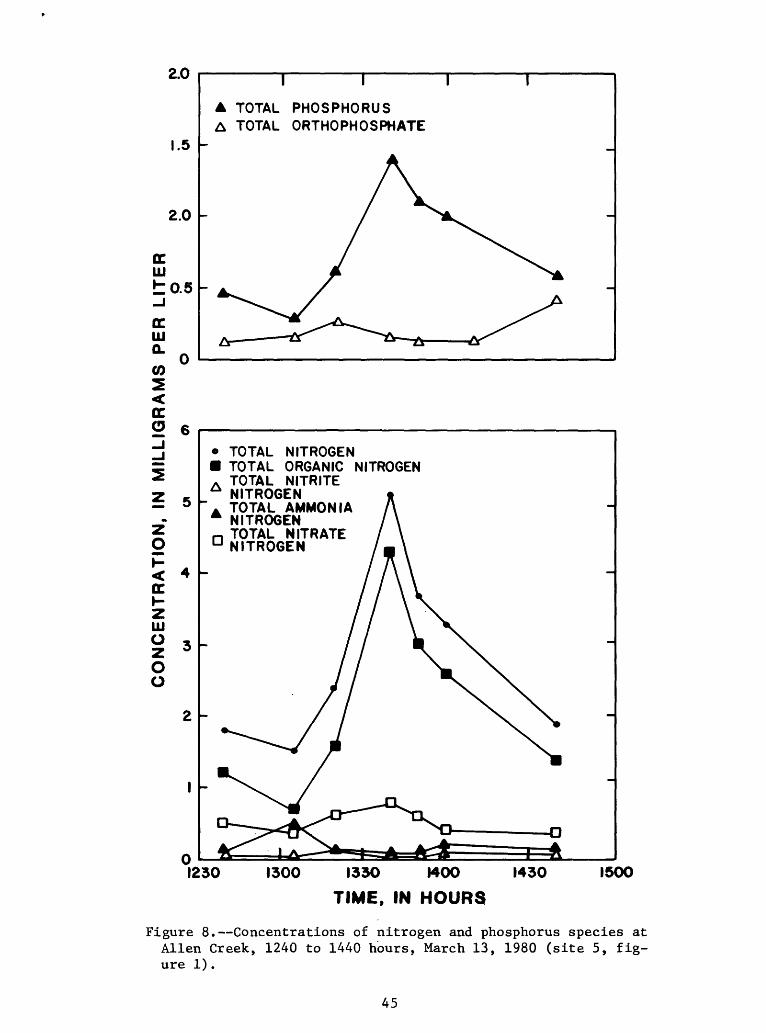
2.0
1.5
2.0
I
A TOTAL PHOSPHORUSA TOTAL ORTHOPHOSPHATE
TOTAL NITROGENTOTAL ORGANIC NITROGENTOTAL NITRITENITROGENTOTAL AMMONIANITROGEN
n TOTAL NITRATE u NITROGEN
1230 1300 1330 1400
TIME, IN HOURS
1430 1500
Figure 8. Concentrations of nitrogen and phosphorus species at Alien Creek, 1240 to 1440 hours, March 13, 1980 (site 5, fig ure 1).
45
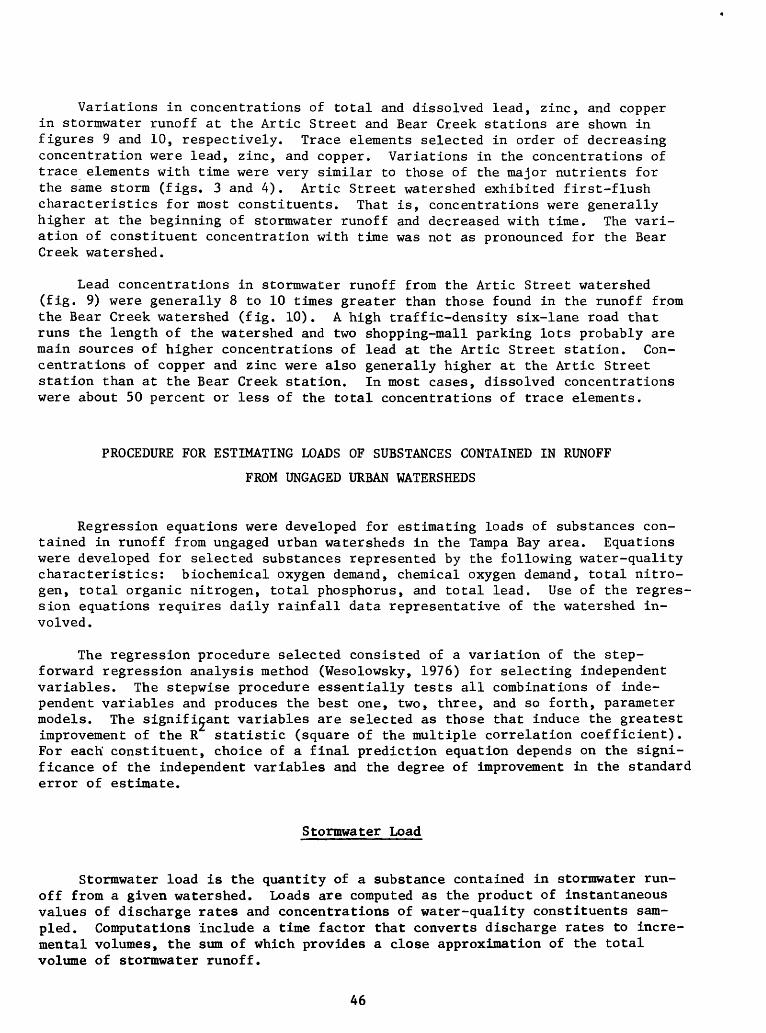
Variations in concentrations of total and dissolved lead, zinc, and copper in stormwater runoff at the Artic Street and Bear Creek stations are shown in figures 9 and 10, respectively. Trace elements selected in order of decreasing concentration were lead, zinc, and copper. Variations in the concentrations of trace elements with time were very similar to those of the major nutrients for the same storm (figs. 3 and 4). Artic Street watershed exhibited first-flush characteristics for most constituents. That is, concentrations were generally higher at the beginning of stormwater runoff and decreased with time. The vari ation of constituent concentration with time was not as pronounced for the Bear Creek watershed.
Lead concentrations in stormwater runoff from the Artic Street watershed (fig. 9) were generally 8 to 10 times greater than those found in the runoff from the Bear Creek watershed (fig. 10). A high traffic-density six-lane road that runs the length of the watershed and two shopping-mall parking lots probably are main sources of higher concentrations of lead at the Artic Street station. Con centrations of copper and zinc were also generally higher at the Artic Street station than at the Bear Creek station. In most cases, dissolved concentrations were about 50 percent or less of the total concentrations of trace elements.
PROCEDURE FOR ESTIMATING LOADS OF SUBSTANCES CONTAINED IN RUNOFF
FROM UNGAGED URBAN WATERSHEDS
Regression equations were developed for estimating loads of substances con tained in runoff from ungaged urban watersheds in the Tampa Bay area. Equations were developed for selected substances represented by the following water-quality characteristics: biochemical oxygen demand, chemical oxygen demand, total nitro gen, total organic nitrogen, total phosphorus, and total lead. Use of the regres sion equations requires daily rainfall data representative of the watershed in volved.
The regression procedure selected consisted of a variation of the step- forward regression analysis method (Wesolowsky, 1976) for selecting independent variables. The stepwise procedure essentially tests all combinations of inde pendent variables and produces the best one, two, three, and so forth, parameter models. The significant variables are selected as those that induce the greatest improvement of the R statistic (square of the multiple correlation coefficient). For each' constituent, choice of a final prediction equation depends on the signi ficance of the independent variables and the degree of improvement in the standard error of estimate.
Stormwater Load
Stormwater load is the quantity of a substance contained in stormwater run off from a given watershed. Loads are computed as the product of instantaneous values of discharge rates and concentrations of water-quality constituents sam pled. Computations include a time factor that converts discharge rates to incre mental volumes, the sum of which provides a close approximation of the total volume of stormwater runoff.
46
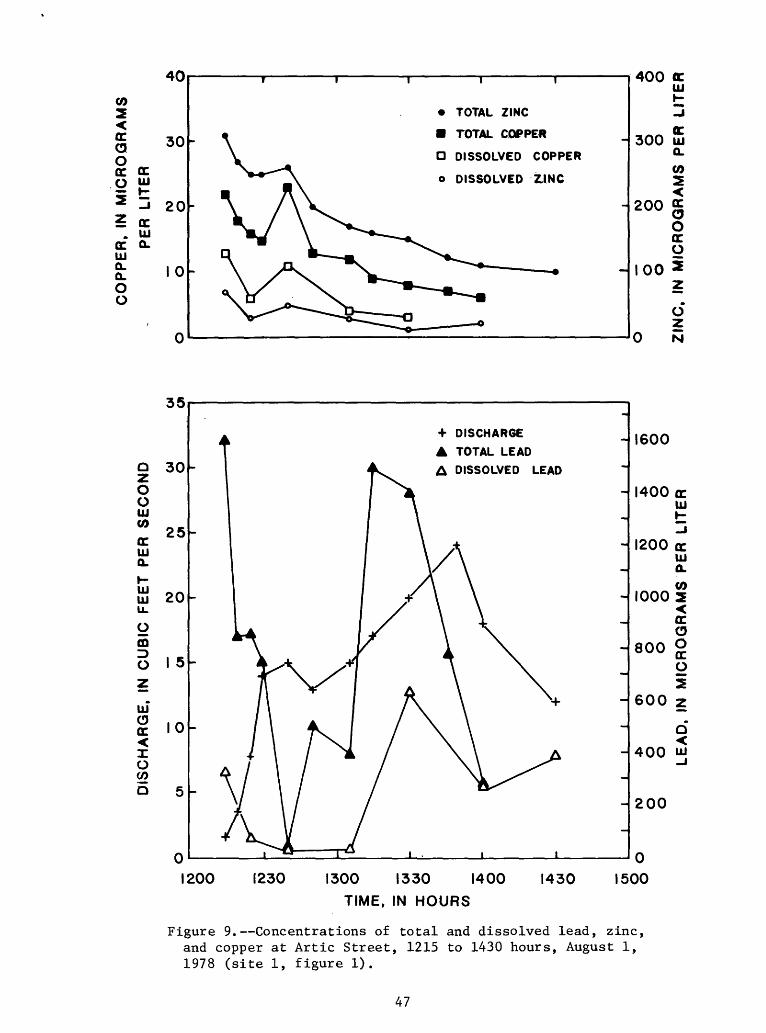
CO2 < oc a o a: oc
a:. uj
oc a.UJa. a.O O
40
30
20
TOTAL ZINC
TOTAL COPPER
O DISSOLVED COPPER
o DISSOLVED ZINC
400 acUJ
ac300 UJ
a.
200
00
CO
O oc o
OzN
- 1600+ DISCHARGE
TOTAL LEAD
A DISSOLVED LEAD
1200 1230 1300 1330 1400TIME, IN HOURS
1430 1500
Figure 9. Concentrations of total and dissolved lead, zinc, and copper at Artic Street, 1215 to 1430 hours, August 1, 1978 (site 1, figure 1).
47
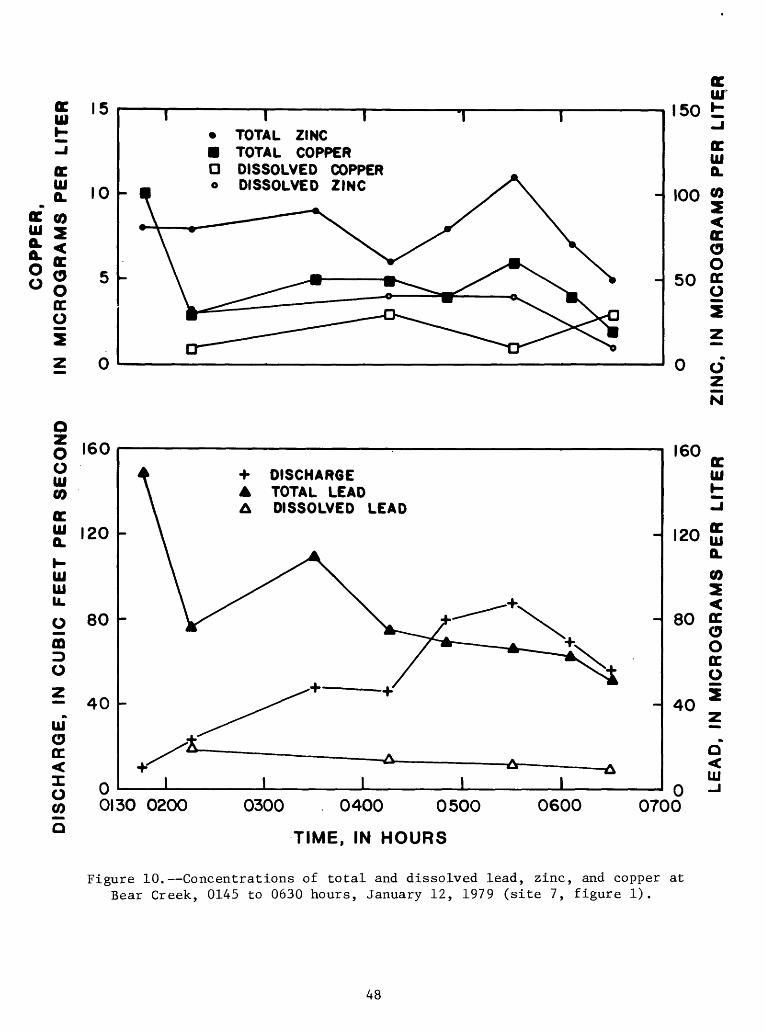
in
oc 111
^ O,
flC CO
15
10
-
O oOoc oi
I ITOTAL ZINC TOTAL COPPER DISSOLVED COPPER DISSOLVED ZINC
ocUJ
150 t
100
cr o o
50 g
O O UJ CO
160
120
ill tu u.OfflD O
80
- 40 UJoocXoCO
+ DISCHARGE A TOTAL LEAD
DISSOLVED LEAD
I
160
120 5
80
40
0130 0200 0300 0400 0500
TIME, IN HOURS
0600 0700
Figure 10. Concentrations of total and dissolved lead, zinc, and copper at Bear Creek, 0145 to 0630 hours, January 12, 1979 (site 7, figure 1).
48
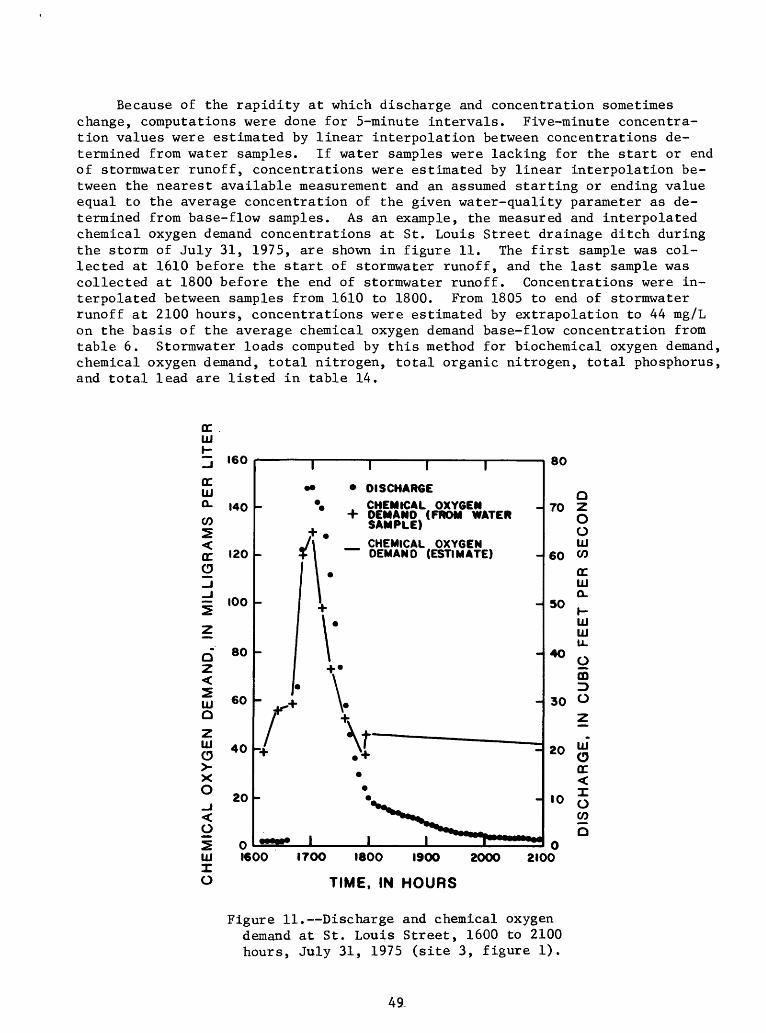
Because of the rapidity at which discharge and concentration sometimes change, computations were done for 5-minute intervals. Five-minute concentra tion values were estimated by linear interpolation between concentrations de termined from water samples. If water samples were lacking for the start or end of stormwater runoff, concentrations were estimated by linear interpolation be tween the nearest available measurement and an assumed starting or ending value equal to the average concentration of the given water-quality parameter as de termined from base-flow samples. As an example, the measured and interpolated chemical oxygen demand concentrations at St. Louis Street drainage ditch during the storm of July 31, 1975, are shown in figure 11. The first sample was col lected at 1610 before the start of stormwater runoff, and the last sample was collected at 1800 before the end of stormwater runoff. Concentrations were in terpolated between samples from 1610 to 1800. From 1805 to end of stormwater runoff at 2100 hours, concentrations were estimated by extrapolation to 44 mg/L on the basis of the average chemical oxygen demand base-flow concentration from table 6. Stormwater loads computed by this method for biochemical oxygen demand, chemical oxygen demand, total nitrogen, total organic nitrogen, total phosphorus, and total lead are listed in table 14.
DC UJH-_j IOW
DC UJ°- 140 COZE
CC "20
g_ii 100ZE-Z
Q 80
W 60Q
1 *°> Xo
20
^OZE 0 w
1 1 1 1
DISCHARGE
* CHEMICAL OXYGEN + DEMAND (FROM WATER
+ SAMPLE)
J\ * CHEMICAL OXYGEN%\ DEMAND (ESTIMATE)- V
. v r* ^
/ "*"
*
N. _^^*S^^
^^^^N||< 111 ^^^^p"*******M
OU
Q70 Z
O OUJ
60 CO
CCUJQ.
50 H-LUUJU.
40 oCD
30 0^y
20 g"
CC
-J-10 Q
CO
Q«
UJ 1600 I70O 1800 I90O 20OO 2100I O TIME, IN HOURS
Figure 11. Discharge and chemical oxygen demand at St. Louis Street, 1600 to 2100 hours, July 31, 1975 (site 3, figure 1).
49.
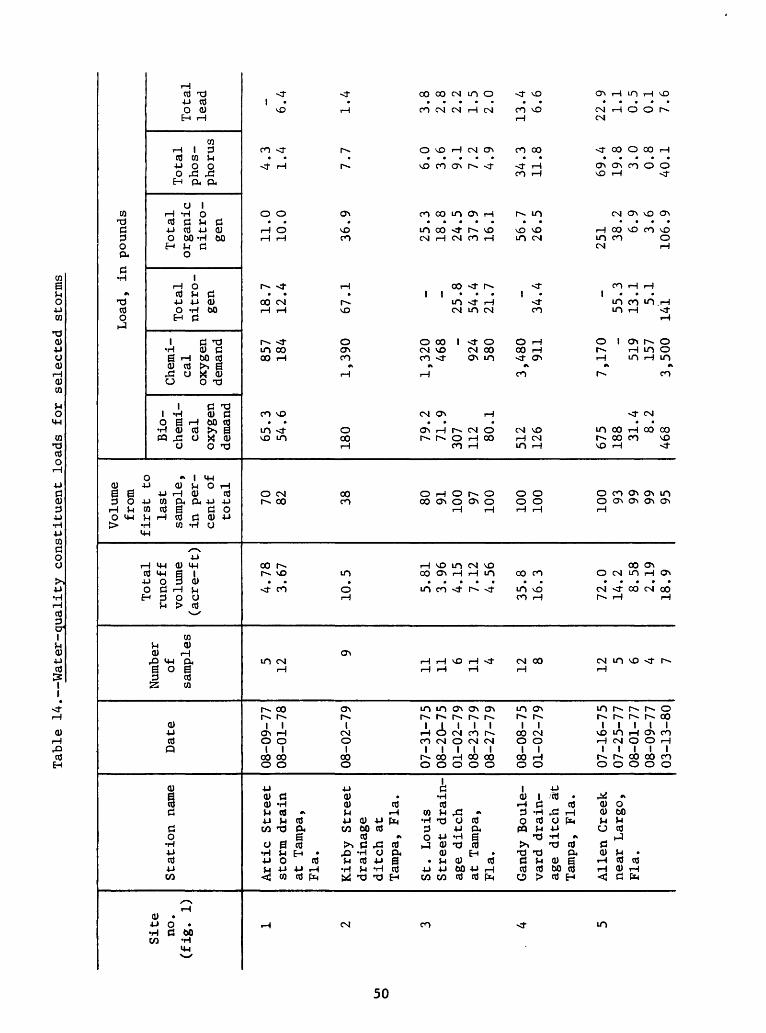
Table
14. Water-quality co
nsti
tuen
t lo
ads
for
selected storms
Site
no.
(fig.
1)
1 2 3
. 4 5
Stat
ion
name
Artic
Stre
etstorm drain
at Ta
mpa,
Fla.
Kirby St
reet
drainage
ditch
atTamp
a, Fla.
St.
Louis
Street dr
ain
age
ditch
at Ta
mpa,
Fla.
Gandy
Boule
vard drain
age
ditch
a>t
Tamp
a, Fla.
Alien Creek
near
La
rgo,
Fla.
Date
08-0
9-77
08-0
1-78
08-02-79
07-3
1-75
08-2
0-75
01-0
2-79
08-2
3-79
08-2
7-79
08-0
8-75
01-0
2-79
07-1
6-75
07-2
5-77
08-0
1-77
08-0
9-77
03-13-80
Number
of
samp
les
5 12
9
11 11 6 11 4 12 8 125 6 4 7
Total
runo
ff
volume
(acre-f t)
4.78
3.67
10.5 5.81
3.96
4.15
7.12
4.56
35.8
16.3
72.0
14.2 8.58
2.19
18.9
Volume
from
firs
t to
last
sample ,
in pe
r
cent
of
tota
l
70 82 38 80 91 100 97
100
100
100
100 93 99 99 95
Load
, in pounds
Bio
ch
emi
ca
l oxygen
demand
65.3
54.6
180 79.2
71.9
307
112 80.1
512
126
675
188 31.4 8.2
468
Chem
i
cal
oxyg
en
demand 857
184
1,390
1,320
468 -
924
580
3,480
911
7,170 -
519
157
3,500
Total
nitro
gen
18.7
12.4
67.1 _ -
25.8
54.4
21.7
34.4
55.3
13.1 5.1
141
Total
orga
nic
nitr
o
gen
11.0
10.0
36.9
25.3
18.8
24.5
37.9
16.1
56.7
26.5
251 38.2 6.9
3.6
106.
9
Total
phos
phor
us
4.3
1.4
7.7
6.0
3.6
9.1
7.2
4.9
34.3
11.8
69.4
19.8 3.0
0.8
40.1
Tota
l le
ad 6.4
1.4
3.8
2.8
2.2
1.5
2.0
13.4 6.6
22.9 1.1
0.5
0.1
7.6
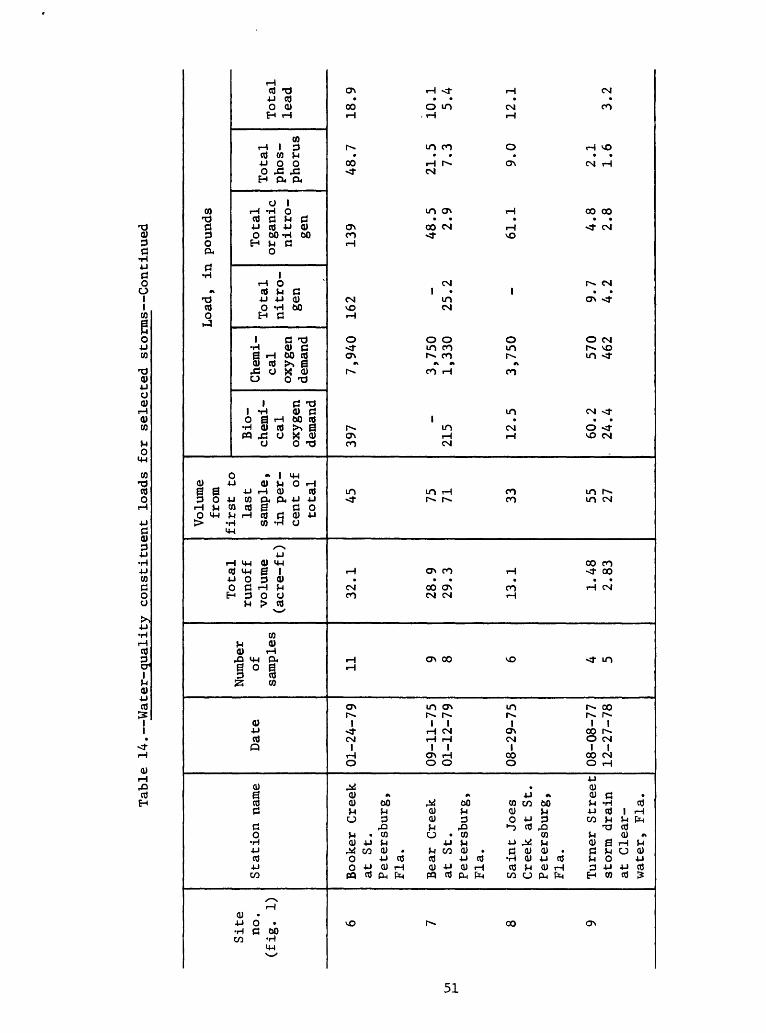
Table
14. Water-quality co
nsti
tuen
t loads
for
sele
cted
storms Continued
Site
no
. (f
ig.
1)
6 7 8 9
Station
name
Booker Creek
at St
.Pe
ters
burg
,Fla.
Bear
Creek
at St
.Pe
ters
burg
,Fla.
Sain
t Jo
esCreek
at St
.Petersburg,
Fla.
Turner St
reet
storm
drain
at Cl
ear-
wate
r, Fl
a.
Date
01-2
4-79
09-1
1-75
01-1
2-79
08-2
9-75
08-08-77
12-2
7-78
Number
of
samples
11 9 8 6 4 5
Total
runo
ff
volume
(acr
e-ft
)
32.1
28.9
29.3
13.1 1.48
2.83
Volume
from
first
to
last
samp
le ,
in pe
r
cent
of
total
45 75 71 33 55 27
Bio
chemi
cal
oxygen
demand
397
_21
5 12.5
60.2
. 24
.4
Load
Chem
i-
Tot
cal
nit
oxygen
dema
nd
7,940
162
3,75
01,
330
25
3,75
0
570
9462
4
, in po
unds
- Total
al
. or
gani
c ro-
* nitro-
n gen
139 48.5
.2
2.9
61.1
.7
4.8
.2
2.8
Total
phos
phorus
48.7
21.5 7.3
9.0
2.1
1.6
Total
lead
18.9
10.1 5.4
12.1 3.2
The stormwater loads from table 14 were used in a multiple linear-regres sion analysis that includes land use, antecedent rainfall, and stormwater-runoff volume as independent variables. The eight land-use classifications listed in table 1 were combined into three major categories (residential, developed, and natural) to combine land uses that have similar influences on runoff volumes and water quality. Residential consisted of single-family and multifamily residen tial land uses including the roads within the area. Developed consisted of com mercial, industrial, and institutional land uses including the roads within the area. Natural consisted of recreational and open space land uses. Combined percentages of land use for these three categories were converted to area in square miles and are listed in table 15. Storm rainfall and variables related to antecedent rainfall are listed in table 16.
Stepwise regression analysis of stormwater loads and various independent variables was performed. Results of the regression analyses are summarized in table 17. All independent variables were significant at the 95 percent level and appear in order of decreasing significance. The number of samples used, multiple correlation coefficient, and average standard error of estimate are also listed in table 17.
The ranges and definitions of input data for the stormwater-load equations are as follows:
Variable Minimum Maximum
RVAF 1.48 72DEVT .06 1.02RF14 .07 4.11RF7 0 2.50RF2 0 1.32DRYDAYS 0 16
where RVAF = Stormwater-runoff volume, in acre feet;
DEVT = Developed land area, in square miles;
RF14 = Amount of rainfall during the preceding 14 days, in inches;
RF7 = Amount of rainfall during the preceding 7 days, in inches;
RF2 = Amount of rainfall during the preceding 2 days, in inches;
DRYDAYS = Number of days prior to the storm with less than 0.1 inch of rainfall.
Stormwater-runoff volume (RVAF) was the most significant independent varia ble in all regression equations. Developed land area (DEVT) was the second most significant variable in the stormwater-load equations for chemical oxygen demand, total nitrogen, total phosphorus, and total lead. This indicates that the loads for these constituents are partly related to the amount of development (commer cial, industrial, institutional) in the watershed. Antecedent rainfall (RF2, RF7, and RF14) indicates the amount of rain available during the antecedent period to flush the watershed of pollutants, and the last variable (DRYDAYS) indicates the number of days available for pollutants to accumulate.
52
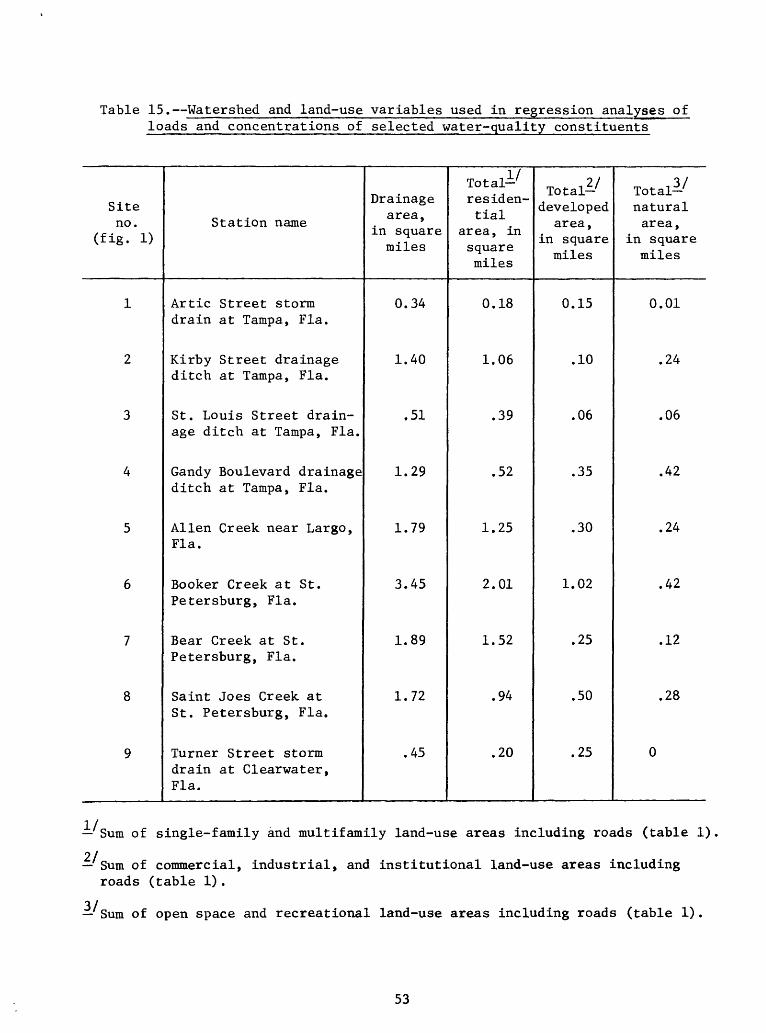
Table 15. Watershed and land-use variables used in regression analyses of loads and concentrations of selected water-quality constituents
Site no.
(fig. 1)
1
2
3
4
5
6
7
8
9
Station name
Artic Street stormdrain at Tampa, Fla.
Kirby Street drainage ditch at Tampa, Fla.
St. Louis Street drainage ditch at Tampa, Fla.
Gandy Boulevard drainage ditch at Tampa, Fla.
Alien Creek near Largo, Fla.
Booker Creek at St.Petersburg, Fla.
Bear Creek at St.Petersburg, Fla.
Saint Joes Creek atSt. Petersburg, Fla.
Turner Street stormdrain at Clearwater, Fla.
Drainage area,
in square miles
0.34
1.40
.51
1.29
1.79
3.45
1.89
1.72
.45
Total-/
residen tial
area, in square miles
0.18
1.06
.39
.52
1.25
2.01
1.52
.94
.20
Total-/
developed area,
in square miles
0.15
.10
.06
.35
.30
1.02
.25
.50
.25
Total-/
natural area,
in square miles
0.01
.24
.06
.42
.24
.42
.12
.28
0
Sum of single-family and multifamily land-use areas including roads (table 1)
21 Sum of commercial, industrial, and institutional land-use areas includingroads (table 1).
3/ Sum of open space and recreational land-use areas including roads (table 1).
53
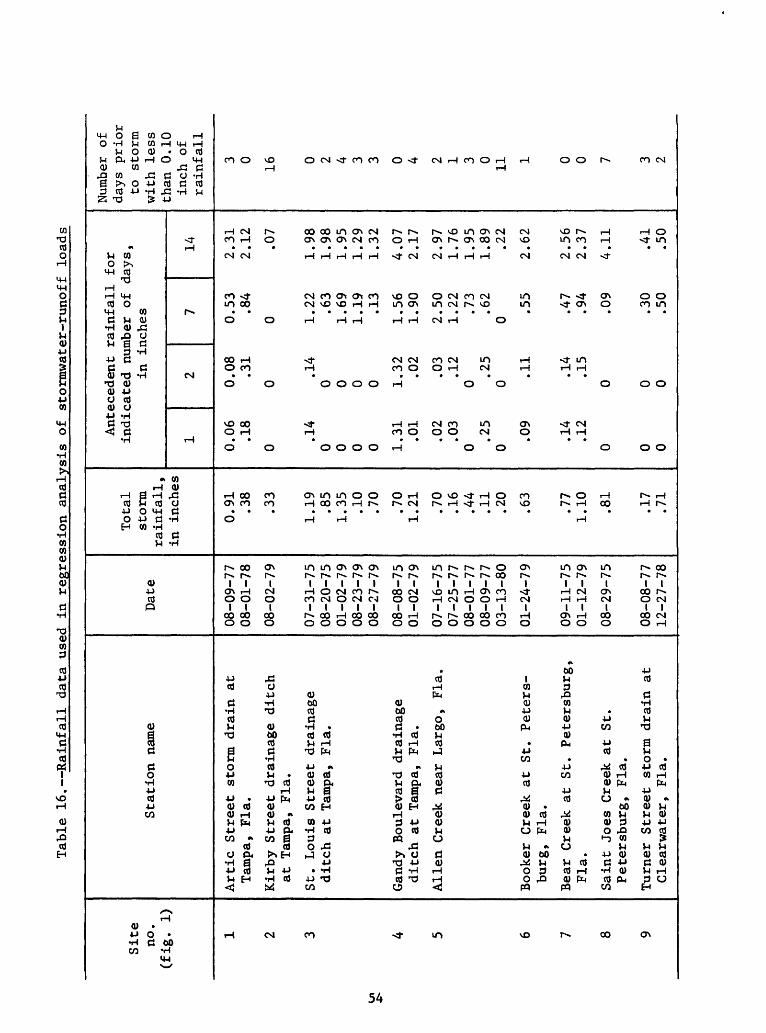
Table 16. Rainfall data used in regression an
alys
is of stormwater-runoff
load
s
Site
no.
(fig.
1)
1 2 3 4 5 6 7 8 9
Stat
ion
name
Artic St
reet
storm drain
atTa
mpa,
Fla.
Kirby St
reet
dr
aina
ge ditch
at Ta
mpa,
Fl
a.
St.
Louis St
reet
dr
aina
geditch
at Tampa, Fl
a.
Gandy B
oule
vard
drainage
ditch
at Ta
mpa,
Fl
a.
Alien Creek n
ear
Larg
o, Fl
a.
Booker
Cr
eek
at St.
Peters
burg
, Fl
a.
Bear Creek
at St
. Petersburg,
Fla.
Saint
Joes
Creek
at St
.Petersburg,
Fla.
Turn
er St
reet
storm
drain
atClearwater,
Fla.
Date
08-09-77
08-0
1-78
08-0
2-79
07-3
1-75
08-2
0-75
01-0
2-79
08-2
3-79
08-27-79
08-0
8-75
01-0
2-79
07-1
6-75
07-2
5-77
08-0
1-77
08-09-77
03-1
3-80
01-2
4-79
09-1
1-75
01-12-79
08-2
9-75
08-0
8-77
12-2
7-78
Total
storm
rain
fall
, in
in
ches
0.91 .38
.33
1.19 .85
1.35 .10
.70
.70
1.21 .70
.16
.44
.11
.20
.63
.77
1.10 .81
.17
.71
Ante
cede
nt ra
infa
llfor
indi
cate
d nu
mber
of
days,
in in
ches
1 0.06 .18
0
.14
0 0 0 0 1.31 .01
.02
.03
0.25
0
.09
.14
.12
0 0 0
2
0.08 .31
0
.14
0 0 0 0 1.32 .02
.03
.12
0.2
50
.11
.14
.15
0 0 0
7
0.53 .84
0 1.22 .63
1.69
1.19 .13
1.56
1.90
2.50
1.22 .73
.62
0
.55
.47
.94
.09
.30
.50
14 2.31
2.12 .07
1.98
1.98
1.95
1.29
1.32
4.07
2.17
2.97
1.76
1.95
1.89 .22
2.62
2.56
2.37
4.11 .41
.50
Numb
er of
days pr
ior
to st
orm
with le
ss
than 0.
10inch of
rain
fall
3 0
16
0 2 4 3 3 0 4 2 1 3 0 11 1 0 0 7 3 2
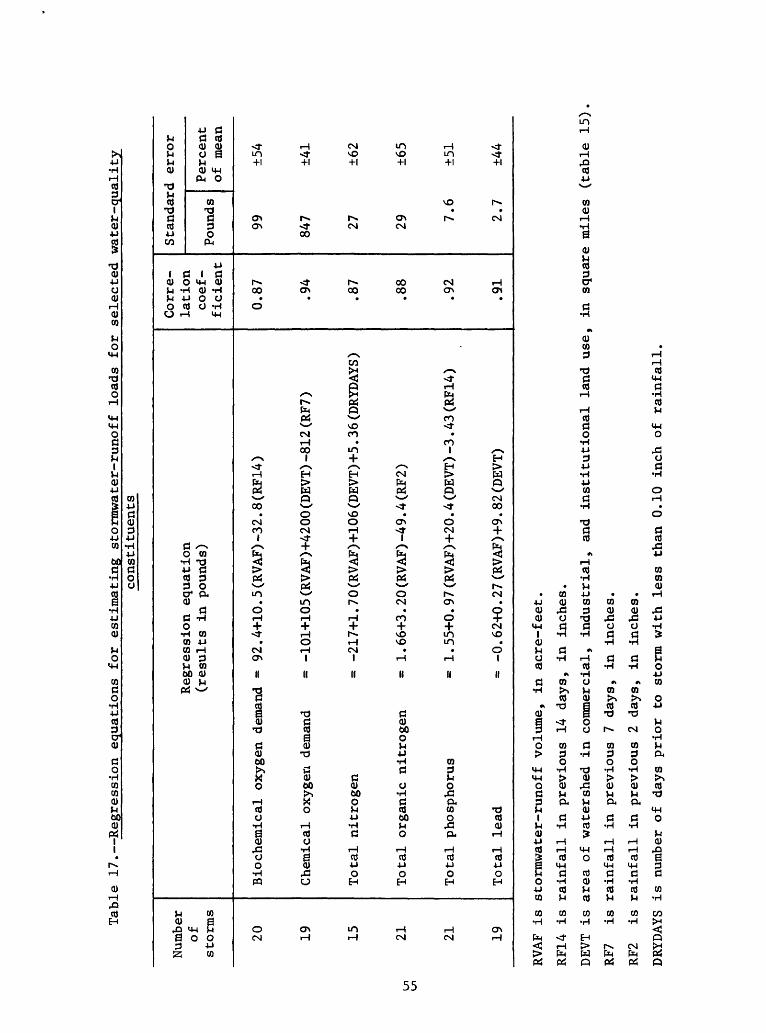
Table 17. Regression eq
uati
ons
for
esti
mati
ng st
ormw
ater
-run
off
loads
for
selected water-quality
cons
titu
ents
Number
of
stor
ms
20 19 15 21 21 19
Regr
essi
on eq
uati
on
(results in pounds)
Bioc
hemi
cal
oxyg
en de
mand
=
92.4+10.5(RVAF)-32.8(RF14)
Chemical oxygen demand
= -1
01+1
05(R
VAF)
+420
0(DE
VT)-
812(
RF7)
Total
nitrogen
= -217+1. 70 (RVAF)+106(DEVT)+5. 36 (DRYDAYS)
Total
orga
nic
nitr
ogen
=
1.66
+3. 20 (RV
AF) -4
9.4 (RF2)
Total
phosphorus
= 1.55+0. 97 (RV
AF)+
20. 4 (D
EVT)
-3.
43 (RF
14)
Total
lead
=
-0. 62
+0.2
7 (R
VAF)
+9.
82 (D
EVT)
Corre
lation
coef
ficient
0.87 .94
.87
.88
.92
.91
Standard er
ror
Poun
ds
99
847 27 29 7.
6
2.7
Percent
of mean
±54
±41
±62
±65
±51
±44
RVAF is
stormwater-runoff
volume,
in acre-feet.
RF14 is
ra
infa
ll in previous
14 da
ys,
in inches.
DEVT
is area of wa
ters
hed
in commercial,
industrial,
and
institutional
land use, in
sq
uare
miles (table 15)
RF7
is ra
infa
ll in pr
evio
us 7
days
, in
inches.
RF2
is ra
infa
ll in pr
evio
us 2
days
, in in
ches
.
DRYDAYS
is number of
days pr
ior
to storm wi
th le
ss th
an 0.
10 in
ch of rainfall.
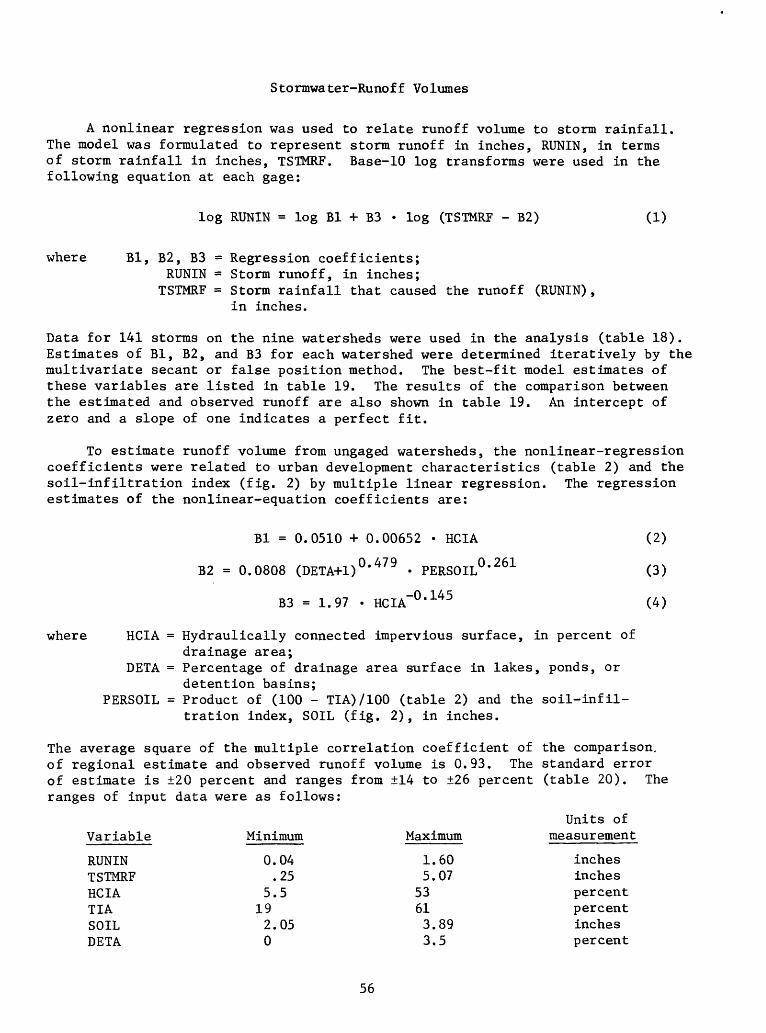
Stormwater-Runoff Volumes
A nonlinear regression was used to relate runoff volume to storm rainfall. The model was formulated to represent storm runoff in inches, RUNIN, in terms of storm rainfall in inches, TSTMRF. Base-10 log transforms were used in the following equation at each gage:
log RUNIN = log Bl + B3 log (TSTMRF - B2) (1)
where Bl, B2, B3 = Regression coefficients; RUNIN = Storm runoff, in inches;TSTMRF = Storm rainfall that caused the runoff (RUNIN),
in inches.
Data for 141 storms on the nine watersheds were used in the analysis (table 18). Estimates of Bl, B2, and B3 for each watershed were determined iteratively by the multivariate secant or false position method. The best-fit model estimates of these variables are listed in table 19. The results of the comparison between the estimated and observed runoff are also shown in table 19. An intercept of zero and a slope of one indicates a perfect fit.
To estimate runoff volume from ungaged watersheds, the nonlinear-regression coefficients were related to urban development characteristics (table 2) and the soil-infiltration index (fig. 2) by multiple linear regression. The regression estimates of the nonlinear-equation coefficients are:
Bl = 0.0510 + 0.00652 HCIA
B2 = 0.0808 (DETA+1) 0 * 479 PERSOIL0 ' 261
B3 = 1.97 HCIA-0.145
(2)
(3)
(4)
where HCIA = Hydraulically connected impervious surface, in percent ofdrainage area;
BETA = Percentage of drainage area surface in lakes, ponds, ordetention basins;
PERSOIL = Product of (100 - TIA)/100 (table 2) and the soil-infil tration index, SOIL (fig. 2), in inches.
The average square of the multiple correlation coefficient of the comparison, of regional estimate and observed runoff volume is 0.93. The standard error of estimate is ±20 percent and ranges from ±14 to ±26 percent (table 20). The ranges of input data were as follows:
Units of Variable Minimum Maximum measurement
RUNINTSTMRFHCIATIASOILBETA
0.04 .25
5.5192.050
15
53613
6007
893.5
inchesinchespercentpercentinchespercent
56
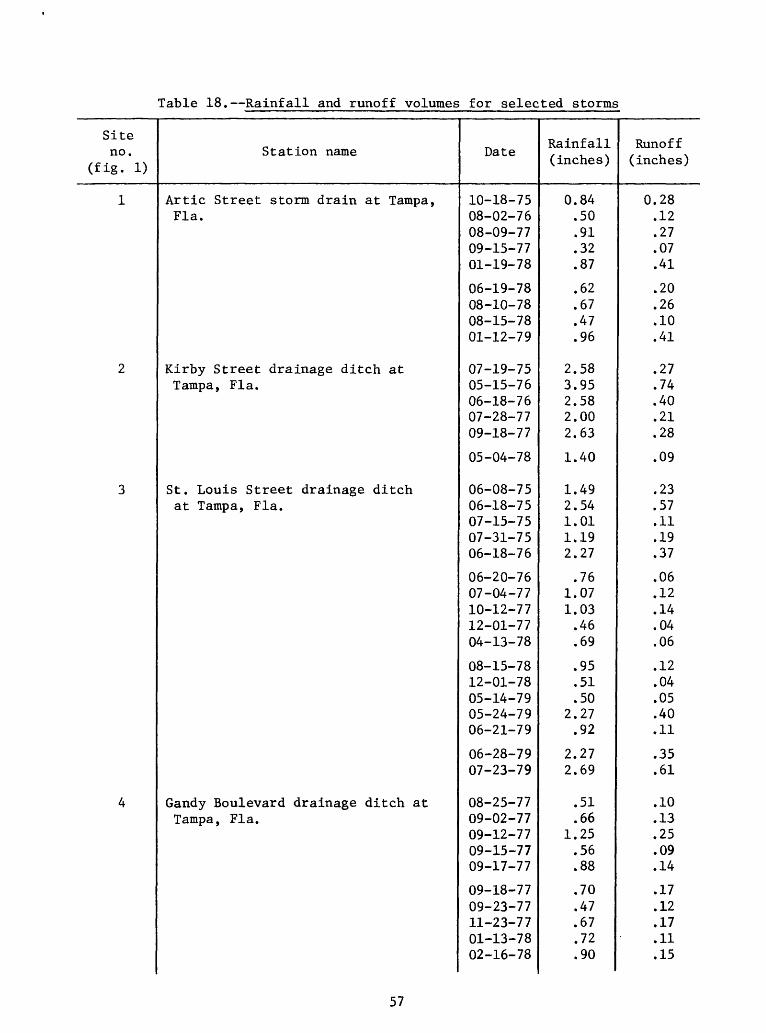
Table 18. Rainfall and runoff volumes for selected storms
Site no.
(fig. 1)
1
2
3
4
Station name
Artic Street storm drain at Tampa,Fla.
Kirby Street drainage ditch atTampa, Fla.
St. Louis Street drainage ditchat Tampa, Fla.
Gandy Boulevard drainage ditch atTampa, Fla.
Date
10-18-7508-02-7608-09-7709-15-7701-19-78
06-19-7808-10-7808-15-7801-12-79
07-19-7505-15-7606-18-7607-28-7709-18-77
05-04-78
06-08-7506-18-7507-15-7507-31-7506-18-76
06-20-7607-04-7710-12-7712-01-7704-13-78
08-15-7812-01-7805-14-7905-24-7906-21-79
06-28-7907-23-79
08-25-7709-02-7709-12-7709-15-7709-17-77
09-18-7709-23-7711-23-7701-13-7802-16-78
Rainfall (inches)
0.84.50.91.32.87
.62
.67
.47
.96
2.583.952.582.002.63
1.40
1.492.541.011.192.27
.761.071.03.46.69
.95
.51
.502.27.92
2.272.69
.51
.661.25.56.88
.70
.47
.67
.72
.90
Runoff (inches)
0.28.12.27.07.41
.20
.26
.10
.41
.27
.74
.40
.21
.28
.09
.23
.57
.11
.19
.37
.06
.12
.14
.04
.06
.12
.04
.05
.40
.11
.35
.61
.10
.13
.25
.09
.14
.17
.12
.17
.11
.15
57
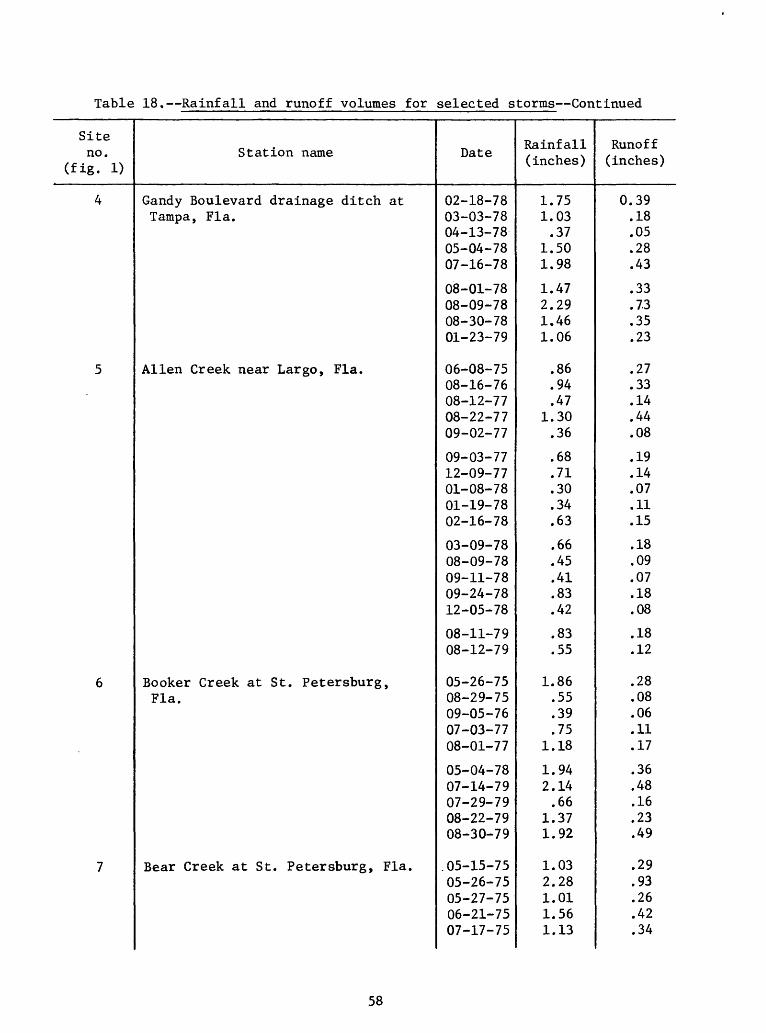
Table 18. Rainfall and runoff volumes for selected storms Continued
Site no.
(fig. 1)
4
5
6
7
Station name
Gandy Boulevard drainage ditch atTampa, Fla.
Alien Creek near Largo, Fla.
Booker Creek at St. Petersburg,Fla.
Bear Creek at St. Petersburg, Fla.
Date
02-18-7803-03-7804-13-7805-04-7807-16-78
08-01-7808-09-7808-30-7801-23-79
06-08-7508-16-7608-12-7708-22-7709-02-77
09-03-7712-09-7701-08-7801-19-7802-16-78
03-09-7808-09-7809-11-7809-24-7812-05-78
08-11-7908-12-79
05-26-7508-29-7509-05-7607-03-7708-01-77
05-04-7807-14-7907-29-7908-22-7908-30-79
.05-15-7505-26-7505-27-7506-21-7507-17-75
Rainfall (inches)
1.751.03.37
1.501.98
1.472.291.461.06
.86
.94
.471.30.36
.68
.71
.30
.34
.63
.66
.45
.41
.83
.42
.83
.55
1.86.55.39.75
1.18
1.942.14.66
1.371.92
1.032.281.011.561.13
Runoff (inches)
0.39.18.05.28.43
.33
.73
.35
.23
.27
.33
.14
.44
.08
.19
.14
.07
.11
.15
.18
.09
.07
.18
.08
.18
.12
.28
.08
.06
.11
.17
.36
.48
.16
.23
.49
.29
.93
.26
.42
.34
58
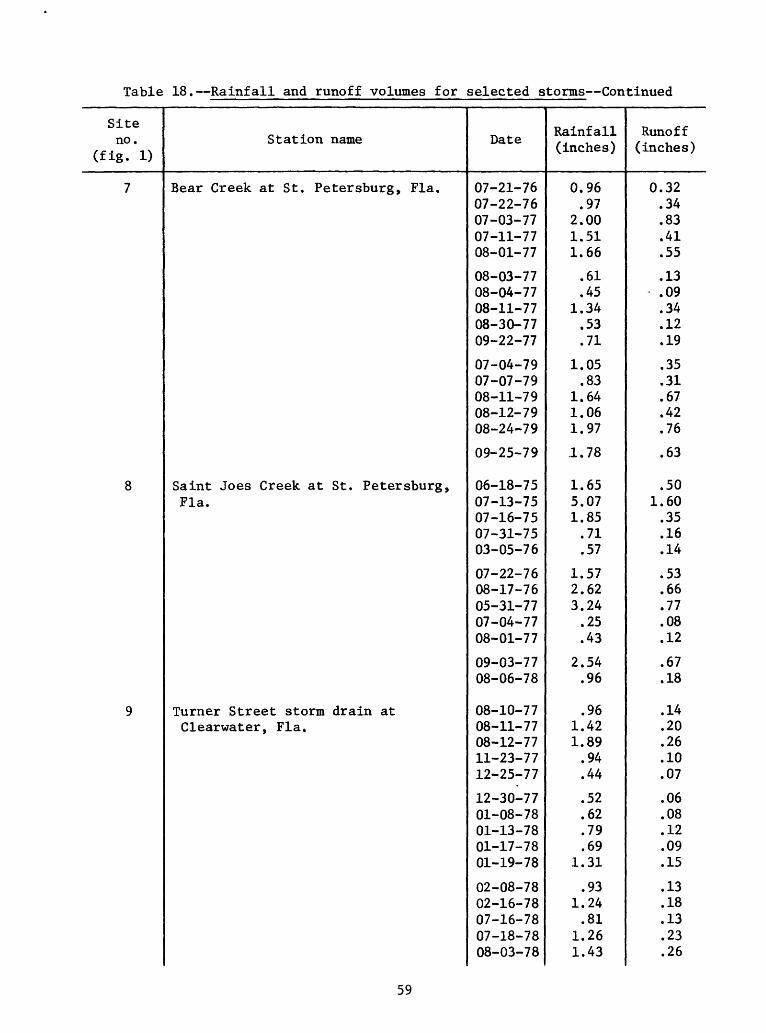
Table 18. Rainfall and runoff volumes for selected storms Continued
Site no.
(fig. 1)
7
8
9
Station name
Bear Creek at St. Petersburg, Fla.
Saint Joes Creek at St. Petersburg,Fla.
Turner Street storm drain atClearwater, Fla.
Date
07-21-7607-22-7607-03-7707-11-7708-01-77
08-03-7708-04-7708-11-7708-30-7709-22-77
07-04-7907-07-7908-11-7908-12-7908-24-79
09-25-79
06-18-7507-13-7507-16-7507-31-7503-05-76
07-22-7608-17-7605-31-7707-04-7708-01-77
09-03-7708-06-78
08-10-7708-11-7708-12-7711-23-7712-25-77
12-30-7701-08-7801-13-7801-17-7801-19-78
02-08-7802-16-7807-16-7807-18-7808-03-78
Rainfall (inches)
0.96.97
2.001.511.66
.61
.451.34.53.71
1.05.83
1.641.061.97
1.78
1.655.071.85.71.57
1.572.623.24.25.43
2.54.96
.961.421.89.94.44
.52
.62
.79
.691.31
.931.24.81
1.261.43
Runoff (inches)
0.32.34.83.41.55
.13
.09
.34
.12
.19
.35
.31
.67
.42
.76
.63
.501.60.35.16.14
.53
.66
.77
.08
.12
.67
.18
.14
.20
.26
.10
.07
.06
.08
.12
.09
.15
.13
.18
.13
.23
.26
59
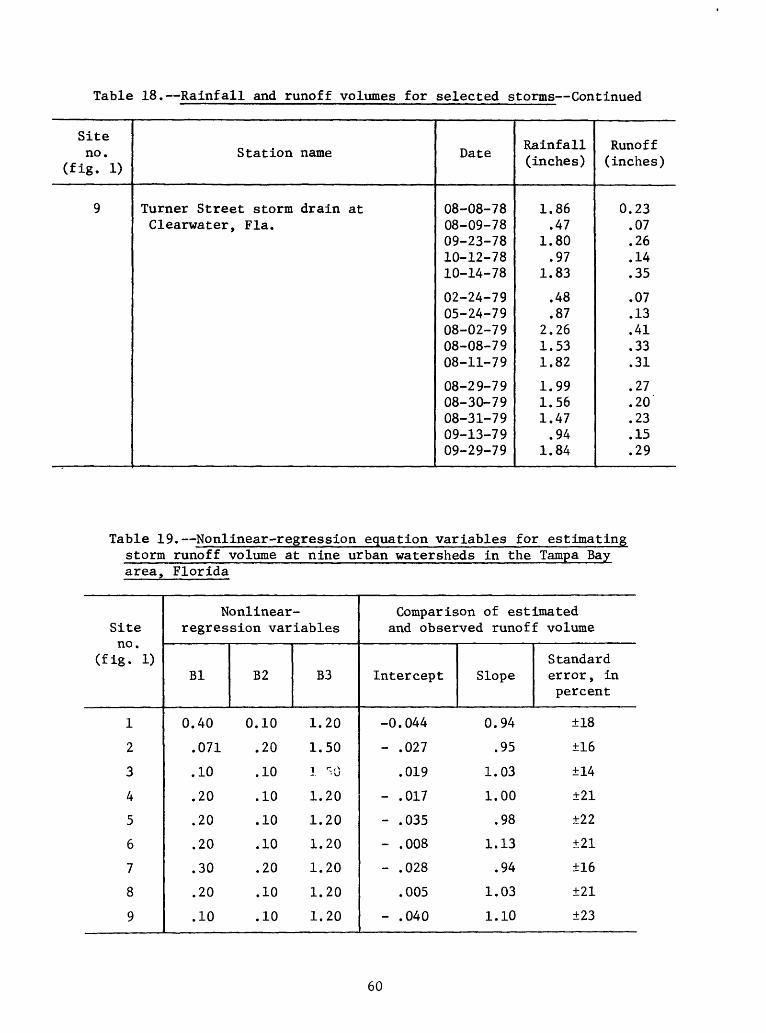
Table 18. Rainfall and runoff volumes for selected storms Continued
Site no.
(fig. 1)
9
Station name
Turner Street storm drain atClearwater, Fla.
Date
08-08-7808-09-7809-23-7810-12-7810-14-78
02-24-7905-24-7908-02-7908-08-7908-11-79
08-29-7908-30-7908-31-7909-13-7909-29-79
Rainfall (inches)
1.86.47
1.80.97
1.83
.48
.872.261.531.82
1.991.561.47.94
1.84
Runoff (inches)
0.23.07.26.14.35
.07
.13
.41
.33
.31
.27
.20
.23
.15
.29
Table 19. Nonlinear-regression equation variables for estimating storm runoff volume at nine urban watersheds in the Tampa Bay area, Florida
Site no.
(fig. 1)
1
2
3
4
5
6
7
8
9
Nonlinear- regression variables
Bl
0.40
.071
.10
.20
.20
.20
.30
.20
.10
B2
0.10
.20
.10
.10
.10
.10
.20
.10
.10
B3
1.20
1.501 "0
1.20
1.20
1.20
1.20
1.20
1.20
Comparison of estimated and observed runoff volume
Intercept
-0.044
- .027
.019
- .017
- .035
- .008
- .028
.005
- .040
Slope
0.94
.95
1.03
1.00
.98
1.13
.94
1.03
1.10
Standard error , inpercent
±18
±16
±14
±21
±22
±21
±16
±21
±23
60
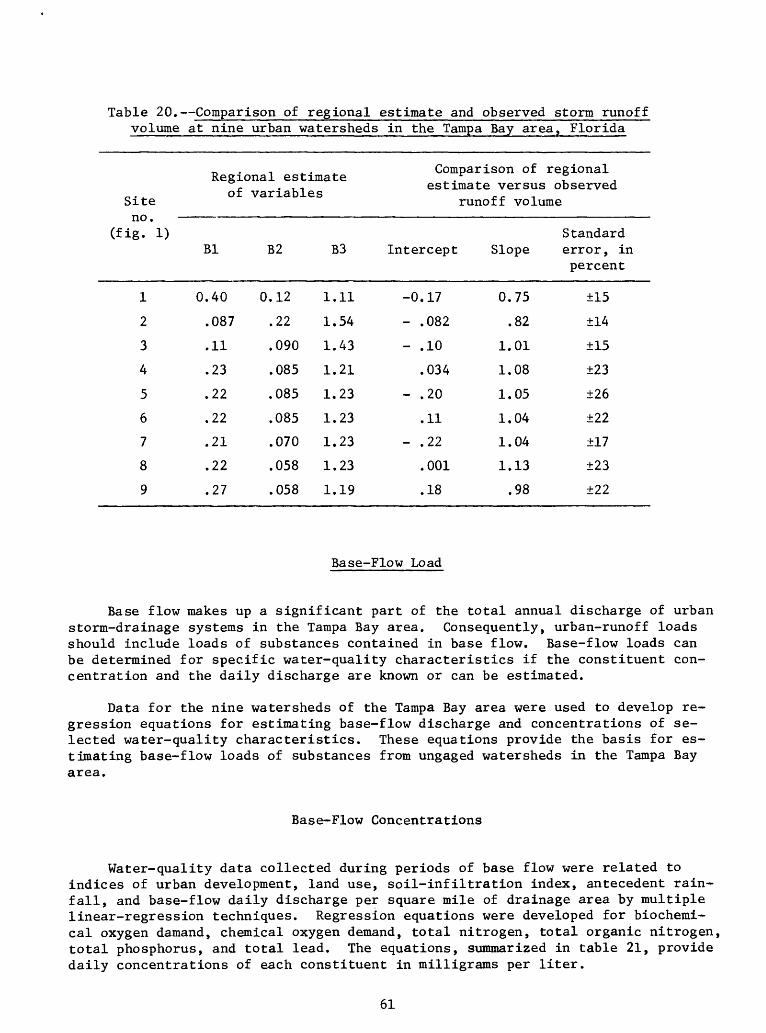
Table 20. Comparison of regional estimate and observed storm runoff volume at nine urban watersheds in the Tampa Bay area, Florida
Regional estimate Comparison of regional estimate versus observed
Site no.
(fig. 1)
1
2
3
4
5
6
7
8
9
runoff volume
Bl
0.40
.087
.11
.23
.22
.22
.21
.22
.27
B2
0.12
.22
.090
.085
.085
.085
.070
.058
.058
B3
1.11
1.54
1.43
1.21
1.23
1.23
1.23
1.23
1.19
Intercept
-0.17
- .082
- .10
.034
- .20
.11
- .22
.001
.18
Slope
0.75
.82
1.01
1.08
1.05
1.04
1.04
1.13
.98
Standard error , in percent
±15
±14
±15
±23
±26
±22
±17
±23
±22
Base-Flow Load
Base flow makes up a significant part of the total annual discharge of urban storm-drainage systems in the Tampa Bay area. Consequently, urban-runoff loads should include loads of substances contained in base flow. Base-flow loads can be determined for specific water-quality characteristics if the constituent con centration and the daily discharge are known or can be estimated.
Data for the nine watersheds of the Tampa Bay area were used to develop re gression equations for estimating base-flow discharge and concentrations of se lected water-quality characteristics. These equations provide the basis for es timating base-flow loads of substances from ungaged watersheds in the Tampa Bay area.
Base-Flow Concentrations
Water-quality data collected during periods of base flow were related to indices of urban development, land use, soil-infiltration index, antecedent rain fall, and base-flow daily discharge per square mile of drainage area by multiple linear-regression techniques. Regression equations were developed for biochemi cal oxygen damand, chemical oxygen demand, total nitrogen, total organic nitrogen, total phosphorus, and total lead. The equations, summarized in table 21, provide daily concentrations of each constituent in milligrams per liter.
61
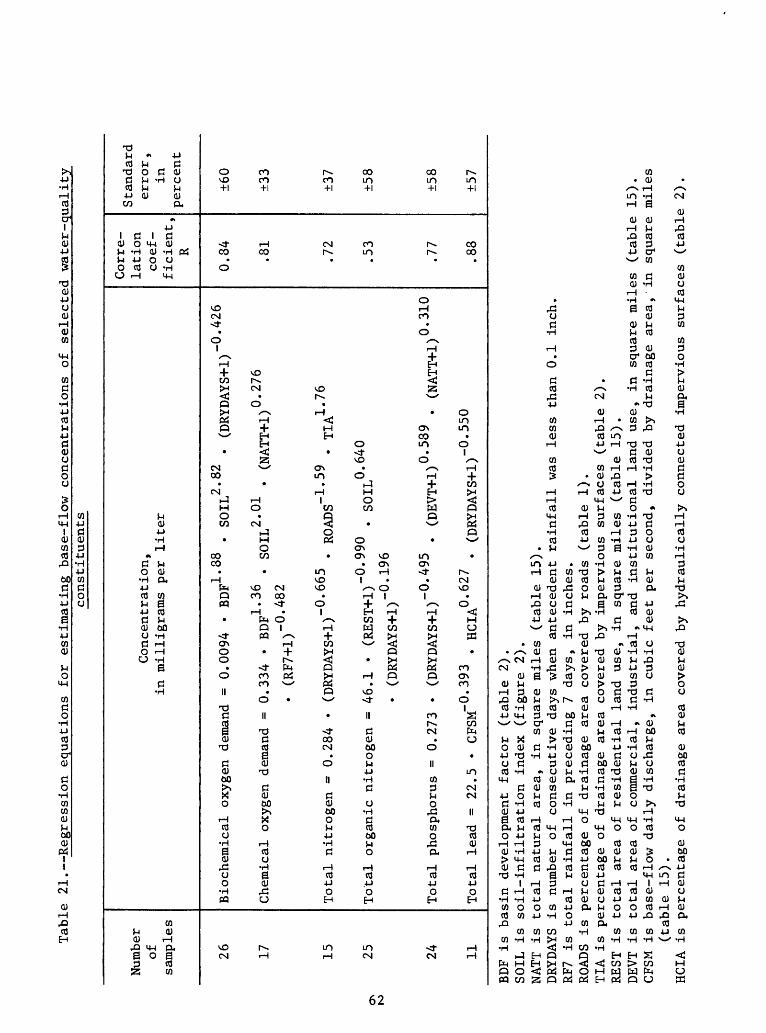
Table
21. Regression eq
uati
ons
for
esti
mati
ng base-flow
conc
entr
atio
ns of se
lect
ed water-quality
constituents
Number
of
samples
26 17 15 25 24 11
Conc
entr
atio
n,
in mil
ligr
ams
per
liter
1 QQ
o
R9
n A2
6 Bi
oche
mica
l oxygen de
mand
=
0.00
94
BDF
SO
IL
(DRYDAYS+1)
U'H
^U
1 Q£
9
rvi
rv 97 f.
Chemical oxygen demand =
0.33
4 BDF
*°
SOIL
(N
ATT+
1)
'
(RF7
+1)-
0*482
Total
nitrogen =
0.28
4
(DRY
DAYS
+1) ~°
*665
. RO
ADS"
1*59
TIA1
'76
Total
organic
nitrogen =
46.1
(REST+1)"0
' "°
SOIL
0'640
(DRY
DAYS
+1) ~°
*196
Total
phosphorus =
0.27
3
(DRY
DAYS
+1 )~°'495
. (D
EVT+
1)0
*589
(NAT
T+1)
0*310
Total
lead =
22.5
CF
SM~°
t393
HCIA°'
627
(DRYDAYS+1 )~°'55
°
Corre
lati
on
coef
ficient,
R
0.84 .81
.72
.53
.77
.88
Stan
dard
error
, in
percent
±60
±33
±37
±58
±58
±57
BDF
is basin
deve
lopm
ent
fact
or (t
able
2).
SOIL is
soil-infiltration
inde
x (f
igure
2).
NATT is total
natural
area
, in
sq
uare miles (table 15
).DR
YDAYS
is nu
mber
of co
nsec
utiv
e da
ys when antecedent rainfall wa
s le
ss th
an 0.
1 in
ch.
RF7
is total
rain
fall
in
preceding
7 da
ys,
in in
ches
.RO
ADS
is pe
rcen
tage
of drainage ar
ea covered
by ro
ads
(tab
le 1)
.TIA
is pe
rcen
tage
of
dr
aina
ge ar
ea covered
by im
perv
ious
su
rfac
es (table 2).
REST is
total
area
of
residential
land
us
e, in
sq
uare
miles (table 15).
DEVT is
total
area of
co
mmer
cial
, in
dustrial,
and
inst
itut
iona
l la
nd use, in
squa
re miles
(table 15
).CFSM is base-flow
daily
disc
harg
e, in
cu
bic
feet pe
r second,
divided
by drainage ar
ea,
in square miles
(table 15
).
HCIA is pe
rcen
tage
of
drainage ar
ea co
vere
d by
hydraulically
connected
impe
rvio
us su
rfac
es (t
able
2)
.
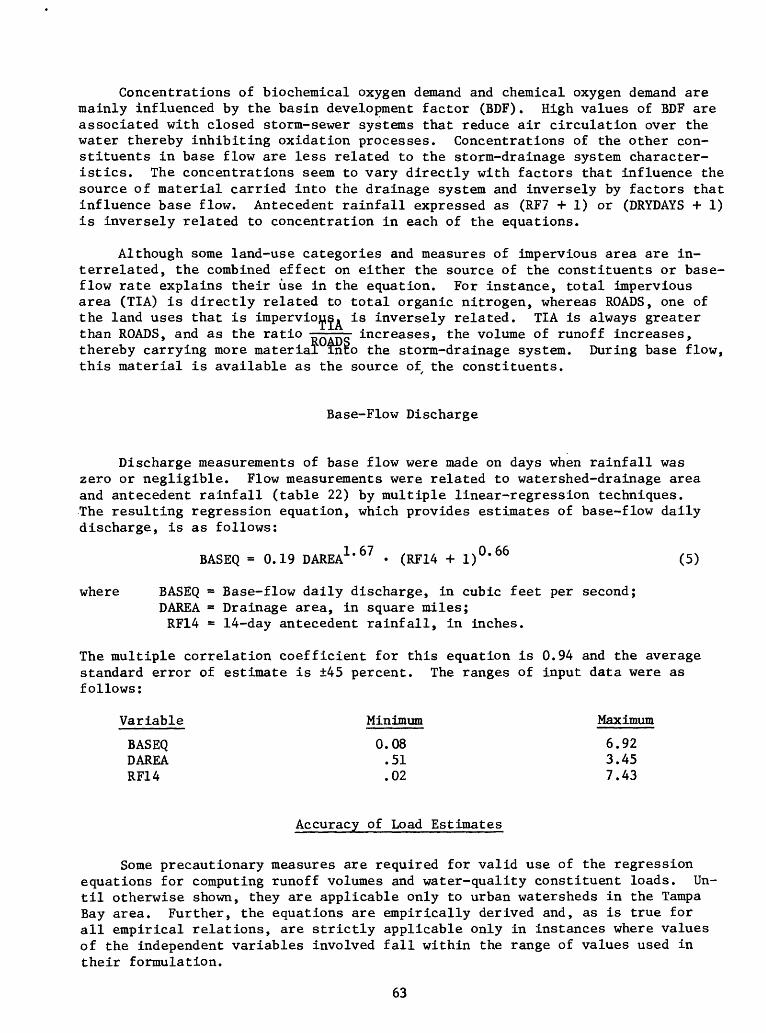
Concentrations of biochemical oxygen demand and chemical oxygen demand are mainly influenced by the basin development factor (BDF). High values of BDF are associated with closed storm-sewer systems that reduce air circulation over the water thereby inhibiting oxidation processes. Concentrations of the other con stituents in base flow are less related to the storm-drainage system character istics. The concentrations seem to vary directly with factors that influence the source of material carried into the drainage system and inversely by factors that influence base flow. Antecedent rainfall expressed as (RF7 + 1) or (DRYDAYS + 1) is inversely related to concentration in each of the equations.
Although some land-use categories and measures of impervious area are in terrelated, the combined effect on either the source of the constituents or base- flow rate explains their use in the equation. For instance, total impervious area (TIA) is directly related to total organic nitrogen, whereas ROADS, one of the land uses that is impervious, is inversely related. TIA is always greater than ROADS, and as the ratio increases, the volume of runoff increases, thereby carrying more material into the storm-drainage system. During base flow, this material is available as the source of the constituents.
Base-Flow Discharge
Discharge measurements of base flow were made on days when rainfall was zero or negligible. Flow measurements were related to watershed-drainage area and antecedent rainfall (table 22) by multiple linear-regression techniques. The resulting regression equation, which provides estimates of base-flow daily discharge, is as follows:
BASEQ = 0.19 DAREA1 ' 67 (RF14 + i)°' 66 (5)
where BASEQ = Base-flow daily discharge, in cubic feet per second; DAREA = Drainage area, in square miles; RF14 = 14-day antecedent rainfall, in inches.
The multiple correlation coefficient for this equation is 0.94 and the average standard error of estimate is ±45 percent. The ranges of input data were as follows:
Variable Minimum Maximum
BASEQ 0.08 6.92DAREA .51 3.45RF14 .02 7.43
Accuracy of Load Estimates
Some precautionary measures are required for valid use of the regression equations for computing runoff volumes and water-quality constituent loads. Un til otherwise shown, they are applicable only to urban watersheds in the Tampa Bay area. Further, the equations are empirically derived and, as is true for all empirical relations, are strictly applicable only in instances where values of the independent variables involved fall within the range of values used in their formulation.
63
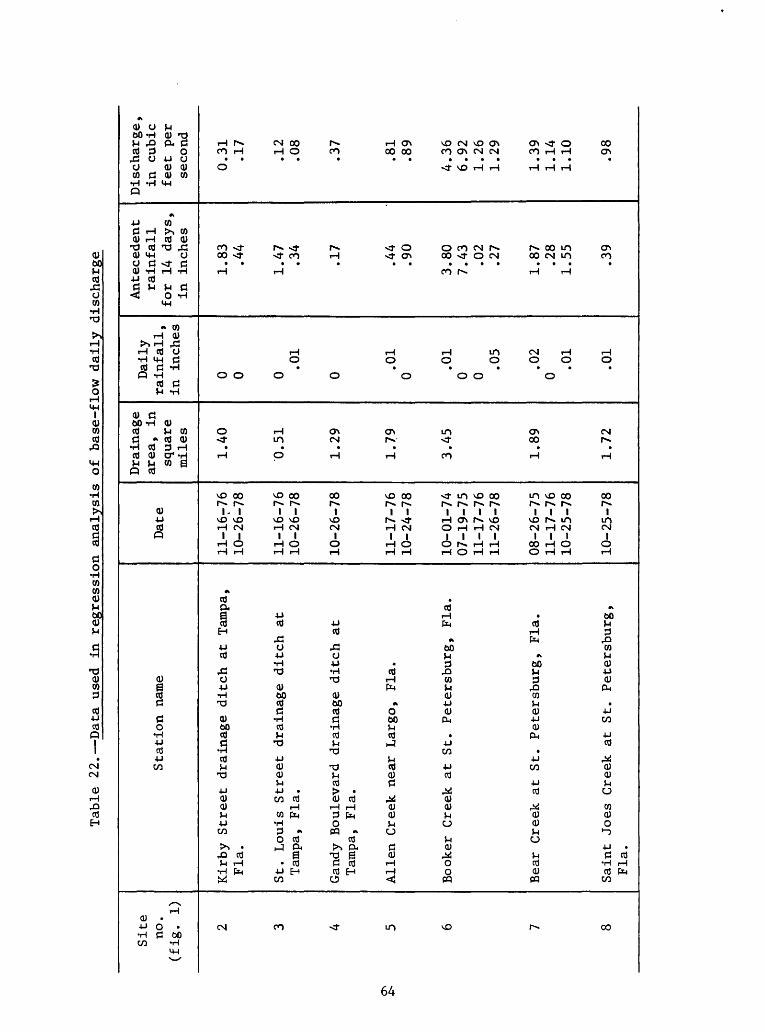
Table 22. Data used in regression analysis of
base-flow daily
disc
harg
e
Site
no
. (fig.
1)
2 3 4 5 6 7 8
Station
name
Kirby St
reet
dr
aina
ge ditch
at Tampa,
Fla.
St.
Louis
Stre
et dr
aina
ge ditch
at
Tampa, Fl
a.
Gandy
Boul
evar
d dr
aina
ge ditch
at
Tampa, Fl
a.
Alien
Creek
near
Largo, Fl
a.
Book
er Creek
at St
. Pe
tersburg,
Fla.
Bear
Creek
at St
. Pe
tersburg,
Fla.
Sain
t Jo
es Creek
at St
. Pe
ters
burg
, Fl
a.
Date
11-1
6776
10-2
6-78
11-1
6-76
10
-26-
78
10-2
6-78
11-1
7-76
10-24-78
10-01-74
07-1
9-75
11-17-76
11-2
6-78
08-2
6-75
11-17-76
10-2
5-78
10-2
5-78
Drainage
area
, in
squa
re
miles
1.40
0.51
1.29
1.79
3.45
1.89
1.72
Daily
rain
fall,
in in
ches
0 0 0 .0
1
0
.01
0
.01
0 0.0
5
.02
0.0
1
.01
Antecedent
rainfall
for
14 da
ys,
in inches
1.83
.44
1.47
.34
.17
.44
.90
3.80
7.43 .02
.27
1.87
.28
1.55 .39
Disc
harg
e,
in cubic
feet per
seco
nd
0.31
.17
.12
.08
.37
.81
.89
4.36
6.92
1.26
1.29
1.39
1.14
1.10 .98
At an ungaged site, an estimate of storm-runoff volume will be computed by equation 1, and this estimate will have an error associated with it. To evaluate the possible magnitude of this error in the computation of storm load, the regres sion estimate for runoff volume (equation 1) was used in the multiple linear re gression instead of the observed volume. The standard errors were as follows:
Constituent load
Biochemical oxygen demandChemical oxygen demandTotal nitrogenTotal organic nitrogenTotal phosphorusTotal lead
Standard error, in percent of the mean
±99±82±69
±137 ±109±79
Except for error for total nitrogen, these standard errors are greater than the sum of the runoff-volume estimate (±20 percent) and the constituent load es timates (table 17). The reason for this may be that the rainfall recorded during the storms that were sampled were not representative of the rainfall over the watershed. Only 2 of the storms for which storm loads were computed (table 14) were in the 141 storms used for the runoff-volume regressions (table 18). The regression estimates for constituent loads and runoff volume are applied to un gaged watersheds assuming uniform rainfall over the area. Therefore, the regres sion estimates for storm loads from ungaged watersheds probably have errors less than those listed above.
Similarly, at an ungaged site, the base-flow discharge will be estimated by equation 5, and this estimate will have an error. The estimated base-flow load error will be some combination of the constituent concentration error (table 21) and discharge error (±45 percent), but not necessarily the sum. For the modeled constituents, except total lead, the load estimate would tend to vary as the es timated discharge. The errors in the load estimate of total lead would tend to offset each other because, as discharge increases, concentration decreases.
Annual Loads
The annual load of substances contained in urban runoff is the sum of the stormwater and base-flow loads for a year. The regression equations of tables 17 and 21 were used with streamflows estimated by use of equations 1 and 5 to determine daily stormwater and base-flow loads that were summed for the 1979 water year (October 1, 1978, to September 30, 1979). Computations were per formed for six water-quality constituents for each of the nine Tampa Bay area watersheds. Annual totals are shown in table 23.
Although rainfall differed appreciably among the nine watersheds, the same daily rainfall data that of St. Louis Street drainage ditch station were used in computations of runoff and annual loads for all watersheds. Consequently, the differences in the computed runoff from the various watersheds shown in table 23 are due to differences in land use and watershed characteristics. The differences in runoff are reflected in the magnitude of the computed basin loads of the vari ous substances involved because runoff volume enters directly into the load compu tations. It follows, generally, that the higher the ratio of base flow to annual runoff, the higher the ratio of base-flow load to annual load.
65
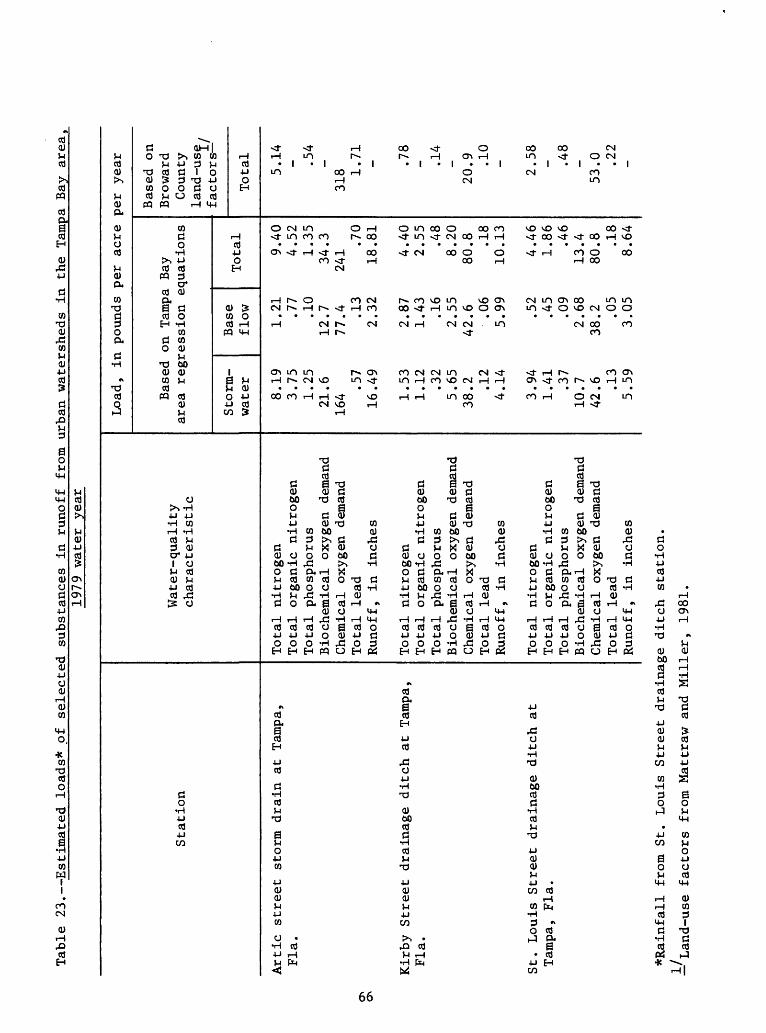
Table
23. Estimated lo
ads*
of se
lect
ed substances in
ru
noff
fr
om ur
ban
watersheds in
th
e Tampa
Bay
area
,1979 water
year
Station
Artic
street st
orm
drain
at Ta
mpa,
Fla.
Kirby
Stre
et drainage ditch
at Tampa,
Fla.
St.
Louis
Street
dr
aina
ge di
tch
atTa
mpa, Fla.
Wate
r-qu
alit
y ch
arac
teri
stic
Tota
l ni
trog
enTotal
organic
nitrogen
Total
phosphorus
Bioc
hemi
cal
oxygen de
mand
Chem
ical
oxygen de
mand
Tota
l lead
Runoff,
in in
ches
Total
nitr
ogen
Tota
l or
gani
c ni
trog
enTotal
phosphorus
Biochemical
oxygen de
mand
Chem
ical
ox
ygen
de
mand
Total
lead
Runoff,
in in
ches
Tota
l nitrogen
Total
organic
nitrogen
Total
phosphorus
Bioc
hemi
cal
oxyg
en de
mand
Chem
ical
oxygen de
mand
Tota
l le
adRu
noff
, in
in
ches
Load
, in pounds
per
acre
per
year
Base
d on Ta
mpa
Bay
area
regression equations
Stor
m-water
8.19
3.75
1.25
21.6
164.5
716.49
1.53
1.12 .32
5.65
38.2 .1
24.
14
3.94
1.41 .37
10.7
42.6 .1
35.
59
Base
flow 1.21 .77
.10
12.7
77.4 .1
32.
32
2.87
1.43 .16
2.55
42.6 .0
65.99 .52
.45
.09
2.68
38.2 .0
53.05
Total
9.40
4.52
1.35
34.3
241.7
018
.81
4.40
2.55 .48
8.20
80.8 .1
810
.13
4.46
1.86 .46
13.4
80.8 .1
88.
64
Based
onBr
owar
d Co
unty
land -us
e.f Q r*
i~ n T"
G^
J-ci
i* U<JJL o
Tota
l
5.14 - .54
-31
8 1.71 - .78
- .14
-20.9 .1
0-
2.58 - .48
-53.0 .2
2-
*Rai
nfal
l fr
om St
. Louis
Stre
et dr
aina
ge ditch
stat
ion.
Land-use
factors
from
Mattraw an
d Mi
ller
, 19
81.
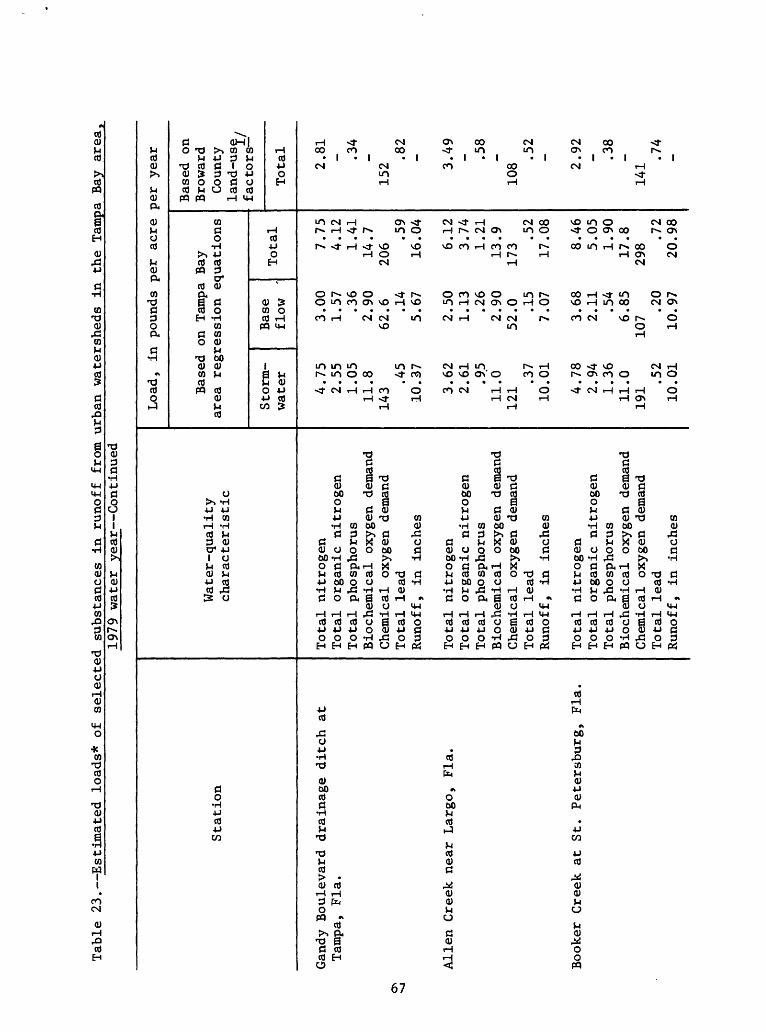
Table
23. Estimated lo
ads*
of se
lect
ed substances in ru
noff
fr
om urban wa
ters
heds
in
the
Tampa
Bay
area
,19
79 water
year Continued
Station
Gandy
Boulevard
drainage ditch
atTampa, Fla.
Alien
Creek near La
rgo,
Fla.
Book
er Creek
at St
. Pe
ters
burg
, Fl
a.
Wate
r-qu
alit
y ch
arac
teri
stic
Tota
l nitrogen
Total
orga
nic
nitrogen
Tota
l phosphorus
Bioc
hemi
cal
oxygen de
mand
Chemical oxygen demand
Total
lead
Runoff,
in in
ches
Tota
l nitrogen
Total
organic
nitrogen
Total
phos
phor
usBiochemical
oxygen de
mand
Chem
ical
oxygen demand
Total
lead
Runoff,
in in
ches
Tota
l nitrogen
Tota
l organic
nitrogen
Total
phosphorus
Biochemical
oxygen de
mand
Chem
ical
oxygen de
mand
Tota
l le
adRunoff,
in in
ches
Load,
in po
unds
per
acre
pe
r ye
ar
Base
d on Ta
mpa
Bay
area regression eq
uati
ons
Stor
m-water
4.75
2.55
1.05
11.8
143.4
510.37
3.62
2.61 95
11.0
121.3
710.01
4.78
2.94
1.36
11.0
191.5
210.01
Base
flow 3.00
1.57 .36
2.90
62.6 .1
45.
67
2.50
1.13 .26
2.90
52.0 .1
57.07
3.68
2.11 .54
6.85
107.2
010
.97
Total
7.75
4.12
1.41
14.7
206.5
916
.04
6.12
3.74
1.21
13.9
173.52
17.08
8.46
5.05
1.90
17.8
298.7
220
.98
Based
onBr
owar
d Co
unty
la
nd-u
se ,
factors-
Total
2.81 - .34
-152.8
2-
3.49 - .58
-10
8.5
2-
2.92 - .38
-141.7
4-
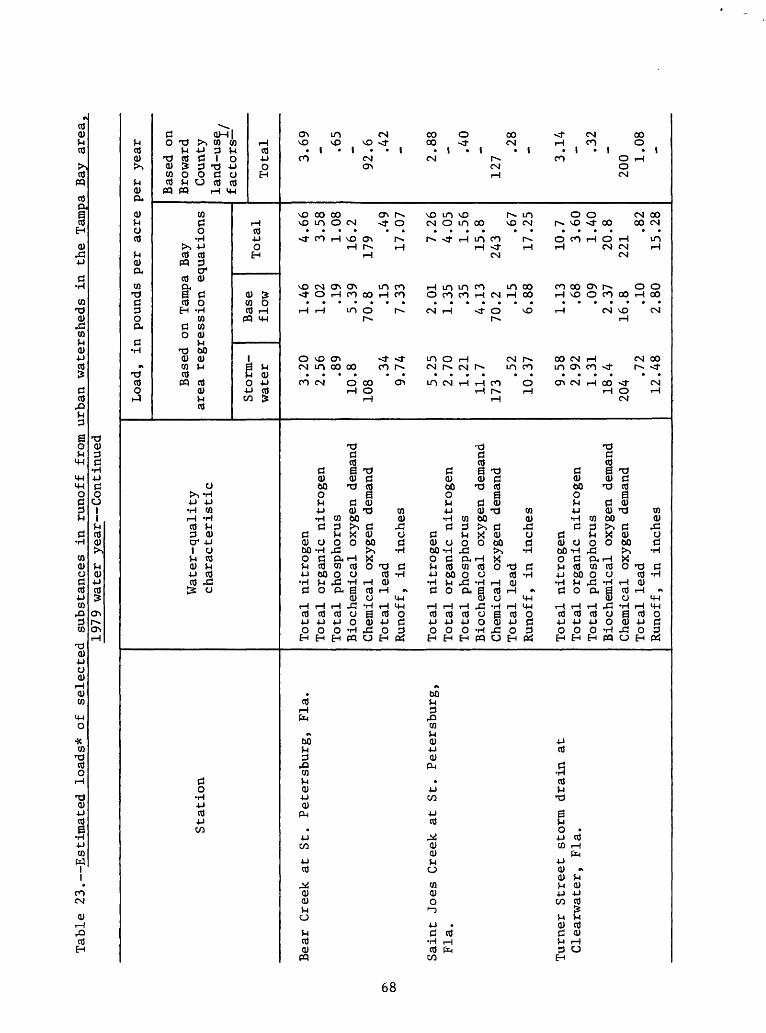
Table
23. Estimated lo
ads*
of
se
lect
ed su
bsta
nces
in ru
noff
from u
rban watersheds
in th
e Ta
mpa
Bay
area
,1979 water
year Continued
Stat
ion
Bear Creek
at St
. Petersburg,
Fla.
Saint
Joes
Creek
at St
. Petersburg,
Fla.
Turner St
reet
st
orm
drain
atClearwater,
Fla.
Water-quality
characteristic
Tota
l nitrogen
Tota
l or
gani
c nitrogen
Total
phosphorus
Bioc
hemi
cal
oxygen demand
Chem
ical
oxygen demand
Total
lead
Runo
ff,
in inches
Total
nitr
ogen
Total
organic
nitr
ogen
Total
phos
phor
usBi
oche
mica
l oxygen de
mand
Chemical oxygen demand
Tota
l le
adRu
noff
, in
inches
Total
nitr
ogen
Tota
l organic
nitr
ogen
Tota
l phosphorus
Bioc
hemi
cal
oxygen demand
Chem
ical
ox
ygen
de
mand
Tota
l lead
Runoff,
in in
ches
Load
, in po
unds
per
acre
per
year
Based
on Ta
mpa
Bay
area re
gres
sion
eq
uati
ons
Stor
m-wa
ter
3.20
2.56 .89
10.8
108.3
49.
74
5.25
2.70
1.21
11.7
173.52
10.3
7
9.58
2.92
1.31
18.4
204.72
12.4
8
Base
flow 1.46
1.02 .19
5.39
70.8 .1
57.33
2.01
1.35 .35
4.13
70.2 .1
56.88
1.13 .68
.09
2.37
16.8 .1
02.80
Tota
l
4.66
3.58
1.08
16.2
179.49
17.07
7.26
4.05
1.56
15.8
243.67
17.25
10.7 3.60
1.40
20.8
221.82
15.2
8
Based
onBr
owar
d County
land -us
e.J- cH» Uw J. £>
Total
3.69 - .65
-92.6 .4
2-
2.88 - .40
-12
7.2
8-
3.14 - .32
-200 1.
08 -
00
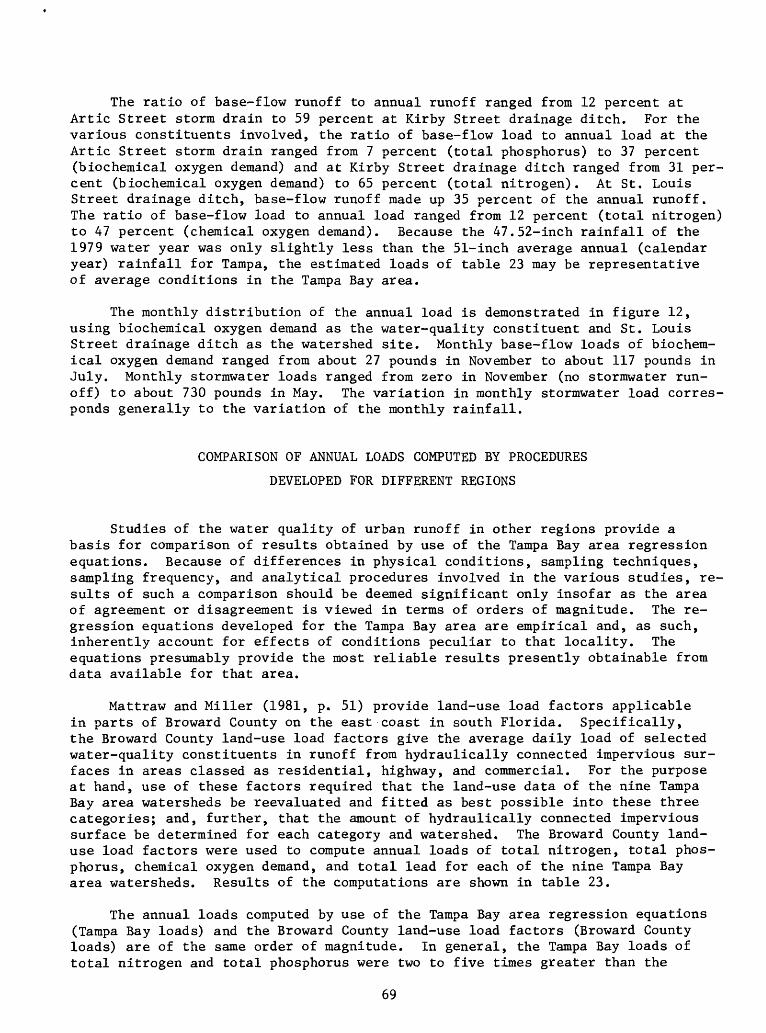
The ratio of base-flow runoff to annual runoff ranged from 12 percent at Artic Street storm drain to 59 percent at Kirby Street drainage ditch. For the various constituents involved, the ratio of base-flow load to annual load at the Artic Street storm drain ranged from 7 percent (total phosphorus) to 37 percent (biochemical oxygen demand) and at Kirby Street drainage ditch ranged from 31 per cent (biochemical oxygen demand) to 65 percent (total nitrogen). At St. Louis Street drainage ditch, base-flow runoff made up 35 percent of the annual runoff. The ratio of base-flow load to annual load ranged from 12 percent (total nitrogen) to 47 percent (chemical oxygen demand). Because the 47.52-inch rainfall of the 1979 water year was only slightly less than the 51-inch average annual (calendar year) rainfall for Tampa, the estimated loads of table 23 may be representative of average conditions in the Tampa Bay area.
The monthly distribution of the annual load is demonstrated in figure 12, using biochemical oxygen demand as the water-quality constituent and St. Louis Street drainage ditch as the watershed site. Monthly base-flow loads of biochem ical oxygen demand ranged from about 27 pounds in November to about 117 pounds in July. Monthly stormwater loads ranged from zero in November (no stormwater run off) to about 730 pounds in May. The variation in monthly stormwater load corres ponds generally to the variation of the monthly rainfall.
COMPARISON OF ANNUAL LOADS COMPUTED BY PROCEDURES
DEVELOPED FOR DIFFERENT REGIONS
Studies of the water quality of urban runoff in other regions provide a basis for comparison of results obtained by use of the Tampa Bay area regression equations. Because of differences in physical conditions, sampling techniques, sampling frequency, and analytical procedures involved in the various studies, re sults of such a comparison should be deemed significant only insofar as the area of agreement or disagreement is viewed in terms of orders of magnitude. The re gression equations developed for the Tampa Bay area are empirical and, as such, inherently account for effects of conditions peculiar to that locality. The equations presumably provide the most reliable results presently obtainable from data available for that area.
Mattraw and Miller (1981, p. 51) provide land-use load factors applicable in parts of Broward County on the east coast in south Florida. Specifically, the Broward County land-use load factors give the average daily load of selected water-quality constituents in runoff from hydraulically connected impervious sur faces in areas classed as residential, highway, and commercial. For the purpose at hand, use of these factors required that the land-use data of the nine Tampa Bay area watersheds be reevaluated and fitted as best possible into these three categories; and, further, that the amount of hydraulically connected impervious surface be determined for each category and watershed. The Broward County land- use load factors were used to compute annual loads of total nitrogen, total phos phorus, chemical oxygen demand, and total lead for each of the nine Tampa Bay area watersheds. Results of the computations are shown in table 23.
The annual loads computed by use of the Tampa Bay area regression equations (Tampa Bay loads) and the Broward County land-use load factors (Broward County loads) are of the same order of magnitude. In general, the Tampa Bay loads of total nitrogen and total phosphorus were two to five times greater than the
69
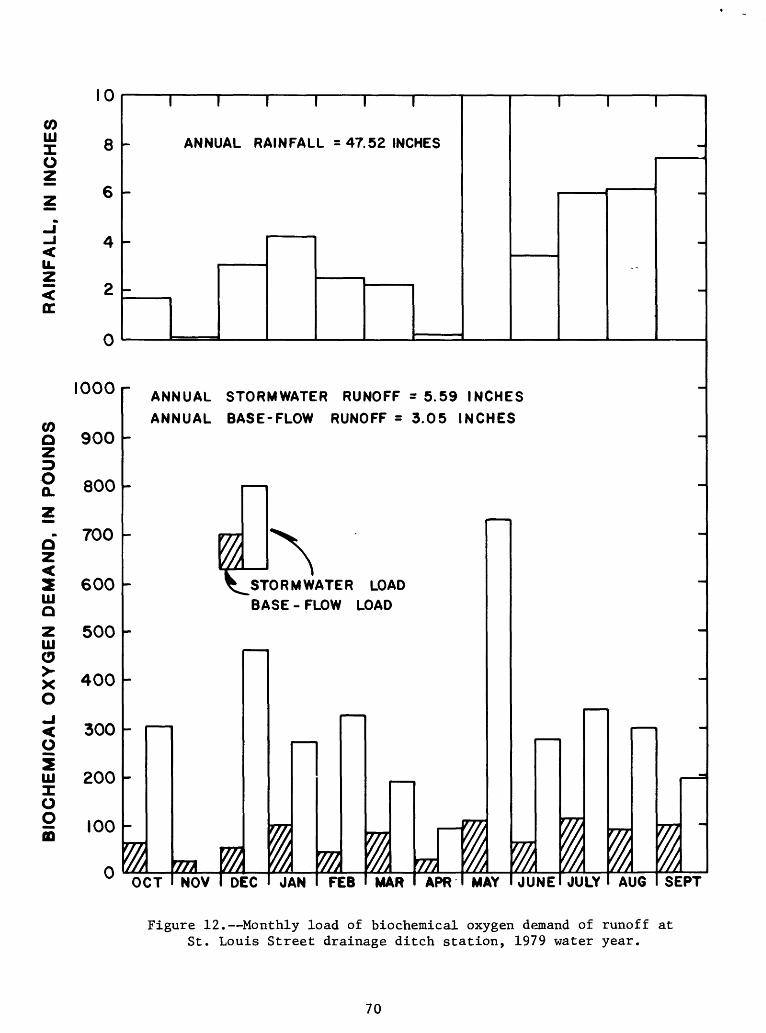
CO 111Xo
u.z
COozD O Q.
UJ O
Z UJoX Xo
o
UJ
o gID
10
8
6
4
2
0
1000
900
800
700
600
500
400
300
200
ANNUAL RAINFALL =47.52 INCHES
^ 100
ANNUAL STORMWATER RUNOFF = 5.59 INCHES
ANNUAL BASE-FLOW RUNOFF = 3.05 INCHES
STORMWATER LOAD
BASE - FLOW LOAD
OCT77*NOV I DEC JAN FEB MAR
77)APR MAY JUNE JULY AU6 SEPT
Figure 12. Monthly load of biochemical oxygen demand of runoff at St. Louis Street drainage ditch station, 1979 water year.
70
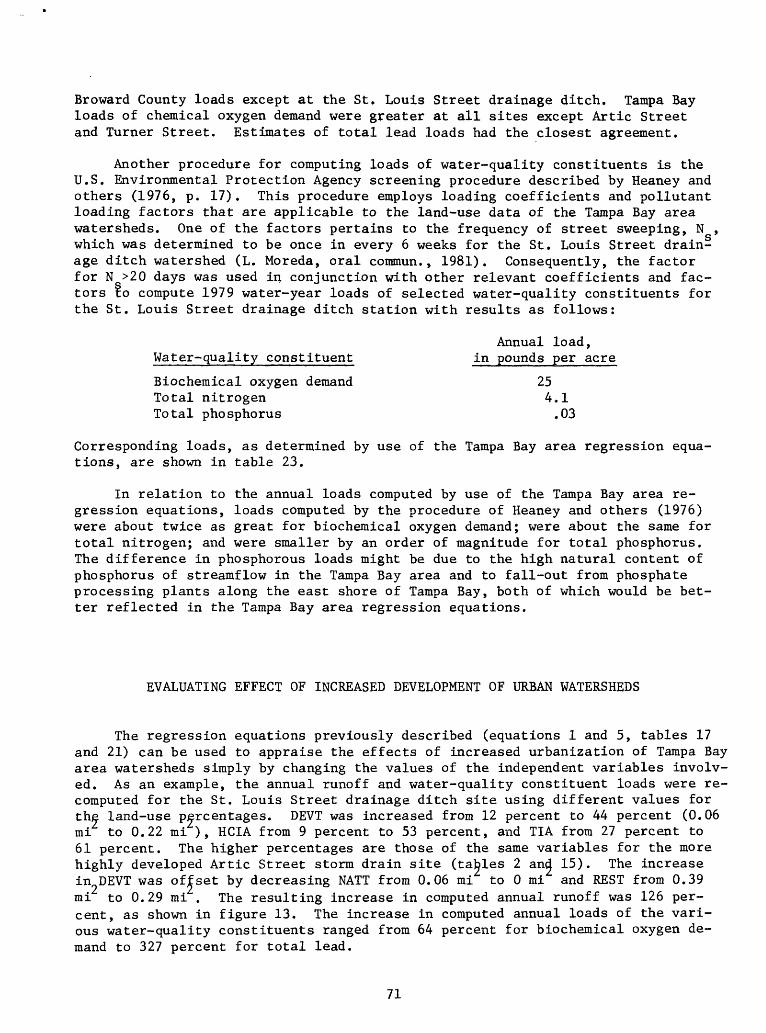
Broward County loads except at the St. Louis Street drainage ditch. Tampa Bay loads of chemical oxygen demand were greater at all sites except Artic Street and Turner Street. Estimates of total lead loads had the closest agreement.
Another procedure for computing loads of water-quality constituents is the U.S. Environmental Protection Agency screening procedure described by Heaney and others (1976, p. 17). This procedure employs loading coefficients and pollutant loading factors that are applicable to the land-use data of the Tampa Bay area watersheds. One of the factors pertains to the frequency of street sweeping, N . which was determined to be once in every 6 weeks for the St. Louis Street drain age ditch watershed (L. Moreda, oral commun., 1981). Consequently, the factor for N >20 days was used in conjunction with other relevant coefficients and fac tors to compute 1979 water-year loads of selected water-quality constituents for the St. Louis Street drainage ditch station with results as follows:
Annual load, Water-quality constituent in pounds per acre
Biochemical oxygen demand 25Total nitrogen 4.1Total phosphorus .03
Corresponding loads, as determined by use of the Tampa Bay area regression equa tions, are shown in table 23.
In relation to the annual loads computed by use of the Tampa Bay area re gression equations, loads computed by the procedure of Heaney and others (1976) were about twice as great for biochemical oxygen demand; were about the same for total nitrogen; and were smaller by an order of magnitude for total phosphorus. The difference in phosphorous loads might be due to the high natural content of phosphorus of streamflow in the Tampa Bay area and to fall-out from phosphate processing plants along the east shore of Tampa Bay, both of which would be bet ter reflected in the Tampa Bay area regression equations.
EVALUATING EFFECT OF INCREASED DEVELOPMENT OF URBAN WATERSHEDS
The regression equations previously described (equations 1 and 5, tables 17 and 21) can be used to appraise the effects of increased urbanization of Tampa Bay area watersheds simply by changing the values of the independent variables involv ed. As an example, the annual runoff and water-quality constituent loads were re computed for the St. Louis Street drainage ditch site using different values for the land-use percentages. DEVT was increased from 12 percent to 44 percent (0.06 mi to 0.22 mi ), HCIA from 9 percent to 53 percent, and TIA from 27 percent to 61 percent. The higher percentages are those of the same variables for the more highly developed Artic Street storm drain site (tables 2 and 15). The increase in DEVT was offset by decreasing NATT from 0.06 mi to 0 mi and REST from 0.39 mi to 0.29 mi . The resulting increase in computed annual runoff was 126 per cent, as shown in figure 13. The increase in computed annual loads of the vari ous water-quality constituents ranged from 64 percent for biochemical oxygen de mand to 327 percent for total lead.
71
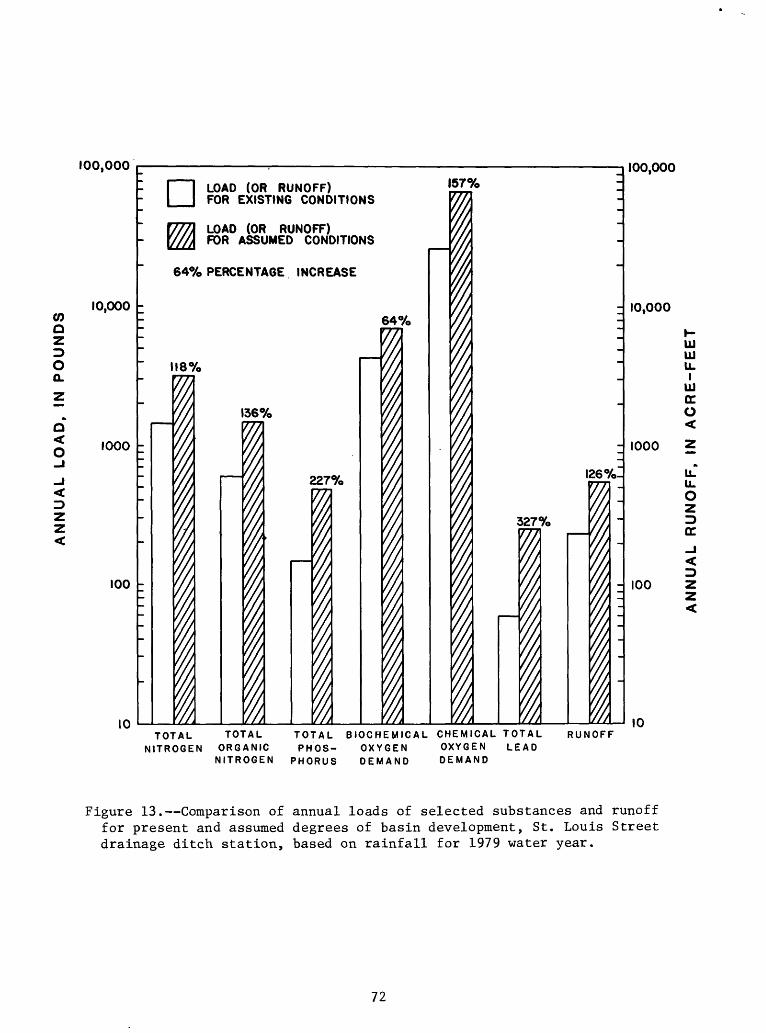
100,000
CO QzDoo.
a< o
Z Z
10,000
1000
100
10
LOAD (OR RUNOFF)FOR EXISTING CONDITIONS
LOAD (OR RUNOFF)FOR ASSUMED CONDITIONS
64% PERCENTAGE INCREASE
157%n 100,000
64%
118%
136%
227% 126%-
327%
10,000
1000
100
111111LL
I111 DC O
u. u. OZ D DC
D Z Z
TOTAL TOTAL NITROGEN ORGANIC
NITROGEN
TOTAL BIOCHEMICAL CHEMICAL TOTALPHOS- OXYGEN OXYGEN LEAD
PHORUS DEMAND DEMAND
10RUNOFF
Figure 13. Comparison of annual loads of selected substances and runoff for present and assumed degrees of basin development, St. Louis Street drainage ditch station, based on rainfall for 1979 water year.
72
SUMMARY AND CONCLUSIONS
Runoff from urban watersheds in the Tampa Bay area contains chemical and other substances that impact receiving-water bodies, such as the Hillsborough River, Tampa Bay, and the Gulf of Mexico. As part of an effort to quantify the constituent loads entering receiving waters, rainfall and streamflow data were collected from 1975 to 1980 to evaluate the quantity and quality of runoff from nine urban watersheds in the Tampa Bay area. Residential, commercial, industri al, institutional, recreational, and open-space land uses were identified and measured. Impervious surfaces, such as roofs, paved roads, and parking lots, were measured; separate tabulations were made of impervious surfaces that were directly connected to sewer systems (hydraulically connected impervious sur faces). The land-use mixture of the various watersheds differed appreciably, as did the degree of development, which ranged from a sparsely populated water shed having 19 percent impervious surface to a commercial-residential watershed having 61 percent impervious surface. Many of the urbanized watersheds in the Tampa Bay area fall within the range in size and land-use mixture of the nine selected watersheds.
Streamflow and water-quality data were collected during periods of storm- water runoff and base flow. Average biochemical oxygen demand concentration for base flow at one site and the flow-weighted average of stormwater-runoff samples at four sites exceeded treated sewage effluent standards. Average concentrations of total nitrogen and phosphorus in both base-flow and stormwater-runoff samples were within treated sewage effluent standards at all sites. Average concentra tions of coliform in stormwater-runoff samples were generally several orders of magnitude greater than limits set by the Florida Department of Environmental Regulation for Class III water (that used for recreation or propagation and man agement of fish and wildlife). Average concentrations of lead and zinc in storm- water-runoff samples were consistently higher than limits for Class III water at all sites sampled. Average concentrations of lead and zinc also exceeded limits for Class III water in base-flow samples from watersheds having large percentages of commercial development.
Time variations in rainfall, discharge, and water-quality constituent concen trations were determined for selected sites. In watersheds that have a high per centage of hydraulically connected impervious surface, high concentrations occur red during rising stream stages. Concentrations of chemical oxygen demand, total organic carbon, nitrogen, and total phosphorus were generally several times higher at the start of stormwater runoff than at the end.
Regression equations were developed for estimating stormwater-runoff loads from ungaged watersheds for water-quality constituents as follows: biochemical oxygen demand, chemical oxygen demand, total nitrogen, total organic nitrogen, total phosphorus, and total lead. Multiple linear-regression techniques were used to relate stormwater-runoff loads to runoff volume, land use, and antece dent rainfall. Standard errors of estimate ranged from ±41 percent of the mean for chemical oxygen demand to ±65 percent of the mean for total nitrogen. Storm- water-runoff volume was estimated by use of a separate regression equation that relates runoff volume to pervious area multiplied by soil-infiltration index, hydraulically connected impervious surface, and rainfall. The average standard of error of estimate for this equation was ±20 percent; correlation coefficient, 0.93.
73
Regression equations also were developed to compute base-flow concentrations for the same suite of water-quality constituents. Base-flow constituent concen trations were related to daily discharge, rainfall, watershed, and land-use vari ables. Standard error of estimates ranged from ±33 percent for chemical oxygen demand to ±60 percent for biochemical oxygen demand. Base-flow daily discharge was estimated by use of a separate regression equation that related discharge to drainage area and antecedent rainfall. This equation has an average standard error of ±45 percent and a multiple correlation coefficient of 0.94.
The regression equations were used to compute base-flow, stormwater, and annual runoff volumes and loads of selected water-quality constituents for the nine urban watersheds of the Tampa Bay area. Base-flow volume made up from 12 to 59 percent of the annual runoff volume from the various watersheds. The ra tio of base-flow load to annual load of water-quality constituents differed in like manner, ranging from as little as 7 percent for total phosphorus at Artic Street storm drain to as much as 65 percent for total nitrogen at Kirby Street drainage ditch.
Comparison was made of loads of selected water-quality constituents as com puted by use of the Tampa Bay area regression equations and as computed by meth ods devised for other parts of the country. The annual loads computed by use of the Tampa Bay area regression equations (Tampa Bay loads) and the Broward County land-use load factors (Broward County loads) are of the same order of magnitude. In general, the Tampa Bay loads of total nitrogen and total phosphorus were two to five times greater than the Broward County loads except at the St. Louis Street drainage ditch. Tampa Bay loads of chemical oxygen demand were greater at all sites except Artic Street and Turner Street. Estimates of total lead loads had the closest agreement. A second comparison was made by application of the U.S. Environmental Protection Agency screening procedure (Heaney and others, 1976) to land-use data at the St. Louis Street drainage ditch site. As determined by use of the Tampa Bay area regression equations, the annual load of nitrogen was about the same, biochemical oxygen demand was about one-half as great, and total phos phorus was about one order of magnitude greater than loads estimated by the screen ing procedure. The Tampa Bay area regression equations, because of their empirical nature, presumably reflect the high natural phosphorous content of bay area stream- flow and fallout from local phosphate processing plants.
The regression equations developed in this report for estimating volume of stormwater runoff, base-flow daily discharge, stormwater-runoff loads, and base- flow concentrations of the various water-quality constituents may be applicable to other urban watersheds of the Tampa Bay area provided the independent varia bles involved fall within the range defined by data for the nine selected water sheds.
74
REFERENCES
American Public Health Association and others, 1976, Standard methods for the examination of water and wastewater: New York, American Public Health Association, 14th edition, 1, 193 p.
Florida Department of Administration, 1975, The Florida general soils atlas with interpretations for regional planning districts VII and VIII: 32 p.
Florida Department of Commerce, 1980, Florida facts: Tallahassee, 4 p.
Florida Department of State, 1979, Rules of the Department of EnvironmentalRegulation, water-quality standards, Chapter 17-3, in Florida Administra tive Code: Tallahassee.
Geraghty and Miller, Inc., 1976, Management of the water resources of thePinellas-Anclote and northwest Hillsborough basins, west-central Florida: v. 1, 301 p.
Heaney, J. P., Huber, W. C., and Nix, S. J., 1976, Storm water management model; Level I - Preliminary screening procedures: U.S. Environmental Protection Agency Environmental Protection Technology Series, EPA-600/2-76-275, 76 p.
Lopez, M. A., and Michaelis, D. M., 1979, Hydrologic data from urban watersheds in the Tampa Bay area, Florida: U.S. Geological Survey Water-Resources Investigations 78-125, 51 p.
Lopez, M. A., and Woodham, W. M., 1982, Magnitude and frequency of flooding on small urban watersheds in the Tampa Bay area, Florida: U.S. Geological Survey Water-Resources Investigations 82-42, 59 p.
Mattraw, H. C., and Miller, R. A., 1981, Stormwater quality processes for three land-use areas in Broward County, Florida: U.S. Geological Survey Water- Resources Investigations 81-23, 55 p.
Miller, R. A., 1979, Characteristics of four urbanized basins in south Florida: U.S. Geological Survey Open-File Report 79-694, 45 p.
SAS Institute, Inc., 1982, SAS user f s guide: statistics: Gary, N.C., SAS Institute, Inc., p. 15-37.
Sauer, V. B., Thomas, W. 0., Jr., Stricker, V. A., and Wilson, K. V., 1981, Flood characteristics of urban watersheds in the United States: U.S. Geological Survey Water-Supply Paper 2207 (in press).
Seijo, M. A., Giovannelli, R. F., and Turner, J. F., Jr., 1979, Regional flood- frequency relations for west-central Florida: U.S. Geological Survey Water- Resources Investigations Open-File Report 79-1293, 41 p., 2. plates.
Skougstad, M. W., Fishman, M. J., Friedman, L. C., Erdmann, D. E., and Duncan, S. S., editors, 1979, Methods for determination of inorganic substances in water and fluvial sediments: U.S. Geological Survey Techniques of Water- Resources Investigations, Book 5, Chapter Al, 626 p.
Snedecor, G. W., and Cochran, W. G., 1974, Statistical methods, sixth edition: Ames, Iowa, The Iowa State University Press, p. 155 and 156.
Tampa Bay Regional Planning Council, 1977, Regional comprehensive planning guide: St. Petersburg, 110 p.
75
Tampa Bay Regional Planning Council, 1978, Areawide water quality. A management plan for the Tampa Bay region: St. Petersburg, 878 p.
Thompson, R. B., 1977, Florida statistical abstract 1977: Bureau of Economic and Business Research, College of Business Administration, University of Florida, 597 p.
U.S. Department of Agriculture, 1972, National Engineering Handbook, Hydrology Section 4.
Wesolowsky, G. 0., 1976, Multiple regression and analysis of variance: New York, John Wiley, p. 26-149.
Wright, A. P., 1974, Environmental geology and hydrology, Tampa area, Florida: Florida Bureau of Geology Special Publication 19, 94 p.
76