Embed Size (px)
Citation preview
World Water Day Dialogue
International Water Management Institute (IWMI)March 23, 2016
Ananda Mallawatantri, Ph.D.Country Representative
International Union for Conservation of Nature (IUCN)
Water Quality: Can we say “yes” to development while keeping health of water resources?
Outline
Context and selected pollution pathways
Types of diseases associated with poor water quality
Several important processes and parameters
Policies, institutional and legal aspects
Selected set of scenarios for better management
A case study : Kelani River Basin
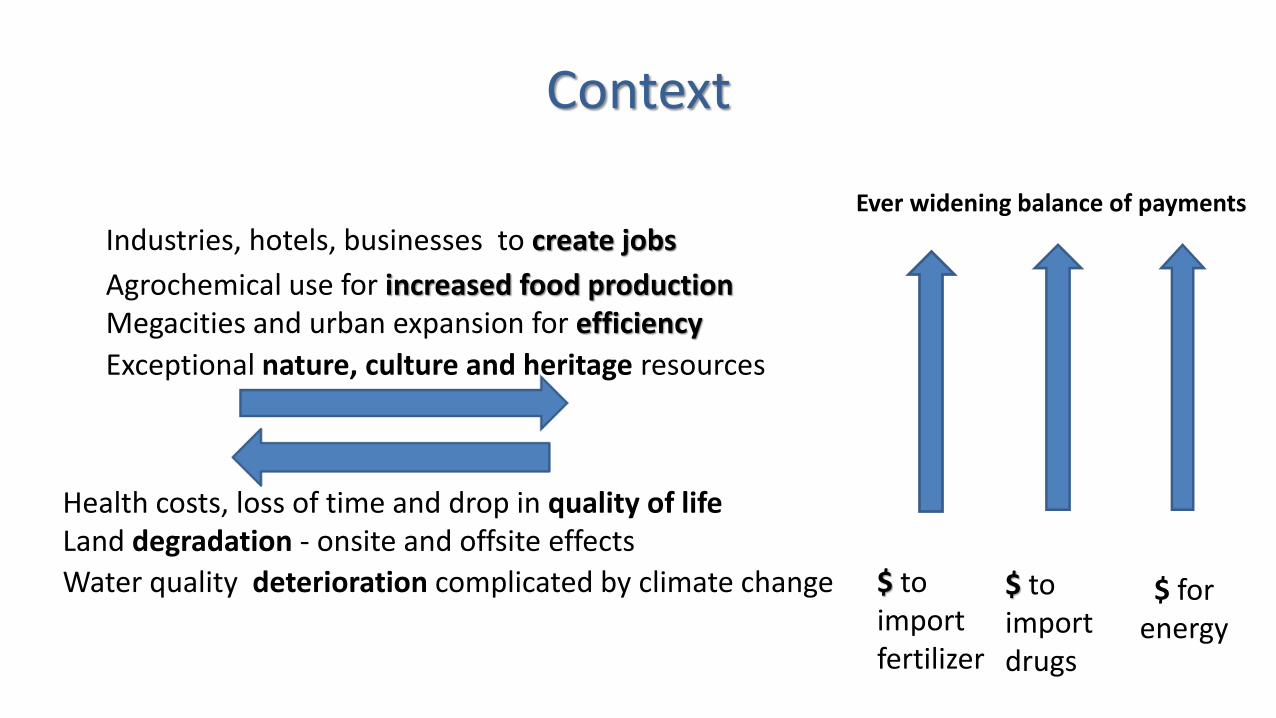
Context
Agrochemical use for increased food production
Health costs, loss of time and drop in quality of life
$ to importfertilizer
$ toimport drugs
Industries, hotels, businesses to create jobs
$ for energy
Land degradation - onsite and offsite effects
Water quality deterioration complicated by climate change
Megacities and urban expansion for efficiency
Ever widening balance of payments
Exceptional nature, culture and heritage resources
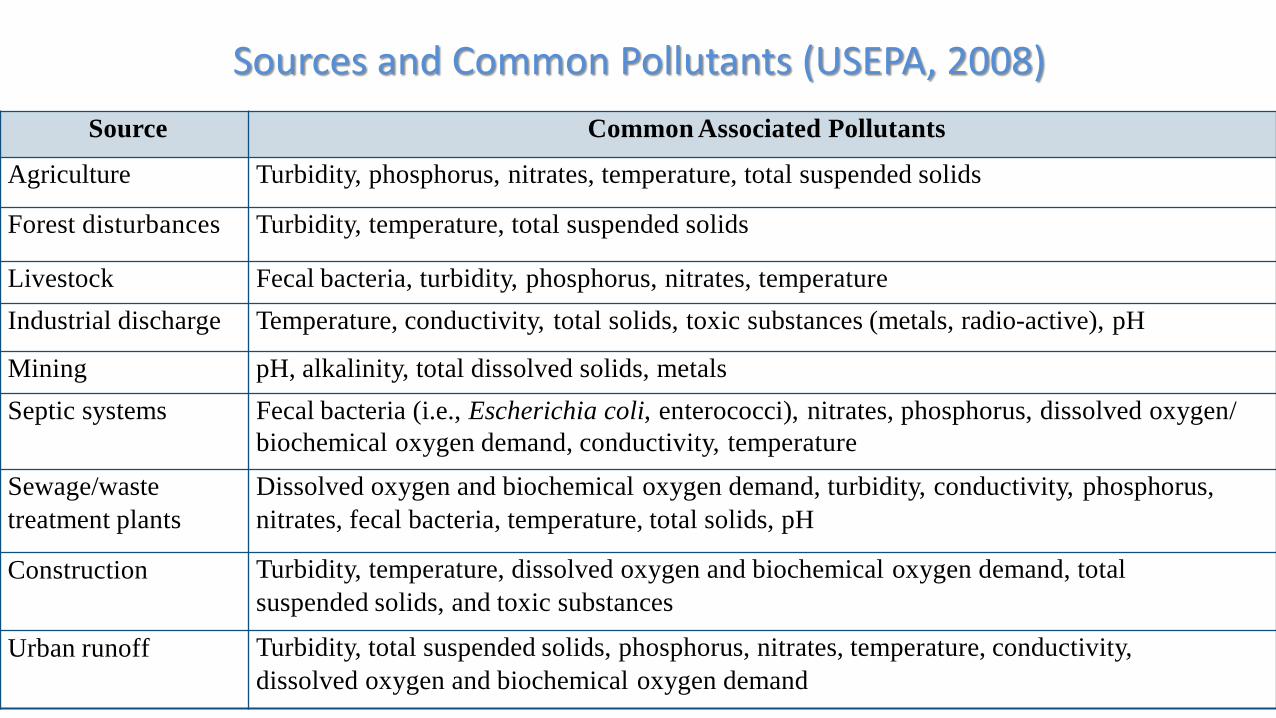
Source Common Associated Pollutants
Agriculture Turbidity, phosphorus, nitrates, temperature, total suspended solids
Forest disturbances Turbidity, temperature, total suspended solids
Livestock Fecal bacteria, turbidity, phosphorus, nitrates, temperature
Industrial discharge Temperature, conductivity, total solids, toxic substances (metals, radio-active), pH
Mining pH, alkalinity, total dissolved solids, metals
Septic systems Fecal bacteria (i.e., Escherichia coli, enterococci), nitrates, phosphorus, dissolved oxygen/
biochemical oxygen demand, conductivity, temperature
Sewage/waste
treatment plants
Dissolved oxygen and biochemical oxygen demand, turbidity, conductivity, phosphorus,
nitrates, fecal bacteria, temperature, total solids, pH
Construction Turbidity, temperature, dissolved oxygen and biochemical oxygen demand, total
suspended solids, and toxic substances
Urban runoff Turbidity, total suspended solids, phosphorus, nitrates, temperature, conductivity,
dissolved oxygen and biochemical oxygen demand
Sources and Common Pollutants (USEPA, 2008)
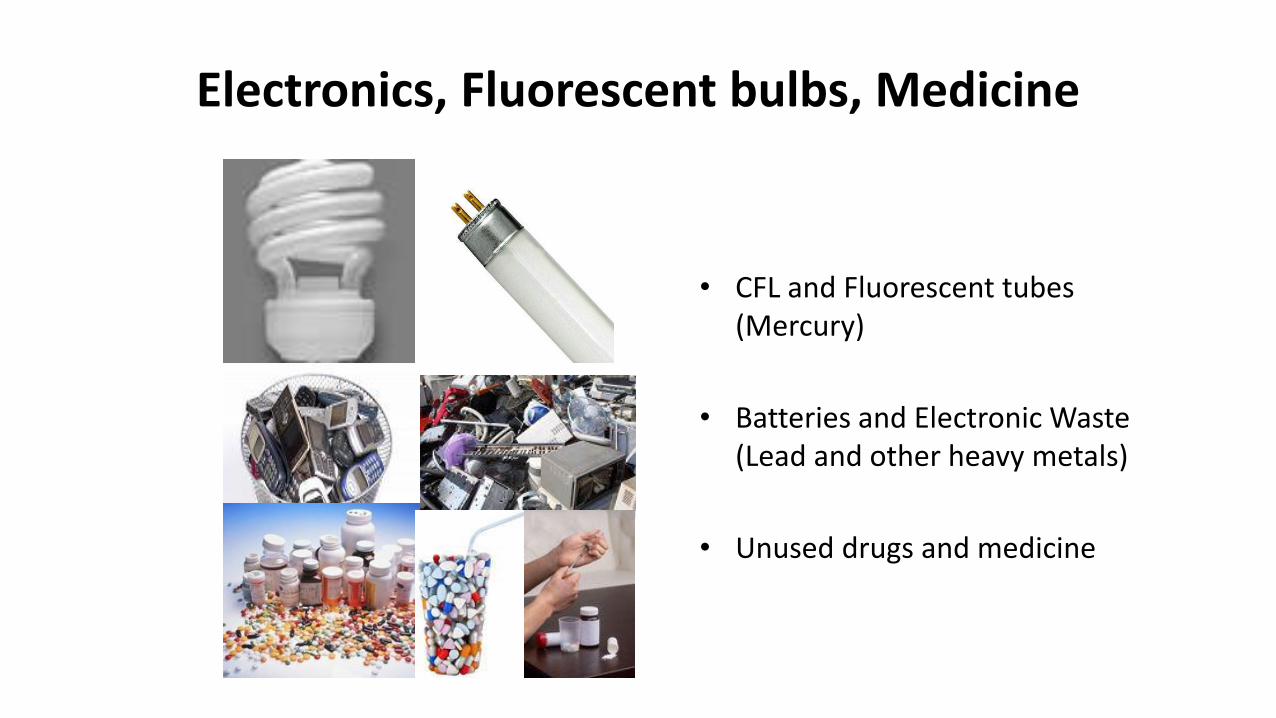
Electronics, Fluorescent bulbs, Medicine
• CFL and Fluorescent tubes (Mercury)
• Batteries and Electronic Waste (Lead and other heavy metals)
• Unused drugs and medicine
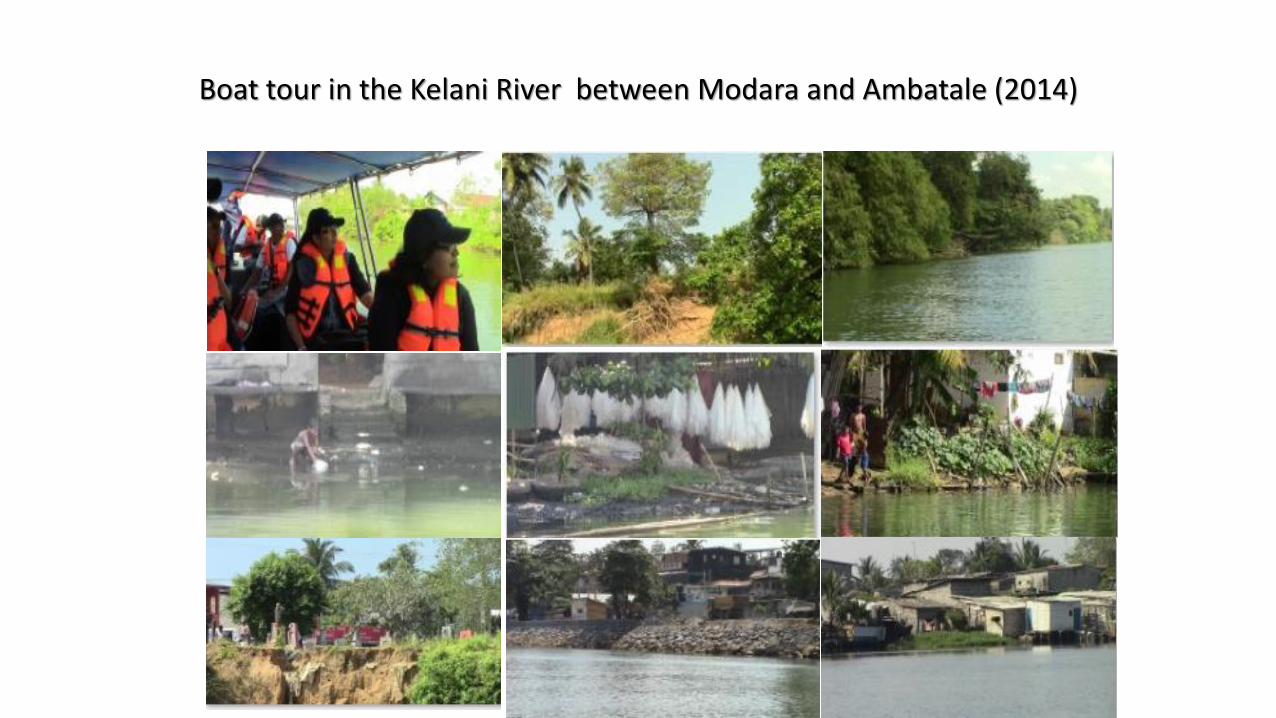
Boat tour in the Kelani River between Modara and Ambatale (2014)
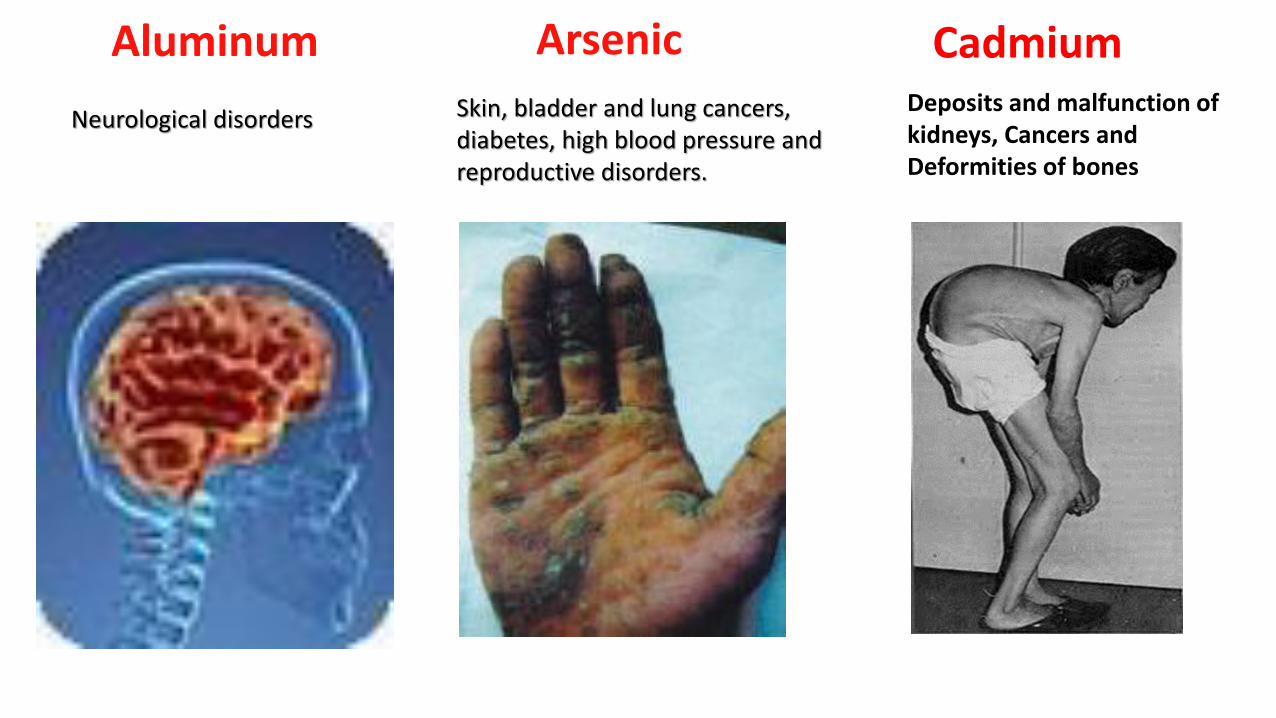
Aluminum
Neurological disorders
Arsenic
Skin, bladder and lung cancers,diabetes, high blood pressure and reproductive disorders.
CadmiumDeposits and malfunction ofkidneys, Cancers and Deformities of bones
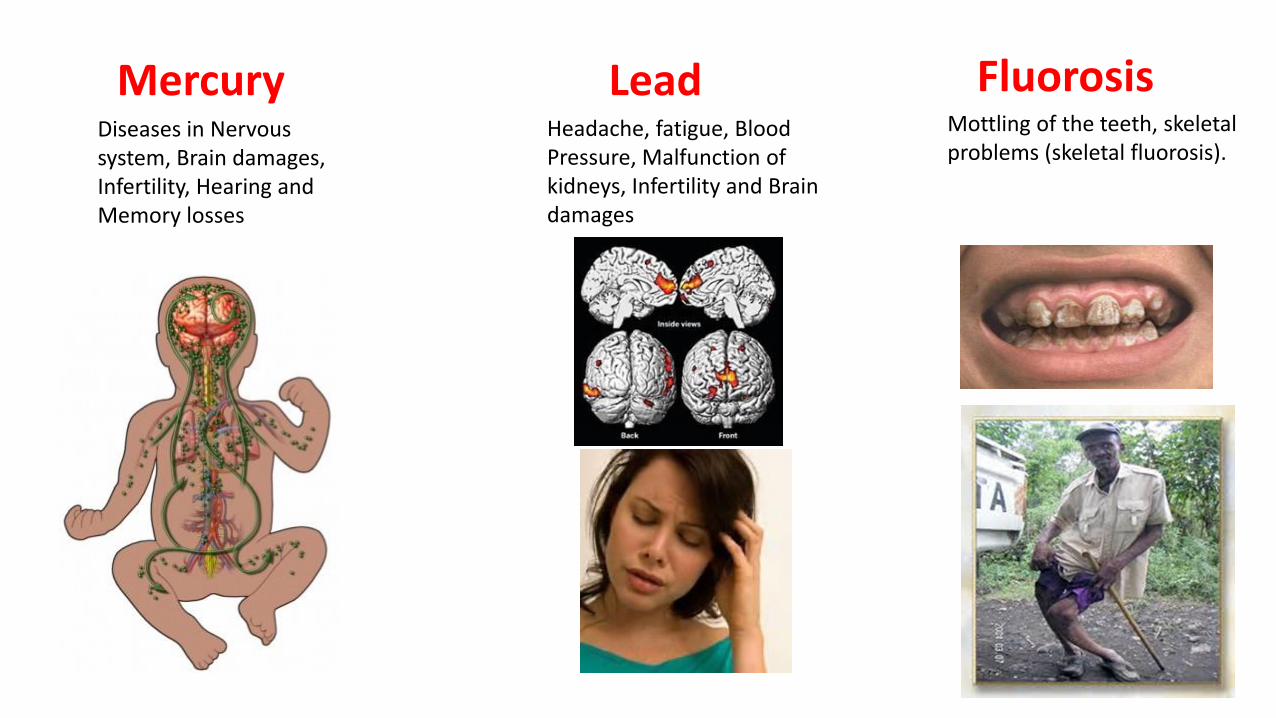
MercuryDiseases in Nervous system, Brain damages, Infertility, Hearing and Memory losses
LeadHeadache, fatigue, Blood Pressure, Malfunction of kidneys, Infertility and Brain damages
FluorosisMottling of the teeth, skeletalproblems (skeletal fluorosis).
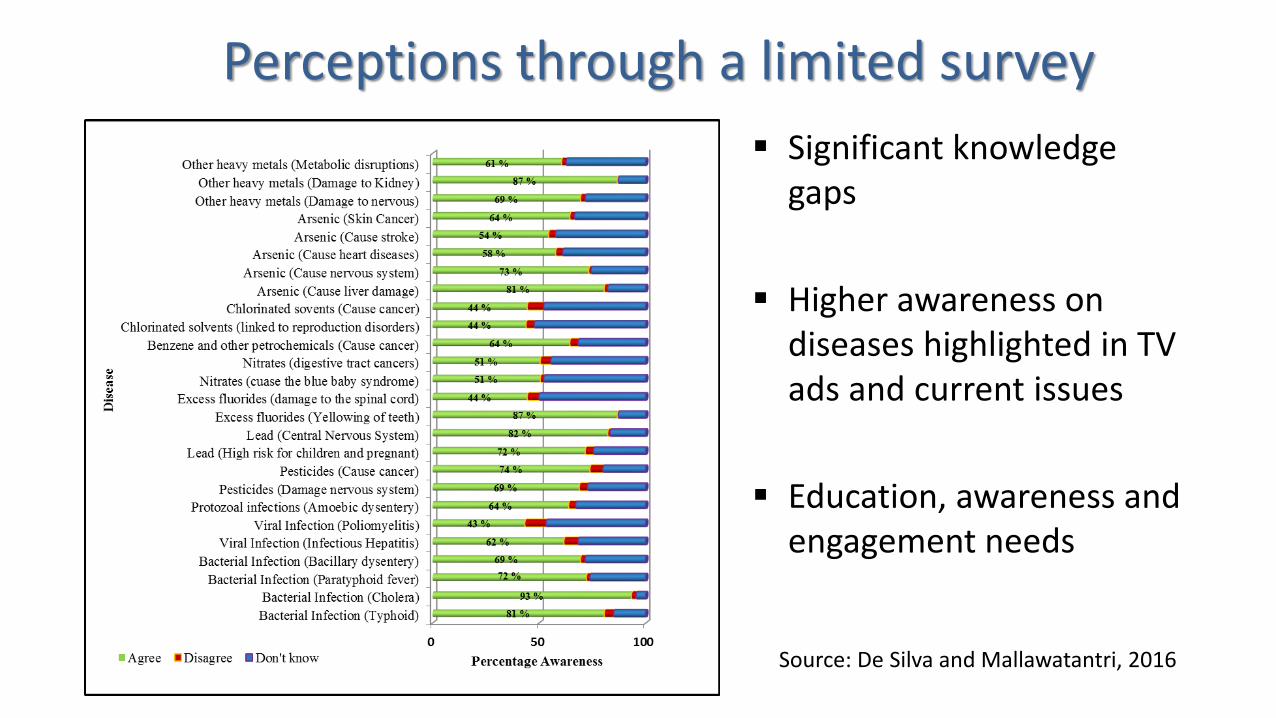
Perceptions through a limited survey
Significant knowledge gaps
Higher awareness on diseases highlighted in TV ads and current issues
Education, awareness and engagement needs
Source: De Silva and Mallawatantri, 2016
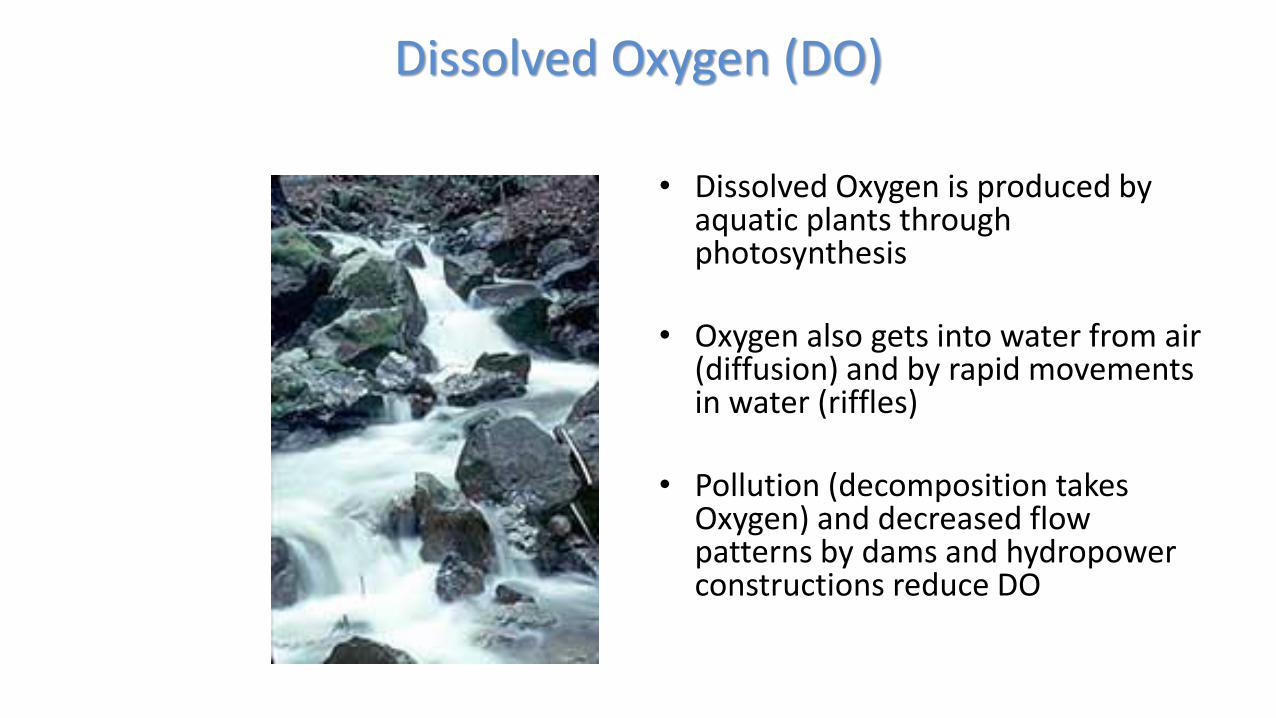
Dissolved Oxygen (DO)
• Dissolved Oxygen is produced by aquatic plants through photosynthesis
• Oxygen also gets into water from air (diffusion) and by rapid movements in water (riffles)
• Pollution (decomposition takes Oxygen) and decreased flow patterns by dams and hydropower constructions reduce DO
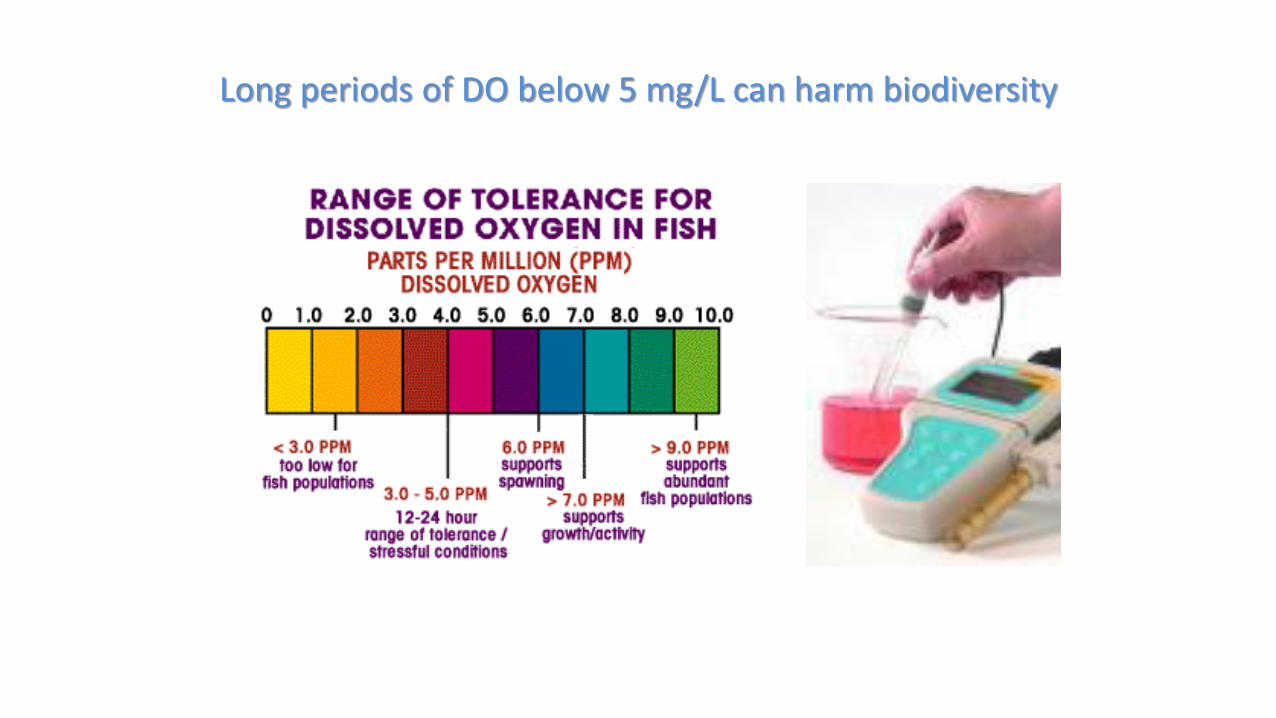
Long periods of DO below 5 mg/L can harm biodiversity
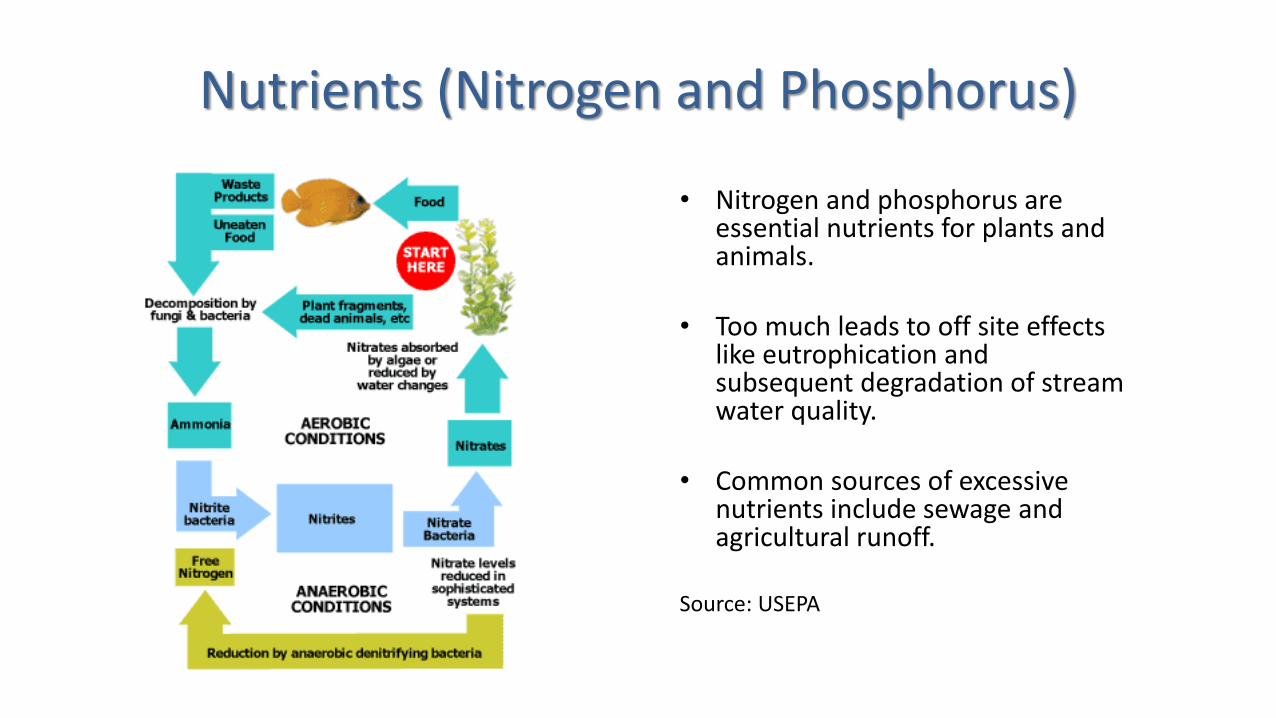
Nutrients (Nitrogen and Phosphorus)
• Nitrogen and phosphorus are essential nutrients for plants and animals.
• Too much leads to off site effects like eutrophication and subsequent degradation of stream water quality.
• Common sources of excessive nutrients include sewage and agricultural runoff.
Source: USEPA
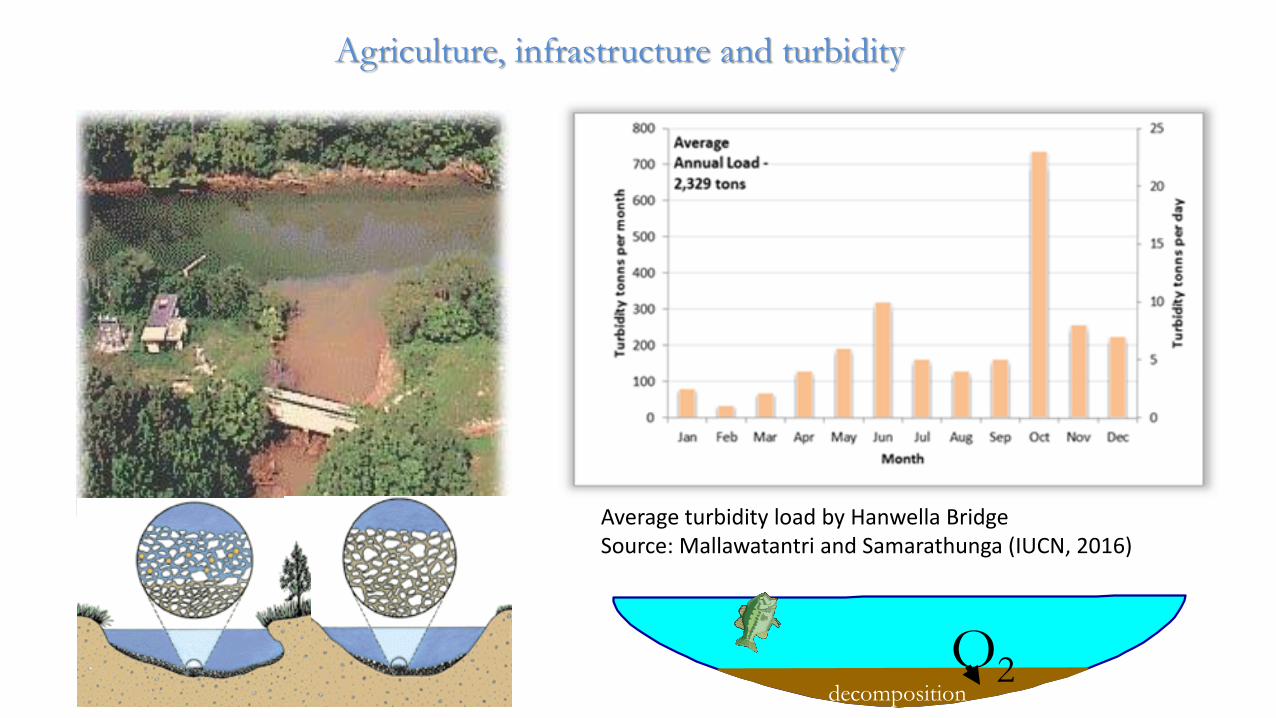
Agriculture, infrastructure and turbidity
decomposition
O2
Average turbidity load by Hanwella Bridge Source: Mallawatantri and Samarathunga (IUCN, 2016)
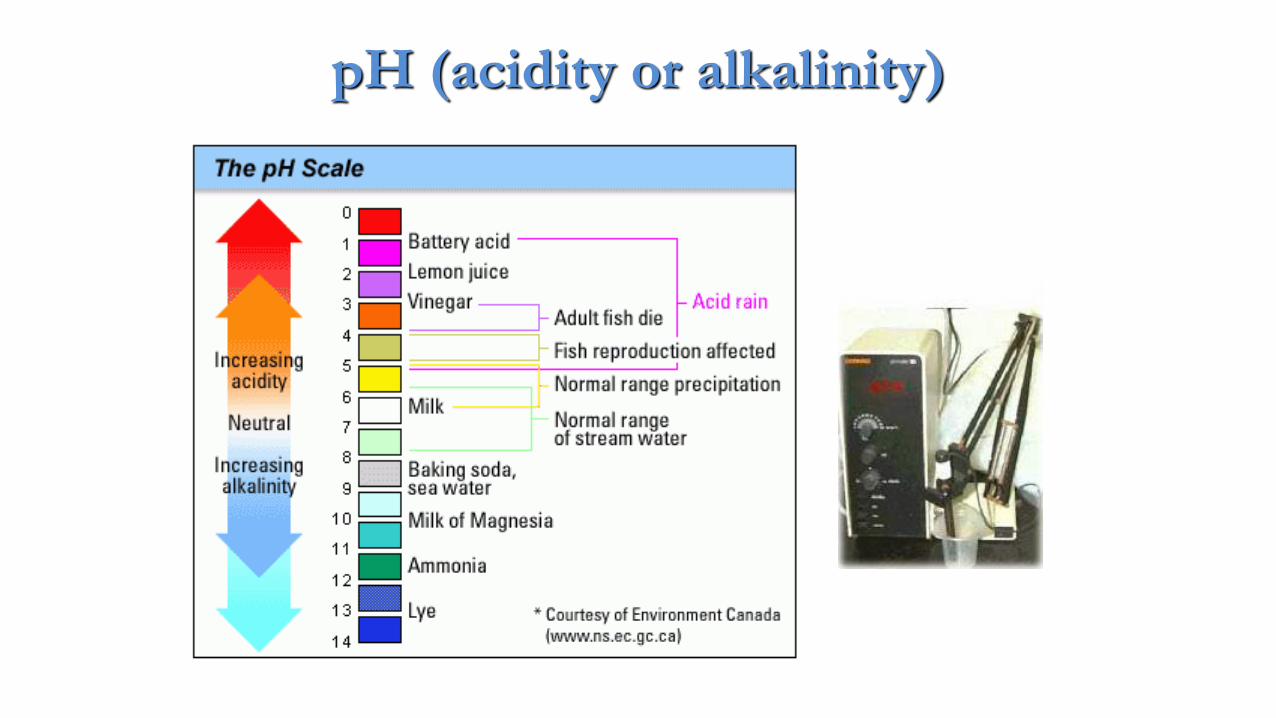
pH (acidity or alkalinity)
BOD and COD
Important in understanding the extent of pollution in water bodies
Used mostly in waste water treatment and water quality monitoring
Chemical Oxygen Demand (COD) indicates extent of all chemicals that can be oxidized
Biochemical Oxygen Demand (BOD) measures the amount of food (or organic carbon) that bacteria can oxidize and measured usually after five days (BOD5)
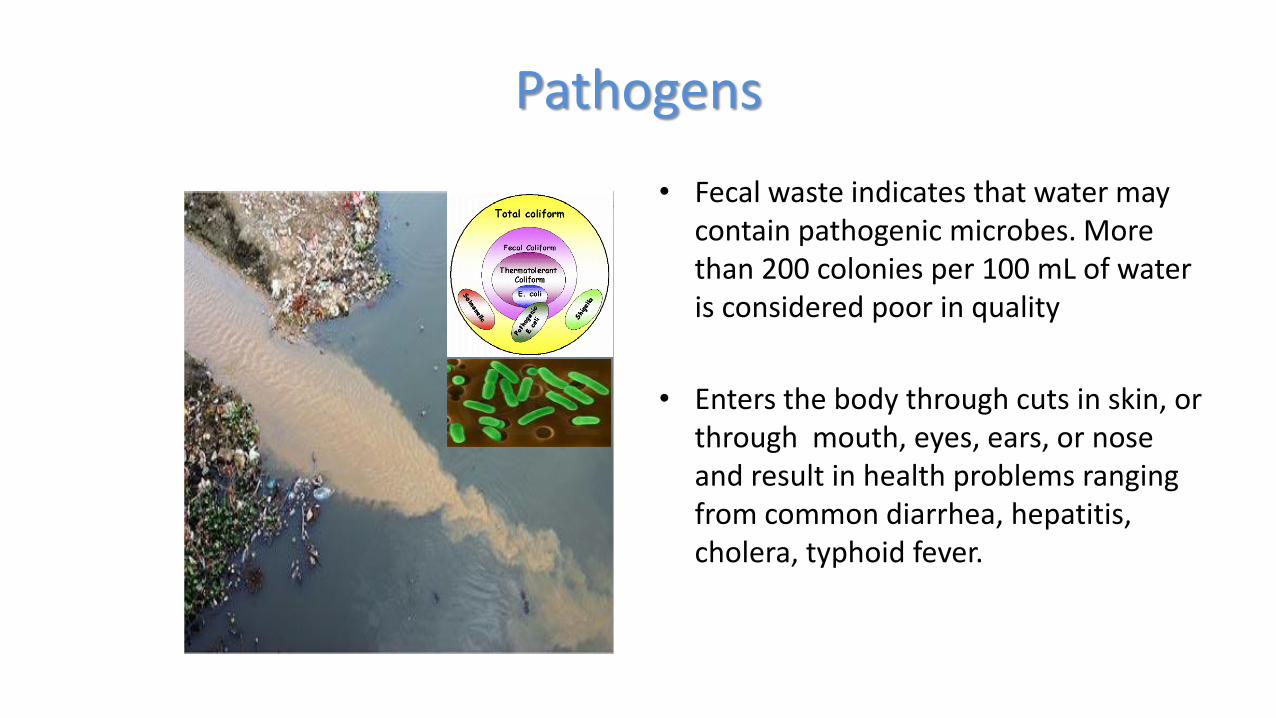
Pathogens
• Fecal waste indicates that water may contain pathogenic microbes. More than 200 colonies per 100 mL of water is considered poor in quality
• Enters the body through cuts in skin, or through mouth, eyes, ears, or nose and result in health problems ranging from common diarrhea, hepatitis, cholera, typhoid fever.
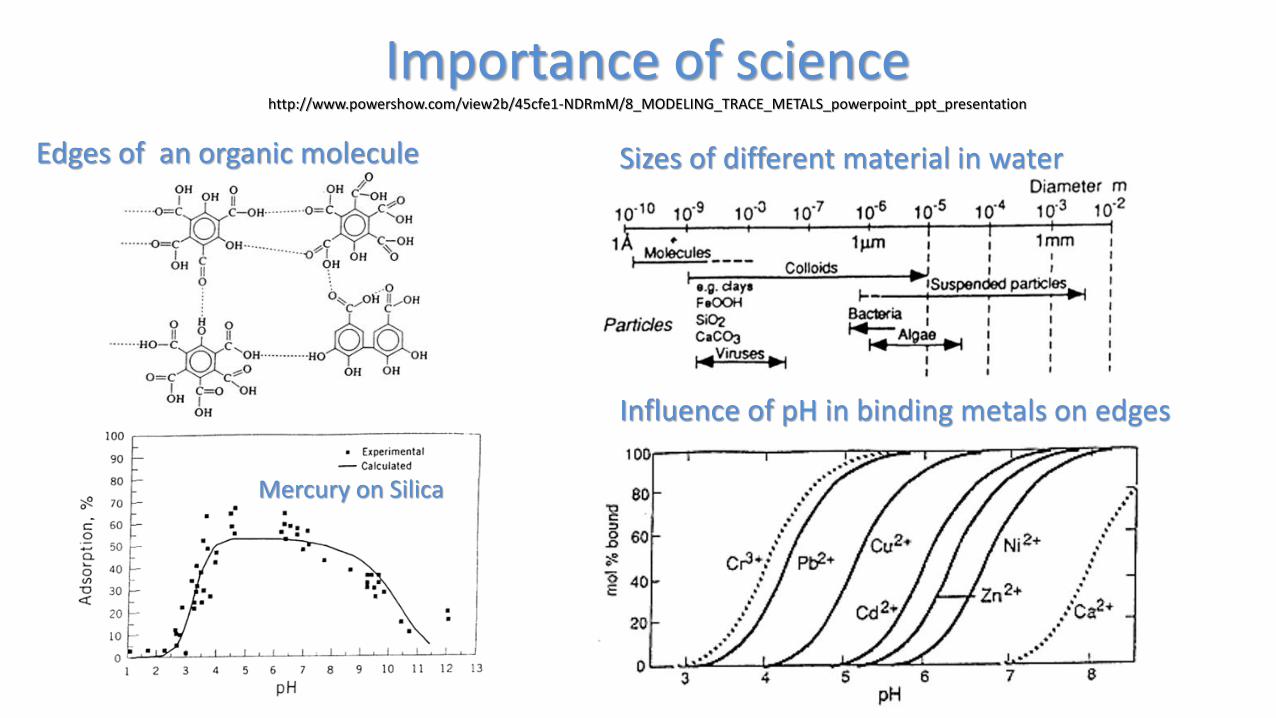
Importance of science http://www.powershow.com/view2b/45cfe1-NDRmM/8_MODELING_TRACE_METALS_powerpoint_ppt_presentation
Edges of an organic molecule Sizes of different material in water
Influence of pH in binding metals on edges
Mercury on Silica
Key legislations
National Policy on Protection and Conservation of Water Sources, their
Catchments and Reservations, 2014
Environmental Protection Licences (EPL) and Environment Impact
Assessment (EIA) - National Environment Act No. 47 of 1980 and its
amendments of 1998, 2000 and 2005
Haritha (Green) Lanka Programme and Action Plan developed by the
Council for Sustainable Development in 2009 and being updated till year
2022
National Action Programme (NAP) for Combating Land Degradation
2016-2025
Comprehensive Disaster Management Programme 2014-2020
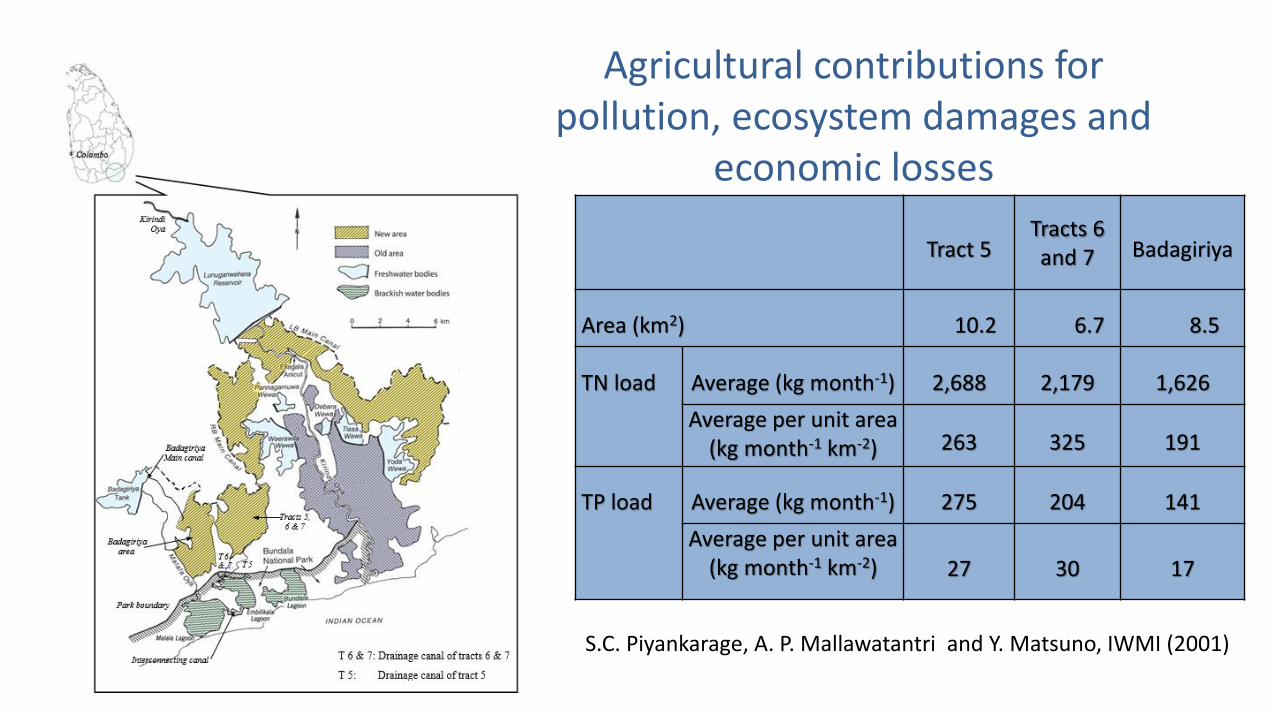
Agricultural contributions for pollution, ecosystem damages and
economic losses
Tract 5Tracts 6 and 7 Badagiriya
Area (km2) 10.2 6.7 8.5
TN load Average (kg month-1) 2,688 2,179 1,626
Average per unit area(kg month-1 km-2) 263 325 191
TP load Average (kg month-1) 275 204 141
Average per unit area(kg month-1 km-2) 27 30 17
S.C. Piyankarage, A. P. Mallawatantri and Y. Matsuno, IWMI (2001)
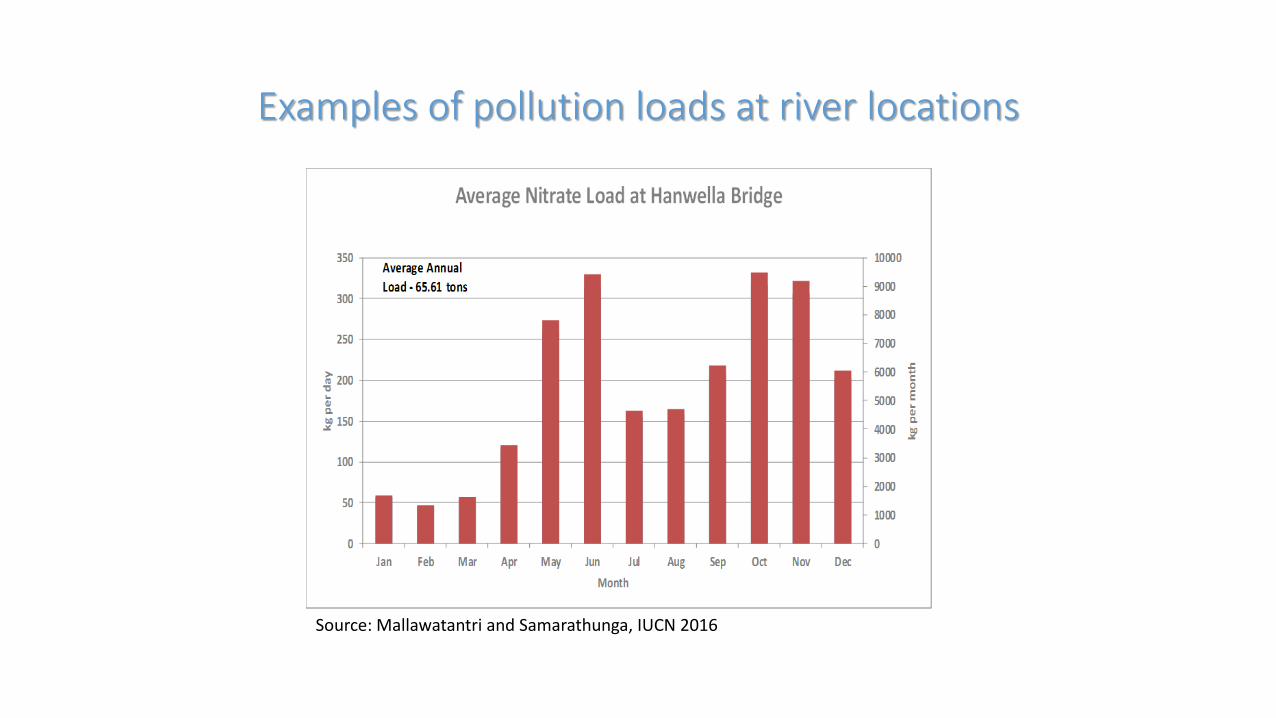
Examples of pollution loads at river locations
Source: Mallawatantri and Samarathunga, IUCN 2016
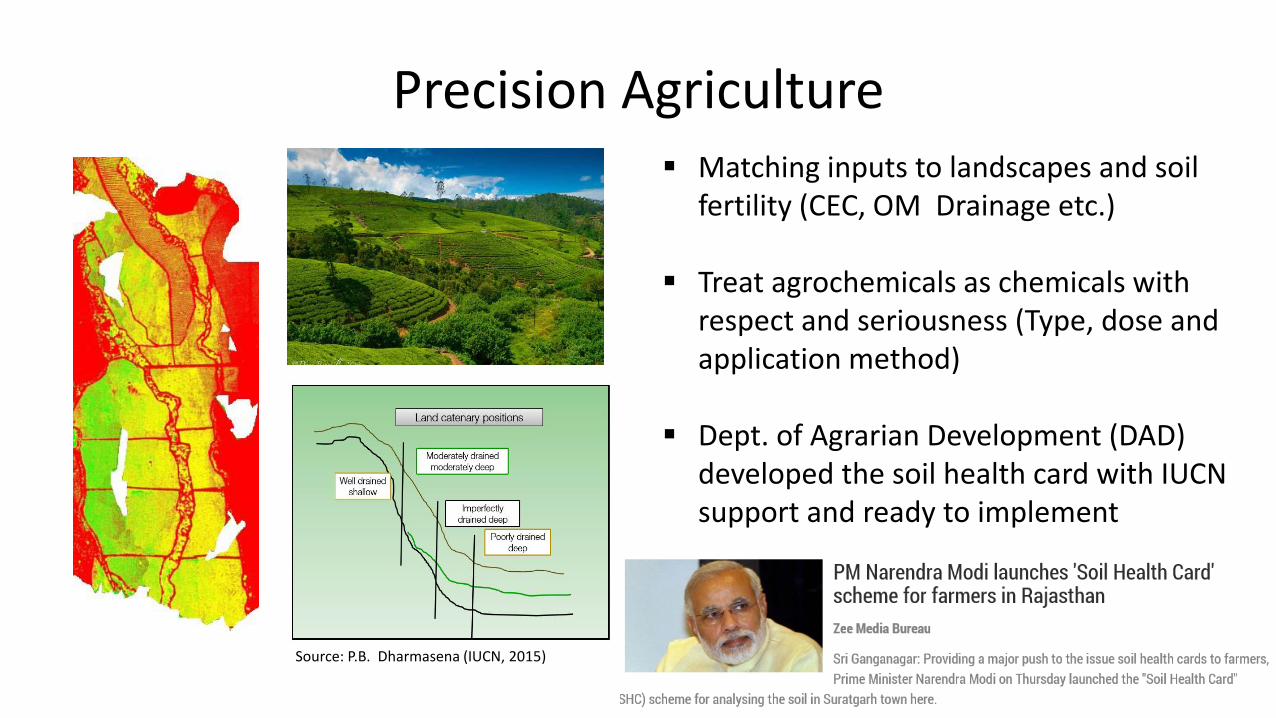
Precision Agriculture Matching inputs to landscapes and soil
fertility (CEC, OM Drainage etc.)
Treat agrochemicals as chemicals with respect and seriousness (Type, dose and application method)
Dept. of Agrarian Development (DAD) developed the soil health card with IUCN support and ready to implement
Source: P.B. Dharmasena (IUCN, 2015)
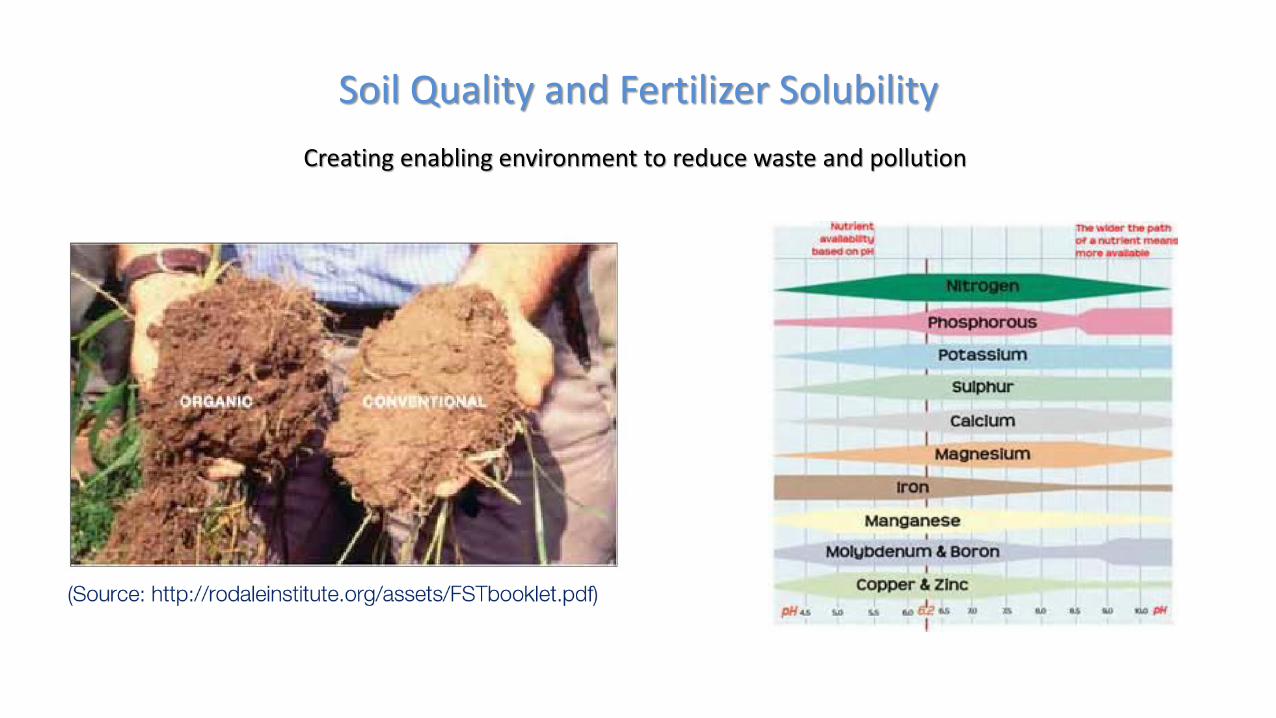
Soil Quality and Fertilizer Solubility
Creating enabling environment to reduce waste and pollution
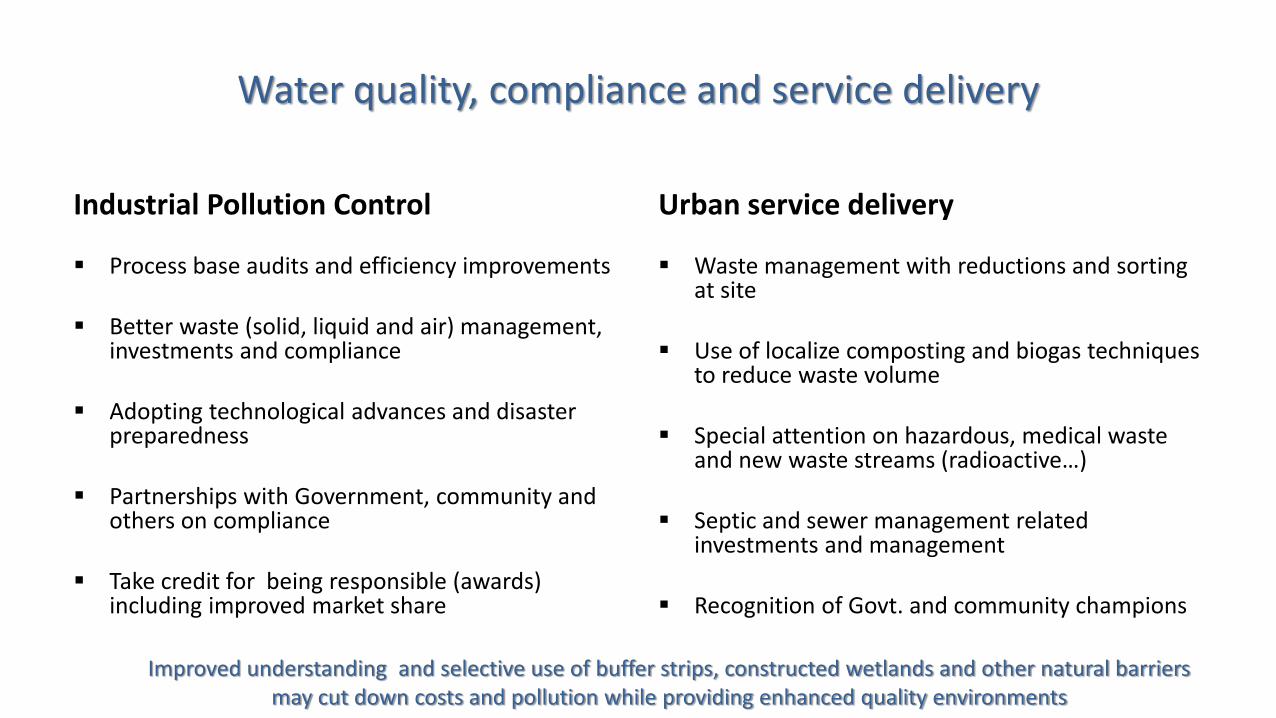
Water quality, compliance and service delivery
Industrial Pollution Control
Process base audits and efficiency improvements
Better waste (solid, liquid and air) management, investments and compliance
Adopting technological advances and disaster preparedness
Partnerships with Government, community and others on compliance
Take credit for being responsible (awards) including improved market share
Urban service delivery
Waste management with reductions and sorting at site
Use of localize composting and biogas techniques to reduce waste volume
Special attention on hazardous, medical waste and new waste streams (radioactive…)
Septic and sewer management related investments and management
Recognition of Govt. and community champions
Improved understanding and selective use of buffer strips, constructed wetlands and other natural barriers may cut down costs and pollution while providing enhanced quality environments
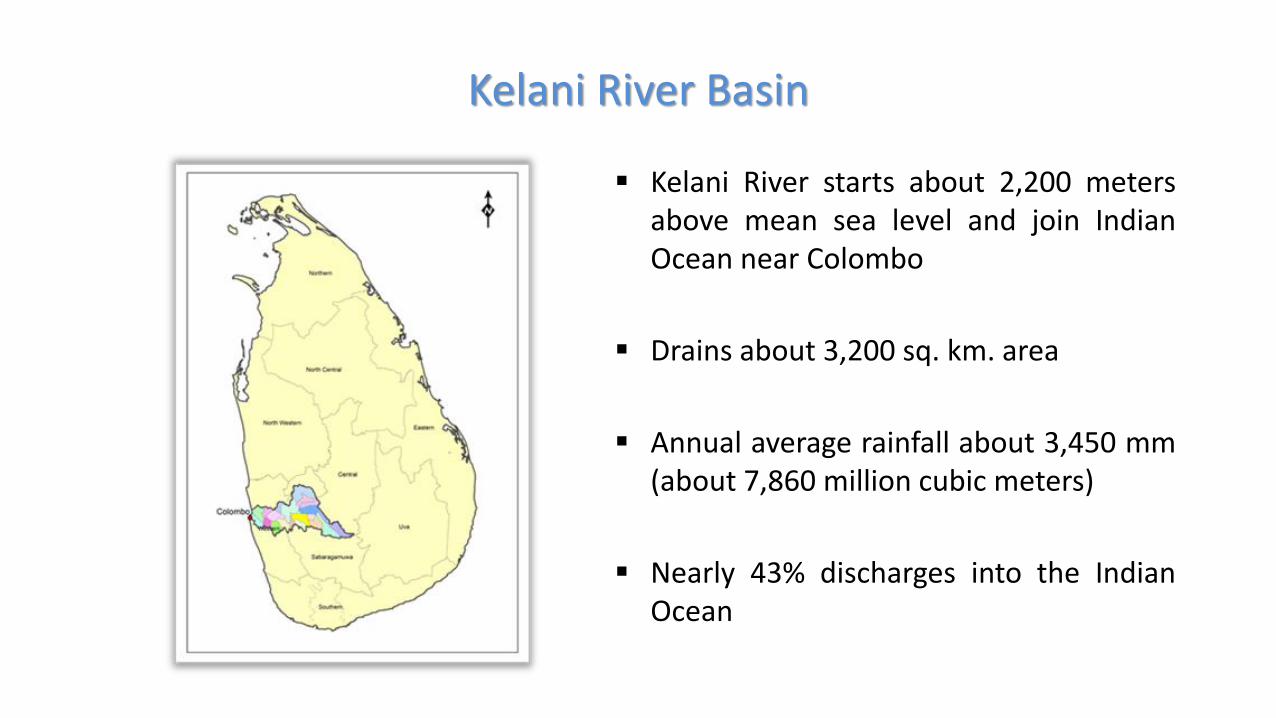
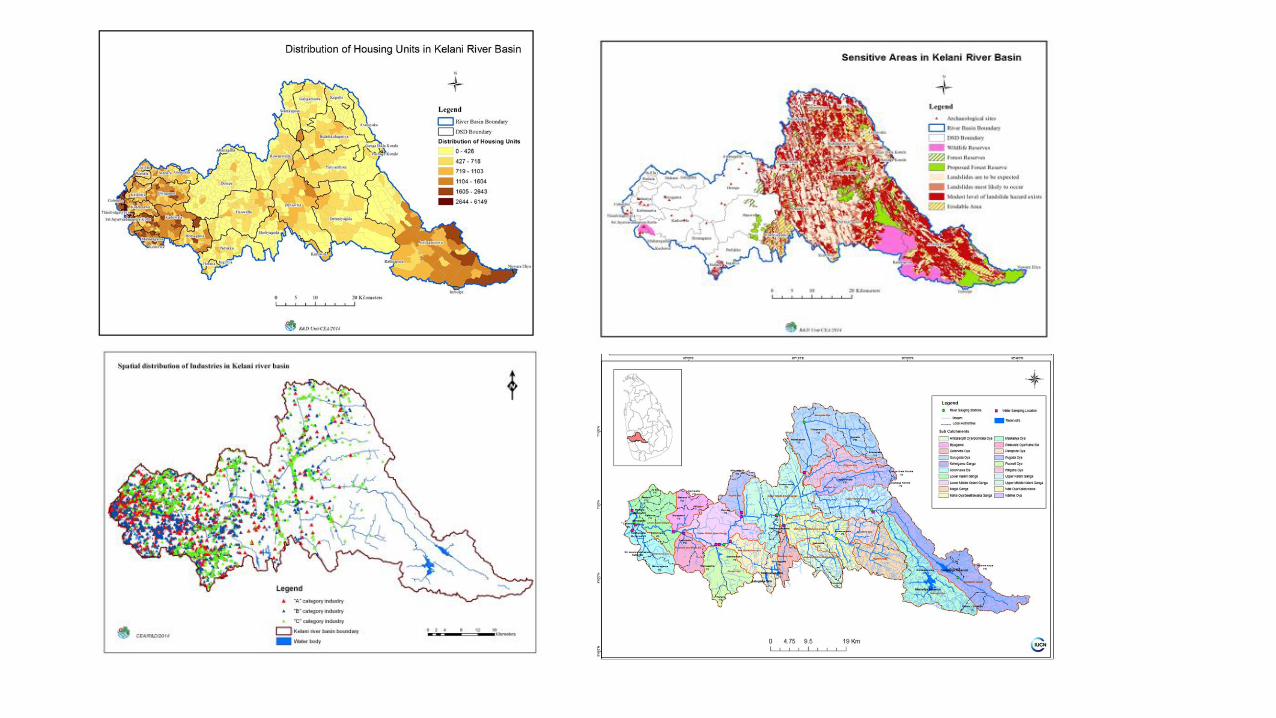
Kelani River Basin
Kelani River starts about 2,200 metersabove mean sea level and join IndianOcean near Colombo
Drains about 3,200 sq. km. area
Annual average rainfall about 3,450 mm(about 7,860 million cubic meters)
Nearly 43% discharges into the IndianOcean
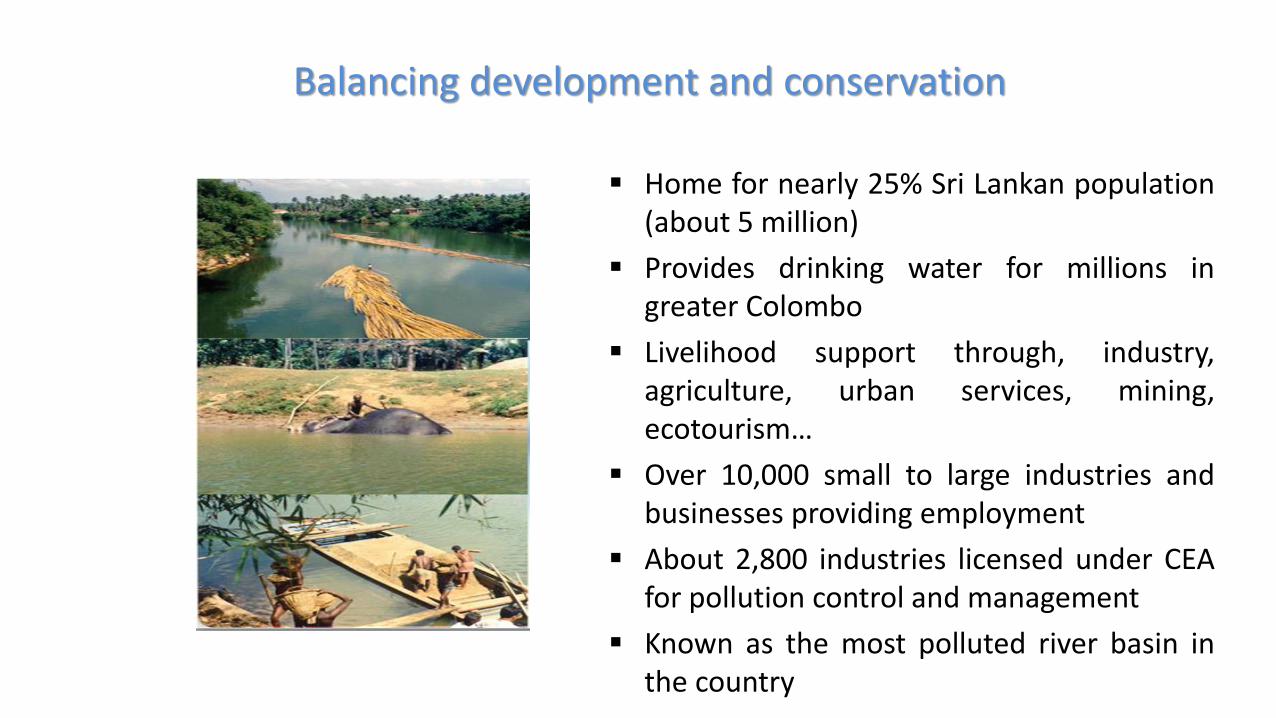
Balancing development and conservation
Home for nearly 25% Sri Lankan population(about 5 million)
Provides drinking water for millions ingreater Colombo
Livelihood support through, industry,agriculture, urban services, mining,ecotourism…
Over 10,000 small to large industries andbusinesses providing employment
About 2,800 industries licensed under CEAfor pollution control and management
Known as the most polluted river basin inthe country
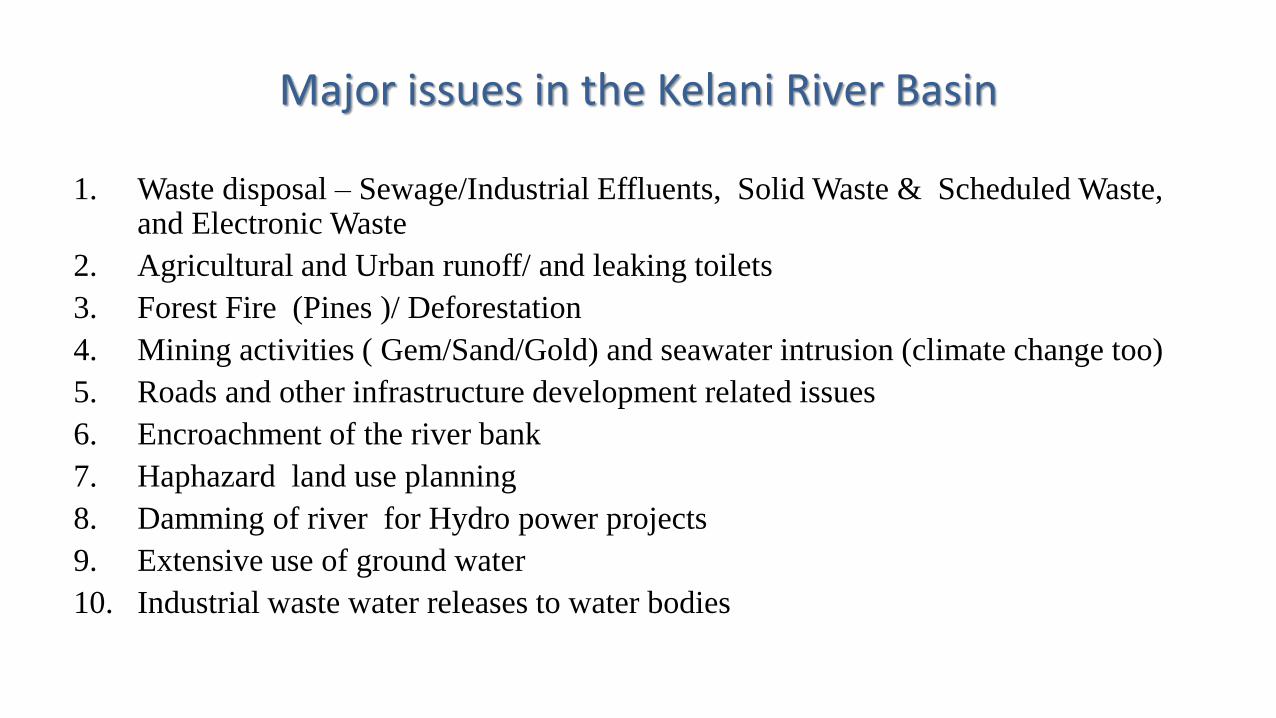
Major issues in the Kelani River Basin
1. Waste disposal – Sewage/Industrial Effluents, Solid Waste & Scheduled Waste, and Electronic Waste
2. Agricultural and Urban runoff/ and leaking toilets
3. Forest Fire (Pines )/ Deforestation
4. Mining activities ( Gem/Sand/Gold) and seawater intrusion (climate change too)
5. Roads and other infrastructure development related issues
6. Encroachment of the river bank
7. Haphazard land use planning
8. Damming of river for Hydro power projects
9. Extensive use of ground water
10. Industrial waste water releases to water bodies
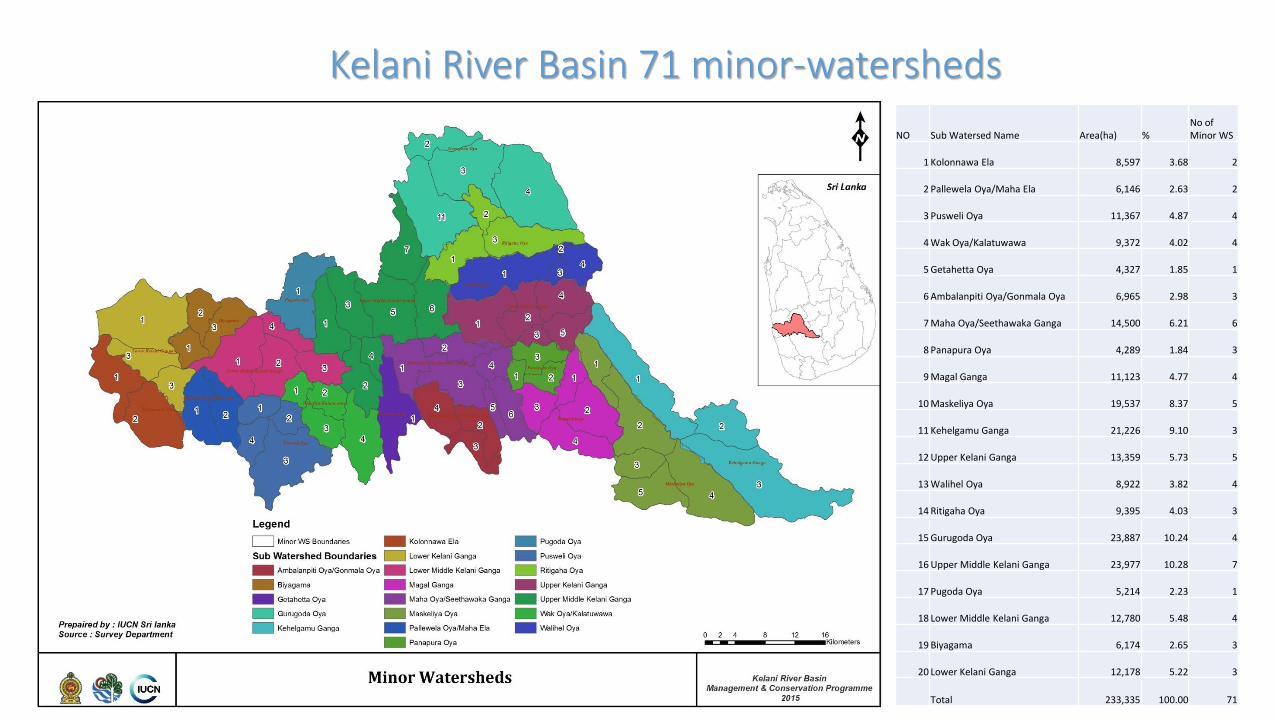
NO Sub Watersed Name Area(ha) %No of Minor WS
1 Kolonnawa Ela 8,597 3.68 2
2 Pallewela Oya/Maha Ela 6,146 2.63 2
3 Pusweli Oya 11,367 4.87 4
4 Wak Oya/Kalatuwawa 9,372 4.02 4
5 Getahetta Oya 4,327 1.85 1
6 Ambalanpiti Oya/Gonmala Oya 6,965 2.98 3
7 Maha Oya/Seethawaka Ganga 14,500 6.21 6
8 Panapura Oya 4,289 1.84 3
9 Magal Ganga 11,123 4.77 4
10 Maskeliya Oya 19,537 8.37 5
11 Kehelgamu Ganga 21,226 9.10 3
12 Upper Kelani Ganga 13,359 5.73 5
13 Walihel Oya 8,922 3.82 4
14 Ritigaha Oya 9,395 4.03 3
15 Gurugoda Oya 23,887 10.24 4
16 Upper Middle Kelani Ganga 23,977 10.28 7
17 Pugoda Oya 5,214 2.23 1
18 Lower Middle Kelani Ganga 12,780 5.48 4
19 Biyagama 6,174 2.65 3
20 Lower Kelani Ganga 12,178 5.22 3
Total 233,335 100.00 71
Kelani River Basin 71 minor-watersheds
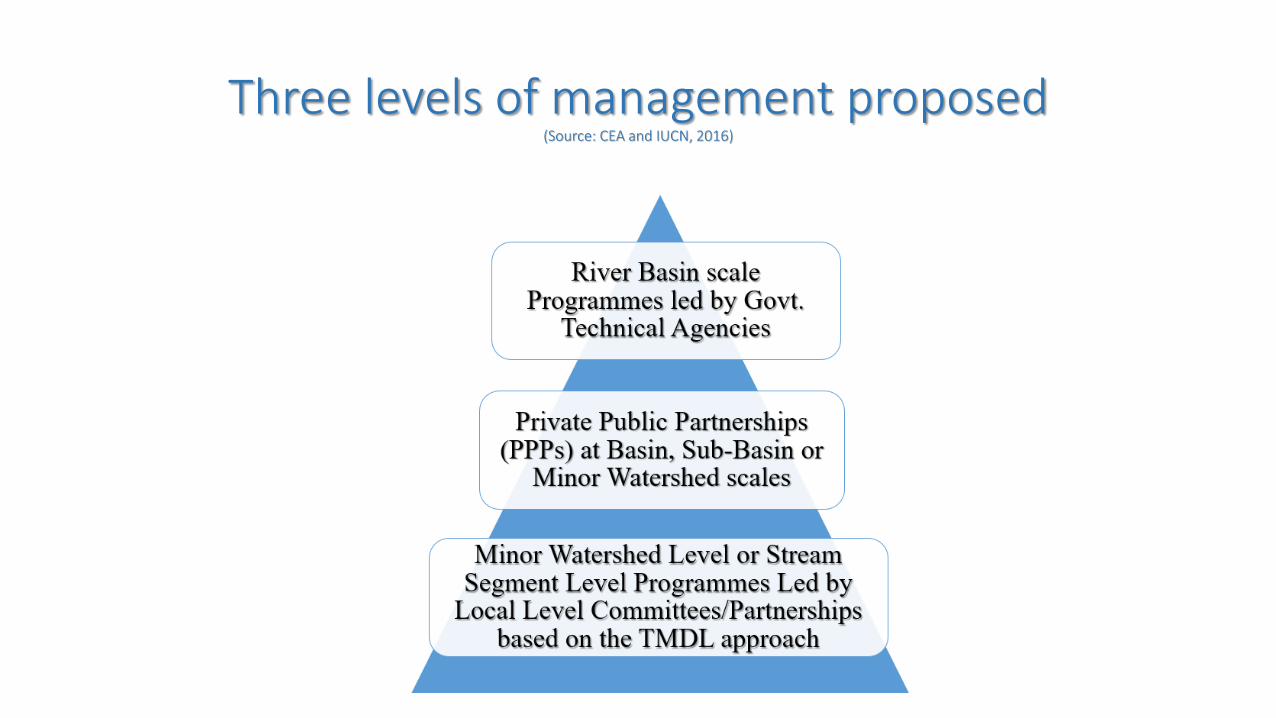
Three levels of management proposed(Source: CEA and IUCN, 2016)
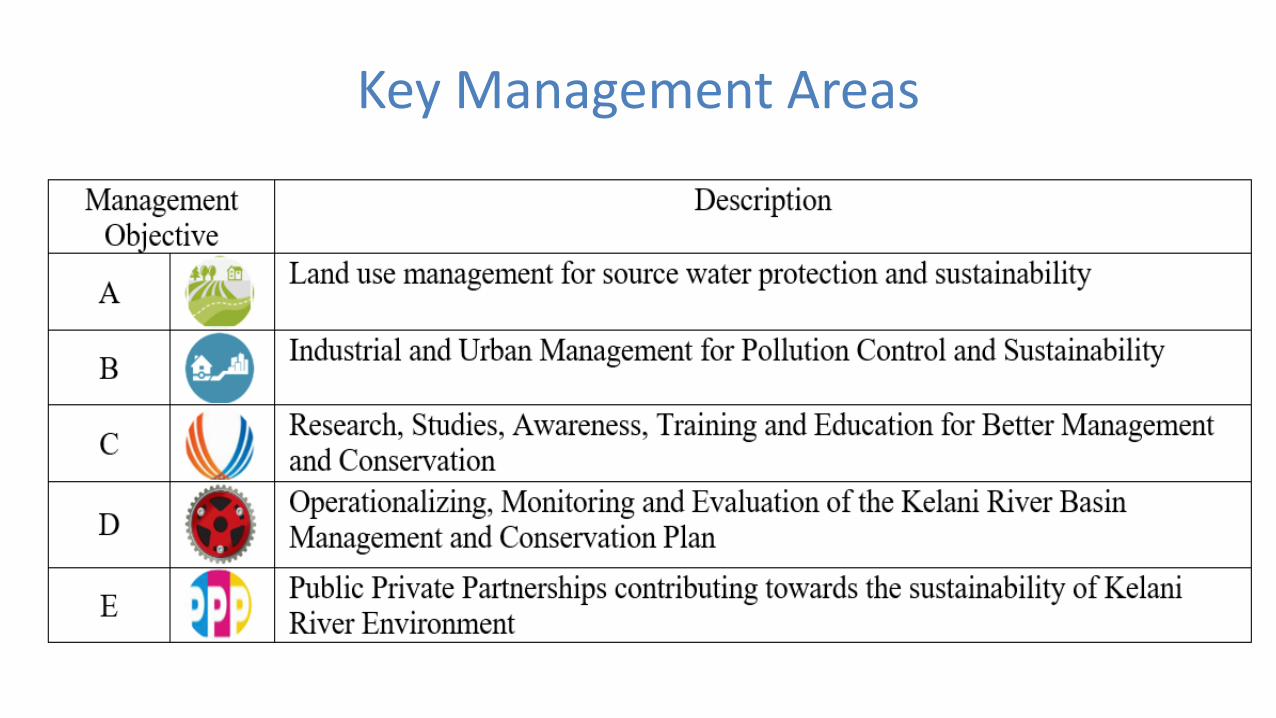
Key Management Areas
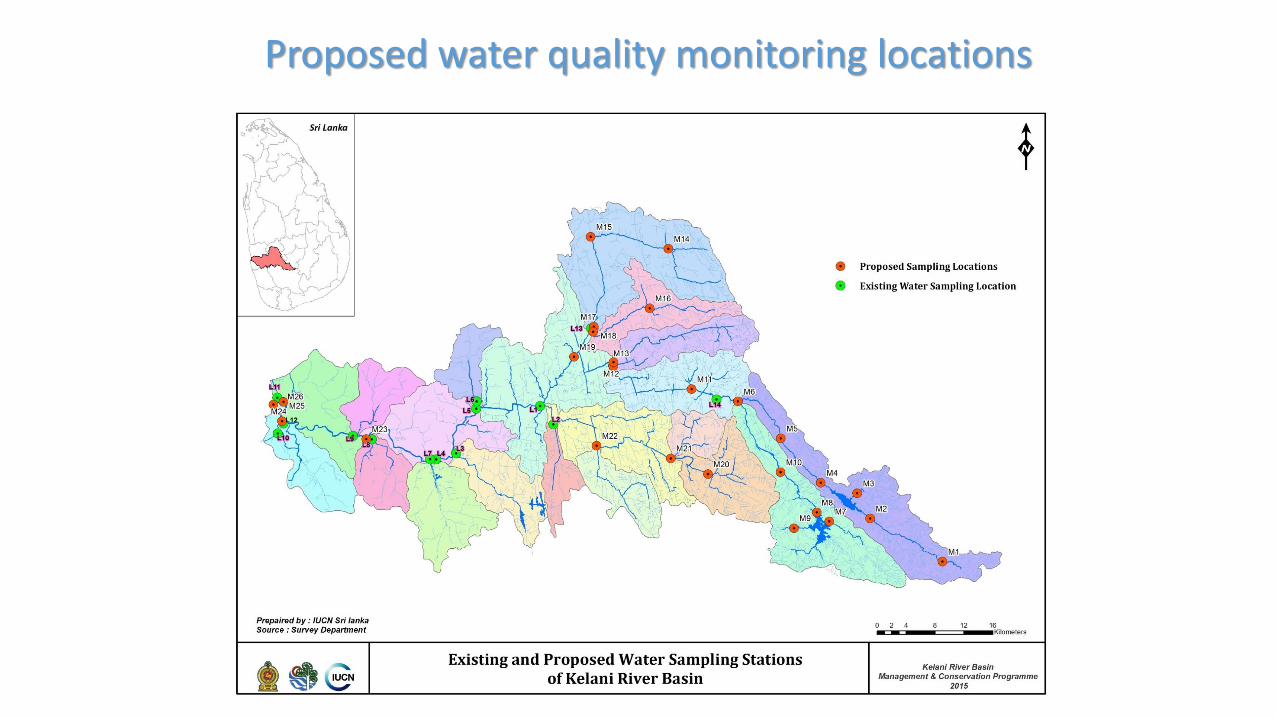
Proposed water quality monitoring locations
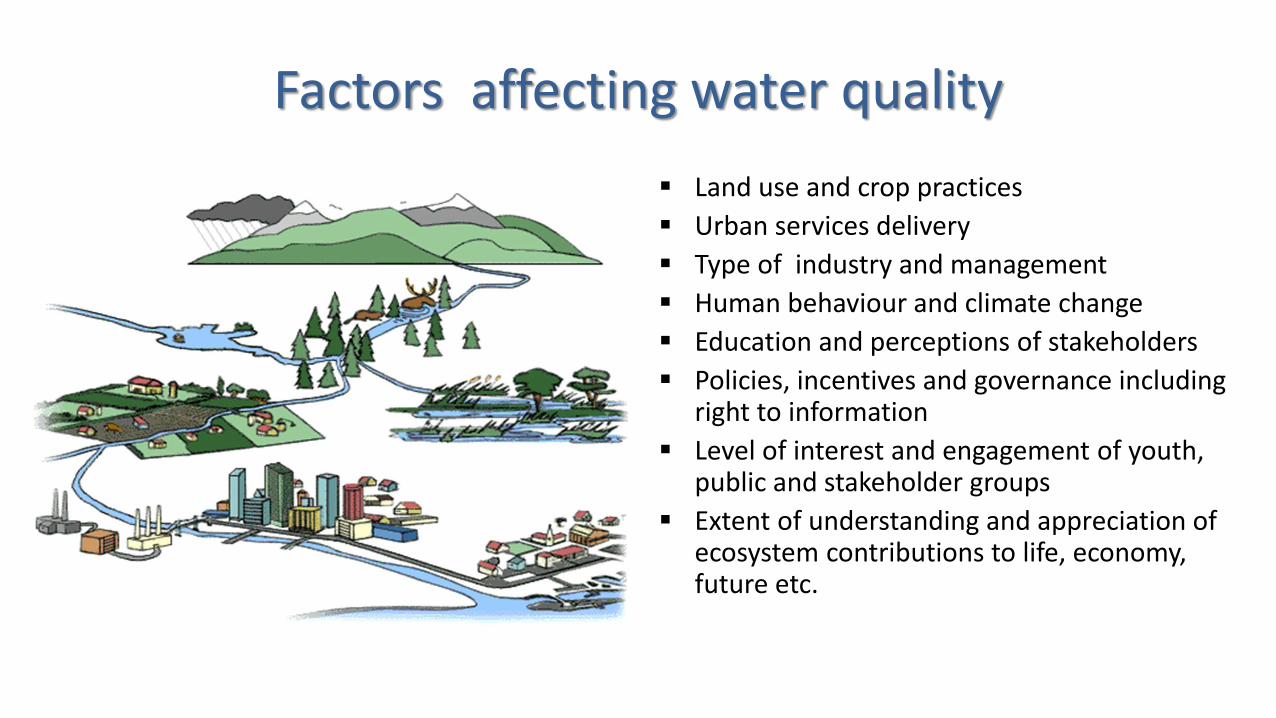
Factors affecting water quality
Land use and crop practices
Urban services delivery
Type of industry and management
Human behaviour and climate change
Education and perceptions of stakeholders
Policies, incentives and governance including right to information
Level of interest and engagement of youth, public and stakeholder groups
Extent of understanding and appreciation of ecosystem contributions to life, economy, future etc.
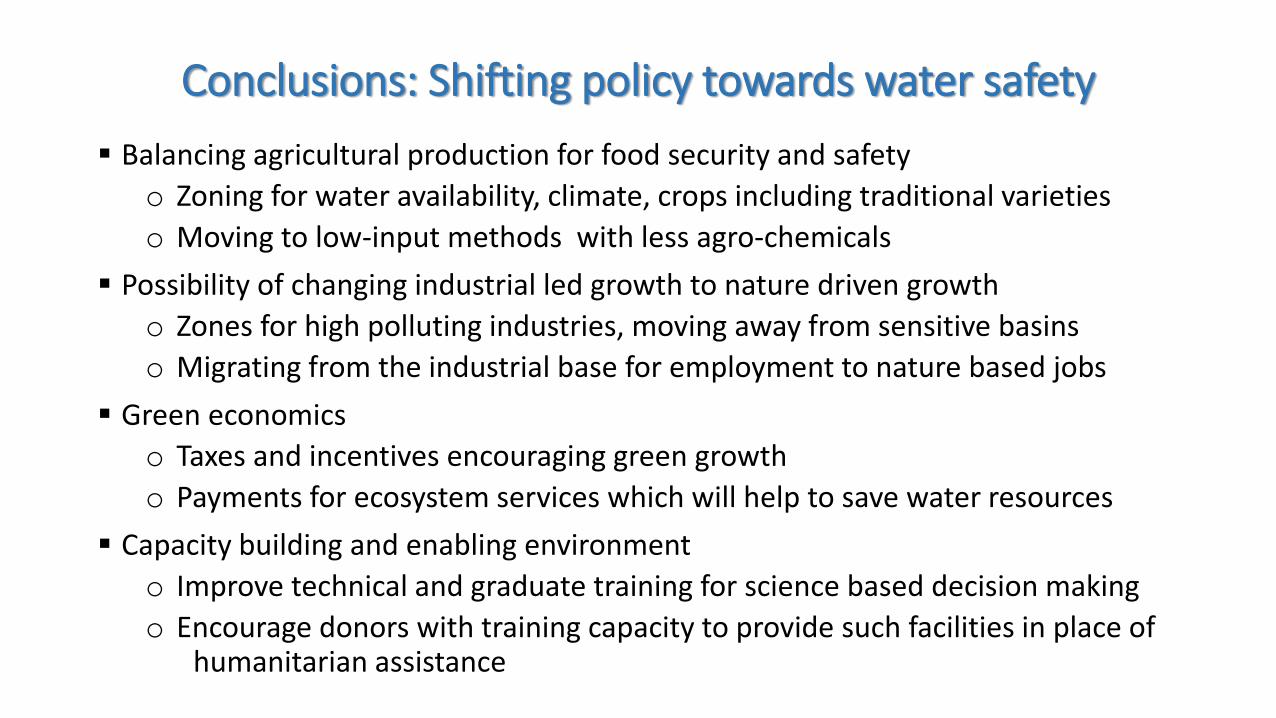
Conclusions: Shifting policy towards water safety
Balancing agricultural production for food security and safety
o Zoning for water availability, climate, crops including traditional varieties
o Moving to low-input methods with less agro-chemicals
Possibility of changing industrial led growth to nature driven growth
o Zones for high polluting industries, moving away from sensitive basins
o Migrating from the industrial base for employment to nature based jobs
Green economics
o Taxes and incentives encouraging green growth
o Payments for ecosystem services which will help to save water resources
Capacity building and enabling environment
o Improve technical and graduate training for science based decision making
o Encourage donors with training capacity to provide such facilities in place of humanitarian assistance
Thank [email protected]