Embed Size (px)
Citation preview
4/22/2014
1
Water Quality and Waller CreekDr. Kinney &
UTBIOME Collaborators
The Visible
&
The Invisible
http://www.utexas.edu/tmm/sponsored_sites/waller/news.htm
What is in Waller Creek?
A Wide Variety of Biota!Yellow‐crowned Night
Heronat 24th Street Bridge
June 2003 Photo by Dr. Ed Theriot
SnakeUTBIOME Station 2
Waller Creek Sampling by CE 341 ClassOctober 2013
4/22/2014
2
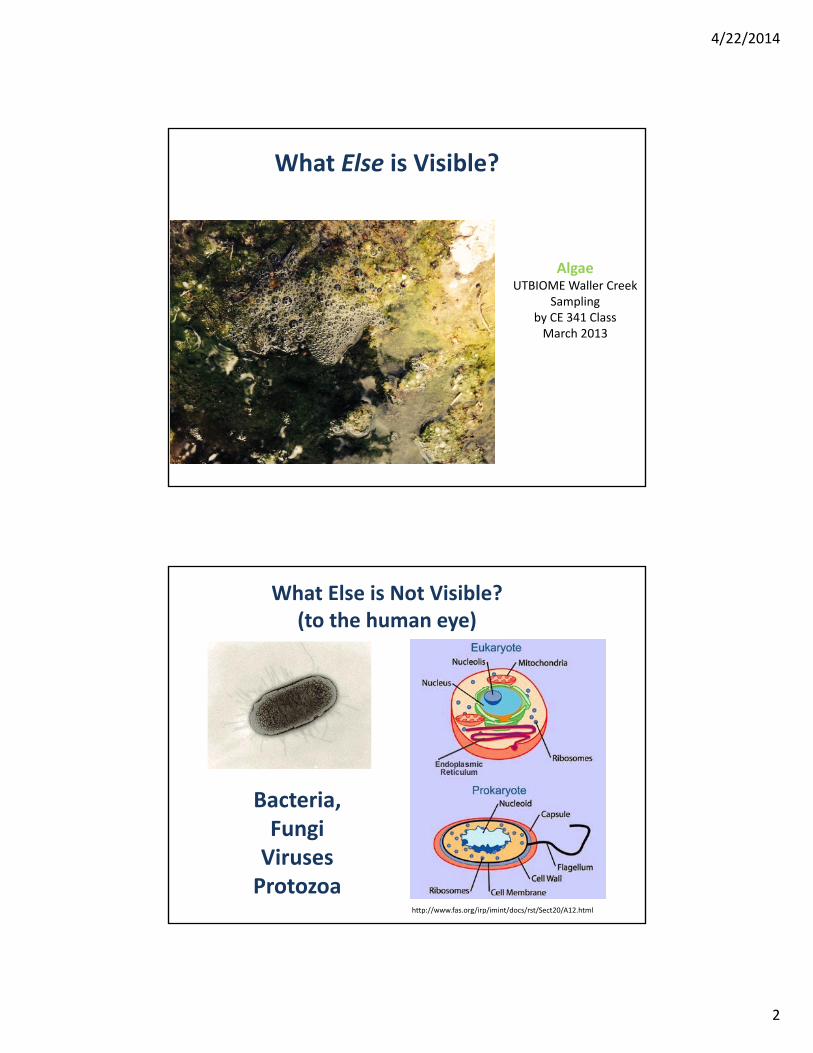
What Else is Visible?
Algae UTBIOME Waller Creek
Sampling by CE 341 ClassMarch 2013
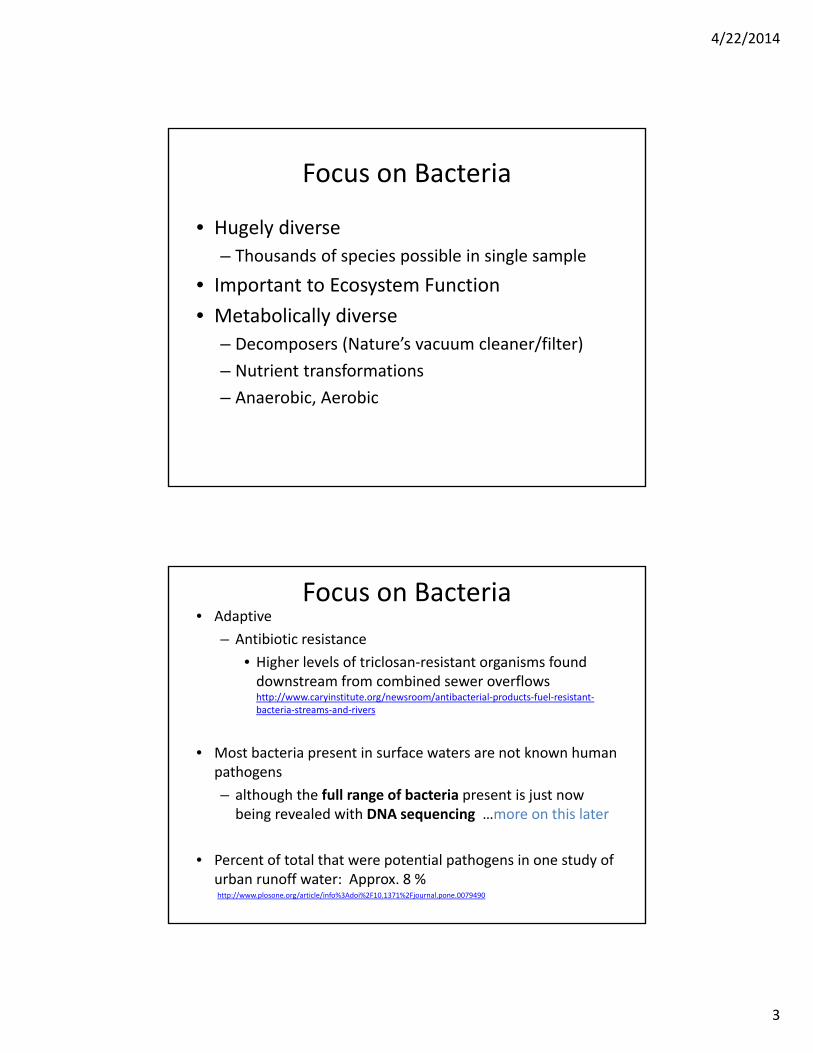
What Else is Not Visible?(to the human eye)
Bacteria,FungiVirusesProtozoa
http://www.fas.org/irp/imint/docs/rst/Sect20/A12.html
4/22/2014
3
Focus on Bacteria
• Hugely diverse
– Thousands of species possible in single sample
• Important to Ecosystem Function
• Metabolically diverse
– Decomposers (Nature’s vacuum cleaner/filter)
– Nutrient transformations
– Anaerobic, Aerobic
Focus on Bacteria• Adaptive
– Antibiotic resistance
• Higher levels of triclosan‐resistant organisms found downstream from combined sewer overflows http://www.caryinstitute.org/newsroom/antibacterial‐products‐fuel‐resistant‐bacteria‐streams‐and‐rivers
• Most bacteria present in surface waters are not known human pathogens
– although the full range of bacteria present is just now being revealed with DNA sequencing …more on this later
• Percent of total that were potential pathogens in one study of urban runoff water: Approx. 8 %http://www.plosone.org/article/info%3Adoi%2F10.1371%2Fjournal.pone.0079490
4/22/2014
4
Why do we care about what microorganisms are present?
Protect Human Health
Protect Ecosystem Health(e.g., contaminants can shift microbial community from algae to cyanobacteria)
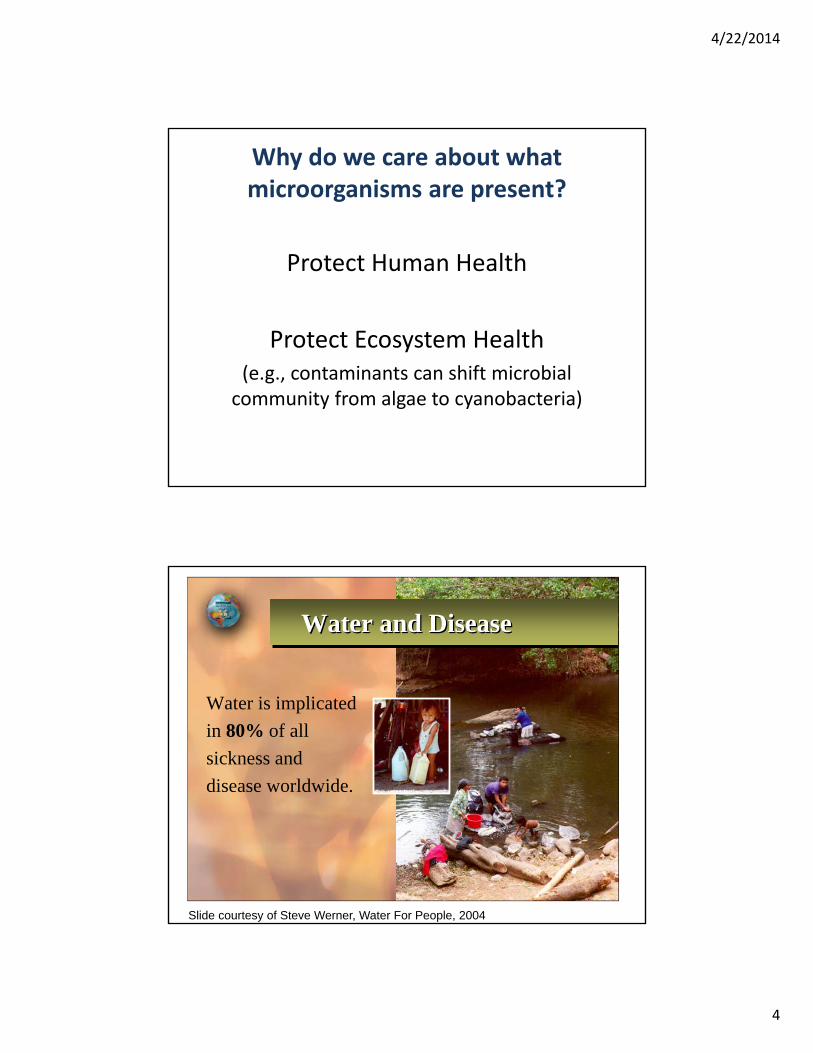
Water is implicated
in 80% of all
sickness and
disease worldwide.
Water and DiseaseWater and Disease
Slide courtesy of Steve Werner, Water For People, 2004
4/22/2014
5
Drinking Water and Sanitation: Global
• Some sobering statistics from the World Health Organization
• Approximately 1.5 million deaths per year due to poor water quality, poor sanitation and hygiene.
– Equivalent to the deaths of the entire population of Austin metropolitan area (approx. 1.6 million)
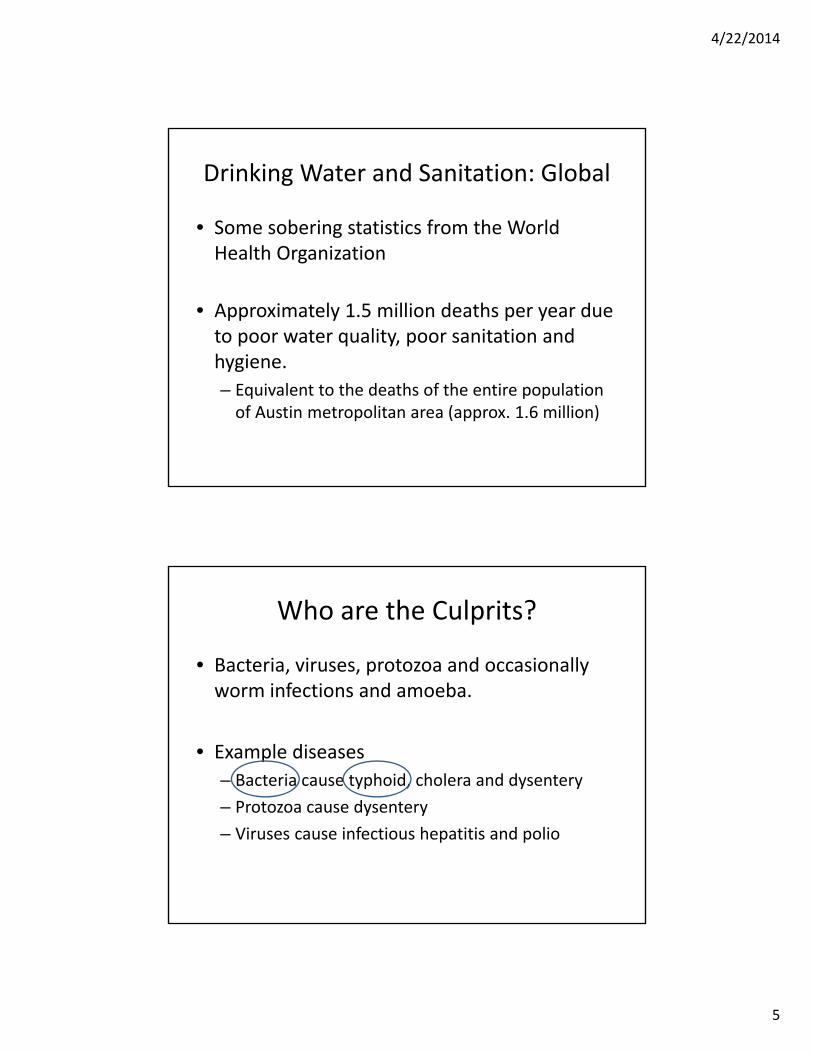
Who are the Culprits?
• Bacteria, viruses, protozoa and occasionally worm infections and amoeba.
• Example diseases
– Bacteria cause typhoid, cholera and dysentery
– Protozoa cause dysentery
– Viruses cause infectious hepatitis and polio
4/22/2014
6
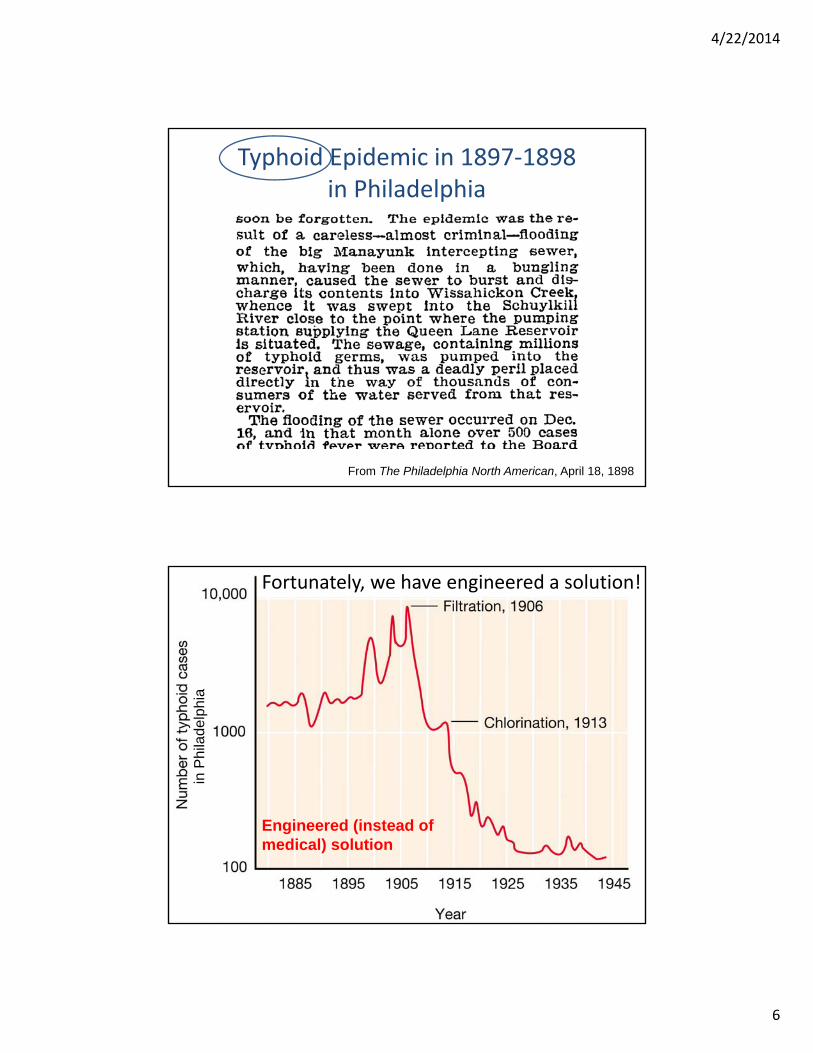
Typhoid Epidemic in 1897‐1898 in Philadelphia
From The Philadelphia North American, April 18, 1898
in P
hila
delp
hia
Engineered (instead of medical) solution
Fortunately, we have engineered a solution!
4/22/2014
7
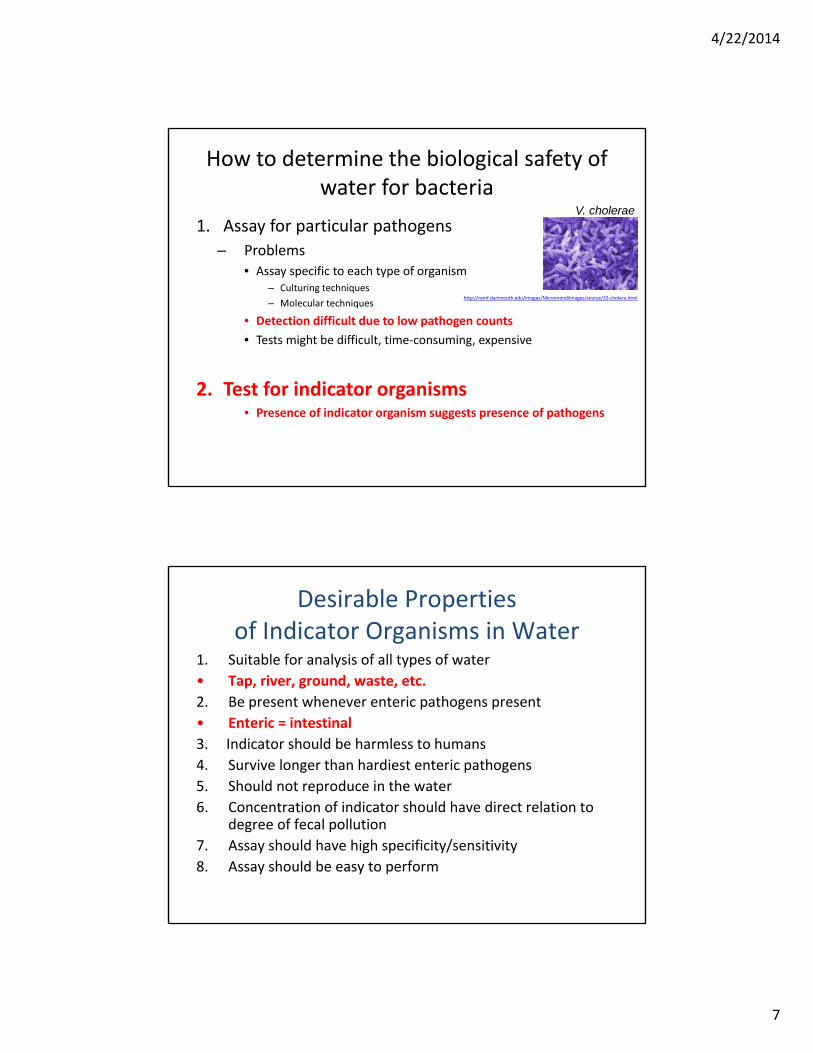
How to determine the biological safety of water for bacteria
1. Assay for particular pathogens
– Problems• Assay specific to each type of organism
– Culturing techniques
– Molecular techniques
• Detection difficult due to low pathogen counts
• Tests might be difficult, time‐consuming, expensive
2. Test for indicator organisms• Presence of indicator organism suggests presence of pathogens
http://remf.dartmouth.edu/images/MicromondiImages/source/32‐cholera.html
V. cholerae
Desirable Properties of Indicator Organisms in Water
1. Suitable for analysis of all types of water
• Tap, river, ground, waste, etc.
2. Be present whenever enteric pathogens present
• Enteric = intestinal
3. Indicator should be harmless to humans
4. Survive longer than hardiest enteric pathogens
5. Should not reproduce in the water
6. Concentration of indicator should have direct relation to degree of fecal pollution
7. Assay should have high specificity/sensitivity
8. Assay should be easy to perform
4/22/2014
8
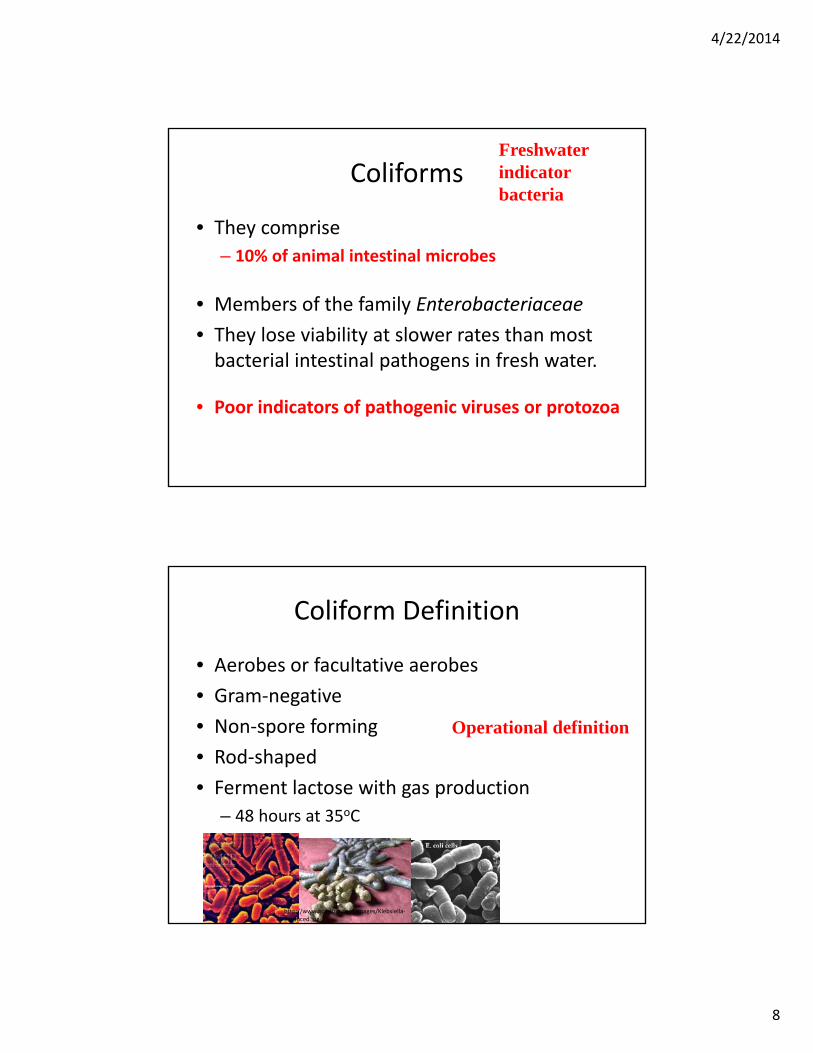
Coliforms
• They comprise
– 10% of animal intestinal microbes
• Members of the family Enterobacteriaceae
• They lose viability at slower rates than most bacterial intestinal pathogens in fresh water.
• Poor indicators of pathogenic viruses or protozoa
Freshwater indicator bacteria
Coliform Definition
• Aerobes or facultative aerobes
• Gram‐negative
• Non‐spore forming
• Rod‐shaped
• Ferment lactose with gas production
– 48 hours at 35oC
Operational definition
http://www.gcarlson.com/images/Klebsiella‐2reduced.jpg
4/22/2014
9
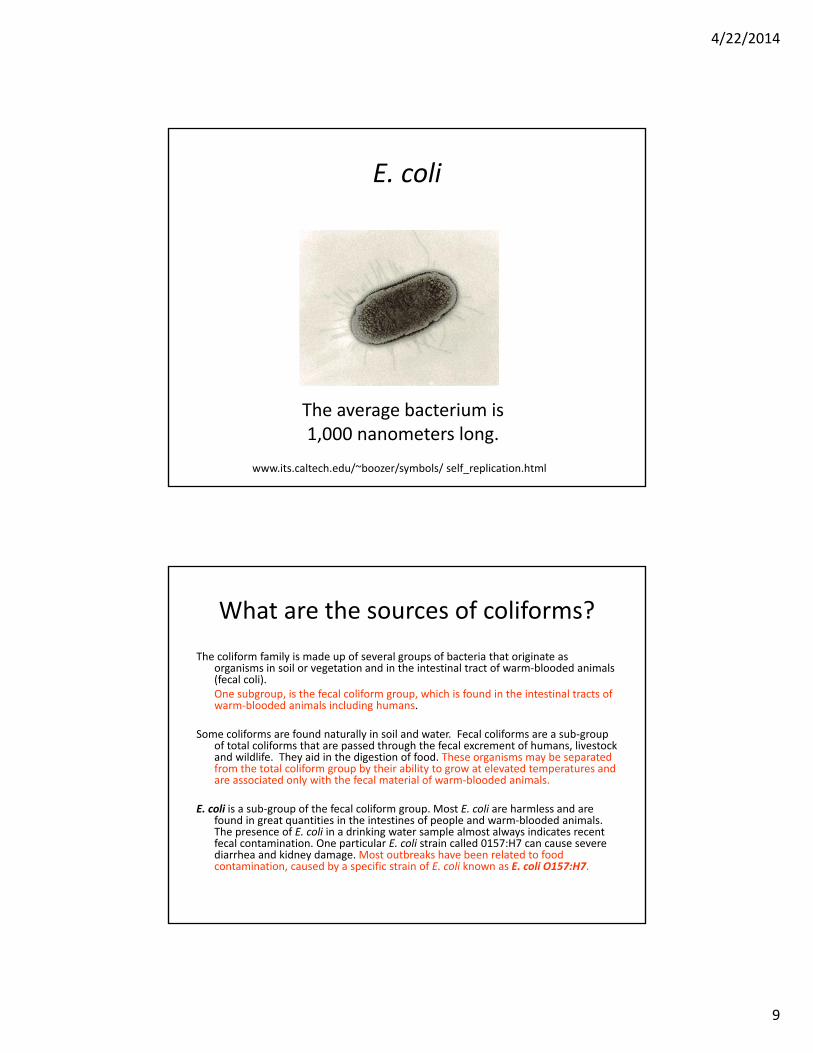
E. coli
www.its.caltech.edu/~boozer/symbols/ self_replication.html
The average bacterium is 1,000 nanometers long.
What are the sources of coliforms?
The coliform family is made up of several groups of bacteria that originate as organisms in soil or vegetation and in the intestinal tract of warm‐blooded animals (fecal coli). One subgroup, is the fecal coliform group, which is found in the intestinal tracts of warm‐blooded animals including humans.
Some coliforms are found naturally in soil and water. Fecal coliforms are a sub‐group of total coliforms that are passed through the fecal excrement of humans, livestock and wildlife. They aid in the digestion of food. These organisms may be separated from the total coliform group by their ability to grow at elevated temperatures and are associated only with the fecal material of warm‐blooded animals.
E. coli is a sub‐group of the fecal coliform group. Most E. coli are harmless and are found in great quantities in the intestines of people and warm‐blooded animals. The presence of E. coli in a drinking water sample almost always indicates recent fecal contamination. One particular E. coli strain called 0157:H7 can cause severe diarrhea and kidney damage. Most outbreaks have been related to food contamination, caused by a specific strain of E. coli known as E. coli O157:H7.
4/22/2014
10
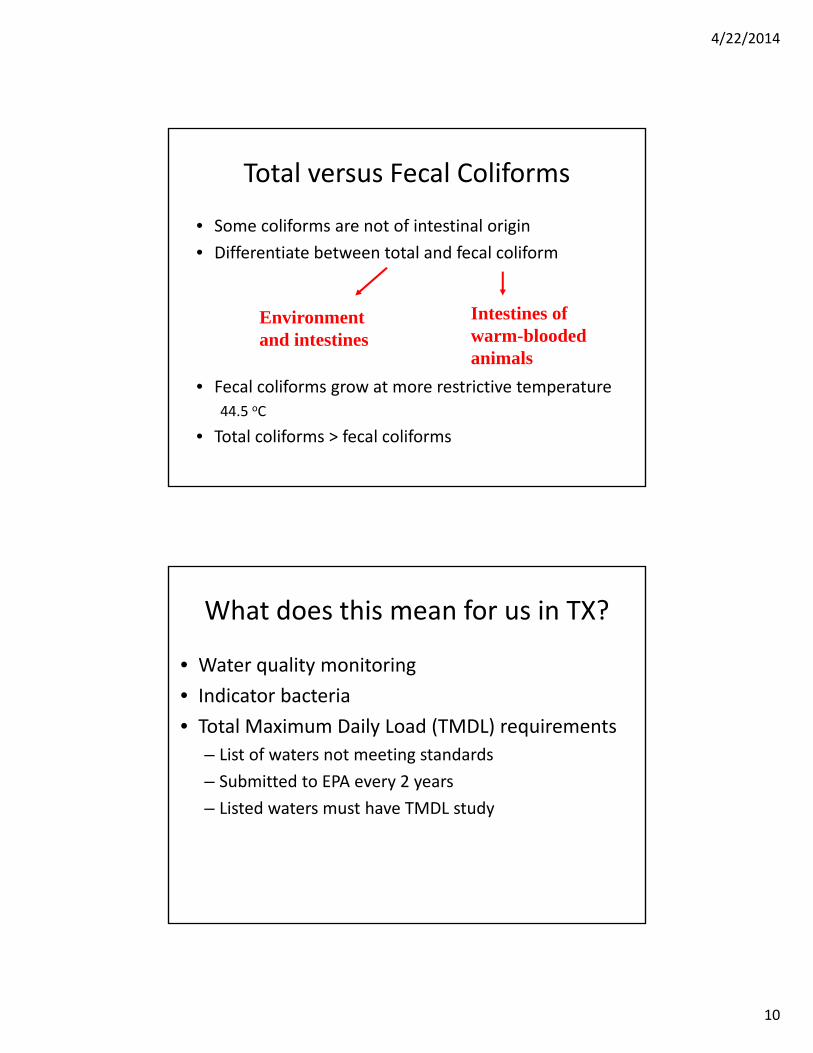
Total versus Fecal Coliforms
• Some coliforms are not of intestinal origin
• Differentiate between total and fecal coliform
• Fecal coliforms grow at more restrictive temperature
44.5 oC
• Total coliforms > fecal coliforms
Environment and intestines
Intestines ofwarm-blooded animals
What does this mean for us in TX?
• Water quality monitoring
• Indicator bacteria
• Total Maximum Daily Load (TMDL) requirements
– List of waters not meeting standards
– Submitted to EPA every 2 years
– Listed waters must have TMDL study

4/22/2014
11
TMDL Calculation
TMDL: Maximum quantity of a pollutant that can enter a water body and still meet WQ standards
% Reduction
TMDL = Point‐source allocation + Non‐point source allocation + Margin of Safety (MOS)
Implementation
MOS
Point
Non‐Point
Total
Causes of Impaired Waters in Texas
• A total of 568 impairments are now included in Category 5.
• Impairments due to elevated bacteria represent the highest percentage (45%) included in Category 5.
http://www.tceq.texas.gov/waterquality/assessment/12twqi
4/22/2014
12
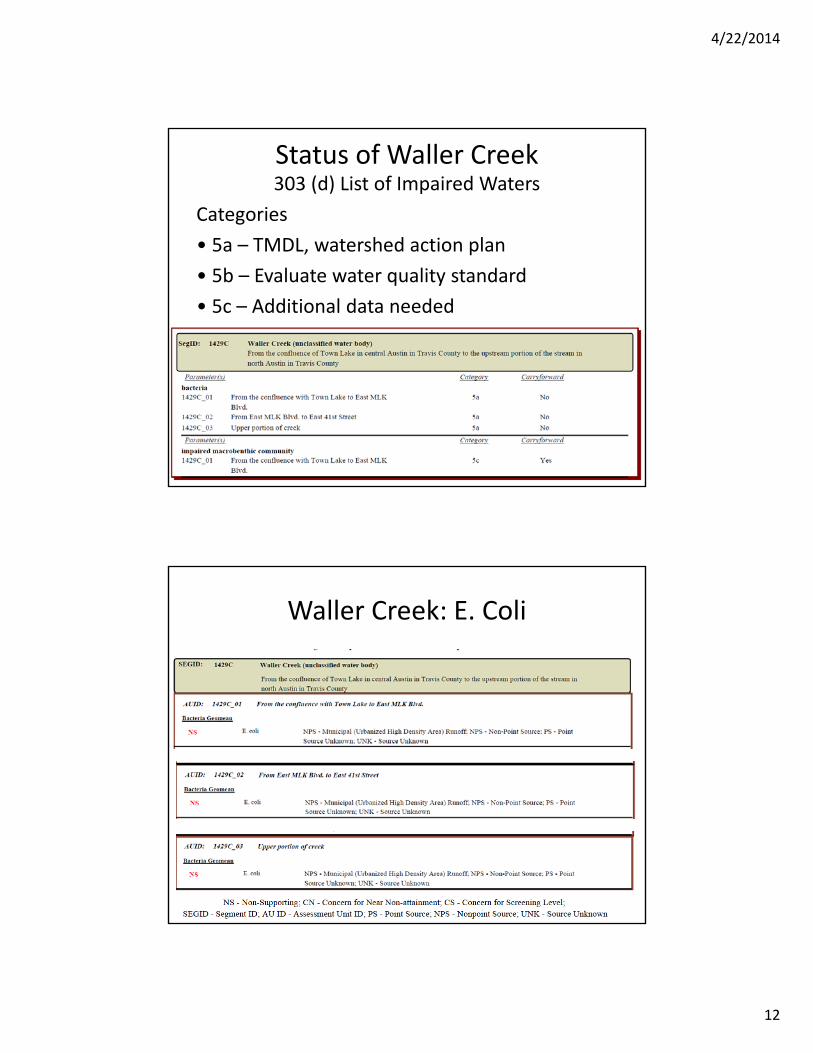
Status of Waller Creek303 (d) List of Impaired Waters
Categories
• 5a – TMDL, watershed action plan
• 5b – Evaluate water quality standard
• 5c – Additional data needed
Waller Creek: E. Coli
4/22/2014
13
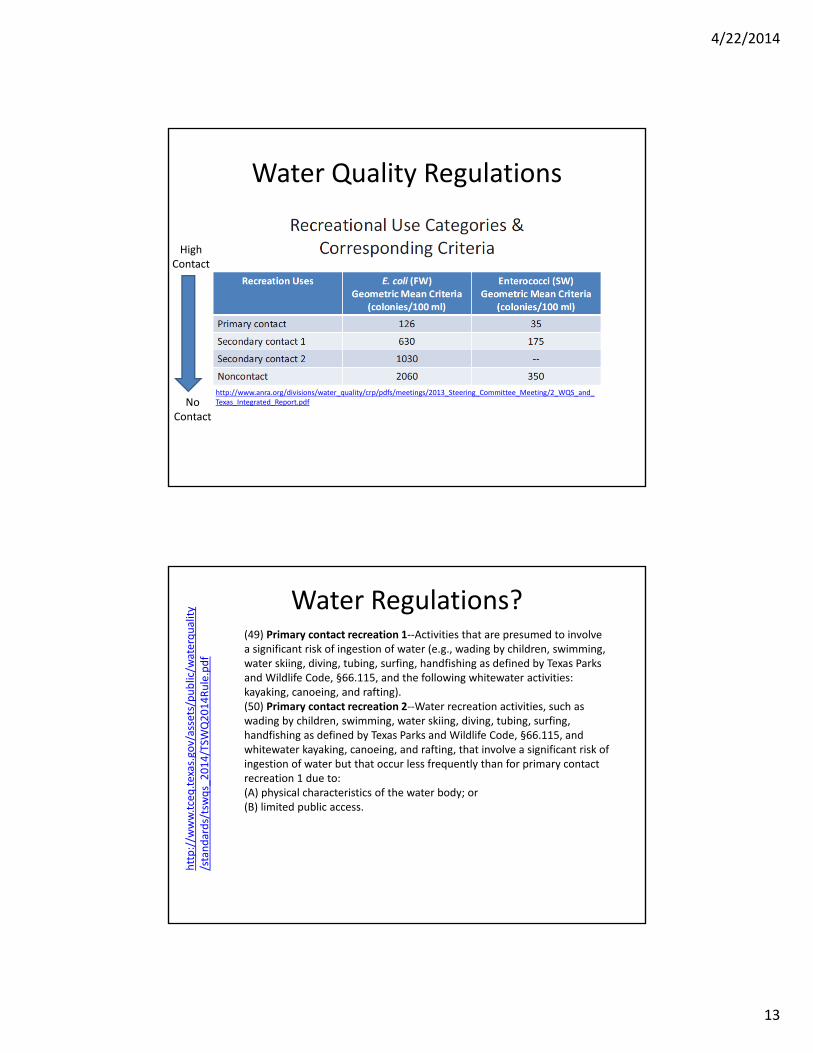
Water Quality Regulations
High Contact
NoContact
http://www.anra.org/divisions/water_quality/crp/pdfs/meetings/2013_Steering_Committee_Meeting/2_WQS_and_Texas_Integrated_Report.pdf
Water Regulations? (49) Primary contact recreation 1‐‐Activities that are presumed to involve a significant risk of ingestion of water (e.g., wading by children, swimming, water skiing, diving, tubing, surfing, handfishing as defined by Texas Parks and Wildlife Code, §66.115, and the following whitewater activities: kayaking, canoeing, and rafting). (50) Primary contact recreation 2‐‐Water recreation activities, such as wading by children, swimming, water skiing, diving, tubing, surfing, handfishing as defined by Texas Parks and Wildlife Code, §66.115, and whitewater kayaking, canoeing, and rafting, that involve a significant risk of ingestion of water but that occur less frequently than for primary contact recreation 1 due to: (A) physical characteristics of the water body; or (B) limited public access.
http://w
ww.tceq.texas.gov/assets/public/w
aterquality
/standards/tswqs_2014/TSW
Q2014Rule.pdf
4/22/2014
14
Water Regulations? http://w
ww.tceq.texas.gov/assets/public/w
aterquality
/standards/tswqs_2014/TSW
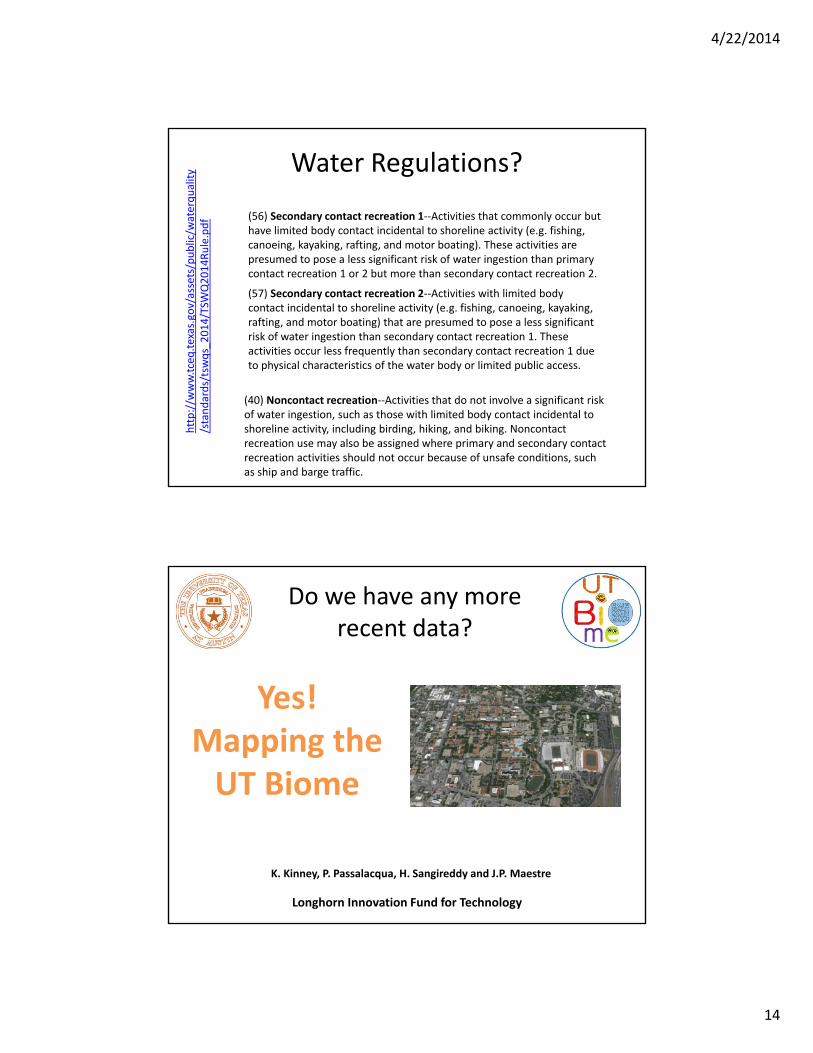
Q2014Rule.pdf (56) Secondary contact recreation 1‐‐Activities that commonly occur but
have limited body contact incidental to shoreline activity (e.g. fishing, canoeing, kayaking, rafting, and motor boating). These activities are presumed to pose a less significant risk of water ingestion than primary contact recreation 1 or 2 but more than secondary contact recreation 2.
(57) Secondary contact recreation 2‐‐Activities with limited body contact incidental to shoreline activity (e.g. fishing, canoeing, kayaking, rafting, and motor boating) that are presumed to pose a less significant risk of water ingestion than secondary contact recreation 1. These activities occur less frequently than secondary contact recreation 1 due to physical characteristics of the water body or limited public access.
(40) Noncontact recreation‐‐Activities that do not involve a significant risk of water ingestion, such as those with limited body contact incidental to shoreline activity, including birding, hiking, and biking. Noncontact recreation use may also be assigned where primary and secondary contact recreation activities should not occur because of unsafe conditions, such as ship and barge traffic.
Yes!Mapping the UT Biome
Longhorn Innovation Fund for Technology
K. Kinney, P. Passalacqua, H. Sangireddy and J.P. Maestre
Do we have any more recent data?
4/22/2014
15
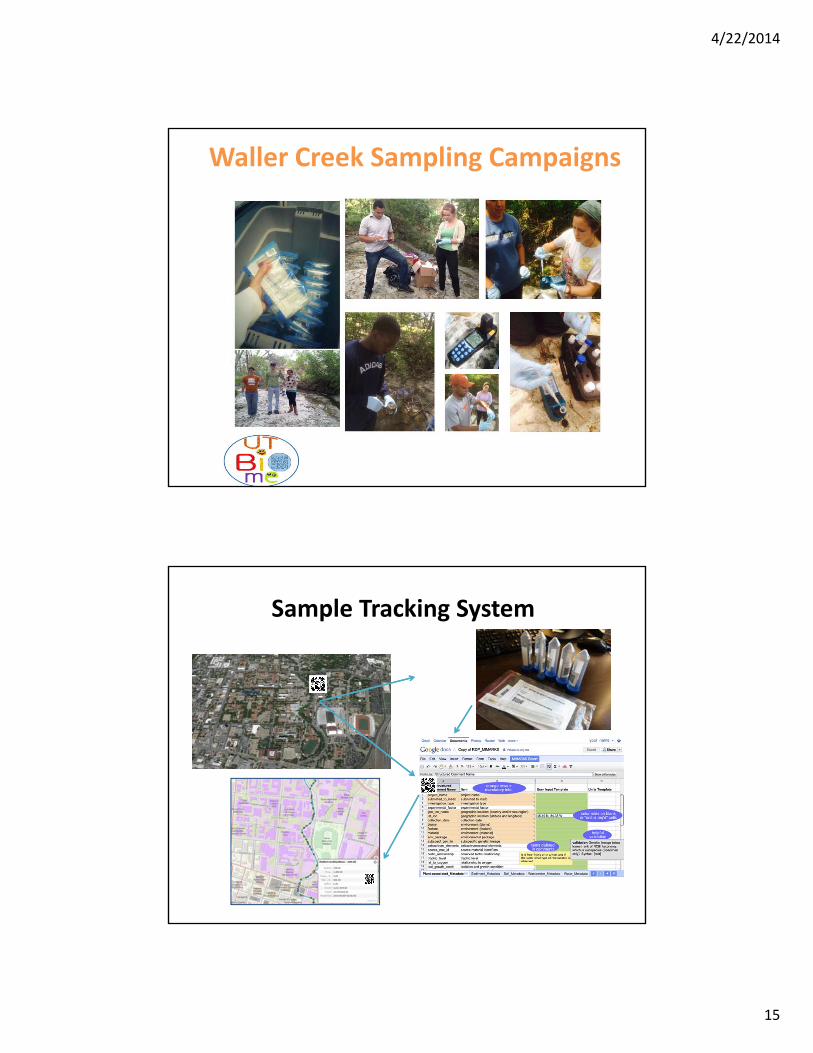
Waller Creek Sampling Campaigns
Sample Tracking System

4/22/2014
16
Interactive Mapping Platform Under Development
Regions of The University of Texas at Austin

4/22/2014
17
Time series at Upstream Station on Waller creek.
Waller Creek Transect
4/22/2014
18
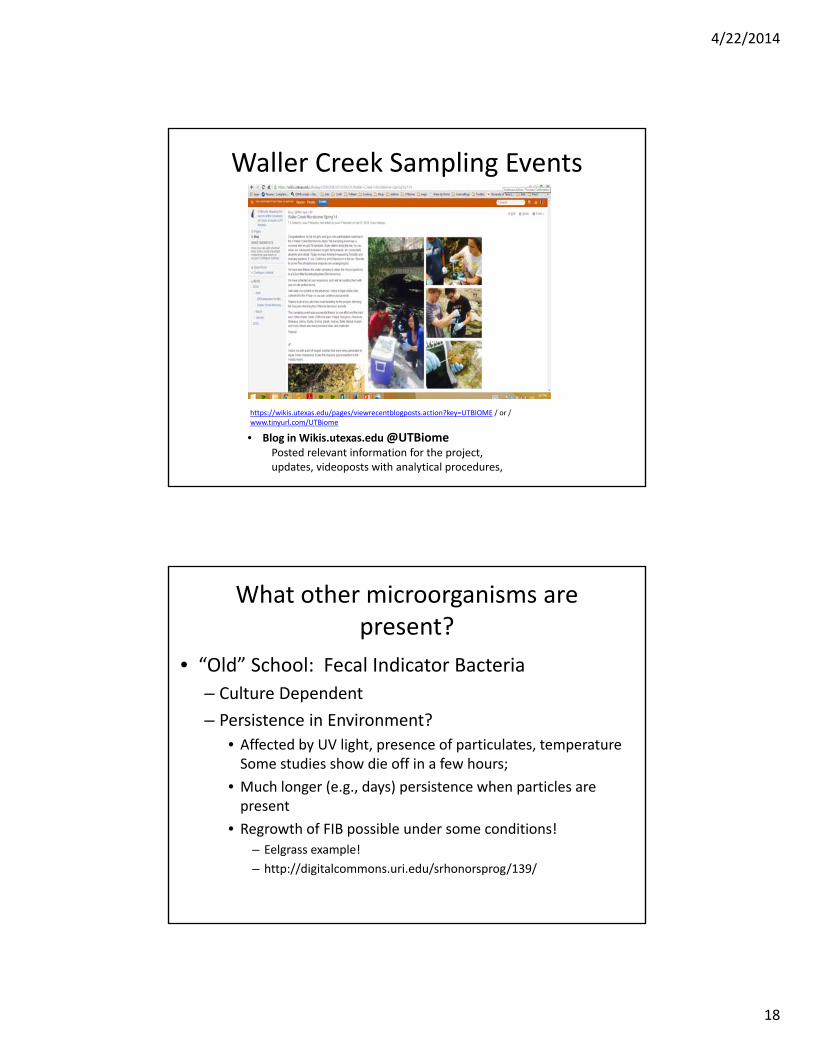
Waller Creek Sampling Events
https://wikis.utexas.edu/pages/viewrecentblogposts.action?key=UTBIOME / or / www.tinyurl.com/UTBiome
• Blog in Wikis.utexas.edu @UTBiomePosted relevant information for the project, updates, videoposts with analytical procedures,
What other microorganisms are present?
• “Old” School: Fecal Indicator Bacteria
– Culture Dependent
– Persistence in Environment?
• Affected by UV light, presence of particulates, temperature Some studies show die off in a few hours;
• Much longer (e.g., days) persistence when particles are present
• Regrowth of FIB possible under some conditions!– Eelgrass example!
– http://digitalcommons.uri.edu/srhonorsprog/139/
4/22/2014
19
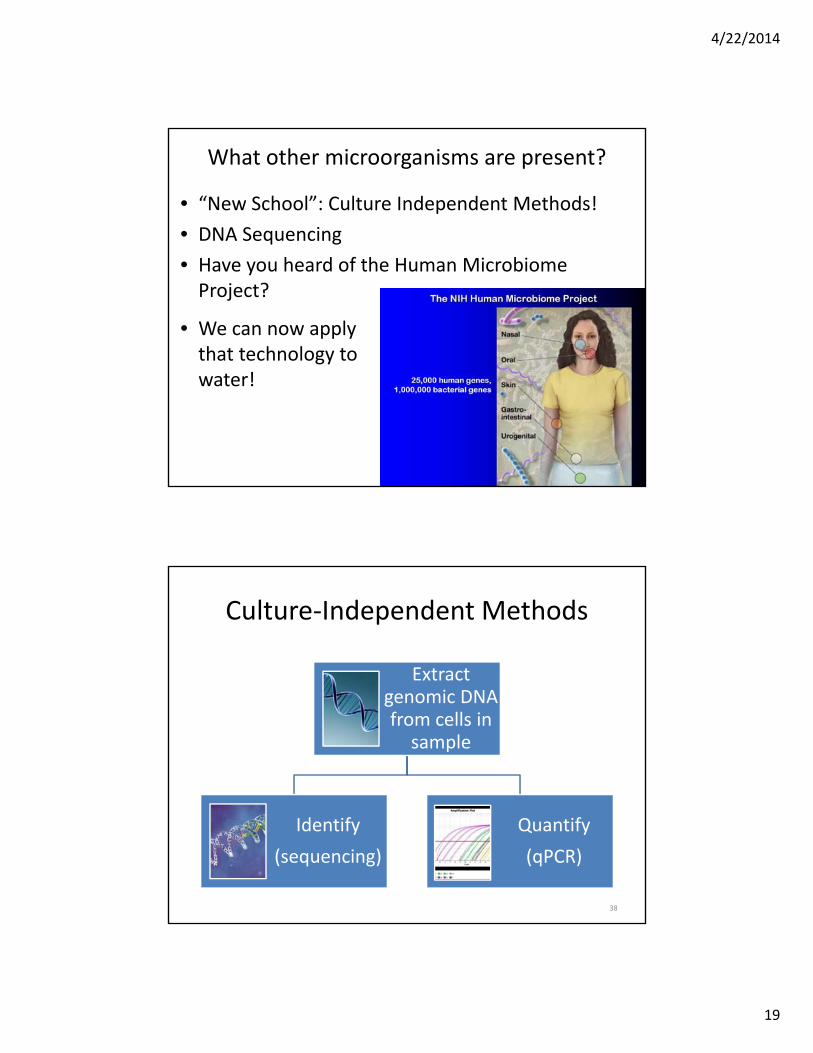
What other microorganisms are present?
• “New School”: Culture Independent Methods!
• DNA Sequencing
• Have you heard of the Human Microbiome Project?
• We can now apply that technology to water!
Culture‐Independent Methods
Extract genomic DNA from cells in sample
Identify
(sequencing)
Quantify
(qPCR)
38
4/22/2014
20
Identification via– DNA sequencing
• All bacteria have ribosomes (make proteins in cell)
• Ribosomes are made up of ribosomal RNA (rRNA) molecules
• The segment of DNA (gene) that encodes for making rRNAis useful for sequencing. Also referred to as 16S rDNA.
• Why useful?
– Ideal mix of • “Conserved” DNA regions – allows us to align with other species
• And Variable Regions – unique sequences that can be used to identify organisms
39
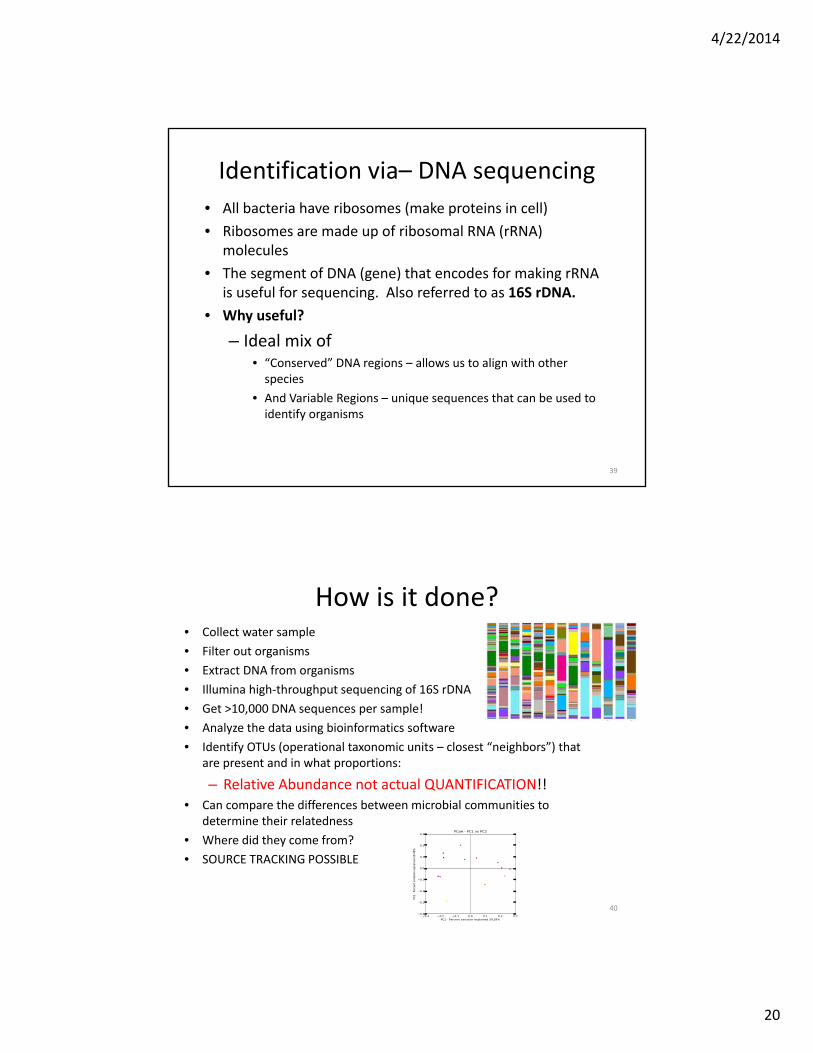
How is it done?• Collect water sample
• Filter out organisms
• Extract DNA from organisms
• Illumina high‐throughput sequencing of 16S rDNA
• Get >10,000 DNA sequences per sample!
• Analyze the data using bioinformatics software
• Identify OTUs (operational taxonomic units – closest “neighbors”) that are present and in what proportions:
– Relative Abundance not actual QUANTIFICATION!!• Can compare the differences between microbial communities to
determine their relatedness
• Where did they come from?
• SOURCE TRACKING POSSIBLE
40−0.3 −0.2 −0.1 0.0 0.1 0.2 0.3
PC1 - Percent variation explained 39.28%
−0.4
−0.3
−0.2
−0.1
0.0
0.1
0.2
0.3
PC2-Percentvariationexplained20.46%
PCoA - PC1 vs PC2
4/22/2014
21
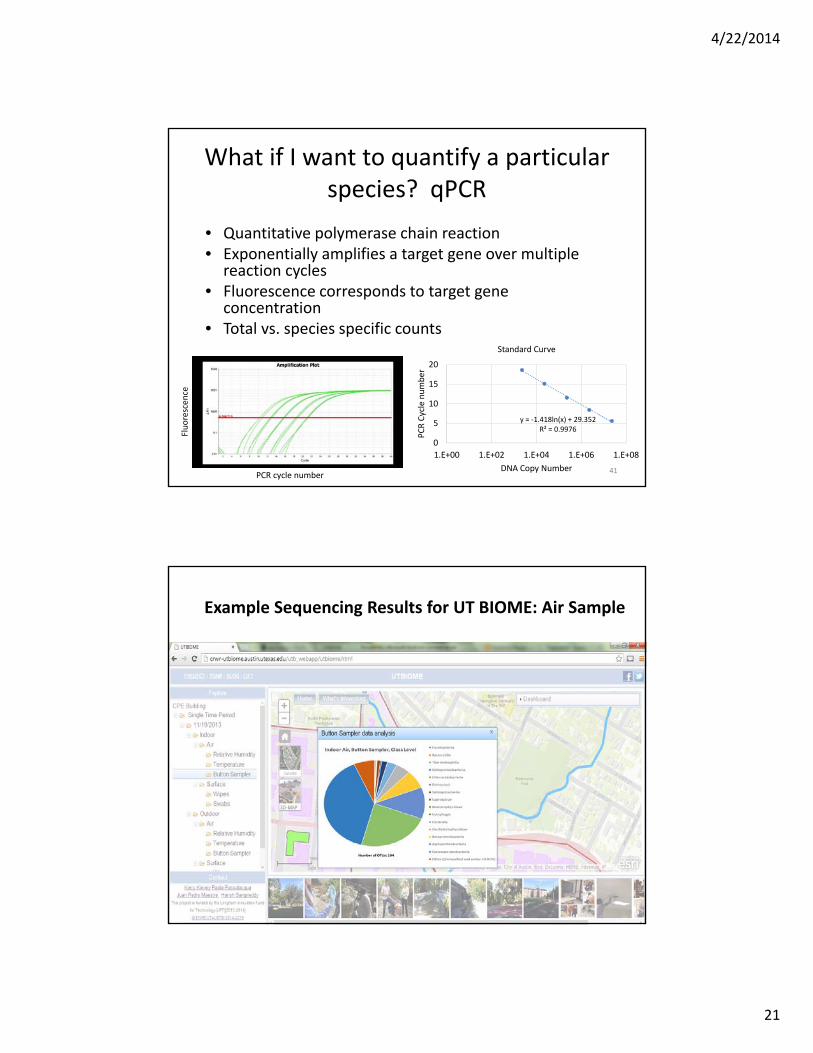
What if I want to quantify a particular species? qPCR
• Quantitative polymerase chain reaction• Exponentially amplifies a target gene over multiple
reaction cycles• Fluorescence corresponds to target gene
concentration• Total vs. species specific counts
41
y = ‐1.418ln(x) + 29.352R² = 0.9976
0
5
10
15
20
1.E+00 1.E+02 1.E+04 1.E+06 1.E+08
PCR Cycle number
DNA Copy Number
Standard Curve
PCR cycle number
Fluorescen
ce
Example Sequencing Results for UT BIOME: Air Sample
4/22/2014
22
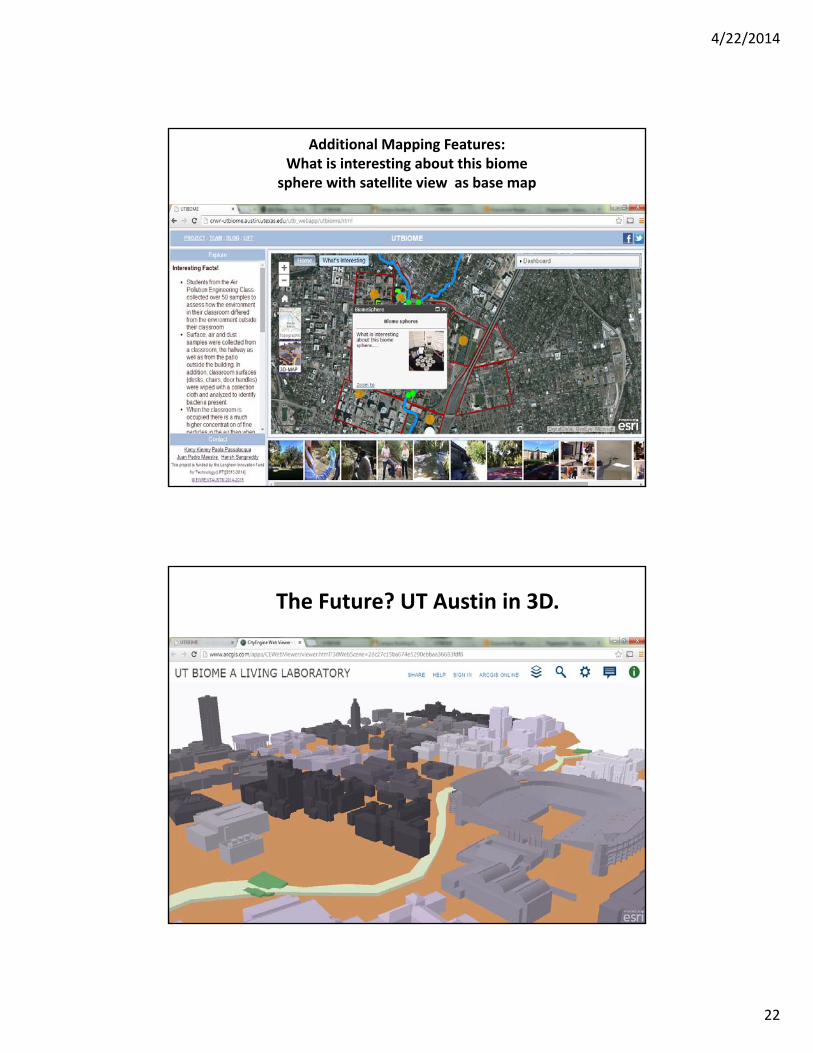
Additional Mapping Features:What is interesting about this biome
sphere with satellite view as base map
The Future? UT Austin in 3D.
4/22/2014
23
Mapping the UT Biome: The Future?
• Expand Engagement Across Campus and Beyond to City of Austin and other Campuses –Partners?
• Bridge Gap between GIS framework and BIM framework with visualization tools
• Extend Scope to Map Other Sustainability, Energy and Health Metrics