Embed Size (px)
Citation preview
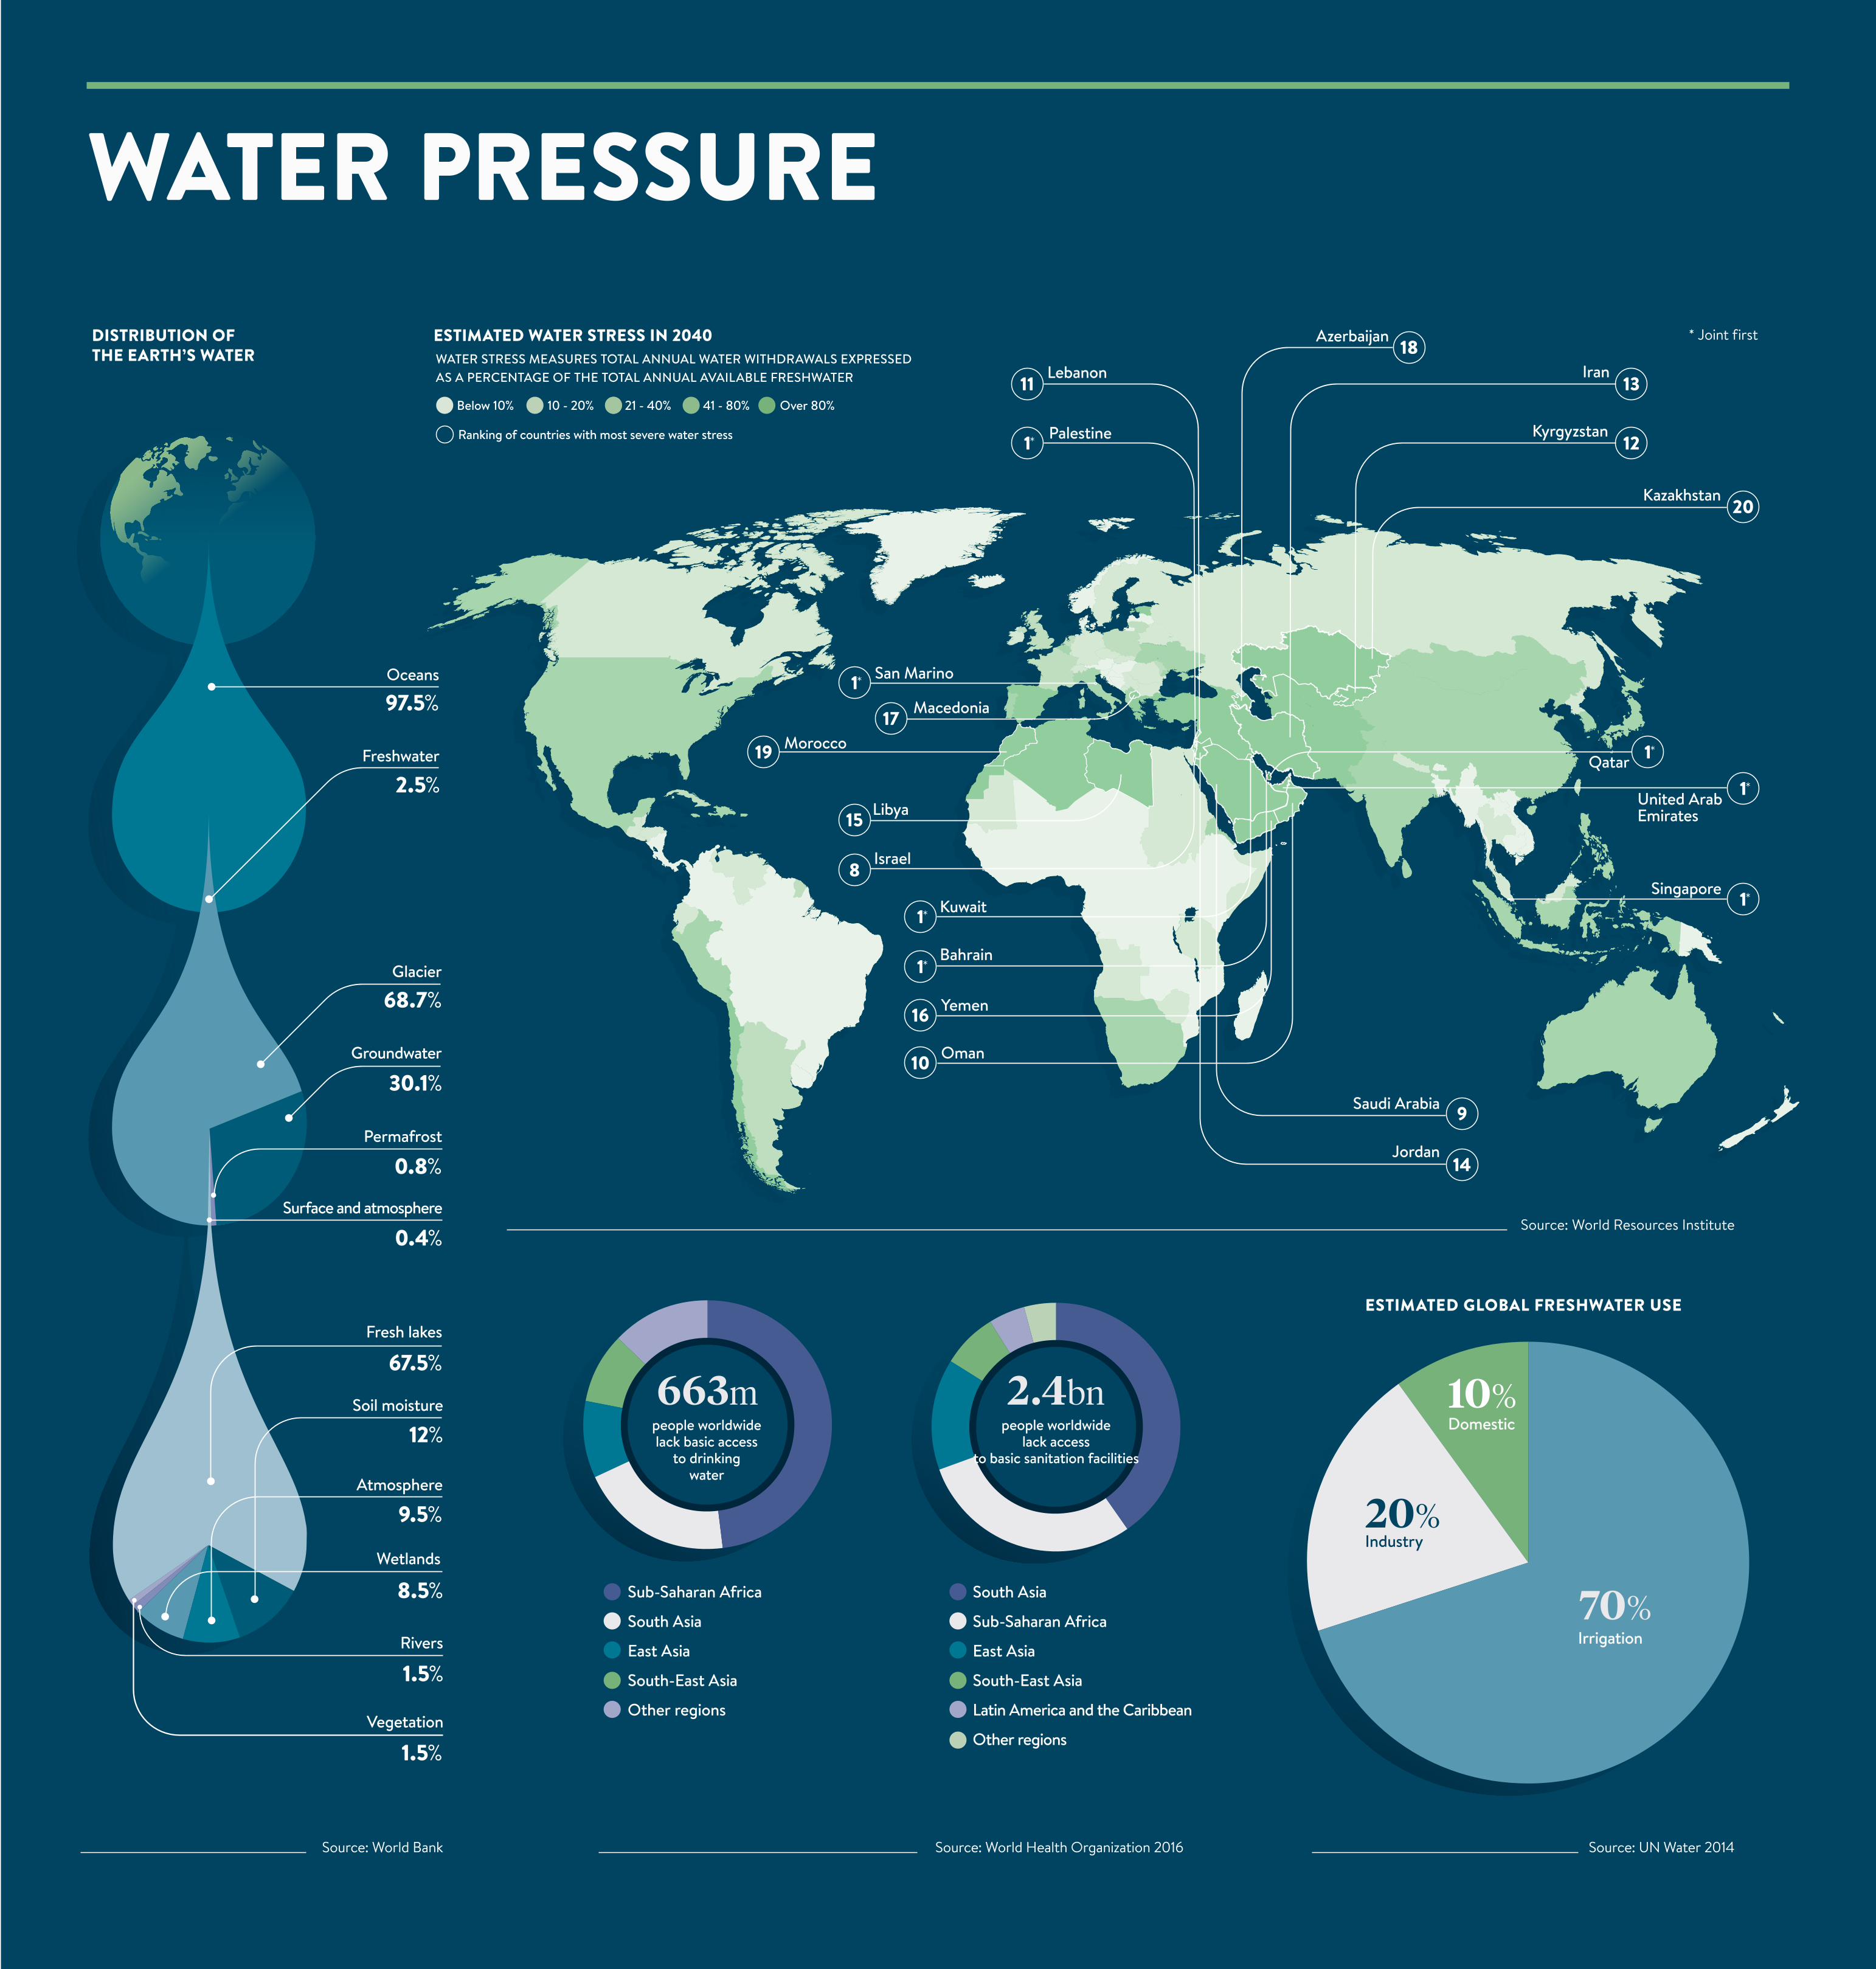
WATER PRESSURE
Source: World Bank
Oceans
Freshwater
Glacier
97.5%
2.5%
68.7%
DISTRIBUTION OF THE EARTH’S WATER
ESTIMATED WATER STRESS IN 2040
Groundwater
Permafrost
Surface and atmosphere
30.1%
0.8%
0.4%
Fresh lakes
Soil moisture
Atmosphere
Wetlands
Rivers
Vegetation
67.5%
12%
9.5%
8.5%
1.5%
1.5%
WATER STRESS MEASURES TOTAL ANNUAL WATER WITHDRAWALS EXPRESSED AS A PERCENTAGE OF THE TOTAL ANNUAL AVAILABLE FRESHWATER
Morocco
San Marino
Macedonia
Libya
Kazakhstan
Kyrgyzstan
Qatar
United Arab Emirates
Oman
Yemen
Azerbaijan
Lebanon
Israel
Palestine
SingaporeKuwait
Bahrain
* Joint first
1
1
17
19
15
11
1
8
18
1
1
16
1
1
10
20
12
Iran13
9
14
Saudi Arabia
Jordan
people worldwide lack basic access
to drinking water
people worldwide lack access
to basic sanitation facilities
663m 2.4bn
Sub-Saharan Africa
South Asia
East Asia
South-East Asia
Other regions
South Asia
Sub-Saharan Africa
East Asia
South-East Asia
Latin America and the Caribbean
Other regions
Below 10%
Ranking of countries with most severe water stress
10 - 20% 21 - 40% 41 - 80% Over 80%
Source: World Health Organization 2016 Source: UN Water 2014
ESTIMATED GLOBAL FRESHWATER USE
70%Irrigation
20%Industry
10%Domestic
Source: World Resources Institute