Embed Size (px)
Citation preview

t %
PergamonCement and Concrete Research. Vol. 25, No. 4, pp. 790-802, 1995
1995 Elsevier Science M
Printed in the USA. All rights reserved
0008-8846/95 $9.50t.00
0008-8846 (95)00069-0
WATER PERMEABILITY AND CHLORIDE ION DIFFUSIONIN PORTLAND CEMENT MORTARS:
RELATIONSHIP TO SAND CONTENT AND CRITICAL PORE DIAMETER
Pavla Halamickova’ and Rachel J. Detwiler2Department of Civil Engineering
University of TorontoToronto, Ontario M5S 1A4
Canada
Dale P. Bentz3 and Edward J. Garboczi3National Institute of Standards and Technology
Gaithersburg, Maryland 20899 U.S.A.
(Refereed)
(Received June 24, 1994; in find form January 6. 1995)
ABSTRACTThe pore structure of hydrated cement in mortar and concrete is quite differentfrom that of neat cement paste. The porous transition zones formed at theaggregate-paste interfaces affect the pore size distribution. The effect of thesand content on the development of pore structure, the permeability to water,and the diffusivity of chloride ions was studied on Portland cement mortars.Mortars of two water-to-cement ratios and three sand volume fractions were casttogether with pastes and tested at degrees of hydration ranging from 45 to 70%.An electrically-accelerated concentration cell test was used to determine thecoefficient of chloride ion diffusion while a high pressure permeability cell wasemployed to assess liquid permeabilityy. The coefficient of chloride ion diffusionvaried linearly with the critical pore radius as determined by mercury intrusionporosimetry while permeability was found to follow a power-law relationship vs.this critical radius. The data set provides an opportunity to direetly $xamine theapplication of the Katz-Thompson relationship to cement-based materials.
‘Currently at Yolles Partnership Inc., Toronto, Ontario M5A 1S1, Canada
z Currently at Construction Technology Laboratories, Skokie, Illinois 60077, U.S.A.
3Building Materials Division, Building and Fire Research Laboratory, TechnologyAdministration, U.S. Department of Commerce
79(I
.
Vol. 25, No. 4 WATER PERMEABILITY, CHLORIDE DIFFUSION, MORTARS, FORE STRUCTURE 791
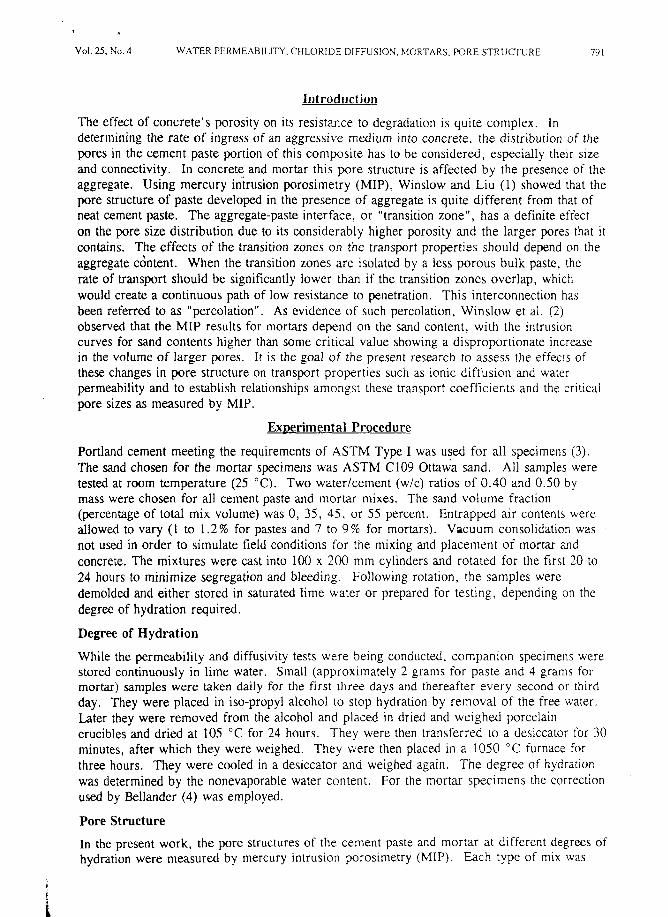
Introduction
The effect of concrete’s porosity on its resistance to degradation is quite complex. Indetermining the rate of ingress of an aggressive medium into concrete, the distribution of thepores in the cement paste portion of this composite has to be considered, especially their sizeand connectivity. In concrete and mortar this pore structure is affeeted by the presence of theaggregate. Using mercury iritrusion porosimetry (MIP), Winslow and Liu (1) showed that thepore structure of paste developed in the presence of aggregate is quite different from that ofneat cement paste. The aggregate-paste interface, or “transition zone”, has a definite effecton the pore size distribution due to its considerably higher porosity and the larger pores that itcontains. The effects of the transition zones on the transport properties should depend on theaggregate c6ntent. When the transition zones are isolated by a less porous bulk paste, therate of transport should be significantly lower than if the transition zones overlap, whichwould create a continuous path of low resistance to penetration. This interconnection hasbeen referred to as “percolation”. As evidence of such percolation, Winslow et al. (2)observed that the MIP results for mortars depend on the sand content, with the intrusioncurves for sand contents higher than some critical value showing a disproportionate increasein the volume of larger pores. It is the goal of the present research to assess the effects ofthese changes in pore structure on transport properties such as ionic diffusion and waterpermeability and to establish relationships amongst these transport coefficients and the criticalpore sizes as measured by MIP.
Experimental Procedure
Portland cement meeting the requirements of ASTM Type I was used for all specimens (3).The sand chosen for the mortar specimens was ASTM C 109 Ottawa sand. All samples weretested at room temperature (25 ‘C). Two water/cement (w/c) ratios of 0.40 and 0.50 bymass were chosen for all cement paste and mortar mixes. The sand volume fraction(percentage of total mix volume) was O, 35, 45, or 55 percent. Entrapped air contents wereallowed to vary (1 to 1.2% for pastes and 7 to 9 % for mortars). Vacuum consolidation wasnot used in order to simulate tield conditions for the mixing and placement of mortar andconcrete. The mixtures were cast into 100 x 200 mm cylinders and rotated for the first 20 to24 hours to minimize segregation and bleeding. Following rotation, the samples weredemoldwl and either stored in saturated lime water or prepared for testing, depending on thedegree of hydration required.
Degree of Hydration
While the permeability and diffusivity tests were being conducted, companion specimens werestored continuously in lime water. Small (approximately 2 grams for paste and 4 grams formortar) samples were taken daily for the first three days and thereafter every second or thirdday. They were placed in iso-propyl alcohol to stop hydration by removal of the free water.Later they were removed from the alcohol and placed in dried and weighed porcelaincrucibles and dried at 105 “C for 24 hours. They were then transferred to a desiccator for 30minutes, after which they were weighed. They were then placed in a 1050 0C furnace forthree hours. They were cooled in a desiccator and weighed again. The degree of hydrationwas determined by the nonevaporable water content. For the mortar specimens the correctionused by Bellander (4) was employed.
Pore Structure
In the present work, the pore structures of the cement paste and mortar at different degrees ofhydration were measured by mercury intrusion porosimetry (MIP). Each type of mix was

792
measured in duplicate
P. Halamickova e[ al. Vol. 25, No. 4
at five different degrees of hydration between 45 and ’70percent.Hearn and Hooton (5) showed that using &ushed ~mples can introduce an exte;nal Wrositypeak and suggested the use of small, saw cut prisms as an alternative. Specimens for MIPwere cut from the cylinder cured in water at the time corresponding to the estimated degreeof hydration, and then stored in isopropyl alcohol to remove the free water. The solvent wasreplaced after the first three days and storage in solvent was continued for several weeks.One month before the MIP measurements, the samples were removed from the isopropyl -alcohol and dried to a constant mass in a vacuum oven at 55 “C.
The critical radius was taken to be the inflection point on the volume intrusion versus radiuscurve (or the maximum of the dV/dp curve). Katz and Thompson (6) suggested that thispoint corresponds to the smallest pore size diameter of the subset of the largest pores whichcreates a connected path through the sample. Figures 1 and 2 demonstrate the changes of thecritical radius of paste and mortar samples with hydration as determined by MIP.
Water Permeability
The water permeability of both pastes and mortars was measured using the permeability celldesigned and built by Hearn and Mills (7). The permeability cell allows monitoring of bothinflow and outflow by sensing the movement of pistons in calibrated cylinders as well asmeasuring the driving pressure and outflow pressure by means of pressure transducers. Theoutflow pressure is caused mainly by the friction of the piston in the outflow cylinder. Theinflow pressure was applied by dead loading of the piston and was maintained at the lowestrange that would still yield results. The pressure transducers were calibrated by means ofvacuum and a mercury manometer. The confining pressure of the sample was applied by asilicone rubber cylinder constrained by a stainless steel cylinder. The axial confining forcewas applied by screw jacks.
For each test, two 35-mm thick disks were cut from each specimen cylinder immediately afterdemolding. These specimens were vacuum saturated for 24 hours according to the procedure
180i
160+
/
. .. ..40
20
0!40 45 50 55 W 65 70 75
DEGREEOF HYDRATION (%o)
J—0%0sand-----
35?t0 sand—
45?4s~d---55%sand
FIG. 1Critical pore radius changes with continuing hydration for 0.40 w/c ratio paste and mortars as
determined by MIP.
.
Vol. 25, No, 4 WATER PERMEABILITY, CHLORIDE DIFFUSION, MORTARS, PORE STRUCTURE 793
Lu
5*L
2001-<,
180- ‘“.‘.
160- “’..,
140‘.‘.,.\
120 ‘.\“,
100
; ‘h_
‘i >.>*..
80 .. -7‘. \-. ,
60 ...$
40~..~\L -----------
20- - - --=-G
0440 45 50 55 60 65 70 75 /
DEGREEOF HYDRATION (%)
—
O% sad. . . .
35°/0sand
45”/0sand--,
55”/0sand
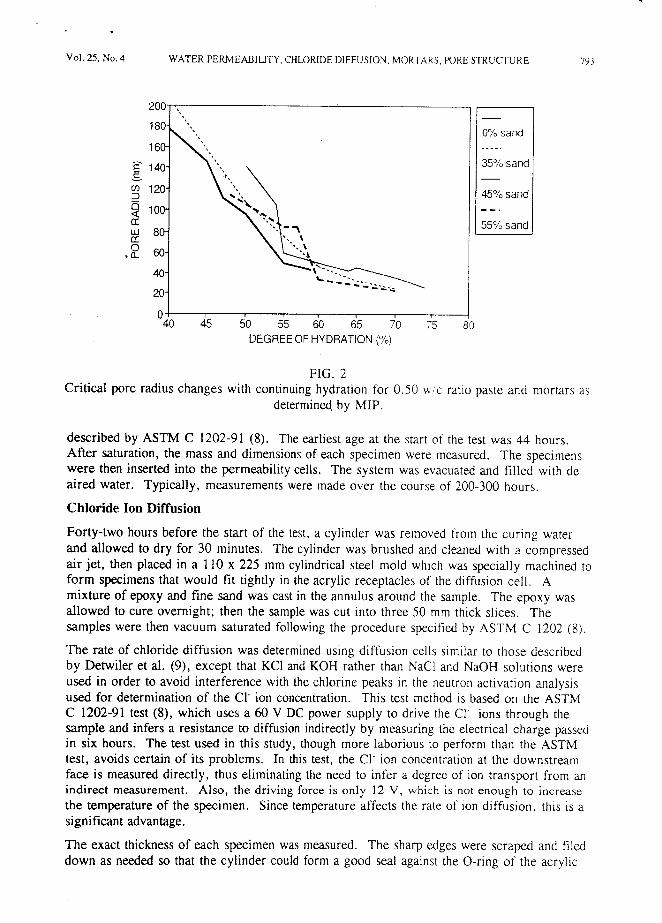
FIG. 2Critical pore radius changes with continuing hydration for 0.50 wc ratio paste and mortars as
determinuj by MIP.
described by ASTM C 1202-91 (8). The earliest age at the start of the test was 44 hours.After saturation, the mass and dimensions of each specimen were measured. The specimenswere then inserted into the permeability cells. The system was evacuated and filled with de-sired water. Typically, measurements were made over the course of 200-300 hours.
Chloride Ion Diffusion
Forty-two hours before the start of the test, a cylinder was removed from the curing waterand allowed to dry for 30 minutes. The cylinder was brushed and cleaned with a compressedair jet, then placed in a 110 x 225 mm cylindrical steel mold which was specially machined toform specimens that would fit tightly in [he acrylic receptacles of the diffusion cell. Amixture of epoxy and fine sand was cast in the annulus around the sample. The epoxy wasallowed to cure overnight; then the sample was cut into three 50 mm thick slices. Thesamples were then vacuum saturated following the procedure specified by ASTM C 1202 (8),
The rate of chloride diffusion was determined using diffusion cells similar to those describedby Detwiler et al. (9), except that KC1 and KOH rather than NaCl and NaOH solutions wereused in order to avoid interference with the chlorine peaks in the neutron activation analysisused for determination of the Cl- ion concentration. This test method is based on the ASTMC 1202-91 test (8), which uses a 60 V DC power supply to drive the Cl” ions through thewnple and infers a resistance to diffusion indirectly by measuring the electrical charge passedin six hours. The test used in this study, though more laborious to perform than the ASTMtest, avoids certain of its problems. In this test, the Cl- ion concentration at the downstreamface is measured directly, thus eliminating the need to infer a degree of ion transport from anindirect measurement. Also, the driving force is only 12 V, which is not enough to increase
the temperature of the specimen. Since temperature affects the rate of ion diffusion, this is asignificant advantage.
The exact thickness of each specimen was measured. The sharp edges were scraped and fileddown as needed so that the cylinder could form a good seal against the O-ring of the acrylic

794 P. Halamickova CLal. Vol. 25. No. 4
receptacle of the diffusion cell. The edges of the cylinder were coated with a high vacuumgrease to improve the seal. Stainless steel wire mesh electrodes were placed so as to coverthe exposed concrete surfaces. A receptacle was force fitted over the electrode onto each endof the cylinder and the whole assemblage bolted together. The cathodic compartment wasfilled with 3% KCI solution and the anodic compartment with 0.3 M KOH solution. Thevolume of solution in each side was 260 ml. The stainless steel electrodes were thenconnected to a 12 + 0.1 V DC power supply.
Samples of the KOH solution were taken for chloride content analysis daily or twice dailydepending on the expected rate of ion transport. The KCI concentration was also monitoredon one sample from each set. It was observed that the Cl- concentration decreased veryrapidly during the first 30 - 40 hours in the upstream side, while later the decrease wasslower. To approximate constant concentration of the upstream KC1 solution, it was decidedto change this solution every 24 hours for one sample in each set. The test had to be stoppedwhen rust occurred in the downstream (KOH) part of the cell. Neutron activation analysis(NAA) was used to determine the chloride content of the liquid samples (10). With thismethod, concentrations as low as five ppm could be determined.
Determination of the Coefficient of Chloride Ion Diffusion
The coefficient of diffusion can be calculated from a modified version of Fick’s second law:
Cic .D(<c_zFEdc)dt 0!X2 RT dx
(1)
whereD = diffusion coefficient (m2/s)c = concentration of ions (moles/liter) as a function of distance, x, and time, tz = charge of 1 mole of ionsE = electric field (volts/m)F = Faraday’s constant (23060 cal/(mol-eV))R = gas constant (1 .987 cal/(mol K))T = temperature (K)
For the given experimental setup, the following conditions apply:boundary condition: C=co, x=(), [>()
initial condition: C=o, x>o, t=oinfinite-point condition: c = O, x = infinite, t = large number
The exact analytical solution for Eq. (1) is:&
cl ~ [e=erfc(~) +erfc( ‘“aDt ) ]—=—co 24m 247X
where
~ . zFERT
(2)
For the chloride diffusivity test the following constants apply:Z=l;
T = 298 K;E = 12/x Vm-’, where x is the thickness of the sample in meters.
“, .
Vol. 25, No. 4 WATER PERMEABIL~, CHLORIDE DIFFUS1ON, MORTARS, FORE STRUCTURE 795
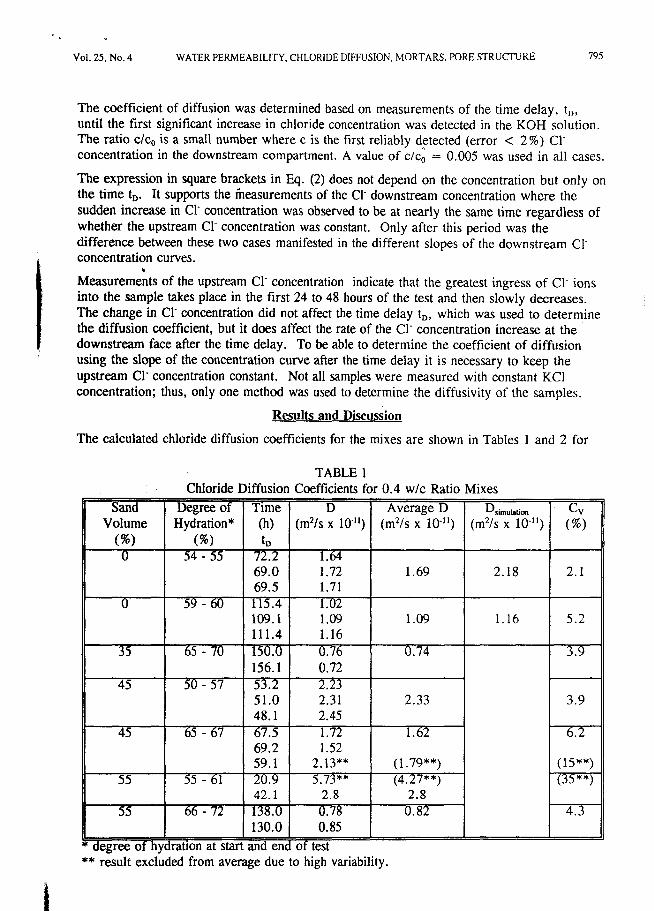
The coefficient of diffusion was determined based on measurements of the time delay, t~,until the first significant increase in chloride concentration was detected in the KOH solution.The ratio c/cOis a small number where c is the first reliably detected (error < 2%) Cl-concentration in the downstream compartment. A value of c/c~ = 0.005 was used in all cases.
The expression in sqmre brackets in Eq. (2) does not depend on the concentration but only onthe time t~. It supports the measurements of the Cl- downstream concentration where thesudden increase in Cl concentration was observed to be at nearly the same time regardless ofwhether the upstream Cl- concentration was constant. Only after this period was thedifference between these two cases manifested in the different slopes of the downstr~m Cl-concentration curves.
Measureme~ts of the upstream Cl- concentration indicate that the greatest ingress of Cl- ionsinto the sample takes place in the first 24 to 48 hours of the test and then slowly decreases.The change in Cl- emcentration did not affect the time delay tn, which was used to determinethe diffusion coefficient, but it does affect the rate of the Cj- c¢ration increase at thedownstream face after the time delay. To be able to determine the coefficient of diffusionusing the slope of the concentration curve after the time delay it is necessary to k~p theupstream Cl- concentration constant. Not all samples were measured with constant KC]concentration; thus, only one method was used to determine the diffusivity of the samples.
Results and Dwussion
The calculated chloride diffusion coefficients for the mixes are shown in Tables 1 and 2 for
SandVolume
(%)o
35
45
45
55
55
legree of h)result exch
Chloride
Degree ofHydration*
(%)54-55
59-60
65-70
50-57
65-67
55-61
66 -72
‘ation at staxi from avt
liffusiol
Time(h)
-%2-69.069.5
-mm109.1111.4
m156.1
-?$Z-51.048.1
m69.259.1
m42.1
TRIU-130.0—
and emLgedue
TABLE 1Coefficients for 0.4 w/c Ratio Mixes
Average D(m’/s; 10”) (m2/s x 101’) (m~~l’;~-’l)
1.641.72 1.69 2.181.711.021.09 1.09 1.161.160.76 0.740.722.232.31 2.332.451.72 1.621.52
2.13** (1.79**)5.73** (4.27**)
2.8 2.80.78 0.8 20.85
of test;Ohigh variability.
(2)
2.1
5.2
3.9
n-2--
(15**)-

, .
796 P. Halamickova et al. Vol. 25, No. 4
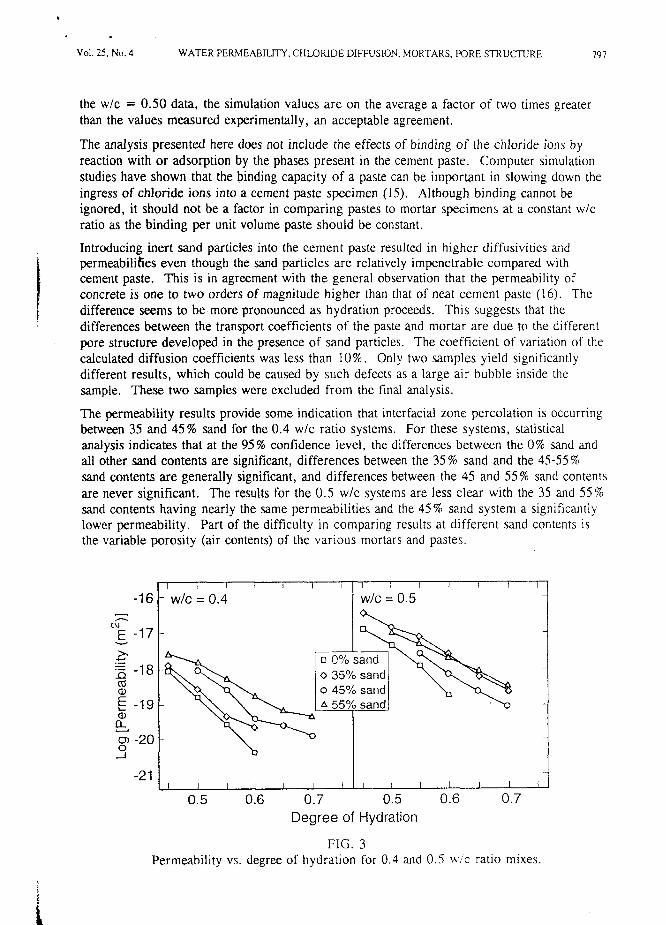
the 0.4 w/c and 0.5 w/c ratio mixes, respectively. The coefficient of variation, C“, is alsopresented. The permeability results are graphed in Figure 3, which plots permeability vs.degree of hydration for the two w/c ratios and the four sand contents. As would be expected,the diffusivities and permeabilities are higher for the 0.5 w/c ratio systems than for their 0.4w/c counterparts, due to the higher initial capillary porosity in a 0.5 w/c system.
Garboczi and Bentz (11) have utilized computer simulation to develop an equation for thediffusivity of cement paste as a function of capillary porosity. The values measured hereexperimentally for the paste specimens can be compared to the equation:
;($) = 0.001 +0.07 *$2+ H($-0018) *lt8* (@-0.18)2 (3)o
where D/DO is the relative diffusivit y, @is the capillary porosity fraction, and H is theHeaviside function (taking a value of O when (+ -0. 18)s O and a value of 1 otherwise). ForCl- ions, DOhas a value of about 1.5 x 10⁻⁹m2/s at room temperature (12). For hardenedcement paste, based on the analysis of Powers and Brownyard (13), as modified by Youngand Hansen (14), the capillary porosity can be estimated as:
~ = ~_l+l .31a(4)
1+3,2:
where a is the degree of hydration measured for the sample. For the w/c = 0.40 datapresented in Table 1, the agreement with this equation is excellent, with an average variationof less than 10% between the simulation (column 6) and experimental (column 5) values. For
TABLE 2Chloride Diffusion Coefficients for 0.5 w/c Ratio Mixes
Sand Volume Degree of Time Average D c(%) Hydration (h) (m*/s; 10-11) (m’/s x 10-’1) (m?;tix~-”) (;
(%) tD )o 46-48 15.8 7.95 7.54 12.88 5.5
17.4 7.120 55-56 40.0 2.78
37.0 3.00 2.96 8.12 4.636.0 3.11
35 70-73 125.0 092 0.96 3.7115.0 0:99
45 53-55 222 5.16 *20:3 5.76 5.66 6.719.6 6.07
45 70-72 633 1.864:6 1.78 1.79 0.566.1 1.8
55 35-57 226 -4.93 5,322:2 5.66
55 70-73 125.0 086 0.84130.0 0:82
.
.
*
.
Vol. 2S, No. 4 WATER PERMEABILITY, CHLORIDE DIFFUSION, MORTARS. FORE STRUCTURE 797
the w/c = 0.50 data, the simulation values are on the average a factor of two times greaterthan the values measured experimentally, an acceptable agreement.
The analysis presented here does not include the effects of binding of the chloride ions by
reaction with or adsorption by the phases present in the cement paste. Computer simulationstudies have shown that the binding capacity of a paste can be important in slowing down theingress of chloride ions into a cement paste specimen (15). Although binding cannot beignored, it should not be a factor in comparing pastes to mortar specimens at a constant w/cratio as the binding per unit volume paste should be constant.
Introducing inert sand particles into the cement paste resulted in higher diffusivities andpermeabilifies even though the sand particles are relatively impenetrable compared withcement paste. This is in agreement with the general observation that the permeability ofconcrete is one to two orders of magnitude higher than that of neat cement paste (16). Thedifference seems to be more pronounced as hydration proceeds. This suggests that thedifferences between the transport coefficients of the paste and mortar are due to the differentpore structure developed in the presence of sand particles. The coefficient of variation of thecalculated diffusion coefficients was less than 10%. Only two samples yield significant]ydifferent results, which could be caused by such defects as a large air bubble inside thesample. These two samples were excluded from the final analysis.
The permeability results provide some indication that interracial zone percolation is occurringbetween 35 and 45% sand for the 0.4 w/c ratio systems. For these systems, statisticalanalysis indicates that at the 95% confidence level, the differences between the O% sand andall other sand contents are significant, differences between the 35% sand and the 45-55 %sand contents are generally significant, and differences between the 45 and 55% sand contentsare never significant. The results for the 0.5 w/c systems are less clear with the 35 and 55%sand contents having nearly the same permeabilities and the 45% sand system a significantlylower permeability. Part of the difficulty in comparing results at different sand contents isthe variable porosity (air contents) of the various mortars and pastes.
-16 k W/C= 0.4
““\/ WJC=O.5 i
‘2’LuJ_u—L I I I I I
0.5 0.6 0.7 0.5 0.6 0.7
Degree of Hydration
FIG. 3
Permeability vs. degree of hydration for 0.4 and 0.5 wtc ratio mixes.

$
,:.....
. E
798 P. Halamickova et d. Vol. 25, No. 4
The critical pore radius (or maximum continuous pore radius) showed that the largest fractionof interconnected pores in mortars have greater radii than in the paste. This differencebetween paste and mortars was much less pronounced at 0.5 w/c ratio. However, there was agreat difference between the range of the critical pore radius with continuing hydration.When hydration of the samples increased from 50% to 73%, the critical radius decreasedfrom 65 nm to 17 nm for the 0.4 w/c ratio mortars, while for the 0.5 w/c ratio mortars thisdecrease was from 140 nm to 20 nm.
It might be expected that there are relationships between the two transport rates measured inthis study and the pore structure characteristics. Roy and Li (17) investigated the relationshipbetween the rapid chloride permeability (total charge passed in six hours) and mean poreradius for ordinary portland cement pastes as well as for cements containing supplementarycementing materials. They observed that the chloride transport rate increased linearly withmean pore radius, which was defined as the pore radius at which 50% of the pore volumewas intruded in the pore size range considered. Roy (18) pointed out that the mean poreradius and the critical pore radius had similar values in most cementitious materials. Sincethe critical radius represents the grouping of the largest fraction of interconnected poresinfluencing the transport properties, the relationship between the critical pore radius and thechloride diffusion was examined in the present work. The diffusion coefficient, determinedfrom the accelerated concentration cell test described above, was plotted against the criticalpore radius of the corresponding mix for the two w/c ratios [Fig. 4]. A well correlated linearrelationship between chloride diffusion and critical pore radius was observed, especially forthe 0.5 w/c ratio mixes (r2 for 0.5 w/c ratio was 0.972 and r2 for both w/c ratios was 0.931).
For cement pastes with w/c between 0.23 and 1.0, Nyame and Iilston (19) have previouslyshown that permeability can be represented by a power-law function of critical pore radius
I I I I I
D
■ 0.4Wlc•1 0,5Wlc
/❑
/
.
—
*
I I I I I I
20 40 60 80 100 120
Critical Pore Radius (rim)
FIG. ‘4Chloride diffusion coefficient vs. critical pore radius (Cr) for portland cement pastes and
mortars.
VO1.25, No. 4 WATER PERMEABILITY, CHLORIDE DIFFUSION, J1ORTARS, PORE STRUCTURES 799
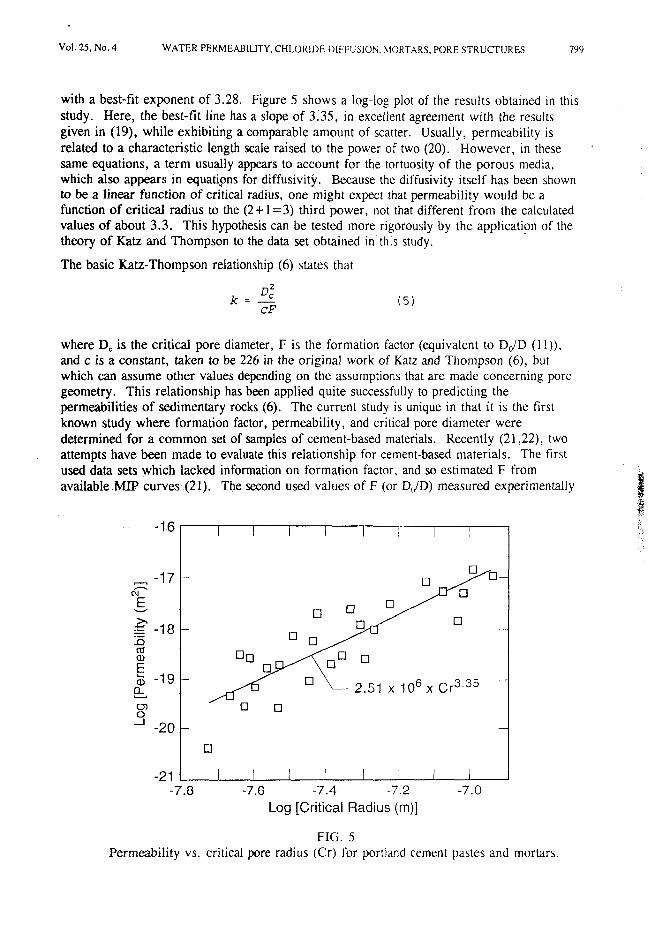
with a best-fit exponent of 3.28. Figure 5 shows a log-log plot of the results obtained in thisstudy. Here, the best-fit line has a slope of 3135, in excellent agreement with the resultsgiven in (19), while exhibiting a comparable amount of scatter. Usually, permeability isrelated to a characteristic length scale raised to the power of two (20). However, in thesesame equations, a term usually appears to account for the tortuosity of the porous media,which also appears in equati$ns for diffusivity. Because the diffusivity itself has been shownto be a linear function of critical radius, one might expect that permeability would be afunction of critical radius to the (2+1=3) third power, not that different from the calculatedvalues of about 3.3. This hypothesis can be tested more rigorously by the application of thetheory of Katz and Thompson to the data set obtained in this study.
The basic Katz-Thompson relationship (6) states that
(5)
where DCis the critical pore diameter, F is the formation factor (equivalent to D~D (11)),and c is a constant, taken to be 226 in the original work of Katz and Thompson (6), butwhich can assume other values depending on the assumptions that are made concerning poregeometry, This relationship has been applied quite successfully to predicting thepermeabilities of sedimentary reeks (6). The current study is unique in that it is the firstknown study where formation factor, permeabilityy, and critical pore diameter weredetermined for a common set of samples of cement-based materials. Recently (21,22), twoattempts have been made to evaluate this relationship for cement-based materials. The firstused data sets which lacked information on formation factor, and so estimated F fromavailable MIP curves (21). The second used values of F (or D@) measured experimentally 1
g:4$+
-16:..
I I I,.
~ -17 “ ❑
‘1 •1
~ -18 -❑ n
❑
n ona ❑nE •1z -19 –&03
3 -20 –
❑
-21 I /-7.8 -7.6 -7.4 -7.2 -7.0
Log [Critical Radius (m)]
FIG. 5Permeability vs. critical pore radius (Cr) for portland cement pastes and mortars.
800 P. Halamickova C[al, Vol. 25, No. 4
(22), tk,ing impedance spectroscopy techniques on a series of specimens similar to those usedby Nyame and Illston (19). The results of E1-Dieb and Hooton in (21) indicated that theKatz-Thompson relationship was generally not valid for cement-based materials. However,the results of Christensen et al. in (22) found the permeabilities determined using the Katz-Thompson relationship to be within an order of magnitude of those observed experimentally,with larger deviations at the later hydration times. This agreement could be somewhat furtherimproved. by using a constant other than the value of 226 originally suggested by Katz andThompson. Also, it is crucial to note that while conductivities, diffusivities, and waterpermeabilities are measured on never-dried samples, the critical pore diameter, DC, istypically measured by MIP on dried samples. When D. is of a magnitude associated withcapillary pores, implying that the capillary pores are still percolated, the effect of drying onthe relevant pore structure should be negligible. However, when D. is of C-S-H gel pore size(<40 rim), then the effect of drying could become more important. If the measured valuesof DCdo not reflect the true pore structure due to drying artifacts and cracking then,obviously, the Katz-Thompson relation is less likely to be accurate. One alternative to usingMIP would be to utilize resorption isotherms to estimate the critical pore diameter (23).
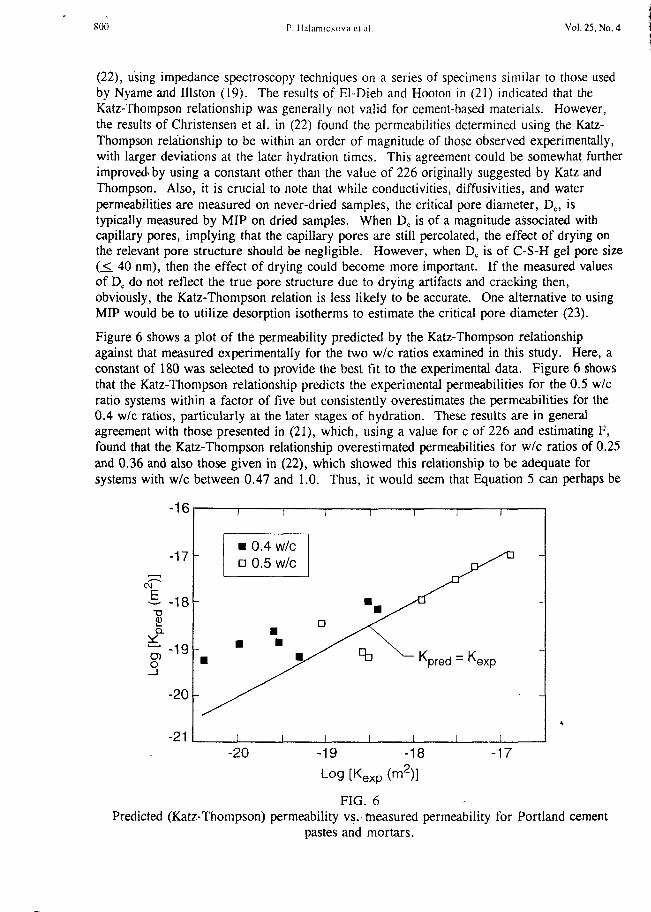
Figure 6 shows a plot of the permeability predicted by the Katz-Thompson relationshipagainst that measured experimentally for the two w/c ratios examined in this study. Here, aconstant of 180 was selected to provide the best fit to the experimental data. Figure 6 showsthat the Katz-Thompson relationship predicts the experimental permeabilities for the 0.5 w/cratio systems within a factor of five but consistent y overestimates the permeabilities for the0.4 w/c ratios, particularly at the later stages of hydration. These results are in generalagreement with those presented in (21), which, using a value for c of 226 and estimating F,found that the Katz-Thompson relationship overestimated permeabilities for w/c ratios of 0.25and 0.36 and also those given in (22), which showed this relationship to be adequate forsystems with w/c between 0.47 and 1.0. Thus, it would seem that Equation 5 can perhaps be
-16
-17
-18
-19
-20
-21
I I I I I I I
I I I I I I 1 1
-20 -19 -18 -17
Log [&xp (m*)]
*
FIG. 6Predicted (Katz-Thompson) permeability VS. measured perm~bility for Portland cement
pastes and mortars.
Vol. 25, No. 4 WATER PERMEABILITY, CHLORIDE DIFFUS1ON, MORTARS. PORE STRUCTURES 801
used for systems with relatively high w/c ratio systems but not for lower w/c ratios. Thiscould be an effect of the capillary porosity percolation (24) and the changing pore structure ofcement-based materials as a function of w/c and hydration as was discussed above, and theeffect of drying on measurements of DCwhen DCis clearly of gel pore magnitude, as is thecase for the latest hydration stages of the 0.4 w/c ratio systems.
The results of (24) imply thafthe critical degree of hydration at which the capillary poresbecome disconnected is 0.66 for 0.4 WIC,and 0.86 for 0.5 wlc. So for ctsct,, one wouldpredict that the paste transport is dominated by capillary pores, and for a> a,, by C-S-H gelpores. Looking at Figure 1, it is clear that for many of the later hydration points studied, the0.4 w/c transport will be dominated by gel pores, since a > a,. This is reflected in the small
;
I
changes in DCwith hydration, especially for the O% sand data, as the gel pore sizes do notchange with hydration but are determined by C-S-H morphology (23). The contribution ofinterracial zone pores for the mortars changes this picture somewhat. In Figure 2, however,all of the 0.5 w/c data studied is in the asa, regime, and one sees very large changes in DC
:with hydration, even for the O% sand specimens. The value of DCis clearly picking up theprogressive reduction of the diameter of the still-percolated capillary pores, which aredominating transport. Because the measurement of these capillary pore diameters is lessaffected by drying, one might then expect that the Katz-Thompson relation would work betterfor the 0.5 WICsystems than for the 0.4 WICones.
Conclusions
Chloride diffusion and water permeability in pastes and mortars with different sand contentswere investigated using a concentration cell with a limited electrical gradient and a highpressure permeability cell. The coefficients of diffusion were calculated from a modifiedversion of Fick’s second law. It em be concluded that:1. The method yielded the diffusion coefficients in a relatively short period (up to 10 days)
with acceptable variability of 4 to 7%.2. The diffusivity and permeability of both pastes and mortars decrease with increasing
degree of hydration, the rate of hydration being different for pastes and mortars.3. Increasing the w/c ratio reduced the resistance of both pastes and mortars to Cl- diffusion
and water flow.4. For the same degree of hydration, introducing sand particles into the cement paste resulted
in higher transport coefficients.5. A good linear relationship between the coefficient of diffusion and the critical pore radius,
as determined by MIP, was observed. A power-law relationship with an exponent of 3.3 wasobserved in relating permeability to this same critical pore radius.6. The Katz-Thompson relationship appears ‘to have limited validity for cement-basedmaterials, providing accurate estimates of permeability at WIC=0.5 but significantlyoverestimating the permeability for the more hydrated w/c = 0.4 systems; this suggests that theKatz-Thompson relation may work better for systems with interconnected capillary porenetworks, than for systems where the gel pores dominate the transport.
1.2.
3.
&
References
Winslow, D. and Liu, D., Cement and Concrete Research, U (2), 227, 1990.Winslow, D. N., Cohen, M. D., Bentz, D. P., Snyder, K. A., and Garboezi, E. J., Cementand Concrete Research, U (3), 25, 1994.Cao, Y.,Elevated
and Detwiler, R., “Backscattered Electron Imaging of Cement Pastes Cured atTem~ratures”, submitted to Cement and Concrete Research.
.
802 P. Halanickova et al. vol. 25,No. 4
4.
5.6.
7.8,
9.10.
11.12.
13.
14.
15.
16.17.18.
19.
20.21.22.
23.
24.
Bellander, U., Accelererad Provning av Betongs H&llfasthet. Bestiimning avHydratationsgrad. Report No. Fo 7312/P5, Swedish Cement and Concrete ResearchInstitute, Stockholm, 1973.Hearn, N. and Hooton, R. D., Cement and Concrete Research, Q (5), 970, 1992, .Katz, A.J. and Thompson, A. H., Journal of Geophysical Research, ~ (Bl), 599, 1987,and Physical Review B, 34, 8179, 1986.Hearn, N. and Mills, R. H., Cement and Concrete Research, , M (2/3), 257, 1991.ASTM C 1202-91, “Standard Test Method for Electrical Indication of Concrete’s Abilityto Resist Chloride Ion Penetration, ” American Society for Testing and Materials, 1991.Detwiler, R.J., Kjellsen, K.O. and Gjarv, O. E,, ACI Materials Journal, ~ (l), 19, 1991.
Halamickova, P._, “The Influence of-Sand Content on the Microstructure Developmentand Transport Properties of Mortars”, M.S. Thesis, University of Toronto, 1993.Garboczi, E.J. and Bentz, D. P., Journal of Materials Science, u, 2083, 1992.Weast, R.C., ed. Handbook of Chemistry and Physics, 57th edition, CRC Press,Cleveland (1976).Powers, T. C., and Brownyard, T. L., Journal of the American Concrete Institute, Q,101, 249, 469, 549, 669, 845, 993 (1947).Young, J. F., and Hansen, W., “Volume Relationships for C-S-H Formation Based onHydration Stoichiometries, ” Materials Research Society Symposium Proceedings, Vol. 85,313, 1987.Bentz, D.P. and Garboczi, E. J., “A Computer Model for the Diffusion and Binding ofChloride Ions in Portland Cement Paste, ” NISTIR 5125, U.S. Department of Commerce,February 1993.Young, J. F., in ACI SP108-1, Permeability of Concrete, ACI, Detroit (1988).Roy, D.M. and Ll, S., Cement and Concrete Research, M (5), 749, 1986.Roy, D.M. “Relationship Between Permeability, Porosity, Diffusion and Microstructureof Cement Pastes, Mortar, and Concrete at Different Temperatures, ” MaterialsResearch Society Symposium Proceedings, Vol. 137, 179, 1988.Nyame, B.K. and Illston, J. M., “Capillary Pore Structure and Permeability of HardenedCement Paste, ” 7th International Symposium on the Chemistry of Cement, Paris, Vol.III, V1181-V1186, 1980.Garboczi, E.J., Cement and Cement Research, Q (4), 591, 1990.E1-Dieb, A. and Hooton, R. D., Cement and Concrete Resmrch, ~ (3), 443, 1994..Christensen, B.J., Mason, T. O., and Jennings, H. M., “Comparison of Measured mdCalculated Permeabilities for Hardened Cement Paste, ” submitted to Cement andConcrete Research.Baroghel-Bouny, V., and Chaussadent, T., Bulletin de Liaison des Laboratoires des Pontset Chauss&s 187 69, 1993., —,Bentz, D.P. and Garboczi, E. J., Cement and Concrete Research, U (2/3), 3~5, 1991.