Embed Size (px)
Citation preview

WATER NETWORK MANAGEMENT Real-time monitoring and proactive decision making
PROVIDING CLEAN WATER TO MORE THAN 100 MILLION HOMES
WHITE PAPER
Description of functionalities in
AQUIS Water Network Management
and Leak Detection System

Page 1 of 38
7-Technologies
Contents:
1 INTRODUCTION ........................................................................................................................................ 2
2 WHAT IS AQUIS ........................................................................................................................................ 3
2.1 AQUIS OFFLINE, ONLINE AND REAL-TIME .............................................................................................. 3
3 MODEL BUILDING .................................................................................................................................... 5
3.1 CHECKING DATA .................................................................................................................................... 6 3.2 UPDATING A MODEL............................................................................................................................... 8 3.3 ENTERING THE AQUIS ENVIRONMENT .................................................................................................... 9 3.4 RETURNING TO MODEL MANAGER .......................................................................................................... 9 3.5 SQL – EDITING DATA ............................................................................................................................ 9
4 NETWORK ANALYSIS ............................................................................................................................ 10
4.1 HYDRAULIC SIMULATIONS .................................................................................................................... 11 4.2 WATER QUALITY SIMULATIONS ............................................................................................................. 14
4.2.1 Tracking Chemicals, Age, Taste and Odor ................................................................................ 14 4.2.2 Anti-Pollution .............................................................................................................................. 15
4.3 SURGE MODULE .................................................................................................................................. 16
5 NETWORK OPERATION ........................................................................................................................ 18
5.1 GRAPHICAL USER INTERFACE .............................................................................................................. 18 5.1.1 Views .......................................................................................................................................... 20 5.1.2 Themes ...................................................................................................................................... 21 5.1.3 Historic data – Now - Future ...................................................................................................... 23 5.1.4 Alarms / Events .......................................................................................................................... 23 5.1.5 Bird eye ...................................................................................................................................... 24 5.1.6 Short cut buttons ........................................................................................................................ 24
5.2 WATER QUALITY .................................................................................................................................. 24 5.2.1 Contingency management - pollutants ...................................................................................... 25
5.3 WHAT-IF SCENARIOS ........................................................................................................................... 28 5.4 CUTTING OFF CONSUMERS ................................................................................................................... 30 5.5 CALL CENTRE FEATURES ..................................................................................................................... 31
6 OPTIMIZATION MODULES ..................................................................................................................... 35
6.1 LEAKAGE MANAGEMENT ...................................................................................................................... 35 6.1.1 The Integrated Flow Measurement Method (IFM) ..................................................................... 35 6.1.2 The Nightline Measurement Method (NLM) ............................................................................... 36
6.2 PRESSURE OPTIMIZATION .................................................................................................................... 37 6.3 PUMP OPTIMIZATION ............................................................................................................................ 37 6.4 PRODUCTION OPTIMIZATION................................................................................................................. 38

Page 2 of 38
7-Technologies
1 Introduction
This document describes the functionalities and features of the AQUIS Water Management software. The document is seen as an add-on to the AQUIS brochure. Further details of the more specific way of utilizing the functionalities of the AQUIS Water Management software is available in the AQUIS manual.
Page 3 of 38
7-Technologies
2 What is AQUIS
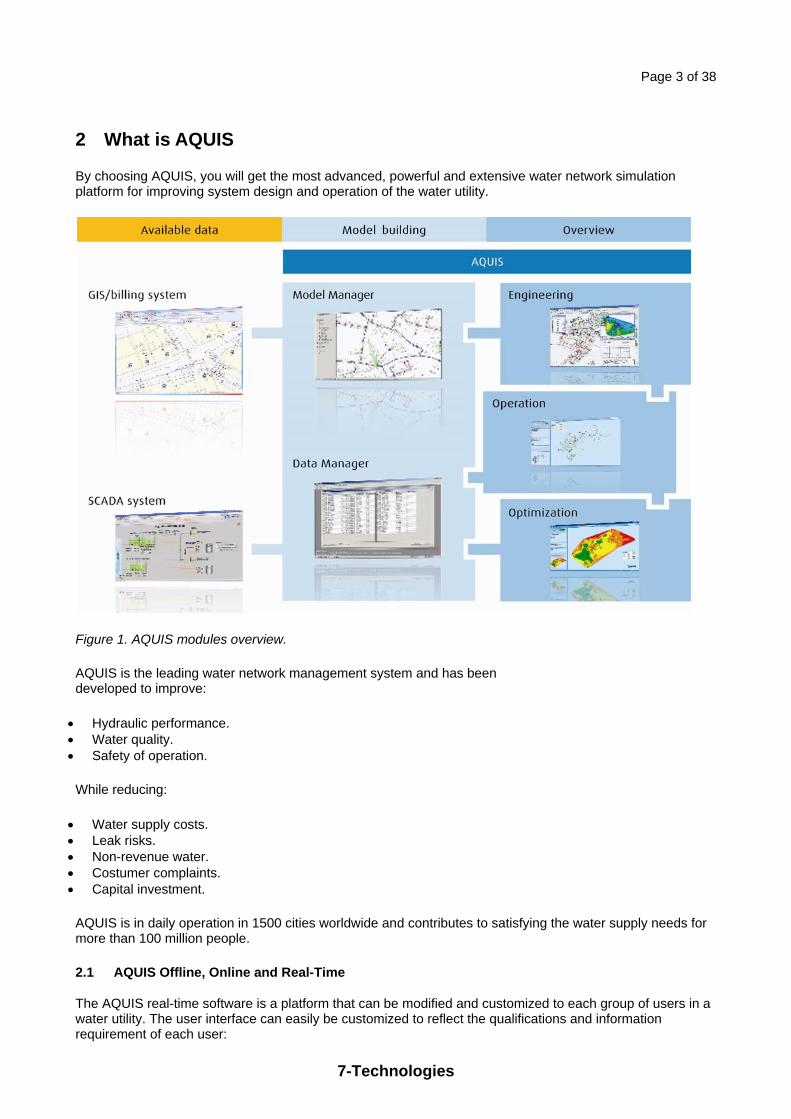
By choosing AQUIS, you will get the most advanced, powerful and extensive water network simulation platform for improving system design and operation of the water utility.
Figure 1. AQUIS modules overview.
AQUIS is the leading water network management system and has been developed to improve:
Hydraulic performance. Water quality. Safety of operation.
While reducing:
Water supply costs. Leak risks. Non-revenue water. Costumer complaints. Capital investment.
AQUIS is in daily operation in 1500 cities worldwide and contributes to satisfying the water supply needs for more than 100 million people.
2.1 AQUIS Offline, Online and Real-Time
The AQUIS real-time software is a platform that can be modified and customized to each group of users in a water utility. The user interface can easily be customized to reflect the qualifications and information requirement of each user:

Page 4 of 38
7-Technologies
AQUIS has solutions that address:
- The operator - The man in the field - The planner - The specialist - The maintenance staff - The call centre - The management - Even the clients can get updated information on the Internet, if the Utility wish to broadcast this.
Figure 2. Same user interface in real-time as in offline mode.
The above introduces a number of advantages:
- Knowledge about the operation of the water utility can be obtained by all level of staff – no modelling experience is required
- Decisions can be made by non modelling staff – they can undertake modelling problems just by clicking at bottom
- The specialists can focus on the future or more important tasks, leaving the basic task to the operation – the bar is lifted for the entire organization
- Several of our clients have introduced a ‘no incident policy’ – hence they cannot allow themselves to supply with too low pressure or mistakenly close a valve – AQUIS Operation is an integrated part of securing that mistakes are not made.
AQUIS is one platform – enabling the user to go back in time, look at the situation now and look at the future.

Page 5 of 38
7-Technologies
3 Model Building
Model building has become a much easier task with Model Manager. You only need the following data:
GIS/mapping data Demand data/profiles/geocoding Elevation data Calibration data – pressure, flow, level and water quality
When you have fed in this data, Model Manager automatically generates the model for you. What previously took a man-month is now finalized within hours!
Furthermore, you benefit from the fact that the data is checked for errors such as double piping, wrong sizes and missing pipes, and these are identified.
Moreover, the model can be automatically updated and maintained in Model Manager, which saves you tedious upgrade work.
You can use data stored in GIS directly for automatic model building via the generic Model Manager interface.
Model Manager support
ESRI (SHP) ArcSDE ORACLE/SDE SQL MicroStation (DGN) AutoCAD (DWG/DXG) SmallWorld EPAnet Most other formats.
Page 6 of 38
7-Technologies
3.1 Checking Data
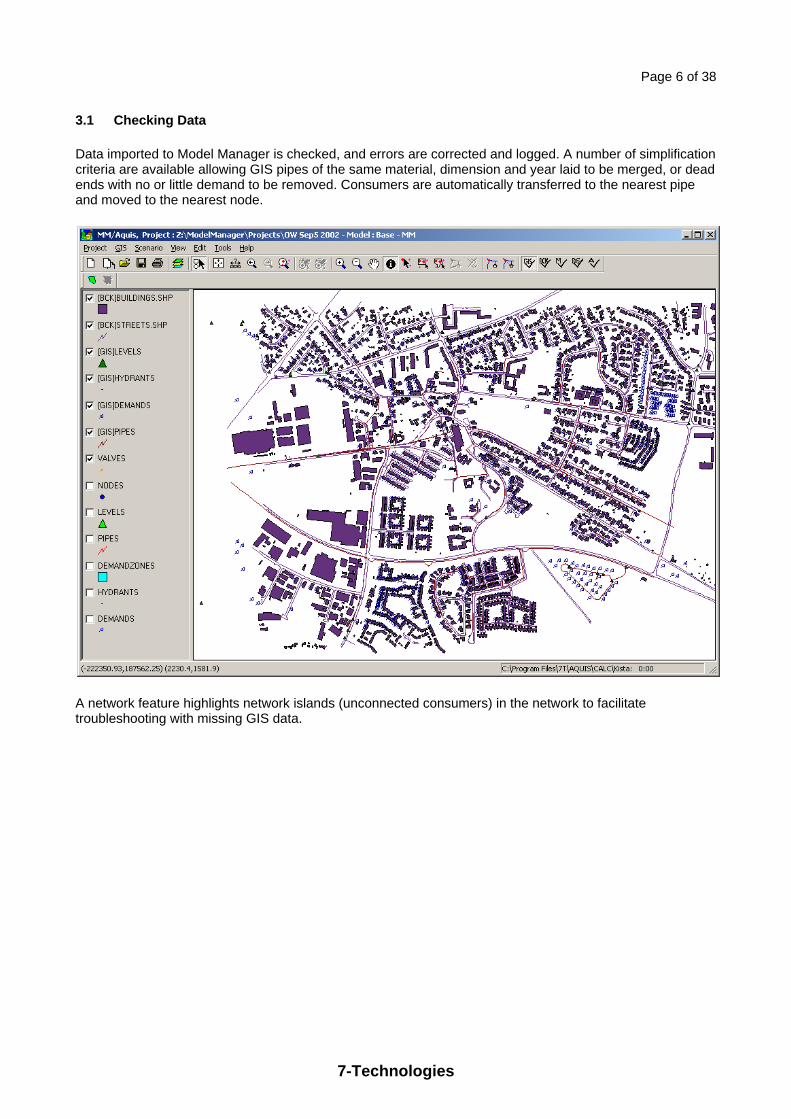
Data imported to Model Manager is checked, and errors are corrected and logged. A number of simplification criteria are available allowing GIS pipes of the same material, dimension and year laid to be merged, or dead ends with no or little demand to be removed. Consumers are automatically transferred to the nearest pipe and moved to the nearest node.
A network feature highlights network islands (unconnected consumers) in the network to facilitate troubleshooting with missing GIS data.

Page 7 of 38
7-Technologies

Page 8 of 38
7-Technologies
In Model Manager, you have access to all sorts of presentation tools for visualization of imported GIS data, model data and AQUIS result data.
When you use the layer control feature in Model Manager, you can customize what information to display by selecting and deselecting different types of data.
This feature is particularly useful for attaining, viewing and sorting pipe and nodal information built from the GIS.
3.2 Updating a Model
While providing a fast and error free model building capability, Model Manager also enables model maintenance. All GIS and billing ID’s are kept and tracked within the Model Manager for each project/model you build. Any changes in GIS or billing data can be transferred and all models updated in a single feature.
As all models are saved on a server, the user can copy the latest updated version of any model from the model library via the network.

Page 9 of 38
7-Technologies
3.3 Entering the AQUIS Environment
Once the model has been generated by Model Manager, an automatic link is displayed. Clicking the link will copy the model into the AQUIS modeling environment, where you may perform hydraulic, water quality and surge simulations.
3.4 Returning to Model Manager
You have access to a vast number of plot types for result presentation in AQUIS, but you may also copy the simulation results to Model Manager for thematic and fully customizable presentation and combining of results.
3.5 SQL – Editing Data
Data editing is made available in Model Manager by means of an SQL Table Editor. The editor allows you to manipulate, change and update GIS data, model data and simulation results when required.
Page 10 of 38
7-Technologies
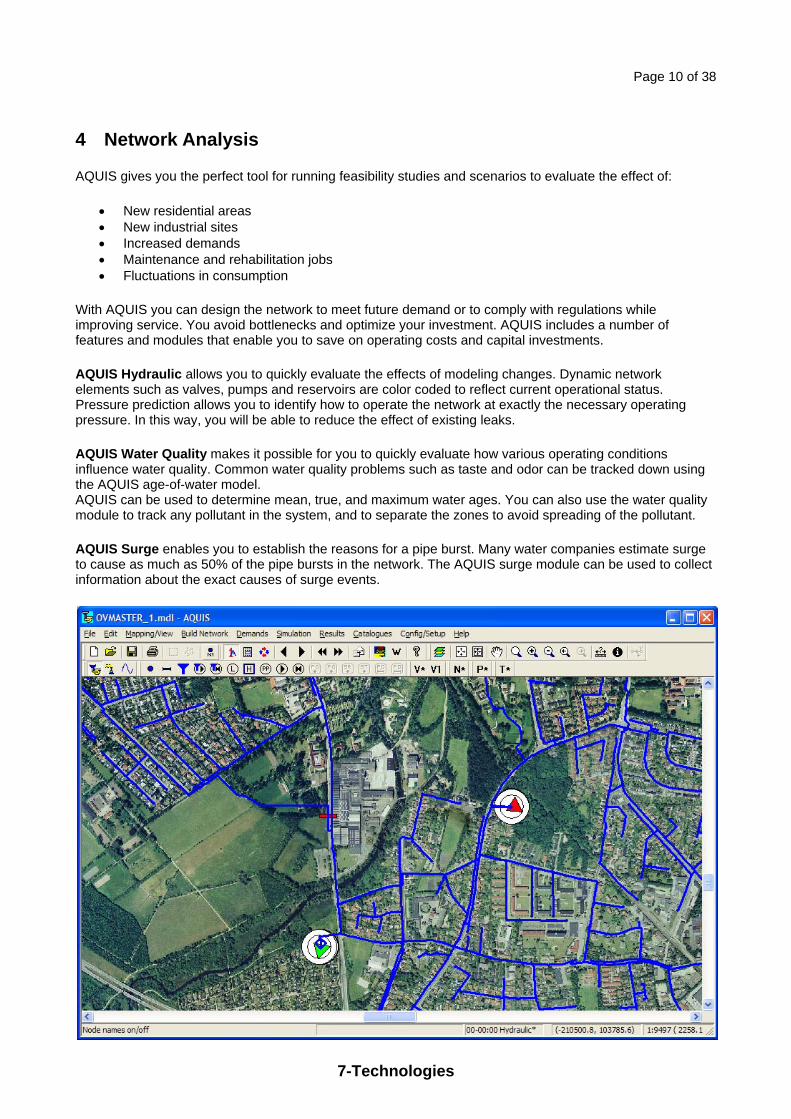
4 Network Analysis
AQUIS gives you the perfect tool for running feasibility studies and scenarios to evaluate the effect of:
New residential areas New industrial sites Increased demands Maintenance and rehabilitation jobs Fluctuations in consumption
With AQUIS you can design the network to meet future demand or to comply with regulations while improving service. You avoid bottlenecks and optimize your investment. AQUIS includes a number of features and modules that enable you to save on operating costs and capital investments.
AQUIS Hydraulic allows you to quickly evaluate the effects of modeling changes. Dynamic network elements such as valves, pumps and reservoirs are color coded to reflect current operational status. Pressure prediction allows you to identify how to operate the network at exactly the necessary operating pressure. In this way, you will be able to reduce the effect of existing leaks.
AQUIS Water Quality makes it possible for you to quickly evaluate how various operating conditions influence water quality. Common water quality problems such as taste and odor can be tracked down using the AQUIS age-of-water model. AQUIS can be used to determine mean, true, and maximum water ages. You can also use the water quality module to track any pollutant in the system, and to separate the zones to avoid spreading of the pollutant.
AQUIS Surge enables you to establish the reasons for a pipe burst. Many water companies estimate surge to cause as much as 50% of the pipe bursts in the network. The AQUIS surge module can be used to collect information about the exact causes of surge events.

Page 11 of 38
7-Technologies
4.1 Hydraulic Simulations
AQUIS is a market leading PC program for modeling and managing of all processes in clean water distribution systems. AQUIS provides you with a powerful, user-friendly operational tool that will help you meet regulatory standards and business objectives.
AQUIS includes the hydraulic, water quality and surge modules as well as applications for automatic calibration, detection of existing leaks, detection of new leaks, load forecasting and optimization of operation. The individual modules are all based on proven technology
AQUIS is fully modularized to ensure ultimate scalability and flexibility. The platform provides all the tools needed for small, medium and large utilities.
Figure 1. The AQUIS graphical user interface
Today AQUIS software is used in more than 1500 cities around the world.
Typical hydraulic applications are listed below:
Calibration of networks. Handling of hazardous situations such as the occurrence of major leaks and pipeline ruptures,
outages of production plants or pumping stations.

Page 12 of 38
7-Technologies
Extending and rebuilding networks. Optimization of operation. Contingency planning. Water production cost and evaluation. Analysis of dynamic system elements, such as flows and pressures over time. Analysis for leaks. Rehabilitation planning and designing. Designing new networks or network extensions. Pre- and post-project appraisal.
Calibration and network reporting are made easier using the AQUIS features, which include:
Global and local hydraulic results. Import data capability. Comparison of modeled and measured data. Export of data to other programs running under Windows, such as Excel. Use of AQUIS and Windows data when reporting on calibrated models.
Figure 2. AQUIS hydraulic results
Page 13 of 38
7-Technologies
Rehabilitation planning and designing are assisted using:
Global and local plotting options. Exportable selection criteria. Configuration of specific results data.
From the interface, you can extend network models to AQUIS Model Manager that updates existing models via new corporate system data such as GIS, customer billing and so on, or directly in the AQUIS graphical user interface.
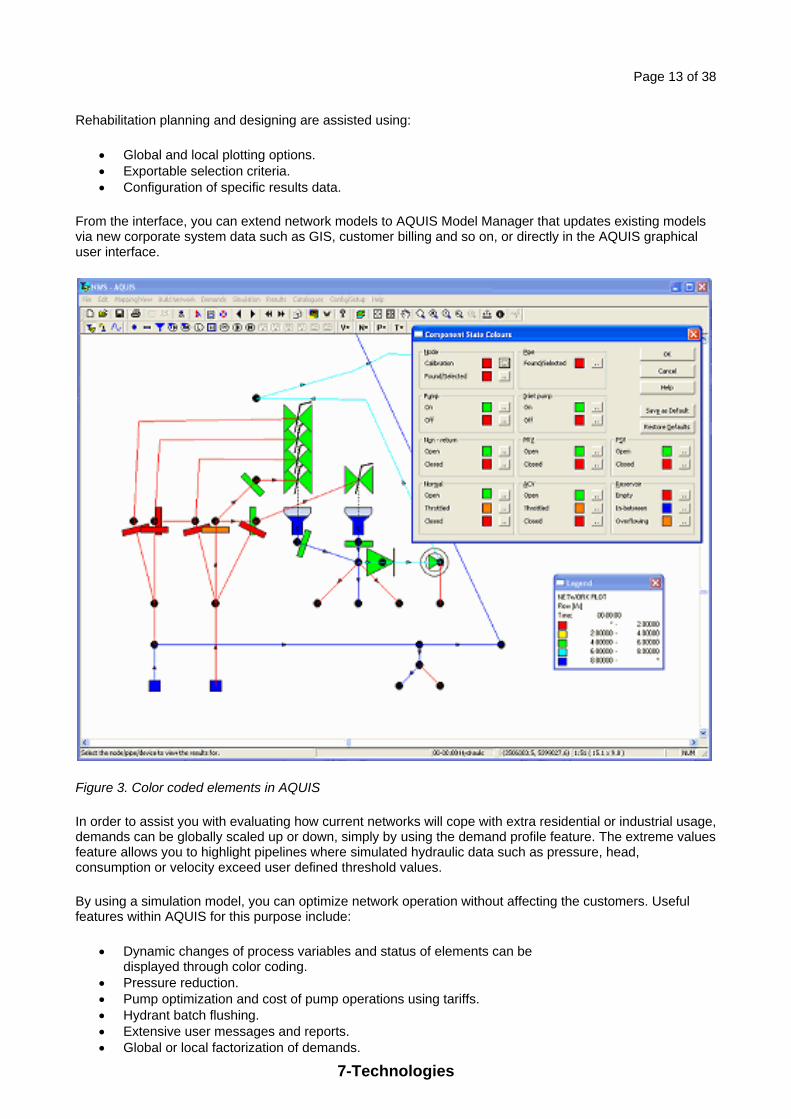
Figure 3. Color coded elements in AQUIS
In order to assist you with evaluating how current networks will cope with extra residential or industrial usage, demands can be globally scaled up or down, simply by using the demand profile feature. The extreme values feature allows you to highlight pipelines where simulated hydraulic data such as pressure, head, consumption or velocity exceed user defined threshold values.
By using a simulation model, you can optimize network operation without affecting the customers. Useful features within AQUIS for this purpose include:
Dynamic changes of process variables and status of elements can be displayed through color coding.
Pressure reduction. Pump optimization and cost of pump operations using tariffs. Hydrant batch flushing. Extensive user messages and reports. Global or local factorization of demands.

Page 14 of 38
7-Technologies
4.2 Water Quality Simulations
The AQUIS Water Quality module gives you full overview of the chemical composition in every part of the water network in order to preserve the right water quality. You can follow and track the water throughout the network and be informed about the composition in every node.
The AQUIS water quality simulation engine allows speedy, accurate evaluation of the most complex water networks.
4.2.1 Tracking Chemicals, Age, Taste and Odor
You can identify how chemicals move around in the system, and thus optimize the dosing of chemicals such as nitrate, phosphate, fluoride and chlorine.
To improve the water quality, AQUIS can also determine the age of the water.
AQUIS follows the water and registers the percentages of the different water ages in each location within the network. You can apply the same tracking algorithm for taste and odor, and thereby ensure that the water quality corresponds to the given specifications.

Page 15 of 38
7-Technologies
4.2.2 Anti-Pollution
AQUIS tracks the water and registers the chemical composition in every location throughout the network.
If a pollutant enters the system, AQUIS can help you identify the point of entry. Moreover, you are assisted in developing a contingency plan in case of pollution. For instance if you need to determine, which zones to cut off to prevent pollutants from spreading. In other words, AQUIS helps you react correctly and in due time.
4.2.3 Network Flushing
AQUIS tracks the water and registers the chemical composition in each location throughout the network.
If a pollutant has entered the system, AQUIS will provide recommendations on network flushing; which fire hydrants should be opened, which zones should be flushed when and for how long.
AQUIS helps you to realize your contingency plan in case of pollution. By using AQUIS, you will know when the water is safe to drink again.

Page 16 of 38
7-Technologies
Figure 1. Network flushing
4.3 Surge Module
50% of all bursts in the distribution network are caused by pressure surges.
AQUIS can help you:
Track the pressure surges throughout the network and determine sizes and locations of pressure peaks for given scenarios.
Evaluate the operational or mechanical changes required in order to prevent pipe bursts. Reduce the investment in new piping, avoid discoloration and prevent shutdowns.

Page 17 of 38
7-Technologies
Figure 1. AQUIS surge.
AQUIS provides guidance on when to simulate network behavior during transients, for example when stopping and starting of pumps, opening and closing of valves, or large clients going online. You can determine the pressure fluctuations, which such incidents will introduce on the network, and identify where the peak loads are.
With AQUIS, you can modify pumps or pumping operation, valve opening times or piping layout to ensure safe operation.

Page 18 of 38
7-Technologies
5 Network Operation
AQUIS will give you a better overview and improved operation once you run the water network modeling tool in real-time mode.
By using live SCADA data the AQUIS model is transformed from a planning tool to a decision making tool, integrated in your day-to-day operations – with instant and clearly identified benefits and economic advantages. Like GPS automobile navigation, AQUIS Operation will advise you of problems in the network, no matter which turn you take.
How does it work? The operator does not require any in-depth knowledge of AQUIS. By scrolling back and forth on a simple button interface he can obtain the information he need such as pressure, flow and quality for any given point in time - in the past or in the future.
The AQUIS model is fed with live information from the SCADA system as well as forecast information about weather conditions. This enables the model to predict future consumption even during periods of quickly changing or extreme weather conditions.
Different variables, such as supply pressure, age of the water, amount of chemicals in the water or flow can be displayed. Effects of interventions, such as opening or closing of valves can be assessed by simulations, which reveal disturbances in consumer supply.
Improved Network Overview AQUIS Operation gives the operator full overview of all aspects of his distribution network. This will provide operational understanding of bottlenecks and potential performance of the network.
AQUIS Operation displays the data, such as age or pressure, with color coding all over the network, enabling the user to learn how the network is functioning at any given time.
The information can be made available to the call center. Error conditions or temporary problems will be evident. The call center can click on any node in the network to see measurements such as the water pressure at the specific location. Alarm set points for all parameters can be preconfigured.
Prediction of Demand AQUIS Operation is fully integrated with SCADA and can be prepared to send an alarm to SCADA if error conditions in the network are predicted. The AQUIS system will constantly predict the demand of your network, which is based on history and on the current and future weather situation.
By a click of the mouse the operator can simulate the closing of a valve. AQUIS will run prediction and return an alarm if one of the pre-configured set-points is exceeded. The operator will therefore quickly and easily be able to advise the staff in the field if it is safe to close a specific valve. Other related problems can be seen and avoided with intervention simulation.
5.1 Graphical User Interface
The graphical user interface (GUI) is designed for easy and intuitive access from all parties involved, whether it is:
- The operator - The man in the field - The planner - The specialist - The maintenance staff - The call centre - The management - Even the clients can get updated information on the Internet, if the Utility wish to broadcast this.
Page 19 of 38
7-Technologies
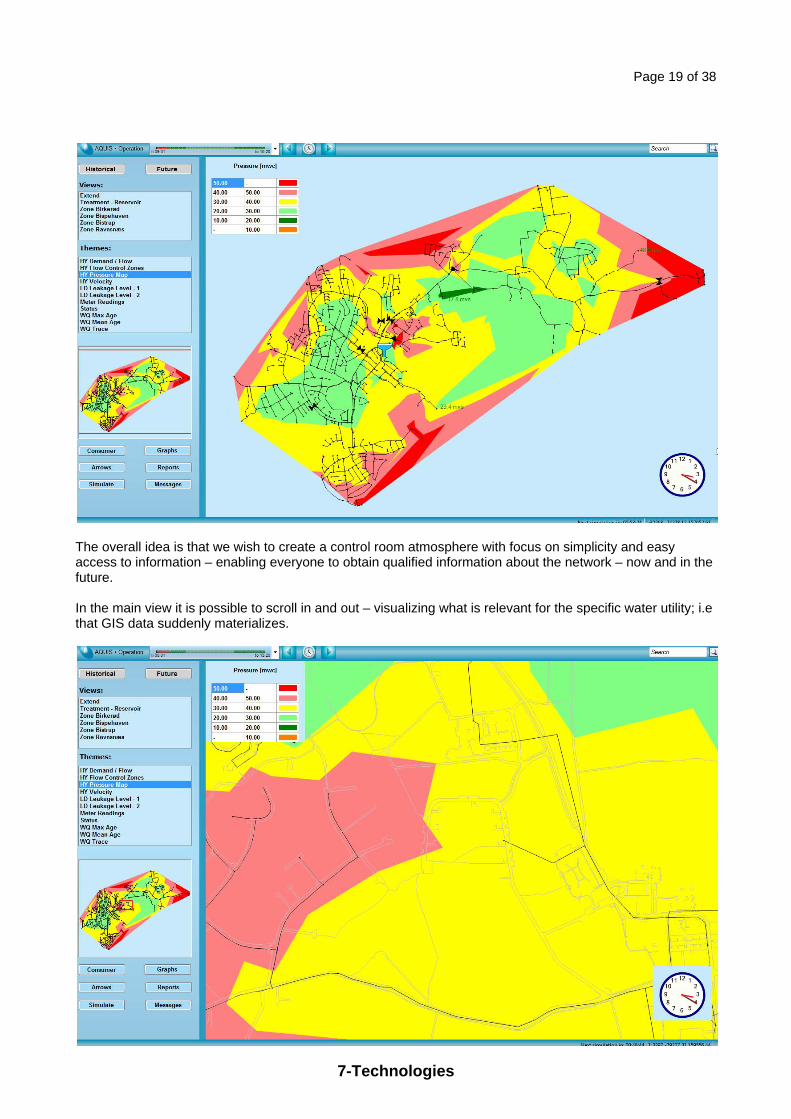
The overall idea is that we wish to create a control room atmosphere with focus on simplicity and easy access to information – enabling everyone to obtain qualified information about the network – now and in the future. In the main view it is possible to scroll in and out – visualizing what is relevant for the specific water utility; i.e that GIS data suddenly materializes.
Page 20 of 38
7-Technologies
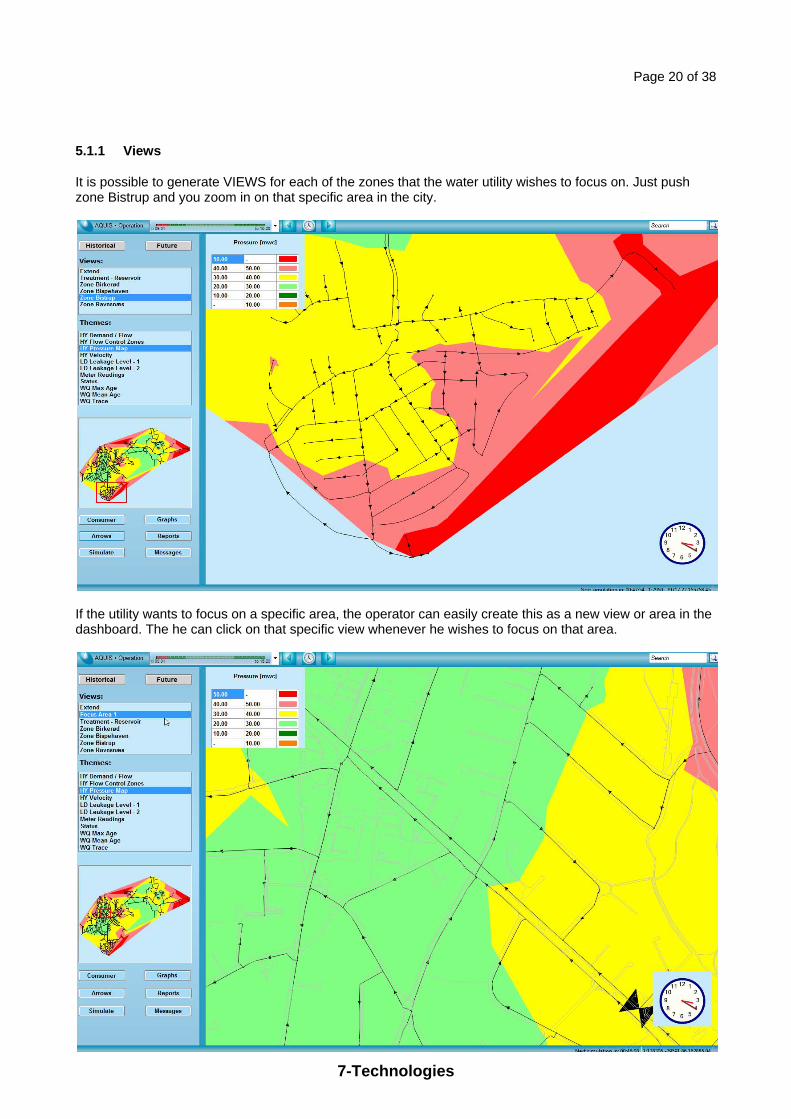
5.1.1 Views
It is possible to generate VIEWS for each of the zones that the water utility wishes to focus on. Just push zone Bistrup and you zoom in on that specific area in the city.
If the utility wants to focus on a specific area, the operator can easily create this as a new view or area in the dashboard. The he can click on that specific view whenever he wishes to focus on that area.
Page 21 of 38
7-Technologies
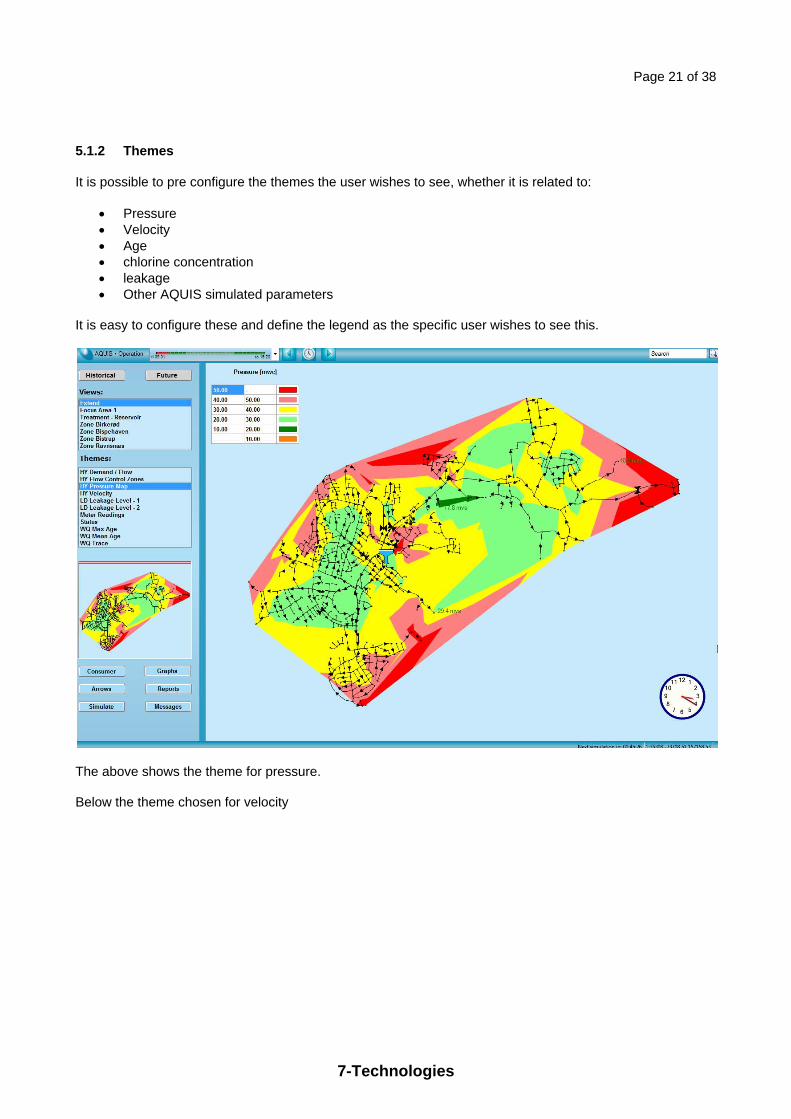
5.1.2 Themes
It is possible to pre configure the themes the user wishes to see, whether it is related to:
Pressure Velocity Age chlorine concentration leakage Other AQUIS simulated parameters
It is easy to configure these and define the legend as the specific user wishes to see this.
The above shows the theme for pressure. Below the theme chosen for velocity

Page 22 of 38
7-Technologies
The theme for demand and flow.
Below is shown the zones the city is divided into – presently 4 zones – having the 7T leak detection system installed.

Page 23 of 38
7-Technologies
5.1.3 Historic data – Now - Future
The GUI makes it possible to move quickly back in time - to the situation now and scroll forward to any future situation. This is done by toggling on the buttons at the top. 5.1.4 Alarms / Events
The system is equipped with ‘alarm’ buttons – or ‘events’ where the user can free-configure thresholds that shall raise a historic or future breach of a threshold – if for instance the pressure will be too low, the utility can reach by opening a valve or start a pump – avoiding the problem. If the user presses the event button he can go directly to the point of alarm and highlight the exact problem.

Page 24 of 38
7-Technologies
5.1.5 Bird eye
To give the user possibility of moving quickly around in the network he can use the bird eye facility. 5.1.6 Short cut buttons
The system also has the possibility of defining buttons that can serve as short cut to any function – this being simulate, reporting, messages etc. 5.2 Water Quality
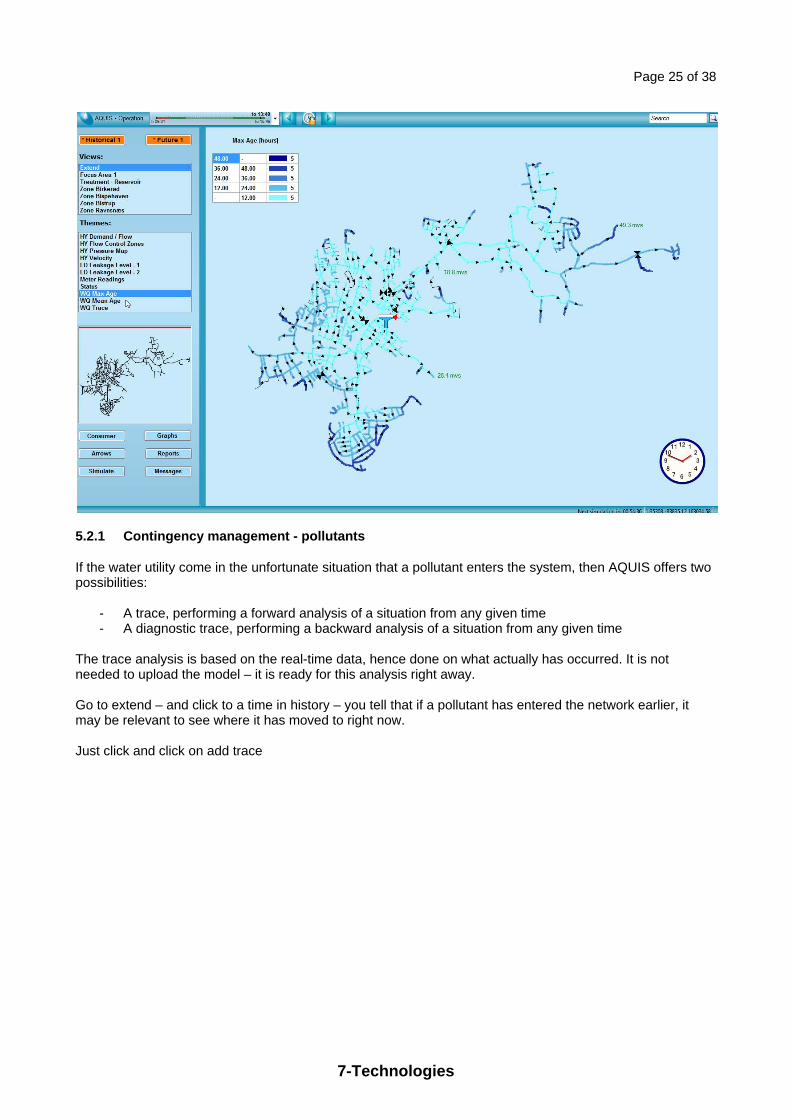
Special for AQUIS is that we can analyze water quality. It is possible to see how the water moves and hence the age of the water. In the below is shown age – It could also be show chlorine degradation or other aspects reducing the need for analysis or just being aware when flushing is necessary. This may also be extremely interesting for the utility with more than 1 water supply. They will be able to identify which water supply supplies water to whom.
Page 25 of 38
7-Technologies
5.2.1 Contingency management - pollutants
If the water utility come in the unfortunate situation that a pollutant enters the system, then AQUIS offers two possibilities:
- A trace, performing a forward analysis of a situation from any given time - A diagnostic trace, performing a backward analysis of a situation from any given time
The trace analysis is based on the real-time data, hence done on what actually has occurred. It is not needed to upload the model – it is ready for this analysis right away. Go to extend – and click to a time in history – you tell that if a pollutant has entered the network earlier, it may be relevant to see where it has moved to right now. Just click and click on add trace

Page 26 of 38
7-Technologies
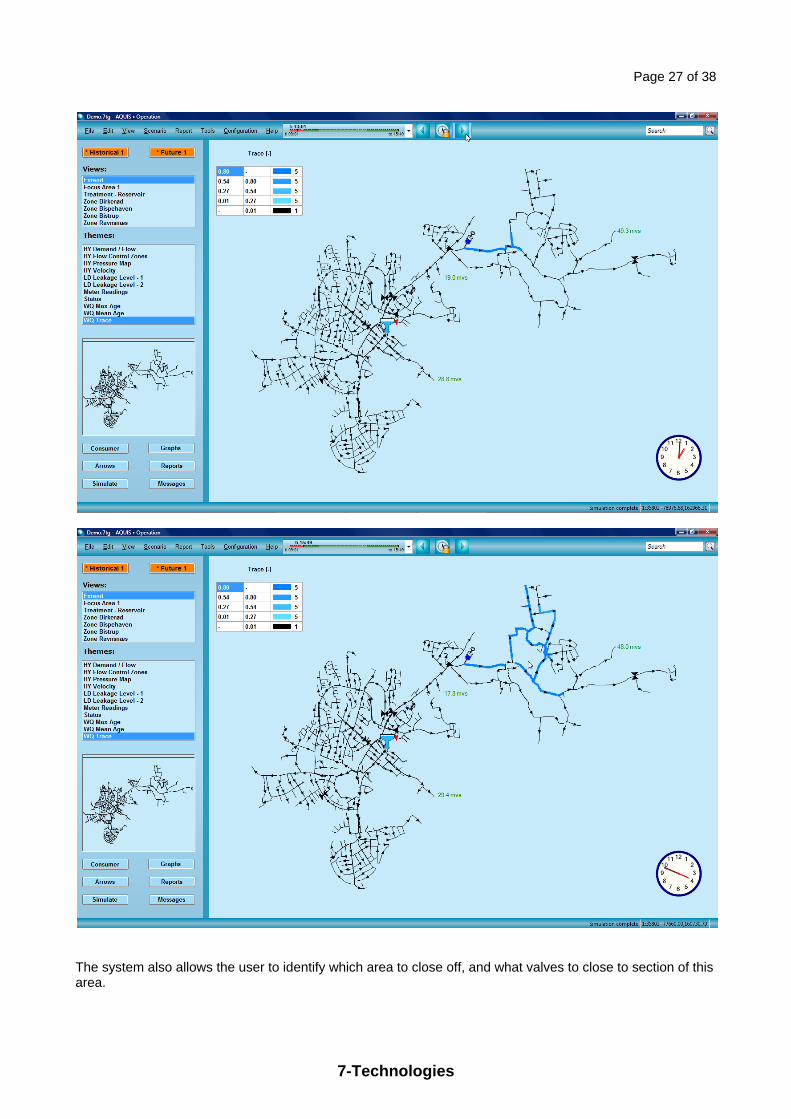
Go to trace and click forward to see where the pollutant has moved to.
Page 27 of 38
7-Technologies
The system also allows the user to identify which area to close off, and what valves to close to section of this area.
Page 28 of 38
7-Technologies
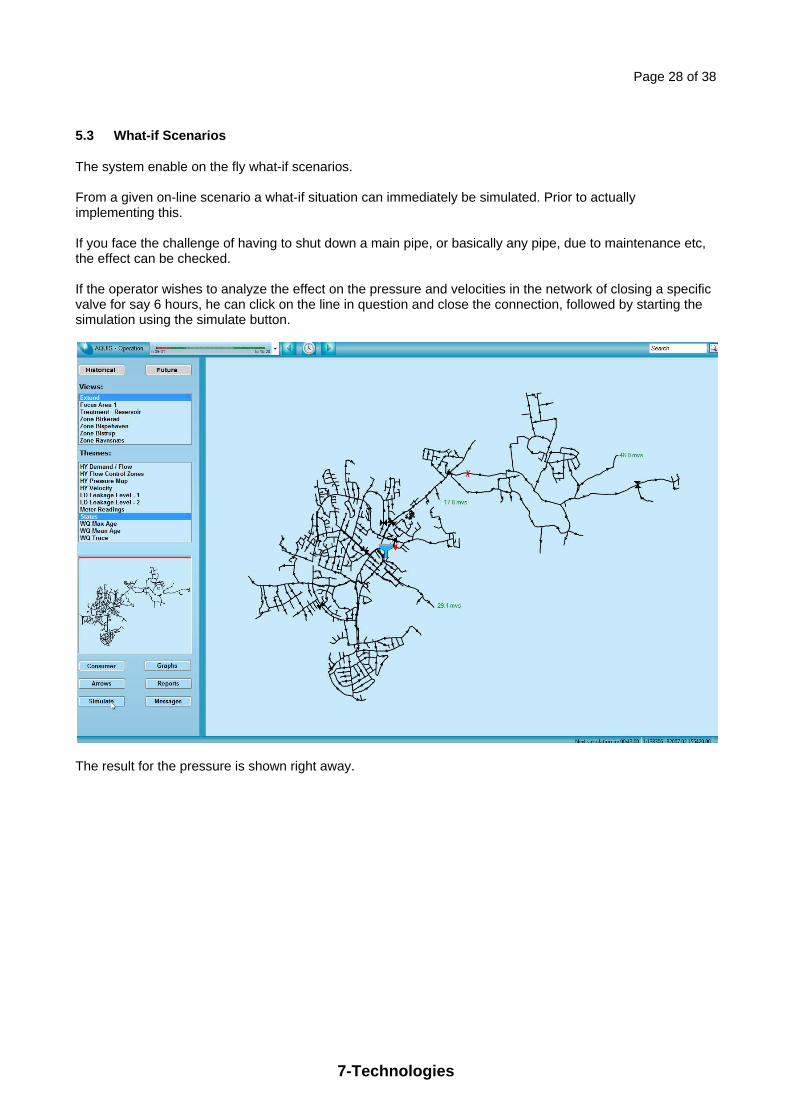
5.3 What-if Scenarios
The system enable on the fly what-if scenarios. From a given on-line scenario a what-if situation can immediately be simulated. Prior to actually implementing this. If you face the challenge of having to shut down a main pipe, or basically any pipe, due to maintenance etc, the effect can be checked. If the operator wishes to analyze the effect on the pressure and velocities in the network of closing a specific valve for say 6 hours, he can click on the line in question and close the connection, followed by starting the simulation using the simulate button.
The result for the pressure is shown right away.

Page 29 of 38
7-Technologies
As seen from the above15.35 is not a good time for closing his valve. But when is? – he can continue to click on the time until adequate pressure is reached. As seen below it is safe to close the valve at 17.35.
If he continues to analyze, the valve must be opened before 06.35 in the next morning.

Page 30 of 38
7-Technologies
5.4 Cutting off consumers
If the utility needs to close an area cutting of some consumers, this normally requires staff to go out ‘knocking on doors’ informing about the problem – or at least that the consumers are notified by letter about the shut down. If an area is closed we know who you hit – close the valve as shown – the yellow dots represent consumers that will not receive water.
By clicking ‘reports’ it is possible to get a report showing the consumers that are out of water. And by clicking ‘send messages’ it is possible to send out messages by letter, e-mail or sms. This may not be relevant for villas, but it may be extremely relevant for critical consumers such as restaurants, hospitals, schools or hairdressers – allowing them to take precaution in their business.
Page 31 of 38
7-Technologies
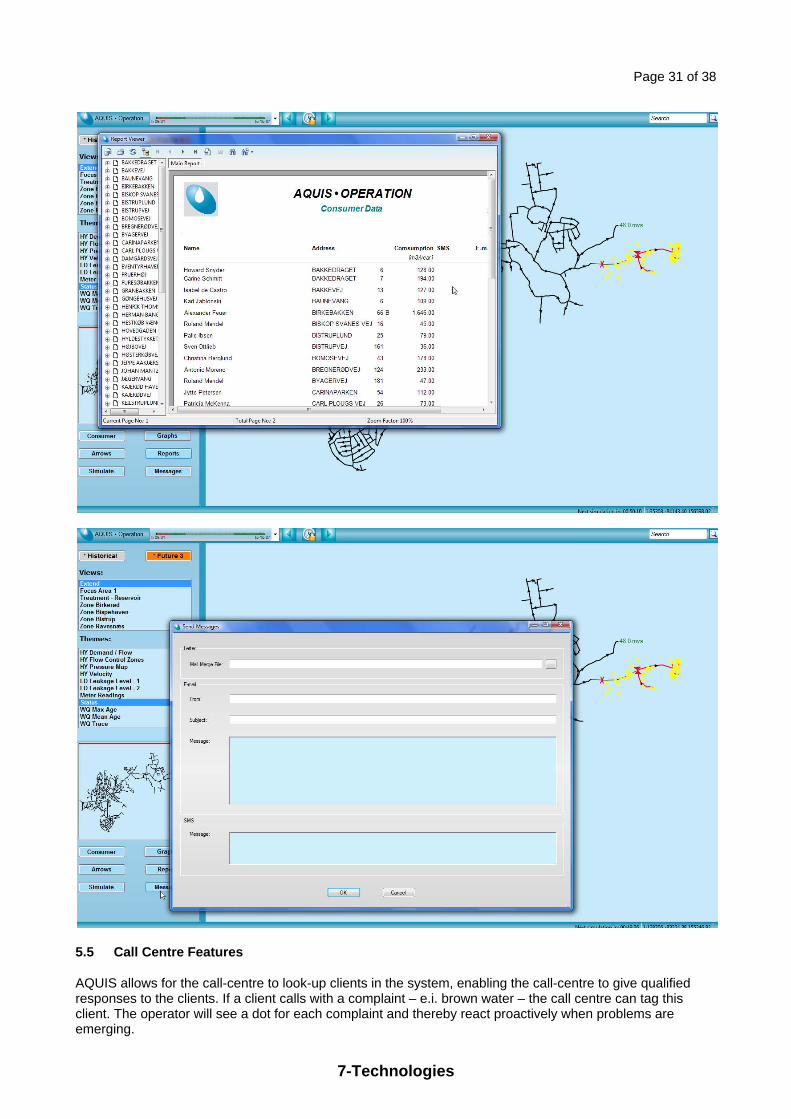
5.5 Call Centre Features
AQUIS allows for the call-centre to look-up clients in the system, enabling the call-centre to give qualified responses to the clients. If a client calls with a complaint – e.i. brown water – the call centre can tag this client. The operator will see a dot for each complaint and thereby react proactively when problems are emerging.
Page 32 of 38
7-Technologies
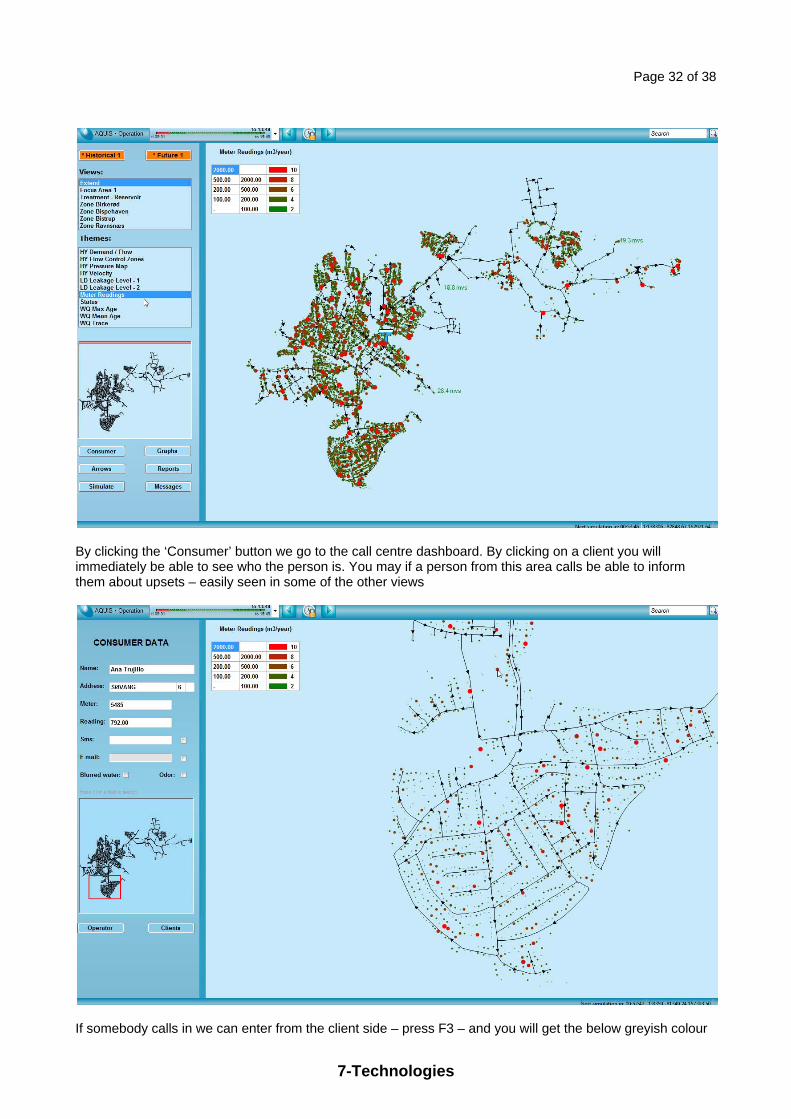
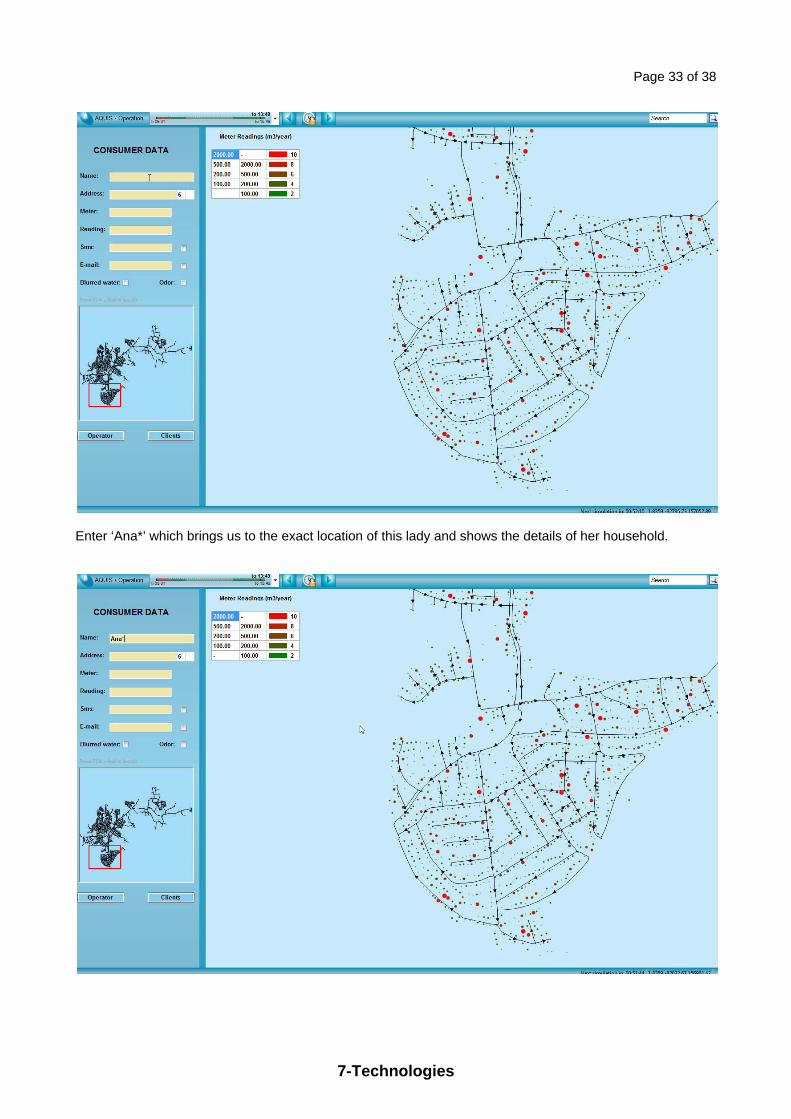
By clicking the ‘Consumer’ button we go to the call centre dashboard. By clicking on a client you will immediately be able to see who the person is. You may if a person from this area calls be able to inform them about upsets – easily seen in some of the other views
If somebody calls in we can enter from the client side – press F3 – and you will get the below greyish colour
Page 33 of 38
7-Technologies
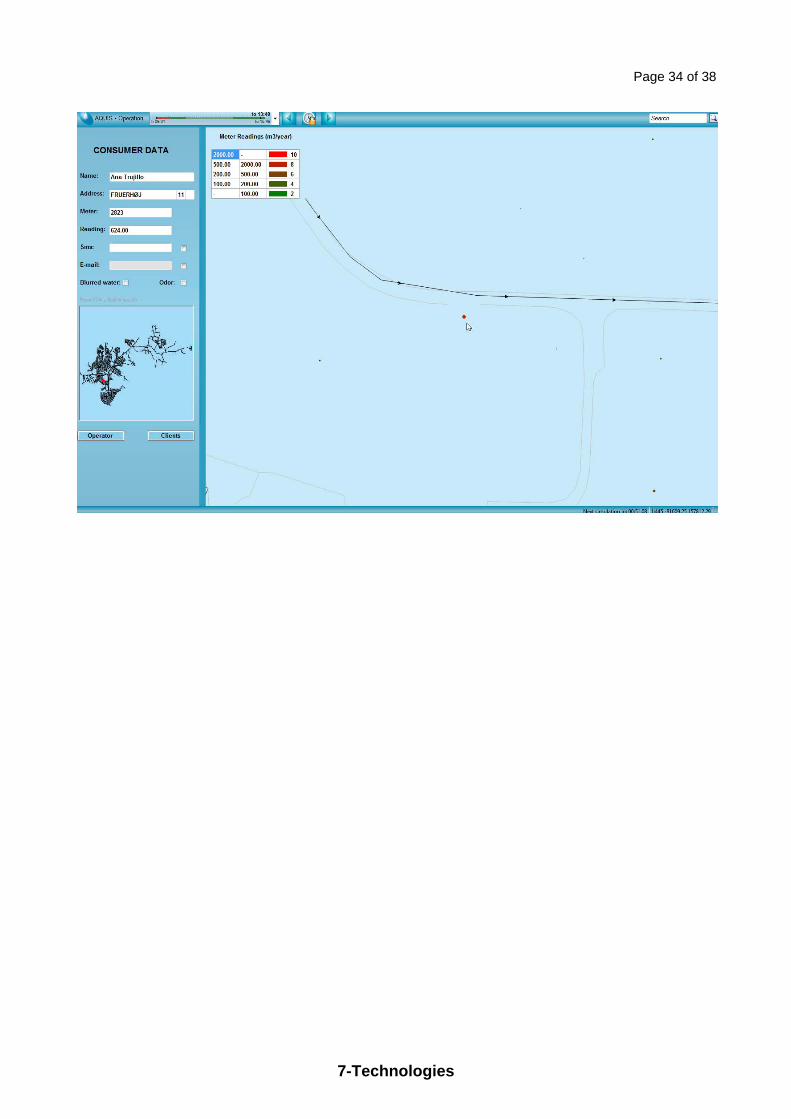
Enter ‘Ana*’ which brings us to the exact location of this lady and shows the details of her household.
Page 34 of 38
7-Technologies
Page 35 of 38
7-Technologies
6 Optimization Modules
6.1 Leakage Management
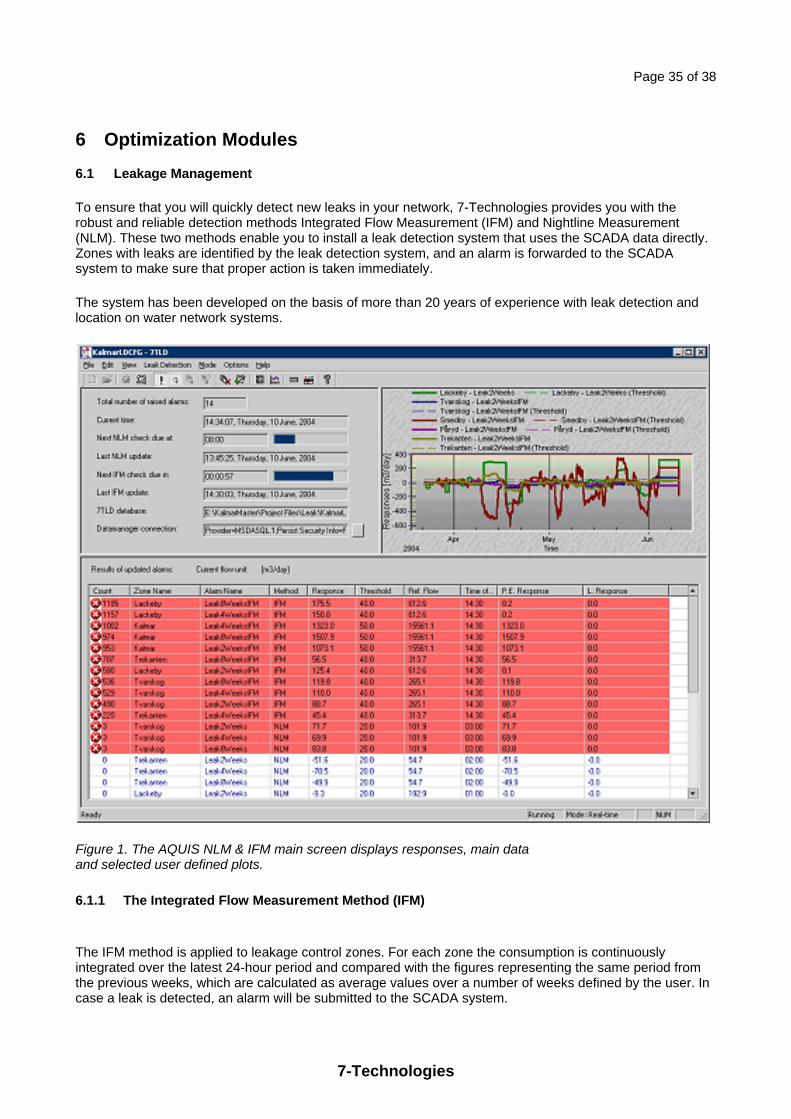
To ensure that you will quickly detect new leaks in your network, 7-Technologies provides you with the robust and reliable detection methods Integrated Flow Measurement (IFM) and Nightline Measurement (NLM). These two methods enable you to install a leak detection system that uses the SCADA data directly. Zones with leaks are identified by the leak detection system, and an alarm is forwarded to the SCADA system to make sure that proper action is taken immediately.
The system has been developed on the basis of more than 20 years of experience with leak detection and location on water network systems.
Figure 1. The AQUIS NLM & IFM main screen displays responses, main data and selected user defined plots.
6.1.1 The Integrated Flow Measurement Method (IFM)
The IFM method is applied to leakage control zones. For each zone the consumption is continuously integrated over the latest 24-hour period and compared with the figures representing the same period from the previous weeks, which are calculated as average values over a number of weeks defined by the user. In case a leak is detected, an alarm will be submitted to the SCADA system.
Page 36 of 38
7-Technologies
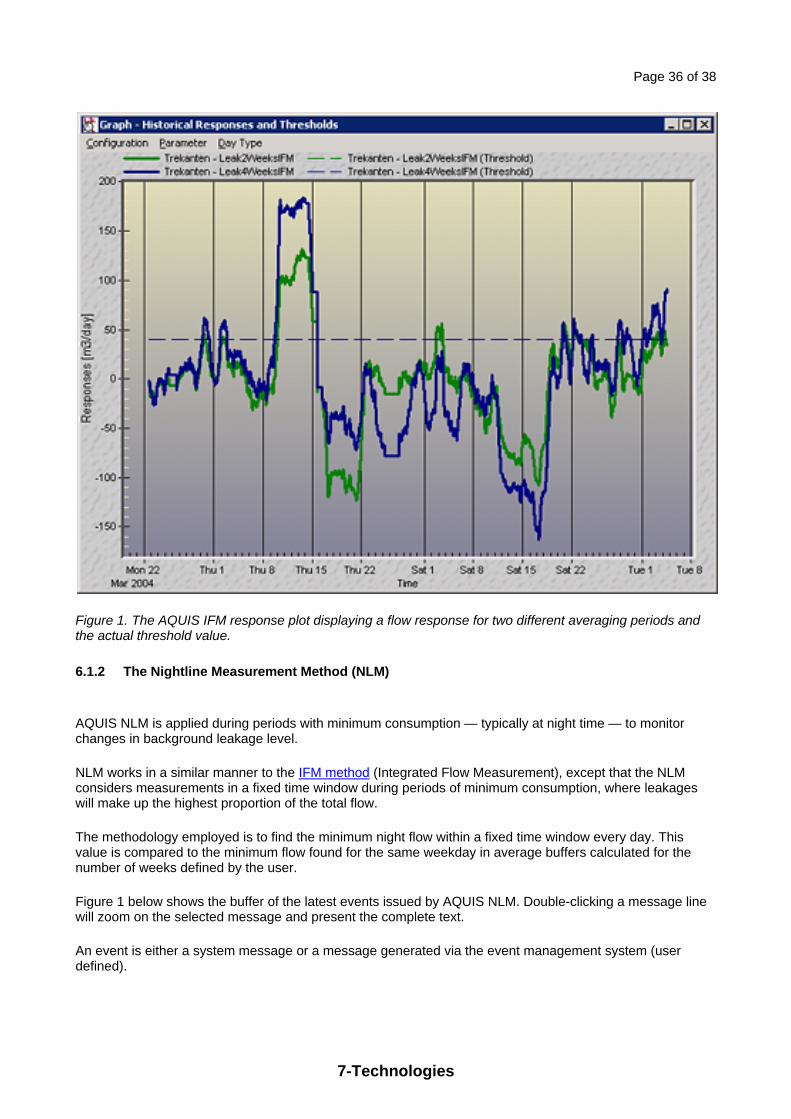
Figure 1. The AQUIS IFM response plot displaying a flow response for two different averaging periods and the actual threshold value.
6.1.2 The Nightline Measurement Method (NLM)
AQUIS NLM is applied during periods with minimum consumption — typically at night time — to monitor changes in background leakage level.
NLM works in a similar manner to the IFM method (Integrated Flow Measurement), except that the NLM considers measurements in a fixed time window during periods of minimum consumption, where leakages will make up the highest proportion of the total flow.
The methodology employed is to find the minimum night flow within a fixed time window every day. This value is compared to the minimum flow found for the same weekday in average buffers calculated for the number of weeks defined by the user.
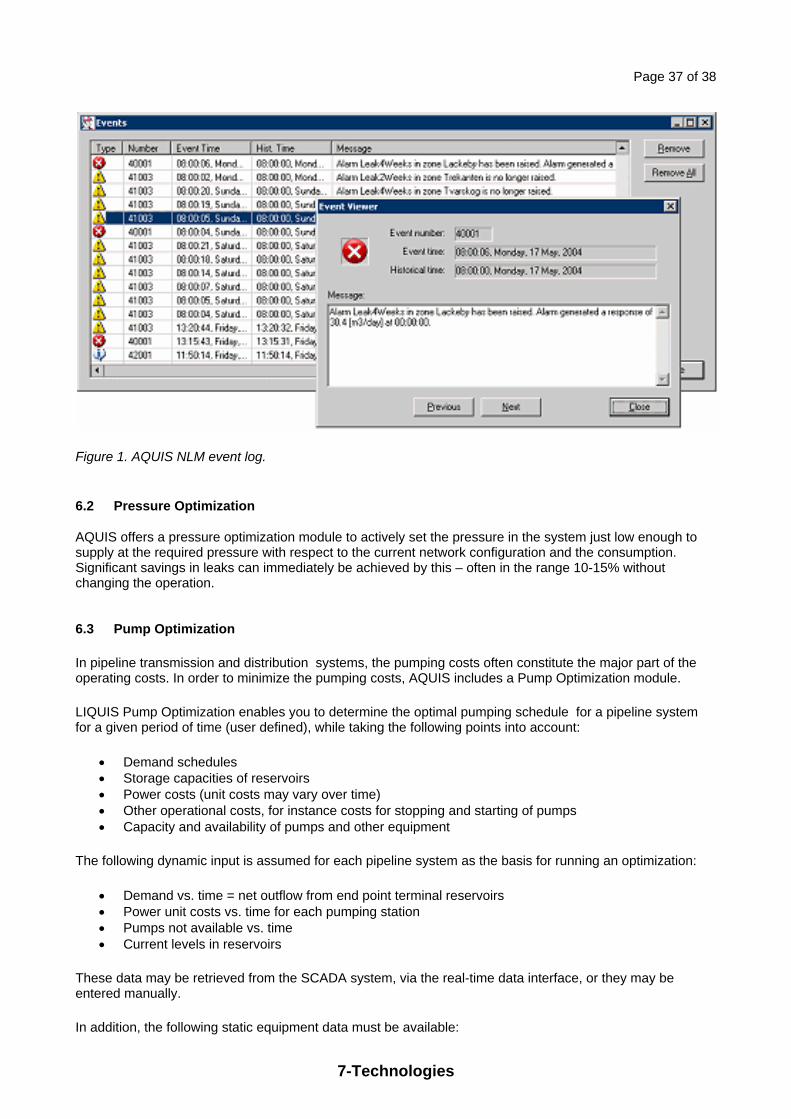
Figure 1 below shows the buffer of the latest events issued by AQUIS NLM. Double-clicking a message line will zoom on the selected message and present the complete text.
An event is either a system message or a message generated via the event management system (user defined).
Page 37 of 38
7-Technologies
Figure 1. AQUIS NLM event log.
6.2 Pressure Optimization
AQUIS offers a pressure optimization module to actively set the pressure in the system just low enough to supply at the required pressure with respect to the current network configuration and the consumption. Significant savings in leaks can immediately be achieved by this – often in the range 10-15% without changing the operation. 6.3 Pump Optimization
In pipeline transmission and distribution systems, the pumping costs often constitute the major part of the operating costs. In order to minimize the pumping costs, AQUIS includes a Pump Optimization module.
LIQUIS Pump Optimization enables you to determine the optimal pumping schedule for a pipeline system for a given period of time (user defined), while taking the following points into account:
Demand schedules Storage capacities of reservoirs Power costs (unit costs may vary over time) Other operational costs, for instance costs for stopping and starting of pumps Capacity and availability of pumps and other equipment
The following dynamic input is assumed for each pipeline system as the basis for running an optimization:
Demand vs. time = net outflow from end point terminal reservoirs Power unit costs vs. time for each pumping station Pumps not available vs. time Current levels in reservoirs
These data may be retrieved from the SCADA system, via the real-time data interface, or they may be entered manually.
In addition, the following static equipment data must be available:

Page 38 of 38
7-Technologies
Volume vs. level curves for each reservoir Max./min. water levels of each reservoir Pump characteristics and power curves for each different type of pump (the module is capable of
taking wear of the pump into account in the power calculations)
Allowable area of operation of pumps, for example max./min. speed of rotation, surge limit and stonewall limit
The information above produces the following main output:
Flow set point or pressure set point for each pumping station vs. time Resulting levels in reservoirs vs. time Costs of optimal operation vs. time
The flow set point or pressure set point for each pumping station may be sent back to the SCADA system automatically. The optimization algorithm is based on the dynamic programming technique.
6.4 Production Optimization
The AQUIS platform uniquely follows the mixing of the water from the specific source; often several water treatment plants supply water to the utility – AQUIS knows how it is mixed. If the water Utility can establish economic parameters or ranking for which sources to utilize then AQUIS production optimization can produce production set points to each production unit. The same applies to limitations in mixing.