Embed Size (px)
Citation preview
Water Monitoring Report2017–18
May 2019
ISBN 978 1 920702 05 2
Australian Competition and Consumer Commission 23 Marcus Clarke Street, Canberra, Australian Capital Territory, 2601
© Commonwealth of Australia 2019
This work is copyright. In addition to any use permitted under the Copyright Act 1968, all material contained within this work is provided under a Creative Commons Attribution 3.0 Australia licence, with the exception of:
� the Commonwealth Coat of Arms
� the ACCC and AER logos
� any illustration, diagram, photograph or graphic over which the Australian Competition and Consumer Commission does not hold copyright, but which may be part of or contained within this publication.
The details of the relevant licence conditions are available on the Creative Commons website, as is the full legal code for the CC BY 3.0 AU licence.
Requests and inquiries concerning reproduction and rights should be addressed to the Director, Content and Digital Services, ACCC, GPO Box 3131, Canberra ACT 2601.
Important notice
The information in this publication is for general guidance only. It does not constitute legal or other professional advice, and should not be relied on as a statement of the law in any jurisdiction. Because it is intended only as a general guide, it may contain generalisations. You should obtain professional advice if you have any specific concern.
The ACCC has made every reasonable effort to provide current and accurate information, but it does not make any guarantees regarding the accuracy, currency or completeness of that information.
Parties who wish to re-publish or otherwise use the information in this publication must check this information for currency and accuracy prior to publication. This should be done prior to each publication edition, as ACCC guidance and relevant transitional legislation frequently change. Any queries parties have should be addressed to the Director, Content and Digital Services, ACCC, GPO Box 3131, Canberra ACT 2601.
ACCC 05/19_1522
www.accc.gov.au
Cover photo: Darling River, NSW March 2018
Source: iStockphoto
iiiWater monitoring report 2017–18
ContentsAbbreviations viii
Glossary xi
Key findings xvii
Summary xixDrought conditions began to emerge xix
Some areas experienced record prices for traded water entitlements xx
There was widespread debate and many reviews of water policy and governance arrangements in the Murray–Darling Basin xx
Water charge rules changes move forward xxi
Allocation trade declined xxi
Trade in water delivery rights remained low relative to total rights on issue xxii
A lower volume of irrigation rights was transformed xxii
And termination activity declined xxiii
Some on-river hypothetical bills increased while others decreased xxiv
Off-river hypothetical bills continued to increase for most networks xxv
There are significant differences between each Basin State’s water planning and management arrangements xxviii
Complaints increased slightly during 2017–18 but compliance with the water market and water charge rules is generally good xxix
1. Drought and water deliverability challenges loomed 21.1 Seasonal conditions were drier than in previous years 2
1.2 Water availability declined 3
1.3 Most trading zones saw record water allocation trade volumes and higher prices 8
1.4 Southern Murray–Darling Basin water entitlement prices reached record highs 9
1.5 New South Wales introduced subsidies for fixed charges due to drought conditions 12
1.6 Energy prices remained a concern for irrigators and water infrastructure operators, particularly in pressurised systems 12
1.7 Changing cropping choices are placing a premium on high reliability water 13
1.8 Mass fish deaths in the Lower Darling in late 2018 and early 2019 increased pressure on governments and water managers 15
2. Murray–Darling Basin policy, legal and governance arrangements were widely reviewed and evaluated 202.1 Compliance concerns in New South Wales led to commitments to improve monitoring and enforcement across the Murray–Darling Basin 20
2.2 The Murray–Darling Basin Authority and Productivity Commission found issues with the Basin Plan’s impact and implementation 26
2.3 Other inquiries examined water governance, management and service delivery and recommended changes 30
2.4 The Australian Minister for Agriculture and Water Resources revised the water charge rules 34
3. Murray–Darling Basin water markets are growing, with potential for improvement 383.1 Murray–Darling Basin water market effectiveness has improved since 2007 but market functioning has room for improvement 39
iv Water monitoring report 2017–18
3.2 Water markets are driving the emergence of more complex water products and business models 40
3.3 There are concerns about the reliability of reported price data 43
3.4 Allocation trade within irrigation infrastructure operators’ districts declined 44
3.5 Increases in water delivery right trade were strongly influenced by four networks 47
4. Transformation and termination volumes declined again 504.1 Transformation contributes to effective water markets, but large volumes of irrigation rights remain untransformed 50
4.2 Termination activity declined, and operators imposed termination fees on all reported transactions 58
5. On-river infrastructure operators’ charges reflected regulators’ efforts to rebalance charging arrangements and increase cost recovery 665.1 Most on-river infrastructure operators charges are set by regulators under the water charge rules or Basin state frameworks 67
5.2 Carryover water and use of fixed charges reduced the impact of a dry year on operators 70
5.3 More hypothetical bills fell in the southern Murray–Darling Basin 75
5.4 Northern Murray–Darling Basin hypothetical bills showed significant decreases in New South Wales but not Queensland 79
6. Most hypothetical bills for pressurised irrigation networks increased modestly 846.1 Dry, hot conditions prevailed but water deliveries by off-river IOs increased 84
6.2 Charging arrangements responded to service changes, cost increases and regulatory requirements 85
6.3 Hypothetical bills varied greatly but generally increased, especially in pressurised networks 87
7. Basin states’ approaches to water planning and management continue to vary 1087.1 Basin states’ water planning and management regimes continue to evolve 109
7.2 Basin states’ apply varying approaches to water planning and management, guided by the National Water Initiative 110
7.3 Contributions to Murray–Darling Basin Authority joint program funding continued to rise 121
8. Operators largely complied with water market and water charge rules 1248.1 Compliance issues outside of the ACCC’s role received a lot of attention across the Murray–Darling Basin 125
8.2 While complaints and enquiries rose, we did not identify any rule breaches resulting in serious detriment 125
8.3 We use our resources to build a culture of compliance 127
8.4 We will support IOs to comply with new rule requirements 128
9. Our monitoring in the Murray–Darling Basin helps water and related markets function effectively 1329.1 The Water Act 2007 requires us to monitor in the Murray–Darling Basin 132
9.2 Sources of information for the report 134
vWater monitoring report 2017–18
Tables and chartsTables
Table 1.1: Annual change in water allocations in the southern and northern Murray–Darling Basin, 2009–10 to 2017–18 7
Table 3.1: Percentage of trades with prices reported, 2014–15 to 2017–18 44
Table 3.2: Off-river irrigation infrastructure operator networks allocation trade history, 2013–14 to 2017–18 46
Table 3.3: Proportion of water delivery rights traded in selected networks, 2013–14 to 2017–18 47
Table 3.4: Total water delivery rights traded as a proportion of water delivery rights held, 2013–14 to 2017–18 48
Table 4.1: Transformation processing fees, 2017–18 58
Table 4.2: Number and volume of terminations, off-river infrastructure operators that can effect transformation and joint water supply schemes 59
Table 4.3: Number and volume of terminations, Goulburn–Murray Water and Lower Murray Water 60
Table 4.4: Volume of irrigation rights transformed and water delivery rights terminated, 2009–10 to 2017–18 61
Table 4.5: Terminations and transformations by proportion of water delivery right terminated or irrigation right transformed, 2017–18 61
Table 5.1: Water access rights and delivery volumes, by operator 72
Table 5.2: Hypothetical bills for the southern Murray–Darling Basin 75
Table 5.3: Hypothetical bills for the northern Murray–Darling Basin 79
Table 6.1: Changes in characteristics of off-river infrastructure operators, 2017–18 88
Table 6.2: Hypothetical bills per ML from off-river infrastructure operators for customers in pressurised networks, 2017–18 89
Table 6.3: Hypothetical bills per ML from off-river infrastructure operators for customers in gravity fed networks, 2017–18 90
Table 8.1: Complaints and enquiries received from water stakeholders, 2011–12 to 2017–18 126
Charts
Chart S.1: Water allocation volumes traded into, out of and within networks as a proportion of total water volumes delivered, 2017–18 xxii
Chart S.2: Proportion of irrigation rights transformed between July 2009 and July 2018 xxiii
Chart S.3: Terminations by imposition of termination fee, 2012–13 to 2017–18 xxiv
Chart S.4: Year-on-year change in nominal terms for hypothetical bills in pressurised networks, 2017–18 xxvi
Chart S.5: Year-on-year change in nominal terms for hypothetical bills in gravity fed networks, 2017–18 xxvii
Chart 1.1: Mean temperature deciles in the Murray–Darling Basin, 2017–18 3
Chart 1.2: Rainfall deciles in the Murray–Darling Basin, 2017–18 4
Chart 1.3: Water storage levels in the Murray–Darling Basin (New South Wales, Victoria and Queensland), 2001 to 2018 5
Chart 1.4: Water allocated to major southern Murray–Darling Basin entitlement holder types, 1998–99 to 2017–18 6
Chart 1.5: Water allocation and carryover in the southern Murray–Darling Basin, 2007–08 to 2017–18 7
Chart 1.6: Southern connected Murray–Darling Basin water allocation market trade value in nominal terms and volume, 2009–10 to 2017–18 9
vi Water monitoring report 2017–18
Chart 1.7: Southern connected Murray–Darling Basin high security/reliability entitlement market summary in nominal terms, 2010–11 to 2017–18 10
Chart 1.8: Southern connected Murray–Darling Basin general security/low reliability entitlement market summary in nominal terms, 2010–11 to 2017–18 11
Chart 1.9: Almond prices, 2008 to 2017, in nominal terms 15
Chart 3.1: Water allocation volumes traded into, out of and within networks, as a proportion of total water volume delivered, 2017–18 45
Chart 4.1: Number and volume of transformations, 2009–10 to 2017–18 51
Chart 4.2: Proportion of irrigation rights transformed between July 2009 and July 2018 52
Chart 4.3: Australian Government environmental water acquisitions and net decrease in irrigation rights, 2009–10 to 2017–18 53
Chart 4.4: Number of transformations as a proportion of irrigation right transformed, 2010–11 to 2017–18 54
Chart 4.5: Transformations as a proportion of irrigation right transformed for New South Wales and South Australian infrastructure operators, 2010–11 to 2017–18 55
Chart 4.6: Median days to process a transformation application in South Australia and New South Wales, 2009–10 to 2017–18 56
Chart 4.7: Range of transformation processing times in New South Wales and South Australia, 2017–18 57
Chart 4.8 Number of transformation and/or termination transactions, 2009–10 to 2017–18 62
Chart 4.9: Terminations by imposition of termination fee, 2012–13 to 2017–18 63
Chart 5.1: Southern Murray–Darling Basin hypothetical bill charge components, 2017–18 (nominal) 73
Chart 5.2: Northern Murray–Darling Basin hypothetical bill charge components, 2017–18 (nominal) 74
Chart 5.3: Southern Murray–Darling Basin hypothetical bill changes with 1000 ML of water entitlements for 50 per cent and 100 per cent water delivery (nominal) 77
Chart 5.4: Northern Murray–Darling Basin hypothetical bill changes with 1000 ML of water entitlements for 50 per cent and 100 per cent water delivery (nominal) 81
Chart 6.1: Hypothetical bills in pressurised networks by charge category, 2017–18 (250 ML entitlement) 92
Chart 6.2: Hypothetical bills in gravity fed networks by charge category, 2017–18 (250 ML entitlement) 93
Chart 6.3: Total bill breakdown into fixed and variable charges by charge category, network type and irrigation network, 2017–18 (250 ML entitlement) 94
Chart 6.4: Year-on-year percentage change in total hypothetical bills in nominal terms for pressurised networks, by irrigation network, 2017–18 (250 ML entitlement) 97
Chart 6.5: Year-on-year percentage change in nominal terms for total hypothetical bills in gravity fed networks by irrigation network, 2017–18 (250 ML entitlement) 98
Chart 6.6: Year-on-year change in nominal terms for water planning and management, on-river and off-river charges—pressurised networks, 2017–18 (for 250 ML entitlement) 100
Chart 6.7: Year-on-year changes in nominal terms for water planning and management, on-river and off-river charges—gravity fed networks, 2017–18 (for 250 ML entitlement) 101
Chart 6.8: Hypothetical bills over time for pressurised networks in real terms, 2009–10 to 2017–18 (250 ML entitlement) 103
Chart 6.9: Hypothetical bills over time for Victorian gravity fed networks in real terms, 2009–10 to 2017–2018 (for 250 ML entitlement) 104
Chart 6.10: Hypothetical bills over time in New South Wales and Queensland gravity fed networks in real terms, 2009–10 to 2017–18 (for 250 ML entitlement) 105
viiWater monitoring report 2017–18
Chart 7.1: Aggregate water planning and management costs and revenue in real terms, by cost and activity type, 2016–17 and 2017–18 112
Chart 7.2: New South Wales’ water planning and management costs, revenue, and cost recovery in real terms, 2013–14 to 2017–18 115
Chart 7.3: Victoria’s state-wide water planning and management expenditure in real terms, 2013–14 to 2017–18 116
Chart 7.4: Victoria’s Murray–Darling Basin water planning and management revenue in real terms, 2013–14 to 2017–18 117
Chart 7.5: South Australia’s water planning and management costs, revenue and cost recovery rate in real terms, 2013–14 to 2017–18 118
Chart 7.6: Queensland’s Murray–Darling Basin water planning and management revenue in real terms, 2013–14 to 2017–18 119
Chart 7.7: Australian Capital Territory’s water planning and management costs, revenue and cost recovery rate in real terms 2013–14 to 2017–18 120
Chart 7.8: Jurisdictions’ contributions to Murray–Darling Basin Authority joint program funding in nominal terms, 2010–11 to 2017–18 121
viii Water monitoring report 2017–18
AbbreviationsABARES Australian Bureau of Agricultural and Resource Economics and Sciences
ABC Australian Broadcasting Corporation
ABS Australian Bureau of Statistics
ACCC Australian Competition and Consumer Commission
ACL Australian Consumer Law
ALP Australian Labor Party
ATO Australian Taxation Office
AWBA Australian Water Brokers Association
BRC Dumaresq–Barwon Border Rivers Commission
CCA Competition and Consumer Act 2010 (Cth)
CICL Coleambally Irrigation Cooperative Limited
CIT Central Irrigation Trust
COAG Council of Australian Governments
CPI consumer price index
DELWP Victorian Department of Environment, Land, Water and Planning
DEWNR South Australian Department of Environment, Water and Natural Resources
DNRM Queensland Department of Natural Resources and Mines (DNRME since December 2017)
DNRME Queensland Department of Natural Resources, Mines and Energy
DOI Water Department of Industry (Water) (NSW)
DSEWPAC Department of Sustainability, Environment, Water Population and Communities
EPSDD ACT Environment, Planning and Sustainable Development Directorate
ESCOSA Essential Services Commission of South Australia
ESCV Essential Services Commission (Victoria)
EWH environmental water holder
GL gigalitre (one billion litres)
GMW Goulburn–Murray Water
GWMWater Grampians Wimmera Mallee Water
GS general security
HP high pressure
HPID Hay Private Irrigation District
HS high security
ICD irrigation corporation and district
IHS integrated horticulture supply
IIO irrigation infrastructure operator
IO infrastructure operator
IPART Independent Pricing and Regulatory Tribunal (NSW)
IR irrigation right
ixWater monitoring report 2017–18
IVT Inter-Valley Transfer
JWSS Joint Water Supply Scheme
KL kilolitres
LAW Large area supply Wah Wah excluding IHS
LAS large area supply
LTAAY The average annual yield
LMW Lower Murray Water
LP low pressure
LTAAY long term average annual yield
MDB Murray–Darling Basin
MDBA Murray–Darling Basin Authority
MI Murrumbidgee Irrigation Limited
MIL Murray Irrigation Limited
MJA Marsden Jacob Associates
ML megalitre (one million litres)
MP medium pressure
MPID Moira Private Irrigation District
NIBM Narromine Irrigation Board of Management
NRAR Natural Resources Access Regulator
NRM national resources management
NWC National Water Commission
NWI National Water Initiative
off-river IO off-river infrastructure operator
on-river IO on-river infrastructure operator
PC Productivity Commission
PIIOP Private Irrigation Infrastructure Operators Program (NSW)
QCA Queensland Competition Authority
RIT Renmark Irrigation Trust
RMO River Murray Operations
SACOME South Australian Chamber of Mines and Energy
SAMDB South Australia Murray–Darling Basin
SAS small area supplies
SDL sustainable diversion limit
TNAC total network access charge
VWAP volume weighted average prices
WAE water access entitlement
WAL water access licence
WC West Corurgan
WCIR Water Charge (Infrastructure) Rules 2010
WCTFR Water Charge (Termination Fees) Rules 2009
x Water monitoring report 2017–18
WDR water delivery right
WMI Western Murray Irrigation Limited
WPM water planning and management
WRP Water Resource Plan
xiWater monitoring report 2017–18
GlossaryBasin plan A high level framework on which the Australian Government and Basin
States agreed, and that sets standards for the management of the Murray–Darling Basin’s water resources in a coordinated and sustainable way in collaboration with the community. Officially known as the Basin Plan 2012.
Basin Plan Water Trading Rules (BPWTR)
Rules set out in Part 12 of the Basin Plan that relate to the trade or transfer of tradeable water rights. The rules commenced on 1 July 2014 and are enforced by the Murray–Darling Basin Authority.
Basin states
Basin state agencies
New South Wales, Victoria, Queensland, South Australia, the ACT
Basin State departments and water authorities.
bulk water charge A charge payable for either (or both) the storage of water for, or the delivery of water to:
(i) infrastructure operators
(ii) other operators of reticulated water systems
(iii) other persons (including private diverters and environmental water holders).
carryover Arrangements that allow water entitlement holders to hold allocated water in storages so it is available in subsequent years.
conveyance water Water required primarily to operate regulated rivers and utility supply networks to enable the delivery of water.
gravity-fed irrigation system
An irrigation system comprising channels and/or pipes that relies on the movement of water due to the force of gravity.
infrastructure charge Charges that infrastructure operators impose for access to their water service infrastructure, and for services provided in relation to that access.
infrastructure operator (IO)
Any person or entity that owns or operates infrastructure for one or more of the following purposes:
(i) the storage of water
(ii) the delivery of water
(iii) the drainage of water
for providing a service to someone who does not own or operate the infrastructure.
irrigation infrastructure operator (IIO)
An infrastructure operator that owns or operates water service infrastructure for delivering water for the primary purpose of irrigation.
irrigation network As defined in s. 7(4) of the Water Act 2007, the water service infrastructure of an irrigation infrastructure operator. In practice, an irrigation network typically constitutes a network of carriers (open channels, pipes and/or natural waterways) that convey water from a water source through customer service points to customer properties. It may be either a gravity fed network (typically using channels and/or natural waterways) or a pressurised network (using pipes).
irrigation right A person’s right against an IIO to receive water, which is not a water access right or a water delivery right. It usually can be transformed into a water access entitlement.
infrastructure service Access, or a service provided in relation to access, to water service infrastructure. It includes the storage, delivery, drainage and taking of water.

xii Water monitoring report 2017–18
joint water supply schemes
Similar to cooperatives where the members form and run an organisation to deliver water to irrigators.
non-volumetric charge A charge that does not reference a volume of a water right—for example, a charge that is levied per account, per outlet or per meter.
off-river infrastructure service/off-river infrastructure operator
The storage, delivery and/or drainage of water diverted from a natural watercourse through a network consisting of channels and/or pipes (which can be gravity fed or pressurised) to another person. An operator providing such services is an off-river infrastructure operator.
on-river infrastructure service/on-river infrastructure operator
Harvesting and storing water through infrastructure such as dams, lakes, weirs and reservoirs located primarily on a natural watercourse, and delivering water, primarily through natural watercourses. An operator providing such services is an on-river infrastructure operator.
private diverter An irrigator that extracts water directly from a natural watercourse (either a regulated or unregulated river).
pressurised irrigation system
A piped irrigation system that usually requires on water pressure for the system to work and requires pumps to pressurise the water.
regulated water charge A water charge to which any of these three sets of water charge rules applies:
�� Water Charge (Infrastructure) Rules
�� Water Charge (Planning and Management Information) Rules
�� Water Charge (Termination Fees) Rules.
See s. 91 of the Water Act 2007 for a full definition.
southern connected Murray–Darling Basin
Refers to the southern Murray–Darling Basin catchments that are hydrologically connected and water can be traded between any of these catchments (subject to trade limits).
termination When a person terminates or surrenders the whole or part of a right of access to an IIO’s network, typically by terminating a water delivery right.
termination fee A fee that an IIO may impose when an irrigator terminates.
the Act Water Act 2007 (Cth)
total network access charge
Amount on which the termination fee multiple is applied to calculate a maximum termination fee. It is the sum of all amounts that would have been payable for access to an operator’s irrigation network by an irrigator for a full financial year if termination or surrender had not occurred, excluding:
�� any amount for the amount of water actually delivered to the terminating irrigator (that is, variable irrigation network charges)
�� any amount for the storage of water
�� connection/disconnection fees
�� any amount that exceeds the cost of providing irrigators with access to an operator’s irrigation network
�� fees under ACCC approved contracts.
tradeable water right One of:
(i) water access rights
(ii) water delivery rights
(iii) irrigation rights.
xiiiWater monitoring report 2017–18
transformation Process by which an irrigator permanently transforms their entitlement to water under an irrigation right against an IIO into a water access entitlement held by the irrigator (or anybody other than the IIO), thereby reducing the volume (for example, the share component) of the operator’s water access entitlement.
volumetric charge Charge based on the volume of a water right or physical amount of water. A fixed volumetric charge is a charge based on the volume of a water right held, while a variable volumetric charge is a charge based on the volume of the right that is used in a particular manner.
water access entitlement Perpetual or ongoing entitlement, by or under a law of a state, to exclusive access to a share of the water resources of a water resource plan area.
water access entitlement trade
Change of ownership and/or location of a water access entitlement (including through the establishment of a tagging arrangement).
water access right Any right conferred by or under a law of a state to hold and/or take water from a water resource, including:
�� stock and domestic rights
�� riparian rights
�� a water access entitlement
�� a water allocation.
water allocation Specific volume of water allocated to water access entitlements in a given water accounting period.
water allocation trade Change of ownership and/or location of a particular volume of water allocation.
watercourse A river, creek or other natural watercourse (whether modified or not) in which water is contained or flows (whether permanently or intermittently). It may be a:
(i) a dam or reservoir that collects water flowing in a watercourse
(ii) a lake or wetland through which water flows
(iii) a channel into which the water of a watercourse has been diverted
(iv) part of a watercourse
(v) an estuary through which water flows.
Water Charge (Infrastructure) Rules 2010 (WCIR)
Rules for fees and charges payable to an infrastructure operator for:
�� bulk water charges
�� access to the IIO’s network, or services provided in relation to that access
�� matters specified in regulations made under s. 91(1)(d) of the Water Act 2007.
Water Charge (Planning and Management Information) Rules 2010 (WCPMIR)
Rules relating to charges for water planning and water management activities in the Murray–Darling Basin, and requiring the publication of the charge details and the process for determining the charge.
Water Charge (Termination Fees) Rules 2009 (WCTFR)
Rules for fees or charges payable to an IIO in relation to terminating access to an operator’s irrigation network (or services relating to such termination), or surrendering a right to delivery of water through the operator’s irrigation network.
water delivery right (WDR)
Right to have water delivered by an infrastructure operator. It typically represents the holder’s right of access to an irrigation network (there may also be a right to drainage), and can be terminated.
xiv Water monitoring report 2017–18
Water Market Rules/2009 (WMR)
Rules dealing with actions or omissions of an IIO that prevent or unreasonably delay transformation arrangements or trade of the resulting water access entitlement.
water service infrastructure
Infrastructure for one or more of the following purposes:
(i) the storage of water
(ii) the delivery of water
(iii) the drainage of water
for providing a service to another person.
xvWater monitoring report 2017–18
1 Document title
Photo © Victoria International Container Terminal 2017. Photo supplied by Victoria International Container Terminal Limited.
Water Monitoring Report 2017–18
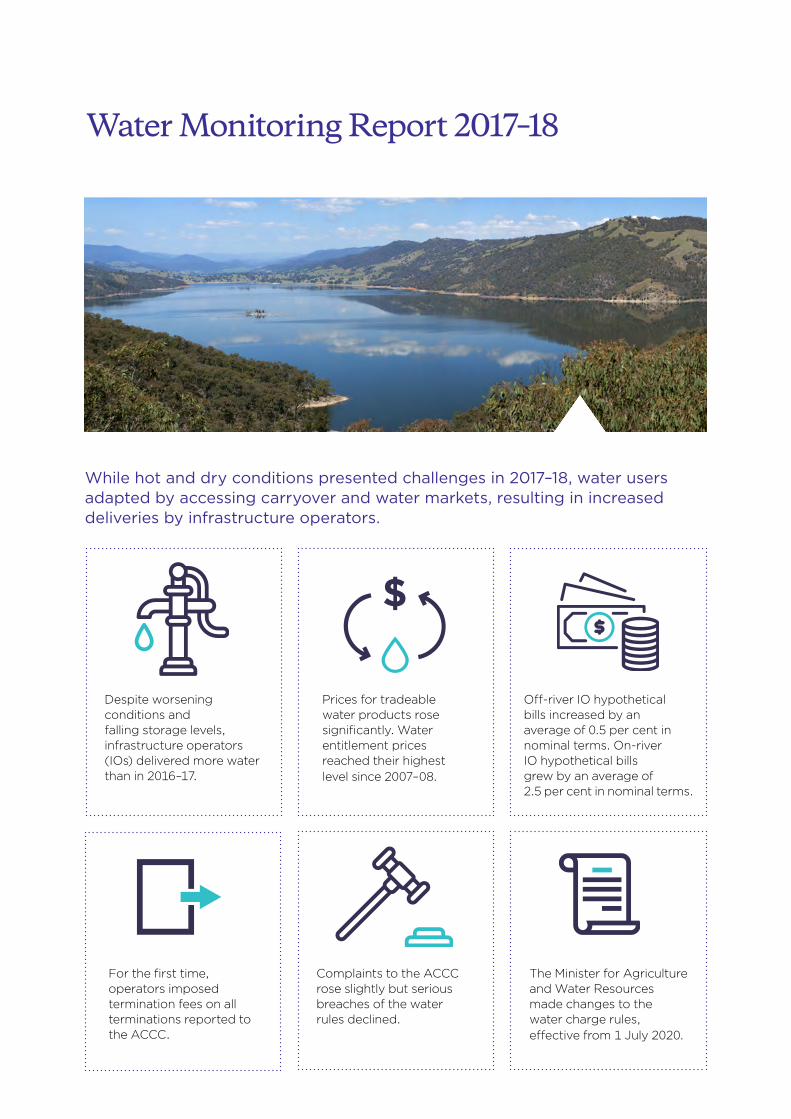
The Minister for Agriculture and Water Resources made changes to the water charge rules, effective from 1 July 2020.
For the first time, operators imposed termination fees on all terminations reported to the ACCC.
Prices for tradeable water products rose significantly. Water entitlement prices reached their highest level since 2007–08.
Off-river IO hypothetical bills increased by an average of 0.5 per cent in nominal terms. On-river IO hypothetical bills grew by an average of 2.5 per cent in nominal terms.
Complaints to the ACCC rose slightly but serious breaches of the water rules declined.
Despite worsening conditions and falling storage levels, infrastructure operators (IOs) delivered more water than in 2016–17.
$
While hot and dry conditions presented challenges in 2017–18, water users adapted by accessing carryover and water markets, resulting in increased deliveries by infrastructure operators.
xvi Water monitoring report 2017–18
Key market results 2017–18
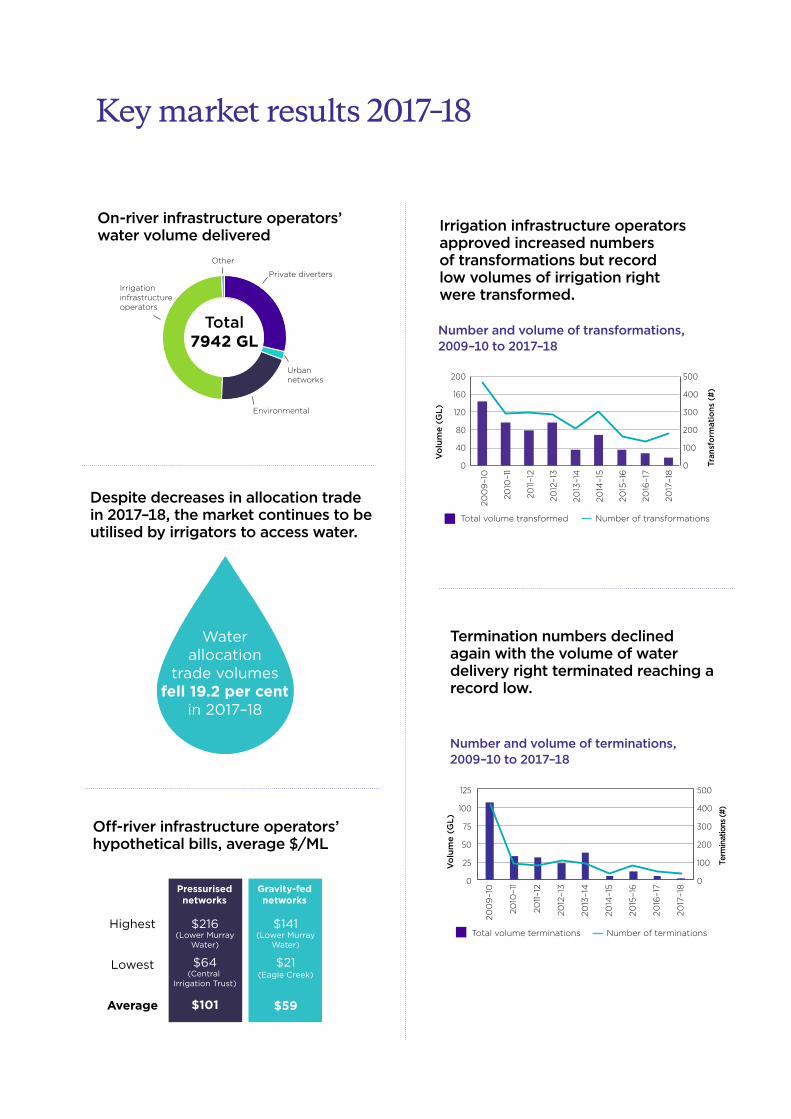
On-river infrastructure operators’ water volume delivered
Private diverters
Urbannetworks
Environmental
Irrigationinfrastructureoperators
Other
Total7942 GL
Waterallocation
trade volumesfell 19.2 per cent
in 2017–18
Despite decreases in allocation trade in 2017–18,
the market continues to be utilised by irrigators to
access water.
Despite decreases in allocation trade in 2017–18, the market continues to be utilised by irrigators to access water.
Off-river infrastructure operators’ hypothetical bills, average $/ML
Highest
Lowest
Average
$216(Lower Murray
Water)
$64(Central
Irrigation Trust)
$101
$141(Lower Murray
Water)
$21(Eagle Creek)
$59
Pressurisednetworks
Gravity-fednetworks
Irrigation infrastructure operators approved increased numbers of transformations but record low volumes of irrigation right were transformed.
200
9–1
0
2010
–11
2011–
12
2012
–13
2013
–14
2014
–15
2015
–16
2016
–17
2017
–18
Vo
lum
e (G
L)
Tran
sfor
mat
ions
(#)
Total volume transformed Number of transformations
0
40
80
120
160
200
0
100
200
300
400
500
Termination numbers declined again with the volume of water delivery right terminated reaching a record low.
Number and volume of terminations, 2009–10 to 2017–18
200
9–1
0
2010
–11
2011–
12
2012
–13
2013
–14
2014
–15
2015
–16
2016
–17
2017
–18
Vo
lum
e (G
L)
Term
inat
ions
(#)
Total volume terminations Number of terminations
0
100
200
300
400
500
0
25
50
75
100
125
Number and volume of transformations, 2009–10 to 2017–18
xviiWater monitoring report 2017–18
Key market results 2017–18
On-river infrastructure operators’ water volume delivered
Private diverters
Urbannetworks
Environmental
Irrigationinfrastructureoperators
Other
Total7942 GL
Waterallocation
trade volumesfell 19.2 per cent
in 2017–18
Despite decreases in allocation trade in 2017–18,
the market continues to be utilised by irrigators to
access water.
Despite decreases in allocation trade in 2017–18, the market continues to be utilised by irrigators to access water.
Off-river infrastructure operators’ hypothetical bills, average $/ML
Highest
Lowest
Average
$216(Lower Murray
Water)
$64(Central
Irrigation Trust)
$101
$141(Lower Murray
Water)
$21(Eagle Creek)
$59
Pressurisednetworks
Gravity-fednetworks
Irrigation infrastructure operators approved increased numbers of transformations but record low volumes of irrigation right were transformed.
200
9–1
0
2010
–11
2011–
12
2012
–13
2013
–14
2014
–15
2015
–16
2016
–17
2017
–18
Vo
lum
e (G
L)
Tran
sfor
mat
ions
(#)
Total volume transformed Number of transformations
0
40
80
120
160
200
0
100
200
300
400
500
Termination numbers declined again with the volume of water delivery right terminated reaching a record low.
Number and volume of terminations, 2009–10 to 2017–18
200
9–1
0
2010
–11
2011–
12
2012
–13
2013
–14
2014
–15
2015
–16
2016
–17
2017
–18
Vo
lum
e (G
L)
Term
inat
ions
(#)
Total volume terminations Number of terminations
0
100
200
300
400
500
0
25
50
75
100
125
Number and volume of transformations, 2009–10 to 2017–18
Key findingsDrought and water deliverability challenges emerged in 2017–18�� The majority of the Murray–Darling Basin (MDB) experienced mean temperatures very much above
the long-term average with rainfall below average for the year.
�� Most water trading zones experienced record water allocation trade volumes. Prices for water allocations rose, with record water access entitlement prices in the southern MDB.
�� In the southern MDB, water storage levels fell. Water allocated to entitlements was also lower, but water carried over from previous years helped to offset lower allocations. The use of carryover and water markets more generally, are aimed at facilitating water market participants to manage risk.
�� Energy input costs remained a concern for irrigators and infrastructure operators, particularly in pressurised systems. But new forms of energy contracting are emerging, with at least one infrastructure operator reporting success in reducing energy costs.
�� The expansion of perennial crops such as almonds continued. As these plantations expand further, water requirements in the Lower Murray River may increase.
There was widespread debate and many reviews of water policy and governance arrangements in the Murray–Darling Basin�� During 2017–18 and post 2018 MDB policy, legal and governance arrangements continued to
generate widespread debate and attract public scrutiny. Governments initiated or concluded many major inquiries and policy reviews, including a Royal Commission in South Australia.
�� The series of mass fish deaths in late 2018 and early 2019 in the Lower Darling River received considerable media attention and increased public focus on management of the Menindee Lakes and on the Murray–Darling Basin Plan and Murray–Darling Basin Agreement.
The Minister announced changes to the water charge rules�� The ACCC provided advice to the Australian Minister for Agriculture and Water Resources on
amendments to the water charge rules in 2016.
�� On 3 April 2019, the Minister amended the water charge rules based on the ACCC advice to increase transparency by requiring IOs to provide customers with more information on infrastructure charges, water planning and management charges and termination fees. Regulation of on-river infrastructure operators will return to Basin state regulatory frameworks except in specific circumstances. The changes will combine the existing three sets of water charge rules into one and commence on 1 July 2020.
�� The Minister did not accept the ACCC’s recommendations to strengthen non-discrimination requirements, reform the current regulation of distributions, or remove the right of private action. The ACCC supported expanded non-discrimination provisions as being consistent with and contributing to the achievement of the Basin Water Charging Objectives and Principles—in particular, to the achievement of ‘user pays’, full cost recovery and avoiding perverse or unintended pricing outcomes.
Transformation, termination and trade volumes were down, but MDB water markets continue to increase in sophistication, depth, volume, value and efficiency�� The number of transformation applications increased by 32 per cent from 2016–17 but the volume
of irrigation rights transformed was a record low of 17 GL. The total volume of irrigation rights transformed as a percentage of the total volume of irrigation rights as of 1 July 2009 remained around 18 per cent.
xviii Water monitoring report 2017–18
�� The number and volume of water delivery rights terminated in 2017–18 were the lowest reported since ACCC monitoring commenced in 2009, with all terminations having termination fees imposed for the first time since monitoring began.
�� The volume of water delivery right trade increased by 10 per cent in 2017–18. This reflected large trades within Murrumbidgee Irrigation Limited and Jemalong, with four off-river infrastructure operators (IOs) accounting for the bulk of water delivery right trade.
�� Trade activity for allocations within IO networks monitored by the ACCC declined in 2017–18 by 20 per cent, with a net export of water from the monitored networks.
Some on-river hypothetical bills increased while others decreased�� The six on-river IOs delivered 9 per cent more water in 2017–18 than the previous year, partly driven
by the delivery of carryover water.
�� In aggregate, hypothetical bills calculated by the ACCC for these on-river IOs increased by around 2.5 per cent in nominal terms.
�� For those hypothetical bills that showed increases, Goulburn–Murray Water’s Bullarook, Broken and Ovens systems in the southern MDB all increased by 12 per cent in nominal terms, while Murray Irrigation Limited’s high security increased by 25 per cent. In July 2018 deteriorating conditions saw the New South Wales Government announce a drought relief package that included fixed charge rebates for many water users.
Off-river hypothetical bills continue to increase for the majority of networks�� In aggregate, the average growth between 2016–17 and 2017–18 in hypothetical bills for pressurised
systems was around 5 per cent, while for gravity fed networks it was less than 1 per cent in nominal terms.
Basin states’ spending trends varied�� In 2017–18 spending in water planning and management increased in New South Wales and Victoria,
was stable in South Australia, and decreased in the ACT.
Compliance with water market and water charge rules is generally good�� Compliance with the water market rules and water charge rules (the Rules) is generally good. We
found no breaches of the Rules or Australian Consumer Law that resulted in serious detriment to irrigators or other stakeholders. We will continue to work with irrigators and IOs to educate them about their rights and responsibilities, and the need for compliance with the Rules (including amendments), to ensure transparency of regulated water charges and stakeholder confidence in the water market.
�� During the year, we received 14 complaints and inquiries regarding the Rules, IOs and water market intermediaries, up from 10 in the previous year. In 2017–18, we conducted three initial investigations into possible breaches of the water charge rules and two possible Australian Consumer Law breaches (one on-going).
xixWater monitoring report 2017–18
SummaryThe ACCC’s role in the Murray–Darling Basin
The ACCC has a number of compliance and advisory roles in the Murray–Darling Basin, including monitoring regulated water charges, transformations and terminations. It also produces an annual report for the Australian Minister for Water Resources, Drought, Rural Finance, Natural Disaster and Emergency Management. This is our ninth report.
Both on and off-river infrastructure operators (IOs) are regarded as monopolies. This is because competition is unlikely to develop between these IOs as they operate in geographically exclusive markets for water harvesting, storage and/or delivery services. Our monitoring helps highlight where IOs may be exercising their market power over irrigators and other customers and assists policy makers to determine the appropriate form of regulation for these monopolies.
We also facilitate effective water (and related) markets by monitoring and enforcing compliance with the water charge and water market rules. Due to their monopoly position, IOs are in a position, and have incentive, to prevent or unreasonably delay trade or transformation requests and increase the cost of termination.
There are a number of other Commonwealth and Basin State regulatory measures that are directly relevant to water markets in the Murray–Darling Basin and the management of Basin water resources more generally. For example, the administration of water planning and management activities, the allocation and metering of water, and the trading of water are primarily undertaken by Basin State governments.
This report utilises a range of sources to assess the state of the water market and regulated water charges. We collect data from IOs and Basin states. We also use information from reports and other sources published by a number of Australian departments and agencies, academia and industry consultants.
Drought conditions began to emergeThe Murray–Darling Basin (MDB) region experienced generally warmer and drier weather during 2017–18, with drought like conditions emerging in many areas. Water storage levels in the southern MDB fell by 22 per cent and water allocated to entitlements was 28 per cent lower than the previous year. However, water carried over from 2016–17 lessened the impact of the decrease in allocations. As a result water deliveries by on and off-river infrastructure operators (IOs) increased by 9 and 17 per cent respectively. Carryover is an arrangement that allows a person to retain unused water allocation for use, or trade, in the following year. A person’s ability to carryover their unused water allocation is normally dependent on them holding sufficient water access entitlements in that network, and may be subject to adjustments to account of evaporation or other losses or the risk of being lost if storages spill. Carryover arrangements, in conjunction with water markets more generally, are designed to afford water holders improved flexibility in their water use and help to manage risk.
By the end of 2017–18 reduced water availability in New South Wales, along with ongoing dry conditions and poor seasonal forecasts led to areas of New South Wales being considered to be drought affected. The New South Wales Government announced a $500 million Emergency Drought Relief Package on 30 July 2018, including rebates of up to $4000 for the fixed charges components of bills. The majority of general security licence holders (95 per cent) will receive a rebate of the entire amount of fixed charges for 2017–18 bills.
Algal blooms from low water inflows and high temperatures led to a series of mass fish death events in the Lower Darling River in December 2018 and January 2019. This led to calls for a new round of water inquiries and a refocus on the management of the Menindee Lakes, the wider MDB and the Murray–Darling Basin Plan (Basin Plan).
xx Water monitoring report 2017–18
Some areas experienced record prices for traded water entitlementsThe southern connected MDB experienced record prices for most water entitlement types in 2017–18. Underpinning these prices were strong commodity prices and expanded growing area for crops such as cotton in the Murrumbidgee and Murray regions. Expansion of perennial cropping such as almonds continued, increasing concerns about future water deliverability. Demand and competition for irrigation water is driven primarily by the relative profitability of irrigated activities. Higher value crops such as perennial tree nuts are placing a premium on high and general security/reliability water entitlement prices.
In the northern New South Wales entitlement market, increases in general security entitlement prices were observed in the Lachlan, Namoi and Macquarie valleys over 2017–18. This can be attributed to more parcels being sold ‘wet’ with allocation water, strong prices for cotton, and growth of area planted of higher value permanent crops such as citrus and almonds in the Lower Lachlan Valley.
There was widespread debate and many reviews of water policy and governance arrangements in the Murray–Darling BasinDuring 2017–18 and into 2019, planned and ad hoc reviews and evaluations of the MDB policy and governance framework led to or foreshadowed further changes to policy settings and governance arrangements.
The inquiries commissioned following the allegations of water theft and corruption in New South Wales aired on the Australian Broadcasting Corporation’s Four Corners program in July 2017 have now reported their conclusions. In response to the Matthews Review, the New South Wales Government published its Water Reform Action Package. Reforms included the restructuring of the responsible department, the adoption of a new metering framework for irrigators and establishing the Natural Resources Access Regulator (NRAR)as an independent regulator with total carriage of the compliance and enforcement of water management legislation in New South Wales.
The Australian Senate’s inquiry into the integrity of the water market in the MDB reported in November 2018. While the final report acknowledged the majority of submissions supported the Basin Plan, it noted that that the integrity of the water market had been eroded by a lack of transparency with a diminished compliance and enforcement capability. Of concern to some stakeholders, the inquiry noted the lack of provisions for the shepherding of environmental water. The inquiry also supported separating the policy and compliance functions of the Murray–Darling Basin Authority (MDBA).
The South Australian Murray–Darling Basin Royal Commission reported flaws in the implementation of the Water Act 2007 (Cth) (Water Act) and the Basin Plan. The Royal Commission report and its recommendations were substantial. The report noted key aspects of the Basin Plan had not been enacted or implemented in accordance with the objects and purposes of the Water Act, and suggested the Basin Plan is not likely to achieve its objects and purposes or those of the Water Act.
The MDBA issued a formal response to the report, rejecting the commission’s view that the Basin Plan was unlawful or had been made unlawfully. It stated the report did not present any evidence to support the commission’s assertion of maladministration, negligence and unlawful conduct by MDBA officers. The MDBA recognised, however, that the Report ‘draws attention to some important issues’, consistent with the MDBA Report Card and the recent Productivity Commission review. Then Australian Minister for Agriculture and Water Resources, the Hon David Littleproud MP, also responded to the Royal Commission report, declaring the ‘Legal advice to the Commonwealth Government under both sides of politics for the last seven years has been consistent—that the Basin Plan is lawful and was lawfully made’.
xxiWater monitoring report 2017–18
A number of inquiries assessed the policy and governance arrangements in the MDB as well as the status of water reforms. The Productivity Commission’s first five-year assessment of Basin Plan implementation found progress has been made but reform will be required to navigate the complex and challenging upcoming period. Like the Australian Senate’s inquiry to the integrity of the water market in the MDB, the Productivity Commission recommended the MDBA be separated into two institutions—the MDB Agency, which would drive intergovernmental collaboration and strategic service delivery, and the Basin Plan Regulator, which would carry out the MBDA’s compliance and evaluation functions. The Productivity Commission also found that good progress has been made in implementing the National Water Initiative, but that further work remains.
Water charge rules changes move forwardOn 3 April 2019, the Australian Minister for Agriculture and Water Resources made changes to the water charge rules. The Minister had already accepted the ACCC’s advice to remove the requirements for some IOs to prepare network service plans, with this change coming into effect on 1 July 2017. The water charge rules provide for pricing transparency and a framework for the setting of some regulated charges affecting irrigators and rural water infrastructure operators in the MDB. The Minister’s changes followed the ACCC’s advice on amendments, provided in September 2016. The ACCC’s advice was targeted at reducing the regulatory burden, promoting efficient and sustainable use of water infrastructure, facilitating effective water markets and improving pricing transparency.
Under the Minister’s changes, the three existing sets of water charge rules will be combined into the Water Charge Rules 2010. Infrastructure operators will be required to include more information on their schedule of charges about pass-through charges, and to provide more information to their customers about termination fees, which will be calculated using only fixed volumetric charges. Amendments will also largely return price regulation of on-river infrastructure operators back to Basin states’ regulatory frameworks.
The Minister did not accept the ACCC’s advice on strengthening the current non-discrimination provisions or improvements to ensure financial and water distributions are made to customers in reflection of their contribution to the ongoing fixed costs of operating the infrastructure network. In particular, the ACCC had supported expanded non-discrimination provisions as being consistent with and contributing to the achievement of Basin Water Charging Objectives and Principles. In particular, it supported the achievement of ‘user pays’, full cost recovery and avoiding perverse or unintended pricing outcomes.
Although the Minister initially intended these changes to the water charge rules to commence on 1 July 2019, after further consultation, this was postponed until 1 July 2020. The additional time before the changes take effect will allow a smooth and efficient transition to the amended rules.
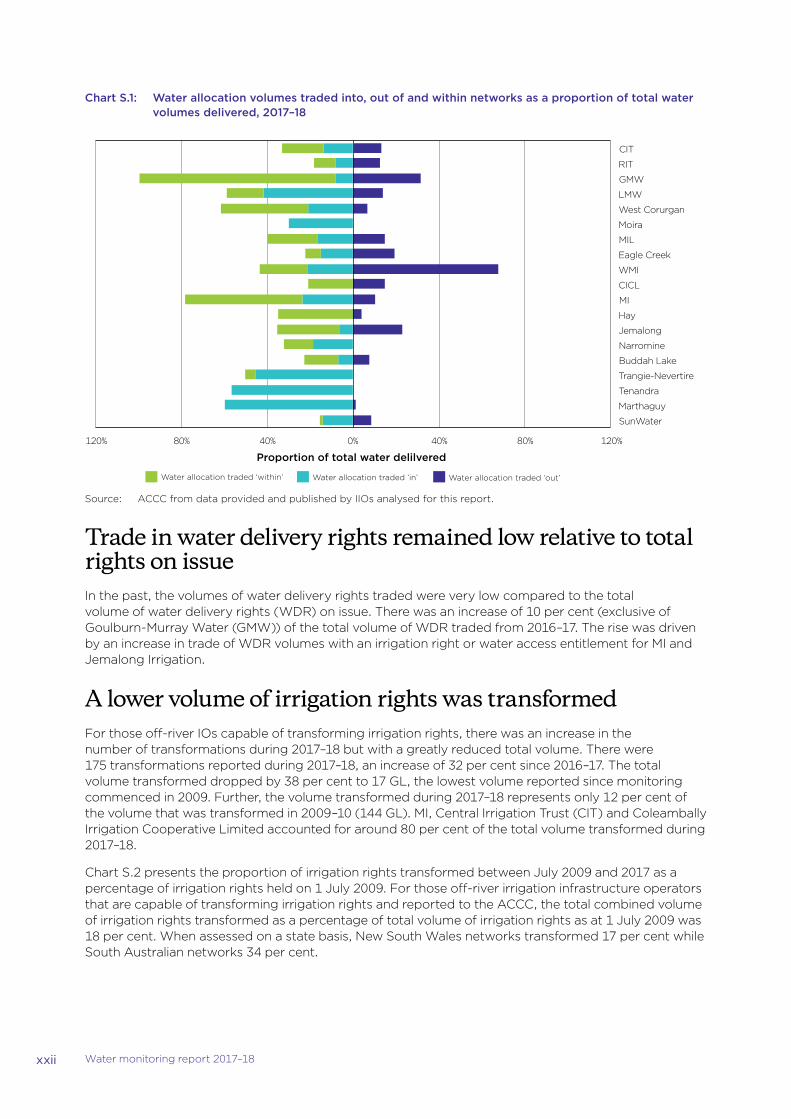
Allocation trade declinedTrade activity for allocations within IO networks monitored by the ACCC declined in 2017–18 by 19 per cent from 4600 GL to 3700 GL, with a net export out of water from the monitored networks. This volume of water was, however, 23 per cent lower than in 2016–17 (chart S.1).
Murrumbidgee Irrigation Limited (MI) and West Corurgan Private Irrigation District both changed from net exporters of water in 2016–17 to net importers in 2017–18. MI’s change was attributed to high demand for water in the region, especially from cotton growers. The West Corurgan increase was partly due to higher demand from irrigators sowing summer crops, and increases in plantings of other crops, such as maize and rice.
xxii Water monitoring report 2017–18
Chart S.1: Water allocation volumes traded into, out of and within networks as a proportion of total water volumes delivered, 2017–18
120% 80% 40% 0% 40% 80% 120%
CIT
RIT
GMW
LMW
West Corurgan
Moira
MIL
Eagle Creek
WMI
CICL
MI
Hay
Jemalong
Narromine
Buddah Lake
Trangie-Nevertire
Tenandra
Marthaguy
SunWater
Water allocation traded ‘out’Water allocation traded ‘in’ Water allocation traded ‘within’
Proportion of total water delilvered
Source: ACCC from data provided and published by IIOs analysed for this report.
Trade in water delivery rights remained low relative to total rights on issueIn the past, the volumes of water delivery rights traded were very low compared to the total volume of water delivery rights (WDR) on issue. There was an increase of 10 per cent (exclusive of Goulburn-Murray Water (GMW)) of the total volume of WDR traded from 2016–17. The rise was driven by an increase in trade of WDR volumes with an irrigation right or water access entitlement for MI and Jemalong Irrigation.
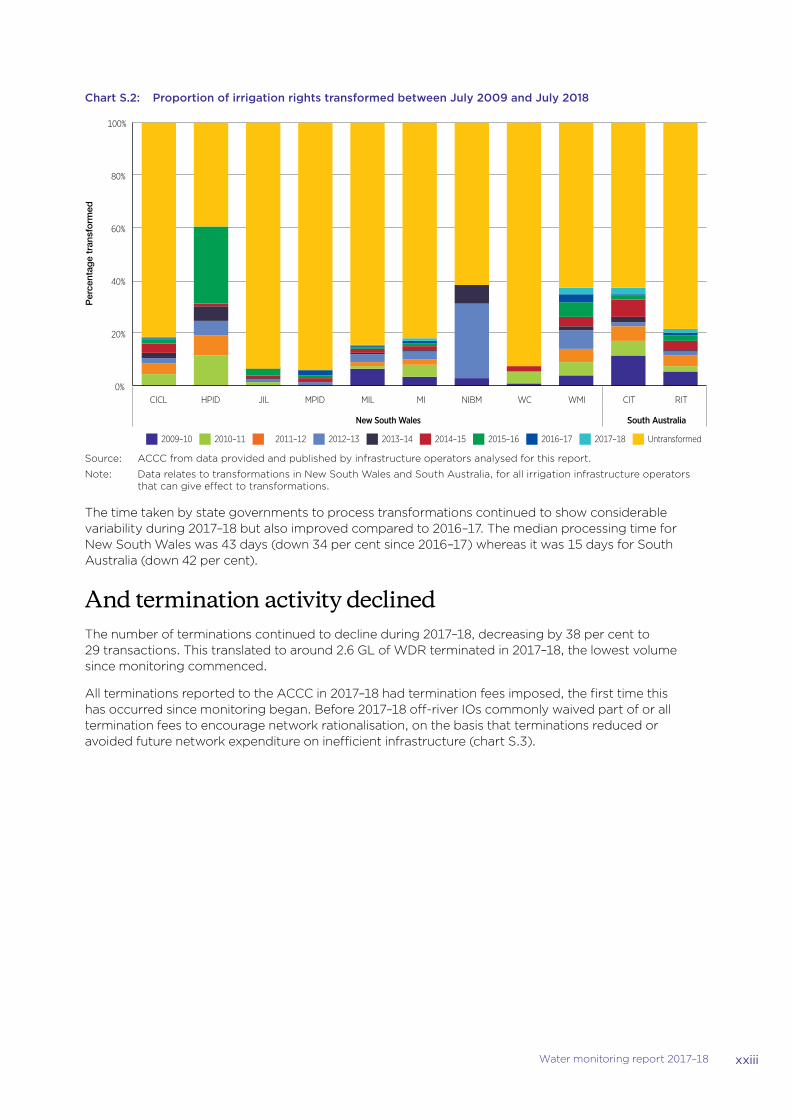
A lower volume of irrigation rights was transformedFor those off-river IOs capable of transforming irrigation rights, there was an increase in the number of transformations during 2017–18 but with a greatly reduced total volume. There were 175 transformations reported during 2017–18, an increase of 32 per cent since 2016–17. The total volume transformed dropped by 38 per cent to 17 GL, the lowest volume reported since monitoring commenced in 2009. Further, the volume transformed during 2017–18 represents only 12 per cent of the volume that was transformed in 2009–10 (144 GL). MI, Central Irrigation Trust (CIT) and Coleambally Irrigation Cooperative Limited accounted for around 80 per cent of the total volume transformed during 2017–18.
Chart S.2 presents the proportion of irrigation rights transformed between July 2009 and 2017 as a percentage of irrigation rights held on 1 July 2009. For those off-river irrigation infrastructure operators that are capable of transforming irrigation rights and reported to the ACCC, the total combined volume of irrigation rights transformed as a percentage of total volume of irrigation rights as at 1 July 2009 was 18 per cent. When assessed on a state basis, New South Wales networks transformed 17 per cent while South Australian networks 34 per cent.
xxiiiWater monitoring report 2017–18
Chart S.2: Proportion of irrigation rights transformed between July 2009 and July 2018P
erce
ntag
e tr
ansf
orm
ed
0%
20%
40%
60%
80%
100%
CICL HPID JIL MPID MIL MI NIBM WC WMI CIT RIT
New South Wales South Australia
2009–10 2010–11 2011–12 2012–13 2013–14 2014–15 2015–16 2016–17 2017–18 Untransformed
Source: ACCC from data provided and published by infrastructure operators analysed for this report.
Note: Data relates to transformations in New South Wales and South Australia, for all irrigation infrastructure operators that can give effect to transformations.
The time taken by state governments to process transformations continued to show considerable variability during 2017–18 but also improved compared to 2016–17. The median processing time for New South Wales was 43 days (down 34 per cent since 2016–17) whereas it was 15 days for South Australia (down 42 per cent).
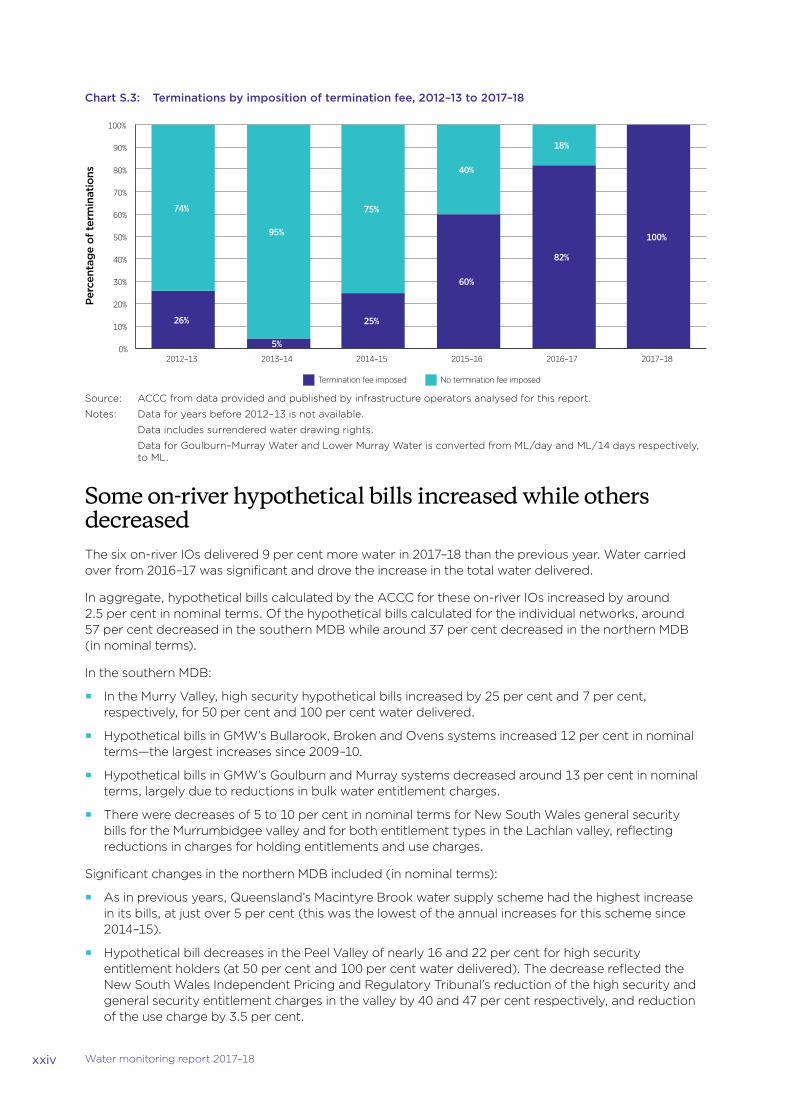
And termination activity declinedThe number of terminations continued to decline during 2017–18, decreasing by 38 per cent to 29 transactions. This translated to around 2.6 GL of WDR terminated in 2017–18, the lowest volume since monitoring commenced.
All terminations reported to the ACCC in 2017–18 had termination fees imposed, the first time this has occurred since monitoring began. Before 2017–18 off-river IOs commonly waived part of or all termination fees to encourage network rationalisation, on the basis that terminations reduced or avoided future network expenditure on inefficient infrastructure (chart S.3).
xxiv Water monitoring report 2017–18
Chart S.3: Terminations by imposition of termination fee, 2012–13 to 2017–18
26%
5%
25%
60%
82%
100%
74%
95%
75%
40%
18%
0%
10%
20%
30%
40%
50%
60%
70%
80%
90%
100%
2012–13 2013–14 2014–15 2015–16 2016–17 2017–18
Termination fee imposed No termination fee imposed
Perc
enta
ge
of t
erm
inat
ions
Source: ACCC from data provided and published by infrastructure operators analysed for this report.
Notes: Data for years before 2012–13 is not available.
Data includes surrendered water drawing rights.
Data for Goulburn–Murray Water and Lower Murray Water is converted from ML/day and ML/14 days respectively, to ML.
Some on-river hypothetical bills increased while others decreasedThe six on-river IOs delivered 9 per cent more water in 2017–18 than the previous year. Water carried over from 2016–17 was significant and drove the increase in the total water delivered.
In aggregate, hypothetical bills calculated by the ACCC for these on-river IOs increased by around 2.5 per cent in nominal terms. Of the hypothetical bills calculated for the individual networks, around 57 per cent decreased in the southern MDB while around 37 per cent decreased in the northern MDB (in nominal terms).
In the southern MDB:
�� In the Murry Valley, high security hypothetical bills increased by 25 per cent and 7 per cent, respectively, for 50 per cent and 100 per cent water delivered.
�� Hypothetical bills in GMW’s Bullarook, Broken and Ovens systems increased 12 per cent in nominal terms—the largest increases since 2009–10.
�� Hypothetical bills in GMW’s Goulburn and Murray systems decreased around 13 per cent in nominal terms, largely due to reductions in bulk water entitlement charges.
�� There were decreases of 5 to 10 per cent in nominal terms for New South Wales general security bills for the Murrumbidgee valley and for both entitlement types in the Lachlan valley, reflecting reductions in charges for holding entitlements and use charges.
Significant changes in the northern MDB included (in nominal terms):
�� As in previous years, Queensland’s Macintyre Brook water supply scheme had the highest increase in its bills, at just over 5 per cent (this was the lowest of the annual increases for this scheme since 2014–15).
�� Hypothetical bill decreases in the Peel Valley of nearly 16 and 22 per cent for high security entitlement holders (at 50 per cent and 100 per cent water delivered). The decrease reflected the New South Wales Independent Pricing and Regulatory Tribunal’s reduction of the high security and general security entitlement charges in the valley by 40 and 47 per cent respectively, and reduction of the use charge by 3.5 per cent.
xxvWater monitoring report 2017–18
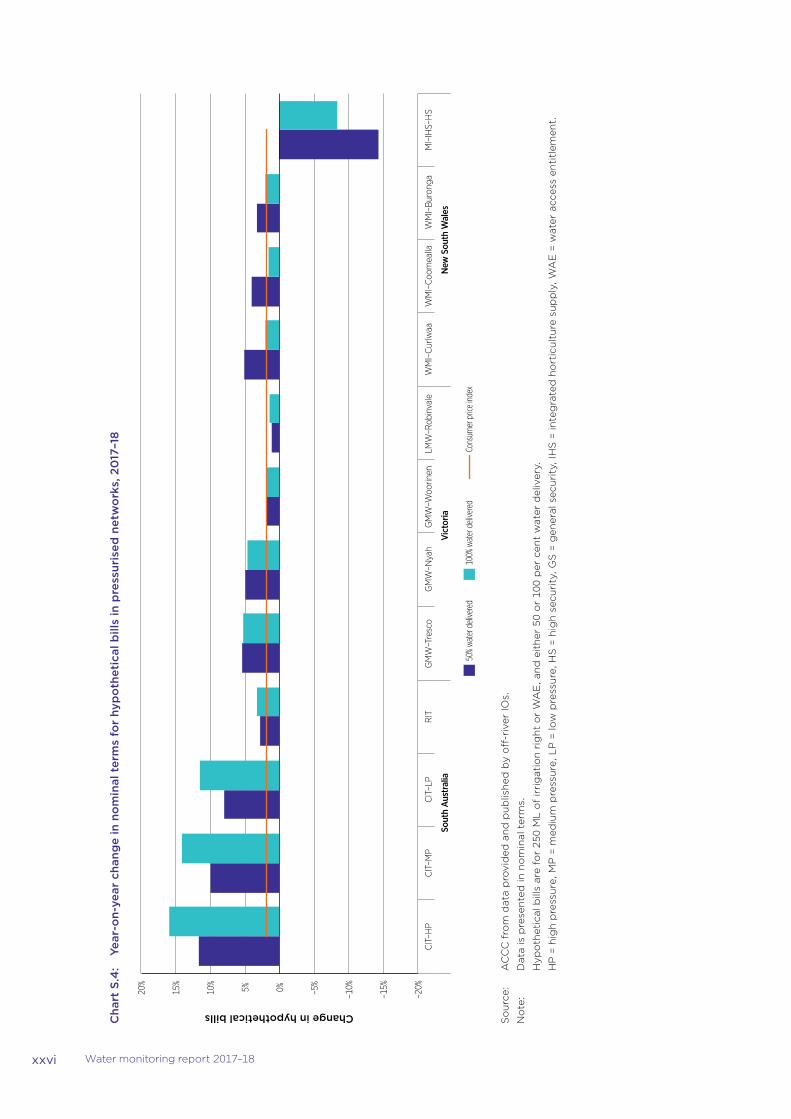
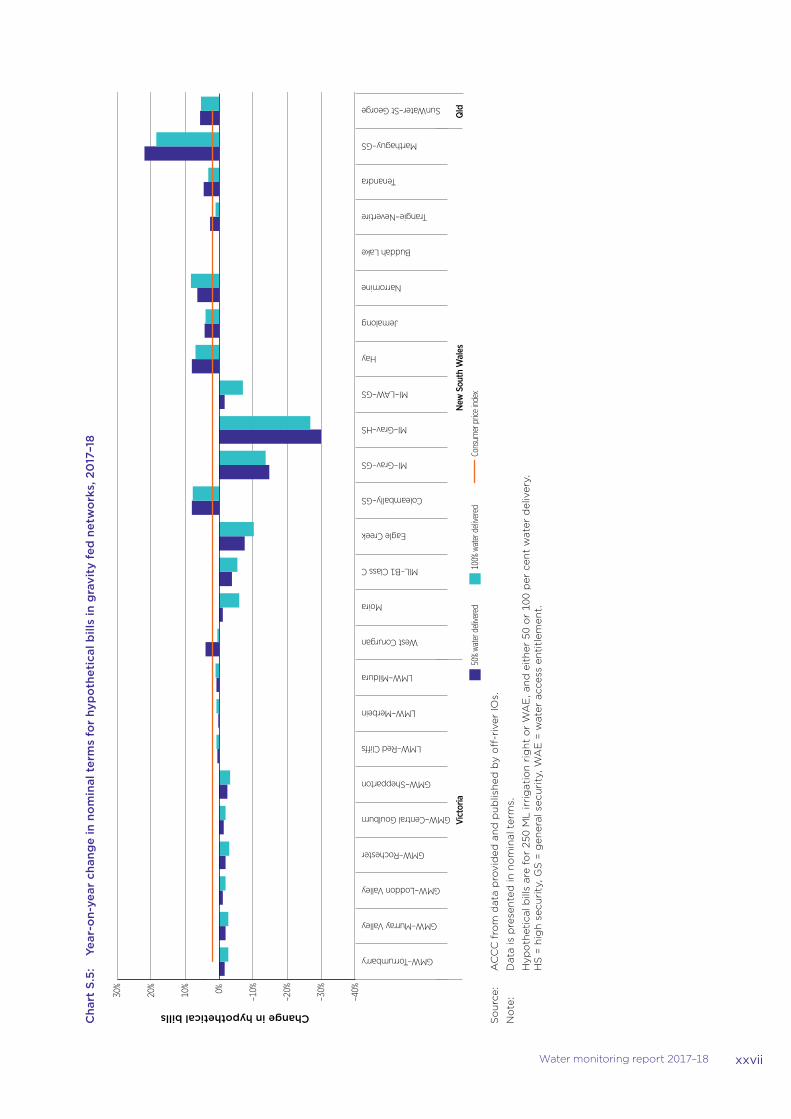
Off-river hypothetical bills continued to increase for most networksAcross both pressurised and gravity fed networks, 60 per cent of hypothetical bills had increases in nominal terms during 2017–18, two percentage points below the equivalent figure in 2016–17. Of those networks that had increases, 49 per cent were in excess of the consumer price index (CPI) (charts S.4 and S.5)
In aggregate, the average growth for all pressurised hypothetical bills was 4 per cent in nominal terms since 2017–18. Within this type network, all hypothetical bills apart from MI increased during 2017–18. Of those that increased, 75 per cent had a rise exceeding CPI. The average aggregate increase in gravity fed networks was less than 1 per cent in nominal terms since 2016–17. Around 56 per cent of these networks had increases in hypothetical bills and only 36 per cent of these exceeded CPI.
Within individual networks, we observed:
�� For pressurised networks, the largest increase in a hypothetical bill over the past 12 months was CIT, increasing by 16 percent in nominal terms for 100 per cent of water delivered. This rise reflected increases in its variable use fee which increased by 38 per cent for peak services. CIT’s medium pressure hypothetical bills had the second highest increase with a rise of 14 per cent in nominal terms, also reflecting increases in variable use fees.
�� Marthaguy Irrigation Scheme had the largest increase in hypothetical bills within gravity fed networks with rises of 22 and 19 per cent in nominal terms (for 50 and 100 per cent water delivered). Until 2017–18 Marthaguy’s off-river charges had not changed since 2011–12. Marthaguy’s operating and maintenance fee rose by 39 per cent and its pumping charge rose by 15 per cent
xxvi Water monitoring report 2017–18
Cha
rt S
.4:
Year
-on-
year
cha
nge
in n
om
inal
ter
ms
for
hyp
oth
etic
al b
ills
in p
ress
uris
ed n
etw
ork
s, 2
017
–18
–20%
–15%
–10%
–5%
0%
5%
10%
15%
20%
CIT
–HP
CIT
–MP
CIT
–LP
RIT
G
MW
–Tre
sco
GM
W–N
yah
GM
W–W
oorin
en
LMW
–Rob
inva
le
WM
I–C
urlw
aa
WM
I–Co
omea
lla
WM
I–B
uron
ga
MI–
IHS–
HS
Sout
h A
ustr
alia
Vict
oria
New
Sou
th W
ales
50% water delivered
100% water delivered
Consum
er price index
Change in hypothetical bills
So
urc
e:
AC
CC
fro
m d
ata
pro
vid
ed a
nd
pu
blis
hed
by
off
-riv
er IO
s.
No
te:
Dat
a is
pre
sen
ted
in n
om
inal
ter
ms.
H
ypo
thet
ical
bill
s ar
e fo
r 25
0 M
L o
f ir
rig
atio
n r
igh
t o
r W
AE
, an
d e
ith
er 5
0 o
r 10
0 p
er c
ent
wat
er d
eliv
ery.
H
P =
hig
h p
ress
ure
, MP
= m
ediu
m p
ress
ure
, LP
= lo
w p
ress
ure
, HS
= h
igh
sec
uri
ty, G
S =
gen
eral
sec
uri
ty, I
HS
= in
teg
rate
d h
ort
icu
ltu
re s
up
ply
, WA
E =
wat
er a
cces
s en
titl
emen
t.
xxviiWater monitoring report 2017–18
Cha
rt S
.5:
Year
-on-
year
cha
nge
in n
om
inal
ter
ms
for
hyp
oth
etic
al b
ills
in g
ravi
ty f
ed n
etw
ork
s, 2
017
–18
–40%
–30%
–20%
–10%
0%
10%
20%
30%
GMW–Torrumbarry
GMW–Murray Valley
GMW–Loddon Valley
GMW–Rochester
GMW–Central Goulburn
GMW–Shepparton
LMW–Red Cli�s
LMW–Merbein
LMW–Mildura
West Corurgan
Moira
MIL–B1 Class C
Eagle Creek
Coleambally–GS
MI–Grav–GS
MI–Grav–HS
MI–LAW–GS
Hay
Jemalong
Narromine
Buddah Lake
Trangie–Nevertire
Tenandra
Marthaguy–GS
SunWater–St George
Vict
oria
N
ew S
outh
Wal
esQ
ld
Change in hypothetical bills
50% water delivered
100% water delivered
Consum
er price index
So
urc
e:
AC
CC
fro
m d
ata
pro
vid
ed a
nd
pu
blis
hed
by
off
-riv
er IO
s.
No
te:
Dat
a is
pre
sen
ted
in n
om
inal
ter
ms.
H
ypo
thet
ical
bill
s ar
e fo
r 25
0 M
L ir
rig
atio
n r
igh
t o
r W
AE
, an
d e
ith
er 5
0 o
r 10
0 p
er c
ent
wat
er d
eliv
ery.
H
S =
hig
h s
ecu
rity
, GS
= g
ener
al s
ecu
rity
, WA
E =
wat
er a
cces
s en
titl
emen
t.
xxviii Water monitoring report 2017–18
Increases in off-river charges drove the majority of rises in hypothetical billsAcross both pressurised and gravity fed networks, around 86 per cent of off-river IO hypothetical bill changes were driven by either increases or decreases in off-river charges in dollar terms, rather than changes in water planning and management (WPM) or on-river charges (75 per cent for pressurised networks and 88 per cent for gravity fed). Changes in off-river charges contributed to increases for all pressurised network hypothetical bills, but in gravity fed networks, changes in these charges drove decreases in 40 per cent of network bills.
While hypothetical bills have generally increased from 2009–10, average increases have not been excessiveThe average aggregate bill change including both 50 and 100 per cent allocations from 2009–10 to 2017–18 was 12 per cent in real terms (reflecting both increases and decreases in networks). By network type, the average aggregate bill change was 12 per cent in pressurised networks and 11 per cent in real terms in gravity fed networks. Other observations include:
�� around 27 per cent of the hypothetical bills decreased over the period from 2009–10 to 2017–18 (both in real terms)
�� between network types there was considerable variation with 8 per cent of hypothetical bills in pressurised networks decreasing over this period and 36 per cent of hypothetical bills in gravity fed networks decreasing (both in real terms)
�� in pressurised networks, the largest percentage increase occurred at GMW’s Nyah network with rises of 43 and 32 per cent in real terms for 50 and 100 per cent water allocation respectively
�� Tenandra had the largest increase of the gravity fed networks with its hypothetical bills increasing by 162 per cent (50 per cent allocation) and 166 per cent (100 per cent allocation) in real terms. Other large increases include Hay Private Irrigation District with growth of 82 and 56 per cent for 100 and 50 per cent allocation respectively.
There are significant differences between each Basin State’s water planning and management arrangementsBasin state water authorities and departments undertake a range of water planning and management activities to promote sustainability of water use, maintain ecosystem health, and minimise the impact of water extraction. These authorities and departments also impose charges to recover a proportion of the expenditure associated with these activities.
Both the New South Wales Department of Industry (Water) and WaterNSW increased their spending on water planning in 2017–18, driving a 25.1 per cent increase in New South Wales’ total WPM expenditure in the MDB. WPM revenue collected by WaterNSW remained relatively stable in 2017–18. The New South Wales Government established the NRAR as an independent regulator with total carriage of the compliance and enforcement of New South Wales water management legislation.
Victoria spent an additional $30 million on Water for Victoria projects across the state in 2017–18. The majority of Victoria’s WPM revenue in the MDB continues to be collected by the Victorian Department of Environment, Land, Water and Planning through the environmental contribution levy. The proportion of Victoria’s WPM revenue collected by regional water authorities continues to grow, however, reaching 20.4 per cent in 2017–18.
South Australia announced planned reforms to the legislation establishing its WPM regime, though these did not come into effect in 2017–18. Accordingly, the state’s WPM expenditure and revenue remained relatively constant in 2017–18.
Queensland’s Department of Natural Resources, Mining and the Energy (DNRME) cannot provide the ACCC with data on their WPM spending. DNRME collected 46 per cent less revenue in 2017–18 than
xxixWater monitoring report 2017–18
in 2016–17, bringing Queensland’s WPM revenues closer to pre-2016–17 levels, following a spike in that year.
ACT’s expenditure on WPM activities fell by over 40 per cent in 2017–18. This fall, coupled with a slight increase in WPM revenue, led to ACT’s WPM revenue being nearly double its spending in 2017–18.
Complaints increased slightly during 2017–18 but compliance with the water market and water charge rules is generally goodWe received 14 complaints and inquiries about the water market or water charge rules (the Rules) in 2017–18, more than half of these from irrigators. This represents a small increase since 2016–17 (when we received 10 complaints and inquiries), but Rule-related complaints and enquiries have declined markedly since 2011–12 (71 complaints).
In 2017–18 the ACCC conducted three initial investigations (prompted by complaints or ACCC compliance reviews) of possible breaches of the water charge rules and two initial investigations into breaches of the Australian Consumer Law (ACL). One of the initial ACL investigations is ongoing. No breaches of the Rules or ACL that resulted in serious detriment to irrigators or other stakeholders were found. On each occasion, the IO or water market intermediary under investigation was cooperative and willing to follow the ACCC’s guidance to achieve compliance. As in previous years, this affirms our impression of a generally good compliance culture among IOs.
Nevertheless, we will continue to work with irrigators and IOs to educate them about their rights and responsibilities, and the need for compliance with the Rules (including amendments) to ensure transparency in regulated water charges and confidence in the water market by all stakeholders.
In 2018–19 we will undertake monitoring and compliance activities that promote informed and well-functioning markets for water (and related rights and services). To this end, we will focus on trade barriers relating to transformations, pricing transparency and stakeholder education about the water charge rule changes that take effect on 1 July 2020.

xxx Water monitoring report 2017–18
Drought and water deliverability challenges loomed
Almond crop in Murray-Darling Basin Source: iStockphoto
01
2 Water monitoring report 2017–18
1. Drought and water deliverability challenges loomed
Key points
�� Seasonal conditions were drier in 2017–18 than the previous year across much of the country.
�� In the southern Murray–Darling Basin (MDB), water storage levels fell and water allocated to entitlements was also lower, but water carried over from previous years helped to buffer the lower water allocations.
�� Prices for water allocations rose and there were record entitlements prices in the southern connected MDB.
�� Irrigators are changing their mix of water market products, selling entitlements to free up capital and supplementing their annual water needs through products such as leases, spot and forward contracts.
�� Electricity prices continue to create pressure on irrigators and operators to decrease their energy costs. Joint purchasing agreements may offer a vehicle for some infrastructure operators to constrain their energy costs.
�� Expansion of perennial cropping continued, raising some concerns about future water deliverability.
This chapter provides a snapshot of key influences on irrigation water use in 2017–18. It also describes other significant factors affecting the environment in which infrastructure operators (IOs) and irrigators operate:
�� Section 1.1 describes seasonal conditions, which influence both water availability and the water needs of crops.
�� Section 1.2 looks at water available in storages, water allocations and carryover across the Murray–Darling Basin (MDB).
�� Section 1.3 provides an overview of water allocation trading in 2017–18, while section 1.4 looks at water access entitlement (WAE) trades and prices.
�� Section 1.5 examines the introduction by New South Wales of a rebate for fixed charges.
�� Section 1.6 looks at the price of electricity (a major input cost for IOs and for many irrigators) and section 1.7 considers implications for water use of increases in cotton and almond planting.
�� Section 1.8 describes recent mass fish deaths and the response by government.
1.1 Seasonal conditions were drier than in previous years
Many regions throughout the MDB experienced mean temperatures well above average (chart 1.1) and below average rainfall (chart 1.2). After a dry winter, the southern MDB received welcome rain in November and December 2017, and some areas in southern New South Wales and Victoria experienced the wettest December day on record.1
However, by the end of June 2018 the Australian Bureau of Agricultural and Resource Economics and Sciences (ABARES) reported that rainfall deficiencies had increased across large parts of eastern Australia and southern South Australia. There were serious to severe rainfall deficiencies across large areas of New South Wales, large areas of southern to central Queensland, parts of eastern Victoria, and
1 Bureau of Meteorology, ‘Australia in December 2017’, http://www.bom.gov.au/climate/current/month/aus/archive/201712.summary.shtml, viewed 5 March 2019.
3Water monitoring report 2017–18
parts of eastern and southern South Australia. These rainfall deficiencies significantly affected water availability and water needs of crops in the MDB.2
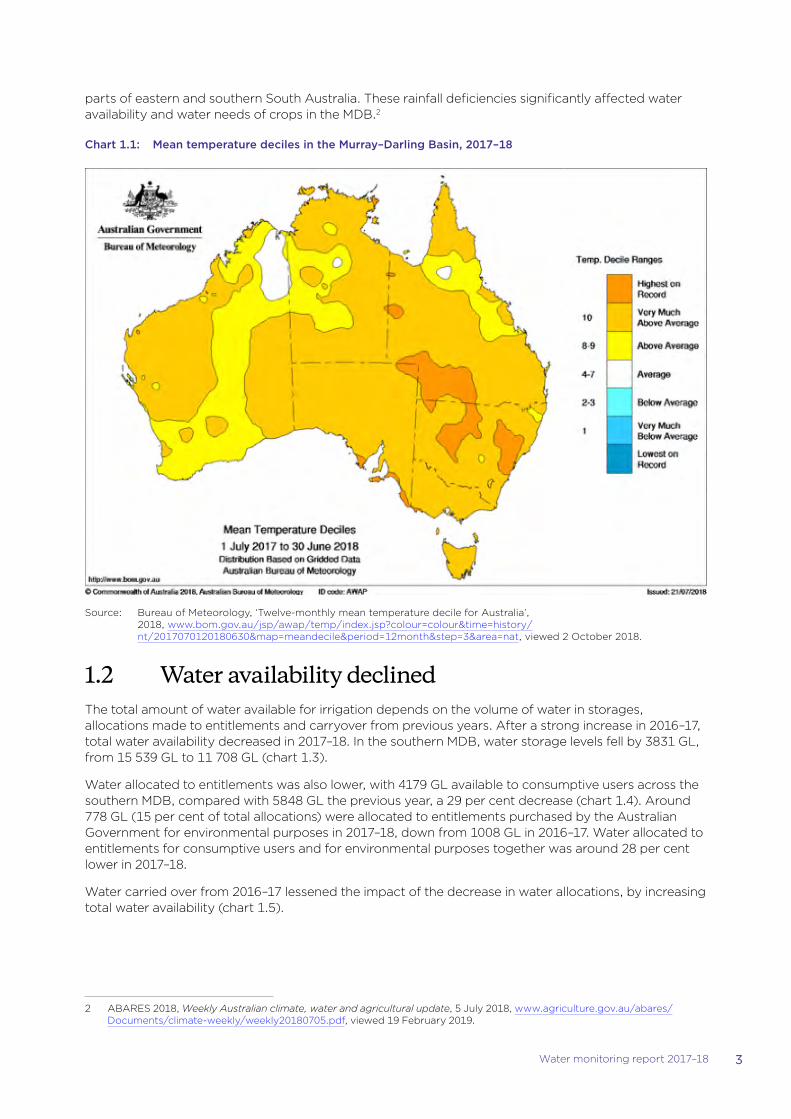
Chart 1.1: Mean temperature deciles in the Murray–Darling Basin, 2017–18
Source: Bureau of Meteorology, ‘Twelve-monthly mean temperature decile for Australia’, 2018, www.bom.gov.au/jsp/awap/temp/index.jsp?colour=colour&time=history/nt/2017070120180630&map=meandecile&period=12month&step=3&area=nat, viewed 2 October 2018.
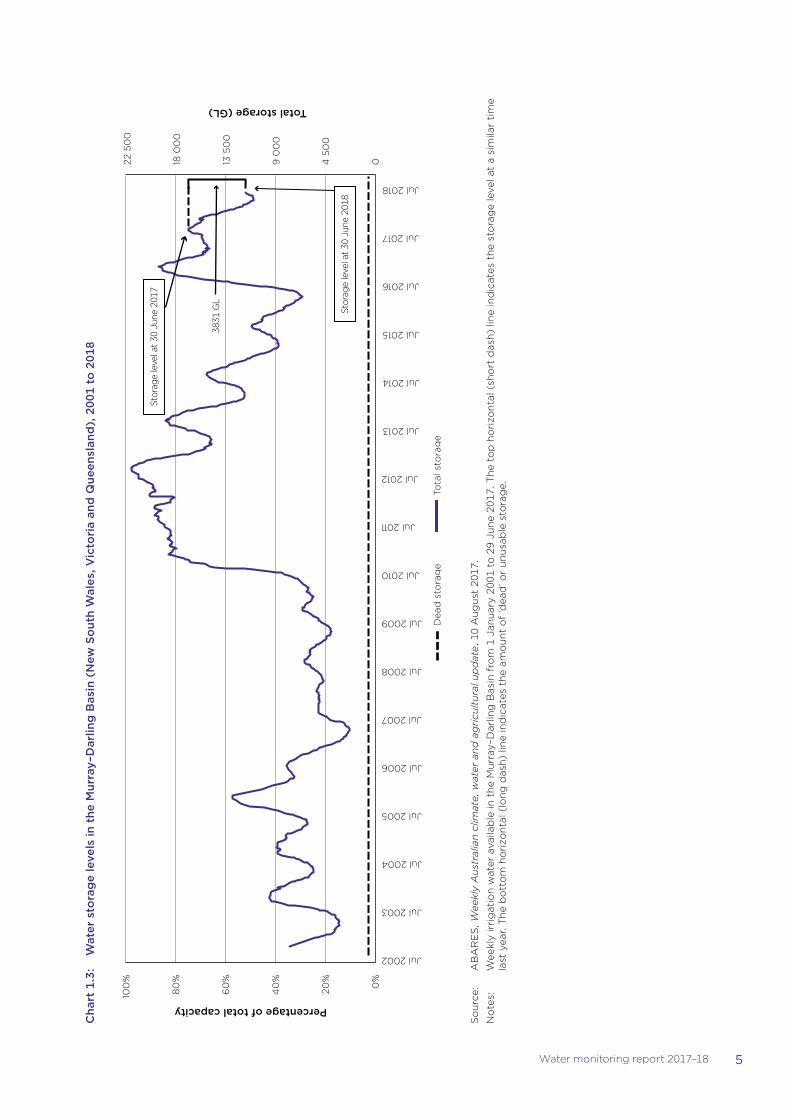
1.2 Water availability declinedThe total amount of water available for irrigation depends on the volume of water in storages, allocations made to entitlements and carryover from previous years. After a strong increase in 2016–17, total water availability decreased in 2017–18. In the southern MDB, water storage levels fell by 3831 GL, from 15 539 GL to 11 708 GL (chart 1.3).
Water allocated to entitlements was also lower, with 4179 GL available to consumptive users across the southern MDB, compared with 5848 GL the previous year, a 29 per cent decrease (chart 1.4). Around 778 GL (15 per cent of total allocations) were allocated to entitlements purchased by the Australian Government for environmental purposes in 2017–18, down from 1008 GL in 2016–17. Water allocated to entitlements for consumptive users and for environmental purposes together was around 28 per cent lower in 2017–18.
Water carried over from 2016–17 lessened the impact of the decrease in water allocations, by increasing total water availability (chart 1.5).
2 ABARES 2018, Weekly Australian climate, water and agricultural update, 5 July 2018, www.agriculture.gov.au/abares/Documents/climate-weekly/weekly20180705.pdf, viewed 19 February 2019.
4 Water monitoring report 2017–18
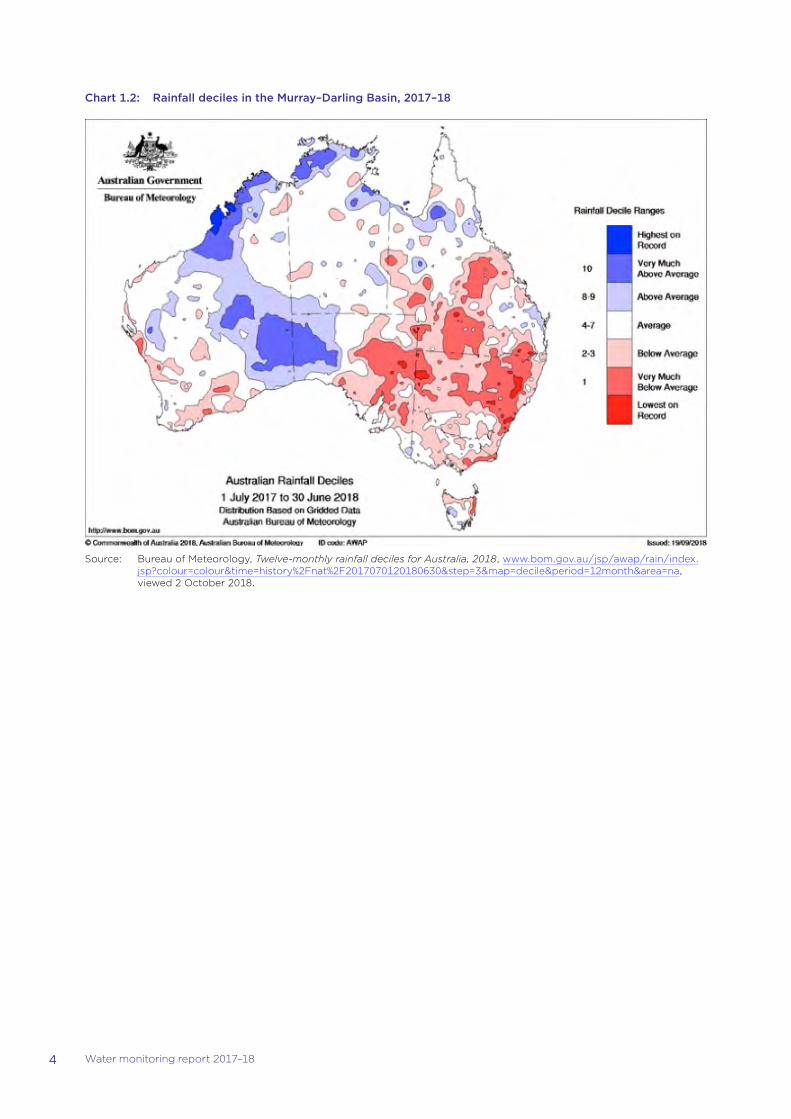
Chart 1.2: Rainfall deciles in the Murray–Darling Basin, 2017–18
Source: Bureau of Meteorology, Twelve-monthly rainfall deciles for Australia, 2018, www.bom.gov.au/jsp/awap/rain/index.jsp?colour=colour&time=history%2Fnat%2F2017070120180630&step=3&map=decile&period=12month&area=na, viewed 2 October 2018.
5Water monitoring report 2017–18
Cha
rt 1
.3:
Wat
er s
tora
ge
leve
ls in
the
Mur
ray–
Dar
ling
Bas
in (
New
So
uth
Wal
es, V
icto
ria
and
Que
ensl
and
), 2
001
to 2
018
Stor
age
leve
l at
30 J
une
2017
Stor
age
leve
l at
30 J
une
2018
3831
GL
0
4 5
00
9 0
00
13 5
00
18 0
00
22 5
00
0%
20%
40
%
60
%
80
%
100
%
Jul 2002
Jul 2003
Jul 2004
Jul 2005
Jul 2006
Jul 2007
Jul 2008
Jul 2009
Jul 2010
Jul 2011
Jul 2012
Jul 2013
Jul 2014
Jul 2015
Jul 2016
Jul 2017
Jul 2018
Total storage (GL)
Percentage of total capacity
Dea
d s
tora
ge
Tota
l sto
rag
e
So
urc
e:
AB
AR
ES
, Wee
kly
Au
stra
lian
clim
ate,
wat
er a
nd
ag
ricu
ltu
ral u
pd
ate,
10
Au
gu
st 2
017.
No
tes:
W
eekl
y ir
rig
atio
n w
ater
ava
ilab
le in
th
e M
urr
ay–D
arlin
g B
asin
fro
m 1
Jan
uar
y 20
01 t
o 2
9 Ju
ne
2017
. Th
e to
p h
ori
zon
tal (
sho
rt d
ash
) lin
e in
dic
ates
th
e st
ora
ge
leve
l at
a si
mila
r ti
me
last
yea
r. T
he
bo
tto
m h
ori
zon
tal (
lon
g d
ash
) lin
e in
dic
ates
th
e am
ou
nt
of
‘dea
d’ o
r u
nu
sab
le s
tora
ge.
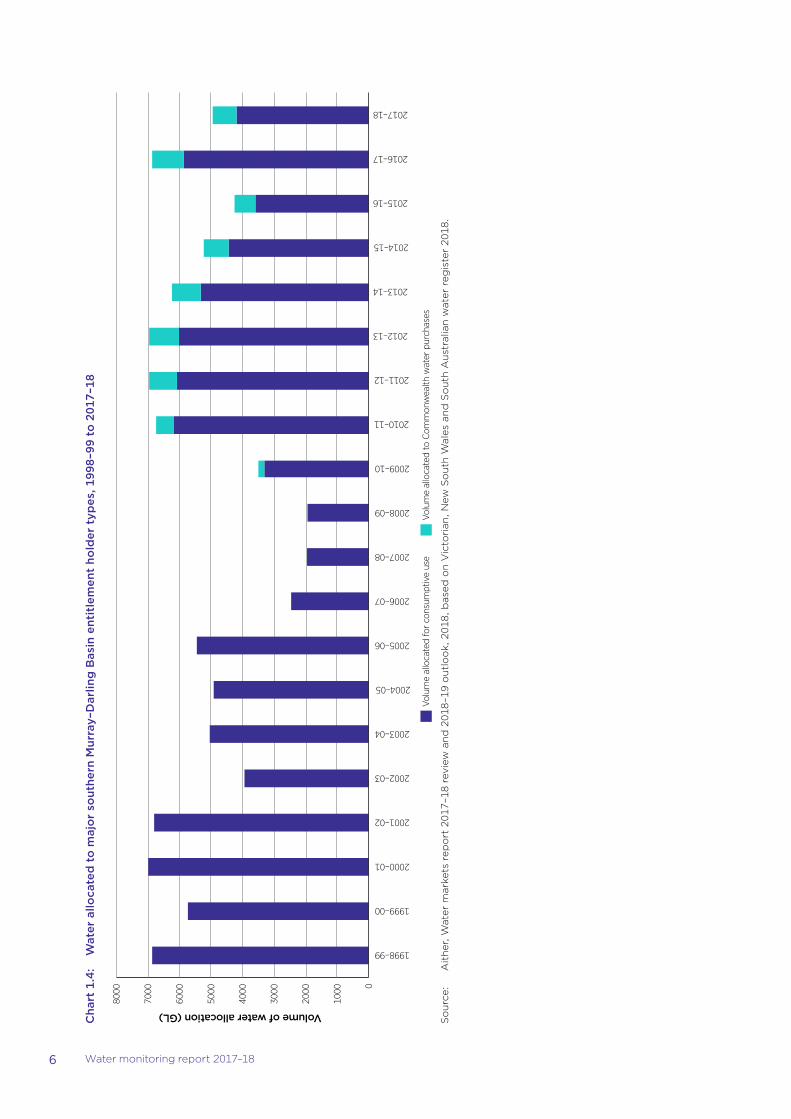
6 Water monitoring report 2017–18
Cha
rt 1
.4:
Wat
er a
lloca
ted
to
maj
or
sout
hern
Mur
ray–
Dar
ling
Bas
in e
ntit
lem
ent
hold
er t
ypes
, 199
8–99
to
201
7–18
0
1000
2000
3000
4000
5000
6000
7000
8000
1998–99
1999–00
2000–01
2001–02
2002–03
2003–04
2004–05
2005–06
2006–07
2007–08
2008–09
2009–10
2010–11
2011–12
2012–13
2013–14
2014–15
2015–16
2016–17
2017–18
Volume of water allocation (GL)
Volu
me
allo
cate
d fo
r co
nsum
ptiv
e us
e Vo
lum
e al
loca
ted
to C
omm
onw
ealth
wat
er p
urch
ases
So
urc
e:
Ait
her
, Wat
er m
arke
ts r
epo
rt 2
017–
18 r
evie
w a
nd
201
8–19
ou
tlo
ok,
201
8, b
ased
on
Vic
tori
an, N
ew S
ou
th W
ales
an
d S
ou
th A
ust
ralia
n w
ater
reg
iste
r 20
18.
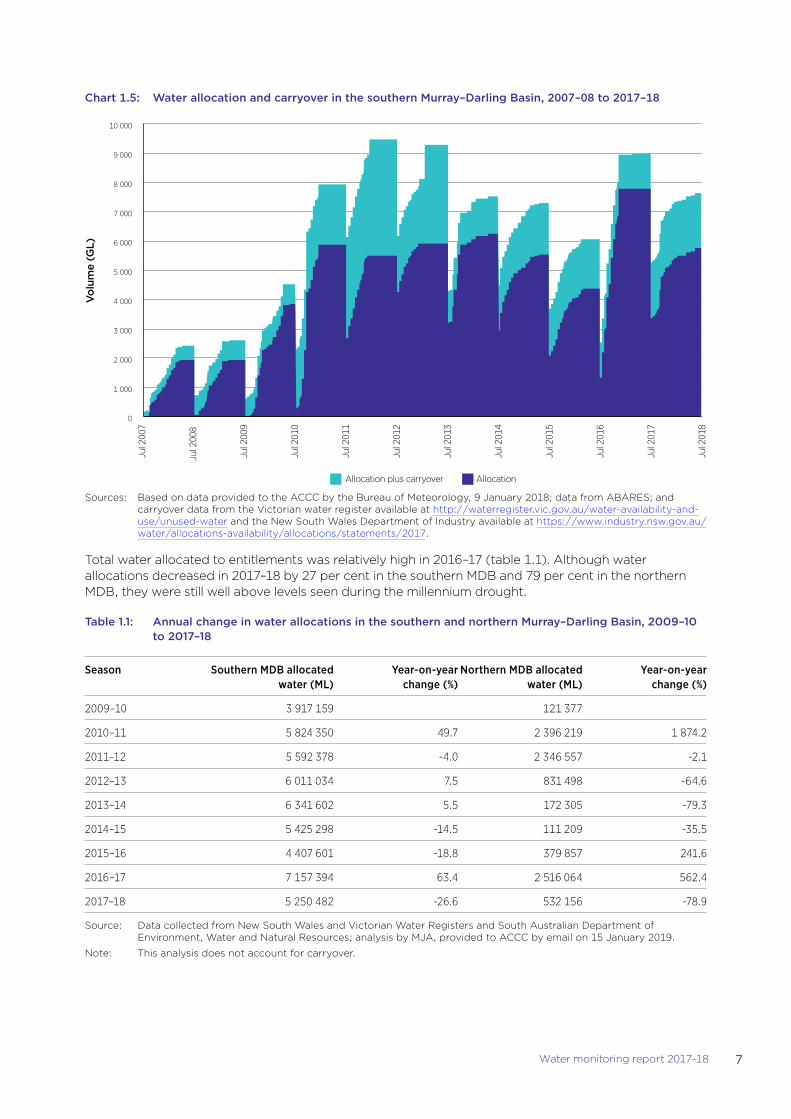
7Water monitoring report 2017–18
Chart 1.5: Water allocation and carryover in the southern Murray–Darling Basin, 2007–08 to 2017–18
0
1 000
2 000
3 000
4 000
5 000
6 000
7 000
8 000
9 000
10 000
Allocation plus carryover Allocation
Jul 2
007
Jul 2
008
Jul 2
009
Jul 2
010
Jul 2
011
Jul 2
012
Jul 2
013
Jul 2
014
Jul 2
015
Jul 2
016
Jul 2
017
Jul 2
018
Vol
ume
(GL)
Sources: Based on data provided to the ACCC by the Bureau of Meteorology, 9 January 2018; data from ABARES; and carryover data from the Victorian water register available at http://waterregister.vic.gov.au/water-availability-and-use/unused-water and the New South Wales Department of Industry available at https://www.industry.nsw.gov.au/water/allocations-availability/allocations/statements/2017.
Total water allocated to entitlements was relatively high in 2016–17 (table 1.1). Although water allocations decreased in 2017–18 by 27 per cent in the southern MDB and 79 per cent in the northern MDB, they were still well above levels seen during the millennium drought.
Table 1.1: Annual change in water allocations in the southern and northern Murray–Darling Basin, 2009–10 to 2017–18
Season Southern MDB allocated water (ML)
Year-on-year change (%)
Northern MDB allocated water (ML)
Year-on-year change (%)
2009–10 3 917 159 121 377
2010–11 5 824 350 49.7 2 396 219 1 874.2
2011–12 5 592 378 -4.0 2 346 557 -2.1
2012–13 6 011 034 7.5 831 498 -64.6
2013–14 6 341 602 5.5 172 305 -79.3
2014–15 5 425 298 -14.5 111 209 -35.5
2015–16 4 407 601 -18.8 379 857 241.6
2016–17 7 157 394 63.4 2 516 064 562.4
2017–18 5 250 482 -26.6 532 156 -78.9
Source: Data collected from New South Wales and Victorian Water Registers and South Australian Department of Environment, Water and Natural Resources; analysis by MJA, provided to ACCC by email on 15 January 2019.
Note: This analysis does not account for carryover.
8 Water monitoring report 2017–18
As can be seen in chart 1.5, water carried over from previous years can be an important component of water availability. In 2017–18 carryover helped to buffer lower water allocations. Although total water allocations in the southern MDB at the end of June 2018 were 27 per cent lower than at the end of June 2017, carryover added around 1 900 GL of available water. As a result, total water availability (water allocations plus carryover) decreased by only 15 per cent.
By allowing water users to retain unused water allocation for use, or trade, in the following year, carryover arrangements can help them offset the impacts of reduced water availability and apply water when it is needed most, manage risk and adapt to rapidly changing circumstances. Carryover arrangements, in conjunction with other emerging water market trade products outlined in box 3.2 (including trade in carryover capacity), afford licence holders improved flexibility in their water use and enhances the ability of water markets to move water to its highest value use (see box 2.3).3
1.3 Most trading zones saw record water allocation trade volumes and higher prices
After favourable seasonal conditions in 2016–17 with above average rainfall across much of the Basin, water supply was plentiful in the form of carryover, water in storages and announced allocations at the start of 2017–18.
The dry conditions and below average inflows to storages, combined with expansion in annual cropping, all contributed to increased demand for irrigation water in 2017–18. Most water trading zones in the southern connected MDB4 experienced record water allocation trade volumes (chart 1.6) and increased allocation prices in 2017–18.5
Marsden Jacobs Associates (MJA) reported that demand from annual cropping (especially cotton) in the Murrumbidgee was the key market driver early in the season. Murrumbidgee became a net importer of water, which led to inter-valley trade closing for in-trade for the first time since September 2013.
MJA indicated that towards the end of the season, allocation prices strengthened as the allocation outlooks for 2018–19 signalled lower water availability and market participants were purchasing allocation for carryover. Irrigators purchasing water to rebalance their accounts due to overuse, especially in South Australia, was another late season driver contributing to prices peaking at the tail end of the year.6
3 MDBA, Basin Plan evaluation addendum, 2018, p. 10. https://www.mdba.gov.au/sites/default/files/pubs/basin-plan-evaluation-addendum-jun2018.pdf, viewed January 2019.
4 The southern connected MDB refers to the catchments that are hydrologically connected where allocation water can be traded between any catchments within that system, subject to any trade limits. It excludes catchments such as Bullarook and Ovens that are part of the southern MDB but not connected to the rest.
5 The values given for MDB entitlement and allocation markets and prices are estimates from MJA. Other reports may give somewhat different figures given different approaches to data cleaning and methods of classification. We note concerns with the accuracy and comprehensive of price data in chapter 3.
6 MJA, Murray–Darling Basin water markets 2018–19 outlook and 2017–18 review, 2018, p. 8.
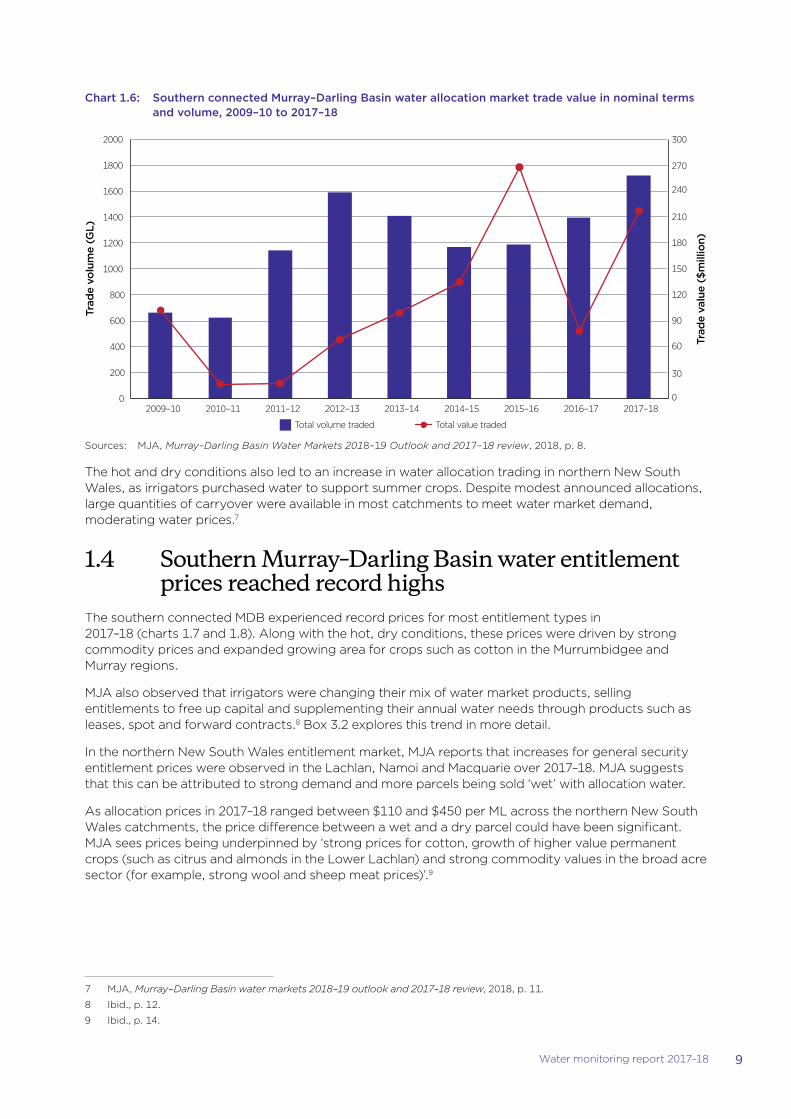
9Water monitoring report 2017–18
Chart 1.6: Southern connected Murray–Darling Basin water allocation market trade value in nominal terms and volume, 2009–10 to 2017–18
0
30
90
120
150
180
300
0
200
400
600
800
1000
1200
1400
1600
1800
2000
2009–10 2010–11 2011–12 2012–13 2013–14 2014–15 2015–16 2016–17 2017–18
Trad
e va
lue
($m
illio
n)
Trad
e vo
lum
e (G
L)
Total volume traded Total value traded
60
270
240
210
Sources: MJA, Murray–Darling Basin Water Markets 2018–19 Outlook and 2017–18 review, 2018, p. 8.
The hot and dry conditions also led to an increase in water allocation trading in northern New South Wales, as irrigators purchased water to support summer crops. Despite modest announced allocations, large quantities of carryover were available in most catchments to meet water market demand, moderating water prices.7
1.4 Southern Murray–Darling Basin water entitlement prices reached record highs
The southern connected MDB experienced record prices for most entitlement types in 2017–18 (charts 1.7 and 1.8). Along with the hot, dry conditions, these prices were driven by strong commodity prices and expanded growing area for crops such as cotton in the Murrumbidgee and Murray regions.
MJA also observed that irrigators were changing their mix of water market products, selling entitlements to free up capital and supplementing their annual water needs through products such as leases, spot and forward contracts.8 Box 3.2 explores this trend in more detail.
In the northern New South Wales entitlement market, MJA reports that increases for general security entitlement prices were observed in the Lachlan, Namoi and Macquarie over 2017–18. MJA suggests that this can be attributed to strong demand and more parcels being sold ‘wet’ with allocation water.
As allocation prices in 2017–18 ranged between $110 and $450 per ML across the northern New South Wales catchments, the price difference between a wet and a dry parcel could have been significant. MJA sees prices being underpinned by ‘strong prices for cotton, growth of higher value permanent crops (such as citrus and almonds in the Lower Lachlan) and strong commodity values in the broad acre sector (for example, strong wool and sheep meat prices)’.9
7 MJA, Murray–Darling Basin water markets 2018–19 outlook and 2017–18 review, 2018, p. 11.
8 Ibid., p. 12.
9 Ibid., p. 14.
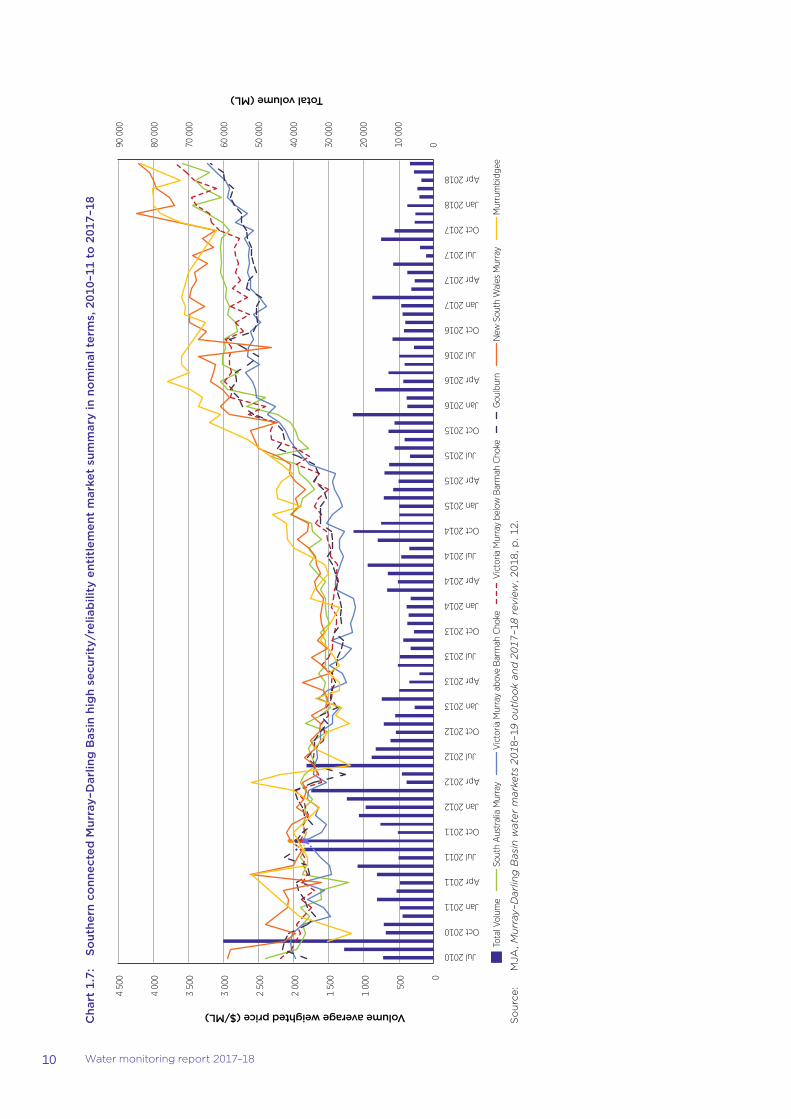
10 Water monitoring report 2017–18
Cha
rt 1
.7:
Sout
hern
co
nnec
ted
Mur
ray–
Dar
ling
Bas
in h
igh
secu
rity
/rel
iab
ility
ent
itle
men
t m
arke
t su
mm
ary
in n
om
inal
ter
ms,
201
0–11
to
201
7–18
Volume average weighted price ($/ML)
010 0
00
20 0
00
30 0
00
40 0
00
50 0
00
60 0
00
70 0
00
80 0
00
90 0
00
Jul 2010
Oct 2010
Jan 2011
Apr 2011
Jul 2011
Oct 2011
Jan 2012
Apr 2012
Jul 2012
Oct 2012
Jan 2013
Apr 2013
Jul 2013
Oct 2013
Jan 2014
Apr 2014
Jul 2014
Oct 2014
Jan 2015
Apr 2015
Jul 2015
Oct 2015
Jan 2016
Apr 2016
Jul 2016
Oct 2016
Jan 2017
Apr 2017
Jul 2017
Oct 2017
Jan 2018
Apr 2018
0
500
1 00
0
1 50
0
2 00
0
2 50
0
3 00
0
3 50
0
4 00
0
4 50
0
Sout
h A
ustr
alia
Mur
ray
Vic
toria
Mur
ray
abov
e B
arm
ah C
hoke
V
icto
ria M
urra
y be
low
Bar
mah
Cho
ke
Gou
lbur
n N
ew S
outh
Wal
es M
urra
y M
urru
mbi
dgee
To
tal V
olum
e
Total volume (ML)
So
urc
e:
MJA
, Mu
rray
–Dar
ling
Bas
in w
ater
mar
kets
201
8–19
ou
tlo
ok
and
201
7–18
rev
iew
, 201
8, p
. 12.
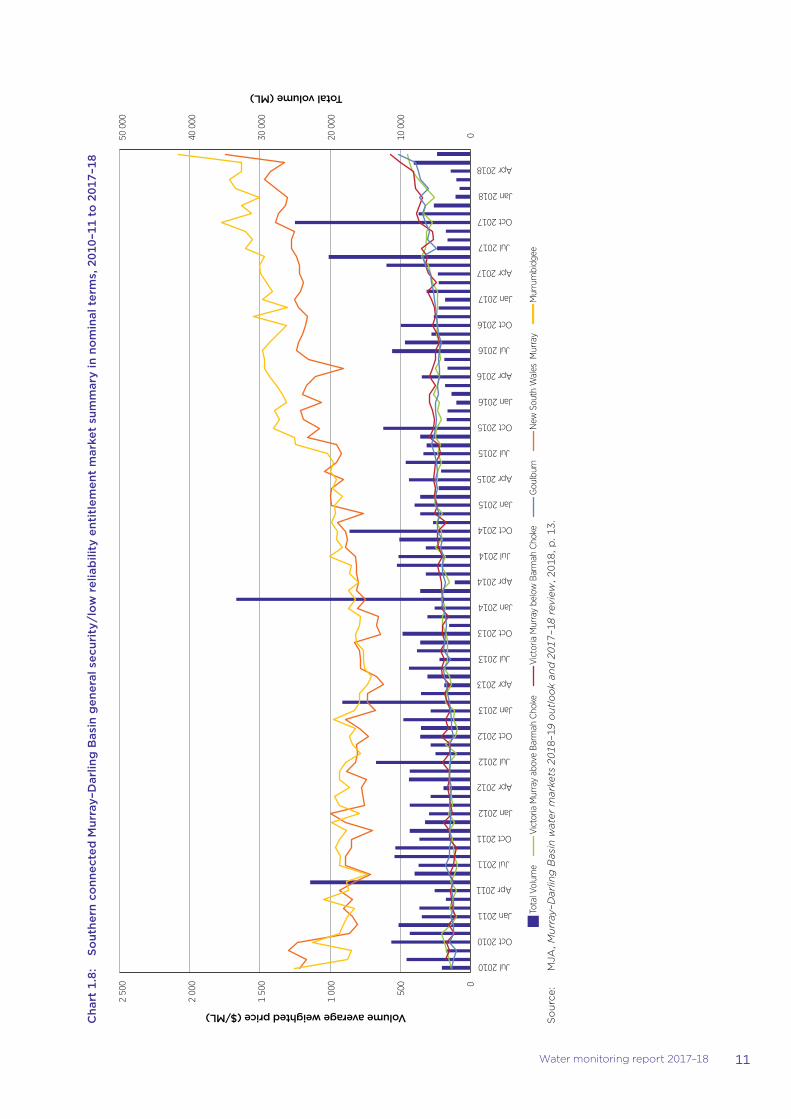
11Water monitoring report 2017–18
Cha
rt 1
.8:
Sout
hern
co
nnec
ted
Mur
ray–
Dar
ling
Bas
in g
ener
al s
ecur
ity/
low
rel
iab
ility
ent
itle
men
t m
arke
t su
mm
ary
in n
om
inal
ter
ms,
201
0–11
to
201
7–18
0
10 0
00
20 0
00
30 0
00
40 0
00
50 0
00
0
500
1 00
0
1 50
0
2 00
0
2 50
0
Jul 2010
Oct 2010
Jan 2011
Apr 2011
Jul 2011
Oct 2011
Jan 2012
Apr 2012
Jul 2012
Oct 2012
Jan 2013
Apr 2013
Jul 2013
Oct 2013
Jan 2014
Apr 2014
Jul 2014
Oct 2014
Jan 2015
Apr 2015
Jul 2015
Oct 2015
Jan 2016
Apr 2016
Jul 2016
Oct 2016
Jan 2017
Apr 2017
Jul 2017
Oct 2017
Jan 2018
Apr 2018
Tota
l Vol
ume
Vic
toria
Mur
ray
abov
e B
arm
ah C
hoke
V
icto
ria M
urra
y be
low
Bar
mah
Cho
ke
Gou
lbur
n N
ew S
outh
Wal
es M
urra
y M
urru
mbi
dgee
Volume average weighted price ($/ML)
Total volume (ML)
So
urc
e:
MJA
, Mu
rray
–Dar
ling
Bas
in w
ater
mar
kets
201
8–19
ou
tlo
ok
and
201
7–18
rev
iew
, 201
8, p
. 13.
12 Water monitoring report 2017–18
1.5 New South Wales introduced subsidies for fixed charges due to drought conditions
By the end of 2017–18 reduced water availability in New South Wales, along with ongoing dry prevailing climatic conditions and poor seasonal forecasts, led to areas of New South Wales being considered as drought affected. Drought puts downward pressure on irrigator revenue streams, which can affect irrigators’ ability to meet expenses (including charges relating to holding water access entitlements and irrigation rights) and to use water. IOs impose charges for access to their infrastructure and to recover the costs of operations such as water harvesting and storage, water transportation and delivery. These are explained in chapter 2 of the Water monitoring report: supplementary information, 2017–18.
The New South Wales Government announced an Emergency Drought Relief Package on 30 July 2018. The package included rebates for the fixed charges components of bills for holders of general security licences (box 1.1). This is discussed further in section 5.1.1.
Box 1.1: The New South Wales Government waived the fixed charge component cost of most water licences in rural and regional areas
The New South Wales Government introduced a financial assistance package, including rebates of up to $4000 to all general security licence holders and supplementary water access licence holders in rural and regional New South Wales. This financial assistance was part of a broader $500 million Emergency Drought Relief Package announced on 30 July 2018.
The rebate applied to the fixed component of bills for general security licences and supplementary water access licences across surface and ground water systems. It also applied to customers of irrigation corporation districts (ICDs) for water entitlement costs incurred by ICD customers (for example, government pass through costs such as Water Administration Ministerial Corporation and WaterNSW fixed entitlement charges).
High security licence holders for regulated river systems and government entities, such as environmental water holders, are not eligible for this rebate. The New South Wales Department of Primary Industries indicates that the rebate is expected to cover 100 per cent of the fixed component of charges for 95 per cent of eligible customers.
Further information is available on the New South Wales Department of Primary Industries ‘DroughtHub’ at https://www.dpi.nsw.gov.au/climate-and-emergencies/droughthub/faq.
1.6 Energy prices remained a concern for irrigators and water infrastructure operators, particularly in pressurised systems
While not all irrigation is energy intensive—systems such as flood, furrow and level basin irrigation rely on gravity to distribute water—irrigation methods such as sprinkler systems using highly pressurised water require high levels of energy. Many irrigators rely on electricity to pump water from its source to storage and from the source or storage to crops.
According to the Australian Farm Institute, substantial increases in the cost of energy as a proportion of production costs in Australian agriculture have outstripped the sector’s ability to match increased cost with efficiency gains.10 Rises in electricity costs in the past decade have compelled many irrigators to assess ways to reduce energy costs. Options may include changing watering schedules to take advantage of off peak tariffs, ‘going off grid’ and using distributed generation, or exiting irrigated agriculture. Such decisions by irrigators may affect demands on irrigation infrastructure operators (IIO)
10 Australian Farm Institute, The impacts of energy costs on the Australian agriculture sector, research report, August 2018.
13Water monitoring report 2017–18
infrastructure and operating revenue. Decisions taken by IIOs to reduce their energy costs will affect irrigators through the charges that they pay.11
To address rising electricity prices, new forms of energy contracting are emerging. As noted in our 2016–17 report, one such example is the Joint Purchasing Electricity Buyers’ Group contract entered into by Central Irrigation Trust (box 1.2).
Box 1.2: Central Irrigation Trust reports success in reducing electricity costs through Joint Electricity Purchasing Groups
Central Irrigation Trust (CIT) is a private irrigation trust located in Barmera, part of the Riverland region in South Australia. In 2016–17, CIT’s energy costs comprised 36 per cent of its total operating expenses and over 72 per cent of total expenditure on irrigation and drainage operations.12 In 2016–17, CIT reported spending almost $5.2 million on electricity for irrigation and drainage. In 2017–18 this amount had risen to over $6.4 million.13
On 8 June 2018 the South Australian Chamber of Mines and Energy (SACOME) awarded an eight-year supply contract to renewable energy retailer SIMEX ZEN Energy after authorisation by the ACCC.14 This bulk buying consortium followed discussions among members, about how to respond when electricity prices doubled after the Northern Power Station closed. By aggregating load, SACOME members sought to improve their individual bargaining positions: ‘the platform provides an aggregated and definite load, enabling SIMEC ZEN to back this demand with its anticipated new renewable power generation, hence making it possible to offer lower pricing.’15
In its 2017–18 annual report, CIT reported it ‘…believe[d] that we have passed the peak of rising energy prices seen in recent times…This contract facilitated through SACOME (South Australian Council of Mines and Energy) is for eight years at a price significantly lower than we are currently incurring with an annual escalator of 1.5%. We will now see more certainty in our energy costs which I am sure growers will appreciate.’16
1.7 Changing cropping choices are placing a premium on high reliability water
The MDB has a wide range of climatic and soil conditions, which means the region supports seasonal crops, permanent plantings and livestock. Rice has traditionally featured in the Murrumbidgee and parts of the New South Wales Murray. Further downstream of the New South Wales and Victorian Murray, perennial tree nuts including almonds and walnuts are grown, while dairy maintains a strong presence within the Goulburn region.
Demand and competition for irrigation water is driven primarily by the relative profitability of irrigated activities. Higher value crops, such as perennial tree nuts, are placing a premium on high and general reliability water access entitlement prices.
11 ACCC, Water monitoring report 2016–17, 2018.
12 Ibid.
13 CIT, Annual report 2017–18, 2018, www.cit.org.au:84/Downloads/CIT_Annual_Report_2017-18_v2.pdf, viewed 19 February 2019.
14 ACCC, ‘ACCC allows SA businesses to jointly purchase electricity’, media release,17 May 2017, https://www.accc.gov.au/media-release/accc-allows-sa-businesses-to-jointly-purchase-electricity, viewed 24 March 2019.
15 SACOME, ’SACOME Joint Electricity Purchasing Group awards long-term supply contract to Sanjeev Gupta’s SIMEC ZEN Energy’, media release, 2018, www.sacome.org.au/sacome-joint-electricity-purchasing-group-awards-long-term-supply-contract-to-sanjeev-guptas-simec-zen-energy.html, viewed 19 February 2019.
16 CIT, Annual report 2017–18, 2018, www.cit.org.au:84/Downloads/CIT_Annual_Report_2017-18_v2.pdf, viewed 19 February 2019.
14 Water monitoring report 2017–18
1.7.1 The area planted to cotton is expandingCotton prices have risen since 2014–15, although they are well below the 2011 peak. As cotton has become more profitable, the volume of water used to irrigate cotton in the southern MDB has increased substantially. The Australian Bureau of Statistics (ABS) reports the area of irrigated cotton in the MDB increased 65 per cent in 2016–17 to 308 000 hectares due to increased water availability with higher than average rainfall in parts of New South Wales and Queensland during that year. The volume of water applied to cotton in the MDB increased 87 per cent to 2.4 million ML, with the rate of application growing by 14.5 per cent from 6.9 to 7.9 ML per hectare.17 While the ABS data for 2017–18 are not yet available, ABARES reported that the area planted to irrigated cotton is estimated to have declined by around 8 per cent in 2017–18 to 394 000 hectares.18 However, production was forecast to rise by 12 per cent due to increase yields compared with the previous year. ABARES expects a further decrease in the area planted to cotton and a fall in cotton production in 2018–19, largely due to reduced water availability in dams and low levels of soil moisture.19
1.7.2 Almond plantings continue to expandSignificant increases in almond prices since 2008 (chart 1.9) are driving an expansion in almond plantings. According to the Almond Board of Australia, the doubling of almond prices between 2008 and 2014 was driven by emerging market demand in India and China and drought conditions in California, the global production leader. An increase in global almond production to meet the rise in demand from emerging markets resulted in a price decrease following 2014.20
Almond trees take three years to bear a crop and typically around seven years to reach mature production levels. Depending on soil type, water stress, environment, or disease pressure, an almond orchard might remain productive for 25–30 years before it is removed.
Australia is now the world’s second largest almond growing region, and almonds are Australia’s most valuable horticultural export.21 MJA reports that the total area planted to almonds in the southern connected MDB increased from 3555 hectares in 2000 to 35 886 hectares in 2016, with the Almond Board of Australia forecasting this to increase to around 50 000 hectares by 2025. MJA observes that new almond plantings occurred during 2016 with 4904 hectares planted and that further orchard expansion is forecast.22 Around 68 per cent of Australia’s almond trees are in Victoria, 20 per cent in South Australia and 12 per cent in New South Wales.23
As plantations expand, water requirements in the Lower Murray area may increase. Satisfying the downstream demand for water is likely to become more challenging because of physical constraints and the operation of trade restrictions that limit the volume of water that can be traded from above to below such constraints.24 Section 3.4 describes the major restrictions currently affecting trade in the southern MDB.
17 ABS, Water use on farms 2016–17, cat. No. 4618.0 http://www.abs.gov.au/AUSSTATS/[email protected]/DetailsPage/4618.02016-17?OpenDocument, viewed 8 April 2019.
18 ABARES, Australian crop report, June 2018, p. 3.
19 ABARES, Agricultural commodities report, December quarter, 2018.
20 Almond Board of Australia, Almond insights 2017–18, 2018, https://industry.australianalmonds.com.au/wp-content/uploads/2018/08/Almond-Insights-2017-18-August22.pdf, viewed 19 February 2019.
21 Almond Board of Australia, Almond insights 2017–18, 2018, https://industry.australianalmonds.com.au/wp-content/uploads/2018/08/Almond-Insights-2017-18-August22.pdf, viewed 19 February 2019. See also Horticulture Innovation Australia, Australian horticulture statistics handbook: nuts 2017–18, 2019.
22 MJA, MDB water market outlook 2017–18 and 2016–17 review, 2017, p. 2.
23 Almond Board of Australia, Almond insights 2017–18, 2018, viewed 19 February 2019.
24 See, for example, Jasper, Clint, ‘Water trading reshapes what foods and fibres are grown along the Murray and Murrumbidgee rivers’, ABC Rural News, 10 July 2018, https://www.abc.net.au/news/rural/2018-07-10/water-trading-makes-farmers-adapt/9945688, viewed 10 April 2019.
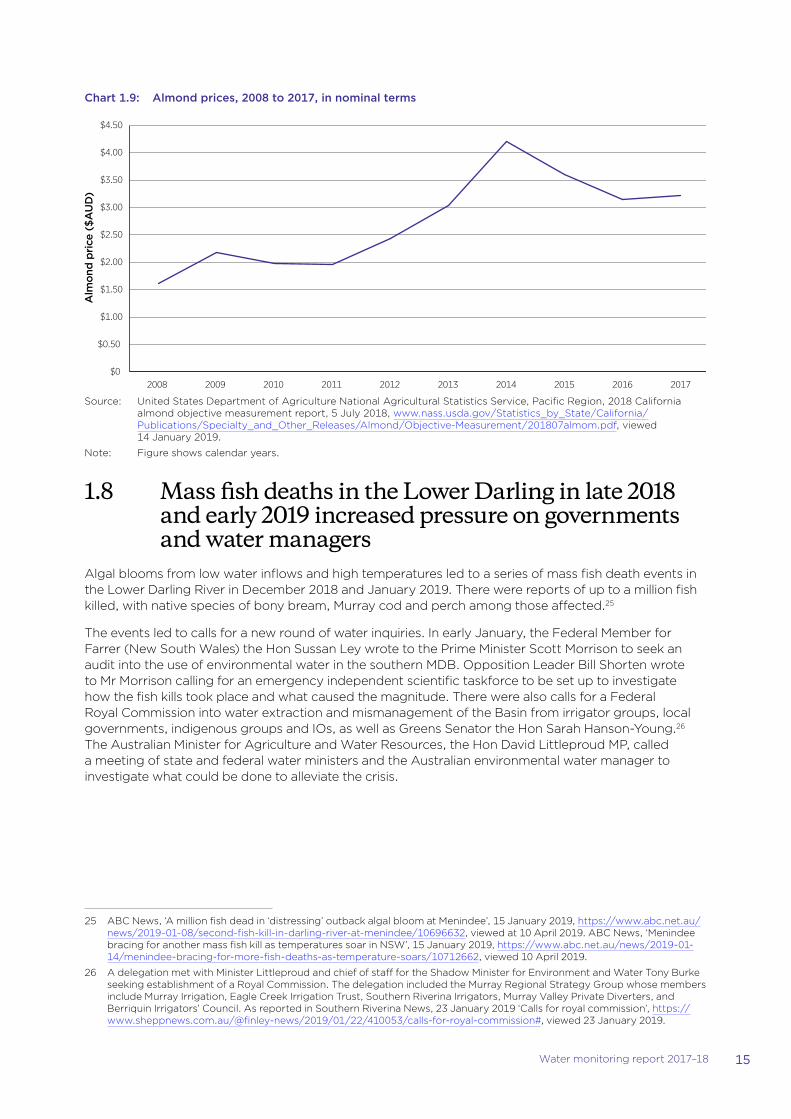
15Water monitoring report 2017–18
Chart 1.9: Almond prices, 2008 to 2017, in nominal terms
2008 2009 2010 2011 2012 2013 2014 2015 2016 2017 $0
$0.50
$1.00
$1.50
$2.00
$2.50
$3.00
$3.50
$4.00
$4.50
Alm
ond
pri
ce (
$AU
D)
Source: United States Department of Agriculture National Agricultural Statistics Service, Pacific Region, 2018 California almond objective measurement report, 5 July 2018, www.nass.usda.gov/Statistics_by_State/California/Publications/Specialty_and_Other_Releases/Almond/Objective-Measurement/201807almom.pdf, viewed 14 January 2019.
Note: Figure shows calendar years.
1.8 Mass fish deaths in the Lower Darling in late 2018 and early 2019 increased pressure on governments and water managers
Algal blooms from low water inflows and high temperatures led to a series of mass fish death events in the Lower Darling River in December 2018 and January 2019. There were reports of up to a million fish killed, with native species of bony bream, Murray cod and perch among those affected.25
The events led to calls for a new round of water inquiries. In early January, the Federal Member for Farrer (New South Wales) the Hon Sussan Ley wrote to the Prime Minister Scott Morrison to seek an audit into the use of environmental water in the southern MDB. Opposition Leader Bill Shorten wrote to Mr Morrison calling for an emergency independent scientific taskforce to be set up to investigate how the fish kills took place and what caused the magnitude. There were also calls for a Federal Royal Commission into water extraction and mismanagement of the Basin from irrigator groups, local governments, indigenous groups and IOs, as well as Greens Senator the Hon Sarah Hanson-Young.26 The Australian Minister for Agriculture and Water Resources, the Hon David Littleproud MP, called a meeting of state and federal water ministers and the Australian environmental water manager to investigate what could be done to alleviate the crisis.
25 ABC News, ‘A million fish dead in ‘distressing’ outback algal bloom at Menindee’, 15 January 2019, https://www.abc.net.au/news/2019-01-08/second-fish-kill-in-darling-river-at-menindee/10696632, viewed at 10 April 2019. ABC News, ‘Menindee bracing for another mass fish kill as temperatures soar in NSW’, 15 January 2019, https://www.abc.net.au/news/2019-01-14/menindee-bracing-for-more-fish-deaths-as-temperature-soars/10712662, viewed 10 April 2019.
26 A delegation met with Minister Littleproud and chief of staff for the Shadow Minister for Environment and Water Tony Burke seeking establishment of a Royal Commission. The delegation included the Murray Regional Strategy Group whose members include Murray Irrigation, Eagle Creek Irrigation Trust, Southern Riverina Irrigators, Murray Valley Private Diverters, and Berriquin Irrigators’ Council. As reported in Southern Riverina News, 23 January 2019 ‘Calls for royal commission’, https://www.sheppnews.com.au/@finley-news/2019/01/22/410053/calls-for-royal-commission#, viewed 23 January 2019.
16 Water monitoring report 2017–18
On 22 January 2019 the Minister appointed an independent panel chaired by Professor Rob Vertessy to review the fish deaths, identify its causes and make recommendations within the framework of the Murray–Darling Basin Plan and Murray–Darling Basin Agreement. An interim report was released on 21 February 2019, which found that ‘exceptional climatic conditions, unparalleled in the observed climate record’ contributed to the mass fish kill.27 The report made 20 provisional recommendations, including improving water monitoring in tributaries and greater transparency around floodplain harvesting in New South Wales and Queensland.
The final report was released on 10 April 2019. The Australian Government’s response included a buyback of A Class water licences28 issued under the Barwon–Darling water sharing plan and $70 million for subsidies to upgrade irrigation meters, install cameras to live stream river flows to the internet to provide transparency to the public, and expanded research for better water management.
This report followed a separate report by the Australian Academy of Science, requested by Labor, into causes of three of these fish kill events in the Darling in December 2018 and January 2019. The report, delivered on 18 February 2019, found irrigators pumping too much water upstream, drought, and low flows into and from Menindee Lakes (Box 1.3) had contributed to the deaths of millions of fish.29
27 MDBA, Independent assessment of the 2018–19 fish deaths in the Lower Darling, interim report with provisional findings and recommendations, 20 February 2019, https://www.mdba.gov.au/publications/mdba-reports/independent-panel-assess-fish-deaths-lower-darling, viewed 15 March 2019.
28 A Class licences were created by the New South Wales Government in 2012 to provide irrigators access to water during times of low river flow.
29 Australian Academy of Science, Investigation of the causes of mass fish kills in the Menindee region NSW over the summer of 2018–19, 18 February 2019, https://www.science.org.au/supporting-science/science-policy-and-sector-analysis/reports-and-publications/fish-kills-report, viewed 15 March 2019.
17Water monitoring report 2017–18
Box 1.3: Understanding water management in the Menindee Lakes
The Menindee Lakes are located in south-west New South Wales on the Darling River, about 200 km upstream of the Darling River’s junction with the River Murray. Several towns are reliant on these lakes for their urban water supply, including Menindee and Broken Hill.
The lakes were originally a series of natural depressions that would often dry up naturally and fill during floods. The lakes drained back into the Darling River. Modifications to use the lakes for water conservation and regulation along the Lower Darling River were undertaken during the mid-20th century. The lakes now supply water to Broken Hill, the Lower Darling and to water users along the Murray River in New South Wales, Victoria and South Australia under the Murray–Darling Basin Agreement. The Menindee Lakes are important breeding sites for native fish, and critical to maintaining fish stocks throughout the river system.
The lakes are owned by the New South Wales Government. The New South Wales Government agreed with the Australian, Victorian and South Australian governments in 1963 that water from the lakes could be shared to meet downstream water needs when the volume of the lakes rises above 640 GL and until it drops below 480 GL. This agreement reflects the fact that when the Menindee storages were created they impeded flows of water through to Victoria and South Australia.
The Murray–Darling Basin Authority (MDBA) calls on water to fulfil New South Wales, Victorian and South Australian entitlements when there is water in the Menindee lakes. The Menindee Lakes have been managed by New South Wales since December 2017 when water levels dropped below 470 GL.
The MDBA draws water from the Menindee Lakes first because the Dartmouth and Hume dams do not suffer from the high evaporation rates of the Menindee Lakes. The Menindee Lakes can hold up to 2050 GL and are estimated on average to lose 426 GL a year to evaporation, and up to 700 GL a year when they are full. This is because the lakes are relatively shallow storages with large surface areas and are located in a semi-arid region of the country. Dartmouth Dam can hold up 3850 GL with net evaporation30 of close to zero. Storing water in the storages furthest upstream also provides the greatest flexibility in meeting downstream orders—Menindee Lakes cannot meet orders upstream of Wentworth.
The New South Wales Government proposed altering the way it manages the Menindee Lakes water storage to reduce evaporation. It also constructed a $500 million pipeline from the Murray River to Broken Hill to provide the city with an alternative water supply. The plans have been controversial, raising concerns from stakeholders that the government will have less reason to keep the lakes full and hence will see the Lower Darling River run dry more often.Sources: MDBA, Menindee Lakes factsheet, https://www.mdba.gov.au/sites/default/files/pubs/1104_MDBA-factsheet_
menindee-lakes.pdf, viewed 25 March 2019; MDBA, ‘Menindee Lakes: the facts’, https://www.mdba.gov.au/river-murray-system/running-river-murray/menindee-lakes-facts, viewed 25 March 2019; MDBA, ‘Fish deaths in the Lower Darling’, https://www.mdba.gov.au/managing-water/drought-Murray–Darling-basin/fish-deaths-lower-darling, viewed 25 March 2019.
30 Net evaporative loss is the difference between the evaporative loss and the rain falling directly onto the dam. See Agriculture Victoria, Farm water calculator: determining the evaporative loss from a farm dam, http://calculator.agriculture.vic.gov.au/fwcalc/information/determining-the-evaporative-loss-from-a-farm-dam, viewed 25 March 2019.

18 Water monitoring report 2017–18
02Murray–Darling Basin policy, legal and governance arrangements were widely reviewed and evaluated
Tumut River, NSW Source: iStockphoto
20 Water monitoring report 2017–18
2. Murray–Darling Basin policy, legal and governance arrangements were widely reviewed and evaluated
Key points
�� Management and oversight arrangements for the Murray–Darling Basin (MDB) continued to generate widespread debate and attract public scrutiny in 2017–18.
�� Governments initiated or continued a significant number of major MDB-related policy reviews and inquiries in 2017–18 and into the following year. The resulting recommendations are likely to result in further changes to policy settings and governance arrangements.
�� On 3 April 2019, the Australian Minister for Agriculture and Water Resources, the Hon David Littleproud MP, amended the water charge rules following ACCC advice in 2016. The Minister adopted most of the amendments proposed by the ACCC, but did not accept advice to strengthen non-discrimination requirements, expand the current regulation of distributions, or remove the right of private action. The revised rules will commence on 1 July 2020.
This chapter reports on significant developments Murray–Darling Basin (MDB) policy, legislation and governance over 2017 and 2018, and into 2019. Over the period, both planned and ad hoc reviews and evaluations of the MDB policy and governance framework led to or foreshadowed further changes to policy settings and governance arrangements. As a result, the regulatory environment in which administrators, irrigators, infrastructure operators, and other water users operate continues to evolve.
�� Section 2.1 describes developments arising from the major Australian and state government parliamentary inquiries, reviews and policy changes initiated following allegations of water theft and corruption on the Australian Broadcasting Corporation’s Four Corners program in July 2017.
�� Section 2.2 covers planned reviews that the Water Act 2007 (Cth) (Water Act) requires of policy and governance arrangements.
�� Section 2.3 notes changes to the Water Act and the Murray–Darling Basin Plan (the Basin Plan), and relevant Australian and state government parliamentary inquiries and policy reviews that affected the MDB.
�� Section 2.4 briefly outlines recent developments and the resulting reviews and inquiries foreshadowed for 2018–19.
2.1 Compliance concerns in New South Wales led to commitments to improve monitoring and enforcement across the Murray–Darling Basin
As we noted in the 2016–17 water monitoring report, Australian and state governments initiated a number of inquiries after allegations of water theft and corruption in New South Wales aired on the Australian Broadcasting Corporation’s Four Corners program in July 2017. These inquiries included:
�� the Ken Matthews-led inquiry into New South Wales water management and compliance31 (the Matthews Review, section 2.1.1)
�� a Basin-wide compliance review undertaken by the Murray–Darling Basin Authority (MDBA) and reviewed by an independent panel (section 2.1.2)32
31 K Matthews, Independent review of water management and compliance, NSW Department of Industry, NSW, 2017, https://www.industry.nsw.gov.au/about/our-business/independent-review-water-management-and-compliance viewed 8 March 2019.
32 MDBA, Murray–Darling Basin water compliance review, MDBA, 25 November 2017, https://www.mdba.gov.au/publications/mdba-reports/murray-darling-basin-water-compliance-review, viewed 8 March 2019.
21Water monitoring report 2017–18
�� an Australian Senate inquiry into MDB water market integrity (section 2.1.3)
�� the South Australian Royal Commission into the MDB (section 2.1.4).
These inquiries have now reported their conclusions. The MDBA and other Australian and state agencies have responded, and in some cases have changed, or are changing, their organisational structures, laws, policies and management arrangements in response to the inquiry findings and recommendations.
A series of fish deaths in the Darling River at the end of 2018 and the beginning of 2019 (see section 1.8) prompted renewed calls for new inquiries into the MDB’s management, including calls for an Australian Government Royal Commission.
2.1.1 New South Wales committed to change policies and administrative arrangements to manage water more equitably and transparently
The New South Wales Government published its Water Reform Action Package in response to the Matthews Review in December 2017. Key reforms from that package have been implemented, including:
�� establishing a new Lands and Water division in the Department of Industry and training staff to build capability, improve standards and embed an ethical culture
�� adopting a new metering framework, which commenced on 1 December 2018, requiring appropriate metering equipment to be installed, used and properly maintained on all water supply work approvals (box 2.1)33
�� forming the Natural Resources Access Regulator (NRAR) in April 2018, giving it independence from Ministerial direction, with responsibility for compliance and enforcement of the state’s water law.
At 12 February 2019, the NRAR had undertaken 258 audits and inspections across New South Wales and commenced six prosecutions (at least three of which relate to actions in the Barwon–Darling Water Sharing Plan area).34 Section 7.1.1 has more information about the NRAR.
2.1.2 The Murray–Darling Basin Authority and Basin states developed the Basin Compliance Compact for better outcomes across the Basin
The Council of Australian Governments (COAG) endorsed the Basin Compliance Compact (the Compact) on 12 December 2018. The Compact signals the Commonwealth and Basin state governments’ joint commitment to a transparent and consistent approach to water resource management and regulation. The aim of that approach is to restore public confidence in the MDB. Signatories agreed to implement a risk-based compliance culture that focuses on increasing transparency and accountability, developing compliance and enforcement frameworks, improved metering and measurement, finalising water resource plans (WRPs), and protecting and managing environmental water.35
33 The new metering framework aims to improve the standard and coverage of non-urban water meters in New South Wales, and will be implemented through a staged roll-out over five years. NSW Department of Industry, NSW non-urban water metering framework, NSW Department of Industry, NSW, 2018, https://www.industry.nsw.gov.au/water-reform/metering-framework, viewed 18 March 2019.
34 NRAR, NRAR’s response to the ACCC’s voluntary data request, 22 February 2019.
35 Murray–Darling Basin Ministerial Council, Murray–Darling Basin Compliance Compact, MDBA, Canberra, 8 June 2018, p. 2, https://www.mdba.gov.au/sites/default/files/Basin-Compliance-Compact-180702-D18-31184.pdf, viewed 21 January 2019.
22 Water monitoring report 2017–18
Box 2.1: New South Wales’ updated metering policies do not apply within off-river infrastructure operators’ networks
As discussed in the Independent investigation into NSW water management and compliance36 (the Matthews Review) and the Murray–Darling Basin Water Compliance Review37, accurate metering of water is required for sound water management. Basin states are working towards a nationally consistent framework, including nationally consistent water metering standards, under the National Water Initiative.38
The New South Wales Government released its Water Reform Action Plan39 in 2017, in response to the Matthews report. This plan was followed by the New South Wales non-urban water metering framework40, which includes the New South Wales non-urban water metering policy, and new metering provisions in the Water Management (General) Regulation 2018 and Water Management Act 2000 (Cth). The framework, which commenced on 1 December 2018, requires metering equipment to be installed, used and properly maintained on all water supply work approvals, works of infrastructure operators (IOs) at the extraction point from a water source, and works authorised to take water under the Water Act 1912 (NSW).
Further, all new and replacement meters covered by the framework must be pattern-approved41 and installed by a qualified person in accordance with AS4747. The framework provisions do not apply to meters that measure the water taken by privately managed off-river IO customers from water infrastructure managed by the IO.42 These private off-river IOs develop and enforce their own metering policies, practices and procedures.43
The Compact requires the MDBA to prepare an annual report assessing progress in implementing these activities. The first report was published in December 2018 and found Basin states had made considerable progress against their commitments under the Compact in a relatively short time.44 Nevertheless, the MDBA considers it is unlikely that New South Wales will be able to finalise its WRPs before 30 June 2019 (see box 1.1 in the Water monitoring report: supplementary information, 2017–18) and transparency of progress against other required actions among some Basin states.45
The MDBA’s March 2019 report on WRP progress reported that Basin states have agreed to enter into agreements with the Australian Government to ensure key elements of the WRPs are given effect from 1 July 2019 where WRPs are not accredited by that date.46 Parties agreed to review the compact by 30 June 2020.
36 K Matthews, Independent review of water management and compliance, NSW Department of Industry, NSW, 2017, https://www.industry.nsw.gov.au/about/our-business/independent-review-water-management-and-compliance, viewed 21 February 2019.
37 MDBA, Murray–Darling Basin water compliance review, MDBA, 25 November 2017, https://www.mdba.gov.au/publications/mdba-reports/murray-darling-basin-water-compliance-review, viewed 8 March 2019.
38 COAG, Intergovernmental Agreement on a National Water Initiative, Department of Agriculture and Water Resources, Canberra, 2004, paragraphs 87 and 88, http://www.agriculture.gov.au/SiteCollectionDocuments/water/Intergovernmental-Agreement-on-a-national-water initiative.pdf, viewed 21 February 2019.
39 NSW Department of Industry, NSW Government’s Water Reform Action Plan, NSW Department of Industry, 2017 https://www.industry.nsw.gov.au/water-reform/metering-framework viewed 21 February 2019.
40 NSW Department of Industry, NSW non-urban water metering framework, NSW Department of Industry, 2018, , viewed 21 February 2019.
41 Pattern approval determines the accuracy of a meter and is granted by the National Measurement Institute in the Australian Government Department of Industry, Innovation and Science. National Measurement Institute, Water meters, Australian Government Department of Industry, Innovation and Science, Canberra, undated. www.measurement.gov.au/Industry/business/Pages/Water-Meters.aspx, viewed 21 February 2019.
42 Sections 101A of the Water Management Amendment Act 2018 (NSW) and clauses 229 and 231 of the regulation.
43 NSW Department of Industry, NSW Water Metering Implementation Plan, NSW Department of Industry, NSW, 2018, p. 18, www.water.nsw.gov.au/data/assets/pdf_file/0003/547257/metering_nsw_metering_implementation_plan.pdf, viewed 21 February 2019.
44 MDBA, Murray–Darling Basin Compliance Compact interim assurance report 2018, December 2018, https://www.mdba.gov.au/sites/default/files/pubs/murray-darling-compliance-compact-assurance-report.pdf, viewed 18 March 2019.
45 MDBA, Murray–Darling Basin water compliance review report, 25 November 2017, https://www.mdba.gov.au/publications/mdba-reports/murray-darling-basin-water-compliance-review, viewed 8 March 2019.
46 MDBA, Water resource plan—quarterly report, March 2019, Canberra, 2019, https://www.mdba.gov.au/sites/default/files/pubs/water-resource-plan-quarterly-report-march-2019.pdf, viewed 8 March 2019.
23Water monitoring report 2017–18
2.1.3 The Australian Senate inquiry found market integrity and public trust in the Basin Plan had been eroded
The Australian Senate’s inquiry into the integrity of the water market in the MDB began in August 2017 and reported on 29 November 2018. It inquired into allegations of water theft and corruption in water resources management in the MDB.
The inquiry final report acknowledged the majority of submissions provided support for the Basin Plan, but also noted stakeholder concerns.47 These concerns included that the integrity of the water market has been eroded by a lack of transparency, diminished compliance and enforcement capability, imbalanced consultation processes, and legislative loopholes (such as a lack of provisions for the ‘shepherding’ of environmental water).
The report concluded flawed and inconsistently applied compliance and enforcement mechanisms allowed breaches of regulations related to water use and licence conditions to occur, particularly in New South Wales. It found these breaches, coupled with a lack of transparency around government operations, have undermined public trust in the MDB regulatory framework.
To strengthen compliance and restore public trust in the system, the inquiry supported separating the policy and compliance functions of the MDBA to create the Basin Plan Regulator (consistent with a draft recommendation by the Productivity Commission in its Basin Plan evaluation—see section 2.2.3). It also recommended developing a uniform schedule of evidentiary requirements, penalties and sanctions to ensure consistent prosecution of water legislation breaches across states. The Compact is addressing this recommendation (section 2.1.2).
2.1.4 The South Australian Murray–Darling Basin Royal Commission found major flaws in the implementation of the Water Act and the Basin Plan
The then Premier of South Australia, the Hon Jay Weatherill, announced in November 2017 that South Australia would hold a Royal Commission into the operations and effectiveness of the MDB system, with a wide ranging terms of reference, including regarding implementation of WRPs and sustainable diversion limits (SDL) under the Basin Plan (see box 1.1 in the Water monitoring report: supplementary information, 2017–18).48
Following extensive consultation, Commissioner Bret Walker SC delivered his report to the Governor of South Australia on 29 January 2019. Recommendations to the South Australian Government included amendments to the Basin Plan and the Water Act. For these recommendations to be actioned, the relevant combination of the Australian Government, the other Basin states and the MDBA need to agree.
The report found key aspects of the Basin Plan had not been enacted or implemented in accordance with the objects and purposes of the Water Act, and the Basin Plan is not likely to achieve its objects and purposes or those of the Water Act. The Commissioner expressed ‘deep pessimism whether the objects of the Act and Plan will be realised’.49 He also recorded his strongly held view that adoption of a triple bottom line approach (balancing social, economic and environmental outcomes) had resulted in an SDL that did not reflect an environmentally sustainable level of take, contrary to section 23 of the Water Act (box 2.2).
47 Australian Senate Rural and Regional Affairs and Transport References Committee, Integrity of the water market in the Murray–Darling Basin, 29 November 2018. https://www.aph.gov.au/Parliamentary_Business/Committees/Senate/Rural_and_Regional_Affairs_and_Transport/MurrayDarlingPlan/~/media/Committees/rrat_ctte/MurrayDarlingPlan/Report/report.pdf, viewed 19 March 2019.
48 The South Australian Murray–Darling Basin Royal Commission’s terms of reference are available at https://www.mdbrc.sa.gov.au/resources/terms-reference.
49 South Australian Murray–Darling Basin Royal Commission, Murray–Darling Basin Royal Commission report, January 2019, p. 11.
24 Water monitoring report 2017–18
The MDBA issued a formal response to the report,50 rejecting the Commission’s assertion that the Basin Plan was unlawful or had been made unlawfully. The MDBA response stated the report did not present evidence to support the commission’s assertion of maladministration, negligence and unlawful conduct by MDBA officers. The MDBA recognised, however, that the Report ‘draws attention to some important issues’, consistent with the MDBA Report Card51 and the recent Productivity Commission review.
The Australian Minister for Agriculture and Water Resources, the Hon David Littleproud MP, also responded to the Royal Commission report, declaring that the ‘Legal advice to the Commonwealth Government under both sides of politics for the last seven years has been consistent—that the Basin Plan is lawful and was lawfully made’.52
The South Australian Premier, the Hon Steven Marshall, requested the findings of the Royal Commission be considered at the next COAG meeting.
50 MDBA, Response to the South Australian Royal Commission final report, 31 January 2019, https://www.mdba.gov.au/sites/default/files/pubs/MDBA-response-SA-Royal-Commission-Feb-20.pdf, viewed 13 March 2019.
51 MDBA, 2018 report card, published 13 December 2018, https://www.mdba.gov.au/basin-plan/basin-plan-annual-report-card, viewed 13 March 2019.
52 The Australian Minister for Agriculture and Water Resources the Hon David Littleproud MP, ‘Statement on SA Royal Commission’, media release, 31 January 2019.
25Water monitoring report 2017–18
Box 2.2: South Australian Royal Commission made wide ranging recommendations
The Royal Commission report and its recommendations were substantial. Key responses to the terms of reference were:
�� Key aspects of the Murray–Darling Basin Plan (Basin Plan) have not been enacted or implemented in accordance with the objects and purposes of the Water Act 2007 (Cth).
�� The Basin Plan, its implementation, and any proposed amendments to the Basin Plan are not likely to achieve the objects and purposes of the Water Act and Basin Plan, and the ‘enhanced environmental outcomes’ and additional 450 GL provided for in the Act.
�� There is no reasonable prospect of all water resource plans (WRPs) being delivered in full and in a form compliant with a valid Basin Plan.
�� All WRPs were premised on a wrong sustainable diversion limit (SDL), and many have been inadequately resourced, particularly in New South Wales.
�� The report pointed to scope for legislative amendments to achieve the objects and purposes of the Water Act and the Basin Plan:
– re-determine the environmentally sustainable level of take, and consequently amend the Basin Plan provisions relating to the Basin-wide and resource unit SDLs, such that the additional 450 GL becomes redundant
– amend the SDL adjustment mechanism and repeal the legislative cap on buyback of 1500 GL
– address existing limitations on genuine Aboriginal engagement, including by amending current requirements to ‘have regard to’ and non-compulsory representation on the Murray–Darling Basin Authority (MDBA) Board
– address the lack of recognition of, and insert a requirement for, connectivity between WRP areas
– insert provisions in the Water Act and the Basin Plan requiring real-time data sharing and publication on water extractions.
�� The report also identified impediments to achieving the objects and purposes of the Water Act and the Basin Plan, including:
– the reliance of Basin Plan implementation on co-operative federalism, which lends itself to conversation among some Basin states about their desire to ‘withdraw’
– insufficient consideration by the MDBA of proper and lawful administration of the Water Act, particularly in the context of the Basin-wide SDL, climate change and administrative secrecy
– failure by the Australian Government to properly resource and build on the scientific base, and in the context of appropriate metering and monitoring
– failure to implement appropriate methods to measure and regulate floodplain harvesting
– the MDBA’s failure to progress constraints53 relaxation proactively, particularly given the distributed responsibilities for compensation
– failure of development planning to account for impacts on the shared water resource of the Murray–Darling Basin.
53 Constraints are ‘river management practices and structures that govern the volume and timing of regulated water delivery through the river system’ (MDBA, Constraints Management Strategy 2013 to 2024, 2013, publication no. 28/13). They may be physical limitations on the volume of flow (such as the Barmah Choke), or infrastructure such as dams, water storages, weirs, regulators and bridges. They can also include practices and operations by which the MDB rivers and dams are managed, such as when and how much water is delivered for consumptive uses to townships, cities and farms.
26 Water monitoring report 2017–18
2.2 The Murray–Darling Basin Authority and Productivity Commission found issues with the Basin Plan’s impact and implementation
In 2017 the MDBA commenced an evaluation of the Basin Plan’s implementation (section 2.2.1) and completed its review of the impacts of the Basin Plan in the northern MDB (section 2.2.2), while the Productivity Commission began its first five year assessment of the Basin Plan (section 2.2.3).
2.2.1 The Murray–Darling Basin Authority’s evaluation of Basin Plan implementation found signs the Plan is working but progress lagged in important areas
The MDBA evaluated the Basin Plan five years after implementation began. Between December 2017 and June 2018, it published an evaluation report (supported by a series of technical reports) to document progress on key elements of the plan.
As part of this work, the MDBA assessed the social and economic impacts of the Basin Plan on affected communities, publishing detailed information about 40 southern MDB irrigation-dependent communities. It also assessed the Basin Plan’s impact on irrigation infrastructure operator (IIO) business models.
The MDBA’s report included the following messages about IIOs:
�� Water recovery through on-and off-farm water saving investments has provided more water for the environment without the negative impact of water buybacks on the water volume available for irrigated production.
�� Investments in off-farm efficiencies have led to better water supply delivery efficiency for IIOs, which provided benefits for IIOs’ customers.
�� Viticultural and horticultural production has fallen in some areas supplied by IIOs (such as Berri and Merbein), with offsetting increases in other locations (such as Robinvale and Euston).
�� There are likely to be ongoing system rationalisation challenges for IIOs as a result of transfers of water entitlements out of irrigation districts and reductions in delivery shares. These would require analysis for the MDBA’s 2020 evaluation.54
�� The MDBA also recognised, however, that irrigators were using trade in entitlements, allocations and delivery shares to adapt to changes (see box 2.3).
54 MDBA, Basin Plan evaluation addendum, 2018, p. 92.https://www.mdba.gov.au/sites/default/files/pubs/basin-plan-evaluation-addendum-jun2018.pdf, viewed January 2019.
27Water monitoring report 2017–18
Box 2.3: The water market is playing a more prominent role in irrigators’ farm business planning and risk management decisions
In 2018 the Murray–Darling Basin Authority evaluation report on the Murray–Darling Basin Plan concluded:
Despite water recovery, the maximum real value of irrigated agriculture in the Basin has remained fairly constant at more than $7B since 2001. Irrigated agriculture therefore remains a significant contributor to the Basin economy. The total value of all agriculture in the Basin rose by around 4%. By contrast, the real value of Australia’s irrigated production and total agricultural production in Australia has increased by around 11% since 2001.
However, these aggregate statistics do not provide a clear picture of the effects of the Basin Plan. Other factors have also influenced the changes experienced in rural communities. For example, since water recovery commenced in 2008 there have been considerable changes in the mix and area of crops grown in the Basin. For example, there have been decreases in rice and milk production, and cotton production has moved into the southern Basin and increased significantly. Fruit and nut production has also increased in response to improvements in commodity prices. Reductions in viticultural and horticultural production in some areas have been offset by increases in other areas.
The water market is playing a more prominent role in irrigators’ farm business planning and risk management strategies. Depending on the overall direction of trade, the temporary and permanent water trading market is influencing the effects of water recovery in communities.
The emergence of new water trade products, such as trading of unused carryover space, are helping farmers find new ways to adapt to rapidly changing circumstances. Some irrigators are taking advantage of these opportunities, while others are finding it difficult to adapt, particularly given the pace at which many of the changes are occurring.55
2.2.2 Concerns about the northern Basin review amendments led Victoria and New South Wales to threaten to withdraw from the Basin Plan
The MDBA completed its review of the impacts of the Basin Plan in the northern MDB in July 2017. It recommended reducing the water recovery target for northern MDB catchments from 390 GL to 320 GL per year. Along with measures to improve water management (agreed by the Australian, Queensland and New South Wales governments), the MDBA considered this reduction would reduce the social and economic impacts of the Basin Plan in the northern MDB communities but reduction in environmental outcomes ‘would be minimised’.56
The Australian Assistant Minister for Agriculture and Water Resources, Senator the Hon Anne Ruston, made amendments to the Basin Plan in November 2017 to give effect to the outcomes of the northern MDB review57, including the 70 GL reduction of the water recovery target. The changes also included minor amendments to the Basin Plan water trading rules (on which the ACCC provided advice in 2016) and unrelated groundwater amendments. On 14 February 2018 the Commonwealth Parliament disallowed the November 2017 amendments. In response, the New South Wales and Victorian
55 MDBA, Basin Plan evaluation addendum, 2018, p. 10.
56 MDBA, 2016, The northern Basin review: understanding the economic, social and environmental outcomes from water recovery in the northern basin, November.
57 In 2016 the MDBA reviewed the Basin Plan recovery target of 390 GL of water for the river systems of the northern MDB. The review outcomes led the MDBA to propose reducing the target to 320 GL, provided the Australian, Queensland and New South Wales governments committed to implement ‘toolkit measures’ to enhance the effectiveness of use of environmental water while reducing the social and economic effects of the Basin Plan. See MDBA, The Northern Basin review: understanding the economic, social and environmental outcomes from water recovery in the northern Basin, November 2016, https://www.mdba.gov.au/sites/default/files/pubs/Northern-basin-review-report-FINAL.pdf, viewed 19 March 2019.
28 Water monitoring report 2017–18
governments threatened to withdraw from the Basin Plan unless the Commonwealth Parliament approved the 70 GL water reduction target.58
The Senate passed the Bill59 on 25 June 2018 and its provisions commenced on 28 June 201860 after the Government agreed to:
�� continue to deliver 450 GL of additional environmental water (but it will recover that water through water efficiency savings projects instead of through buybacks from irrigators). It will use $1.5 billion from the ‘water for the environment special account’ to fund these projects
�� work with the New South Wales Government to establish mechanisms to protect environmental flows, particularly in the northern MDB. This work includes the New South Wales Government (through legislation tabled in the New South Wales Parliament) implementing plans for temporary water restrictions, and mandatory conditions on access licences to protect environmental flows
�� strengthen compliance with MDB water laws, which includes implementing the key outcomes of the MDBA’s review of compliance and enforcement
�� establish a Northern Basin Commissioner to oversee the implementation of the northern MDB review and implement compliance commitments.61
Shortly after, the Minister directed the MDBA to reduce the environmental flows in the northern MDB by 70 GL, and the Basin Plan Amendment Instrument 2017 (no. 1) was remade without going through further consultation.62
2.2.3 The Productivity Commission found reform is required to manage significant risks to the Basin Plan’s implementation
The Productivity Commission is required to undertake five yearly assessments of the effectiveness of the implementation of the Basin Plan and WRPs.63 It commenced its first assessment in March 2018 and provided its final report to the Australian Government in December 2018.
The Productivity Commission acknowledged significant progress towards resetting the balance between environmental and consumptive use of water, as well as establishing improved water management arrangements. It noted the required water recovery task is largely complete and some of the new management arrangements established by Basin governments are working well.64
The Productivity Commission stated, however, Basin Plan implementation will be complex and challenging in the upcoming period.65 It flagged the high risk of supply and efficiency measures failing to meet their objectives on time and on budget. It noted WRP development and accreditation are well behind schedule, with complex issues yet to be resolved.66 It also identified an inherent conflict between the multiple roles of the MDBA, as well as a lack of clarity in responsibility for leading implementation of the Basin Plan.67
58 See ABC News, ‘Murray–Darling Basin: NSW moves to withdraw from plan as SA urges Commonwealth action’, 15 February, https://www.abc.net.au/news/2018-02-15/murray-darling-basin-plan-changes-blocked/9448280, viewed 7 April 2019; Department of Industry, ‘Labor and the Greens fail Basin rivers and people’, media release, NSW Government, 14 February 2018, https://www.industry.nsw.gov.au/media/releases/2018/labor-and-the-greens-fail-basin-rivers-and-people, viewed 7 April 2019; Minister for Water, ‘Response to northern Basin review disallowance’, media release, Victorian Government, 6 February 2018, https://www.premier.vic.gov.au/response-to-northern-basin-review-disallowance/, viewed 7 April 2019.
59 Water Amendment Act 2018 (Cth), s. 2.
60 Water Amendment Act 2018 (Cth), s. 2.
61 The Hon Tony Burke MP, ‘Murray–Darling Basin Plan back on track’, media release, 7 May 2018, https://www.tonyburke.com.au/media-releases/2018/5/8/media-release-murray-darling-basin-plan-back-on-track, viewed 4 April 2019.
62 The Hon David Littleproud MP, ‘Northern Basin Review is again law’, media release, 3 July 2018, http://minister.agriculture.gov.au/littleproud/Pages/Media-Releases/nbr-is-again-law.aspx, viewed 4 April 2019.
63 Water Act 2007 (Cth), s. 87.
64 Productivity Commission, Murray–Darling Basin Plan: five-year assessment, Final report no. 90, Canberra, 19 December 2018, pp. 9–11, https://www.pc.gov.au/inquiries/completed/basin-plan#report, viewed 31 January 2019.
65 ibid., p. 15.
66 ibid., p. 14.
67 ibid., p. 27.
29Water monitoring report 2017–18
As a result, the Productivity Commission considered reforms to institutional and governance arrangements are required to manage the significant risks to implementation.68 It recommended:
�� Basin governments take joint responsibility for leading Basin Plan implementation, rather than leaving it to the MDBA. The Murray–Darling Basin Ministerial Council should be ultimately accountable for implementation and should delegate responsibility to the Basin Officials Committee for managing the significant risks to successful implementation.
�� the MDBA separate into two institutions: the MDB Agency, which would drive intergovernmental collaboration and strategic service delivery, and the Basin Plan Regulator, which would carry out the MBDA’s compliance and evaluation functions.
�� the MDBA develop a revised Basin Plan Evaluation Framework and Basin governments develop a monitoring strategy to give effect to this framework by the end of 2019
�� the MDBA finalise and publish an assessment framework for evaluating the consistency of trade restrictions against the Basin Plan trading rules
�� Basin governments work with Standards Australia to revise water metering standards.69
In a letter accompanying the report, the Productivity Commission noted decisions made by the Ministerial Council on 14 December 2018 were relevant to many issues raised in the report but occurred after the report was finalised. These decisions included agreeing to:
�� allow WRPs to be submitted and accredited by 31 December 2019 (rather than 1 July 2019)
�� apply a socio-economic neutrality test to all efficiency measure projects before those projects are submitted to the Australian Government
�� address River Murray water delivery challenges
�� fund efficiency measure, supply measure and Northern Basin Toolkit projects70 to progress a work plan for constraints easing projects
�� appoint a standing Aboriginal member to the MDBA board.71
The Productivity Commission considered its report recommendations remain pertinent to successful implementation of the Basin Plan. It warned, however, the socio-economic neutrality test is impractical and requiring a project to demonstrate no negative socio-economic impacts would effectively block additional water recovery.72
68 The report warned of the massive potential costs if major shortcomings in current arrangements are not addressed and projects fail. These costs include an additional $564 million to reset the water allocation balance, lower environmental outcomes, further reductions in public trust in the Basin Plan and Basin governments, and possible implications for how water is managed for the environment, and for users’ needs. See Productivity Commission, Murray–Darling Basin Plan: five-year assessment, Final report no. 90, Canberra, 19 December 2018, p. 27.
69 ibid., pp. 35–59.
70 The Northern Basin Toolkit refers to measures the Australian, Queensland and New South Wales governments agreed to as part of the northern MDB review, to improve water management and allow the lowering of water recovery targets in the northern MDB from 390 GL to 320 GL.
71 MDBA, ‘Murray–Darling Basin Ministers meet in Melbourne’, media release, 14 December 2018, https://www.mdba.gov.au/media/mr/murray-darling-basin-ministers-meet-melbourne, viewed 31 January 2018.
72 Productivity Commission, Murray–Darling Basin Plan: five-year assessment, final report no. 90, Canberra, 19 December 2018, p. 40.
30 Water monitoring report 2017–18
2.3 Other inquiries examined water governance, management and service delivery and recommended changes
In 2017–18 governments and agencies across the MDB also reviewed a broad range of arrangements relating to water policy, planning and governance, including:
�� a Productivity Commission review of progress against the National Water Initiative (NWI) (section 2.3.1)
�� a House of Representatives Standing Committee inquiry into the management and use of Commonwealth environmental water (section 2.3.2)
�� a Victorian parliamentary committee inquiry into the management, governance and use of environmental water (section 2.3.3)
�� an inquiry into water supply augmentation for rural and regional New South Wales (section 2.3.4)
�� a Victorian review of water delivery share arrangements (section 2.3.5).
2.3.1 The Productivity Commission found good progress on the National Water Initiative, but noted work remains
The Productivity Commission completed its inquiry on National Water Reform, releasing the final report on 31 May 2018. It found good progress has been made in implementing the NWI, but further work remains. Reform priorities identified by the Productivity Commission include:
�� ‘maintaining the key foundations of water management, preventing the reemergence of outdated policies and avoiding the erosion of hard won reforms through backsliding
�� revising national policy settings in a range of areas, including entitlement and planning arrangements for extractive industries, and the water needs of Indigenous Australians
�� significantly enhancing national policy settings in:
– urban water management, including clearer roles and responsibilities for supply augmentation planning, improving economic regulation, enabling decentralised solutions and more outcomes focused environmental regulation
– environmental water management, including better integration with waterway management, strengthened and streamlined institutional, governance and management arrangements, and improved monitoring and evaluation for adaptive management
– new infrastructure, where the focus needs to be on ensuring environmental sustainability and financial viability before any government resources are committed for construction.’73
Box 7.1 includes further detail on the Productivity Commission’s assessment of water planning and management arrangements.
The Australian Government issued its response to the inquiry on 5 April 2019, welcoming its findings and supporting renewal of the 2004 Intergovernmental Agreement on the NWI.74
73 Productivity Commission, National water reform, report no. 87, 2018, p. 2.
74 The Government response to the inquiry can be accessed at http://www.agriculture.gov.au/about/reporting/obligations/government-responses/response-national-water-reform.
31Water monitoring report 2017–18
2.3.2 The Commonwealth Environmental Water Holder was found to manage its environmental water well, but improvements are possible
The House of Representatives Standing Committee on Environment and Energy tabled its report Inquiry into the management and use of Commonwealth environmental water in December 2018. The report inquired into the 2016–17 annual report of the Department of Environment and Energy, focusing on the management and use of Commonwealth environmental water. The report supported many current practices of the Commonwealth Environmental Water Holder, including:
�� its engagement with other stakeholders (while advocating that it continually improve this engagement)
�� its transparency relating to its use of environmental water
�� its ability to trade water (subject to environmental requirements).
The report also recommended the Australian Government continue to fund and support water efficiency-related infrastructure programs in the MDB. It advocated for Basin states to work together to ensure the use of environmental water flows achieves their aims, and related reporting is complementary and timely.75
2.3.3 A Victorian parliamentary committee report supported greater monitoring of environmental water management
The Victorian Parliament’s Environment, Natural Resources and Regional Development Committee delivered its final report on the management, governance and use of environmental water in November 2017. The inquiry examined matters such as the effectiveness of charging arrangements for, and the carryover of, environmental water in Victoria. It also considered how to address any barriers to the more efficient use of environmental water.
The government response to this report was tabled in the Victorian Parliament in December 2018. It supported greater monitoring of the effectiveness of environmental water and its social and economic impact on communities, further education to improve community understanding, and additional opportunities for communities to become involved in environmental watering decisions.76
2.3.4 The New South Wales Legislative Council inquiry into rural/regional water supply augmentation called for more long term water planning
The New South Wales Legislative Council’s inquiry into the augmentation of water supply for rural and regional areas delivered its final report in May 2018.77 The inquiry examined New South Wales Government agencies’ performance in progressing the augmentation. Its final report warned it will be necessary to augment water for the state’s agricultural production in the face of significant population growth forecasts. It noted a lack of long term planning for the management of supply and water in New South Wales, despite local and regional will to invest in planning.
75 House of Representatives Standing Committee on Environment and Energy, Inquiry into the management and use of Commonwealth environmental water, 2018, https://www.aph.gov.au/Parliamentary_Business/Committees/House/Environment_and_Energy/EnvironmentalWater/Report, viewed 19 March 2019.
76 Victorian Government, Inquiry into the management governance and use of environmental water: government response, 2017, pp. 1–3.
77 New South Wales Legislative Council Portfolio Committee No. 5—Industry and Transport, Augmentation of water supply for rural and regional New South Wales, 14 May 2018, https://www.parliament.nsw.gov.au/lcdocs/inquiries/2390/Augmentation%20of%20water%20supply%20for%20rural%20and%20regional%20New%20South%20Wales.pdf, viewed 19 March 2019.
32 Water monitoring report 2017–18
The report strongly recommended the government develop a water equation for supply and demand to support strategic planning for the next 50 years. This should be informed by community consultation and factor in population growth forecasts as well as water demand projections based on current estimates of demand for agricultural products. It also supported the Matthews Review’s recommendations to introduce a universal requirement for metering (‘no metering, no pumping’) and monitoring arrangements, and to strengthen and better resource compliance and enforcement.78
The New South Wales Government’s response to the final report79 supported these recommendations, at least in principle, but not the recommendation to renegotiate the Basin Plan. The response drew attention to initiatives already underway to improve water management in the state, such as the NRAR (sections 2.1.1 and 7.1.1).80
2.3.5 Victoria progressed significant reforms to water delivery share arrangements
Victoria reviewed water delivery share arrangements in 2018, meeting a commitment in action 4.3 of Water for Victoria81 to examine how delivery shares are working and how their future use could support affordable and resilient irrigation districts that are attractive to new businesses.82 The review recommended actions for northern Victoria, and set out principles for clarity and transparency around delivery shares (including required information on costs and pricing, delivery system operations and property sales). Outcomes and actions proposed for Lower Murray Water (LMW) and Goulburn–Murray Water (GMW) (box 2.4) address irrigator concerns unique to each region.
78 New South Wales Legislative Council Portfolio Committee no. 5—Industry and Transport, Augmentation of water supply, 2018, pp. xix–xxiv.
79 New South Wales Government, NSW Government response to the inquiry into the augmentation of water supply for rural and regional New South Wales, 14 November 2018, https://www.parliament.nsw.gov.au/lcdocs/inquiries/2390/Government%20response%20%20Water%20augmentation%20-%2014%20November%202018.pdf, viewed 18 March 2019.
80 NSW Government, NSW Government response to the inquiry into the augmentation of water, 2018.
81 Water for Victoria, the Victorian Government’s plan for water developed in response to the impact of climate change and a growing population, is available at https://www.water.vic.gov.au/water-for-victoria, viewed on 24 March 2019.
82 The two reports, Outcomes and Actions for the Sunraysia Irrigation Districts and Outcomes and Actions for the Goulburn–Murray Irrigation Districts, are available at https://engage.vic.gov.au/delivery-share-review, viewed 16 January 2019.
33Water monitoring report 2017–18
Box 2.4: Victoria reviewed delivery share arrangements
Irrigation infrastructure operators in Victoria manage allocation of network capacity and water delivery largely through the mechanism of delivery shares.83 Delivery shares are one form of water delivery right. Water delivery rights enable irrigation infrastructure operators to manage access to their network and provide a basis for charging customers to recover the costs of operating the network. As demand for services changes, operators need to plan for and manage their network capacity. Two tools that assist operators to do this are termination fees and trade of water delivery right, but there are other changes to delivery arrangements that can be used to facilitate better network outcomes.
The Victorian Department of Environment, Land, Water and Planning (DELWP) completed a review of delivery share arrangements in northern Victoria in 2018. The review was in response to significant change in water use patterns seen before the 2007 unbundling reforms due to reduced water availability, new technology, global markets and commodity prices. The review examined how well delivery shares perform against the five purposes they were designed for, that is to:
�� manage the obligation to continue a delivery service
�� manage level of service, including rationing in congestion events
�� share the fixed costs of irrigation infrastructure
�� protect from price shocks as water is traded
�� signal areas that could be rationalised.
Options to alter or replace delivery shares were also considered.
The review made a range of recommendations, with some proposed for immediate implementation and others for further investigation. It recommended some different approaches within the Sunraysia and the Goulburn–Murray irrigation districts, reflecting the different pressures and circumstances in the Lower Murray Water and Goulburn–Murray Water networks.
The outcomes for Sunraysia were to:
�� facilitate markets and trade in delivery shares, providing new tools and developing products that meet irrigation needs, and putting in systems so irrigators can adjust their access to delivery infrastructure as their need for water changes
�� improve tools for managing system operation and deliverability constraints, making sure there are clear rights and processes in place to manage water delivery, protect delivery rights and ensure equitable access to shared infrastructure, clearly and transparently linked to delivery shares
�� improve the quality, transparency and timeliness of information and communication on delivery shares
�� strengthen and clarify the over-arching governance and pricing principles for delivery shares and termination fees to ensure that changes in water ownership and use are taken into consideration, that prices reflect actual cost and service received and infrastructure management reflects changing water use. Pricing and infrastructure management decisions are to be supported by high quality and transparent information on water trade and use.
83 The terminology for delivery shares varies between Basin states and IOs. Other names include ‘water delivery rights’, ‘delivery entitlements’, or ‘water supply contracts’. Section 1.5.3 in the Water monitoring report: supplementary information, 2017–18 explains these rights.
34 Water monitoring report 2017–18
The outcomes for Goulburn–Murray districts were:
�� to help irrigators to adjust the delivery shares they hold through new and existing pathways, providing clearer signals for infrastructure management. This includes new tools and options to trade or terminate delivery shares, including facilitated markets, limited term contract arrangements, and termination fee discounts linked to rationalisation opportunities
�� set tariff and pricing principles that help to adjust the infrastructure footprint, including exploring major reforms for alternative pricing models, ensuring tariffs reflect the costs of service, and that effective price signals are set to that inform how infrastructure is managed
�� provide clear benefits for irrigators to holding delivery shares, in the level of service received and in how the system operates and ensuring that benefits flow to those who contribute to maintaining the irrigation system
�� improve the quality, transparency and timeliness of information and communication on delivery shares
�� ensure Goulburn–Murray Water’s costs and pricing are clear and transparent
�� capture delivery shares up front in property transactions, making sure that people purchasing properties in irrigation districts have a clear understanding of the obligations, costs and options involved with the delivery shares tied to the property.
Further consultation and collaboration is planned, working with irrigators to confirm the proposed actions and to develop plans for how and when the agreed changes will be put in place.
More information on the review can be found at https://engage.vic.gov.au/delivery-share-review.
2.4 The Australian Minister for Agriculture and Water Resources revised the water charge rules
On 13 February 2019, the Australian Minister for Agriculture and Water Resources, the Hon David Littleproud MP, announced his intention to make changes to the water charge rules. The water charge rules improve pricing transparency by requiring the publication of information. They also provide a framework for setting many of the regulated charges levied on water users by governments and infrastructure operators (IOs) in the MDB. The rule changes follow advice given to the Minister by the ACCC in September 2016.
The Minister had already accepted the ACCC’s advice to remove the requirements for some IOs to prepare network service plans, with this change coming into effect on 1 July 2017. In his decision on 13 February 2019, the Minister accepted the ACCC’s advice to:
�� combine the three sets of water charge rules administered by the ACCC into one instrument
�� require IOs to include more information on their schedule of charges
�� require IOs to provide more information to customers about termination fees
�� return regulation of on-river infrastructure to Basin states, except in limited specific circumstances.
The Minister did not accept the ACCC’s advice to:
�� strengthen non-discrimination provisions
�� make changes to expand the scope of current regulation to require financial and water distributions to be made on a non-discriminatory manner
�� remove the private right of action for breaches of the rules.
35Water monitoring report 2017–18
�� The ACCC had supported strengthened non-discrimination provisions as being consistent with and contributing to the achievement of Basin Water Charging Objectives and Principles. In particular, to the achievement of ‘user pays’, full cost recovery and avoiding perverse or unintended pricing outcomes.84
The Minister advertised these changes would commence on 1 July 2019. After further consultation, the changes will now take effect on 1 July 2020 to allow for a smooth transition to the arrangements under the amended rules.
84 ACCC, Review of the Water Charge Rules final advice, September 2016, p. 72

36 Water monitoring report 2017–18
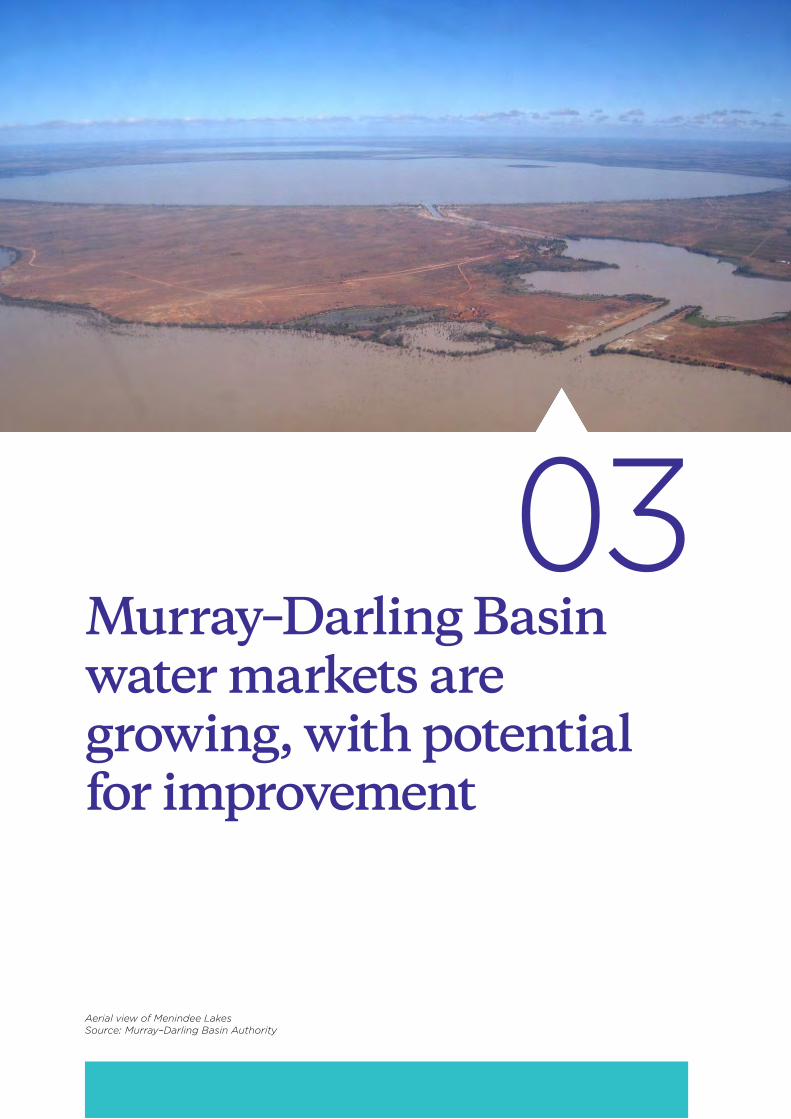
03Murray–Darling Basin water markets are growing, with potential for improvement
Aerial view of Menindee Lakes Source: Murray–Darling Basin Authority
38 Water monitoring report 2017–18
3. Murray–Darling Basin water markets are growing, with potential for improvement
Key points
Development of Murray–Darling Basin water markets
�� Within the Murray–Darling Basin, markets for tradeable water rights (including water delivery rights) have developed significantly, as shown by increasing trade in more complex products and new entrants into water markets.
�� A range of reviews and reports identified significant progress by Basin states on compatible arrangements for water trade but also identified opportunities for further reform to strengthen market operation.
�� Work to improve market transparency is being undertaken by the Murray–Darling Basin Authority and by Basin state government agencies to enhance the quality and availability of information about trade (in particular, how prices are reported) and to review trade restrictions.
�� Estimates of market value rely on the accuracy and completeness of price data. Concerns about data reliability arise from different approaches to the collection of price information across Basin state water registers and the lack of procedures to verify reported prices.
�� Within off-river infrastructure operators’ (IOs) districts, customers are managing their water and delivery capacity needs by trading water (that is, allocations, irrigation rights and water access entitlements) and water delivery rights.
Infrastructure operator trade
�� Allocation trade volumes within and out of off-river IO areas declined from 2016–17 to 2017–18, reflecting seasonal conditions. Over that period, off-river IOs reported allocation trade figures showing a 20 per cent decrease in total allocation trade and the volume of allocation traded out of off-river IO networks decreased by 23 per cent.
�� The aggregate volume of water delivery rights traded in off-river IOs increased nearly 10 per cent from 2016–17 to 2017–18, largely due to trade in Murrumbidgee Irrigation Limited and Jemalong networks.
This chapter makes some observations about recent development of Murray–Darling Basin (MDB) water markets and reports on trade-related activity in 2017–18 for off-river infrastructure operators (IOs):
�� Section 3.1 describes recent developments in Basin states’ efforts to improve water market effectiveness and describes some opportunities for further improvements, including market information and price data.
�� Section 3.2 discusses our observations about data reported to the ACCC by off-river IOs for 2017–18 water allocation and water delivery right (WDR) trade.
�� Section 3.3 outlines concerns about the reliability of reported price data for water trades.
�� Section 3.4 presents the results of allocation trade reported by off-river IOs.
�� Section 3.5 covers WDR trade reported by the off-river IOs.
39Water monitoring report 2017–18
3.1 Murray–Darling Basin water market effectiveness has improved since 2007 but market functioning has room for improvement
The Water Act 2007 (Water Act) incorporated the Basin water market and trading objectives and principles, reflecting the policy commitments made under the National Water Initiative (NWI) to improve water markets. These objectives included to:
�� facilitate the operation of efficient water markets and the opportunities for trading within and between states and territories, where water resources are physically shared or hydrologic connections and water supply considerations will permit water trading
�� minimise transactions costs on water trades including through good information flows, registry, regulatory and other arrangements
�� enable the appropriate mix of water products to develop based on water access entitlements or which can be traded permanently or temporarily, or through leasing or other trading options’
�� recognise and protect environmental needs and protect third party interests.
In its 2017 review of progress on the NWI, the Productivity Commission stated there had been good progress in implementing water market related reforms under the NWI. However, further steps to improve the functioning of water markets included a need to review trade rules designed for hydrological constraints and reduce transaction costs with water trading, such as speeding up trade approvals and reducing trade application charges.85
Building on commitments set out in Water for Victoria86, the Victorian Government conducted an assessment of the effectiveness of Victoria’s water markets in the second half of 2017.87 The report found that water markets overall were contributing to the desired outcome with equitable and efficient ways of allowing access and sharing of Victoria’s water resources and that Victoria’s northern regulated surface water market area was working efficiently. The report also found some priority areas for improvement, which included:
�� ensuring that optimal trade rules, processes and governance arrangements in the northern regulated surface water market area are in place and that market participants are well informed and public water information and communication could be improved
�� improving public water information and communication
�� strengthening the fundamental architectural requirements of unregulated surface water and groundwater markets.
The report also found that there is potential for increased trade in groundwater markets, outside the MDB, there was untapped trade potential for urban water in the southern regulated surface water market, and that there may be benefit of trade for the western regulated surface water market given that there were diverse users and increasing scarcity from climate change.
In 2017 the New South Wales Government also looked at water market and trading arrangements. Its report concluded water markets has helped manage the two extreme wet and dry periods in New South Wales that had occurred over the last 15 years. It also found environmental water purchases had made progress towards targets in the Murray–Darling Basin Plan (Basin Plan) but there was a need to further improve the water market in New South Wales to keep up with new and changing demands. The report observed that the northern Victoria regulated surface water markets were working effectively.88
85 Productivity Commission, National water reform, report no. 87, 2018, p. 111.
86 Water for Victoria is a policy for the management of Victorian water resources and responding to the impact of climate change and a growing population; see Victorian State Government, Water for Victoria water plan, https://www.water.vic.gov.au/__data/assets/pdf_file/0030/58827/Water-Plan-strategy2.pdf.
87 Aither, Effectiveness of Victoria’s water markets, final report prepared for the Victorian Department of Environment, Land, Water and Planning, February 2018.
88 Aither, Water markets in New South Wales; improving the understanding of market fundamentals, development and current status, March 2017, p. 13.
40 Water monitoring report 2017–18
3.2 Water markets are driving the emergence of more complex water products and business models
Increasing demand for water and evolving agricultural business models are driving some water users to meet water requirements by diversifying their mix of water products. Brokers play an important role in the water market and help their customers to understand the range of product offerings, including non-standard and emerging products (box 3.1). Anecdotal reports from water brokers note the increasing use of products like leasing and forward contracts.89 At present, it is difficult to establish the magnitude and growth in the use of ‘non-standard’ products, as state water registers do not effectively capture this information.90 Box 3.2 outlines the main types of products or arrangements.
89 Marsden Jacob Associates, Murray–Darling Basin water markets 2018–19 outlook and 2017–18 review, 2018, p. 12.
90 Some broker sites list leasing and forward contract offers and report on some trades of less standard products.
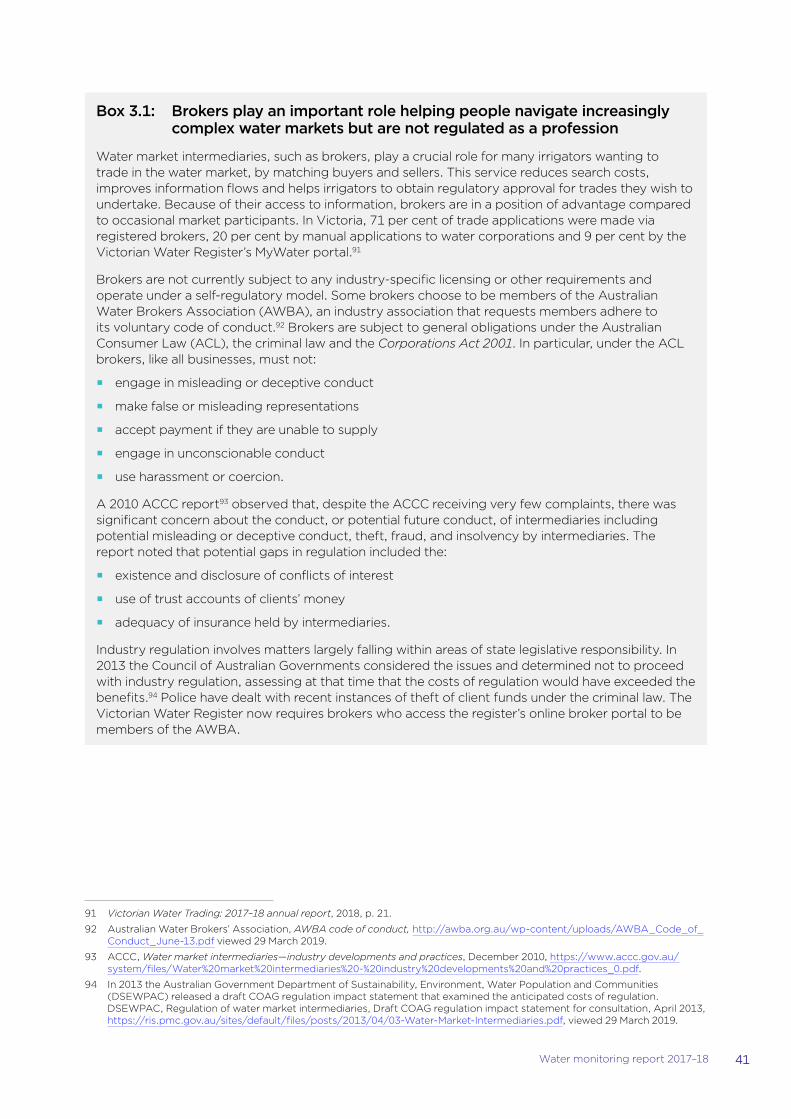
41Water monitoring report 2017–18
Box 3.1: Brokers play an important role helping people navigate increasingly complex water markets but are not regulated as a profession
Water market intermediaries, such as brokers, play a crucial role for many irrigators wanting to trade in the water market, by matching buyers and sellers. This service reduces search costs, improves information flows and helps irrigators to obtain regulatory approval for trades they wish to undertake. Because of their access to information, brokers are in a position of advantage compared to occasional market participants. In Victoria, 71 per cent of trade applications were made via registered brokers, 20 per cent by manual applications to water corporations and 9 per cent by the Victorian Water Register’s MyWater portal.91
Brokers are not currently subject to any industry-specific licensing or other requirements and operate under a self-regulatory model. Some brokers choose to be members of the Australian Water Brokers Association (AWBA), an industry association that requests members adhere to its voluntary code of conduct.92 Brokers are subject to general obligations under the Australian Consumer Law (ACL), the criminal law and the Corporations Act 2001. In particular, under the ACL brokers, like all businesses, must not:
�� engage in misleading or deceptive conduct
�� make false or misleading representations
�� accept payment if they are unable to supply
�� engage in unconscionable conduct
�� use harassment or coercion.
A 2010 ACCC report93 observed that, despite the ACCC receiving very few complaints, there was significant concern about the conduct, or potential future conduct, of intermediaries including potential misleading or deceptive conduct, theft, fraud, and insolvency by intermediaries. The report noted that potential gaps in regulation included the:
�� existence and disclosure of conflicts of interest
�� use of trust accounts of clients’ money
�� adequacy of insurance held by intermediaries.
Industry regulation involves matters largely falling within areas of state legislative responsibility. In 2013 the Council of Australian Governments considered the issues and determined not to proceed with industry regulation, assessing at that time that the costs of regulation would have exceeded the benefits.94 Police have dealt with recent instances of theft of client funds under the criminal law. The Victorian Water Register now requires brokers who access the register’s online broker portal to be members of the AWBA.
91 Victorian Water Trading: 2017–18 annual report, 2018, p. 21.
92 Australian Water Brokers’ Association, AWBA code of conduct, http://awba.org.au/wp-content/uploads/AWBA_Code_of_Conduct_June-13.pdf viewed 29 March 2019.
93 ACCC, Water market intermediaries—industry developments and practices, December 2010, https://www.accc.gov.au/system/files/Water%20market%20intermediaries%20-%20industry%20developments%20and%20practices_0.pdf.
94 In 2013 the Australian Government Department of Sustainability, Environment, Water Population and Communities (DSEWPAC) released a draft COAG regulation impact statement that examined the anticipated costs of regulation. DSEWPAC, Regulation of water market intermediaries, Draft COAG regulation impact statement for consultation, April 2013, https://ris.pmc.gov.au/sites/default/files/posts/2013/04/03-Water-Market-Intermediaries.pdf, viewed 29 March 2019.
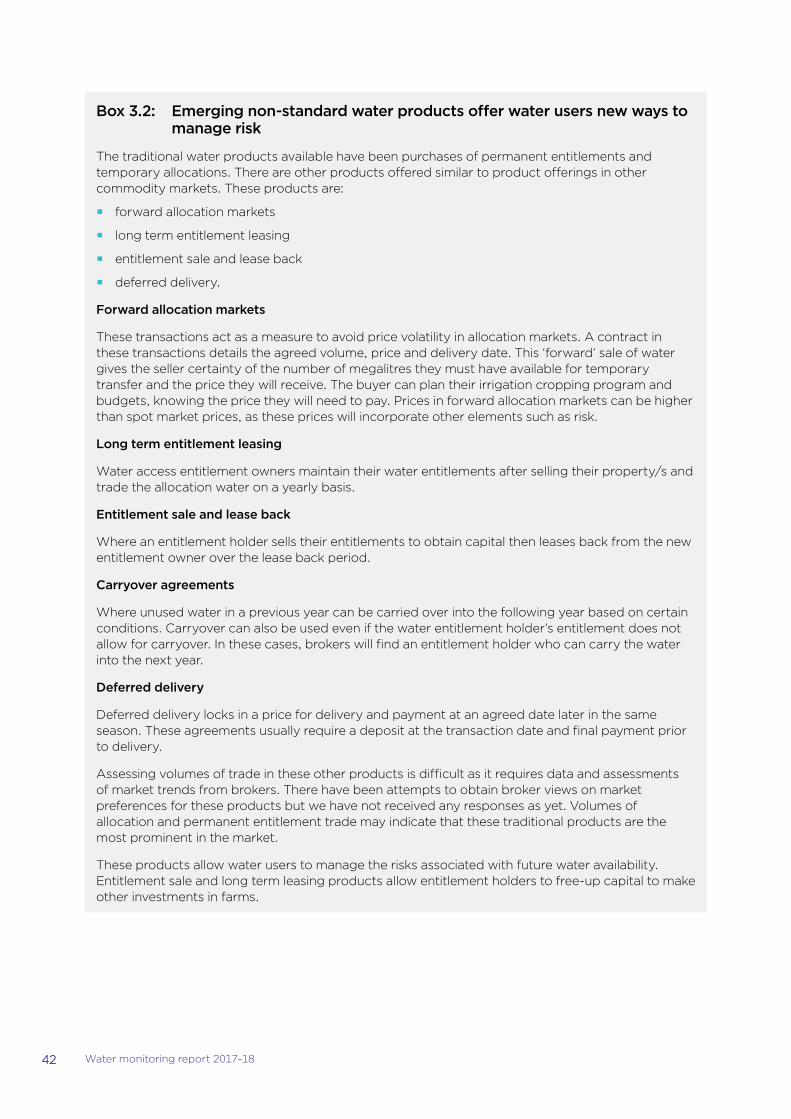
42 Water monitoring report 2017–18
Box 3.2: Emerging non-standard water products offer water users new ways to manage risk
The traditional water products available have been purchases of permanent entitlements and temporary allocations. There are other products offered similar to product offerings in other commodity markets. These products are:
�� forward allocation markets
�� long term entitlement leasing
�� entitlement sale and lease back
�� deferred delivery.
Forward allocation markets
These transactions act as a measure to avoid price volatility in allocation markets. A contract in these transactions details the agreed volume, price and delivery date. This ‘forward’ sale of water gives the seller certainty of the number of megalitres they must have available for temporary transfer and the price they will receive. The buyer can plan their irrigation cropping program and budgets, knowing the price they will need to pay. Prices in forward allocation markets can be higher than spot market prices, as these prices will incorporate other elements such as risk.
Long term entitlement leasing
Water access entitlement owners maintain their water entitlements after selling their property/s and trade the allocation water on a yearly basis.
Entitlement sale and lease back
Where an entitlement holder sells their entitlements to obtain capital then leases back from the new entitlement owner over the lease back period.
Carryover agreements
Where unused water in a previous year can be carried over into the following year based on certain conditions. Carryover can also be used even if the water entitlement holder’s entitlement does not allow for carryover. In these cases, brokers will find an entitlement holder who can carry the water into the next year.
Deferred delivery
Deferred delivery locks in a price for delivery and payment at an agreed date later in the same season. These agreements usually require a deposit at the transaction date and final payment prior to delivery.
Assessing volumes of trade in these other products is difficult as it requires data and assessments of market trends from brokers. There have been attempts to obtain broker views on market preferences for these products but we have not received any responses as yet. Volumes of allocation and permanent entitlement trade may indicate that these traditional products are the most prominent in the market.
These products allow water users to manage the risks associated with future water availability. Entitlement sale and long term leasing products allow entitlement holders to free-up capital to make other investments in farms.
43Water monitoring report 2017–18
Box 3.3: Foreign owned Murray–Darling Basin water entitlements largely used for agriculture
Rising community concerns over the level of foreign ownership of agricultural assets including water led the Australian Parliament to pass the Register of Foreign Ownership of Agricultural Land Amendment (Water) Act 2016 in December 2016. The Act requires the Australian Tax Office (ATO) to keep a register containing information about foreigners’ holdings of registerable water entitlements and contractual water rights. The ATO is also required to produce an annual report setting out general statistical information derived from the register. On 1 March 2019 the Australian Treasurer, the Hon Josh Frydenberg MP, publicly released the first report, which found (as at 30 June 2018):
�� an estimated 10.4 per cent of water entitlements in Australia were foreign-owned
�� the largest foreign holders of these entitlements were China and the United States (each with 1.9 per cent of total water entitlements on issue) and the United Kingdom (1.1 per cent)
�� New South Wales/ACT had the greatest amount of foreign-held water entitlements (1306 GL) with Queensland the next highest (1219 GL). Of the Basin states, Queensland had the highest percentage of foreign-owned water entitlements (18.4 per cent), more than twice as much as the next highest Basin state, New South Wales/ACT (8.7 per cent)
�� over 1800 GL of foreign-held water entitlement was within the Murray–Darling Basin. This is 9.4 per cent of the total Murray–Darling water entitlement on issue
�� in Basin states, over 86 per cent of foreign-held entitlements were used for agricultural purposes. This compared to 66.5 per cent in Australia overall. Around 26 per cent of foreign-held entitlements in Australia were used for mining
�� foreign ownership of surface water entitlements on issue (surface water) was a much higher proportion in the northern Basin (21.9 percent, 882 GL) than in the southern Basin (5.5 per cent, 738 GL)
�� less than 3 per cent of foreign held water entitlements were irrigation rights which were issued by irrigation infrastructure operators.
3.3 There are concerns about the reliability of reported price data
In 2018 the Murray–Darling Basin Authority announced its intention to audit the water trade price information being reported to Basin state water registers. The results of the audit will be published in 2019.
Section 12.48 of the Basin Plan requires trading prices to be made available where the trade requires the approval of an approval authority and where the trade requires registration. The Basin Plan also requires the approval authority to publish on its website information such as the volume of water traded, the price of the trade and the days elapsed between lodgement and approval.
Not every trade in water markets has a price associated with the volume of water traded. This may reflect that the trade is non-commercial in nature, may be associated with a sale of land (and the price of water may not be separately disclosed) or may be incorrectly reported.
Reported prices per ML in allocation markets ranged from $0 per ML to over $5500 per ML. In entitlement markets, reported prices ranged from $0 to $1.1 million per ML. The Australian Bureau of Agricultural and Resource Economics and Sciences has undertaken work on statistical methodologies for analysing water trade data. It suggests that these outliers, such as extremely high or low prices, could be the result of incorrect price data entry, false reporting and/or reported transactions of different water products.95
95 Department of Agriculture and Water Resources, Measuring water market prices: statistical methods for interpreting water trade data, December 2018, p. 9.
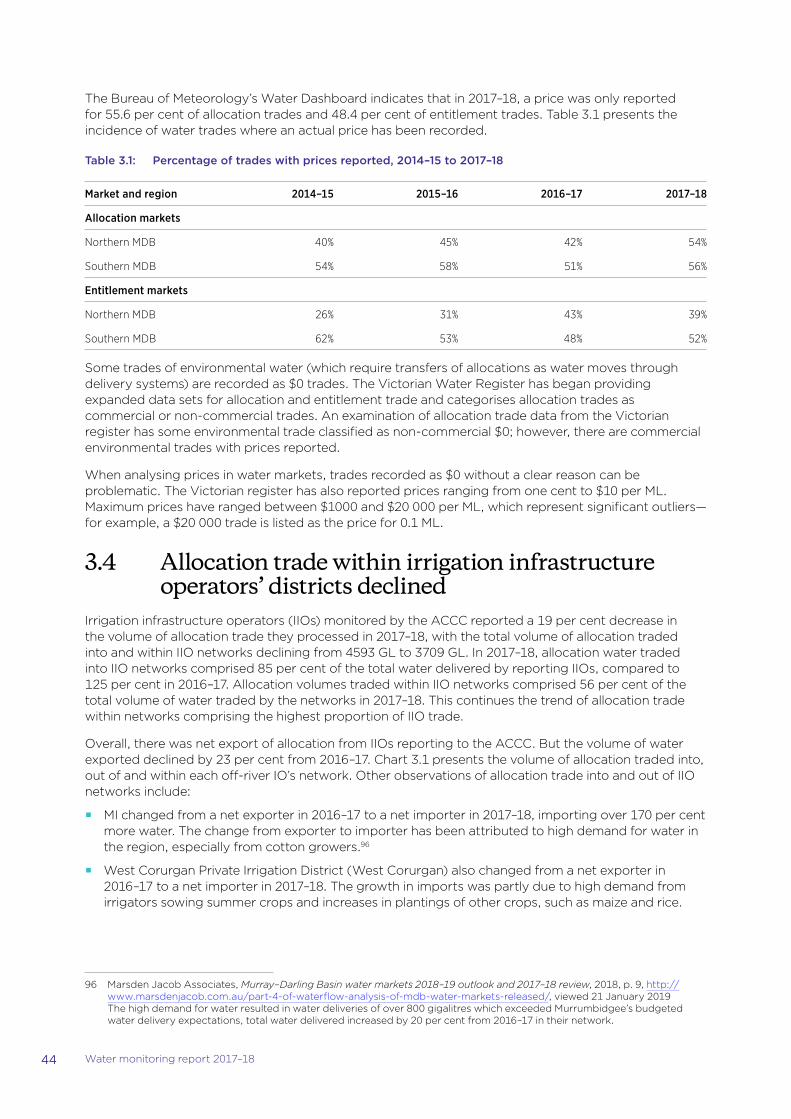
44 Water monitoring report 2017–18
The Bureau of Meteorology’s Water Dashboard indicates that in 2017–18, a price was only reported for 55.6 per cent of allocation trades and 48.4 per cent of entitlement trades. Table 3.1 presents the incidence of water trades where an actual price has been recorded.
Table 3.1: Percentage of trades with prices reported, 2014–15 to 2017–18
Market and region 2014–15 2015–16 2016–17 2017–18
Allocation markets
Northern MDB 40% 45% 42% 54%
Southern MDB 54% 58% 51% 56%
Entitlement markets
Northern MDB 26% 31% 43% 39%
Southern MDB 62% 53% 48% 52%
Some trades of environmental water (which require transfers of allocations as water moves through delivery systems) are recorded as $0 trades. The Victorian Water Register has began providing expanded data sets for allocation and entitlement trade and categorises allocation trades as commercial or non-commercial trades. An examination of allocation trade data from the Victorian register has some environmental trade classified as non-commercial $0; however, there are commercial environmental trades with prices reported.
When analysing prices in water markets, trades recorded as $0 without a clear reason can be problematic. The Victorian register has also reported prices ranging from one cent to $10 per ML. Maximum prices have ranged between $1000 and $20 000 per ML, which represent significant outliers—for example, a $20 000 trade is listed as the price for 0.1 ML.
3.4 Allocation trade within irrigation infrastructure operators’ districts declined
Irrigation infrastructure operators (IIOs) monitored by the ACCC reported a 19 per cent decrease in the volume of allocation trade they processed in 2017–18, with the total volume of allocation traded into and within IIO networks declining from 4593 GL to 3709 GL. In 2017–18, allocation water traded into IIO networks comprised 85 per cent of the total water delivered by reporting IIOs, compared to 125 per cent in 2016–17. Allocation volumes traded within IIO networks comprised 56 per cent of the total volume of water traded by the networks in 2017–18. This continues the trend of allocation trade within networks comprising the highest proportion of IIO trade.
Overall, there was net export of allocation from IIOs reporting to the ACCC. But the volume of water exported declined by 23 per cent from 2016–17. Chart 3.1 presents the volume of allocation traded into, out of and within each off-river IO’s network. Other observations of allocation trade into and out of IIO networks include:
�� MI changed from a net exporter in 2016–17 to a net importer in 2017–18, importing over 170 per cent more water. The change from exporter to importer has been attributed to high demand for water in the region, especially from cotton growers.96
�� West Corurgan Private Irrigation District (West Corurgan) also changed from a net exporter in 2016–17 to a net importer in 2017–18. The growth in imports was partly due to high demand from irrigators sowing summer crops and increases in plantings of other crops, such as maize and rice.
96 Marsden Jacob Associates, Murray–Darling Basin water markets 2018–19 outlook and 2017–18 review, 2018, p. 9, http://www.marsdenjacob.com.au/part-4-of-waterflow-analysis-of-mdb-water-markets-released/, viewed 21 January 2019
The high demand for water resulted in water deliveries of over 800 gigalitres which exceeded Murrumbidgee’s budgeted water delivery expectations, total water delivered increased by 20 per cent from 2016–17 in their network.
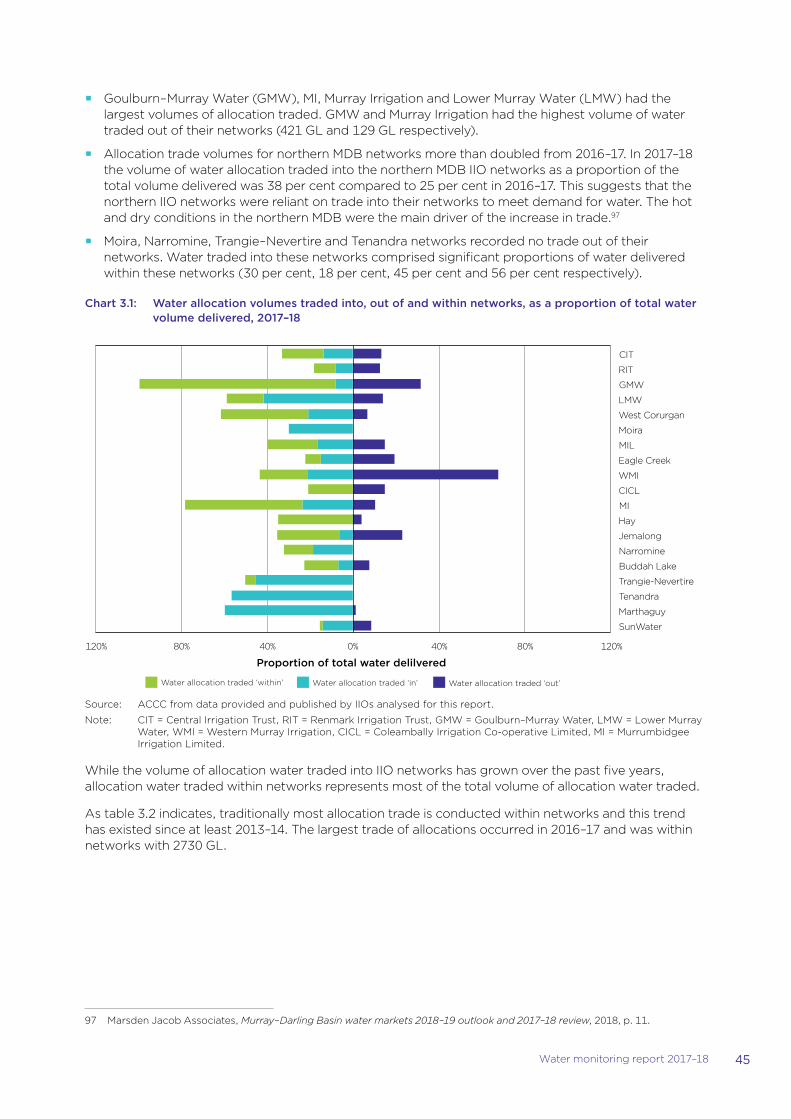
45Water monitoring report 2017–18
�� Goulburn–Murray Water (GMW), MI, Murray Irrigation and Lower Murray Water (LMW) had the largest volumes of allocation traded. GMW and Murray Irrigation had the highest volume of water traded out of their networks (421 GL and 129 GL respectively).
�� Allocation trade volumes for northern MDB networks more than doubled from 2016–17. In 2017–18 the volume of water allocation traded into the northern MDB IIO networks as a proportion of the total volume delivered was 38 per cent compared to 25 per cent in 2016–17. This suggests that the northern IIO networks were reliant on trade into their networks to meet demand for water. The hot and dry conditions in the northern MDB were the main driver of the increase in trade.97
�� Moira, Narromine, Trangie–Nevertire and Tenandra networks recorded no trade out of their networks. Water traded into these networks comprised significant proportions of water delivered within these networks (30 per cent, 18 per cent, 45 per cent and 56 per cent respectively).
Chart 3.1: Water allocation volumes traded into, out of and within networks, as a proportion of total water volume delivered, 2017–18
120% 80% 40% 0% 40% 80% 120%
CIT
RIT
GMW
LMW
West Corurgan
Moira
MIL
Eagle Creek
WMI
CICL
MI
Hay
Jemalong
Narromine
Buddah Lake
Trangie-Nevertire
Tenandra
Marthaguy
SunWater
Water allocation traded ‘out’Water allocation traded ‘in’ Water allocation traded ‘within’
Proportion of total water delilvered
Source: ACCC from data provided and published by IIOs analysed for this report.
Note: CIT = Central Irrigation Trust, RIT = Renmark Irrigation Trust, GMW = Goulburn–Murray Water, LMW = Lower Murray Water, WMI = Western Murray Irrigation, CICL = Coleambally Irrigation Co-operative Limited, MI = Murrumbidgee Irrigation Limited.
While the volume of allocation water traded into IIO networks has grown over the past five years, allocation water traded within networks represents most of the total volume of allocation water traded.
As table 3.2 indicates, traditionally most allocation trade is conducted within networks and this trend has existed since at least 2013–14. The largest trade of allocations occurred in 2016–17 and was within networks with 2730 GL.
97 Marsden Jacob Associates, Murray–Darling Basin water markets 2018–19 outlook and 2017–18 review, 2018, p. 11.
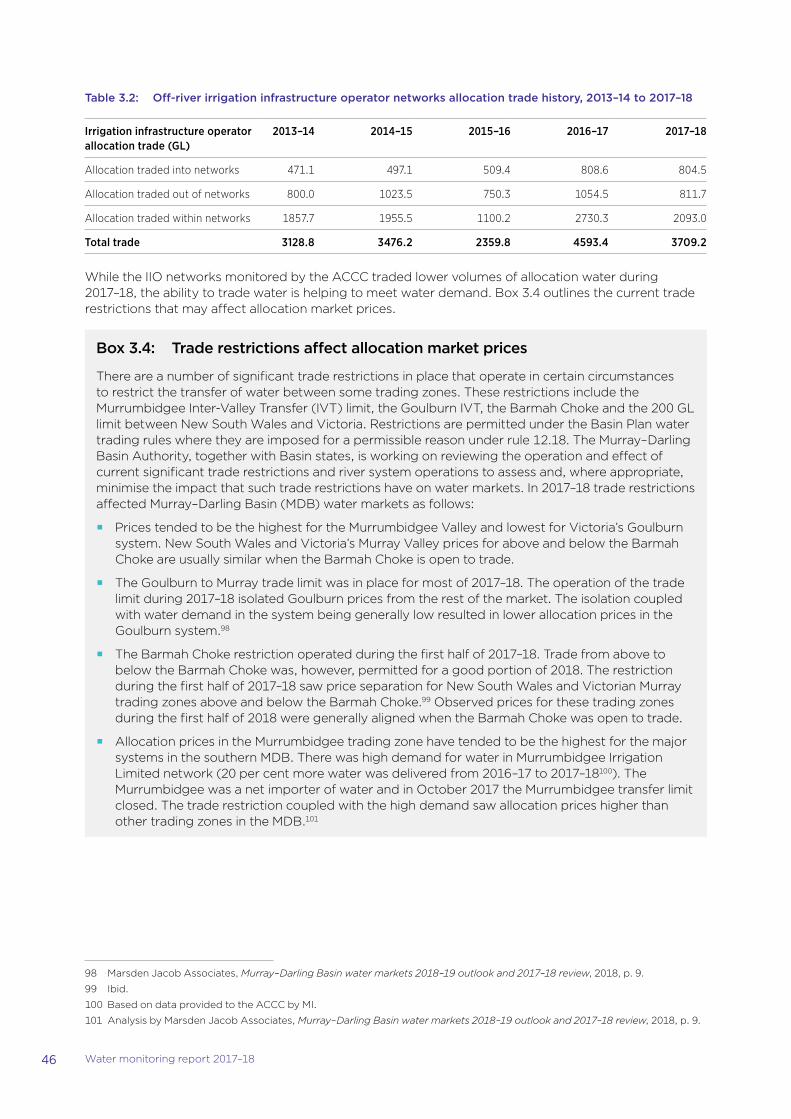
46 Water monitoring report 2017–18
Table 3.2: Off-river irrigation infrastructure operator networks allocation trade history, 2013–14 to 2017–18
Irrigation infrastructure operator allocation trade (GL)
2013–14 2014–15 2015–16 2016–17 2017–18
Allocation traded into networks 471.1 497.1 509.4 808.6 804.5
Allocation traded out of networks 800.0 1023.5 750.3 1054.5 811.7
Allocation traded within networks 1857.7 1955.5 1100.2 2730.3 2093.0
Total trade 3128.8 3476.2 2359.8 4593.4 3709.2
While the IIO networks monitored by the ACCC traded lower volumes of allocation water during 2017–18, the ability to trade water is helping to meet water demand. Box 3.4 outlines the current trade restrictions that may affect allocation market prices.
Box 3.4: Trade restrictions affect allocation market prices
There are a number of significant trade restrictions in place that operate in certain circumstances to restrict the transfer of water between some trading zones. These restrictions include the Murrumbidgee Inter-Valley Transfer (IVT) limit, the Goulburn IVT, the Barmah Choke and the 200 GL limit between New South Wales and Victoria. Restrictions are permitted under the Basin Plan water trading rules where they are imposed for a permissible reason under rule 12.18. The Murray–Darling Basin Authority, together with Basin states, is working on reviewing the operation and effect of current significant trade restrictions and river system operations to assess and, where appropriate, minimise the impact that such trade restrictions have on water markets. In 2017–18 trade restrictions affected Murray–Darling Basin (MDB) water markets as follows:
�� Prices tended to be the highest for the Murrumbidgee Valley and lowest for Victoria’s Goulburn system. New South Wales and Victoria’s Murray Valley prices for above and below the Barmah Choke are usually similar when the Barmah Choke is open to trade.
�� The Goulburn to Murray trade limit was in place for most of 2017–18. The operation of the trade limit during 2017–18 isolated Goulburn prices from the rest of the market. The isolation coupled with water demand in the system being generally low resulted in lower allocation prices in the Goulburn system.98
�� The Barmah Choke restriction operated during the first half of 2017–18. Trade from above to below the Barmah Choke was, however, permitted for a good portion of 2018. The restriction during the first half of 2017–18 saw price separation for New South Wales and Victorian Murray trading zones above and below the Barmah Choke.99 Observed prices for these trading zones during the first half of 2018 were generally aligned when the Barmah Choke was open to trade.
�� Allocation prices in the Murrumbidgee trading zone have tended to be the highest for the major systems in the southern MDB. There was high demand for water in Murrumbidgee Irrigation Limited network (20 per cent more water was delivered from 2016–17 to 2017–18100). The Murrumbidgee was a net importer of water and in October 2017 the Murrumbidgee transfer limit closed. The trade restriction coupled with the high demand saw allocation prices higher than other trading zones in the MDB.101
98 Marsden Jacob Associates, Murray–Darling Basin water markets 2018–19 outlook and 2017–18 review, 2018, p. 9.
99 Ibid.
100 Based on data provided to the ACCC by MI.
101 Analysis by Marsden Jacob Associates, Murray–Darling Basin water markets 2018–19 outlook and 2017–18 review, 2018, p. 9.
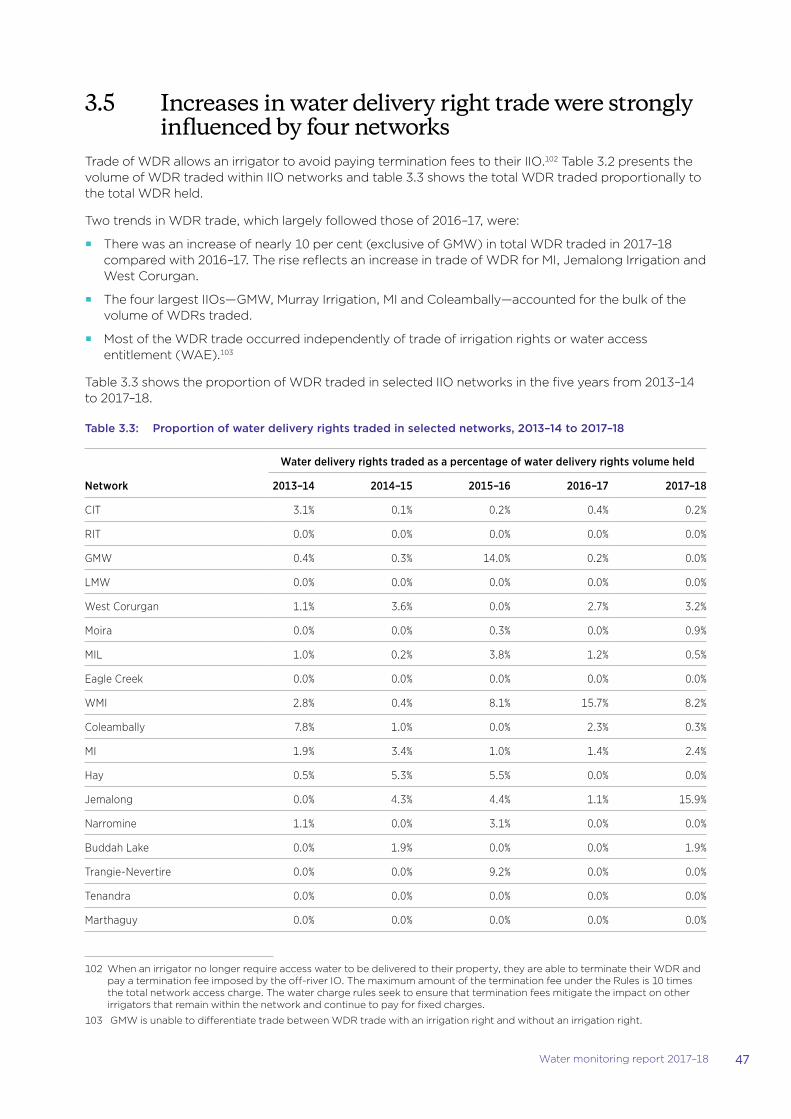
47Water monitoring report 2017–18
3.5 Increases in water delivery right trade were strongly influenced by four networks
Trade of WDR allows an irrigator to avoid paying termination fees to their IIO.102 Table 3.2 presents the volume of WDR traded within IIO networks and table 3.3 shows the total WDR traded proportionally to the total WDR held.
Two trends in WDR trade, which largely followed those of 2016–17, were:
�� There was an increase of nearly 10 per cent (exclusive of GMW) in total WDR traded in 2017–18 compared with 2016–17. The rise reflects an increase in trade of WDR for MI, Jemalong Irrigation and West Corurgan.
�� The four largest IIOs—GMW, Murray Irrigation, MI and Coleambally—accounted for the bulk of the volume of WDRs traded.
�� Most of the WDR trade occurred independently of trade of irrigation rights or water access entitlement (WAE).103
Table 3.3 shows the proportion of WDR traded in selected IIO networks in the five years from 2013–14 to 2017–18.
Table 3.3: Proportion of water delivery rights traded in selected networks, 2013–14 to 2017–18
Network
Water delivery rights traded as a percentage of water delivery rights volume held
2013–14 2014–15 2015–16 2016–17 2017–18
CIT 3.1% 0.1% 0.2% 0.4% 0.2%
RIT 0.0% 0.0% 0.0% 0.0% 0.0%
GMW 0.4% 0.3% 14.0% 0.2% 0.0%
LMW 0.0% 0.0% 0.0% 0.0% 0.0%
West Corurgan 1.1% 3.6% 0.0% 2.7% 3.2%
Moira 0.0% 0.0% 0.3% 0.0% 0.9%
MIL 1.0% 0.2% 3.8% 1.2% 0.5%
Eagle Creek 0.0% 0.0% 0.0% 0.0% 0.0%
WMI 2.8% 0.4% 8.1% 15.7% 8.2%
Coleambally 7.8% 1.0% 0.0% 2.3% 0.3%
MI 1.9% 3.4% 1.0% 1.4% 2.4%
Hay 0.5% 5.3% 5.5% 0.0% 0.0%
Jemalong 0.0% 4.3% 4.4% 1.1% 15.9%
Narromine 1.1% 0.0% 3.1% 0.0% 0.0%
Buddah Lake 0.0% 1.9% 0.0% 0.0% 1.9%
Trangie-Nevertire 0.0% 0.0% 9.2% 0.0% 0.0%
Tenandra 0.0% 0.0% 0.0% 0.0% 0.0%
Marthaguy 0.0% 0.0% 0.0% 0.0% 0.0%
102 When an irrigator no longer require access water to be delivered to their property, they are able to terminate their WDR and pay a termination fee imposed by the off-river IO. The maximum amount of the termination fee under the Rules is 10 times the total network access charge. The water charge rules seek to ensure that termination fees mitigate the impact on other irrigators that remain within the network and continue to pay for fixed charges.
103 GMW is unable to differentiate trade between WDR trade with an irrigation right and without an irrigation right.
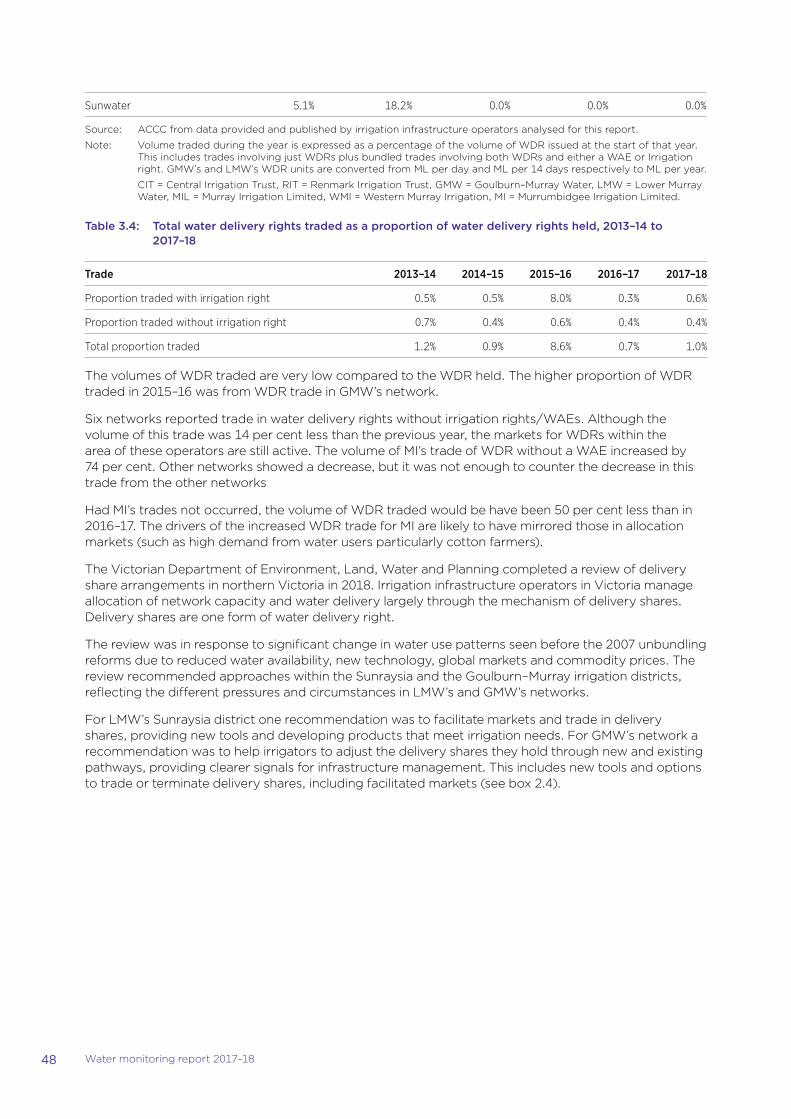
48 Water monitoring report 2017–18
Sunwater 5.1% 18.2% 0.0% 0.0% 0.0%
Source: ACCC from data provided and published by irrigation infrastructure operators analysed for this report.
Note: Volume traded during the year is expressed as a percentage of the volume of WDR issued at the start of that year. This includes trades involving just WDRs plus bundled trades involving both WDRs and either a WAE or Irrigation right. GMW’s and LMW’s WDR units are converted from ML per day and ML per 14 days respectively to ML per year.
CIT = Central Irrigation Trust, RIT = Renmark Irrigation Trust, GMW = Goulburn–Murray Water, LMW = Lower Murray Water, MIL = Murray Irrigation Limited, WMI = Western Murray Irrigation, MI = Murrumbidgee Irrigation Limited.
Table 3.4: Total water delivery rights traded as a proportion of water delivery rights held, 2013–14 to 2017–18
Trade 2013–14 2014–15 2015–16 2016–17 2017–18
Proportion traded with irrigation right 0.5% 0.5% 8.0% 0.3% 0.6%
Proportion traded without irrigation right 0.7% 0.4% 0.6% 0.4% 0.4%
Total proportion traded 1.2% 0.9% 8.6% 0.7% 1.0%
The volumes of WDR traded are very low compared to the WDR held. The higher proportion of WDR traded in 2015–16 was from WDR trade in GMW’s network.
Six networks reported trade in water delivery rights without irrigation rights/WAEs. Although the volume of this trade was 14 per cent less than the previous year, the markets for WDRs within the area of these operators are still active. The volume of MI’s trade of WDR without a WAE increased by 74 per cent. Other networks showed a decrease, but it was not enough to counter the decrease in this trade from the other networks
Had MI’s trades not occurred, the volume of WDR traded would be have been 50 per cent less than in 2016–17. The drivers of the increased WDR trade for MI are likely to have mirrored those in allocation markets (such as high demand from water users particularly cotton farmers).
The Victorian Department of Environment, Land, Water and Planning completed a review of delivery share arrangements in northern Victoria in 2018. Irrigation infrastructure operators in Victoria manage allocation of network capacity and water delivery largely through the mechanism of delivery shares. Delivery shares are one form of water delivery right.
The review was in response to significant change in water use patterns seen before the 2007 unbundling reforms due to reduced water availability, new technology, global markets and commodity prices. The review recommended approaches within the Sunraysia and the Goulburn–Murray irrigation districts, reflecting the different pressures and circumstances in LMW’s and GMW’s networks.
For LMW’s Sunraysia district one recommendation was to facilitate markets and trade in delivery shares, providing new tools and developing products that meet irrigation needs. For GMW’s network a recommendation was to help irrigators to adjust the delivery shares they hold through new and existing pathways, providing clearer signals for infrastructure management. This includes new tools and options to trade or terminate delivery shares, including facilitated markets (see box 2.4).
04
Cotton crop in Murray–Darling Basin Source: iStockphoto
Transformation and termination volumes declined again
50 Water monitoring report 2017–18
4. Transformation and termination volumes declined again
Key points
Transformations
�� The number of irrigation right transformations reported by off-river infrastructure operators (IOs) increased by 32 per cent from the previous year (from 133 to 175). The volume of irrigation right transformed, however, was the lowest reported since monitoring commenced in 2009, at only 17 GL.
�� This may reflect that irrigators who are transforming rights are seeking flexibility or looking to raise capital rather than exiting the industry.
�� The total volume of irrigation rights transformed as a percentage of the total volume of irrigation rights at 1 July 2009 was 18 per cent.
�� In both New South Wales and South Australia, total transformation processing times improved. The median processing time was 43 and 15 working days respectively.
Terminations
�� The number of terminations reported in 2017–18 declined 38 per cent to only 30 transactions. This number is the lowest reported since monitoring commenced in 2009.
�� The volume of water delivery rights terminated in 2017–18 was 2.6 GL, also the lowest volume recorded since monitoring began.
�� This may reflect a maturing market where irrigators’ willingness to exit (or reduce water delivery rights) has declined.
�� For the first time since monitoring began, all terminations reported by off-river IOs to the ACCC had termination fees imposed.
This chapter reports on changes and trends in transformations and terminations in irrigation networks.
�� Section 4.1 looks at transformation data reported by those off-river infrastructure operators (IOs) capable of transforming irrigation rights, with reference to transformation trends since 2009–10.
�� Section 4.2 reports on termination activity in the irrigation networks of selected off-river IOs.
4.1 Transformation contributes to effective water markets, but large volumes of irrigation rights remain untransformed
This section looks at transformation data reported by those off-river IOs that are capable of transforming irrigation rights91, with reference to transformation trends since 2009–10. Transformation represents water moving off the water access entitlement (WAE) held by the operator. It may represent water moving outside the off-river IO’s irrigation network, depending on whether the transforming irrigator holds or trades the resulting WAE.
91 Operators that can give effect to transformation are concentrated in New South Wales and South Australia. They typically hold a WAE on behalf of their customers, who hold irrigation rights against the operator. In Victoria, Queensland and the ACT, irrigators typically hold a WAE directly, so the concept of transformation is largely irrelevant.
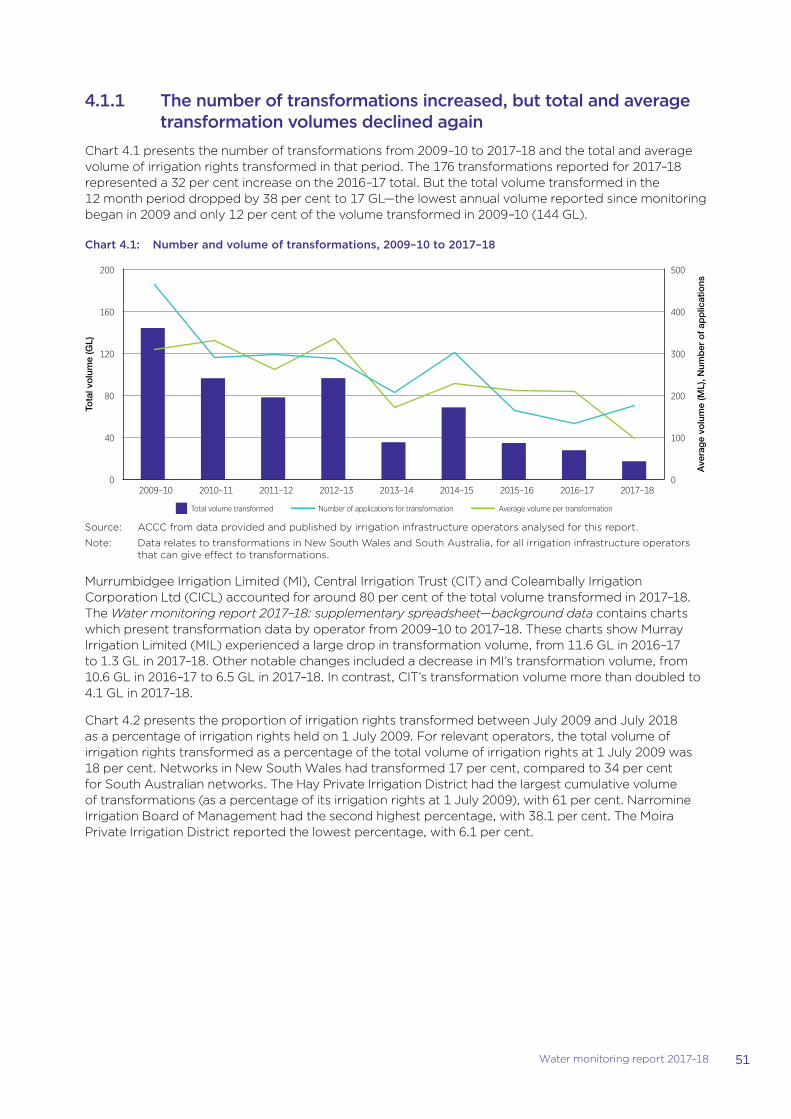
51Water monitoring report 2017–18
4.1.1 The number of transformations increased, but total and average transformation volumes declined again
Chart 4.1 presents the number of transformations from 2009–10 to 2017–18 and the total and average volume of irrigation rights transformed in that period. The 176 transformations reported for 2017–18 represented a 32 per cent increase on the 2016–17 total. But the total volume transformed in the 12 month period dropped by 38 per cent to 17 GL—the lowest annual volume reported since monitoring began in 2009 and only 12 per cent of the volume transformed in 2009–10 (144 GL).
Chart 4.1: Number and volume of transformations, 2009–10 to 2017–18
2009–10 2010–11 2011–12 2012–13 2013–14 2014–15 2015–16 2016–17 2017–18
Total volume transformed Average volume per transformationNumber of applications for transformation
Ave
rag
e vo
lum
e (M
L), N
umb
er o
f ap
plic
atio
ns
Tota
l vo
lum
e (G
L)
0
40
80
120
160
200
0
100
200
300
400
500
Source: ACCC from data provided and published by irrigation infrastructure operators analysed for this report.
Note: Data relates to transformations in New South Wales and South Australia, for all irrigation infrastructure operators that can give effect to transformations.
Murrumbidgee Irrigation Limited (MI), Central Irrigation Trust (CIT) and Coleambally Irrigation Corporation Ltd (CICL) accounted for around 80 per cent of the total volume transformed in 2017–18. The Water monitoring report 2017–18: supplementary spreadsheet—background data contains charts which present transformation data by operator from 2009–10 to 2017–18. These charts show Murray Irrigation Limited (MIL) experienced a large drop in transformation volume, from 11.6 GL in 2016–17 to 1.3 GL in 2017–18. Other notable changes included a decrease in MI’s transformation volume, from 10.6 GL in 2016–17 to 6.5 GL in 2017–18. In contrast, CIT’s transformation volume more than doubled to 4.1 GL in 2017–18.
Chart 4.2 presents the proportion of irrigation rights transformed between July 2009 and July 2018 as a percentage of irrigation rights held on 1 July 2009. For relevant operators, the total volume of irrigation rights transformed as a percentage of the total volume of irrigation rights at 1 July 2009 was 18 per cent. Networks in New South Wales had transformed 17 per cent, compared to 34 per cent for South Australian networks. The Hay Private Irrigation District had the largest cumulative volume of transformations (as a percentage of its irrigation rights at 1 July 2009), with 61 per cent. Narromine Irrigation Board of Management had the second highest percentage, with 38.1 per cent. The Moira Private Irrigation District reported the lowest percentage, with 6.1 per cent.
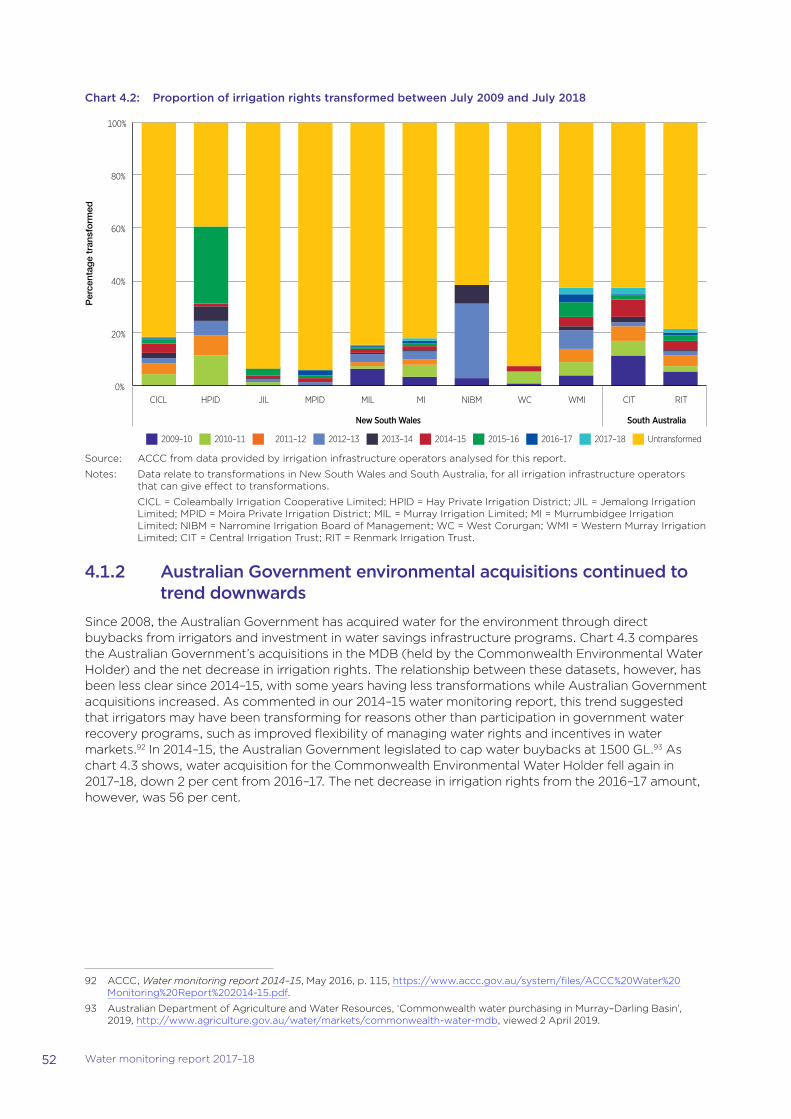
52 Water monitoring report 2017–18
Chart 4.2: Proportion of irrigation rights transformed between July 2009 and July 2018P
erce
ntag
e tr
ansf
orm
ed
0%
20%
40%
60%
80%
100%
CICL HPID JIL MPID MIL MI NIBM WC WMI CIT RIT
New South Wales South Australia
2009–10 2010–11 2011–12 2012–13 2013–14 2014–15 2015–16 2016–17 2017–18 Untransformed
Source: ACCC from data provided by irrigation infrastructure operators analysed for this report.
Notes: Data relate to transformations in New South Wales and South Australia, for all irrigation infrastructure operators that can give effect to transformations.
CICL = Coleambally Irrigation Cooperative Limited; HPID = Hay Private Irrigation District; JIL = Jemalong Irrigation Limited; MPID = Moira Private Irrigation District; MIL = Murray Irrigation Limited; MI = Murrumbidgee Irrigation Limited; NIBM = Narromine Irrigation Board of Management; WC = West Corurgan; WMI = Western Murray Irrigation Limited; CIT = Central Irrigation Trust; RIT = Renmark Irrigation Trust.
4.1.2 Australian Government environmental acquisitions continued to trend downwards
Since 2008, the Australian Government has acquired water for the environment through direct buybacks from irrigators and investment in water savings infrastructure programs. Chart 4.3 compares the Australian Government’s acquisitions in the MDB (held by the Commonwealth Environmental Water Holder) and the net decrease in irrigation rights. The relationship between these datasets, however, has been less clear since 2014–15, with some years having less transformations while Australian Government acquisitions increased. As commented in our 2014–15 water monitoring report, this trend suggested that irrigators may have been transforming for reasons other than participation in government water recovery programs, such as improved flexibility of managing water rights and incentives in water markets.92 In 2014–15, the Australian Government legislated to cap water buybacks at 1500 GL.93 As chart 4.3 shows, water acquisition for the Commonwealth Environmental Water Holder fell again in 2017–18, down 2 per cent from 2016–17. The net decrease in irrigation rights from the 2016–17 amount, however, was 56 per cent.
92 ACCC, Water monitoring report 2014–15, May 2016, p. 115, https://www.accc.gov.au/system/files/ACCC%20Water%20Monitoring%20Report%202014-15.pdf.
93 Australian Department of Agriculture and Water Resources, ‘Commonwealth water purchasing in Murray–Darling Basin’, 2019, http://www.agriculture.gov.au/water/markets/commonwealth-water-mdb, viewed 2 April 2019.
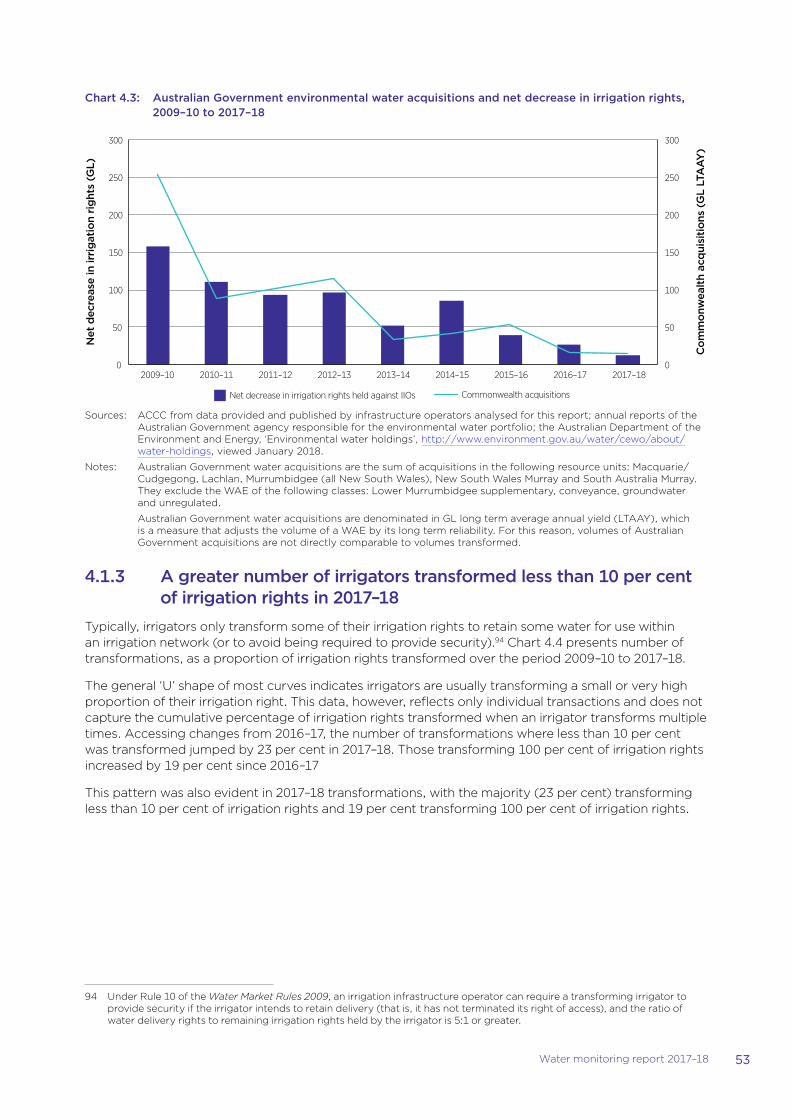
53Water monitoring report 2017–18
Chart 4.3: Australian Government environmental water acquisitions and net decrease in irrigation rights, 2009–10 to 2017–18
0
50
100
150
200
250
300
0
50
100
150
200
250
300
2009–10 2010–11 2011–12 2012–13 2013–14 2014–15 2015–16 2016–17 2017–18
Net decrease in irrigation rights held against IIOs Commonwealth acquisitions
Net
dec
reas
e in
irri
gat
ion
rig
hts
(GL)
Com
mon
wea
lth
acq
uisi
tion
s (G
L LT
AA
Y)
Sources: ACCC from data provided and published by infrastructure operators analysed for this report; annual reports of the Australian Government agency responsible for the environmental water portfolio; the Australian Department of the Environment and Energy, ‘Environmental water holdings’, http://www.environment.gov.au/water/cewo/about/water-holdings, viewed January 2018.
Notes: Australian Government water acquisitions are the sum of acquisitions in the following resource units: Macquarie/Cudgegong, Lachlan, Murrumbidgee (all New South Wales), New South Wales Murray and South Australia Murray. They exclude the WAE of the following classes: Lower Murrumbidgee supplementary, conveyance, groundwater and unregulated.
Australian Government water acquisitions are denominated in GL long term average annual yield (LTAAY), which is a measure that adjusts the volume of a WAE by its long term reliability. For this reason, volumes of Australian Government acquisitions are not directly comparable to volumes transformed.
4.1.3 A greater number of irrigators transformed less than 10 per cent of irrigation rights in 2017–18
Typically, irrigators only transform some of their irrigation rights to retain some water for use within an irrigation network (or to avoid being required to provide security).94 Chart 4.4 presents number of transformations, as a proportion of irrigation rights transformed over the period 2009–10 to 2017–18.
The general ‘U’ shape of most curves indicates irrigators are usually transforming a small or very high proportion of their irrigation right. This data, however, reflects only individual transactions and does not capture the cumulative percentage of irrigation rights transformed when an irrigator transforms multiple times. Accessing changes from 2016–17, the number of transformations where less than 10 per cent was transformed jumped by 23 per cent in 2017–18. Those transforming 100 per cent of irrigation rights increased by 19 per cent since 2016–17
This pattern was also evident in 2017–18 transformations, with the majority (23 per cent) transforming less than 10 per cent of irrigation rights and 19 per cent transforming 100 per cent of irrigation rights.
94 Under Rule 10 of the Water Market Rules 2009, an irrigation infrastructure operator can require a transforming irrigator to provide security if the irrigator intends to retain delivery (that is, it has not terminated its right of access), and the ratio of water delivery rights to remaining irrigation rights held by the irrigator is 5:1 or greater.
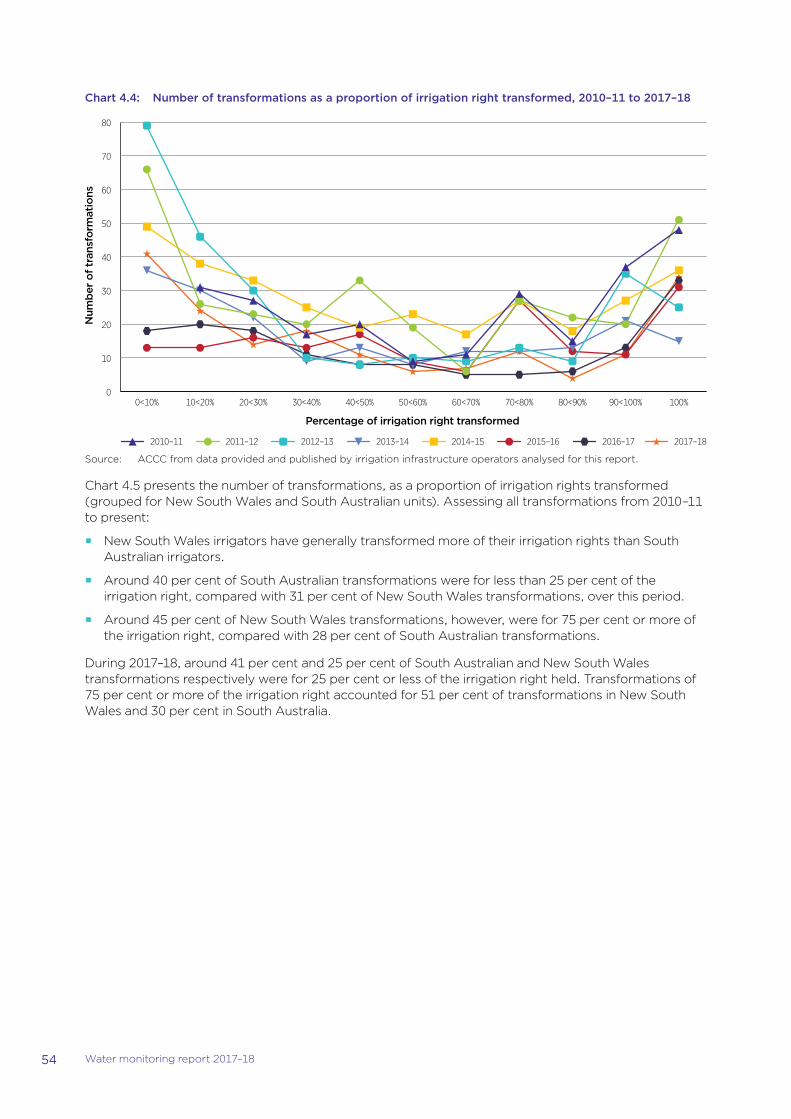
54 Water monitoring report 2017–18
Chart 4.4: Number of transformations as a proportion of irrigation right transformed, 2010–11 to 2017–18N
umb
er o
f tra
nsfo
rmat
ions
0
10
20
30
40
50
60
70
80
100%90<100%80<90%70<80%60<70%50<60%40<50%30<40%20<30%10<20%0<10%
2017–182016–172015–162014–152013–142012–132011–122010–11
Percentage of irrigation right transformed
Source: ACCC from data provided and published by irrigation infrastructure operators analysed for this report.
Chart 4.5 presents the number of transformations, as a proportion of irrigation rights transformed (grouped for New South Wales and South Australian units). Assessing all transformations from 2010–11 to present:
�� New South Wales irrigators have generally transformed more of their irrigation rights than South Australian irrigators.
�� Around 40 per cent of South Australian transformations were for less than 25 per cent of the irrigation right, compared with 31 per cent of New South Wales transformations, over this period.
�� Around 45 per cent of New South Wales transformations, however, were for 75 per cent or more of the irrigation right, compared with 28 per cent of South Australian transformations.
During 2017–18, around 41 per cent and 25 per cent of South Australian and New South Wales transformations respectively were for 25 per cent or less of the irrigation right held. Transformations of 75 per cent or more of the irrigation right accounted for 51 per cent of transformations in New South Wales and 30 per cent in South Australia.
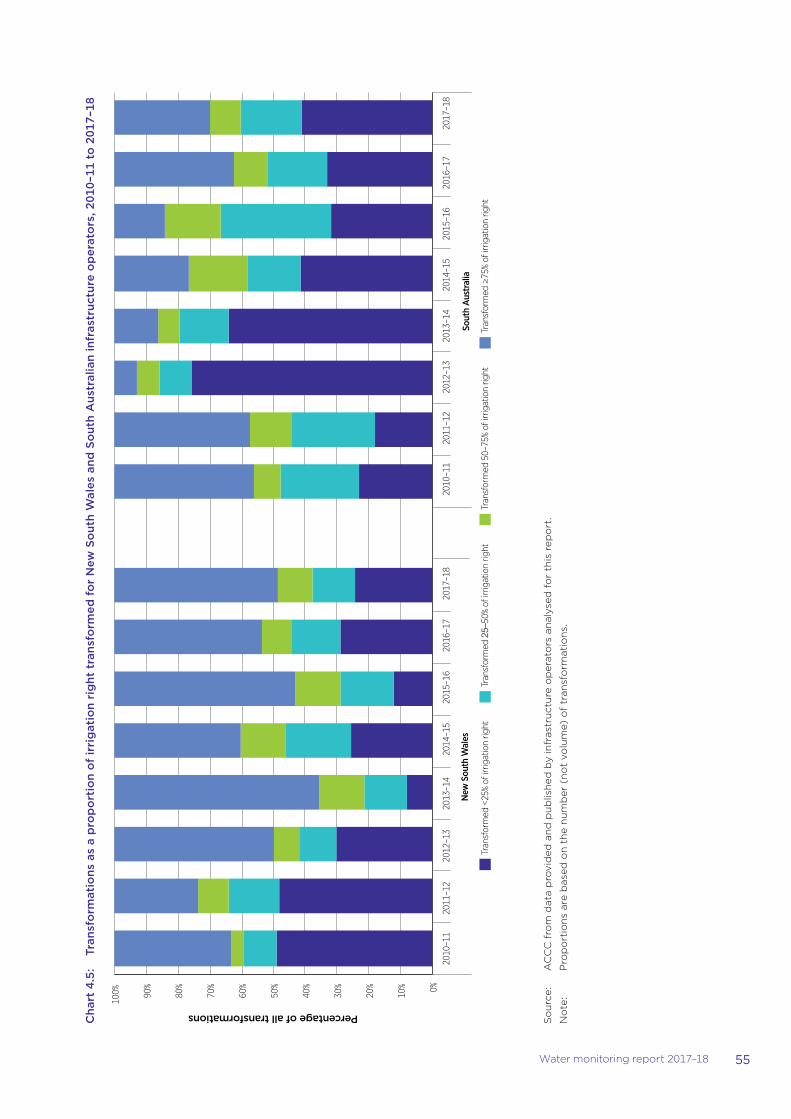
55Water monitoring report 2017–18
Cha
rt 4
.5:
Tran
sfo
rmat
ions
as
a p
rop
ort
ion
of
irri
gat
ion
rig
ht t
rans
form
ed f
or
New
So
uth
Wal
es a
nd S
out
h A
ustr
alia
n in
fras
truc
ture
op
erat
ors
, 201
0–11
to
201
7–18
0%
10%
20%
30%
40%
50%
60%
70%
80%
90%
100%
2010
–11
2011
–12
2012
–13
2013
–14
2014
–15
2015
–16
2016
–17
2017
–18
2010
–11
2011
–12
2012
–13
2013
–14
2014
–15
2015
–16
2016
–17
2017
–18
Sout
h A
ustr
alia
Tran
sfor
med
<25
% of
irrig
atio
n rig
htTr
ansf
orm
ed 25–
50%
of ir
rigat
ion
right
Tran
sfor
med
50–
75%
of ir
rigat
ion
right
Tran
sfor
med
≥75
% of
irrig
atio
n rig
ht
Percentage of all transformations
New
Sou
th W
ales
So
urc
e:
AC
CC
fro
m d
ata
pro
vid
ed a
nd
pu
blis
hed
by
infr
astr
uct
ure
op
erat
ors
an
alys
ed f
or
this
rep
ort
.
No
te:
Pro
po
rtio
ns
are
bas
ed o
n t
he
nu
mb
er (
no
t vo
lum
e) o
f tr
ansf
orm
atio
ns.
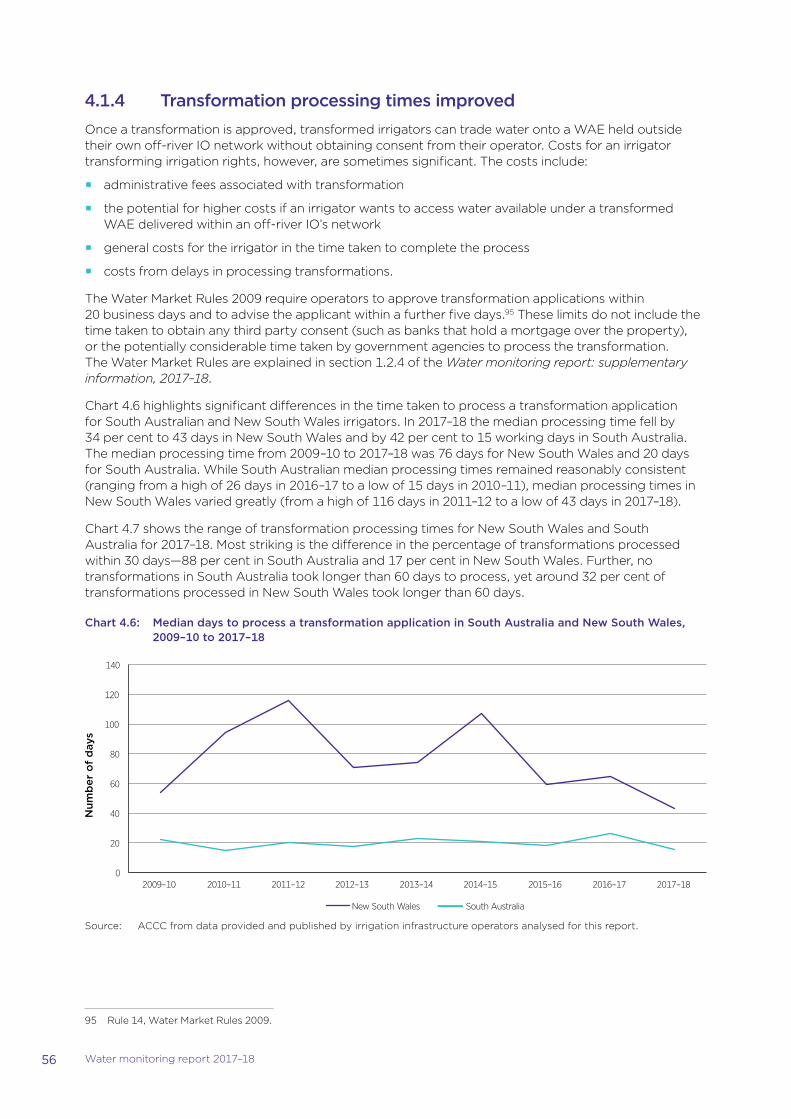
56 Water monitoring report 2017–18
4.1.4 Transformation processing times improvedOnce a transformation is approved, transformed irrigators can trade water onto a WAE held outside their own off-river IO network without obtaining consent from their operator. Costs for an irrigator transforming irrigation rights, however, are sometimes significant. The costs include:
�� administrative fees associated with transformation
�� the potential for higher costs if an irrigator wants to access water available under a transformed WAE delivered within an off-river IO’s network
�� general costs for the irrigator in the time taken to complete the process
�� costs from delays in processing transformations.
The Water Market Rules 2009 require operators to approve transformation applications within 20 business days and to advise the applicant within a further five days.95 These limits do not include the time taken to obtain any third party consent (such as banks that hold a mortgage over the property), or the potentially considerable time taken by government agencies to process the transformation. The Water Market Rules are explained in section 1.2.4 of the Water monitoring report: supplementary information, 2017–18.
Chart 4.6 highlights significant differences in the time taken to process a transformation application for South Australian and New South Wales irrigators. In 2017–18 the median processing time fell by 34 per cent to 43 days in New South Wales and by 42 per cent to 15 working days in South Australia. The median processing time from 2009–10 to 2017–18 was 76 days for New South Wales and 20 days for South Australia. While South Australian median processing times remained reasonably consistent (ranging from a high of 26 days in 2016–17 to a low of 15 days in 2010–11), median processing times in New South Wales varied greatly (from a high of 116 days in 2011–12 to a low of 43 days in 2017–18).
Chart 4.7 shows the range of transformation processing times for New South Wales and South Australia for 2017–18. Most striking is the difference in the percentage of transformations processed within 30 days—88 per cent in South Australia and 17 per cent in New South Wales. Further, no transformations in South Australia took longer than 60 days to process, yet around 32 per cent of transformations processed in New South Wales took longer than 60 days.
Chart 4.6: Median days to process a transformation application in South Australia and New South Wales, 2009–10 to 2017–18
Num
ber
of
day
s
0
20
40
60
80
100
120
140
2009–10 2010–11 2011–12 2012–13 2013–14 2014–15 2015–16 2016–17 2017–18
New South Wales South Australia
Source: ACCC from data provided and published by irrigation infrastructure operators analysed for this report.
95 Rule 14, Water Market Rules 2009.
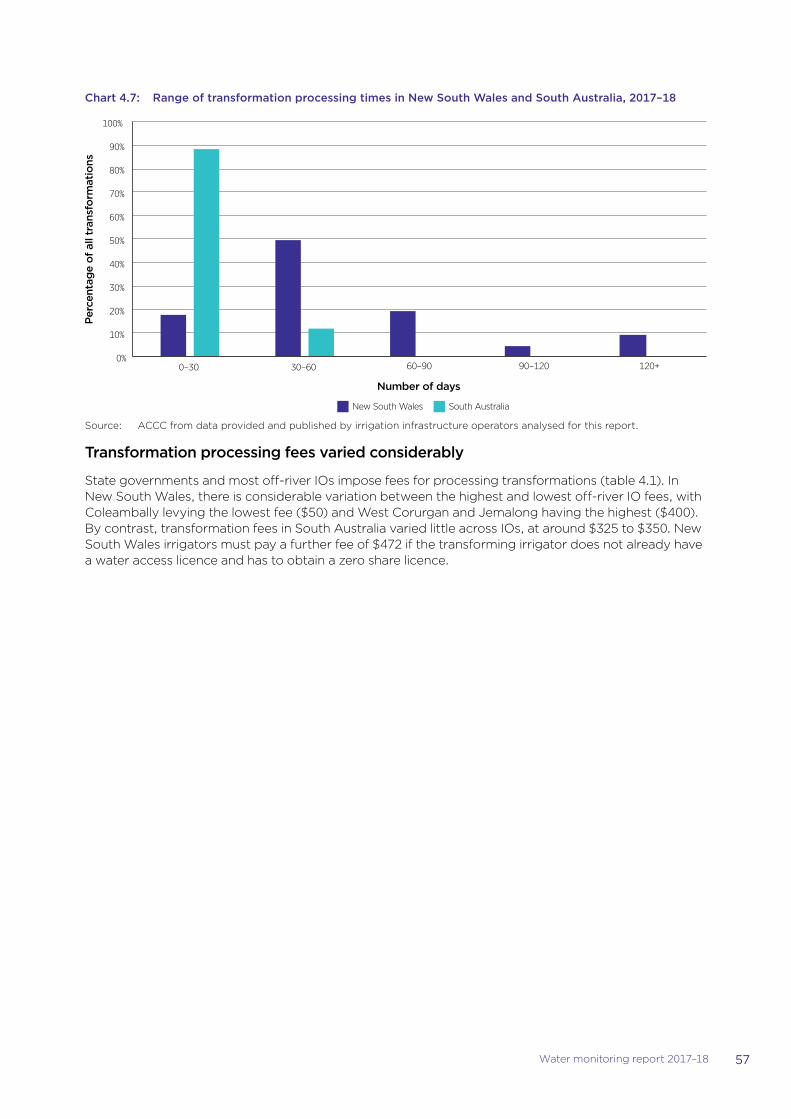
57Water monitoring report 2017–18
Chart 4.7: Range of transformation processing times in New South Wales and South Australia, 2017–18
0%
10%
20%
30%
40%
50%
60%
70%
80%
90%
100%
0–30 30–60
New South Wales South Australia
Perc
enta
ge
of a
ll tr
ansf
orm
atio
ns
Number of days
120+60–90 90–120
Source: ACCC from data provided and published by irrigation infrastructure operators analysed for this report.
Transformation processing fees varied considerably
State governments and most off-river IOs impose fees for processing transformations (table 4.1). In New South Wales, there is considerable variation between the highest and lowest off-river IO fees, with Coleambally levying the lowest fee ($50) and West Corurgan and Jemalong having the highest ($400). By contrast, transformation fees in South Australia varied little across IOs, at around $325 to $350. New South Wales irrigators must pay a further fee of $472 if the transforming irrigator does not already have a water access licence and has to obtain a zero share licence.
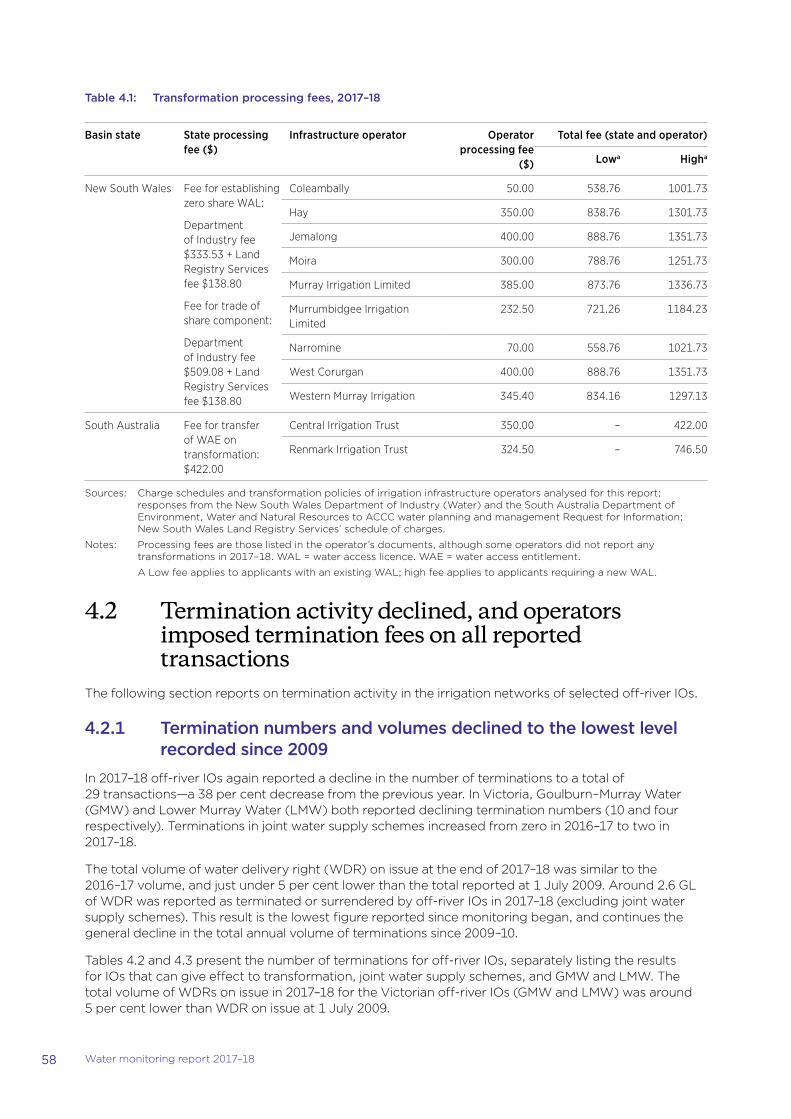
58 Water monitoring report 2017–18
Table 4.1: Transformation processing fees, 2017–18
Basin state State processing fee ($)
Infrastructure operator Operator processing fee
($)
Total fee (state and operator)
Lowa Higha
New South Wales Fee for establishing zero share WAL:
Department of Industry fee $333.53 + Land Registry Services fee $138.80
Fee for trade of share component:
Department of Industry fee $509.08 + Land Registry Services fee $138.80
Coleambally 50.00 538.76 1001.73
Hay 350.00 838.76 1301.73
Jemalong 400.00 888.76 1351.73
Moira 300.00 788.76 1251.73
Murray Irrigation Limited 385.00 873.76 1336.73
Murrumbidgee Irrigation Limited
232.50 721.26 1184.23
Narromine 70.00 558.76 1021.73
West Corurgan 400.00 888.76 1351.73
Western Murray Irrigation 345.40 834.16 1297.13
South Australia Fee for transfer of WAE on transformation: $422.00
Central Irrigation Trust 350.00 – 422.00
Renmark Irrigation Trust 324.50 – 746.50
Sources: Charge schedules and transformation policies of irrigation infrastructure operators analysed for this report; responses from the New South Wales Department of Industry (Water) and the South Australia Department of Environment, Water and Natural Resources to ACCC water planning and management Request for Information; New South Wales Land Registry Services’ schedule of charges.
Notes: Processing fees are those listed in the operator’s documents, although some operators did not report any transformations in 2017–18. WAL = water access licence. WAE = water access entitlement.
A Low fee applies to applicants with an existing WAL; high fee applies to applicants requiring a new WAL.
4.2 Termination activity declined, and operators imposed termination fees on all reported transactions
The following section reports on termination activity in the irrigation networks of selected off-river IOs.
4.2.1 Termination numbers and volumes declined to the lowest level recorded since 2009
In 2017–18 off-river IOs again reported a decline in the number of terminations to a total of 29 transactions—a 38 per cent decrease from the previous year. In Victoria, Goulburn–Murray Water (GMW) and Lower Murray Water (LMW) both reported declining termination numbers (10 and four respectively). Terminations in joint water supply schemes increased from zero in 2016–17 to two in 2017–18.
The total volume of water delivery right (WDR) on issue at the end of 2017–18 was similar to the 2016–17 volume, and just under 5 per cent lower than the total reported at 1 July 2009. Around 2.6 GL of WDR was reported as terminated or surrendered by off-river IOs in 2017–18 (excluding joint water supply schemes). This result is the lowest figure reported since monitoring began, and continues the general decline in the total annual volume of terminations since 2009–10.
Tables 4.2 and 4.3 present the number of terminations for off-river IOs, separately listing the results for IOs that can give effect to transformation, joint water supply schemes, and GMW and LMW. The total volume of WDRs on issue in 2017–18 for the Victorian off-river IOs (GMW and LMW) was around 5 per cent lower than WDR on issue at 1 July 2009.
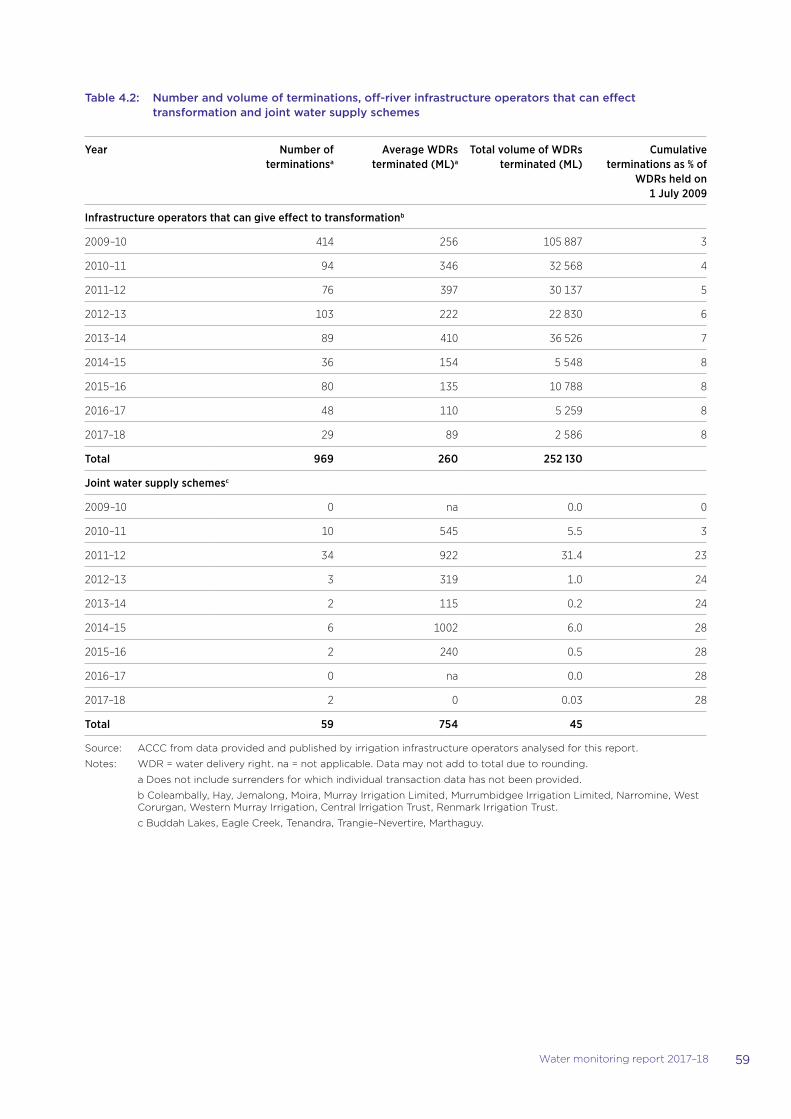
59Water monitoring report 2017–18
Table 4.2: Number and volume of terminations, off-river infrastructure operators that can effect transformation and joint water supply schemes
Year Number of terminationsa
Average WDRs terminated (ML)a
Total volume of WDRs terminated (ML)
Cumulative terminations as % of
WDRs held on 1 July 2009
Infrastructure operators that can give effect to transformationb
2009–10 414 256 105 887 3
2010–11 94 346 32 568 4
2011–12 76 397 30 137 5
2012–13 103 222 22 830 6
2013–14 89 410 36 526 7
2014–15 36 154 5 548 8
2015–16 80 135 10 788 8
2016–17 48 110 5 259 8
2017–18 29 89 2 586 8
Total 969 260 252 130
Joint water supply schemesc
2009–10 0 na 0.0 0
2010–11 10 545 5.5 3
2011–12 34 922 31.4 23
2012–13 3 319 1.0 24
2013–14 2 115 0.2 24
2014–15 6 1002 6.0 28
2015–16 2 240 0.5 28
2016–17 0 na 0.0 28
2017–18 2 0 0.03 28
Total 59 754 45
Source: ACCC from data provided and published by irrigation infrastructure operators analysed for this report.
Notes: WDR = water delivery right. na = not applicable. Data may not add to total due to rounding.
a Does not include surrenders for which individual transaction data has not been provided.
b Coleambally, Hay, Jemalong, Moira, Murray Irrigation Limited, Murrumbidgee Irrigation Limited, Narromine, West Corurgan, Western Murray Irrigation, Central Irrigation Trust, Renmark Irrigation Trust.
c Buddah Lakes, Eagle Creek, Tenandra, Trangie–Nevertire, Marthaguy.
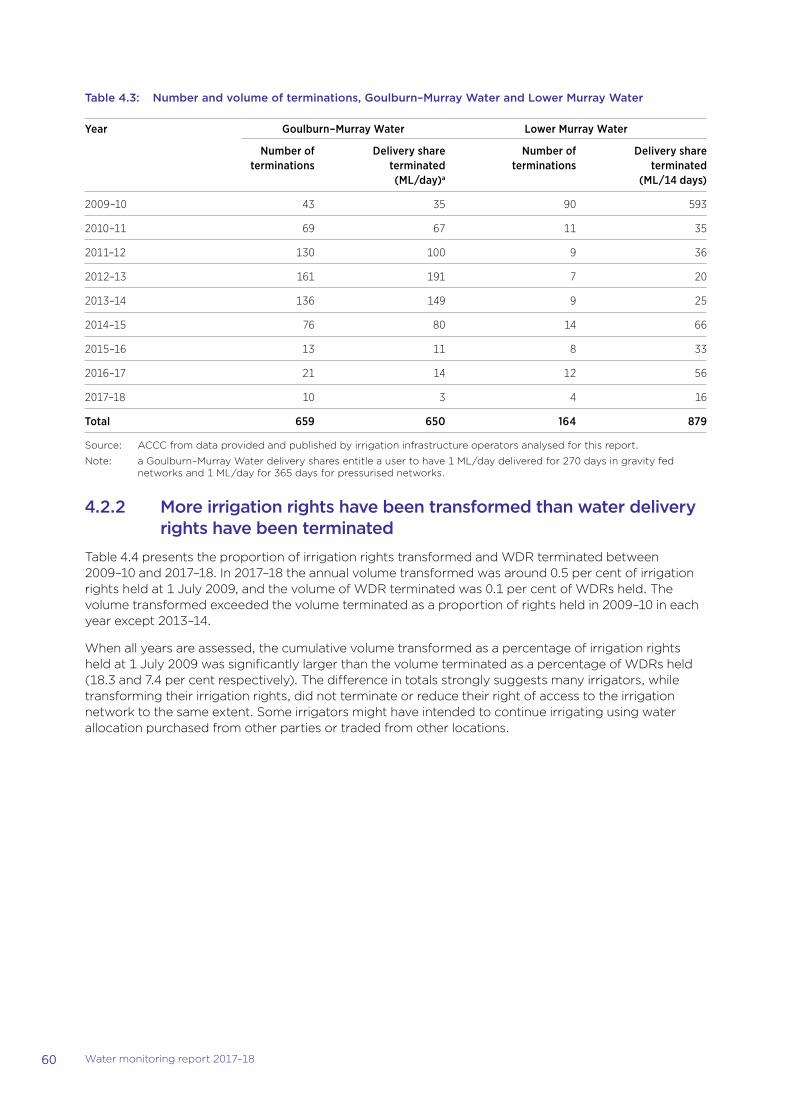
60 Water monitoring report 2017–18
Table 4.3: Number and volume of terminations, Goulburn–Murray Water and Lower Murray Water
Year Goulburn–Murray Water Lower Murray Water
Number of terminations
Delivery share terminated (ML/day)a
Number of terminations
Delivery share terminated
(ML/14 days)
2009–10 43 35 90 593
2010–11 69 67 11 35
2011–12 130 100 9 36
2012–13 161 191 7 20
2013–14 136 149 9 25
2014–15 76 80 14 66
2015–16 13 11 8 33
2016–17 21 14 12 56
2017–18 10 3 4 16
Total 659 650 164 879
Source: ACCC from data provided and published by irrigation infrastructure operators analysed for this report.
Note: a Goulburn–Murray Water delivery shares entitle a user to have 1 ML/day delivered for 270 days in gravity fed networks and 1 ML/day for 365 days for pressurised networks.
4.2.2 More irrigation rights have been transformed than water delivery rights have been terminated
Table 4.4 presents the proportion of irrigation rights transformed and WDR terminated between 2009–10 and 2017–18. In 2017–18 the annual volume transformed was around 0.5 per cent of irrigation rights held at 1 July 2009, and the volume of WDR terminated was 0.1 per cent of WDRs held. The volume transformed exceeded the volume terminated as a proportion of rights held in 2009–10 in each year except 2013–14.
When all years are assessed, the cumulative volume transformed as a percentage of irrigation rights held at 1 July 2009 was significantly larger than the volume terminated as a percentage of WDRs held (18.3 and 7.4 per cent respectively). The difference in totals strongly suggests many irrigators, while transforming their irrigation rights, did not terminate or reduce their right of access to the irrigation network to the same extent. Some irrigators might have intended to continue irrigating using water allocation purchased from other parties or traded from other locations.
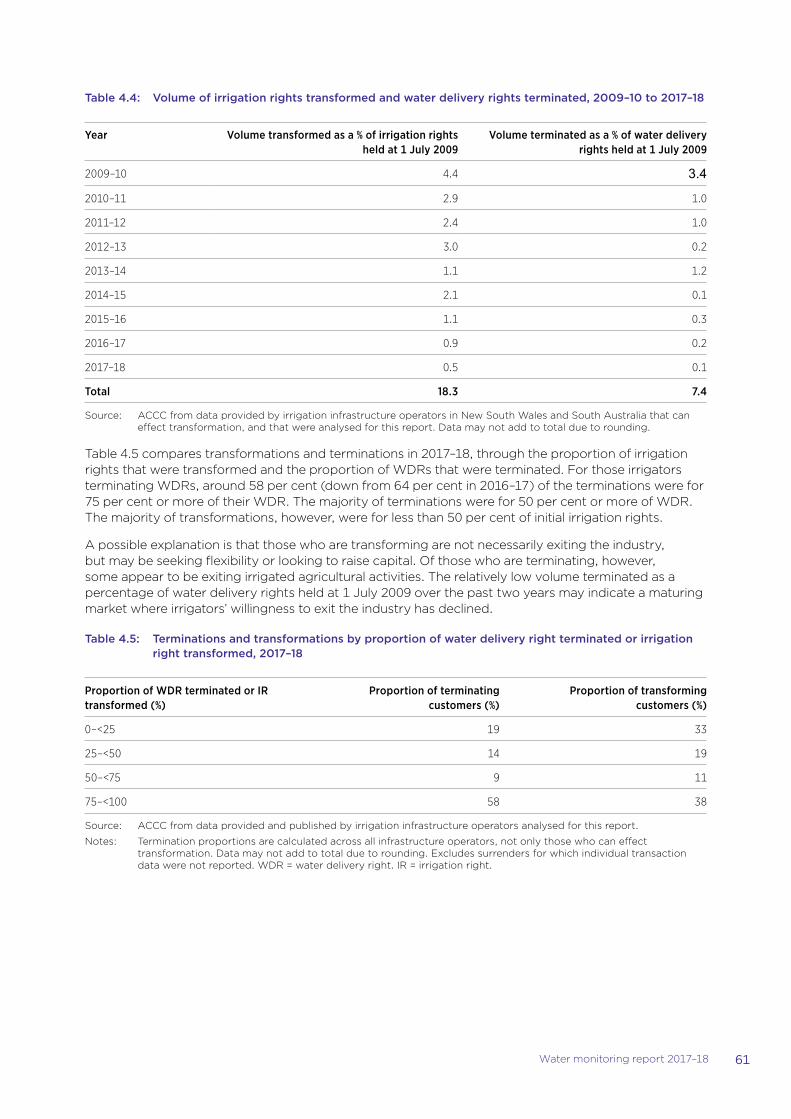
61Water monitoring report 2017–18
Table 4.4: Volume of irrigation rights transformed and water delivery rights terminated, 2009–10 to 2017–18
Year Volume transformed as a % of irrigation rights held at 1 July 2009
Volume terminated as a % of water delivery rights held at 1 July 2009
2009–10 4.4 3.4
2010–11 2.9 1.0
2011–12 2.4 1.0
2012–13 3.0 0.2
2013–14 1.1 1.2
2014–15 2.1 0.1
2015–16 1.1 0.3
2016–17 0.9 0.2
2017–18 0.5 0.1
Total 18.3 7.4
Source: ACCC from data provided by irrigation infrastructure operators in New South Wales and South Australia that can effect transformation, and that were analysed for this report. Data may not add to total due to rounding.
Table 4.5 compares transformations and terminations in 2017–18, through the proportion of irrigation rights that were transformed and the proportion of WDRs that were terminated. For those irrigators terminating WDRs, around 58 per cent (down from 64 per cent in 2016–17) of the terminations were for 75 per cent or more of their WDR. The majority of terminations were for 50 per cent or more of WDR. The majority of transformations, however, were for less than 50 per cent of initial irrigation rights.
A possible explanation is that those who are transforming are not necessarily exiting the industry, but may be seeking flexibility or looking to raise capital. Of those who are terminating, however, some appear to be exiting irrigated agricultural activities. The relatively low volume terminated as a percentage of water delivery rights held at 1 July 2009 over the past two years may indicate a maturing market where irrigators’ willingness to exit the industry has declined.
Table 4.5: Terminations and transformations by proportion of water delivery right terminated or irrigation right transformed, 2017–18
Proportion of WDR terminated or IR transformed (%)
Proportion of terminating customers (%)
Proportion of transforming customers (%)
0–<25 19 33
25–<50 14 19
50–<75 9 11
75–<100 58 38
Source: ACCC from data provided and published by irrigation infrastructure operators analysed for this report.
Notes: Termination proportions are calculated across all infrastructure operators, not only those who can effect transformation. Data may not add to total due to rounding. Excludes surrenders for which individual transaction data were not reported. WDR = water delivery right. IR = irrigation right.
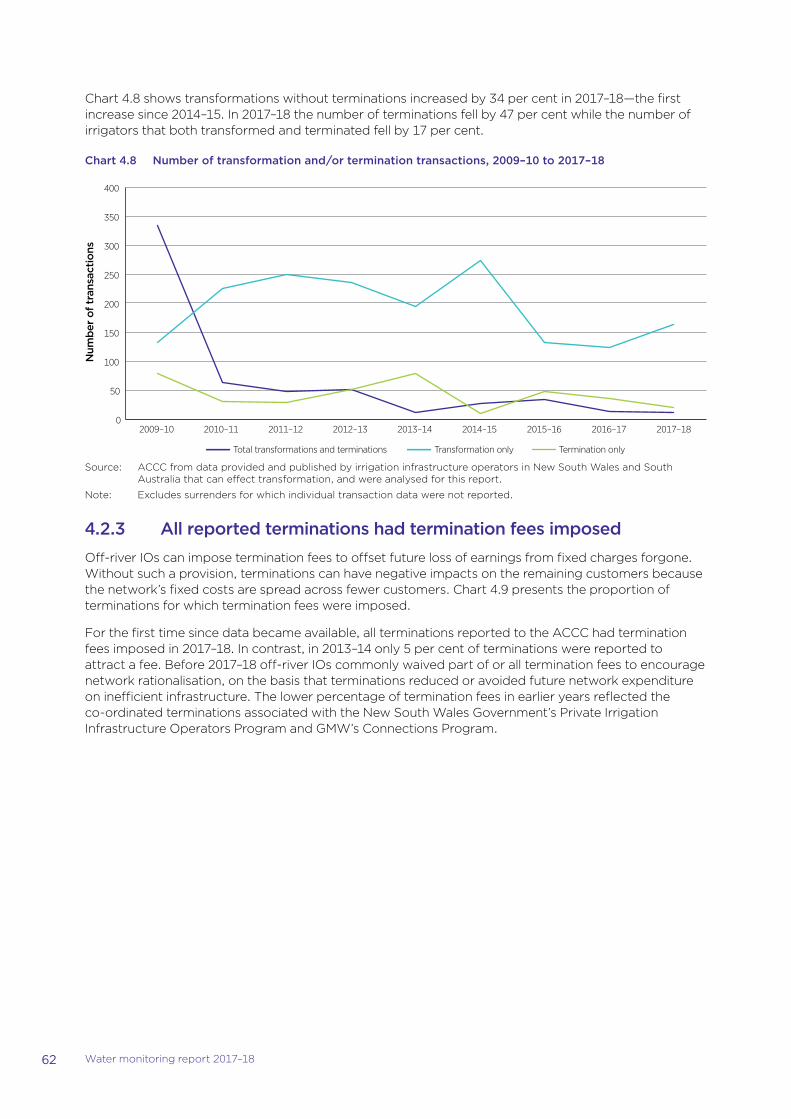
62 Water monitoring report 2017–18
Chart 4.8 shows transformations without terminations increased by 34 per cent in 2017–18—the first increase since 2014–15. In 2017–18 the number of terminations fell by 47 per cent while the number of irrigators that both transformed and terminated fell by 17 per cent.
Chart 4.8 Number of transformation and/or termination transactions, 2009–10 to 2017–18
Num
ber
of t
rans
acti
ons
0
50
100
150
200
250
300
350
400
2009–10 2010–11 2011–12 2012–13 2013–14 2014–15 2015–16 2016–17 2017–18
Total transformations and terminations Transformation only Termination only
Source: ACCC from data provided and published by irrigation infrastructure operators in New South Wales and South Australia that can effect transformation, and were analysed for this report.
Note: Excludes surrenders for which individual transaction data were not reported.
4.2.3 All reported terminations had termination fees imposedOff-river IOs can impose termination fees to offset future loss of earnings from fixed charges forgone. Without such a provision, terminations can have negative impacts on the remaining customers because the network’s fixed costs are spread across fewer customers. Chart 4.9 presents the proportion of terminations for which termination fees were imposed.
For the first time since data became available, all terminations reported to the ACCC had termination fees imposed in 2017–18. In contrast, in 2013–14 only 5 per cent of terminations were reported to attract a fee. Before 2017–18 off-river IOs commonly waived part of or all termination fees to encourage network rationalisation, on the basis that terminations reduced or avoided future network expenditure on inefficient infrastructure. The lower percentage of termination fees in earlier years reflected the co-ordinated terminations associated with the New South Wales Government’s Private Irrigation Infrastructure Operators Program and GMW’s Connections Program.
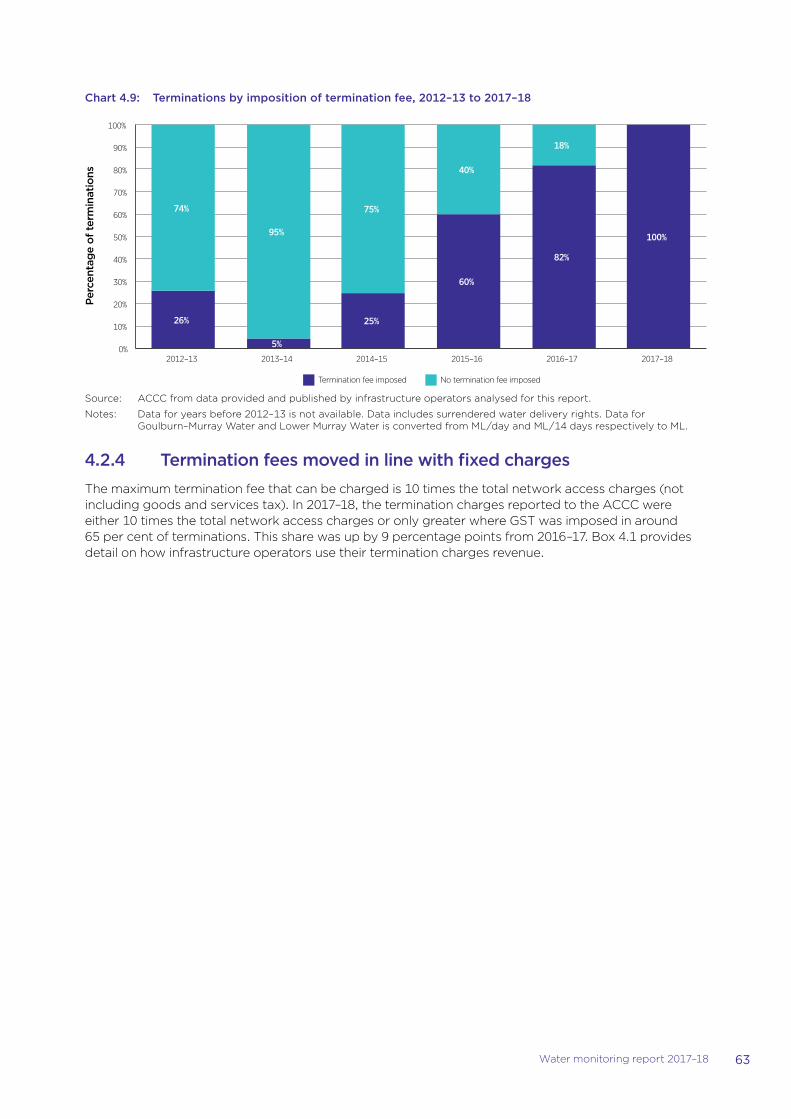
63Water monitoring report 2017–18
Chart 4.9: Terminations by imposition of termination fee, 2012–13 to 2017–18
26%
5%
25%
60%
82%
100%
74%
95%
75%
40%
18%
0%
10%
20%
30%
40%
50%
60%
70%
80%
90%
100%
2012–13 2013–14 2014–15 2015–16 2016–17 2017–18
Termination fee imposed No termination fee imposed
Perc
enta
ge
of t
erm
inat
ions
Source: ACCC from data provided and published by infrastructure operators analysed for this report.
Notes: Data for years before 2012–13 is not available. Data includes surrendered water delivery rights. Data for Goulburn–Murray Water and Lower Murray Water is converted from ML/day and ML/14 days respectively to ML.
4.2.4 Termination fees moved in line with fixed chargesThe maximum termination fee that can be charged is 10 times the total network access charges (not including goods and services tax). In 2017–18, the termination charges reported to the ACCC were either 10 times the total network access charges or only greater where GST was imposed in around 65 per cent of terminations. This share was up by 9 percentage points from 2016–17. Box 4.1 provides detail on how infrastructure operators use their termination charges revenue.
64 Water monitoring report 2017–18
Box 4.1: Infrastructure operators use their termination fee revenue in different ways, but do not necessarily report this expenditure
Off-river infrastructure operators (IOs) incur ongoing costs to operate their infrastructure, regardless of whether an irrigator chooses to terminate access. The Water Charge (Termination Fee) Rules 2009 (WCTFR) allow IOs to charge fees to contribute to the unavoidable fixed costs of operating the network when an irrigator terminates or surrenders all or part of their right of access. Consistent with the Basin water charging objectives and principles in schedule 2 of the Water Act 2007 (Cth), these fees help achieve the economically efficient use of water service infrastructure by:
�� providing for some future revenue certainty for off-river IOs
�� limiting future increases in charges for those customers that maintain their connection
�� helping fund network rationalisation to lower ongoing costs.
Neither the Water Act nor the WCTFR require off-river IOs to report how they use their termination fees. In November 2018, however, the Victorian Department of Environment, Land, Water and Planning (DELWP) recommended that Goulburn–Murray Water and Lower Murray Water be required to clearly publish on their websites how they use termination fees.96 The WCTFR are explained in section 1.2.2 of the Water monitoring report: supplementary information, 2017–18.
Some operators report how they use termination fees
Some off-river IOs already explain their termination fee expenditure in their annual reports or charge schedules:
�� Western Murray Irrigation funded a joint venture to rehabilitate the Coomealla irrigation area, and contributes to an asset replacement fund for irrigation and drainage infrastructure.
�� Central Irrigation Trust invests in term deposits and transfers compensatory amounts for access charges foregone as a result of terminated delivery rights.
�� Coleambally Irrigation Co-operative Limited draws down 10 per cent of an investment account each year, to offset the difference in lost water delivery rights income.
�� Goulburn–Murray Water reports termination fees as ‘Other revenue’ in its financial reports.
Benefits of transparency
Publication of its termination fee expenditure by an off-river IO should build confidence it is managing its district to support active irrigators, and to provide infrastructure that meets customer needs. Further, such transparency allows irrigators to evaluate how the IO manages system costs, ensuring downward price pressure continues for those remaining on the network. It also provides other IOs with an opportunity to learn more about uses for termination fees.
96 The recommendation was one of the proposed outcomes and actions in Department of Environment, Land, Water and Planning, Delivery share review, 2018.
05
Yarrawonga Weir on the Murray River Source: Brayen Dykes (Murray-Darling–Basin Authority)
On-river infrastructure operators’ charges reflected regulators’ efforts to rebalance charging arrangements and increase cost recovery
66 Water monitoring report 2017–18
5. On-river infrastructure operators’ charges reflected regulators’ efforts to rebalance charging arrangements and increase cost recovery
Key points
�� On-river infrastructure operators (IOs) delivered 9 per cent more water in 2017–18 than in 2016–17.
�� In 2017–18, Basin state regulators and governments made or extended several decisions affecting on-river IO charges:
– In Victoria, the Essential Services Commission (ESC) reviewed Lower Murray Water’s (LMW) prices for 2018–23. LMW’s bulk water prices are the prices approved by the ESC for Goulburn-Murray Water (GMW) and passed through. GMW’s entitlement storage fees are to increase annually in real terms by 1 per cent for the Goulburn and 0 per cent for the Murray. The ESC issued its decision on 19 June 2018.
– In July 2018, the New South Wales Government announced a drought relief package that included fixed charge rebates for many water users. For eligible IO customers, 2018–19 bills will reflect the 2017–18 charge rebate.
– The Queensland Competition Authority (QCA) commenced the 2020–24 charge review, with the Government’s decision to be made in 2020. In 2016, the Queensland Government extended the QCA’s 2012–17 decision on Sunwater’s charges for three years to 2020.
– Changes to the Water Charge (Infrastructure) Rules 2010, announced in March 2019, will alter current arrangements for setting prices for on-river IOs from 1 July 2020.
�� In 2017–18, WaterNSW commenced charging under the first year of the Independent Pricing and Regulatory Tribunal’s 2017–21 pricing determination, resulting in:
– hypothetical bill increases for high security (24.8 per cent) and general security entitlement holders (2.9 per cent) in the Murray Valley, at 50 per cent water delivered. Hypothetical bills for high security entitlement holders in the Murrumbidgee Valley increased 8.1 per cent, at 50 per cent water delivered
– hypothetical bill decreases in the Peel Valley of nearly 22 per cent and 16 per cent for high security entitlement holders (at 50 per cent and 100 per cent water delivered respectively), and 7 per cent and nearly 5 per cent for general security entitlement holders (at 50 per cent and 100 per cent water delivered respectively).
�� In Victoria, GMW’s hypothetical bills had:
– 12 per cent increases for the Broken, Bullarook and Ovens systems, reflecting the ESC’s 2016 decision to raise charges for these systems at 10 per cent per year plus the consumer price index (CPI) until they reach full cost recovery. CPI was 1.9 per cent in 2017–18
– approximately 13 per cent decreases for the Goulburn and Murray systems, reflecting a 0 per cent annual increase in Goulburn and a 1.5 per cent annual decrease in bulk water entitlement charges, plus other changes in charges.
�� Hypothetical bills for Queensland’s Sunwater increased just above the CPI in five of its six systems, with Macintyre Brook’s bill rising by approximately 5 per cent.
�� South Australian private diverters’ hypothetical bills increased at a rate below the CPI.
67Water monitoring report 2017–18
This chapter covers the charging arrangements for on-river infrastructure operators (IOs) across the Murray–Darling Basin (MDB). On-river IOs manage water service infrastructure used for storing and delivering water (sometimes called bulk water services). They use different charge or tariff structures to recover the costs of providing these services from customers.126
We use hypothetical bills to analyse the changes in charges from year to year:
�� Section 5.1 describes key decisions affecting on-river IO charges in 2017–18 and important upcoming changes to MDB regulatory arrangements for setting charges for on-river infrastructure services.
�� Section 5.2 reports on the volumes of water delivered by on-river IOs in 2017–18.
�� Section 5.3 shows the hypothetical bill results for the southern MDB and discusses the changes from 2016–17.
�� Section 5.4 shows the hypothetical bill results for the northern MDB and discusses the changes from 2016–17.
5.1 Most on-river infrastructure operators charges are set by regulators under the water charge rules or Basin state frameworks
Under the Water Charge (Infrastructure) Rules (WCIR), on-river IOs are subject to different forms of regulatory oversight depending on their ownership structure and size.127 In section 5.1.1, we describe the pricing changes or decisions made by regulators or ministers in (or taking effect in) 2017–18 that affect on-river IOs. Section 1.2.1 of the Water monitoring report: supplementary information, 2017–18 explains the WCIR.
On 3 April 2019, the Australian Minister for Agriculture and Water Resources, the Hon David Littleproud MP, decided to make changes to the water charge rules that will affect the regulatory arrangements applying to large on-river IOs in the MDB.128 Described in section 5.1.2, these changes will take effect once the current regulatory period for each affected operator expires.129
5.1.1 Regulators and governments set on-river infrastructure operators’ charges
Basin state regulators currently approve the infrastructure charges of the large, non-member owned on-river IOs under accreditation arrangements established under the WCIR. This framework helps ensure on-river IO charges give effect to the Basin water charging objectives and principles, including cost recovery and user pays principles. In the MDB, the large, non-member owned IOs are Goulburn-Murray Water (GMW) and Lower Murray Water (LMW)—both regulated by the Victorian Essential Services Commission (ESC)—and WaterNSW, which is regulated by the Independent Pricing and Regulatory Tribunal (IPART) in New South Wales.130,131
126 For more information on tariff structures and charging arrangements, see Water monitoring report: supplementary information, 2017–18.
127 The size of IOs is assessed with reference to the volume of water they service.
128 The water charge rules is a blanket term used to collectively refer to three sets of rules made under the Water Act 2007: the Water Charge (Infrastructure) Rules 2010, the Water Charge (Termination Fees) Rules 2009, and the Water Charge (Planning and Management Information) Rules 2010. Section 1.2 of our supplementary information explains these rules.
129 The changes to the rules will take effect as prescribed by the transitional arrangements in the amended rules. See Part 11 of the Water Charge Rules 2010 (Cth).
130 We do not report on arrangements in the ACT in this chapter. The volume of non-urban bulk water services provided in the ACT is negligible, and the charges paid by ACT private diverters relate to water planning and management activities, not bulk water services.
131 In South Australia, we do not consider SA Water to be a large on-river IO because it does not deliver non-urban bulk water services within the MDB above the required volume threshold of 250 GL of water access entitlements. It is, however, required under the WCIR to publish its regulated water charges. The Essential Services Commission of South Australia (ESCOSA) is the economic regulator of SA Water and other South Australian licensed water and sewerage retailers. ESCOSA performs this function under the Water Industry Act 2012 (SA).
68 Water monitoring report 2017–18
Under the WCIR, regulators set infrastructure charges for four or five year periods. Charges are usually adjusted smoothly over the regulatory period, with any major changes usually taking effect at the start of a new price setting period.
New South Wales
WaterNSW implemented the first year of charges approved under IPART’s June 2017 decision for 2017–21. Significant changes adopted by IPART in that decision (and partly reflected in the 2017–18 charges) included:
�� restructuring the fixed-to-variable ratio of the Murray–Darling Basin Authority (MDBA) component of charges for the Murray and Murrumbidgee valleys. This ratio changed from 60:40 to 80:20, to better reflect the cost structure of WaterNSW (charges in Victoria are fixed charges reflecting the cost structure). These charges also reflected the recovery of an increased revenue requirement following the New South Wales Government’s restoration of its historical funding of the MDBA
�� changing the fixed-to-variable ratio for Peel Valley customers’ charges from 40:60 to 80:20, with effect in 2018–19. Entitlement charges will rise and use charges will fall. These changes will be reflected in the 2018–19 hypothetical bills
�� other MDB rural valleys to maintain the 60:40 fixed-to-variable ratio.
In July 2018, the New South Wales Government announced a drought relief package that included fixed charge rebates for many water users. It has provided up to $4000 to all general security licence holders. The rebate (section 1.5) applies to the fixed component (charge for holding general security entitlement) of the general security bill.132 For regulated water general security entitlement holders the rebate was applied across the next four quarterly bills from when WaterNSW announced the rebate in August 2018.
Victoria
The ESC released its decision on charges for LMW’s rural water services on 19 June 2018, with effect in the following water year. Box 5.1 describes the key features of the decision.
In 2017–18, GMW implemented the second year of charges approved in the ESC’s 2016 decision. The 2016 decision resulted in the ESC approving GMW’s proposed bulk water charges. This resulted in annual price changes for GMW’s bulk entitlement (high reliability water shares charges), increasing by 10 per cent for the Broken, Bullarook and Ovens systems, 0 per cent for the Goulburn and Campaspe systems, and decreasing by 1.5 per cent for the Murray system. Entitlement storage fees are to increase in real terms by 1 per cent annually for the Goulburn system and 0 per cent for the Murray system. Most of GMW’s costs are fixed and recovered by fixed charges and, as such, water demand does not have an impact on these hypothetical bills calculated by the ACCC.
In December 2018, the ESC consulted on its proposed approach to determining GMW’s prices for the next regulatory period (commencing 1 July 2020). It published guidance papers on how it would assess GMW’s pricing proposal against the water charge rules and the Victorian Government’s Water Industry Regulatory Order requirements.133
132 The rebate is automatically applied to the next bill notice. Groundwater and unregulated surface water customers receiving an annual bill receive the rebate on the next annual bill (2017–18 or 2017–18). Regulated surface water customers receive the rebate on their next four quarterly bills.
133 ESC, Goulburn–Murray Water Price Review 2020: guidance on price submission under the WCIR, 2018, https://www.esc.vic.gov.au/water/water-prices-tariffs-and-special-drainage/water-price-reviews/goulburn-murray-water-price-review-2020, viewed 8 February 2019.
69Water monitoring report 2017–18
Box 5.1: Essential Services Commission’s decision on Lower Murray Water bulk water charges for 2018–19 to 2022–23
On 19 June 2018, the Essential Services Commission (ESC) of Victoria released its final determination of Lower Murray Water’s (LMW) charges for the five year period commencing 1 July 2018. The ESC assessed LMW’s proposed charges (described below) against the ACCC’s pricing principles, as required by the Water Charge (Infrastructure) Rules. The ESC’s final decision accepted LMW’s proposed tariff structures and proposed prices, which involve small average annual increases. We will report on these changes in our 2018–19 water monitoring report.
LMW stated the primary driver for its proposed price changes was a substantial increase in forecast electricity costs; however, it forecast an overall reduction in other costs and efficiency gains.134 In 2018–19, electricity costs equated to around 28 per cent of what LMW describes as controllable costs. LMW’s current power contract expired in June 2018 and forecast increases in electricity were based on an Ernst & Young report commissioned for the operator.
LMW’s entitlement storage charges are set by the ESC for Goulburn–Murray Water (GMW) and this revenue is remitted to GMW. The ESC approved the continuation of the arrangement. The ESC’s 2016 decision for GMW set the high reliability water share fee for the Goulburn and Murray storages to increase by 1 per cent and 0 per cent respectively in real terms annually.135 The decision resulted in private diverter bills increasing by around 1.3 per cent in 2018–19.136
The ESC’s final determination set expenditures and revenues over the price setting period totalling:
�� operational expenditure of $98.5 million
�� capital expenditure of $34.3 million
�� a revenue requirement of $128.3 million.
Queensland
Most of Sunwater’s operations fall outside the Queensland MDB, so the operator does not meet the threshold (250 GL of entitlements) to be considered a large on-river IO under the Water Charge (Infrastructure) Rules (WCIR). Its charges, therefore, are not approved or determined under Part 6 of the WCIR.137 Rather, the Queensland Competition Authority (QCA) reviews Sunwater’s prices.138 The QCA recommended price path increases of $2 per ML for those tariff groups that had not reached lower bound full cost recovery. The QCA stated the price increase would not see these tariff groups reach lower bound cost recovery over the 2012–17 price setting period.139
In May 2016, the Queensland Government deferred the next QCA price review and extended the application of Sunwater’s charges (as recommended by the QCA in its 2012–17 review) until the end of June 2019. Its reason was to allow for some of Sunwater’s water supply schemes to transition to local management arrangements. Within the Queensland MDB, Sunwater’s St George water supply scheme adopted local management arrangements and, from 1 July 2018 became known as Mallawa Irrigation. Effectively, Mallawa Irrigation is a new irrigation infrastructure operator.
134 LMW, 2018–2023 price submission—rural, September 2017, p. 34, https://www.esc.vic.gov.au/sites/default/files/documents/2018-water-price-review-lower-murray-water-price-submission-rural-20170928.pdf, viewed 1 February 2019.
135 ESC, Goulburn–Murray Water Price Review: draft decision, June 2016–17, 2017, p. 65.
136 Based on 1000 ML of annual use. See ESC, Lower Murray Water: final decision—rural services, 2018 Water Price Review, 2018, p. 33.
137 Sunwater was formerly considered a Part 5 operator under the WCIR, requiring it to prepare a network service plan, until then Australian Minister for Agriculture and Water Resources, the Hon Barnaby Joyce MP, repealed Part 5 of the WCIR on 31 January 2017.
138 The QCA undertakes the review at the request of the Queensland Minister for Finance and the Arts and the Queensland Treasurer, under Section 23 of the Queensland Competition Authority Act 1997.
139 QCA, Final Report: Sunwater irrigation price review 2012–17, volume 1, May 2012, p. 332.
70 Water monitoring report 2017–18
5.1.2 Changes to the rules and regulatory arrangements for the setting of charges for large on-river infrastructure operators were announced
Amended water charge rules will commence on 1 July 2020 (section 2.4). The amendments will change the existing arrangements for Part 6 operators and for Basin state regulators accredited under Part 9 of the WCIR.
After a transition period, the amendments mean the current Part 6 operators will be regulated under Basin state regulatory arrangements (not under Part 6), if certain conditions are met. The conditions include the form of regulation in place in the Basin state. That is, a single state agency must regulate the IO’s charges in a manner consistent with the ‘prudent and efficient’ expenditure requirements set out in sub-rule 29(2)(b) of the amended water charge rules. If the Basin state framework does not satisfy these requirements, the ACCC will regulate the IO’s charges, unless we grant the IO an exemption from Part 6.
Under the new Part 6, we must notify an IO if we become aware the IO is or is likely to become a Part 6 operator.140 Likewise, an IO must notify the ACCC if it considers it is or is likely to become a Part 6 operator. The ACCC can exempt an IO from the Part 6 requirements if satisfied that regulating the IO under that Part would not materially help achieve the Basin water charging objectives and principles.
The amended rules apply transitional arrangements to existing Part 6 operators and accredited Basin state regulators. Those regulators will either apply the new Part 6 arrangements for the remainder of the regulatory period (for decisions already made) or make a decision under the old rules but apply the new Part 6 after the decision is made. At the end of each IO’s transitional period, we expect Basin state governments will have arrangements mostly in place to regulate those IOs.
5.2 Carryover water and use of fixed charges reduced the impact of a dry year on operators
Total water deliveries by on-river IOs increased by just over 9 per cent in 2017–18 from the previous year. On-river IO water delivery volumes reflect customer demand (including the use of carryover, where available) and announced allocations for different entitlement classes.141 Although conditions in 2017–18 were drier than in 2016–17, irrigators carried over significant volumes of water from 2016–17 and the use of carryover water in 2017–18 partly drove the increase in the total water delivered by on-river IOs (see chapter 1).
WaterNSW reported strong rural valley water demand with the dry conditions over the year.142 WaterNSW stated despite demand being high, the annual volume they delivered to rural valleys was down. Contributing factors were overall water availability143 and lower water allocations to general security entitlement holders during 2017–18. Victorian on-river IOs GMW and LMW reported delivering 44 per cent and 17 per cent more water for irrigation purposes than in 2016–17 respectively.
Table 5.1 shows on-river IOs’ water access right and delivery volumes for 2016–17 and 2017–18. These data show, over the past four years, most on-river IOs’ reported water deliveries were to off-river IOs (49 per cent) and private diverters (28.6 per cent), with less than 20 per cent delivered to environmental water holders. Water deliveries to the environment increased annually from 2014–15 to 2016–17, then
140 To be a Part 6 operator, an IO must levy an infrastructure charge for bulk water services or infrastructure services (the storage or delivery of water) needed to effect the arranged sharing of water between more than one Basin state.
141 High security/high reliability entitlement holders in New South Wales and Victoria usually receive close to or 100 per cent allocation against their entitlements. General security/low reliability entitlement holders are the most exposed to fluctuations in water availability. Other factors determining water availability include inflows from rains, water conveyance losses, climatic conditions and evaporation rates.
142 WaterNSW, Annual report 2017–18, 2018, p. 16, https://www.opengov.nsw.gov.au/publications/17613;jsessionid=3E8AC3E0DD349B212FD7C6ADBA103DF6, viewed 1 February 2019.
143 WaterNSW, Annual report 2017–18, 2018, p. 16.
71Water monitoring report 2017–18
fell by just over 4 per cent from 2016–17 to 2017–18.144 On-river IOs also delivered water to urban water supply networks within the MDB (an average of 2.3 per cent of deliveries over the past four years).
The volumes of water delivered affect revenues for those operators whose tariff structure includes variable charges. Chart 5.1 and 5.2 show the charge components for IOs in the southern and northern MDB:
�� GMW and LMW levy fixed charges for their bulk water services, so the volume of water delivered does not alter these operators’ revenues.
�� Private diverters in South Australia’s Murray region paid only water planning and management charges.
�� WaterNSW had the highest reliance on variable charges.145 In previous pricing determinations, the ACCC and IPART set a fixed-to-variable tariff structure of 40:60 despite the costs incurred by WaterNSW being largely fixed. Under the current determination, IPART made an exception for the 40:60 structure, changing the fixed-to-variable ratio to 80:20 for 2018–19 for the Peel Valley and in 2017–18 for the MDBA charges (section 5.1).
WaterNSW’s tariff structure leads to revenue volatility risk with changes in water use, especially when low water availability leads to lower water allocations to licences. In its 2014–17 decision, the ACCC sought to limit WaterNSW’s exposure to fluctuating revenues from changes in water use by applying an ‘unders and overs’ mechanism. This mechanism allowed for the adjustment of charges annually to recover a portion of the revenue not recovered because water use was lower than forecast, or to return a portion of revenue to customers if water use was higher than forecast. In its 2017–21 decision, IPART replaced the ‘unders and overs’ mechanism with a volatility allowance of $1.3 million in 2017–18 and $1.27 million per year from 2018–19 to 2020–21. IPART factored the volatility allowance into WaterNSW’s charges over the regulatory period.146
144 Based on data we received from on-river IOs.
145 Our total hypothetical bills for the southern MDB show the proportion of variable charges ranged from 18 per cent for WaterNSW Murray valley high security users to 83.6 per cent for general security entitlements in the Lachlan Valley. The proportion of variable charges in the northern MDB ranged from 34 per cent for high security entitlement holders in the Macquarie Valley to 93 per cent for general security entitlement holders in the Peel Valley.
146 IPART, WaterNSW annual review of regulated charges for 2018–19, June 2018, p. 2.
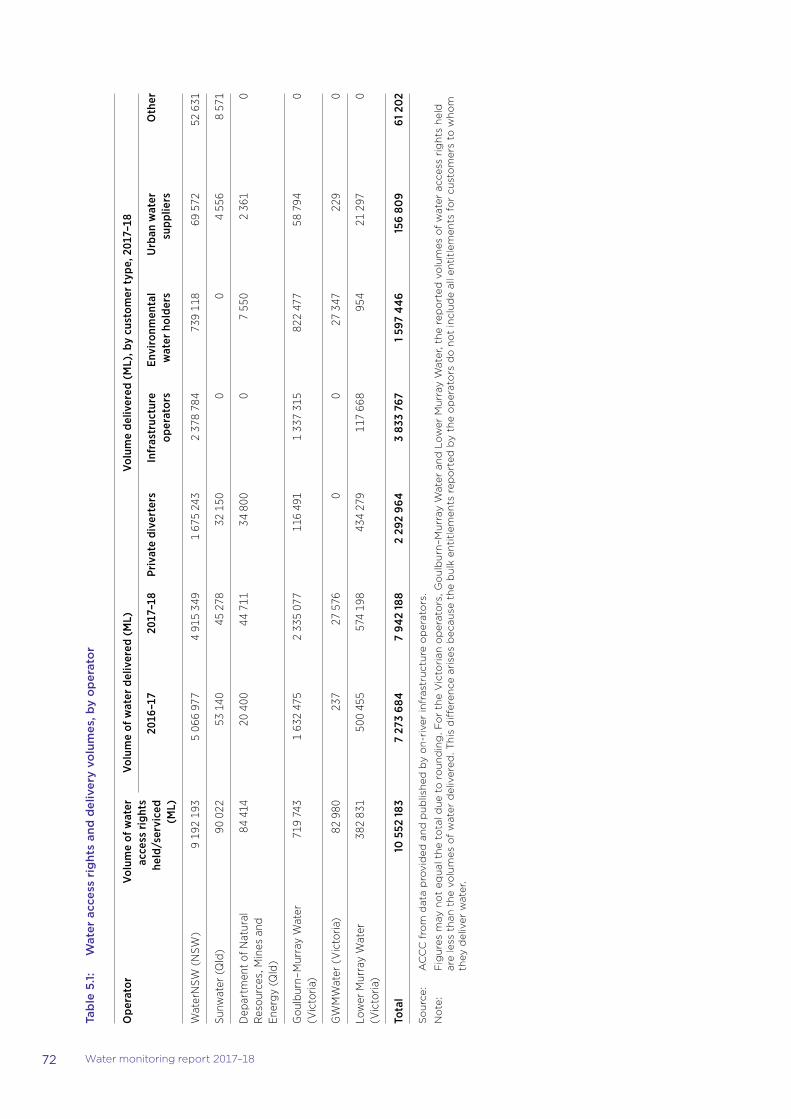
72 Water monitoring report 2017–18
Tab
le 5
.1:
Wat
er a
cces
s ri
ght
s an
d d
eliv
ery
volu
mes
, by
op
erat
or
Ope
rato
rVo
lum
e of
wat
er
acce
ss r
ight
s he
ld/s
ervi
ced
(ML)
Volu
me
of w
ater
del
iver
ed (
ML)
Volu
me
deliv
ered
(M
L), b
y cu
stom
er t
ype,
201
7–18
2016
–17
2017
–18
Priv
ate
dive
rter
sIn
fras
truc
ture
op
erat
ors
Envi
ronm
enta
l w
ater
hol
ders
Urb
an w
ater
su
pplie
rsO
ther
Wat
erN
SW (
NSW
)9
192
193
5 06
6 97
74
915
349
1 67
5 24
32
378
784
739
118
69 5
7252
631
Sunw
ater
(Q
ld)
90 0
2253
140
45 2
7832
150
00
4 55
68
571
Dep
artm
ent
of N
atur
al
Res
ourc
es, M
ines
and
En
ergy
(Q
ld)
84 4
1420
400
44 7
1134
800
07
550
2 36
10
Gou
lbur
n–M
urra
y W
ater
(V
icto
ria)
719
743
1 63
2 47
52
335
077
116
491
1 33
7 31
582
2 47
758
794
0
GW
MW
ater
(V
icto
ria)
82 9
8023
727
576
00
27 3
4722
90
Low
er M
urra
y W
ater
(V
icto
ria)
382
831
500
455
574
198
434
279
117
668
954
21 2
970
Tota
l10
552
183
7 27
3 68
47
942
188
2 29
2 96
43
833
767
1 597
446
156
809
61 2
02
So
urc
e:
AC
CC
fro
m d
ata
pro
vid
ed a
nd
pu
blis
hed
by
on
-riv
er in
fras
tru
ctu
re o
per
ato
rs.
No
te:
Fig
ure
s m
ay n
ot
equ
al t
he
tota
l du
e to
ro
un
din
g. F
or
the
Vic
tori
an o
per
ato
rs, G
ou
lbu
rn–M
urr
ay W
ater
an
d L
ow
er M
urr
ay W
ater
, th
e re
po
rted
vo
lum
es o
f w
ater
acc
ess
rig
hts
hel
d
are
less
th
an t
he
volu
mes
of
wat
er d
eliv
ered
. Th
is d
iffer
ence
ari
ses
bec
ause
th
e b
ulk
en
titl
emen
ts r
epo
rted
by
the
op
erat
ors
do
no
t in
clu
de
all e
nti
tlem
ents
fo
r cu
sto
mer
s to
wh
om
th
ey d
eliv
er w
ater
.
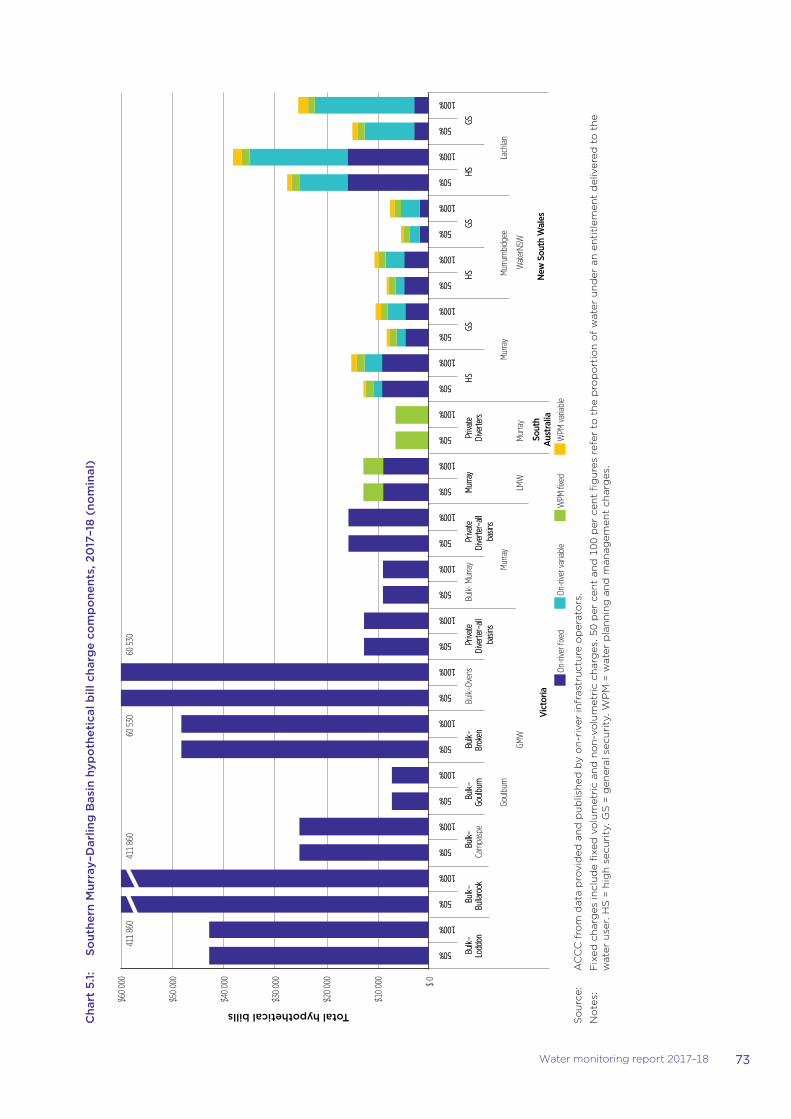
73Water monitoring report 2017–18
Cha
rt 5
.1:
Sout
hern
Mur
ray–
Dar
ling
Bas
in h
ypo
thet
ical
bill
cha
rge
com
po
nent
s, 2
017
–18
(no
min
al)
50%
100%
50%
100%
50%
100%
50%
100%
50%
100%
50%
100%
50%
100%
50%
100%
50%
100%
50%
100%
50%
100%
50%
100%
50%
100%
50%
100%
50%
100%
50%
100%
50%
100%
Bulk -
Loddon
Bulk -
Bullarook
Bulk -
Goulburn
Bulk -
Broken
Private
Diverter–all
basins
Private
Diverter–all
basins
Murray
Private
Diverters
HS
GS
HS
GS
HS
GS
Murray
Murray
Murrumbidgee
Lachlan
GMW
WaterNSW
New
Sou
th W
ales
411 860
411 860
60 530
60 530
50%
100%
50%
100%
50%
100%
50%
100%
50%
100%
50%
100%
50%
100%
50%
100%
50%
100%
50%
100%
50%
100%
50%
100%
50%
100%
50%
100%
50%
100%
50%
100%
50%
100%
Bulk–
Loddon
Bulk–
Bullarook
Bulk–
Campaspe
Bulk–
Bulk–
Goulburn
Bulk–
Broken
Bulk–Ovens
Private
Diverter–all
basins
Bulk- Murray
Private
Diverter–all
basins
Murray
Private
Diverters
HS
GS
HS
GS
HS
GS
Goulburn
LMW
Murray
Vict
oria
So
uth
Aus
tral
ia
On-river fixed
On-river variable
WPM
fixed
WPM
variable
$ 0
$10 000
$20 000
$30 000
$40 000
$50 000
$60 000
Total hypothetical bills
So
urc
e:
AC
CC
fro
m d
ata
pro
vid
ed a
nd
pu
blis
hed
by
on
-riv
er in
fras
tru
ctu
re o
per
ato
rs.
No
tes:
F
ixed
ch
arg
es in
clu
de
fixe
d v
olu
met
ric
and
no
n-v
olu
met
ric
char
ges
. 50
per
cen
t an
d 1
00 p
er c
ent
fig
ure
s re
fer
to t
he
pro
po
rtio
n o
f w
ater
un
der
an
en
titl
emen
t d
eliv
ered
to
th
e w
ater
use
r. H
S =
hig
h s
ecu
rity
. GS
= g
ener
al s
ecu
rity
. WP
M =
wat
er p
lan
nin
g a
nd
man
agem
ent
char
ges
.
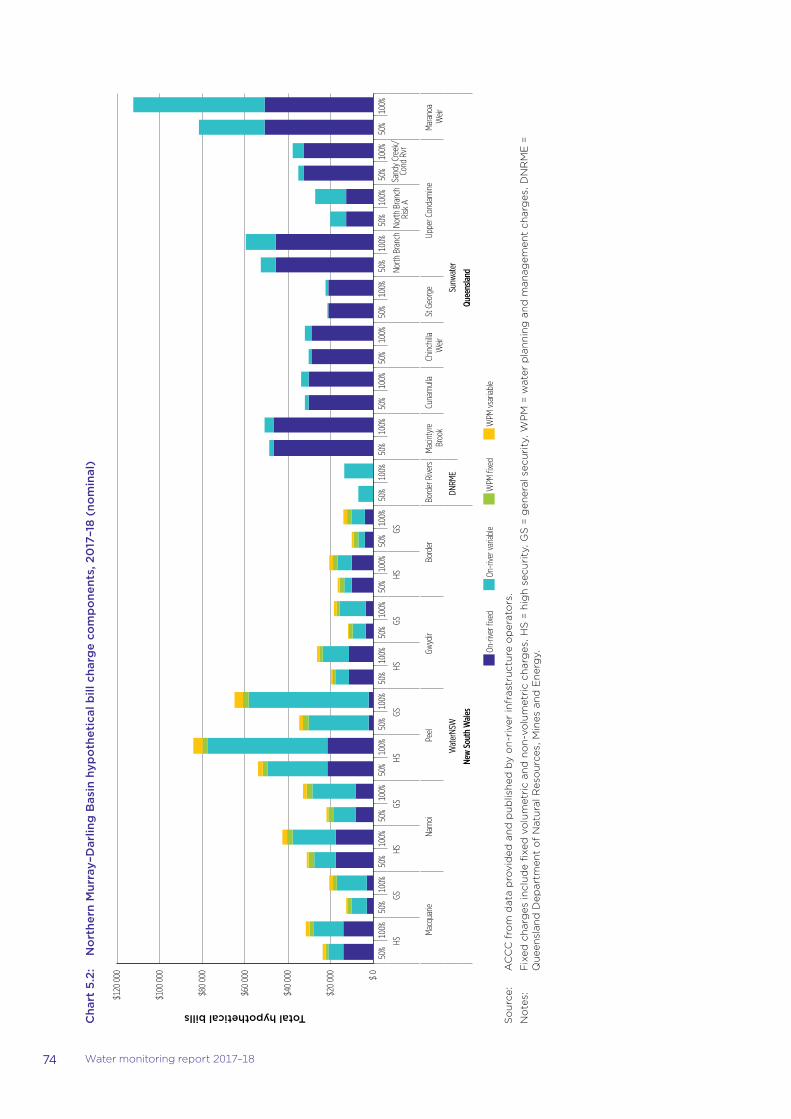
74 Water monitoring report 2017–18
Cha
rt 5
.2:
No
rthe
rn M
urra
y–D
arlin
g B
asin
hyp
oth
etic
al b
ill c
harg
e co
mp
one
nts,
20
17–1
8 (n
om
inal
)
On-river fixed
On-river variable
WPM
fixed
WPM
vsariable
$ 0
$20 000
$40 000
$60 000
$80 000
$100 000
$120 000
50%
100% 50%
100% 50%
100% 50%
100% 50%
100% 50%
100% 50%
100% 50%
100% 50%
100% 50%
100% 50%
100% 50%
100% 50%
100% 50%
100% 50%
100% 50%
100% 50%
100% 50%
100% 50%
100%
HS
GS
HS
GS
HS
GS
HS
GS
HS
GS
North Branch North Branch
Risk A
Macquarie
Namoi
Peel
Gwydir
Border
Border Rivers
Macintyre
Brook
Cunamulla
Chinchilla
Weir
St George
Upper Condamine
Maranoa
Weir
WaterNSW
DNRM
E Sunw
ater
New South Wale
s Queenslan
d
Sandy Creek/
Cond Rvr
Total hypothetical bills
So
urc
e:
AC
CC
fro
m d
ata
pro
vid
ed a
nd
pu
blis
hed
by
on
-riv
er in
fras
tru
ctu
re o
per
ato
rs.
No
tes:
F
ixed
ch
arg
es in
clu
de
fixe
d v
olu
met
ric
and
no
n-v
olu
met
ric
char
ges
. HS
= h
igh
sec
uri
ty. G
S =
gen
eral
sec
uri
ty. W
PM
= w
ater
pla
nn
ing
an
d m
anag
emen
t ch
arg
es. D
NR
ME
=
Qu
een
slan
d D
epar
tmen
t o
f N
atu
ral R
eso
urc
es, M
ines
an
d E
ner
gy.
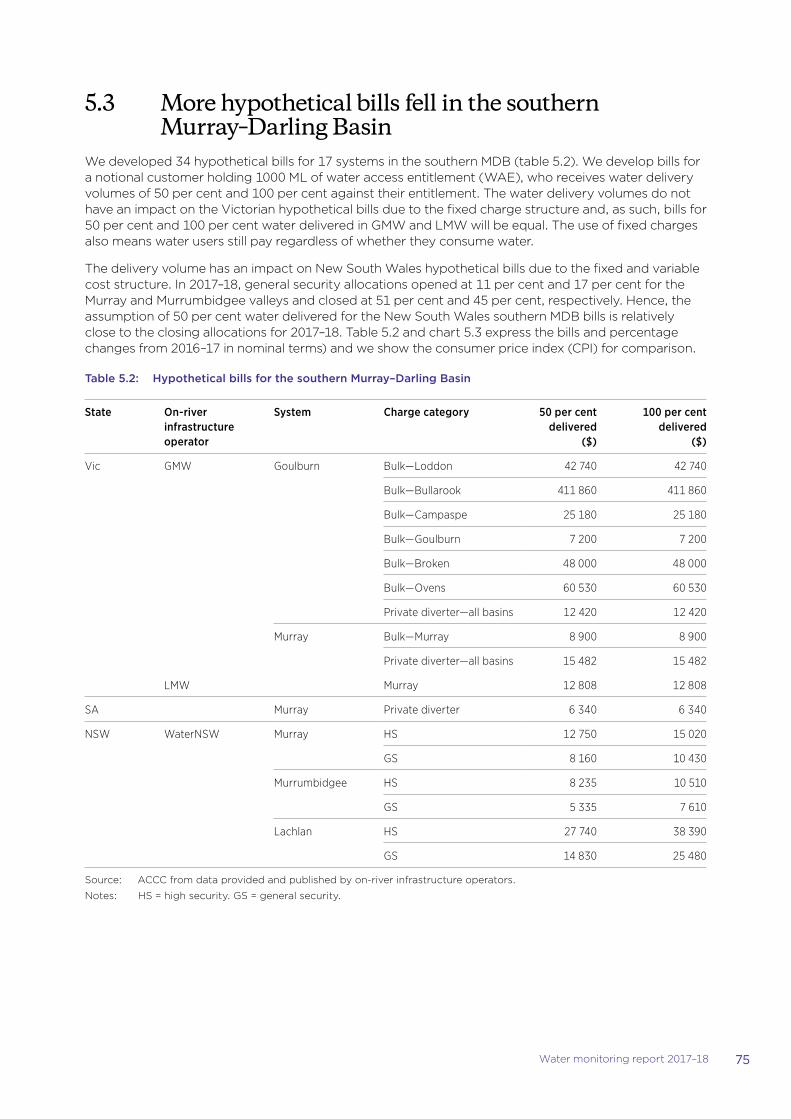
75Water monitoring report 2017–18
5.3 More hypothetical bills fell in the southern Murray–Darling Basin
We developed 34 hypothetical bills for 17 systems in the southern MDB (table 5.2). We develop bills for a notional customer holding 1000 ML of water access entitlement (WAE), who receives water delivery volumes of 50 per cent and 100 per cent against their entitlement. The water delivery volumes do not have an impact on the Victorian hypothetical bills due to the fixed charge structure and, as such, bills for 50 per cent and 100 per cent water delivered in GMW and LMW will be equal. The use of fixed charges also means water users still pay regardless of whether they consume water.
The delivery volume has an impact on New South Wales hypothetical bills due to the fixed and variable cost structure. In 2017–18, general security allocations opened at 11 per cent and 17 per cent for the Murray and Murrumbidgee valleys and closed at 51 per cent and 45 per cent, respectively. Hence, the assumption of 50 per cent water delivered for the New South Wales southern MDB bills is relatively close to the closing allocations for 2017–18. Table 5.2 and chart 5.3 express the bills and percentage changes from 2016–17 in nominal terms) and we show the consumer price index (CPI) for comparison.
Table 5.2: Hypothetical bills for the southern Murray–Darling Basin
State On-river infrastructure operator
System Charge category 50 per cent delivered
($)
100 per cent delivered
($)
Vic GMW Goulburn Bulk—Loddon 42 740 42 740
Bulk—Bullarook 411 860 411 860
Bulk—Campaspe 25 180 25 180
Bulk—Goulburn 7 200 7 200
Bulk—Broken 48 000 48 000
Bulk—Ovens 60 530 60 530
Private diverter—all basins 12 420 12 420
Murray Bulk—Murray 8 900 8 900
Private diverter—all basins 15 482 15 482
LMW Murray 12 808 12 808
SA Murray Private diverter 6 340 6 340
NSW WaterNSW Murray HS 12 750 15 020
GS 8 160 10 430
Murrumbidgee HS 8 235 10 510
GS 5 335 7 610
Lachlan HS 27 740 38 390
GS 14 830 25 480
Source: ACCC from data provided and published by on-river infrastructure operators.
Notes: HS = high security. GS = general security.
76 Water monitoring report 2017–18
There were more hypothetical bill decreases in the southern MDB in 2017–18 (17) than in 2016–17. GMW had 10 decreases in hypothetical bills and two of its systems had no change (the Loddon and Campaspe systems). WaterNSW had seven decreases in hypothetical bills, ranging from 6 per cent to just over 10 per cent.
Price determinations released in June 2017 by the ESC and IPART drove the changes reflected in our hypothetical bills. We discussed the ESC’s decision on GMW charges and IPART’s decision on WaterNSW charges in our 2016–17 water monitoring report.147
In 2017–18 we observed:
�� 12 per cent increases for GMW’s Bullarook, Broken and Ovens systems. The hypothetical bills for these systems had the highest increases in GMW’s area of operations since 2009–10. This outcome is due to their smaller size and their lack of the economies of scale that are evident in the larger systems
�� approximately 13 per cent decreases for on-river bills in GMW’s Goulburn and Murray systems, which were due to reductions in bulk water entitlement charges
�� a 25 per cent increase in WaterNSW’s Murray high security bill at 50 per cent delivery, due to higher MDBA pass-through charges (box 5.2)
�� decreases of 1–5 per cent for New South Wales general security bills for the Murrumbidgee Valley, and decreases of around 5–8 per cent for both entitlement types in the Lachlan Valley. The falls reflected reductions in charges for holding entitlements, as well as use charges.
The large increases in MDBA pass-through charges in the Murray and Murrumbidgee valleys in New South Wales are due to the Government’s decision to resume funding its historical share of the costs of the MDBA. IPART’s 2017 decision restructured the fixed-to-variable ratio of the MDBA component of the total charges applied to water users in the Murray and Murrumbidgee valleys (from 60:40 to 80:20) to better reflect the cost structure of WaterNSW. This change increased the charge for holding high security and general security entitlements in the Murray and Murrumbidgee valleys, and reduced the MDBA use charges.
WaterNSW’s pricing submission had proposed a 13 per cent increase in the customer share of MDBA and Border Rivers Commission payments to an average annual amount of $15.4 million. IPART reduced this proposal by 1.25 per cent compounded per year. It stated the reduction was in response to customer concerns (expressed in submissions to the price determination) about lack of transparency of charges.
The increases in the MDBA pass-through charges offset decreases in the premium paid by high security entitlement holders in the Murray Valley. The premium was adjusted through updated inputs for water security and reliability. Updating the inputs resulted in a 16 per cent decrease in the high security premium for the Murray Valley.
147 ACCC, Water monitoring report 2016–17, pp. 41–2.
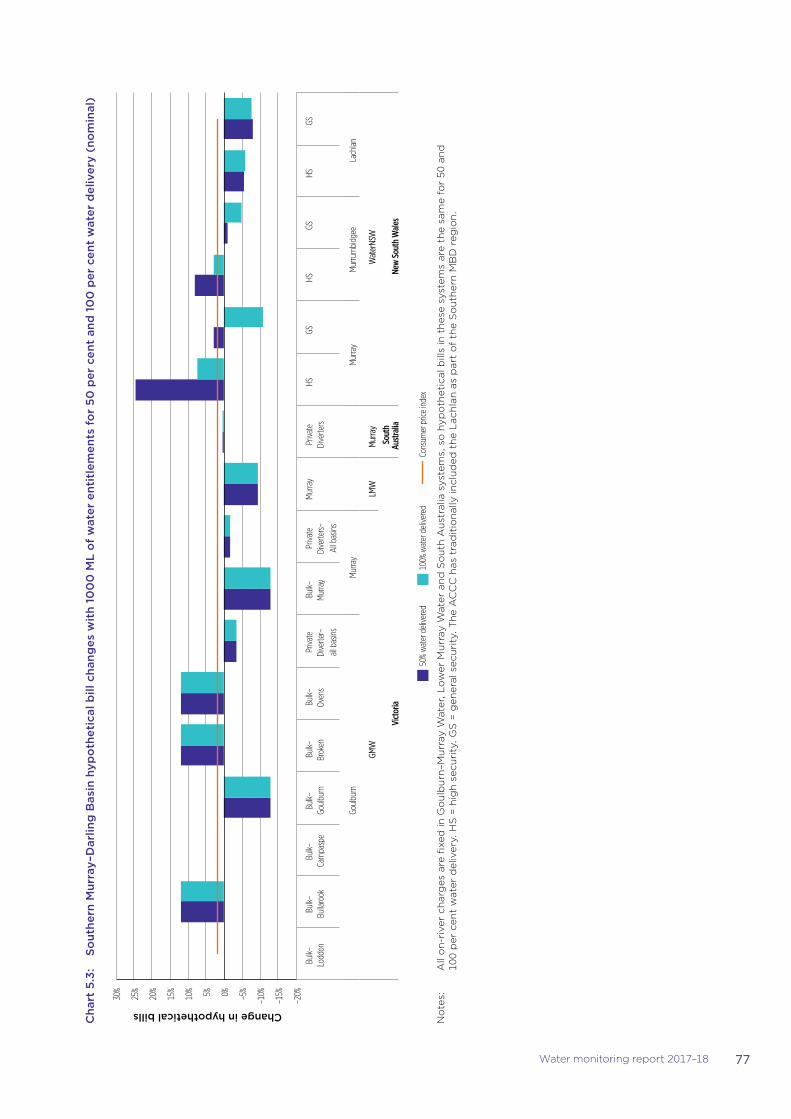
77Water monitoring report 2017–18
Cha
rt 5
.3:
Sout
hern
Mur
ray–
Dar
ling
Bas
in h
ypo
thet
ical
bill
cha
nges
wit
h 10
00
ML
of
wat
er e
ntit
lem
ents
fo
r 50
per
cen
t an
d 1
00
per
cen
t w
ater
del
iver
y (n
om
inal
)
–20%
–15%
–10%
–5% 0%
5%
10%
15%
20%
25%
30%
Bulk–
Loddon
Bulk–
Bullarook
Bulk–
Campaspe
Bulk–
Goulburn
Bulk–
Broken
Bulk–
Ovens
Private
Diverter–
all basins
Bulk–
Murray
Private
Diverters–
All basins
Murray
Private
Diverters
HS
GS
HS
GS
HS
GS
Goulburn
Murray
Murray
Murrumbidgee
Lachlan
GMW
LMW
Murray
WaterNSW
Victoria
South
Australia
New South Wale
s
50% water delivered
100% water delivered
Consum
er price index
Change in hypothetical bills
No
tes:
A
ll o
n-r
iver
ch
arg
es a
re fi
xed
in G
ou
lbu
rn–M
urr
ay W
ater
, Lo
wer
Mu
rray
Wat
er a
nd
So
uth
Au
stra
lia s
yste
ms,
so
hyp
oth
etic
al b
ills
in t
hes
e sy
stem
s ar
e th
e sa
me
for
50 a
nd
10
0 p
er c
ent
wat
er d
eliv
ery.
HS
= h
igh
sec
uri
ty. G
S =
gen
eral
sec
uri
ty. T
he
AC
CC
has
tra
dit
ion
ally
incl
ud
ed t
he
Lac
hla
n a
s p
art
of
the
So
uth
ern
MB
D r
egio
n.
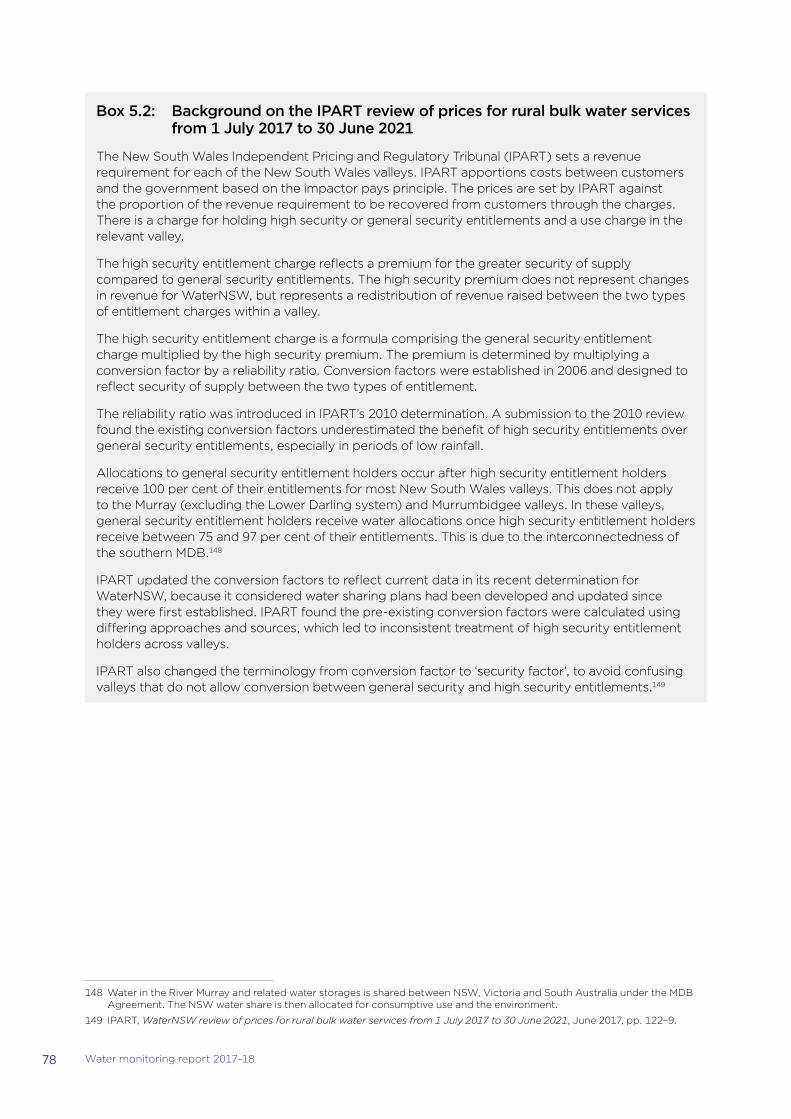
78 Water monitoring report 2017–18
Box 5.2: Background on the IPART review of prices for rural bulk water services from 1 July 2017 to 30 June 2021
The New South Wales Independent Pricing and Regulatory Tribunal (IPART) sets a revenue requirement for each of the New South Wales valleys. IPART apportions costs between customers and the government based on the impactor pays principle. The prices are set by IPART against the proportion of the revenue requirement to be recovered from customers through the charges. There is a charge for holding high security or general security entitlements and a use charge in the relevant valley.
The high security entitlement charge reflects a premium for the greater security of supply compared to general security entitlements. The high security premium does not represent changes in revenue for WaterNSW, but represents a redistribution of revenue raised between the two types of entitlement charges within a valley.
The high security entitlement charge is a formula comprising the general security entitlement charge multiplied by the high security premium. The premium is determined by multiplying a conversion factor by a reliability ratio. Conversion factors were established in 2006 and designed to reflect security of supply between the two types of entitlement.
The reliability ratio was introduced in IPART’s 2010 determination. A submission to the 2010 review found the existing conversion factors underestimated the benefit of high security entitlements over general security entitlements, especially in periods of low rainfall.
Allocations to general security entitlement holders occur after high security entitlement holders receive 100 per cent of their entitlements for most New South Wales valleys. This does not apply to the Murray (excluding the Lower Darling system) and Murrumbidgee valleys. In these valleys, general security entitlement holders receive water allocations once high security entitlement holders receive between 75 and 97 per cent of their entitlements. This is due to the interconnectedness of the southern MDB.148
IPART updated the conversion factors to reflect current data in its recent determination for WaterNSW, because it considered water sharing plans had been developed and updated since they were first established. IPART found the pre-existing conversion factors were calculated using differing approaches and sources, which led to inconsistent treatment of high security entitlement holders across valleys.
IPART also changed the terminology from conversion factor to ‘security factor’, to avoid confusing valleys that do not allow conversion between general security and high security entitlements.149
148 Water in the River Murray and related water storages is shared between NSW, Victoria and South Australia under the MDB Agreement. The NSW water share is then allocated for consumptive use and the environment.
149 IPART, WaterNSW review of prices for rural bulk water services from 1 July 2017 to 30 June 2021, June 2017, pp. 122–9.
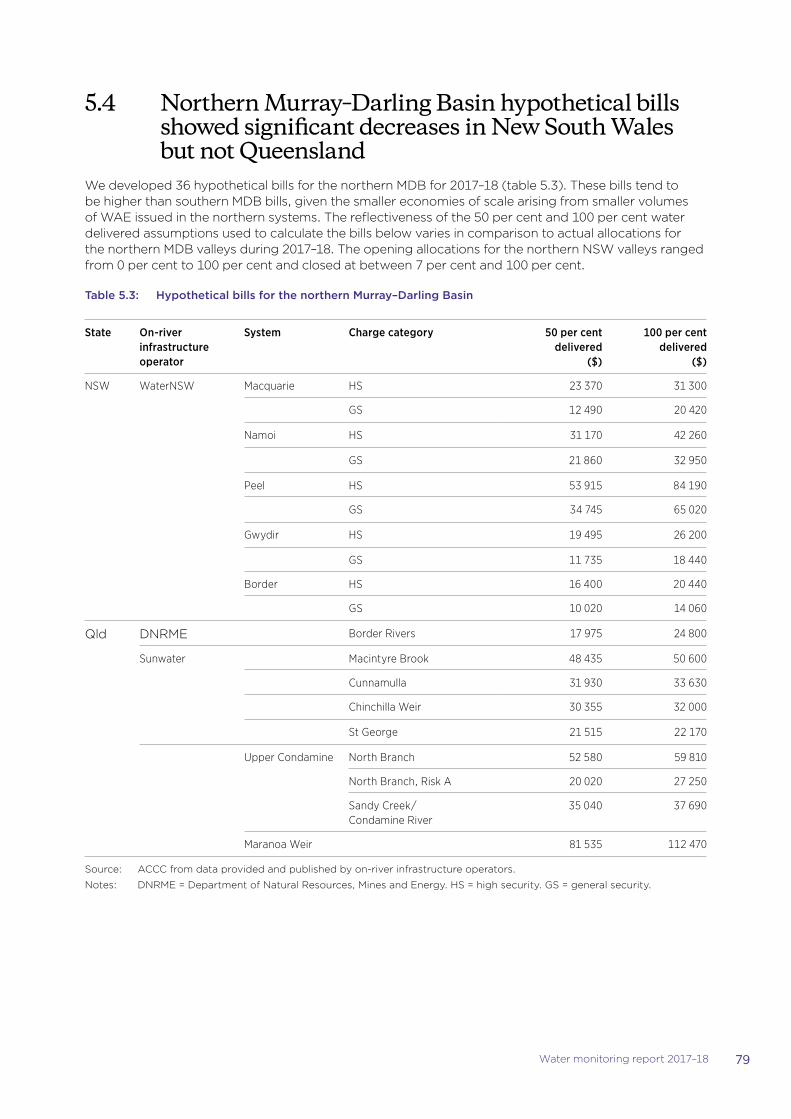
79Water monitoring report 2017–18
5.4 Northern Murray–Darling Basin hypothetical bills showed significant decreases in New South Wales but not Queensland
We developed 36 hypothetical bills for the northern MDB for 2017–18 (table 5.3). These bills tend to be higher than southern MDB bills, given the smaller economies of scale arising from smaller volumes of WAE issued in the northern systems. The reflectiveness of the 50 per cent and 100 per cent water delivered assumptions used to calculate the bills below varies in comparison to actual allocations for the northern MDB valleys during 2017–18. The opening allocations for the northern NSW valleys ranged from 0 per cent to 100 per cent and closed at between 7 per cent and 100 per cent.
Table 5.3: Hypothetical bills for the northern Murray–Darling Basin
State On-river infrastructure operator
System Charge category 50 per cent delivered
($)
100 per cent delivered
($)
NSW WaterNSW Macquarie HS 23 370 31 300
GS 12 490 20 420
Namoi HS 31 170 42 260
GS 21 860 32 950
Peel HS 53 915 84 190
GS 34 745 65 020
Gwydir HS 19 495 26 200
GS 11 735 18 440
Border HS 16 400 20 440
GS 10 020 14 060
Qld DNRME Border Rivers 17 975 24 800
Sunwater Macintyre Brook 48 435 50 600
Cunnamulla 31 930 33 630
Chinchilla Weir 30 355 32 000
St George 21 515 22 170
Upper Condamine North Branch 52 580 59 810
North Branch, Risk A 20 020 27 250
Sandy Creek/ Condamine River
35 040 37 690
Maranoa Weir 81 535 112 470
Source: ACCC from data provided and published by on-river infrastructure operators.
Notes: DNRME = Department of Natural Resources, Mines and Energy. HS = high security. GS = general security.
80 Water monitoring report 2017–18
In 2017–18 there were a number of significant decreases (chart 5.4) in bills for New South Wales, and no decreases in Queensland bills. We observed:
�� decreases exceeding 10 per cent in nominal terms for hypothetical bills for the Macquarie (high security and general security), Peel (high security and general security)150 and Gwydir (high security for 100 per cent water delivered)
�� a decrease in the bills for the Peel Valley. The decrease reflected IPART’s reduction of the high security and general security entitlement charges in the valley by 40 and 47 per cent respectively, and reduction of the use charge by 3.5 per cent
�� decreases exceeding 15 per cent in the Border valleys, which reflected decreases in entitlement charges and smaller falls in the use charge
�� small increases that were below the CPI for general security entitlement holders in the Gwydir Valley. The increase was less than 1 per cent for high security entitlement holders in the Namoi Valley and less than 0.5 per cent for general security entitlement holders
�� as in previous years, the highest increase was in bills in Queensland’s Macintyre Brook water share scheme. The increase was just over 5 per cent (the lowest annual increase for this scheme since 2014–15).
The bill decreases in the New South Wales northern valleys reflected lower operational costs and a lower return on capital (through a lower weighted average cost of capital), which required lower revenues for these valleys.151 The increases in the general security bill for the Namoi and Gwydir valleys reflect IPART’s decision to rebalance the recovery of more costs through general security charges.152 Under IPART’s 2017 decision, use charges fell for all northern MDB areas in New South Wales. The main driver of the reduced use charges was the lower revenue requirements for each of the valleys over the duration of the regulatory period.
The small increases of around 2 to 3 per cent for the Queensland MDB (except Macintyre Brook) resulted from the Queensland Government’s decision to adjust charges in line with arrangements applying from 2012–17 until 30 June 2019. For those areas that had reached full cost recovery, the government decided to increase prices at or just above the CPI. The 5 per cent increase for the Macintyre Brook area reflected the additional increase of $2 per ML until that scheme reaches full lower bound cost recovery.153
150 Traditionally, the Peel Valley in New South Wales has had bill increases exceeding 10 per cent over the past few years. This resulted from the ACCC increasing charges by 10 per cent in real terms each year of the 2014 to 2016 price setting period until the valley reached full cost recovery in 2016–17.
151 IPART, WaterNSW review of prices for rural bulk water services from 1 July 2017 to 30 June 2021, June 2017, pp. 3–5.
152 Ibid.
153 QCA, Sunwater irrigation price review: 2012–2017 final report, vol. 1, p. xxxiv, http://www.qca.org.au/getattachment/5fad8dc9-2101-4097-bdc8-d90d25fbfbbb/SunWater-Irrigation-Price-Review-2012-17-Volum-(1).aspx, viewed 4 February 2019.
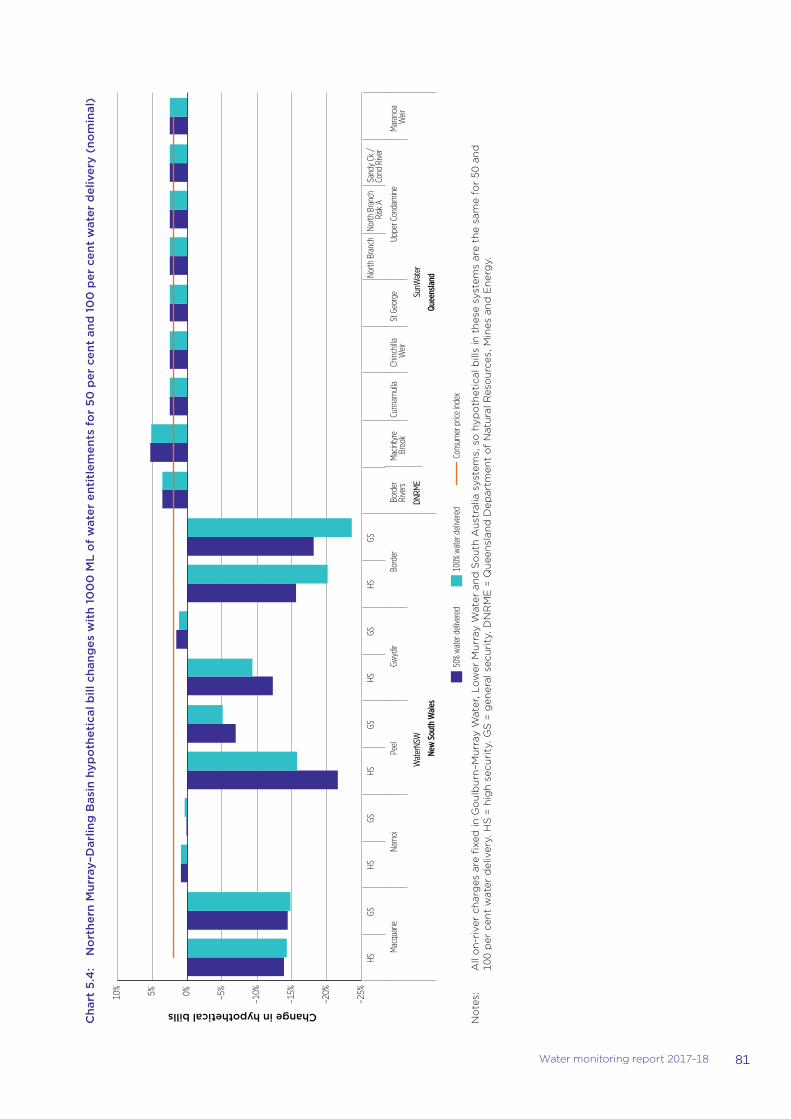
81Water monitoring report 2017–18
Cha
rt 5
.4:
No
rthe
rn M
urra
y–D
arlin
g B
asin
hyp
oth
etic
al b
ill c
hang
es w
ith
100
0 M
L o
f w
ater
ent
itle
men
ts f
or
50 p
er c
ent
and
10
0 p
er c
ent
wat
er d
eliv
ery
(no
min
al)
50% water delivered
100% water delivered
Consum
er price index
–25%
–20%
–15%
–10%
–5% 0%
5%
10%
HS
GS
HS
GS
HS
GS
HS
GS
HS
GS
North Branch
North Branch
Risk A
Sandy Ck /
Cond River
Macquarie
Namoi
Peel
Gwydir
Border
Border
Rivers
Macintyre
Brook
Cunnam
ulla
Chinchilla
Weir
St George
Upper Condamine
Maranoa
Weir
WaterNSW
DNRM
E SunW
ater
New South Wale
sQueenslan
d
Change in hypothetical bills
No
tes:
A
ll o
n-r
iver
ch
arg
es a
re fi
xed
in G
ou
lbu
rn–M
urr
ay W
ater
, Lo
wer
Mu
rray
Wat
er a
nd
So
uth
Au
stra
lia s
yste
ms,
so
hyp
oth
etic
al b
ills
in t
hes
e sy
stem
s ar
e th
e sa
me
for
50 a
nd
10
0 p
er c
ent
wat
er d
eliv
ery.
HS
= h
igh
sec
uri
ty. G
S =
gen
eral
sec
uri
ty. D
NR
ME
= Q
uee
nsl
and
Dep
artm
ent
of
Nat
ura
l Res
ou
rces
, Min
es a
nd
En
erg
y.

82 Water monitoring report 2017–18

06
Irrigation channel, Tabbita NSW Source: Brayen Dykes (Murray–Darling Basin Authority)
Most hypothetical bills for pressurised irrigation networks increased modestly
84 Water monitoring report 2017–18
6. Most hypothetical bills for pressurised irrigation networks increased modestly
Key points
�� While much of the Murray–Darling Basin experienced dry, hot conditions and low allocations in 2017–18, off-river infrastructure operators (IOs) delivered more water to irrigators than in the previous year. The higher delivery volumes reflected access to carryover water and water market activity.
�� Changes to the water charge rules, scheduled to come into effect on 1 July 2020, will require off-river IOs to review their charge schedules and their calculation of termination fees for compliance with the new requirements.
�� Although a majority (64 per cent) of all irrigation network hypothetical bills rose in 2017–18, the increase was below that of 2016–17 when 73 per cent of bills rose. Of the network bill increases, 45 per cent were above the consumer price index (CPI).
�� The total average growth for pressurised network hypothetical bills was 4.6 per cent (in nominal terms) from 2016–17. Within this type of network, all hypothetical bills increased in 2017–18, except for Murrumbidgee Irrigation Limited’s bills (which had significant changes to its pricing schedule). Of the increases, 70 per cent were above the CPI.
�� The total average increase for gravity fed network hypothetical bills was less than 1 per cent (in nominal terms) from 2016–17. Around 48 per cent of these networks had bill increases and only 36 per cent of those increases were above the CPI.
This chapter reports on changes and trends in the charges (including termination fees) of off-river infrastructure operators (IOs). It covers the 19 off-river IOs that provide services relating to more than 10 GL of water access entitlement (WAE).
�� Section 6.1 discusses factors in 2017–18 that affected the service quality and performance of the 19 off-river IOs, including significant infrastructure upgrades and other developments.
�� Section 6.2 describes significant changes to off-river IO charges, and notes the recent water charge rule changes that will affect off-river IOs’ schedules of charges in 2020.
�� Section 6.3 presents our findings on off-river IOs’ 2017–18 hypothetical bills (including total bills, components and changes over time).
6.1 Dry, hot conditions prevailed but water deliveries by off-river IOs increased
Much of the Murray–Darling Basin (MDB) experienced dry, hot conditions in 2017–18 (section 1.1). A number of areas received substantial rain in August 2017 and again in December, which decreased the immediate demand for water and improved allocations in some areas.154 However, significant rainfall deficiencies approached two years duration by the end of June 2018, with storage levels in the MDB dropping from 68 per cent in July 2017 to 57 per cent by June 2018.155
154 Murray Irrigation Limited had a significant local rainfall in late November, with Deniliquin receiving 63 mm over two days. West Corurgan also reported significant rainfall events in November. Murrumbidgee Irrigation Limited noted significant rainfall events in September.
155 Murray–Darling Basin Authority, Annual report 2017–18, 2018, pp. 3–4, https://www.mdba.gov.au/sites/default/files/pubs/MDBA-Annual-Report-2017–18.pdf, viewed 5 March 2019.
85Water monitoring report 2017–18
Allocated water volumes decreased by 27 per cent over 2017–18, with low allocations made to general security entitlements over the year.156 However, total water availability fell by only 15 per cent in 2017–18 because customers had access to significant volumes of carryover water. On 1 July 2017, carryover water available for use during 2017–18 was equivalent to around 48 per cent of the total allocation for the southern MDB (chart 1.5 in chapter 1).157
These factors led to the 19 off-river IOs reporting delivery of 3841 gigalitres, up 18 per cent on 2016–17 delivery.158
6.2 Charging arrangements responded to service changes, cost increases and regulatory requirements
Many off-river IOs have sought to improve network efficiency and service through reconfigurations and infrastructure upgrades. Table 6.1 presents information on significant changes in the characteristics of 19 off-river IOs. In 2017–18, 55 per cent of these IOs undertook infrastructure upgrades or restructures, with many of the works funded by the Australian Government through the Private Irrigation Infrastructure Operator’s Program.159 Such upgrades can alter a network’s customer numbers, service levels and energy requirements, with implications for charges (discussed below).
Sections 6.2.1 and 6.2.2 describe substantial changes to off-river IOs in 2017–18, including charge increases attributed to energy costs, and Murrumbidgee Irrigation Limited’s (MI) changes to its charge structure. Section 6.2.3 discusses the recently announced changes to the water charge rules, noting these changes will alter the requirements applying to off-river IOs’ charge schedules.
6.2.1 Energy and upgrade costs reportedly increased infrastructure operators’ charges
The National Irrigators’ Council highlighted energy prices as a continuing major concern for its members in 2017–18.160 The West Corurgan Private Irrigation District advised members that it was increasing charges for 2017–18 due to New South Wales’ higher Murray–Darling Basin Authority (MDBA) charges and a 30–40 per cent increase in West Corurgan’s energy costs.161 Central Irrigation Trust (CIT) also reported facing significant cost pressures due to energy cost increases of around 32 per cent in 2017–18 (box 1.2).
The Hay Private Irrigation District (HPID) reported delivering an increased volume of water for the year, after reporting no deliveries in 2016–17 because it shut down temporarily to replace its open channel network with a hybrid pressurised gravity pipe system. HPID delivered 1876 GL to customers (with no requirement for conveyance water)162 in 2017–18, compared to 1535 GL (with 355 GL of conveyance water required) in 2015–16. The network upgrade reduced the number of irrigated water outlets from
156 Estimates suggest volumes of water allocated fell over the year by 27 per cent in the southern MDB and 79 per cent in the northern MDB. Primary numbers from New South Wales and Victorian water registers, and the South Australian Department of Natural Resources. Analysis by Marsden Jacob Associates, provided to ACCC by email, 15 January 2019.
157 Based on data provided by Bureau of Meteorology, pers. comm., 9 January 2018, based on data from ABARES; and carryover data from the Victorian water register, http://waterregister.vic.gov.au/water-availability-and-use/unused-water and the New South Wales Department of Industry, https://www.industry.nsw.gov.au/water/allocations-availability/allocations/statements/2017., viewed 6 May 2019.
158 Hay Private Irrigation District (HPID) was closed during 2016–17 for infrastructure upgrades and no water was delivered. If we exclude HPID’s volumes from the 2017–18 total, the percentage change in water delivered remains 18 per cent.
159 The Private Irrigation Infrastructure Operators Program in New South Wales aimed to improve the efficiency and productivity of water use and management of private irrigation networks to deliver water savings for the environment. For more information, see Department of Agriculture and Water Resources, ‘Private Irrigation Infrastructure Operators Program in New South Wales’, http://www.agriculture.gov.au/water/mdb/programs/nsw/piiop-nsw, viewed 26 March 2019.
160 National Irrigators’ Council, Report to 2018 AGM—Steve Whan, https://www.irrigators.org.au/wp-content/uploads/2018/10/CEO_report_to_2018_AGM_18_October_2018_326.pdf, viewed 7 March 2019. See also ACCC, Water monitoring report 2016–17, and section 1.6 of this report.
161 West Corurgan Private Irrigation District, Corurgan Comment, circ. no. 7 July, 2017, https://www.corurgan.com.au/images/Circ07_-_July_2017.pdf, viewed 8 March 2018.
162 Conveyance water is the water need to physically run the river system. For water deliveries to be met, extra water must then be supplied on top of the conveyance water.
MDBA, MDBA annual report 2015–16 – glossary, https://www.mdba.gov.au/annual-report-2015-16/appendixes-references/glossary, viewed 7 May 2019.
86 Water monitoring report 2017–18
117 to 112.163 HPID’s variable use charge in 2017–18 remained similar to that of previous years, while its fixed charges increased substantially after the upgrade. A 12 ML outlet charge, for example, rose from $185 per outlet to $1100.
6.2.2 Murrumbidgee Irrigation Limited made major changes to its pricing approach
While most off-river IOs maintained their existing pricing structures in 2017–18, MI implemented substantial changes. It told customers that the changes were intended to reduce the complexity of its previous charges, and that a simplified pricing structure would enhance customers’ decision making about the services they require, increase production and reduce costs.
MI’s previous pricing structure included a standard outlet charge, with tiered charges applying a declining block tariff based on the size of the delivery entitlement and pricing groups based on location within, and type of, irrigation network. The 2017–18 pricing schedule replaced these charges with a single flat rate for holding delivery entitlements. It also simplified some pricing groups (removing the small and large area supply groups) and realigned the outlet charge with the actual cost of different sized outlets.
The ACCC considers these changes improve the likelihood that MI’s charges will reflect the underlying differences in the costs of service provision to different users and, therefore, reduce the potential for large users to benefit unfairly over small users. MI’s approach is consistent with what was proposed in the ACCC’s 2016 advice to the Australian Minister for Agriculture and Water Resources (which was not accepted) to expand the existing non-discrimination provisions to prohibit operators from unreasonably levying different charges or restricting the availability of infrastructure services.
6.2.3 Operators should review their charge schedules for consistency with requirements of the new water charge rules
On 3 April 2019, the Australian Minister for Agriculture and Water Resources, the Hon David Littleproud MP, amended the water charge rules, with the changes to take effect on 1 July 2020. Among other changes, IOs will need to:
�� check the information included on their schedule of charges
�� provide more information to customers about termination fees.164
The changes to the water charge rules require charge schedules to include more detail on individual charges, including the circumstances in which the charge is payable, the amount of the charge, and any generally available discount. They also require greater transparency about the passing through of charges paid by the IO and recovered from customers. The new rules define these pass through charges as either network operation charges or ancillary charges.
Off-river IOs do not have to levy a separate charge to recover network operation costs. If they do, the IO can recover no more than the charge(s) that they are passing through. To recover ancillary charges, off-river IOs must levy one or more separate charges, but they must recover (as far as practicable) the same amount as the original charge passed through.165
163 Australian Department of Agriculture, Hay Private Irrigation District final project report under round three of the Private Irrigation Infrastructure Operators Program in NSW, 2018, http://www.agriculture.gov.au/SiteCollectionDocuments/water/hay-round3-final-project-report.pdf, viewed 26 March 2019.
164 The changes also return the regulation of on-river infrastructure to Basin states, except in limited specific circumstances (section 5.1.2).
165 New Rule 9A, Water Charge (Infrastructure) Rules 2010.
87Water monitoring report 2017–18
The rule changes also improve transparency of termination fees. Before termination occurs, an IO must give a customer a termination information statement that includes the amount of any applicable termination fee, how the fee was calculated, and whether the customer could trade the water delivery right (WDR) proposed to be terminated. When calculating a customer’s termination fees, IOs will be limited to using fixed volumetric charges and charges for infrastructure used exclusively by the terminating customer. If the IO does not allow the trade of WDRs, it may charge the customer a termination fee only. The water charge rules changes and review process is explained in section 1.2.5 of the Water monitoring report: supplementary information, 2017–18. Before the amended rules commence, the ACCC will publish information to help IOs comply with the rules.
6.3 Hypothetical bills varied greatly but generally increased, especially in pressurised networks
As in past years, we calculated hypothetical bills for off-river IOs for 2017–18. These bills rely on key assumptions to replicate how an off-river IO charges an irrigator for given volumes of water held and delivered, and allow us to analyse changes over time.166 Note that all price changes over a 12 month period are presented in nominal terms, while changes over multiple years are in real terms.
�� Section 6.3.1 presents off-river IO hypothetical bill results for 2017–18 in dollars per ML.
�� Section 6.3.2 assesses the contribution of off-river IOs’ charges (and on-river and water planning and management (WPM) charges) as a proportion of those bills.
�� Section 6.3.3 considers the proportion of the total hypothetical bill attributable to fixed and variable charges.
�� Section 6.3.4 describes the changes observed in off-river IOs’ hypothetical bills for 2017–18.
�� Section 6.3.5 observes some trends in off-river IOs’ hypothetical bills since 2009–10.
6.3.1 Water delivered showed considerable variation in price per megalitre across network types
Tables 6.2 and 6.3 present hypothetical bill results in dollars per ML. As in previous years, the results show considerable variation by operator and type of irrigation system, reflecting a range of factors, including network characteristics and service type. When comparing the average bill per ML for a WAE of 250 ML for 100 per cent of water delivered, pressurised networks were $101 and gravity fed networks were 42 per cent less at $59. The higher average price in pressurised networks reflects the relatively large capital costs for pipes and pumps (compared with the capital costs of gravity fed networks), and higher operating costs such as electricity.
Across network types, the variation in bills per ML was more pronounced in pressurised networks. It ranged from a low of $64 for CIT’s low pressure network to a high of $216 for Lower Murray Water’s (LMW) Robinvale network. In gravity fed networks, bills per ML ranged from a low of $18 at Eagle Creek to a high of $141 at LMW’s Mildura network. Variations across networks reflect a range of factors, including the degree of cost recovery, customer numbers, network size and efficiency, service levels, volumes of water delivered, energy costs and other revenue streams.
The average bill across all operators in pressurised systems ranged from $105 per ML for a WAE of 50 ML to $100 per ML for a WAE of 1000 ML. This represents an average increase of 4 per cent (from an average 2 per cent for a WAE of 50 ML and an average 6 per cent for a WAE of 1000 ML) since 2016–17. In gravity fed networks, the average bill ranged from a high of $69 per ML for a WAE of 50 ML (no change from 2016–17) to $57 per ML for a WAE of 1000 ML (up 3 per cent since 2016–17).
166 We applied the following key assumptions in developing hypothetical bills:�� The bills are based on the standard charges that an off-river IO would bill their customers.�� The customer holds 50 ML, 250 ML or 1000 ML of irrigation right or WAE, and an equivalent volume of water delivery right.�� The volume of water delivered is equivalent to either 50 per cent or 100 per cent of the irrigation right or WAE volume held.
For smaller IOs, we generally create one hypothetical bill. For larger operators that have several differing charging groups, we create more than one bill. The accompanying Water monitoring report: monitoring approach and assumptions, 2017–18 details our assumptions in calculating an individual operator’s hypothetical bills.
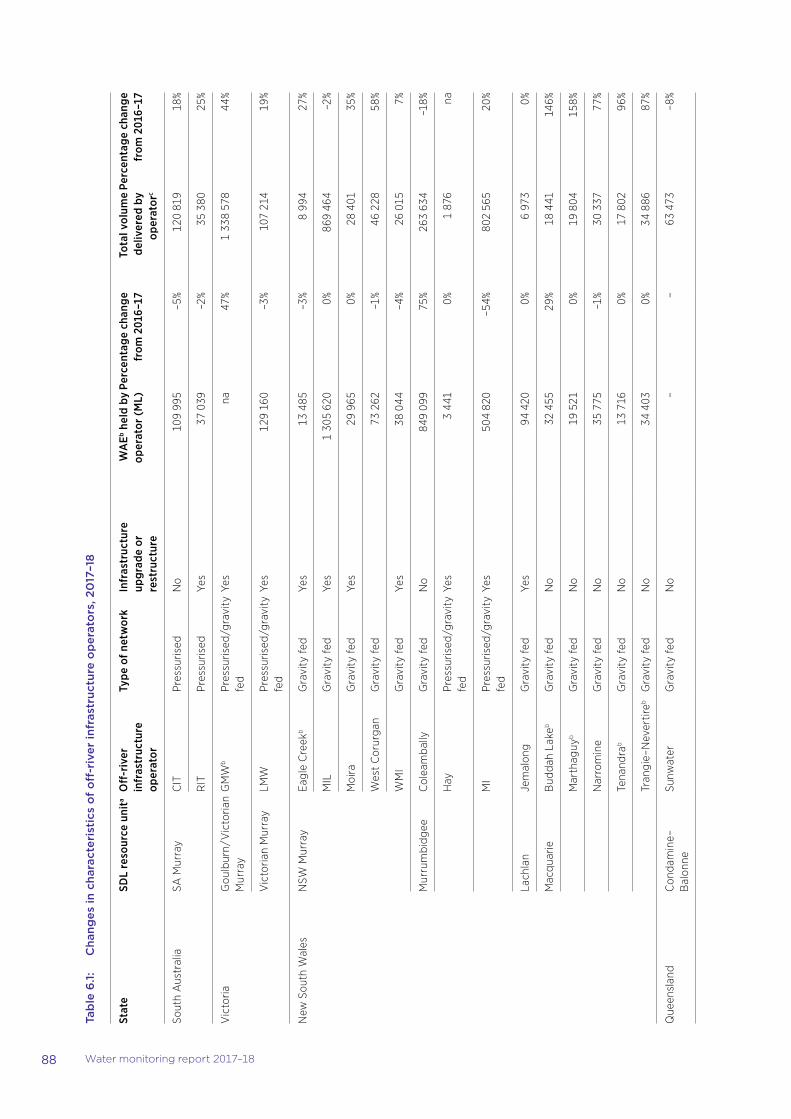
88 Water monitoring report 2017–18
Tab
le 6
.1:
Cha
nges
in c
hara
cter
isti
cs o
f o
ff-r
iver
infr
astr
uctu
re o
per
ato
rs, 2
017
–18
Stat
eSD
L re
sour
ce u
nita
Off
-riv
er
infr
astr
uctu
re
oper
ator
Type
of n
etw
ork
Infr
astr
uctu
re
upgr
ade
or
rest
ruct
ure
WA
Eb hel
d by
op
erat
or (
ML)
Perc
enta
ge c
hang
e fr
om 2
016–
17To
tal v
olum
e de
liver
ed b
y op
erat
orc
Perc
enta
ge c
hang
e fr
om 2
016–
17
Sout
h A
ustr
alia
SA M
urra
yC
ITPr
essu
rised
No
109
995
–5%
120
819
18%
RIT
Pres
suris
edYe
s37
039
–2%
35 3
8025
%
Vic
toria
Gou
lbur
n/V
icto
rian
Mur
ray
GM
Wb
Pres
suris
ed/g
ravi
ty
fed
Yes
na
47%
1 33
8 57
844
%
Vic
toria
n M
urra
yLM
WPr
essu
rised
/gra
vity
fe
dYe
s12
9 16
0–3
%10
7 21
419
%
New
Sou
th W
ales
NSW
Mur
ray
Eagl
e C
reek
bG
ravi
ty fe
dYe
s13
485
–3%
8 99
427
%
MIL
Gra
vity
fed
Yes
1 30
5 62
00%
869
464
–2%
Moi
raG
ravi
ty fe
dYe
s29
965
0%28
401
35%
Wes
t C
orur
gan
Gra
vity
fed
73 2
62–1
%46
228
58%
WM
IG
ravi
ty fe
dYe
s38
044
–4%
26 0
157%
Mur
rum
bidg
eeC
olea
mba
llyG
ravi
ty fe
dN
o84
9 09
975
%26
3 63
4–1
8%
Hay
Pres
suris
ed/g
ravi
ty
fed
Yes
3 44
10%
1 87
6na
MI
Pres
suris
ed/g
ravi
ty
fed
Yes
504
820
–54%
802
565
20%
Lach
lan
Jem
alon
gG
ravi
ty fe
dYe
s94
420
0%6
973
0%
Mac
quar
ieB
udda
h La
keb
Gra
vity
fed
No
32 4
5529
%18
441
146%
Mar
thag
uyb
Gra
vity
fed
No
19 5
210%
19 8
0415
8%
Nar
rom
ine
Gra
vity
fed
No
35 7
75–1
%30
337
77%
Tena
ndra
bG
ravi
ty fe
dN
o13
716
0%17
802
96%
Tran
gie–
Nev
ertir
ebG
ravi
ty fe
dN
o34
403
0%34
886
87%
Que
ensl
and
Con
dam
ine–
Bal
onne
Sunw
ater
Gra
vity
fed
No
––
63 4
73–8
%
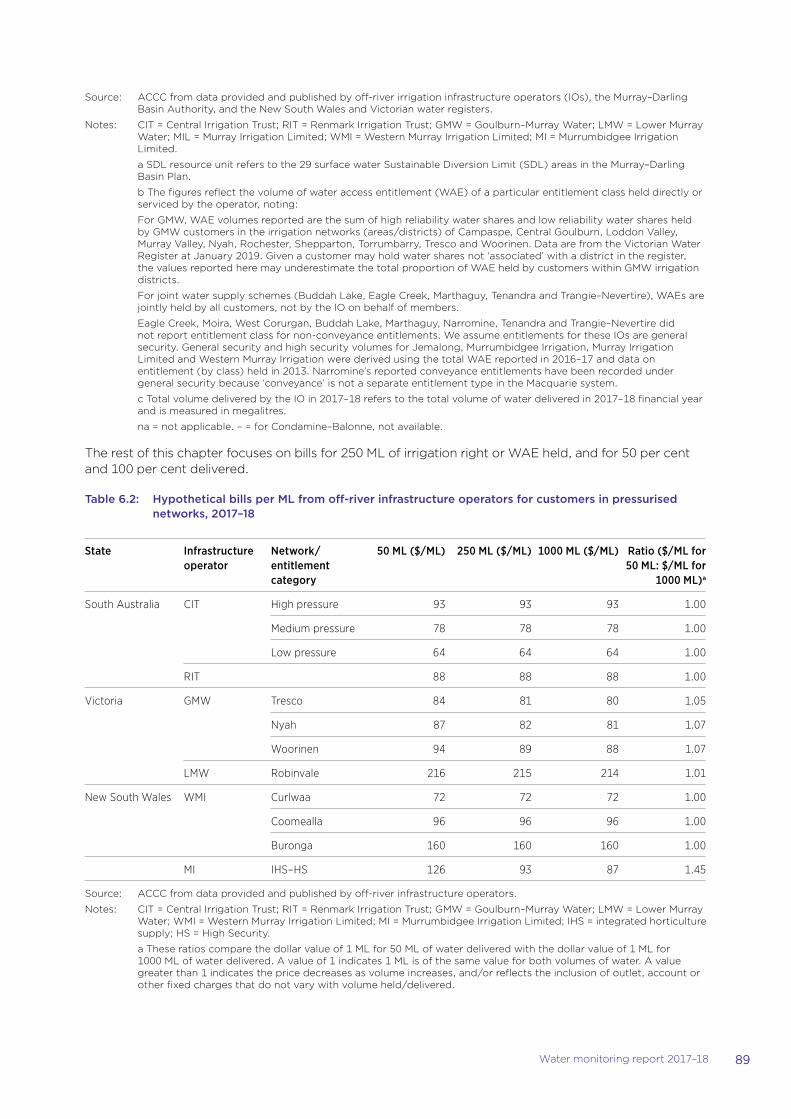
89Water monitoring report 2017–18
Source: ACCC from data provided and published by off-river irrigation infrastructure operators (IOs), the Murray–Darling Basin Authority, and the New South Wales and Victorian water registers.
Notes: CIT = Central Irrigation Trust; RIT = Renmark Irrigation Trust; GMW = Goulburn–Murray Water; LMW = Lower Murray Water; MIL = Murray Irrigation Limited; WMI = Western Murray Irrigation Limited; MI = Murrumbidgee Irrigation Limited.
a SDL resource unit refers to the 29 surface water Sustainable Diversion Limit (SDL) areas in the Murray–Darling Basin Plan.
b The figures reflect the volume of water access entitlement (WAE) of a particular entitlement class held directly or serviced by the operator, noting:
For GMW, WAE volumes reported are the sum of high reliability water shares and low reliability water shares held by GMW customers in the irrigation networks (areas/districts) of Campaspe, Central Goulburn, Loddon Valley, Murray Valley, Nyah, Rochester, Shepparton, Torrumbarry, Tresco and Woorinen. Data are from the Victorian Water Register at January 2019. Given a customer may hold water shares not ‘associated’ with a district in the register, the values reported here may underestimate the total proportion of WAE held by customers within GMW irrigation districts.
For joint water supply schemes (Buddah Lake, Eagle Creek, Marthaguy, Tenandra and Trangie–Nevertire), WAEs are jointly held by all customers, not by the IO on behalf of members.
Eagle Creek, Moira, West Corurgan, Buddah Lake, Marthaguy, Narromine, Tenandra and Trangie–Nevertire did not report entitlement class for non-conveyance entitlements. We assume entitlements for these IOs are general security. General security and high security volumes for Jemalong, Murrumbidgee Irrigation, Murray Irrigation Limited and Western Murray Irrigation were derived using the total WAE reported in 2016–17 and data on entitlement (by class) held in 2013. Narromine’s reported conveyance entitlements have been recorded under general security because ‘conveyance’ is not a separate entitlement type in the Macquarie system.
c Total volume delivered by the IO in 2017–18 refers to the total volume of water delivered in 2017–18 financial year and is measured in megalitres.
na = not applicable. – = for Condamine–Balonne, not available.
The rest of this chapter focuses on bills for 250 ML of irrigation right or WAE held, and for 50 per cent and 100 per cent delivered.
Table 6.2: Hypothetical bills per ML from off-river infrastructure operators for customers in pressurised networks, 2017–18
State Infrastructure operator
Network/entitlement category
50 ML ($/ML) 250 ML ($/ML) 1000 ML ($/ML) Ratio ($/ML for 50 ML: $/ML for
1000 ML)a
South Australia CIT High pressure 93 93 93 1.00
Medium pressure 78 78 78 1.00
Low pressure 64 64 64 1.00
RIT 88 88 88 1.00
Victoria GMW Tresco 84 81 80 1.05
Nyah 87 82 81 1.07
Woorinen 94 89 88 1.07
LMW Robinvale 216 215 214 1.01
New South Wales WMI Curlwaa 72 72 72 1.00
Coomealla 96 96 96 1.00
Buronga 160 160 160 1.00
MI IHS–HS 126 93 87 1.45
Source: ACCC from data provided and published by off-river infrastructure operators.
Notes: CIT = Central Irrigation Trust; RIT = Renmark Irrigation Trust; GMW = Goulburn–Murray Water; LMW = Lower Murray Water; WMI = Western Murray Irrigation Limited; MI = Murrumbidgee Irrigation Limited; IHS = integrated horticulture supply; HS = High Security.
a These ratios compare the dollar value of 1 ML for 50 ML of water delivered with the dollar value of 1 ML for 1000 ML of water delivered. A value of 1 indicates 1 ML is of the same value for both volumes of water. A value greater than 1 indicates the price decreases as volume increases, and/or reflects the inclusion of outlet, account or other fixed charges that do not vary with volume held/delivered.
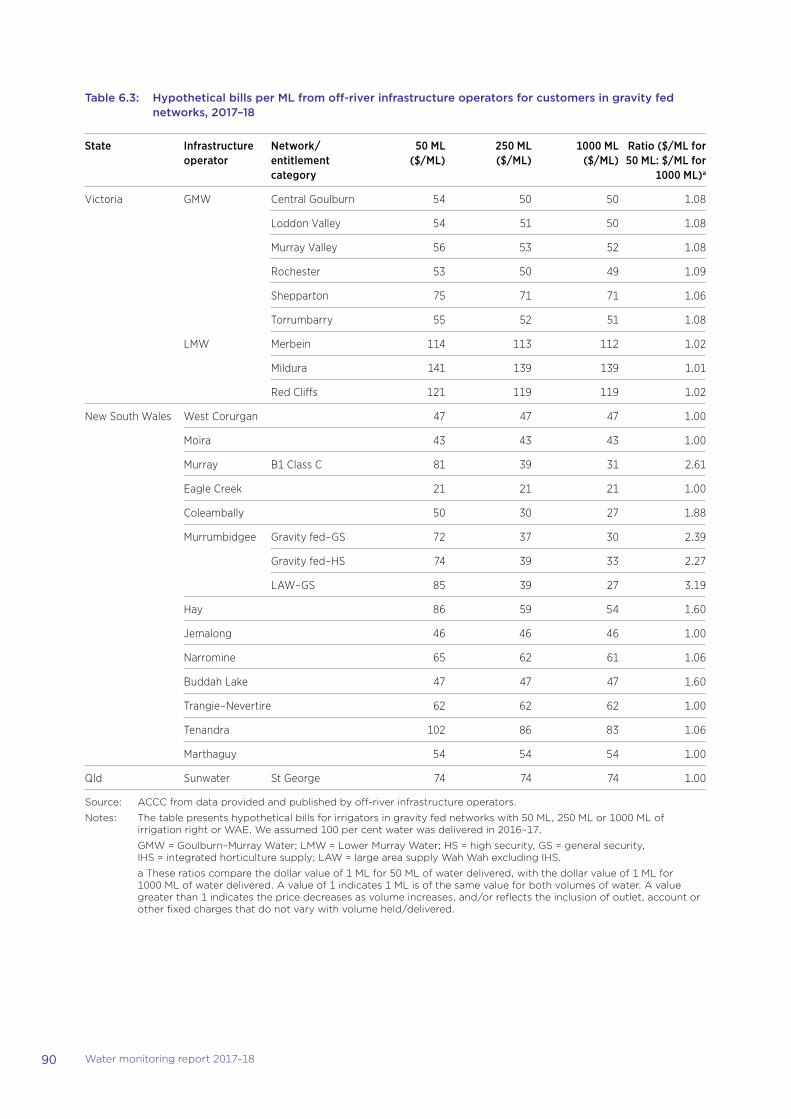
90 Water monitoring report 2017–18
Table 6.3: Hypothetical bills per ML from off-river infrastructure operators for customers in gravity fed networks, 2017–18
State Infrastructure operator
Network/entitlement category
50 ML ($/ML)
250 ML ($/ML)
1000 ML ($/ML)
Ratio ($/ML for 50 ML: $/ML for
1000 ML)a
Victoria GMW Central Goulburn 54 50 50 1.08
Loddon Valley 54 51 50 1.08
Murray Valley 56 53 52 1.08
Rochester 53 50 49 1.09
Shepparton 75 71 71 1.06
Torrumbarry 55 52 51 1.08
LMW Merbein 114 113 112 1.02
Mildura 141 139 139 1.01
Red Cliffs 121 119 119 1.02
New South Wales West Corurgan 47 47 47 1.00
Moira 43 43 43 1.00
Murray B1 Class C 81 39 31 2.61
Eagle Creek 21 21 21 1.00
Coleambally 50 30 27 1.88
Murrumbidgee Gravity fed–GS 72 37 30 2.39
Gravity fed–HS 74 39 33 2.27
LAW–GS 85 39 27 3.19
Hay 86 59 54 1.60
Jemalong 46 46 46 1.00
Narromine 65 62 61 1.06
Buddah Lake 47 47 47 1.60
Trangie–Nevertire 62 62 62 1.00
Tenandra 102 86 83 1.06
Marthaguy 54 54 54 1.00
Qld Sunwater St George 74 74 74 1.00
Source: ACCC from data provided and published by off-river infrastructure operators.
Notes: The table presents hypothetical bills for irrigators in gravity fed networks with 50 ML, 250 ML or 1000 ML of irrigation right or WAE. We assumed 100 per cent water was delivered in 2016–17.
GMW = Goulburn–Murray Water; LMW = Lower Murray Water; HS = high security, GS = general security, IHS = integrated horticulture supply; LAW = large area supply Wah Wah excluding IHS.
a These ratios compare the dollar value of 1 ML for 50 ML of water delivered, with the dollar value of 1 ML for 1000 ML of water delivered. A value of 1 indicates 1 ML is of the same value for both volumes of water. A value greater than 1 indicates the price decreases as volume increases, and/or reflects the inclusion of outlet, account or other fixed charges that do not vary with volume held/delivered.
91Water monitoring report 2017–18
6.3.2 Off-river charges as a proportion of hypothetical bills were almost unchanged
In addition to recovering off-river IOs’ capital and operating costs, customers’ bills include components to recover on-river IO and/or WPM charges that are paid (or passed through) by the off-river IO. Charts 6.1 and 6.2 show the breakdown of hypothetical bills for 2017–18 into these charge categories for pressurised and gravity fed networks.
Off-river IOs do not always clearly identify the on-river/WPM charges that they are passing through to their customers, although this approach will change once the new water charge rules come into effect on 1 July 2020. For some off-river IOs, we calculated the bill components attributable to on-river and WPM charges by using amounts in schedules of the on-river IO or the Basin state agency levying the charge on the off-river IO. We also considered any other relevant information (for example, the amount of Irrigation Corporations and Districts rebate received by some IOs in New South Wales). Our publication Water monitoring report: monitoring approach and assumptions, 2017–18 provides more detail of our calculations for specific IOs.
As in past years, the off-river IO’s charges formed the most significant component of an irrigator’s bill in 2017–18, regardless of whether the network was pressurised or gravity fed. In pressurised networks, an average 89 per cent of total hypothetical bills were from off-river charges. In gravity fed networks, this average was 13 percentage points lower at 75 per cent. These proportions remained virtually unchanged in both network types from 2016–17.
In pressurised networks, off-river charges ranged from a high of 95 per cent of the bill in LMW’s Robinvale network to a low of 79 per cent in Western Murray Irrigation’s (WMI) Curlwaa network. The variation in gravity fed networks was much larger, ranging from a high of 91 per cent in LMW’s Mildura network to a low of 39 per cent in both the Buddah Lake and Jemalong networks.
Chart 6.3 presents hypothetical bills split by whether charges are attributable to on-river, off-river and WPM categories. For gravity fed networks, it shows considerable variation in the contribution of off-river IO charges by state and across individual networks:
�� For Victorian networks, off-river charges comprised (on average) 86 per cent of the total bill. This share dropped to 55 per cent for Queensland’s only off-river network in the MDB—Sunwater’s St George.
�� Jemalong had the lowest contribution of off-river charges (39 per cent), while LMW’s Mildura network had the highest (93 per cent).
�� WPM charges did not make up a significant proportion of hypothetical bills for off-river IOs, at only 3 per cent of the average bill. This finding did not vary by type of network.
6.3.3 Operators’ aggregate reliance on fixed charges did not change dramatically, but continued to vary significantly across operators
Chart 6.3 also shows hypothetical bills split by whether charges are fixed or variable. Fixed charges (displayed on the left side of the chart) include both fixed volumetric charges and non-volumetric charges. The latter include charges per account, connection type, landholding. The proportion of fixed to variable charges is a critical component for off-river IOs. Increased variable charging by volume of water delivered can be used to cover a portion of fixed costs but can be problematic during times of water scarcity.
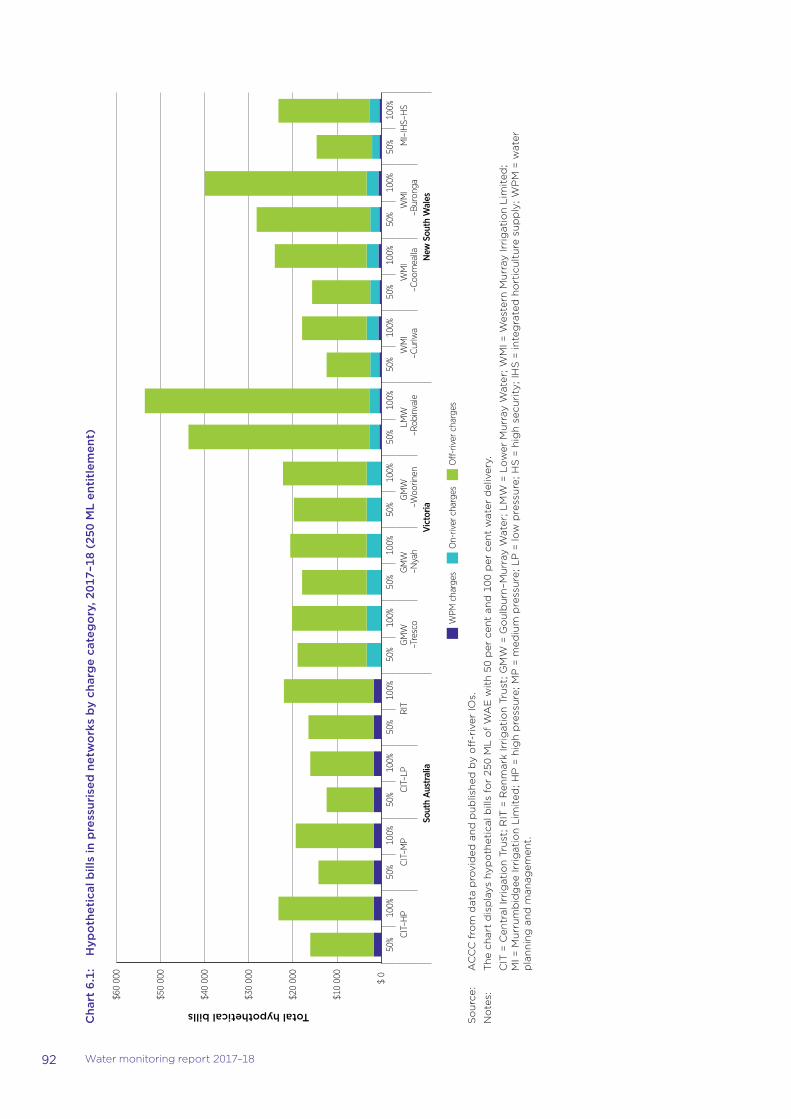
92 Water monitoring report 2017–18
Cha
rt 6
.1:
Hyp
oth
etic
al b
ills
in p
ress
uris
ed n
etw
ork
s b
y ch
arg
e ca
teg
ory
, 201
7–18
(25
0 M
L en
titl
emen
t)
50%
100%
50
% 10
0%
50%
100%
50
% 10
0%
50%
100%
50
% 10
0%
50%
100%
50
% 10
0%
50%
100%
50
% 10
0%
50%
100%
50
% 10
0%
CIT–
HP
CIT–
MP
CIT–
LP
RIT
G
MW
–T
resc
o G
MW
–N
yah
GM
W
–Woo
rinen
LM
W
–Rob
inva
le
WM
I –C
urlw
a W
MI
–Coo
mea
lla
WM
I –B
uron
ga
MI–
IHS–
HS
Sout
h A
ustr
alia
Vi
ctor
ia
New
Sou
th W
ales
WPM
cha
rges
O
n-riv
er c
harg
es
O
-riv
er c
harg
es
Total hypothetical bills
$ 0
$10
000
$20
000
$30
000
$40
000
$50
000
$60
000
So
urc
e:
AC
CC
fro
m d
ata
pro
vid
ed a
nd
pu
blis
hed
by
off
-riv
er IO
s.
No
tes:
T
he
char
t d
isp
lays
hyp
oth
etic
al b
ills
for
250
ML
of
WA
E w
ith
50
per
cen
t an
d 1
00 p
er c
ent
wat
er d
eliv
ery.
C
IT =
Cen
tral
Irri
gat
ion
Tru
st; R
IT =
Ren
mar
k Ir
rig
atio
n T
rust
; GM
W =
Go
ulb
urn
–Mu
rray
Wat
er; L
MW
= L
ow
er M
urr
ay W
ater
; WM
I = W
este
rn M
urr
ay Ir
rig
atio
n L
imit
ed;
MI =
Mu
rru
mb
idg
ee Ir
rig
atio
n L
imit
ed; H
P =
hig
h p
ress
ure
; MP
= m
ediu
m p
ress
ure
; LP
= lo
w p
ress
ure
; HS
= h
igh
sec
uri
ty; I
HS
= in
teg
rate
d h
ort
icu
ltu
re s
up
ply
; WP
M =
wat
er
pla
nn
ing
an
d m
anag
emen
t.
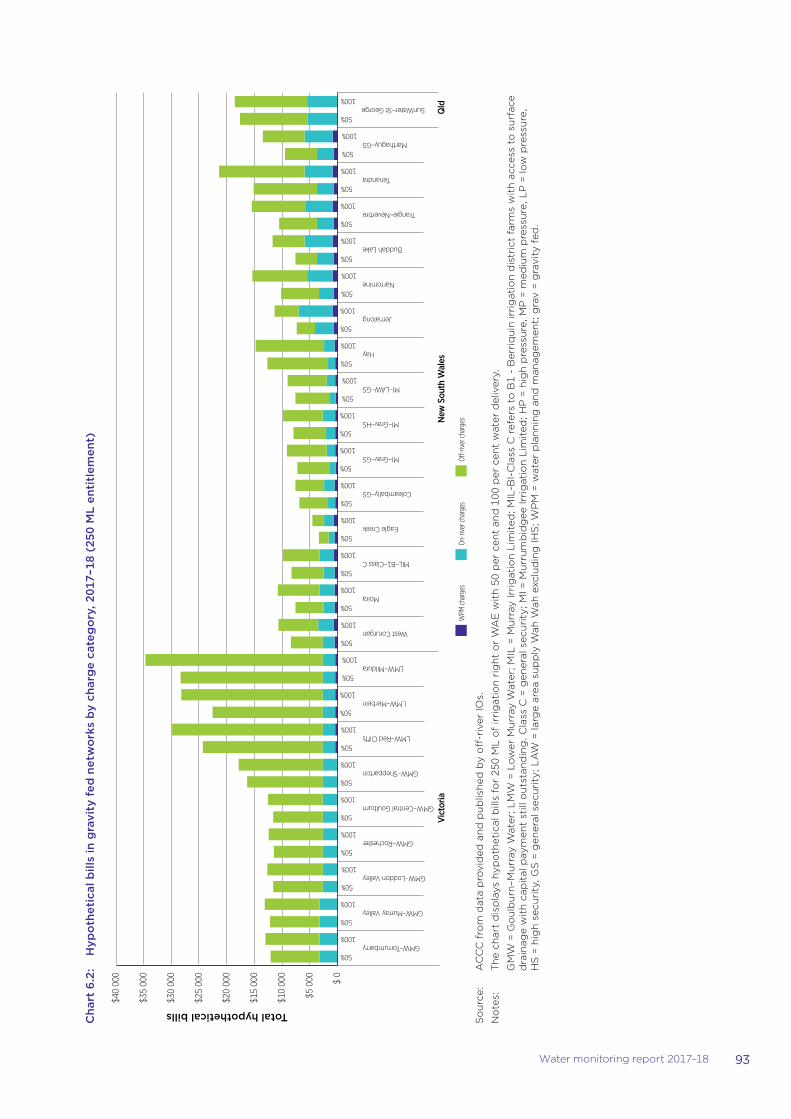
93Water monitoring report 2017–18
Cha
rt 6
.2:
Hyp
oth
etic
al b
ills
in g
ravi
ty f
ed n
etw
ork
s b
y ch
arg
e ca
teg
ory
, 201
7–18
(25
0 M
L en
titl
emen
t)
50%
100%
50%
100%
50%
100%
50%
100%
50%
100%
50%
100%
50%
100%
50%
100%
50%
100%
50%
100%
50%
100%
50%
100%
50%
100%
50%
100%
50%
100%
50%
100%
50%
100%
50%
100%
50%
100%
50%
100%
50%
100%
50%
100%
50%
100%
Buddah Lake
Coleambally–GS
Eagle Creek
Hay
Jemalong
Marthaguy–GS
50%
100%MI–Grav–GS
50%
100%MI–Grav–HS
MI–LAW–GS
SunWater–St George
MIL–B1–Class C
Moira
Narromine
Tenandra
Trangie–Nevertire
West Corurgan
New
Sou
th W
ales
GMW–Torrumbarry
GMW–Murray Valley
GMW–Loddon Valley
GMW–Rochester
GMW–Central Goulburn
GMW–Shepparton
LMW–Red Cli�s
LMW–Merbein
LMW–MilduraVi
ctor
iaQ
ld
Total hypothetical bills
$ 0
$5 0
00
$10
000
$15
000
$20
000
$25
000
$30
000
$35
000
$40
000
WPM
charges
On-river charges
O�-river charges
So
urc
e:
AC
CC
fro
m d
ata
pro
vid
ed a
nd
pu
blis
hed
by
off
-riv
er IO
s.
No
tes:
T
he
char
t d
isp
lays
hyp
oth
etic
al b
ills
for
250
ML
of
irri
gat
ion
rig
ht
or
WA
E w
ith
50
per
cen
t an
d 1
00 p
er c
ent
wat
er d
eliv
ery.
G
MW
= G
ou
lbu
rn–M
urr
ay W
ater
; LM
W =
Lo
wer
Mu
rray
Wat
er; M
IL =
Mu
rray
Irri
gat
ion
Lim
ited
; MIL
-BI-
Cla
ss C
ref
ers
to B
1 -
Ber
riq
uin
irri
gat
ion
dis
tric
t fa
rms
wit
h a
cces
s to
su
rfac
e d
rain
age
wit
h c
apit
al p
aym
ent
still
ou
tsta
nd
ing
. Cla
ss C
= g
ener
al s
ecu
rity
; MI =
Mu
rru
mb
idg
ee Ir
rig
atio
n L
imit
ed; H
P =
hig
h p
ress
ure
, MP
= m
ediu
m p
ress
ure
, LP
= lo
w p
ress
ure
, H
S =
hig
h s
ecu
rity
, GS
= g
ener
al s
ecu
rity
; LA
W =
larg
e ar
ea s
up
ply
Wah
Wah
exc
lud
ing
IHS
; WP
M =
wat
er p
lan
nin
g a
nd
man
agem
ent;
gra
v =
gra
vity
fed
.

94 Water monitoring report 2017–18
The average aggregate level of contribution by fixed charges to hypothetical bills remained steady in 2017–18 at around 61 per cent of the total bill (the same as in 2016–17). This share moved slightly when assessed according to network type—it was 60 per cent for pressurised networks and 62 per cent for gravity fed networks (from 61 per cent for both network types in 2016–17).
The aggregate figures disguise substantial variation in the significance of fixed charges across individual off-river IOs’ hypothetical bills:
�� In pressurised networks, Goulburn-Murray Water’s (GMW) Tresco network had the highest proportion of fixed charges (87 per cent), while MI’s high pressure network reported the lowest (25 per cent).
�� For gravity fed networks, Sunwater’s St George network had the highest proportion of fixed charges (90 per cent), while Jemalong had the lowest (30 per cent). The proportion of fixed charges also differed considerably across states:
�� For pressurised networks in South Australia, fixed charges comprised on average 46 per cent of the aggregate hypothetical bill, compared with 56 per cent in New South Wales and 72 per cent in Victoria.
�� For gravity fed networks, the average fixed charge contribution to the aggregate hypothetical bill ranged from a low of 48 per cent in New South Wales to a high of 73 per cent in Victoria.
Chart 6.3: Total bill breakdown into fixed and variable charges by charge category, network type and irrigation network, 2017–18 (250 ML entitlement)
$40 000 $30 000 $20 000 $10 000 $ 0 $10 000 $20 000 $30 000
PRESSURISED CIT–HP CIT–MP CIT–LP Renmark GMW–Tresco GMW–Nyah GMW–Woorinen LMW–Robinvale WMI–Curlwaa WMI–Coomealla WMI–Buronga MI–IHS–HS
GRAVITY FED GMW–Torrumbarry GMW–Murray Valley GMW–Loddon Valley GMW–Rochester GMW–Central Goulburn GMW–Shepparton LMW–Red Cli�s LMW–Merbein LMW–Mildura West Corurgan Moira MIL–B1 Class C Eagle Creek Coleambally–GS MI–Grav–GS MI–Grav–HS MI–LAW–GS Hay Jemalong Narromine Buddah Lake Trangie–Nevertire Tenandra Marthaguy–GS Sunwater–St George
On–river—variable O�–river—variable WPM—fixed On–river—fixed O�–river—fixed WPM—variable
Hypothetical bill components
95Water monitoring report 2017–18
Source: ACCC from data provided and published by off-river IOs.
Notes: Hypothetical bills are for 250 ML irrigation right or WAE, with 100 per cent water delivery.
CIT = Central Irrigation Trust; RIT = Renmark Irrigation Trust; GMW = Goulburn–Murray Water; LMW = Lower Murray Water; MIL = Murray Irrigation Limited; WMI = Western Murray Irrigation Limited; MI = Murrumbidgee Irrigation Limited; HS = high security, GS = general security, IHS = integrated horticulture supply; LAW = large area supply Wah Wah excluding IHS; WPM = water planning and management; grav = gravity fed.
6.3.4 Fewer hypothetical bills increased, with pressurised networks having more increases above consumer price index
Chart 6.4 presents the percentage changes in hypothetical bills from 2016–17 to 2017–18 for pressurised networks. Chart 6.5 presents the same material for gravity fed networks. The outputs are in nominal terms, and the change in the CPI is also displayed.
In general, we observed:
�� Hypothetical bills increased for 64 per cent of all irrigation networks in 2017–18 (7 percentage points less than in 2016–17). Of the bill increases, 45 per cent were above the CPI.
�� Across pressurised networks, all hypothetical bills increased in 2017–18 except for MI’s bills. MI’s high security hypothetical bills fell by 14 and 8 per cent for 50 and 100 per cent of water delivered respectively, reflecting the operator’s 2017–18 restructure of its charges to remove tiering based on individual networks and the number of delivery entitlements held.167
�� Of the increased bills in pressurised networks, 71 per cent were above the CPI. The total average increase for all pressurised network bills for 100 per cent of water delivered was 4 per cent in nominal terms.
�� For gravity fed networks, around 52 per cent of hypothetical bills rose, and 34 per cent of those bill increases exceeded the CPI. The total average change in all gravity fed network bills for 100 per cent of water delivered was just under 1 per cent in nominal terms.
Within pressurised networks, we observed:
�� The largest bill increase (16 per cent) was in CIT’s high pressure network, for 100 per cent delivered. This increase reflected rises in CIT’s variable use fees, which increased by 38 per cent for peak services.168 CIT’s medium pressure network reported the second highest bill increase (14 per cent), which also reflected increases in peak and off-peak variable use fees.
�� The smallest bill increase (1.2 per cent) was in LMW’s Robinvale network, for 50 per cent of water delivered. This small increase partly reflected a fall of 13 per cent in the GMW entitlement storage fee (a pass through charge). LMW’s Robinvale network, however, also had the largest hypothetical bill for 2017–18 ($51 039 for 100 per cent of water delivered) and has since monitoring commenced (section 6.3.5).
Within gravity fed networks, we observed:
�� The Marthaguy Irrigation Scheme had the largest increases in hypothetical bills, with increases of 22 and 19 per cent for 50 and 100 per cent respectively. Until 2017–18, Marthaguy’s off-river charges had not changed since 2011–12. Marthaguy’s operating and maintenance fee rose by 39 per cent and its pumping charge rose by 15 per cent.169
�� Other relatively large bill increases were observed at HPID, with increases of 8 and 7 per cent for 50 and 100 per cent allocation respectively (and following 10 and 9 per cent increases in 2016–17). HPID’s bill increases over the past two years partly reflected substantial increases in fixed outlet charges and administrative fees. Coleambally Irrigation Cooperative Limited and the Narromine Irrigation Board of Management had similar increases to HPID.
167 See section 6.2.2 and Murrumbidgee Irrigation, Changes to our pricing structure, 2018. Murrumbidgee Irrigation, Schedule of charges 2017–18 V12, viewed 3 April 2019, https://www.mirrigation.com.au/
Customers/Schedule-of-Charges/Schedule-of-Charges-2017-18.
168 As noted in box 1.2, the increase in CIT’s hypothetical bills partly relate to increases in energy costs. See CIT, Annual report 2017–18, 2018, www.cit.org.au:84/Downloads/CIT_Annual_Report_2017-18_v2.pdfwww, viewed 27 March 2019.
169 While the Marthaguy Irrigation Scheme’s own charges had remained unchanged for the past six years, its pumping charge (which included two government charges) changed due to changes in the government charges.
96 Water monitoring report 2017–18
�� MI had the largest decrease in hypothetical bills. While bills for all of MI’s gravity fed networks fell, the largest drops occurred for high security entitlement holders in the gravity fed network, with decreases of 30 and 27 per cent for 50 and 100 per cent of water delivered respectively. As discussed in section 6.2.2, MI made major changes to its pricing approach and schedules.
�� Eagle Creek had the second largest decrease in hypothetical bills, with falls of 10 and 7 per cent for 100 and 50 per cent allocation respectively. These decreases were largely due to reductions in Eagle Creek’s use charges.
�� For the second year in a row, bills for all of GMW’s gravity fed networks decreased, from 3 per cent down in Torrumbarry, Murray Valley, Rochester and Shepparton for 100 per cent of water delivered, to 1 per cent in Loddon Valley and Central Goulburn for 50 per cent of water delivered. These decreases reflected the Essential Services Commission of Victoria’s 2016 determination for GMW, which approved common infrastructure access and use fees in the Central Goulburn, Rochester, Loddon Valley, Murray Valley and Torrumbarry irrigation networks. GMW had proposed uniform charges for all its gravity irrigation networks, to reflect its increasingly centralised services and to achieve administrative savings from the simplified charging structure. The Essential Services Commission accepted uniform charges for all networks except Shepparton, which had a significantly higher cost structure.170
Lower Murray Water had the largest hypothetical bill
In 2017–18, the largest hypothetical bills continued to be in LMW’s Robinvale pressurised network, which had the most expensive off-river water delivery since monitoring began. LMW’s Robinvale bills were $43 724 and $53 659 for 50 and 100 per cent delivered respectively.171
The lowest pressurised hypothetical bill for 50 per cent allocation was in WMI’s Curlwaa network ($12 293) and the lowest for 100 per cent allocation was in CIT’s low pressure network ($16 008). The average bill across all pressurised networks was $19 195 for 50 per cent allocation and $25 244 for 100 per cent allocation.
Within gravity fed networks, the largest hypothetical bills were in LMW’s Mildura network for both 50 and 100 per cent allocations ($28 387 and $34 762 respectively). LMW has had the most expensive gravity fed irrigated water since 2012–13. The smallest hypothetical bill in 2017–18 was at Eagle Creek for both 50 and 100 per cent allocations ($4134 and $5320 respectively). The average bill across all gravity fed networks was $11 720 for 50 per cent allocation and $14 568 for 100 per cent allocation.
170 Essential Services Commission, Goulburn-Murray Water Price Review 2016—final decision, June 2016, https://www.esc.vic.gov.au/water/water-prices-tariffs-and-special-drainage/water-price-reviews/water-price-review-2016-goulburn-murray-water, viewed 15 November 2018.
171 A Marsden Jacob and Associates report released in June 2015 indicated that LMW’s higher hypothetical bills in relation to CIT, GMW and WMI systems was partly due to the higher cost recovery, other revenue streams, falling customer base and average higher costs. See Marsden Jacob Associates, Lower Murray Water: independent benchmarking study of rural irrigation services, final report, June 2015, p. 44, http://www.marsdenjacob.com.au/wp-content/uploads/2015/06/LMW-Benchmarking-Final-report.pdf, viewed 29 March 2019.

97Water monitoring report 2017–18
Cha
rt 6
.4:
Year
-on-
year
per
cent
age
chan
ge
in t
ota
l hyp
oth
etic
al b
ills
in n
om
inal
ter
ms
for
pre
ssur
ised
net
wo
rks,
by
irri
gat
ion
netw
ork
, 201
7–18
(25
0 M
L en
titl
emen
t)
–20%
–15%
–10%
–5%
0%
5%
10%
15%
20%
CIT
–HP
CIT
–MP
CIT
–LP
RIT
G
MW
–Tre
sco
GM
W–N
yah
GM
W–W
oorin
en
LMW
–Rob
inva
le
WM
I–C
urlw
aa
WM
I–Co
omea
lla
WM
I–B
uron
ga
MI–
IHS–
HS
Sout
h A
ustr
alia
Vict
oria
New
Sou
th W
ales
50% water delivered
100% water delivered
Consum
er price index
Change in hypothetical bills
So
urc
e:
AC
CC
fro
m d
ata
pro
vid
ed a
nd
pu
blis
hed
by
off
-riv
er in
fras
tru
ctu
re o
per
ato
rs.
No
tes:
D
ata
is p
rese
nte
d in
no
min
al t
erm
s. H
ypo
thet
ical
bill
s ar
e fo
r 25
0 M
L o
f ir
rig
atio
n r
igh
t o
r w
ater
acc
ess
enti
tlem
ent,
an
d e
ith
er 5
0 o
r 10
0 p
er c
ent
wat
er d
eliv
ery.
C
IT =
Cen
tral
Irri
gat
ion
Tru
st; R
IT =
Ren
mar
k Ir
rig
atio
n T
rust
; GM
W =
Go
ulb
urn
–Mu
rray
Wat
er; L
MW
= L
ow
er M
urr
ay W
ater
; WM
I = W
este
rn M
urr
ay Ir
rig
atio
n L
imit
ed;
MI =
Mu
rru
mb
idg
ee Ir
rig
atio
n L
imit
ed; H
P =
hig
h p
ress
ure
; MP
= m
ediu
m p
ress
ure
; LP
= lo
w p
ress
ure
; HS
= h
igh
sec
uri
ty; I
HS
= in
teg
rate
d h
ort
icu
ltu
re s
up
ply
; CP
I = c
on
sum
er p
rice
in
dex
.
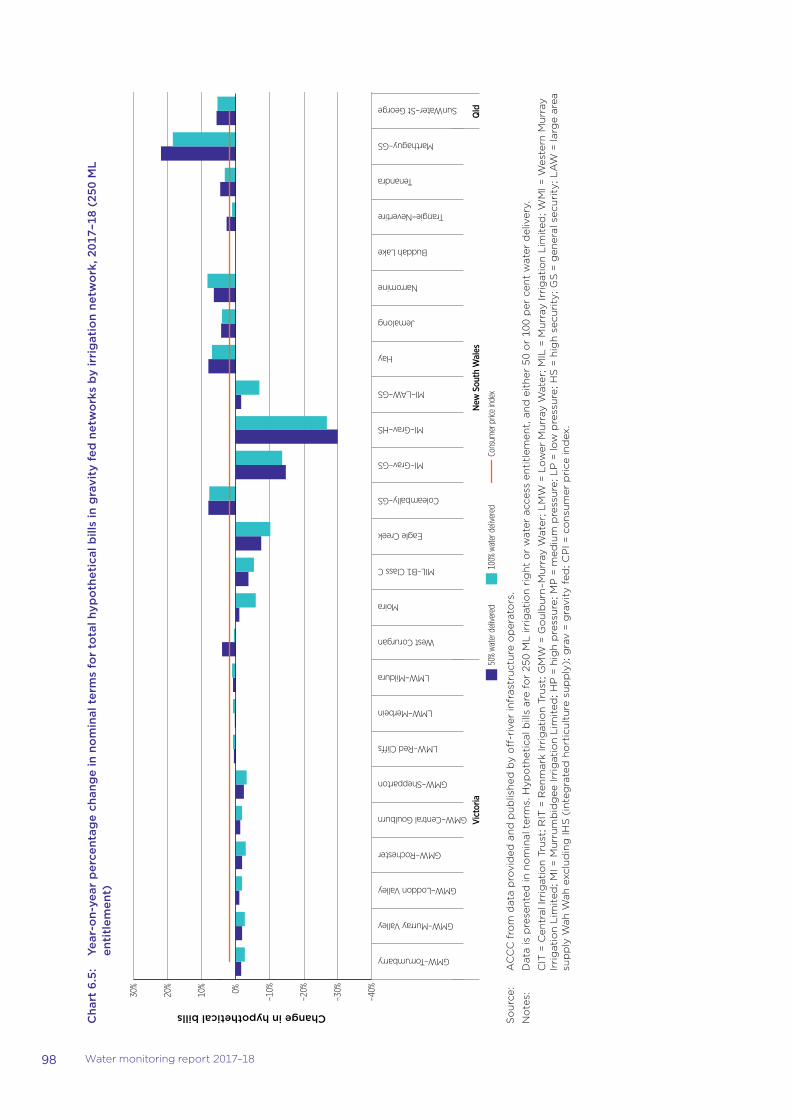
98 Water monitoring report 2017–18
Cha
rt 6
.5:
Year
-on-
year
per
cent
age
chan
ge
in n
om
inal
ter
ms
for
tota
l hyp
oth
etic
al b
ills
in g
ravi
ty f
ed n
etw
ork
s b
y ir
rig
atio
n ne
two
rk, 2
017–
18 (
250
ML
enti
tlem
ent)
–40%
–30%
–20%
–10%
0%
10%
20%
30%
GMW–Torrumbarry
GMW–Murray Valley
GMW–Loddon Valley
GMW–Rochester
GMW–Central Goulburn
GMW–Shepparton
LMW–Red Cli�s
LMW–Merbein
LMW–Mildura
West Corurgan
Moira
MIL–B1 Class C
Eagle Creek
Coleambally–GS
MI–Grav–GS
MI–Grav–HS
MI–LAW–GS
Hay
Jemalong
Narromine
Buddah Lake
Trangie–Nevertire
Tenandra
Marthaguy–GS
SunWater–St George
Vict
oria
N
ew S
outh
Wal
esQ
ld
Change in hypothetical bills
50% water delivered
100% water delivered
Consum
er price index
So
urc
e:
AC
CC
fro
m d
ata
pro
vid
ed a
nd
pu
blis
hed
by
off
-riv
er in
fras
tru
ctu
re o
per
ato
rs.
No
tes:
D
ata
is p
rese
nte
d in
no
min
al t
erm
s. H
ypo
thet
ical
bill
s ar
e fo
r 25
0 M
L ir
rig
atio
n r
igh
t o
r w
ater
acc
ess
enti
tlem
ent,
an
d e
ith
er 5
0 o
r 10
0 p
er c
ent
wat
er d
eliv
ery.
C
IT =
Cen
tral
Irri
gat
ion
Tru
st; R
IT =
Ren
mar
k Ir
rig
atio
n T
rust
; GM
W =
Go
ulb
urn
–Mu
rray
Wat
er; L
MW
= L
ow
er M
urr
ay W
ater
; MIL
= M
urr
ay Ir
rig
atio
n L
imit
ed; W
MI =
Wes
tern
Mu
rray
Ir
rig
atio
n L
imit
ed; M
I = M
urr
um
bid
gee
Irri
gat
ion
Lim
ited
; HP
= h
igh
pre
ssu
re; M
P =
med
ium
pre
ssu
re; L
P =
low
pre
ssu
re; H
S =
hig
h s
ecu
rity
; GS
= g
ener
al s
ecu
rity
; LA
W =
larg
e ar
ea
sup
ply
Wah
Wah
exc
lud
ing
IHS
(in
teg
rate
d h
ort
icu
ltu
re s
up
ply
); g
rav
= g
ravi
ty f
ed; C
PI =
co
nsu
mer
pri
ce in
dex
.
99Water monitoring report 2017–18
Higher off-river charges drove the majority of hypothetical bill increases
Charts 6.6 and 6.7 present the drivers that contributed to the overall dollar changes in hypothetical bills from 2016–17. These drivers are split by type of charge and grouped into WPM, on-river and off-river categories.
We observed:
�� Across all networks, around 86 per cent of hypothetical bill changes were driven by either increases or decreases in off-river charges (in dollar terms), rather than by changes in WPM or on-river charges. This was the case in 75 per cent of bills for pressurised networks and 88 per cent for gravity fed networks.
�� In pressurised networks, the largest dollar change for off-river charges occurred in CIT’s high pressure network, with an increase of $3179. This increase represented 99.7 per cent of the total dollar change for this network. CIT’s medium and low pressure networks reported the second and third highest changes in off-river charges (up $294 and $1653 respectively).
�� While off-river charges drove most changes in pressurised networks’ hypothetical bills, increases in on-river charges generally drove bill increases in WMI’s networks. Except in WMI’s Buronga network, increased on-river charges of $310 represented over 80 per cent of the dollar change in WMI’s hypothetical bills.172
�� The largest change in off-river charges for gravity fed networks occurred in MI’s high security network, with a decrease of $3377. This decrease related to the earlier mentioned changes (section 6.2.2) introduced in 2017–18 in MI’s pricing structure.
�� Other large changes for off-river charges occurred at Narromine (up $2525) and Marthaguy (up $2128). Both networks reported falls in onriver charges.
�� In the GMW networks, reductions in off-river charges were the only reason for the fall in hypothetical bills (for the second year in a row). As noted previously, these decreases were partly due to the Victorian Essential Services Commission’s 2016 revenue determination173 approving common infrastructure access and use fees across GMW networks.
�� In contrast, changes in hypothetical bills in the Eagle Creek, Coleambally general security and Buddah Lake networks were largely due to changes in on-river charges in 2017–18.174
172 IPART’s June 2017 review of prices for WaterNSW’s bulk water services stated WaterNSW’s core costs were falling in most valleys. In the Murray Valley where WMI operates, however, customers also pay MDBA pass through charges to recover the state’s funding of the MDBA. See Independent Pricing and Regulatory Tribunal NSW, Water NSW: review of prices for rural bulk water services from 1 July 2017 to 30 June 2021, final report, June 2017, p. 1, https://www.ipart.nsw.gov.au/files/sharedassets/website/shared-files/investigation-legislative-requirements-water-bulk-water-review-of-prices-for-waternsws-rural-bulk-water-services-from-1-july-2017-formerly-state-water-corporation/final-report-waternsw-review-of-prices-for-rural-bulk-water-services-from-1-july-2017-june-2017.pdf, viewed 15 January 2019.
173 Essential Services Commission, 2016 Water Price Review: Goulburn–Murray Water Determination 1 July 2016–30 June 2020, 2016, p. 51, https://www.esc.vic.gov.au/water/water-prices-tariffs-and-special-drainage/water-price-reviews/water-price-review-2016-goulburn-murray-water#tabs-container2, viewed 15 January 2019.
174 The 2017 IPART review led to on-river charge decreases in the Murrumbidgee and Macquarie valleys where Coleambally and Buddah Lake are located respectively.

100 Water monitoring report 2017–18
Cha
rt 6
.6:
Year
-on-
year
cha
nge
in n
om
inal
ter
ms
for
wat
er p
lann
ing
and
man
agem
ent,
on-
rive
r an
d o
ff-r
iver
cha
rges
—p
ress
uris
ed n
etw
ork
s, 2
017–
18 (
for
250
ML
enti
tlem
ent)
WPM
cha
rges
O
n-riv
er c
harg
es
O�-
river
cha
rges
CIT–
HP
CIT–
MP
CIT–
LP
RIT
GM
W–T
resc
o G
MW
–Nya
h G
MW
–Woo
rinen
LM
W–R
obin
vale
W
MI–
Curlw
aa
WM
I–Co
omea
lla
WM
I–Bu
rong
a M
I–IH
S–H
S
Sout
h A
ustr
alia
Vict
oria
N
ew S
outh
Wal
es
Change in hypothetical bills
–$30
00
–$20
00
–$10
00
$ 0
$100
0
$200
0
$300
0
$400
0
So
urc
e:
AC
CC
fro
m d
ata
pro
vid
ed a
nd
pu
blis
hed
by
off
-riv
er in
fras
tru
ctu
re o
per
ato
rs.
No
tes:
D
ata
is p
rese
nte
d in
no
min
al t
erm
s. H
ypo
thet
ical
bill
s ar
e fo
r 25
0 M
L o
f ir
rig
atio
n r
igh
t o
r w
ater
acc
ess
enti
tlem
ent,
an
d 1
00 p
er c
ent
wat
er d
eliv
ery.
C
IT =
Cen
tral
Irri
gat
ion
Tru
st; R
IT =
Ren
mar
k Ir
rig
atio
n T
rust
; GM
W =
Go
ulb
urn
–Mu
rray
Wat
er; L
MW
= L
ow
er M
urr
ay W
ater
; WM
I = W
este
rn M
urr
ay Ir
rig
atio
n L
imit
ed;
MI =
Mu
rru
mb
idg
ee Ir
rig
atio
n L
imit
ed; H
P =
hig
h p
ress
ure
; MP
= m
ediu
m p
ress
ure
; LP
= lo
w p
ress
ure
; HS
= h
igh
sec
uri
ty; I
HS
= in
teg
rate
d h
ort
icu
ltu
re s
up
ply
; WP
M =
wat
er
pla
nn
ing
an
d m
anag
emen
t.

101Water monitoring report 2017–18
Cha
rt 6
.7:
Year
-on-
year
cha
nges
in n
om
inal
ter
ms
for
wat
er p
lann
ing
and
man
agem
ent,
on-
rive
r an
d o
ff-r
iver
cha
rges
—g
ravi
ty f
ed n
etw
ork
s, 2
017–
18 (
for
250
ML
enti
tlem
ent)
WPM
cha
rges
O
n-riv
er c
harg
es
O�-
river
cha
rges
–$40
00
–$30
00
–$20
00
–$10
00
$0
$100
0
$200
0
$300
0
GMW–Torrumbarry
GMW–Murray Valley
GMW–Loddon Valley
GMW–Rochester
GMW–Central Goulburn
GMW–Shepparton
LMW–Red Cli�s
LMW–Merbein
LMW–Mildura
West Corurgan
Moira
MIL–B1 Class C
Eagle Creek
Coleambally–GS
MI–Grav–GS
MI–Grav–HS
MI–LAW–GS
Hay
Jemalong
Narromine
Buddah Lake
Trangie–Nevertire
Tenandra
Marthaguy–GS
Sunwater–St George
Vict
oria
N
ew S
outh
Wal
es
Qld
Change in hypothetical bills
So
urc
e:
AC
CC
fro
m d
ata
pro
vid
ed a
nd
pu
blis
hed
by
off
-riv
er in
fras
tru
ctu
re o
per
ato
rs.
No
tes:
D
ata
is p
rese
nte
d in
no
min
al t
erm
s. H
ypo
thet
ical
bill
s ar
e fo
r 25
0 M
L ir
rig
atio
n r
igh
t o
r w
ater
acc
ess
enti
tlem
ent,
an
d 1
00 p
er c
ent
wat
er d
eliv
ery.
G
MW
= G
ou
lbu
rn–M
urr
ay W
ater
; LM
W =
Lo
wer
Mu
rray
Wat
er; M
IL =
Mu
rray
Irri
gat
ion
Lim
ited
; MI =
Mu
rru
mb
idg
ee Ir
rig
atio
n L
imit
ed; H
P =
hig
h p
ress
ure
; MP
= m
ediu
m p
ress
ure
; L
P =
low
pre
ssu
re; H
S =
hig
h s
ecu
rity
; GS
= g
ener
al s
ecu
rity
; LA
W =
larg
e ar
ea s
up
ply
Wah
Wah
exc
lud
ing
IHS
(in
teg
rate
d h
ort
icu
ltu
re s
up
ply
); g
rav
= g
ravi
ty f
ed; W
PM
= w
ater
p
lan
nin
g a
nd
man
agem
ent.
102 Water monitoring report 2017–18
6.3.5 While hypothetical bills have generally increased from 2009–10, average rises have not been excessive
This section looks at changes in hypothetical bills from 2009–10 to 2017–18 in real terms, as shown in charts 6.8 to 6.10. Over the period from 2009–10 to 2017–18, the total aggregate bill change was 12 per cent in real terms (reflecting both increases and decreases in bills for both 50 and 100 per cent of water delivered). By network type, the total aggregate change was 12 per cent in pressurised networks and 11 per cent in gravity fed networks over that period.
More generally over that period, we observed:
�� Around 27 per cent of hypothetical bills decreased in real terms. This share was considerably different between network types, with 8 per cent of bills falling in pressurised networks compared with 36 per cent of hypothetical bills in gravity fed networks.
�� In pressurised networks, the largest percentage increase occurred in GMW’s Nyah network, with bills rising by 43 and 32 per cent in real terms for 50 and 100 per cent of water delivered respectively. GMW’s other two pressurised networks also had larger than average increases in hypothetical bills. The Tresco network had increases of 30 and 26 per cent for 50 and 100 per cent allocation, while Woorinen network bills rose by 26 and 19 per cent for the different allocations. In contrast, WMI’s three pressurised networks had relatively subdued bill increases, ranging from 1 to 11 per cent.
�� In gravity fed networks, bills showed considerable variation (particularly compared with results for pressurised networks). Tenandra had the largest bill increases in real terms, with 162 per cent for 50 per cent of water delivered and 166 per cent for 100 per cent of water delivered. Other large increases occurred in the HPID network, with growth of 82 and 56 per cent for 100 and 50 per cent of water delivered respectively.
�� Bill decreases were observed in MI’s high security pressurised network (MI-IHS-HS), down 21 and 18 per cent for 50 and 100 per cent of water delivered respectively.
�� In gravity fed networks, MI’s high security bill declined by 28 and 26 per cent for 50 and 100 per cent of water delivered. Other large decreases included MI’s general security bill (down 14 and 15 per cent for 50 and 100 per cent of water delivered respectively) and GMW’s Central Goulburn bill (down 14 and 15 per cent). Bills in LMW’s Red Cliffs and Merbein networks fell by 6–9 per cent for both 50 and 100 per cent of water delivered.
While off-river charges remain significant, on-river charges are increasing as a proportion of hypothetical bills
Off-river charges continued to make up a significant proportion of off-river IOs’ hypothetical bills in 2017–18. They made up over 50 per cent of the total hypothetical bill for around 92 per cent of networks. Within pressurised networks, this contribution ranged from a high of 95 per cent for LMW’s Robinvale network to a low of 82 per cent for WMI’s Curlwaa network. Within gravity fed networks, it ranged from 92 per cent for LMW’s Mildura network to 39 per cent for Jemalong.

103Water monitoring report 2017–18
Cha
rt 6
.8:
Hyp
oth
etic
al b
ills
over
tim
e fo
r p
ress
uris
ed n
etw
ork
s in
rea
l ter
ms,
200
9–10
to
201
7–18
(25
0 M
L en
titl
emen
t)
$ 0
$10 000
$20 000
$30 000
$40 000
$50 000
$60 000
Total hypothetical bills (2017–18 $)
High Pressure
Medium
Pressure
Low Pressure
Tresco
Nyah
Woorinen
Robinvale
Curlw
aa
Coom
ealla
Buronga
CIT
RIT
GMW
LMW
WMI
IHS-HS
MI
50% water delivered
100% water delivered
So
urc
e:
AC
CC
fro
m d
ata
pro
vid
ed a
nd
pu
blis
hed
by
off
-riv
er in
fras
tru
ctu
re o
per
ato
rs.
No
tes:
To
ass
ist
the
read
abili
ty o
f th
e ch
art,
we
did
no
t la
bel
ind
ivid
ual
yea
rs o
n t
he
ho
rizo
nta
l axi
s.
H
ypo
thet
ical
bill
s ar
e fo
r 25
0 M
L ir
rig
atio
n r
igh
t o
r w
ater
acc
ess
enti
tlem
ent,
an
d 5
0 an
d 1
00 p
er c
ent
wat
er d
eliv
ery,
in r
eal v
alu
es (
2017
–18
do
llars
).
C
IT =
Cen
tral
Irri
gat
ion
Tru
st; R
IT =
Ren
mar
k Ir
rig
atio
n T
rust
; GM
W =
Go
ulb
urn
–Mu
rray
Wat
er; L
MW
= L
ow
er M
urr
ay W
ater
; WM
I = W
este
rn M
urr
ay Ir
rig
atio
n L
imit
ed;
MI =
Mu
rru
mb
idg
ee Ir
rig
atio
n L
imit
ed; H
S =
hig
h s
ecu
rity
; IH
S =
inte
gra
ted
ho
rtic
ult
ure
su
pp
ly.
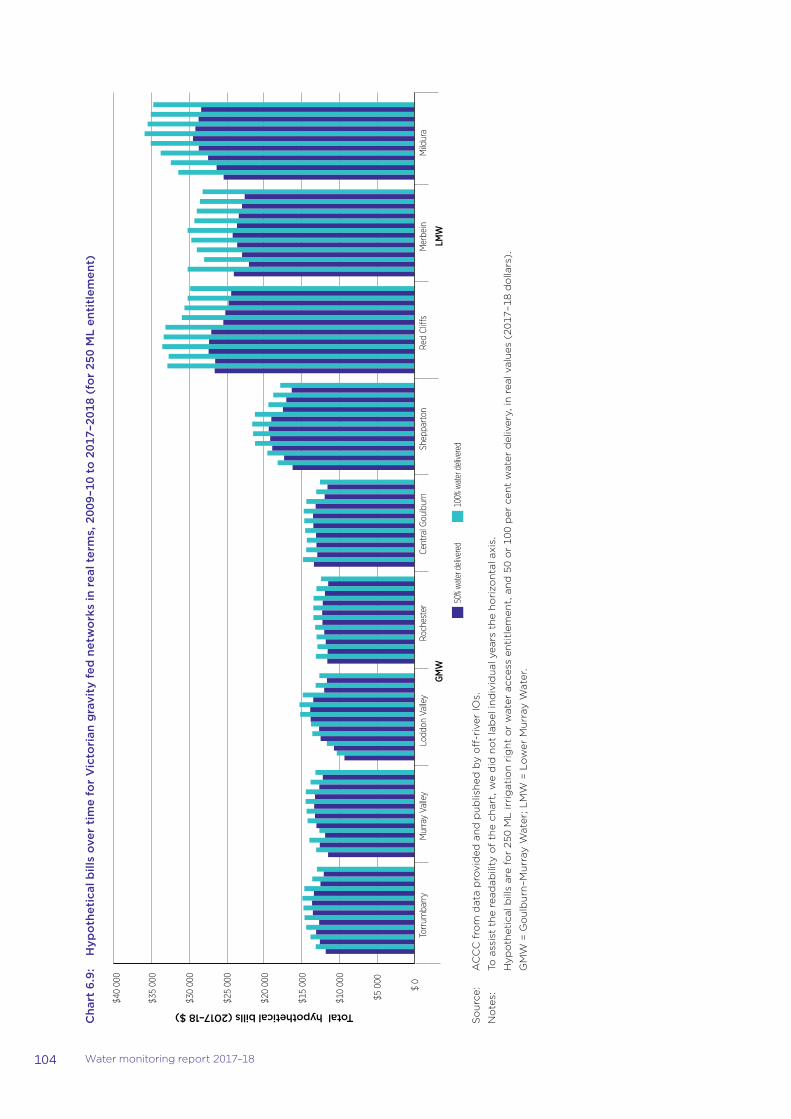
104 Water monitoring report 2017–18
Cha
rt 6
.9:
Hyp
oth
etic
al b
ills
over
tim
e fo
r V
icto
rian
gra
vity
fed
net
wo
rks
in r
eal t
erm
s, 2
009–
10 t
o 2
017–
2018
(fo
r 25
0 M
L en
titl
emen
t)
Torr
umba
rry
Mur
ray
Valle
y Lo
ddon
Val
ley
Roch
este
r Ce
ntra
l Gou
lbur
n Sh
eppa
rton
Re
d Cl
i�s
Mer
bein
M
ildur
a
50% water delivered
100% water delivered
$ 0
$5 0
00
$10
000
$15
000
$20
000
$25
000
$30
000
$35
000
$40
000
GMW
LM
W
Total hypothetical bills (2017–18 $)
So
urc
e:
AC
CC
fro
m d
ata
pro
vid
ed a
nd
pu
blis
hed
by
off
-riv
er IO
s.
No
tes:
To
ass
ist
the
read
abili
ty o
f th
e ch
art,
we
did
no
t la
bel
ind
ivid
ual
yea
rs t
he
ho
rizo
nta
l axi
s.
H
ypo
thet
ical
bill
s ar
e fo
r 25
0 M
L ir
rig
atio
n r
igh
t o
r w
ater
acc
ess
enti
tlem
ent,
an
d 5
0 o
r 10
0 p
er c
ent
wat
er d
eliv
ery,
in r
eal v
alu
es (
2017
–18
do
llars
).
G
MW
= G
ou
lbu
rn–M
urr
ay W
ater
; LM
W =
Lo
wer
Mu
rray
Wat
er.
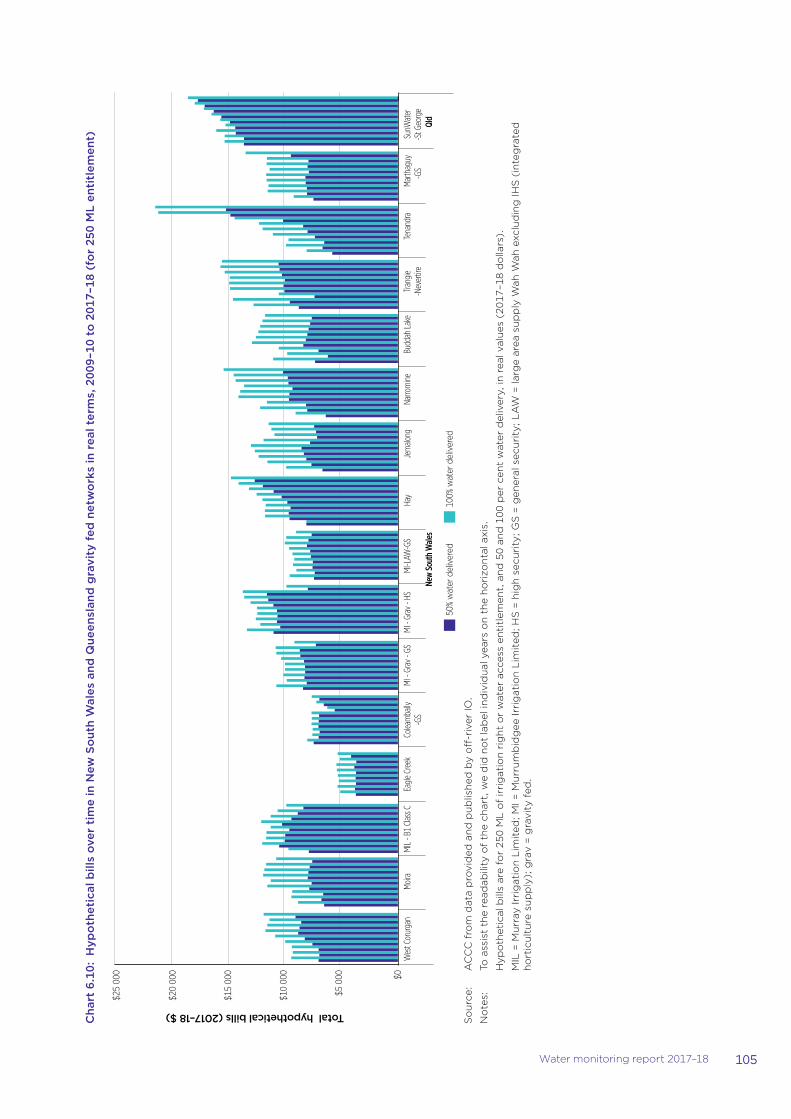
105Water monitoring report 2017–18
Cha
rt 6
.10:
Hyp
oth
etic
al b
ills
over
tim
e in
New
So
uth
Wal
es a
nd Q
ueen
slan
d g
ravi
ty f
ed n
etw
ork
s in
rea
l ter
ms,
200
9–10
to
201
7–18
(fo
r 25
0 M
L en
titl
emen
t)
$0
$5 0
00
$10
000
$15
000
$20
000
$25
000
West Corurgan
Moira
MIL - B1 Class C
Eagle C
reek
Coleambally
-GS
MI - Grav - GS
MI - Grav - HS
MI-LAW
-GS
Hay
Jemalong
Narromine
Buddah Lake
Trangie
-Nevertire
Tenandra
Marthaguy
-GS
SunW
ater
-St George
New South Wale
sQld
50%
wat
er d
eliv
ered
10
0% w
ater
del
iver
ed
Total hypothetical bills (2017–18 $)
So
urc
e:
AC
CC
fro
m d
ata
pro
vid
ed a
nd
pu
blis
hed
by
off
-riv
er IO
.
No
tes:
To
ass
ist
the
read
abili
ty o
f th
e ch
art,
we
did
no
t la
bel
ind
ivid
ual
yea
rs o
n t
he
ho
rizo
nta
l axi
s.
H
ypo
thet
ical
bill
s ar
e fo
r 25
0 M
L o
f ir
rig
atio
n r
igh
t o
r w
ater
acc
ess
enti
tlem
ent,
an
d 5
0 an
d 1
00 p
er c
ent
wat
er d
eliv
ery,
in r
eal v
alu
es (
2017
–18
do
llars
).
M
IL =
Mu
rray
Irri
gat
ion
Lim
ited
; MI =
Mu
rru
mb
idg
ee Ir
rig
atio
n L
imit
ed; H
S =
hig
h s
ecu
rity
; GS
= g
ener
al s
ecu
rity
; LA
W =
larg
e ar
ea s
up
ply
Wah
Wah
exc
lud
ing
IHS
(in
teg
rate
d
ho
rtic
ult
ure
su
pp
ly);
gra
v =
gra
vity
fed
.
106 Water monitoring report 2017–18
From 2009–10 to 2017–18, however, the proportion of off-river charges as part of the hypothetical bill decreased in significance for most networks. It fell for all bills within pressurised networks, and for 80 per cent of bills within gravity fed networks. The largest decline for pressurised networks occurred in CIT’s low pressure network, where the off-river charges contribution dropped 10 percentage points. The largest decline in gravity fed networks was in West Corurgan, with a drop of 33 percentage points.
By state, the level of reliance on off-river charges is less in New South Wales than in other states including Victoria and South Australia, particularly for gravity fed networks. In Victorian and South Australian gravity fed networks, off-river charges comprised 70 per cent or more of all hypothetical bills in 2017–18. Yet, in New South Wales the share was only 44 per cent. For pressurised networks, the reliance on off-river charges does not vary by state. The contribution of these charges in 2017–18 exceeded 80 per cent of all hypothetical bills within pressurised networks.
The Water monitoring report 2017–18: supplementary spreadsheet—background data contains charts (for pressurised networks, gravity fed networks in Victoria, and gravity fed networks in New South Wales and Queensland) that show changes in the proportion of hypothetical bills attributable to off-river charges from 2009–10 to 2017–18.
Fixed charges have been a key component of network hypothetical bills
A greater proportion of revenue derived from fixed charges means a network’s revenue base is more stable (and reliable) over time and less reliant on fluctuating water availability and use. The level of fixed off-river charges also influences the maximum termination fee that an off-river IO can impose on a customer if terminating access to the off-river IO’s network.
Fixed charges made up more than 50 per cent of hypothetical bill totals for 74 per cent of all networks in 2017–18. Reliance on these charges, however, varied by type of network. In small gravity fed networks, fixed charges were less than 50 per cent of the total bill for half of the networks. In contrast, no larger gravity fed network had fixed charges that were less than 50 per cent of the total bill. The use of fixed charges in pressurised network hypothetical bills was more varied than in the gravity fed networks, with these charges contributing less than 50 per cent of the bills for 33 per cent of pressurised networks.
Since 2009–10, there has been no strong trend across all hypothetical bills in the use of fixed charges. In total, around 55 per cent of networks increased their proportion of fixed charges over the nine years to 2017–18. By network type, this share was 50 per cent of pressurised networks, 40 per cent of small gravity fed networks, and 71 per cent of larger gravity fed networks. By operator, the largest change in the use of fixed charges was in the Marthaguy network, which increased its proportion of fixed charges from 24 per cent in 2009–10 to 52 per cent in 2017–18.
The Water monitoring report 2017–18: supplementary spreadsheet—background data includes three charts that display changes in the fixed charge proportion of hypothetical bills.
07
The Murray River between Purnong and Swan Reach in South Australia Source: Arthur Mostead (Murray–Darling Basin Authority)
Basin states’ approaches to water planning and management continue to vary
108 Water monitoring report 2017–18
7. Basin states’ approaches to water planning and management continue to vary
Key points
�� Our analysis in this chapter is based on the water planning and management (WPM) spending and revenue data provided to the ACCC by the Basin states, which is subject to some limitations as described in the chapter.
�� In New South Wales, a 25.1 per cent real increase in water planning and management expenditure in the Murray–Darling Basin in 2017–18 was largely driven by a doubling of spending on water planning. This was partly due to increased water resource planning activities ahead of the deadline for water resource plan accreditation. Revenue from WPM charges, however, remained relatively stable. New South Wales’ observed rate of cost recovery from water users dropped to 46.6 per cent in 2017–18.
�� Victoria spent an additional $30 million on Water for Victoria projects across the state in 2017–18. The Environmental Contribution levy collected by the Department of Environmental, Land, Water and Planning once again raised the majority of Victoria’s WPM revenue. However, the proportion of revenue collected by regional water authorities continues to grow and reached 20.4 per cent in 2017–18.
�� With South Australia’s planned reforms to its WPM regime not coming into effect in 2017–18, the state’s WPM expenditure and revenue had no notable trends. South Australia’s estimated cost recovery rate remained steady at approximately 23 per cent.
�� Queensland’s Department of Natural Resources, Mining and the Energy cannot provide the ACCC with data on its WPM spending. The state’s WPM revenue fell by 45.8 per cent in 2017–18 in real terms, back closer to levels before 2016–17. This was due to significant falls in water availability reducing the revenue recovered through water harvesting charges in unregulated river systems.
�� The ACT’s expenditure on WPM activities fell by over 40 per cent in 2017–18 in real terms due to the completion of several WPM-related projects in 2016–17. Coupled with growing revenue, this fall led the ACT’s estimated rate of cost recovery to grow to an estimated 191.2 per cent in 2017–18 and an estimated three-year average rate of 129.2 per cent. This outcome in the ACT reflects both urban charge revenue and rural water charge revenue.
�� Basin jurisdictions’ funding contributions to Murray–Darling Basin Authority joint programs continued its upward trend, rising by 4.8 per cent in nominal terms to a total of $92.6 million.
�� The Productivity Commission’s National Water Reform inquiry report noted progress on WPM cost recovery has stalled since 2014 and there is scope for all jurisdictions except New South Wales to improve their WPM charging and cost recovery arrangements.
For 2017–18 we have restructured this chapter to focus on key trends within Basin states rather than comparisons between them. The change acknowledges the significant differences across each Basin state’s administrative and charging arrangements, and shortcomings in data availability that limit the usefulness of comparisons.
109Water monitoring report 2017–18
The chapter examines the results of each Basin state’s approach to water planning and management (WPM) spending and cost recovery, while also discussing the Productivity Commission’s assessment of progress against the National Water Initiative (NWI) objectives and outcomes for WPM:
�� Section 7.1 looks at changes in Basin state agencies’ administrative, funding and charging arrangements for WPM.
�� Section 7.2 provides a state-by-state breakdown of WPM spending, the charges imposed, the revenue earned from these charges, and rates of cost recovery.
�� Section 7.3 gives an overview of each Basin state’s contributions to the Murray–Darling Basin Authority’s (MDBA) joint program funding.
�� Section 2.3 in our Water monitoring report: supplementary information, 2017–18 outlines the policy commitments to WPM cost recovery and further describes WPM charging arrangements in each Basin state.
7.1 Basin states’ water planning and management regimes continue to evolve
All Basin states except New South Wales kept their WPM administrative and charging arrangements unchanged in 2017–18, though South Australia and Victoria flagged changes that will likely come into effect in 2018–19.
7.1.1 New South Wales formed the Natural Resource Access RegulatorFollowing allegations of water theft (highlighted in the Four Corners ‘Pumped’ program) and allegations of corruption, misconduct and maladministration in water management and compliance in the Department of Primary Industries, the New South Wales Government engaged Ken Matthews to undertake an independent review of water management and compliance (the Matthews Review). Based on the review’s recommendations, the Government introduced the Water Reform Action Package (section 2.1.1) and established the Natural Resource Access Regulator (NRAR) as an independent and transparent regulator with total carriage of the compliance and enforcement of the NSW Government water management legislation.175 The NRAR was formed on 30 April 2018.
The NRAR combines compliance functions previously split between WaterNSW and Department of Industry (Water) (DOI Water). It is responsible for monitoring and auditing compliance with the state’s water management laws, investigating alleged non-compliance, and taking enforcement action in response to breaches. It also handles controlled activity approvals and shares (with WaterNSW) responsibility for granting and managing water licences. As of 12 February 2019, the NRAR had undertaken a range of compliance and enforcement activities, including:
�� performed 58 compliance audits and 200 inspections
�� sent 237 advisory and formal warning letters
�� issued 34 remediation notices and 36 penalty infringement notices
�� commenced six prosecutions.176
175 See https://www.industry.nsw.gov.au/natural-resources-access-regulator/about-nrar, viewed 19 February 2019.
176 NRAR, NRAR’s response to the ACCC’s voluntary data request, 22 February 2019.
110 Water monitoring report 2017–18
7.1.2 Victoria abolished one of its longstanding water planning and management charges
On 22 June 2018 Victorian Minister for Water, the Hon Lisa Neville, announced the Victorian Government would abolish (from 1 July 2018) a salinity levy imposed on irrigators in the Mallee region since 1993. The levy was originally introduced to improve irrigation management and reduce the impact of salinity.177 It was collected as usual for 2017–18, at the rate of 50 cents per ML of water entitlement held, collecting approximately $97 000.
7.1.3 South Australia committed to legislative changesThe Coalition South Australian Government, elected at the March 2018 State Election, indicated it will replace the Natural Resources Management Act 2004 (SA) with the Landscape South Australia Act. The South Australian Government introduced the Landscape South Australia Bill into Parliament on 20 March 2019. The new Act will transfer responsibility for WPM charges and activities to the yet to be created South Australian Murray–Darling Basin Landscape Board.178 While this change has no impact on our reporting of the state’s WPM costs and revenue in this Report, from 2018–19 the South Australian Murray–Darling Landscape Board will be in charge of raising funds for, undertaking and reporting on WPM activities.
7.2 Basin states’ apply varying approaches to water planning and management, guided by the National Water Initiative
In this section, we look at the approach and outcomes of each Basin state’s WPM arrangements, by breaking down each state’s spending, revenue and resulting rate of cost recovery.
WPM activities are undertaken by, or on behalf of, governments to plan for and manage water resource sustainability. They promote sustainability of the resource, maintain ecosystem health, and minimise the impact of water extraction. By doing so, they protect the integrity of the entitlement system and the security of authorised users’ access to water.
The NWI breaks WPM activities into the following categories:
�� water reform strategy and policy
�� water planning
�� water management
�� water monitoring and evaluation
�� information management and reporting
�� water administration and regulation
�� water industry regulation.179
While individual activities by Basin states do not always fit neatly into just one of these categories, we ask Basin states to class each activity as only the category that fits best (to avoid duplication and ensure consistency with our previous water monitoring reports).
177 Victorian Government, ‘50 cent levy abolished to save Mallee irrigators money’, media release, https://www.premier.vic.gov.au/50-cent-levy-abolished-to-save-mallee-irrigators-money/, viewed 12 March 2019.
178 South Australian Government, ‘About the Reform’, https://yoursay.sa.gov.au/decisions/landscape-reform/about-the-bill, viewed 9 May 2019.
179 National Water Initiative Pricing Principles, 2004, appendix B, pp. 19–21, see http://www.agriculture.gov.au/SiteCollectionDocuments/water/national-water-initiative-pricing-principles.pdf, viewed 8 March 2019.
111Water monitoring report 2017–18
The NWI also committed Basin states to recovering the cost of their WPM activities according to the principles of user pays and pricing transparency. These commitments were incorporated into the Water Act 2007 through schedule 2, and given effect through the Water Charge (Planning and Management Information) Rules 2010, which help achieve the Basin water charging objectives and principles. These objectives and principles require Basin states to link WPM charges as closely as possible to the costs of activities or products, and to report publicly on WPM cost recovery.180
To recover their costs, Basin states apply different types of charges: water access right charges (which can be fixed volumetric, variable volumetric or non-volumetric), transactions charges or broad-based levies.181 In discussing WPM charges, the Productivity Commission contended states should seek to find a balance between an activity-based approach to cost recovery and more administratively simple charging schemes (such as broad-based levies), which can offer budgetary and compliance savings. Box 7.1 details the Productivity Commission’s findings.
When considering Basin states’ estimated rates of cost recovery for WPM activities, we note spending can vary significantly from year to year, with many programs extending over multiple years. For this reason, we also consider medium term rates (five-year averages) of cost recovery, rather than focusing solely on the figures from any given year.
7.2.1 Trends in water planning and managementWe collect data from Basin states on their revenue earned from WPM charges, and their expenditure on WPM related activities. Relevant Basin state agencies have reported a number of issues with the data that we collect, such as incomplete data, the inability to separate Murray–Darling Basin (MDB) specific data from state-wide arrangements, and inconsistent reporting processes across agencies and years. Attempts to address these data issues have led to revisions of some previously published figures, so data in this Report may not align exactly with figures in past water monitoring reports. We are considering options for how we collect and present WPM data in the future.
In 2017–18 Basin states’ spending on WPM activities rose by 17.3 per cent in real terms to a total of $315.4 million. The greatest driver of this trend was a real 25.2 per cent increase in spending on water management activities, which again made up the majority of Basin states’ WPM expenditure. Spending on water planning activities grew by 19.5 per cent across the Basin states in real terms, on the back of increased water planning expenditure in New South Wales. Some additional cost was attributed to extra resources dedicated to handling compliance cases. WPM spending grew in all Basin states on which we collect data except the ACT.
Across all Basin states, revenue from WPM charges grew slightly in 2017–18 to a total of $99.6 million. All Basin states except the ACT (which raises minimal revenue from transaction charges) increased their revenue collected from transaction charges, by a total of 41.9 per cent in real terms. Total revenue from variable water access right charges also grew, largely on the back of increased earnings from urban ‘water abstraction fees’ in the ACT and from use charges imposed on Murrumbidgee groundwater in New South Wales. Revenue collected by Basin states from fixed volumetric and non-volumetric water access right charges fell slightly. Sections 7.2.2–7.2.6 discuss each Basin states’ WPM expenditure and revenue.
Chart 7.1 reflects aggregate WPM cost and revenue data across all Basin states, although it should be interpreted against the data limitations noted throughout this chapter. Specifically, by including all expenditure on WPM activities across all of Victoria, and limiting revenues to those collected from water users in the Victorian MDB, the chart exaggerates WPM costs relative to revenue.
180 Schedule 2, Water Act 2007.
181 For further information on WPM charges, see section 2.3 of Water monitoring report: supplementary information, 2017–18.
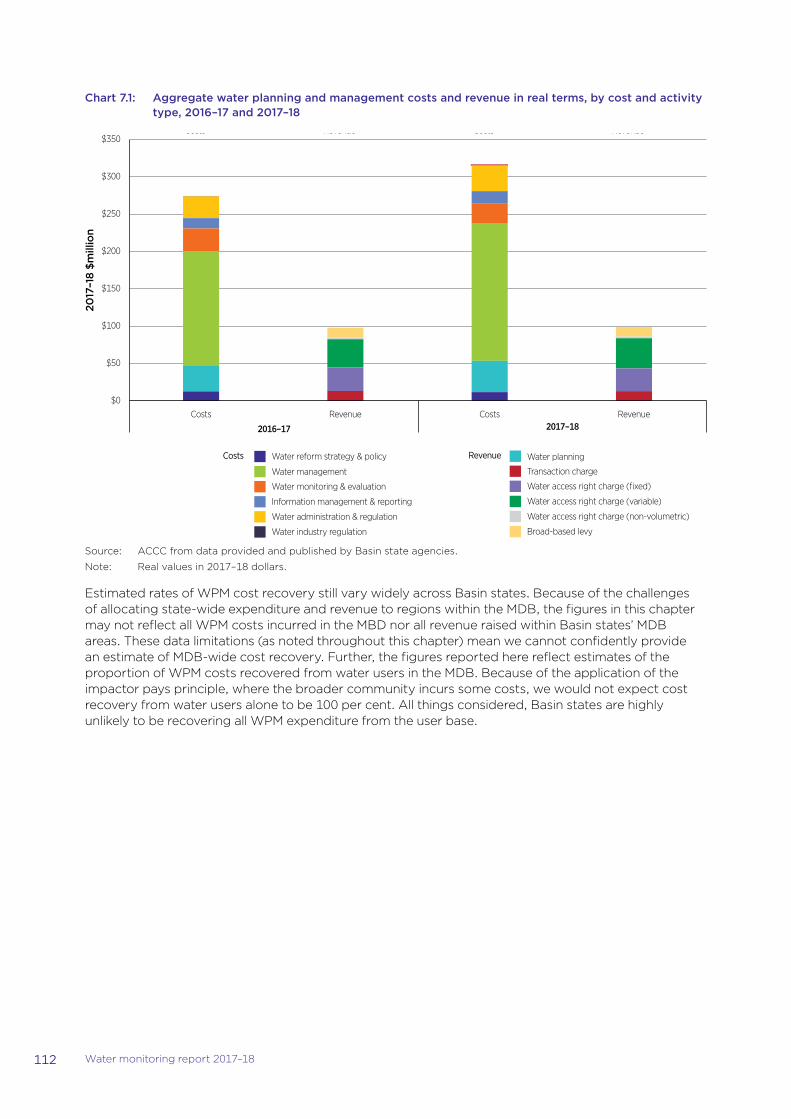
112 Water monitoring report 2017–18
Chart 7.1: Aggregate water planning and management costs and revenue in real terms, by cost and activity type, 2016–17 and 2017–18
RevenueCostsRevenueCosts
$0
$50
$100
$150
$200
$250
$300
$350RevenueCostsRevenueCosts
Revenue
Broad-based levy
Water access right charge (non-volumetric)
Water access right charge (variable)
Water access right charge (fixed)
Transaction charge
Water planningCosts
Water industry regulation
Water administration & regulation
Information management & reporting
Water monitoring & evaluation
Water management
Water reform strategy & policy
2017
–18
$mill
ion
2016–17 2017–18
Source: ACCC from data provided and published by Basin state agencies.
Note: Real values in 2017–18 dollars.
Estimated rates of WPM cost recovery still vary widely across Basin states. Because of the challenges of allocating state-wide expenditure and revenue to regions within the MDB, the figures in this chapter may not reflect all WPM costs incurred in the MBD nor all revenue raised within Basin states’ MDB areas. These data limitations (as noted throughout this chapter) mean we cannot confidently provide an estimate of MDB-wide cost recovery. Further, the figures reported here reflect estimates of the proportion of WPM costs recovered from water users in the MDB. Because of the application of the impactor pays principle, where the broader community incurs some costs, we would not expect cost recovery from water users alone to be 100 per cent. All things considered, Basin states are highly unlikely to be recovering all WPM expenditure from the user base.
113Water monitoring report 2017–18
Box 7.1: Findings from the National Water Reform inquiry report for water planning and management activities
Under the Water Act 2007, the Productivity Commission conducts triennial assessments of progress towards the objectives and outcomes of the National Water Initiative (NWI), including the recovery and reporting of water planning and management (WPM) activity costs.
In its first National Water Reform inquiry report (provided to government in December 2017 and released in May 2018), the Productivity Commission made a number of findings on states’ approaches and achievements in WPM.182 (The report focused on overall state approaches across Australia, not just operations within the Murray–Darling Basin).
The Productivity Commission’s report found all states had successfully separated responsibility for WPM activities from the role of water service delivery. This separation helps to de-politicise water service delivery, allows more focused policy making, and helps achieve cost-reflective pricing for water infrastructure services.183
The Productivity Commission noted, despite improvement in cost recovery arrangements over the past decade, progress among states has been mixed and has stalled since 2014.184 Consistent with findings of previous years’ ACCC water monitoring reports, the Productivity Commission report noted WPM cost recovery arrangements are inconsistent across jurisdictions, and scope remains to improve arrangements in all jurisdictions (except New South Wales).
WPM arrangements can primarily improve through greater transparency in the identification and reporting of WPM costs, as well as in the basis for allocating these costs among users. The Productivity Commission report calls for five-yearly reviews (by an independent expert) of the efficiency and transparency of River Murray Operations.185
The report encourages a shift away from broad-based levies towards more precise forms of charges, such as New South Wales applies.186 Broad-based levies, while administratively simpler than other forms of charges, can impose less discipline on governments to separate WPM costs from the costs of other policies. Further, they can create cross-subsidies and inequitable outcomes when applied across an entire jurisdiction.187
In assessing states’ progress against the NWI outcomes and objectives for environmental management, the Productivity Commission argued all jurisdictions should prioritise:
�� better specifying environmental and other public benefit outcomes in water planning
�� improving monitoring and reporting arrangements
�� introducing independent auditing of environmental water outcomes and supporting management arrangements.188
Section 2.3.1 of the 2017–18 report provides an overall summary of the inquiry’s findings.
182 Section 2.3.1 in Chapter 2 summarises the Productivity Commission’s report.
183 Productivity Commission, National Water Reform inquiry report, 2018, p. 244. https://www.pc.gov.au/inquiries/completed/water-reform/report, viewed 2 April 2019.
184 Productivity Commission, National Water Reform inquiry report, 2018, pp. 238 and 423.
185 River Murray Operations (RMO) activities involve the management of joint assets to support the reliable supply of water across South Australia, New South Wales and Victoria. Further information on RMO is available at MDBA, ‘Running the River Murray’, https://www.mdba.gov.au/river-information/running-river-murray, viewed 3 April 2019; Productivity Commission, National Water Reform inquiry report, 2018, p. 237.
186 The Productivity Commission noted broad-based levies are in place in Victoria, South Australia and the ACT, but did not define broad-based levies in its report. While Victoria’s DELWP applies a broad-based levy in the form of the environmental contribution levy, our monitoring has not identified any broad-based levies applied in the ACT, or in the MDB region of South Australia since the abolition of the Save the River Murray Fund in 2015. The Productivity Commission possibly considers the ACT’s water abstraction fee and South Australia’s Natural Resources Management Water Levy are broad-based levies, but we define them as water access right charges.
187 Productivity Commission, National Water Reform inquiry report, 2018, p. 425.
188 Ibid., p. 336.
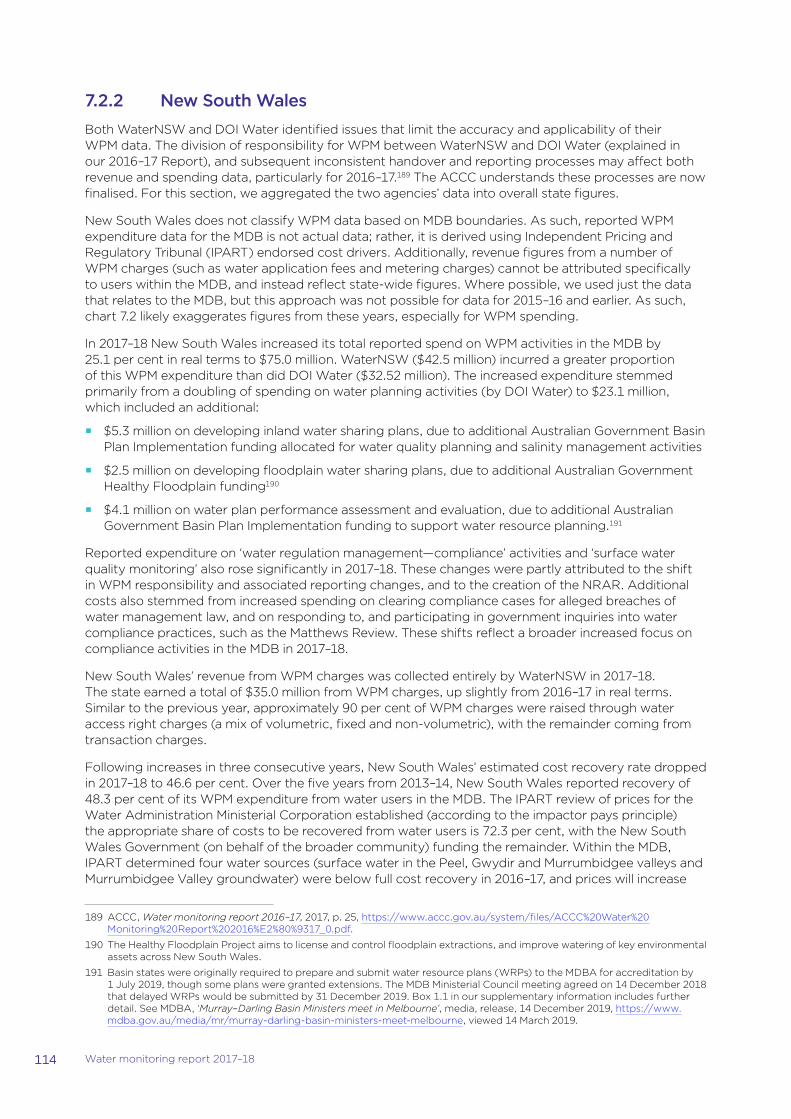
114 Water monitoring report 2017–18
7.2.2 New South WalesBoth WaterNSW and DOI Water identified issues that limit the accuracy and applicability of their WPM data. The division of responsibility for WPM between WaterNSW and DOI Water (explained in our 2016–17 Report), and subsequent inconsistent handover and reporting processes may affect both revenue and spending data, particularly for 2016–17.189 The ACCC understands these processes are now finalised. For this section, we aggregated the two agencies’ data into overall state figures.
New South Wales does not classify WPM data based on MDB boundaries. As such, reported WPM expenditure data for the MDB is not actual data; rather, it is derived using Independent Pricing and Regulatory Tribunal (IPART) endorsed cost drivers. Additionally, revenue figures from a number of WPM charges (such as water application fees and metering charges) cannot be attributed specifically to users within the MDB, and instead reflect state-wide figures. Where possible, we used just the data that relates to the MDB, but this approach was not possible for data for 2015–16 and earlier. As such, chart 7.2 likely exaggerates figures from these years, especially for WPM spending.
In 2017–18 New South Wales increased its total reported spend on WPM activities in the MDB by 25.1 per cent in real terms to $75.0 million. WaterNSW ($42.5 million) incurred a greater proportion of this WPM expenditure than did DOI Water ($32.52 million). The increased expenditure stemmed primarily from a doubling of spending on water planning activities (by DOI Water) to $23.1 million, which included an additional:
�� $5.3 million on developing inland water sharing plans, due to additional Australian Government Basin Plan Implementation funding allocated for water quality planning and salinity management activities
�� $2.5 million on developing floodplain water sharing plans, due to additional Australian Government Healthy Floodplain funding190
�� $4.1 million on water plan performance assessment and evaluation, due to additional Australian Government Basin Plan Implementation funding to support water resource planning.191
Reported expenditure on ‘water regulation management—compliance’ activities and ‘surface water quality monitoring’ also rose significantly in 2017–18. These changes were partly attributed to the shift in WPM responsibility and associated reporting changes, and to the creation of the NRAR. Additional costs also stemmed from increased spending on clearing compliance cases for alleged breaches of water management law, and on responding to, and participating in government inquiries into water compliance practices, such as the Matthews Review. These shifts reflect a broader increased focus on compliance activities in the MDB in 2017–18.
New South Wales’ revenue from WPM charges was collected entirely by WaterNSW in 2017–18. The state earned a total of $35.0 million from WPM charges, up slightly from 2016–17 in real terms. Similar to the previous year, approximately 90 per cent of WPM charges were raised through water access right charges (a mix of volumetric, fixed and non-volumetric), with the remainder coming from transaction charges.
Following increases in three consecutive years, New South Wales’ estimated cost recovery rate dropped in 2017–18 to 46.6 per cent. Over the five years from 2013–14, New South Wales reported recovery of 48.3 per cent of its WPM expenditure from water users in the MDB. The IPART review of prices for the Water Administration Ministerial Corporation established (according to the impactor pays principle) the appropriate share of costs to be recovered from water users is 72.3 per cent, with the New South Wales Government (on behalf of the broader community) funding the remainder. Within the MDB, IPART determined four water sources (surface water in the Peel, Gwydir and Murrumbidgee valleys and Murrumbidgee Valley groundwater) were below full cost recovery in 2016–17, and prices will increase
189 ACCC, Water monitoring report 2016–17, 2017, p. 25, https://www.accc.gov.au/system/files/ACCC%20Water%20Monitoring%20Report%202016%E2%80%9317_0.pdf.
190 The Healthy Floodplain Project aims to license and control floodplain extractions, and improve watering of key environmental assets across New South Wales.
191 Basin states were originally required to prepare and submit water resource plans (WRPs) to the MDBA for accreditation by 1 July 2019, though some plans were granted extensions. The MDB Ministerial Council meeting agreed on 14 December 2018 that delayed WRPs would be submitted by 31 December 2019. Box 1.1 in our supplementary information includes further detail. See MDBA, ‘Murray–Darling Basin Ministers meet in Melbourne’, media, release, 14 December 2019, https://www.mdba.gov.au/media/mr/murray-darling-basin-ministers-meet-melbourne, viewed 14 March 2019.
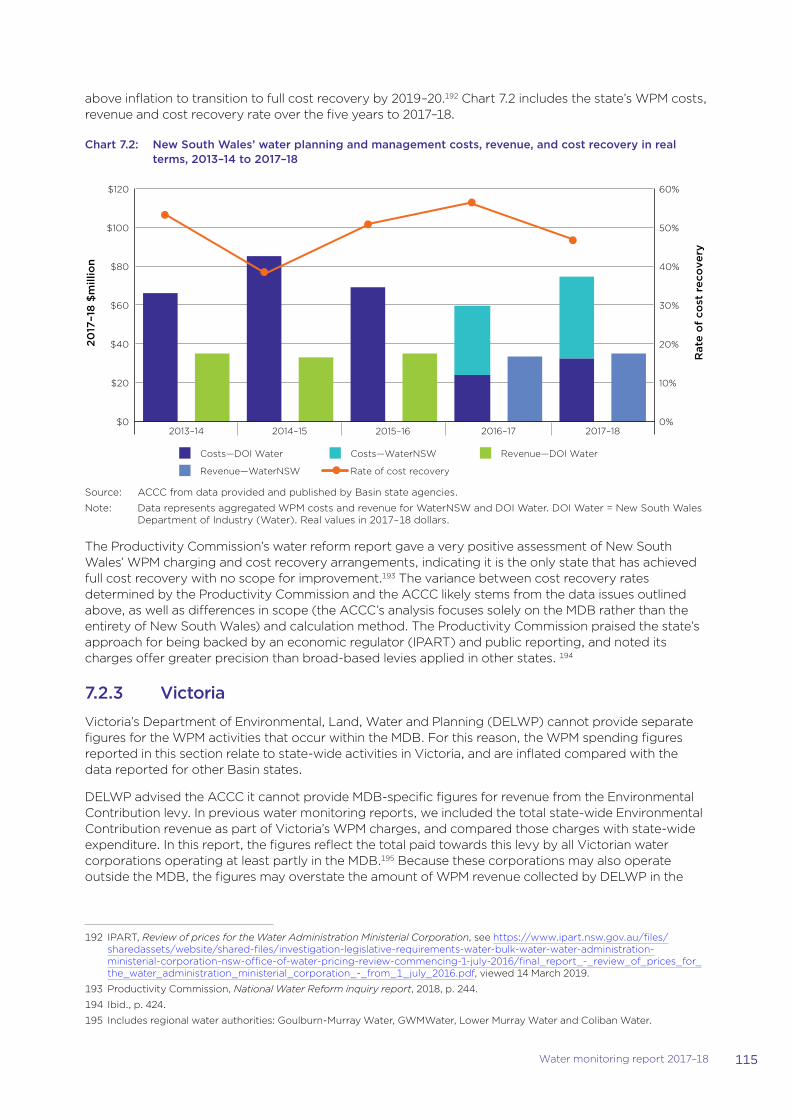
115Water monitoring report 2017–18
above inflation to transition to full cost recovery by 2019–20.192 Chart 7.2 includes the state’s WPM costs, revenue and cost recovery rate over the five years to 2017–18.
Chart 7.2: New South Wales’ water planning and management costs, revenue, and cost recovery in real terms, 2013–14 to 2017–18
0%
10%
20%
30%
40%
50%
60%
$0
$20
$40
$60
$80
$100
$120
Rat
e o
f co
st r
eco
very
2017
–18
$m
illio
n
Costs—DOI Water Costs—WaterNSW Revenue—DOI Water
Revenue—WaterNSW Rate of cost recovery
2013–14 2014–15 2015–16 2016–17 2017–18
Source: ACCC from data provided and published by Basin state agencies.
Note: Data represents aggregated WPM costs and revenue for WaterNSW and DOI Water. DOI Water = New South Wales Department of Industry (Water). Real values in 2017–18 dollars.
The Productivity Commission’s water reform report gave a very positive assessment of New South Wales’ WPM charging and cost recovery arrangements, indicating it is the only state that has achieved full cost recovery with no scope for improvement.193 The variance between cost recovery rates determined by the Productivity Commission and the ACCC likely stems from the data issues outlined above, as well as differences in scope (the ACCC’s analysis focuses solely on the MDB rather than the entirety of New South Wales) and calculation method. The Productivity Commission praised the state’s approach for being backed by an economic regulator (IPART) and public reporting, and noted its charges offer greater precision than broad-based levies applied in other states. 194
7.2.3 VictoriaVictoria’s Department of Environmental, Land, Water and Planning (DELWP) cannot provide separate figures for the WPM activities that occur within the MDB. For this reason, the WPM spending figures reported in this section relate to state-wide activities in Victoria, and are inflated compared with the data reported for other Basin states.
DELWP advised the ACCC it cannot provide MDB-specific figures for revenue from the Environmental Contribution levy. In previous water monitoring reports, we included the total state-wide Environmental Contribution revenue as part of Victoria’s WPM charges, and compared those charges with state-wide expenditure. In this report, the figures reflect the total paid towards this levy by all Victorian water corporations operating at least partly in the MDB.195 Because these corporations may also operate outside the MDB, the figures may overstate the amount of WPM revenue collected by DELWP in the
192 IPART, Review of prices for the Water Administration Ministerial Corporation, see https://www.ipart.nsw.gov.au/files/sharedassets/website/shared-files/investigation-legislative-requirements-water-bulk-water-water-administration-ministerial-corporation-nsw-office-of-water-pricing-review-commencing-1-july-2016/final_report_-_review_of_prices_for_the_water_administration_ministerial_corporation_-_from_1_july_2016.pdf, viewed 14 March 2019.
193 Productivity Commission, National Water Reform inquiry report, 2018, p. 244.
194 Ibid., p. 424.
195 Includes regional water authorities: Goulburn-Murray Water, GWMWater, Lower Murray Water and Coliban Water.
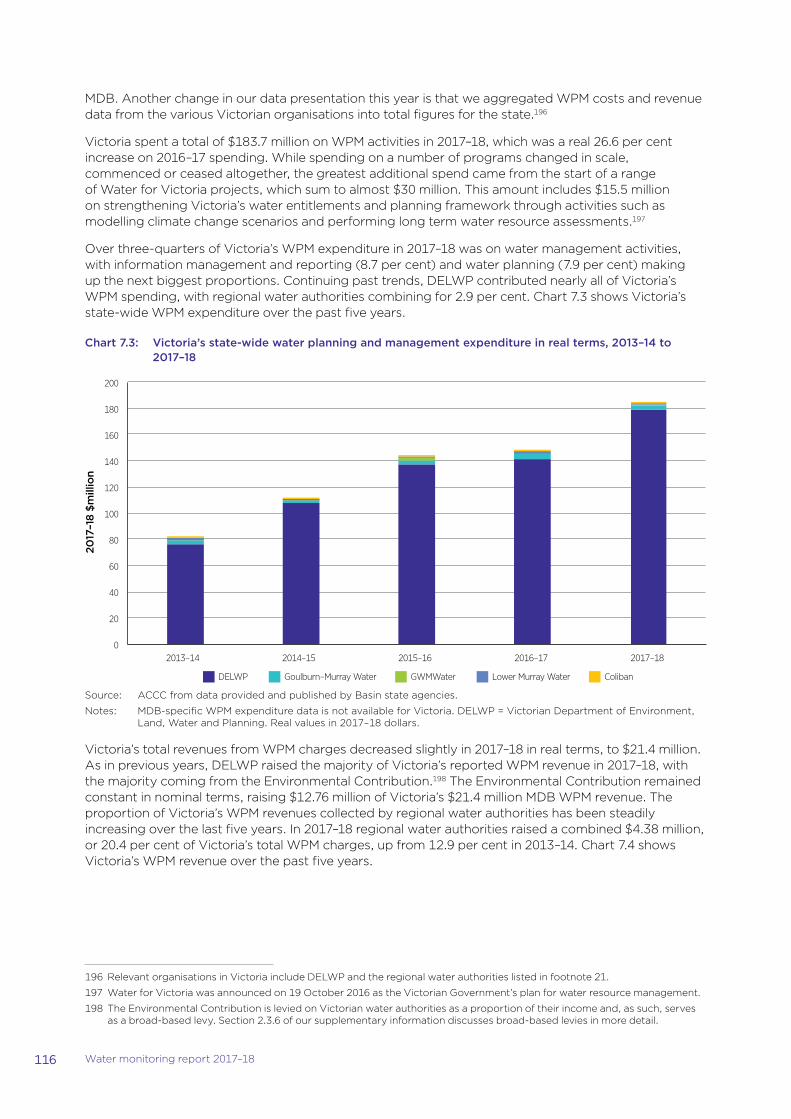
116 Water monitoring report 2017–18
MDB. Another change in our data presentation this year is that we aggregated WPM costs and revenue data from the various Victorian organisations into total figures for the state.196
Victoria spent a total of $183.7 million on WPM activities in 2017–18, which was a real 26.6 per cent increase on 2016–17 spending. While spending on a number of programs changed in scale, commenced or ceased altogether, the greatest additional spend came from the start of a range of Water for Victoria projects, which sum to almost $30 million. This amount includes $15.5 million on strengthening Victoria’s water entitlements and planning framework through activities such as modelling climate change scenarios and performing long term water resource assessments.197
Over three-quarters of Victoria’s WPM expenditure in 2017–18 was on water management activities, with information management and reporting (8.7 per cent) and water planning (7.9 per cent) making up the next biggest proportions. Continuing past trends, DELWP contributed nearly all of Victoria’s WPM spending, with regional water authorities combining for 2.9 per cent. Chart 7.3 shows Victoria’s state-wide WPM expenditure over the past five years.
Chart 7.3: Victoria’s state-wide water planning and management expenditure in real terms, 2013–14 to 2017–18
2017
–18
$mill
ion
0
20
40
60
80
100
120
140
160
180
200
2013–14 2014–15 2015–16 2016–17 2017–18
DELWP Goulburn–Murray Water GWMWater Lower Murray Water Coliban
Source: ACCC from data provided and published by Basin state agencies.
Notes: MDB-specific WPM expenditure data is not available for Victoria. DELWP = Victorian Department of Environment, Land, Water and Planning. Real values in 2017–18 dollars.
Victoria’s total revenues from WPM charges decreased slightly in 2017–18 in real terms, to $21.4 million. As in previous years, DELWP raised the majority of Victoria’s reported WPM revenue in 2017–18, with the majority coming from the Environmental Contribution.198 The Environmental Contribution remained constant in nominal terms, raising $12.76 million of Victoria’s $21.4 million MDB WPM revenue. The proportion of Victoria’s WPM revenues collected by regional water authorities has been steadily increasing over the last five years. In 2017–18 regional water authorities raised a combined $4.38 million, or 20.4 per cent of Victoria’s total WPM charges, up from 12.9 per cent in 2013–14. Chart 7.4 shows Victoria’s WPM revenue over the past five years.
196 Relevant organisations in Victoria include DELWP and the regional water authorities listed in footnote 21.
197 Water for Victoria was announced on 19 October 2016 as the Victorian Government’s plan for water resource management.
198 The Environmental Contribution is levied on Victorian water authorities as a proportion of their income and, as such, serves as a broad-based levy. Section 2.3.6 of our supplementary information discusses broad-based levies in more detail.
117Water monitoring report 2017–18
Chart 7.4: Victoria’s Murray–Darling Basin water planning and management revenue in real terms, 2013–14 to 2017–18
2017
–18
$mill
ion
$0
$5
$10
$15
$20
$25
2017–182016–172015–162014–152013–14
DELWP GWMWater Lower Murray Water Coliban Goulburn Murray Water
Source: ACCC from data provided and published by Basin state agencies.
Notes: Victoria’s WPM revenue data cannot be directly attributed to MDB operators, so the figures are approximations. DELWP = Victorian Department of Environment, Land, Water and Planning. Real values in 2017–18 dollars.
7.2.4 South AustraliaWith the proposed change in South Australia’s WPM approach not scheduled to take effect until 2018–19, there were minimal shifts in the state’s reported spending, revenue and cost recovery rate in 2017–18.
South Australia’s reported expenditure on WPM activities in the MDB remained stable for the third consecutive year, with a total spend of $40.32 million in 2017–18. As in previous years, the bulk of the state’s costs (76.2 per cent) was spent on water management activities, while the remainder was spent on water administration and regulation (11.4 per cent), water planning (10.5 per cent) and information management and reporting (1.8 per cent).
The biggest change in spending was the fall in Regions SA project spending to zero (from $2 million in 2016–17).199 This fall and other decreases were offset by a nearly $4 million nominal increase in MDBA state contributions (including corporate costs), from just under $21 million in the previous year to $24.6 million in 2017–18.
As in other years since 2015–16, the bulk (76.3 per cent) of South Australia’s WPM revenue collected from the MDB in 2017–18 came from the imposition of the River Murray Division 2 Natural Resource Management (NRM) Water Levies, which is primarily a fixed volumetric water access charge, but also includes a non-volumetric component. Almost all of South Australia’s WPM charges rose by 0.6 to 2.4 per cent in nominal terms.
From 2013–14 to 2017–18 South Australia recovered an estimated 45.4 per cent of its WPM charges in the MDB. Following the abolition of the Save the River Murray Fund in 2015, the state’s observed cost recovery rate fell from over 80 per cent to approximately 23 per cent, where it has remained steady. Chart 7.5 shows South Australia’s WPM costs, revenue and cost recovery rate over the past five years.
199 Regions SA forms part of the Primary Industries and Regions SA, an economic development agency in the South Australian Government. It aims to integrate and strengthen partnerships among local communities, businesses and industries, and all tiers of governments to improve economic and social outcomes for regions.
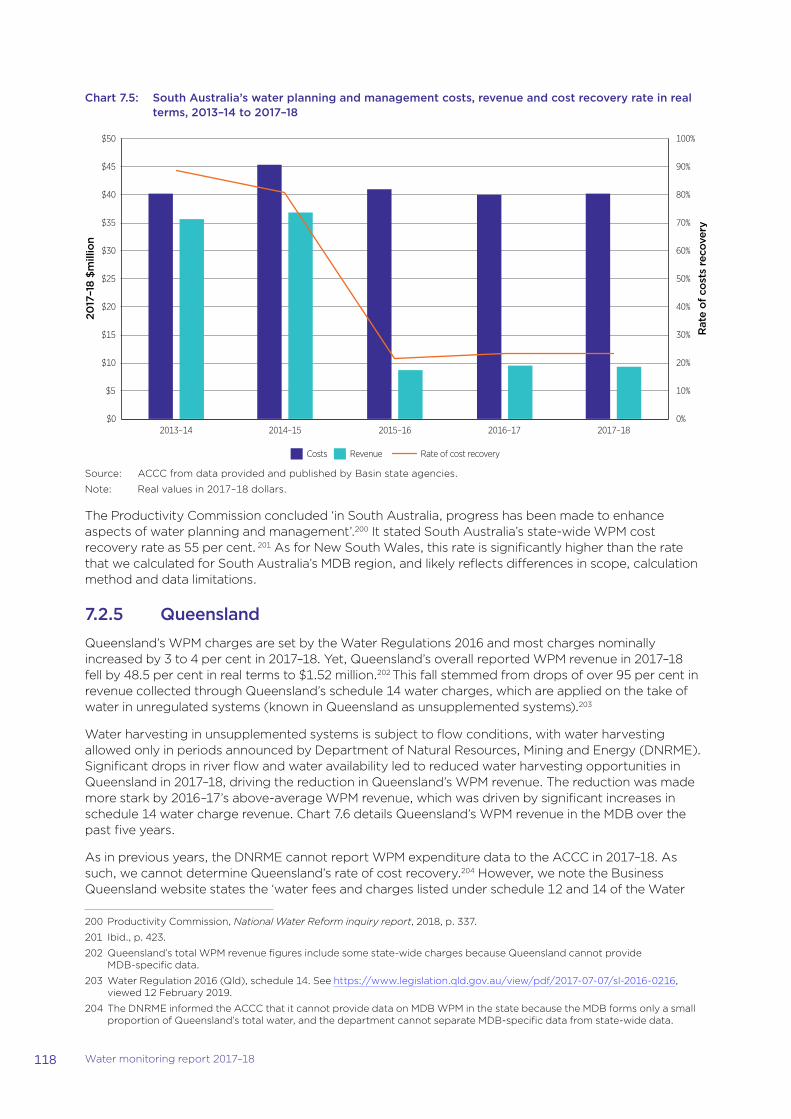
118 Water monitoring report 2017–18
Chart 7.5: South Australia’s water planning and management costs, revenue and cost recovery rate in real terms, 2013–14 to 2017–18
0%
10%
20%
30%
40%
50%
60%
70%
80%
90%
100%
$0
$5
$10
$15
$20
$25
$30
$35
$40
$45
$50
2013–14 2014–15 2015–16 2016–17 2017–18
Costs Revenue Rate of cost recovery
2017
–18
$mill
ion
Rat
e of
cos
ts r
ecov
ery
Source: ACCC from data provided and published by Basin state agencies.
Note: Real values in 2017–18 dollars.
The Productivity Commission concluded ‘in South Australia, progress has been made to enhance aspects of water planning and management’.200 It stated South Australia’s state-wide WPM cost recovery rate as 55 per cent. 201 As for New South Wales, this rate is significantly higher than the rate that we calculated for South Australia’s MDB region, and likely reflects differences in scope, calculation method and data limitations.
7.2.5 QueenslandQueensland’s WPM charges are set by the Water Regulations 2016 and most charges nominally increased by 3 to 4 per cent in 2017–18. Yet, Queensland’s overall reported WPM revenue in 2017–18 fell by 48.5 per cent in real terms to $1.52 million.202 This fall stemmed from drops of over 95 per cent in revenue collected through Queensland’s schedule 14 water charges, which are applied on the take of water in unregulated systems (known in Queensland as unsupplemented systems).203
Water harvesting in unsupplemented systems is subject to flow conditions, with water harvesting allowed only in periods announced by Department of Natural Resources, Mining and Energy (DNRME). Significant drops in river flow and water availability led to reduced water harvesting opportunities in Queensland in 2017–18, driving the reduction in Queensland’s WPM revenue. The reduction was made more stark by 2016–17’s above-average WPM revenue, which was driven by significant increases in schedule 14 water charge revenue. Chart 7.6 details Queensland’s WPM revenue in the MDB over the past five years.
As in previous years, the DNRME cannot report WPM expenditure data to the ACCC in 2017–18. As such, we cannot determine Queensland’s rate of cost recovery.204 However, we note the Business Queensland website states the ‘water fees and charges listed under schedule 12 and 14 of the Water
200 Productivity Commission, National Water Reform inquiry report, 2018, p. 337.
201 Ibid., p. 423.
202 Queensland’s total WPM revenue figures include some state-wide charges because Queensland cannot provide MDB-specific data.
203 Water Regulation 2016 (Qld), schedule 14. See https://www.legislation.qld.gov.au/view/pdf/2017-07-07/sl-2016-0216, viewed 12 February 2019.
204 The DNRME informed the ACCC that it cannot provide data on MDB WPM in the state because the MDB forms only a small proportion of Queensland’s total water, and the department cannot separate MDB-specific data from state-wide data.
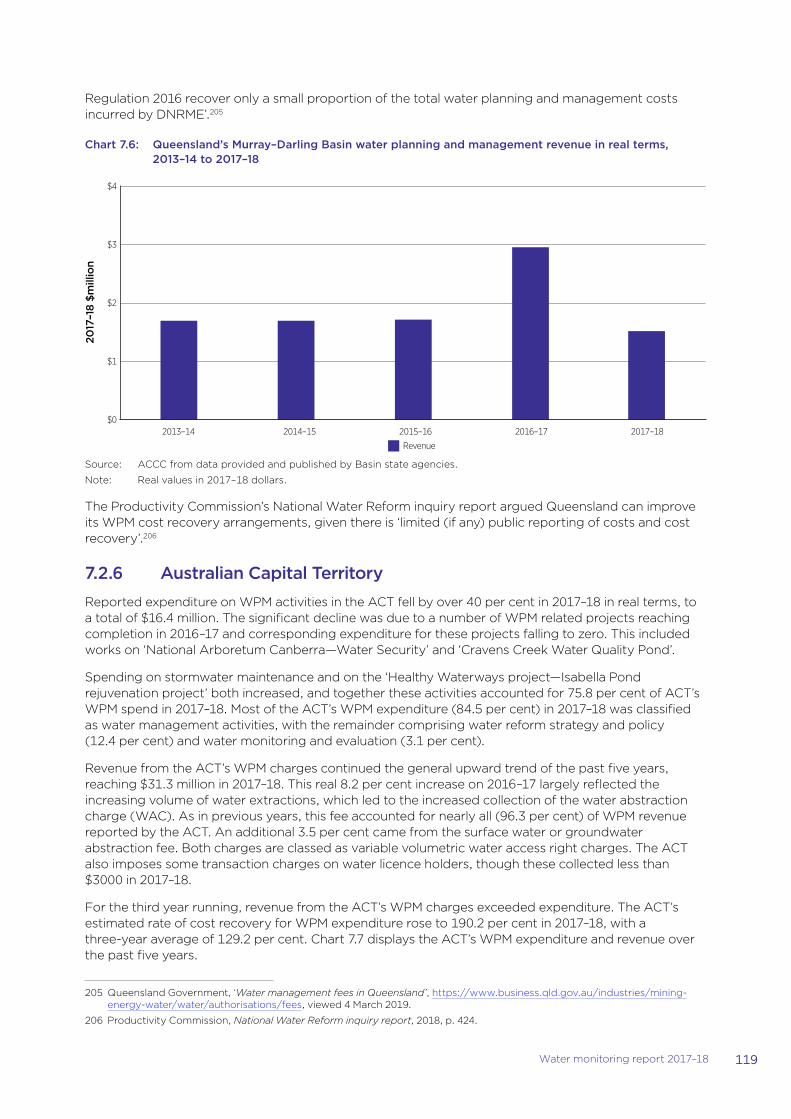
119Water monitoring report 2017–18
Regulation 2016 recover only a small proportion of the total water planning and management costs incurred by DNRME’.205
Chart 7.6: Queensland’s Murray–Darling Basin water planning and management revenue in real terms, 2013–14 to 2017–18
2017
–18
$mill
ion
$0
$1
$2
$3
$4
2013–14 2014–15 2015–16 2016–17 2017–18
Revenue
Source: ACCC from data provided and published by Basin state agencies.
Note: Real values in 2017–18 dollars.
The Productivity Commission’s National Water Reform inquiry report argued Queensland can improve its WPM cost recovery arrangements, given there is ‘limited (if any) public reporting of costs and cost recovery’.206
7.2.6 Australian Capital TerritoryReported expenditure on WPM activities in the ACT fell by over 40 per cent in 2017–18 in real terms, to a total of $16.4 million. The significant decline was due to a number of WPM related projects reaching completion in 2016–17 and corresponding expenditure for these projects falling to zero. This included works on ‘National Arboretum Canberra—Water Security’ and ‘Cravens Creek Water Quality Pond’.
Spending on stormwater maintenance and on the ‘Healthy Waterways project—Isabella Pond rejuvenation project’ both increased, and together these activities accounted for 75.8 per cent of ACT’s WPM spend in 2017–18. Most of the ACT’s WPM expenditure (84.5 per cent) in 2017–18 was classified as water management activities, with the remainder comprising water reform strategy and policy (12.4 per cent) and water monitoring and evaluation (3.1 per cent).
Revenue from the ACT’s WPM charges continued the general upward trend of the past five years, reaching $31.3 million in 2017–18. This real 8.2 per cent increase on 2016–17 largely reflected the increasing volume of water extractions, which led to the increased collection of the water abstraction charge (WAC). As in previous years, this fee accounted for nearly all (96.3 per cent) of WPM revenue reported by the ACT. An additional 3.5 per cent came from the surface water or groundwater abstraction fee. Both charges are classed as variable volumetric water access right charges. The ACT also imposes some transaction charges on water licence holders, though these collected less than $3000 in 2017–18.
For the third year running, revenue from the ACT’s WPM charges exceeded expenditure. The ACT’s estimated rate of cost recovery for WPM expenditure rose to 190.2 per cent in 2017–18, with a three-year average of 129.2 per cent. Chart 7.7 displays the ACT’s WPM expenditure and revenue over the past five years.
205 Queensland Government, ‘Water management fees in Queensland’, https://www.business.qld.gov.au/industries/mining-energy-water/water/authorisations/fees, viewed 4 March 2019.
206 Productivity Commission, National Water Reform inquiry report, 2018, p. 424.
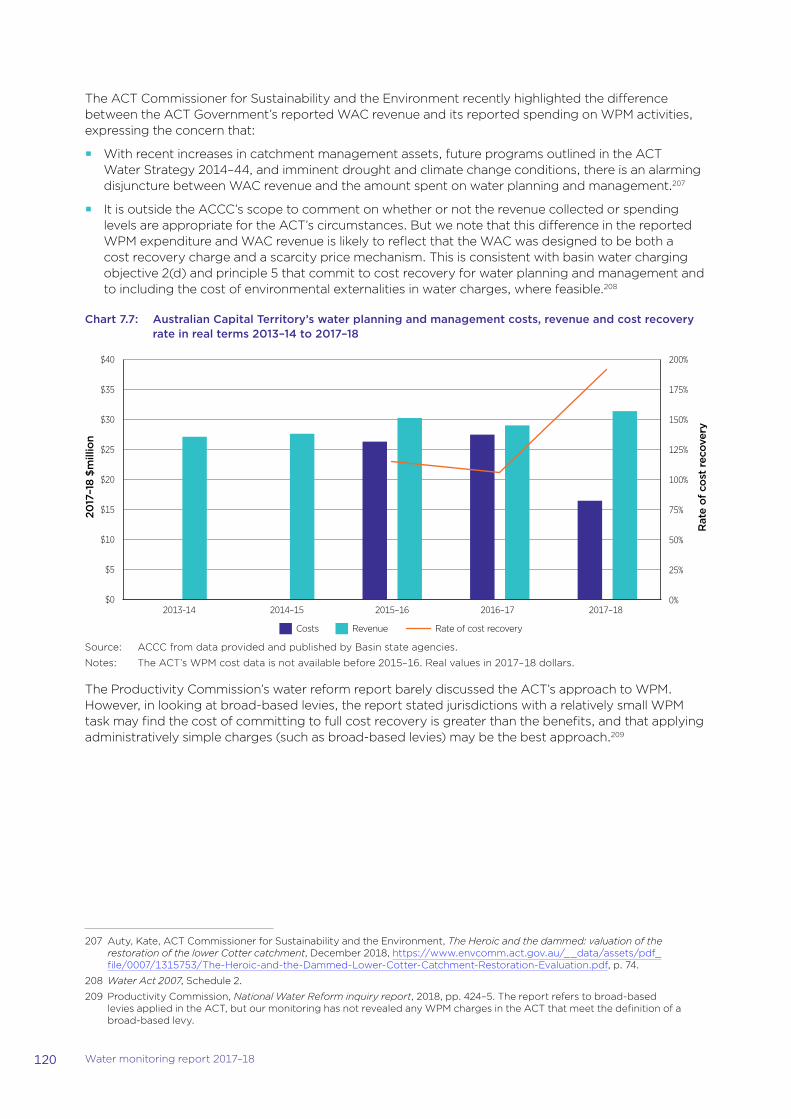
120 Water monitoring report 2017–18
The ACT Commissioner for Sustainability and the Environment recently highlighted the difference between the ACT Government’s reported WAC revenue and its reported spending on WPM activities, expressing the concern that:
�� With recent increases in catchment management assets, future programs outlined in the ACT Water Strategy 2014–44, and imminent drought and climate change conditions, there is an alarming disjuncture between WAC revenue and the amount spent on water planning and management.207
�� It is outside the ACCC’s scope to comment on whether or not the revenue collected or spending levels are appropriate for the ACT’s circumstances. But we note that this difference in the reported WPM expenditure and WAC revenue is likely to reflect that the WAC was designed to be both a cost recovery charge and a scarcity price mechanism. This is consistent with basin water charging objective 2(d) and principle 5 that commit to cost recovery for water planning and management and to including the cost of environmental externalities in water charges, where feasible.208
Chart 7.7: Australian Capital Territory’s water planning and management costs, revenue and cost recovery rate in real terms 2013–14 to 2017–18
2013-14 2014–15 2015–16 2016–17 2017–18
Costs Revenue Rate of cost recovery
2017
–18
$mill
ion
Rat
e of
cos
t re
cove
ry
$0
$5
$10
$15
$20
$25
$30
$35
$40
0%
25%
50%
75%
100%
125%
150%
175%
200%
Source: ACCC from data provided and published by Basin state agencies.
Notes: The ACT’s WPM cost data is not available before 2015–16. Real values in 2017–18 dollars.
The Productivity Commission’s water reform report barely discussed the ACT’s approach to WPM. However, in looking at broad-based levies, the report stated jurisdictions with a relatively small WPM task may find the cost of committing to full cost recovery is greater than the benefits, and that applying administratively simple charges (such as broad-based levies) may be the best approach.209
207 Auty, Kate, ACT Commissioner for Sustainability and the Environment, The Heroic and the dammed: valuation of the restoration of the lower Cotter catchment, December 2018, https://www.envcomm.act.gov.au/__data/assets/pdf_file/0007/1315753/The-Heroic-and-the-Dammed-Lower-Cotter-Catchment-Restoration-Evaluation.pdf, p. 74.
208 Water Act 2007, Schedule 2.
209 Productivity Commission, National Water Reform inquiry report, 2018, pp. 424–5. The report refers to broad-based levies applied in the ACT, but our monitoring has not revealed any WPM charges in the ACT that meet the definition of a broad-based levy.
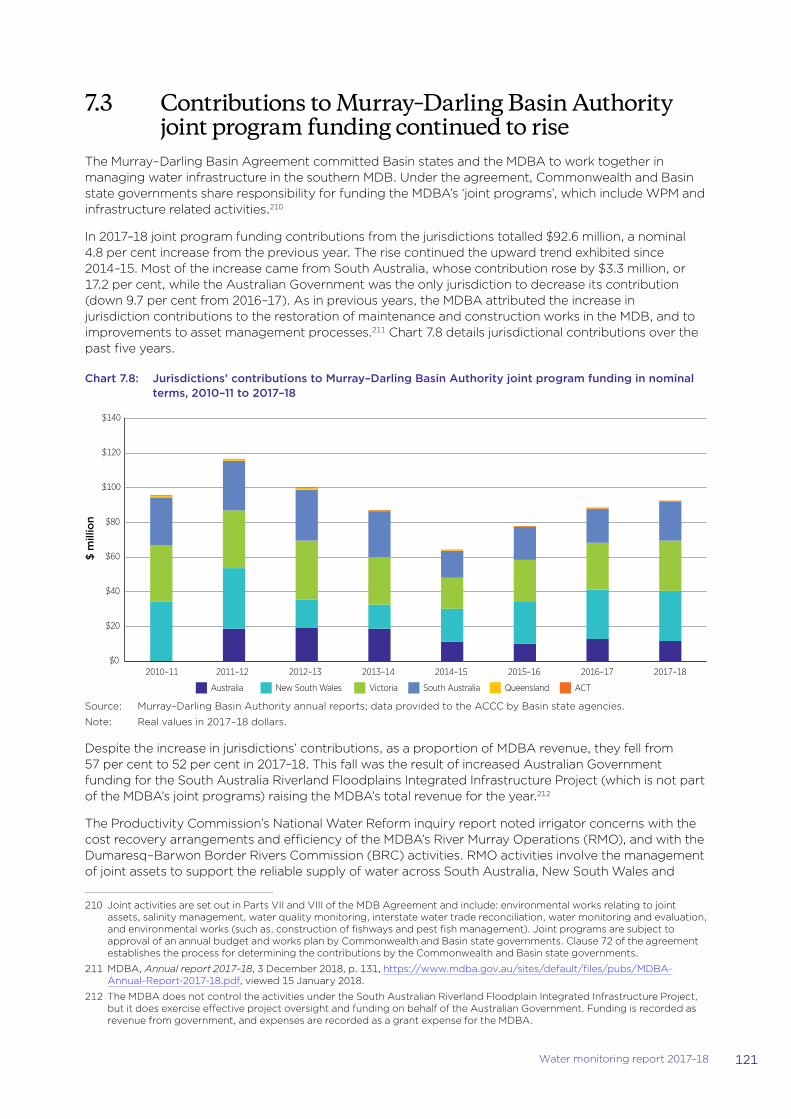
121Water monitoring report 2017–18
7.3 Contributions to Murray–Darling Basin Authority joint program funding continued to rise
The Murray–Darling Basin Agreement committed Basin states and the MDBA to work together in managing water infrastructure in the southern MDB. Under the agreement, Commonwealth and Basin state governments share responsibility for funding the MDBA’s ‘joint programs’, which include WPM and infrastructure related activities.210
In 2017–18 joint program funding contributions from the jurisdictions totalled $92.6 million, a nominal 4.8 per cent increase from the previous year. The rise continued the upward trend exhibited since 2014–15. Most of the increase came from South Australia, whose contribution rose by $3.3 million, or 17.2 per cent, while the Australian Government was the only jurisdiction to decrease its contribution (down 9.7 per cent from 2016–17). As in previous years, the MDBA attributed the increase in jurisdiction contributions to the restoration of maintenance and construction works in the MDB, and to improvements to asset management processes.211 Chart 7.8 details jurisdictional contributions over the past five years.
Chart 7.8: Jurisdictions’ contributions to Murray–Darling Basin Authority joint program funding in nominal terms, 2010–11 to 2017–18
$ m
illio
n
Australia New South Wales Victoria South Australia Queensland ACT
$0
$20
$40
$60
$80
$100
$120
$140
2010–11 2011–12 2012–13 2013–14 2014–15 2015–16 2016–17 2017–18
Source: Murray–Darling Basin Authority annual reports; data provided to the ACCC by Basin state agencies.
Note: Real values in 2017–18 dollars.
Despite the increase in jurisdictions’ contributions, as a proportion of MDBA revenue, they fell from 57 per cent to 52 per cent in 2017–18. This fall was the result of increased Australian Government funding for the South Australia Riverland Floodplains Integrated Infrastructure Project (which is not part of the MDBA’s joint programs) raising the MDBA’s total revenue for the year.212
The Productivity Commission’s National Water Reform inquiry report noted irrigator concerns with the cost recovery arrangements and efficiency of the MDBA’s River Murray Operations (RMO), and with the Dumaresq–Barwon Border Rivers Commission (BRC) activities. RMO activities involve the management of joint assets to support the reliable supply of water across South Australia, New South Wales and
210 Joint activities are set out in Parts VII and VIII of the MDB Agreement and include: environmental works relating to joint assets, salinity management, water quality monitoring, interstate water trade reconciliation, water monitoring and evaluation, and environmental works (such as, construction of fishways and pest fish management). Joint programs are subject to approval of an annual budget and works plan by Commonwealth and Basin state governments. Clause 72 of the agreement establishes the process for determining the contributions by the Commonwealth and Basin state governments.
211 MDBA, Annual report 2017–18, 3 December 2018, p. 131, https://www.mdba.gov.au/sites/default/files/pubs/MDBA-Annual-Report-2017-18.pdf, viewed 15 January 2018.
212 The MDBA does not control the activities under the South Australian Riverland Floodplain Integrated Infrastructure Project, but it does exercise effective project oversight and funding on behalf of the Australian Government. Funding is recorded as revenue from government, and expenses are recorded as a grant expense for the MDBA.
122 Water monitoring report 2017–18
Victoria. Dumaresq–Barwon BRC activities include responsibility for bulk water infrastructure in the Border Rivers region of New South Wales and Queensland.
The Productivity Commission called for improved transparency, scrutiny by economic regulators, and regular reviews to examine RMO and BRC activities. It cited South Australia as particularly needing to improve transparency in its recovery of RMO costs from water users.213 The Productivity Commission considered Basin states are best placed to implement these reviews and ensure transparent cost recovery, and recommended the states coordinate their approach.214
213 Productivity Commission, National Water Reform inquiry report, 2018, pp. 39, 237 and 252.
214 Ibid., p. 255.
08
Murray River in Hattah National Park Source: Corey Brown (Murray–Darling Basin Authority)
Operators largely complied with market and water charge rules
124 Water monitoring report 2017–18
8. Operators largely complied with water market and water charge rules
Key points
�� Strategic monitoring and enforcement of compliance underpins effective regulatory frameworks. Recent inquiries across a range of industries show public trust in regulation is essential to good compliance outcomes.
�� Compliance with the Water Market Rules 2009 and water charge rules (the Rules) administered by the ACCC (now in force for almost a decade) is generally good. During the year, we received 14 complaints and inquiries regarding the water charge rules, infrastructure operators (IOs) and water market intermediaries. More than half of these came from irrigators. The number of complaints is relatively low particularly when viewed against the 71 complaints received in 2011–12.
�� In 2017–18, we conducted three initial investigations (prompted by complaints or ACCC compliance reviews) of possible breaches of the water charge rules by IOs and two initial investigations into alleged breaches of the Australian Consumer Law (ACL). One of the initial ACL investigations is ongoing. No breaches of the Rules or ACL were found that resulted in serious detriment to irrigators or other stakeholders.
�� We will continue to work with irrigators and IOs to educate them about their rights and responsibilities, and the need for compliance with the Rules (including amendments), so as to ensure transparency of regulated water charges and confidence in the water market by all stakeholders.
�� In 2018–19, we will undertake monitoring and compliance activities that promote informed and well-functioning markets for water. We will focus on trade barriers relating to transformations, pricing transparency and stakeholder education about the rule changes that take effect on 1 July 2020.
This chapter reports on our rules-related compliance and enforcement activities and outcomes in 2017–18:
�� Section 8.1 describes our compliance overview for the period.
�� Section 8.2 summarises our 2017–18 observations and outcomes.
�� Section 8.3 outlines our activities to monitor and enforce the Water Market Rules 2009 and water charge rules (the Rules) and the Australian Consumer Law (ACL).
�� Section 8.4 explains our compliance priorities for 2018–19.
125Water monitoring report 2017–18
8.1 Compliance issues outside of the ACCC’s role received a lot of attention across the Murray–Darling Basin
Strategic monitoring and enforcement of compliance underpins effective regulatory frameworks. Recent inquiries across a range of industries215 show public trust in regulation is essential to good compliance outcomes. As the Murray–Darling Basin Authority (MDBA) noted:
An effective and fair compliance system is critical to a healthy, sustainable Murray–Darling Basin. It underpins the integrity of water resource plans, environmental watering, water property rights and the water market.216
In 2017–18, compliance issues in the Murray–Darling Basin (MDB) were the focus of significant public attention. Prominent media coverage featured allegations of water theft, corruption and alarm about meeting Murray–Darling Basin Plan timeframes, water recovery targets and other requirements (see chapter 2). These matters fall outside the ACCC’s compliance role.
The ACCC is responsible for enforcing the rules made under Part 4 of the Water Act 2007 (Water Act)—namely the water market rules, and the water charge rules, which collectively refers to the Water Charge (Termination Fees) Rules 2009, the Water Charge (Infrastructure) Rules 2010, and the Water Charge (Planning and Management Information) Rules 2010.217 To monitor compliance with these Rules, we use information collected through routine monitoring, information requests, and complaints and enquiries we receive. We can also enforce IOs’ and water market intermediaries’ compliance with the fair trading requirements of the Competition and Consumer Act 2010 (Cth). We refer complaints about matters that may breach the Basin Plan Water Trading Rules218 to the MBDA.
Our 2017–18 assessment showed compliance with the water market rules and the water charge rules was generally good, based on the number of complaints received and the number and types of breaches of the Rules (and the ACL) we identified. The Rules have been in place for almost a decade and monitored and enforced by the ACCC over that time, so we now expect high levels of compliance by infrastructure operators (IOs). Following the Minister for Agriculture and Water Resource’s April 2019 decision to amend the Rules, we will help IOs to understand the changes and comply with their obligations under the Rules.
8.2 While complaints and enquiries rose, we did not identify any rule breaches resulting in serious detriment
We received 14 complaints and enquiries from water stakeholders in 2017–18, more than half of these from irrigators. While we received more complaints and enquiries in 2017–18 than in 2016–17, Rule related complaints and enquiries have declined markedly since 2011–12 (table 8.1).
215 For example, Royal Commission into Misconduct in the Banking, Superannuation and Financial Services Industry, https://financialservices.royalcommission.gov.au/Pages/default.aspx, viewed 1 April 2019.
216 Murray–Darling Basin Authority, The Murray–Darling Basin Water Compliance Review, 2018, p. 11, available at: www.mdba.gov.au/sites/default/files/pubs/MDB-Compliance-Review-Final-Report.pdf, viewed 21 February 2019.
217 For more information about these Rules, see section 1.2 of the Water Monitoring Report: supplementary Information, 2017–18 available on the ACCC website.
218 The Water Trading Rules are set out in chapter 12 of the Murray–Darling Basin Plan, and enforced by the MDBA.
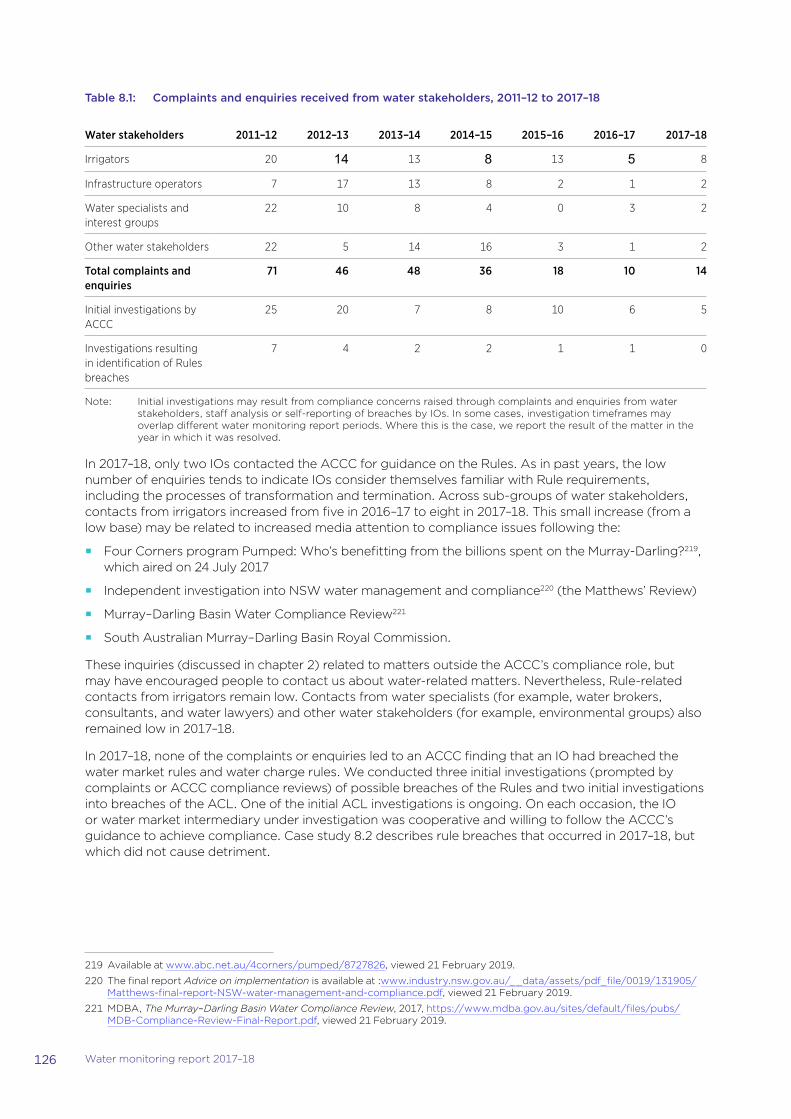
126 Water monitoring report 2017–18
Table 8.1: Complaints and enquiries received from water stakeholders, 2011–12 to 2017–18
Water stakeholders 2011–12 2012–13 2013–14 2014–15 2015–16 2016–17 2017–18
Irrigators 20 14 13 8 13 5 8
Infrastructure operators 7 17 13 8 2 1 2
Water specialists and interest groups
22 10 8 4 0 3 2
Other water stakeholders 22 5 14 16 3 1 2
Total complaints and enquiries
71 46 48 36 18 10 14
Initial investigations by ACCC
25 20 7 8 10 6 5
Investigations resulting in identification of Rules breaches
7 4 2 2 1 1 0
Note: Initial investigations may result from compliance concerns raised through complaints and enquiries from water stakeholders, staff analysis or self-reporting of breaches by IOs. In some cases, investigation timeframes may overlap different water monitoring report periods. Where this is the case, we report the result of the matter in the year in which it was resolved.
In 2017–18, only two IOs contacted the ACCC for guidance on the Rules. As in past years, the low number of enquiries tends to indicate IOs consider themselves familiar with Rule requirements, including the processes of transformation and termination. Across sub-groups of water stakeholders, contacts from irrigators increased from five in 2016–17 to eight in 2017–18. This small increase (from a low base) may be related to increased media attention to compliance issues following the:
�� Four Corners program Pumped: Who’s benefitting from the billions spent on the Murray-Darling?219, which aired on 24 July 2017
�� Independent investigation into NSW water management and compliance220 (the Matthews’ Review)
�� Murray–Darling Basin Water Compliance Review221
�� South Australian Murray–Darling Basin Royal Commission.
These inquiries (discussed in chapter 2) related to matters outside the ACCC’s compliance role, but may have encouraged people to contact us about water-related matters. Nevertheless, Rule-related contacts from irrigators remain low. Contacts from water specialists (for example, water brokers, consultants, and water lawyers) and other water stakeholders (for example, environmental groups) also remained low in 2017–18.
In 2017–18, none of the complaints or enquiries led to an ACCC finding that an IO had breached the water market rules and water charge rules. We conducted three initial investigations (prompted by complaints or ACCC compliance reviews) of possible breaches of the Rules and two initial investigations into breaches of the ACL. One of the initial ACL investigations is ongoing. On each occasion, the IO or water market intermediary under investigation was cooperative and willing to follow the ACCC’s guidance to achieve compliance. Case study 8.2 describes rule breaches that occurred in 2017–18, but which did not cause detriment.
219 Available at www.abc.net.au/4corners/pumped/8727826, viewed 21 February 2019.
220 The final report Advice on implementation is available at :www.industry.nsw.gov.au/__data/assets/pdf_file/0019/131905/Matthews-final-report-NSW-water-management-and-compliance.pdf, viewed 21 February 2019.
221 MDBA, The Murray–Darling Basin Water Compliance Review, 2017, https://www.mdba.gov.au/sites/default/files/pubs/MDB-Compliance-Review-Final-Report.pdf, viewed 21 February 2019.
127Water monitoring report 2017–18
Case study 8.1: Schedule of charges must be updated prior to changes
The Victorian IOs (Goulburn–Murray Water, Lower Murray Water, GWMWater and Coliban Water) did not comply with rules 7, 12 and 15 of the Water Charge (Infrastructure) Rules 2010. In particular, they could not publish and give their customers their 2018–19 Schedule of Charges 10 business days before the schedules commenced on 1 July 2018. This was because the Essential Services Commission Victoria (ESC) did not release its decision on the regulatory period commencing 1 July 2018 until 19 June 2018.
Although this was a breach of the Rules, we did not take enforcement action against the IOs. This response was appropriate because the potential detriment was low (the ESC’s decision was available publicly on the ESC website as soon it was released) and the IOs updated their schedules of charges within a reasonable period after the ESC published its decision.
Our final advice to the Australian Minister for Agriculture and Water Resources about the review of water charge rules222 recommended amending these timing requirements. Our changes recommended an IO would be taken to have complied with the timing requirements if they released their schedule of charges as soon as practicable after charges the IO was required to pass through had been approved or determined by the relevant body (for example, ESC in Victoria, or the Independent Pricing and Regulatory Tribunal in New South Wales). The Minister recently announced he intended to make changes to give effect to this part of our advice on amendments to the water charge rules schedule of charge requirements, effective from 1 July 2020.223
8.3 We use our resources to build a culture of compliance
Since the Rules commenced, we have monitored compliance by using information from relevant Basin state departments, monitoring information requests, self-reported identification, complaints and enquiries. Under the Water Act, the Rules apply to all entities that meet the definition of ‘infrastructure operator’.224 They also apply to Basin state agencies in some cases. To monitor compliance with the Rules in 2017–18, we:
�� requested information from 52 IOs and Basin states water management departments to assess their compliance with the Rules
�� reviewed IO and Basin states responses to these requests for information
�� investigated complaints.
Our compliance strategy aims to support the water charging objectives, and water market and trading objectives in the Water Act.225 That is, through our monitoring and enforcement of the rules, we aim to:
�� promote efficient operating water markets and minimise the transaction costs of water trades
�� ensure all water users have reasonable opportunities to access water markets, and are not unreasonably restricted from trading their water rights
�� achieve pricing transparency
�� provide appropriate protection of third party interests.
222 ACCC, Review of the Water Charge Rules final advice, 2016,www.accc.gov.au/system/files/ACCC%20Review%20of%20the%20water%20charge%20rules%20-%20Final%20Advice.pdf, viewed 21 February 2019.
223 See Water Charge Amendment Rules 2019, available at: http://www.agriculture.gov.au/water/markets, viewed 21 February 2019.
224 The Water Charge (Termination Fees) Rules 2009 and the Water Market Rules 2009 apply only to irrigation infrastructure operators (IIOs). An IIO is an infrastructure operator that operates water service infrastructure for the primary purpose of being used for irrigation.
225 See Schedules 1 and 2 of the Water Act 2007.
128 Water monitoring report 2017–18
Our approach aims to foster a culture of compliance among regulated entities. This approach reduces the risk that IOs’ policies or conduct may contravene the Rules or the ACL, and potentially harm water users or impede water trading.
We foster this compliance culture by undertaking targeted compliance and enforcement activities to:
�� ensure IOs understand their obligations under the Rules and provide accurate and relevant information to their customers
�� assist IOs (particularly smaller operators) to comply with the Rules
�� ensure water users understand their rights under the Rules and how to contact the ACCC if they consider their IO or water market intermediary has breached the Rules or the ACL.
If we identify practices that may breach the Rules or the ACL, we first try to engage cooperatively with stakeholders rather than proceeding immediately to enforcement (unless the circumstances warrant a different approach). In particular, if there is limited or no detriment and there are other mitigating factors, we are more likely to resolve compliance concerns administratively than through enforcement action. In this way, we aim to achieve positive compliance outcomes.226 We also encourage operators to voluntarily disclose breaches rather than waiting for the ACCC to investigate customer complaints.
Key elements of our compliance strategy include education (through updated guidance and consolidating stakeholder relationships), monitoring emerging water market changes and taking compliance or enforcement action where a breach of the Rules gives rise to detriment. The factors below inform our approach to compliance:
�� The Rules have now been in force for around 10 years and operators stated they generally believe they have a good knowledge of the Rules.
�� We receive very few complaints about operators or state government water management departments who have breached the Rules or the ACL.
�� Mostly, when we have detected a breach of the Rules or the ACL:
– we have generally assessed the breach to have low potential detriment to customers
– operators have generally fully cooperated with our enquiries.
�� Operators have required staff to undergo new compliance training, and have established new procedures to ensure future compliance with the Rules.
�� Generally, smaller operators have fewer resources to ensure their staff have a good knowledge of the Rules.
�� Some irrigators may not know about the Rules, or fully understand their rights under the Rules.
�� Some of our publications about the Rules will require updating to reflect amendments made by the Minister.
8.4 We will support IOs to comply with new rule requirements
In 2018–19 we will undertake monitoring and compliance activities that promote informed and well-functioning markets for water (and related rights and services). In particular, we will focus on:
�� educating stakeholders about new or amended requirements arising from the recent changes to the regulatory framework
�� identifying, removing or reducing barriers to trade of irrigation rights and water delivery rights
�� promoting pricing transparency, user pays principles and cost recovery.
226 The principles adopted by the ACCC to achieve compliance, and tools available to it, are set out in our Enforcement guide—water market and water charge rules, available at: www.accc.gov.au/regulated-infrastructure/water/water-guides.

129Water monitoring report 2017–18
In 2019 we plan to review our publications to update them and make them more accessible. This process will improve water stakeholders’ awareness of their rights and responsibilities under the ACL and the Rules. Updating the publications may also help improve stakeholders’ knowledge of the Rules.
We will begin with updating our guidance on the water charge rules following changes being made to those rules in April 2019. We will continue to help IOs (particularly smaller IOs who may have fewer resources) to comply with the Rules.
Our updated publications will help water users to understand their rights under the Rules and know how to contact us if they consider their IO or water market intermediary has breached the Rules or the ACL.

130 Water monitoring report 2017–18
09
GMW Connections Project Stage 2—Automated flume gate regulators on main water supply channel Source: Department of Agriculture and Water Resources
Our monitoring in the Murray–Darling Basin helps water and related markets function effectively
132 Water monitoring report 2017–18
9. Our monitoring in the Murray–Darling Basin helps water and related markets function effectively
Key points
�� The ACCC has a number of roles in the Murray–Darling Basin, including monitoring regulated water charges, transformations and terminations, and producing a report for the Minister. This is our ninth annual report.
�� Both on and off-river infrastructure operators (IOs) are generally regarded as monopolies. This is because competition is unlikely to develop between these IOs as they generally operate in geographically exclusive markets for water harvesting, storage and/or delivery services.
�� Our monitoring helps highlight where IOs may be exercising their market power over irrigators and other customers and assists policy makers to determine the appropriate form of regulation for these monopolies.
�� We also facilitate effective water (and related) markets by monitoring and enforcing compliance with the water charge and market rules. Due to their monopoly position, IOs can, and have incentive to, prevent or unreasonably delay trade or transformation requests and increase the cost of termination.
�� This report uses a range of sources to assess the state of the water market and regulated water charges. We collect data from IOs and Basin states. We also use information from reports and other sources published by a number of Australian Government departments and agencies, academia and industry consultants.
The Murray–Darling Basin (MDB) is Australia’s largest and most complex river system and home to what many regard as the most important agricultural region. While the region was experiencing severe drought during 2017–18, it normally produces around $22 billion of food and fibre each year.
The ACCC has a number of roles in the MDB including monitoring. Our monitoring role encompasses assessing regulated water charges, transformation and terminations and related matters in the MDB.
This chapter outlines why and how we monitor these matters:
�� Section 9.1 describes the basis for our monitoring role and outlines some of the benefits and limitations of monitoring.
�� Section 9.2 outlines how we prepare the report and the information sources we use.
9.1 The Water Act 2007 requires us to monitor in the Murray–Darling Basin
We are required to monitor water charges and compliance with the water charge rules and provide a report to the Minister under powers set out in the Water Act 2007 (the Water Act).227 Our first water monitoring report was for the financial year 2009–10. This 2017–18 report will be the ninth.
Our monitoring role aims to support the Water Act’s multiple policy objectives. The Basin water charging objectives and principles, and the Basin water market and trading objectives and principles underpin the Water Act’s regulatory framework.
Some of these objectives specifically related to our monitoring role in the MDB include:
�� achieving pricing transparency and cost recovery
227 Sections 94(1) and 99(1) outlines the ACCC’s monitoring responsibilities in the MDB.
133Water monitoring report 2017–18
�� facilitating effective and efficient markets
�� the removal of barriers to trade
�� giving effect to user pays principles.
These objectives take effect through the Water Market Rules 2009 and the water charge rules (the Rules). We contribute to achieving these objectives by the collection and dissemination of data from Basin state departments and on and off-river infrastructure operators (IOs) and we publicly reporting the results. The public reporting of our results disseminates information about these entities that otherwise may not be widely available and provides for a greater level of transparency for monopoly IOs in the MDB.
9.1.1 Monitoring regulated water charges can highlight the exercise of market power
Both on and off-river infrastructure operators (IOs) are generally regarded as monopolies. This is because competition is unlikely to develop between these IOs as they normally operate in geographically exclusive markets for water harvesting, storage and delivery services. Without competition, the potential increases for prices, quality of service and innovation to diverge from efficient levels.
Our monitoring of on-river IOs shows the impact of regulated pricing decisions on their charges (under the Water Charge (Infrastructure) Rules 2010 (WCIR) framework, for New South Wales and Victorian IOs, and under state law in Queensland). For member-owned and smaller off-river IOs, the WCIR framework does not directly restrict them from increasing their off-river charges and/or decreasing service levels.
Our monitoring is an important source of information on how an IO’s charges compare to similar operators. It can highlight when IOs exercise their market power over irrigators and other customers and help policy makers determine whether there is a need to regulate.
9.1.2 Monitoring of transformation arrangements can identify where barriers to trade persist
We also monitor and enforce the water market rules in regard to transformations and trade. The transformation process occurs when an irrigator converts their entitlement to water under an irrigation right into a separate water access entitlement. This provides more flexibility for the irrigator to make decisions to trade water outside of an irrigation network. Due to their monopoly position, IOs are in a position and have incentives to prevent or unreasonably delay transformation and associated trade requests from irrigators.
9.1.3 Monitoring compliance helps us enforce the Rules and protect against market power
We monitor compliance with the Rules by assessing the data collected direct from IOs. Other sources that help with our compliance monitoring include complaints from irrigators, inquiries and the examination of other information published by other government agencies.
The ACCC’s monitoring ensures IOs and Basin state and territory departments understand their obligations under the Rules and also helps to identify when the Rules may not be working as intended. Rectifying non-compliance is critical for consumers of IOs and helps to protect consumers from abuse of market power by monopoly IOs.
9.1.4 Other ACCC roles under the Water Act 2007 and the Competition and Consumer Act 2010
The Water Act also provides for an enforcement and advisory role. We are responsible for enforcing compliance with the water charge rules and the Water Market Rules and part 8 of the Water Act allows
134 Water monitoring report 2017–18
for a number of enforcement actions to address any non-compliance.228 Our advisory role includes advice to the responsible Minister on water charge rule changes and water trading rules. Sections 42 and 46 of the Water Act requires the Murray–Darling Basin Authority (MDBA) to consult with the ACCC (among others) on making or amending the water trading rules.
We also responsible for enforcing the Competition and Consumer Act 2010 to promote competition and fair trade in rural water markets. A component of this enforcement is the education of stakeholders (particularly for the smaller IOs) to improve understanding of their rights and responsibilities under this Act. We also publish guides on the Rules and fair trading obligations for water brokers.
9.2 Sources of information for the report9.2.1 We draw on various sources of informationWe draw on a number of sources to produce our report including:
�� data collected directly from 32 on- and off-river IOs and six Basin states and territories
�� IO schedules of charges and irrigation infrastructure operator (IIO) transformation policies from their websites
�� data and information from inquiries, complaints and contacts with IOs, irrigators and industry participants including water brokers and peak associations
�� data, photos and other information sourced from government agencies such the MDBA, Australian Bureau of Agriculture and Resource Economics and Sciences, Bureau of Meteorology, Department of the Environment and Energy, Victorian Water Register and WaterNSW
�� academic literature, independent reports from industry consultants and media articles.
9.2.2 We consider respondent burdenWe seek to minimise the respondent burden our information requests create and consider ways to reduce the time required to respond to these requests. For this report, we introduced a new pricing change tab that allowed respondents to provide explanations for price movements of greater than 10 per cent to minimise follow up inquiries and reduce overall respondent burden.
9.2.3 We use the information to analyse trends, assess compliance and report observations
As noted, the data collected from Basin state agencies, on-river and most off-river IOs is used to create hypothetical bills so as to compare average charges. Other information collected including transformations, terminations and trade enable us to assess the state of the water market and highlight possible areas of concern and their compliance with the rules.
9.2.4 This report continues to evolveThis year’s report includes expanded coverage of policy matters, water markets related issues and IIO charging arrangements. We have restructured the reporting of information on Basin state water planning and management charges. We have published material explaining the rural water framework and how water charging works in the MDB, formerly contained in appendices to the report, as a web-only document: the ACCC Water monitoring report: supplementary information, 2017–18.
228 Water Act 2007, s. 100A.