Embed Size (px)
Citation preview

Central Research Institute for Dryland AgricultureCentral Research Institute for Dryland AgricultureSantoshnagar, Hyderabad Santoshnagar, Hyderabad –– 500 059, INDIA500 059, INDIA
Y. S. RamakrishnaY. S. RamakrishnaDirectorDirector
&&G.G.S.NG.G.S.N.Rao.RaoPC (PC (AgrometAgromet))
Water Management - Water Use in Rainfed Regions of India

each drop counts
Water- Elixir of life

INDIA’S SHARE IN GLOBAL RESOURCESINDIA’S SHARE IN GLOBAL RESOURCES
Human ResourceHuman Resource 16.0%16.0%
Land ResourceLand Resource 2.45%2.45%
Water ResourceWater Resource 4.00%4.00%
Livestock ResourceLivestock Resource 15.0%15.0%

India is blessed with large rainfall for its size
432Ground water
690Surface water
1122Estimated utilizable water
1967Per capita water availability
1869Annual potential flow in rivers
4000Annual rainfall (1200mm)
Quantity (km3)
Source

113.5 m.haPotential Irrigable area
53.0%Ground water
40.5%Surface water
54.0 m.haNet Irrigated Area
Despite large area under irrigation stress during crop growth is unavoidable

India- Rainfed Region
Irrigated area (> 30% irrigation)
Rainfed area (< 30% irrigation )
54.0 m.ha
75.14 m.ha
Net Irrigated area
Gross irrigated area
85.7 m.haNet Rainfed area
139.7 m.haNet cultivated area
328.7 m.haGeographical area

Irrigated area Irrigated area Irrigated area Irrigated area(1000 ha) (1000 ha) (1000 ha) (1000 ha)
INDIA, NORTH INDIA, SOUTH (Andra INDIA, WEST INDIA, EAST Barley 125 92 158Cotton 1749 466 1671Fruits 444 278 417 250Groundnut 600 224 72Maize 413 303 523 138Millet 363 266 459 121Potatoes 147 92 138 83Pulses 1309 141 1839 248Rapeseed 154 302 56Rice 6,786 7,004 1,970 6,129Sorghum 305 224 387 102Soybean 286 179 268 161Sugarcane 1650 809 777Vegetables 394 246 369 222Wheat 6,526 204 9,994 3,671All irrigated crops 20,651 10,905 19,496 11,251Equipped for irrigation 16,032 10,020 15,030 9,018Cropping intensity 129 109 130 125
Status of irrigation facility across the country - India
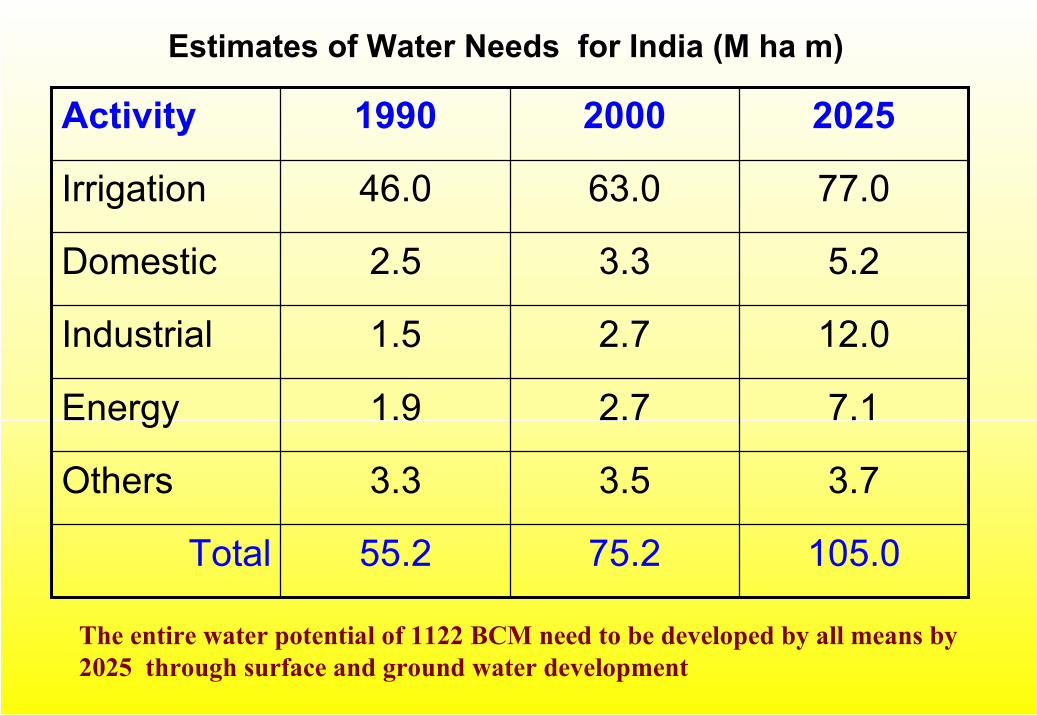
Estimates of Water Needs for India (M ha m)
105.075.255.2Total
3.73.53.3Others
7.12.71.9Energy
12.02.71.5Industrial
5.23.32.5Domestic
77.063.046.0Irrigation
202520001990Activity
The entire water potential of 1122 BCM need to be developed by all means by 2025 through surface and ground water development

Predominant Rainfed Predominant Rainfed CropsCrops
ÿÿ
ÿÿ
ÿ
ÿ
ÿÿ
ÿÿ
ÿ
ÿ
ÿ
ÿ
ÿ
ÿ
ÿÿ
ÿ
ÿ
ÿ
ÿÿ
VARANASI
REWA
RAJKOT INDORE
AKOLA
SOLAPUR
BIJAPUR
HYDERABAD
BELLARYANANTAPUR
BANGALORE
KOVILPATTI
DANTIWADA
ARJIA
AGRA
HISSAR
JODHUPUR
FIZABAD
PHULBANI
RANCHI
JHANSI
RAKH DHIANSAR
BALLOWAL - S
Wheat
Fruits & Vegetables
Pigeonpea
Maize
HorsegramGreengram
Fingermillet
ChickpeaCotton
Blackgram
PearlmilletSorghum
SunflowerSoybean
Rapeseed Mustard
Rice
Groundnut
CastorIrrigated AreaUn accounted area
14%Wheat
67%Cotton
93%Greengram
94%Blackgram
78%Chickpea
96%Pigeonpea
96%Castor
97%Linseed
96%Sesame
99%Safflower
76%Sunflower
36%Rapeseed mustard
97%Soybean
80%Groundnut
46%Rice
76%Maize
90%Fingermillet
94%Pearlmillet
91%Sorghum

Efficient water management
A crucial issue for meeting future agricultural production needs
Because ……

• Extreme spatial and temporal variability in rainfall
• Evaporative demand is higher than rainfall during greater part of the year
• Drought and water scarcity is a constant threat
• Greater expansion of ground water irrigation
• Poor ground water quality (saline / brackish water)
• Deterioration of soil health in the intensively cultivated areas
• Low rainwater use efficiency and low crop productivity
• Dominance of small and marginal farmers
• Stubborn poverty and food insecurity
Water management related problems in rainfed areas

Ground water status
7270984562.564India
6030.150.52.84.79.3Madhya Pradesh11
5842.472.71.42.43.3West Bengal10
7057.582.52.33.34Andhra Pradesh9
6961.087.82.53.64.1Bihar8
Safe exploitation
5760.7107.11.732.8Tamilnadu7
7785.9112.31418.316.3Uttar Pradesh6
7289.2124.33.34.63.7Maharashtra5
6196.4157.12.74.42.8Gujarat4
96153.3160.02.32.41.5Haryana3
90196.6217.25.76.32.9Punjab2
66211.1322.23.85.81.8Rajasthan1
(c/b)(c/a)(b/a)Over exploited
Utilisation with reference to potential created (%)
Utilisation with reference to ultimate potential (%)
Potential created with reference to ultimate potential (%)
Utilsed(m.ha)
(c)
Created (m.ha)
(b)
Ultimate(m.ha)
(a)
StateS.no

Surface Water Status
58407071217.3India
4538850.51.11.3West Bengal7
58581000.71.21.2Tamilnadu6
50501000.511Orissa5
6750750.60.91.2Maharashtra4
5833570.71.22.1Madhya Pradesh3
6356890.50.80.9Karnataka2
5848831.11.92.3Andhra Pradesh1
Safe exploitation
Utilisationwith reference to potential created (%)
Utilisationwith reference to ultimate potential (%)
Potential created with reference to ultimate potential (%)
Utilisedpotential (m. ha)
Potential Created (m. ha)
Ultimate potential (m.ha)
StateS.no

Rainwater Management: Core of WS management in RF Areas
Integrate conservation and production technologies with watershed as a unit of management
Ensure maximum in situ rainwater conservation
Harvest rainwater for recycling -to high value crops -to support establishment of tree crops
Recharging groundwater

Topdown Approach:
Bio-physicalemphasis
(1980s)
Participatory Approach:
Bio-physical+
Socio-economic(1990s)
Livelihoods Approach: Integrated Watershed
(2000)
Evolution of watershed concept in India

Integrated Watershed Management Strategies
Integrated Watershed
Management OBJECTIVES
Sustainable Rural
Livelihoods
Efficient Management of
Natural Resources
Coordination of Policies,
Programmes and Activities
Promotion of Community Participation
Goal: Productive and high quality agro-ecosystem

Resource Management through IWS ManagementHolds Promise because…
Integration of crop production with NRM
Land use according to land capability possible through diversification
Provides opportunity for participative on-farm research:higher degree commitment from stakeholders
Effective means of CPR management and sharing of productivity gains
Farming system approach more feasible providing more resilience to drought

Watershed programs details since inception on area coverage and expenditure
20387.06384.85Grand Total
852.898.77NAEP
Environment and Forests Ministry
9462.33189.19Total
212.673.6EAP
2228.4184.54IWDP
1960.7535.31DDP
5060.565.74DPAP
Rural Development Ministry
10071.84186.89Total
498028EAP
21.020.39WDF
105.946.87RAS
255.583.53WDPSCA
2037.7462.51RVP& FPR
2671.5685.59NWDPRA
Agriculture Ministry
Expenditure (Rs in crore)Area treated (lakh ha.)Scheme name

Components of Rainwater Management in rainfed areas
1. In-situ conservation2. Grade line Bund 3. Drainage line treatment4. Water harvesting & utilization5. Groundwater recharge
3, 4, 2, 1>2500Per-humid
3, 4, 2, 1, 51000-2500Sub-humid
2, 3, 4, 5, 1750-1000Wet Semi-arid
2, 1, 3, 5500-750Dry Semi-arid
1, 3100-500Arid
Order of componentsRainfall (mm)Agro Climatic Zone

Summer tillage for alluvial, red and other light soils
Off season land treatment - reduces weed growth and retains more moisture
Compartment bund for heavy black soils for assured rabi crops
In-situ conservation practices

Conservation furrow
-retains about 37% additional soil moisture compared to farmers’ practice-better plant growth and higher yields by about 17%
GroundnutCastor + Pigeonpea
In-situ conservation practices

Ridges and furrows system in cotton -additional yield of 500 kg/ha over farmers’ practice
In-situ conservation practices

Horsegram
Cover cropping-soil quality improvement with on-farm generation of organic matter in off-season
CRIDAIn-situ conservation practices

Micro-catchments
- improves perennial plant establishment even on steep slopes
In-situ conservation practices

Medium term measures

Indigenous technical knowledge - field bunds are time tested means of soil and water conservation
Stone and vegetative field bunding

Graded bund helps in efficient drainageGrade live bund

Live-bed system for improved moisture retention in tobacco
Grade live bund

Trench cum bund for soil and water conservation
In-situ soil and water conservation

Long term measures

Contour trenching for runoff collectionWater Harvesting

On Farm Reservoir (OFR) technology in Chattisgarh, Orissa and Jharkhand created major impact on drought management during kharif
The Government of Chhattisgarh included this technology in the drought relief programme
Water Harvesting

Rs. 200/Cum
CRIDAWater Harvesting
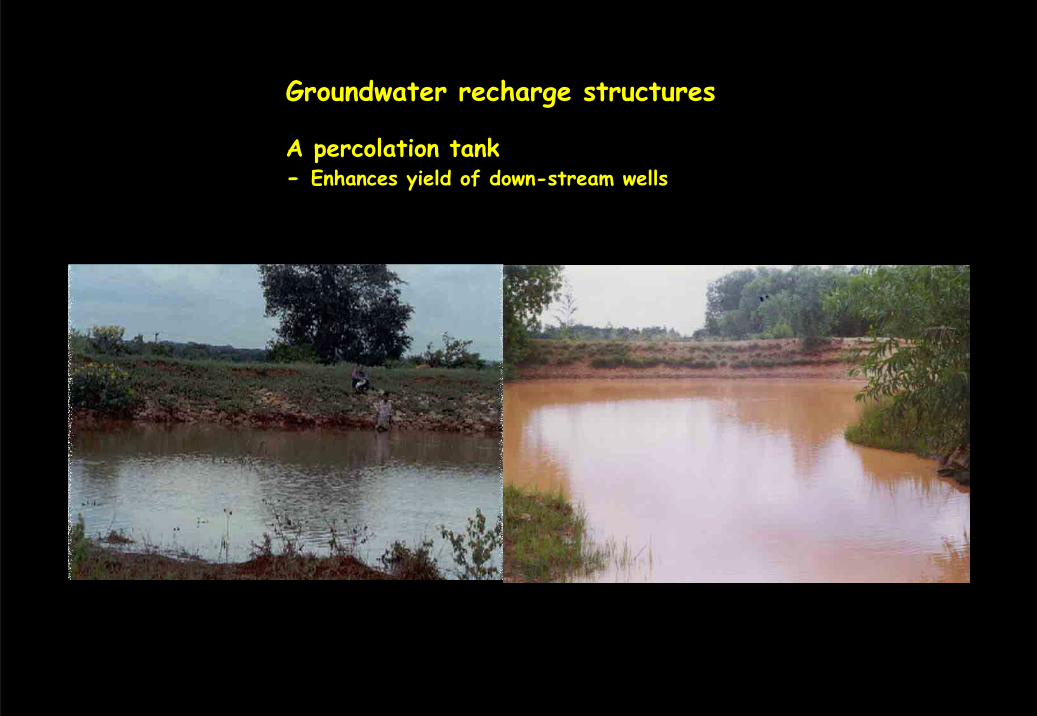
A percolation tank - Enhances yield of down-stream wells
Groundwater recharge structures

Recharge of defunct wells through diversion pipe
50% of open dug wells are defunct
Cost– effective
Recharge through defunct wells
Inlet to recharging well

Strategies for improving water use efficiencies

Method of irrigation Method of irrigation -- FurrowFurrow
Improving the efficiency of stored waterImproving the efficiency of stored water

Life saving irrigation of tobacco through harvested rainwater
• Crop yield improved by 25% through one irrigation during dryspell
• Payback 4-5 years without lining

Effect of one life saving irrigation on yield of FCV Tobacco (2003-04)
+21.2+4.6+18.1+23.4+25.5Improvement (%)
95855.0163111476770Without irrigation
8496
Green leaf
116152.607451416With irrigation
Grade index
(%) Bright
leaf
Bright leaf
Cured leaf

Rainwater stored in farm pond can be judiciously utilized using sprinkler

Sweet oranges + groundnut in rabi in Anantapur district, AP
Banana in Cuddapah district, AP
Micro Irrigation techniques for improved water use efficiency

Supplemental Irrigation with harvested runoff

System of Rice Intensification (SRI) Cultivation
Traditional Rice cultivation
• Low seed rate 1 kg/ac• Less than half the water required • Crop duration reduced by one month (Nursery 8 days)• Mostly managed with family labour • No inorganic fertilizers (weeds are plowed back)• Yield doubles• Cost of cultivation reduced (low seed + low labour + no fertilizer)• Scope for area/ crop diversification
Yield doubles

Crop DiversificationWater requirements of paddy and Irrigated Dry
(ID) crops
3.0400Ragi
3.0400Maize
-1200Paddy
4.8250Chickpea
3.0400Groundnut
Area equivalent of paddy (ha)
Water requirement (mm)
Crop
4.8 ha area can be brought under chickpea by replacing 1.0 ha area under paddy, besides soil improvement as chickpea is a leguminous crop (fixes nitrogen)

6.42+Additional water saving of 400mm
27936Improved practiceRice - Chickpea
7.8337560Improved practice Rice - Groundnut
5.0036000Farmers’ practice Rice - Rice
Water use efficiency Rs. per mm
Total net returns
(Rs. for 3 acres)
Practice
Net returns and water use efficiency for different cropping systems

Alternate land use system

Curry leaf + Black gram
Bush farming in arable land
Jatropha
Bush farming in non-arable land
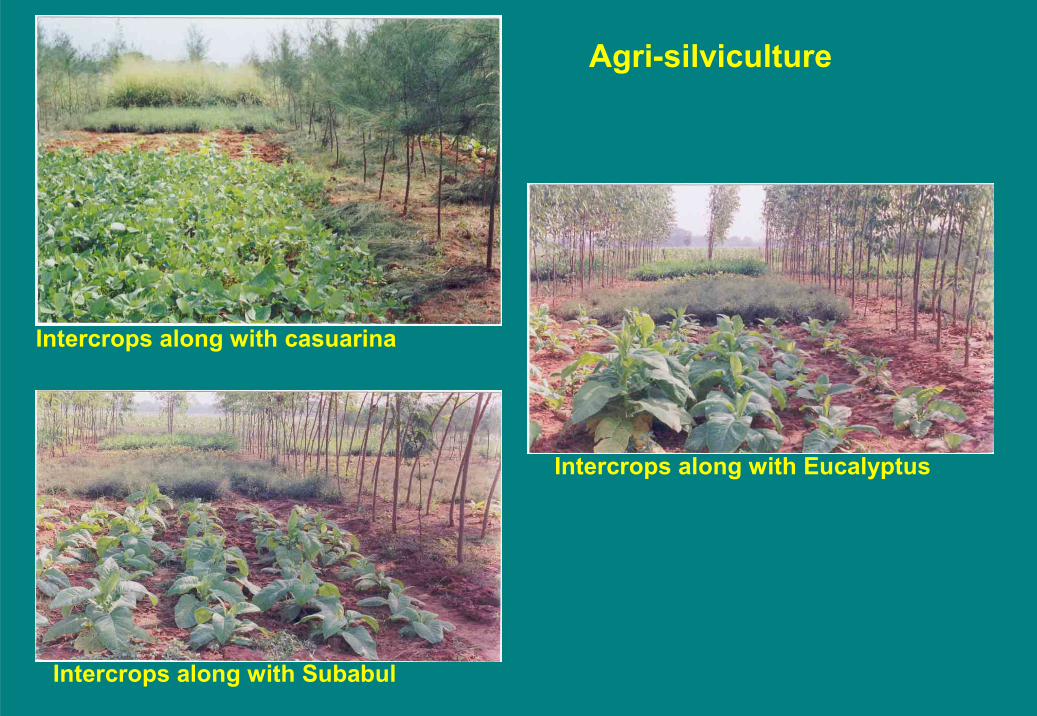
Intercrops along with casuarina
Intercrops along with Eucalyptus
Intercrops along with Subabul
Agri-silviculture

Economics of alternative land use systems in Andhra Pradesh
Alternative land use systems B/C ratioAgri-horticulture with ber 5.00Agri-silviculture 2.00Arable crops 1.20-1.75Dryland horticultureMango 3.21Acid lime 3.04
Sweet lime 2.89Guava 2.18

Creating Awareness: Action learning – Rainfall Simulator

Seeing is Believing: Impact of Treatment on Soil Loss

To understand their ground water system and water level fluctuations in annual and seasonal basis,
To regulate the ground water use,
To initiate the dialogue on social regulation, and
To bring change in cropping pattern leading to reduced use of ground water
Participatory Ground Water Evaluation

Ground water level measuring device
Farmer measuring level of ground water through
measuring device
Participatory Groundwater Evaluation

Ground Water Level Fluctuations in a typicle irrigation well
02468
101214161820
F1 F2 F1 F2 F1 F2 F1 F2 F1 F2 F1 F2 F1 F2 F1 F2 F1 F2 F1 F2 F1 F2 F1 F2 F1
Nov-03.
Nov-03. Dec. Dec.
Jan-04. Jan. Feb. Feb. Mar. Mar. April April May May June June July July Aug.Aug.Sept.Sept.Oct. Oct.
Nov-04.
FortnightG
WL
(bgl
), m
0
20
40
60
80
100
120
Rai
nfal
l,mm
Rainfall (mm)Water level depth (bgl)
Farmer name: Yadamma w/o Narsimhulu
Village : Chowderpally
Total bore well depth: 250 ft.
Survey No: 154

• Crop alternatives to paddy, particularly during rabi (Winter season)
• Inclusion of coarse cereals in the Public Distribution System
• Higher support price to ID crops
• Supply of quality seeds of ID crops at subsidized rates
• Implementation of the Act (Walter Land and Trees Act, AP-WALTA 2002)
promulgated by Government of Andhra Pradesh in true spirit.
• Development of water markets and water sharing mechanism
• Favourable policy initiatives for reforms in power sector
Policy Implications-leading to efficient water management

• Participatory hydrological monitoring
• highest priority to domestic water supply
• Panchayat needs to be empowered legally to manage their resources, particularly groundwater in an equitable manner
• community-based water management and crop planning for sustainable use of groundwater
• Tank rehabilitation to restore the livelihoods of various stakeholders dependent on them.
Social Implications

Groundwater management strategies
Demand management of water
adoption of improved management practices would be the key to sustainability in areas where the recharge potential is low (Eg. Peninsular India)
• Reducing the gap between potential created and potential utilization
• Lined channels or closed conduits can reduce conveyance losses resulting in additional area under irrigation
• Optimizing cropping patterns and use of improved irrigation systems are key drivers for better management of water.
• Encouraging farmers to adopt irrigated dry crops through input subsidy and better marketability of the produce
• Organizing awareness programmes in monitoring of water use

water harvesting for supplemental irrigation would be the key driver for ensuring improvement in water use efficiency (eg. Central and eastern India)
• Water productivity is low in spite of high rainfall in the region due to uncertainty in timing and quantity of rainfall.
• Utilization of harvested runoff for supplemental irrigation during dry spells and/or for pre sowing irrigation during the rabi season ensures the increase in cropping intensity
• Gap between potential created and potential utilized need to be reduced by addressing the reasons for under utilization in these areas.
Supply management of water

Climate change impact on water resources

An ice free Arctic?
City Lights from Space
1979 2003
Arctic sea-ice extent: decrease since mid-
1970s

Melting of polar ice sheets would rise global sea leveland make statues more accessible
Water quality problems will increase in coastal areas due to salt water incursion inland

Impact of climate change on water resources(With reference to India)
• The hydrological cycle is predicted to be more intense, with higher annual average rainfall as well increased drought.
• There is a predicted increase in extreme rainfall and rainfall intensity in all three river basins towards the end of the 21st Century
• The Godavari basin is projected to have higher precipitation than the other two
543150482134Ganga
11620198166Godavari
671126091Krishna
Annual Flow (km2)
Annual Rainfall (cm)
Annual Flow (km2)
Annual Rainfall
(cm)
Future (2071-2100)Baseline (1961-1990)River Basin
Rainfall intensity at three major river basins
* Source: iitm, Pune

ABC model suggests more number of droughts in the coming decades in India
0
1
2
3
4
5
6
1930
-194
0
1940
-195
0
1950
-196
0
1960
-197
0
1970
-198
0
1980
-199
0
1990
-200
0
2000
-201
0
2010
-202
0
2020
-203
0
2030
-204
0
2040
-205
0
Dro
ught
Fre
quen
cy (N
o. o
f Yea
rs)
ObservationGHGs+SO4_1998ABC_2050

• Proper and timely agro-advisories helps in improved irrigation scheduling, fertilizer management thus conserve water and increases the use efficiency

Thank you