Embed Size (px)
Citation preview
Water Management
Tools for Water Supply and Water Management
Richard McNider James Cruise, Cameron Handyside and Kevin Doty
University of Alabama in Huntsville
Alabama Water Resources ConferenceSeptember 5, 2013
A Quantitative Approach

Water Management
For Alabama to adopt a Comprehensive Water Management Plan it may have to be shown that the economic cost of not having a plan exceeds the cost of the plan.
Today the State is losing $100’s of millions because farmers don’t have access to water and are not irrigating.
Some areas such as Birmingham may face water restrictions if we have a drought like 1954 again. Nursery and lawn and garden sales retails might be reduced by $10-100 million.
Loss of habitat may lead to greater number of endangered species leading to costly permit delays for industry and agriculture.
100’s of millions in irrigation infrastructure may be at risk if new upstream riparian users take water – the farmer is at the mercy of a court.

Water Management
For Alabama to Adopt a Comprehensive Water Plan -
We need quantitative tools to determine what impact the plan may have on stakeholders:
What does it mean for municipal water suppliers – will they be able to protect their investment in water infrastructure – how many time will they face water restrictions such as Birmingham in 2000 if a plan is in place ?
How many times might an irrigating farmer face restrictions on withdrawals – can he afford to make irrigation investments?
Water Management
Is 15 gallons of fuel a lot? It is if it is ¾ tank of gas in your car. It is not if it is what you have left in a Boeing 747 in its 45,000 gallon tank.
Is $100,000 too much to pay for a car? It is if your income is $50,000. May be not if you are Jay Leno and that is only 1% of your annual income.
Is $1000 too much to pay for a hair cut? Not if you are Donald Trump or John Edwards.
Is 100 million gallons per day a lot of water for public water supply? It is if you are El Paso and it is 50% of the average flow of the Rio Grande. It may not be if that is the water supply needs for a most of North Alabama and it is only 4% of the average flow of the Tennessee River.
To be meaningful water use must be viewed against available water.
It’s all relative!
Water Management
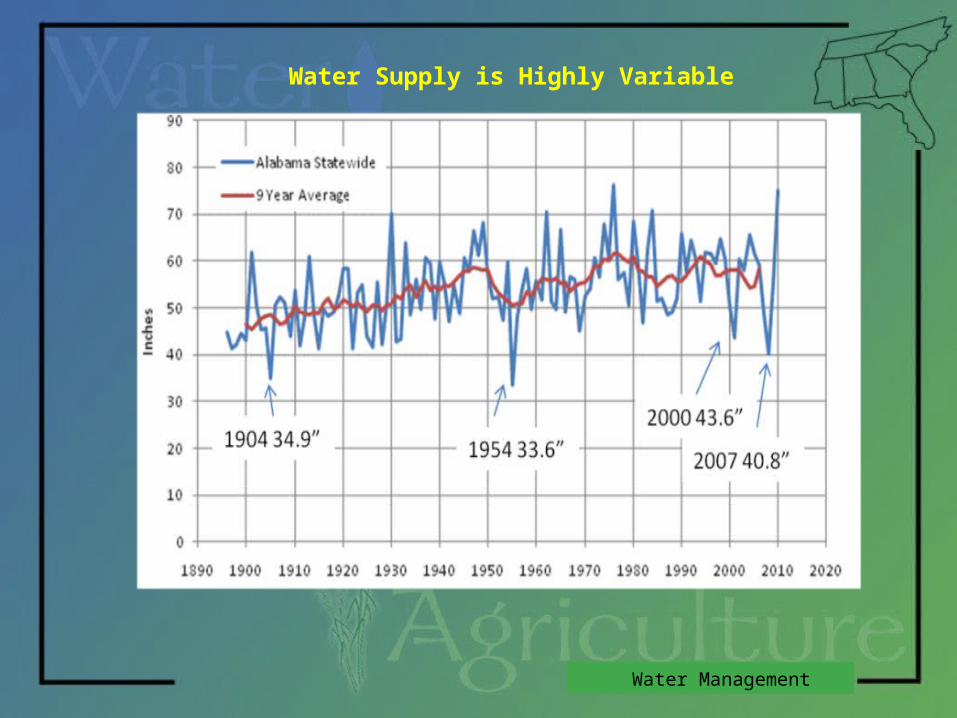
Water Supply is Highly Variable

Water Management
Add Water Withdrawal

Water Management
Practical Water Management Questions:
How would Birmingham Water Supply Fare if we had the droughts of 1950’s?
How many acres can we add in irrigation in a given water shed without impacting environmental flows?
How would adding 1 million acres of irrigation in Alabama impact flow into the Mobile Delta if we had the drought of 2007 again?
How would lake levels change on Lake Mitchell if 15% of Birmingham water supply were provided from the Coosa River?
What would be the impact on hydroelectric revenues of Alabama Power if 50,000 acres of irrigation were supplied by Coosa River.
Water Management
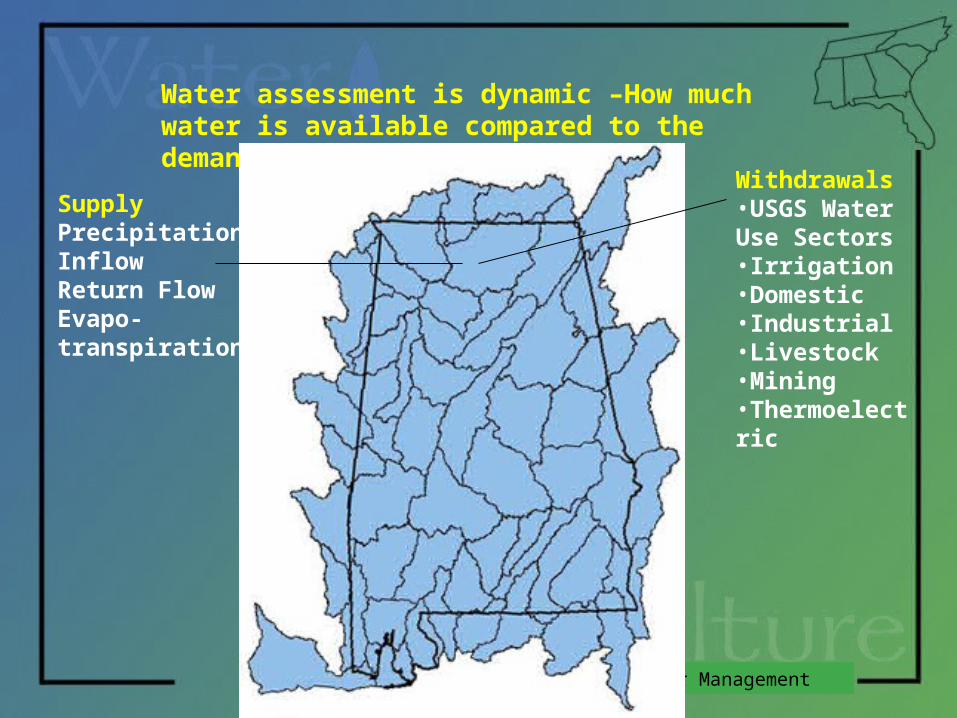
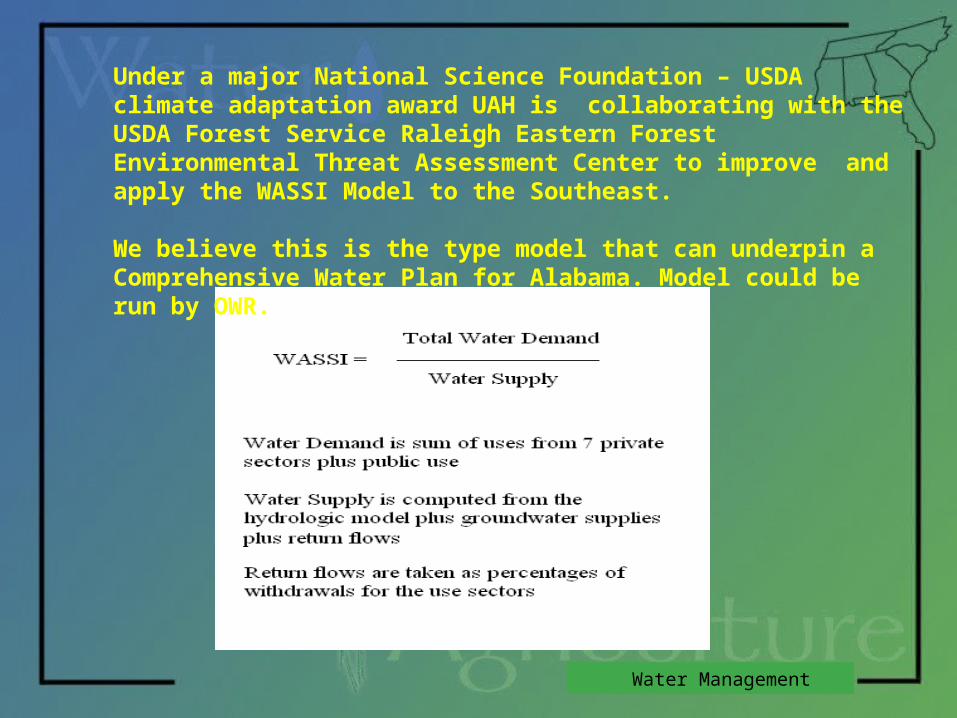
Water assessment is dynamic –How much water is available compared to the demand for water ?
Withdrawals •USGS Water Use Sectors •Irrigation•Domestic•Industrial •Livestock•Mining•Thermoelectric
SupplyPrecipitationInflowReturn FlowEvapo-transpiration
Water Management
Under a major National Science Foundation – USDA climate adaptation award UAH is collaborating with the USDA Forest Service Raleigh Eastern Forest Environmental Threat Assessment Center to improve and apply the WASSI Model to the Southeast.
We believe this is the type model that can underpin a Comprehensive Water Plan for Alabama. Model could be run by OWR.

Current Operational Model
• Monthly Time Step• 8-Digit HUC Level• Run for 1951-2012• Employs USGS/Alabama Water Use for 2005

Hydrologic Model/Demand Model

Water Management
The hydrologic flows from the WaSSI Model can be used to compare to Environmental Flows/Instream Flows.
The Alabama Conservation Department – Instream Flow Criteria or the ACF Flow Requirements could be used as the test statistic (see Srivastava et al. 2010).
The Forest Service has used a WaSSI value greater than 0.4 to indicate stress on a water shed.
Environmental Flows

Water Management
Simulation 1995-2005

Water Management
WASSI Flows Compared to Stream Flow – Alabama River at Claiborne
1961 1984 2007
Water Management
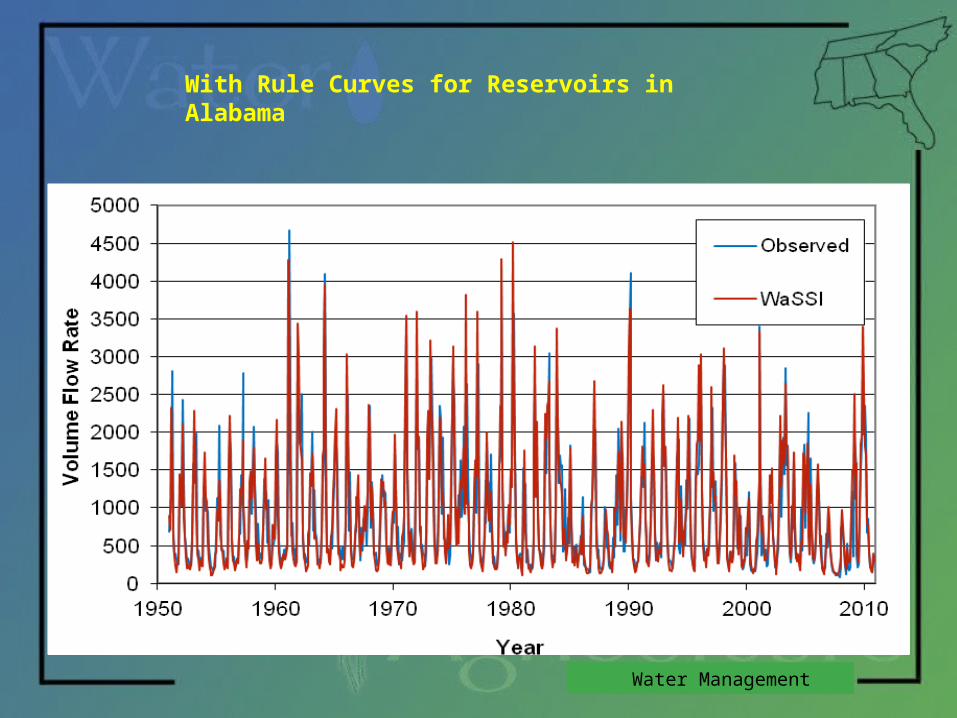
With Rule Curves for Reservoirs in Alabama

Water Management
Cahaba R. nr Marion Junction: 1969-2010
0
2,000
4,000
6,000
8,000
10,000
12,000
14,000
16,000
18,000
1 19 37 55 73 91 109 127 145 163 181 199 217 235 253 271 289 307 325 343 361 379 397 415 433 451 469 487
Month
Dis
char
ge
(cfs
)
Gage
Wassi

Water Management
Choctawatchee R. nr Caryville, FL
0
5,000
10,000
15,000
20,000
25,000
30,000
35,000
40,000
45,000
1 20 39 58 77 96 115 134 153 172 191 210 229 248 267 286 305 324 343 362 381 400 419 438 457 476 495 514
Month
Dis
char
ge
(cfs
)
Gage
Adj Sum

Water Management
Tallapoosa R. Nr Montgomery Water Works:1984-2010
0
2,000
4,000
6,000
8,000
10,000
12,000
14,000
16,000
1 13 25 37 49 61 73 85 97 109 121 133 145 157 169 181 193 205 217 229 241 253 265 277 289 301 313
Month
Dis
char
ge
(cfs
)
Gage
Wassi

Water Management
Mean WASSI (fraction of demand to supply), 1950-2010

04/20/23 20
Average Oct WaSSI 1951-2010
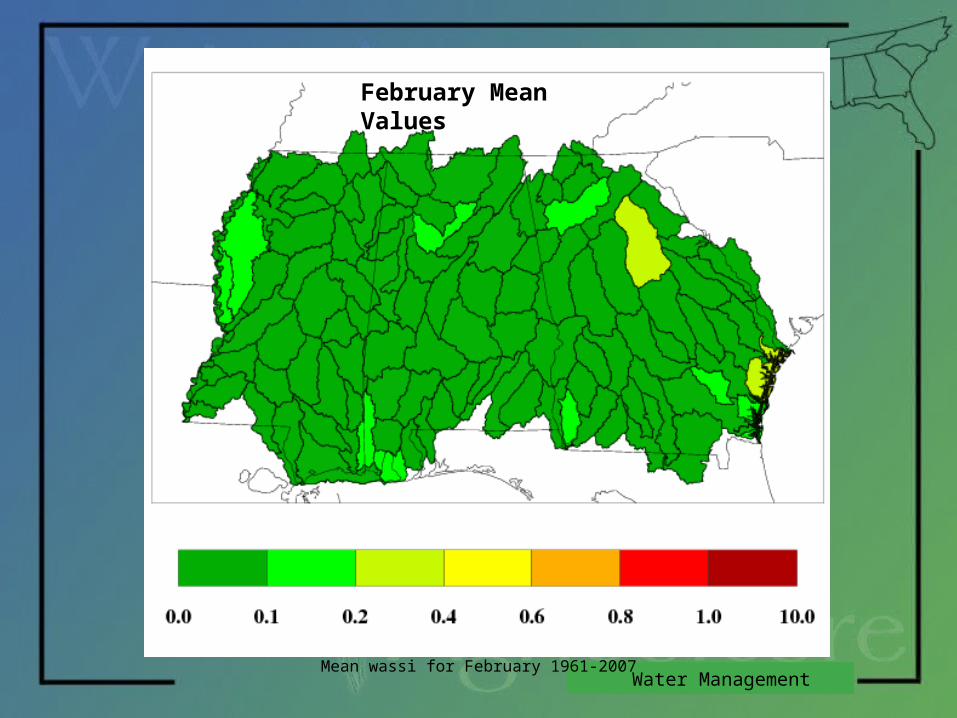
Water ManagementMean wassi for February 1961-2007
February Mean Values

Water Management
Maximum WASSI and Year

04/20/23 23
% Time WaSSI Less Than .40 (1951-2010)

Water Management
The challenge for water resource management in Alabama is to avoid policies that restrict water use during the majority of times that water resources are not stressed trying to protect the resource the few times when extreme droughts do strain water availability.
WaSSI can give an indication of how many times over a 50 year period water withdrawal restrictions might be imposed due to extreme stress.
Historical data can be used to set actuarial rates for water insurance

Water Management
Irrigation Demand is Dynamic
GridDSSAT Crop Model
USDA NASS Cropscape Data
Watershed Irrigation Withdrawals

Combined acreage of corn, cotton, soybeans, and peanuts in units of km2 for HUC-8 regions

April-August (1951-1999) Number of Months Increase WASSI > 0.40 For 10% Crop Acreage
Irrigation
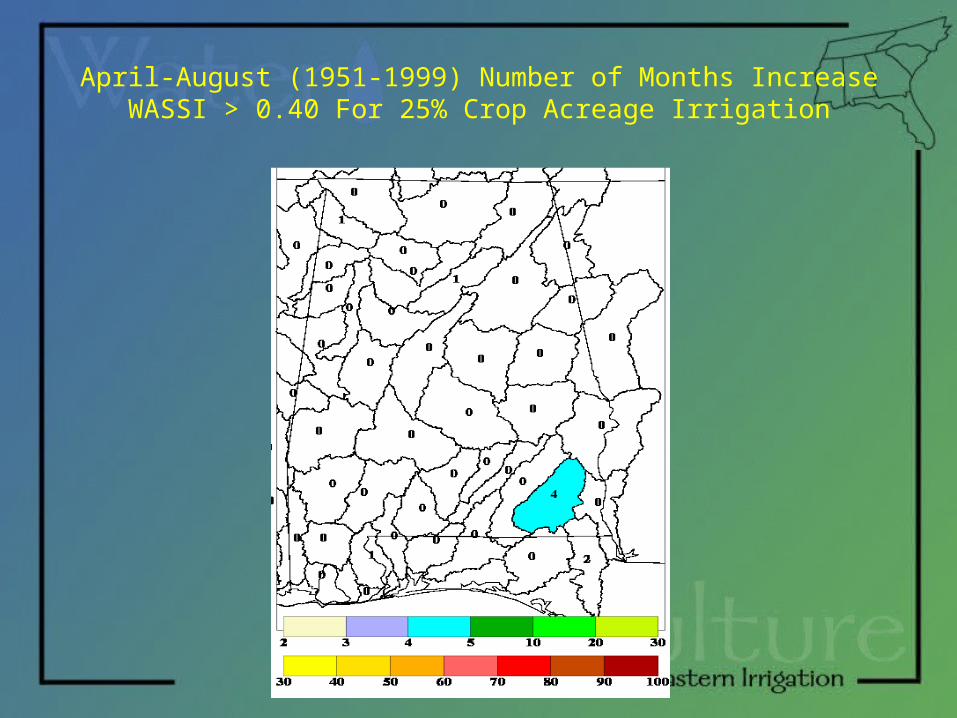
April-August (1951-1999) Number of Months Increase WASSI > 0.40 For 25% Crop Acreage Irrigation

April-August (1951-1999) Number of Months Increase WASSI > 0.40 For 50% Crop Acreage Irrigation

April-August (1951-1999) Number of Months Increase WASSI > 0.40 For 75% Crop Acreage Irrigation

April-August (1951-1999) Number of Months Increase WASSI > 0.40 For 100% Crop Acreage Irrigation

Water Management
Future Improvements
Make weather dependent adjustments to withdrawal data sectors such as public water supply and thermoelectric withdrawals.
Improve current irrigation location and wetted area data
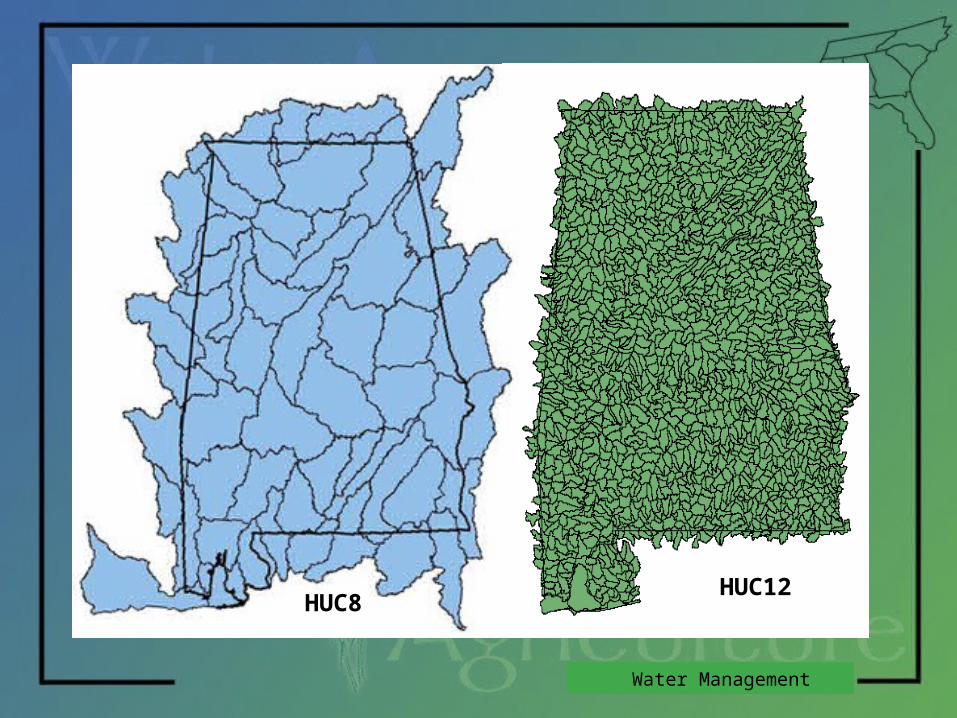
Configure WaSSI to run at HUC12 and at daily/weekly time step
Add groundwater/surface water interaction
Run WaSSI in real-time on a daily basis
Connect WaSSI Hydrology to Corp ResSIM model.
Water Management
HUC8HUC12

Water Management
Real-time RadarNASA land surface temperatures
Satellite derived insolation Real-time Gridded Crop Model

Water Management
Real-time RadarNASA land surface temperatures
Satellite derived insolation Real-time WASSI Model

Water Management
Schematic example of p WaSSI-GriDSSAT “Red Yellow Green” system at the 12 –digit HUC resolution. Green indicates all environmental flow criteria are being met. Yellow indicates that flows are near environmental limits. Red indicates environmental flows are threatened and water restrictions may be needed.