Embed Size (px)
Citation preview

WATERinCORE Water Management Analysis MED Programme 2007-2013 Phase 3.3
1
Project cofinanced by European Regional Development Fund
Project cofinancé par le Fonds européen de développement régional
1G-MED08-515
“Sustainable Water Management through
Common Responsibility enhancement in
Mediterranean River Basins‖
August 2010
Water Management
Common List of Indicators & Database

WATERinCORE Water Management Analysis MED Programme 2007-2013 Phase 3.3
2
TABLE OF CONTENTS
1. Indroduction
2. List of Water Management indicators
3. Common Database Template per Indicator
4. Annex: Guideline for developing an indicators system for monitoring
sustainability of water management
WATERinCORE Water Management Analysis MED Programme 2007-2013 Phase 3.3
3
1. Introduction
The present report was drafted in the framework of the 1G-MED08-515
WATERinCORE project for the ―Sustainable Water Management through Common
Responsibility enhancement in Mediterranean River Basins‖.
The WATERinCORE project is implemented under the transnational programme of
European territorial cooperation MED (http://www.programmemed.eu), Priority Axe
2: Environmental protection and promotion of a sustainable territorial development,
Objective 2.1: Protection and enhancement of natural resources and cultural
heritage.
The project is focusing on the protection of water resources through the sustainable
management and common responsibility enhancement. Its objective is the
exploitation of the experience and the disparity of the participants’ regional
institutions in WM issues and the Public Participation (PP) in Med Level, in order to
produce methodological tools for PP in WM for the entire Mediterranean River Basin.
Within the framework of the 3rd component of the project ―Water Management in the
participants’ regions-Pilot River basin‖, a methodological framework for the definition
of WM indicators for the monitoring of sustainable water management, based on the
results of WM Analysis, was set and applied (phase 3.3). Thus, a common list of WM
indicators was formed. Each indicator will be analytically described by each partner
for the pilot river basin districts, based on the Common Database Template
proposed. The Water Management List of indices will be used for the creation of the
common database on water management (phase 3.4). The evaluation of the data for
the indicators and the implementation of a SWOT analysis per pilot basin will finally
develop a Strategic Water Management Plan for each pilot basin of the participant
regions (phase 3.4).
The annex describes the guidelines for developing an indicators system for
monitoring sustainability of water management. Its purpose is to provide criteria for
selection of indicators and homogeneous operative standards for filling indicator
common database templates in order to support monitoring and assessment of
sustainability of water management.

WATERinCORE Water Management Analysis
MED Programme 2007-2013 Phase 3.3 4
2. List of Water Management indicators
Country: Region: Name of Pilot River Basin: Total Area of Pilot River Basin: Total Population of Pilot River Basin:
Indicator Type Sustainability Dimension
Purpose Description Unit of Measurement
DPSIR Classification
1. Land use a. Water bodies
b. Rangeland c. Forests
d. Urban area e. Industrial area
f. Agricultural area
Descriptive Environmental Providing information about land coverage and use
This indicator expresses the articulation of territory based on the category of use (water bodies, forests,
agricultural, industrial, urban areas and grazing land) through data on extension, given in hectares and
percentage, of land area of each category of use. It should be elaborated with GIS instruments starting from
studies on land use or the Corine Land Cover maps, with
cartographic restitution of elaboration.
Hectares (ha), percentage (%)
State
2. Population Density Descriptive Social Providing information about the concentration
of the human population in reference to space.
It can be used as a partial indicator of human requirements and activities in an area.
Population density is the number of people per unit of
area usually per square kilometer or mile. It can be
calculated from population of the area divided by the surface it covers.
Number of population per
Square meters of area
(per m2)
Driving Force
3. Plant communities zones
Descriptive Environmental Providing information about the plant species groups that are growing in the zone. Plant
community zones affect the surface runoff and
give information whether an irrigation area or a settlement is prone to flood risks. Moreover
is a indirect indicator which gives information about climate conditions and the relief
This indicator expresses the type of climate that is suitable for a specific group of plant species. Describe
the exact community zone that belongs each pilot river
basin.
Dimensionless State
4. Elevation Descriptive Environmental The elevation of a specific area informs about
the complete morphological view
This indicator expresses the peaks and dipr of the relief
on the Z-axis given in meters, from mean sea level (0m).
Meters (m) State
5. Slope Descriptive Environmental Slope is one of the natural factors, decides soil
characteristics, plant and animals, controlling the proportion of precipitation that is
converted to runoff in a given landscape, and the time it takes for runoff to enter a stream.
Ratio of the altitude change to the horizontal distance
between any two points on the line
(%) percentage State
6. Total Water Balance Performance Environmental-
Developmental
The knowledge of the water balance is crucial
parameter which is able to lead to the integrated exploitation of water resources and
to detect water deficit or surplus.
The total water balance is expressed as:
Changes in stock=Inputs-Outputs (over a specific period of time)
The water Inputs are the sum of the precipitation that
infiltrates and enriches the aquifer, the reused wastewater and the inputs of neighboring basins. The
water Outputs are the sum of the consumption for irrigation, water supply, industrial and livestock
consumption and the outputs to the neighboring basins.
m3/year deficit of surplus State
7. Water table variation rate
Performance Environmental Provides information about the availability of ground waters
This indicator expresses the mean level variation of the ground water per drilling or the general mean level
variation, given in meters or in percentage.
Meters (m) or Percentage variation pre year (%)
State
8. Mean annual precipitation
Descriptive Environmental Providing information about the amount of water as input to the hydraulic cycle.
This indicator expresses the mean amount of precipitation given in millimeters in a year.
Millimeters (mm)
State
9. Runoff coefficient Performance Environmental RC is a parameter to evaluate the moisture
recycling and the importance of land use practices in rainfall recycling
This indicator expresses the amount of water that runs
off to the total amount of precipitation that the catchment has as input, given in percentage.
Percentage (%)
State
10. Total Annual Water
Consumption
Performance Environmental-
Developmental
Providing information the water consumed
from ground and surface water per sector
Total annual water use per sector (water supply,
irrigation, industry, livestock).
Percentage of the total
consumption for each
Pressure

WATERinCORE Water Management Analysis
MED Programme 2007-2013 Phase 3.3 5
(water supply, irrigation, industry, livestock). sector
11. Water Exploitation
Index (WEI)
Performance Environmental-
Developmental
Providing information whether the rate of
abstractions in countries are sustainable over the long term.
WEI is defined as the mean annual total abstraction of
fresh water divided by the long-term average freshwater resources. It describes how the total water abstraction
puts pressure on water resources. Thus it identifies
those countries having high abstraction in relation to their resources and therefore are prone to suffer
problems of water stress. The long-term average freshwater resource is derived from the long-term
average precipitation minus the long-term average
evapotranspiration plus the long-term average inflow from neighbouring countries. The warning threshold for
the water exploitation index which distinguishes a non-stressed from a stressed region is around 20 % (Raskin
et al. 1997). Severe water stress can occur where the
WEI exceeds 40%, indicating strong competition for water but not necessarily enough extraction to trigger
frequent water crises.
Water exploitation index -
WEI (%)
Pressure
12. Water Discharge Descriptive Environmental A forecasting and management tool of risk
events caused by floods in a specific repeat
period.
This indicator expresses the maximum discharge that
the hydrographic network of the catchment can
produce, given in m3/sec.(proposed 50 years period of time)
Cubic meters per second
(m3/sec)
Impact
13. Sediment discharge Descriptive Environmental PD expresses the aggravation rate of water
discharge, with sediments and the bed and banks exposure rate to desertification.
Increase of sediment discharge Increases the possibility of floods.
This indicator expresses the amount of sediments that is
eroded from the banks and bed of the river from the maximum water discharge given in m3/sec.
Cubic meters per second
(m3/sec)
Impact
14. Produced urban
wastewaters
Performance Environmental Urban Wastewaters a significant point source Amount of Waste water from residential settlements and
services which originates predominantly from the human metabolism and from household activities and run-off
rain water
Cubic meters (m3/sec)
Impact
15. Produced industrial wastewaters
Performance Environmental Industrial Wastewaters a significant point source
Any waste water which is discharged from premises used for carrying on any trade or industry, including
pasturalism, other than domestic waste water and run-off rain water.
Cubic meters (m3/sec)
Impact
16. % Population served by
W.W.T.P.
Performance Environmental-
Social-Developmental
The level of treatment before discharge and
the sensitivity of the receiving waters determine the scale of impacts on aquatic
ecosystems.
In compliance with the Directive 91/271/EC, that has
been incorporate with the JMD 5673/400/1997 in the Greek aquis, the Greek populated areas have been
divided in three priorities (A,B,C): Priority area A: Settlements with equivalent population
(e.p.) over 10.000 that discharge their wastewater to
―sensitive‖ water bodies must complete the installation of sewage central collection and treatment systems until
31/12/1998. Priority area B: Settlements with e.p. over 15.000 that
discharge their wastewater to ―normal‖ water bodies
must complete the installation of sewage central collection and treatment systems until 31/12/2000.
Priority area C: Settlements with e.p. over 2.000 that are not included in the priority area A &B must complete the
installation of sewage central collection and treatment systems until 31/12/2005. In this priority it is also
included settlements in which sewage central collection
system has already been installed. Taking into consideration the above classification it can
be identified the percentage of population connected with WWTP.
Percentage of the
population served by WWTP
State
17. Industries with Treated
Wastewater
Performance Environmental Gives information whether the industrial
activity comprises significant point source
Percentage of the amount of wastewater of industries
located at the River basin, treated by using their own
Percentage (%) of
industrial wastewater
Driving Force-Impact

WATERinCORE Water Management Analysis
MED Programme 2007-2013 Phase 3.3 6
pollution for surface and ground waters in the specific region.
plants or by transferring then to other Wastewater Treatment Plants.
treated
18. Reused wastewater Performance Environmental Treated wastewater is becoming increasingly
an important alternative water resource.
Moreover wastewater effluence is a water source that covers the quality standards and
its use reduces the natural water consumption.
Treated wastewater could be precious water recourse
for the following purposes:
Urban reuse—the irrigation of public parks, school yards, highway medians, and residential landscapes, as well as
for fire protection and toilet flushing in commercial and industrial buildings.
Agricultural reuse—irrigation of nonfood crops, such as
fodder and fiber, commercial nurseries, and pasture lands. High-quality reclaimed water is used to irrigate
food crops. Environmental reuse—creating artificial wetlands,
enhancing natural wetlands, and sustaining stream
flows. Industrial reuse—process or makeup water and cooling
tower water.
Percentage of waste
water reused
Response
19. Population served by
water supply network
Performance Environmental-
Social-
Developmental
Information whether the potables needs of the
population is covered by water networks
The number of population that is served by water supply
network within the limits of the particular area
Percentage of population
served
State
20. Irrigation Area served
by irrigation network
Performance Environmental-
Developmental
Providing information about the integrated
management of water resources for irrigation
purposes
The surface of irrigated area served by irrigation
network
Percentage of irrigated
area served by irrigation networks
State
21. Ecological status of
surface waters
Performance Environmental-
Developmental
UNDER DISCUSSION ****The ecological status, as an indicator for monitoring sustainable water management, is difficult to assess because of the large number of measurements that need to be implemented and the complexity to describe it, because is related with a large number of sub-indicators.
For surface water categories, the ecological status
classification for the water body shall be represented by the lower of the values for the biological and physico-
chemical monitoring results for the relevant quality
elements classified in High, Good, Moderate, Poor and Bad, according WFD.
State
22. Chemical Status of surface waters
Performance Environmental-Developmental
UNDER DISCUSSION ****The chemical status, as an indicator for monitoring sustainable water management, is difficult to assess because of the large number of measurements that need to be implemented, and the complexity to describe it, because is related with a large number of sub-indicators.
Where a waterbody achieves compliance with all the environmental quality standards established in Annex
IX, Article 16 of WFD and under other relevant Community legislation setting environmental quality
standards it shall be recorded as achieving good
chemical status. If not, the body shall be recorded as failing to achieve good chemical status, according
WFD.
State
23. Quantity of ground
waters
Performance Environmental-
Developmental
Providing information whether the availability
of groundwater resources is not exceeded by
the long-term annual average abstraction rate.
The parameter for the classification of quantitative
status is Groundwater level regime.
State
24. Chemical Status of
ground waters
Performance Environmental-
Developmental
UNDER DISCUSSION ****Providing information about the appropriateness for different kind of water uses.
The parameters for the classification of chemical status
are Conductivity and Concentrations of pollutants
State
25. Bathing Water Quality Performance Environmental Providing information about the coastal water quality assessing the presence or absence of
pollution sources.
The indicator describes the changes over time in the quality of designated bathing waters (inland and marine)
in EU Member States in terms of compliance with
standards for microbiological parameters (total coliforms and faecal coliforms) and physicochemical parameters
(mineral oils, surface-active substances and phenols) introduced by the EU Bathing Water Directive
(76/160/EEC).
Percentage of inland and marine water bathing
waters complying with
the mandatory standards and guide levels for
microbiological and physicochemical
parameters.
State
26. Water tariffs Performance Social-
Developmental-Economical
Providing information about the integrated
pricing policy adapted per water use.
A water tariff is a price assigned to water supplied by a
public enterprise to its customers per use. Currency/m3 per use Response
27. Cost Recovery Performance Environmental- Providing information about the cost recovery Article 9.1 of the Directive refers to the total cost of Cost recovery rate per Response

WATERinCORE Water Management Analysis
MED Programme 2007-2013 Phase 3.3 7
Developmental-Social-Economical
of municipality water services (water supply, sewerage and irrigation)
water services requires detailed assessment of all components of total cost including:
The financial cost which refers to investment costs, operating and maintenance works,
management and administrative costs and other
direct economic costs. The cost of natural resources represents the
benefit loss due to limitation of available water resources to a greater extent than natural the
refresh rate. The environmental costs represent the cost of the
impact caused by the use of water environment and
aquatic ecosystems.
Municipality and service-Percentage (%)
28. Water Management
Authorities
Descriptive Environmental-
Developmental-
Social-Economical
Providing Information whether there is a local
authority which is responsible for the
integrated management of the Pilot River Basin.
Water management authorities that are responsible for
the implementation of the WFD and the achievement of
its Objectives.
Number Response
29. Water bodies’ Naturalness
Descriptive Environmental Providing information about the water bodies have been altered by human activities
The indicator describes the morphological state of water body. Indicate the percentage of the total length of
rivers or the surface of lakes that fall into the following
classes: Natural
Heavily (or strong) modified Artificial
Percentage (%) State

8
3. Common Database template per Indicator
TYPE Distinguish the different roles they can play in decision-making processes (EEA, 2003). 1) Descriptive indicators: used to characterize environmental situation; 2) Performance indicators: used to measure achievement degree of established
targets (they may use the same variables as descriptive indicators, but are connected with target values);
3) Efficiency indicators: used to measure efficiency degree of products and processes;
4) Policy-effectiveness indicators: used to relate detected environmental changes with political efforts;
5) Total welfare indicators; indicators of overall sustainability. Particularly interesting for the purposes of Waterincore project, appear to be the first two types of indicators, since they can be used respectively to characterize in detail water management in chosen pilot basin (phase 3.4), and to measure the achievement degree of targets established in the Water Action Plan (phase 5.4).
SUSTAINABILITY DIMENSION Specify if it is Environmental, Social, Institutional or Economical PURPOSE Specify indicator’s priority aims DESCRIPTION Describes indicator in details: definition and based concepts. Methodological description and kind of data needed to compile the indicator UNIT OF MEASUREMENT Gives indicator unit of measurement (tons, meters, mg/lit, etc.) DPSIR CLASSIFICATION Specify if it is a driving force, pressure, Impact, State, Response indicator. DATA PROCESSING SCALE
● Spatial scale: specify if spatial coverage is provincial, municipal, etc. ● Timing scale:
○ Temporal coverage: time range of data availability ○ Updating frequency: frequency at which indicator is or can be updated.
DATA SOURCE Indicates data holder from whom they can be obtained.
INDICATOR
Indicator name

9
TABLES and PICTURES They can give indicators value. Here it could also be point out comments and remarks, if any, about indicators values presented at the tables and pictures. STATUS and TREND Table – Scheme to assign Chernoff icon to indicators on the basis of their state and trend
State or trend is very favorable and/or is approaching to established target value
State or trend is stationary and/or shows a steady trend to established target value
State or trend is unfavourable and/or is departing from established target value
Indicator evaluation should be done by assessing the indicator’s status and temporal trend comparing with target or reference value (from benchmarking, provincial/municipal means, laws values). The selection of a "specific" Chernoff icon will therefore be based on improving or worsening indicator trend comparing with the adopted target or reference value.

10
ANNEX

WATERinCORE Water Management Analysis
MED Programme 2007-2013 Phase 3.3 1
GUIDELINE FOR DEVELOPING AN INDICATORS SYSTEM
FOR MONITORING SUSTAINABILITY OF WATER
MANAGEMENT
Phase 3.3 – Water management lists and database
Ing. Antonino Granata
Dott.ssa Virginia Palumbo
Dott.ssa Paola Aiello
1G–MED08-515
MED Programme 2007-2013

WATERinCORE Water Management Analysis
MED Programme 2007-2013 Phase 3.3 1
Contents
1 Introduction .................................................................................................................... 2 2 Indicators: characteristics, functions and application fields .................................................. 2 3 Monitoring sustainability of water resources management by using indicators ....................... 4
3.1 Principles of general sustainability .............................................................................. 5 3.2 Specific sustainability aims related to water resources theme ....................................... 5
4 Typology of indicators to use for monitoring sustainability of water resources management ... 6 5 Essential references ......................................................................................................... 9 6 Attachments ................................................................................................................. 10
6.1 Attachment 1 - Data sheet model for core-set indicator and sub-areas indicators ....... 10 6.2 Attachment 2 - Data sheet model for context indicator ........................................... 11

WATERinCORE Water Management Analysis
MED Programme 2007-2013 Phase 3.3 2
Introduction
This paper is a proposal of guideline for developing an indicators system for monitoring sustainability of water management, in order to carry out phase 3.3 of Waterincore project.
Its purpose is to provide criteria for selection of indicators and homogeneous operative standards for filling indicator sheets in order to support monitoring and assessment of sustainability of water management. The document, after introducing basic concepts on indicators and their characteristics, functions and application fields, focuses on sustainability indicators and their use for monitoring sustainablility of water management, by identifying general criteria for selection of indicators, standards for filling of their sheets and by also providing a proposal of methodological procedure for individuation of indicators system to be adopted.
Indicators: characteristics, functions and application fields
―An indicator is an observed value representative of a phenomenon of study. In general, indicators quantify information by aggregating different and multiple data. The resulting information is therefore synthesised. In short, indicators simplify information that can help to reveal complex phenomena. They focus on certain aspects which are regarded relevant and on which data are available. But their significance goes beyond that obtained directly from the observed properties‖ (EEA, 1999, 2003). Main function of indicators is communication: they in fact, by quantifying phenomena and simplifying complex realities, should be able to provide key information to support decision-making and promote public awareness regarding the issues they relate with.
Using indicators to support policies development is well established in Europe and all over the world. For instance environmental indicators are used for these main purposes:
• to supply information on environmental issues, in order to enable policy-makers to value their seriousness, to identify key factors that cause pressures on the environment and to support policies development and priority setting;
• to monitor the effects of policy responses aimed to solve environmental detected issues;
• to raise public awareness on environmental issues in order to strengthen public support to policy measures.
A key role is also played by indicators in environmental assessment processes, particularly those of plans and programmes, namely in strategic environmental assessment processes under Directive 42/2001/CE, in which the use of indicators is planned in several phases of assessment process for the following main purposes:
• to analyze territorial and environmental characteristics of area potentially affected by effects of the plan/program;
• to monitor temporal evolution of area’s environmental characteristics and trend of effects of the plan/program;
• to periodically measure achievement degree of targets established in the plan/program.

WATERinCORE Water Management Analysis
MED Programme 2007-2013 Phase 3.3 3
As to concerned to the use of indicators to communicate information, useful both to political decision-making and environmental assessment processes, it is to point out some key features that indicators should have in order to effectively perform their function. These features are listed below in order to provide general guidance criteria for the selection of indicators as is specified in paragraph 4:
• Relevance: relation of the indicator with the topics and the aims;
• Analytical consistency: the indicator must be qualified and well founded in technical and scientific point of view;
• Communicability: immediate comprehensibility for both technicians and common people;
• Sensitivity to plan’s actions: capability to detect changes induced by implementation of the plan;
• Short response time: indicator must detect in a short time changes induced from the implementation of the plan;
• Based on data:
quickly available, or made available through a reasonable use of resource,
of known quality and reliability,
regularly updated.
Referential analytical framework adopted by European Environmental Agency (EEA) in order to evaluate relationship between human activities and environment is the DPSIR model (Drivers – Pressures – State – Impact - Responses). According to this model, human activities drivers exert pressures on the environment and, as a consequence, the state of the environment changes: this leads to impacts (i.e. on human healt, ecosystems and materials) that may elicit responses aimed to change drivers, pressures or directly state or impacts, through adaptation or improvement actions (Fig.1).
Figure 1 – The DPSIR Framework (EEA, 1999)
This model describes a dynamic situation, as the real one, through the use of indicators (of Drivers – Pressures – State – Impact - Responses), which are ―snapshots‖ of a non-stop evolving system, useful not only to describe each components of the model, but also to highlight the dynamic relationships among them.

WATERinCORE Water Management Analysis
MED Programme 2007-2013 Phase 3.3 4
Most of indicators sets used internationally to analyze the relationships between human activities and the environment is based on this model. These sets are used to characterize principal environmental issues (eg. air pollution, waste, water, etc ...) in relation to geographical scope of the analysis.
So we think it’s advisable to relate to DIPSIR model proposed by EEA also in Waterincore project – phase 3.3, as regards selection and classification of sustainability indicators for water management (see paragraph 4).
Finally, it is worth dwelling on indicators classification adopted by EEA to distinguish the different roles they can play in decision-making processes (EEA, 2003). Indicators can be classified into 5 different typologies:
6) Descriptive indicators: used to characterize environmental situation;
7) Performance indicators: used to measure achievement degree of established targets (they may use the same variables as descriptive indicators, but are connected with target values);
8) Efficiency indicators: used to measure efficiency degree of products and processes;
9) Policy-effectiveness indicators: used to relate detected environmental changes with political efforts;
10) Total welfare indicators; indicators of overall sustainability.
Particularly interesting for the purposes of Waterincore project, appear to be the first two types of indicators, since they can be used respectively to characterize in detail water management in chosen pilot basin (phase 3.4), and to measure the achievement degree of targets established in the Water Action Plan (phase 5.4).
Monitoring sustainability of water resources management by using indicators
The United Nations Conference on Environment and Development held in Rio de Janeiro in 1992, established, subscribing Agenda 21, that environmental aims must be considered together with social, economic and institutional ones, by pursuing social equity in distribution and access to environmental resources and human rights such as work, health, social care, access to basic services and house. This, it was said in that conference, has to be achieved by protecting right of people of third world and of future generations to enjoy the same rights.
At Rio Conference was also stated that ―Indicators of sustainable development need to be developed in order to provide solid bases to decision-making processes at all levels and to trigger a mechanism of autoregulation of environment and development integrated systems1‖.
Using sustainability indicators as a tool to support sustainable development policies is by now widespread internationally, nationally and locally. They in effect represent an useful tool even in Local Agenda 21 processes, where they allow not only to produce a "diagnostic picture‖, but also to monitor and verify the achievement of targets that Agenda 21 intends to pursue through implementation of Action Plan.
In order to define an adequate system of sustainability indicators to be used in Local Agenda 21 processes applied to water management, it is necessary to begin from general
1 Agenda 21, Rio de Janeiro 1992, chapter 40.

WATERinCORE Water Management Analysis
MED Programme 2007-2013 Phase 3.3 5
sustainability principles and specific sustainability aims established for water resources and for geographic scopes of analysis. Coherence with identified principles and aims, in fact, can provide an useful guidance for indicators assessment and selection.
Principles of general sustainability
A detailed survey of general sustainability principles can be based on policy papers drawn up at European, national and regional levels. Among European references, Sustainability principles adopted under ECI Project (2003), Aalborg Commitments (2004), European Strategy for Sustainable Development (2006) and Integrated Guidelines for Growth and Employment of Lisbon Strategy (2000) are worth remembering. In Waterincore project, however, a survey of those most applicable in Local Agenda 21 processes has been carried out (see internal document "Local Agenda 21 - Achievement Recognition Matrix"). These principles are:
1. Integration: the effective integration of environmental, social and economic considerations in decision making;
2. Community involvement: recognition that sustainability cannot be achieved, nor significant progress made toward it, without the support and involvement of the whole community;
3. Precautionary behaviour: where there are threats of serious or irreversible environmental damage, lack of full scientific certainty should not be used as a reason for postponing measures to prevent environmental degradation;
4. Equity within and between generations: fairness and equal access to opportunities both in our lifetimes, as well as future generations;
5. Continual improvement: the declining environmental situation means there is an imperative to take immediate action to become more sustainable and to make continual improvement;
6. Ecological integrity: to protect biological diversity and maintain essential ecological processes and life support systems.
Specific sustainability aims related to water resources theme
A survey of specific sustainability aims related to water resources theme should be based on following references:
a) regulatory requirements and guidance provided by european, national and regional policy documents already identified during the survey referred to in paragraph 3.1;
b) examples of good practices come out from geographic benchmarking processes among areas with similar features and/or issues;
c) environmental, social and economic aims identified for each sectors of Water Management Analysis (Phase 3.1) and related to river basins of each region taking part in the project, during the filling of Survey Document, section AIMS - RESPONSES
In relation to point c), a scheme of matrix is proposed in Table 1, that can be used to synthesize specific sustainability aims identified for each sector of the WM Analysis within the river basins of regions involved in the project, and reported in the Survey Document.

WATERinCORE Water Management Analysis
MED Programme 2007-2013 Phase 3.3 6
Table 1 – Scheme di matrix Sustainability aims – Sector of WM Analysis
Sector of WM Analysis (Survey Document) Aims
environmental social economical
11 - Lakes and rivers
12 - Groundwater
13 - Seawater
14 - Ecosystems and special protected areas
15 - Thermal and mineral waters
16 - Drainage, rain water management
17 - Irrigation, water for agricultural use
18 - Derivations’water for energy and industrial use
19 - Aquaculture - fish and plant farming - fishing
20 - Water quality control
21 - Water balance analysis, meteo data
22 - Surveillance and controls’policy
23 - Drillings, permit and control
24 - Water infrastructures
25 - Sewage infrastructures
Typology of indicators to use for monitoring sustainability of water resources management
The list of specific sustainability aims in water resources theme resulting from the survey
referred to in paragraph 3.2, together with the general principles of sustainability stated in paragraph 3.1, can be used as a "selection grid" of descriptive and performance indicators, as described in paragraph 2, to monitor and assess the sustainability of water management at basin scale. The first kind of indicators, in fact, may be used to characterize in detail the water management of pilot basin (phase 3.4 of Waterincore project), the second kind (which may use the same variables as descriptive indicators, but are connected with target values) can be used to monitor and assess the achievement degree of sustainability aims identified for water resources theme and could become targets of Water Action Plan for that pilot basin (phase 5.4).
The indicators should be selected to adequately represent the categories of DPSIR model applied to water theme. In this regard it may be useful to refer to the scheme developed by EEA (2003), shown in Fig. 2, where the main types of Determinants, Pressures, State, Impacts and Responses, related to Water theme, have been identified.

WATERinCORE Water Management Analysis
MED Programme 2007-2013 Phase 3.3 7
Figure 2 – Scheme of DPSIR model applied to water theme (EEA, 2003)
Another important aspect to keep in mind is the territorial scope of analysis to which
selection of indicators refers, according to DPSIR model. In this respect, it seems to be useful, for purposes of the project, to consider two distinct levels of analysis:
1) An analysis at pilot river basin level, which constitutes the main territorial scope for the detailed analysis of water management scheduled in phase 3.4;
2) An analysis at sub-areas level (identified within the pilot river basin on the basis of homogeneous environmental, territorial and/or socio-economic characteristics), which, borrowing a classification successfully applied in some experiences of monitoring and assessment of local sustainability (Municipality of Florence, 2008), are believed to be represented at least in the first instance by the following main types:
a. coastal area and islands; b. mountain area; c. rural and hilly area; d. urban area; e. tourism area; f. agricultural area; g. industrial area.
The identification of sub-areas with homogeneous environmental territorial and/or socio-economic characteristics, aims to guide the selection of indicators not only to those which analyze sustainability issues at basin level, but also on those which analyze local issues and territorial specificities within it, which may stimulate interest and involvement of local stakeholders in ―Social Dialogue‖ on water management, scheduled in phase 5.2 of project.

WATERinCORE Water Management Analysis
MED Programme 2007-2013 Phase 3.3 8
According to these different levels of analysis, it’s therefore possible to identify a corresponding articulation of indicators system in three separate classes: core-set indicators (related to pilot river basin), context indicators and sub-areas indicators (related to territorial sub-areas mentioned above), as shown in table 3, where also the description of classes is reported together with the reference to Indicator Data Sheet Model to be filled in, attached to this document.
In general, except for context indicators which aim to provide a general overview and to facilitate the association of a territory to one or more types of sub-areas for the subsequent in-depth analysis, the selected indicators will be used both to characterize water management in the pilot river basin, and to monitor and assess its sustainability. The core-set and sub-areas indicators, in fact, will be used not only as descriptive but also as performance indicators, through the assessment of state and time trends observed in the indicators in absolute and in relation to the target value adopted.
The target value would consist of normative values, average provincial/municipal values or values achieved by the same indicator in similar realities (benchmarking). Indicator trend towards improvement/deterioration and its trend towards approaching to/departing from the adopted target value will be represented by means of the "specific" Chernoff icon (Table 2), which provides an evaluation of reaching target. After processing and evaluating each indicator, an integrated assessment of all observed dynamics will be carried out, in order to assess sustainability of water management as a whole within the pilot river basin.
Table 2 – Scheme to assign Chernoff icon to indicators on basis of their state and trend
State or trend is very favorable and/or is approaching to established target value State or trend is stationary and/or shows a steady trend to established target value State or trend is unfavourable and/or is departing from established target value
Table 3 – Scheme of indicators system partition based on territorial field of analysis
Territorial scope of analysis
Indicators class Class description Reference to
Indicator Data Sheet Model
River basin Core-set indicators
They constitute the "heart" of the indicators system, related to water management issues and features of common interest to the whole river basin. They are classifiable according to sustainability dimension (environmental, socio-institutional, economic) to which they relate, and according to DPSIR model.
Attachment 6.1
Sub-areas
Context indicators It 'a set of indicators covering the three dimensions of sustainability that
Attachment 6.2

WATERinCORE Water Management Analysis
MED Programme 2007-2013 Phase 3.3 9
Essential references
Municipality of Florence, Linee Guida per un sistema regionale di indicatori comuni di sostenibilità locale, 2008
Gabrielsen P. and Bosch P., Environmental Indicators: Typology and Use in Reporting, European Environment Agency, 2003
Smeets E. and Weterings R., Environmental indicators: Typology and overview, European Environment Agency, 1999
AA.VV., Europe’s water: an indicator-based assessment, European Environment Agency, 2003
are functional to general overview of the territory as regards the geographical, environmental, social and economic aspects. Context indicators provide a general framework from which emerge local specificities and which facilitates the association of a territory to one or more types of sub-areas among the identified ones: coastal area and islands, mountain area, rural and hilly area; urban area, tourism area, agricultural area, industrial area. They are classifiable according to dimensions of sustainability (environmental, socio-institutional, economic) to which they relate, and according to DPSIR model.
Sub-areas indicators
These indicators aim to analyse issues and features of water management explicitly related to local specificities. These are indicators aimed to in-depth examination of environmental, social, economic and institutional peculiarities of each territory at local scale and they are classifiable according to dimensions of sustainability (environmental, socio-institutional, economic) to which they relate, and according to DPSIR model.
Attachment 6.1
WATERinCORE Water Management Analysis
MED Programme 2007-2013 Phase 3.3 10
Attachments
Attachment 1 - Data sheet model for core-set indicator and sub-areas indicators
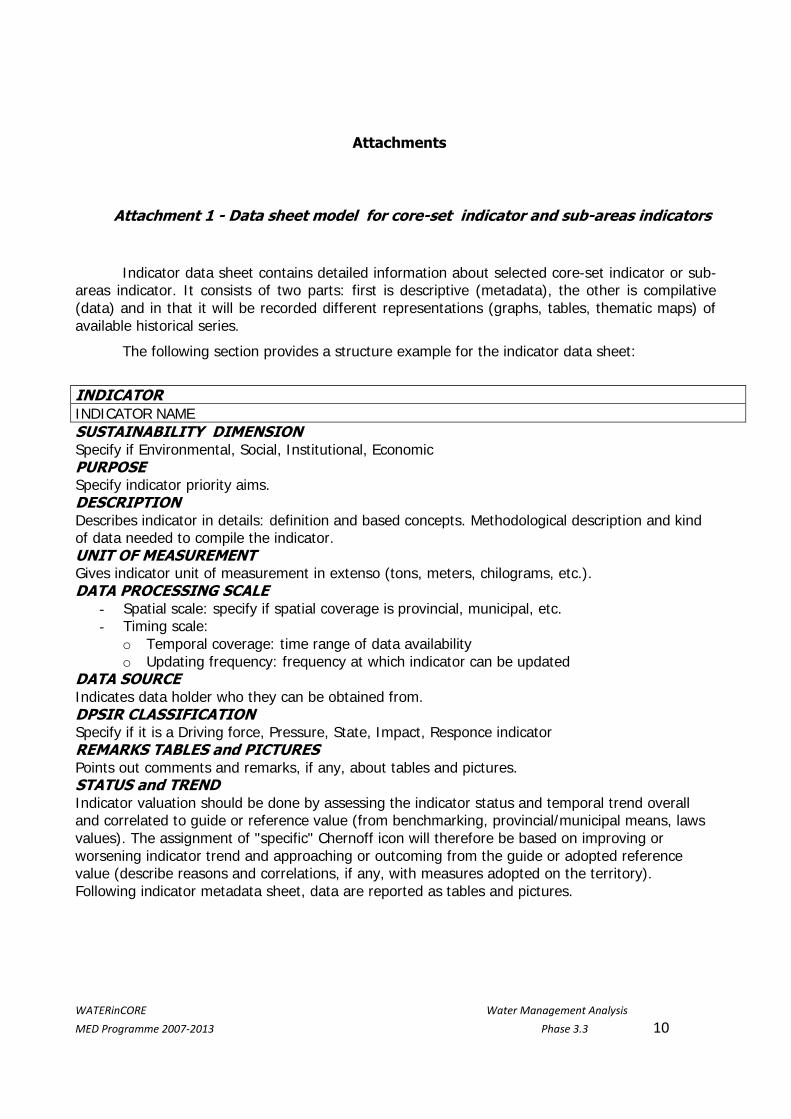
Indicator data sheet contains detailed information about selected core-set indicator or sub-areas indicator. It consists of two parts: first is descriptive (metadata), the other is compilative (data) and in that it will be recorded different representations (graphs, tables, thematic maps) of available historical series.
The following section provides a structure example for the indicator data sheet:
INDICATOR INDICATOR NAME
SUSTAINABILITY DIMENSION Specify if Environmental, Social, Institutional, Economic PURPOSE Specify indicator priority aims. DESCRIPTION Describes indicator in details: definition and based concepts. Methodological description and kind of data needed to compile the indicator. UNIT OF MEASUREMENT Gives indicator unit of measurement in extenso (tons, meters, chilograms, etc.). DATA PROCESSING SCALE
- Spatial scale: specify if spatial coverage is provincial, municipal, etc. - Timing scale:
o Temporal coverage: time range of data availability o Updating frequency: frequency at which indicator can be updated
DATA SOURCE Indicates data holder who they can be obtained from. DPSIR CLASSIFICATION Specify if it is a Driving force, Pressure, State, Impact, Responce indicator REMARKS TABLES and PICTURES Points out comments and remarks, if any, about tables and pictures. STATUS and TREND Indicator valuation should be done by assessing the indicator status and temporal trend overall and correlated to guide or reference value (from benchmarking, provincial/municipal means, laws values). The assignment of "specific" Chernoff icon will therefore be based on improving or worsening indicator trend and approaching or outcoming from the guide or adopted reference value (describe reasons and correlations, if any, with measures adopted on the territory). Following indicator metadata sheet, data are reported as tables and pictures.

WATERinCORE Water Management Analysis
MED Programme 2007-2013 Phase 3.3 11
Attachment 2 - Data sheet model for context indicator
Indicator data sheet contains detailed information about selected context indicator.
It consists of two parts: first is descriptive (metadata), the other is compilative (data) in the latter they will be recorded changing number of representations (graphs, tables, thematic maps) of available historical series.
The following section provides a structure example for the indicator data sheet:
INDICATOR INDICATOR NAME
SUSTAINABILITY DIMENSION Specify if Environmental, Social, Institutional, Economic PURPOSE Specify indicator priority aims. DESCRIPTION Describes indicator in details: definition and based concepts, methodological description and kind of data needed to compile the indicator. UNIT OF MEASUREMENT Gives indicator unit of measurement in extenso (tons, meters, chilograms, etc.). DATA PROCESSING SCALE
- spatial scale: Specify if spatial coverage is provincial, municipal, etc. - timing scale:
o Temporal coverage: time range of data availability o Updating frequency: frequency in which indicator can be updated
DATA SOURCE Indicates data holder who they can be obtained from. DPSIR CLASSIFICATION Specify if it is a Driving force, Pressure, State, Impact, Responce indicator REMARKS TABLES and PICTURES Points out comments and remarks, if any, about tables and pictures. STATUS and TREND Describes indicator status and variation trend over the time. Following indicator metadata sheet, data are reported as tables and pictures.

WATERinCORE Water Management Analysis
MED Programme 2007-2013 Phase 3.3 12
EXAMPLE OF DRAWING UP OF DATA SHEET MODEL FOR SUB-AREAS INDICATOR
Attachment 1 – ARPA SiCILIA GuidELine (From ―ARPA Sicilia, Annuario regionale dei dati ambientali 2007, Palermo, 2008‖ with
modifications)
INDICATOR
SUITABILITY FOR BATHING SUSTAINABILITY DIMENSION Environmental PURPOSE The indicator ―suitability for bathing‖ indicates coastal water quality assessing the presence or absence of pollution sources, mainly due to urban sewage, and the efficiency of sewage treatment. DESCRIPTION It is estimated the percentage ratio of the length (misured in km) of coast asserted suitable for bathing on that effectively controlled. Further information can be deduced from the relationship "no bathing coast / total coast" for its significance as potential impact (human activity on the coast) and only at larger time scale (permanent interdiction shows significant changes only considering periods of 5 - 10 years). Necessary samples for judging suitability for bathing or to put the temporary and / or permanent interdiction, are carried out fortnightly from April to September. According to the Decree of the President of the Republic (D.P.R) No. 470/82 are considered bathing waters those coastal water (and, if present, freshwater or lake) in which bathing is explicitly authorized or "not prohibited". All areas "permanently interdected" for bathing, indicated by the Region, are excluded from the control system, either if prohibited for reasons indipendent from pollution, for example due to the presence of ports, military zones, areas of full protection etc.. , or for pollution, resulting from laboratory analysis. The D.P.R. No 470/82 identifies as suitable for bathing waters whose parameters, analyzed with the frequency identified by the same decree, comply with those provided, at least in 90% of cases. For physical-chemical parameters not complying, the values must not exceed 50% of the maximum limits provided. For microbiological parameters, it is sufficient a compliance of 80% but this limit is increased to 95% when the concentrations of faecal coliforms and faecal streptococci exceed the peremptory limits and, simultaneously, the non-compliance due to chemical-physical parameters don’t reach values 50% higher than given limits. Are consideres not suitable for bathing even all those areas where there were no controls

WATERinCORE Water Management Analysis
MED Programme 2007-2013 Phase 3.3 13
in number compliant to laws or they have not been checked at all. These are, largely, shores of the smaller islands or stretches of coast difficult to reach. UNIT OF MEASUREMENT percentage DATA PROCESSING SCALE
- Spatial scale: provincial, municipal - Timing scale:
o Temporal coverage: 2000-2007 o Updating frequency: annual
DATA SOURCE All data are from elaboration by ARPA Sicilia based on data pubblished by Department of Healt, Healt Information System, Department of Prevention, ―Bathing water Quality‖. Summary of results of 2003-2007 seasons. DPSIR CLASSIFICATION State indicator REMARKS TABLES and PICTURES In table 1.1, in figures 1.12 and 1.13 are reported rate of suitable coast for bathing and interdicted coast due to pollution, and their trend from 2000 to 2007. Figure 1.13 shows cartography detailed at provincial scale, of distribution of coast suitability for bathing in Siciliy at the end of bathing season in 2007. STATUS and TREND
Data reported in table 1.1 and Figure 1.1 points out that percentage has already been almost high in the whole island since 2000, showing a mean of bathing coast of that controlled higher than 98%. During 2000-2006 period the percentage of bathing coast increased significantly, reaching a value of 100% in five out of eight provinces, reaching the percentage of 99% in the remaining three provinces. The value of 99% in Sicily, lower than in previous years, is dued to the increase in the percentage of costs controlled throughout the island. As to the percentage of interdected coast due to pollution/whole coast, data from all interdected coast due to pollution (included in Regional law) are to be considered excluding coastline ―permanently interdected‖ for pollution. Figure 1.1 shows the trend of pollution and suitability for bathing in the last eight years.

WATERinCORE Water Management Analysis
MED Programme 2007-2013 Phase 3.3 14
Table 1.1: Percentage of coast suitable for bathing (of that controlled) and of interdected coast due to pollution (upon the whole) (2003-2007).
bathing coast / coast controlled (%)
interdected coast due to pollution / whole coast (%)
2000
2001
2002
2003
2004
2005
2006
2007
2000
2001
2002
2003
2004
2005
2006
2007
Agrigento 99,6 100 100 100 100 100 100 100 0,2 0 0 0 0 0 0 0
Caltanissetta
91,2 91,2 91,2 91,2 91,2 91,2 100 91,6 7,3
7,3 7,3 7,3 7,3 7,3 0 7
Catania 98,7 98,2 98,6 98,5 98,1 98,2 100 96,5 1 1,3 1 6,4 6,4 4,1 0,7 2,4
Messina 99,8 99,8 99,4 99,5 99,5 99,5 99,2 99,1 0,1 0,2 0,6 0,5 0,5 0,4 0,7 0,7
Palermo 98,8 97,5 98,5 99 98,7 98,6 98,9 97,8 0,6 1,3 1,4 2,5 2,5 1,2 2,6 1,2
Ragusa 99,5 99,5 99,5 97,5 100 100 100 100 0,4 0,4 0,4 0 0 0 0 0
Siracusa 99,2 99,4 100 99,7 99,7 99,7 99,7 99,8 0,4 0,3 1,1 0,1 0,1 0,3 3,4 0,1
Trapani 100 100 100 100 100 100 100 100 0 0 0,5 0 0 0 0,5 0
Sicilia 99,3 99,2 99,3 99,1 99,3 99,3 99,6 99 0,4 0,5 0,8 0,9 0,9 0,6 1,1 0,6
Source: Elaboration based on Department of Health data, 2008.
Bathing and polluted Sicilian coast
98,0
98,5
99,0
99,5
100,0
2000 2001 2002 2003 2004 2005 2006 2007
anno
ba
thin
g c
oa
st
(%)
0,0
0,2
0,4
0,6
0,8
1,0
1,2
inte
rde
cte
d c
oa
st
du
e t
o p
oll
uti
on
(%)
Costa balneabile / costa controllata (%)
Costa vietata per inquinamento / costa totale (%)
Source: Elaboration based on Department of Health data, 2008.
Figura 1.12: Trends of percentage of coast suitable for bathing/controlled
coast (2000-2007) and and of interdected coast due to pollution /the whole coast (2000-2007)

WATERinCORE Water Management Analysis
MED Programme 2007-2013 Phase 3.3 15
Costa Balneabile (%)
Costa insufficientemente campionata e/o non controllata (%)
Costa interdetta per inquinamento (%)
48%
52%
31%
67%
2%
85%
14% 1%
11%
89%
59%
41%
56%
44%
1%45%
54%
76%
7%17%
Source: Elaboration by ARPA Sicilia based on Department of Health data, 2008.
Figure 1.13: Cartography of distribution of suitability for bathing in Sicily detailed in provincial scale (2007).
WATERinCORE Water Management Analysis
MED Programme 2007-2013 Phase 3.3 16
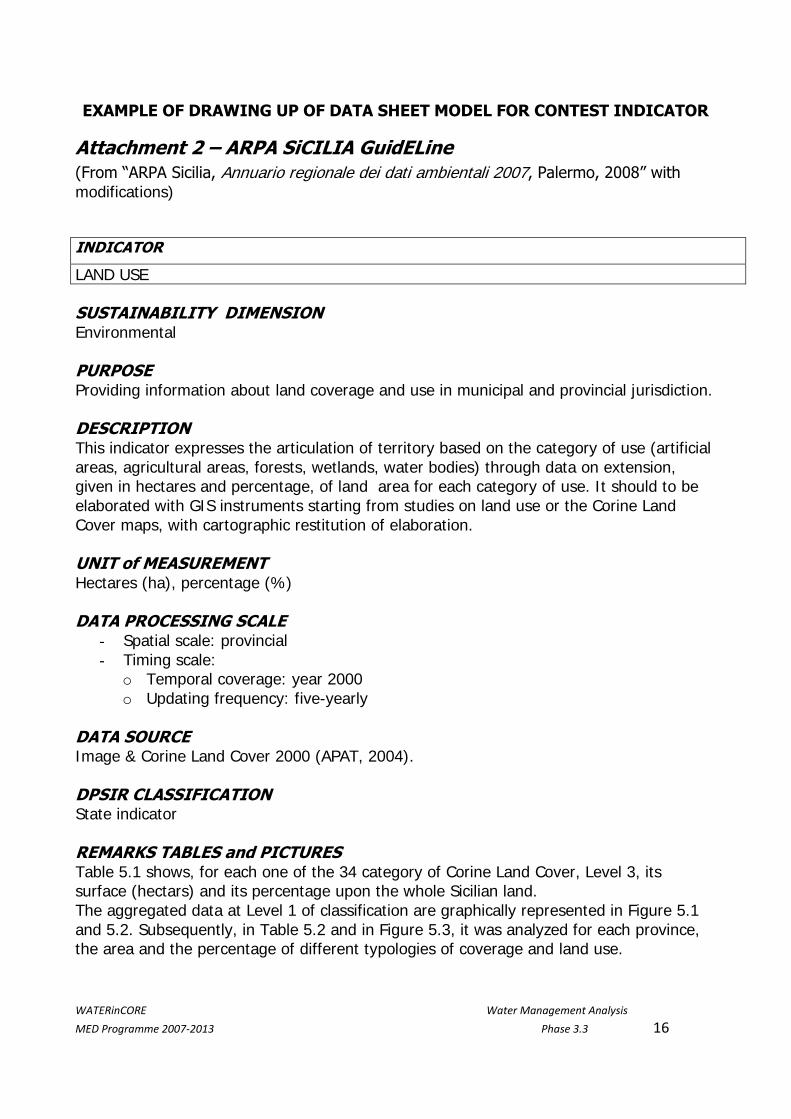
EXAMPLE OF DRAWING UP OF DATA SHEET MODEL FOR CONTEST INDICATOR
Attachment 2 – ARPA SiCILIA GuidELine (From ―ARPA Sicilia, Annuario regionale dei dati ambientali 2007, Palermo, 2008‖ with modifications) INDICATOR
LAND USE SUSTAINABILITY DIMENSION Environmental PURPOSE Providing information about land coverage and use in municipal and provincial jurisdiction. DESCRIPTION This indicator expresses the articulation of territory based on the category of use (artificial areas, agricultural areas, forests, wetlands, water bodies) through data on extension, given in hectares and percentage, of land area for each category of use. It should to be elaborated with GIS instruments starting from studies on land use or the Corine Land Cover maps, with cartographic restitution of elaboration. UNIT of MEASUREMENT Hectares (ha), percentage (%) DATA PROCESSING SCALE
- Spatial scale: provincial - Timing scale:
o Temporal coverage: year 2000 o Updating frequency: five-yearly
DATA SOURCE Image & Corine Land Cover 2000 (APAT, 2004). DPSIR CLASSIFICATION State indicator REMARKS TABLES and PICTURES Table 5.1 shows, for each one of the 34 category of Corine Land Cover, Level 3, its surface (hectars) and its percentage upon the whole Sicilian land. The aggregated data at Level 1 of classification are graphically represented in Figure 5.1 and 5.2. Subsequently, in Table 5.2 and in Figure 5.3, it was analyzed for each province, the area and the percentage of different typologies of coverage and land use.

WATERinCORE Water Management Analysis
MED Programme 2007-2013 Phase 3.3 17
STATUS and TREND From elaboration of Corine Land Cover 2000 (APAT, 2004) data, results that most part of regional surface (63%) is covered by agricultural land, among which approximately 32% of the area is characterized by arable land, followed by woodland (mostly degraded forests and deciduous) and semi-natural areas (in most part pasture, fallow, bush scrubs), which cover 31% of the whole regional surface (Table 5.1 and Figure 5.1). Evaluating the spatial distribution of the typologies of land use, it results that most of the artificial surface (urbanization, infrastructure, industries, ports, etc..) and the one used for agriculture lies in the provinces of Palermo and Catania, the wooded areas are mainly in the province of Messina and Palermo, the water bodies in the province of Messina, and wetlands in the province of Trapani (Table 5.2 and Figure 5.3).

WATERinCORE Water Management Analysis
MED Programme 2007-2013 Phase 3.3 18
Table 5.1: Land use in Sicily (2000)
Level 1 Level 2 Level 3 Surface
(hectars)
% upon the
whole of regional
surface
Artificial
surfaces
Mines, dumps and
construction sites
Mineral extraction sites 7.350 0,28
Construction sites 387 0,02
Dump 54 0,00
Industrial, commercial and trasport units
Airports 2.209 0,09
Industrial and commercial units 9.831 0,38
Sea ports 754 0,03
Road and rail networks 499 0,02
Urban Fabric Continuous Urban Fabric 36.564 1,42
Discontinuous Urban Fabric 66.173 2,56
Artificial non-
agricultural vegetated areas
Sport and Leisure facilities 409 0,02
Green urban areas 546 0,02
Agricoltural
areas
Permanent crops
Fruit trees and berries plantations 167.726 6,50
Olive groves 240.823 9,33
Vineyards 161.747 6,26
Pastures Unimproved grassland 817.155 31,65
Heterogeneous
agricultural areas
Land principally occupied by agricolture with
significant areas of natural vegetation 77.371 3,00
Annual crops associated with permanent
crops 45.213 1,75
Complex cultivation patterns 127.093 4,92
Forest and
semi-natural areas
Open spaces with little
or no vegetation
Sparsely vegetated areas 25.633 0,99
Bare rocks 20.921 0,81
Beaches, dunes, sand 317 0,01
Forest
Coniferous forests 30.621 1,19
Broad-leaves forests 139.137 5,39
Mixed forests 23.052 0,89
Scrub and/or
herbaceous vegetation
associtions
Natural grassland 249.080 9,65
Transitional woodland scrub 53.416 2,07
Sclerophyllous vegetation 182.610 7,07
Moors and heathlands 83.557 3,24
Wetlands
Inner wetlands Inland marshes 154 0,01
Coastal wetland Salt marshes 538 0,02
Salines 1.473 0,06
Water
bodies
Continental waters Water bodies 5.390 0,21
Stream courses 3.991 0,15
Marine waters Estuaries 25 0,00
Total 2.581.819 100,00
Source: Elaborations by ARPA Sicilia based on data: APAT, Image & Corine Land Cover 2000 (2004)

WATERinCORE Water Management Analysis
MED Programme 2007-2013 Phase 3.3 19
Table 5.2: Land Use in Sicily (ha), for each province (2000)
Province Artificial
surfaces
Agricoltural
areas
Forest and semi-natural
areas
Wetlands Water bodies Grand total
Agrigento 11.573 224.336 68.693 71 454 305.127
Caltanissetta 5.031 165.516 42.909 337 213.793
Catania 24.118 219.852 112.927 345 357.242
Enna 3.580 168.294 84.078 1.527 257.480
Messina 19.036 100.873 203.008 3.372 326.290
Palerme 24.738 307.807 166.418 1.740 500.703
Ragusa 6.965 129.807 25.371 150 162.292
Syracuse 11.829 125.513 73.468 421 1.027 212.258
Trapani 17.905 195.129 31.474 1.673 453 246.634
Sicily 124.774 1.637.128 808.346 2.165 9.406 2.581.819
Source: Elaborations by ARPA Sicilia based on data: APAT, Image & Corine Land Cover 2000 (2004)
63,41
31,31
4,830,360,08
Superfici artificiali Superfici agricole utilizzate Territori boscati e ambienti semi-naturali Zone umide Corpi idrici
Source: Elaborations by ARPA Sicilia based on data: APAT, Image & Corine Land Cover 2000 (2004)
Figure 5.1: Surfaces distribution (%) of land cover/use in Sicily (2000)

WATERinCORE Water Management Analysis
MED Programme 2007-2013 Phase 3.3 20
-
200.000
400.000
600.000
800.000
1.000.000
1.200.000
1.400.000
1.600.000
1.800.000
Superfici artificiali Superfici agricole utilizzate Territori boscati e ambienti
semi-naturali
Zone umide Corpi idrici
su
perf
icie
(ett
ari
)
Source: Elaborations by ARPA Sicilia based on data: APAT, Image & Corine Land Cover 2000 (2004) Figure 5.2: Regional surface (ha) for each category of land use/cover (2000)
0%
20%
40%
60%
80%
100%
Agrigento Caltanissetta Catania Enna Messina Palermo Ragusa Siracusa Trapani
su
perf
icie
(%
)
Superfici artificiali Superfici agricole utilizzate Territori boscati e ambienti semi-naturali Zone umide Corpi idrici
Source: Elaboration ARPA Sicilia based on data: APAT, Image & Corine Land Cover 2000 (2004)
Figure 5.3: Surfaces distribution (%) of land use/cover for each province (2000)


![Water level indicator [autosaved]](https://img.pdfslide.us/doc/110x75/587996bd1a28ab95318b6a91/water-level-indicator-autosaved.jpg)