Embed Size (px)
Citation preview
1
WATER INTAKE AND FACTORS AFFECTING WATER INTAKE OF GROWING BEEF CATTLE IN NORTH FLORIDA
By
MEGAN NOEL BREW
A THESIS PRESENTED TO THE GRADUATE SCHOOL OF THE UNIVERSITY OF FLORIDA IN PARTIAL FULFILLMENT
OF THE REQUIREMENTS FOR THE DEGREE OF MASTER OF SCIENCE
UNIVERSITY OF FLORIDA
2008

2
© 2008 Megan Noël Brew

3
To my sweetest son, Riley Joshua Brew. You are my sunshine.
4
ACKNOWLEDGMENTS
The author wished to express her appreciation and gratitude to Dr. Robert Myer,
chairman of the supervisory committee, for his valuable guidance and assistance throughout her
graduate program. Special appreciation is also extended to Dr. Jeff Carter and Dr. Gary Hanson
for their invaluable wisdom, assistance, and support. Acknowledgments are also due to Dr.
Matthew Hersom, for his time and advice as a committee member, and to Dr. Saundra Tenbroeck
for her kindness, wisdom, and friendship.
Recognition and appreciation are also due to Mrs. Mary Maddox for her assistance in the
field and to Ms. Meghan Brennan for her assistance with statistical analysis of the many pages of
data that this research generated. An abundance of gratitude is due to all of the North Florida
Research and Education Center (NFREC) Beef Unit and Feed Efficiency Barn personnel.
Without their hard work none of this would have been possible.
The author is especially grateful to her fellow graduate students who provided her with
support, assistance, and constant amusement. Special thanks are due to Mrs. Kelly Vineyard,
Mrs. Sarah Dilling, Ms. Jamie Foster, and Mr. Jerome Vickers. Without their friendship the trials
and tribulations of graduate school would have been insurmountable.
Finally, she wishes express her most sincere appreciation, and deepest affection, to her
son, Riley Brew. His joy, determination, and sweetness were a constant well of inspiration.
5
TABLE OF CONTENTS page
ACKNOWLEDGMENTS ...............................................................................................................4
ABSTRACT.....................................................................................................................................7
CHAPTER
1 GENERAL INTRODUCTION ................................................................................................9
2 LITERATURE REVIEW .......................................................................................................12
Introduction.............................................................................................................................12 Water as a Resource................................................................................................................12
Water Used for Beef Production .....................................................................................14 Future Water Policy.........................................................................................................15
Water as a Nutrient .................................................................................................................16 Biological Functions of Water.........................................................................................16
Factors Influencing Water Intake ...........................................................................................18 Effect of Dry Matter Intake on Water Intake ..................................................................19 Influence of Dietary Nutrients on Water Intake ..............................................................20 Effect of Environment and Temperature on Water Intake ..............................................20 The Influence of Water Temperature on Water Intake ...................................................21 Influence of Access to Water on Water Intake................................................................22 Effect of Breed Type on Water Intake ............................................................................23 Effect of Water Quality on Water Intake ........................................................................23
Water Intake Prediction Equations .........................................................................................26 Measuring Water Intake .........................................................................................................28 The Use of the GrowSafe System to Monitor Water Intake...................................................29 Conclusion ..............................................................................................................................30
3 WATER INTAKE AND FACTORS AFFECTING WATER INTAKE OF GROWING BEEF CATTLE IN FLORIDA...............................................................................................31
Introduction.............................................................................................................................31 Materials and Methods ...........................................................................................................32 Results and Discussion ...........................................................................................................35
4 GENERAL CONCLUSIONS AND SUGGESTIONS FOR FURTHER RESEARCH.........46
LIST OF REFERENCES...............................................................................................................48
BIOGRAPHICAL SKETCH .........................................................................................................54
6
LIST OF TABLES
Table page 2-1 Freshwater withdrawal by categories of use in Florida 1975-2000 ...................................14
2-2 Tolerable levels of Total Dissolved Solids (TDS) in cattle drinking water.......................24
2-3 Approximate Total Daily Water Intake of Beef Cattle ......................................................27
4-1 Water intake by breed ........................................................................................................41
4-2 Water intake by gender ......................................................................................................42
4-3 Intake, ADG, and G:F by Breed .......................................................................................43
4-4 Intake, ADG, and G:F by Gender .....................................................................................44
4-5 Correlations between Variables .........................................................................................45
7
Abstract of Thesis Presented to the Graduate School of the University of Florida in Partial Fulfillment of the
Requirements for the Degree of Master of Science
WATER INTAKE AND FACTORS AFFECTING WATER INTAKE OF GROWING BEEF CATTLE IN NORTH FLORIDA
By
Megan Noël Brew
May 2008
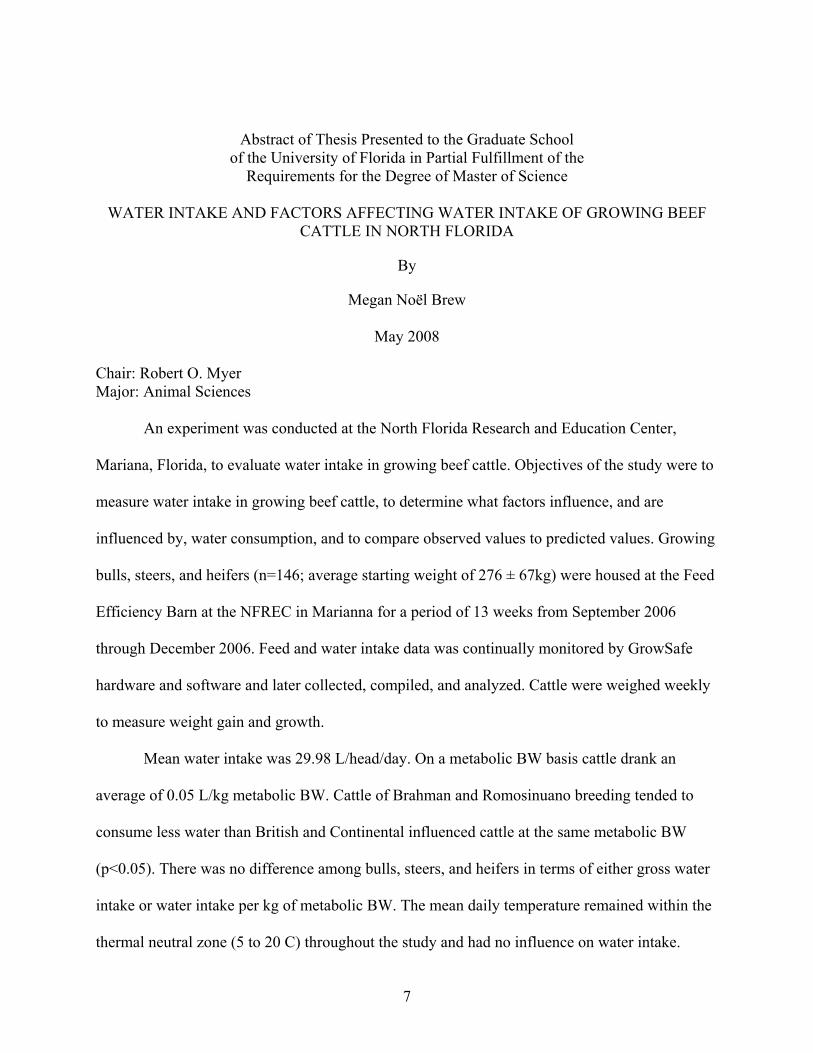
Chair: Robert O. Myer Major: Animal Sciences An experiment was conducted at the North Florida Research and Education Center,
Mariana, Florida, to evaluate water intake in growing beef cattle. Objectives of the study were to
measure water intake in growing beef cattle, to determine what factors influence, and are
influenced by, water consumption, and to compare observed values to predicted values. Growing
bulls, steers, and heifers (n=146; average starting weight of 276 ± 67kg) were housed at the Feed
Efficiency Barn at the NFREC in Marianna for a period of 13 weeks from September 2006
through December 2006. Feed and water intake data was continually monitored by GrowSafe
hardware and software and later collected, compiled, and analyzed. Cattle were weighed weekly
to measure weight gain and growth.
Mean water intake was 29.98 L/head/day. On a metabolic BW basis cattle drank an
average of 0.05 L/kg metabolic BW. Cattle of Brahman and Romosinuano breeding tended to
consume less water than British and Continental influenced cattle at the same metabolic BW
(p<0.05). There was no difference among bulls, steers, and heifers in terms of either gross water
intake or water intake per kg of metabolic BW. The mean daily temperature remained within the
thermal neutral zone (5 to 20 C) throughout the study and had no influence on water intake.
8
Water intake was correlated (p>0.05) with feed intake and gain with heavier feeders
tending to consume more water and gain more weight. There was no relationship between water
intake and gain to feed ratio.
Two common prediction equations, the Murphy and Hicks equations, were used to
predict expected daily water intake. These predicted values were compared with observed values
and were found to be statistically higher than observed values. The Murphy equation
overestimated water intake by an average of 20.20 L/head/day (p<0.05) while the Hicks equation
overestimated water intake by an average of 8.36L/head/day (p<0.05)
9
CHAPTER 1 GENERAL INTRODUCTION
Water has been traditionally considered an inexpensive, readily available, and renewable
natural resource. However, as human populations continue to soar, and major cities continue to
grow at nearly exponential rates, this may not always be the case. Current and future legislation
will enforce stricter guidelines for water use in residential, industrial, and agricultural realms. In
the future ranchers may expect to be held more accountable for water use. Understanding how
much water various types of cattle normally consume, and understanding the relationships that
exist between water intake and performance is the first step to better water stewardship on behalf
of Florida ranchers.
Tropically adapted cattle, such as the Brahman and Romosinuano breeds, are
phenotypically better adapted to living in the hot and humid conditions that are common to
Florida. Their loose skin, long ears, and pendulous briskets and underlines combine to increase
body surface area which in turn allows for greater evaporative cooling of the animal. Numerous
studies have demonstrated that tropically adapted cattle are better able to cope with heat stress
and are more likely to survive and even thrive in hot and humid conditions. The Brahman and
Romosinuano cattle on this study drank significantly less water when compared to the
Continental and British influenced breeds. Admittedly, they gained numerically less per day but
did so with equal efficiency. Incorporating tropically adapted genetics into Florida beef herds
may be one of the most cost effective ways to reduce water consumption.
Water is too vital a nutrient to be withheld from any class of animal. Restricting water
intake decreases performance quicker and more drastically than any other deficiency. Water
intake is influenced by a number of factors including breed type, production state, size of the
10
animal, external temperature and dry matter intake. Water intake in turn may influence a number
of production traits including weight gain, average daily gain, feed intake, and feed efficiency.
The environmental temperature remained within the thermoneutral zone for growing
cattle for the duration of the study and had no influence on water consumption. This trial should
be repeated during other times of the year in order to completely capture the influence of weather
on water intake. Additionally, because the cattle were housed in an open sided barn they were
not exposed to the same degree of heat or wind that they would have experienced in a pasture
setting. It is a valid hypothesis to assume that the artificial shelter provided by the barn may have
had an influence on water intake. Pasture trials, where animals have to walk a distance to water,
and are regularly exposed to sun, wind, and rain, are the next logical step in water intake
research.
Water intake was positively correlated with feed intake. Water intake increased linearly
as dry matter intake increased. These results concur with the literature. Water is vital to proper
feed digestion and it is no surprise that cattle drink more water when dry matter consumption is
increased. Water intake was also positively correlated with average daily gain. Cattle who
consumed greater quantities of water tended to gain more weight per day than those who
consumed less.
Past research has demonstrated an inverse relationship between water intake and feed
efficiency. One theory is that as cattle drink more water they increase the rate of washout from
the rumen thus decreasing dry matter retention time and digestibility. This trial found no
correlation between water intake and gain to feed ratio. Cattle that drank more water gained
weight with the same efficiency as those that drank less water.
11
As water use issues heat up it will be vital that ranchers be able to forecast the amount of
water that their cattle will consume in a given time period. This may be done in one of two ways;
direct measurement or estimation using prediction equations. Directly measuring water intake is
expensive, time consuming, and labor intensive even in a research setting and is simply not
practical in production settings. To combat this, prediction equations were created which
estimate water intake based on a number of contributing factors. Two of the most widely used
prediction equations are the Murphy equation, which was developed for dairy cattle but can be
modified for use with beef cattle, and the Hicks equation which was developed specifically for
feedlot steers.
Using actual data generated by this research trial the Murphy and Hicks equations were
used to predict water intake. The Murphy equation over predicted water intake by 20.20 L/
head/d and the Hicks equation overestimated water intake by 8.36 L/ head/d. The creation of new
equations, or refinement of existing equations, is needed in order to more accurately and
precisely capture water intake in growing beef cattle. However, all of the factors that influence
water intake must first be identified, and the weight that their influence carries must be
evaluated.
As we move further into the new millennium, issues relating to water use will become
more contested. As stewards of the land, Florida ranchers have been charged with the
responsibility of understanding the ways in which water is used both on their ranch and by their
animals. This study, as well as future research which will follow, will be instrumental in
accomplishing this goal.
12
CHAPTER 2 LITERATURE REVIEW
Introduction
There has been very little research on beef cattle water intake. Water has historically been
viewed as a cheap and renewable resource; however this is changing on local, national, and
international levels. An increase in regulations governing water resources increases the need for
researchers and producers to appreciate the impact that current and future legislation may have
on the beef cattle industry (Morse, 1995).
Water as a Resource
Approximately 1.1 billion people throughout the world have no access to safe drinking
water. This is generally not the case in the U.S.; however, conflicts over water rights do exist
between and within several states, including Florida. A 2003 report by the Florida Council of
100 recommended “developing a system which enables water distribution from water-rich to
water-poor areas”. This report incited widespread opposition by Floridians, thus setting the stage
for potentially prolonged water conflicts within the state (Holt, 2007).
Florida is well known for its natural wetlands and artesian springs, both excellent sources
of drinking water. However, enormous population growth in the latter part of the 20th century has
resulted in the destruction of thousands of acres of wetlands, and threatened the states’ drinking
water supply (Florida Department of Environmental Protection, 2007)
Approximately 90% of Florida’s drinking water comes from groundwater with the
remaining 10% being derived from surface water. Groundwater withdraws are expected to
outstrip demand in the near future. As the population in Florida continues to surge groundwater
will be increasingly less able to meet demands. The population in Florida is projected to exceed
13
22.6 million by 2020 and the demand for potable water is expected to increase to an estimated
34.4 billion l/d (Florida Department of Environmental Protection, 2007).
Rainfall in Florida averages 137 to 139 cm per year. However rainfall is highly variable
year to year ranging from 76 to 203 cm annually. Additionally only 30% of rainwater ever finds
its way to bodies of water or aquifers (Florida Department of Environmental Protection, 2008).
The distribution of rainfall and the demands for potable and recreational water are also highly
variable throughout the state. The south, southwest, and central regions of Florida have
experienced the greatest population increases relative to water supply. These highly populated
regions are geographically water poor and existing groundwater sources are threatened by
population growth. The threats to groundwater in heavily populated areas are two fold. First,
excessive urban growth results in little open land for rainwater to accumulate, seep, and
recharge. Second, excessive groundwater pumping has resulted in saltwater intrusion (Florida
Department of Environmental Protection, 2007). The majority of cattle production in Florida
takes place south of Interstate 4 (Florida Department of Environmental Protection, 2007),
therefore the water demands of beef cattle must also be taken into account when considering the
water crisis in this area.
Freshwater uses in Florida can be categorized under six types of users; agricultural
irrigation, public supply (households served by water utilities), domestic self supply (households
served by personal wells), industrial/commercial, electric generation, and recreation irrigation.
Agricultural irrigation includes water withdrawals for crops, livestock, and aquaculture.
Agricultural irrigation represents the largest water withdrawal followed by public supply. A
percentage of the public supply and domestic self supply may also represent agricultural uses on
a small scale.
14
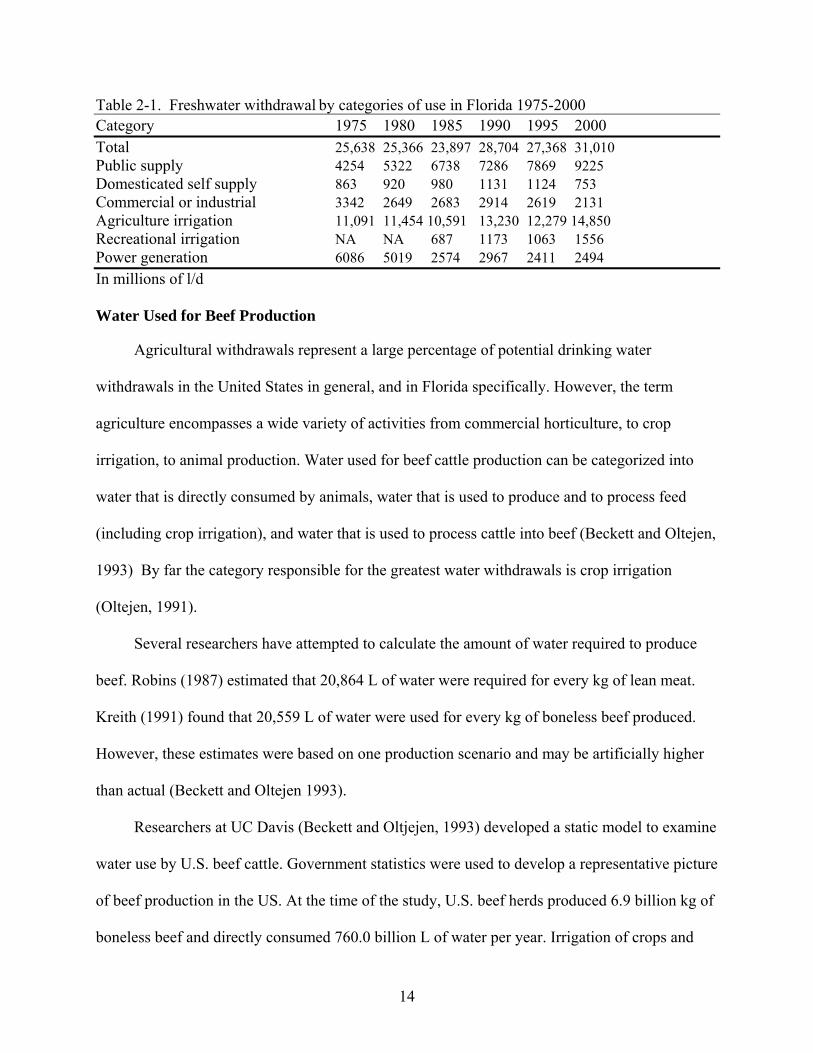
Table 2-1. Freshwater withdrawal by categories of use in Florida 1975-2000 Category 1975 1980 1985 1990 1995 2000 Total 25,638 25,366 23,897 28,704 27,368 31,010 Public supply 4254 5322 6738 7286 7869 9225 Domesticated self supply 863 920 980 1131 1124 753 Commercial or industrial 3342 2649 2683 2914 2619 2131 Agriculture irrigation 11,091 11,454 10,591 13,230 12,279 14,850 Recreational irrigation NA NA 687 1173 1063 1556 Power generation 6086 5019 2574 2967 2411 2494 In millions of l/d
Water Used for Beef Production
Agricultural withdrawals represent a large percentage of potential drinking water
withdrawals in the United States in general, and in Florida specifically. However, the term
agriculture encompasses a wide variety of activities from commercial horticulture, to crop
irrigation, to animal production. Water used for beef cattle production can be categorized into
water that is directly consumed by animals, water that is used to produce and to process feed
(including crop irrigation), and water that is used to process cattle into beef (Beckett and Oltejen,
1993) By far the category responsible for the greatest water withdrawals is crop irrigation
(Oltejen, 1991).
Several researchers have attempted to calculate the amount of water required to produce
beef. Robins (1987) estimated that 20,864 L of water were required for every kg of lean meat.
Kreith (1991) found that 20,559 L of water were used for every kg of boneless beef produced.
However, these estimates were based on one production scenario and may be artificially higher
than actual (Beckett and Oltejen 1993).
Researchers at UC Davis (Beckett and Oltjejen, 1993) developed a static model to examine
water use by U.S. beef cattle. Government statistics were used to develop a representative picture
of beef production in the US. At the time of the study, U.S. beef herds produced 6.9 billion kg of
boneless beef and directly consumed 760.0 billion L of water per year. Irrigation of crops and
15
production of feedstuff for beef cattle accounted for 12,991 billion L of water with irrigated
pasture costing an additional 11,243 billion L. Finally, carcass processing required 79 billion L
of water annually. Beckett and Oltjen (1993) model estimated 3,682 L of developed water were
withdrawn for every kilogram of boneless beef produced. This estimate was significantly lower
than previously suggested (Beckett and Oltejen, 1993) by Robins (1987) and Kreith (1991).
Irrigation, of both crops and pasture, accounted for the largest portion of water use by U.S. beef
cattle. Intensifying or reducing irrigation may be the most effective way of decreases water use
in beef cattle operations. Water is too important a nutrient to be denied to any class of animal,
but understanding water intake may allow cattle producers to more accurately predict water
needs and to better justify water withdrawals.
Future Water Policy
Water is a commodity, subject to the usual economic pulls of supply and demand, to public
policy, and to environmental considerations. The state of Florida is currently investigating ways
to shape the pricing structure for water to better represent the real cost of supplying water.
Compared to other industrial nations, the U.S. charges a nominal amount for water. Germans pay
1.78 USD per cubic meter of water, the French pay 1.08 USD, the British 1.23 USD, and
Americans only .054 USD (OECD, 1999).
To legally withdrawal water from aquifers, lakes or rivers in Florida, users must receive
consumptive use permits from Florida’s water management districts or the Department of
Environmental Protection. Applicants must establish that the proposed use of water meets three
requirements: 1) it is a reasonable beneficial use; 2) it will not interfere with any presently
existing legal water use; and 3) it is consistent with public interests (Florida Department of
Environmental Protection, 2007).
16
The impending water crisis and renewed interest in protecting water as a resource has
profound implications for cattle producers in the state of Florida. In the near future, ranchers may
expect to be held accountable for their water usage, up to and including being required to apply
for special permits before expanding existing operations. It is absolutely essential that ranchers
be able to accurately estimate the amount of water that is used on their operation. Current
estimates of beef cattle water intake are based on antiquated data gathered under varying
circumstances. The genetics of the beef animal have changed dramatically over the past 50 yr
and these established values may no longer be representative of the modern animal. Furthermore,
current prediction equations that are used to estimate water intake by beef cattle may or may not
be accurate.
Water as a Nutrient
Water is the single most important nutrient for animal health and production (Harris and
Van Horn, 1991) Indeed the mature bovine body contains 55 to 65% water. Water makes up 75
to 80% of a calves body (Adams and Sharpe, 1995). Sources of water include water contained in
feedstuff as moisture, metabolic water derived from the oxidation of fat and protein in the body,
as well as water that is directly consumed. Of these sources, drinking water represents the
largest portion (Stockhill, 1991).
Biological Functions of Water
Water has several important functions in the body. Water is required for digestion,
metabolism, and transport of nutrients, excretion of waste products, maintenance of proper ion
and fluid balance, and for temperature regulation (Beede and Myers, 2000). Water also plays an
important role in reproduction, providing a fluid envelope for the developing fetus and later
contributing to milk production. From a production standpoint, water is required for growth of
tissue and production of milk.
17
Approximately 66% of water in the body is intracellular with the remaining third being
found in extracellular spaces, in connective tissues, and in the digestive tract (Beede, 2005).
Water constitutes 98% of all molecules in the body. An ideal solvent for glucose, amino acids,
mineral ions, water soluble vitamins and metabolic waste, water is vital for the hydrolysis of
nutrients and the regulation of mineral homeostasis (Gerrish and Davis, 1995). Water in the
digestive tract, including the rumen, accounts for between 15 to 35% of BW (Odwongo et al.
1985). A molecule of water will remain in the rumen for an hour before being transported
elsewhere in the body (Woodford et al. 1984).
Loss of only 20% total body water is fatal (Boyles, 2004). Water loss can occur through
production, urinary and fecal excretion, sweating, and respiration. In lactating dairy cattle, daily
losses via milk production represented 26 to 34% of total water intake (Holter and Urban, 1992).
Between 30 and 35% of total water intake was lost in the feces of lactating dairy cattle, losses in
urine represented 15 to 22% of total water consumed (Holter and Urban, 1992; Dahlborn et al.
1998). Fecal water losses increase as DM intake and DM content of the diet increase in dairy
cattle (Murphy, 1983). Approximately 18% of total water loss in dairy cattle is associated with
sweat, saliva, and respiration (Holter and Urban, 1992). Water losses associated with sweat and
respiration are highly dependent on environmental temperature and may be greater when
temperatures are above the thermoneutral zone ( McDowell and Weldy, 1967).
Limitations on water intake depress animal performance quicker and more drastically
than any other nutrient deficiency (Boyles, 2004).. Domesticated cattle can live for up to 60 d
without food but will not survive over a week without water (Boyles, 2004). The onset of
dehydration can occur rapidly once water has been restricted or removed. Signs of dehydration
include tightening of the skin and loss of associated elasticity, loss of weight, and drying of the
18
mucous membranes and eyes. Chronic dehydration can cause urinary calculi or water belly. As
water flow to the bladder and kidney is reduced and kidney stones are formed. When the stones
become too big to pass through the urethra, a condition known as water belly results.
Factors Influencing Water Intake
Combinations of factors are involved in determining the quantity of water that is needed by
cattle. These factors include physiological state, age, activity level and size of the animal,
environmental air temperature and movement, diet and nutrient composition, and the quality of a
particular water source (Murphy, 1983; Holter and Urban, 1992, Hicks et al., 1988). Other
factors may include frequency of watering, temperature of the water itself, and behavioral
interactions of animals (Beede, 1992). The water requirement of beef cattle is a sum of all water
needed for growth, fetal development, lactation, and replacement of body stores lost in urine,
feces, sweat and respiration. Anything that impacts these needs or losses will alter the volume of
water required.
Body water is lost through excretion from the kidney as urine, from the gastrointestinal
tract as feces, from the skin as sweat, and as water vapor from the lungs.
The amount of water that is lost as urine is dependent on a number of factors including
water consumption, air temperature, and the activity and production level of the animal. The
antidiuretic hormone vasopressin affects urine production by controlling the reabsorption of
water from the kidney tubules and ducts. When water intake is restricted, urine can be
concentrated thus reducing the water requirement by a small amount. Water requirement will
increase when the diet is high in diuretic substances such as protein, salt, and certain minerals
(Weeth et al., 1965).
The volume of water that is lost in the feces is determined primarily by the nutrient
composition of the feed. Feeds high in minerals cause more water to be excreted in the feces
19
(Weeth et al., 1965). Water is also lost through sweating and as vapor during exhalation. During
periods of high environmental temperature or physical activity, perspiration, and respiration can
result in more water loss than urine. Additionally, the oxidation of certain nutrients produce
water. High energy feeds produce more metabolic water compared to lower energy feeds.
Fasting animals and those fed low protein diets may also form water trough the breakdown of
body protein and fat (Reid et al., 1955).
Effect of Dry Matter Intake on Water Intake
Water is closely tied to DM intake and DM digestion. There is a direct positive
relationship between DMI and water intake in cattle (Beede, 1992). If water intake is depressed,
DM intake will also be depressed. Water requirements are met not only by directly consuming
water, but also through the moisture content of feed. The DM content of a feed influences how
much water an animal must drink to meet the requirement, with DM content being positively
correlated to drinking water intake (Paquay et al. 1970; Little, 1978; Murphy et al. 1983; Holter
and Urban, 1992).
Consumption of high moisture forage, such as fresh grass, may reduce the drinking water
requirement. Conversely, Castle and Thomas (1975) found that dairy cattle water intake was
dependent solely on DM content of the concentrate feed and was not related to forage type.
Urban (1992) found little difference in terms of water intake between dairy cattle fed diets of 70
and 50% DM. When DM content of the diet was reduced from 50 to 30% (moisture content
increased from 50 to 70%) drinking water intake decreased by 42%. Dairy cattle managed on
fresh pasture met 62% of their water requirement with the moisture found in grass (Stockdale
and King, 1983).
Dry matter content of feed and total water consumption (feed moisture + drinking water)
may be negatively correlated. Paquay et al. (1970) and Stockdale and King (1983) found that as
20
DM intake increased, direct consumption of water also increased but total water intake actually
decreased in dairy cattle. Holter and Urban (1992) found that as dietary DM content increased
from 30 to 60% total water consumption decreased by 14.97 kg/d in dairy cattle. When DM
content was further increased from 60 to 90% total water intake was reduced by an additional
4.99 kg/d in dairy heifers.
Restricting water intake in cattle increases the apparent digestibility of DM, organic
matter (OM), and crude fiber (CF) (Larsen et al.,1917; Balch et al. 1955; French, 1956; Phillips,
1961). Water intake and DM intake are highly related, restricting water intake will result in
reduced DM intake. As DM intake decreases, DM digestibility will increase (Brown, 1966). This
is due to the fact that DM is retained in the rumen for longer periods of time allowing for more
complete degradation. Additionally, during periods of water restriction, rumen conditions are
more favorable for cellulose degradation (Thorton and Yates, 1968). The increase in apparent
digestibility may or may not be offset by a decrease in DM intake and may or may not have an
impact on weight gain.
Influence of Dietary Nutrients on Water Intake
As a rule of thumb, cattle will consume between 0.9 and 1.8 kg of water/ kg of DM. Dry
matter rations high in protein and salt may increase this ratio (Bahman et al., 1993). Holter and
Urban (1992) found that raising the CP content of feed from 12 to 13% resulted in an average
increase in water intake of 0.99 kg/head/d in dry dairy cows.
Effect of Environment and Temperature on Water Intake
Environmental temperature plays a significant role in regulating water intake in all classes
of cattle. As environmental temperature increases, more water is lost via sweat and respiration.
In order to compensate for these losses, water intake must also increase. McDowell and Weldy
(1967) found that dairy cows drank twice the volume of water at 32 C weather as they did at 3
21
to10 C weather. Water intake was positively related to temperature in several other studies as
well (Richards 1985; Holter and Urban 1992). Murphy et al. (1983) and Andersson (1987) found
that water intake increases 1.2 kg (1.11 L) per degree (C) increase in barn temperature in dairy
cattle. Temperature may be an even bigger determinant of water intake than DM intake.
Ragsdale and colleagues (1949) demonstrated that water intake and DM intake are comparable at
temperatures of up to 27 C in dairy cows. However, once environmental temperatures surged
above 27.2 C water intake increased independent of DM intake.
Temperature alone is not the only environmental determinant of water intake in cattle.
Feedlot steers drink more water (31.02 vs 18.93 L/ d) in the summer months than in the winter
months (Hoffman and Self, 1972). Mullick et al. (1952) agreed that water intake was highest in
the summer months and comparable in autumn and spring, and lowest during winter. These
variations in water intake were likely related to temperature differences but may also have been
influenced by weather patterns and the length of daylight. During hot summer months, steers will
drink less water when provided with adequate shade (Hoffan and Self, 1972). Shade had no
influence on water intake during the cooler months. Shultz (1984) supported Hoffman and Self
(1972), finding that dairy cows provided with shade consumed less water. Both studies
concluded that shade keeps cattle cooler in warm temperatures which results in reduced
sweating, and thus reduces water loss (and the need for compensatory increases in water intake).
The Influence of Water Temperature on Water Intake
The temperature of the water itself may also influence consumption particularly when
environmental temperature is outside of the thermoneutral zone. During periods of heat stress,
chilled water (27 to 29 C) may lower body temperature for a maximum of 2.2 hr in dairy cattle
(Stermer et al. 1986). However this effect was not maintained long enough to make a significant
impact on body temperature during heat stress conditions. Research at Texas A&M found that
22
cooling water from between 20 to 30 degrees C to below 10 degrees C resulted in overall
decreased consumption but also reduced incidences of heat stress during the summer months.
Feedlot steers allowed access to cool drinking water will gain 0.13 to 0.18 kg more per
day than those drinking warm water (Stermer et al. 1986). A two year study in California found
that British cattle consumed more feed and gained more weight when given access to cool water
(18.3C) compared to warm water (32.2C). The cattle provided cool water also drank significantly
less than those provided warm water. Water temperature did not appear to affect Brahman X
British crossbred feedlot cattle in terms of intake or performance (Lofgreen et al., 1975)
Cattle may actually prefer warmer water, even during warm weather. Wilks et al (1990)
found that when dairy cows were offered warm and chilled water cafeteria style, they preferred
warm water 97% of the time.
Influence of Access to Water on Water Intake
Animals drink primarily to satisfy thirst. Thirst is triggered by an increase in electrolyte
concentrations in the body fluids. Constant access to water can improve cattle performance
(Landfeld and Bettinger, 2002).This fact has been clearly demonstrated in dairy cattle, with
farmers reporting an additional 0.91 to 2.27 kg of milk output when cows have readily accessible
water compared to animals whose intake was restricted (Landfeld and Bettinger, 2002). Because
DM intake is associated with water intake similar improvements in terms of weight gain may be
expected in beef cattle.
The availability of water has an effect both on the behavior of cattle and on their water
consumption patterns. Cattle prefer to have water available at the time of feeding (Andersson,
1987). If water is not available at the time of feeding, cattle will seek out a water source and
consume 60 to 80% of their total water consumption within a few hours of being fed (Andersson,
1987). Andersson and Lindgren (1987) found that dairy cows given free access to drinking
23
water drank within 15 min of being fed. When adequate water is not available, competition may
occur. In a water availability study with dairy cows, researchers found that dominant cows drink
more frequently (29 vs 26 times/d) and consumed more water than submissive cows (Andersson
and Lindgren 1987).
Effect of Breed Type on Water Intake
Breed type may influence water requirements and therefore water intake in cattle. Beatty
et al, (2006) conducted an experiment to determine what differences existed between the
physiological responses of Bos taurus and Bos indicus cattle to prolonged heat and humidity.
Water intake in both types of cattle increased as heat and humidity increased. Bos taurus cattle
increased their water intake later in the experiment (at a higher temperature) than Bos indicus.
Maximum water intakes during the hot period at least doubled from the control period with
increases being more substantial in Bos taurus cattle. Bos indicus animals consume more feed
during periods of heat stress when compared to Bos taurus animals. Significant acid-base and
electrolyte imbalances also occurred in both types of cattle as temperature became excessive. Bos
taurus cattle imbalances were both more extreme and more prolonged. Beatty et al (2006)
concluded that Bos indicus animals are better equipped to cope with prolonged periods of heat
and humidity as changes in feed intake, body temperature, respiratory rate, and blood gas
parameters were not as dramatic as in Bos taurus.
Effect of Water Quality on Water Intake
Evaluating water intake involves not only quantity, but also quality. Poor quality water can
reduce voluntary intake and may be a source for disease. An estimated 40% of livestock in the
U.S. are watered from streams, lakes, and ponds (Harris and Van Horn, 1991). These cattle may
be susceptible to pollution related diseases. Groundwater may be polluted with manure,
24
pesticides, and parasites from agriculture runoff. Additionally, high levels of certain dissolved
minerals may affect health and reduce consumption.
Water quality may also play a role in determining weight gain. A study from Alberta
Canada (Brawl, 2002) indicated that beef cows with access to fresh water gained 0.22 more kg/d
than those watered from ponds or streams. Calves whose dams drank clean (vs pond) water
gained 9% more weight. Steers drinking clean water gained 16 to 19% more weight than those
drinking pond water. Aerating water, a process which reduces contaminates, resulted in a 20%
increase in water intake (Brawl, 2002).
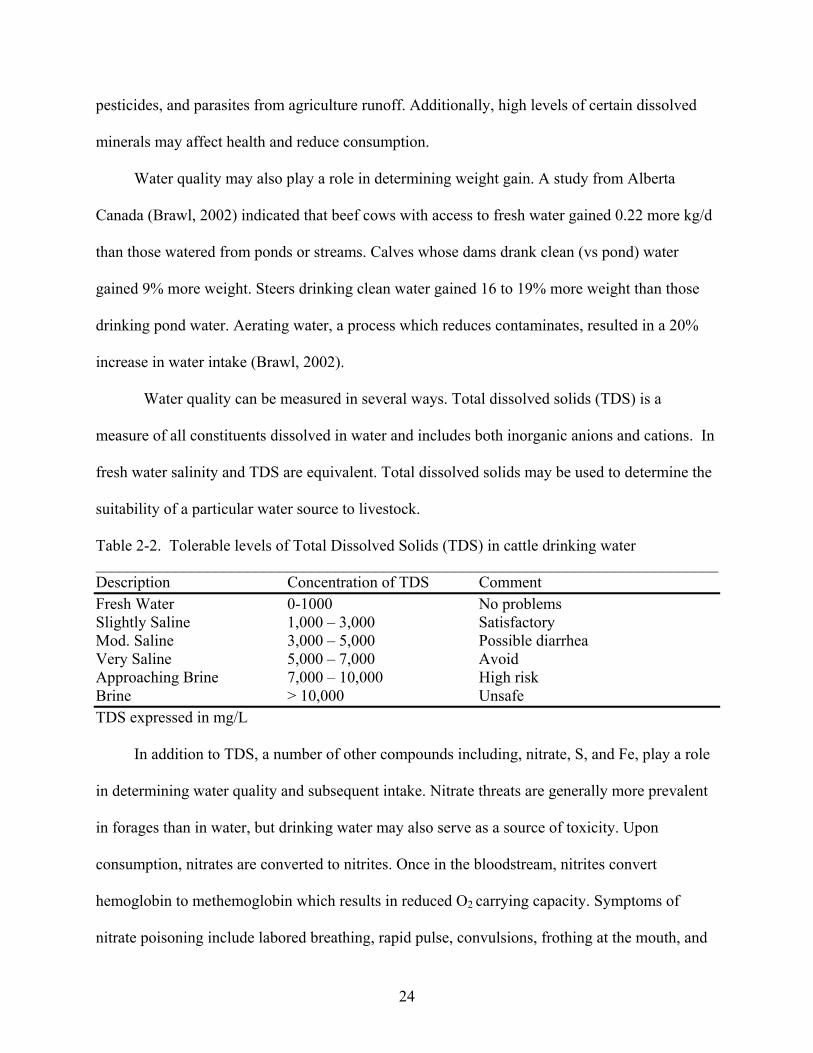
Water quality can be measured in several ways. Total dissolved solids (TDS) is a
measure of all constituents dissolved in water and includes both inorganic anions and cations. In
fresh water salinity and TDS are equivalent. Total dissolved solids may be used to determine the
suitability of a particular water source to livestock.
Table 2-2. Tolerable levels of Total Dissolved Solids (TDS) in cattle drinking water ______________________________________________________________________________Description Concentration of TDS Comment Fresh Water 0-1000 No problems Slightly Saline 1,000 – 3,000 Satisfactory Mod. Saline 3,000 – 5,000 Possible diarrhea Very Saline 5,000 – 7,000 Avoid Approaching Brine 7,000 – 10,000 High risk Brine > 10,000 Unsafe TDS expressed in mg/L
In addition to TDS, a number of other compounds including, nitrate, S, and Fe, play a role
in determining water quality and subsequent intake. Nitrate threats are generally more prevalent
in forages than in water, but drinking water may also serve as a source of toxicity. Upon
consumption, nitrates are converted to nitrites. Once in the bloodstream, nitrites convert
hemoglobin to methemoglobin which results in reduced O2 carrying capacity. Symptoms of
nitrate poisoning include labored breathing, rapid pulse, convulsions, frothing at the mouth, and
25
a chocolate brown colored blood. Once the hemoglobin-methamoglobin conversion has reached
70 to 80%, the animal normally dies of asphyxiation (Wolff and Wasserman, 1972). Drinking
water associated nitrate toxicity is most likely to occur when animals frequent water sources that
have been contaminated by heavily fertilized fields (Weichenthal et al., 1963).
Safe sulfate levels have not been clearly defined at this time but it appears that levels
above 500 ppm for calves and 1000 ppm for mature cattle may affect water intake (Longeragan
et al., 2001). Common forms of sulfates in water include Ca, Fe, Mg, and Na. All forms of
sulfate have a laxative effect, with sodium sulfate being the most potent. Iron sulfate has the
most dramatic effect on intake. Cattle will become resistant to the laxative effect of sulfate after
several weeks (Longeragan et al., 2001) Longeragan and colleagues (2001) found that
increasing water sulfate concentration resulted in linear decreases in ADG and G:F ratio.
Additionally, increasing water sulfate concentrations quadratically increased then decreased
DMI. A water sulfate concentration of greater than 583mg/L, equivalent to 0.22% of the diet,
decreased feedlot performance compared to sulfate free water (Longeragan et al., 2001).Mean
daily temperature explained 26% of the observed variations in water intake during this trial.
Other factors which the researches determined had an impact on water intake included BW,
DMI, water sulfate concentration, barometric pressure, wind speed, and humidity.
Iron in water is found predominantly in the highly soluble ferrous form. Water
contaminated with Fe is not only unpalatable (and will therefore lead to a reduction in
consumption) but consumption may lead to serious health problems. Excess Fe in water, which is
both highly soluble and readily absorbed, can upon consumption interfere with the absorption of
Cu (Kegley and Spears, 1994) Additionally, when Fe is found in the body in excessive
26
quantities, it may lead to oxidative stress and cell membrane damage. Symptoms of iron toxicity
include diarrhea, anorexia, and reduced performance (Kegley and Spears, 1994).
Water Intake Prediction Equations
Water intake can be determined through direct measurement or through the use of
prediction equations designed to predict water intake. Both methods may be fraught with error.
The majority of prediction equations were designed with lactating dairy cattle in mind. Due to
the enormous need for water for milk production, the water requirement per unit of BW of the
high producing dairy cow is greater than any other land mammal. (Woodford et al. 1985).
Therefore equations meant to predict water intake in dairy cows may not be suitable for use with
beef cattle of any class.
Prediction equations use a number of variables to predict water intake. However, the exact
combinations of variables which determine water intake are unknown and may vary from animal
to animal.
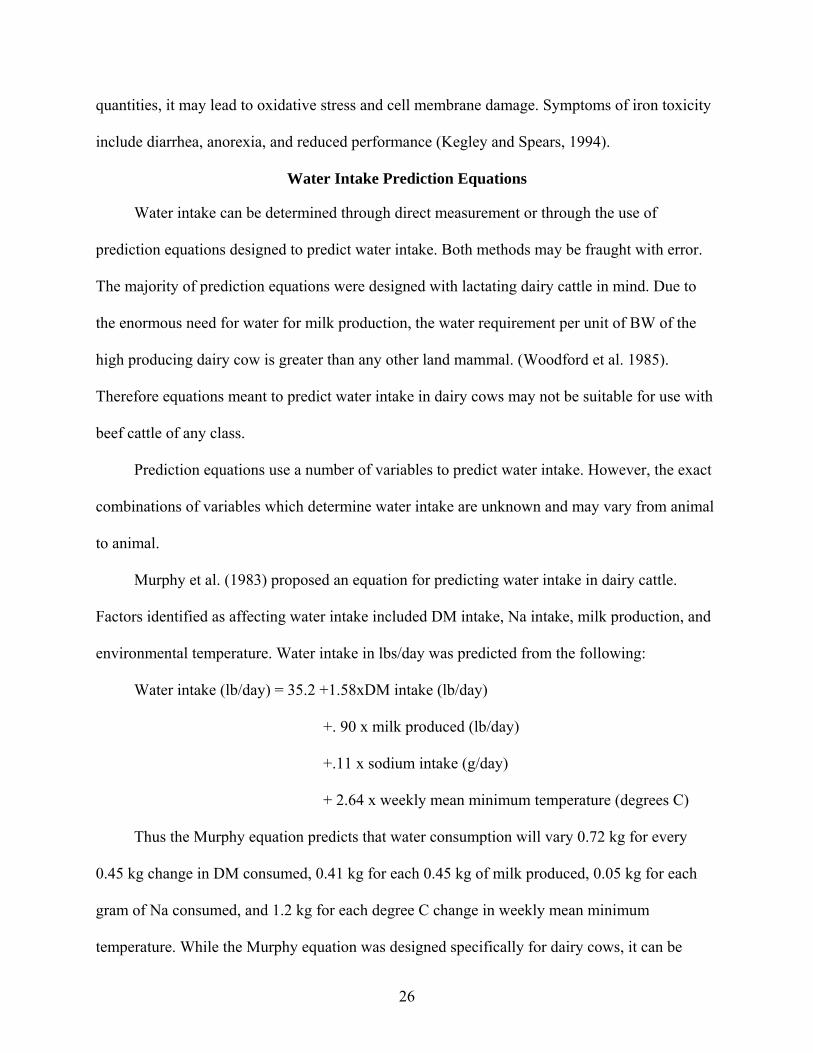
Murphy et al. (1983) proposed an equation for predicting water intake in dairy cattle.
Factors identified as affecting water intake included DM intake, Na intake, milk production, and
environmental temperature. Water intake in lbs/day was predicted from the following:
Water intake (lb/day) = 35.2 +1.58xDM intake (lb/day)
+. 90 x milk produced (lb/day)
+.11 x sodium intake (g/day)
+ 2.64 x weekly mean minimum temperature (degrees C)
Thus the Murphy equation predicts that water consumption will vary 0.72 kg for every
0.45 kg change in DM consumed, 0.41 kg for each 0.45 kg of milk produced, 0.05 kg for each
gram of Na consumed, and 1.2 kg for each degree C change in weekly mean minimum
temperature. While the Murphy equation was designed specifically for dairy cows, it can be
27
modified for beef animals by multiplying the amount of milk produced by a factor of zero. This
author is not aware of any studies that have been performed to investigate the efficacy of using
the Murphy equation to predict water intake in beef cattle. Additionally, while the Murphy
equation does take into account a number of important factors, it does not consider all the factors
which may contribute to water consumption.
Hicks et al. (1988) developed an equation to predict water intake specifically in feedlot
steers.
Water intake (L/d) = -18.67+(0.3937 x MT)+(2.432 x DMI)–(3.870 x PP)–(4.437 x DS)
Where MT is the maximum temperature in degrees farenheit, DMI is dry matter
intake in kg/d, PP is precipitation in cm/d, and DS is the percent of dietary NaCl. While
this equation is more applicable to beef cattle than the Murphy equation, it fails to take all
factors, such as productions state, gender, and breed of the animal, into account and may be little
or no more accurate.
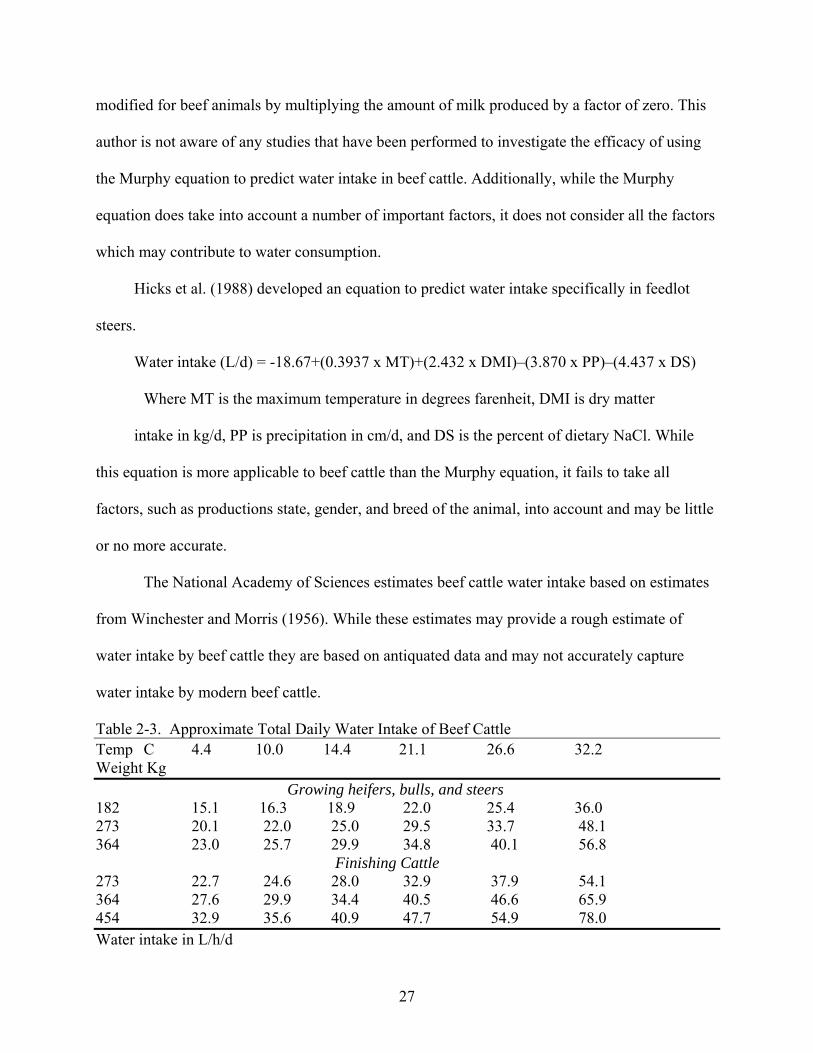
The National Academy of Sciences estimates beef cattle water intake based on estimates
from Winchester and Morris (1956). While these estimates may provide a rough estimate of
water intake by beef cattle they are based on antiquated data and may not accurately capture
water intake by modern beef cattle.
Table 2-3. Approximate Total Daily Water Intake of Beef Cattle Temp C 4.4 10.0 14.4 21.1 26.6 32.2 Weight Kg Growing heifers, bulls, and steers 182 15.1 16.3 18.9 22.0 25.4 36.0 273 20.1 22.0 25.0 29.5 33.7 48.1 364 23.0 25.7 29.9 34.8 40.1 56.8 Finishing Cattle 273 22.7 24.6 28.0 32.9 37.9 54.1 364 27.6 29.9 34.4 40.5 46.6 65.9 454 32.9 35.6 40.9 47.7 54.9 78.0 Water intake in L/h/d
28
Measuring Water Intake
Directly measuring water intake may provide a more accurate account of water use in
beef cattle. Unfortunately, direct measurements are not without complication. Water intake may
be directly measured by taking the average of a group of animals or by isolating animals and
measuring individual intake. Group housing animals allows for natural animal to animal
interaction and the manifestation of a full spectrum of social behaviors. However, individual
performance cannot be linked to individual intakes. Measuring intake in a pen of animals gives
gross estimates in terms of volume of intake only.
Traditionally, individual feed and water intake was measured by housing animals
individually. However, studies have shown that animals housed individually significantly alter
their performance and behavior when compared to animals housed in production settings (Da
Haer and Mercks, 1992; Beatty et al., 2006; Guiroy et al., 2001; Nielsen et al., 1995).
Individually measuring water intake allows researchers to link productivity and performance to
intake but does so at the cost of real life accuracy. Individually housing animals prohibits social
interaction and may result in unnatural feed and water intakes. Additionally, the animal to trough
ratio of individually housed animals is not representative of feedlot conditions (Nielsen et al.,
2005). De Haer and Merks (1992) found that the feeding behavior of individually housed
growing pigs differed significantly from that of group housed animals. In their study, the isolated
pigs visited the feed trough more frequently and ate in shorter burst (De Haer and Merks, 1992).
Polydipsia (PD) is an excessive thirst manifested by excessive water intake and may be
caused by several physiological or environmental factors. Boredom and isolation may also
induce psychogenic PD in animals, causing them to drink more than they would in a normal
social situation. For this reason, studies which look at water intake in isolated animals may be
skewed (Beatty et al., 2006).
29
Electronic gate feeders have been used to investigate the individual behaviors of pen
housed animals. When the animal enters the feeder gate their individual ID is recorded and the
feed or water consumed is recorded as an event. Very little information on feeding or drinking
behaviors can be recorded in this manner as the effect of competition is not measured.
Additionally, the equipment itself may impact animal feeding and drinking behavior. Even the
simplest electronic gate feeders are labor intensive and costly to operate.
The Use of the GrowSafe System to Monitor Water Intake
GrowSafe™, a continuous data acquisition system, bridges the gap between individual
and group housed intake studies. By reading multiple transponders in close proximity,
GrowSafe™ continually monitors feed and water intake, as well as animal behavior with
minimal disruption to typical behaviors.
In the GrowSafe™ system, cattle are equipped with an ISO compliant passive
transponder. The transponder resembles an ear tag and is unobtrusive in nature. Each transponder
has a unique number which corresponds to an individual animal. A GrowSafe™ mat is affixed in
the feed bunks and water roughs. When the animal places its head close to a GrowSafe™ mat,
the transponder will emit a signal which identifies that animal. The system reports the distance of
the transponder both laterally and in relation to the bunk or trough. This geographic data is
accurate to within 6 cm and can be sampled once a second. Weight data is sampled eight times a
second in increments of 5 g. A GrowSafe™ panel collects, verifies, processes, and stores the
data. The panel then transfers the data to a remote computer using spread spectrum technology.
GrowSafe™ software then collects, segments, compiles, and analyzes the millions of data points
collected by the system. GrowSafe™ continually and automatically records every data point to a
hard drive. This data can later be compiled and used in many ways. The data generated by
30
GrowSafe™ is flexible and allows researchers to make observations within or between events
(GrowSafe Technical Bulletin, 2007).
In addition to accurately measuring the amount water intake, GrowSafe™ also measures
duration and frequency of drinking. Though not important to this study, GrowSafe™ also
measures: duration of every feeding event, head down duration during the feeding event, feed
disappearance, feeding rate, amount of time spent at the bunk without consumption, individual
bite size, number of bites within an event, and force applied to the bunker (GrowSafe Technical
Bulletin, 2007).
A trial was conducted in Canada to demonstrate the efficacy of GrowSafe™ data in terms
of reliability and accuracy. The study demonstrated that the GrowSafe™ equipment caused no
negative impacts on either animal performance or behavior (GrowSafe Technical Bulletin, 2007)
Conclusion
The impending water crisis in Florida will force ranchers to reexamine how water is used
on their operations. In the future it may be necessary for ranchers to accurately account for water
consumption and to justify ground water withdrawals. Research is needed to determine the
amount of drinking water that is required for different classes of beef cattle. From a production
standpoint, it is important to determine what outside factors influence the water requirement and
what effects drinking water intake have on growth and feed conversion.
There is currently no satisfactory equation for determining water intake in growing beef
cattle. Directly measuring water intake is complicated by a number of factors. GrowSafe™, a
continuous data acquisition system, may provide more accurate insight into drinking water use
by growing beef cattle.
31
CHAPTER 3 WATER INTAKE AND FACTORS AFFECTING WATER INTAKE OF GROWING BEEF
CATTLE IN FLORIDA
Introduction
Water and feed intake have traditionally been measured either by measuring intake of
individual animals housed in individual pens or by taking the average intakes of group housed
animals. Neither of these to methods is without error or complication. Individual housing of
animals is clearly not representative of either natural or commercial settings as the feeding
behavior of isolated animals may differ significantly from the feeding behavior of group housed
animals. Maintaining animals in isolation eliminates any social behaviors associated with feed
and water intake. Additionally, the animal to bunk space ratio is not realistic of commercial
settings. Boredom induced polydipsea, a condition wherein animals drink excessively out of
boredom, is another complication of housing animals in confinement. Individually penning
animals is not only scientifically inaccurate and non representative of real life scenarios, it is also
costly and labor intensive.
Taking the average of group housed animals allows for a more natural scenario but limits
the researchers in terms of the number of effects they may study. When the average of a group is
used there is no way for the researcher to link individual intakes to individual performances or to
any genotypic or phenotypic traits which may effect or be affected by the variables in question.
Electronic feeders, such as Calan Gates (American Calan, Northwood, NH), were an
early solution to the aforementioned problems associated with intake studies. Electronic feeders
isolate individual animals to individual stalls when feeding but allow them to remain in a group
setting between meals. When the animal enters the stall the starting weight of the feed bunker or
water trough is recorded, likewise when the animal leaves the stall the final weight is also
recorded. The difference between the starting and ending weights equal total feed intake. The
32
artificial nature of an electronic gate system may have an impact on feeding behavior and
subsequent feed and water intake. Additionally, little behavioral information can be recorded and
the effects of competition are not accounted for.
GrowSafeTM research technology, the newest generation of feed monitoring technology,
continuously measures individual consumption of feed and water under commercial feeding
conditions without obstruction of natural feeding behaviors. GrowSafeTM uses radio frequency
identification (RFID) technology to link intake data to individuals housed in group pens without
the need to isolate them artificially at any point. To date, GrowSafeTM, represents the most
accurate way of measuring individual feed and water intake in group housed animals.
Materials and Methods
A feed and water intake study was conducted at the North Florida Research and
Education Center (NFREC) of the University of Florida located at Mariana in northwest Florida
(30.5 N. lat). The study ran from late September through late December of 2006 for a total of 13
weeks.
The Feed Efficieny (FE) barn at the NFREC, Marianna, FL was designed for use with the
GrowSafeTM system and was used for this study. Each animal was fitted with an International
Standards Organizations (ISO) approved RFID ear tag prior to the beginning of the trial. Each
RFID tag emitted a frequency which was unique to each animal. The tag is Computer and
Communications Industry Association (CCIA) approved and safe for use with growing animals.
The pens at the Feed Efficiency Barn each contain two GrowSafeTM feed bunkers and one
GrowSafeTM water trough which had been fitted with GrowSafeTM hardware. Adjustable head
gates were strategically placed around the perimeter of the bunkers and troughs to allow only one
animal to feed or drink at a time. When an animal inserts its head into the bunker or trough its
RFID tag is automatically read by GrowSafeTM hardware. The data acquired is sent wirelessly to
33
a data acquisition centers located throughout the barn. The data is then compiled and sent using
spread spectrum technology to a GrowSafeTM software enabled computer in a remote location.
The software then automatically analyzes the data and stores it in a readily accessible format.
Growing beef steers (n=61), heifers (n=74), and bull calves (n=11) were housed at the
NFREC FE barn for the duration of the trial. Thirteen different breeds and breed composites
were used. Sire breeds used included Angus (AN), Brangus (BN), and Charolais (CH). Maternal
breeds included BN, AN, Hereford x Angus (HFAN), Romosinuano (RS), Romosinuano x
Angus (RA), Brangus x Hereford (BF), Simmental (SM), and Simmental x Angus (SMAN). The
resulting composites were; ANBN (n=13), BN (n=58), BNAN (n=13), BNHFAN (n=1), BNRS
(n=18), BNRA (n=1), CHAN (n=8), CHBH (n=1), CHBN (n=15), CHRS (n=15), CHSM (n=1)
and CHSMAN (n=2). These breed types are representative of the cattle typically used in
commercial herds in Florida ranches. Average starting weight was 276 ± 67 kg.
Cattle were randomly assigned to pens of 15 to 20 head/ pen. The pens measured 7.32 m
by 14.63 m. Each pen had poured concrete floors and paneled pen dividers. All pens were under
roof and were fully shaded from the sun. Pens were cleaned once a week. During cleaning cattle
were removed and either weighed or held in a holding pen until all waste was removed.
Cattle were allowed ad libitum access to a total mixed ration (TMR) feed throughout the
day with troughs being replenished twice daily at approximately 0800 and 2500. The diet was
composed of whole dry corn (38.0 %), soybean hulls (18.1%), cottonseed hulls (13.6%),
Beefmaker 60 mineral mix (Flint River Mills, Brainbridge, Ga), (11.6%) corn gluten feed
(18.0%), and calcium carbonate (1%). The total CP was 17.33%, NEm was 0.35 mcal/kg, NEg
was 0.24 mcal/kg. Water was available ad libitum.
34
Following a two week adjustment period all cattle were weighed weekly on Wednesday
mornings (n=13). All the cattle in one pen were removed at the same time. The cattle walked
through a series of gates and chutes and were weighed individually using a squeeze chute scale.
Weights were recorded into an excel spreadsheet. Cattle were returned to their pens as a group
once the pens were cleaned.
Ambient temperature and rainfall was recorded by the Florida Automated Weather
Network (FAWN) from the substation in Marianna, Fl. The average daily temperature was 15.0
± 3.5 C and remained within the thermal neutral zone for the duration of the study. Average daily
precipitation was 0.35 cm/d.
Data from GrowSafeTM was transposed to Excel spreadsheets. Total weekly feed and
water intakes per animal were calculated for each of the 13 wk. Weekly weights for each animal
were also recorded. Weekly ADG was calculated by dividing weekly gain by a factor of seven.
Gain: Feed ratio was calculated by dividing the weekly weight gain by the kg of feed consumed.
Because feed and water intake are expected to vary with BW, with smaller animals consuming
less than larger animals, water and feed intake were adjusted by dividing kg of intake by kg of
metabolic BW (MBW). Metabolic BWs were calculated by raising each animal’s weekly weight
by a factor of 0.75 using the following formula; MBW = Weight in Kg 0.75. A final spreadsheet
was developed which included animal ID, sex, breed composite, average total water intake,
average total feed intake, weekly gain, ADG for each of the 13 weeks, G:F for each of the 13
wk, feed intake in kg/ kg MBW and water intake in liters/ kg MBW for each of the 13 wk, and
average weekly temperature.
Data was analyzed using SAS version 9.0 (SAS Inst, Inc., Cary , NC ). The variables
analyzed included total weekly water intake, total weekly feed intake, average total water intake,
35
average total feed intake, weekly gain, ADG, G:F, feed intake in kg/ kg MBW, water intake in
l/kg MBW, and average weekly temperature The experimental unit was individual animal, rather
than pen, as GrowSafeTM allows for individual measurements to be recorded. PROC MEANS
was used to determine mean water intake, feed intake, water intake/ kg metabolic BW (wmb),
feed intake/ kg metabolic BW (fmb), ADG, and G:F for each breed and again for each gender.
PROC GLM and tukeys pdiff were then used to separate significantly different means at the
alpha= 0.05 level. PROC CORR was used to detect correlations that existed between variables.
PROC REG using a repeated measures model where week (time) was the repeated measure was
used to detect the linear relationships between variables. Using actual feed, weight, DM intake,
DM composition, and weather data gathered during this trial the expected daily water intake for
each animal was calculated using the Murphy et al. (1983) and the Hicks et al. equations (1988).
These predicted values were then compared to actual values and means were separated
statistically using a Student’s T Test.
Results and Discussion
The average daily temperature was 15.02 C ± 3.53 and remained within the
thermalneutral zone (5 to 20 C) for the duration of the study. Body mass is a determining factor
for intake of both feed and water intake and was controlled for by calculating the kg of feed or L
of water that were consumed per kg of metabolic BW. Mean feed intake (FI) was 9.73 Kg ± 2.01
kg/ head/d. On average study cattle ate 0.16 kg of feed/ kg of metabolic BW. Mean water intake
(WI) was 29.98 L ± 8.56 L/ head/d. When adjusted for metabolic BW, cattle drank an average of
0.05 L ± 0.02 L/ kg of metabolic BW. The cattle gained an average of 1.41 kg ±1.03 kg/head/d at
a rate of 0.14 kg ± 0.11kg weight gain/ kg feed intake.
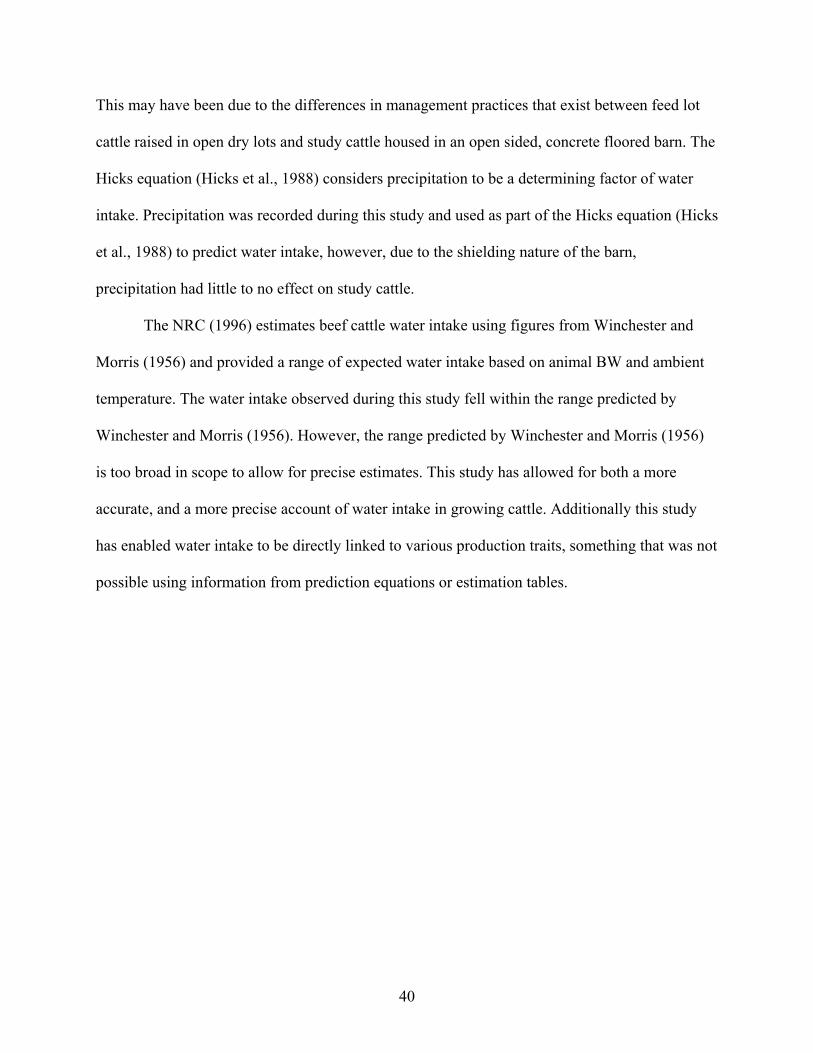
Charolais x Angus (CHAN) cattle drank significantly more (p<0.05) when compared to
all other breed composites. The Angus x Brangus (ANBN), Brangus (BN), Charolais x Brangus
36
(CHBN), and Brangus x Angus (BNAN) cattle, were similar (p< 0.05) in terms of gross water
intake. These composites consumed less water (p< 0.05) when compared to the CHAN cattle and
had a greater gross water intake than either of the two Romosinuano influenced composites (p<
0.05). The Brangus x Romosinuano (BNRS) cattle drank significantly less than the non
Romosinuano influenced composites but drank more than the Charolais x Romosinuano (CHRS)
cattle (p< 0.05). The CHRS cattle had the lowest gross water intake when compared to all other
breed composites (p< 0.05). (Table 4-1)
When adjusted for metabolic BW, CHAN cattle drank significantly more than all other
breed composites (p< 0.05). The BNAN cattle followed in terms of adjusted water intake and
drank more water/ kg MBW than all other breeds except CHAN. The CHBN, BN, BNAN, and
CHRS were similar in terms of adjusted water intake, drinking less than CHAN and BNAN
cattle (p<0.05). The BNRS cattle had the lowest water intake per kg MBW but were statistically
similar to CHBN and CHRS cattle (p< 0.05). (Table 4-1)
As was expected, tropically adapted cattle drank less when compared to non tropically
adapted cattle with the two Romosinuano influenced breeds having the lowest gross water intake
overall. When adjusted for body size, the non tropically adapted cattle still drank more water per
kg of BW when compared to the tropically adapted cattle. Tropically adapted cattle such as the
Brahman and Romosinuano breeds are phenotypically better adapted to living in the hot and
humid conditions that are common to Florida. Their loose skin, long ears, and pendulous briskets
and underlines combine to increase body surface area which in turn allows for greater
evaporative cooling of the animal. Numerous studies have demonstrated that tropically adapted
cattle are better able to cope with heat stress and are more likely to survive and even thrive in sub
optimal conditions. This adaptation to warmer climates may also decrease their biological
37
requirement for drinking water and is likely responsible for their lower levels of both gross and
adjusted water intake.
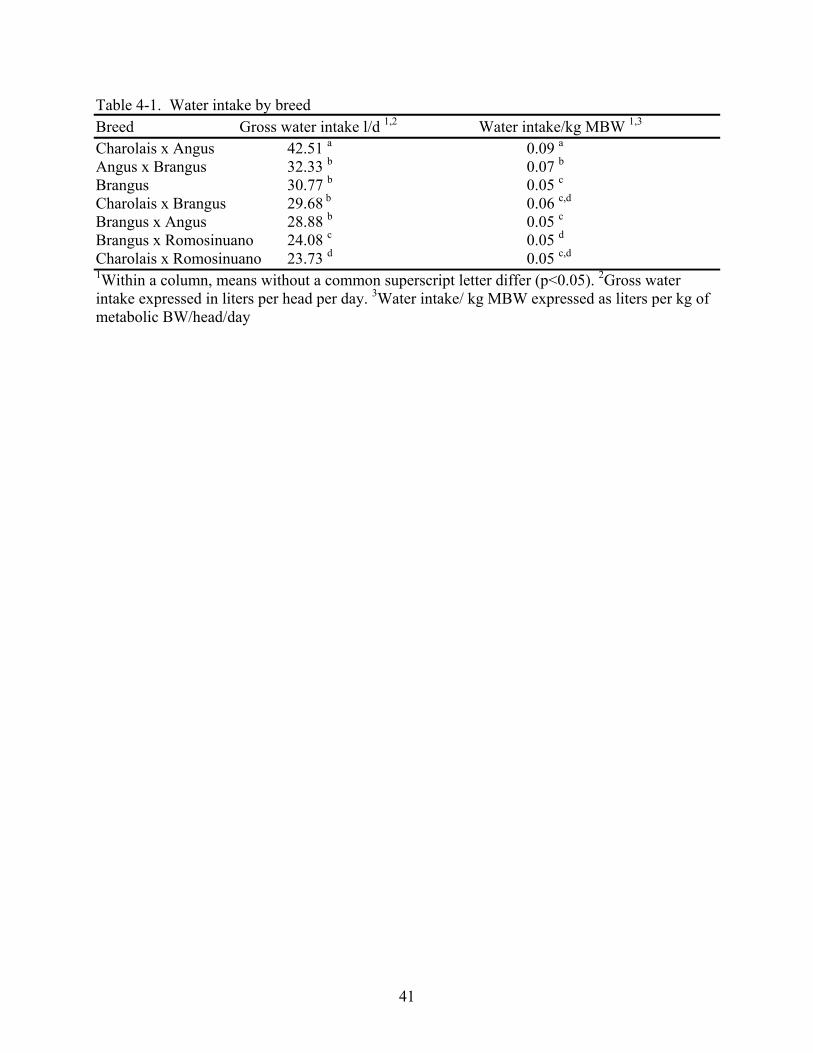
Bulls, heifers, and steers were all similar in terms of both gross and adjusted WI
(p<0.05). Differences in terms of water requirement would be expected in more mature animals
as differences in terms of growth, metabolic rate, and production become more pronounced.
Lactating cows would be expected to have the highest water requirement followed by breeding
bulls and then by steers. The lack of differences in this study was likely due to the young age and
related lack of developed sex character in growing cattle.(Table 4-2)
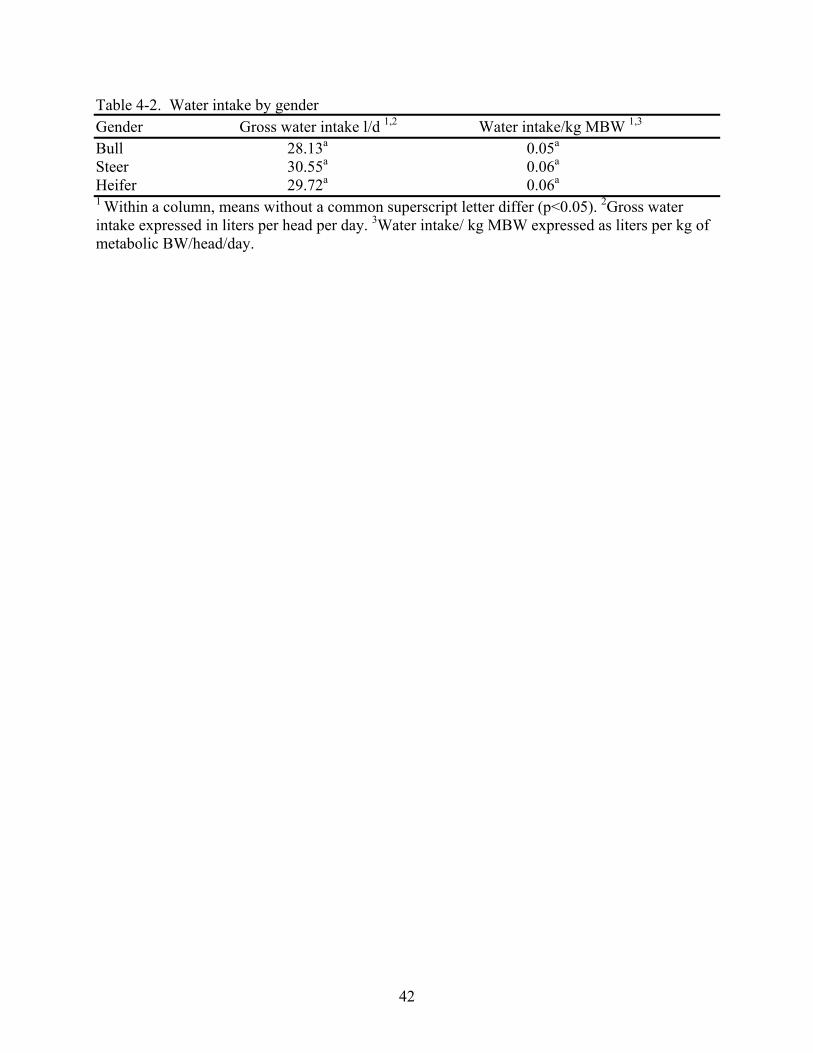
Dry matter intake is a determining factor of both water intake and weight gain. Brangus
cattle had the greatest gross DM intake when compared to all other breed composites except
BNAN (p<0.05). Brangus x Angus, CHBN, BNRS, ANBN, and CHAN cattle were similar in
terms of gross feed intake (p<0.05). The CHRS cattle had the lowest gross DM intake (p<0.05).
When adjusted for metabolic BW, FI was not significantly different between any breed
composite. The differences in FI between breeds were likely a factor of metabolic BW. (Table 4-
3)
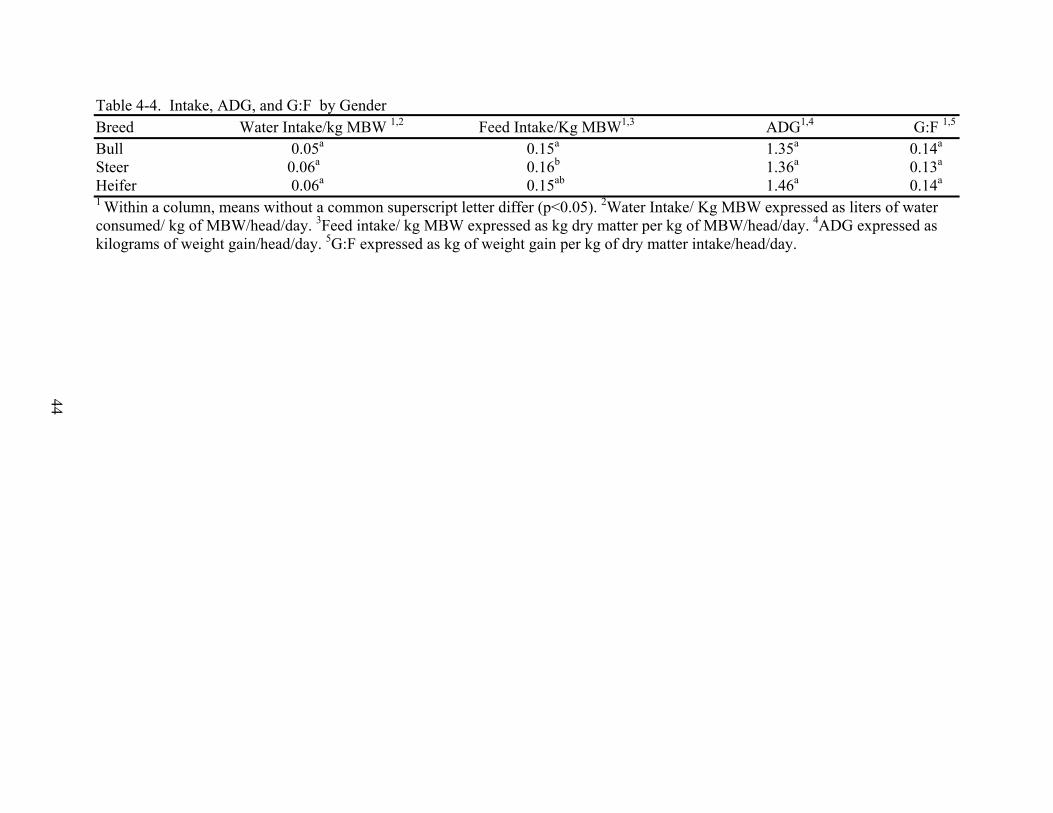
There were no differences between bulls, heifers, or steers in terms of gross DM intake
(p<0.05). When adjusted for metabolic BW, bulls consumed more DM than steers but were
similar to heifers (p<0.05). Likewise, heifers were similar in terms of adjusted DM intake to
steers (p<0.05). (Table 4-4)
Average daily gain is of significant economic importance in the beef cattle industry. By
selecting animals that gain more weight per day one can lessen the number of days that animals
must be kept on feed prior to slaughter. The CHAN, ANBN, CHBN, BNAN, and CHRS cattle
were similar in terms of ADG (p< 0.05). Pure BN cattle were similar in terms of ADG to CHAN,
38
ANBN, CHBN, BNAN, and CHRS but gained significantly more per day when compared to
BNRS cattle (p<0.05). Likewise the BNRS were also similar to CHAN, ANBN, CHBN, and
BNAN cattle (p<0.05). There were no differences in terms of ADG between animals of different
genders (p<0.05). (Table 4-3; Table 4-4)
Perhaps more important than ADG is G:F. This ratio is determined by dividing the kg of
feed by kg of gain for a set period of time. A higher G:F ratio indicates that an individual will
gain more weight on the same amount of feed thus decreasing feed costs over time. On this trial
there was no statistical differences in terms of G:F between either breed composites or genders
(p<0.05). All animals, regardless of breed or gender, tended to gain the same amount per unit of
DM intake. (Table 4-3; Table 4-4)
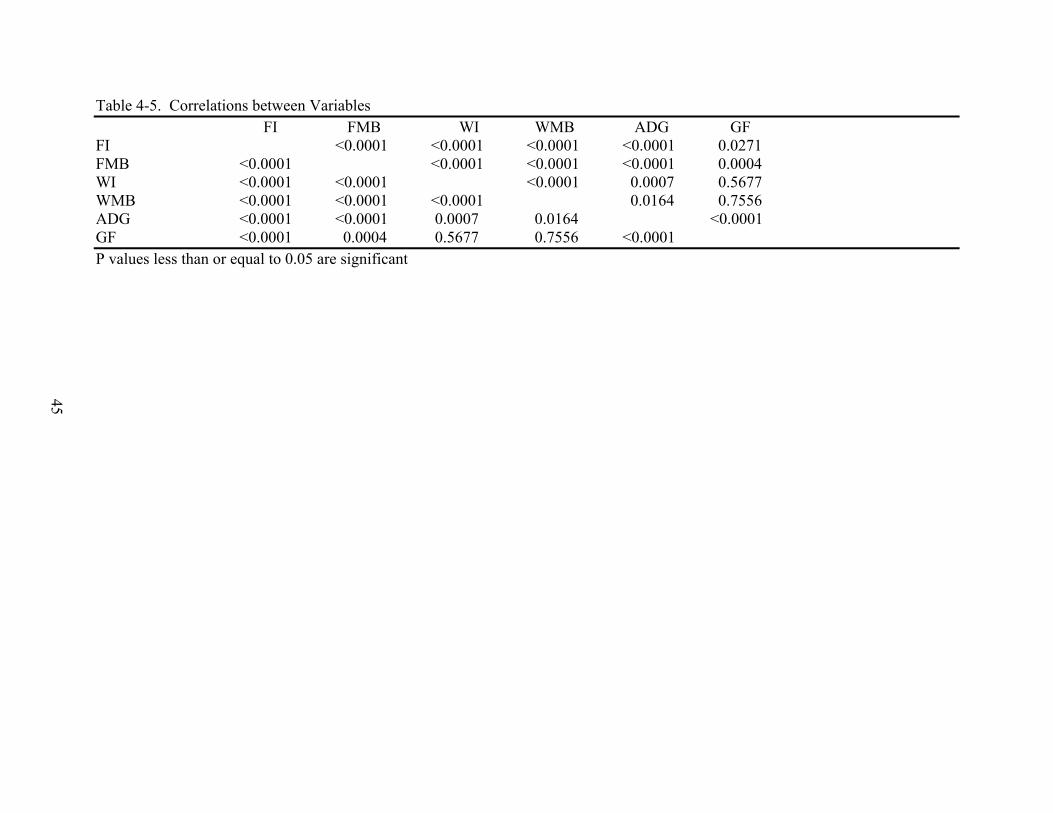
As expected from the literature, FI was correlated with WI, with heavier eaters drinking
more water than light eaters (p<0.0001). Gross FI was also correlated with ADG and G:F
(p<0.0001); table 4-9. Cattle who consumed more feed gained more weight per day, which is to
be expected, and were also more efficient, gaining more weight per kg of feed consumed.
Likewise, FMB was strongly correlated with WMB, ADG, and G:F (p<0.0001) demonstrating
that the relationship between FI and WI, ADG, and FI is not merely a function of body mass.
(Table 4-5)
Gross WI was also related to ADG (p<0.0007) but was not correlated with G:F
(p=0.5677). Cattle who consumed greater quantities of water showed a tendency (p<0.05) to gain
more weight overall, but were not necessarily more or less efficient at doing so than cattle who
consumed less water. (Table 4-5)
39
When adjusted for metabolic BW, water intake was positively correlated with FI
(p<0.0001), FMB (p<0.0001), and ADG (p=0.0164). Once again there was no relationship
between WMB and G:F (p=0.7556).
When run through a regression equation, ADG was found to be a function of WMB
(R2=0.0049) with a weak linear relationship. ADG was slightly more linear in relation to gross
WI (R2=0.009). The strongest linear relationships existed between FI and WI (R2 = 0.13), FMB
and WMB (R2=0.084), FMB and WI (R2 = 0.055) and Fi and WMB (R2 = 0.014).
Prediction equations are useful when estimating water requirements and intakes of a
group of animals. However, given the number of factors that go into determining water intake,
prediction equations may not be able to accurately predict actual intake. Predicted water intake
was calculated based on the Murphy et al. (1983) and Hicks et al. (1988) prediction equations.
These predicted values were then compared with the observed intakes and were used to
determine if the prediction equations accurately captured observed values. The cattle on this trial
drank an average of 29.98L/head/d. The observed intake was significantly less than that
predicted by either equation (p>0.05). The Hicks equation (Hicks et al., 1988) predicted that they
would consume 38.34L/head/d while the Murphy equation (Murphy et al., 1983) predicted an
intake of 50.08 L/head/d. Thus, these two equations overestimated intake by a factor of 8.36L
and 20.10 L respectively. The Murphy equation (Murphy et al., 1983) was designed for use in
dairy cattle rather than beef cattle. It was adapted for use in beef cattle by multiplying milk
production by zero. Despite this modification, the Murphy equation (Murphy et al., 1983)
grossly over estimates water consumption in growing beef cattle. Using this equation to predict
water intake in beef cattle is inappropriate and inaccurate. The Hicks equation (Hicks et al.,
1988) was designed for use with feedlot cattle but still overestimated water intake in this study.
40
This may have been due to the differences in management practices that exist between feed lot
cattle raised in open dry lots and study cattle housed in an open sided, concrete floored barn. The
Hicks equation (Hicks et al., 1988) considers precipitation to be a determining factor of water
intake. Precipitation was recorded during this study and used as part of the Hicks equation (Hicks
et al., 1988) to predict water intake, however, due to the shielding nature of the barn,
precipitation had little to no effect on study cattle.
The NRC (1996) estimates beef cattle water intake using figures from Winchester and
Morris (1956) and provided a range of expected water intake based on animal BW and ambient
temperature. The water intake observed during this study fell within the range predicted by
Winchester and Morris (1956). However, the range predicted by Winchester and Morris (1956)
is too broad in scope to allow for precise estimates. This study has allowed for both a more
accurate, and a more precise account of water intake in growing cattle. Additionally this study
has enabled water intake to be directly linked to various production traits, something that was not
possible using information from prediction equations or estimation tables.
41
Table 4-1. Water intake by breed Breed Gross water intake l/d 1,2 Water intake/kg MBW 1,3 Charolais x Angus 42.51 a 0.09 a Angus x Brangus 32.33 b 0.07 b Brangus 30.77 b 0.05 c Charolais x Brangus 29.68 b 0.06 c,d Brangus x Angus 28.88 b 0.05 c Brangus x Romosinuano 24.08 c 0.05 d Charolais x Romosinuano 23.73 d 0.05 c,d 1Within a column, means without a common superscript letter differ (p<0.05). 2Gross water intake expressed in liters per head per day. 3Water intake/ kg MBW expressed as liters per kg of metabolic BW/head/day
42
Table 4-2. Water intake by gender Gender Gross water intake l/d 1,2 Water intake/kg MBW 1,3 Bull 28.13a 0.05a Steer 30.55a 0.06a Heifer 29.72a 0.06a 1 Within a column, means without a common superscript letter differ (p<0.05). 2Gross water intake expressed in liters per head per day. 3Water intake/ kg MBW expressed as liters per kg of metabolic BW/head/day.
43
Table 4-3. Intake, ADG, and G:F by Breed Breed Water Intake/kg Metabolic BW 1,2 Feed Intake/Kg Metabolic BW1,3 ADG1,4 G:F 1,5 Brangus 0.05c 0.16a 1.49a 0.14a Brangus x Angus 0.05c 0.15a 1.44a 0.13a Charolais x Brangus 0.06c,d 0.16a 1.47ab 0.15a Brangus x Romosinuano 0.05d 0.15a 1.20b 0.13a Angus x Brangus 0.07b 0.16a 1.46ab 0.16a Charolais x Angus 0.09a 0.16a 1.42ab 0.15a Charolais x Romosinuano 0.05 c,d 0.15a 1.21ab
0.15a
1 Within a column, means without a common superscript letter differ (p<0.05). 2Water Intake/ Kg Metabolic BW expressed as liters of water consumed/ kg of Metabolic BW/head/d. 3Feed Intake/ kg Metabolic BW expressed as kg dry matter per kg of Metabolic BW/head/d. 4ADG expressed as kilograms of weight gain/head/d. 5G:F expressed as kg of weight gain per kg of dry matter intake/head/d.
44
Table 4-4. Intake, ADG, and G:F by Gender Breed Water Intake/kg MBW 1,2 Feed Intake/Kg MBW1,3 ADG1,4 G:F 1,5 Bull 0.05a 0.15a 1.35a 0.14a Steer 0.06a 0.16b 1.36a 0.13a Heifer 0.06a 0.15ab
1.46a 0.14a 1 Within a column, means without a common superscript letter differ (p<0.05). 2Water Intake/ Kg MBW expressed as liters of water consumed/ kg of MBW/head/day. 3Feed intake/ kg MBW expressed as kg dry matter per kg of MBW/head/day. 4ADG expressed as kilograms of weight gain/head/day. 5G:F expressed as kg of weight gain per kg of dry matter intake/head/day.
45
Table 4-5. Correlations between Variables FI FMB WI WMB ADG GF FI <0.0001 <0.0001 <0.0001 <0.0001 0.0271 FMB <0.0001 <0.0001 <0.0001 <0.0001 0.0004 WI <0.0001 <0.0001 <0.0001 0.0007 0.5677 WMB <0.0001 <0.0001 <0.0001 0.0164 0.7556 ADG <0.0001 <0.0001 0.0007 0.0164 <0.0001 GF <0.0001 0.0004 0.5677 0.7556 <0.0001 P values less than or equal to 0.05 are significant
46
CHAPTER 4 GENERAL CONCLUSIONS AND SUGGESTIONS FOR FURTHER RESEARCH
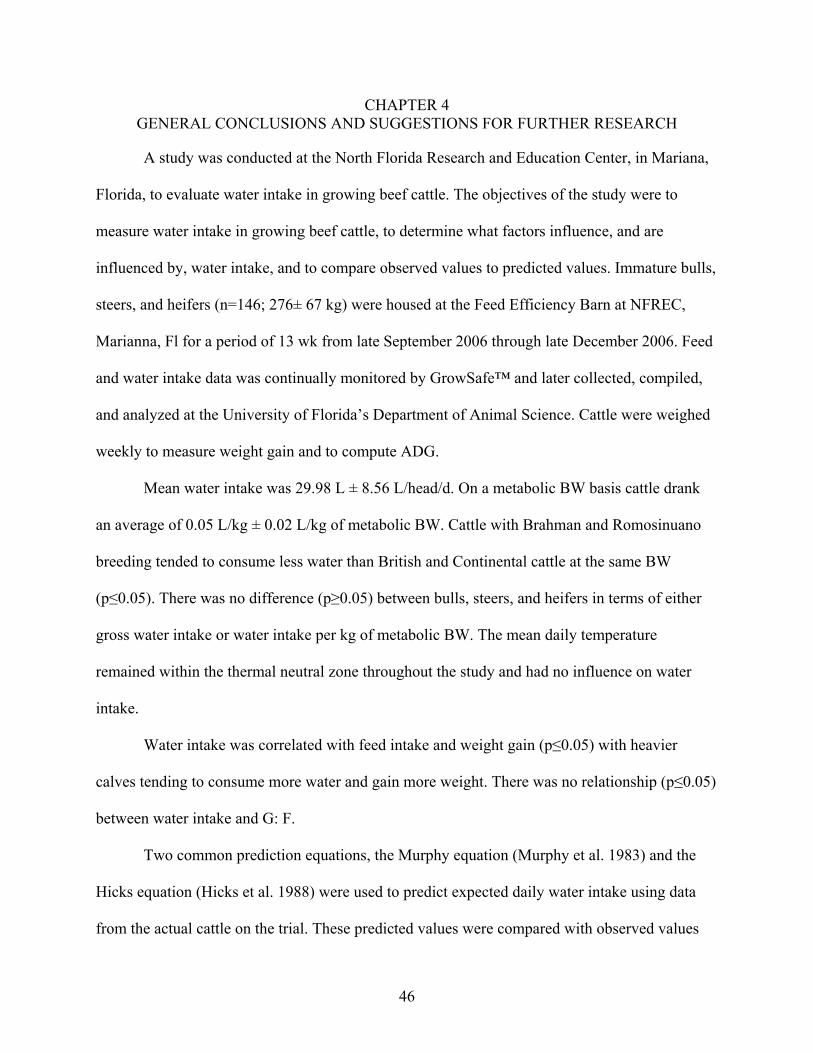
A study was conducted at the North Florida Research and Education Center, in Mariana,
Florida, to evaluate water intake in growing beef cattle. The objectives of the study were to
measure water intake in growing beef cattle, to determine what factors influence, and are
influenced by, water intake, and to compare observed values to predicted values. Immature bulls,
steers, and heifers (n=146; 276± 67 kg) were housed at the Feed Efficiency Barn at NFREC,
Marianna, Fl for a period of 13 wk from late September 2006 through late December 2006. Feed
and water intake data was continually monitored by GrowSafe™ and later collected, compiled,
and analyzed at the University of Florida’s Department of Animal Science. Cattle were weighed
weekly to measure weight gain and to compute ADG.
Mean water intake was 29.98 L ± 8.56 L/head/d. On a metabolic BW basis cattle drank
an average of 0.05 L/kg ± 0.02 L/kg of metabolic BW. Cattle with Brahman and Romosinuano
breeding tended to consume less water than British and Continental cattle at the same BW
(p≤0.05). There was no difference (p≥0.05) between bulls, steers, and heifers in terms of either
gross water intake or water intake per kg of metabolic BW. The mean daily temperature
remained within the thermal neutral zone throughout the study and had no influence on water
intake.
Water intake was correlated with feed intake and weight gain (p≤0.05) with heavier
calves tending to consume more water and gain more weight. There was no relationship (p≤0.05)
between water intake and G: F.
Two common prediction equations, the Murphy equation (Murphy et al. 1983) and the
Hicks equation (Hicks et al. 1988) were used to predict expected daily water intake using data
from the actual cattle on the trial. These predicted values were compared with observed values
47
and were found to be statistically higher (p≤0.05). The Murphy equation overestimated water
intake by an average of 20.20 L/head/d while the Hicks equation overestimated water intake by
an average of 8.36L/head/d.
Further research is needed to determine the influence of temperature on water intake
during other seasons, and to determine water intake in different classes of cattle. This study also
demonstrates a clear need for more accurate prediction equations for use with growing beef cattle
in Florida.
48
LIST OF REFERENCES
Adams, R.S., and W.E. Sharpe. 1995. Water intake and quality for dairy cattle. Penn State Extension Publication DAS 95-8.
Andersson, M. 1985. Effects of drinking water temperature on water intake and milk yield of tied up dairy cows. Livest. Prod. Sci. 12:329-338.
Andersson, M., and K. Lindgren. 1987. Effects of restricted access to drinking water at feeding, and social rank, on performance and behavior of ties-up dairy cows. Swedish J. Agric. Res. 17:71-82.
Asteline, M. 1992. Maintenance of high-quality water assures good dairy cattle health. Feedstuffs. 64:14-15.
Bahman, A.M., J.A. Rooket, and J.H. Topps. 1993. The performance of dairy cows offered drinking water of low or high salinity in a hot arid climate. Anim. Prod. 57:23-28.
Balch, C.C., D.A. Balch, V.W. Johnson, and J. Turner. 1953. Factors affecting the utilization of food by dairy cows: the effect of limited water intake on the digestibility and rate of passage of hay. British J. Nutr. 7:212-220.
Beatty, D.T.,A.Barnes, E.Taylor, D.Pethick, M.McCarthy, and S.K. Maloney. 2006. Physiological responses of Bos taurus and Bos indicus cattle to prolonged continuous heat and humidity. J. Anim. Sci. 84:972-985.
Beckett, J.L. and J.W. Oltejen. 1993. Estimation of the water requirement for beef production in the United States. J. Anim. Sci. 71:4818-4826. Beede, D.K. 2005. The most essential element: Water. Proc. 7th Western Dairy Mngmt, Conf. Reno, NV. pp 13-32.
Beede, D. K., and Z.H. Myers. 2000. Water nourishment of dairy cattle. Proc. 24th Quebec Symposium on Dairy Nutrition. Quebec, Canada.
Beede, D.K. 1992. Water for Dairy Cattle. pp 260-271 in Large Dairy Herd Management. Rev.ed. H.H. Van Horn and C.J. Wilcox, ed.
Boyles, S. 2004. Livestock and Water. http://www.ag.ohio-state.edu/~beef/library/water.html. Accessed June 21, 2006.
Brawl, L. 2002. Effects of water quality on cattle weight gain: summary of results of study years 1999-2002. Tech. Bull. Rev. Ed., Prairie Farm Rehabilitation Administration, Alberta, Canada.
49
Brod. D.L., K.K. Bolsen, and B.E. Brent. 1982. Effect of water temperature on rumen temperature, digestion, and rumen fermentation in sheep. J. Anim. Sci. 54:179-182. Castle, M.E. and T.P. Thomas. 1975. The water intake of British Friesian cows on rations containing various forages. Anim. Prod. 20:181-190.
Challis, D.J., J.S. Zeinstra, and M.J. Anderson. 1987. Some effects of water quality on the performance of high yielding cows in arid climates. Veterinary Record. 120:12-15.
Cole, N.A., and D.P. Hutchinson. 1985. Influence of prefast feed intake on recovery from feed and water deprivation by beef steers. J. Anim. Sci. 60:772-780.
Cundiff, L.V., and R.M. Koch, and K.E. Gregrory. 1984. Characterization of biological types of cattle (cycle III): Postweaning growth and feed efficiency. J. Anim. Sci. 58:312-323.
Dahlborn, K., M. Akerlind, and G. Gustafson. 1998. Water intake by dairy cows selected for high or low milk-fat percentage when fed two forage to concentrate ratios with hay or silage. Swed. J. Agric. Res. 28:167-176 De Haer, L.C.M., and J.W.M. Mercks. 1992. Patterns of daily food intake in growing pigs. Anim. Prod. 54:95-104. French, M.H. 1956. The effects of infrequent water intake on the consumption and digestibility of hay by Zebu cattle. Empire J. Exp. Agr. 24:128-133.
Frisch, J.E., and J.E. Vercoe. 1969. Liveweight gain, food intake, and eating rate in Brahman, Africander, and Shorthorn x Hereford cattle. Aust. J. Agric. Res. 20:1189-1195.
Gerrish, J., and M. Davis. 1995. Water requirements and availability. In Missouri Grazing Manual rev. ed. University of Missouri, Forage Systems Research Center, Dept. of Agronomy, Columbia, MO. Pp 75-81.
GrowSafe Technical Bulletin. 2007a. GB-2007-003, Alberta, Canada GrowSafe Technical Bulletin. 2007b. GB-2007-002, Alberta, Canada GrowSafe Technical Bulletin. 2007c. GB-2007-001, Alberta, Canada Guiroy, P.J., D.G. Fo, L.O. Tedeschi, M.J. Baker, and M.D. Cravey. 2001. Predicting individual feed requirements of cattle in groups. J. Anim. Sci. 79:1983-1995. Harris, B. and H.H. Van Horn. 1992. Water and its importance to animals. EDIS document CIR 1017. UF-IFAS Coop. Ext. Serv. University of Florida, Gainesville.
50
Hart, R.H., J. Bissio, M.J. Samuel, and J.W. Waggoner. 1993. Grazing systems, pasture size, and cattle grazing behavior, distribution, and gains. J. Range. Mngmt. 46:81-87.
Hicks, R.B., F.N. Owens, D. Gill, J.J. Martin, and C.A. Strasia. 1988. Water intake by feedlot steers. Okla Anim. Sci. Rpt. No. 125. Animal Sci Dept, Oklahoma State University, Stillwater. pp 208. Hoffman, M.P., and H.L. Self. 1972. Factors affecting water consumption by feedlot cattle. J. Anim. Sci. 35:871-876. Holt, L. 2007. Avoiding a water crisis in Florida: how should Florida’s water supply be
managed in response to growth. Unpublished paper.
Holter, J.B., and W.E. Urban Jr. 1992. Water partitioning and intake prediction in dry and lactating Holstein cows. J. Dairy Sci. 75:1472-1479.
Kegley, E.B. and J.W. Spears. 1994. Bioavailability of feed-grade copper sources (oxide, sulfate, or lysine) in growing cattle. J. Anim. Sci. 72:2728-2734. Kreith, M. 1991. Water inputs in California food production. In Water Education Foundation.
Sacramento, Ca. pp 15-23.
Kristula, M.A., and S.M. McDonnell. 1994. Drinking water temperature affects consumption of water during cold weather in ponies. Appl. Anim. Behav. Sci. 41:155-160.
Landerfeld, M., and J. Bettinger. 2002. Water effects on livestock performance. Fact Sheet. No. ANR 13-02. rev. ed. Coop Ext. Service., Ohio State University, Columbus, OH.
Larsen, C.E., E.H. Hungerford, and D.E. Bailey. 1917. The role of water in a dairy cows ration. S. Dak. Agr. Exp. Sta. Bul 175. Coop Ext Serv., South Dakota State Univ, Brookings, SD.
Liu, M.F., L.A. Goonewardene, D.R.C. Barney, J.A. Basarab, R.A. Ker, E.K. Okine, and M. Makarechian. 2000. A study on the variation of feed efficiency in station test beef bulls. Can. J. Anim. Sci. 80:435-445.
Little, W., and S.R. Shaw. 1978. A note on the individuality of the intake of drinking water by dairy cows. Anim. Prod. 26:225-237
Loerch, S.C., and F.L. Fluharty. 1998. Effects of programming intake on performance and carcass characteristics of feedlot cattle. J. Anim. Sci. 76:371-377.
Lofgreen, G.P., R.L. Givens, S.R. Morrison, and T.E. Bond. 1975. Effect of drinking water temperature on beef cattle performance. J. Anim. Sci. 40:223-229.
51
Mader, T.L., and M.S. Davis., 2004. Effect of management strategies on reducing heat stress of feedlot cattle: feed and water intake. J. Anim. Sci. 82:3077-3081
McDowell, R.E., and J.R. Weldy. 1967. Water exchange of cattle under heat stress. Biometeorol. 2:414-419
Morse, D. 1995. Environmental considerations of livestock producers. J. Anim. Sci. 73:2733- 2740.
Mullick, D.N., V.N. Murty, and N.D. Kehar. 1952. Seasonal variations in feed and water intake of cattle. J. Anim. Sci.. 11:42-49. Murphy, M.R., C.L. Davis, and G.C. McCoy. 1983. Factors affecting water consumption by Holstein cows in early lactation. J. Dairy Sci. 66:35-43. Murphy, M.R. 1991. Water metabolism of dairy cows. J. Dairy Sci. 75:326-334 Nielsen, B. L., A. B. Lawrence, and C.T. Whittemore. 1995a. Effect of individual housing on the feeding behavior of previously group housed pigs. Appl. Anim. Behav. Sci. 47:149-161. Nielsen, B.L., A.B. Lawrence, and C.T. Whitmore. 1995b. Feeding behavior of growing pigs using single or multi-space feeders. Appl. Anim. Behav. Sci. 47:235-246.
Nkrumah, J.D., E.K. Okine, G.W., Mathison, K. Schmid, C. Li, J.A. Basarab., M.A. Price, Z. Wang, and S.S. Moore. 2006. Relationships of feedlot efficiency, performance, and feeding behavior with metabolic rate, methane production, and energy partitioning in beef cattle. J. Anim. Sci. 84:145-153.
NRC. 1996. Nutrient requirements of beef cattle. 7th rev edn, National Academy of Sciences, Nat’l Academy Press, Washington, DC.
Odowongo, W.O., H.R. Conrad, A.E. Staubus, and J.H. Harrison. 1985. Measurment of water kinetics with deuterium oxide in lactating dairy cows. J. Dairy Sci. 68:1155-1161. OECD. 1999. The price of water: trends in OECD countries. Vol 1, No 8, p 28.
Olkowski, A.A., C.G. Rousseaux, and D.A. Christensen. 1991. Association of sulfate-water and blood thiamine concentration in beef cattle: field studies. Can. J. Anim. Sci. 71:825-832.
Oltejen, J.W. 1991. Water needs for meat production. J. Anim. Sci. 69(Suppl. 1):227 (Abstr.)
Owens, F.N., D.R. Grill, D.S. Secrist, and S.W. Coleman. 1995. Review of some aspects of growth and development of feedlot cattle. J. Anim. Sci. 73:3152-3172.
52
Paquay, R., R. De Baere, and A. Lousse. 1970. Statistical research on the fate of water in the adult cow. J. Agric. Sci. 75:251-258. Phillips, G.D. 1960. The relationship between water and food intakes of European and Zebu type steers. J. Agric. Sci. 54:231-234. Ragsdale, A.C., D.M. Worstell, H.J. Thompson, and S. Brody. 1949. Influence of temperature 50 to 0 F and 50 to 95 F on milk production, feed and water consumption and body weight in Jersey and Holstein cows. Mo. Agr. Exp. Sta. Res. Bul. 449.,Agric. Exp. Sta., Univ of Missouri, Columbia, MO.
Ray, D.E.1989. Interrelationships among water quality, climate, and diet on feedlot performance of steer calves. J. Anim. Sci. 67:357-363.
Reid, J.T., G.H. Wellington, and H.O. Dunn. 1955. Some relationships among the major chemical components of the bovine body and their application to nutritional investigations. J. Dairy Sci. 38:1344-1359. Robins, J. 1987. Diet for a new America. Stillpoint Press, Walpole, NH.
Sekine, J., R. Oura, T. Morooka, and Y. Asahida. 1989. Preliminary consideration on effect of seasonal adaptation on water drinking habit in growing calves. Asian-Aust. J. Anim. Sci. 2:269-270.
Shaw, M.I., A.D. Beaulieu, and J.F. Patience. 2006. Effect of diet composition on water consumption in growing pigs. J. Anim. Sci. 84:3123-3132
Sherbeck, J.A., J.D. Tatum, T.G. Field, J.B. Morgan, and G.C Smith. 1995. Feedlot performance, carcass traits, and palatability traits of Hereford x Brahman steers. J.Anim. Sci. 73:3613-3620.
Shultz, T.A. 1984. Weather and shade effects on cow corral activities. J. Dairy Sci. 67:4868-4873. Stermer, R.A., C.F. Brasington, C.E. Coppock, and K.Z. Milam.1986. Effect of drinking water temperature on heat stress of dairy cows. J. Dairy. Sci. 69:546-551.
Stockdale, C.R., and K.R. King. 1983. A note on some of the factors that affect the water consumption of lactating dairy cows at pasture. Anim. Prod. 36:303-309
Stockhill, P. 1991. Water: the neglected nutrient. Large Anim. Vet. 46: 31-32.
Tedeschi, L.O., D.G. Fox, M.J. Baker, and D.P. Kirschten. 2006. Identifying differences in feed efficiency among group-fed cattle. J. Anim. Sci. 84:767-776.
53
Thorton, R.F., and N.G. Yates. 1968. Some effects of water restriction on apparent digestibility and water excretion of cattle. Aust. J. Agric. Res. 19:665-672.
Utley, P.R., N.W. Bradley, and J.A. Boling. 1969. Effect of restricted water intake on feed intake, nutrient digestibility and nitrogen metabolism in steers. J. Anim. Sci. 31:130-135.
Wagner, J.J., G.H. Longeragan, and D.H. Gould. 2001. The effect of water quality on the performance of feedlot cattle. J. Dairy. Sci. 84(suppl.1):85 (Abstract).
Weeth, H.J. and A.L. Lesperance. 1965. Renal function of cattle under various water and salt loads. J. Anim. Sci. 24:441-447. Weichenthal, B.A., L.B. Embry, R.J. Emerick, and F.W. Whetzal. 1963. Influence of sodium nitrate, vitamin A, and protein level on feedlot performance and vitamin A status of fattening cattle. J. Anim. Sci. 22:979-984. Wilks, D.L., C.E. Coppock, J.K. Lanham, K.N. Brooks, C.C. Baker, W.L. Bryson, R.G. Elmore, and R.A. Stermer. 1990. Response of lactating Holstein cows to chilled drinking water in high ambient temperatures. J. Dairy Sci. 73:1091-1099.
Willms, W. 2002. The water source as a factor affecting livestock production. Tech. Bull. Rev. ed. Agriculture and Agri-Food Canada, Lethbridge, Canada
Willms, W.D., O.R. Kenzie, T.A. McCallister, D. Colwell, D. Viera, T.E. Wilmhurst, and M. Olsen. 2002. Effects of water quality on cattle performance. J. Range. Mngmt. 55:452-460
Winchester, C.F., and M.J. Morris.1956. Water intake rates of cattle. J. Anim. Sci. 15:722-740.
Wolff, I.A., and A.E. Wasserman. 1972. Nitrates, nitrites, and nitrosamines. Science. 177:15-19. Woodford, S.T., M.R. Murphy, and C.L Davis. 1984. Water dynamics of dairy cattle as affected by initiation of lactation and feed intake. J. Dairy Sci. 67:2336-2341
54
BIOGRAPHICAL SKETCH
A Florida Gator from the time of birth, Megan Noël Brew was born January 18, 1981 in
Gainesville, Florida. Megan spent her early years exploring the woods and pastures of Lake City,
Florida before returning to Gainesville for school. As a high school student Meg excelled in
History, English, Art, and the Sciences, earning multiple advanced placement credits toward
college in each subject. Upon graduation Megan enrolled at the University of Florida as an
anthropology major. Quickly discovering that she preferred hard science over social science,
Megan transferred into the Department of Animal Science as a sophomore. She obtained her
Bachelor of Science in Animal Science with a concentration in the equine industry in 2004.
Meg spent a year at New Mexico State University where she served as the coach for the
collegiate horse judging team and worked as a graduate assistant in the lab of Dr. Timothy Ross.
Meg relocated to Florida shortly after the birth of her son, Riley Joshua. In January 2006, she
was admitted as a graduate student at the Department of Animal Sciences, University of Florida.
Since that time she has been working on her master’s degree in preparation for a career in
extension education.
An avid equestrian from a young age, Meg has logged many hours on horseback. When
not writing for graduate school, Meg enjoys spending as much time as possible in the barn,
surrounded by horses and cattle.