Embed Size (px)
Citation preview
1
Water harvesting from Soils by Solar-to-Heat Induced
Evaporation and Capillary Water Migration
Xiaotian Li†, Guang Zhang†, Chao Wang, Lichen He, Yantong Xu, Rong Ma and Wei Yao*
Department of Space sciences, Qian Xuesen Laboratory of Space Technology, China Academy of
Space Technology, Beijing 100094, China.
†These authors contributed equally to this work.
*Correspondence and requests for materials should be addressed to W. Y ([email protected])
2
ABSTRACT
Fresh water scarcity is one of the critical challenges for global sustainable development. Several
novel water resources such as passive seawater solar desalination and atmospheric water harvesting
have made some progress in recent years. However, no investigation has referred to harvesting water
from shallow subsurface soils, which are potential huge water reservoirs. Here, we introduce a
method of solar-driven water harvesting from soils, which can provide cheap fresh water in
impoverished, arid and decentralized areas. The concentrated solar energy is used to heat the soils
to evaporate the soil moisture. Then vapors flow to the condenser through tubes and condense as
freshwater. Sustainable water harvesting is realized by water migration due to capillary pumping
effect within soils. In the laboratory condition, an experimental setup is designed and its water-
harvesting ability from soils is investigated. The maximum water mass harvesting rate was 99.8 g
h-1. In about 12 h, the total harvesting water could be as high as about 900 ml. The whole process is
solar-driven and spontaneous without other mechanical or electrical ancillaries. The water
harvesting rate under one sun energy flux (1 kW m-2) is estimated to be about 360 g h-1 with a 1 m2
solar concentrator. Our proposal provides a potential onsite and sustainable fresh water supply
solution to deal with the water scarcity problem.
KEYWORDS: Water harvesting; Soil moisture; Desalination; Solar-driven evaporation.

3
1. INTRODUCTION
Water is essential in our lives, whereas the scarcity of fresh water is still an increasingly
devastating global problem (Everard, 2019). Ensuring access to clean water for all mankind is one
of the 17 sustainable development goals, which is essential and challenging(“Goal 6: Ensure access
to water and sanitation for all,” n.d.). The projected water shortfall for 2030 is almost 2000 billion
m3, more than 20% of the projected global needs(Chiavazzo et al., 2018a; Grum et al., 2016;
Kallenberger and Fröba, 2018; Tu et al., 2018a). 1.1 billion people still have limited access to clean
fresh water according to a report by WHO and predicted to be worsen with the increasing demands
due to population growth and economic development(“1 in 3 people globally do not have access to
safe drinking water – UNICEF, WHO,” n.d.). In particular, the fresh water shortage is more severe
in arid, impoverished, remote areas, and at emergency times. Nowadays, seawater desalination and
atmospheric water harvesting technologies are regarded as two critical ways to alleviate globe water
shortage.
In specific, mature desalination technologies such as reverse osmosis and bulk desalination are
fossil energy cost and environment impact. In addition, large capital consumption and cumbersome
infrastructure make it unavailable in remote rural areas. Recently, increasing interest has been
directed toward high efficiency, low-cost, scalable, green and renewable fresh water desalination,
among them solar-driven interfacial desalination(Bae et al., 2015; Cao et al., 2019; Ghasemi et al.,
2014; G. Li et al., 2018; Siva Reddy et al., 2013; Tao et al., 2018; Wang et al., 2019; Zhang et al.,
2015) and solar-driven passive membrane distillation (Chiavazzo et al., 2018b)are especially
attractive. But after desalination, high-salinity brines are hard to deal with, which may cause
ecological problems. Moreover, desalination is infeasible in the landlocked areas without seawater
4
resources(Miller et al., 2014), which constrains its application. The other way is to harvest water
from the atmosphere. Typical AWGs (atmospheric water generations) such as fog water
collection(Al-hassan, 2009; Fessehaye et al., 2014; Marzol Jaén, 2002) and dew water
collection(Seo et al., 2014) is hard to harvest water from low humidity air, while novel adsorption-
based AWGs employing inorganic salt(Ji et al., 2007; Kallenberger and Fröba, 2018; R. Li et al.,
2018), zeolite, brines and MOFs (metal–organic frameworks) (Fathieh et al., 2018; Kalmutzki et al.,
2018; Kim et al., 2018; LaPotin et al., 2019; Rieth et al., 2017; Umans et al., 2017)have recently
flourished and shows promising prospects even in arid atmosphere. However, the thermodynamic
performance of adsorption-based AWGs is relatively low and some absorbers such as MOFs are still
unstable and unhealthy(Tu et al., 2018b).
Apart from seawater and atmospheric vapor, water storage in shallow subsurface soil between
0 - 2 m is tremendous. It is reported that average soil water content (SWC) between 0 - 2 m
underground is normally in the range of 1.25 % - 25 % gravimetric content (or approximately 2% -
40% volumetric content) in most areas(“https://www.geo.tuwien.ac.at/insitu/data_viewer/#,” n.d.;
Liu and Xie, 2013; Qin et al., 2013). Utilizing this huge water resources to will benefit a lot to
alleviate water shortage. However, no investigations have been made to extracting water from the
shallow subsurface soil to date. In this work, we demonstrated that fresh water extraction from soil
is feasible for the first time. The integrated experimental setup could effectively harvest fresh water
from soils with different SWC. The maximum water mass harvesting rate was 0.1 kg h-1. In about
12 h, the total harvesting water could be as high as about 0.9 kg, which could approximately meet
a single person’s drinking water needs. Then the maximum water harvesting rate of 20 wt.% SWC
soil was estimated to be about 0.36 kg h-1 under one sun (1 kW m-2) with a 1 m2 solar concentrator.
5
Our experimental and theoretical results also demonstrated that the soil moisture could be pumped
to the evaporation interface by capillary force, which enabled quick water replenishment for
continuous water evaporation. Herein, our work opened a new avenue to augment fresh water supply
to alleviate the water shortage with totally solar energy.
2. METHODS AND MATERIALS
2.1 The scheme for solar water mining from soils
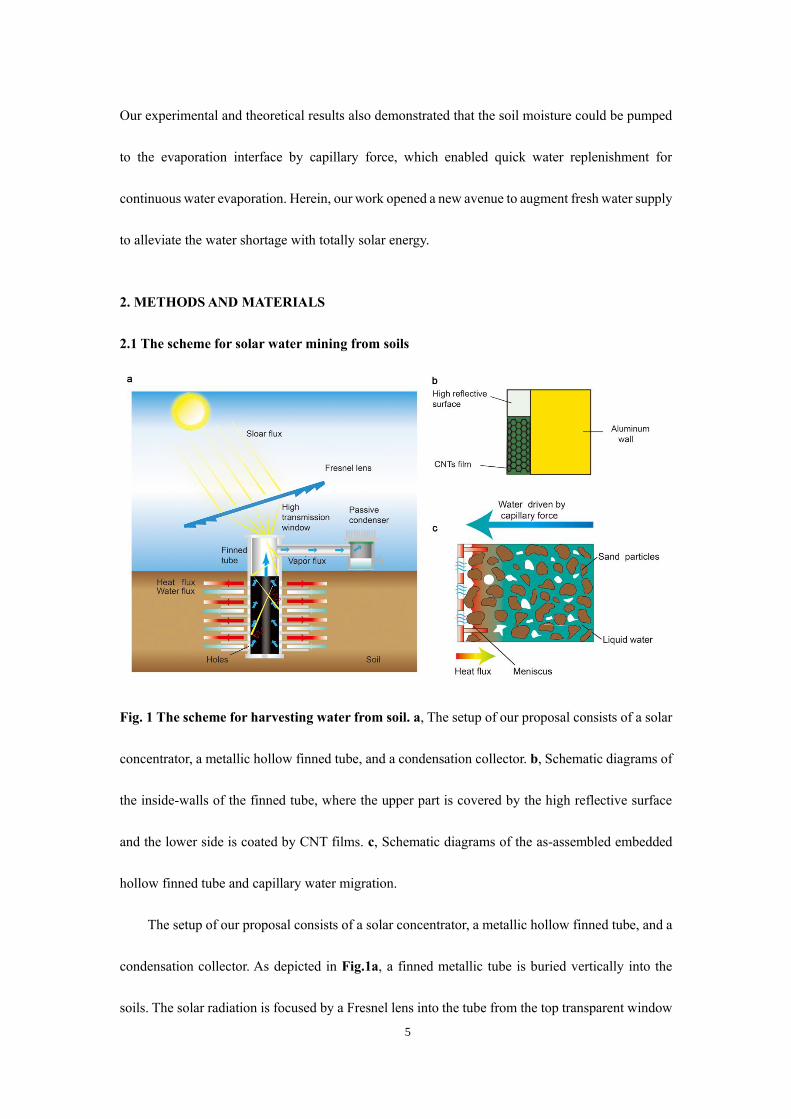
Fig. 1 The scheme for harvesting water from soil. a, The setup of our proposal consists of a solar
concentrator, a metallic hollow finned tube, and a condensation collector. b, Schematic diagrams of
the inside-walls of the finned tube, where the upper part is covered by the high reflective surface
and the lower side is coated by CNT films. c, Schematic diagrams of the as-assembled embedded
hollow finned tube and capillary water migration.
The setup of our proposal consists of a solar concentrator, a metallic hollow finned tube, and a
condensation collector. As depicted in Fig.1a, a finned metallic tube is buried vertically into the
soils. The solar radiation is focused by a Fresnel lens into the tube from the top transparent window
6
and is reflected from the upper part to the lower part inside the tube. Then, the solar irradiation is
approximately completely absorbed by a highly absorbable coating. Fins enhance the heat transfers
to the soils and evaporate the soil moisture. Intensive small holes on the wall allow vapors to flow
into the tube, meanwhile, the soil moisture will migrate from the far side to the heated tube due to
capillary force. Once vapors move up to the passive condenser through a pipe, they are condensed
to fresh water.
As shown in Fig. 1b, the upper side is polished to form a high solar reflective surface. Then
the lower side is coated by multi-walled carbon nanotube (CNT) films for perfect adsorption of solar
radiation(Gokhale et al., 2014). The fabrication, characterization, and properties of the CNT films
are provided in the Supplementary Material. The process for heat and moisture transfer during
solar mining is depicted in Fig. 1c. The heat continues transferring to the soils from the finned tube.
The liquid water at the meniscus of water-air interface near the tube continues evaporating to vapors
with the tube temperature increases. At the same time, the far side soil moisture transports toward
the tube due to the effective capillary force through the tiny porous pathways, which is in analogy
with the heat pipe effect(Udell, 1985). Then, the vapor pressure gradient is built between the soil
pores and the inside of the finned tube, promoting vapor flux into the finned tube through the small
holes on the finned tube wall. Therefore, the accumulated vapors inside the tube provide a positive
pressure to drive the net vapor flow to the condenser.
2.2 Laboratory experiment on harvesting water from sand soils
7
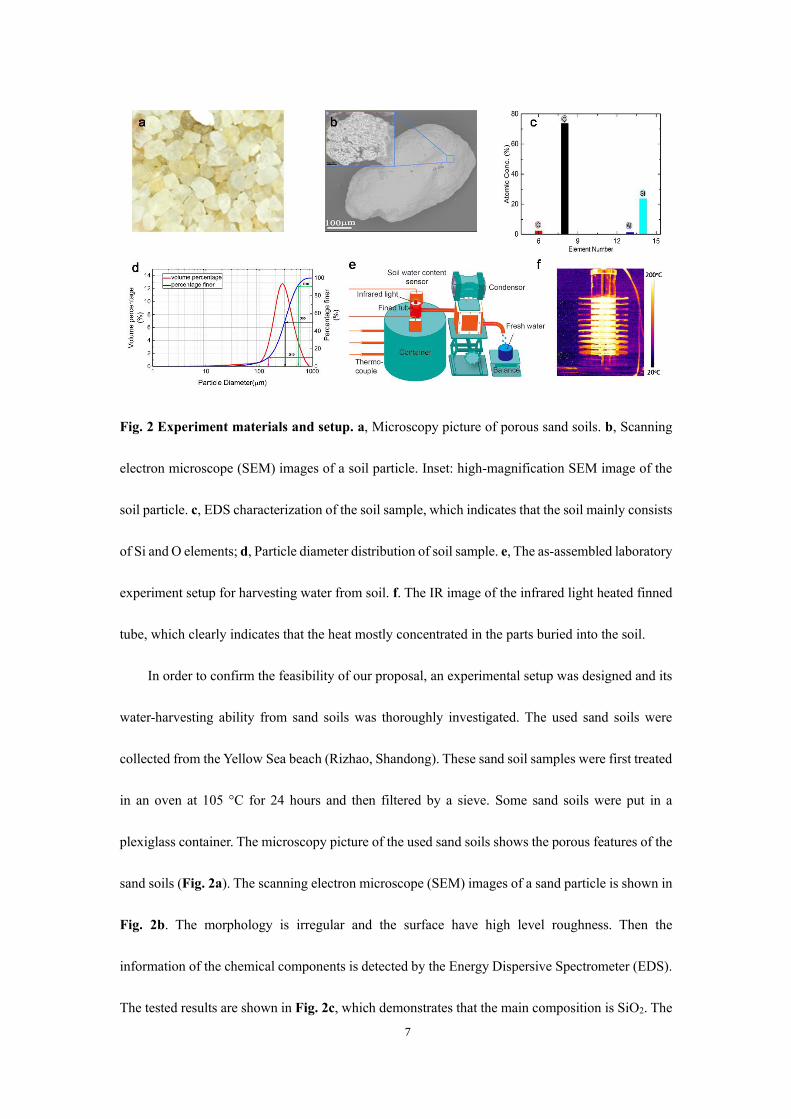
Fig. 2 Experiment materials and setup. a, Microscopy picture of porous sand soils. b, Scanning
electron microscope (SEM) images of a soil particle. Inset: high-magnification SEM image of the
soil particle. c, EDS characterization of the soil sample, which indicates that the soil mainly consists
of Si and O elements; d, Particle diameter distribution of soil sample. e, The as-assembled laboratory
experiment setup for harvesting water from soil. f. The IR image of the infrared light heated finned
tube, which clearly indicates that the heat mostly concentrated in the parts buried into the soil.
In order to confirm the feasibility of our proposal, an experimental setup was designed and its
water-harvesting ability from sand soils was thoroughly investigated. The used sand soils were
collected from the Yellow Sea beach (Rizhao, Shandong). These sand soil samples were first treated
in an oven at 105 °C for 24 hours and then filtered by a sieve. Some sand soils were put in a
plexiglass container. The microscopy picture of the used sand soils shows the porous features of the
sand soils (Fig. 2a). The scanning electron microscope (SEM) images of a sand particle is shown in
Fig. 2b. The morphology is irregular and the surface have high level roughness. Then the
information of the chemical components is detected by the Energy Dispersive Spectrometer (EDS).
The tested results are shown in Fig. 2c, which demonstrates that the main composition is SiO2. The
8
particle diameter distribution is shown in Fig. 2d. It is shown that particles with a particle size
smaller than 512.1 m is account for 90 % (D90). Then the D50 and D10 and are 300.5 m and
183.1 m, respectively.
The as-assembled laboratory experiment setup is shown in Fig. 2e. A hollow tube was buried
vertically in the sand soils. The hollow tube was made up of aluminum (200 mm in length, 30 mm
in diameter and 2 mm wall thickness). The photograph of the hollow tube is shown in
Supplementary Information (Fig. S2). Intensive holes with 1 mm diameter were cut through the
wall. To enhance heat transfer, eleven fins with 10 mm pitch were integrated on the outer walls of
the drill, each was 3 mm thick and 30 mm larger than the outer diameter of the drill in the radial
direction. The plexiglass container was 250 mm in diameter and 200 mm in length.
An infrared light was used to simulate solar concentrator effect in the laboratory condition. The
heating power of the infrared light was controlled by a DC source. The infrared light was 12 mm in
diameter and 250 mm in length, of which the light wavelength was 7-14 m. The power of the
infrared heater ranged from 0 - 800 W and could be modified by changing the voltage and current
when connected to an adjustable DC power supply. The tests were performed in the laboratory
environment where the relative humanity (RH) was 71% and room temperature was 21-24 °C. K-
type thermocouples (range from -40 ~ 900 ºC, resolution 0.1 ºC) were used to measure the
temperature on the outer wall of the finned tube. They could be divided into 3 groups at 60 mm
depth increments from 50 mm below the top of the finned tube. Each group consisted of a pair of
thermocouples placed at the same height level but different circumference location in order to
minimize the random error. A multiple-channel datalogger was used to acquire the temperature data.
As shown in Fig. 2f, the upper wall of the finned tube was less heated and the lower side had a

9
higher temperature, which demonstrated that the heat was mainly absorbed by the lower part. Then
the heated vapor reached into an upper closure of condenser, which was mounted with an aluminum
fins and sprayed by hydrophobic coatings to enhance the condensation of water vapor. Because the
fins enlarged the cold surface for water molecules to collide and the hydrophobic film allows the
water droplet to drop rapidly when it grown over the threshold radius. The distilled water
accumulated on the damp at bottom and then slipped to the water tank. Changes in water content of
soils were measured by two CS655 TDR probes (Campbell scientific tech. co.td) at 10 min intervals
for 7 hours. The distribution of the two probes were 10 cm and 12 cm, respectively, from the center
of the finned tube. The data collection was implemented by a CR800 datalogger (Campbell scientific
tech. co. td). The moisture Migration experiment was conducted under the 20 % moisture condition.
3 RESULTS AND DISCUSSION
3.1 Water harvesting performance of our setup
Here, in order to identify the water harvesting ability of our proposal, sand soils with different
SWC (5%, 10%, and 20%) were prepared and tested for water harvesting experiments. Furthermore,
every soil sample was heated by three different infrared light power (200 W, 250 W, and 300 W).
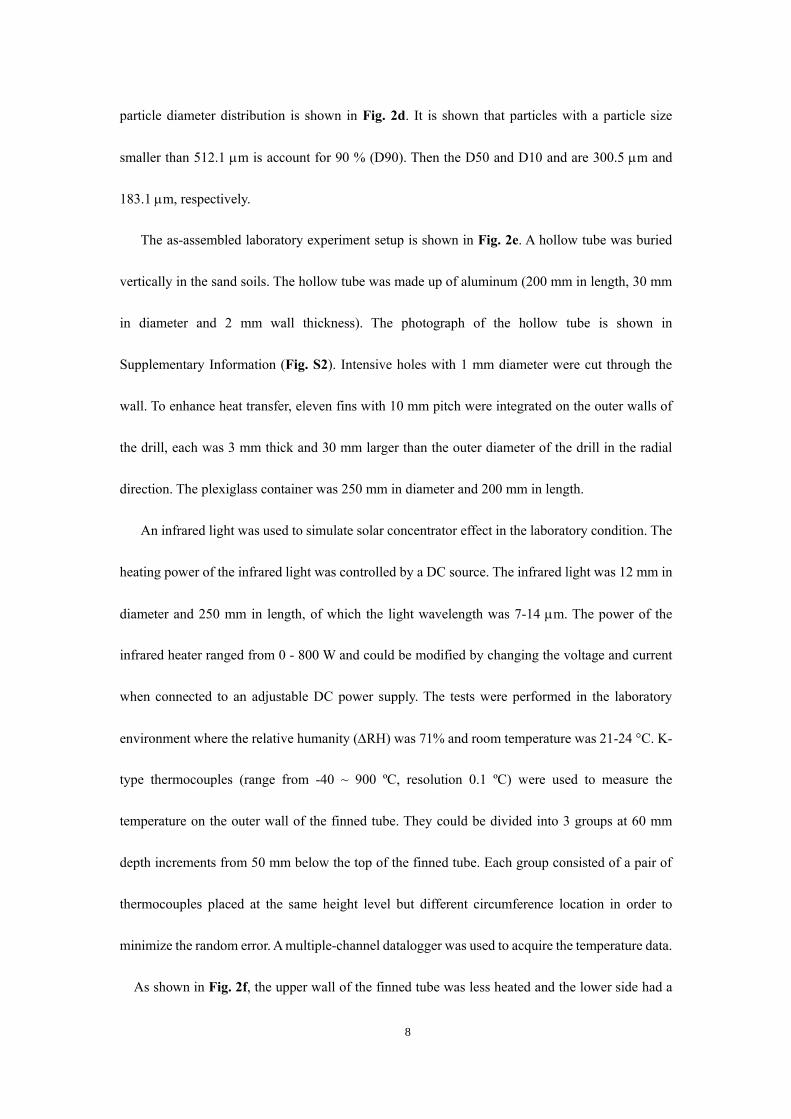
Here, the temperature profiles of the finned tube walls were measured. The temperature profiles at
200 W is shown in Fig. 3a-c. It can be seen that temperature raised rapidly then a plateau appeared
and lasted for several hours. The plateau stayed for several hours regardless of different input powers
and different water contents, meaning that the water was boiling steadily by consuming large
quantity of latent heat, also indirectly revealed that the moisture migration to these areas took place
continuously. After that, the temperature increased rapidly again because the mean water content
declined during the process resulting that the vaporizing rate was faster than the liquid water
10
migration rate into the vaporization zone, which lead to a fast temperature rising of the porous matrix.
At 10% and 20% water content, the temperature arrived to the boiling point firstly, and then stayed
steady for several hour. The steady time was longer when water content was higher. In our study the
maximum mean temperature of the finned tube was 350 ºC, which is far below the melting
temperatures of the aluminum and CNTs.
Fig. 3 Water harvesting performances. a, Temperature of finned tube walls at 5% water content,
200 W. b, Temperature of finned tube walls at 10% water content, 200 W. c, temperature of finned
tube walls at 20% water content, 200 W. d, Water harvesting rate (water harvesting mass per hour,
g h-1) against different power at 5% water content. e, Water harvesting rate against different power
at 10% water content. f, Water harvesting rate against different power at 20% water content.
The water harvesting performances of our as-assembled setup are shown in Fig. 3d-f. As shown
in Fig. 3d, when the soil is relatively arid (SWC ~ 5%), our setup could effectively extract fresh
water from the arid soil at three different heating powers (200 W, 250 W, and 300 W). The water
collection mass increased with the heating power. In addition, the water collection rate (water
harvesting mass per hour, g h-1) firstly increased and then reached to a stable value. In 12 h, the total
11
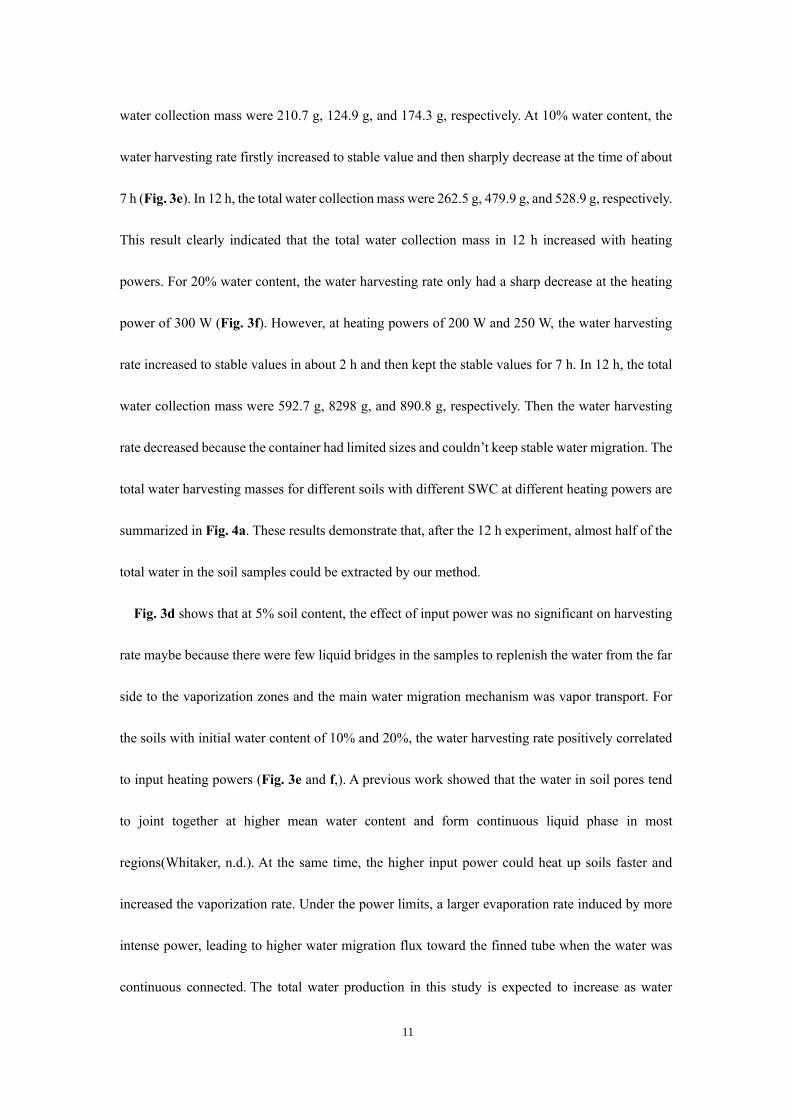
water collection mass were 210.7 g, 124.9 g, and 174.3 g, respectively. At 10% water content, the
water harvesting rate firstly increased to stable value and then sharply decrease at the time of about
7 h (Fig. 3e). In 12 h, the total water collection mass were 262.5 g, 479.9 g, and 528.9 g, respectively.
This result clearly indicated that the total water collection mass in 12 h increased with heating
powers. For 20% water content, the water harvesting rate only had a sharp decrease at the heating
power of 300 W (Fig. 3f). However, at heating powers of 200 W and 250 W, the water harvesting
rate increased to stable values in about 2 h and then kept the stable values for 7 h. In 12 h, the total
water collection mass were 592.7 g, 8298 g, and 890.8 g, respectively. Then the water harvesting
rate decreased because the container had limited sizes and couldn’t keep stable water migration. The
total water harvesting masses for different soils with different SWC at different heating powers are
summarized in Fig. 4a. These results demonstrate that, after the 12 h experiment, almost half of the
total water in the soil samples could be extracted by our method.
Fig. 3d shows that at 5% soil content, the effect of input power was no significant on harvesting
rate maybe because there were few liquid bridges in the samples to replenish the water from the far
side to the vaporization zones and the main water migration mechanism was vapor transport. For
the soils with initial water content of 10% and 20%, the water harvesting rate positively correlated
to input heating powers (Fig. 3e and f,). A previous work showed that the water in soil pores tend
to joint together at higher mean water content and form continuous liquid phase in most
regions(Whitaker, n.d.). At the same time, the higher input power could heat up soils faster and
increased the vaporization rate. Under the power limits, a larger evaporation rate induced by more
intense power, leading to higher water migration flux toward the finned tube when the water was
continuous connected. The total water production in this study is expected to increase as water
12
content increases at the same input power, which indicates that higher water content makes easier
water harvesting.
Fig. 4 Total water harvesting masses and soil moisture migration results. a, The total harvesting
water mass in about 12 h. b, Water content change at 10 cm and 12 cm away from finned tube center
at 20% water content and 200 W. c, Water content change at 10 cm and 12 cm away from finned
tube center at 20% water content and 300 W.
Fig. 4b and c show the water migration experimentsal results of water migration. The gravimetric
soil water content was transformed to the volume soil water content (VWC) to show the migration
of soil moisture during our experiment. The soil moisture transported away from the tube at first
because the water vapors transports to the colder surface as the temperature of the tube increases.
However, due to the increase of capillary force resulting from the increasing evaporation rate, this
progress only sustained for about several minutes. The soil moisture migration rate caused by
capillary force is faster than vapor flux due to temperature gradient. So, the total soil moisture
migration is toward the tube, resulting in the decreasing water content of the soil at the far side. The
results also show that the migration rate increased as the input power increased. Because in our
experiment condition, higher input power induces higher capillary force. Thus, we demonstrated the
continuous water migration to the tube during our experiment. We conducted the water migration
13
experiment for 6 hours because the temperature of soil water content sensor couldn’t work for long
time when the temperature is higher than 70 oC.
3.2 Numerical simulation results
To reveal the water distribution in the sand during experiment, COMSOL Multiphysics software
was used to simulate the process at 20% water content and 200 W. The model results were shown
in Fig.5 (a-e). A coupled porous media heat and mass model(Hongbing et al., 2015; Jin et al., 2018;
Nassar and Horton, 1997; Wang et al., 2015) was used to describe the temperature and moisture
distribution in the sand sample, parameters can be found in the listed references. In order to simplify
calculation, a two-dimensional axisymmetric domain was used. (Supplementary Information Fig.
S3). The water transport process was modeled. The water content decreased in the vicinity of the
finned tube as evaporation was in progress. At the same time, the water content at the far side away
from the finned tube also decreased due to water migration induced by capillary force toward the
center. Simultaneously, the simulation results of the temperature distribution at 12 h in the sample
showed a good agreement with our experiment results. The heat was mainly concentrated around
the finned tube because phase change and water migrations kept most heat from transporting deeper
into the sample. In another word, the sample was locally heated. The highest temperature of the
finned tube was about 260 ºC and the temperature at the edge of the sample was nearly 50 ºC.

14
Fig 5. Numerical results. a, the moisture content distribution of soils at heating power of 200 W at
1st hour. b, moisture content distribution of soils at heating power of 200 W at 4th hour. c, moisture
content distribution of soils at heating power of 200 W at 8th hour. d, moisture content distribution
of soils at heating power of 200 W at 12th hour. e, temperature distribution of the setup at the 12th
hour. f, temperature of walls at 200 W and 20% wt. g, temperature of walls at 250 W and 20% wt.
h, temperature of walls at 300 W and 20% wt.
3.3 Maximum water harvesting capability analysis
It is assumed that in the process of water abstraction, the liquid water in the sand is continuously
distributed, and the evaporation rate is considered to be equal to the capillary flow rate, and the
liquid can be continuously replenished, and the temperature of the boiling liquid surface is assumed
to be constant, and the influence of temperature on the capillary force is considered to be negligible.
And then proceed to the discussion below. In sand, the interfacial capillary force of the pore liquid-
non-wetting phase is:
𝑝c =2𝜎cos 𝜃
𝑟eff (1)
15
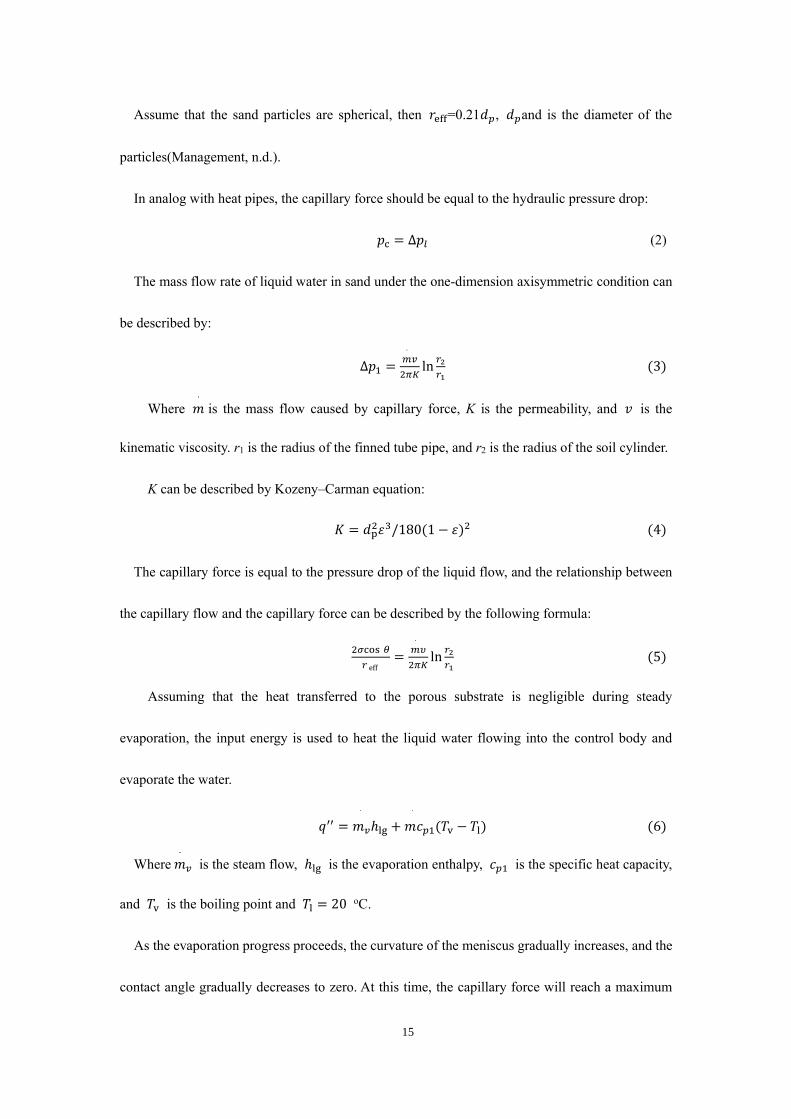
Assume that the sand particles are spherical, then 𝑟eff 00.21𝑑𝑝 , 𝑑𝑝 and is the diameter of the
particles(Management, n.d.).
In analog with heat pipes, the capillary force should be equal to the hydraulic pressure drop:
𝑝c = Δ𝑝𝑙 (2)
The mass flow rate of liquid water in sand under the one-dimension axisymmetric condition can
be described by:
Δ𝑝1 =𝑚˙𝑣
2𝜋𝐾ln
𝑟2
𝑟1 (3)
Where 𝑚˙ is the mass flow caused by capillary force, K is the permeability, and 𝑣 is the
kinematic viscosity. r1 is the radius of the finned tube pipe, and r2 is the radius of the soil cylinder.
K can be described by Kozeny–Carman equation:
𝐾 = 𝑑p2𝜀3/180(1 − 𝜀)2 (4)
The capillary force is equal to the pressure drop of the liquid flow, and the relationship between
the capillary flow and the capillary force can be described by the following formula:
2𝜎cos𝜃
𝑟eff=
𝑚˙𝜐
2𝜋𝐾ln
𝑟2
𝑟1 (5)
Assuming that the heat transferred to the porous substrate is negligible during steady
evaporation, the input energy is used to heat the liquid water flowing into the control body and
evaporate the water.
𝑞′′ = 𝑚˙
𝑣ℎlg +𝑚˙
𝑐𝑝1(𝑇v − 𝑇l) (6)
Where𝑚˙
𝑣 is the steam flow, ℎlg is the evaporation enthalpy, 𝑐𝑝1 is the specific heat capacity,
and 𝑇v is the boiling point and 𝑇l = 20 oC.
As the evaporation progress proceeds, the curvature of the meniscus gradually increases, and the
contact angle gradually decreases to zero. At this time, the capillary force will reach a maximum
16
value. When the evaporation rate and capillary flow are equal, the relationship between maximum
capillary force and maximum heat flux is obtained.
𝑞𝑚𝑎𝑥′′ =
4𝜎𝜋𝐾
𝜐𝑟eff ln𝑟2𝑟1
[ℎlg + 𝑐𝑝l(𝑇v − 𝑇l)] (7)
Substituting 𝑝cmax into the equation (7) gives the best energy input density. If we continue to
increase the input energy, the capillary flow will be less than the evaporation flow, the liquid level
will retreat, and the evaporation interface will expand backward. The limit power density of sand,
loam and clay was computed with some typical values. Given r1 0 40 mm, r2 0 10 m, the peak power
density is: 811.4 kW m-2, 77.9 kW m-2, 12.2 kW m-2 for sand, loam and clay respectively. Because
although the maximum capillary force increases as particle size decreases, the permeability of soils
decreases with particle size increasing. According to the analyses, for soils smaller particles, larger
tube should be designed in order to achieve the same water harvesting rate.
In our laboratory experiments, the input power was only 15.9 kW m-2, far below the maximum
power density of the sand soil. The theoretical maximum mass flow rate under one sun is estimated
to be 1.34 kg m-2 h-1 under one sun. We achieved 360 g h-1 because of the limited size of the container
and the mass loss during condensation, which indicate that there is still room for the improvement
of our devices.
4 Conclusion
In summary, we present a novel method which can harvest water from the soils with low cost, simple
structure and solar-driven devices. Our proposal may be suitable to provide cheap fresh water in the
impoverished, arid, decentralized systems, and in post-disaster times. Both the model and the
experiments predicted that the water could migrate to the vaporized area, resulted in continuously
water harvesting. In the laboratory, we observed that this process is efficiently with respect to the
17
sand soil under different water content and input power density. The maximum water mass
harvesting rate was 0.1 kg h-1. In about 12 h, the total harvesting water could be as high as about 0.9
kg. Then the maximum water harvesting rata of the device under one sun energy flux (1 kW m-2) is
estimated to be about 0.36 kg h-1 with a 1 m2 solar concentrator. Our current experimental setup is
possible to harvest 4.32 kg water for 12 hours under the above condition, which can meet the fresh
water requirements of two people for one day.
Acknowledgements
This work was supported by the National Natural Science Foundation of China (51702357,
11602285) and the
Research Grant of China Aerospace Science and Technology Corporation (Y-KC-JT-00-013).
Competing interests
The authors declare no competing interests.
Appendix A. Supplementary material
Supplementary data to this article can be found online at
Reference
1 in 3 people globally do not have access to safe drinking water – UNICEF, WHO [WWW Document],
n.d. URL https://www.who.int/news-room/detail/18-06-2019-1-in-3-people-globally-do-not-have-
access-to-safe-drinking-water-unicef-who
Al-hassan, G.A., 2009. Fog water collection evaluation in Asir region - Saudi Arabia. Water Resour.
Manag. 23, 2805–2813.
18
Bae, K., Kang, G., Cho, S. K., Park, W., Kim, K., & Padilla, W. J. 2015 . Flexible thin-film black gold
membranes with ultrabroadband plasmonic nanofocusing for efficient solar vapour generation. Nat.
Commun., 6, 10103.
Cao, S., Jiang, Q., Wu, X., Ghim, D., Derami, H. G., Chou, P. I. & Singamaneni, S. 2019. Advances in
solar evaporator materials for freshwater generation. J. Mater. Chem., 7(42), 24092-24123.
Chiavazzo, E., Morciano, M., Viglino, F., Fasano, M., & Asinari, P. 2018. Passive solar high-yield
seawater desalination by modular and low-cost distillation. Nat. Sustain. 1, 763–772.
Everard, M. 2019. Meeting global drinking water needs. Nature Sustainability, 2(5), 360.
Fathieh, F., Kalmutzki, M.J., Kapustin, E.A., Waller, P.J., Yang, J., Yaghi, O.M.,2018. Practical water
production from desert air. Sci. Adv. 4, 1–10.
Fessehaye, M., Abdul-Wahab, S.A., Savage, M.J., Kohler, T., Gherezghiher, T., Hurni, H., 2014. Fog-
water collection for community use. Renew. Sustain. Energy Rev. 29, 52–62.
Ghasemi, H., Ni, G., Marconnet, A.M., Loomis, J., Yerci, S., Miljkovic, N., Chen, G., 2014. Solar
steam generation by heat localization. Nat. Commun. 5, 1–7.
Goal 6: Ensure access to water and sanitation for all [WWW Document], n.d. URL
https://www.un.org/sustainabledevelopment/water-and-sanitation/
Gokhale, V.J., Shenderova, O.A., McGuire, G.E., Rais-Zadeh, M., 2014. Infrared absorption properties
of carbon nanotube/nanodiamond based thin film coatings. J. Microelectromechanical Syst. 23, 191–
196.
Grum, B., Hessel, R., Kessler, A., Woldearegay, K., Yazew, E., Ritsema, C., Geissen, V., 2016. A
decision support approach for the selection and implementation of water harvesting techniques in arid
and semi-arid regions. Agric. Water Manag. 173, 35–47.

19
Hongbing, C., Hanwan, D., Songyu, L., Wei, W., Lei, Z., 2015. Comparative Study on Heat and
Moisture Transfer in Soil Heat Charging at High Temperature for Various Soils. Energy Procedia 75,
3148–3153.
https://www.geo.tuwien.ac.at/insitu/data_viewer/# [WWW Document], n.d. URL
https://www.geo.tuwien.ac.at/insitu/data_viewer/#
Ji, J.G., Wang, R.Z., Li, L.X., 2007. New composite adsorbent for solar-driven fresh water production
from the atmosphere. Desalination 212, 176–182.
Jin, H., Guo, Y., Deng, H., Qi, X., Gui, J., 2018. Jin, H., Guo, Y., Deng, H., Qi, X., & Gui, J. 2018. A
Simulation Model for Coupled Heat Transfer and Moisture Transport under the Action of Heat Source
in Unsaturated Soils. Sci. Rep., 8(1), 7750.
Kallenberger, P.A., Fröba, M., 2018. Water harvesting from air with a hygroscopic salt in a hydrogel–
derived matrix. Commun. Chem. 1, 6–11.
Kalmutzki, M.J., Diercks, C.S., Yaghi, O.M., 2018. Metal–Organic Frameworks for Water Harvesting
from Air. Adv. Mater. 30, 1–26.
Kim, H., Rao, S.R., Kapustin, E.A., Zhao, L., Yang, S., Yaghi, O.M., Wang, E.N., 2018. Adsorption-
based atmospheric water harvesting device for arid climates. Nat. Commun. 9, 1–8.
LaPotin, A., Kim, H., Rao, S.R., Wang, E.N., 2019. Adsorption-Based Atmospheric Water Harvesting:
Impact of Material and Component Properties on System-Level Performance. Acc. Chem. Res. 52,
1588–1597.
Li, G., Law, W.C., Chan, K.C., 2018. Floating, highly efficient, and scalable graphene membranes for
seawater desalination using solar energy. Green Chem. 20, 3689–3695.
Li, R., Shi, Y., Shi, L., Alsaedi, M., Wang, P., 2018. Harvesting Water from Air: Using Anhydrous Salt

20
with Sunlight. Environ. Sci. Technol. 52, 5398–5406.
Liu, J. G., & Xie, Z. H. 2013. Improving simulation of soil moisture in China using a multiple
meteorological forcing ensemble approach. Hydrol. Earth Syst. Sci., 17(9), 3355-3369.
Zohuri, Bahman. Heat pipe design and technology: Modern applications for practical thermal
management. 2016.Springer.
Marzol Jaén, M.V., 2002. Fog water collection in a rural park in the Canary Islands (Spain). Atmos.
Res. 64, 239–250.
Miller, S., Shemer, H., Semiat, R., 2014. Energy and environmental issues in desalination. Desalination
366, 2–8.
Nassar, I.N., Horton, R., 1997. Heat, Water, and Solute Transfer in Unsaturated Porous Media: I -
Theory Development and Transport Coefficient Evaluation. Transp. Porous Media 27, 17–38.
Qin, Y., Chen, X., Zhou, K., Klenk, P., Roth, K., & Sun, L. 2013. Ground-penetrating radar for
monitoring the distribution of near-surface soil water content in the Gurbantünggüt Desert. Environ.
Earth Sci., 70(6), 2883-2893.
Rieth, A.J., Yang, S., Wang, E.N., Dincǎ, M., 2017. Record Atmospheric Fresh Water Capture and
Heat Transfer with a Material Operating at the Water Uptake Reversibility Limit. ACS Cent. Sci. 3,
668–672.
Seo, D., Lee, C., Nam, Y., 2014. Influence of geometric patterns of microstructured superhydrophobic
surfaces on water harvesting performance via dewing. J. Phys. Conf. Ser. 557, 12068.
Siva Reddy, V., Kaushik, S.C., Ranjan, K.R., Tyagi, S.K., 2013. State-of-the-art of solar thermal power
plants - A review. Renew. Sustain. Energy Rev. 27, 258–273.
Tao, P., Ni, G., Song, C., Shang, W., Wu, J., Zhu, J., Chen, G., Deng, T., 2018. Solar-driven interfacial

21
evaporation. Nat. Energy 3, 1031–1041.
Tu, Y., Wang, R., Zhang, Y., & Wang, J. 2018. Progress and expectation of atmospheric water
harvesting. Joule, 2(8), 1452-1475.
Udell, K. S. 1985. Heat transfer in porous media considering phase change and capillarity—the heat
pipe effect. Int. J. Heat Mass Transfer, 28(2), 485-495.
Umans, A.S., Rao, S.R., Furukawa, H., Kim, H., Yaghi, O.M., Kapustin, E.A., Wang, E.N., Yang, S.,
Narayanan, S., 2017. Water harvesting from air with metal-organic frameworks powered by natural
sunlight. Science (80-. ). 358, eaao3139.
Wang, H., Feng, L., Wang, X., Wang, Y., 2015. Experimental study of heat and moisture migration in
unsaturated soils under thermal boundaries. Electron. J. Geotech. Eng. 20, 221–232.
Wang, Z., Horseman, T., Straub, A.P., Yip, N.Y., Li, D., Elimelech, M., Lin, S., 2019. Pathways and
challenges for efficient solar-thermal desalination. Sci. Adv. 5, eaax0763.
Whitaker, Stephen. ,1977, "Simultaneous heat, mass, and momentum transfer in porous media: a theory
of drying." Adv. Heat Transfer. Vol. 13. Elsevier,. 119-203.
Zhang, L., Tang, B., Wu, J., Li, R., Wang, P., 2015. Hydrophobic Light-to-Heat Conversion
Membranes with Self-Healing Ability for Interfacial Solar Heating. Adv. Mater. 27, 4889–4894.
22
Supplementary Material
Water harvesting from Soils by Solar-to-Heat Induced
Evaporation and Capillary Water Migration
Xiaotian Li†, Guang Zhang†, Chao Wang, Lichen He, Yantong Xu, Rong Ma and Wei
Yao*
Department of Space sciences, Qian Xuesen Laboratory of Space Technology, China
Academy of Space Technology, Beijing 100094, China.
†These authors contributed equally to this work.
23
*Correspondence and requests for materials should be addressed to W. Y
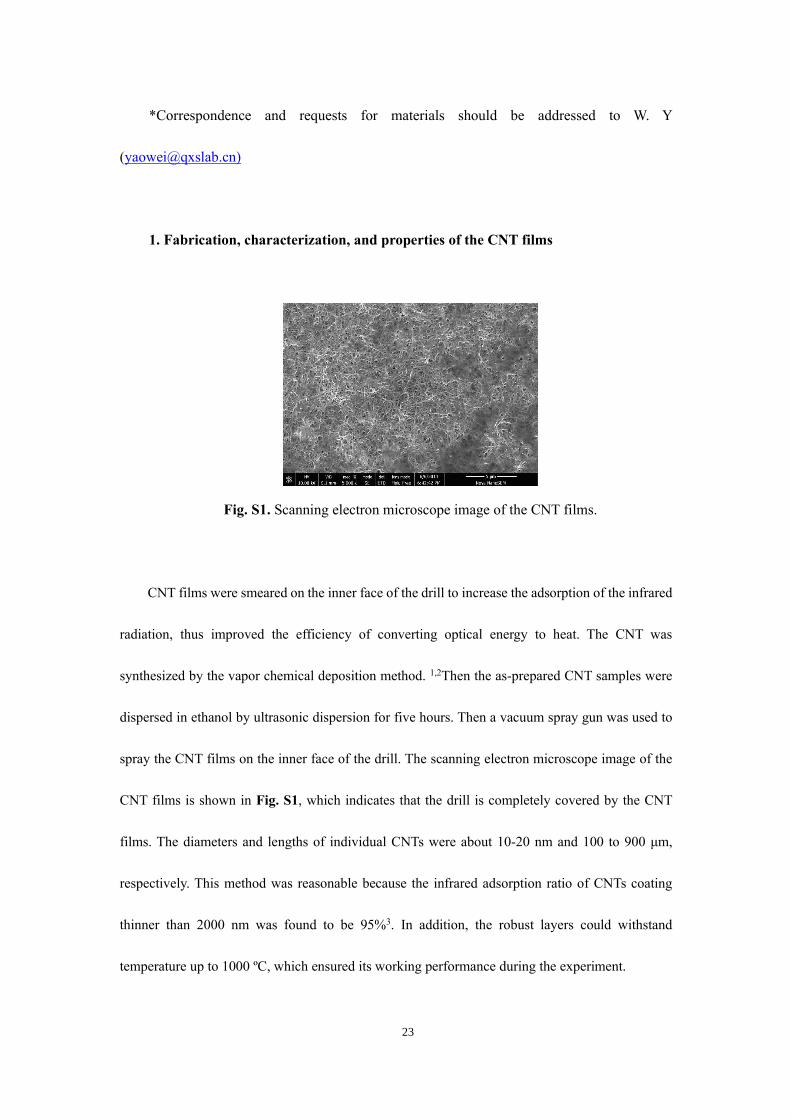
1. Fabrication, characterization, and properties of the CNT films
Fig. S1. Scanning electron microscope image of the CNT films.
CNT films were smeared on the inner face of the drill to increase the adsorption of the infrared
radiation, thus improved the efficiency of converting optical energy to heat. The CNT was
synthesized by the vapor chemical deposition method. 1,2Then the as-prepared CNT samples were
dispersed in ethanol by ultrasonic dispersion for five hours. Then a vacuum spray gun was used to
spray the CNT films on the inner face of the drill. The scanning electron microscope image of the
CNT films is shown in Fig. S1, which indicates that the drill is completely covered by the CNT
films. The diameters and lengths of individual CNTs were about 10-20 nm and 100 to 900 μm,
respectively. This method was reasonable because the infrared adsorption ratio of CNTs coating
thinner than 2000 nm was found to be 95%3. In addition, the robust layers could withstand
temperature up to 1000 ºC, which ensured its working performance during the experiment.
24
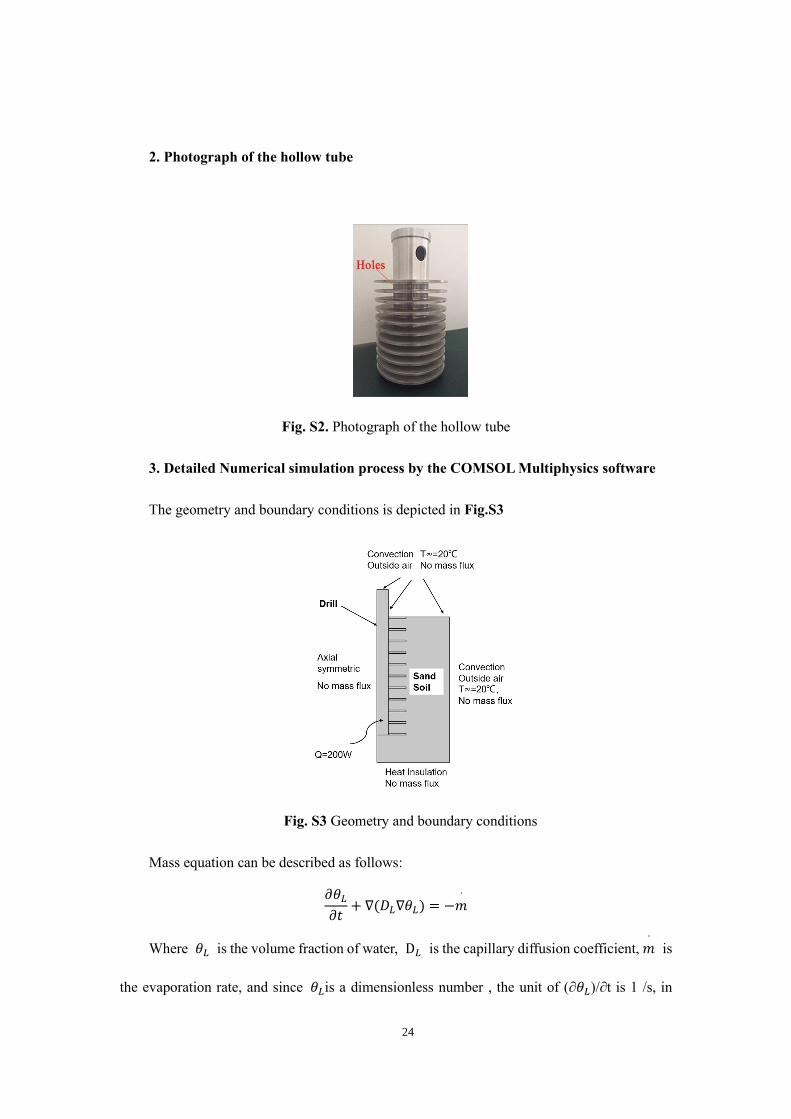
2. Photograph of the hollow tube
Fig. S2. Photograph of the hollow tube
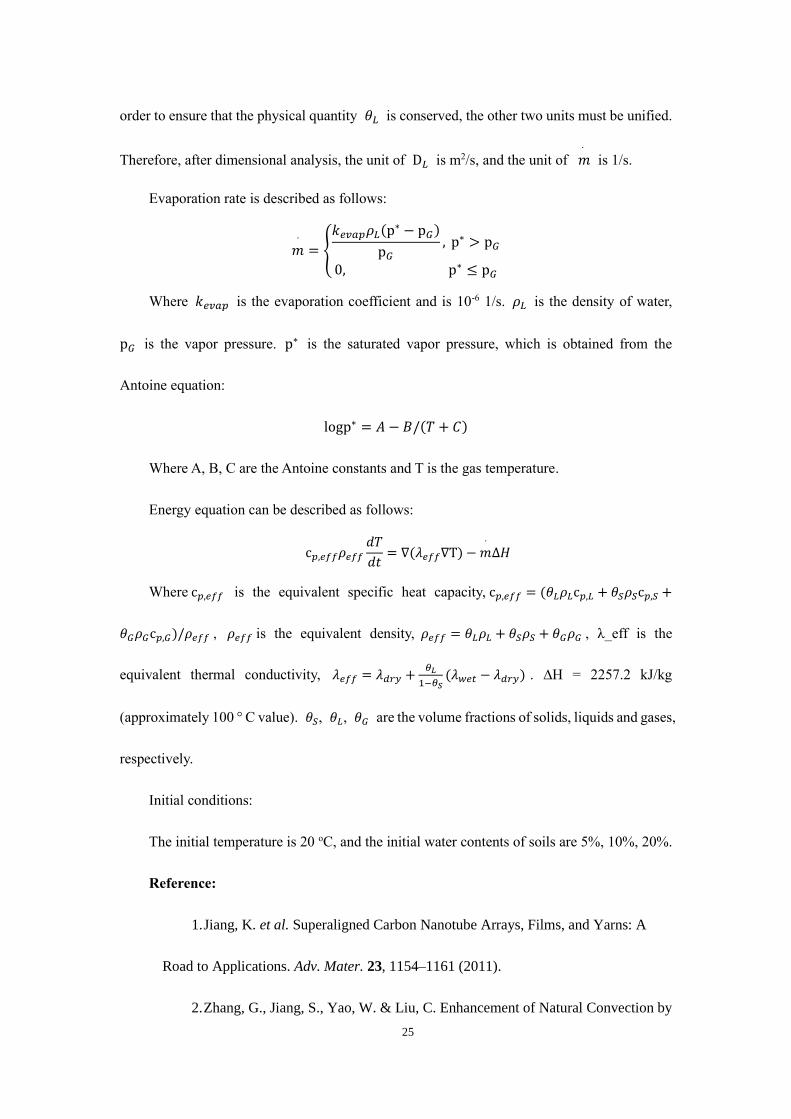
3. Detailed Numerical simulation process by the COMSOL Multiphysics software
The geometry and boundary conditions is depicted in Fig.S3
Fig. S3 Geometry and boundary conditions
Mass equation can be described as follows:
𝜕𝜃𝐿𝜕𝑡
+ ∇(𝐷𝐿∇𝜃𝐿) = −𝑚˙
Where 𝜃𝐿 is the volume fraction of water, D𝐿 is the capillary diffusion coefficient,𝑚˙
is
the evaporation rate, and since 𝜃𝐿is a dimensionless number , the unit of (∂𝜃𝐿)/∂t is 1 /s, in
25
order to ensure that the physical quantity 𝜃𝐿 is conserved, the other two units must be unified.
Therefore, after dimensional analysis, the unit of D𝐿 is m2/s, and the unit of 𝑚˙
is 1/s.
Evaporation rate is described as follows:
𝑚˙= {
𝑘𝑒𝑣𝑎𝑝𝜌𝐿(p∗ − p𝐺)
p𝐺, p∗ > p𝐺
0, p∗ ≤ p𝐺
Where 𝑘𝑒𝑣𝑎𝑝 is the evaporation coefficient and is 10-6 1/s. 𝜌𝐿 is the density of water,
p𝐺 is the vapor pressure. p∗ is the saturated vapor pressure, which is obtained from the
Antoine equation:
logp∗ = 𝐴 − 𝐵/(𝑇 + 𝐶)
Where A, B, C are the Antoine constants and T is the gas temperature.
Energy equation can be described as follows:
c𝑝,𝑒𝑓𝑓𝜌𝑒𝑓𝑓𝑑𝑇
𝑑𝑡= ∇(𝜆𝑒𝑓𝑓∇T) −𝑚
˙∆𝐻
Where c𝑝,𝑒𝑓𝑓 is the equivalent specific heat capacity, c𝑝,𝑒𝑓𝑓 = (𝜃𝐿𝜌𝐿c𝑝,𝐿 + 𝜃𝑆𝜌𝑆c𝑝,𝑆 +
𝜃𝐺𝜌𝐺c𝑝,𝐺)/𝜌𝑒𝑓𝑓 , 𝜌𝑒𝑓𝑓 is the equivalent density, 𝜌𝑒𝑓𝑓 = 𝜃𝐿𝜌𝐿 + 𝜃𝑆𝜌𝑆 + 𝜃𝐺𝜌𝐺 , __eff is the
equivalent thermal conductivity, 𝜆𝑒𝑓𝑓 = 𝜆𝑑𝑟𝑦 +𝜃𝐿
1−𝜃𝑆(𝜆𝑤𝑒𝑡 − 𝜆𝑑𝑟𝑦) . HH 0 2257.2 kJ/kg
(approximately 100 ° C value). 𝜃𝑆, 𝜃𝐿, 𝜃𝐺 are the volume fractions of solids, liquids and gases,
respectively.
Initial conditions:
The initial temperature is 20 oC, and the initial water contents of soils are 5%, 10%, 20%.
Reference:
1. Jiang, K. et al. Superaligned Carbon Nanotube Arrays, Films, and Yarns: A
Road to Applications. Adv. Mater. 23, 1154–1161 (2011).
2. Zhang, G., Jiang, S., Yao, W. & Liu, C. Enhancement of Natural Convection by

26
Carbon Nanotube Films Covered Microchannel-Surface for Passive Electronic
Cooling Devices. ACS Appl. Mater. Interfaces 8, 31202–31211 (2016).
3. Gokhale, V. J., Shenderova, O. A., McGuire, G. E. & Rais-Zadeh, M. Infrared
absorption properties of carbon nanotube/nanodiamond based thin film coatings. J.
Microelectromechanical Syst. 23, 191–196 (2014).