Embed Size (px)
Citation preview
Water Department
ConsumerConfi denceReport
2 2 0 03 C O N S U M E R C O N F I D E N C E R E P O R T
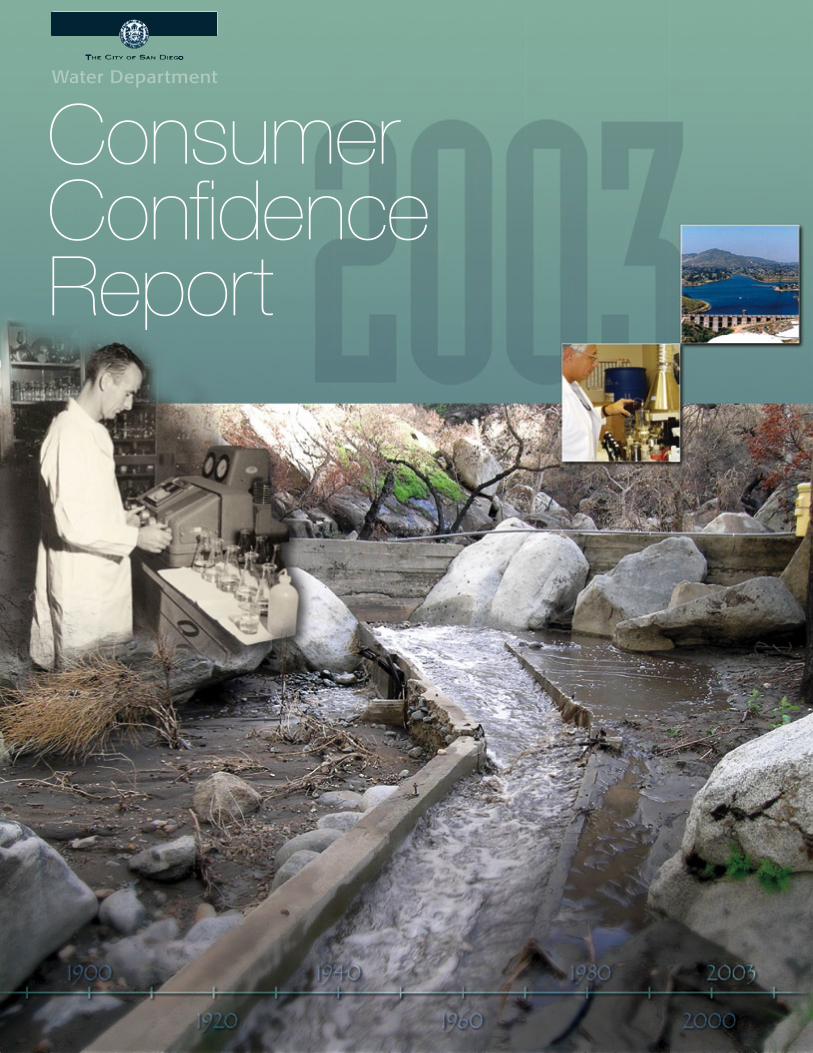
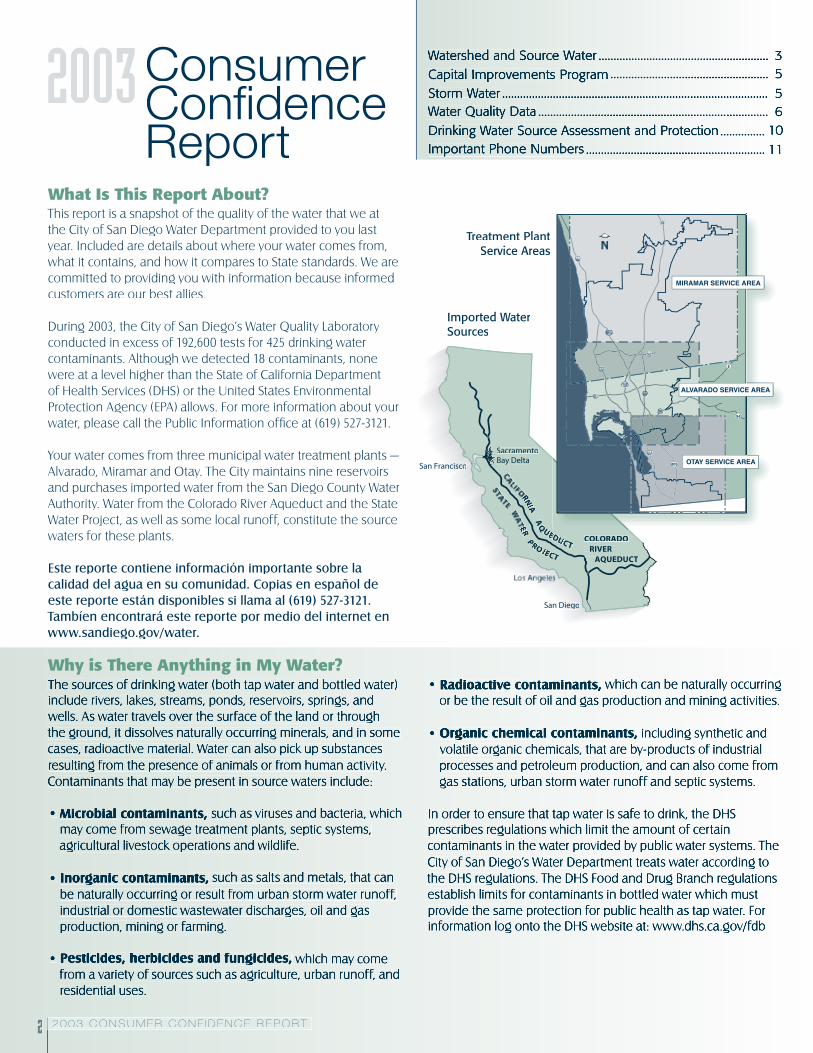
2003 What Is This Report About?This report is a snapshot of the quality of the water that we at the City of San Diego Water Department provided to you last year. Included are details about where your water comes from, what it contains, and how it compares to State standards. We are committed to providing you with information because informed customers are our best allies.
During 2003, the City of San Diego’s Water Quality Laboratory conducted in excess of 192,600 tests for 425 drinking water contaminants. Although we detected 18 contaminants, none were at a level higher than the State of California Department of Health Services (DHS) or the United States Environmental Protection Agency (EPA) allows. For more information about your water, please call the Public Information offi ce at (619) 527-3121.
Your water comes from three municipal water treatment plants — Alvarado, Miramar and Otay. The City maintains nine reservoirs and purchases imported water from the San Diego County Water Authority. Water from the Colorado River Aqueduct and the State Water Project, as well as some local runoff, constitute the source waters for these plants.
Este reporte contiene información importante sobre la calidad del agua en su comunidad. Copias en español de este reporte están disponibles si llama al (619) 527-3121. Tambíen encontrará este reporte por medio del internet en www.sandiego.gov/water.
Why is There Anything in My Water?The sources of drinking water (both tap water and bottled water) include rivers, lakes, streams, ponds, reservoirs, springs, and wells. As water travels over the surface of the land or through the ground, it dissolves naturally occurring minerals, and in some cases, radioactive material. Water can also pick up substances resulting from the presence of animals or from human activity. Contaminants that may be present in source waters include:
• Microbial contaminants, such as viruses and bacteria, which may come from sewage treatment plants, septic systems, agricultural livestock operations and wildlife.
• Inorganic contaminants, such as salts and metals, that can be naturally occurring or result from urban storm water runoff, industrial or domestic wastewater discharges, oil and gas production, mining or farming.
• Pesticides, herbicides and fungicides, which may come from a variety of sources such as agriculture, urban runoff, and residential uses.
• Radioactive contaminants, which can be naturally occurring or be the result of oil and gas production and mining activities.
• Organic chemical contaminants, including synthetic and volatile organic chemicals, that are by-products of industrial processes and petroleum production, and can also come from gas stations, urban storm water runoff and septic systems.
In order to ensure that tap water is safe to drink, the DHS prescribes regulations which limit the amount of certain contaminants in the water provided by public water systems. The City of San Diego’s Water Department treats water according to the DHS regulations. The DHS Food and Drug Branch regulations establish limits for contaminants in bottled water which must provide the same protection for public health as tap water. For information log onto the DHS website at: www.dhs.ca.gov/fdb
Treatment Plant Service Areas
Consumer Confi dence Report
���������������������������������������������������������������������������������������������������������������������������������������������������������������������������������������������������������������������������������������������������������������������������������������������������������������������������������������������������������������������������������������������������������������������������������������������������������������������������������������������������������������������������������������������������������������������������������������������������������
�������������������
������������������������������������������������������������������������������������������������������������������������������������������������������������������������������������������������������������������������������������������������������������������������������������������������������������������������������������������������������������������������������������������������������������������������������
����
��
������
��� �����
���������������������������������������������
8
8
52
94
163
15
15
5
94
5
805
5
805
MIRAMAR SERVICE AREA
ALVARADO SERVICE AREA
OTAY SERVICE AREA
Imported Water Sources
Watershed and Source Water ......................................................... 3Capital Improvements Program ..................................................... 5Storm Water ......................................................................................... 5Water Quality Data ............................................................................. 6Drinking Water Source Assessment and Protection ............... 10Important Phone Numbers ............................................................ 11
2 0 03 C O N S U M E R C O N F I D E N C E R E P O R T 3
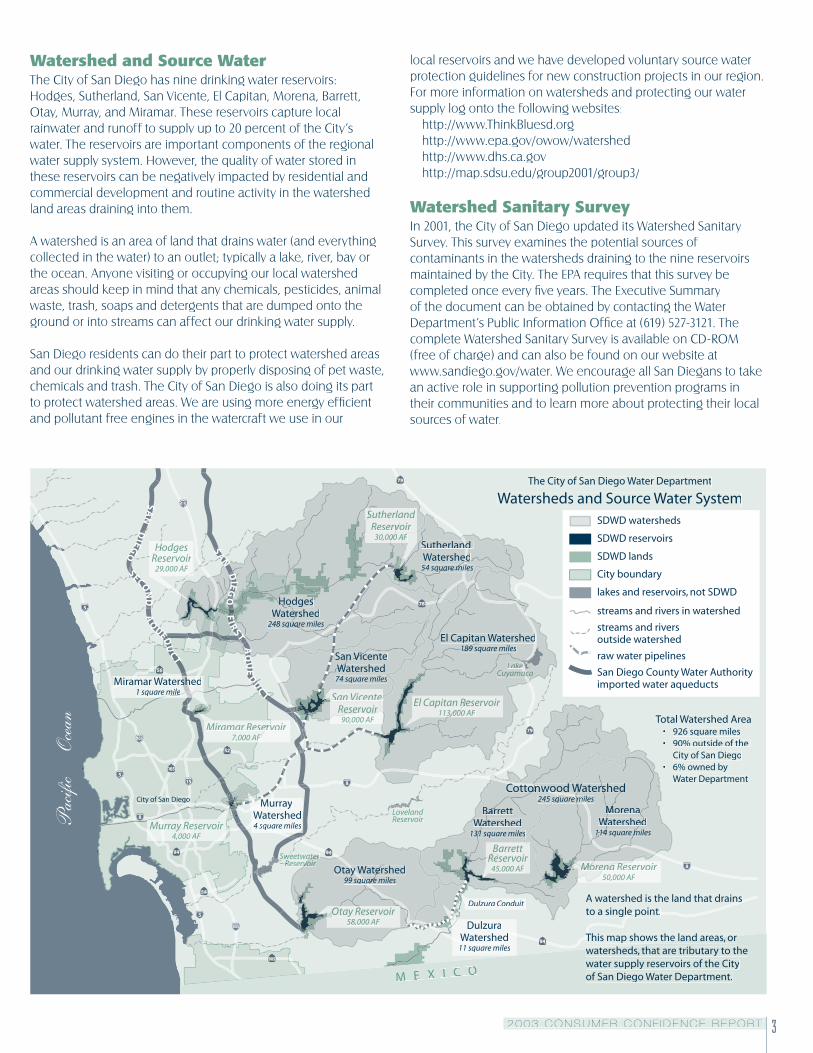
Watershed and Source WaterThe City of San Diego has nine drinking water reservoirs: Hodges, Sutherland, San Vicente, El Capitan, Morena, Barrett, Otay, Murray, and Miramar. These reservoirs capture local rainwater and runoff to supply up to 20 percent of the City’s water. The reservoirs are important components of the regional water supply system. However, the quality of water stored in these reservoirs can be negatively impacted by residential and commercial development and routine activity in the watershed land areas draining into them.
A watershed is an area of land that drains water (and everything collected in the water) to an outlet; typically a lake, river, bay or the ocean. Anyone visiting or occupying our local watershed areas should keep in mind that any chemicals, pesticides, animal waste, trash, soaps and detergents that are dumped onto the ground or into streams can affect our drinking water supply.
San Diego residents can do their part to protect watershed areas and our drinking water supply by properly disposing of pet waste, chemicals and trash. The City of San Diego is also doing its part to protect watershed areas. We are using more energy effi cient and pollutant free engines in the watercraft we use in our
local reservoirs and we have developed voluntary source water protection guidelines for new construction projects in our region. For more information on watersheds and protecting our water supply log onto the following websites:
http://www.ThinkBluesd.org http://www.epa.gov/owow/watershed http://www.dhs.ca.govhttp://map.sdsu.edu/group2001/group3/
Watershed Sanitary SurveyIn 2001, the City of San Diego updated its Watershed Sanitary Survey. This survey examines the potential sources of contaminants in the watersheds draining to the nine reservoirs maintained by the City. The EPA requires that this survey be completed once every fi ve years. The Executive Summary of the document can be obtained by contacting the Water Department’s Public Information Offi ce at (619) 527-3121. The complete Watershed Sanitary Survey is available on CD-ROM (free of charge) and can also be found on our website at www.sandiego.gov/water. We encourage all San Diegans to take an active role in supporting pollution prevention programs in their communities and to learn more about protecting their local sources of water.
�������������������������������
������������������������������������
�������������������
����������������������������������������������������������
���������������
���������������
������������������������������
����������
�������������
���
��
��
��
��
��
��
��
��
��
���
��
���
���
�
�
�
�
�
���
��
��
����
����
��
��
����
��
��
��
���
��
����
��
��
��
�
�
� � � � � �
�������������������������������������
����������������������������
�����������������
������������������������
�������������������
����������������
���������
�����������������������������
4 2 0 03 C O N S U M E R C O N F I D E N C E R E P O R T
Conventional Water Treatment ProcessSan Diego uses a water treatment process that is similar to other large water utilities around the nation. The process produces safe drinking water by removing potentially harmful organisms and substances both in the water and attached to particles.
Raw water from our reservoirs (or outside sources) is disinfected with chlorine to kill disease-causing organisms and to remove disagreeable tastes and odors.
Particles in the water have negative electrical charges and repel each other. To remove them, positively charged chemicals, ferric chloride and organic polymer, are mixed with the water to neutralize the negative charges and allow clumps of particles to form. The clumps then settle out or are fi ltered out of the water.
Ammonia is added to the water after fi ltration to react with chlorine to produce chloramines. Chloramines are used to continue disinfecting the water throughout the distribution pipelines so that it remains safe to drink when it reaches the consumer’s tap. Sodium hydroxide is added to the water to protect pipes, plumbing fi xtures and appliances from corrosion (rust).
Drinking Water FluoridationThe State of California requires that water agencies serving more than 10,000 customers fl uoridate their drinking water supplies. Presently, the City of San Diego does not add fl ouride to the water supply. The Metropolitan Water District of Southern California (the largest wholesaler of San Diego’s imported water) has elected to begin fl uoridating their drinking water supplies by the year 2005. We will provide more information on the fl uoridation of San Diego’s water in the future.
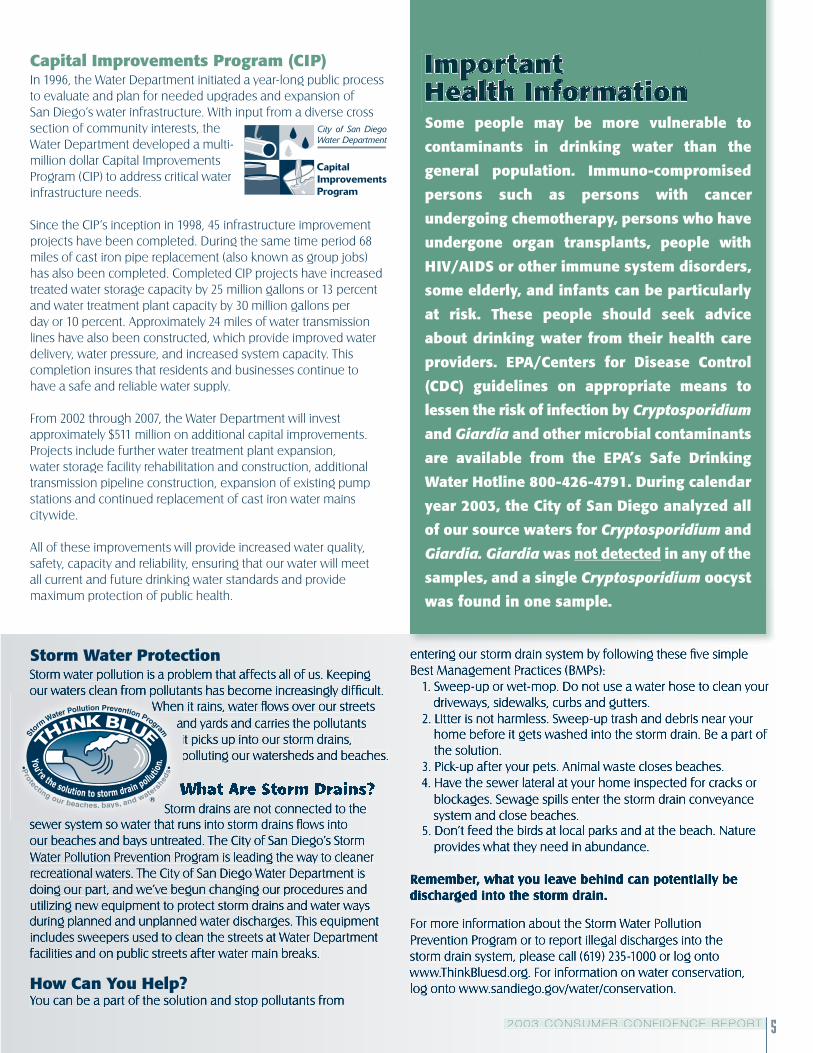
Special Note to Users of Kidney Dialysis Machines and Fish OwnersWater provided by the City of San Diego contains chloramines. The treatment process that uses chloramines produces fewer disinfection by-products, such as trihalomethanes. Our use of chloramines has resulted in signifi cantly fewer disinfection by-products in the drinking water supply. All customers should assume that our drinking water supply contains chloramines at all times. As such, customers who have unique water quality needs and who use specialized home treatments, such as kidney dialysis machines, should make the necessary adjustments to remove chloramines. Customers who have fi sh tanks in their homes should also take precautions to remove chloramines prior to adding water to the tanks. Allowing drinking water to stand will not remove chloramines from it.
Water Supply and the Impact on Water QualityThe City of San Diego imports an average of 85 percent of its water. The water is provided through the San Diego County Water Authority, which purchases its water from the Metropolitan Water District of Southern California. Our imported water is a blend that consists primarily of Colorado River water and State Water Project water (see Page 2 map). Throughout the year, the blend changes.
Several forces negatively impact the water from the Colorado River and State Water Project. The Colorado River winds
through thousands of miles of unprotected watershed containing towns, farms and old mining sites. The Kerr-McGee Chemical Plant in Henderson, Nevada is currently undergoing extensive cleanup efforts, but continues to be a source of perchlorate in the Colorado River. The Colorado River also fl ows past uranium mine tailing piles in Moab, Utah.
Water from the State Water Project is also subject to potential contaminants such as pesticides and herbicides. This water source also has a higher organic carbon and bromide level than the Colorado River water. As organic carbon and bromide levels increase, the potential for creating higher levels of disinfection by-products exists.
(The disinfectants used to treat water can react with naturally occurring materials in the water to form unintended by-products which may pose health risks). The City continually alters its treatment process to adjust for changing water supplies.
The City of San Diego continuously monitors the quality of our water to ensure all water quality standards are met.
For calendar year 2003, your tap water
met all Environmental Protection Agency
(EPA) and Department of Health Services
(DHS) drinking water health standards.
The City of San Diego’s Water Department
vigilantly safeguards its water supplies
and is proud to report that our extensive
water system did not violate a Maximum
Contaminant Level or any other water quality standard.
In the City’s more than 100 year history
of providing water to our residents, we
have consistently met all state and federal
drinking water regulations.
2 0 03 C O N S U M E R C O N F I D E N C E R E P O R T 5
Capital Improvements Program (CIP)In 1996, the Water Department initiated a year-long public process to evaluate and plan for needed upgrades and expansion of San Diego’s water infrastructure. With input from a diverse cross section of community interests, the Water Department developed a multi-million dollar Capital Improvements Program (CIP) to address critical water infrastructure needs.
Since the CIP’s inception in 1998, 45 infrastructure improvement projects have been completed. During the same time period 68 miles of cast iron pipe replacement (also known as group jobs) has also been completed. Completed CIP projects have increased treated water storage capacity by 25 million gallons or 13 percent and water treatment plant capacity by 30 million gallons per day or 10 percent. Approximately 24 miles of water transmission lines have also been constructed, which provide improved water delivery, water pressure, and increased system capacity. This completion insures that residents and businesses continue to have a safe and reliable water supply.
From 2002 through 2007, the Water Department will invest approximately $511 million on additional capital improvements. Projects include further water treatment plant expansion, water storage facility rehabilitation and construction, additional transmission pipeline construction, expansion of existing pump stations and continued replacement of cast iron water mains citywide.
All of these improvements will provide increased water quality, safety, capacity and reliability, ensuring that our water will meet all current and future drinking water standards and provide maximum protection of public health.
Some people may be more vulnerable to
con tam i nants in drinking water than the
general pop u la tion. Immuno-compromised
per sons such as persons with cancer
undergoing che mo ther a py, persons who have
un der gone organ trans plants, people with
HIV/AIDS or other im mune system dis or ders,
some elderly, and infants can be par tic u lar ly
at risk. These people should seek advice
about drinking water from their health care
pro vid ers. EPA/Centers for Disease Control
(CDC) guide lines on ap pro pri ate means to
lessen the risk of infection by Cryptosporidium
and Giardia and other microbial con tam i nants
are available from the EPA’s Safe Drinking
Water Hotline 800-426-4791. During cal en dar
year 2003, the City of San Diego analyzed all
of our source waters for Cryptosporidium and
Giardia. Giardia was not de tect ed in any of the
samples, and a single Cryptosporidium oocyst
was found in one sample.
Storm Water Pro tec tion Storm water pollution is a problem that affects all of us. Keeping our waters clean from pollutants has become increasingly diffi cult.
When it rains, water fl ows over our streets and yards and carries the pollutants it picks up into our storm drains, polluting our watersheds and beaches.
What Are Storm Drains?Storm drains are not connected to the
sewer system so water that runs into storm drains fl ows into our beaches and bays untreated. The City of San Diego’s Storm Water Pollution Prevention Program is leading the way to cleaner recreational waters. The City of San Diego Water Department is doing our part, and we’ve begun changing our procedures and utilizing new equipment to protect storm drains and water ways during planned and unplanned water discharges. This equipment includes sweepers used to clean the streets at Water Department facilities and on public streets after water main breaks.
How Can You Help?You can be a part of the solution and stop pollutants from
entering our storm drain system by following these fi ve simple Best Management Practices (BMPs):
1. Sweep-up or wet-mop. Do not use a water hose to clean your driveways, sidewalks, curbs and gutters.
2. Litter is not harmless. Sweep-up trash and debris near your home before it gets washed into the storm drain. Be a part of the solution.
3. Pick-up after your pets. Animal waste closes beaches.4. Have the sewer lateral at your home inspected for cracks or
blockages. Sewage spills enter the storm drain conveyance system and close beaches.
5. Don’t feed the birds at local parks and at the beach. Nature provides what they need in abundance.
Remember, what you leave behind can potentially be discharged into the storm drain.
For more information about the Storm Water Pollution Prevention Program or to report illegal discharges into the storm drain system, please call (619) 235-1000 or log onto www.ThinkBluesd.org. For information on water conservation, log onto www.sandiego.gov/water/conservation.
our waters clean from pollutants has become increasingly diffi cult. When it rains, water fl ows over our streets
and yards and carries the pollutants
What Are Storm Drains?Storm drains are not connected to the
sewer system so water that runs into storm drains fl ows into
Important Important Health InformationHealth InformationImportant Health InformationImportant Important Health InformationImportant Important Health InformationImportant Health Information
6 2 0 03 C O N S U M E R C O N F I D E N C E R E P O R T
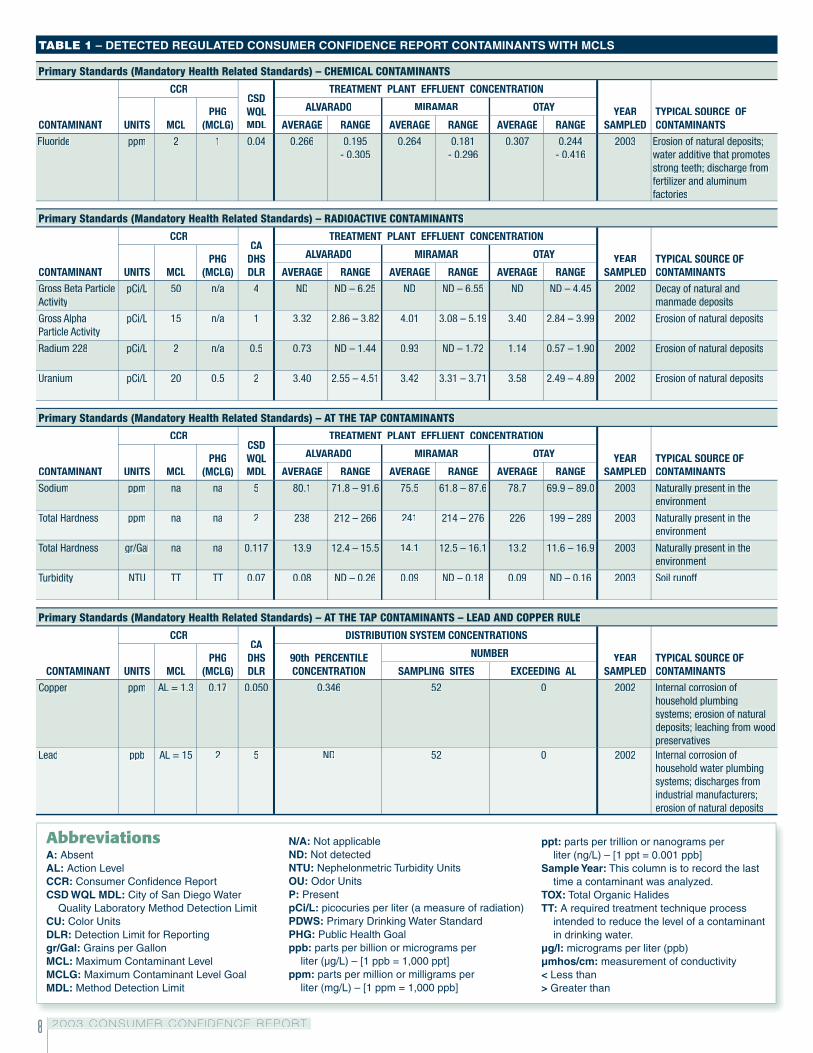
2003 Water Quality DataHow do I Read the Tables?The tables on the following pages list contaminants which: 1) have associated Primary Maximum Contaminant Levels (MCLs) that are regulated and 2) were detected by the City of San Diego’s Water Quality Laboratory. Contaminants were detected at or above the DHS Detection Limits for Purposes of Reporting (DLRs) during the calendar year 2003. Drinking water, including bottled water, may reasonably be expected to contain at least small amounts of some contaminants. The presence of these contaminants in the drinking water does not necessarily indicate that the water poses a health risk. More information about contaminants and potential health effects can be obtained by calling the EPA’s Safe Drinking Water Hotline 800-426-4791 or by visiting the EPA’s website at www.epa.gov/safewater/hfacts.html. California action levels are available on the DHS website www.dhs.ca.gov/ps/ddwem/index.htm. Unless otherwise noted, the data presented in these tables are from testing done January 1 through December 31, 2003.
The State DHS requires us to monitor for certain contaminants less than once per year because the concentrations of these contaminants are not expected to vary signifi cantly from year to year. Some of the data, though representative of the water quality, are more than one year old.
Terms & Abbreviations Used:CCR: Consumer Confi dence Report. Annual Water Quality Report produced by water agencies to inform customers.
Corrosivity: The corrosivity of a sample is measured by the Langlier Stability Index. A positive index, indicating non-corrosivity, was maintained at all plant effl uents.
CSD WQL MDL: City of San Diego Water Quality Laboratory Method Detection Limit. Lowest quantifi able concentration of a measured analyte detectable by the Laboratory.
Information Collection Rule (ICR): A special data-gathering program administered by the EPA to guide future regulatory and public health decisions on pathogens, disinfectants, and disinfection by-products in drinking water.
Maximum Contaminant Level (MCL): The highest level of a contaminant that is allowed in drinking water. Primary MCLs are set as close to the PHGs (or MCLGs) as is economically or technologically feasible. Secondary MCLs are set to protect the odor, taste, and appearance of drinking water.
Maximum Contaminant Level Goal (MCLG): The level of a contaminant in drinking water below which there is no known or expected risk to health. MCLGs are set by the United States EPA.
Maximum Residual Disinfectant Level (MRDL): The level of a disinfectant added for water treatment that may not be exceeded at the consumer’s tap.
Maximum Residual Disinfectant Level Goal (MRDLG): The level of a disinfectant added for water treatment below which there is no known or expected risk to health. MRDLs are set by the United States EPA.
Public Health Goal (PHG): The level of a contaminant in drinking water below which there is no known or expected risk to health. PHGs are set by the California EPA.
Regulatory Action Level (AL): The concentration of a contaminant which, when exceeded, triggers treatment or other requirements that a water system must follow.
Treatment Technique (TT): A required process intended to reduce the level of a contaminant in drinking water.
N/A: not applicable
ND: not detectable at testing limit
ppt: parts per trillion or nanograms per liter (ng/L)
ppb: parts per billion or micrograms per liter (µg/L) — [1 ppb = 1,000 ppt]
ppm: parts per million or milligrams per liter (mg/L) — [1 ppm = 1,000 ppb]
pCi/L: picocuries per liter (a measure of radiation)
Sample Date: This column is to record the last time a contaminant was analyzed.
Table 1 lists all the regulated CCR contaminants with Primary MCLs that the City of San Diego’s Water Quality Laboratory detected in the drinking water at or above the California Department of Health Services (DHS) Detection Limits for Purposes of Reporting (DLRs).
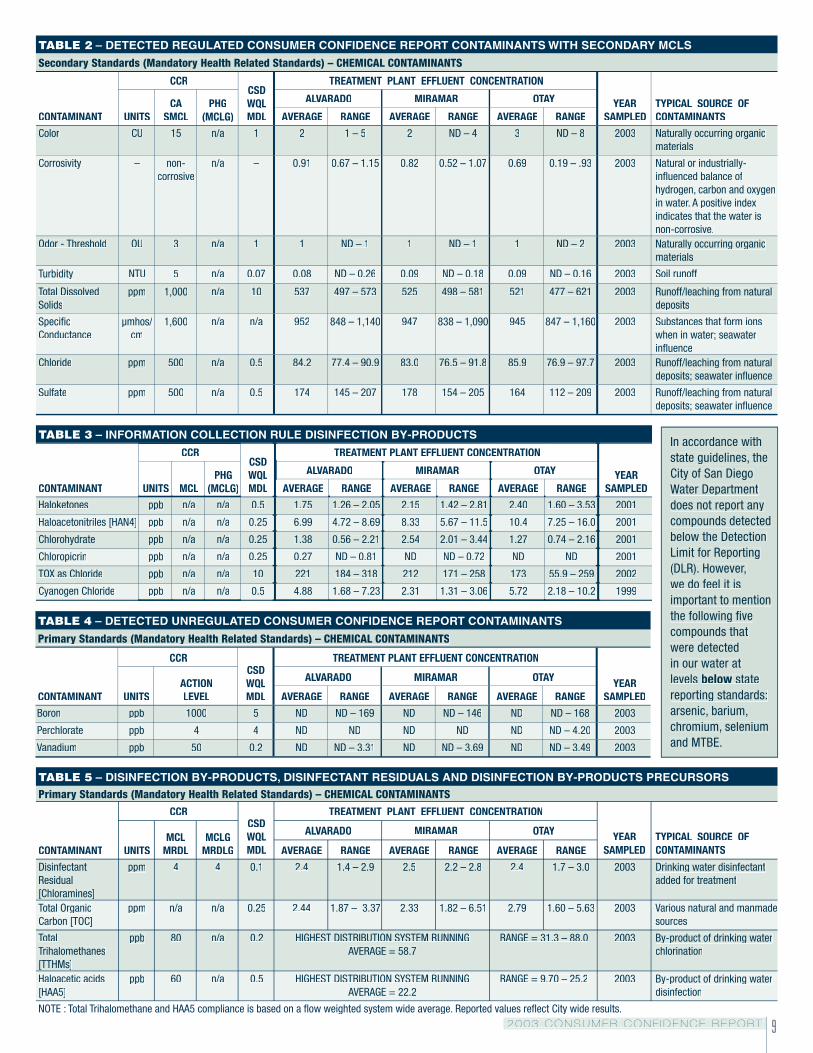
Table 2 is a listing of regulated contaminants with Secondary MCLs that were detected at or above the DHS DLR for each analyte.
Table 3 is a listing of ICR disinfection by-products that were detected at or above the DHS DLR for each analyte.
Table 4 is a listing of detected unregulated CCR contaminants that were detected at or above the DHS DLR for each analyte. Unregulated contaminant monitoring helps the EPA and the DHS to determine where certain contaminants occur and whether the contaminants need to be regulated.
Table 5 is a listing of disinfection residuals and disinfection by-products that were detected.
Table 6 (not included in this report) is a listing of all the remaining CCR reportable compounds that were not detected or detected at a concentration less than the DHS DLR. This table is available by calling our Public Information Offi ce at (619) 527-3121 or by logging on to our website at www.sandiego.gov/water.
2 0 03 C O N S U M E R C O N F I D E N C E R E P O R T 7
Detected CCR Contaminants –Important Health Effects LanguageEven though there were no violations of the MCLs for either the EPA or the California DHS, the following information is provided on the contaminants that are listed in Tables 1 through 5 that on the contaminants that are listed in Tables 1 through 5 that were detected at or above the California DHS Detection Limit for were detected at or above the California DHS Detection Limit for Reporting (DLR). This information describes the potential health Reporting (DLR). This information describes the potential health affects of drinking water that contains the contaminant affects of drinking water that contains the contaminant at levels at levels above the federal MCL.
BORON: Some men who drink water containing boron in excess Some men who drink water containing boron in excess of the action level over many years may experience reproductive of the action level over many years may experience reproductive effects. This information is based on animal studies. (see Table 4)effects. This information is based on animal studies. (see Table 4)
CHLORAMINES: Some people who use water containing Some people who use water containing chloramines well in excess of the MRDL could experience chloramines well in excess of the MRDL could experience irritating effects to their eyes and nose. Some people who drink irritating effects to their eyes and nose. Some people who drink water containing chloramines well in excess of the MRDL could water containing chloramines well in excess of the MRDL could experience stomach discomfort. (see Table 5) experience stomach discomfort. (see Table 5)
COPPER: Copper is an essential nutrient, but some people who Copper is an essential nutrient, but some people who drink water containing copper in excess of the action level over drink water containing copper in excess of the action level over a relatively short amount of time may experience gastrointestinal a relatively short amount of time may experience gastrointestinal distress. Some people who drink water containing copper in excess distress. Some people who drink water containing copper in excess of the action level over many years may suffer liver or kidney of the action level over many years may suffer liver or kidney damage. People with Wilson’s Disease should consult with their damage. People with Wilson’s Disease should consult with their personal doctor. (see Table 1) personal doctor. (see Table 1)
FLUORIDE: Some people who drink water containing fl uoride in Some people who drink water containing fl uoride in excess of the federal MCL of 4 mg/L over many years may get bone excess of the federal MCL of 4 mg/L over many years may get bone disease, including pain and tenderness of the bones. Children who disease, including pain and tenderness of the bones. Children who drink water containing fl uoride in excess of the state MCL of 2 mg/L drink water containing fl uoride in excess of the state MCL of 2 mg/L may get mottled teeth. Currently, all of the fl uoride in our drinking may get mottled teeth. Currently, all of the fl uoride in our drinking water is naturally occurring. The City of San Diego water is naturally occurring. The City of San Diego does not add fl uoride to its drinking water. (see Table 1)fl uoride to its drinking water. (see Table 1)
GROSS ALPHA PARTICLE ACTIVITY:GROSS ALPHA PARTICLE ACTIVITY: Certain materials are Certain materials are radioactive and may emit a form of radiation known as alpha radioactive and may emit a form of radiation known as alpha radiation. Some people who drink water containing alpha emitters radiation. Some people who drink water containing alpha emitters in excess of the MCL over many years may have an increased risk in excess of the MCL over many years may have an increased risk of getting cancer. The City of San Diego is required to analyze for of getting cancer. The City of San Diego is required to analyze for radioactive contaminants every four (4) years. (see Table 1)radioactive contaminants every four (4) years. (see Table 1)
GROSS BETA PARTICLE ACTIVITY: Certain materials are Certain materials are radioactive and may emit forms of radiation known as photons and radioactive and may emit forms of radiation known as photons and beta radiation. Some people who drink water containing beta and beta radiation. Some people who drink water containing beta and photon emitters in excess of the MCL over many years may have an photon emitters in excess of the MCL over many years may have an increased risk of getting cancer. The City of San Diego is required increased risk of getting cancer. The City of San Diego is required to analyze for radioactive contaminants every four (4) years. to analyze for radioactive contaminants every four (4) years. (see Table 1)
HALOACETIC ACIDS: Some people who drink water containing Some people who drink water containing haloacetic acids in excess of the MCL over many years may have an haloacetic acids in excess of the MCL over many years may have an increased risk of getting cancer. (see Table 5)
LEAD: Infants and children who drink water containing lead in excess of the action level may experience delays in their physical or mental development. Children may show slight defi cits in attention span and learning abilities. Adults who drink this water over many years may develop kidney problems or high blood pressure. The
City of San Diego’s service lines do not contain lead and our testing refl ects that. If you reside in an older home, lead solder may have been used in the pipes which could affect the lead content in your drinking water. Visit the American Water Works Association website at www.awwa.com for information on research studies. (see Table 1)
PERCHLORATE: Some people who drink water containing perchlorate in excess of the action level may experience effects associated with hypothyroidism. Perchlorate interferes with the production of thyroid hormones, which are required for normal pre- and postnatal development in humans, as well as normal body metabolism. (see Table 4)
RADIUM 228:RADIUM 228: Some people who drink water containing radium Some people who drink water containing radium 228 in excess of the MCL over many years may have an increased 228 in excess of the MCL over many years may have an increased risk of getting cancer. (see Table 1)risk of getting cancer. (see Table 1)
TOTAL ORGANIC CARBON:TOTAL ORGANIC CARBON: (TOC) has no health effects. (TOC) has no health effects. However, TOC provides a medium for the formation of disinfection However, TOC provides a medium for the formation of disinfection by-products. These by-products include trihalomethanes (THMs) by-products. These by-products include trihalomethanes (THMs) and haloacetic acids (HAA5). Drinking water containing these by-and haloacetic acids (HAA5). Drinking water containing these by-products in excess of the MCL may lead to adverse health effects, products in excess of the MCL may lead to adverse health effects, liver or kidney problems, or nervous system effects, and may lead liver or kidney problems, or nervous system effects, and may lead to an increased risk of cancer. (see Table 5)to an increased risk of cancer. (see Table 5)
TOTAL TRIHALOMETHANES (TTHMs):TOTAL TRIHALOMETHANES (TTHMs): Compliance with the MCL Compliance with the MCL regulation for TTHMs are based on the running average of samples regulation for TTHMs are based on the running average of samples collected over the entire year. An individual sample greater than 80 collected over the entire year. An individual sample greater than 80 µg/L does not constitute a violation of the MCL. Some people who µg/L does not constitute a violation of the MCL. Some people who use water containing TTHMs in excess of the MCL over many years use water containing TTHMs in excess of the MCL over many years may experience liver, kidney, or central nervous system problems, may experience liver, kidney, or central nervous system problems, and may have an increased risk of getting cancer. (see Table 5)and may have an increased risk of getting cancer. (see Table 5)
TURBIDITY:TURBIDITY: Turbidity is the cloudiness of the water. Turbidity has Turbidity is the cloudiness of the water. Turbidity has no health effects. However, high levels of turbidity can interfere no health effects. However, high levels of turbidity can interfere with disinfection and provide a medium for microbial growth. with disinfection and provide a medium for microbial growth. Turbidity may indicate the presence of disease-causing organisms. Turbidity may indicate the presence of disease-causing organisms. These organisms include bacteria, viruses, and parasites that can These organisms include bacteria, viruses, and parasites that can cause symptoms such as nausea, cramps, diarrhea and associated cause symptoms such as nausea, cramps, diarrhea and associated headaches. (see Table 1)headaches. (see Table 1)
URANIUM:URANIUM: Some people who drink water containing uranium in Some people who drink water containing uranium in excess of the MCL over many years may have an increased risk of excess of the MCL over many years may have an increased risk of getting cancer and kidney toxicity. The City of San Diego is required getting cancer and kidney toxicity. The City of San Diego is required to analyze for radioactive contaminants every four (4) years. to analyze for radioactive contaminants every four (4) years. (see Table 1)
VANADIUM: The babies of some pregnant women who drink The babies of some pregnant women who drink water containing vanadium in excess of the action level may have water containing vanadium in excess of the action level may have an increased risk of developmental effects. This is based on studies an increased risk of developmental effects. This is based on studies in laboratory animals. (see Table 4)
8 2 0 03 C O N S U M E R C O N F I D E N C E R E P O R T
AbbreviationsA: AbsentAL: Action LevelCCR: Consumer Confi dence ReportCSD WQL MDL: City of San Diego Water
Quality Laboratory Method De tec tion LimitCU: Color UnitsDLR: Detection Limit for Reporting gr/Gal: Grains per GallonMCL: Maximum Contaminant LevelMCLG: Maximum Contaminant Level GoalMDL: Method Detection Limit
N/A: Not applicableND: Not detectedNTU: Nephelonmetric Turbidity UnitsOU: Odor UnitsP: PresentpCi/L: picocuries per liter (a measure of radiation)PDWS: Primary Drinking Water StandardPHG: Public Health Goalppb: parts per billion or mi cro grams per
liter (µg/L) – [1 ppb = 1,000 ppt]ppm: parts per million or mil li grams per
liter (mg/L) – [1 ppm = 1,000 ppb]
ppt: parts per trillion or nan o grams per liter (ng/L) – [1 ppt = 0.001 ppb]
Sample Year: This column is to record the last time a contaminant was analyzed.
TOX: Total Organic HalidesTT: A required treatment technique process
intended to reduce the level of a contaminant in drinking water.
µg/l: micrograms per liter (ppb)µmhos/cm: measurement of conductivity< Less than> Greater than
TABLE 1 – DETECTED REGULATED CONSUMER CONFIDENCE REPORT CONTAMINANTS WITH MCLS
Primary Standards (Mandatory Health Related Standards) – CHEMICAL CONTAMINANTS
CONTAMINANT
CCRCSD WQLMDL
TREATMENT PLANT EFFLUENT CONCENTRATION
YEARSAMPLED
TYPICAL SOURCE OF CONTAMINANTSUNITS MCL
PHG(MCLG)
ALVARADO MIRAMAR OTAY
AVERAGE RANGE AVERAGE RANGE AVERAGE RANGE
Fluoride ppm 2 1 0.04 0.266 0.195 - 0.305
0.264 0.181 - 0.296
0.307 0.244 - 0.416
2003 Erosion of natural deposits; water additive that promotes strong teeth; discharge from fertilizer and aluminum factories
Primary Standards (Mandatory Health Related Standards) – RADIOACTIVE CONTAMINANTS
CONTAMINANT
CCRCA
DHSDLR
TREATMENT PLANT EFFLUENT CONCENTRATION
YEARSAMPLED
TYPICAL SOURCE OF CONTAMINANTSUNITS MCL
PHG(MCLG)
ALVARADO MIRAMAR OTAY
AVERAGE RANGE AVERAGE RANGE AVERAGE RANGE
Gross Beta Particle Activity
pCi/L 50 n/a 4 ND ND – 6.25 ND ND – 6.55 ND ND – 4.45 2002 Decay of natural and manmade deposits
Gross Alpha Particle Activity
pCi/L 15 n/a 1 3.32 2.86 – 3.82 4.01 3.08 – 5.19 3.40 2.84 – 3.99 2002 Erosion of natural deposits
Radium 228 pCi/L 2 n/a 0.5 0.73 ND – 1.44 0.93 ND – 1.72 1.14 0.57 – 1.90 2002 Erosion of natural deposits
Uranium pCi/L 20 0.5 2 3.40 2.55 – 4.51 3.42 3.31 – 3.71 3.58 2.49 – 4.89 2002 Erosion of natural deposits
Primary Standards (Mandatory Health Related Standards) – AT THE TAP CONTAMINANTS
CONTAMINANT
CCRCSD WQLMDL
TREATMENT PLANT EFFLUENT CONCENTRATION
YEARSAMPLED
TYPICAL SOURCE OF CONTAMINANTSUNITS MCL
PHG(MCLG)
ALVARADO MIRAMAR OTAY
AVERAGE RANGE AVERAGE RANGE AVERAGE RANGE
Sodium ppm na na 5 80.1 71.8 – 91.6 75.5 61.8 – 87.6 78.7 69.9 – 89.0 2003 Naturally present in the environment
Total Hardness ppm na na 2 238 212 – 266 241 214 – 276 226 199 – 289 2003 Naturally present in the environment
Total Hardness gr/Gal na na 0.117 13.9 12.4 – 15.5 14.1 12.5 – 16.1 13.2 11.6 – 16.9 2003 Naturally present in the environment
Turbidity NTU TT TT 0.07 0.08 ND – 0.26 0.09 ND – 0.18 0.09 ND – 0.16 2003 Soil runoff
Primary Standards (Mandatory Health Related Standards) – AT THE TAP CONTAMINANTS – LEAD AND COPPER RULE
CONTAMINANT
CCRCA
DHSDLR
DISTRIBUTION SYSTEM CONCENTRATIONS
YEARSAMPLED
TYPICAL SOURCE OF CONTAMINANTSUNITS MCL
PHG(MCLG)
90th PERCENTILECONCENTRATION
NUMBER
SAMPLING SITES EXCEEDING AL
Copper ppm AL = 1.3 0.17 0.050 0.346 52 0 2002 Internal corrosion of household plumbing systems; erosion of natural deposits; leaching from wood preservatives
Lead ppb AL = 15 2 5 ND 52 0 2002 Internal corrosion of household water plumbing systems; discharges from industrial manufacturers; erosion of natural deposits
2 0 03 C O N S U M E R C O N F I D E N C E R E P O R T 9
TABLE 3 – INFORMATION COLLECTION RULE DISINFECTION BY-PRODUCTS
CONTAMINANT
CCRCSD WQLMDL
TREATMENT PLANT EFFLUENT CONCENTRATION
YEARSAMPLEDUNITS MCL
PHG(MCLG)
ALVARADO MIRAMAR OTAY
AVERAGE RANGE AVERAGE RANGE AVERAGE RANGEHaloketones ppb n/a n/a 0.5 1.75 1.26 – 2.05 2.15 1.42 – 2.81 2.40 1.60 – 3.53 2001
Haloacetonitriles [HAN4] ppb n/a n/a 0.25 6.99 4.72 – 8.69 8.33 5.67 – 11.5 10.4 7.25 – 16.0 2001
Chlorohydrate ppb n/a n/a 0.25 1.38 0.56 – 2.21 2.54 2.01 – 3.44 1.27 0.74 – 2.16 2001
Chloropicrin ppb n/a n/a 0.25 0.27 ND – 0.81 ND ND – 0.72 ND ND 2001
TOX as Chloride ppb n/a n/a 10 221 184 – 318 212 171 – 258 173 55.9 – 259 2002
Cyanogen Chloride ppb n/a n/a 0.5 4.88 1.68 – 7.23 2.31 1.31 – 3.06 5.72 2.18 – 10.2 1999
In accordance with state guidelines, the City of San Diego Water Department does not report any compounds detected below the Detection Limit for Reporting (DLR). However, we do feel it is important to mention the following fi ve compounds that were detected in our water at levels below state reporting standards: arsenic, barium, chromium, selenium and MTBE.
TABLE 2 – DETECTED REGULATED CONSUMER CONFIDENCE REPORT CONTAMINANTS WITH SECONDARY MCLS
Secondary Standards (Mandatory Health Related Standards) – CHEMICAL CONTAMINANTS
CONTAMINANT
CCRCSD WQLMDL
TREATMENT PLANT EFFLUENT CONCENTRATION
YEARSAMPLED
TYPICAL SOURCE OF CONTAMINANTSUNITS
CASMCL
PHG(MCLG)
ALVARADO MIRAMAR OTAY
AVERAGE RANGE AVERAGE RANGE AVERAGE RANGE
Color CU 15 n/a 1 2 1 – 5 2 ND – 4 3 ND – 8 2003 Naturally occurring organic materials
Corrosivity – non-corrosive
n/a – 0.91 0.67 – 1.15 0.82 0.52 – 1.07 0.69 0.19 – .93 2003 Natural or industrially-infl uenced balance of hydrogen, carbon and oxygen in water. A positive index indicates that the water is non-corrosive.
Odor - Threshold OU 3 n/a 1 1 ND – 1 1 ND – 1 1 ND – 2 2003 Naturally occurring organic materials
Turbidity NTU 5 n/a 0.07 0.08 ND – 0.26 0.09 ND – 0.18 0.09 ND – 0.16 2003 Soil runoff
Total Dissolved Solids
ppm 1,000 n/a 10 537 497 – 573 525 498 – 581 521 477 – 621 2003 Runoff/leaching from natural deposits
Specifi c Conductance
µmhos/cm
1,600 n/a n/a 952 848 – 1,140 947 838 – 1,090 945 847 – 1,160 2003 Substances that form ions when in water; seawater infl uence
Chloride ppm 500 n/a 0.5 84.2 77.4 – 90.9 83.0 76.5 – 91.8 85.9 76.9 – 97.7 2003 Runoff/leaching from natural deposits; seawater infl uence
Sulfate ppm 500 n/a 0.5 174 145 – 207 178 154 – 205 164 112 – 209 2003 Runoff/leaching from natural deposits; seawater infl uence
TABLE 5 – DISINFECTION BY-PRODUCTS, DISINFECTANT RESIDUALS AND DISINFECTION BY-PRODUCTS PRECURSORS
Primary Standards (Mandatory Health Related Standards) – CHEMICAL CONTAMINANTS
CONTAMINANT
CCRCSD WQLMDL
TREATMENT PLANT EFFLUENT CONCENTRATION
YEARSAMPLED
TYPICAL SOURCE OF CONTAMINANTSUNITS
MCLMRDL
MCLGMRDLG
ALVARADO MIRAMAR OTAY
AVERAGE RANGE AVERAGE RANGE AVERAGE RANGE
Disinfectant Residual [Chloramines]
ppm 4 4 0.1 2.4 1.4 – 2.9 2.5 2.2 – 2.8 2.4 1.7 – 3.0 2003 Drinking water disinfectant added for treatment
Total Organic Carbon [TOC]
ppm n/a n/a 0.25 2.44 1.87 – 3.37 2.33 1.82 – 6.51 2.79 1.60 – 5.63 2003 Various natural and manmade sources
Total Trihalomethanes [TTHMs]
ppb 80 n/a 0.2 HIGHEST DISTRIBUTION SYSTEM RUNNING AVERAGE = 58.7
RANGE = 31.3 – 88.0 2003 By-product of drinking water chlorination
Haloacetic acids [HAA5]
ppb 60 n/a 0.5 HIGHEST DISTRIBUTION SYSTEM RUNNING AVERAGE = 22.2
RANGE = 9.70 – 25.2 2003 By-product of drinking water disinfection
NOTE : Total Trihalomethane and HAA5 compliance is based on a fl ow weighted system wide average. Reported values refl ect City wide results.
TABLE 4 – DETECTED UNREGULATED CONSUMER CONFIDENCE REPORT CONTAMINANTS
Primary Standards (Mandatory Health Related Standards) – CHEMICAL CONTAMINANTS
CONTAMINANT
CCRCSD WQLMDL
TREATMENT PLANT EFFLUENT CONCENTRATION
YEARSAMPLEDUNITS
ACTIONLEVEL
ALVARADO MIRAMAR OTAY
AVERAGE RANGE AVERAGE RANGE AVERAGE RANGE
Boron ppb 1000 5 ND ND – 169 ND ND – 146 ND ND – 168 2003
Perchlorate ppb 4 4 ND ND ND ND ND ND – 4.20 2003
Vanadium ppb 50 0.2 ND ND – 3.31 ND ND – 3.69 ND ND – 3.49 2003
10 2 0 03 C O N S U M E R C O N F I D E N C E R E P O R T
Drinking Water Source Assessment and Protection ProgramThe Safe Drinking Water Act of 1996 requires the preparation of source water assessments for all drinking water sources. These assessments must be submitted to the Environmental Protection Agency (EPA). In California, source water assessments are referred to as the Drinking Water Source Assessment and Protection (DWSAP) Program. The DWSAP fulfi lls the requirement for source water assessments and will also help to facilitate the development of protection programs for both groundwater and surface water sources.
The Department of Health Services (DHS) is mandated by the EPA to produce source water assessment reports. However, because of the challenges faced by DHS with regard to their resources, many large water agencies compiled their own assessments and provided the information to the DHS. The City of San Diego Water Department volunteered to assist the DHS to meet the challenge of compiling this report.
The City of San Diego operates fi ve primary reservoirs and one groundwater well which directly supply our three water treatment plants. An assessment for the Murray Reservoir was completed in April of 2002. The assessments for San Vicente, El Capitan, Miramar and Otay Reservoirs were completed in June of 2002, and the assessment for the El Cajon Well was completed in February 2003.
Each reservoir is susceptible to potential contamination by the following activities: portable toilets/sewage holding tanks, parking lots with greater than 50 spaces, gas stations, dry cleaners, storm drain discharge points, airport/fueling (for Ultralite Aircraft), wastewater treatment plants, water supply wells, recent burn areas, historic mines, surface water recreation areas, repair shops, grazing, low density septic systems, active mining operations, storm water detention facilities, fertilizer/pesticide/herbicide application, body shops and unauthorized dumping. In addition, all of the reservoirs are susceptible to contamination associated with the use of watercraft for water recreation.
The El Cajon Well is susceptible to contamination by the following activities: dry cleaners, metal fi nishing, repair shops, gas stations, sewer collection systems, a known contamination plume, and leaking tanks.
A copy of the complete assessment is available by calling the Public Information Offi ce at (619) 527-3121.
For a more comprehensive description of the source waters supplying our treatment plants, refer to the Watershed Sanitary Survey, which is available by calling our Public Information Offi ce at (619) 527-3121 or by logging on to www.sandiego.gov/water.
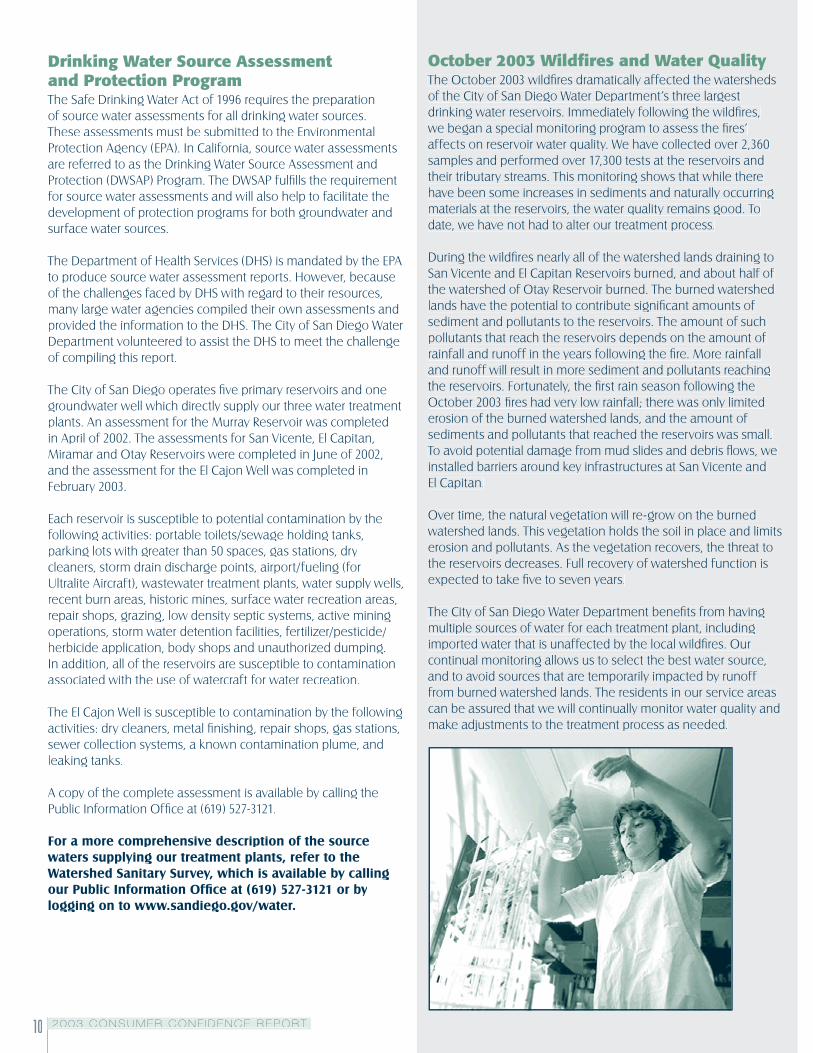
October 2003 Wildfi res and Water QualityThe October 2003 wildfi res dramatically affected the watersheds of the City of San Diego Water Department’s three largest drinking water reservoirs. Immediately following the wildfi res, we began a special monitoring program to assess the fi res’ affects on reservoir water quality. We have collected over 2,360 samples and performed over 17,300 tests at the reservoirs and their tributary streams. This monitoring shows that while there have been some increases in sediments and naturally occurring materials at the reservoirs, the water quality remains good. To date, we have not had to alter our treatment process.
During the wildfi res nearly all of the watershed lands draining to San Vicente and El Capitan Reservoirs burned, and about half of the watershed of Otay Reservoir burned. The burned watershed lands have the potential to contribute signifi cant amounts of sediment and pollutants to the reservoirs. The amount of such pollutants that reach the reservoirs depends on the amount of rainfall and runoff in the years following the fi re. More rainfall and runoff will result in more sediment and pollutants reaching the reservoirs. Fortunately, the fi rst rain season following the October 2003 fi res had very low rainfall; there was only limited erosion of the burned watershed lands, and the amount of sediments and pollutants that reached the reservoirs was small. To avoid potential damage from mud slides and debris fl ows, we installed barriers around key infrastructures at San Vicente and El Capitan.
Over time, the natural vegetation will re-grow on the burned watershed lands. This vegetation holds the soil in place and limits erosion and pollutants. As the vegetation recovers, the threat to the reservoirs decreases. Full recovery of watershed function is expected to take fi ve to seven years.
The City of San Diego Water Department benefi ts from having multiple sources of water for each treatment plant, including imported water that is unaffected by the local wildfi res. Our continual monitoring allows us to select the best water source, and to avoid sources that are temporarily impacted by runoff from burned watershed lands. The residents in our service areas can be assured that we will continually monitor water quality and make adjustments to the treatment process as needed.
2 0 03 C O N S U M E R C O N F I D E N C E R E P O R T 11
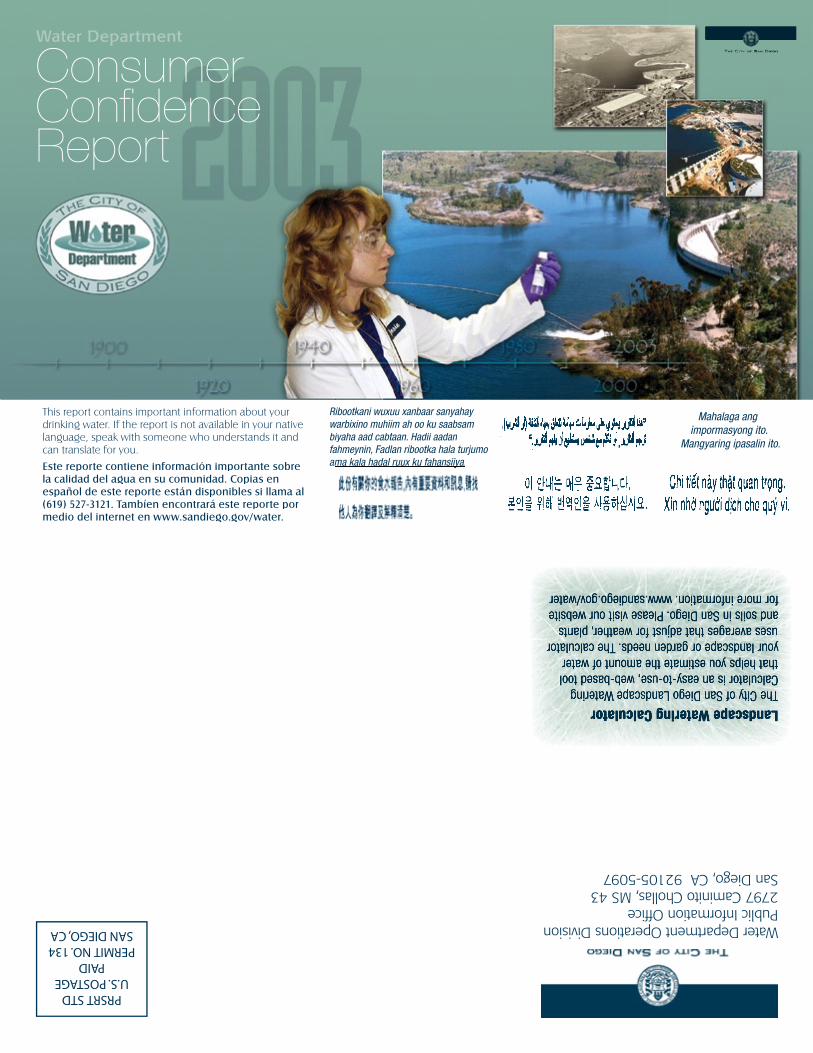
On The CoverThe cover design of this year’s Consumer Confi dence Report seeks to capture just a portion of the signifi cance of the past, present and future of our water distribution system. In addition, we included photos of some of the men and women who dedicate themselves to providing the residents of San Diego with a reliable drinking water supply.
The black and white photo on the left is Bill Conn, an assistant chemist at the Water Quality Laboratory in the 1950s. At the time, the lab was housed inside the Alvarado Water Treatment Plant (an historical landmark). Today, the treatment plant and the laboratory are two separate facilities and have expanded to meet the needs of our growing city. The lab instrument depicted in the photo used a 12 volt wet battery which required re-charging each evening for use the next day.
Enrique Salvatierra, a chemist at the Alvarado Water Quality Lab, is shown performing analyses on drinking water. He is testing for organic compounds in the water.
Murray Reservoir and its dam is shown in the upper insert photo. This property was acquired by the city in 1961. The area, which is also home to the Alvarado Water Treatment Plant and the Water Quality Lab, is currently undergoing an extensive upgrade and expansion which will increase the treated water storage capacity.
The Conejos Creek diverting structure is shown in the center photo. It is located at El Capitan Reservoir and is a remnant of the San Diego Flume which was built between 1886 and 1888. The photo was taken in February 2004 and shows the heavy sediment load in runoff from areas that were burned in the October 2003 Cedar Fire.
The back cover includes an aerial view of the Otay Reservoir (largest photo), along with two aerial views of Murray Reservoir; one current and one historical. Otay and Murray Reservoirs are two of nine drinking water reservoirs operated by the City of San Diego Water Department. Josephine Hill, assistant chemist at the Water Quality Lab is also pictured.
Speakers Bureau ProgramThe Water Department offers a Speakers Bureau program that provides water-related information to the community. You can request a speaker for your business, civic or social group to discuss water conservation, water reuse, quality and treatment, reclamation or our Capital Improvements Program by contacting the Speakers Bureau Coordinator at (619) 533-6638 or via email at [email protected].
Important Phone NumbersGeneral Information .................................................(619) 515-3500Emergency Hotline ................................... (619) 515-3525Water Quality Lab .................................................... (619) 668-3232Capital Improvements Program .............................. (619) 533-4679Group Job Hotline .................................................... (858) 573-5081Water Conservation ..................................................(619) 515-3500City Lakes Fishing Line..............................................(619) 465-3474Speakers Bureau ...................................................... (619) 533-6638EPA’s Drinking Water Hotline ...................................(800) 426-4791Storm Water Pollution Prevention ........................... (619) 235-1000Public Information Offi ce .......................................... (619) 527-3121
Important Web LinksCity of San Diego...............................www.sandiego.govSD County Water Authority................................... www.sdcwa.orgState (DHS)............................................................ www.dhs.ca.govEPA ........................................................... www.epa.gov/safewaterThink Blue ..................................................... www.thinkbluesd.orgCounty of San Diego ..............................www.co.san-diego.ca.usMetropolitan Water Dist. of Southern Cal. ... www.mwd.dst.ca.usCalifornia EPA ..................................................www.calepa-ca.gov
Printed on recycled paper. This information is available in alternative formats upon request.
This Consumer Confi dence Report meets federal and state requirements for annual customer notifi cation regarding water quality. It was produced and mailed to residences and businesses in the City of San Diego Water Department’s service area at a cost of 31 cents per copy. The direct mailing of this report allows us to provide virtually all of our customers with information they should have about drinking water standards and quality in a cost effi cient manner.
How Can I Get More In for ma tion About My Water?The Public Utilities Advisory Commission (PUAC) holds monthly meetings (the 3rd Monday of each month) to discuss water issues facing the City of San Diego Water De part ment. The public is welcome to attend and give input. Simply call the PUAC’s support line at (619) 236-6750 for information about meeting location, dates and times.
To reach the Water Department via email:[email protected]
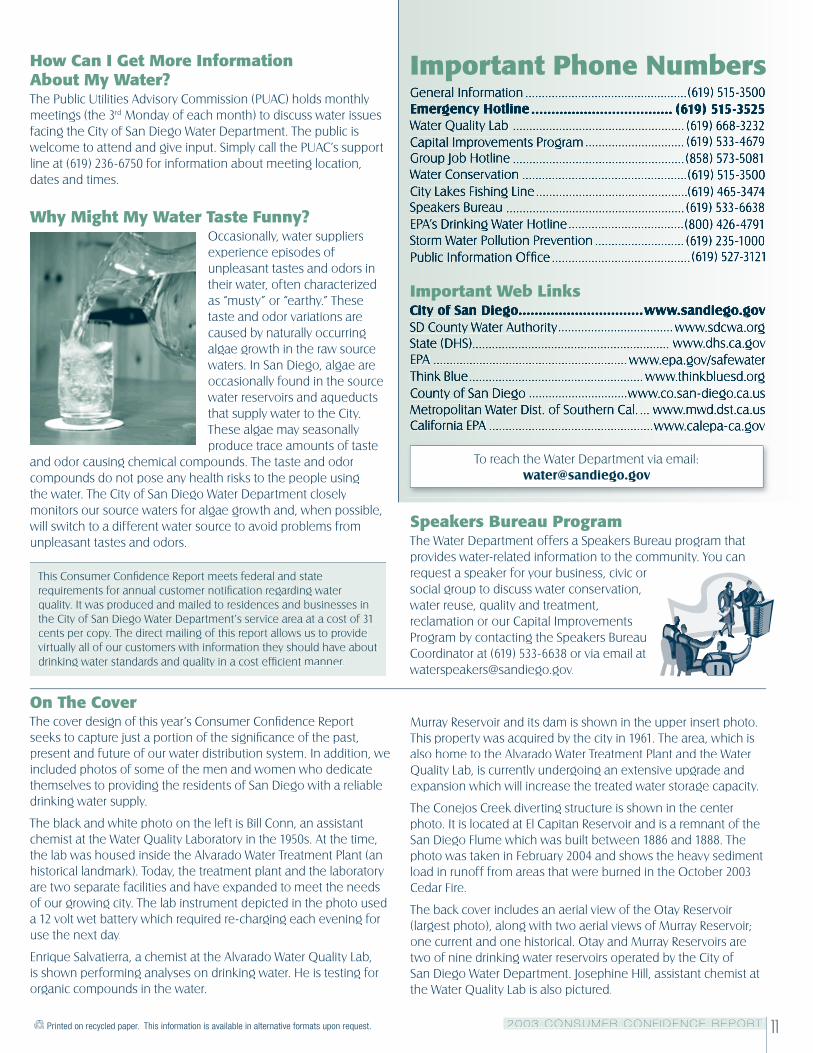
Why Might My Water Taste Funny?Occasionally, water suppliers experience episodes of unpleasant tastes and odors in their water, often characterized as “musty” or “earthy.” These taste and odor variations are caused by naturally occurring algae growth in the raw source waters. In San Diego, algae are occasionally found in the source water reservoirs and aqueducts that supply water to the City. These algae may seasonally produce trace amounts of taste
and odor causing chemical compounds. The taste and odor compounds do not pose any health risks to the people using the water. The City of San Diego Water Department closely monitors our source waters for algae growth and, when possible, will switch to a different water source to avoid problems from unpleasant tastes and odors.
Water Department
Water Department Operations DivisionPublic Information Offi ce2797 Caminito Chollas, MS 43San Diego, CA 92105-5097
Landscape Watering CalculatorThe City of San Diego Landscape Watering Calculator is an easy-to-use, web-based tool that helps you estimate the amount of water your landscape or garden needs. The calculator uses averages that adjust for weather, plants and soils in San Diego. Please visit our website for more information. www.sandiego.gov/water
Mahalaga ang impormasyong ito.
Mangyaring ipasalin ito.
This report contains important information about your drinking water. If the report is not available in your native language, speak with someone who understands it and can translate for you.
Este reporte contiene información importante sobre la calidad del agua en su comunidad. Copias en español de este reporte están disponibles si llama al (619) 527-3121. Tambíen encontrará este reporte por medio del internet en www.sandiego.gov/water.
Ribootkani wuxuu xanbaar sanyahay warbixino muhiim ah oo ku saabsam biyaha aad cabtaan. Hadii aadan fahmeynin, Fadlan ribootka hala turjumo ama kala hadal ruux ku fahansiiya.ama kala hadal ruux ku fahansiiya.
PRSRT STDU.S. POSTAGE
PAIDPERMIT NO. 134SAN DIEGO, CA
Consumer Confi dence Report