Embed Size (px)
Citation preview
______________________________________________
Miami-Dade Water and Sewer Department
Miami-Dade Consolidated PWS Water Use Permit No. 13-00017-W
Water Conservation Plan 2009 Annual Report
January 1, 2009 Through December 31, 2009
_____________________________________________
Miami-Dade Water and Sewer Department
P.O. Box 33-0316, Miami, FL 33233-0316
TABLE OF CONTENTS
INTRODUCTION ........................................................................................................ 1
SUMMARY ................................................................................................................. 2
SECTION I - PLAN IMPLEMENTATION .................................................................... 3
Figure 1 ................................................................................................................... 3
Figure 2 ................................................................................................................... 3
Table 1 .................................................................................................................... 4
APPENDIX A - BMP IMPLEMENTATION ................................................................. A
1
INTRODUCTION
On November 15, 2007, the South Florida Governing Board (SFWMD) approved the Miami-Dade Consolidated PWS Water Use Permit (WUP). To comply with the Permit requirements MDWASD developed a 20-year Water Use Efficiency (WUE) Plan using the Florida Department of Environmental Protection Conserve Florida Guide (Guide). The Guide is a web-based application for goal-based water conservation planning. MDWASD was the first utility in the State to use the Guide to develop, administer and report its water conservation program. The implementation of the Best Management Plans (BMPs) included in the Conserve Florida Plan guarantees that MDWASD will meet the projected 19.8 million gallons a day (MGD) by 2026 as required by the Permit. Current water savings have surpassed the projected 2009 cumulative savings of 3.53 MGD.
MDWASD hereby submits the third Water Conservation Plan Annual Progress Report detailing the County’s actions and efforts to comply with Limiting Condition 45 of the WUP.
2
SUMMARY
Miami-Dade County’s Water Use Efficiency (WUE) Program was implemented utilizing the Florida Department of Environmental Protection (DEP) Conserve Florida Guide. The web-based guide for public water suppliers was used for developing, implementing, and now reporting on the water conservation measures and best management practices (BMPs) of Miami-Dade’s WUE program. Miami-Dade Water and Sewer Department (MDWASD) is the first utility in the State to use the Guide in the development and administration of its conservation program. The implementation of the WUE program has achieved unprecedented water use efficiency in all sectors of Miami-Dade County. The quantifiable BMPs and measures have ensured that the planned savings proposed in the conservation plan are a reality. The Miami-Dade Board of County Commissioners (BCC) has taken an active role in the promotion and implementation of the Water Use Efficiency Plan. On January 1, 2009, Miami-Dade County’s ordinances for Water Use Efficiency Standards for new residential and commercial developments became effective. The standards serve to strengthen the requirements of the Florida Building Code, to both meet the County’s water conservation goals and to provide the public with information and education on all water use efficiency standards and water conservation programs. The ordinances consist of a technical amendment to the Building Code, which requires maximum water conservation flow rates for plumbing fixtures (such as showerheads, water closets, dishwashers, and washing machines), and the publication of a “Water Use Efficiency Standards Manual” on January 1, 2009, with annual updates each year thereafter. It is estimated that the new requirements will represent up to a 31 percent reduction of indoor water use in newly constructed residential units. The ordinance also requires evaluations of applications for “Developments of Regional Impact” with a projected water demand of one million gallons per day or more, to determine the feasibility of an alternative water supply project. Additionally, beginning January 1, 2009, all new multi-family residential developments are required to include a sub-meter for each individual unit. Outdoor water use efficiencies were also addressed in 2009. On April 7, 2009, the BCC approved the Permanent Landscape Irrigation Restrictions Ordinance limiting landscape irrigation to two days a week. On May 5, 2009, the BCC approved the Miami-Dade County Right of Way Landscape Ordinance. Also on May 5, 2009, the BCC adopted an amendment to the Miami-Dade County Landscape Ordinance requiring the use of Florida Friendly landscaping and compliance with more efficient water use guidelines for all new construction. Miami-Dade County is currently experiencing actual finished water demands 34 MGD lower than what was anticipated in the WUP. The lower demands are the result of the County’s irrigation restrictions and the successful implementation of the Water Use Efficiency Plan. As a result of the lower demands and updated population projections, MDWASD has re-evaluated the County’s water demand projections and the AWS project schedule, which will result in significant cost savings to the County. In December 2009, Miami-Dade County's Water Conservation Program received recognition for their efforts by earning five awards from the American Water Works Association's Florida chapter. The Program earned praise for the Every Drop Counts children’s poster contest, the rebate and incentive programs, and for the development of the Water Use Efficiency Standards Manual for Industry.
3
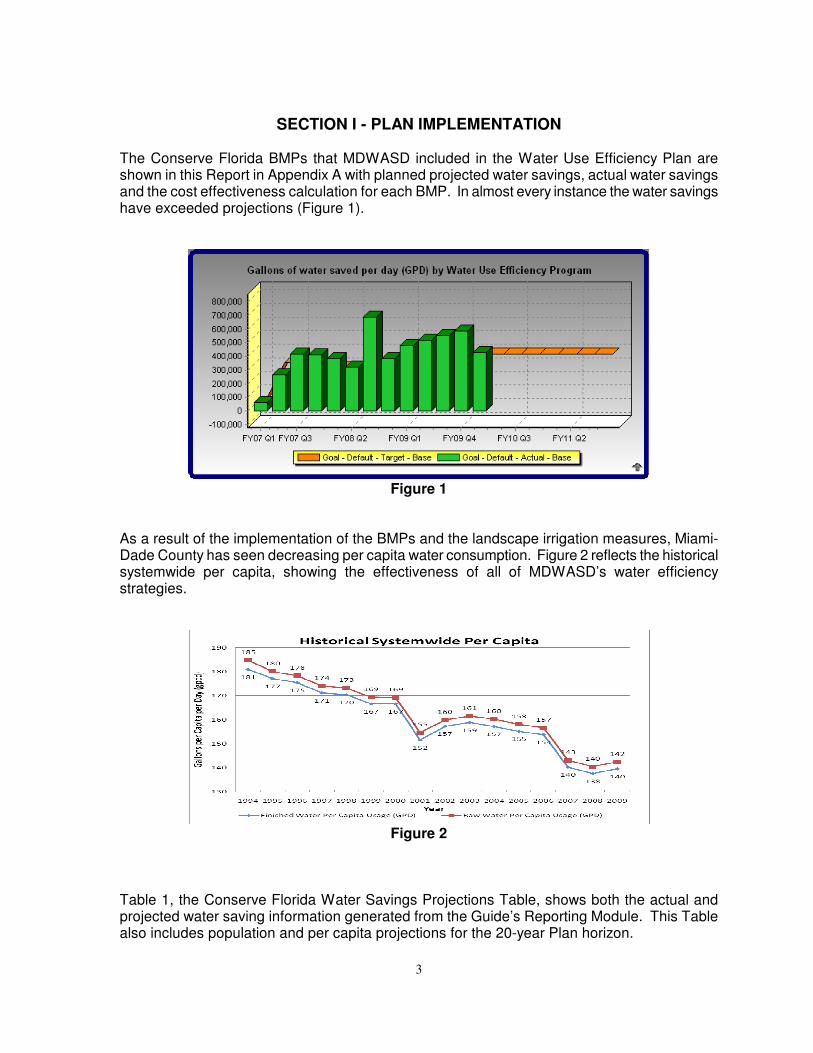
SECTION I - PLAN IMPLEMENTATION
The Conserve Florida BMPs that MDWASD included in the Water Use Efficiency Plan are shown in this Report in Appendix A with planned projected water savings, actual water savings and the cost effectiveness calculation for each BMP. In almost every instance the water savings have exceeded projections (Figure 1).
Figure 1
As a result of the implementation of the BMPs and the landscape irrigation measures, Miami-Dade County has seen decreasing per capita water consumption. Figure 2 reflects the historical systemwide per capita, showing the effectiveness of all of MDWASD’s water efficiency strategies.
Figure 2
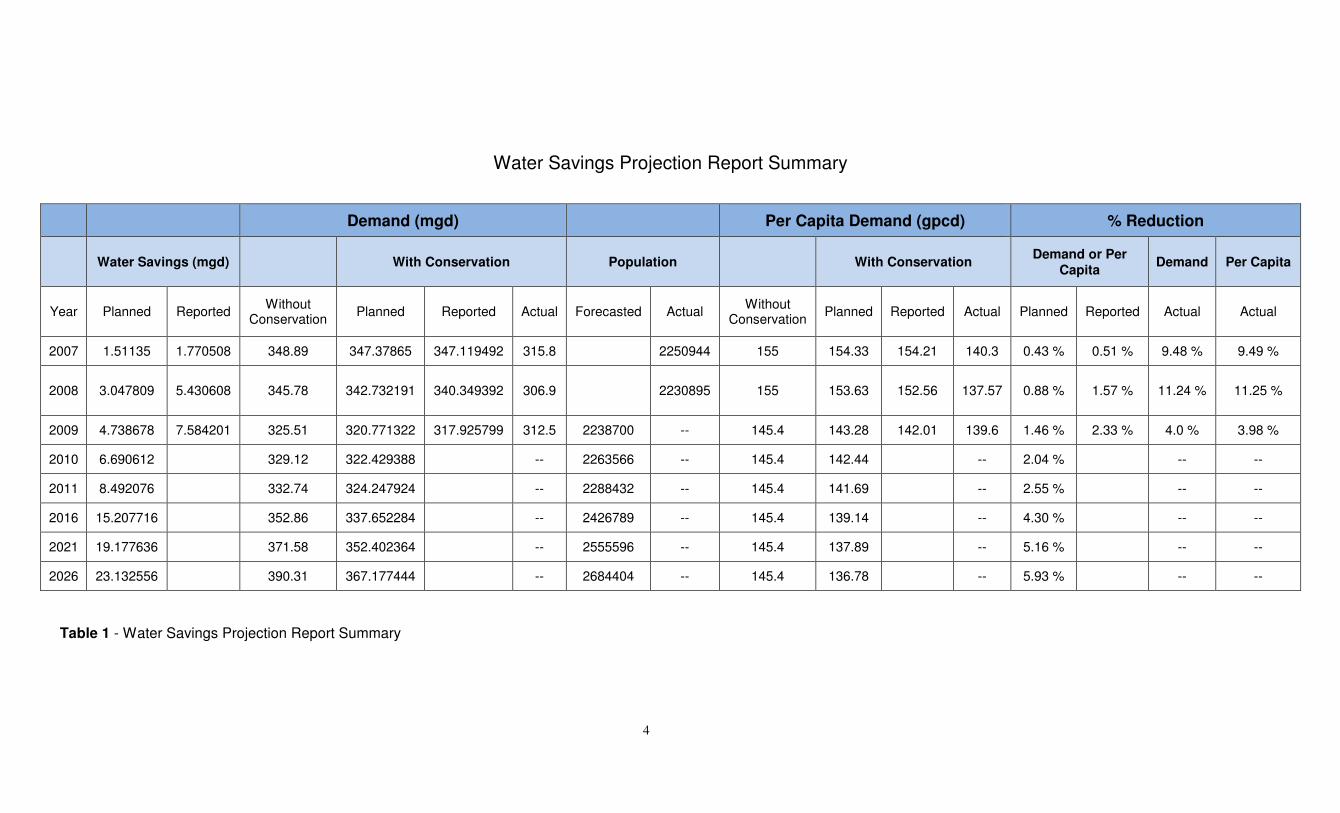
Table 1, the Conserve Florida Water Savings Projections Table, shows both the actual and projected water saving information generated from the Guide’s Reporting Module. This Table also includes population and per capita projections for the 20-year Plan horizon.
4
Water Savings Projection Report Summary
Table 1 - Water Savings Projection Report Summary
Demand (mgd)
Per Capita Demand (gpcd) % Reduction
Water Savings (mgd)
With Conservation Population
With Conservation
Demand or Per Capita
Demand Per Capita
Year Planned Reported Without
Conservation Planned Reported Actual Forecasted Actual
Without Conservation
Planned Reported Actual Planned Reported Actual Actual
2007 1.51135 1.770508 348.89 347.37865 347.119492 315.8
2250944 155 154.33 154.21 140.3 0.43 % 0.51 % 9.48 % 9.49 %
2008 3.047809 5.430608 345.78 342.732191 340.349392 306.9
2230895 155 153.63 152.56 137.57 0.88 % 1.57 % 11.24 % 11.25 %
2009 4.738678 7.584201 325.51 320.771322 317.925799 312.5 2238700 -- 145.4 143.28 142.01 139.6 1.46 % 2.33 % 4.0 % 3.98 %
2010 6.690612
329.12 322.429388
-- 2263566 -- 145.4 142.44
-- 2.04 %
-- --
2011 8.492076
332.74 324.247924
-- 2288432 -- 145.4 141.69
-- 2.55 %
-- --
2016 15.207716
352.86 337.652284
-- 2426789 -- 145.4 139.14
-- 4.30 %
-- --
2021 19.177636
371.58 352.402364
-- 2555596 -- 145.4 137.89
-- 5.16 %
-- --
2026 23.132556
390.31 367.177444
-- 2684404 -- 145.4 136.78
-- 5.93 %
-- --
A
APPENDIX A - BMP IMPLEMENTATION THROUGH DECEMBER 31, 2009
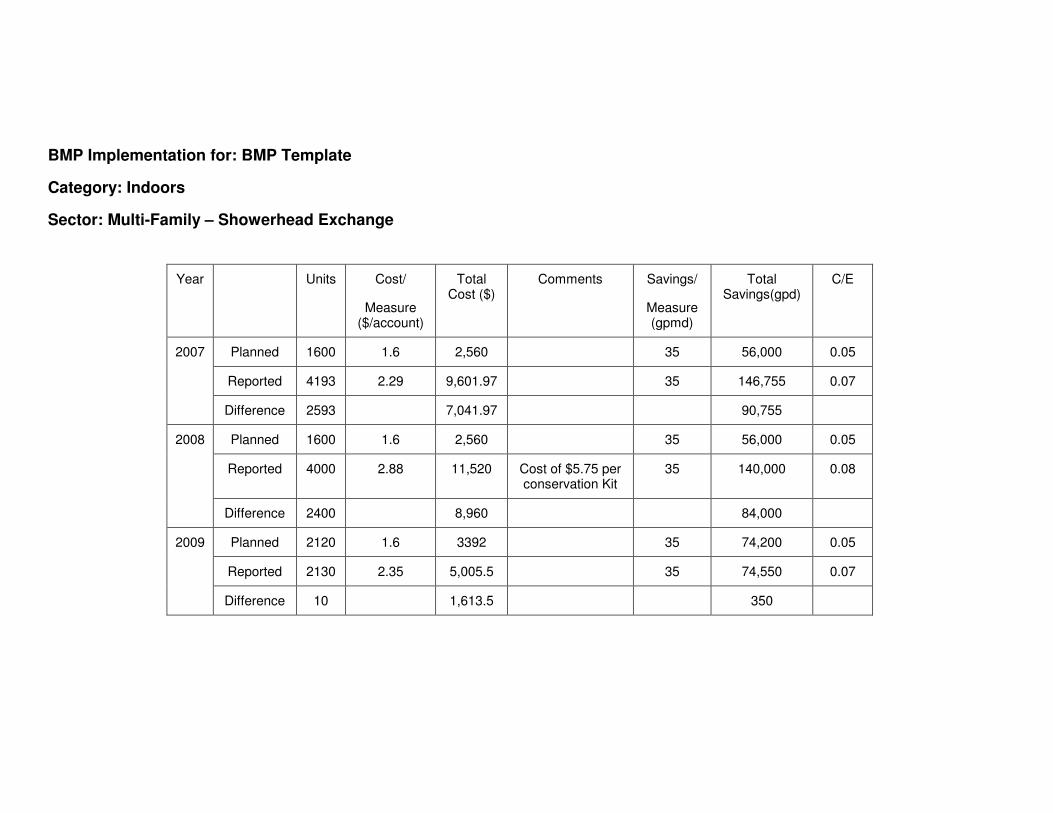
BMP Implementation for: BMP Template
Category: Indoors
Sector: Multi-Family – Showerhead Exchange
Year Units Cost/
Measure ($/account)
Total Cost ($)
Comments Savings/
Measure (gpmd)
Total Savings(gpd)
C/E
2007 Planned 1600 1.6 2,560 35 56,000 0.05
Reported 4193 2.29 9,601.97
35 146,755 0.07
Difference 2593 7,041.97
90,755
2008 Planned 1600 1.6 2,560 35 56,000 0.05
Reported 4000 2.88 11,520 Cost of $5.75 per conservation Kit
35 140,000 0.08
Difference 2400 8,960
84,000
2009 Planned 2120 1.6 3392 35 74,200 0.05
Reported 2130 2.35 5,005.5
35 74,550 0.07
Difference 10 1,613.5
350
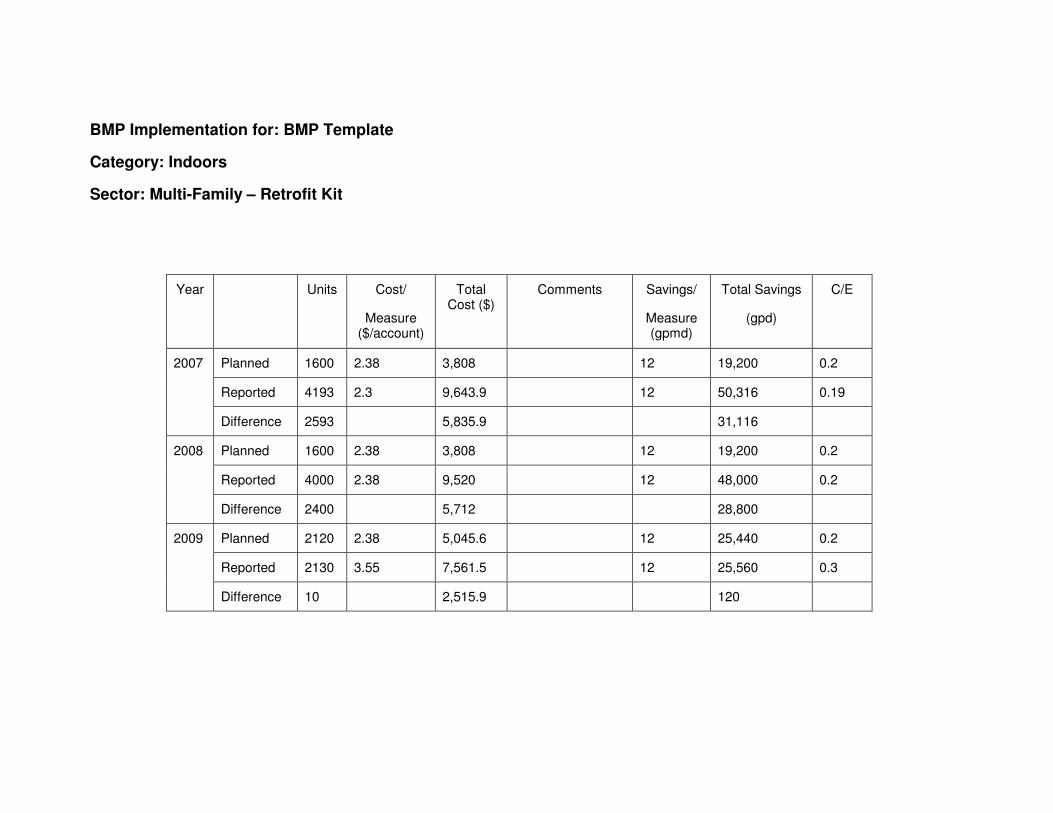
BMP Implementation for: BMP Template
Category: Indoors
Sector: Multi-Family – Retrofit Kit
Year Units Cost/
Measure ($/account)
Total Cost ($)
Comments Savings/
Measure (gpmd)
Total Savings
(gpd)
C/E
2007 Planned 1600 2.38 3,808 12 19,200 0.2
Reported 4193 2.3 9,643.9
12 50,316 0.19
Difference 2593 5,835.9
31,116
2008 Planned 1600 2.38 3,808 12 19,200 0.2
Reported 4000 2.38 9,520
12 48,000 0.2
Difference 2400
5,712
28,800
2009 Planned 2120 2.38 5,045.6 12 25,440 0.2
Reported 2130 3.55 7,561.5
12 25,560 0.3
Difference 10 2,515.9
120
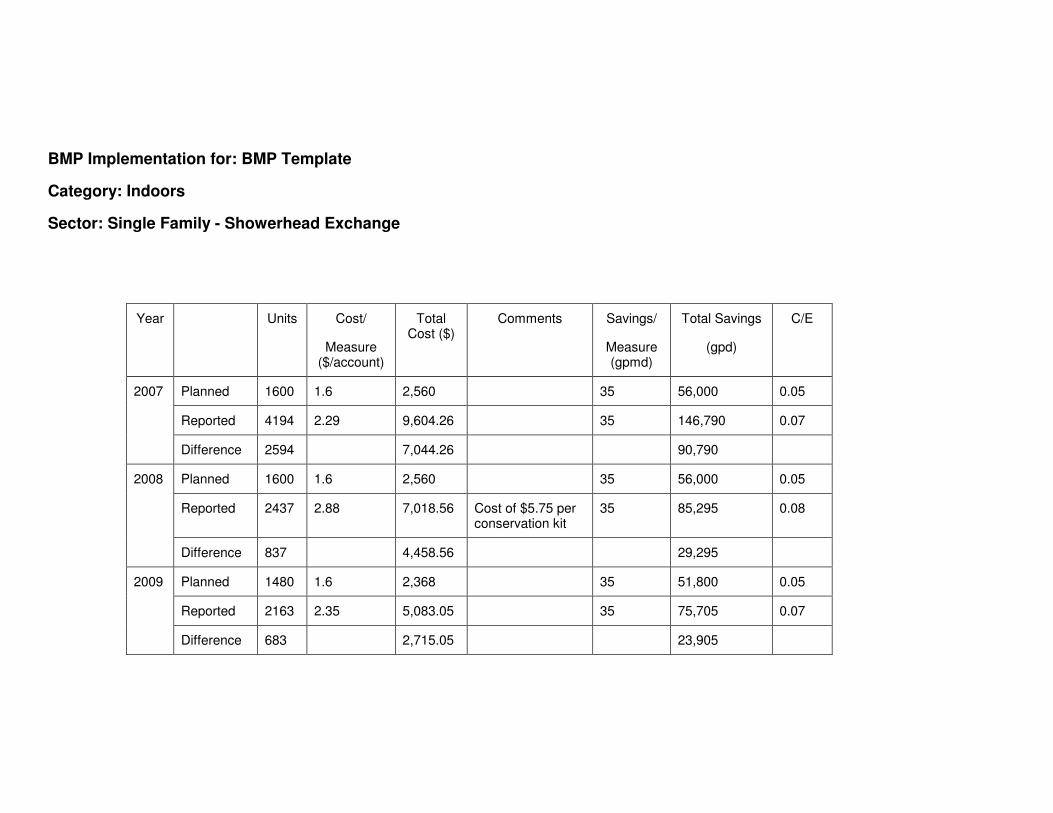
BMP Implementation for: BMP Template
Category: Indoors
Sector: Single Family - Showerhead Exchange
Year Units Cost/
Measure ($/account)
Total Cost ($)
Comments Savings/
Measure (gpmd)
Total Savings
(gpd)
C/E
2007 Planned 1600 1.6 2,560 35 56,000 0.05
Reported 4194 2.29 9,604.26
35 146,790 0.07
Difference 2594 7,044.26
90,790
2008 Planned 1600 1.6 2,560 35 56,000 0.05
Reported 2437 2.88 7,018.56 Cost of $5.75 per conservation kit
35 85,295 0.08
Difference 837 4,458.56
29,295
2009 Planned 1480 1.6 2,368 35 51,800 0.05
Reported 2163 2.35 5,083.05
35 75,705 0.07
Difference 683 2,715.05
23,905
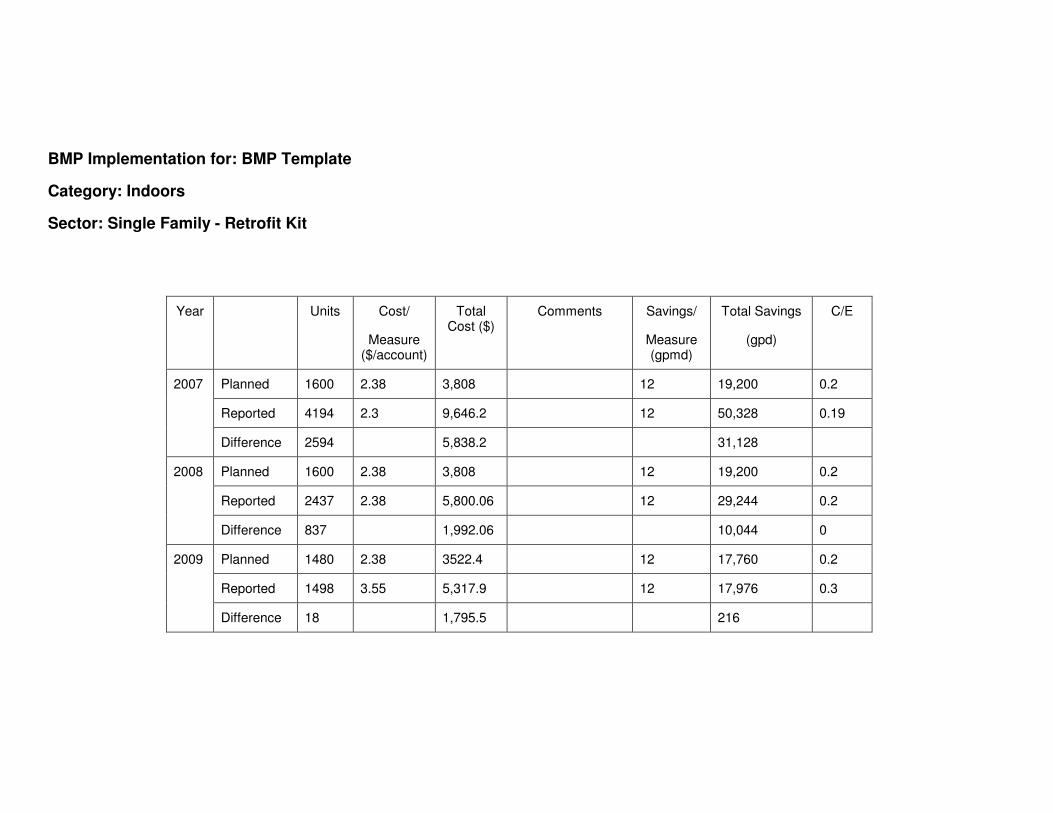
BMP Implementation for: BMP Template
Category: Indoors
Sector: Single Family - Retrofit Kit
Year Units Cost/
Measure ($/account)
Total Cost ($)
Comments Savings/
Measure (gpmd)
Total Savings
(gpd)
C/E
2007 Planned 1600 2.38 3,808 12 19,200 0.2
Reported 4194 2.3 9,646.2
12 50,328 0.19
Difference 2594 5,838.2
31,128
2008 Planned 1600 2.38 3,808 12 19,200 0.2
Reported 2437 2.38 5,800.06
12 29,244 0.2
Difference 837
1,992.06
10,044 0
2009 Planned 1480 2.38 3522.4 12 17,760 0.2
Reported 1498 3.55 5,317.9
12 17,976 0.3
Difference 18 1,795.5
216
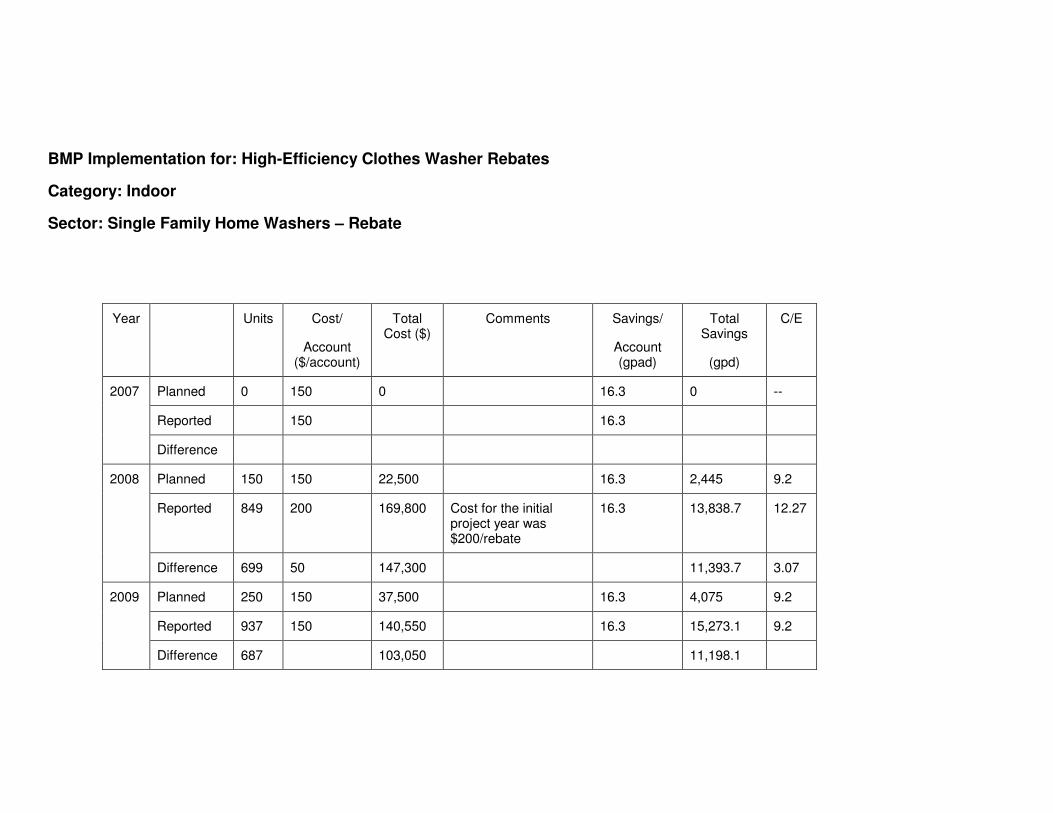
BMP Implementation for: High-Efficiency Clothes Washer Rebates
Category: Indoor
Sector: Single Family Home Washers – Rebate
Year Units Cost/
Account ($/account)
Total Cost ($)
Comments Savings/
Account (gpad)
Total Savings
(gpd)
C/E
2007 Planned 0 150 0 16.3 0 --
Reported
150
16.3
Difference
2008 Planned 150 150 22,500 16.3 2,445 9.2
Reported 849 200 169,800 Cost for the initial project year was $200/rebate
16.3 13,838.7 12.27
Difference 699 50 147,300
11,393.7 3.07
2009 Planned 250 150 37,500 16.3 4,075 9.2
Reported 937 150 140,550
16.3 15,273.1 9.2
Difference 687
103,050
11,198.1
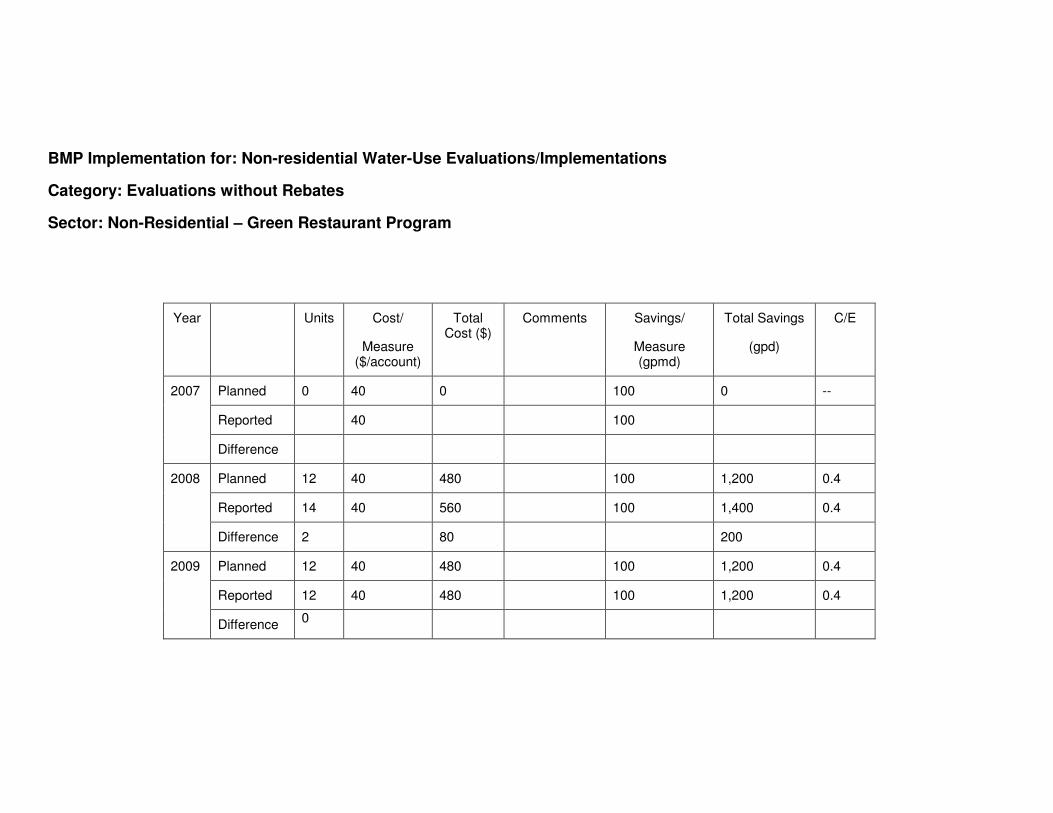
BMP Implementation for: Non-residential Water-Use Evaluations/Implementations
Category: Evaluations without Rebates
Sector: Non-Residential – Green Restaurant Program
Year Units Cost/
Measure ($/account)
Total Cost ($)
Comments Savings/
Measure (gpmd)
Total Savings
(gpd)
C/E
2007 Planned 0 40 0 100 0 --
Reported
40
100
Difference
2008 Planned 12 40 480 100 1,200 0.4
Reported 14 40 560
100 1,400 0.4
Difference 2
80
200
2009 Planned 12 40 480 100 1,200 0.4
Reported 12 40 480
100 1,200 0.4
Difference 0
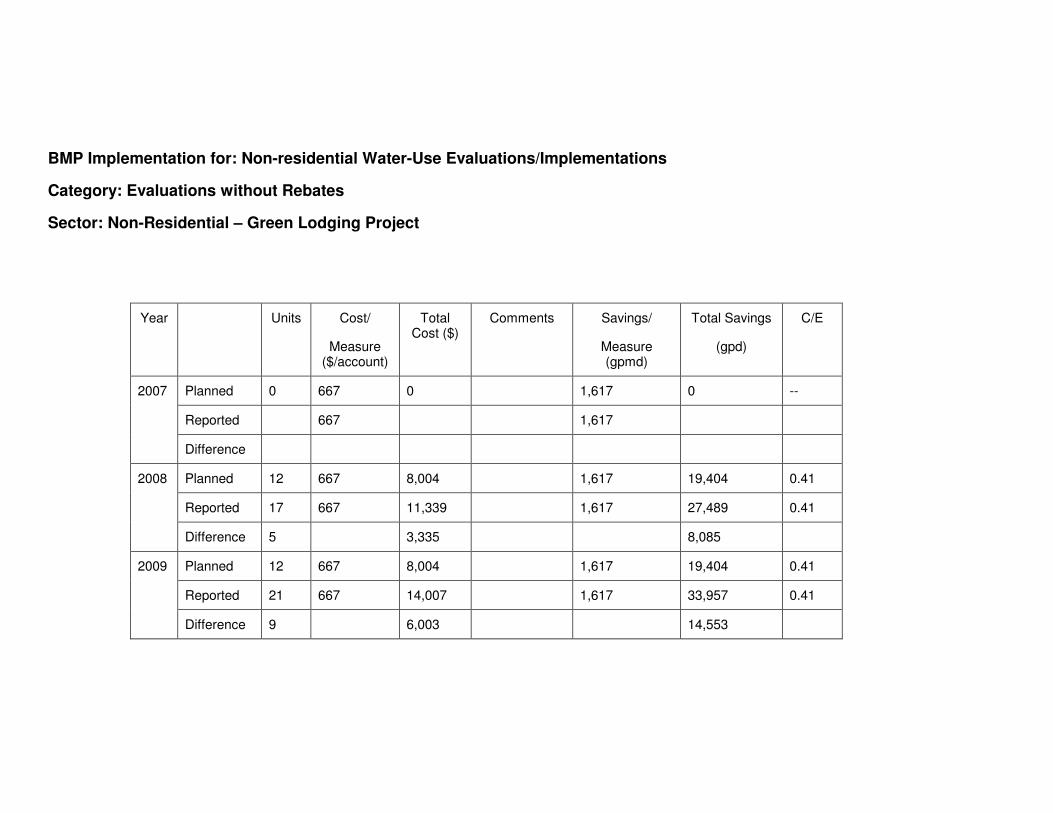
BMP Implementation for: Non-residential Water-Use Evaluations/Implementations
Category: Evaluations without Rebates
Sector: Non-Residential – Green Lodging Project
Year Units Cost/
Measure ($/account)
Total Cost ($)
Comments Savings/
Measure (gpmd)
Total Savings
(gpd)
C/E
2007 Planned 0 667 0 1,617 0 --
Reported
667
1,617
Difference
2008 Planned 12 667 8,004 1,617 19,404 0.41
Reported 17 667 11,339
1,617 27,489 0.41
Difference 5
3,335
8,085
2009 Planned 12 667 8,004 1,617 19,404 0.41
Reported 21 667 14,007
1,617 33,957 0.41
Difference 9
6,003
14,553
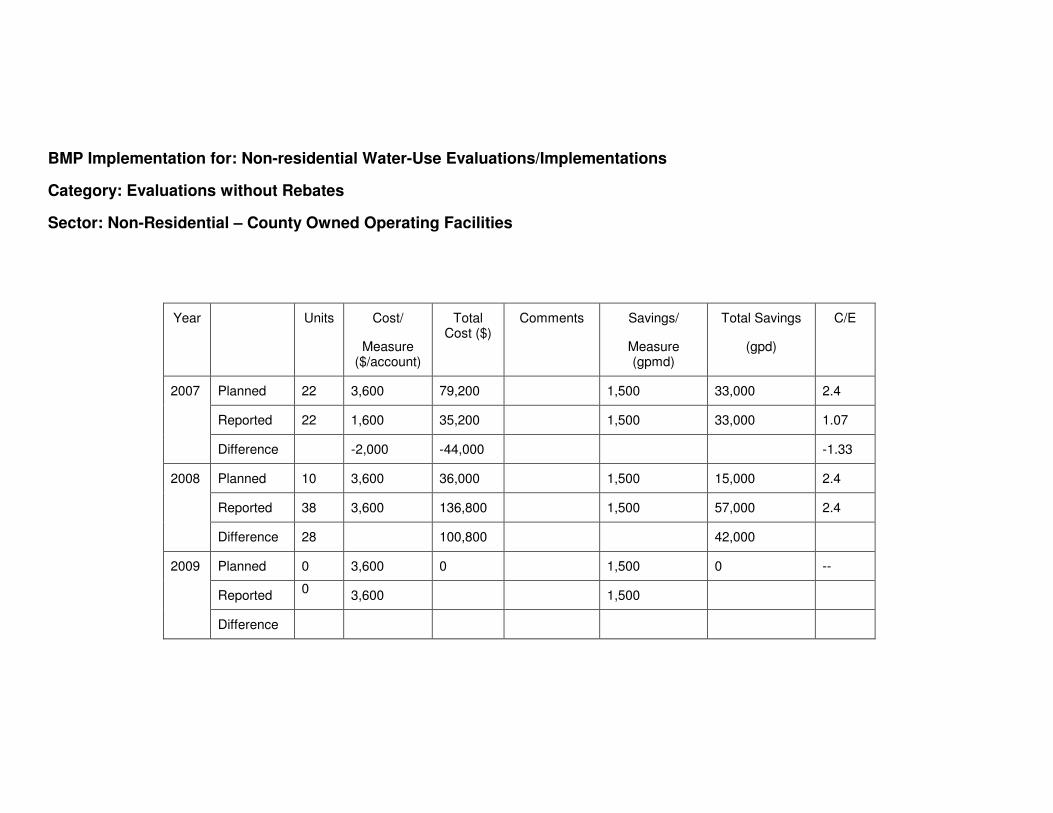
BMP Implementation for: Non-residential Water-Use Evaluations/Implementations
Category: Evaluations without Rebates
Sector: Non-Residential – County Owned Operating Facilities
Year Units Cost/
Measure ($/account)
Total Cost ($)
Comments Savings/
Measure (gpmd)
Total Savings
(gpd)
C/E
2007 Planned 22 3,600 79,200 1,500 33,000 2.4
Reported 22 1,600 35,200
1,500 33,000 1.07
Difference
-2,000 -44,000
-1.33
2008 Planned 10 3,600 36,000 1,500 15,000 2.4
Reported 38 3,600 136,800
1,500 57,000 2.4
Difference 28
100,800
42,000
2009 Planned 0 3,600 0 1,500 0 --
Reported 0
3,600
1,500
Difference
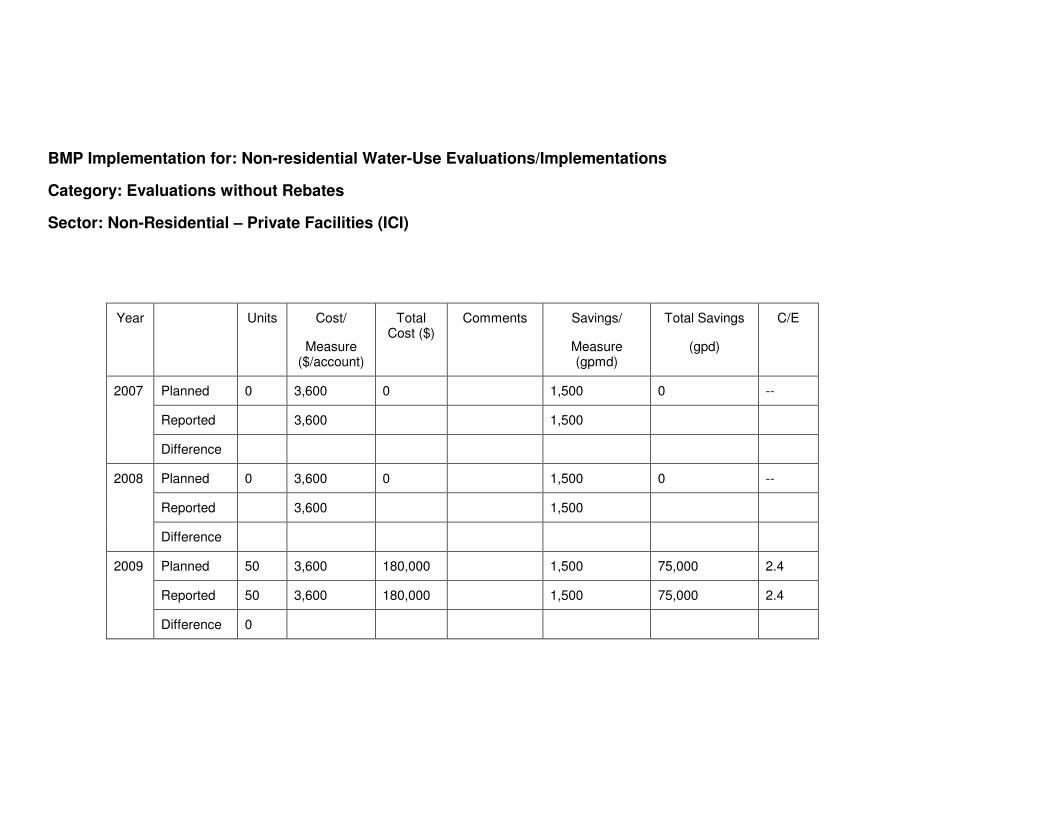
BMP Implementation for: Non-residential Water-Use Evaluations/Implementations
Category: Evaluations without Rebates
Sector: Non-Residential – Private Facilities (ICI)
Year Units Cost/
Measure ($/account)
Total Cost ($)
Comments Savings/
Measure (gpmd)
Total Savings
(gpd)
C/E
2007 Planned 0 3,600 0 1,500 0 --
Reported
3,600
1,500
Difference
2008 Planned 0 3,600 0 1,500 0 --
Reported
3,600
1,500
Difference
2009 Planned 50 3,600 180,000 1,500 75,000 2.4
Reported 50 3,600 180,000
1,500 75,000 2.4
Difference 0
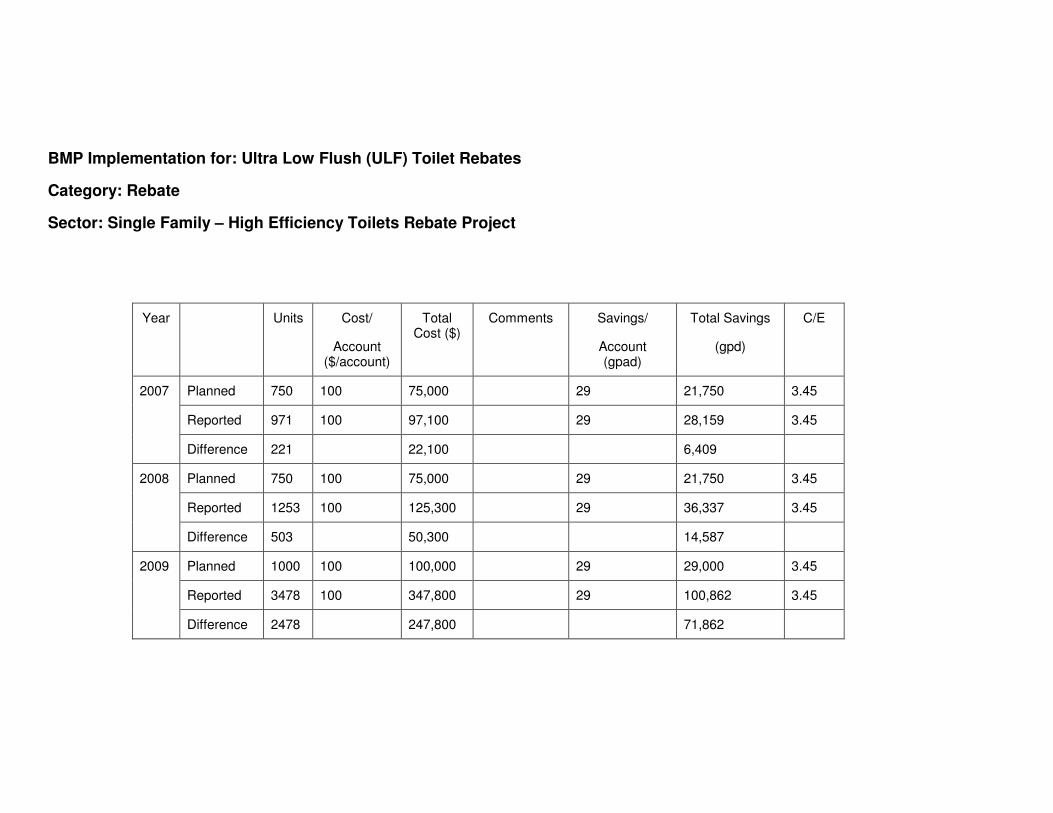
BMP Implementation for: Ultra Low Flush (ULF) Toilet Rebates
Category: Rebate
Sector: Single Family – High Efficiency Toilets Rebate Project
Year Units Cost/
Account ($/account)
Total Cost ($)
Comments Savings/
Account (gpad)
Total Savings
(gpd)
C/E
2007 Planned 750 100 75,000 29 21,750 3.45
Reported 971 100 97,100
29 28,159 3.45
Difference 221
22,100
6,409
2008 Planned 750 100 75,000 29 21,750 3.45
Reported 1253 100 125,300
29 36,337 3.45
Difference 503
50,300
14,587
2009 Planned 1000 100 100,000 29 29,000 3.45
Reported 3478 100 347,800
29 100,862 3.45
Difference 2478
247,800
71,862
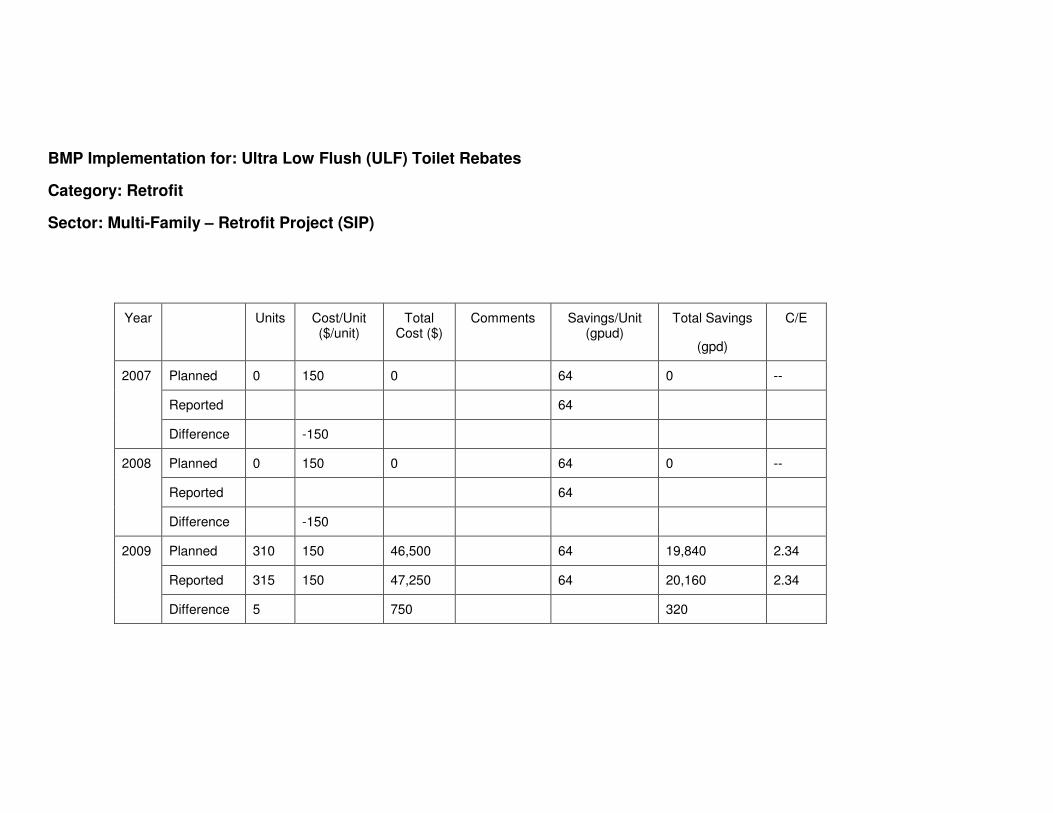
BMP Implementation for: Ultra Low Flush (ULF) Toilet Rebates
Category: Retrofit
Sector: Multi-Family – Retrofit Project (SIP)
Year Units Cost/Unit ($/unit)
Total Cost ($)
Comments Savings/Unit (gpud)
Total Savings
(gpd)
C/E
2007 Planned 0 150 0 64 0 --
Reported
64
Difference
-150
2008 Planned 0 150 0 64 0 --
Reported
64
Difference
-150
2009 Planned 310 150 46,500 64 19,840 2.34
Reported 315 150 47,250
64 20,160 2.34
Difference 5
750
320
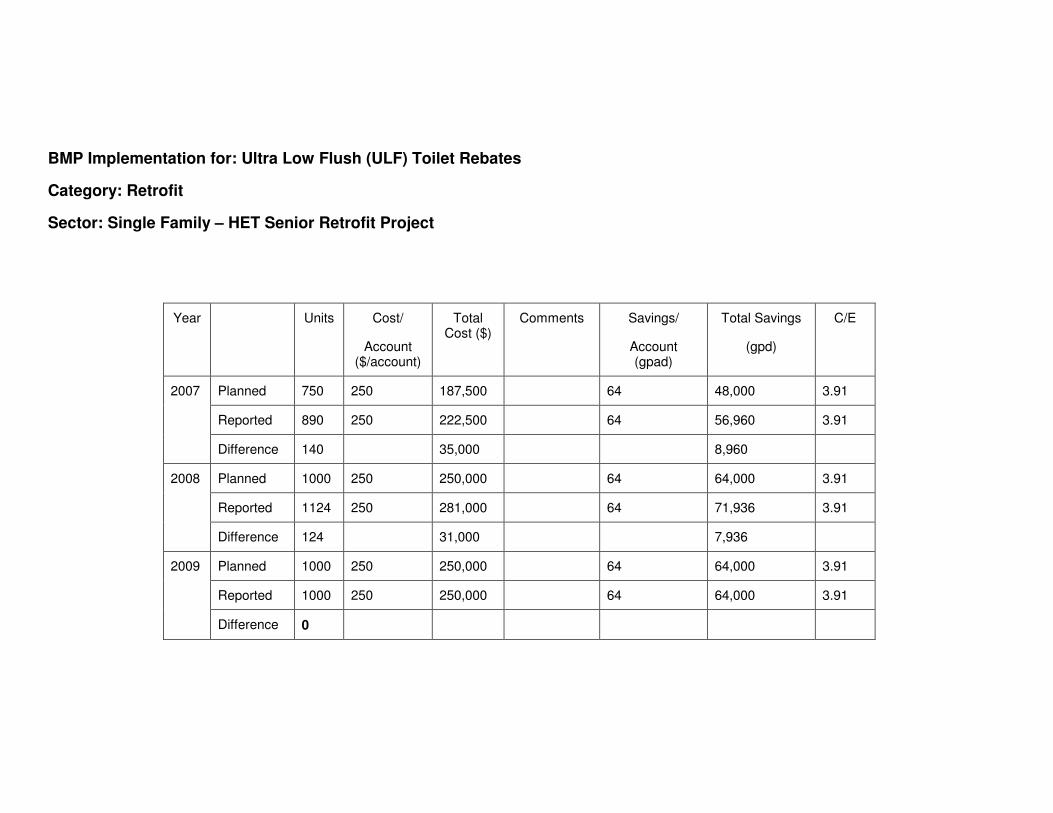
BMP Implementation for: Ultra Low Flush (ULF) Toilet Rebates
Category: Retrofit
Sector: Single Family – HET Senior Retrofit Project
Year Units Cost/
Account ($/account)
Total Cost ($)
Comments Savings/
Account (gpad)
Total Savings
(gpd)
C/E
2007 Planned 750 250 187,500 64 48,000 3.91
Reported 890 250 222,500
64 56,960 3.91
Difference 140
35,000
8,960
2008 Planned 1000 250 250,000 64 64,000 3.91
Reported 1124 250 281,000
64 71,936 3.91
Difference 124
31,000
7,936
2009 Planned 1000 250 250,000 64 64,000 3.91
Reported 1000 250 250,000
64 64,000 3.91
Difference 0
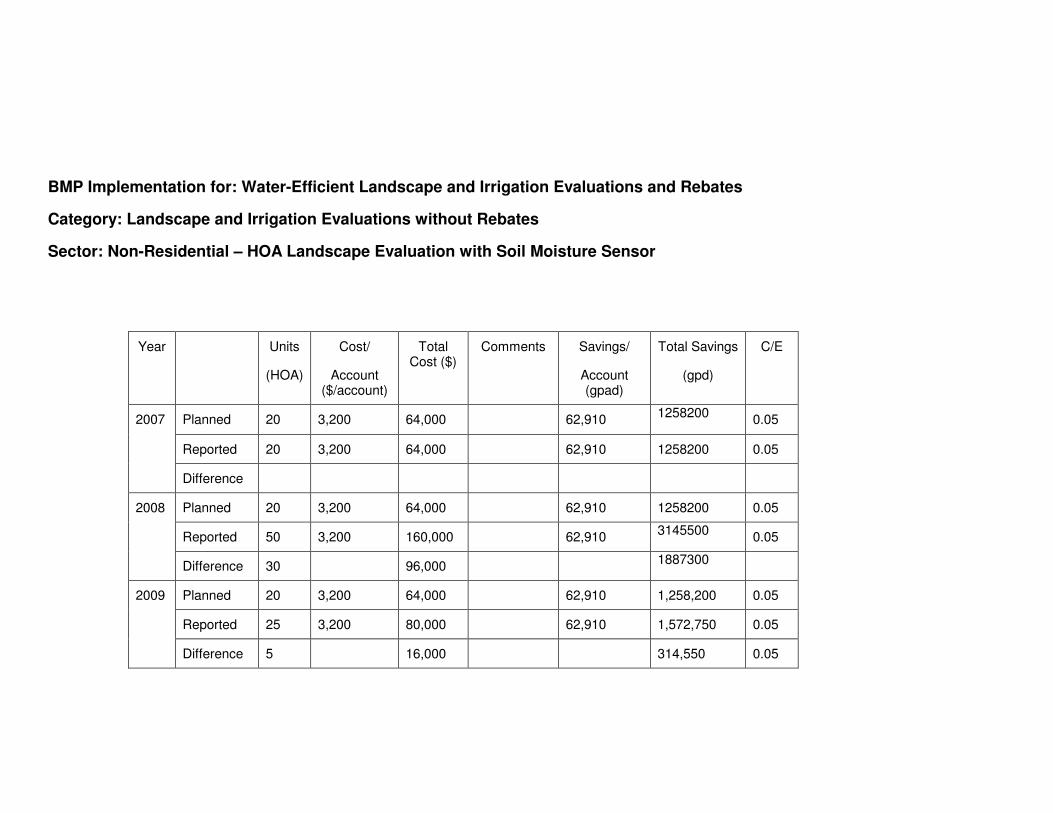
BMP Implementation for: Water-Efficient Landscape and Irrigation Evaluations and Rebates
Category: Landscape and Irrigation Evaluations without Rebates
Sector: Non-Residential – HOA Landscape Evaluation with Soil Moisture Sensor
Year Units
(HOA)
Cost/
Account ($/account)
Total Cost ($)
Comments Savings/
Account (gpad)
Total Savings
(gpd)
C/E
2007 Planned 20 3,200 64,000 62,910 1258200
0.05
Reported 20 3,200 64,000
62,910 1258200 0.05
Difference
2008 Planned 20 3,200 64,000 62,910 1258200 0.05
Reported 50 3,200 160,000
62,910 3145500
0.05
Difference 30
96,000 1887300
2009 Planned 20 3,200 64,000 62,910 1,258,200 0.05
Reported 25 3,200 80,000
62,910 1,572,750 0.05
Difference 5
16,000 314,550 0.05
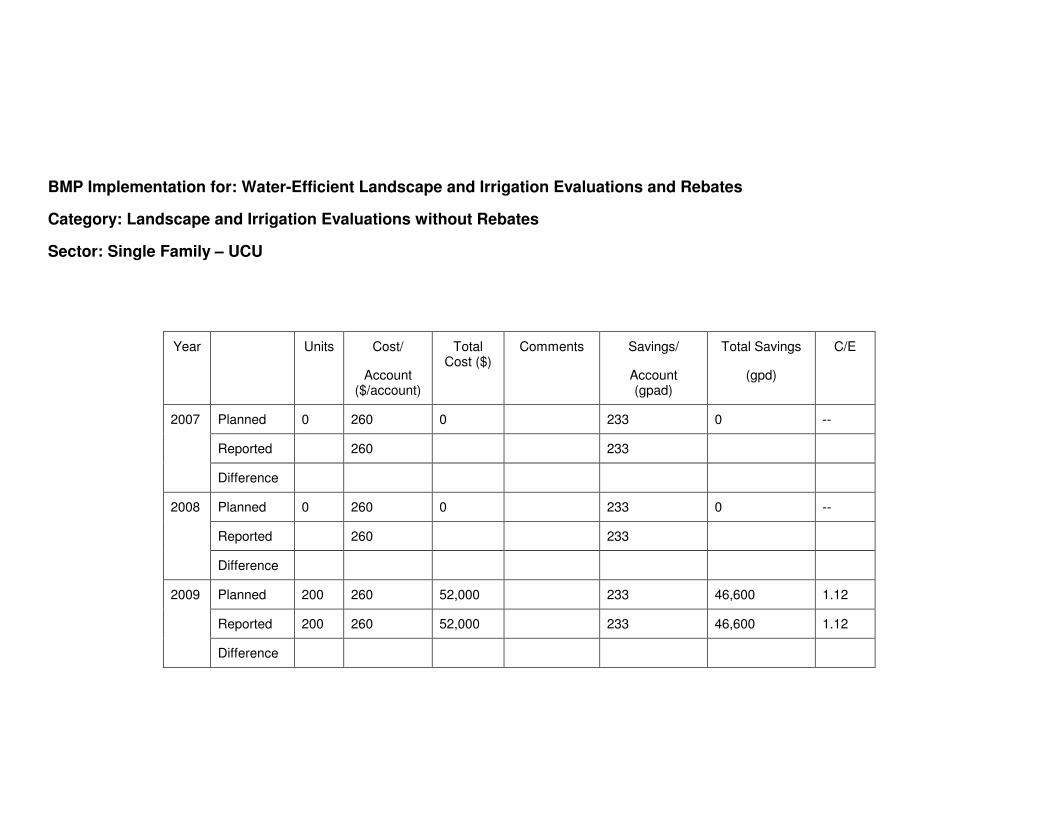
BMP Implementation for: Water-Efficient Landscape and Irrigation Evaluations and Rebates
Category: Landscape and Irrigation Evaluations without Rebates
Sector: Single Family – UCU
Year Units Cost/
Account ($/account)
Total Cost ($)
Comments Savings/
Account (gpad)
Total Savings
(gpd)
C/E
2007 Planned 0 260 0 233 0 --
Reported
260
233
Difference
2008 Planned 0 260 0 233 0 --
Reported
260
233
Difference
2009 Planned 200 260 52,000 233 46,600 1.12
Reported 200 260 52,000
233 46,600 1.12
Difference