Embed Size (px)
Citation preview
Journal of Physical and Chemical Reference Data 20, 575 (1991); https://doi.org/10.1063/1.555905 20, 575
© 1991 American Institute of Physics for the National Institute of Standards and Technology.
Evaluation of Solubility Data of the SystemCO2–H2O from 273 K to the Critical Point ofWaterCite as: Journal of Physical and Chemical Reference Data 20, 575 (1991); https://doi.org/10.1063/1.555905Submitted: 06 September 1990 . Published Online: 15 October 2009
Rosa Crovetto
ARTICLES YOU MAY BE INTERESTED IN
The Solubility of Carbon Dioxide in Water at Low PressureJournal of Physical and Chemical Reference Data 20, 1201 (1991); https://doi.org/10.1063/1.555900
Evaluation of Data on Solubility of Simple Apolar Gases in Light and Heavy Water at HighTemperatureJournal of Physical and Chemical Reference Data 18, 1231 (1989); https://doi.org/10.1063/1.555834
A New Equation of State for Carbon Dioxide Covering the Fluid Region from the Triple-PointTemperature to 1100 K at Pressures up to 800 MPaJournal of Physical and Chemical Reference Data 25, 1509 (1996); https://doi.org/10.1063/1.555991
Evaluation of Solubility Data of the System CO2-H20 from 273 K to the Critical Point of Water
Rosa Crovetto
Thermophysics Division, National Institute o/Standards and Technology, Gaithersburg, MD 20899
Received September 6, 1990; revised manuscript received December 14, 1990
This critical review covers the existing literature on the solubility of CO2 in water from 273 K to the critical temperature of the solvent (647 K). Results of the evaluation are expressed in the form of fitting equations for the infinite dilution Henry's constant, k 0, as a function of the density of the solvent, and also as an explicit function of the temperature. The pressure effect on the solubility is considered in the formulation. Different equations of state were used for the description of the CO2-1I20 vapor phase and the effects on the
calculated Henry's constant values are analyzed. The "best" solubility estimates are presented in smoothed tabular form.
Key words: CO2 dissolution in water; solubility; Henry's constant; high temperature CO2 solubilities in water.
Contents 1. Introduction ......................................................... 576
1.1. Background .............................................. 576 1.2. Scope ........................................................ 576
2. Brief Thermodynamic Description ...................... 576 2.1. Temperature Dependence of Henry's
Constant.. ... ....... ..... ....... ............... ............ 577 3. Solubility of CO2 in Water ................................... 578
3.1. Literature Reviewed ................................. 578 3.1.a. Temperatures up to 353 K, Low Pressure,
<2 bars .................................................... 578 3.2. Temperatures up to 353 K, High Pres-
sures. ........................................................ 582 3.3. Temperatures up to the Critical Point of
the Solvent, Any Pressure ........................ 582 4. Conclusions .......................................................... 586 5. Acknowledgments................................................ 586 6. Reierences ............................................................ 586 Appendix I. Procedure for Calculating Henry's Con-stants. ........................................................................ 587
1.1. Equation of State.................................... ... 587 I.1.a. Equation of State for Low Temperatures.. 587 I. Lb. Equation of State for High Temperatures. 587 I.I.c. Group B .................................................... 589 1.2. Effect of Pressure on Gas Solubility.......... 589
Appendix II. Fitting Procedure Employed and Point Rejection Criteria...................................................... 589
List of Tables
1. List of sources of data ...... ............ ........................ 579 2. Adjusted coefficients for the fitting equations: P3;
P3 + b; KD; DEN*2 and T* ( 1/3) ..................... 580 3. Low-temperature smoothed values of In k ° and
@1991 by the u.s. Secretary of Commerce on behalf of the United States. This copyright is assigned to the American institute of Physics and the American Chemical Society. Reprints availabie from ACS; see Repriilts List at back of issue.
0047-2689/91/030575-15/$5.00 575
comparison with the previous review by Wilhelm et al. (see Ref. 4) .................................................. 580
4. Recommended values for k 0 calculated from the selected fitting equation, P 3, considering all the sources, at 5-K interval from 273.15 to 353.15 K... 582
5. Smoothed values for In k ° at 15-K intervals from 353 K up; calculated from selected equations and EOS ...................................................................... 583
List of Figures
1. Deviation plots as (In k ~xp - In k ~a\c) versus temperature. (a) For In k 0 calculated from equation P3 for all the selected sources for the low temperature data set. (b) Idem excluding the sources NOV (61) andVE (855). (c) Idem with only two sources MOR (52) and MUR (71) ..................... 581
2. Deviation plot as (In k ~xp In k ~alc ) versus tem-perature for the high temperature data set. (a) (Top) k 0 calculated from T* (1/3) with EOS PR and (bottom) idem with Was EOS. (b) (Top) k () calculated from KD and Eq. (5) with EOS PR and (bottom) idem with W as EOS ..................... 584
List of Symbols
Subscripts: 1: solvent, 2: solute, c: critical. Superscripts: 0: infinite dilution, *: pure substance, g: vapor phase, liq: liquid phase, s: saturation. av,x second derivative with respect to the vol
ume and composition of the Helmholtz free energy
k Henry's constant x mole fraction of solute in the liquid phase y mole fraction of solute in the vapor phase B 12 second cross virial coefficient
J.lPhys. Chern. Ref. Data, Vol. 20, No.3, 1991
ROSA CROVETTO
third virial coefficients partial molar isobaric heat capacity for the solute
~ D distribution coefficient P total pressure ~ gas constant r Kelvin temperature r# reduced temperature, T /T1c
V molar volume V;. partial molar volume of i ?: compressibility factor, PV /RT }reek symbols:
1. Introduction The solubility of CO2 in H 20 is of great importance in
nany different fields. At temperatures between 273 and 315 K. it plays an essential role in biochemistry and biotechnol)gy. At higher temperatures it becomes important to geo~hemistry, power plant water chemistry, industrial steam;vater cycling, and engineering design. Also, a consistent set )f evaluated data can be used as a test for predictions from nodels of aqueous solutions.
1.1. Background Because of its natural abundance and biological impor
:ance the solubility of CO2 in water at low temperatures has )een the subject of much research since as early as 1855. One )f the pioneers in gas solubility research who defined and ~ave his name to a measure of solubility, Bunsen, I measured :02 solubilities in water from 4 to 22°C in 1855. Also, some )fthe apparatus designed for measuring gas content in biolo~ical fluids, such as blood and plasma, that are still in use lowadays, were tested and developed by measuring the solu)ility of CO2 in water: see Van Slyke2 and Van Slyke and ~eil.3
This system has previously been considered in the reliew by Wilhelm et al.4 In this review only three sources for :he system CO2-water from the existing low temperature lata were considered. The sources have almost no tempera:ure overlap among them. These were the data of Morrison md Billet,S Murray and Riley,6 and Weiss.7
The system CO2-heavy water at low temperature has no lew measurements or data sources other than those already
~onsidered in the review by Wilhelm et al.4 and will not be ~eanalyzed here.
At high temperature there exists one set of measurenents on CO2-D20 from 303 to 473 K, Kapitanov et al.8
Jnfortunately it is not possible to determine from the availtble translation of this paper the temperature at which the lensity of the solvent was measured. Without this informaion the mole fraction of the dissolved gas, x, cannot be cal;ulated. Thus the system CO2-D20 will not be evaluated at ligh temperatures.
1.2. Scope
Due to the importance of the system CO2-H20, a criti;al evaluation and a representation of the temperature de)endence of the existing solubility data from 273 K to the ~ritical point of water and at pressures up to 20-30 MPa tbove the solvent vapor pressure is presented.
molar density mixture interaction parameter of Peng and Robinson
l/l i fugacity coefficient in the gaseous mixture of component i
yIi activity coefficient in the liquid phase on the scale defining ideality by means of Henry's law
y idem but defining ideality by means of pure solvent behavior or Raoult's law
Mathematical notation: In base e logarithm, exp: exponential
In order to evaluate effectively the different sources, the data treatment must be carried out on the same basis for all sources. Thus every source of data has to be first reduced to the same raw experimental information, i.e., temperature, T, total pressure, P, and dissolved gas mole fraction, x, before any thermodynamic calculation can be started. This is strictly unavoidable for the high-temperature sources because the thermodynamic expression of the solubility depends on the raw experimental data and on the way of considering the system's nonideality. At low temperatures and pressures the nonideality of the systems is small and it would be absolutely necessary to account for nonideality only when dealing with very precise experimental data.
The saturation solubility will be characterized by the two phases' Henry's constant, k o.
As the precision of the low-temperature solubility measurements is greater, by a factor of 3 or more, than that for measurements at high temperature, each set of data will be considered and evaluated separately.
The reevaluated low-temperature solubilities are compared with those from Wilhelm et al. 4
2. Thermodynamic Treatment The concept of saturation gas solubility implies that a
system is considered in which there are two coexisting phases in equilibrium. Usually the solubility data experimentally available are pressure, temperature, and concentration of the gas in the liquid, at eqUilibrium conditions. The concentration of the gas in the vapor phase is rarely an experimentally available datum.
The thermodynamic conditions for a binary liquid-va~ por equilibrium in terms of Henry's constant have been pre
sented, see O'Connel,9 and Alvarez et al.,10 and will there
fore not be given here. From the equality of the chemical potentials of the sol
ute in the vapor and liquid phase the Henry's constant, k 0,
can be defined as:
k 0 = (YPl/l2)exp rP
( - V2) dP. (1 ) rfx )pr RT
From the equality of the chemical potentials of the solvent in the liquid and the vapor phase, it follows that
[11(1- x)Pfl/lf exp S;r( V}/RT)dP] (1 - y) = (Pl/l
1) , (2)
where the symbols (see list) have the usual meaning. In order to calculate k 0 from the experimental data usually avail-
SOLUBILITY OF CARBON DIOXIDE IN WATER 577
able, namely P, T, and x, Eqs. (1) and (2) have to be solved simultaneously. The common assumptions for low temperatures and low total pressures and concentrations are that the activity coefficients rf and rf equal unity and that the partial molar volume, V2, equals the infinite dilution partial molar volume, V~ independent of pressure. These assumptions will be discussed and justified below.
The necessary fugacity coefficients for the vapor phase mixture, <Pi' and for pure water, <Pi, can be calculated once an equation of state, EOS, is chosen to represent the vapor phase. To assess the sensitivity of the derived Henry's constant to the choice of an EOS the following equations were selected: a three coefficient-virial EOS in densities (Vi); Peng and Robinson'sll mixture EOS (PR); Gibbons and Laughton's 12 equation (G); and Wonnald and Lancaster's 13
equation (W). Up to about 500 K all of the EOS gave variations of
about 1.5% or less in the calculated values of k 0. For details on the EOS, calculation procedures, and a discussion on the selection procedures, see Appendix 1.1.
Unce an EUS is selected, Eq. (2) is solved tor the composition of the vapor phase, y, by an iterative procedure described elsewhere (see Crovetto et af. 14)
The explicit pressure dependence of the solubility can
be accounted for either by using information on experimental partial molar volumes or by semiempirical perturbational methods (see Fernandez Prini and Japas. 15
) Details about the treatment of the pressure dependence are given in Appendix 1.2.
The assumed values of the activity coefficients and the partial molar volumes must be reviewed very carefully near the critical point of the solvent. See Japas and Levelt Sengers. 16 As these authors demonstrate, k 0 does exist and has a finite value at the critical temperature of the solvent.
A useful quantity in solubility and liquid/vapor equilibria is the isothermal distribution coefficient, K D , defined as
KD =y/x. (3)
The infinite-dilution coefficient, K~, is defined as
KC]; limy/x, (4) xo.o
and can be calculated from the same set of equations and assumptions already presented as
K~=ko/(Pf¢J~), (5)
where ¢~ is calculated from the selected EOS. In principle K r; win be known with the same precision as k (I hut the effect
ofthe selected EOS on the values of K}) and k 0, respectively, will be different.
Recently Japas and Levelt Sengersll> predicicd the limiting asymptotic thermodynamic behavior for /\ () and 1\" '.!/ and their temperature dependence near the critical lelilper;l
ture of the solvent. They demonstrated that asymptotically as T - Tc of the solvent the following linear correlations wiii apply:
Tln(k (l/If) = A + B(pl1iq* - Pel ).
TIn K ~h = 2B(~!:* - Pel ),
where
(6)
(7) or KD
2 (dP) _ c B(Rpc) = - = - av,x' ax V.Tc
The quantity a~,x is the second derivative of the Helmholtz free energy with respect to the volume and the concentration. This relevant derivative can be related to experimentally measurable initial critical-line slopes of the dilute solution and the pure solvent. (See Japas and Levelt Sengers. 16
) The strictly asymptotic Eq. (7) will be labeled KD for future reference. The fact that K~ must equal unity for T= Tc '
provides a valuable clue to whether the asymptotic behavior has been reached.
As stated by Harvey et al. 17 when dealing with experimental data the K ~ factor Eq. (7), gives a better estimate of the true asymptotic slope and a good agreement with the aC
vx from experimental critical-line data whereas the slope from the Henry's constant, Eq. (6), does not.
It is a fact that the hydration and dissociation of CO2 in
water cannot be separated from its dissolution. In this treatment the total CO2 dissolved is considered, regardless of the species present in solution. This assumption can be made because any species other than CO2 (aq) [the not yet isolated, so-called "carbonic acid" (H2C03 )aQ' the H+, and the HCO) ] in a solution of CO2 in water exist in negligible amounts. These species can be ignored because the ratio of the molalities of (H~C03)aq to CO2 is about 3/1000 at 298.15 K (Ellis I g). Also, experimental and theoretical arguments of Kruse and Franck 19 indicate that (H2C03 )a4 is not an important species at higher temperatures. The acidity constant of CO2 goes through a maximum value of 6.3 10-7
mol kg- I at 353 K and decreases at higher temperature, 20,2 I
so that the quantity of ionic species should become smaller as the temperature increases beyond 353 K. Whenever necessary, values for pure water properties such as P, If, and P r were taken from Haar et al.22
2.1. Temperature dependence of kO
Any formulation that attempts to cover the entire liquid range of the solvent should be consistent with the facts that the derivative {d In k o/dT)s diverges to w a~ T~ Tc , 16
that the infinite dilution solute partial molar isobaric heat capacity of dissolution in the saturated liquid, C~:2' diverges to + 00 as T - Tc. and that the valul' of k 0 at '/: is a constant equal to P r times ¢~ .
Several empirical eqlla! ions for tltl' dependence of k 0 on Tare in common lise: Clar~ and (ik'w;" Valentiner,24 Benson and KrallSl'. '.., and hT!l;inda" Prini and Crovetto.26
These represent;!1 ions perform well in narrow temperature intervals ,lnd;1 rl' 111)1 rl'C( Hllllll'llded for extrapolation outside t hl' it .. '1I1pcr;11 ore inkrv;)l lIsL'C1 in the fit.
Till' SilllPiv:-;( t'qllatioll that can represent within the est ii\l;ilnl (lv~:ralll'.\perillleIltaJ uncertainty the complete lowt<':llIpn;lfu!"e data set, was selected:
ltJ(kll/har) "-C;:" Ao+A1(T)-1 +A~(T)-2. (8) orP3
Thl' I hrl'c-krm polynomial, Eq. (8) will be labeled as P3. P3 ohviously does not fulfill the thermodynamics conditions at the critical poinl of the solvent.
For the high-temperature data set other equations were
J.iPnlYS. Chern. Reif. Data, Vot 20, No.3, 1991
518 ROSA CROVETTO
used. An empirical equation proposed by Alvarez et ai., 10
and by Fernandez Prini and Crovetto,27 that considers at least qualitatively some of the limiting features of kO, is
In(k ° /bar) = b( Te - n (n -I In [ (Te - n/Te]
+Ao +At(n- l +A2(n- 2•
(9) or P3 + b
where b is considered as a free parameter. to Equation (9), a three-term-polynomial plus a term leading to a diverging critical slope, will be labeled P3 + b. It does not predict the correct exponent of the temperature dependence and cannot be used for extrapolation beyond the fitted temperature interval in which data are available.
Recently, Krause and Benson28 presented a new threeparameter equation in fractional powers of the temperature for representing solubilities at high temperatures. This equation will be labeled KB3. The equation docs have the correct temperature dependence at the critical point.
Harvey and Levelt Sengers29 correlated experimental data for solubilities of several gases in water and other solvents with a three-term expression. Asymptotically, near the critical point, the dominant term is linear in the density of the solvent, as in Eq. (6).
Their philosophy is followed here in the develop of a new equation for aqueous CO2 , To obtain the correct limiting behavior as T - Te , the parameter of the term that would lead to the critical behavior is set equal to B. The coefficient B, Eqs. (6) and (7), can be obtained from fitting equation KD to infinite dilution distribution coefficient data, or from reliable experimental critical-line slopes, if available.
The proposed equation is
TIn (k 0/ if) = A ' + B (p~q* - Pel) + B I (p~q* - Pel) 2
+ CTp\iq* exp[ (273.15 - n/50]. (10) or DEN*2
Equation (10), a three-parameter equation with quadratic dependence on the pure solvent density, will be referred by means of the label DEN*2. In order to have an explicit formulation in terms of the temperature only, which would be easier to use for calculation purposes, Eq. (10) is reformulated. In order to change from the variable p to the variable T the asymptotic p T coexistence curve relationship combined with results of scaling laws for pure water was used. (See Levelt Sengers et al. 30) Thus, from the asymptotic relationship:
(p\iQ* - Pel )/pel = 2.105 [ (Te - DITe] 1/3, (11)
P as a function of Tcan be obtained. For simplicity, in Eq. ( 11 ), the true nonclassical exponent /3 = 0.326 has been rounded to 1/3 and the critical amplitUde from Ref. 30 has been slightly modified to counteract this change.
The fugacity of pure water in Eq. (10) can be expressed as a polynomial in inverse powers of T. Incorporating these two changes in Eq. (10) the simple three-parameter expression is obtained:
In(ko/bar) =BT (1- T#)I/3(T)-1 +Ao
+ A1(T)-1 +A2(T)-2,
(12) orT*(1/3)
J. Phys. Chern. Ref. Data, Vol. 20, No.3, 1991
to represent the solubility, where T# = T ITe' Note that the first term on the right is the term leading to the asymptotic critical behavior and is not adjustable. It equals
BT = 2.105pel B,
with parameter B obtained, as stated before, either from experimental distribution coefficients, KD equation, or from critical-line slopes. Equation (12) is labeled T* ( 1/3).
The equations KD, DEN*2, T* (1/3), and KB3 are all consistent with the thermodynamic limiting requirements for T-Tel •
3. Solubility of CO2 in Water 3.1. Literature Reviewed
All sources have been consulted that are cited from 1907 to 1989 in the Chemical Abstracts, the International Critical Tables, and Landolt Bomstein's Zahlenwerten und Funktionen (Volumes on Equilibrium).
The actual references used are presented in Table 1. The experimental data have been retrieved from these references and converted to a standard system of units of concentration, mole fraction of dissolved gas, x, total pressure, P, and temperature, T. In this way it is possible to conduct the thermodynamic treatment for all the sources on the same basis.
Sources that were not considered were those where only graphical results were presented or, in the case of the hightemperature data set, those from which the raw experimental data P, T,x could not be retrieved.
For the system CO2....Ji20 a wide range of temperature and pressure conditions were covered by numerous sources. In different ranges, the assumptions and approximations required to extract Henry's constants from the data, vary considerably. Also, the precision of the low-temperature measurements is usually larger than that ofthe high-temperature data set. The data sources were therefore separated into three groups, to be treated separately.
Group A: solubility measurements from 273 to 353 K, P < 2 bar. Group B: solubility measurements from 273 to 353 K, P> 2 bar. Group C: solubility measurements from 353 K up to the critical temperature of the solvent and at any pressure.
Because of this arbitrary division, some sources fit into more than one group. In those cases the data were partitioned between the groups in accordance with the range of pressures and temperatures.
3.1.a. Group A, Low Temperature, Low Pressure
This group has the largest number of original sources, namely 24, with a total of 235 data points. The solubility of CO2 in H20 at low temperatures, though thoroughly researched, lacks both the precision and agreement among different methods of measurements that have been achieved for other systems of inert gases in water at low temperatures. (For example, see 02-H20, Benson et al.25
)
Unfortunately, although the number of sources of solubility data at low temperatures is relatively large they do not

SOLUBILITY OF CARBON DIOXIDE IN WATER 579
TABLE I. Sources of data.
Group A (273 < T <353 K, P<2 bar)
AUS(63):
BO(891):
BO(899): BU(855):
BUC(28):
CRA(82):
CUR(38):
HAR(43):
KH(867):
KOB(35):
KOC(49):
KUN(22): LI(71):
MAR(41):
MOR(30):
MOR(31):
MOR(52):
MUR(71):
NOV(6t):
ORC(36):
PUW(lU):
PR(895):
SHE(3S):
VAN(39):
VE(855):
YEH(64):
Austin, W. H.; Lacombe, E.; Rand, P. W.; Chatterjee, M., J. AppL Physioi. 1963,18,301-304. (5:5) Bohr, c.; Bock, J" Ann. Phys. Chemie, NF 1891,44,318-343. (2;0) Bohr, c., Ann. Phys. Chemie 1899,68,500-525: (15:15) Bunsen, R. W. E., Philos. Mag. 1855,9, 116-130, 181-201; Gasometrische Methoden, Braunschweig 1857. The same experimental points are also published in: Bunsen, R. W. E., Justus Liebig's Annalen der Chemic (also Ann. Chern.) 1855,93, 1- 50. (6:5) Buch, K., Nord, Kemiskmotet (Finland) 1928, 184-192. (14:7) Cramer, S. D., Bureau of Mines Report of Investigations 1982, RI 8706. ( 1:0) Curry, J.; Hazelton, C. L, J. Am. Chern. Soc. 1938, 60, 2771-3. (4:2) Harned, H. S.; Davies, R., Jr., J. Am. Chern. Soc. 1943,65, 2030-2037. (18:18) de Khanikof, M. M. N.; Louguinine, V., Annales de Chimie et de Physique (Quatrieme Serie) 1867,11, 412-433. (10:1) Kobe, K. A.; Williams, J. S., Ind. Eng. Chern. (Am. Edition) 1935,7(1)' 37-38. (1:1) Koch, H. A., Jr.; Stutzman, L F.; Blum, H. A.; Hutchings, L E., Chern. Eng. Progress 1949,45(11), 677-682. (6: 1 ) Kunerth, W., Phys. Rev. 1922,2,512-524. (8:6) Li, Y. H.; Tsui, T. F., J. Geophys. Res. 1971, 76( 18),4203-4208. (5:5) Markham, A.; Kobe, K., J. Am. Chern. Soc. 1941,63,449-454. (3:3) Morgan, J. L R.; Pyne, H. R., J. Phys. Chern. 1930, 34, 1 "i7R-Rl (?~O)
Morgan, O. M.; Maass, 0., Can. J. Res. 1931,5, 162-199. (19:4) Morrison, T. J.; Billet, F., J. Chern. Soc. 1952, 3819-3822. (19:19) Murray, C. N.; Riley, J. P., Deep-Sea Res. 1971, 18, 533-541. (8:8) Novak, J.; Fried, V.; Pick, J., Collect. Czech. Chern. Commun. 1961,26,2266-2270. Measurements at different pressures at 8 different constant T From the slope of k vs x, k U is calculated. (8:0)# Orcutt, F. S.; Seevers, M. H., J. BioI. Chern. 1936,117, 501-507. (1:1) Power, (j. <.i.; :stegaU, H., J. AppL PhYSlO{Ogy, l'r/U, Z'J, 145-9. (1:1) Prytz, K.; Holst, H., Ann. Phys. Chemic, NF 1895, 54,130-138. (2:0) Shedlovsky, T.; MacInnes, D. A., J. Am. Chern. Soc. 1935, 57, 1705-10. (1 : 1 ) Van Slyke, D. D., J. BioI. Chern. 1939,130, 545-554. (6:6) Verdet, M.; report of Bum;en's, M., Ann. Chim. Phys. 1855, 43, 496--508. (2) :0) #
Yeh, S. Y.; Peterson. R. E .. J. Pharm. Sci. 1964, 53, 882-824. (4:3)
overlap over a temperature interval big enough to provide an unquestionable statistical description of the temperat ure dependence of the solubility.
In this group eleven different ways of expressing the solubility or the concentration of CO2 in water were found. The alphabetical listing of the sources in this group is given
Group B (low temperature, 273 < T < 353 K, P> 2 bar) This group was not considered in the formulation.
KRI(35): Kritsehewsky, I. R.; Shaworonkoff, N. M.; Aepelbaum, V. A., Zeit. Phys. Chern. A 1935, 175, 232-238. i, P: 5-30 bar, (2:0).
MAT(69); Matuu1;, J.; Subr, J.; Novak, J. P.; Pick, J., ColI. Czech. Chern. Comm. 1969, 34, 3982-3985. ii, P: 9-39 bar, (3:0).
SHA(82): Shaiachmetou, R. A.; Tarzimanov, A. A., Dep. Doc. 1981, SPSTL 200-khp-D81, 1982. ii, P: 100-400 bar, (1:0).
STE(70): Slewarl, P. B.; Munjal, P., J. Chern. Eng. Data 1970, 15, 67-71. ii, P~;:::; 10,40 bar, (12:0).
VIL(67): Viku, R.; Gainar, I., Rev. Roum. Chim. 1967,12(2), 181-189. ii, P~;::;;25,70bar, (20:0).
WIE(30): Wiebe, R.; Gaddy, V. L., J. Am. Chern. Soc. 1939,61, 315-318. i, P: 25-700 bar, (2:0).
WIE(40): Wiebe, R.; Gaddy, V. L., 1. Am. Chern. Soc. 1940,62, 815-817. i. P: 25-500 bar. (5:0).
ZAW(81): Zawisza, A.; Molesinska, B., J. Chern. Eng. Data 1981,26, 388-391. ii, P2-;:::;:.25 bar, (9:0).
Group C (T> 373 K, any P)
BO(891): Bohr, c.; Bock, J., Annalen der Physik und Chemie, NF 1891. 44,318-343. ii, 373 K, (1:0).
CRA(82): Cramer, S. D., Bureau of Mines Report of Investigations 1982, RI. ii, 399-486 K, (6:2).
CRO(90): Crovetto, R., Wood, R. H., Fluid Phase Equilibria, to be submitted. ii, i, P: 170-220 bar, 623-640 K, (3:3).
ELL(63): Ellis, A. J.; Golding, R. M., Am. J. Sci. 1963,261,47-60. ii, 450-607 K, (15:14).
MAL(59): Malinin, S. D., Geokhimia 1959,3,235-45. i, P:I00-500 bar, 473-603 K, (4:2).
SHA(82): Shaiachmetou, R. A.; Tarzimanov, A. A., Dep. Doc. 1981, SPSTL 200 kph D81, 1982. i, P; 100-800 bar, 373-423 K, (2:2).
TAK(65): Takenouchi, S.; Kennedy,G. Am.J. Sci. 1965,263,445-454. i, P: 200-1400 bar, 423-623 K, (5:4).
WIE(39): Wiebe, R.; Gaddy, V. L., J. Am. Chem. Soc. 1939,61, 315-318. i, P: 25-700 bar, 373 K, (1:1).
ZAW(81): Zawisza, A.; Molesinska, B., J. Chern. Eng. Data 1981,26, 388-391. ii, 373-473 K, (24:24).
The meaning of the symbols used in the table is as follows: For group A: the numbers in parentheses, (m:n), are: In the !lumber of
experimental points given in the source, and 11 the number of points actually conSIdered in the evaluation.
For Groups Band C: i, several isothermal solubililY measurements are available for different pressures. When feasible. a graphical extrapolation for Henry's constant, k to solvent vapor pressure was performed. The numbers in parentheses, (l11:n). are: m is the Ilumherofk O'sobtainablefrom the source, n is the number actually considered. ii. ollly one pressure, or a very small pressure range, was expl.·rillll.·nlally studied in the source. The number in parenthest!s. (111:11). arc: 11/ ill I hi:- cast' is Ihe number of experimental point~ infornl<.:d. 1/ i~ 11.,' 'Hilli/)' r Ill' p"iUb \,;ull:-.idcICU ill tlte ev1:tlua
tion. The experimental partialillolar volulIll' of Ihe solute is considered for calculating k /I in Eq. ( I ).
In group C the rall)!'l' ur /' and T of Ihe measurements are given, in group B. (,"ly 11. ... , r:II1t'-~' of }'.
ill Table I togct her with information on the number of data points in each source and the number of data actually considered in our formulation. Details of the approximations involved in the calculation of k 0 from Eq. (1) for this group are presented in Appendix I.l.a.
All the available sources and a standard procedure of
J.l?hys. Chern. Ret Datal, You. 20, No.3, 1991
580 ROSA CROVETTO
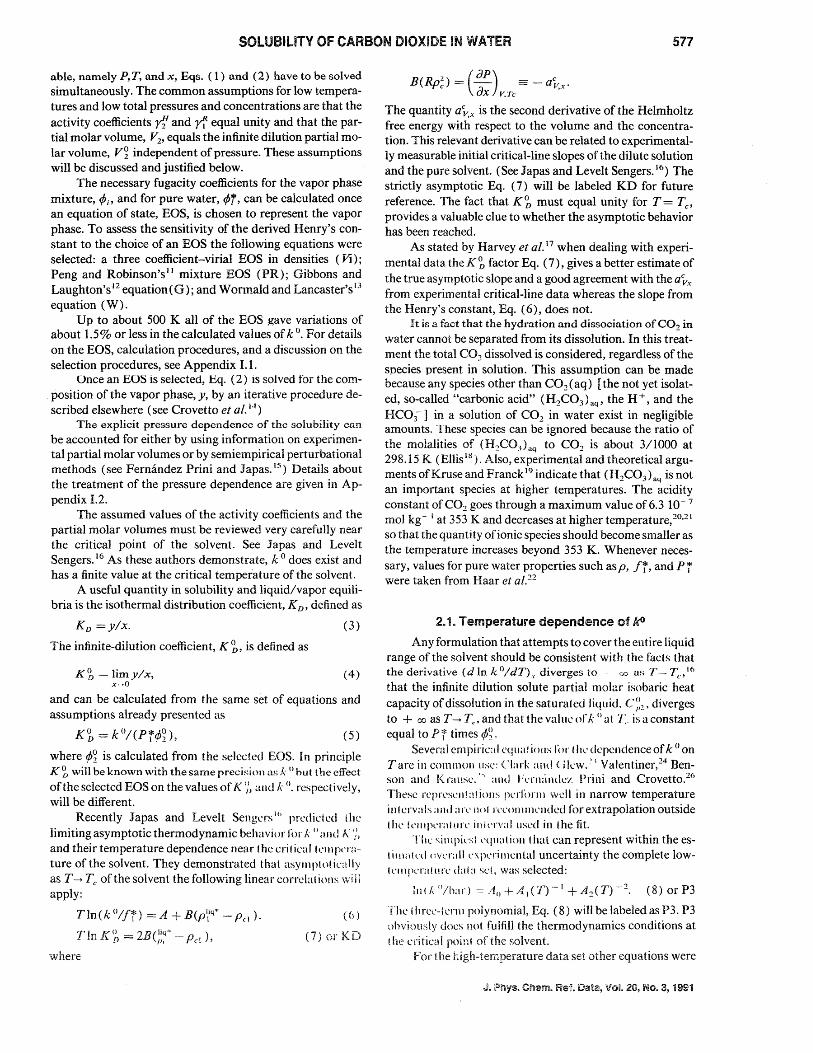
TABLE 2. Adjusted coefficients for the equations P3, P3 + b, KD, DEN*2, T* ( 1/3). The last four ones, have been fitted to values of k 0 calculated from PR and W EOS. [Coefficients informed for P3, P3 + b, T* ( 1/3) are for k 0 in bar. ] The last column, %u, is the % standard deviation of the fit for k 0 values.
Equation Ao
P3 4.800
P3+b b EOS:PR - 3.608
:W - 3.341
KD
EOS:PR :W
A/K
3934.40
Ao 4.610 4.515
2B K. (mollliter) - 1
91.22 90.55
A/K 2849.08 2999.98
coef.sd.dev
0.18 0.20
- 941290.2
A2/K2 - 833050.2 - 852 374.3
%0-
1.1
3.9 4.1
8.6 9.5
DEN*2 A' K
994.85 1033.29
BI K(mollliter) -2
C (mollliter) -I
-0.0174 EOS:PR :W
D fiACU tu 45.54 K(mulllitcI) -I in buth.
T*(l/3) EOS:PR
:W low + high T(PR)
BT fixed to 1713.53 K for all.
Tr = 647.126 K, Pc = 17.874 mol/liter.
Ao 3.875 3.584 3.982
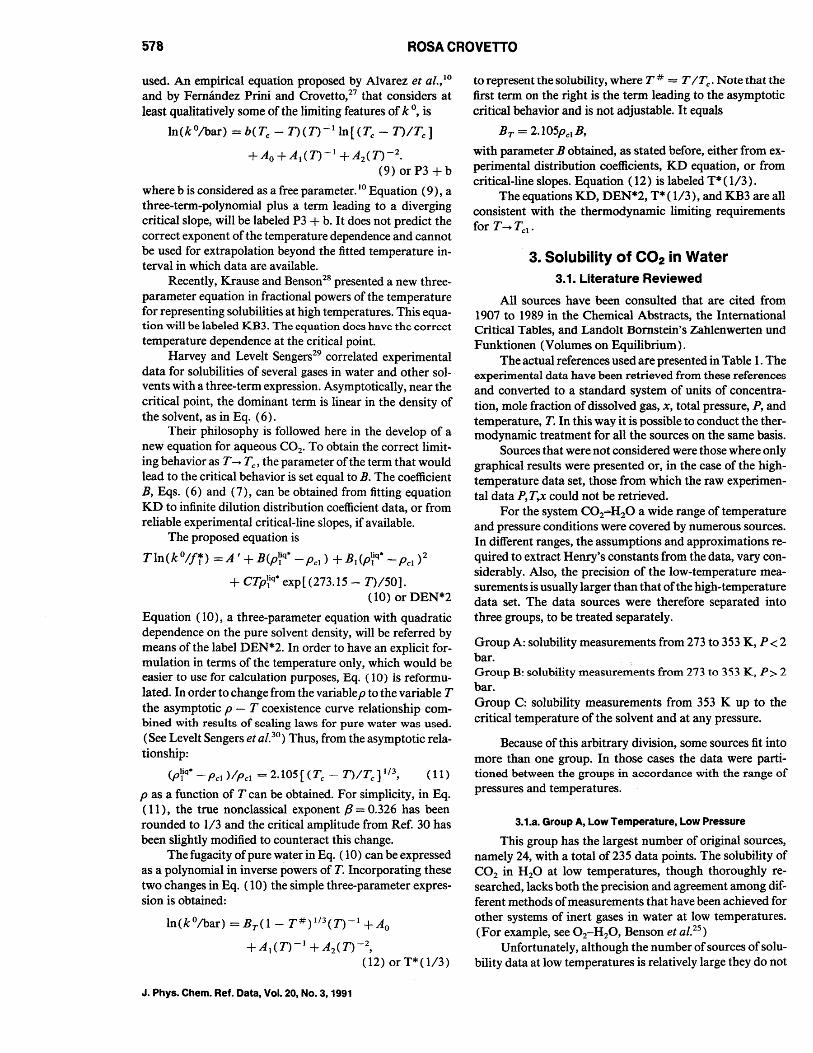
point rejection (see Appendix II) have been used. After studying the reSUlting preliminary nonrejected data deviation plot I have discarded those sources that, although on average in agreement with other data, contribute large scatter. Specifically these were the data by Novak, NOV(61), and Verdet, VE(855).
For the remaining data equation P3 was used as the fitting equation. The optimized coefficients of the unweighted fit and the standard deviation of the fit are given in Table 2. P3 is to be used from 273 to 353 K. No extrapolation beyond the temperature interval is recommended.
The data measured by Weiss,7 which were included in the review of Wilhelm et al.,4 have not been considered here because the original raw data cannot be retrieved from the published k () values.
The major differences between this review and Wilhelm et al.4 are: the number of sources considered, the data treatment, and the fitting equation used.
Wilhelm et al. took into account only three sources: Morrison and Billet,S Murray and Riley,6 and Weiss.7 In this evaluation instead twenty four original sources that, after the rejection criteria, resulted in nineteen sources are considered. Weiss7 measured solubility only at about 20.6 °C and had corrected his data for the nonideality of CO2 and for ionization. Weiss also corrected and recalculated the data of Murray and Riley6 and fitted them to an equation. It is these recalculated values that were used by Wilhelm et al.,4 instead of the original ones. Wilhelm et al. also used only eight of the nineteen original Morrison and BilletS data points. For expressing their results they used a 4-parameter Clarke and Glew 23 type of equation, obtaining a percent standard deviation, a%, of 0.54 for the fit.
Calculated Henry's constant from the same original sources used by Wilhelm et al., were fitted with a 3-param-
0.5129 0.4786
AI/K 3680.09 3886.17 3555.40
- 0.0165
A2/K2 1198506.1 1234227.6 1169899.3
5.2 5.2
5.0 5.3 3.8
eter equation, P3. The percent standard deviation, a%, of the fit is 0.57, which is only marginally larger than that of Wilhelm et al. Adding more terms to P3 is not statistically significant.
Table 3 presents smoothed values of In k 0 calculated from P3, at selected temperatures. Values of In k 0 are tabulated for: all the nineteen sources considered, only Morrison and BilletS and Murray and Riley6 adjusted to a P3 equation, and the corresponding values calculated from the equation of Wilhelm4 et al.
As can be seen from the Table 3, there is almost no difference between In k 0 values obtained with P3 fitted to all the sources, as compared to P3 fitted to only two sources. There is, however, a difference with Wilhelm et al.'s values that increases with temperature. The divergence is as much as 2% lower than our prediction at the highest temperature of the fitting interval, 353 K, and represents three and one-
T AHLl:. 3. Values fur In k 0 calculatcu at uiffclcnt tCIIlpclatun::s, fl-om Eq. P3, for all the sources P3(all); for the two sources Morrison and Billet5 and Murray and Riley, 6 P3 (2); and from the equation of Wilhelm et al.4
In(ko/bar) TIK P3(all) P3(2) Ref. 4
273.15 6.588 6.594 6.600 283.15 6.955 6.958 6.962 293.15 7.268 7.270 7.274 303.15 7.536 7.537 7.542 313.15 7.765 7.766 7.771 323.15 7.961 7.962 7.964 333.15 8.129 8.130 8.127 343.15 8.272 8.274 8.262 353.15 8.393 8.397 8.372
SOLUBILITY OF CARBON DIOXiDE ~N WATIER 581
half times the standard deviation of any of the individual fitting equations.
These differences between the results from the lowest and the highest temperature of the interval, 273 and 353 Kin this case, is a well-known problem when empirical equations are used. The origin if the different curvatures in the equations used to represent Henry's constant as a function of temperature. The difference in number of sources considered or the data treatment cannot be the cause as the result of
0.05
0.04-
0.03 il
0 Dv
.... ~ V to 0.02 V v ()
0 villi iii!!
~ A A !I <> <>. v v
fitting to P3 the same sources as Wilhelm et al. shows (third column in Table 3).
In contrast to Wilhelm et al., I have used data obtained by several different experimental methods, with about the same estimated precision and reproducibility. Systematic errors characteristic of one particular experimental technique have less of an opportunity to bias the fitting equation if data from many different origins are fitted simultaneously.
Equation P3 is chosen to fit all the data sources (Table
0 q
A V III
m <>
~ s:: 0.01 81 ..... :IE .. :K vv A A
()
rl ~ <> M. ~ ~!f
~ 0<> I e • e ~ H7 )( )( x )(
0.00 GI 11
011 <> :II v v! I rI :~i!!. ~
~ :tt -61 1Il
I KG ~ II) -D.01 " 2 0 • $ 0 <> v JI lit e ~ <> Xl!. + li
, t1 s:: -0.02 • 0 a
r-f <> Ili <> ~ 0
+ ~ -0.03 <> x
-0.04
-0.05
(a) 263.15 273.15 283.15 293.15 303.15 313 • .15 323.15 333.15 343.15 353.15 TIl{
0.05
0.04-
0.03
0 0 ~
~ 0.02
v III
~ ... A v
0 0
Il!/ I!I
~ vGl .1 A
'1/ v )i s::: 0.01 ill ~ v V A
B )( )( )( r-I til X A
A i., )(
B ~ <> <> .I!. )(
)oE )(
)( x 0.00 011
II' e vi Ill' t. &l * ~ n tl" E rl 01. II' B Ii! Ell QI -0.01 QZ \II )( Ii
II! 0 V liI 7l E9 If e ~
., ill )(ji1
s:! + lit II
rl -0.02 ~ E9
I!:l 0
-0.03
-O.Oi-
(b) -0.05 1 ._,-1 1 263.15 273.15 283.15 293.15 303.15 313.1:. :t:·:Lf!, : t: ~: t. I : • :t·::LE") 353.15
T/K
FIG. 1. Deviation plot, as [In(k °/bar)e,p - In(k O/bar)"ak ] versus tcmperallll"l' I'm (ii"!lIlp ;\. hi. ( :.;). 1'.\ (:1) \\iIIJ NIli'ak ('I ul .• NOY(61), and Verdet el
al.. VE(855) and (b) without them. (c) Only (wo sources L'ollsidnl'lL S\lIlh"I~, ;11\' ;1" ""Iu,",,,: I I SIlEC~5). 0 POW (70). 6. AUS(63), + CUR(38), X MOR(30). 0 NOV(61). V KUN(221. [.J \TH(()-~).;: i'-:j( .11\( '1.1). + rvl/\!<.(-~ll. ,1' Ill .. R(43). :iii: VAN(39). m ORC(66).
®KOB(35), 1aIKOC(49). OI~/j()R(.~l). i~,I\HW(7!1. <~.'I!(7j). \.·\$ii(~;nl. E !t(\(:;<lt»). 1·lrRO~()5)."t.· KH(867). <)VE(855). '0/ !8UC(28).
582 ROSA CROVETTO
.OS~-----r------~-----'------r------,
.03 - -
~ .01~---------o-------------------~
o 0.08 • ° ° ° ~ _ 00 ° ° .E ~ • • 0 ., u u u
1= -.01 t- 0 -o r---------------~-------------~
.E
(c)
-.03 r-• MUR(71)
° MOR(52) -
-.05 L..-__ ....L' ___ ...L.i ___ il.-.-__ "",,--, __ --'
273.15 291.15 309.15 327.15 345.15 363.15
T/K FIG. 1. Continued
3, column 2) and to generate smoothed solubility data for anchoring the low-temperature end of the high-temperature formulation. In Table 4 the recommended values of k 0 for the low temperature data set are given.
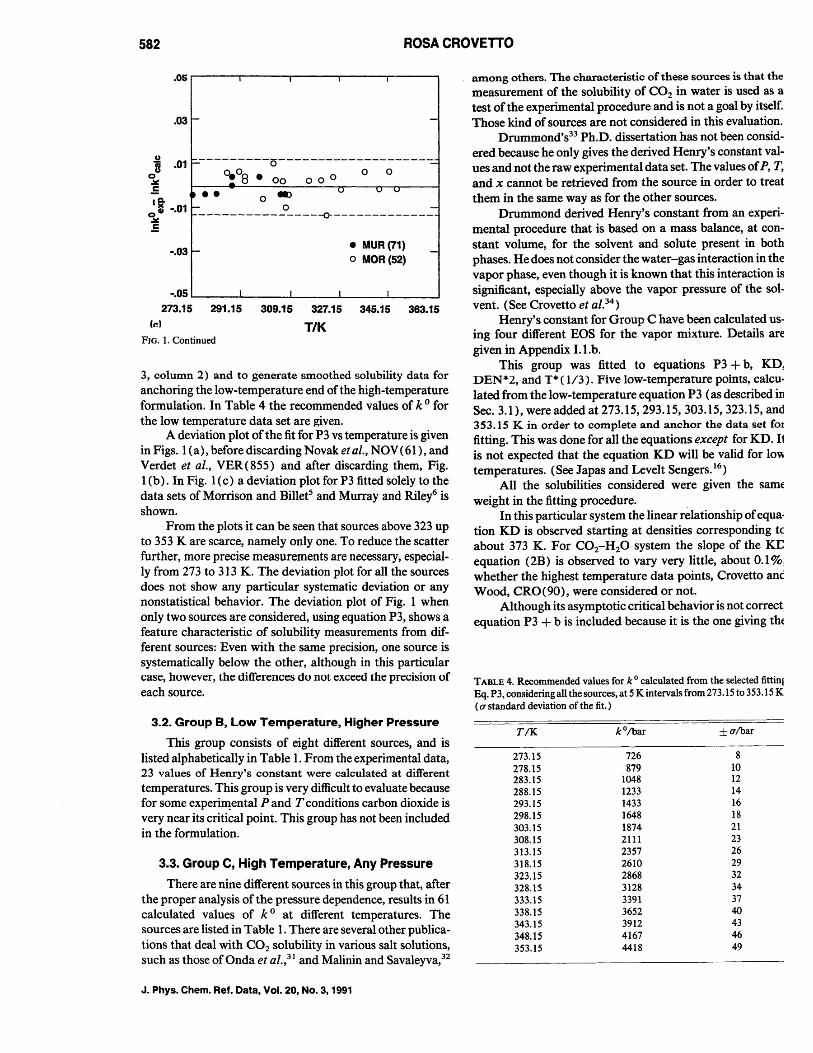
A deviation plot of the fit for P3 vs temperature is given in Figs. 1 (a), before discarding Novaketal., NOV(61), and Verdet et aI., VER(855) and after discarding them, Fig. 1 (b). In Fig. 1 (c) a deviation plot for P3 fitted solely to the data sets of Morrison and BilletS and Murray and Riley6 is shown.
From the plots it can be seen that sources above 323 up to 353 K are scarce, namely only one. To reduce the scatter further, more precise measurements are necessary, especially from 273 to 313 K. The deviation plot for all the sources does not show any particular systematic deviation or any nonstatistical behavior. The deviation plot of Fig. 1 when only two sources are considered, using equation P3, shows a feature characteristic of solubility measurements from different sources: Even with the same precision, one source is systematically below the other, although in this particular case, however, the differences do not exceed the precision of each source.
3.2. Group B, Low Temperature, Higher Pressure
This group consists of eight different sources, and is listed alphabetically in Table 1. From the experimental data, 23 values of Henry'S constant were calculated at different temperatures. This group is very difficult to evaluate because for some experilI!ental P and T conditions carbon dioxide is very near its critical point. This group has not been included in the formulation.
3.3. Group C, High Temperature, Any Pressure
There are nine different sources in this group that, after the proper analysis of the pressure dependence, results in 61 calculated values of k 0 at different temperatures. The sources are listed in Table 1. There are several other publications that deal with CO2 solubility in various salt solutions, such as those ofOnda et al.,31 and Malinin and Savaleyva,32
J. Phys. Chern. Ref. Data, Vol. 20, No.3, 1991
among others. The characteristic of these sources is that the measurement of the solubility of CO2 in water is used as a test of the experimental procedure and is not a goal by itself. Those kind of sources are not considered in this evaluation.
Drummond's33 Ph.D. dissertation has not been considered because he only gives the derived Henry's constant values and not the raw experimental data set. The values of P, T, and x cannot be retrieved from the source in order to treat them in the same way as for the other sources.
Drummond derived Henry's constant from an experimental procedure that is based on a mass balance, at constant volume, for the solvent and solute present in both phases. He does not consider the water-gas interaction in the vapor phase, even though it is known that this interaction is significant, especially above the vapor pressure of the solvent. (See Crovetto et al.34
)
Henry's constant for Group C have been calculated us· ing four different EOS for the vapor mixture. Details are given in Appendix 1.1.b.
This group was fitted to equations P3 + b, KDl DEN*2, and T* ( 1/3). Five low-temperature points, calculated from the low-temperature equation P3 (as described ill Sec. 3.1), were added at 273.15, 293.15, 303.15, 323.15, and 353.15 K in order to complete and anchor the data set fOI fitting. This was done for all the equations except for KD. 11 is not expected that the equation KD will be valid for 10\\
temperatures. (See Japas and Levelt Sengers. 16)
All the solubilities considered were given the same; weight in the fitting procedure.
In this particular system the linear relationship of equa· tion KD is observed starting at densities corresponding tc about 373 K. For CO2-H20 system the slope of the KE equation (2B) is observed to vary very little, about 0.1 % whether the highest temperature data points, Crovetto anc Wood, CRO(90), were considered or not.
Although its asymptotic critical behavior is not correct equation P3 + b is included because it is the one giving th(
TABLE 4. Recommended values for k ° calculated from the selected fittin! Eq. P3. considering all the sources, at 5 K intervals from 273.15 to 353.15 K (0' standard deviation of the fit.)
TIK kO/bar ± O'/bar
273.15 726 8 278.15 879 10 283.15 1048 12 288.15 1233 14 293.15 1433 16 298.15 1648 18 303.15 1874 21 308.15 2111 23 313.15 2357 26 318.15 2610 29 323.15 2868 32 328.15 3128 34 333.15 3391 37 338.15 3652 40
343.15 3912 43 348.15 4167 46 353.15 4418 49

SOLUBILITY OF CARBON DIOXIDE IN WATER 583
TABLE 5. Values of In(ko/bar) obtained by means of different EOS, PR, and W, and smoothed by the Eq. DEN*2, T* (1/3) and KD.
In(kO/bar) DEN*2 T*(1/3) KD
T/K PR W PR PR W
353.15 8.412 8.405 8.415 368.15 8.534 8.528 8.544 383.15 8.612 8.613 8.632 8.674 8.660
398.15 8.669 8.669 8.687 8.694 8.683
413.15 8.696 8.699 8.715 8.695 8.689
428.15 8.703 8.709 8.721 8.683 8.682 443.15 8.692 8.701 8.708 8.658 8.662 458.15 8.666 8.679 8.679 8.623 8.633 473.15 8.627 8.643 8.636 8.579 8.594 488.15 8.577 8.596 8.582 8.526 8.547
503.15 8.515 8.538 8.518 8.465 8.492 518.15 8.443 8.470 8.445 8.397 8.431 533.15 8.361 8.391 8.363 8.322 8.363
548.15 8.268 8.302 8.271 8.239 8.288 :563.1:5 8.163 8.200 8.171 8.149 8.207
578.15 8.043 8.083 8.060 8.050 8.118
593.15 7.905 7.949 7.935 7.940 8.020 608.15 7.741 7.788 7.790 7.798 7.911 623.15 7.531 7.582 7.611 7.632 7.783
638.15 7.216 7.271 7.344 7.381 7.514 643.15 7.037 7.094 7.187 7.231 7.215 647.10 6.601 6.661 6.791 6.675 6.414
Tc: 647.126 K
smallest standard deviation. P3 + b should not be used to extrapolate outside the temperature interval considered to adjust its coefficients, 273-642 K.
Denson and Krause's28 three-parameter equation,
KB3, has been tried to fit the values ofln k 0 vs T. The standard deviation of the corresponding fit is about 16%. This is not considered a satisfactory representation for this system and therefore, the corresponding coefficients are not given.
The adjusted parameters for equations P3 + b, KD, DEN*2, T* (1/3) obtained by using different EOS for calculating the vapor phase nonideality are presented in Table 2 together with the % standard deviation, a%, for k 0. For details on the EOS see Appendix 1.1. Smoothed values for Henry's constant from KD, DEN*2 for Wand PR EOS and
T* (1/3) for W, at intervals of 15 K from 353 to 647.1 K are given in Table 5. Table 5 illustrates differences observed in In k 0 for different fitting equations and EOS. For a given equation, the variation in k 0 above 500 K due to the use of two different EOS (marked PR and Vi) for the vapor phase amounts to several percent (Table 5, compare columns 2 with 3 and 5 with 6). Also, for different fitting equations and the same EOS for the vapor phase, the variation in k 0 is inside the fitting uncertainty but above 608 K becomes very large (Table 5, compare columns 2, 4, and 5),
The standard deviation of this fit is about three times that obtained at low temperatures.
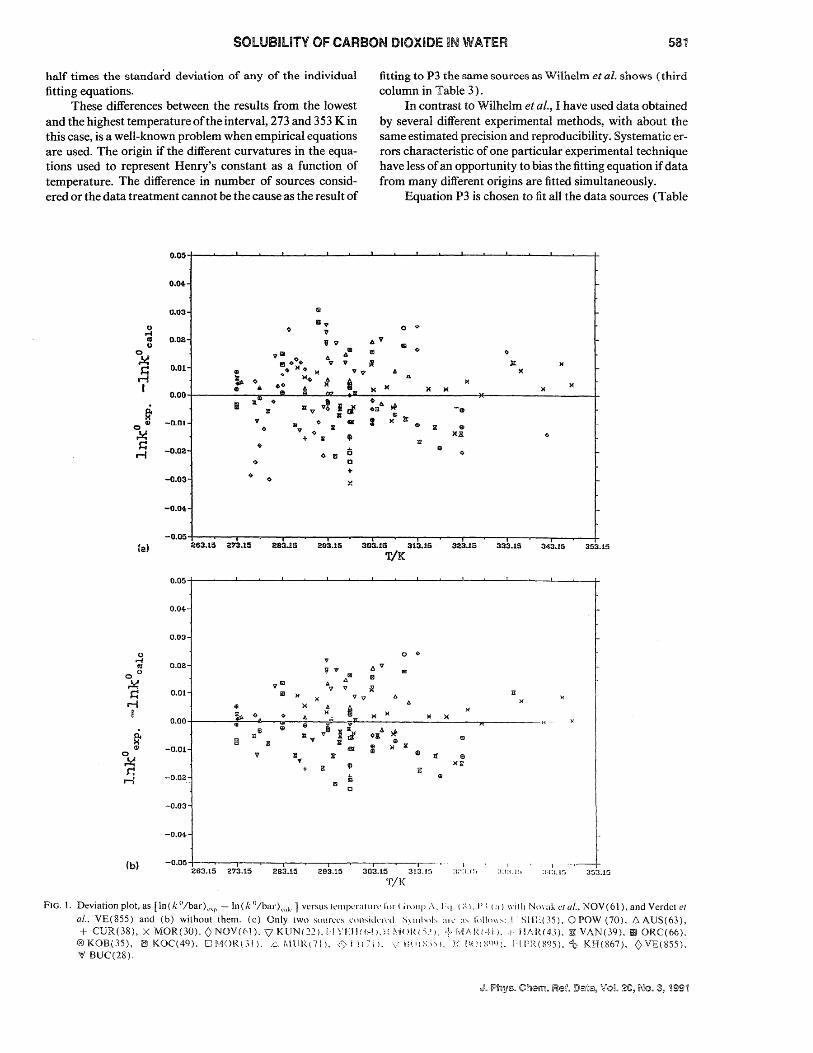
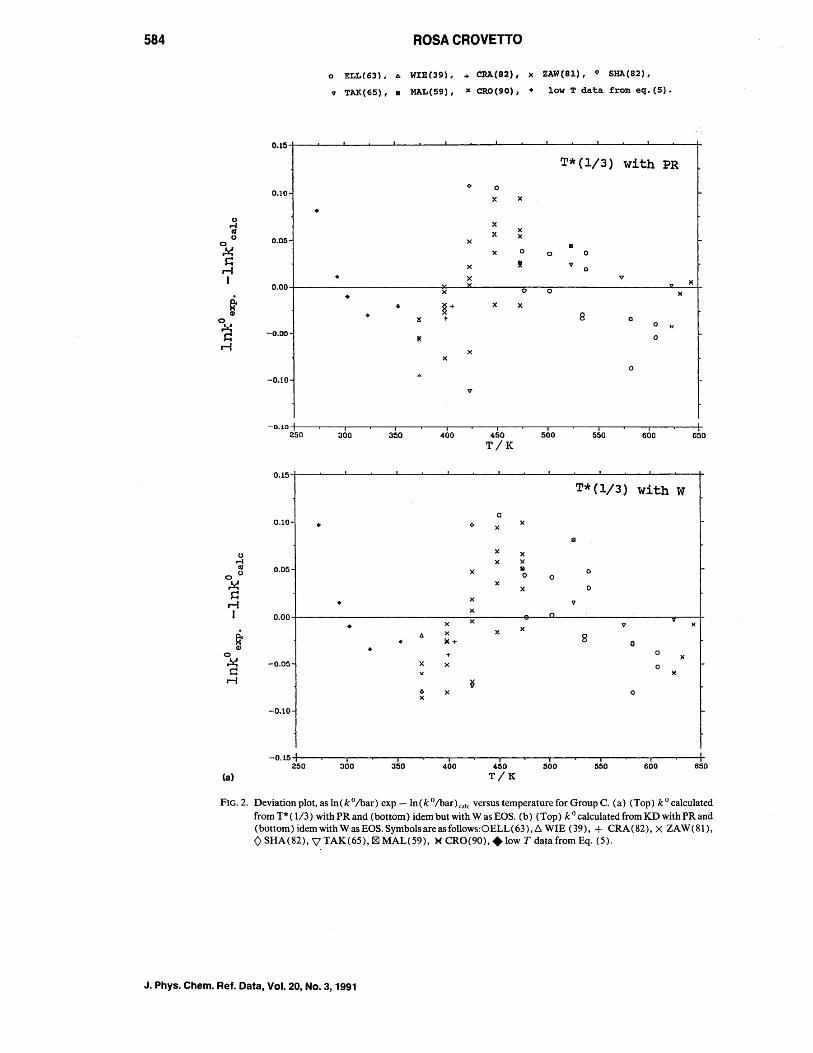
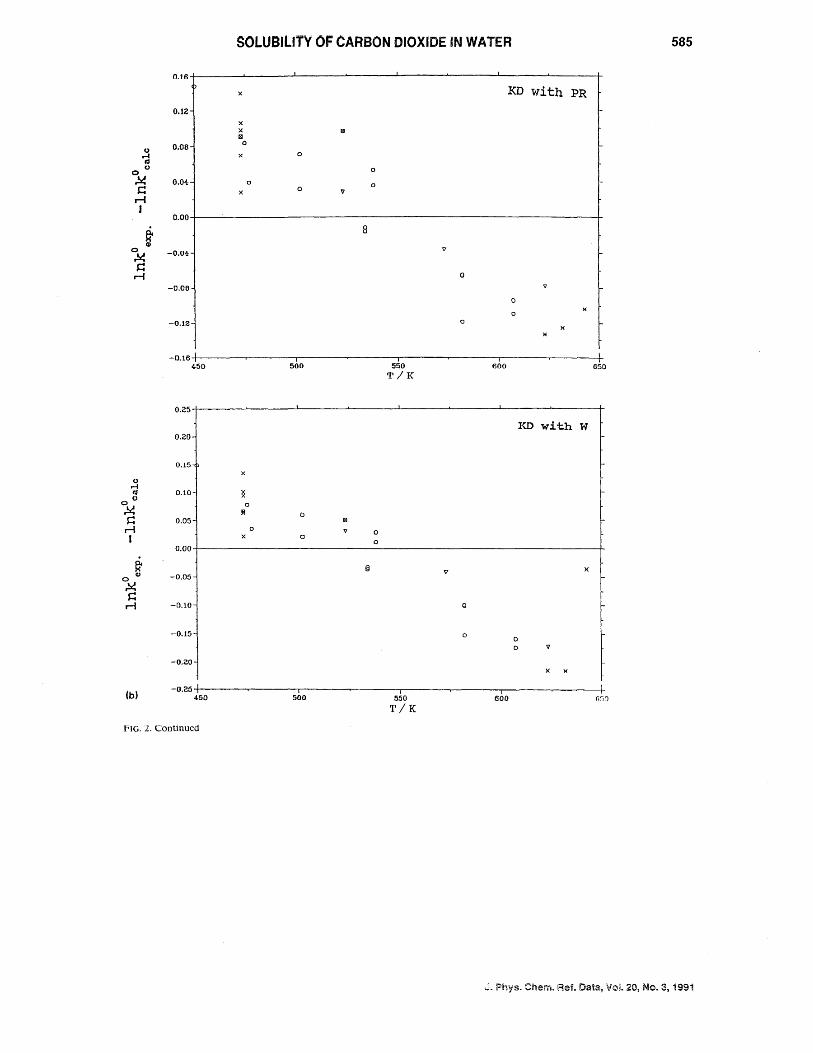
As no qualitative differences are observed in the residual distribution versus temperature for the equations used in the fit of Group C, only deviation plots as a function of the temperature for KD and T* ( 1/3) using both PR and W EOS are presented in Figs. 2(a) and 2(b), respectively.
The overall shape of the deVIatIOn plots IS the same independent of the fitting equation and/or the EOS used. The conclusion is then that the pattern must probably be due to systematic differences among data scts.
All fits seem to represent the data well but they do differ somewhat in the standard deviation found.
An attempt was made to represent all available experimental points at both low and high temperatures with T* ( 1/ 3 ).
For the calculation of the high-temperature k 0, the PR EOS was used.
T* ( 1/3) is selected because it already has terms of the same mathematical type, three terms in inverse of power of temperature, as the expression used to fit the low-tempera
ture solubility P3. No weighting procedure was used. The percent standard deviation obtainable is 3.8,
whereas the one for high temperature is 5.0 and for the low temperature is 1.1. However as the precision and the n um ber of points in each temperature region are so different, the representation is definitely biased by the greater numher or experimental points in the low-temperature region. MallY or the high-temperature points have in this represent:li ion a residual that is two or three times the standard (kvi;1i ion of the fit. The adjusted coefficients are given in T<lbk 2.
584 ROSA CROVETTO
o ELL(63). b. WIE(39), + CRA(82), x ZAW(8l), 0 SHA(82),
v TAK(65), • MAL(59), x CRO(90), • low T data from eq. (5) •
0.15
T*(1/3) with PR
0 0 0.10
X x
• U x ,...f III X
x u 0.05 x x
0 II!I ~ X 0 0 0 s:: x !Ie v r-i 0
I • x v 0.00 x v )(
X 0 0 )(
~ • • ~+ x x
CD • 8 0 ~ + 0
.!< 0
s:: -0.00 )( 0
r-i x x
0
-0.10 V
-0.1::; I I I I I I I I I 250 300 350 400 450 500 550 600 650
T/K
0.15
T* (1/3) with W
0 0.10 • <> x X
II!I
U X x
,...f x x lIS 0.05 x II 0
0 u 0 0
~ x 0 X s:: x
r-i • v
J x n 0.00 x x v
v )( • x
~ A x x
8 • ~+ (I Q) • 0 0 + )(
~ -0.00 x x 0 C )(
r-i ~ () x 0 x
-0.10
-0.15 I I I I I I I I I 250 300 350 400 4.50 500 550 600 650
(a) T/K
FIG. 2. Deviation plot, as In(ko/bar) exp -In(ko/bar)ca'c versus temperature for Group C. (a) (Top) kO calculated from T* ( 1/3) with PR and (bottom) idem but with Was EOS. (b) (Top) k ° calculated from KD with PR and (bottom) idem with Was EOS. Symbols are as follows:OELL( 63), D:.. WIE (39), + CRA (82), X ZA W (81), o SHA(82), \l TAK(65),!8I MAL(59), )( CRO(90), + low T data from Eq. (5).
J. Phys. Chem. Ref. Data, Vol. 20, No.3, 1991
SOLUBlLlTV OF CARBON DIOXIDE IN WATER 585
0.t6
x KD with PR
0.12 x x iii I!II
0.08 0
u ~ 0 lIS
0 U 0
~ 0.04- 0 0 s:: x 0 V
r-I I
0.00
~ 8 CD v 0 -0.04:
~ s:: r-i a
-0.08
0 )(
0
-0.12 0 Jo(
)(
-0.16 I J J J I 450 500 550 600 650
T/K
0.25
I<D with W 0.20
0.15 x
U .-r cu 0.10 ~ U
0 0
~ R 0 s:: 0.05 I!II
r-l 0 v 0 I x 0
0 0.00
~ § v 0
CD -0.05
~ s:: r-l -0.10 0
-0.15 0 0 0 V
-0.20 x )(
(b)
T K
FIG. 2. Continued
J. IPlhys. Chern. Ref. Data, Voi. 20, No.3, 1991
586 ROSA CROVETTO
4. Conclusions From the evaluation of the existing solubility data for
this system it can be concluded that more precise measurements, of the quality of those of Benson et 01.,25 are needed in the low-temperature region, 273 < T < 353 K, if a precision similar to that of other gases in water is desired.
For the high-temperature range there is a need for more precise, reproducible measurements, especially near the minimum of the solubility (at about 400 K), and also for the range above 500 K. As results of this evaluation show, however, in order to obtain reliable values for k ° above 500 K one needs not only more exact and precise measurements, but in addition to have a reliable EOS for the vapor phase of the <:02-water system that could give the correct fugacity coefficients for the solute in the vapor phase. As can be seen in Table 5, above 500 K, the use of different and reasonable guesses of EOS for the vapor phase produces an uncertainty which slowly increases with the temperature and that can be as high as 8% in kO at 643 K. Also, the use of different representative equations, with k ° values calculated from the same EOS, predict slightly different values, with 1 %-5% ~ncertainty in k ° up to 608 K. The difference in predictions mcreases greatly from 608 K and upwards being as large as 20% at 647.1 K.
Combining all of these factors, for the Henry's constant values, k 0, for this system between 273 and 353 K, an uncertainty of 1 % is estimated; and between 353 and 600 K an uncertainty of about 5%-10%. For temperatures above 600 K the uncertainty increases very quickly to at least 20% near the critical point of water.
For calculating a low temperature, 273 to 353 K, Henry's constant P3 is recommended, which was fitted to all the sources. The corresponding coefficients are reported in Table 2. The equation is reproduced here together with the corresponding %a, in k 0, of the fit.
In(ko/bar) = 4.800 + 3934.40(T IK)-l
- 941290.2(T IK)-2, %a= 1.1.
. For calculating Henry's constant above 353 K, T* (11 3) IS recommended, fitted to Henry's constants obtained with the use of the Peng and Robinson equation of state. Although the corresponding coefficients are listed in Table 2, the equation and the percent standard deviation in k 0 are repeated here.
In(kO/har) = 1713.53(1 - T#)1/3(T IK) I
+ 3.875 + 3680.09(T IK)-l - 1198506.1
X (T IK)-2, %a= 5.0
where T# = T ITc •
The recommendation is based on the fact that it is not only a very simple equation to use, but is the equation that gives the smallest rms deviation when k ° values are compared with predictions of k ° calculated from the KD equation, with coefficients adjusted for PR EOS, and combined with Eq. (5). With this statement it is implicity assumed that equation KD can give the most reliable estimates for the solubility, especially at high temperatures.
Equation DEN*2 is also suitable, but requires input of densities and fugacity coefficients for pure water.
The ultimate goal of a representation of all data, both at low and high temperatures, within the precision of the individual measurements, with only one equation could not be attained.
5. Acknowledgments The author would like to acknowledge John Gallagher
for assistance and guidance with computer programs and facilities and also for making available the use of the program for the Haar24 et al. EOS for pure water. The author is grateful to A. Harvey for useful discussions and assistance with computer programs. I also would like to thank J. M. H. Levelt Sengers for encouragement with the project, many helpful discussions, criticism, and critical review of this manuscript as well as for the useful suggestions that gave birth to equations DEN*2 and T* ( 1/3). L. Weber commented on equation fitting philosophies. P. T. Eubank provided information about water CO2 virial coefficients. Thanks to C. J. Wormald for discussions and useful information about the cubic equation for water-nonpolar mixtures and R. Battino for useful discussions, comments, and careful revision of the manuscript. This work received support from the Office of Standard Reference Data.
6. References IR. w. E. Bunsen, Philos. Mag. 9, 116, 181 (1855). 2D. D. SIyke, J. BioI. Chern. 130, 545 (1939); ibid. 73, 121 (1927). 3D. D. Yan Slyke and J. M. Neill, J. BioI. Chern. 61, 523 (1924). 4E. Wilhelm, R. Battino, and R. J. Wilcock, Chern. Rev. 77, 219 (1977). 5T. J. Morrison and F. Billet, J. Chern. Soc. 3819 (1952). 6C. N. Murray and J. P. Riley, Deep Sea Res. 18, 533 (1971). 7R. F. Weiss, Mar. Chern. 2, 203 (1974). lIy. F. Kapitanov and O. M. Shcherbakova, Zh. Fiz. Khirn. 57, 1785 (1983).
9J. P. O'Connell, Phase Equilibria Properties in the Chemical Industry, edited by T. S. Storvick and S.1. Sandler, ACS Symposia Series, 60, 450 (1977).
II)J. Alvarez, R. Crovetto, and R. Femande;t; Prini, Bt:l. Bun5cngc5. Phys.
Chern. 92, 935 (1988). 110. Y. Peng and D. B. Robinson, in Thermodynamics of Aqueous Systems
with Industrial Applications, ACS Symposium Series 133, edited by S. Newman (American Chemical Society, Washington, DC, 1980), p. 393.
12R. M. Gibbons and A. P. Laughton, J. Chern. Soc. Far. Trans. 2 80, 10 19 (1984).
13J. C. Wormald and N. M. Lancaster,i Chern. Soc. Far. Trans. 185, 1315 (1989).
14R. Crovetto, M. L. Japas, and R. Fernandez Prini, An. Asoc. Quirn. Arg. 71,81 (1983).
15R. Femandez Prini and M. L. Japas, J. Phys. Chern. 93, 3802 (1989). 16M. L. Japas and J. M. H. Levelt Sengers, AIChE J. 35, 705 (1989). 17A. Harvey, R. Crovetto, and J. M. H. Levelt Sengers, AIChEJ. 36,1901
( 1990). IliA. J. Ellis, J. Chern. Soc. 4, 3689 (1959). 19R. Kruse and E. U. Franck, Ber. Bunsenges. Phys. Chern. 86, 1036
(1983). 2llA. J. Read, J. Solution Chern. 4,52 (1975). 21J. A. Barbero, L. G. Hepler, K. G. McCurdy, and P. R. Tremaine, Can. J. "Chern. 61, 2509 (1983). --L. Haar,J. G. Gallagher,.and G. S. Kell, NBS /NRSSteam Tables (Hemi
sphere, Washington, DC, 1984). 23E. c. W. Clarke and D. N. Glew, Trans. Faraday Soc. 62, 539 (1966). 24S. Valentiner, Z. Phys. 42, 253 (1927).

sotUBIUTY Of CARBON DIOXUJJE ~N WATER
2:'iB. B. Benson, P. Krause, and M. M. Peterson, J. Solution Chern. 8, 655 (1979).
2hR. Fermindez Prini and R. Crovetto, AIChE J. 31, 513 (1985). 27R. Fernandez Prini and R. Crovetto, J. Phys. Chern. Ref. Data 18, 1231
(1989). 2~D. Krause, B. B. Benson, 1. Solution Chern. 18, 823 (1989). 29 A. Harvey and J. M. H. Levelt Sengers, AIChE J, 36, 539 (1990), 3OJ. M. H. Levelt Sengers, K. Kamgar.Parsi, F. W. Balfour, and 1. V.
sengers, J. Phys. Chern. Ref. Dara 12,1 (1983). .~lK. Onda, E. Sada, T. Kobayashi, S. Kito, and K.lto, J. Chern. Eng. Data
3, 18 (1970) . .'I1S. D. Malinin and N. L Savaleyva, Geochem. lnt. 5,410 (1972). 33S. E. Drummond, Ph.D dissertation, The Pennsylvania State University,
1981. ·'.JR. Crovetto, R. Fernandez Prini, and M. L. Japas, Ber. Bunsenges. Phys.
Chern. 88, 484 ( 1984) . 35H. L. Clever and R. Battino, in Solutions alld Solubilities, edited by M. R.
J. Dack (Wiley, New York, 1975)' Vol. 8, Part 1, pp. 379-381. .1"E. Wilhelm and R. Battino, Chem. Rev. 73, 1 (1973). >,7J. H. Dymond and E. B, Smith, in The Virial CoefficientojPure Gases and
Mixtures: A Critical Compilation (Clarendon, Oxford, 1980). -'~C. R. Coan and A. D. King, j. Am. Chern. Soc. 93, 1857 (1971). 3'lR. M. Patel, J. C Holste, R. H. Kenneth, and P. T. Eubank, Fluid Phase
Equil. 36. 279 ( 1987). .joe. J. Wormald, N. M. Lancaster, and A. J. Sellar~, Research Report by
the Gas Processors Association, Tulsa, Oklahoma, RR·82:9 (1985) . ..lIe. E. Vanderzee and N. C. Haas, J. Chern. Therm. 13.203 (1981) . . 12M. P. Vukalovich and V. V. Altunin, 111ermophysical PropertiesojCarbol1
Dioxide (Collet's Publisher, 1968). ~.1R. r Rf'iti .. L M. Pr~""nit7. :mrl R F. Poling, Tlu> PrnpPl'lipsnf(;nr;pr;nl1d
Liquids, 4th. ed. (McGraw-Hill, New York, 1987). -'-'R. Wiebe and V. L. Gaddy, J. Am. Chern. Soc. 63. 475 (1941). ~~S. D. Malinin. Geokhimiya 3, 235 ( 1959). ·./('R. Crovetto and R. H. Wood, Fluid Phase Equil. (to be submitted).
Appendix t Procedure for calculation of Henry's constant
In this appendix the procedures and the assumptions used to calculate k () according to Eqs. (1) and (2) are described. Every source of data was reduced to the same information, i.e., temperature, total pressure, and molar fraction of carbon dioxide dissolved in the liquid. Thus all the data received the same thermodynamic treatment.
L 10 !Equation of State
In different temperature regions, different assumptions are made. They are discussed separately below.
D. u.s. low-temperature solllJbmty data (Group A)
For definition of units of solubility and their relation, see reviews in Clever and Battino35 or Wilhelm and Battino. 36 To convert Bunsen's and Kuenen's coefficients to mole fraction the real volume of CO2 at normal pressure and temperature was used (24.340 llmol). Since solubilities expressed as Ostwald's coefficient were found only for T < 320 K and P < 1.5 bar, the following assumptions were used to calculate the mole fraction: Molar volume of the solution equals molar volume of water at the same temperature, a second viria! coefficient EOS for the gas considered to
be pure (The water content in the vapor phase at these conditions is very smaH. )
To calculate the solubility, the vapor phase of group A can be described by means of a mixture second virial coefficient EOS. The cross virial coefficients as a function of temperature were taken from Dymond and Smith's compilation. 37
The procedure to obtain y and tP2 needed in Eq. (1) is itf:r::ltlVf: :mci i~ iie~crlhed in ilet::lll f:l~ewhere, rr()vetto I?t
al. 14 When comparing our results for the low temperature data with those of Wilhelm's et al.,4 in Table 3, columns 2 and 4, it has to be pointed out that the data they used for low temperature solubilities (Weiss7 and Murray and Riley6),
had been corrected for nonideality, but that the data they used for the highest temperatures, Morrison and Billet,5 had not. At the highest temperature, however, the nonideality correction can only account for about =+ 0.5% in k 0, whereas the observed differences, Table 3, accounts for 2 % at the end of the temperature intervaL As discussed in the text, this is mainly due to the different functionality with the temperature, curvature, in the equations used to calculate k 0 and not to nonideality corrections .
1.1.0. High ~empell'a~llJlTe dlal~a (Gwo~p C)
The selection of a reasonably good and simple EOS that could describe CO2-H20 in the vapor phase was not an easy task. A good EOS should not only predict accurate volumetric quantities and P, T,x,y for phase separation, but also that yield accurate derivatives for the pressure with respect to the number of moles, or fugacity coefficients. These conditions are not necessarily simultaneously true for a given EOS. For the system CO2-H20 there are several options. The influence of the selected BOS on the value of k 0, especially near the critical point of water is tested. Since no analytical equation will be exact for the critical region, one must expect thai corrections are most uncertain in this region. The selected EOS will determine the equilibrium vapor composition y and the fugacity coefficient ¢J2 to be used in Eq. (1) for calculating k 0. What really matters in (1) is the product oryalld
¢J2' Individual variations ofy and ¢2 can compCllsale, he larger or smaller, or have different pressure depcndence, depending on the EOS used in the calculation.
A natural fundamental EOS for inlcrmcd!;dc and low densities away from the critical density, is I he viri:d EOS" Vi, an expression for the pressure along iso! hl..'l'm'. iii i)( lweI'S of the density of the fluid mixture.
The mixture second virial (.To:.;>: l·Ud/j(·lt'iil. for CO:::-H20 were measured by Cn;l!l ;1111,; King up 10 373 K, and more recently by Patd d lil. ',', and h.'1 Vhmnald cl al:'to
up to 498 K. values froill dilki\'11I \oun.:cs are in very good agreement. There is ,.Iso <IIi ('S/ illi;d ion or 8'2 values for this system up to 11 no K fp)jj\ \1 :lIHk(fn' ('{ al. '1 Third virial cross coefficients e" ' and ( " " Inn' Ix-L'n measured for this system up to 49g ll<., hy i';\Ic! i') (fl. ," The temperature dependence of lilt' I hiI'd ,iri;d l·()diicil..'nls \vas extrapolated up
to the critic;li p()int or \\,;111..'1' hy making educated guesses about their possihk' v,duv:-;. (!::or instance, was already almost cOllsianl ;11 4~)g K so ils value at temperatures \V;h iak,-'Il :1'. cons/;nl!.)
~_;, ; \/~duc:·; 'F'..: :.d!'.~<';idy :;laOC'>ling to decrease at 498 K and

588 ROSA CROVETTO
above. To estimate its temperature dependence a value similar to that of the third virial coefficient for pure water vapor was assigned to it at 1200 K and C1l2's were fitted as a function of temperature. Second and third virial coefficients of pure water as functions of the temperature were obtained from the formulations in the NBS/NRS Steam Tables of Haar et al.22 Second and third virial coefficients of pure CO2 were taken from Vukalovich and Altunin.42
Peng and Robinson'sll mixture EOS, PR, which is capable of adequately describing vapor-liquid equilibria in water-apolar gas systems, was another equation used. The equation has a mixture parameter, 812, that is independent of temperature and pressure, B 12' of the mixture. In disagreement with the general behavior observed for several other binary mixtures of apolar gases and water vapor, see Fernandez Prini and Crovetto,27 a pronounced temperature dependence of 8 12 for temperatures below 373 K, if 8 12 is obtained from the reported values of B 12 is observed. Analyzing the actual dependence of 812 on temperature, an average value of 812 = 0.285 ± 0.035 is found to be approximately independent of temperature between 375 and 650 K. This value was used as the mixture parameter 812 when the PR equation is used. The necessary pure components parameters for the PR equation were obtained from the literature, Reid et al. 43
Gibbons and Laughton,12 G, presented a simple cubic equation of state for polar and nonpolar substances and mixtures as a modification of the Redlich-Kwong-Soave equation. They fitted their mixture interaction parameter so as to represent the experimental liquid-vapor compositions of several mixtures, among them CO2-H20. Their mixture value of - 0.06 was used in the calculations. Pure components parameters values were taken from the literature, Reid et al.43
Recently, Wormald and Lancaster,13 W, presented a cubic EOS for gaseous mixtures containing stearn. Their EOS, with their mixture rules, and the interaction parameter they obtained for the CO2-H20 system are used.
From the four selected EOS y is calculated from Eq. (2) with an iterative procedure described elsewhere, Crovetto et al.,14 and then the corresponding tP2 at that composition from the same EOS. With these values and the experimental measured quantities, k 0 can be obtained from Eq. (1) when the partial molar volume of the solute in the liquid, V2 is known. (Regarding values of V2 used, see Sec. 1.2.)
When using Vi as EOS mathematical problems are found, such as imaginary roots for the volume of pure water at its vapor pressure at 580 K and higher, or imaginary roots for the volume of the mixture at low temperatures for different pressures. The pressure interval that does not have mathematical problems increases with temperature (for instance, it ranges from 0 to 45 bar at 285 K, and from 0 to 100 bar at 323 K). At high temperatures there is no real solution for the volume of the vapor phase mixture starting at 300 bar and up at 423 K and from 157 bar and up, at 573 K. This restricts the P, Tconditions where k 0 values calculated from different EOS can be compared with the resulting k 0 calculated from the virial EOS. The original goal was to use the more fundamental virial EOS as a test for the others, at least not very near the critical point of the solvent.
The four EOS were compared in their ability to predict the compressibility factor, Z, and the fugacity coefficient of pure water, from 373.15 to 643.15 K. Values for comparisons with pure water were taken from Haar et al.22
As can be seen from the following table, any EOS will predict reasonably good values for tPf almost up to the critical point of water, though the predicted Z values are quite poor.
Percent differences in Z and ¢If between values calculated from EOS and Steam Table values for water vapor at different temperatures.
EOS: Vi PR G W T/K % IlZ Ill/lf IlZ Il¢lf IlZ Il¢lf IlZ Ill/lf
373.15 0.001 0.03 -0.6 -0.6 -0.67 -0.6 0.03 0.0 473.15 0.14 0.03 2.3 1.6 2.7 2.0 0.03 -0.05 573.15 10. 1.3 4. -0.5 6.1 -2.4 0.2 0.4 623.15 -8. 0.5 -13.2 -2.3 -0.7 -1.5 633.15 -10. 0.8 16.5 2.2 2.5 -2.2
643.15 -15. 1.0 -23.2 -2.2 -27. -3.7
(The percentage change is the Steam Table value minus the EOS value. divided by the Steam Table value.)
Another way of comparing EOS performance is to test their ability to reproduce values for the known mixture 2nd virial coefficients as a function of the temperature. In this case 812 of the PR equation was fitted to reproduce Bl2 from 375 K up. It was found that G EOS does not reproduce Bl2 values, but W EOS does. Comparing the vapor phase composition predictions from the EOS with the available experimental data from Wiebe and Gaddy,44 Zawisza et al., ZA W (81), and Patel et al.,39 all EOS used reproduce the data fairly well, although none exactly and no systematic trend in the predicted values can be distinguished.
Comparing values of k 0 calculated by means ofthe EOS Vi with values of k 0 calculated by means of PR, G, and W EOS at the same temperature, the values show a spread less than ± 1.5% up to about 500 K. The smallest differences between k o,s values are those derived from Vi and PRo For higher temperatures and as long as the use of Vi is possible, k 0 values calculated from PR and Vi differ less than 1 %-2 %. Differences in k 0 for the highest temperature measured, 642 K, are about 4% when comparing PR and G. When comparing Wand PR, the difference increases slowly with the temperature, becoming as high as 8% at 642 K.
SOLUBILITY OF CARBON DIOXIDE IN WATER 589
A useful comparison to do is to calculate, at constant
temperature, and at increasing pressure, Henry's constant, k, calculated from Eq. (1) setting V2 equal to zero (no pressure correction) and using different EOS for the vapor phase. The results are that from PR and Vi EOS similar k values are obtained, the differences being less than 1 %. From G and W EOS the results are that they would predict a different and bigger pressure dependence for k than either Vi or PR EOS. Differences in k values calculated from G or W compared to PR can be as large as 5% and 20%, respectively, for pressures of about 300 bar. Once again, the pressure dependence of k is a combination of the functional dependence on V2 shown in Eq. (1) but also of the EOS used for ¢2 and sometimes experimental artifacts, Fernandez Prini and Crovetto. 26 For this reason it is not recommended to calculate partial molar volume of the solute from the slope ofln k vs pressure at high vapor pressure of the solvent.
Nevertheless, as already stated, the extrapolated values for k 0 obtained by means of the PR and W EOS do not differ more than the stated 1.5% until about 500 K, although the difference slowly increases with the temperature being about 8% at the highest Tmeasured.
The G EOS does not correctly predict B 12 for CO2-
H 20. It seems to predict too great a pressure dependence for
k. Since k 0 values calculated using PR and G do not differ greatly, especially at pressures near the vapor pressure of the solvent, G is not used any further and to illustrate differences in calculated values of k 0 due to the use of different EOS PR and Ware selected.
The mixture parameter of the W EOS has been adjusted to reproduce the excess molar enthalpies of mixtures. This, however, does not guarantee that the equation represents vapor phase fugacity coefficients of the dilute mixture properly, or that it can predict vapor phase compositions accurately.
An advantage of this equation is that it has been fitted to mixture properties, and the same cannot be said of PR EOS for this system. There is no strong argument to prefer one EOS over the other, but small observations lead us to recommend the PR over the W EOS. PR predicts better fugacity coefficients for pure water for temperatures near Tc (see corresponding table on p. 35).
When K ~ is calculated using in Eq. (5) k 0 val ues from PR EOS, it is fuuud lhal Ey. (7), KD, has a smaller standard deviation and a better linear regression than when W EOS is used.
ti. 1I.c. Group IB
For this group the PR EOS would probably be the most suitable EOS for the vapor phase because its pressure dependence is reasonable. This group, however, has not been included in the fit.
8.2. Effect of Pressure Upon Gas So!ubility
In general, there are only two types of experimental studies of gas solubilities: those in which the concentration has been measured isothermally at different pressures and those in which only a few points are measured at the same temperature, usually at alm.ost the same pressure. For those in the first group, the variation of the solubility with the pressure can be an artifact. Hence, in order to obtain k 0 from the first group a direct extrapolation of the data to the vapor pressure of water at the temperature of the experiment is graphically performed.
In the cases where one or only a few points are available at one temperature, the partial molar volume of the solute and its T and P dependence has to be known in order to calculate k 0 from Eq. (1).
It has been shown by Fernandez Prini and Japas, 15 that by using a perturbation method, the hard-sphere equivalent
diameter of the solute and its temperature dependence and the properties of the pure solvent, V~ can be calculated as a function of T and P.
No reliable hard-sphere equivalent diameters and their corresponding temperature dependence are available for the system CO2-H20. Thus, the experimentally available data for V 2 III thIS system obtained by Malinin45 and by Crovetto and W 00d
46 are considered. We used them to calculate the needed V2 in Eg. (1).
Appendix I L Fitting Procedure Employed to Calculate the Temperature Dependence of
Henry's Constant Group A, low temperature, low pressure, was fitted to
equation P3. Group C, high temperature, any pressure, was fitted to equations P3 + b, KD, DEN*2, and T* (1/3). The parameter adjustment was done by a least squares procedure that minimizes least squares differences in In k o.
For the polynomials in the inverse of the temperature, P3, P3 + b, and T* ( 1/3), it was tested that further increase in the number of parameters used was not statistically significant. Points with residuals bigger than 2 standard deviations, (J, were rejected. The rejection procedure was stopped when no significant improvement of the (J of the fit was attained by further point rejection. This was achieved in the
fourth iteration for group A and in the third iteration for group C.
In the low temperal ure III, aftcr I he fourth iteration, the deviation plot was analyzed and sources that agreed with the rest of the measurements but did only contribute with a larger scatter, were rejected. [Novak el al., NOV(61), and Verdet et al., VEe 855) ].
No weighting was attempted.
J. i?1h}j's. Cruem.lRleii. iDJaJitaJ, V<O~. 2C, iNlo. 3, 199~