Embed Size (px)
Citation preview
When you know better you do better
Maya Angelou
Presented by: Heather Himmelberger, P.E.Director, Southwest Environmental Finance Center
WATER AUDITS AS THE
FIRST PART OF WATER
LOSS CONTROL
Remember to
type in
questions at any
time as we go
along
When you know better you do better
Maya Angelou
Understanding The Water Balance as a Blue and a Green Problem
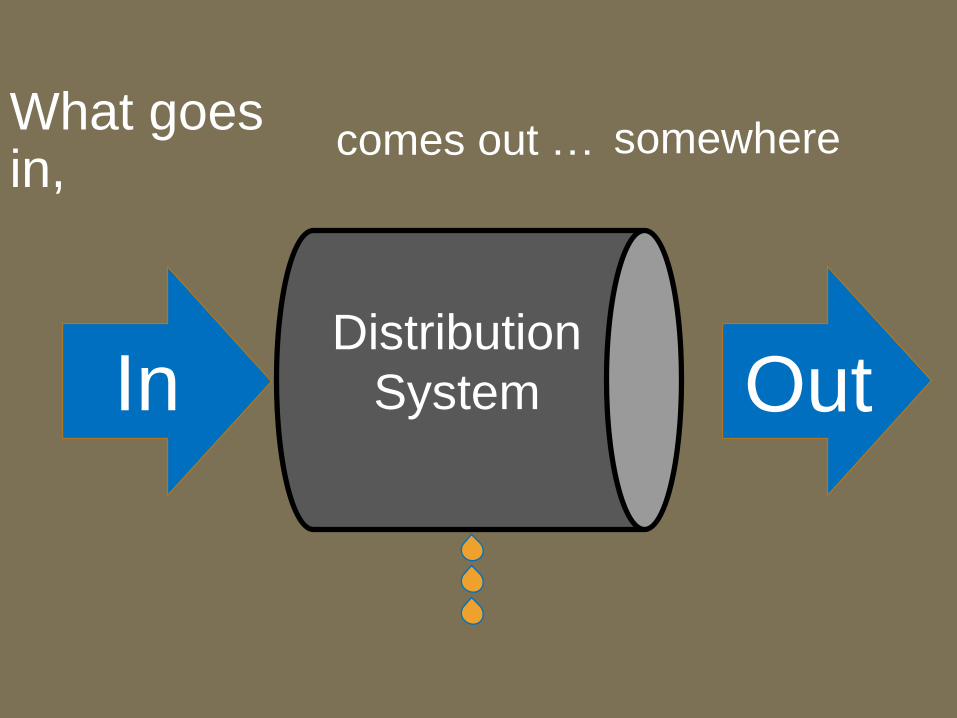
What goes in,
InDistribution
System Out
somewherecomes out …
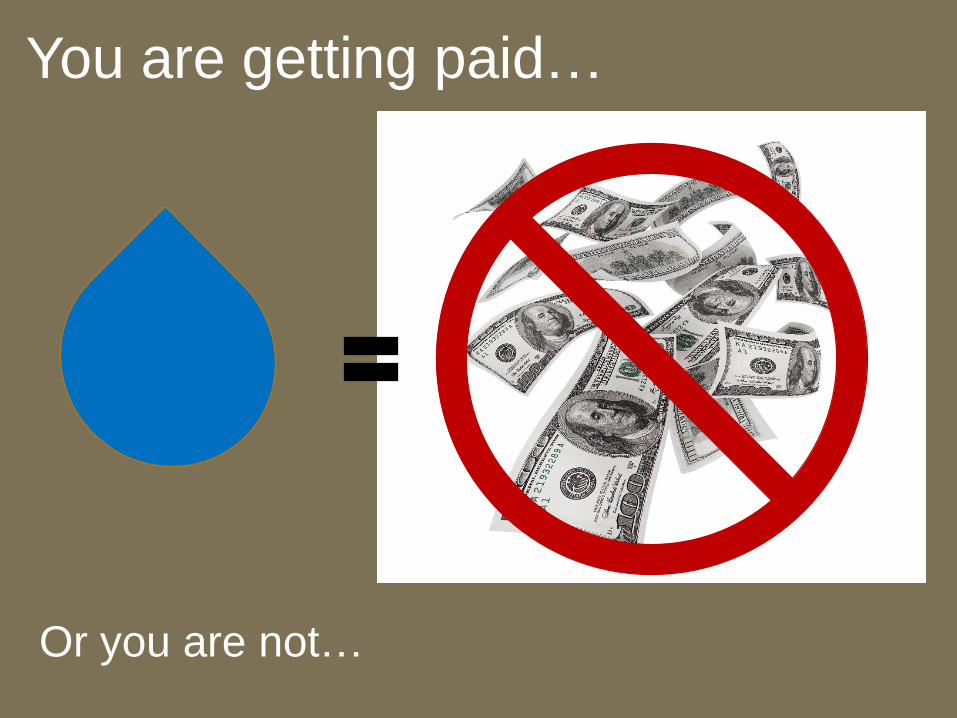
You are getting paid…
Or you are not…

Water that isn’t going
out where we want
Money that we’re not
getting, but could be
So it’s a blue and green problem …
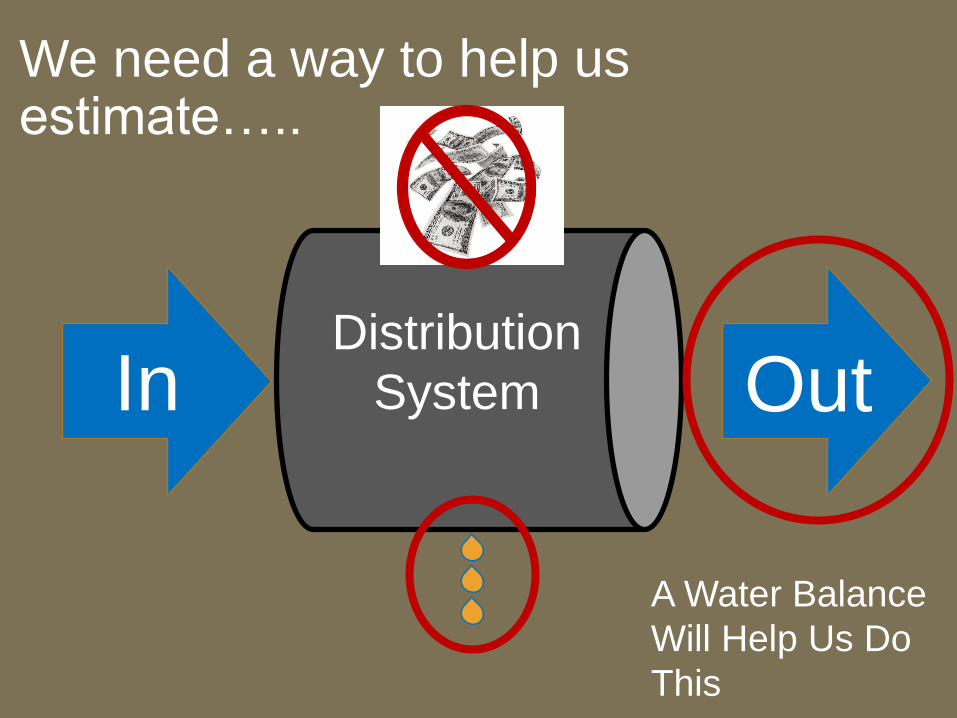
We need a way to help us estimate…..
InDistribution
System Out
A Water Balance
Will Help Us Do
This
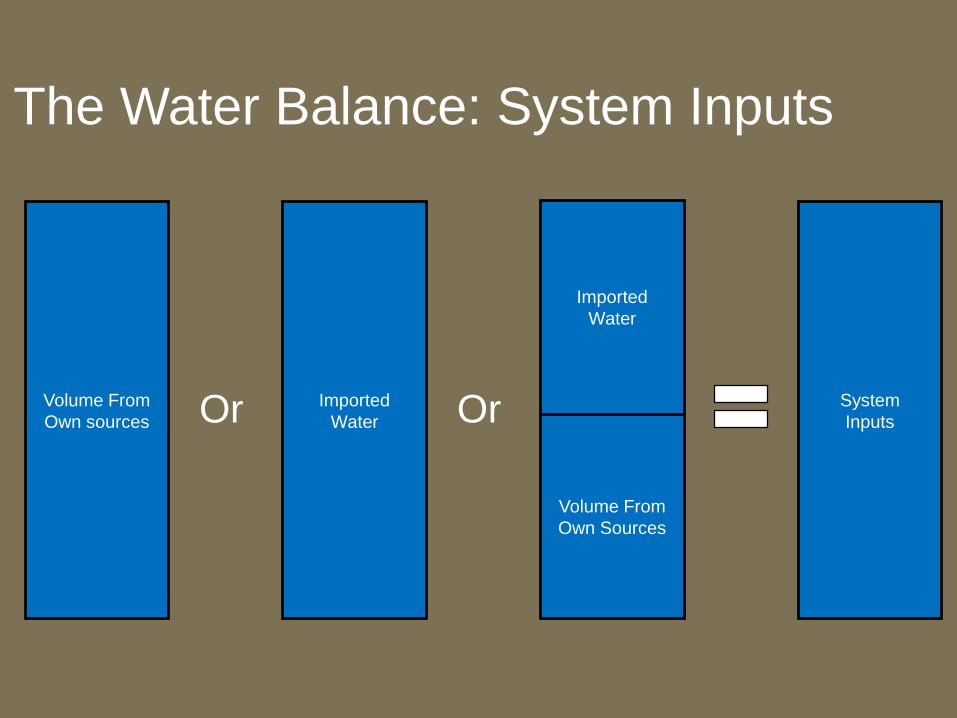
The Water Balance: System Inputs
System
Inputs
Volume From
Own sources
Volume From
Own Sources
Imported
Water
Imported
WaterOr Or
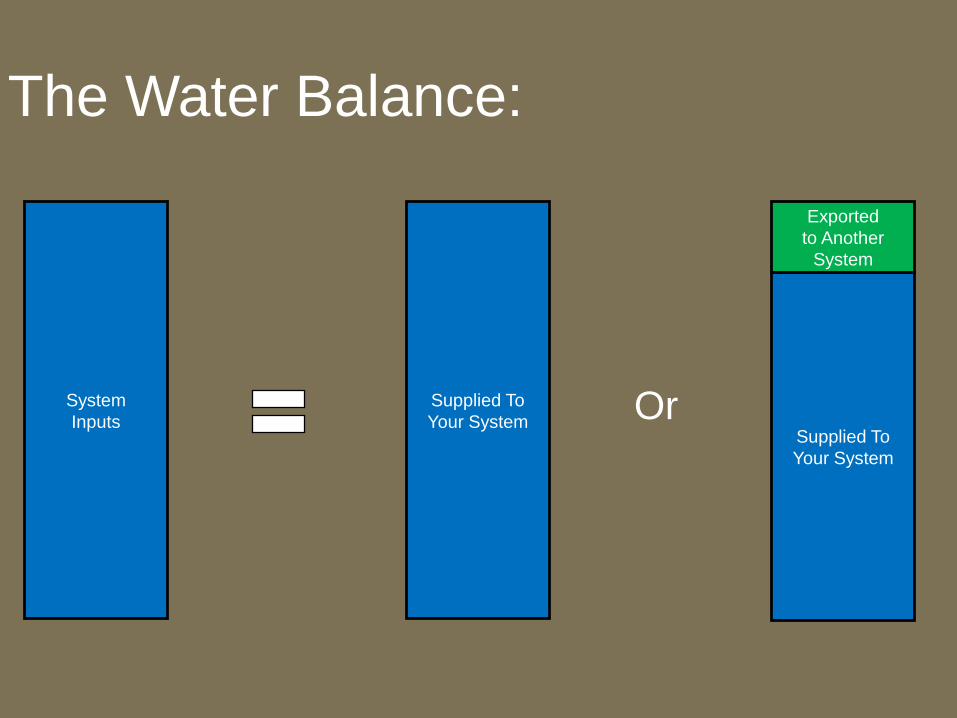
The Water Balance:
System
InputsSupplied To
Your System
Exported
to Another
System
Supplied To
Your SystemOr
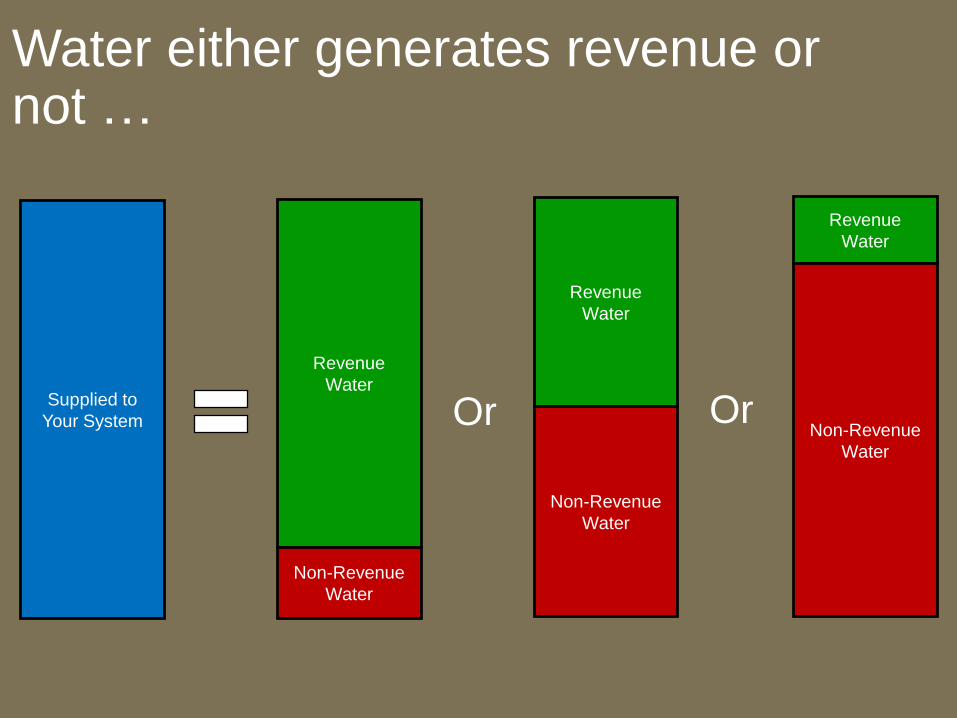
Water either generates revenue or not …
Revenue
Water
Non-Revenue
Water
Supplied to
Your System
Revenue
Water
Non-Revenue
Water
Revenue
Water
Non-Revenue
Water
Or Or
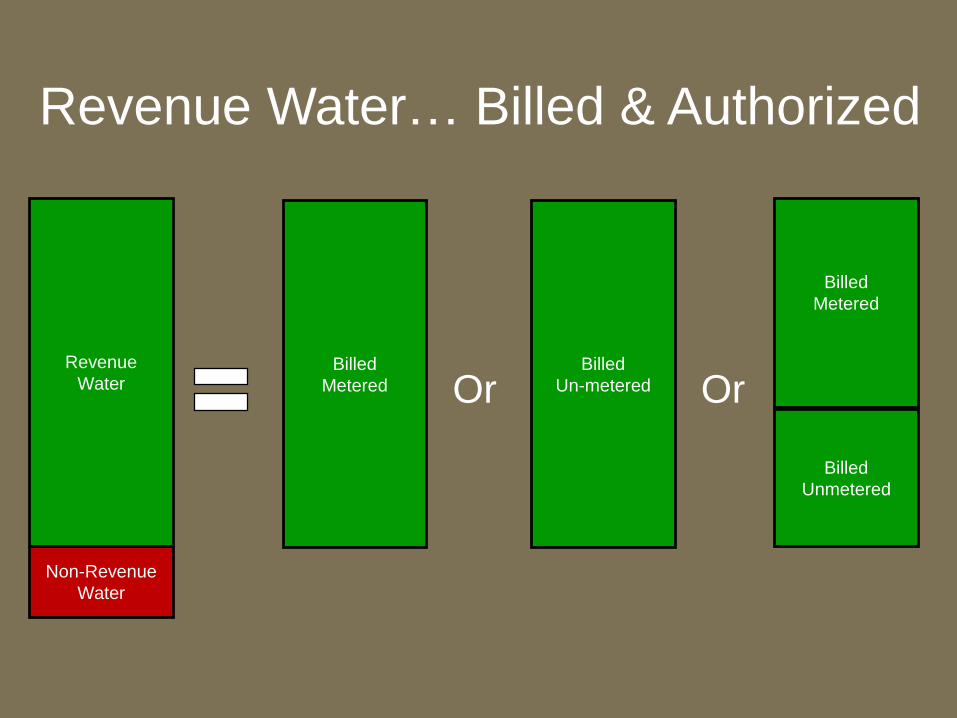
Revenue Water… Billed & Authorized
Revenue
Water
Non-Revenue
Water
Billed
Metered
Billed
Unmetered
Billed
Metered
Billed
Un-meteredOr Or
Non-Revenue
Water
Revenue
Water
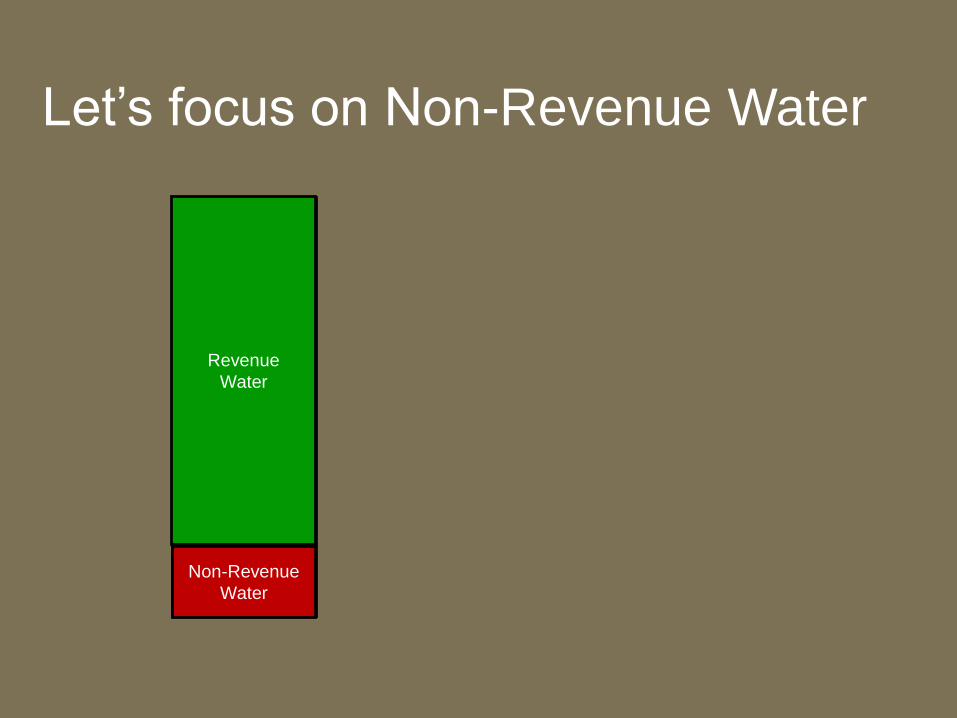
Let’s focus on Non-Revenue Water
Non-Revenue
Water

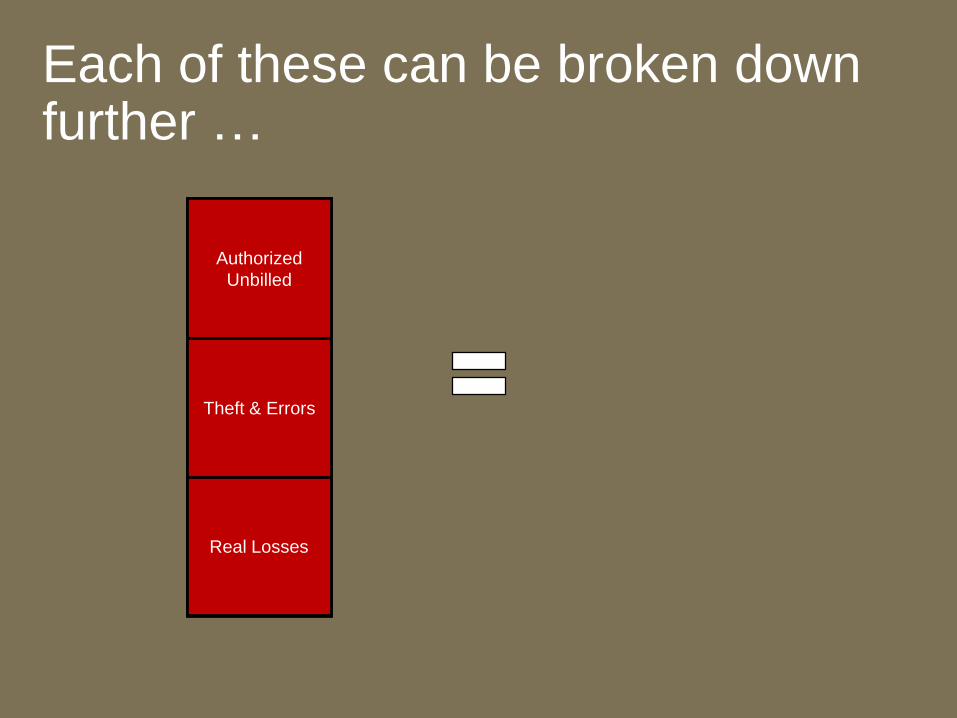
Real Losses
Authorized
Unbilled
Theft & ErrorsNon-Revenue
Water
Non-revenue water… has 3 main components
Storage Leaks
& Overflows
Service Line
Leaks
Main Leaks
Systematic
Data Errors
Customer
Meter Errors
Theft
Unbilled
Un-metered
Unbilled
Metered
Real Losses
Authorized
Unbilled
Theft & Errors
Each of these can be broken down further …
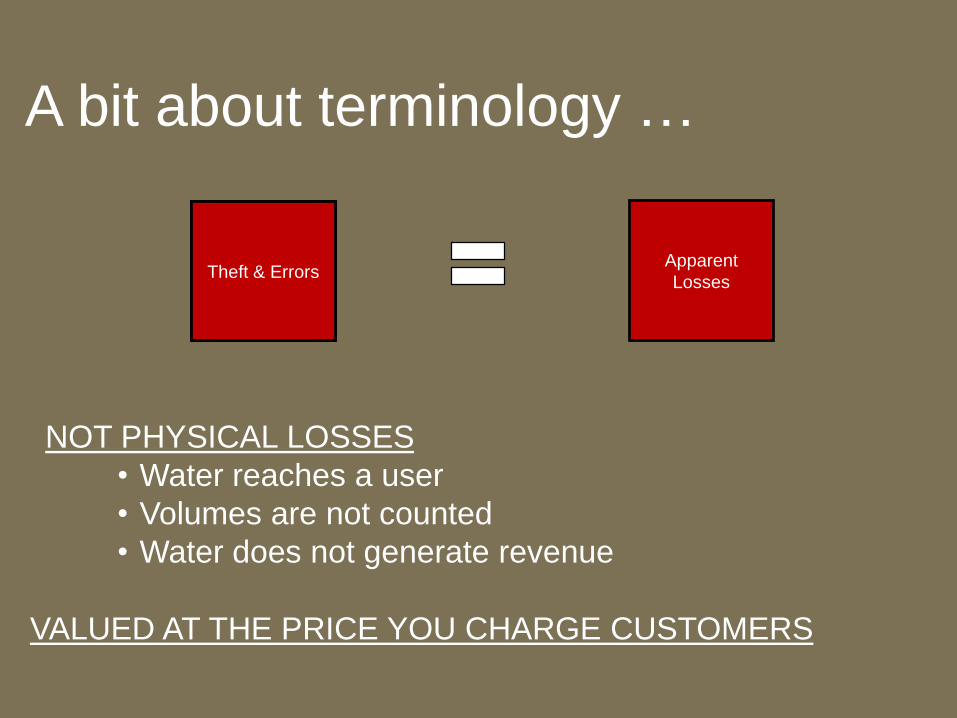
A bit about terminology …
NOT PHYSICAL LOSSES
• Water reaches a user
• Volumes are not counted
• Water does not generate revenue
Systematic
Data Errors
Customer
Meter Errors
Theft
Theft & ErrorsApparent
Losses
VALUED AT THE PRICE YOU CHARGE CUSTOMERS
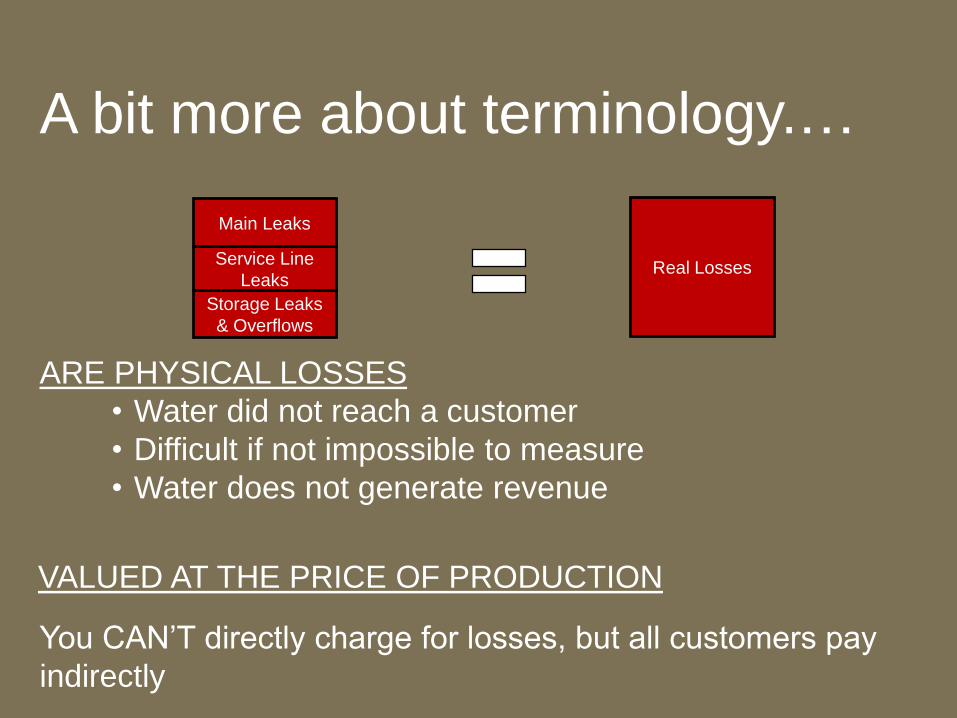
A bit more about terminology.…
Real Losses
ARE PHYSICAL LOSSES
• Water did not reach a customer
• Difficult if not impossible to measure
• Water does not generate revenue
You CAN’T directly charge for losses, but all customers pay
indirectly
VALUED AT THE PRICE OF PRODUCTION
Storage Leaks
& Overflows
Service Line
Leaks
Main Leaks
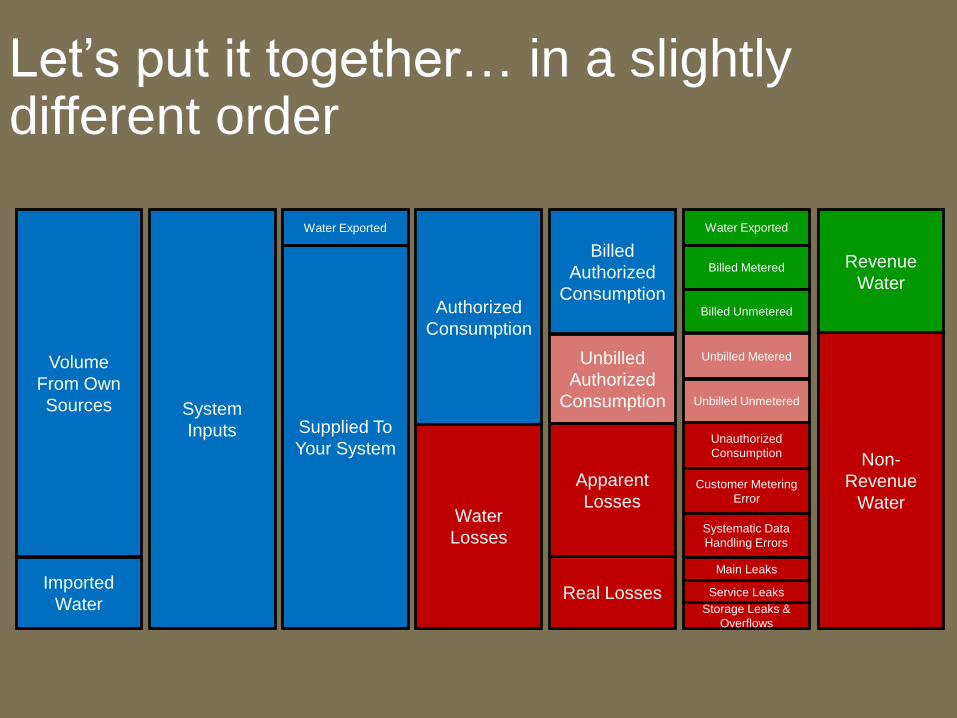
Let’s put it together… in a slightly different order
System
Inputs
Volume
From Own
Sources
Imported
Water
Revenue
Water
Non-
Revenue
Water
Supplied To
Your System
Water Exported
Water
Losses
Authorized
Consumption
Water Exported
Billed Metered
Billed Unmetered
Unbilled Metered
Unbilled Unmetered
Systematic Data
Handling Errors
Main Leaks
Unauthorized
Consumption
Customer Metering
Error
Service Leaks
Storage Leaks &
Overflows
Real Losses
Billed
Authorized
Consumption
Unbilled
Authorized
Consumption
Apparent
Losses
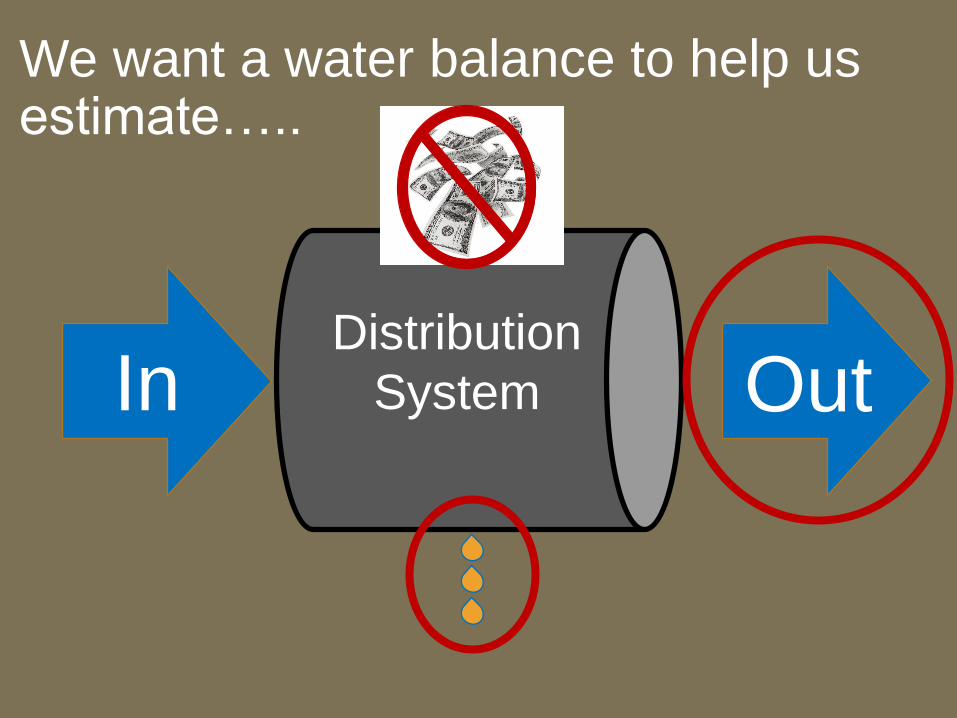
We want a water balance to help us estimate…..
InDistribution
System Out
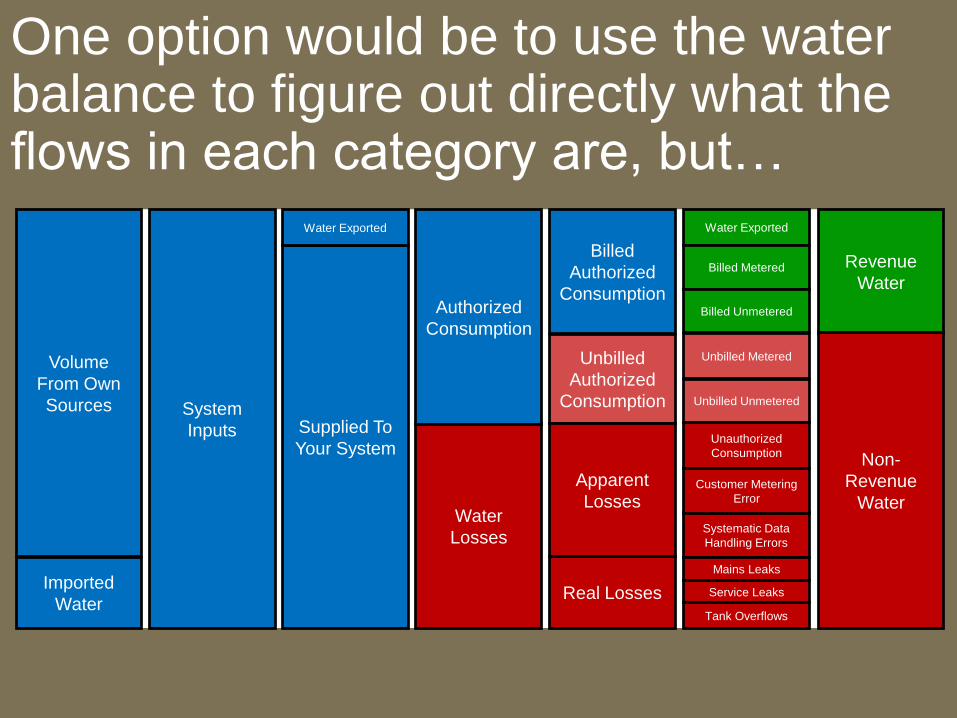
One option would be to use the water balance to figure out directly what the flows in each category are, but…
System
Inputs
Volume
From Own
Sources
Imported
Water
Revenue
Water
Non-
Revenue
Water
Supplied To
Your System
Water Exported
Water
Losses
Authorized
Consumption
Water Exported
Billed Metered
Billed Unmetered
Unbilled Metered
Unbilled Unmetered
Systematic Data
Handling Errors
Mains Leaks
Unauthorized
Consumption
Customer Metering
Error
Service Leaks
Tank Overflows
Real Losses
Billed
Authorized
Consumption
Unbilled
Authorized
Consumption
Apparent
Losses
Water Audit Report for:
Reporting Year:
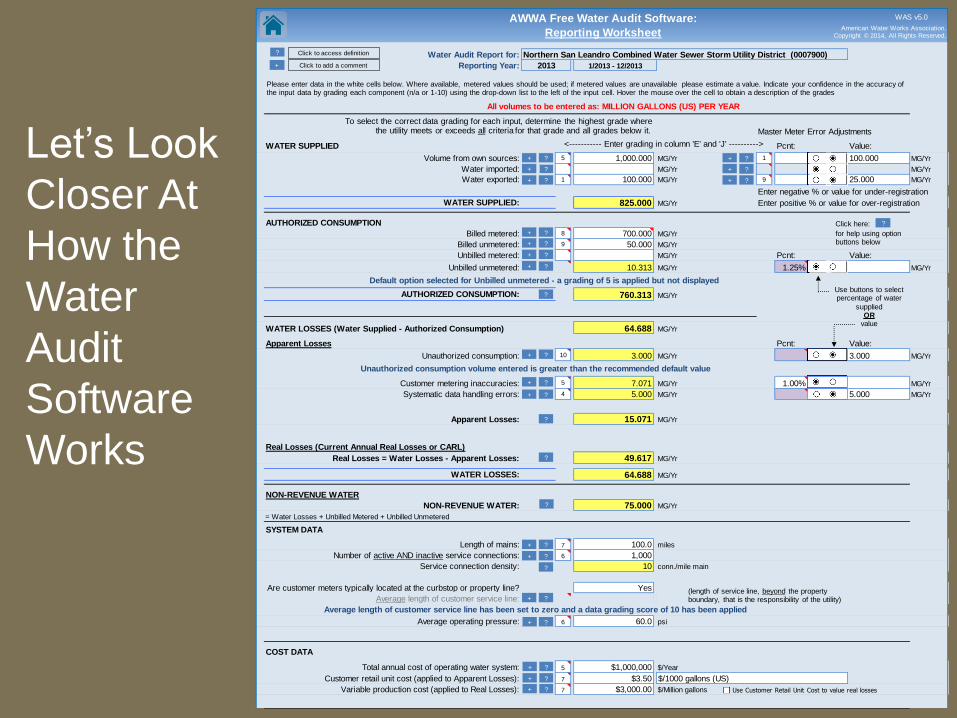
All volumes to be entered as: MILLION GALLONS (US) PER YEAR
Master Meter Error Adjustments
WATER SUPPLIED Pcnt: Value:
Volume from own sources: 5 1,000.000 MG/Yr 1 MG/Yr
Water imported: MG/Yr MG/Yr
Water exported: 1 100.000 MG/Yr 9 MG/Yr
Enter negative % or value for under-registration
WATER SUPPLIED: 825.000 MG/Yr Enter positive % or value for over-registration.
AUTHORIZED CONSUMPTION
Billed metered: 8 700.000 MG/Yr
Billed unmetered: 9 50.000 MG/Yr
Unbilled metered: MG/Yr Pcnt: Value:
Unbilled unmetered: 9 10.313 MG/Yr 1.25% MG/Yr24061
AUTHORIZED CONSUMPTION: 760.313 MG/Yr
WATER LOSSES (Water Supplied - Authorized Consumption) 64.688 MG/Yr
Apparent Losses Pcnt: Value:
Unauthorized consumption: 10 3.000 MG/Yr 0.25% MG/Yr
Customer metering inaccuracies: 5 7.071 MG/Yr 1.00% MG/Yr
Systematic data handling errors: 4 5.000 MG/Yr 0.25% MG/Yr
Apparent Losses: 15.071 MG/Yr
Real Losses (Current Annual Real Losses or CARL)
Real Losses = Water Losses - Apparent Losses: 49.617 MG/Yr
WATER LOSSES: 64.688 MG/Yr
NON-REVENUE WATER
NON-REVENUE WATER: 75.000 MG/Yr
= Water Losses + Unbilled Metered + Unbilled Unmetered
SYSTEM DATA
Length of mains: 7 100.0 miles
Number of active AND inactive service connections: 6 1,000
Service connection density: 10 conn./mile main
Yes
Average length of customer service line: ft
Average operating pressure: 6 60.0 psi
COST DATA
Total annual cost of operating water system: 5 $1,000,000 $/Year
Customer retail unit cost (applied to Apparent Losses): 7 $3.50
Variable production cost (applied to Real Losses): 7 $3,000.00 $/Million gallons
WATER AUDIT DATA VALIDITY SCORE:
PRIORITY AREAS FOR ATTENTION:
1: Volume from own sources
2: Customer metering inaccuracies
3: Total annual cost of operating water system
Based on the information provided, audit accuracy can be improved by addressing the following components:
$/1000 gallons (US)
100.000
<----------- Enter grading in column 'E' and 'J' ---------->
Unauthorized consumption volume entered is greater than the recommended default value
5.000
*** YOUR SCORE IS: 60 out of 100 ***
A weighted scale for the components of consumption and water loss is included in the calculation of the Water Audit Data Validity Score
100.000
3.000
25.000
Average length of customer service line has been set to zero and a data grading score of 10 has been applied
Are customer meters typically located at the curbstop or property line?
AWWA Free Water Audit Software:
Reporting Worksheet
Default option selected for Unbilled unmetered - a grading of 5 is applied but not displayed
1.000
2013 1/2013 - 12/2013
Northern San Leandro Combined Water Sewer Storm Utility District (0007900)
?
?
?
?
?
? Click to access definition
?
?
?
?
?
?
Please enter data in the white cells below. Where available, metered values should be used; if metered values are unavailable please estimate a value. Indicate your confidence in the accuracy of the input data by grading each component (n/a or 1-10) using the drop-down list to the left of the input cell. Hover the mouse over the cell to obtain a description of the grades
?
?
?
?
?
?
(length of service line, beyond the property boundary, that is the responsibility of the utility)
Use buttons to selectpercentage of water
suppliedOR
value
?Click here:
for help using option buttons below
?
?
?
?
+
+ Click to add a comment
WAS v5.0
+
+
+
+
+
+
American Water Works Association.Copyright © 2014, All Rights Reserved.
?
?
?
+
+
+
+
+
+
+
+
+
+
+
+
+ Use Customer Retail Unit Cost to value real losses
?
To select the correct data grading for each input, determine the highest grade where the utility meets or exceeds all criteria for that grade and all grades below it.
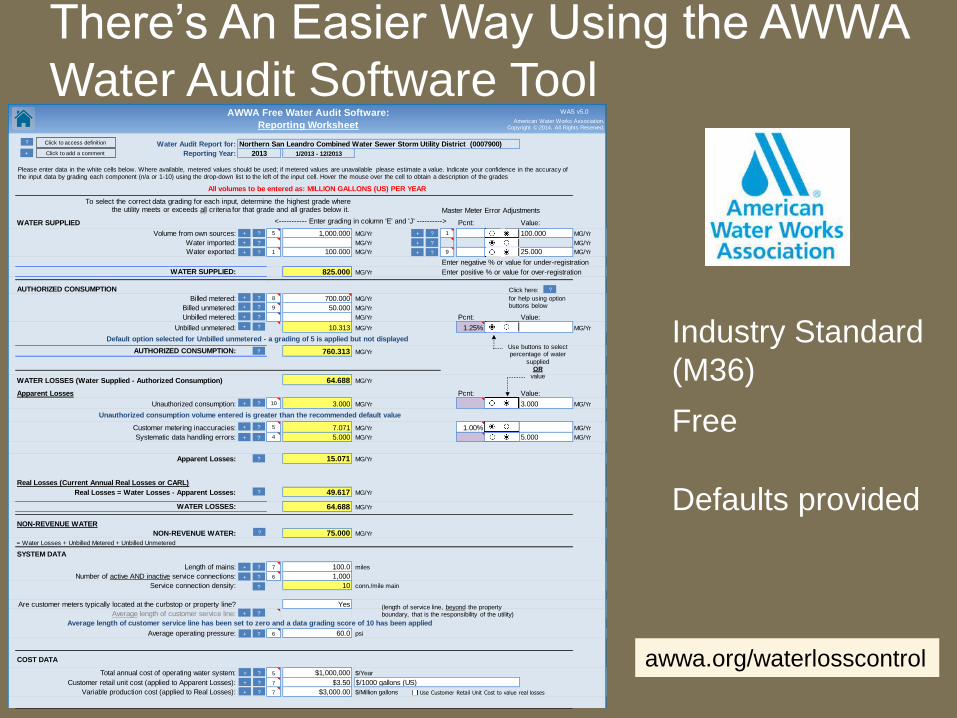
Defaults provided
Free
awwa.org/waterlosscontrol
Industry Standard
(M36)
There’s An Easier Way Using the AWWA
Water Audit Software Tool
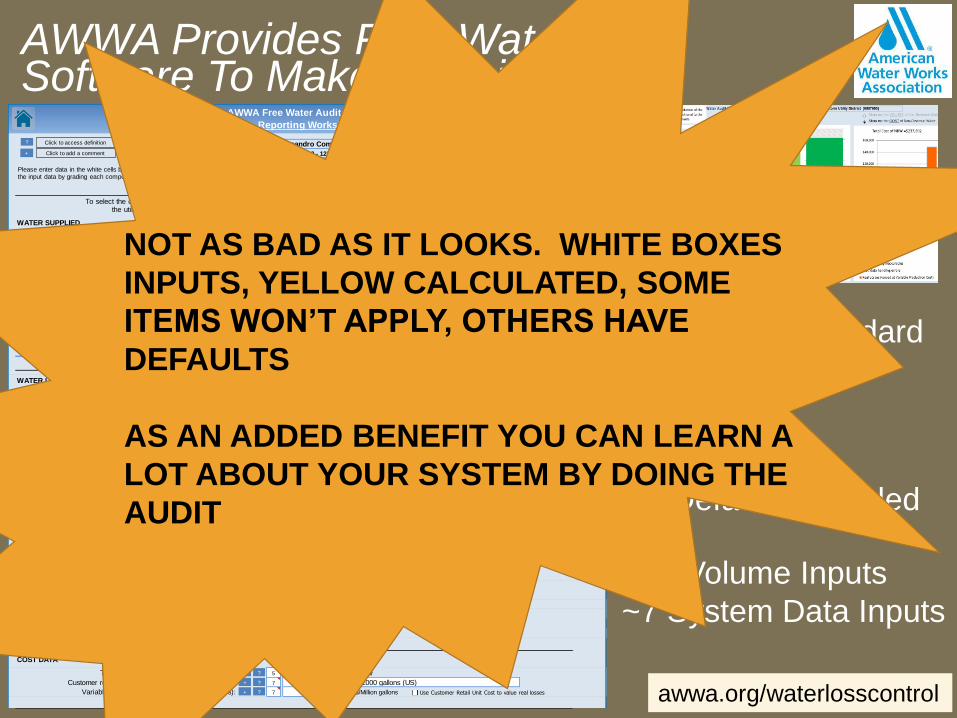
AWWA Provides Free Water Audit Software To Make it Easier
Water Audit Report for:
Reporting Year:
All volumes to be entered as: MILLION GALLONS (US) PER YEAR
Master Meter Error Adjustments
WATER SUPPLIED Pcnt: Value:
Volume from own sources: 5 1,000.000 MG/Yr 1 MG/Yr
Water imported: MG/Yr MG/Yr
Water exported: 1 100.000 MG/Yr 9 MG/Yr
Enter negative % or value for under-registration
WATER SUPPLIED: 825.000 MG/Yr Enter positive % or value for over-registration.
AUTHORIZED CONSUMPTION
Billed metered: 8 700.000 MG/Yr
Billed unmetered: 9 50.000 MG/Yr
Unbilled metered: MG/Yr Pcnt: Value:
Unbilled unmetered: 9 10.313 MG/Yr 1.25% MG/Yr24061
AUTHORIZED CONSUMPTION: 760.313 MG/Yr
WATER LOSSES (Water Supplied - Authorized Consumption) 64.688 MG/Yr
Apparent Losses Pcnt: Value:
Unauthorized consumption: 10 3.000 MG/Yr 0.25% MG/Yr
Customer metering inaccuracies: 5 7.071 MG/Yr 1.00% MG/Yr
Systematic data handling errors: 4 5.000 MG/Yr 0.25% MG/Yr
Apparent Losses: 15.071 MG/Yr
Real Losses (Current Annual Real Losses or CARL)
Real Losses = Water Losses - Apparent Losses: 49.617 MG/Yr
WATER LOSSES: 64.688 MG/Yr
NON-REVENUE WATER
NON-REVENUE WATER: 75.000 MG/Yr
= Water Losses + Unbilled Metered + Unbilled Unmetered
SYSTEM DATA
Length of mains: 7 100.0 miles
Number of active AND inactive service connections: 6 1,000
Service connection density: 10 conn./mile main
Yes
Average length of customer service line: ft
Average operating pressure: 6 60.0 psi
COST DATA
Total annual cost of operating water system: 5 $1,000,000 $/Year
Customer retail unit cost (applied to Apparent Losses): 7 $3.50
Variable production cost (applied to Real Losses): 7 $3,000.00 $/Million gallons
WATER AUDIT DATA VALIDITY SCORE:
PRIORITY AREAS FOR ATTENTION:
1: Volume from own sources
2: Customer metering inaccuracies
3: Total annual cost of operating water system
Based on the information provided, audit accuracy can be improved by addressing the following components:
$/1000 gallons (US)
100.000
<----------- Enter grading in column 'E' and 'J' ---------->
Unauthorized consumption volume entered is greater than the recommended default value
5.000
*** YOUR SCORE IS: 60 out of 100 ***
A weighted scale for the components of consumption and water loss is included in the calculation of the Water Audit Data Validity Score
100.000
3.000
25.000
Average length of customer service line has been set to zero and a data grading score of 10 has been applied
Are customer meters typically located at the curbstop or property line?
AWWA Free Water Audit Software:
Reporting Worksheet
Default option selected for Unbilled unmetered - a grading of 5 is applied but not displayed
1.000
2013 1/2013 - 12/2013
Northern San Leandro Combined Water Sewer Storm Utility District (0007900)
?
?
?
?
?
? Click to access definition
?
?
?
?
?
?
Please enter data in the white cells below. Where available, metered values should be used; if metered values are unavailable please estimate a value. Indicate your confidence in the accuracy of the input data by grading each component (n/a or 1-10) using the drop-down list to the left of the input cell. Hover the mouse over the cell to obtain a description of the grades
?
?
?
?
?
?
(length of service line, beyond the property boundary, that is the responsibility of the utility)
Use buttons to selectpercentage of water
suppliedOR
value
?Click here:
for help using option buttons below
?
?
?
?
+
+ Click to add a comment
WAS v5.0
+
+
+
+
+
+
American Water Works Association.Copyright © 2014, All Rights Reserved.
?
?
?
+
+
+
+
+
+
+
+
+
+
+
+
+ Use Customer Retail Unit Cost to value real losses
?
To select the correct data grading for each input, determine the highest grade where the utility meets or exceeds all criteria for that grade and all grades below it.
Defaults provided
Free
awwa.org/waterlosscontrol
Industry Standard
(M36)
~10 Volume Inputs
~7 System Data Inputs
NOT AS BAD AS IT LOOKS. WHITE BOXES
INPUTS, YELLOW CALCULATED, SOME
ITEMS WON’T APPLY, OTHERS HAVE
DEFAULTS
AS AN ADDED BENEFIT YOU CAN LEARN A
LOT ABOUT YOUR SYSTEM BY DOING THE
AUDIT
When you know better you do better
Maya Angelou
Setting The Parameters For the Audit
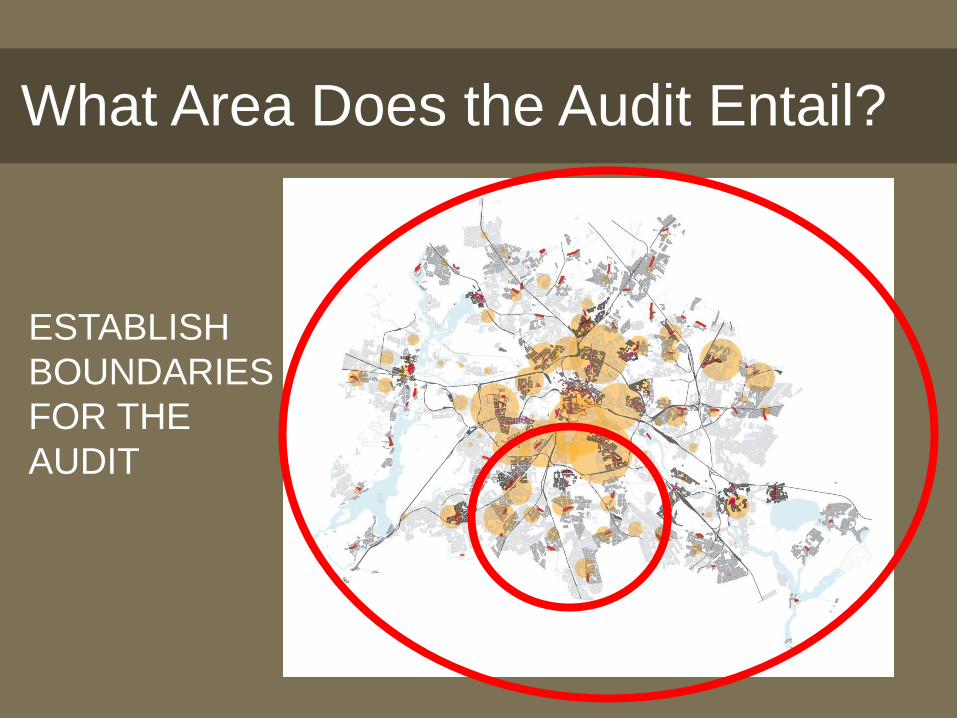
What Area Does the Audit Entail?
ESTABLISH
BOUNDARIES
FOR THE
AUDIT
Set Time Period: AWWA Audit is Annual
Can be
Calendar
Year or
Fiscal
Year
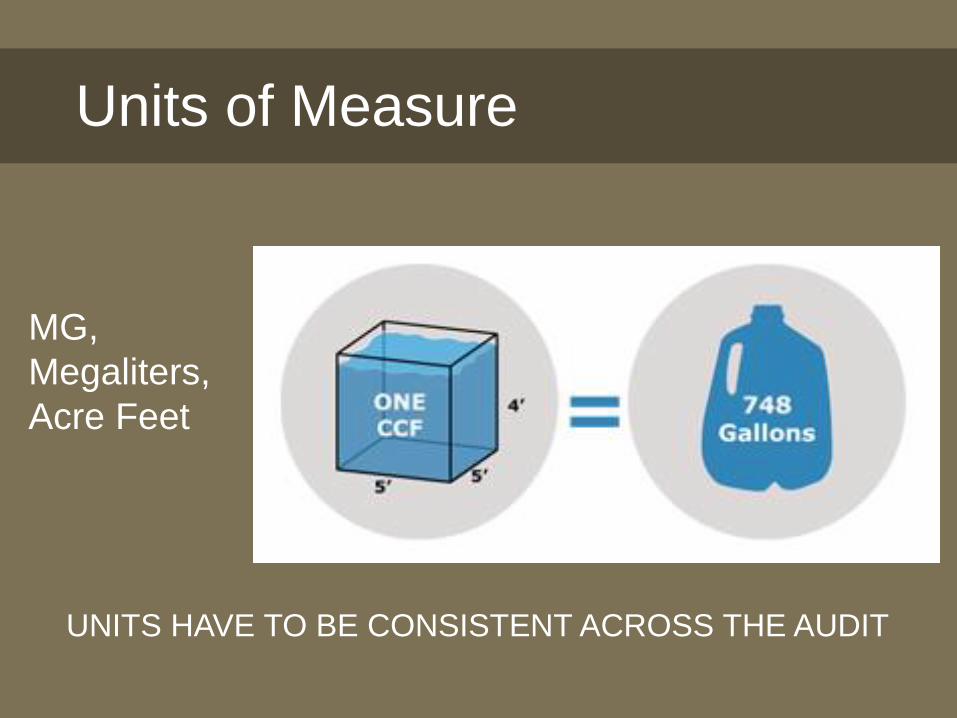
Units of Measure
MG,
Megaliters,
Acre Feet
UNITS HAVE TO BE CONSISTENT ACROSS THE AUDIT
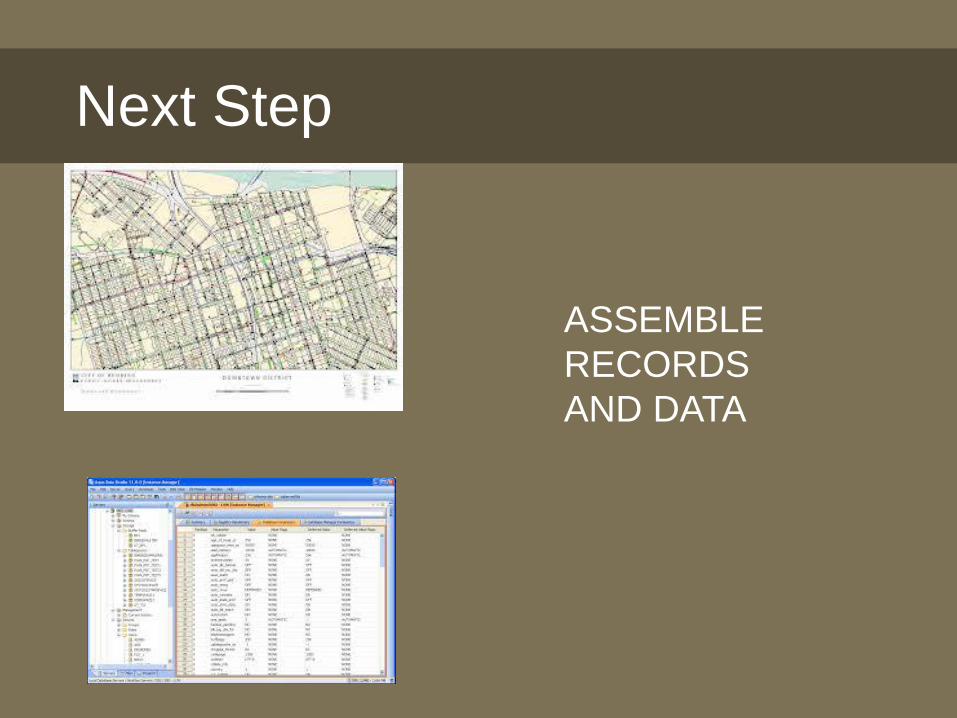
Next Step
ASSEMBLE
RECORDS
AND DATA
Water Audit Report for:
Reporting Year:
All volumes to be entered as: MILLION GALLONS (US) PER YEAR
Master Meter Error Adjustments
WATER SUPPLIED Pcnt: Value:
Volume from own sources: 5 1,000.000 MG/Yr 1 MG/Yr
Water imported: MG/Yr MG/Yr
Water exported: 1 100.000 MG/Yr 9 MG/Yr
Enter negative % or value for under-registration
WATER SUPPLIED: 825.000 MG/Yr Enter positive % or value for over-registration.
AUTHORIZED CONSUMPTION
Billed metered: 8 700.000 MG/Yr
Billed unmetered: 9 50.000 MG/Yr
Unbilled metered: MG/Yr Pcnt: Value:
Unbilled unmetered: 9 10.313 MG/Yr 1.25% MG/Yr24061
AUTHORIZED CONSUMPTION: 760.313 MG/Yr
WATER LOSSES (Water Supplied - Authorized Consumption) 64.688 MG/Yr
Apparent Losses Pcnt: Value:
Unauthorized consumption: 10 3.000 MG/Yr 0.25% MG/Yr
Customer metering inaccuracies: 5 7.071 MG/Yr 1.00% MG/Yr
Systematic data handling errors: 4 5.000 MG/Yr 0.25% MG/Yr
Apparent Losses: 15.071 MG/Yr
Real Losses (Current Annual Real Losses or CARL)
Real Losses = Water Losses - Apparent Losses: 49.617 MG/Yr
WATER LOSSES: 64.688 MG/Yr
NON-REVENUE WATER
NON-REVENUE WATER: 75.000 MG/Yr
= Water Losses + Unbilled Metered + Unbilled Unmetered
SYSTEM DATA
Length of mains: 7 100.0 miles
Number of active AND inactive service connections: 6 1,000
Service connection density: 10 conn./mile main
Yes
Average length of customer service line: ft
Average operating pressure: 6 60.0 psi
COST DATA
Total annual cost of operating water system: 5 $1,000,000 $/Year
Customer retail unit cost (applied to Apparent Losses): 7 $3.50
Variable production cost (applied to Real Losses): 7 $3,000.00 $/Million gallons
WATER AUDIT DATA VALIDITY SCORE:
PRIORITY AREAS FOR ATTENTION:
1: Volume from own sources
2: Customer metering inaccuracies
3: Total annual cost of operating water system
Based on the information provided, audit accuracy can be improved by addressing the following components:
$/1000 gallons (US)
100.000
<----------- Enter grading in column 'E' and 'J' ---------->
Unauthorized consumption volume entered is greater than the recommended default value
5.000
*** YOUR SCORE IS: 60 out of 100 ***
A weighted scale for the components of consumption and water loss is included in the calculation of the Water Audit Data Validity Score
100.000
3.000
25.000
Average length of customer service line has been set to zero and a data grading score of 10 has been applied
Are customer meters typically located at the curbstop or property line?
AWWA Free Water Audit Software:
Reporting Worksheet
Default option selected for Unbilled unmetered - a grading of 5 is applied but not displayed
1.000
2013 1/2013 - 12/2013
Northern San Leandro Combined Water Sewer Storm Utility District (0007900)
?
?
?
?
?
? Click to access definition
?
?
?
?
?
?
Please enter data in the white cells below. Where available, metered values should be used; if metered values are unavailable please estimate a value. Indicate your confidence in the accuracy of the input data by grading each component (n/a or 1-10) using the drop-down list to the left of the input cell. Hover the mouse over the cell to obtain a description of the grades
?
?
?
?
?
?
(length of service line, beyond the property boundary, that is the responsibility of the utility)
Use buttons to selectpercentage of water
suppliedOR
value
?Click here:
for help using option buttons below
?
?
?
?
+
+ Click to add a comment
WAS v5.0
+
+
+
+
+
+
American Water Works Association.Copyright © 2014, All Rights Reserved.
?
?
?
+
+
+
+
+
+
+
+
+
+
+
+
+ Use Customer Retail Unit Cost to value real losses
?
To select the correct data grading for each input, determine the highest grade where the utility meets or exceeds all criteria for that grade and all grades below it.
Let’s Look
Closer At
How the
Water
Audit
Software
Works

DATA FITS INTO 5 CATEGORIES
Water Supplied
Water Delivered
to Customers
System
Characteristics
Financial
Information
Other
Information
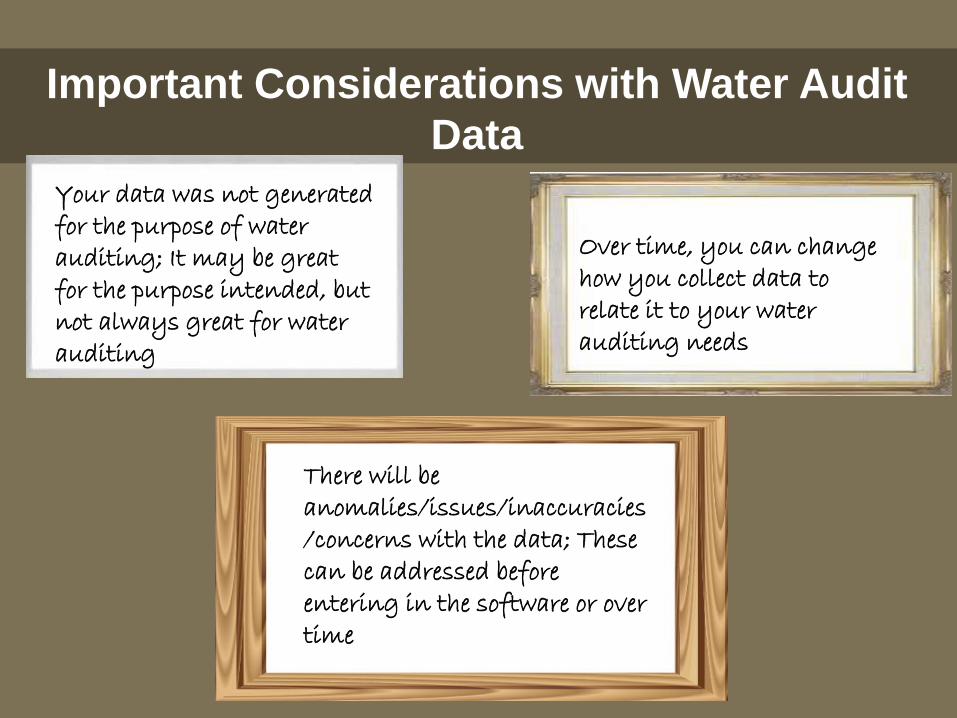
Important Considerations with Water Audit
Data
Your data was not generated for the purpose of water auditing; It may be great for the purpose intended, but not always great for water auditing
There will be anomalies/issues/inaccuracies/concerns with the data; These can be addressed before entering in the software or over time
Over time, you can change how you collect data to relate it to your water auditing needs
How do you
collect your
data?
by hand
electronically
Where do you
store your data?

I don’t have any good data regarding what is going on in my system. Can I really do a water audit?
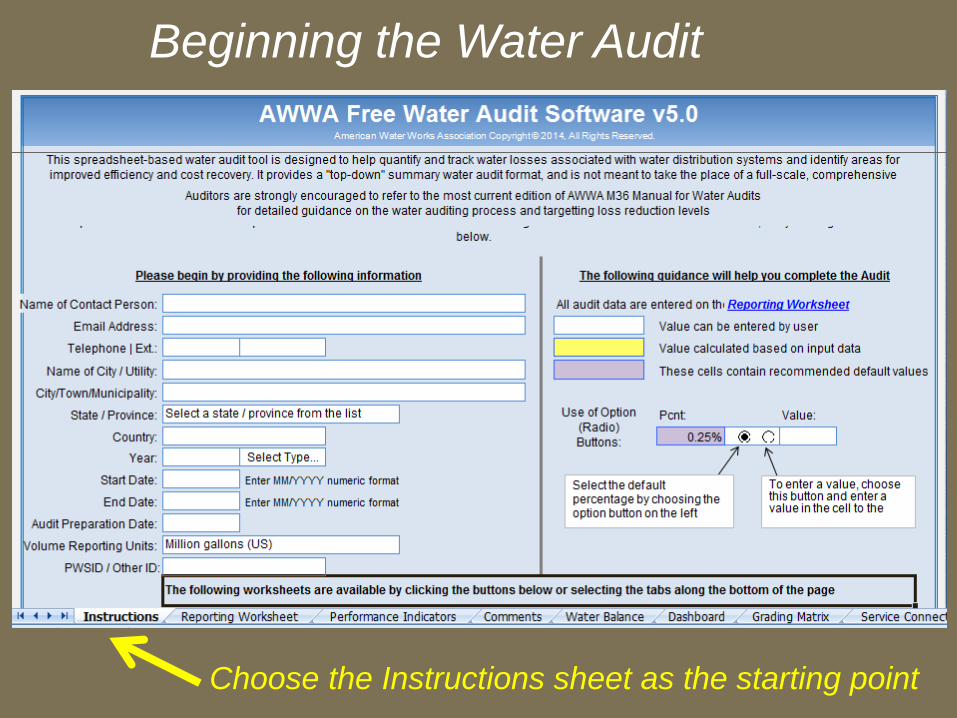
Beginning the Water Audit
Choose the Instructions sheet as the starting point
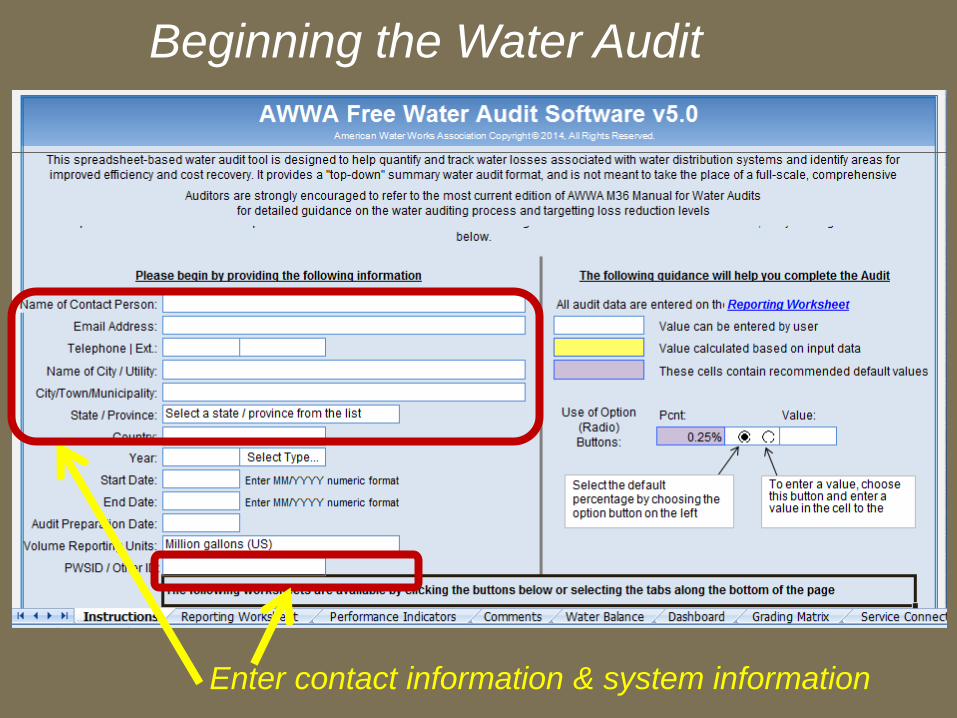
Beginning the Water Audit
Enter contact information & system information
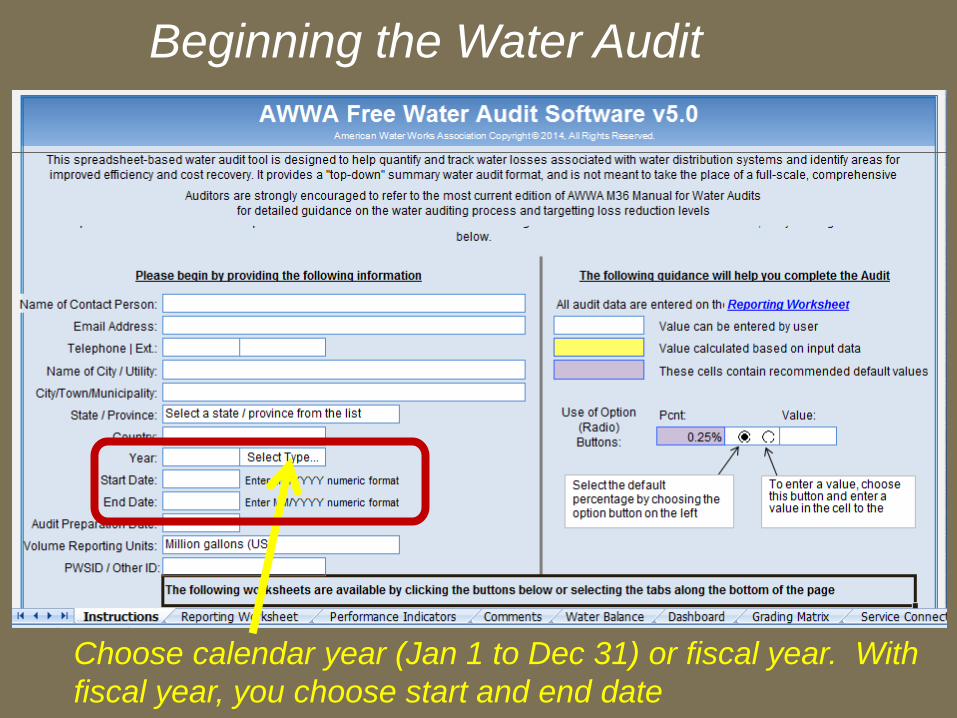
Beginning the Water Audit
Choose calendar year (Jan 1 to Dec 31) or fiscal year. With
fiscal year, you choose start and end date
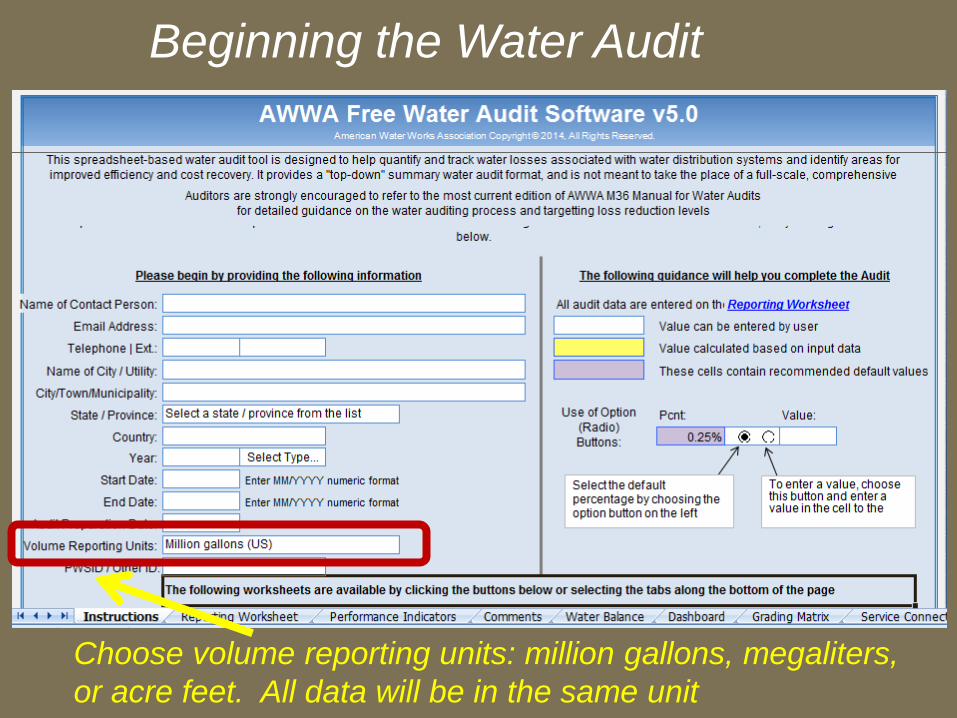
Beginning the Water Audit
Choose volume reporting units: million gallons, megaliters,
or acre feet. All data will be in the same unit
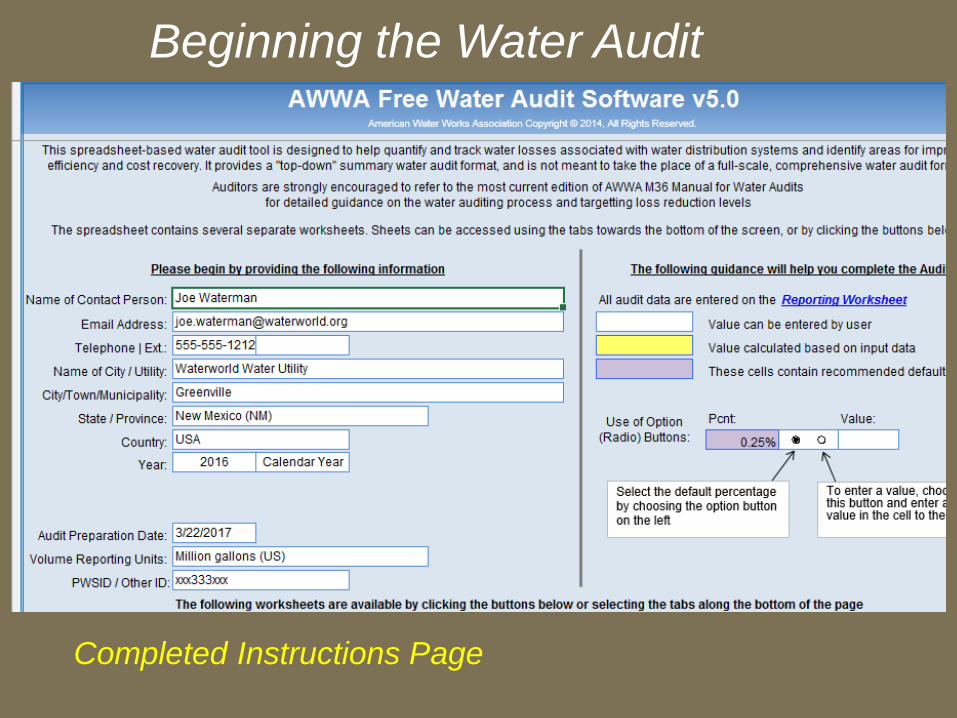
Beginning the Water Audit
Completed Instructions Page
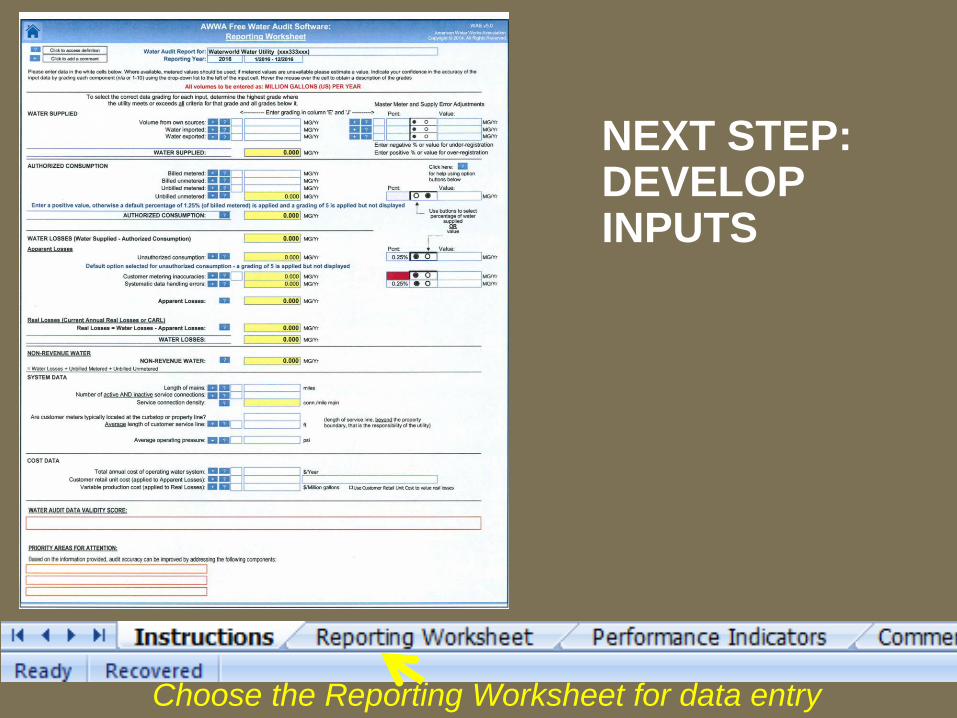
NEXT STEP: DEVELOP INPUTS
Choose the Reporting Worksheet for data entry
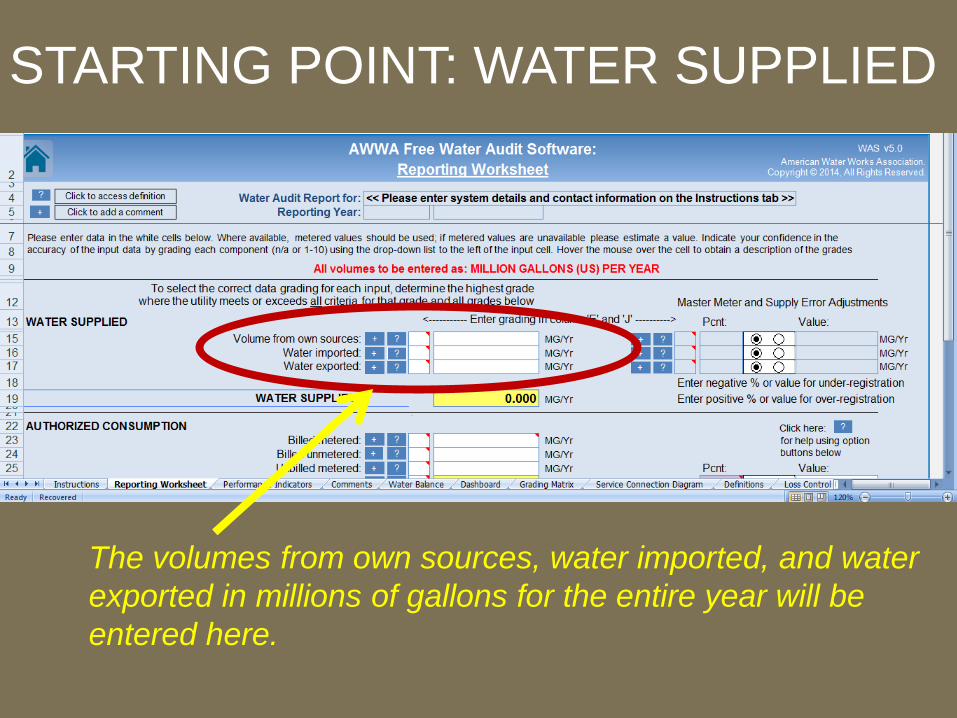
STARTING POINT: WATER SUPPLIED
The volumes from own sources, water imported, and water
exported in millions of gallons for the entire year will be
entered here.
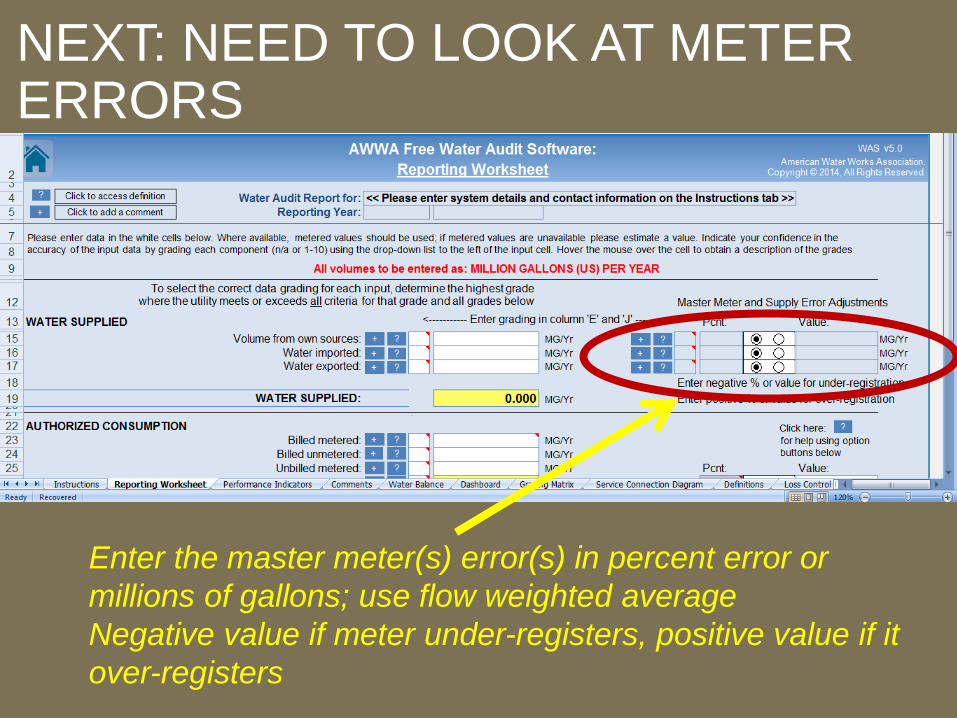
NEXT: NEED TO LOOK AT METER ERRORS
Enter the master meter(s) error(s) in percent error or
millions of gallons; use flow weighted average
Negative value if meter under-registers, positive value if it
over-registers
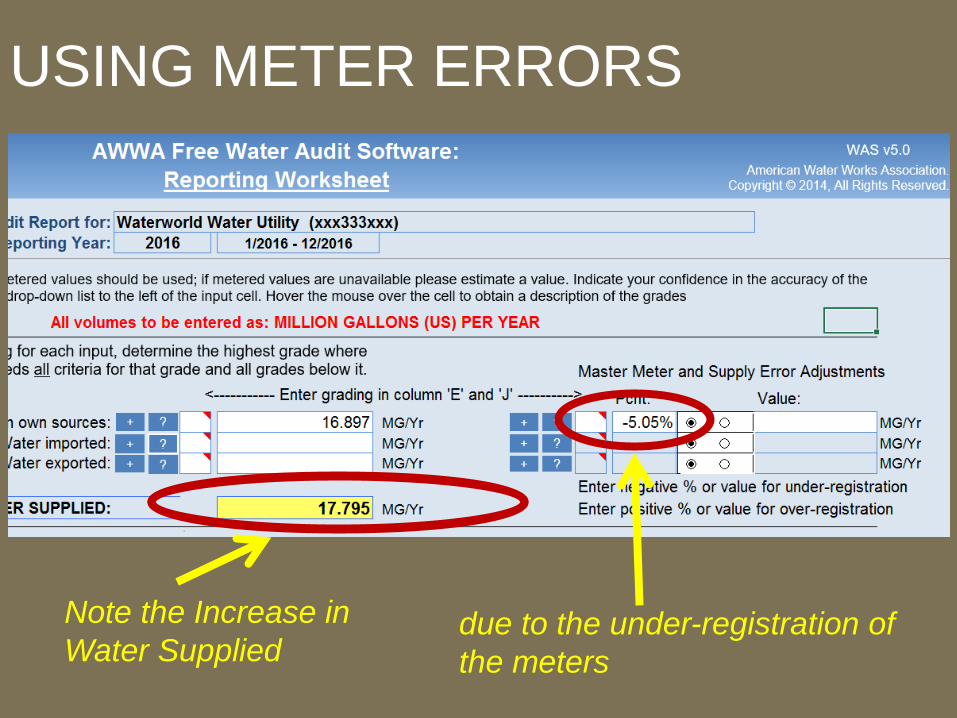
USING METER ERRORS
Note the Increase in
Water Supplieddue to the under-registration of
the meters
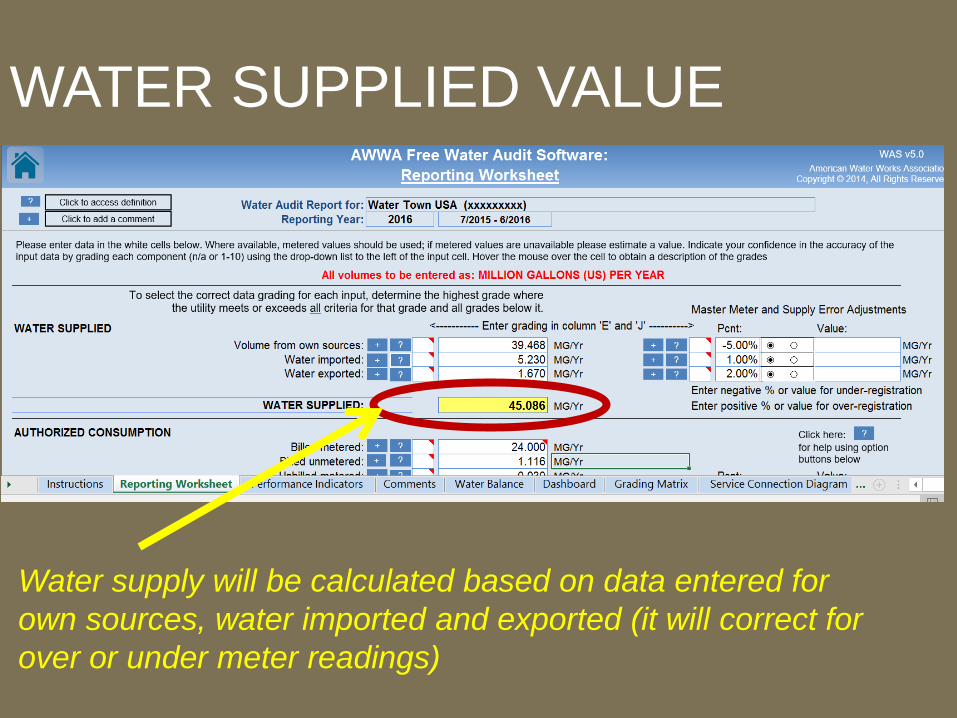
WATER SUPPLIED VALUE
Water supply will be calculated based on data entered for
own sources, water imported and exported (it will correct for
over or under meter readings)
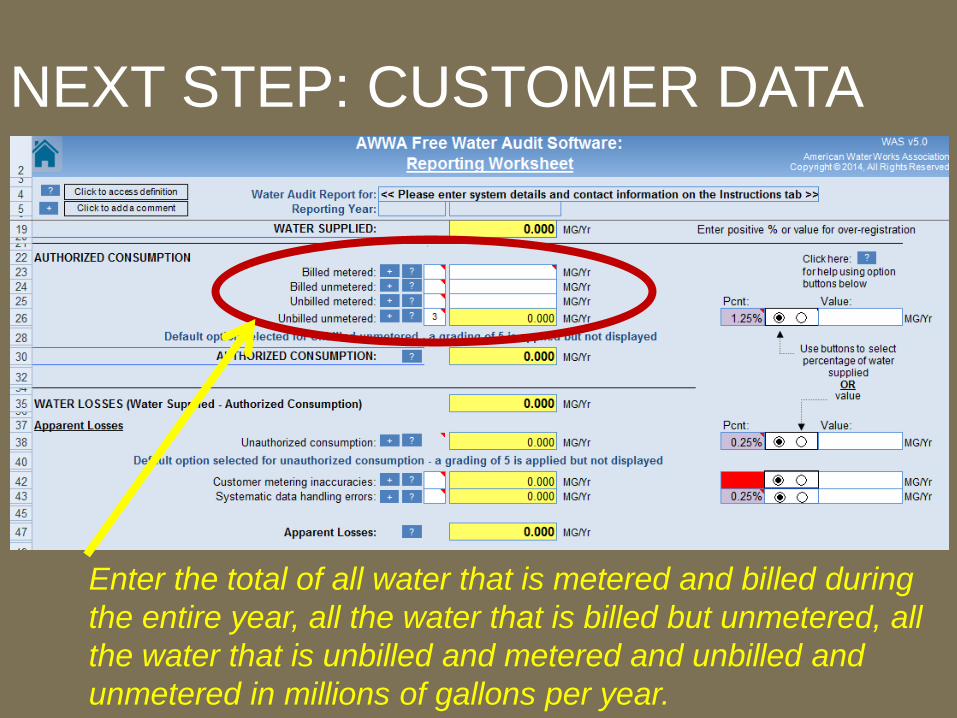
NEXT STEP: CUSTOMER DATA
Enter the total of all water that is metered and billed during
the entire year, all the water that is billed but unmetered, all
the water that is unbilled and metered and unbilled and
unmetered in millions of gallons per year.
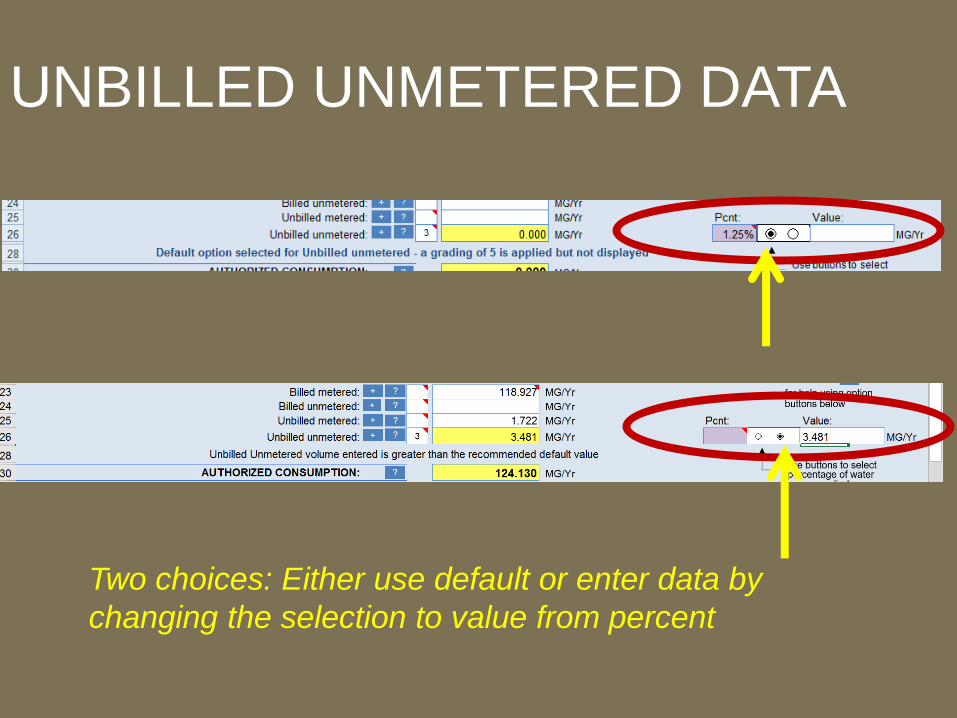
UNBILLED UNMETERED DATA
Two choices: Either use default or enter data by
changing the selection to value from percent
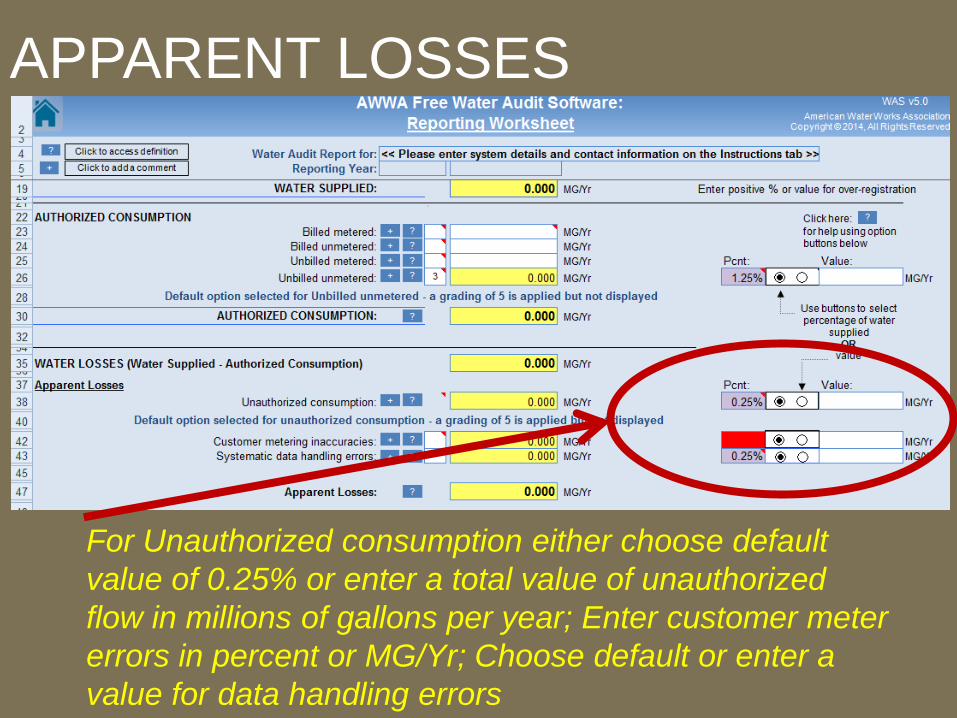
APPARENT LOSSES
For Unauthorized consumption either choose default
value of 0.25% or enter a total value of unauthorized
flow in millions of gallons per year; Enter customer meter
errors in percent or MG/Yr; Choose default or enter a
value for data handling errors
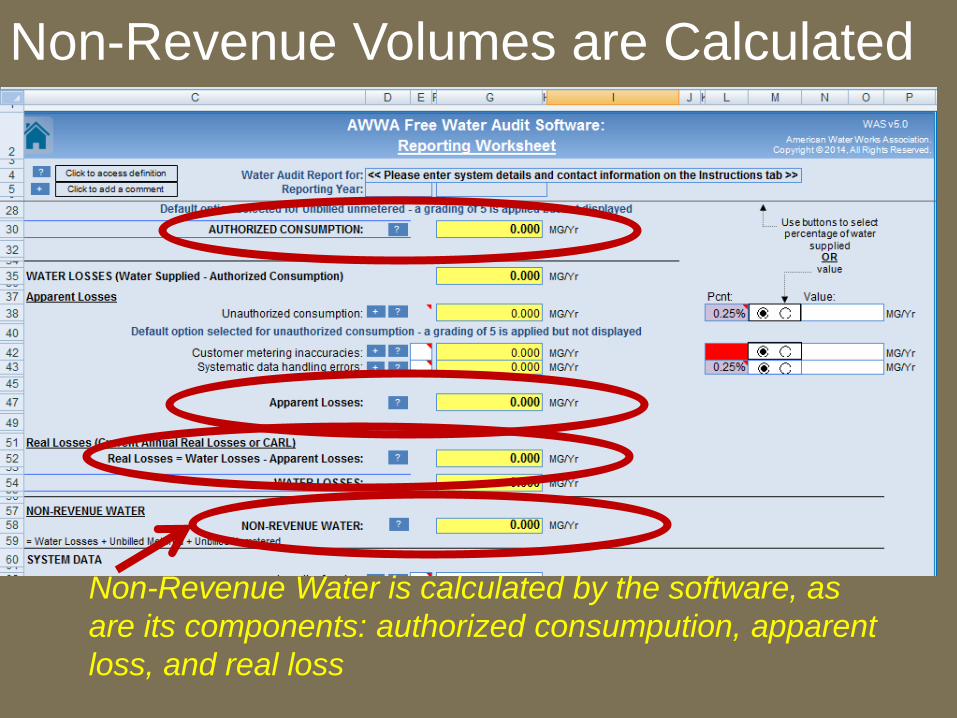
Non-Revenue Volumes are Calculated
Non-Revenue Water is calculated by the software, as
are its components: authorized consumpution, apparent
loss, and real loss
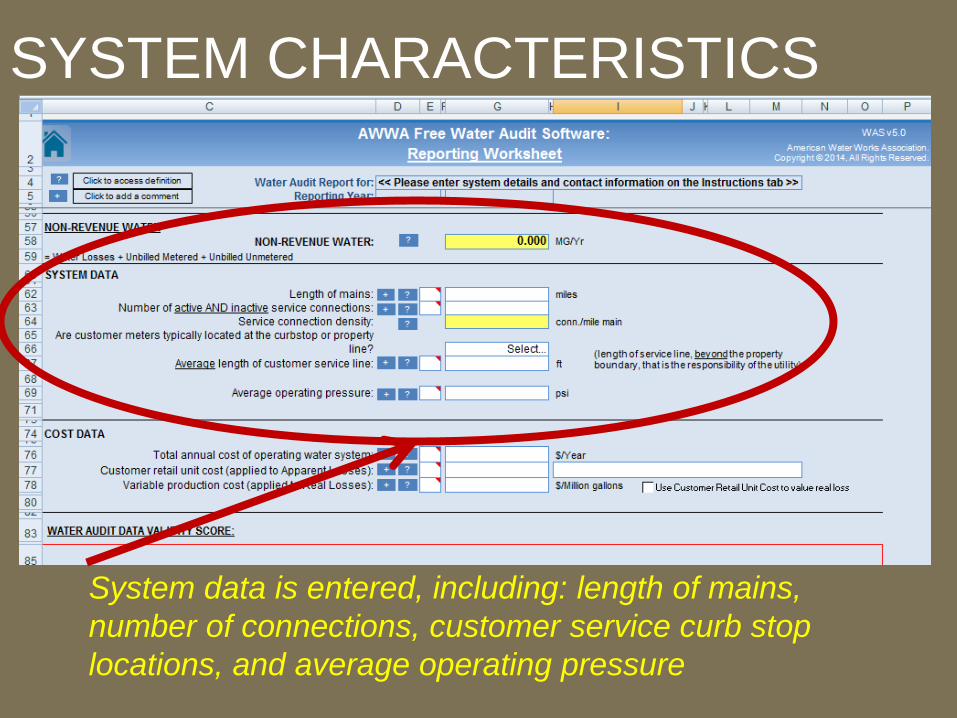
SYSTEM CHARACTERISTICS
System data is entered, including: length of mains,
number of connections, customer service curb stop
locations, and average operating pressure
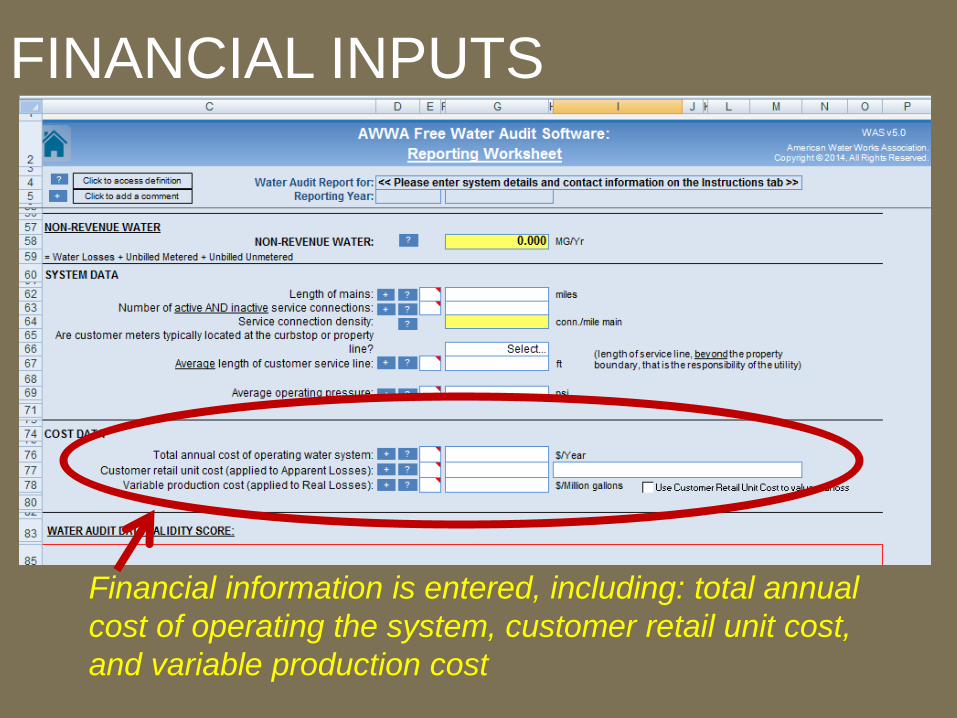
FINANCIAL INPUTS
Financial information is entered, including: total annual
cost of operating the system, customer retail unit cost,
and variable production cost
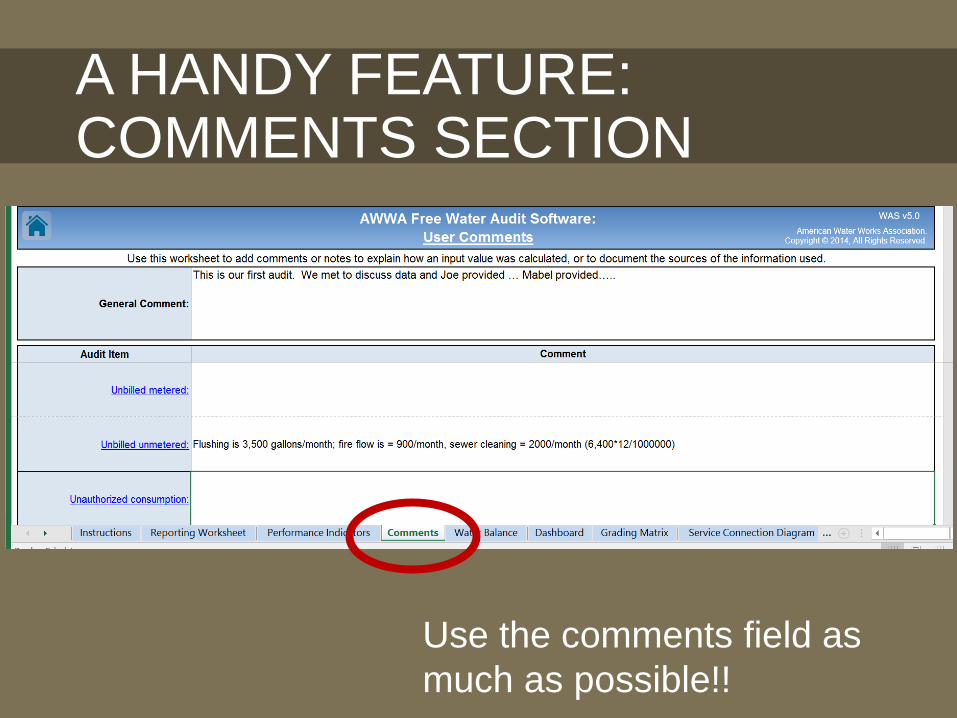
A HANDY FEATURE: COMMENTS SECTION
Use the comments field as
much as possible!!

Is the data you
obtain going to
be completely
acurate?
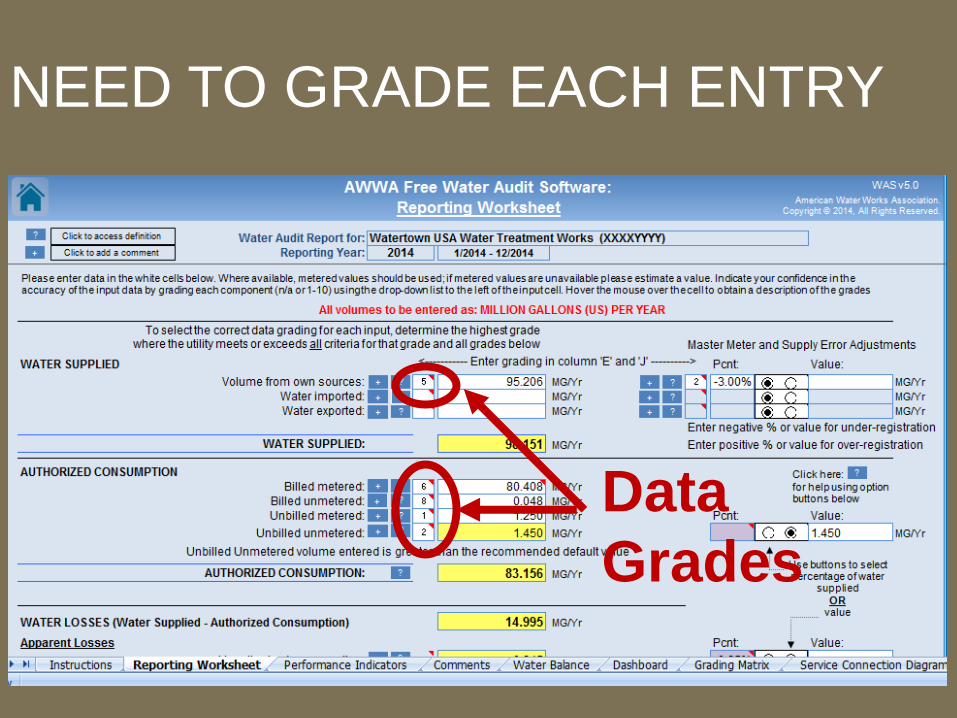
NEED TO GRADE EACH ENTRY
Data
Grades

How Do You Know What Data Grade To Use?
Hover the cursor
over the red
triangle in the
corner
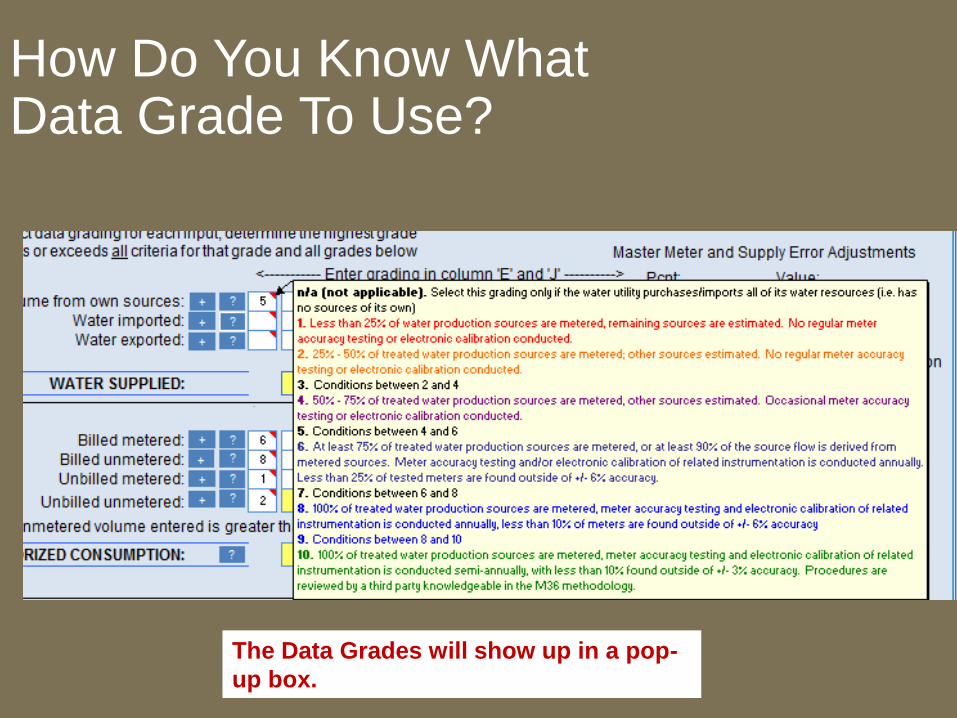
How Do You Know What Data Grade To Use?
The Data Grades will show up in a pop-
up box.
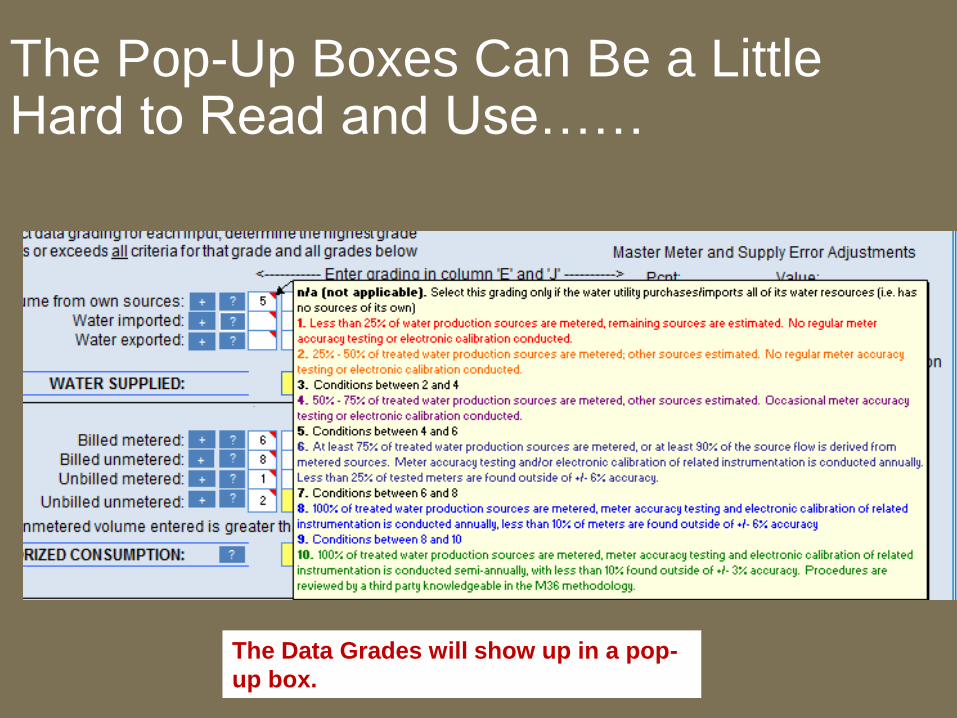
The Pop-Up Boxes Can Be a Little Hard to Read and Use……
The Data Grades will show up in a pop-
up box.
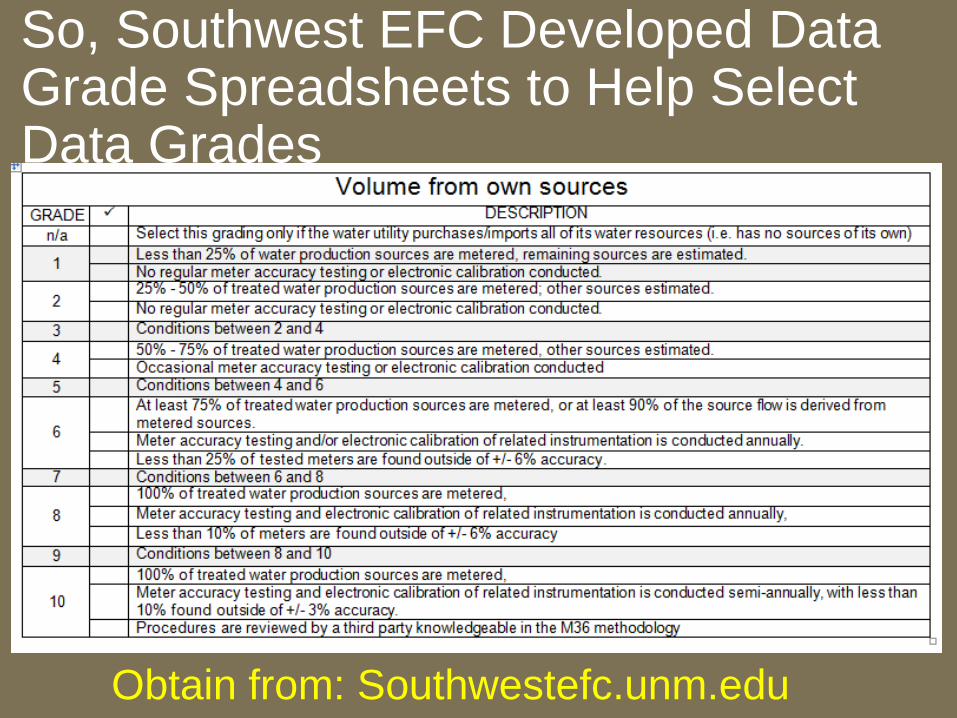
So, Southwest EFC Developed Data Grade Spreadsheets to Help Select Data Grades
Obtain from: Southwestefc.unm.edu
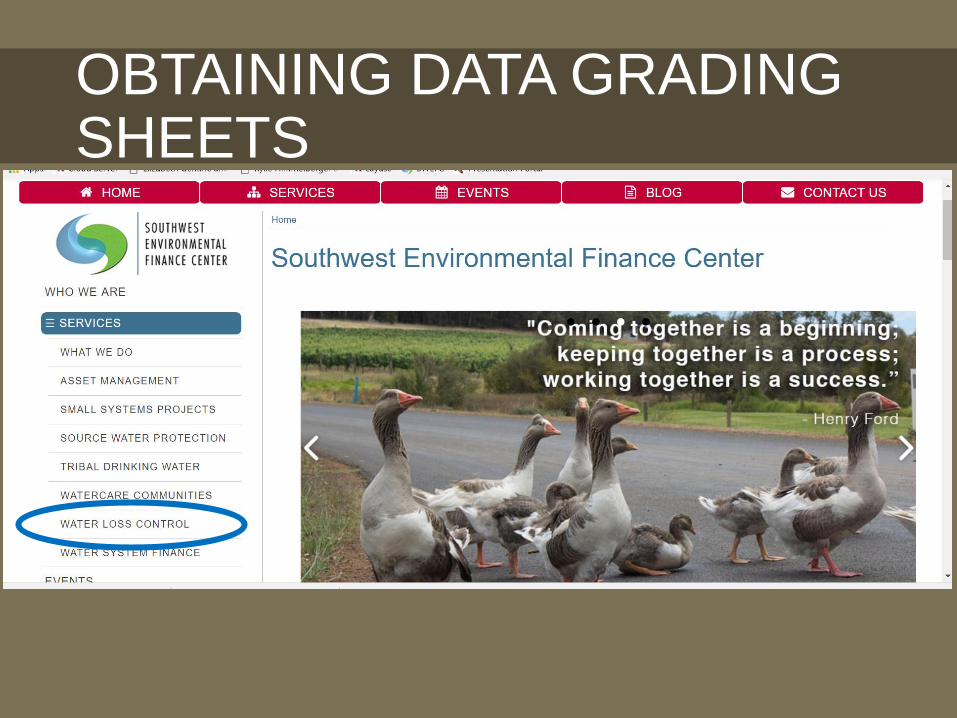
OBTAINING DATA GRADING SHEETS
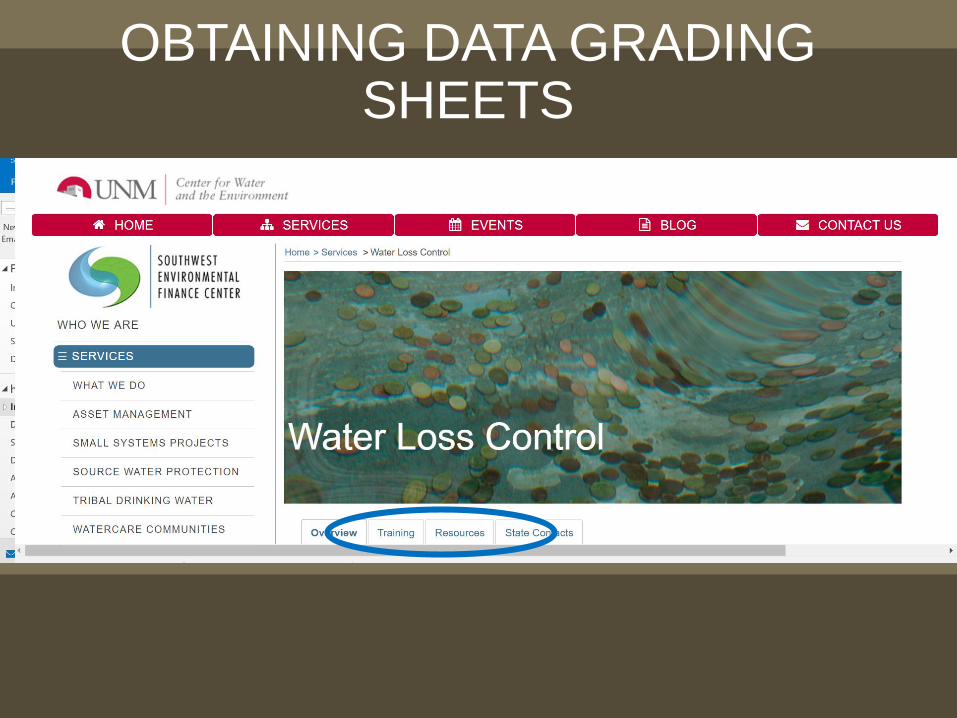
OBTAINING DATA GRADING SHEETS

OBTAINING DATA GRADING SHEETS
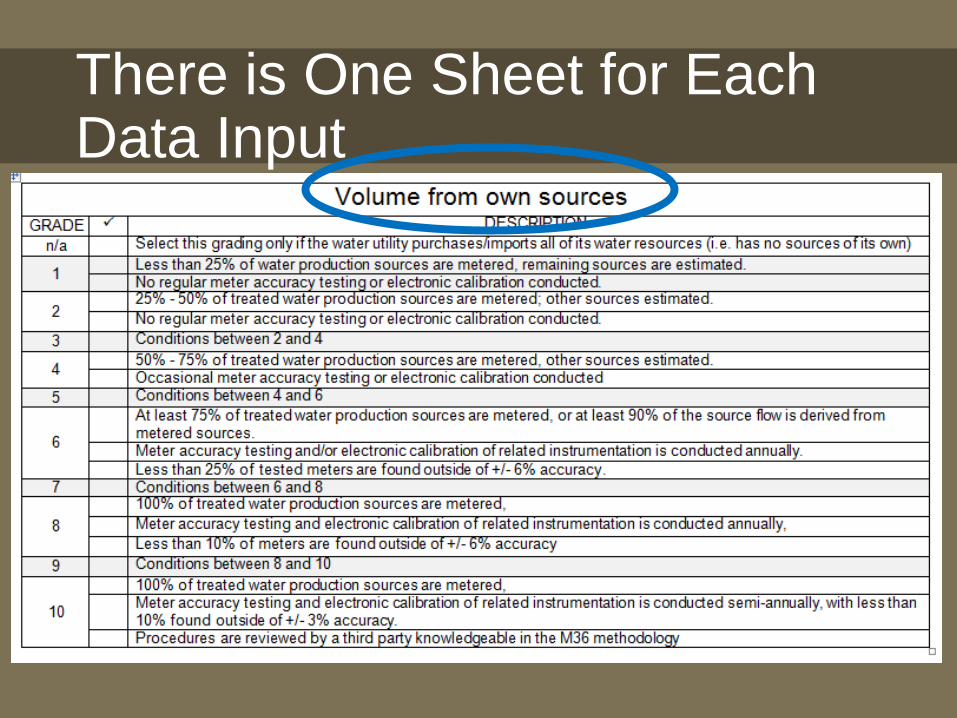
There is One Sheet for Each Data Input
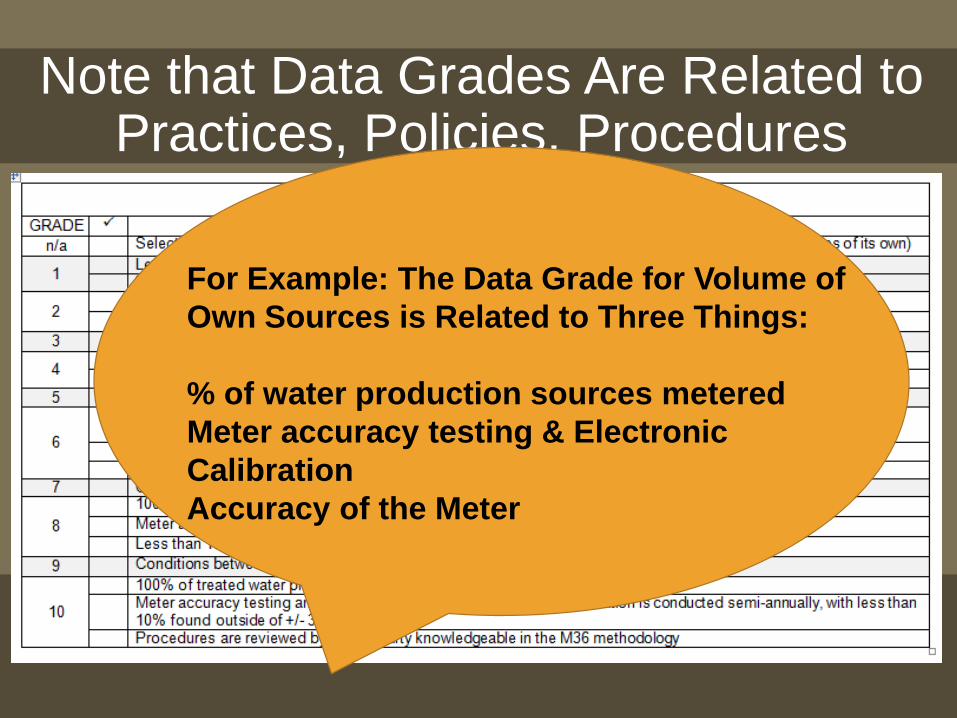
Note that Data Grades Are Related to Practices, Policies, Procedures
For Example: The Data Grade for Volume of
Own Sources is Related to Three Things:
% of water production sources metered
Meter accuracy testing & Electronic
Calibration
Accuracy of the Meter
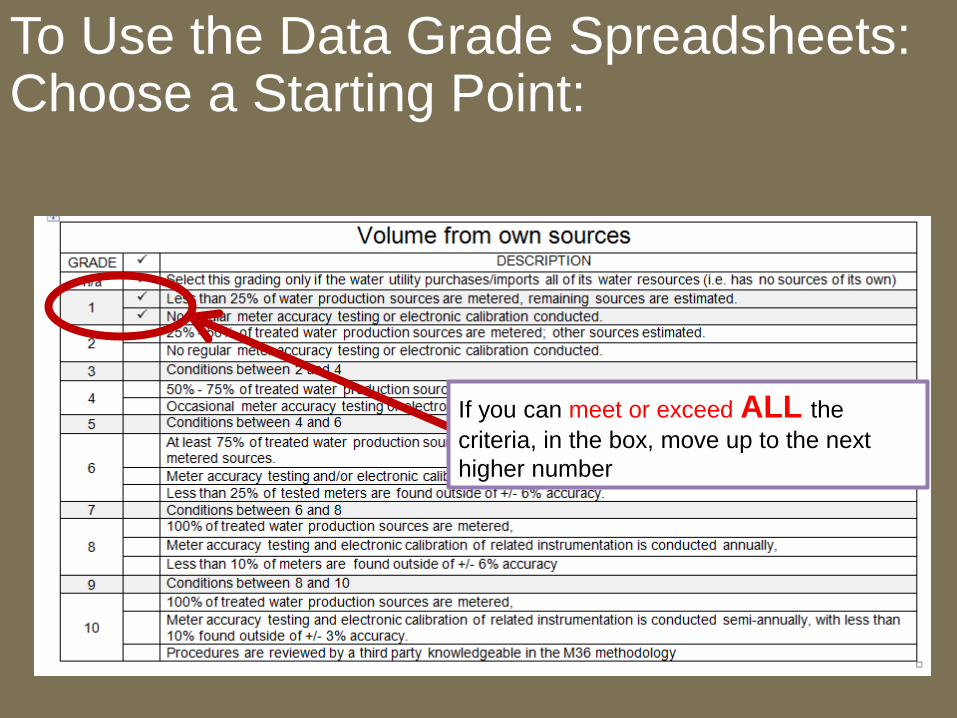
To Use the Data Grade Spreadsheets: Choose a Starting Point:
If you can meet or exceed ALL the
criteria, in the box, move up to the next
higher number
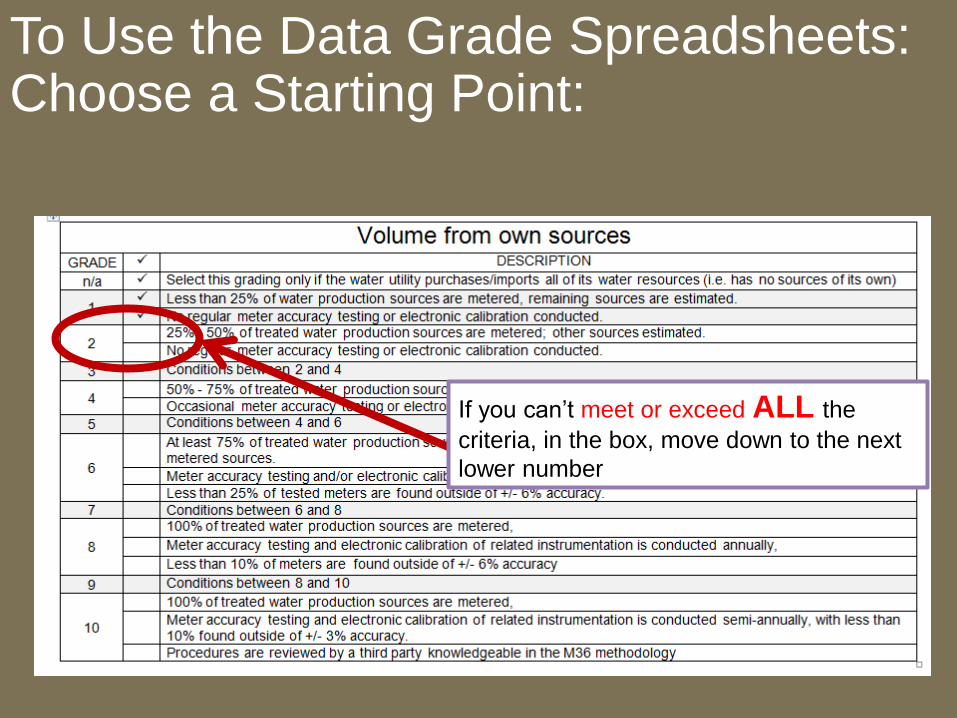
To Use the Data Grade Spreadsheets: Choose a Starting Point:
If you can’t meet or exceed ALL the
criteria, in the box, move down to the next
lower number
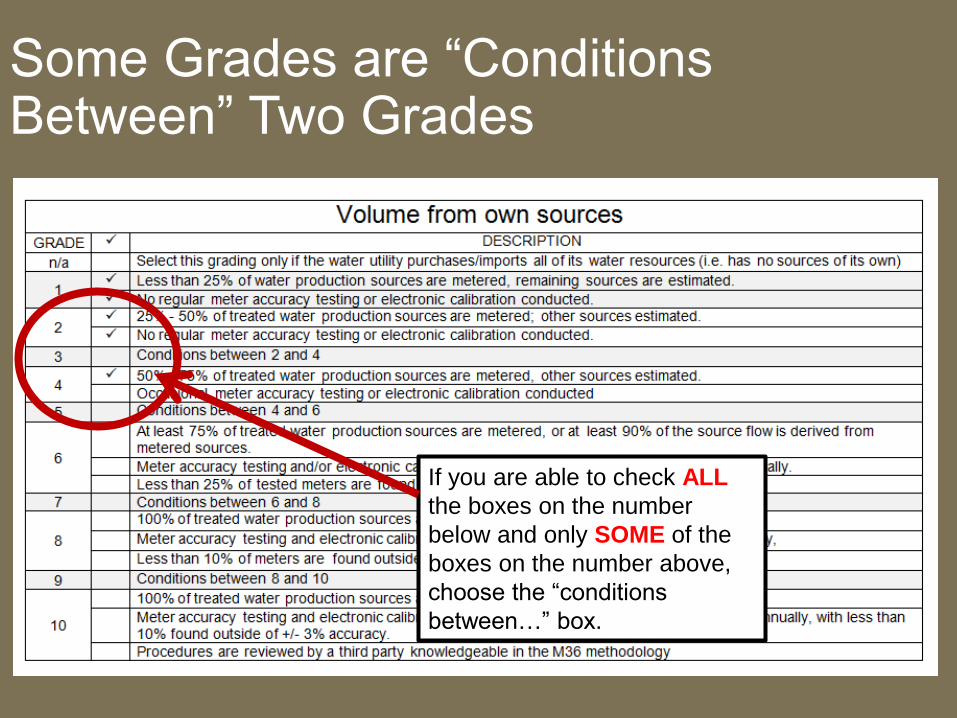
Some Grades are “Conditions Between” Two Grades
If you are able to check ALL
the boxes on the number
below and only SOME of the
boxes on the number above,
choose the “conditions
between…” box.
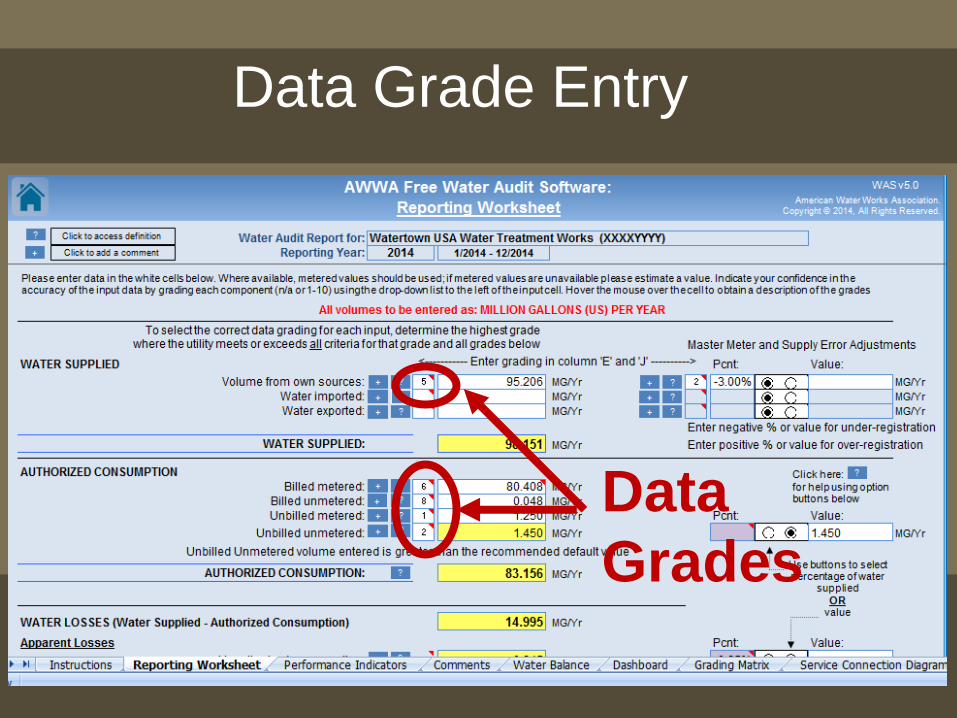
Data Grade Entry
Data
Grades
The most important thing is to make sure you are honest about what the data grade should be!!!
The right data grade is the one that accurately reflects your situation
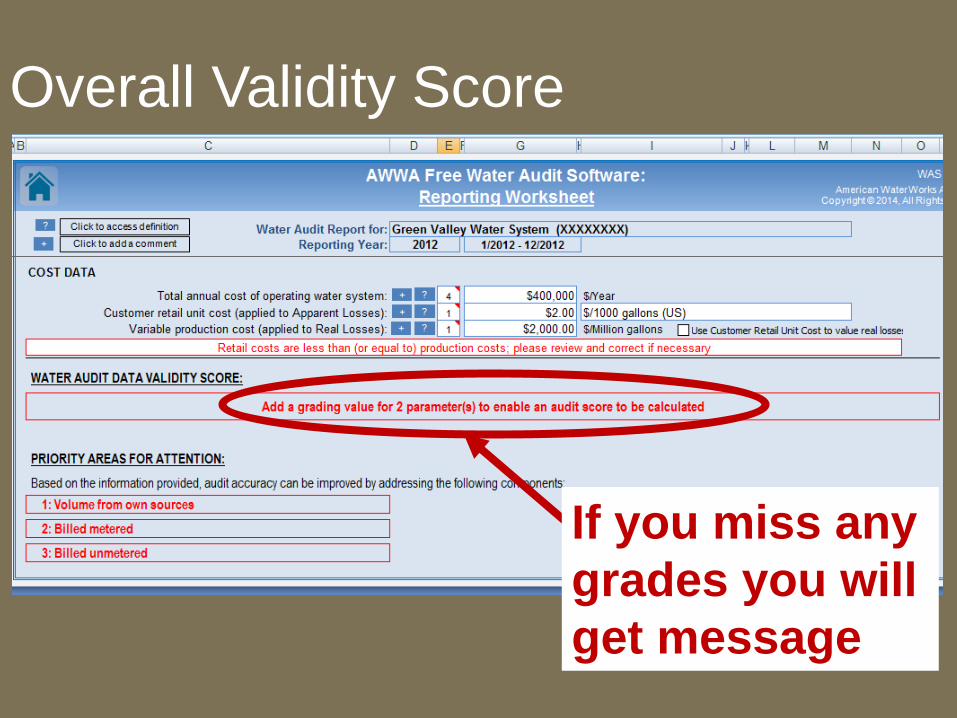
Overall Validity Score
If you miss any
grades you will
get message
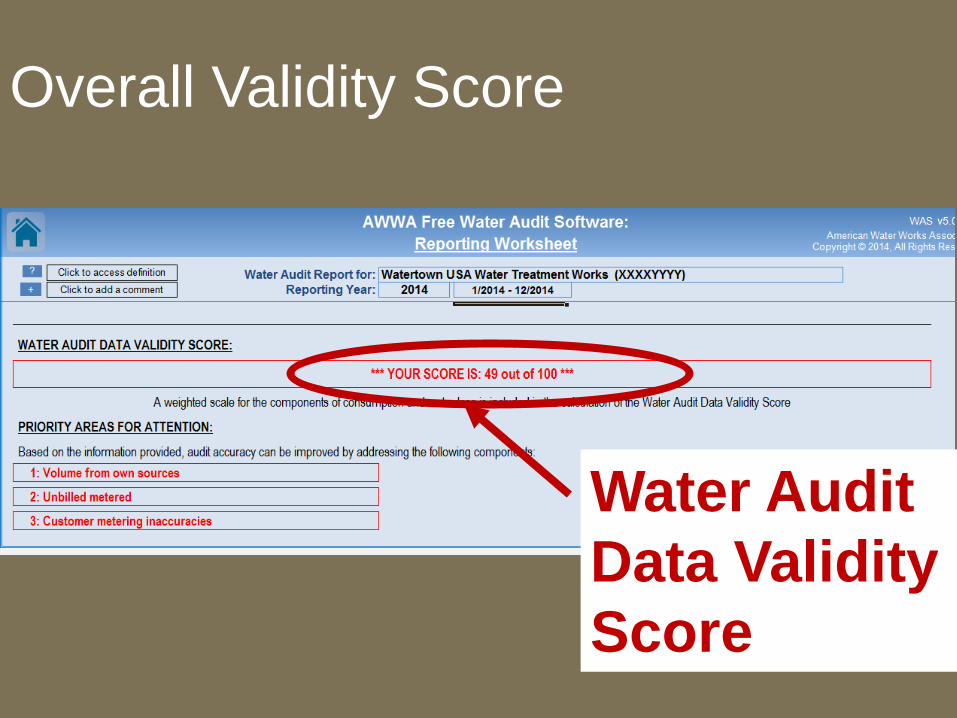
Overall Validity Score
Water Audit
Data Validity
Score
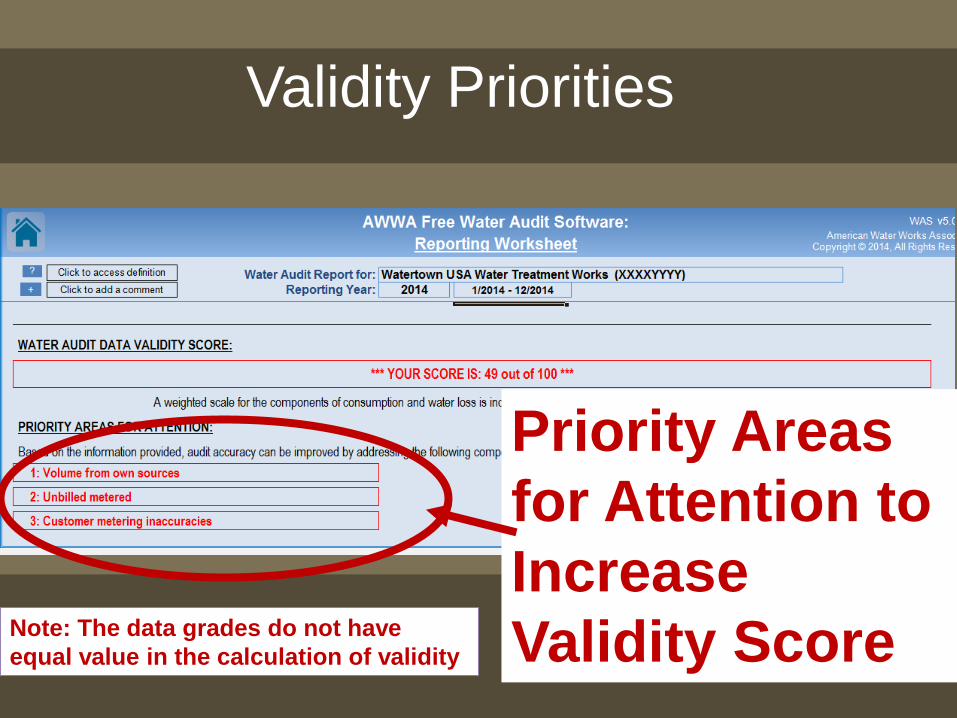
Validity Priorities
Priority Areas
for Attention to
Increase
Validity ScoreNote: The data grades do not have
equal value in the calculation of validity
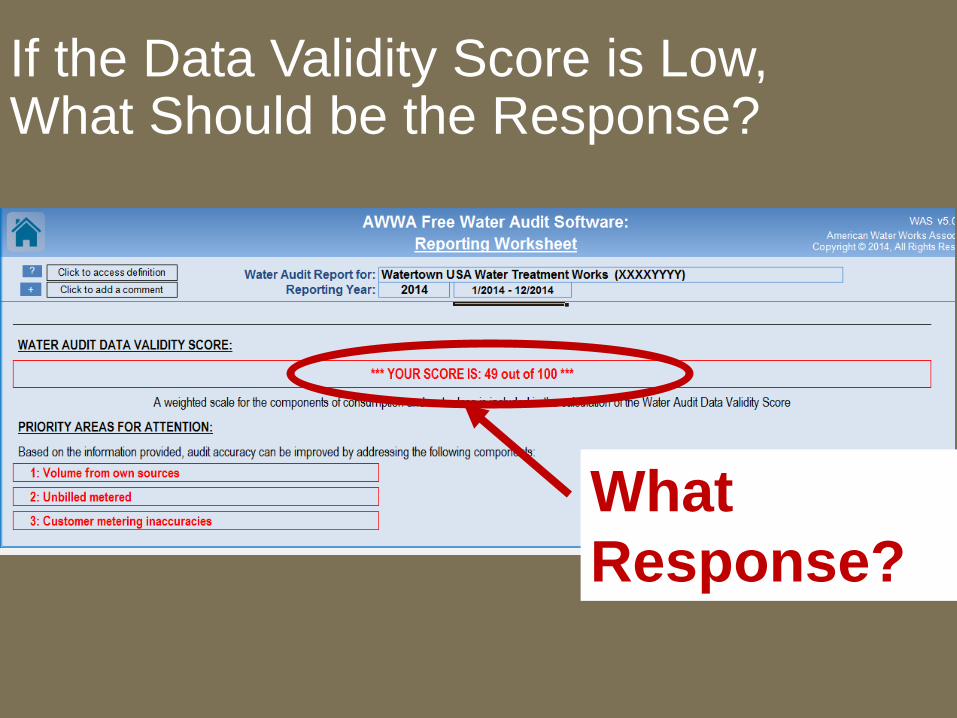
If the Data Validity Score is Low, What Should be the Response?
What
Response?
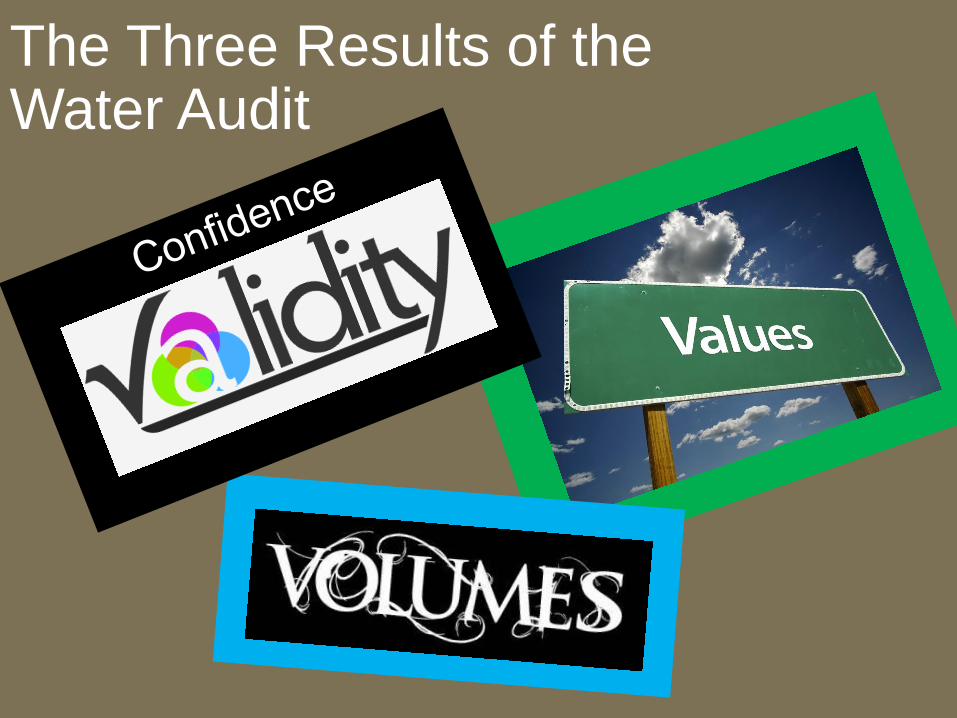
The Three Results of the Water Audit
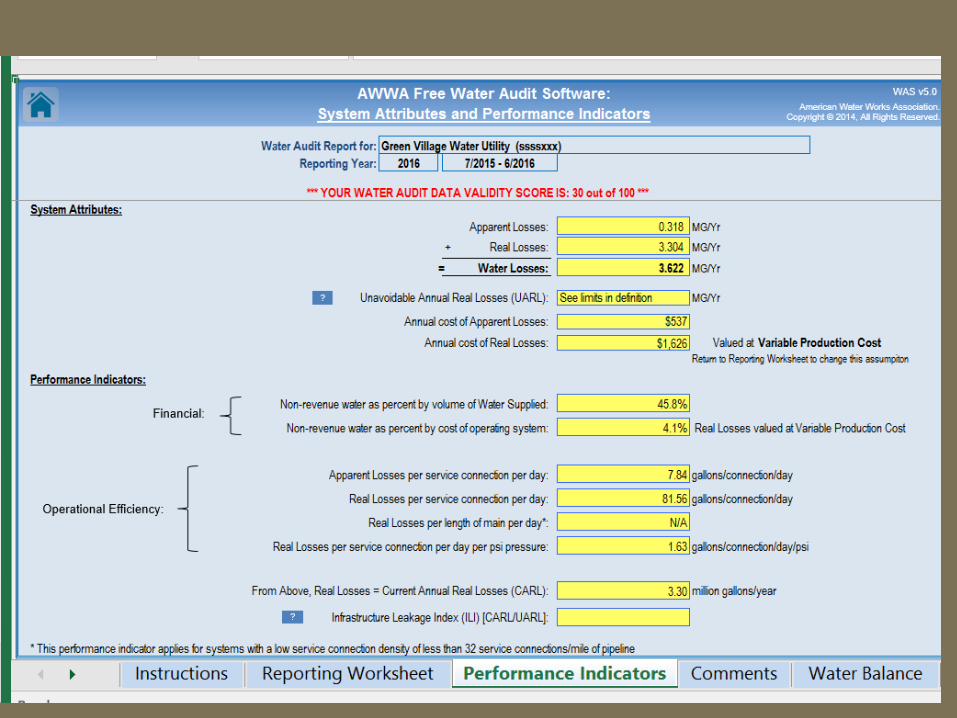
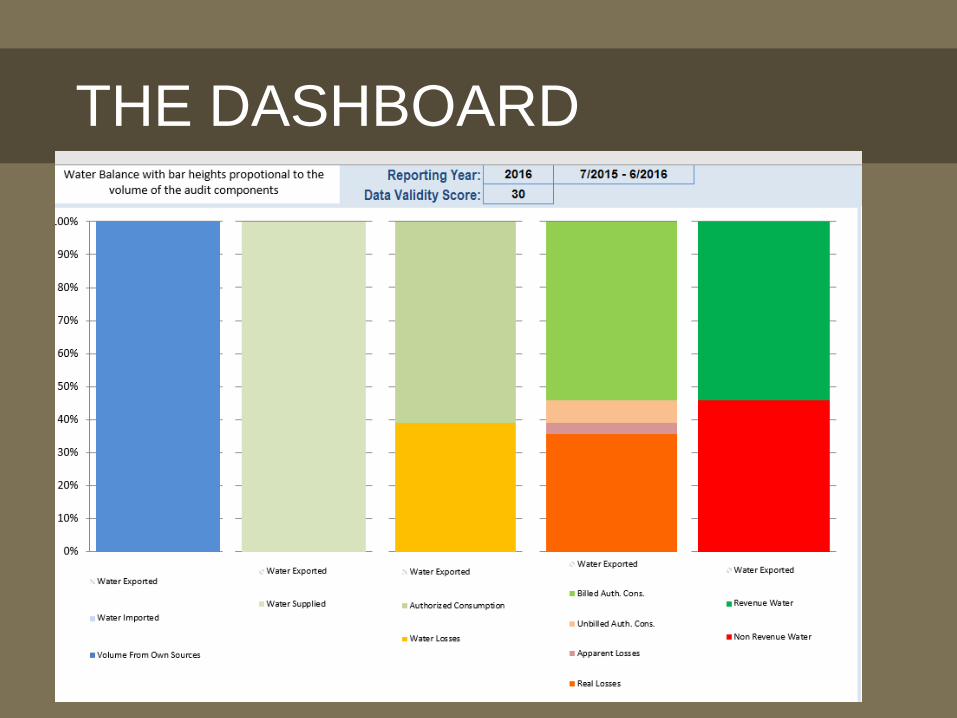
THE DASHBOARD

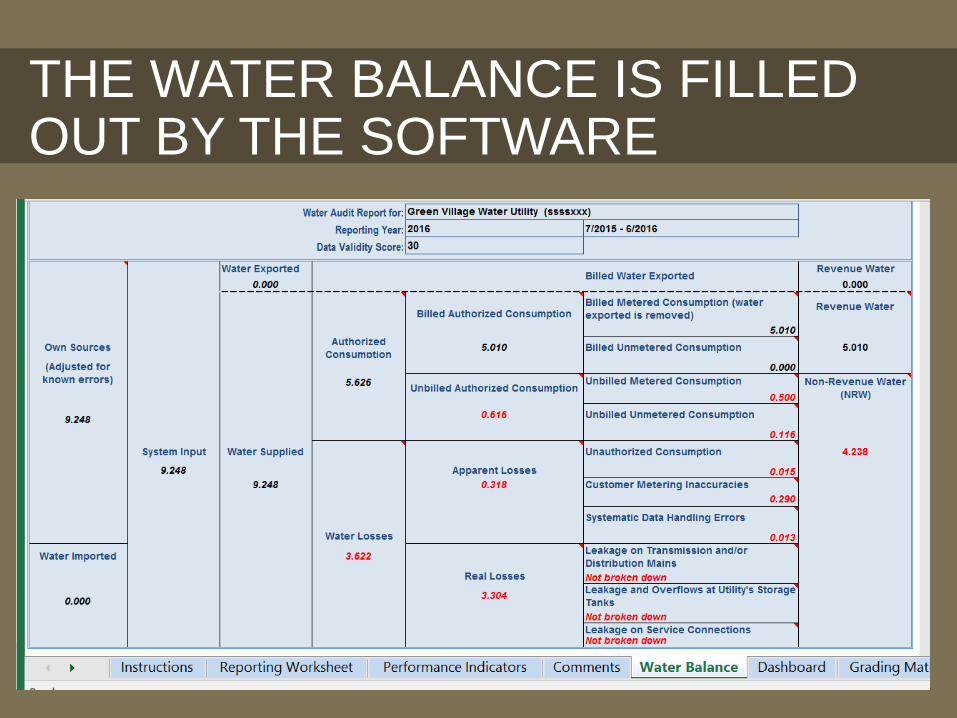
THE WATER BALANCE IS FILLED OUT BY THE SOFTWARE

WHAT TO DO NEXT: LOOK AT THE TOOLBOX
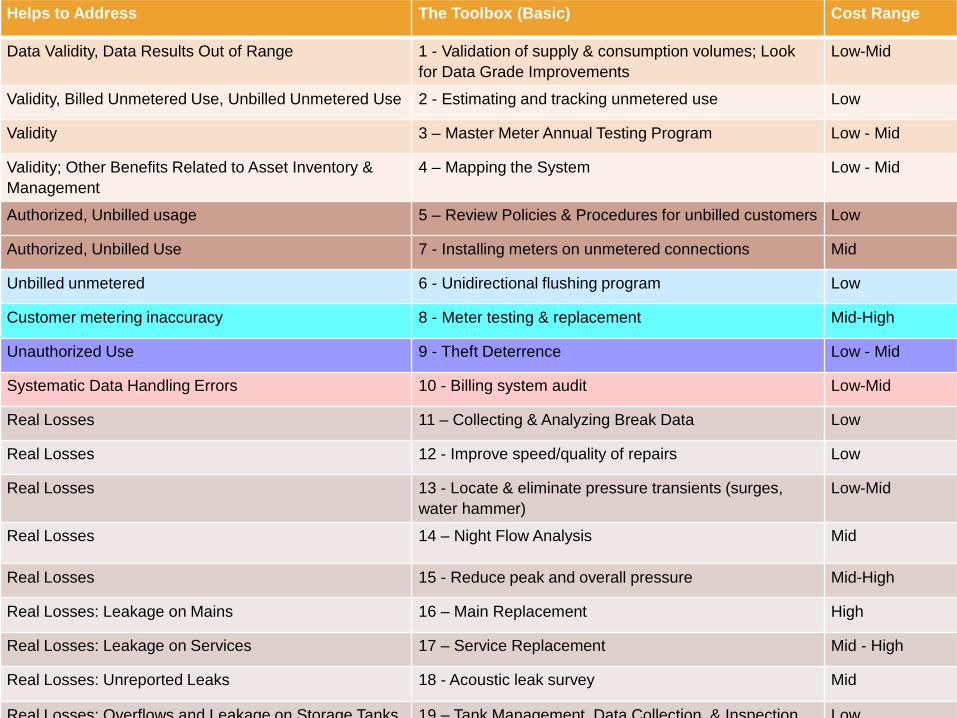
Helps to Address The Toolbox (Basic) Cost Range
Data Validity, Data Results Out of Range 1 - Validation of supply & consumption volumes; Look
for Data Grade Improvements
Low-Mid
Validity, Billed Unmetered Use, Unbilled Unmetered Use 2 - Estimating and tracking unmetered use Low
Validity 3 – Master Meter Annual Testing Program Low - Mid
Validity; Other Benefits Related to Asset Inventory &
Management
4 – Mapping the System Low - Mid
Authorized, Unbilled usage 5 – Review Policies & Procedures for unbilled customers Low
Authorized, Unbilled Use 7 - Installing meters on unmetered connections Mid
Unbilled unmetered 6 - Unidirectional flushing program Low
Customer metering inaccuracy 8 - Meter testing & replacement Mid-High
Unauthorized Use 9 - Theft Deterrence Low - Mid
Systematic Data Handling Errors 10 - Billing system audit Low-Mid
Real Losses 11 – Collecting & Analyzing Break Data Low
Real Losses 12 - Improve speed/quality of repairs Low
Real Losses 13 - Locate & eliminate pressure transients (surges,
water hammer)
Low-Mid
Real Losses 14 – Night Flow Analysis Mid
Real Losses 15 - Reduce peak and overall pressure Mid-High
Real Losses: Leakage on Mains 16 – Main Replacement High
Real Losses: Leakage on Services 17 – Service Replacement Mid - High
Real Losses: Unreported Leaks 18 - Acoustic leak survey Mid
Real Losses: Overflows and Leakage on Storage Tanks 19 – Tank Management, Data Collection, & Inspection Low

If you take the time
to do a water audit
and check the data
there are cost
benefits to doing it.

What can you do at your own facility

Don’t Let what you can’t do stop you from doing what you can do.

CONTACT US WITH
QUESTIONS OR FOR HELP
HEATHER HIMMELBERGER
http://efcnetwork.org
DAWN NALL
http://efcnetwork.org