Embed Size (px)
Citation preview
1
Water and SanitationStudies for the City of
Paraty, Brazil
Water SolutionsNancy Choi, Claire Kfouri,Hyo Jin Kweon, Eun Chu YouAdvisors: Prof. Harleman, Frederic Chagnon
Background on Paraty
• Municipal in the State of Rio deJaneiro– Area: 930 km2
– Population: 30,000• Urban 15,000
• Tourist city: UNESCO WorldHeritage Site Candidate
• Three main sections:– Historical downtown– “Upper” part of city– “Ilha das Cobras”
2
Water and Sanitation Service Coverageand Health Consequences
• Developing countries have prevalent healthproblems due to lack of water and sanitation.
• Paraty’s service coverage:– 60% potable water; 12% sewerage connection
• Water and sanitation-related diseases– 32% of all hospital admissions in Brazil– >100 diarrhea cases/month (443 diarrhea cases
from 9/02 to 12/02) in Paraty– Include: diarrhea, typhoid, viral hepatitis A,
cholera, dysentery, guinea worm disease
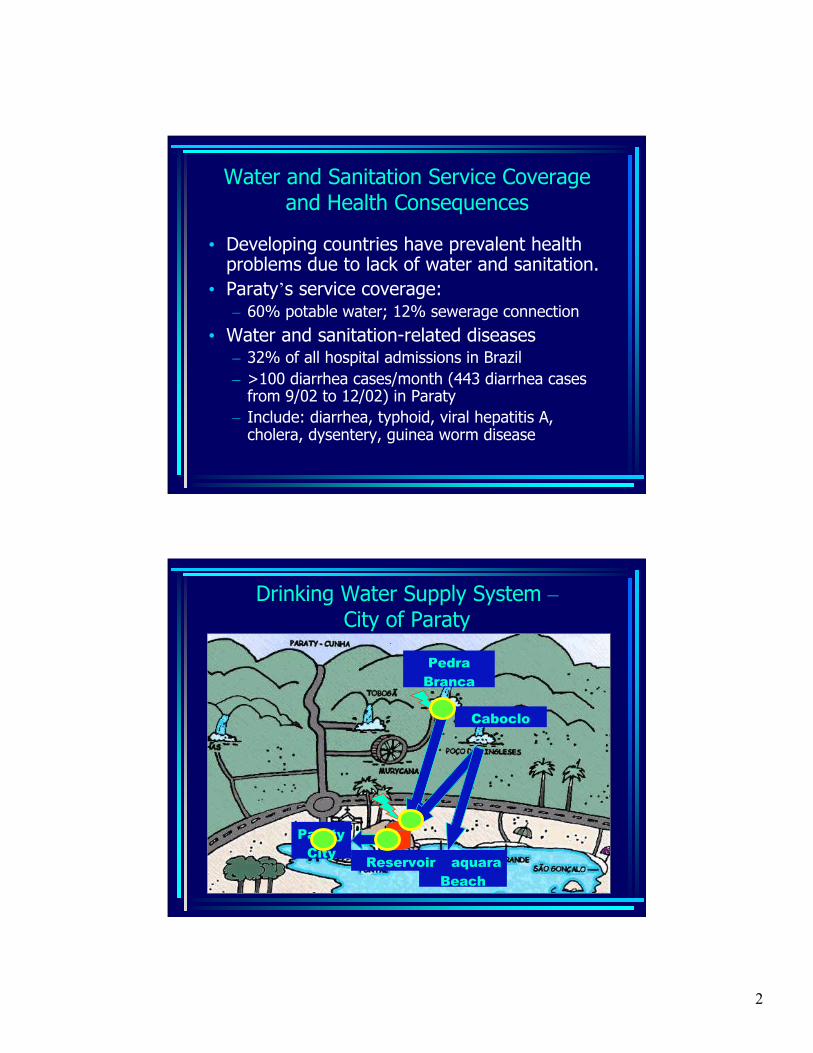
Drinking Water Supply System –City of Paraty
PedraBranca
Caboclo
JabaquaraBeach
ParatyCity
Reservoir
3
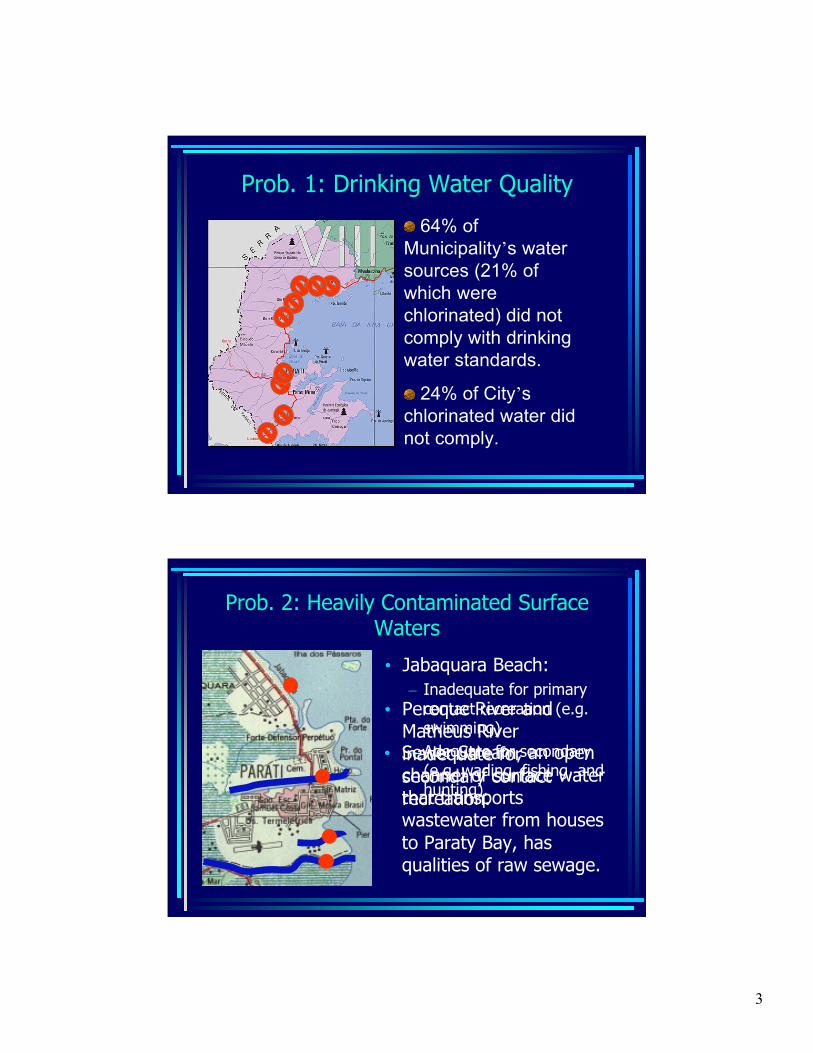
Prob. 1: Drinking Water Quality
64% ofMunicipality’s watersources (21% ofwhich werechlorinated) did notcomply with drinkingwater standards.
24% of City’schlorinated water didnot comply.
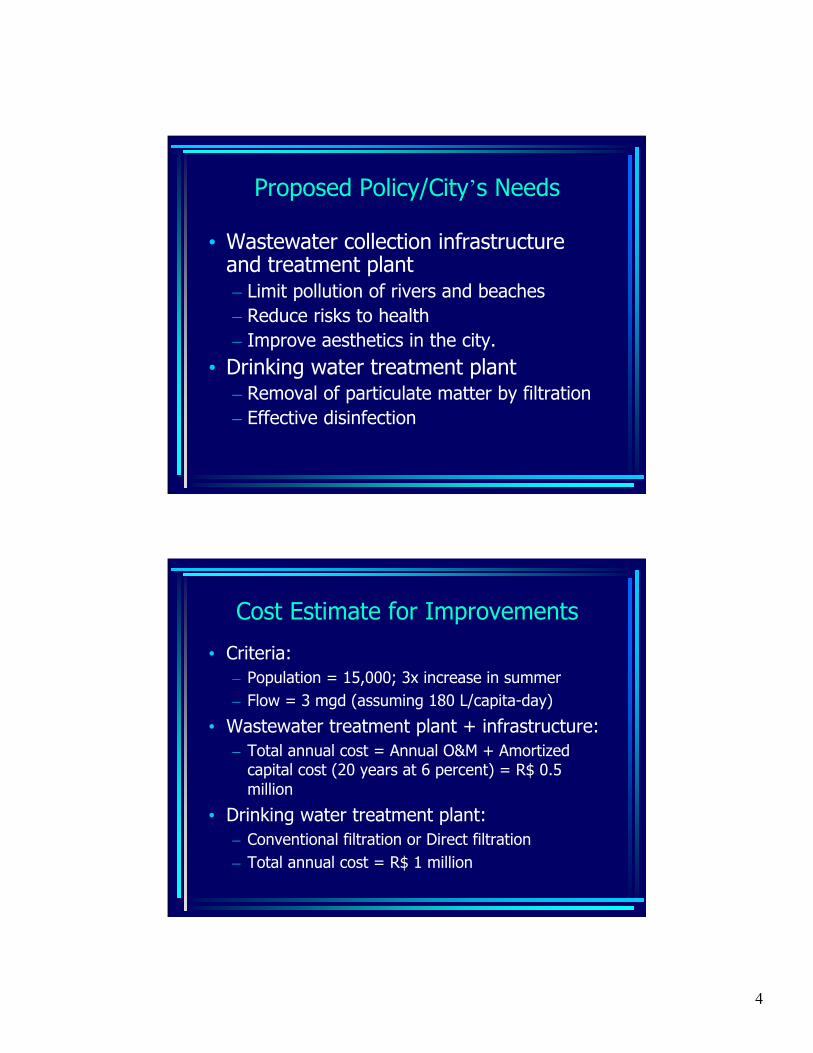
Prob. 2: Heavily Contaminated SurfaceWaters
• Jabaquara Beach:– Inadequate for primary
contact recreation (e.g.swimming)
– Adequate for secondary(e.g. wading, fishing, andhunting).
• Pereque River andMatheus Riverinadequate forsecondary contactrecreation.
• Sewer Stream, an openchannel of surface waterthat transportswastewater from housesto Paraty Bay, hasqualities of raw sewage.
4
Proposed Policy/City’s Needs
• Wastewater collection infrastructureand treatment plant– Limit pollution of rivers and beaches– Reduce risks to health– Improve aesthetics in the city.
• Drinking water treatment plant– Removal of particulate matter by filtration– Effective disinfection
Cost Estimate for Improvements
• Criteria:– Population = 15,000; 3x increase in summer– Flow = 3 mgd (assuming 180 L/capita-day)
• Wastewater treatment plant + infrastructure:– Total annual cost = Annual O&M + Amortized
capital cost (20 years at 6 percent) = R$ 0.5million
• Drinking water treatment plant:– Conventional filtration or Direct filtration– Total annual cost = R$ 1 million
5
Cost vs. Willingness to Pay
• Cost for improvement:– R$ 32/household-month (w/o meter)– R$ 0.35/m^3 (w/ meter)
• Willingness to pay (WTP):– WTP = current payment for existing services +
bottled water + (min wage lost from sickness) = R$7+ R$36 (assuming 2L/capita-day) +
(R$7/capita-day) = R$43 ~ R$50/household-month
• Willingness to Pay > Cost for improvement
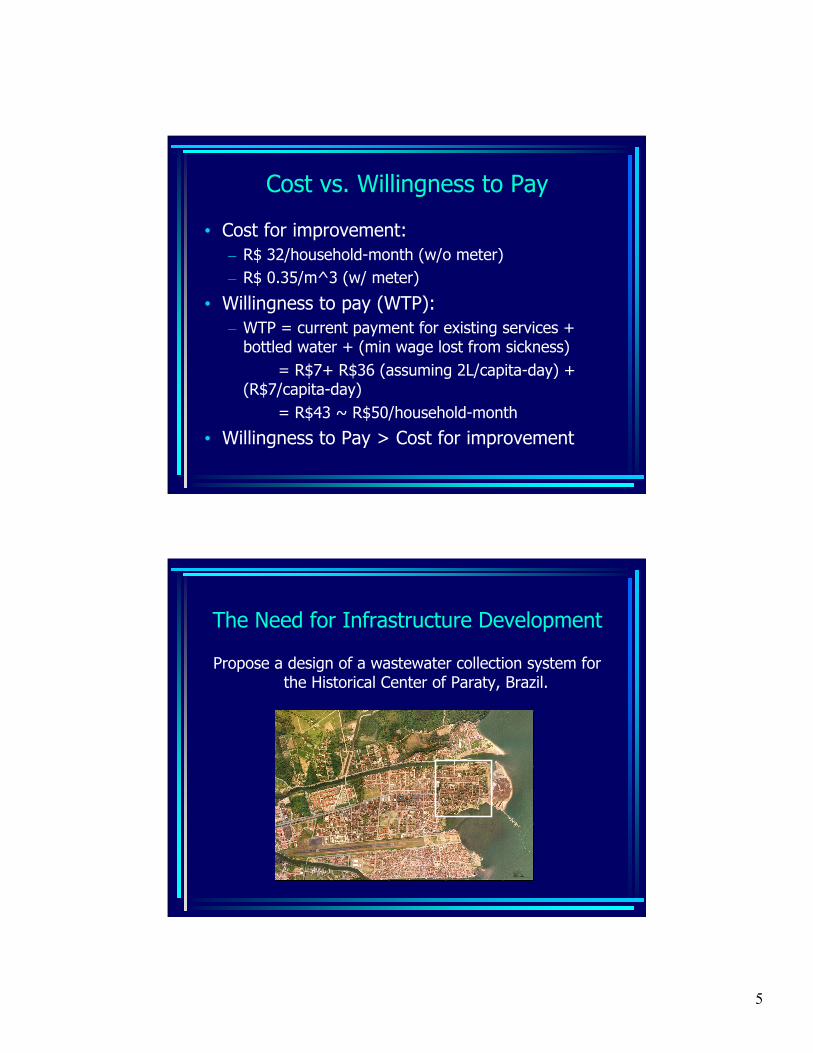
The Need for Infrastructure Development
Propose a design of a wastewater collection system forthe Historical Center of Paraty, Brazil.
6
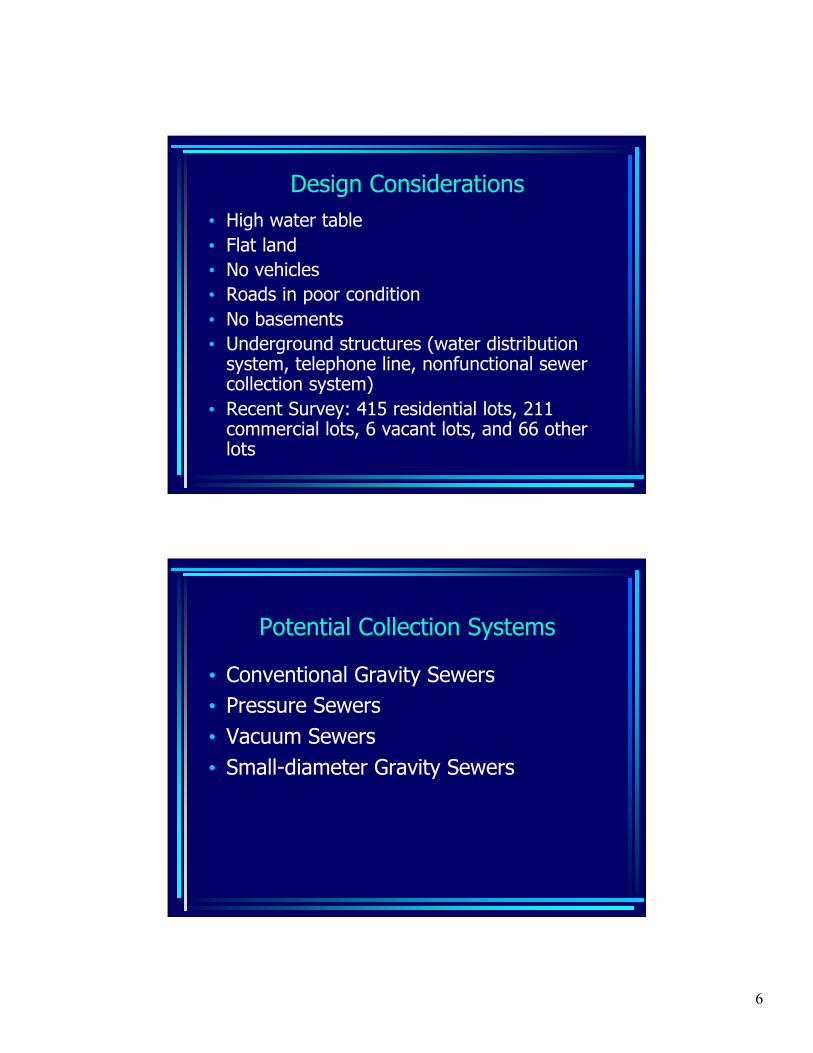
Design Considerations• High water table• Flat land• No vehicles• Roads in poor condition• No basements• Underground structures (water distribution
system, telephone line, nonfunctional sewercollection system)
• Recent Survey: 415 residential lots, 211commercial lots, 6 vacant lots, and 66 otherlots
Potential Collection Systems
• Conventional Gravity Sewers• Pressure Sewers• Vacuum Sewers• Small-diameter Gravity Sewers
7
System Criteria
• Expandable: Future collection additions• Economical: Low cost system• Adaptable: Flexible to seasonal fluxes• Simple: Ease of operation and
maintenance
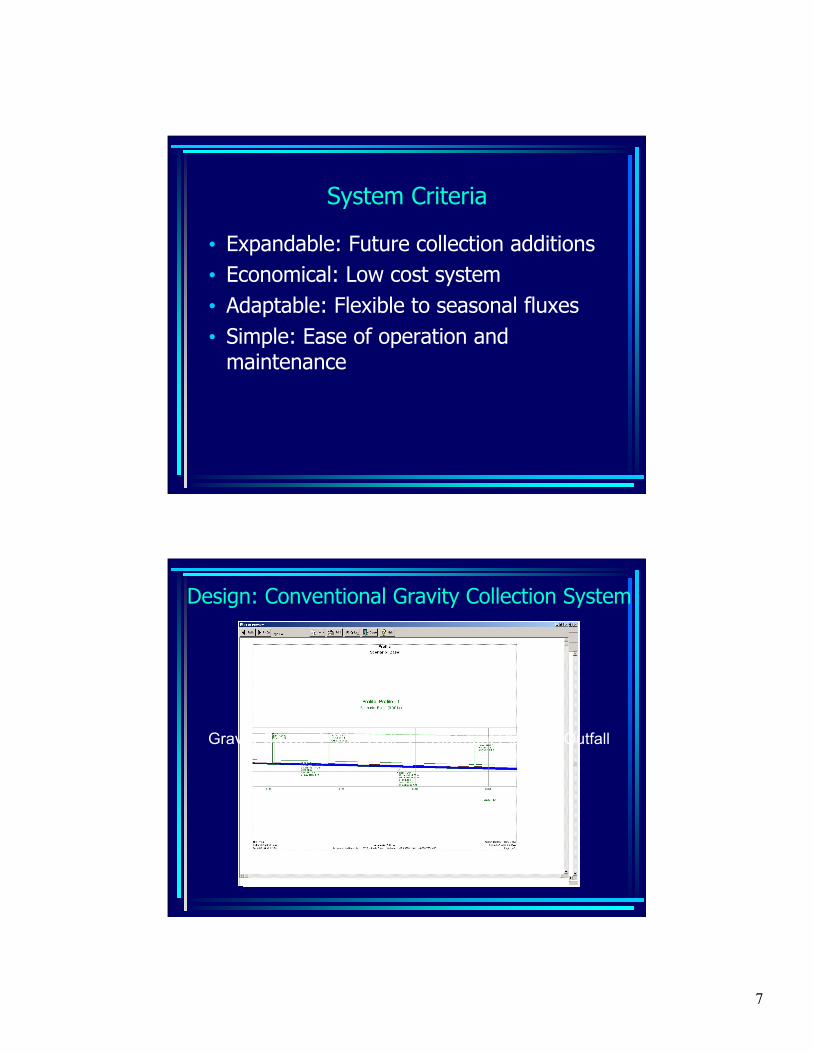
Design: Conventional Gravity Collection System
Gravity Sewer ‡ Wet Well ‡ Treatment Plant ‡ Outfall
8
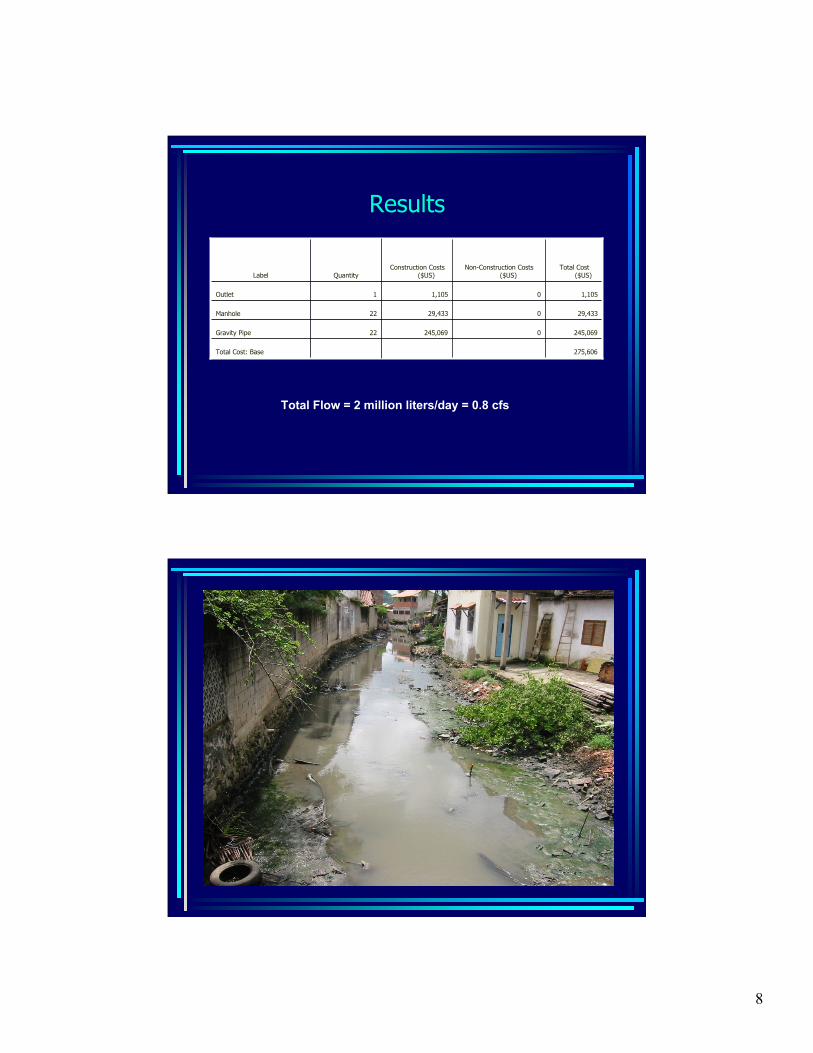
Results
22
22
1
Quantity
275,606 Total Cost: Base
245,0690245,069Gravity Pipe
29,433029,433Manhole
1,10501,105Outlet
Total Cost($US)
Non-Construction Costs($US)
Construction Costs($US)Label
Total Flow = 2 million liters/day = 0.8 cfs
Chemically EnhancedPrimary Treatment
9
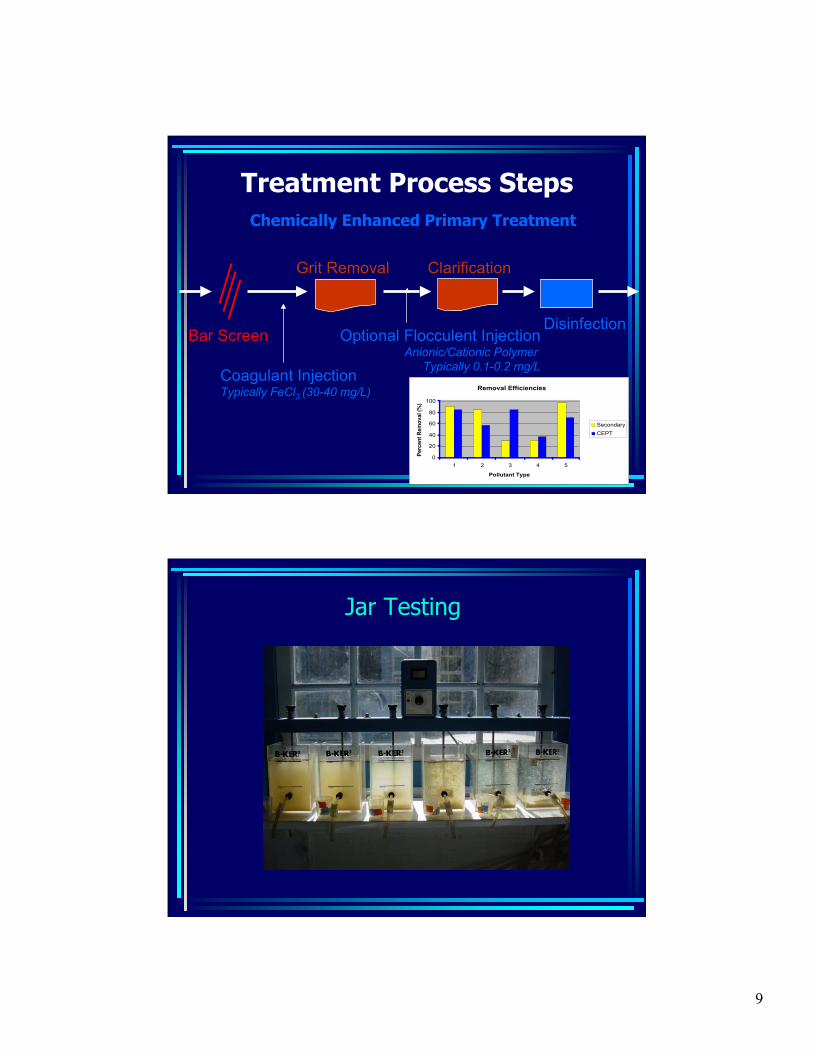
Treatment Process Steps
Conventional Primary Treatment
Bar Screen
Grit Removal
Coagulant InjectionTypically FeCl3 (30-40 mg/L)
Clarification
DisinfectionOptional Flocculent Injection
Anionic/Cationic Polymer Typically 0.1-0.2 mg/L
Chemically Enhanced Primary Treatment
Removal Efficiencies
0
20
40
60
80
100
TSS BOD TP TN FOG
Pollutant Type
Per
cent
Rem
oval
(%)
Conventional
Secondary
Removal Efficiencies
0
20
40
60
80
100
1 2 3 4 5
Pollutant Type
Per
cent
Rem
oval
(%)
Secondary
CEPT
Jar Testing
10
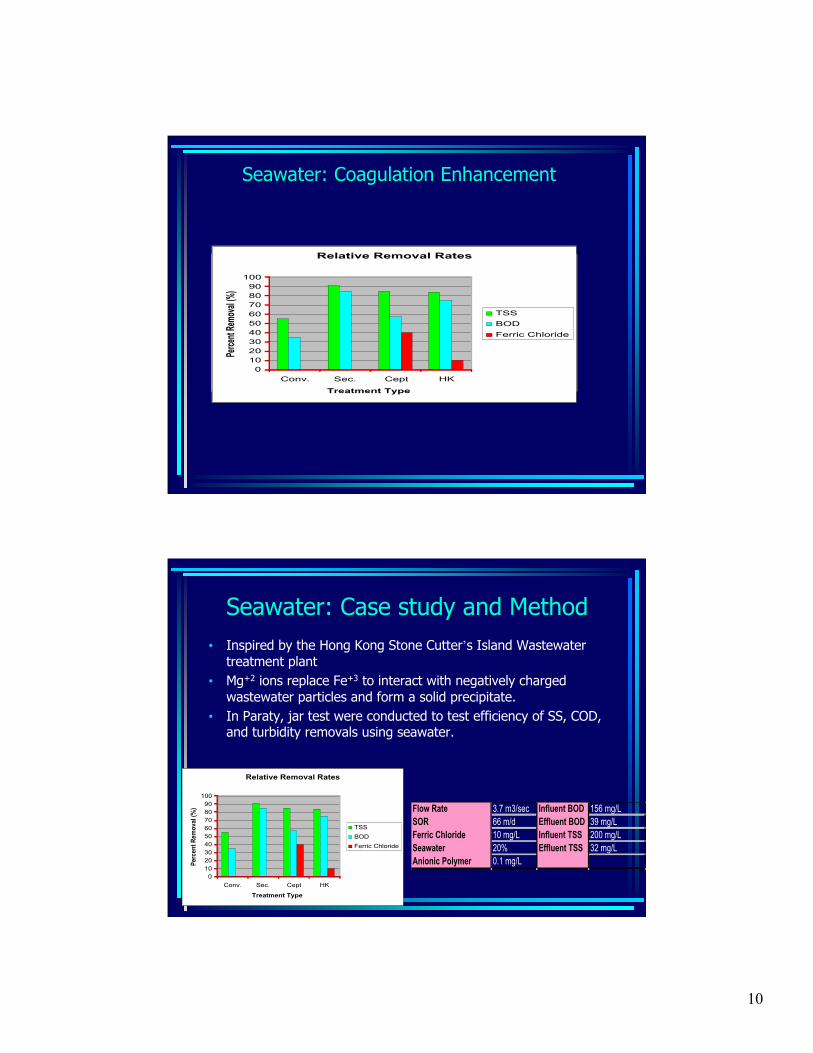
Seawater: Coagulation Enhancement
Removal Efficiencies
0
20
40
60
80
100
120
TSS BOD TP TN FOG
Pollutant Type
Perc
ent R
emov
al (%
)
Conventional
CEPT
Secondary
Relative Removal Rates
0102030405060708090
100
Conv. Sec. Cept HK
Treatment Type
Perc
ent R
emov
al (%
)
TSS
BOD
Ferric Chloride
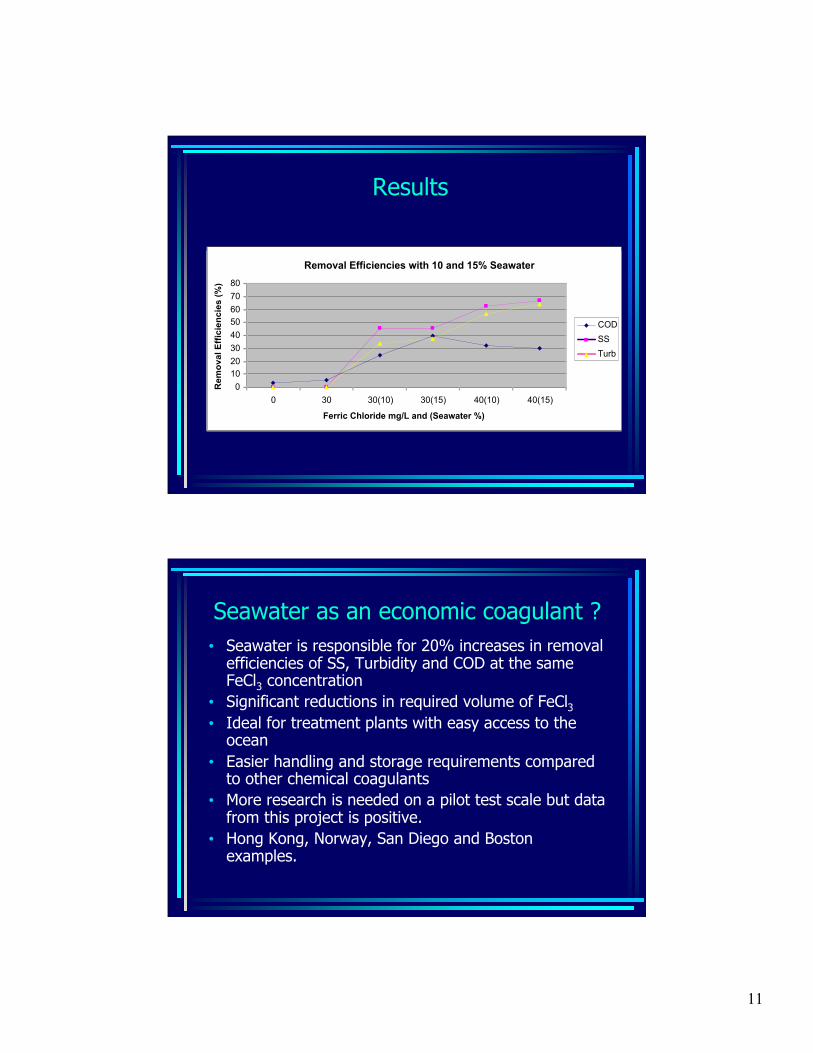
Seawater: Case study and Method• Inspired by the Hong Kong Stone Cutter’s Island Wastewater
treatment plant• Mg+2 ions replace Fe+3 to interact with negatively charged
wastewater particles and form a solid precipitate.• In Paraty, jar test were conducted to test efficiency of SS, COD,
and turbidity removals using seawater.
Flow Rate 3.7 m3/sec Influent BOD 156 mg/LSOR 66 m/d Effluent BOD 39 mg/LFerric Chloride 10 mg/L Influent TSS 200 mg/LSeawater 20% Effluent TSS 32 mg/LAnionic Polymer 0.1 mg/L
Relative Removal Rates
0102030405060708090
100
Conv. Sec. Cept HK
Treatment Type
Per
cent
Rem
oval
(%)
TSS
BOD
Ferric Chloride
11
Results
Relative SS removal rates
01020304050607080
0 10 20 30 40 50 60
Ferric Chloride (mg/L)
Pe
rce
nt
Re
mo
va
l S
S
no SW
0.5 % SW
2 % SW
Relative Turb. Removal Rates
010
2030
4050
6070
80
0 10 20 30 40 50 60
Ferric Chloride (mg/L)
Pe
rce
nt
Re
mo
va
l T
urb
No SW
0.5 % SW
1 % SW
2 % SW
COD Removals with varied SW
0
10
20
30
40
50
60
0 10 20 30 40 50 60
Ferric Chloride (mg/L)
Pe
rce
nt
Re
mo
va
l C
OD
no SW
0.5 %SW
1% SW
2% SW
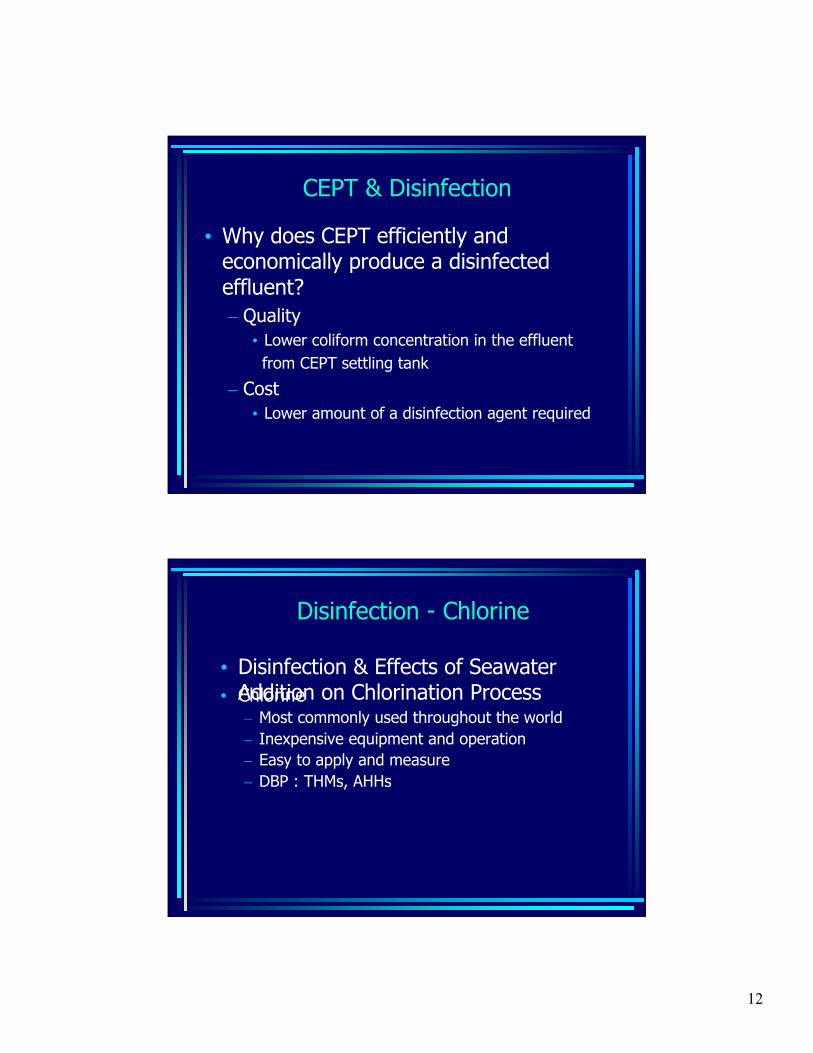
Removal Efficiencies with 10 and 15% Seawater
0
1020
30
40
5060
70
80
0 30 30(10) 30(15) 40(10) 40(15)
Ferric Chloride mg/L and (Seawater %)
Re
mo
va
l E
ffic
ien
cie
s (
%)
COD
SS
Turb
Seawater as an economic coagulant ?• Seawater is responsible for 20% increases in removal
efficiencies of SS, Turbidity and COD at the sameFeCl3 concentration
• Significant reductions in required volume of FeCl3• Ideal for treatment plants with easy access to the
ocean• Easier handling and storage requirements compared
to other chemical coagulants• More research is needed on a pilot test scale but data
from this project is positive.• Hong Kong, Norway, San Diego and Boston
examples.
12
CEPT & Disinfection
• Why does CEPT efficiently andeconomically produce a disinfectedeffluent?– Quality
• Lower coliform concentration in the effluent from CEPT settling tank
– Cost• Lower amount of a disinfection agent required
Disinfection - Chlorine
• Disinfection & Effects of SeawaterAddition on Chlorination Process• Chlorine– Most commonly used throughout the world– Inexpensive equipment and operation– Easy to apply and measure– DBP : THMs, AHHs
13
Disinfection - Alternatives
• Peracetic Acid (PAA)– Solution containing acetic acid, hydrogen peroxide,
peracetic acid, and water– Efficient bactericide and virucide– Not influenced by pH– Short contact time– No formation of DBPs– Biodegradable Products : Acetic Acid
• Ozone• UV Radiation
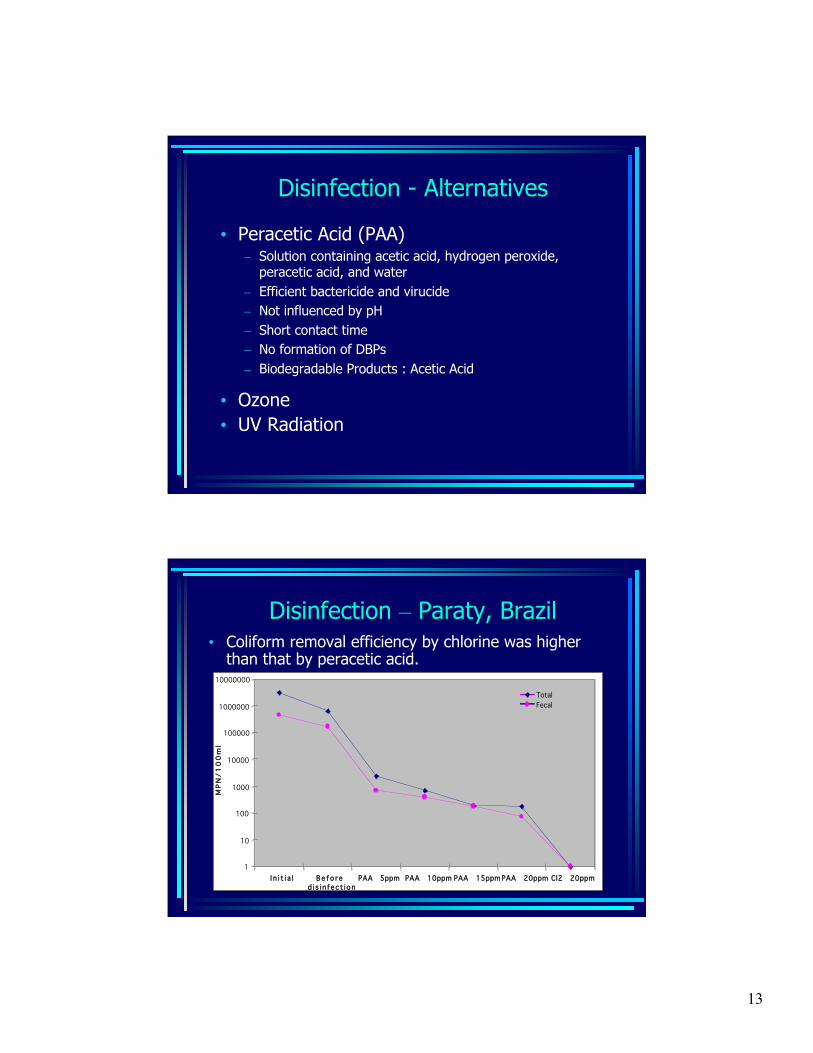
Disinfection – Paraty, Brazil
1
10
100
1000
10000
100000
1000000
10000000
I n i t i a l B e f o r ed i s i n f ec t i on
PAA 5ppm PAA 10ppm PAA 15ppm PAA 20ppm Cl2 20ppm
MP
N/
10
0m
l
TotalFecal
• Coliform removal efficiency by chlorine was higherthan that by peracetic acid.
14
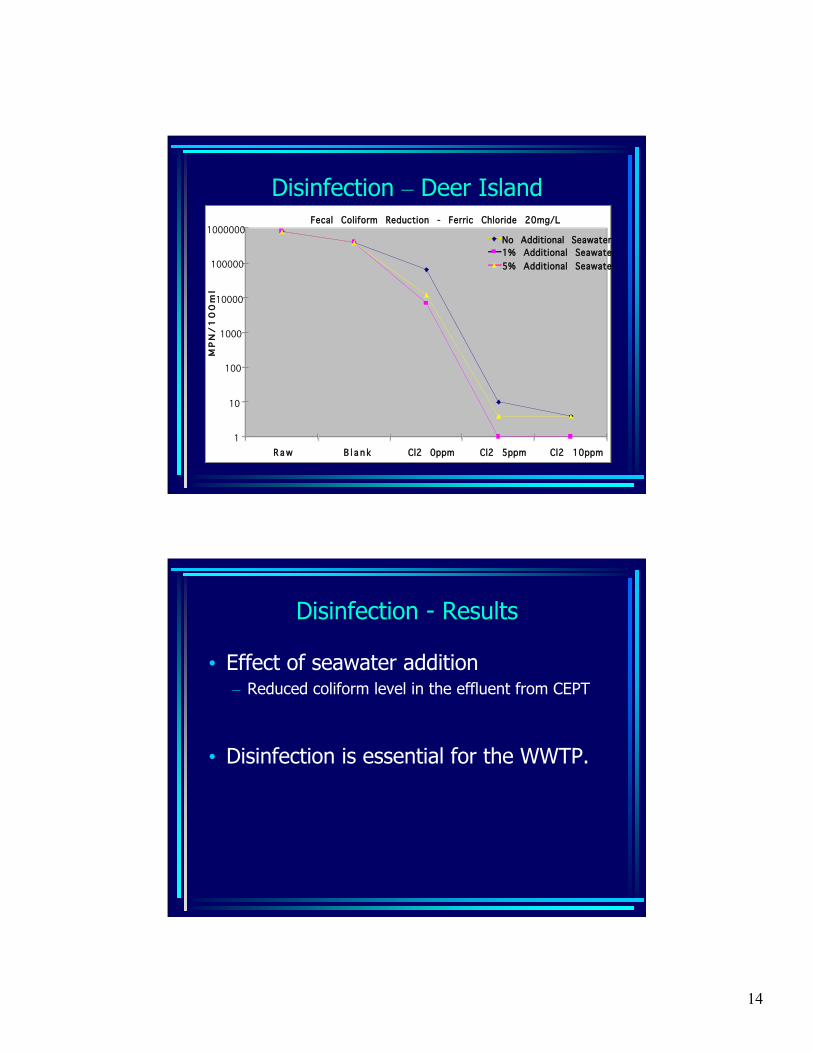
Disinfection – Deer IslandFecal Coliform Reduction - Ferric Chloride 20mg/L
1
10
100
1000
10000
100000
1000000
R a w B l a n k Cl2 0ppm Cl2 5ppm Cl2 10ppm
MP
N/
10
0m
l
No Additional Seawater1% Additional Seawater5% Additional Seawater
Disinfection - Results
• Disinfection is essential for the WWTP.
• Effect of seawater addition– Reduced coliform level in the effluent from CEPT
15
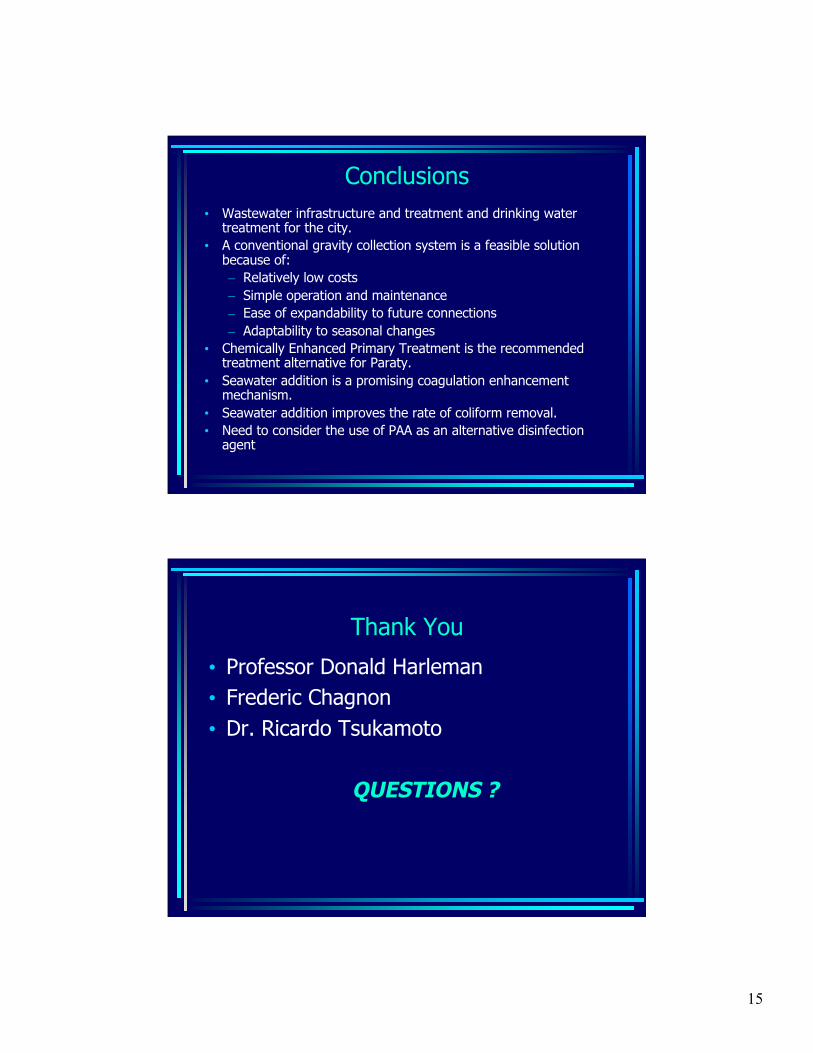
Conclusions• Wastewater infrastructure and treatment and drinking water
treatment for the city.• A conventional gravity collection system is a feasible solution
because of:– Relatively low costs– Simple operation and maintenance– Ease of expandability to future connections– Adaptability to seasonal changes
• Chemically Enhanced Primary Treatment is the recommendedtreatment alternative for Paraty.
• Seawater addition is a promising coagulation enhancementmechanism.
• Seawater addition improves the rate of coliform removal.• Need to consider the use of PAA as an alternative disinfection
agent
Thank You
• Professor Donald Harleman• Frederic Chagnon• Dr. Ricardo Tsukamoto
QUESTIONS ?