Embed Size (px)
Citation preview
Water and renewable energy with rapid growth in the
Arizona-Sonora border region
Presented at Arizona-Mexico Commission, Water
Committee, Phoenix, 20-21 June 2008.

Water and Renewable EnergyWater and Renewable Energywith Rapid Growth in the with Rapid Growth in the
Arizona-Sonora Border RegionArizona-Sonora Border Region
Dr. Martin J. (Mike) Pasqualetti Dr. Christopher ScottDr. Martin J. (Mike) Pasqualetti Dr. Christopher ScottSchool of Geographical SciencesSchool of Geographical Sciences Udall Center for Studies in Public Policy, & Udall Center for Studies in Public Policy, &
Barrett Honors College Barrett Honors College Dept. Geography & Regional Development Dept. Geography & Regional Development
Arizona State UniversityArizona State University University of Arizona University of Arizona
[email protected] [email protected]
This work is supported by the Arizona Water Institute

Humanity’s Top 10 Problems for Humanity’s Top 10 Problems for the Next 50 Yearsthe Next 50 Years
1.1. EnergyEnergy2.2. WaterWater3.3. FoodFood4.4. EnvironmentEnvironment5.5. PovertyPoverty6.6. Terrorism and WarTerrorism and War7.7. DiseaseDisease8.8. EducationEducation9.9. DemocracyDemocracy10.10. PopulationPopulation
Source: Nobel laureate, Richard Smalley

ObjectiveObjective
Identify the needs, opportunities, Identify the needs, opportunities, and impediments for binational and impediments for binational joint water-energy management at joint water-energy management at the Arizona/Sonora borderthe Arizona/Sonora border

OutlineOutline
Growth, energy and water Growth, energy and water Renewable energy resources at the borderRenewable energy resources at the border Water resources at the borderWater resources at the border Preliminary conclusions and next stepsPreliminary conclusions and next steps

1.1. Growth, Energy & WaterGrowth, Energy & Water

Arizona’s Rapid Growth

Population Trends in Mexico – Population Trends in Mexico – 1970 - 19951970 - 1995
Source: El Colegio de la Frontera Norte

Population vs Energy DemandPopulation vs Energy Demand(1990-2005)(1990-2005)
0
1000000
2000000
3000000
4000000
5000000
6000000
7000000
1990
1991
1992
1993
1994
1995
1996
1997
1998
1999
2000
2001
2002
2003
2004
2005
Year
Po
pu
latio
n
0
10000000
20000000
30000000
40000000
50000000
60000000
70000000
80000000
An
nu
al M
Wh
r co
nsu
me
d
MWhr consumed
Population

Average Gallons per MWhrAverage Gallons per MWhrfor Arizona-Based Facilitiesfor Arizona-Based Facilities
Avg. Gal/MWhr for Arizona-based facilities
510
415
195
785
350
<1<5
350
67.2
0
100
200
300
400
500
600
700
800
900
COAL GEOTHERMAL LANDFILL NATURAL GAS NATURAL GAS -CC
NUCLEAR SOLAR - pv SOLAR -Thermal
BIOFUEL
Fuel Type
Gal
lon
s p
er M
egaw
att-
Ho
ur
Re
vise
d 2
/8/0
8

APS’ projected energy demandAPS’ projected energy demand
317
1,281257
511
5,506
1,989
0
1,000
2,000
3,000
4,000
5,000
6,000
7,000
2015 2025
Meg
awat
ts
Renewables
DSM / Conservation
Still needed
2,563 MW
7,298 MW

Source: Allan T. Marks, 2008. http://www.iamericas.org/documents/energy/ljc08/Allan%20Marks.pdf

Water-Energy Joint ManagementWater-Energy Joint Management
Water Energy
Water Energy
EnergyWater
EnergyWater
United States
Mexico
Current resource management
in the border area
Potential binational, joint management of water and energy

2. Renewable energy 2. Renewable energy resources at the borderresources at the border

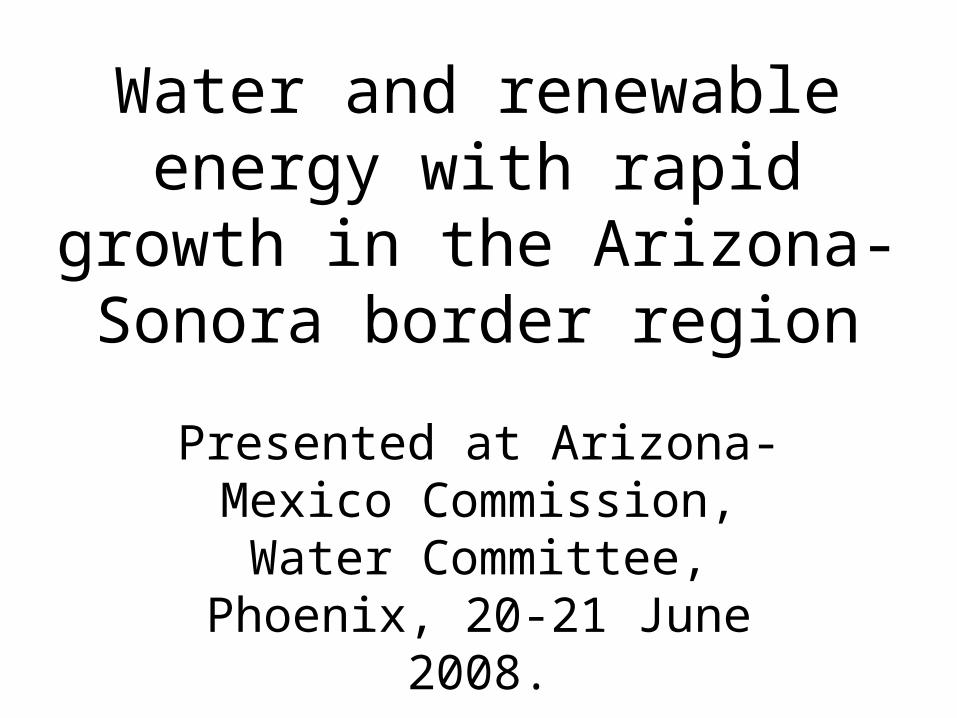
Arizona has several promising areas located primarily from St. Johns northwest to Gray Mountain
Arizona’s Wind
Energy Resource

Geothermal EnergyGeothermal EnergyMexico is 3Mexico is 3rdrd Largest Geothermal Country (over 300 sites identified) Largest Geothermal Country (over 300 sites identified)
On May 2007, the Wagner Trench off Puerto Peñasco was surveyed by researchers from the Institute of Geophysics and the Institute of Marine Science using UNAM’s hydrographic nautical cruiser

Map prepared by Patrick Laney and Julie Brizzee, INEEL for US DoE, based on data from Geo-Heat Center Geothermal Database, 2002 & NOAA, 1982.
Land Ownership
Geothermal Categories
Arizona’s Geothermal ResourceArizona’s Geothermal Resource

Tidal Turbine Farm – artist Tidal Turbine Farm – artist impressionimpression
http://www.fujitaresearch.com/reports/tidalpower.html
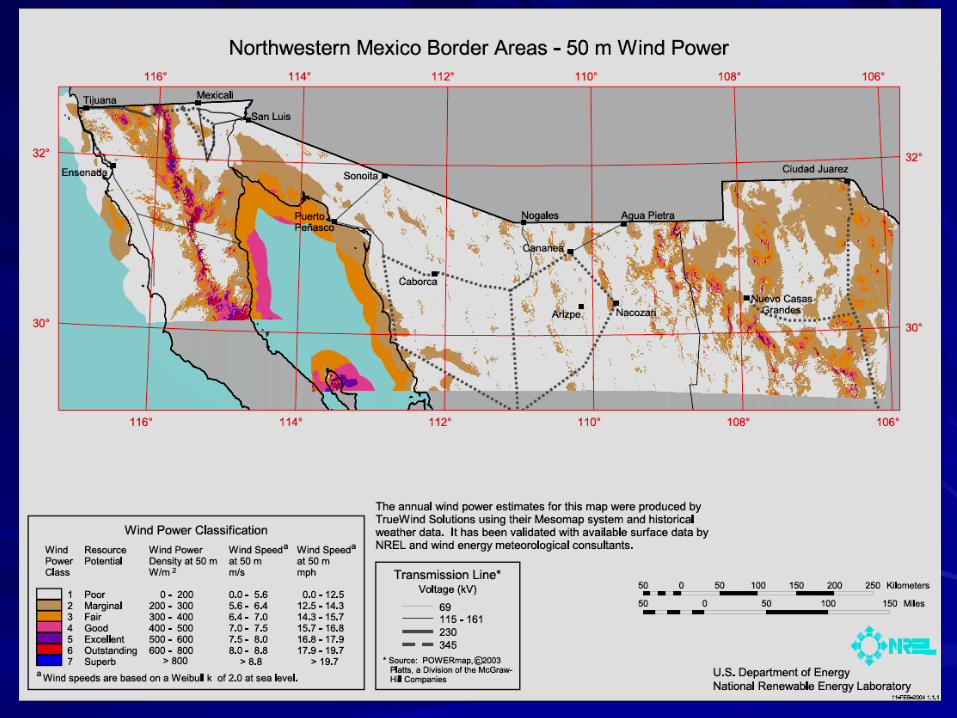
Solar Potential in the USSolar Potential in the US

Solar Potential in MexicoSolar Potential in Mexico
Solar radiation in Mexico is one of the highest in the world, allowing for Solar radiation in Mexico is one of the highest in the world, allowing for an average solar power generation of 5 KW /m2 per day. an average solar power generation of 5 KW /m2 per day. A hybrid combined cycle power station, with a 25 MW thermo-solar A hybrid combined cycle power station, with a 25 MW thermo-solar system, is scheduled to begin operations in 2009, in Agua Prieta, system, is scheduled to begin operations in 2009, in Agua Prieta, Sonora.Sonora.
Source: Renewable energies for sustainable development in Mexico 2006, Sener.

3. Water resources at the 3. Water resources at the borderborder
Photos by Ashley Coles and Joseph Hoover

Source: Robert Varady (2007) Water issues and institutions: transboundary basins and global water initiatives (PowerPoint)
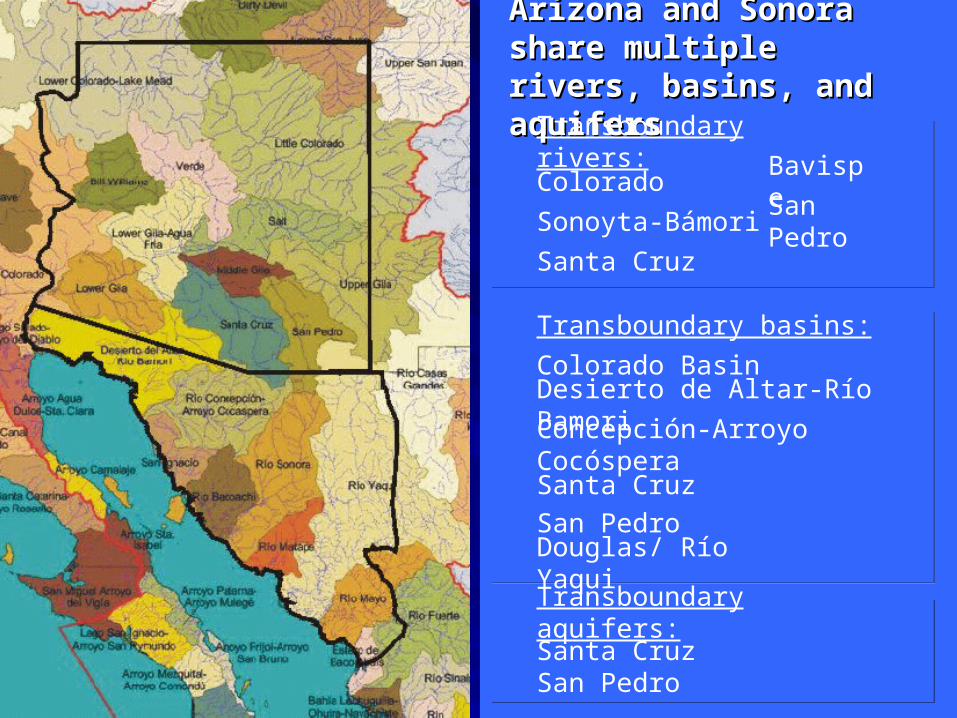
Arizona and Sonora share Arizona and Sonora share multiple rivers, basins, and multiple rivers, basins, and aquifersaquifers
Transboundary rivers:
Transboundary basins:
Colorado
Sonoyta-Bámori
Santa Cruz
Bavispe San Pedro
Colorado BasinDesierto de Altar-Río Bamori
Douglas/ Río Yaqui
Concepción-Arroyo CocósperaSanta Cruz
Transboundary aquifers:
San Pedro
Santa CruzSan Pedro

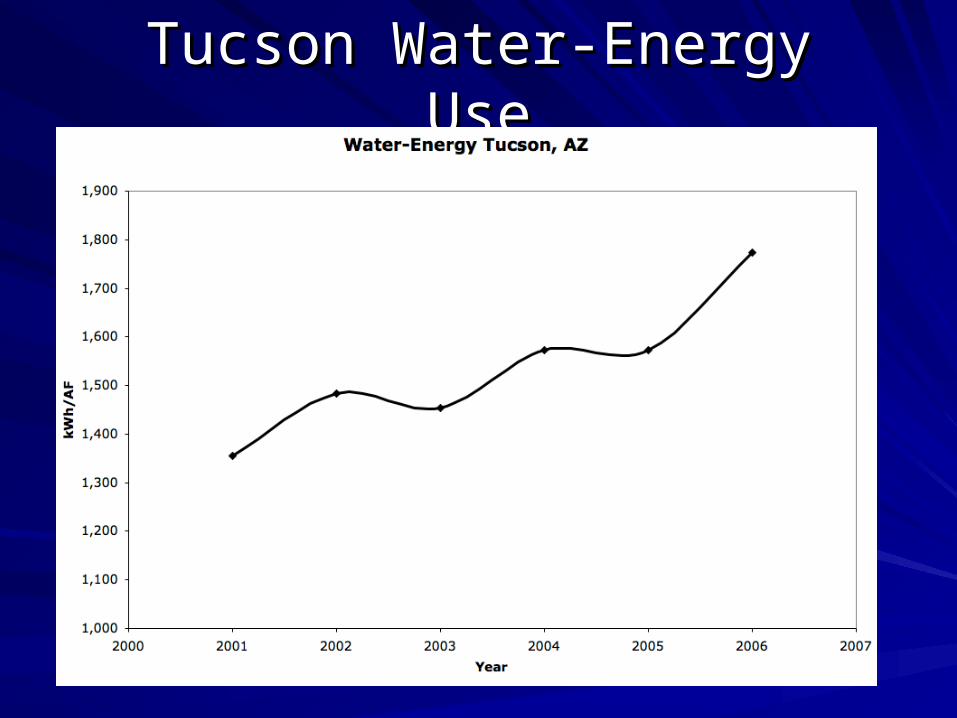
Tucson Water-Energy UseTucson Water-Energy Use
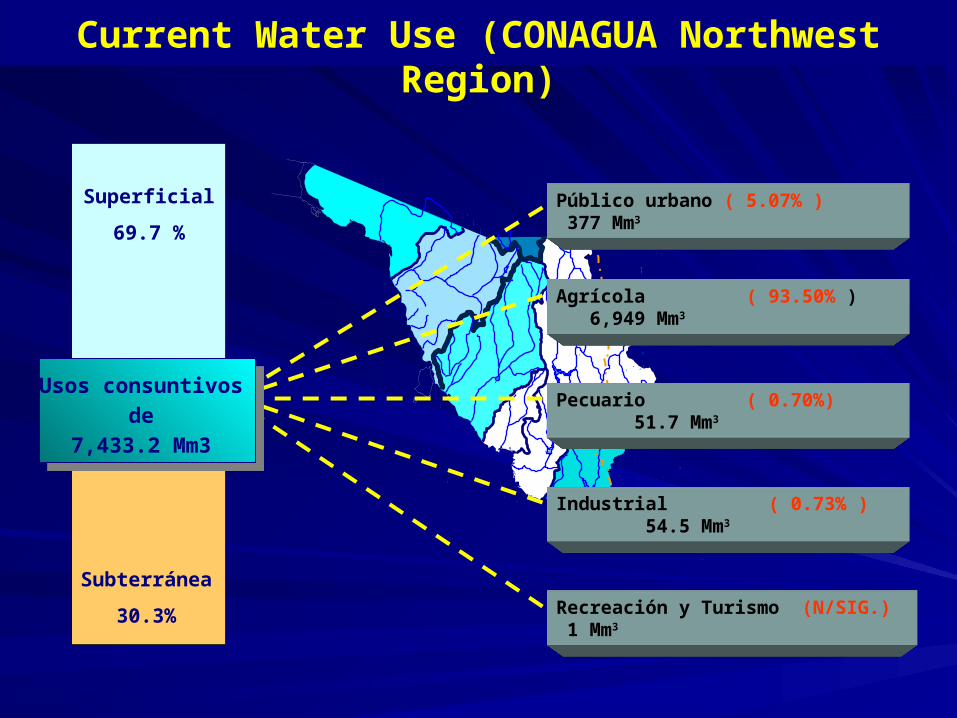
Subterránea
30.3%
Superficial
69.7 %
Current Water Use (CONAGUA Northwest Region)
Público urbano ( 5.07% ) 377 Mm3
Agrícola ( 93.50% ) 6,949 Mm3
Pecuario ( 0.70%) 51.7 Mm3
Industrial ( 0.73% ) 54.5 Mm3
Recreación y Turismo (N/SIG.) 1 Mm3
Usos consuntivos
de
7,433.2 Mm3

Growing Exports of Ag. Produce = Growing Exports of Ag. Produce = Growing (Virtual) Water TradeGrowing (Virtual) Water Trade

Arizona/Sonora Border Aquifers Arizona/Sonora Border Aquifers StressedStressed
US Legend
Mexico Legend
Stressed by over-pumpingImpacted by over-pumping
Impacted by salt water intrusion

Changes in Depth to WaterChanges in Depth to WaterIrrigation Well Average Depth to Water (Feet)
-250
-200
-150
-100
-50
0
19941998
2003Arizona
NewMexico
Source: USDA FRIS

Sonora Ag. Power Consumption
0
200,000
400,000
600,000
800,000
1,000,000
1,200,000
1,400,000
1,600,000
1988
1990
1992
1994
1996
1998
2000
2002
2004
MW
h
Night
Reg./ day
Chihuahua Ag. Power Consumption
0
200,000
400,000
600,000
800,000
1,000,000
1,200,000
1,400,000
1,600,000
1988
1990
1992
1994
1996
1998
2000
2002
2004
MW
h
Night
Reg./ day
Coahuila Ag. Power Consumption
0
200,000
400,000
600,000
800,000
1,000,000
1,200,000
1,400,000
1,600,000
1988
1990
1992
1994
1996
1998
2000
2002
2004
MW
h
Night
Reg./ day
Guanajuato Ag. Power Consumption
0
200,000
400,000
600,000
800,000
1,000,000
1,200,000
1,400,000
1,600,000
1988
1990
1992
1994
1996
1998
2000
2002
2004
MW
h
Night
Reg./ day
Night-time ag. Night-time ag. pumpingpumping

3. Preliminary findings and 3. Preliminary findings and next stepsnext steps

Opportunities for Renewables at Opportunities for Renewables at the Arizona/Sonora Borderthe Arizona/Sonora Border
Growth = renewable energy opportunitiesGrowth = renewable energy opportunities
Border area has highest North America Border area has highest North America solar resourcesolar resource
Open space favors solar deploymentOpen space favors solar deployment
Solar energy has the double advantage of Solar energy has the double advantage of being abundant and using least waterbeing abundant and using least water

Electricity Requirements for RO Electricity Requirements for RO Desalination PlantsDesalination Plants
DemandDemandA 50 MGD (~ 50,000 AF / year @ 90% uptime)A 50 MGD (~ 50,000 AF / year @ 90% uptime)
SW RO Desalination Plant NeedsSW RO Desalination Plant Needs 20 – 35 MW20 – 35 MWBW RO Desalination Plant NeedsBW RO Desalination Plant Needs 8 – 20 MW 8 – 20 MW
Electricity ConsumptionElectricity ConsumptionConventional Surface WaterConventional Surface Water 500 – 700 kWh/AF 500 – 700 kWh/AFMunicipal WW ReclamationMunicipal WW Reclamation 1,000 – 1,200 1,000 – 1,200Brackish Water Brackish Water 1,300 – 2,100 1,300 – 2,100 Sea Water Sea Water 3,260 -- 4,900 3,260 -- 4,900
Source: Shahid Chaudhry, Source: Shahid Chaudhry, State of Desalination & Potential Impacts on Energy Use in California. State of Desalination & Potential Impacts on Energy Use in California. U.S. – Mexico U.S. – Mexico BORDER ENRGY FORUM XIV San Diego, California October 18 – 19, 2007BORDER ENRGY FORUM XIV San Diego, California October 18 – 19, 2007

20.00
8.10
4.864.05
2.431.62
0.00
5.00
10.00
15.00
20.00
1975 1980 1985 1990 1995 2000 2005
kW
h/m
3
Declining Energy Consumption for Declining Energy Consumption for DesalinationDesalination
Source: Shahid Chaudhry, Source: Shahid Chaudhry, State of Desalination & Potential Impacts on Energy Use in California. State of Desalination & Potential Impacts on Energy Use in California. U.S. – Mexico BORDER ENRGY U.S. – Mexico BORDER ENRGY FORUM XIV San Diego, California October 18 – 19, 2007FORUM XIV San Diego, California October 18 – 19, 2007


Water and Renewable EnergyWater and Renewable Energywith Rapid Growth in the with Rapid Growth in the
Arizona-Sonora Border RegionArizona-Sonora Border Region
This work is supported by the Arizona Water Institute
Dr. Martin J. (Mike) Pasqualetti Dr. Christopher ScottDr. Martin J. (Mike) Pasqualetti Dr. Christopher ScottSchool of Geographical SciencesSchool of Geographical Sciences Udall Center for Studies in Public Policy, & Udall Center for Studies in Public Policy, &
Barrett Honors College Barrett Honors College Dept. Geography & Regional Development Dept. Geography & Regional Development
Arizona State UniversityArizona State University University of Arizona University of Arizona