Embed Size (px)
Citation preview
WATER AND GREEN GROWTHEDITION 1 – March 2012
THEMATIC PUBLICATION

Cover photo: Part of the Korean Four Major Rivers Restoration Project.Photo courtesy of Ministry of Land, Transport and Maritime Affairs (MLTM), Republic of Korea.
Acknowledgments
This report was prepared by the Government of the Republic of Korea, (The Ministry of Land, Transport and Maritime Affairs [MLTM]; the Presidential Committee on Green Growth [PCGG]; and the Korea Water Resources Corporation [K-water]) and by the World Water Council (WWC)
The project Steering Committee would like to thank the authors and reviewers of the report:
AuthorsSungjin Kang & Seungho Lee (Korea Univ.); Boosik Kang (Dankook Univ.); Heesu Park (KOICA); Heechan Kang (SERI); Changkil Kim (KREI); Dongjin Choi (KRIED); Sungje Park (FRInstitute); Hee Jin Noh (KCMI ); Paikho Rho (KEI); Dong-Ryul Lee (KICT); Joo Heon Lee (Joongbu Univ.); Hyosok Chae, Yong Cho, Donghwan Kim, Jeongkon Kim, Gyu-Cheol Lee, Seungyoon Lee, Jae Lim Lim, Jeong-yeul Lim, Kwang-Suop Lim, Jin hyeog Park, Jung-Eun Park, Mun Hyun Ryu, In Seok Seo, & Yee-Sook Shin (K-water); and Callum Clench & Marcia M. Brewster (WWC).
Peer reviewersThierry Facon (FAO); Doğan Altinbilek (International Hydropower Association); Mark Smith (IUCN); Eun-kyung Park (Korea Water Forum); Olivier Bommelaer (Ministère du Dével-oppement Durable); Karin Krchnak (The Nature Conservancy); Anthony Cox & Xavier Leflaive (OECD); Charles-Louis de Maud’huy (Société des Eaux de Marseille); Beatrice Arbelot (Suez Environnement); Engin Koncagul (UNESCO); and Josefina Maestu (UN-Water). A special thanks goes to Ick-hwan Ko (K-water); and Bonnie A. Harken & Kim W. Atkinson (WWC).
Mélanie Giard & Raphaël Wittmann completed the report’s final layout and design.
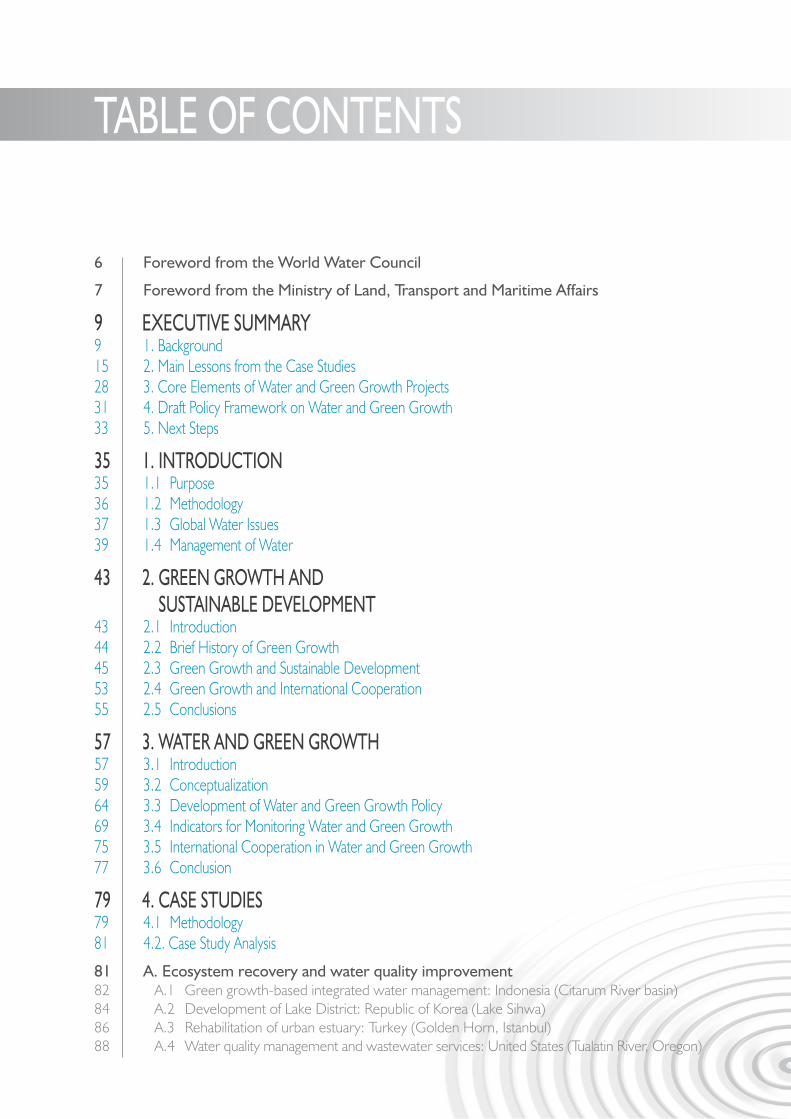
TABLE OF CONTENTS
6 Foreword from the World Water Council
7 Foreword from the Ministry of Land, Transport and Maritime Affairs
9 ExECuTIvE SuMMARy9 1. Background15 2. Main Lessons from the Case Studies28 3. Core Elements of Water and Green Growth Projects31 4. Draft Policy Framework on Water and Green Growth33 5. Next Steps
35 1. INTRODuCTION35 1.1 Purpose36 1.2 Methodology37 1.3 Global Water Issues39 1.4 Management of Water
43 2. GREEN GROWTH AND SuSTAINABLE DEvELOpMENT
43 2.1 Introduction44 2.2 Brief History of Green Growth45 2.3 Green Growth and Sustainable Development 53 2.4 Green Growth and International Cooperation55 2.5 Conclusions
57 3. WATER AND GREEN GROWTH57 3.1 Introduction59 3.2 Conceptualization64 3.3 Development of Water and Green Growth Policy69 3.4 Indicators for Monitoring Water and Green Growth75 3.5 International Cooperation in Water and Green Growth77 3.6 Conclusion
79 4. CASE STuDIES79 4.1 Methodology81 4.2. Case Study Analysis
81 A. Ecosystem recovery and water quality improvement82 A.1 Green growth-based integrated water management: Indonesia (Citarum River basin)84 A.2 Development of Lake District: Republic of Korea (Lake Sihwa)86 A.3 Rehabilitation of urban estuary: Turkey (Golden Horn, Istanbul)88 A.4 Water quality management and wastewater services: United States (Tualatin River, Oregon)
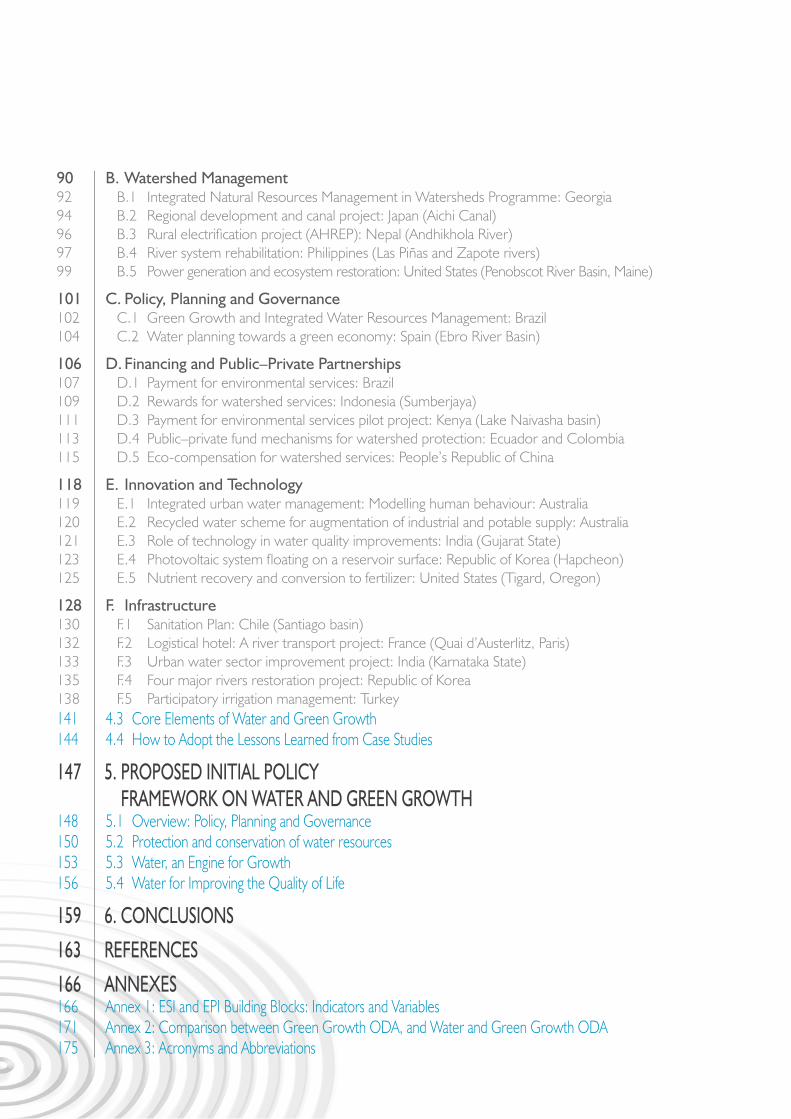
90 B. Watershed Management92 B.1 Integrated Natural Resources Management in Watersheds Programme: Georgia94 B.2 Regional development and canal project: Japan (Aichi Canal)96 B.3 Rural electrification project (AHREP): Nepal (Andhikhola River)97 B.4 River system rehabilitation: Philippines (Las Piñas and Zapote rivers)99 B.5 Power generation and ecosystem restoration: United States (Penobscot River Basin, Maine)
101 C. policy, planning and Governance102 C.1 Green Growth and Integrated Water Resources Management: Brazil104 C.2 Water planning towards a green economy: Spain (Ebro River Basin)
106 D. Financing and public–private partnerships107 D.1 Payment for environmental services: Brazil109 D.2 Rewards for watershed services: Indonesia (Sumberjaya)111 D.3 Payment for environmental services pilot project: Kenya (Lake Naivasha basin)113 D.4 Public–private fund mechanisms for watershed protection: Ecuador and Colombia115 D.5 Eco-compensation for watershed services: People’s Republic of China
118 E. Innovation and Technology 119 E.1 Integrated urban water management: Modelling human behaviour: Australia120 E.2 Recycled water scheme for augmentation of industrial and potable supply: Australia121 E.3 Role of technology in water quality improvements: India (Gujarat State)123 E.4 Photovoltaic system floating on a reservoir surface: Republic of Korea (Hapcheon)125 E.5 Nutrient recovery and conversion to fertilizer: United States (Tigard, Oregon)
128 F. Infrastructure130 F.1 Sanitation Plan: Chile (Santiago basin)132 F.2 Logistical hotel: A river transport project: France (Quai d’Austerlitz, Paris)133 F.3 Urban water sector improvement project: India (Karnataka State)135 F.4 Four major rivers restoration project: Republic of Korea138 F.5 Participatory irrigation management: Turkey141 4.3 Core Elements of Water and Green Growth144 4.4 How to Adopt the Lessons Learned from Case Studies
147 5. pROpOSED INITIAL pOLICy FRAMEWORK ON WATER AND GREEN GROWTH
148 5.1 Overview: Policy, Planning and Governance150 5.2 Protection and conservation of water resources153 5.3 Water, an Engine for Growth156 5.4 Water for Improving the Quality of Life
159 6. CONCLuSIONS163 REFERENCES166 ANNExES166 Annex 1: ESI and EPI Building Blocks: Indicators and Variables171 Annex 2: Comparison between Green Growth ODA, and Water and Green Growth ODA175 Annex 3: Acronyms and Abbreviations
WATER AND GREEN GROWTH
6
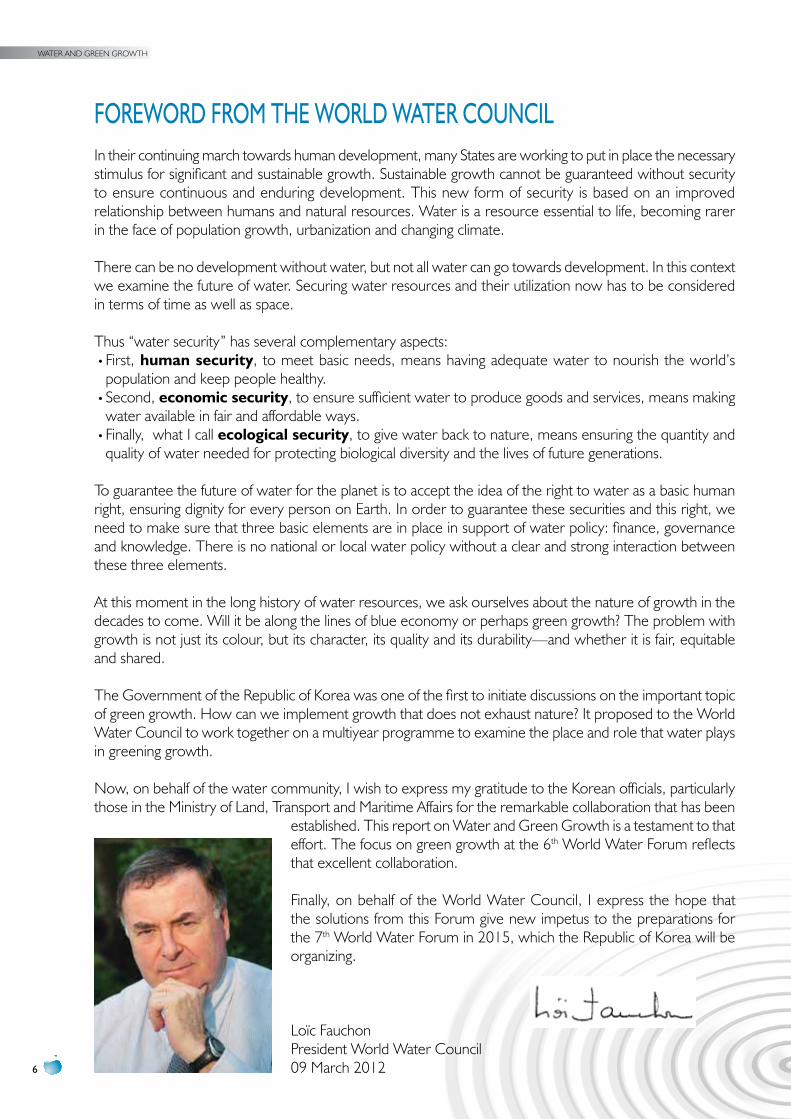
FOREWORD FROM THE WORLD WATER COuNCILIn their continuing march towards human development, many States are working to put in place the necessary stimulus for significant and sustainable growth. Sustainable growth cannot be guaranteed without security to ensure continuous and enduring development. This new form of security is based on an improved relationship between humans and natural resources. Water is a resource essential to life, becoming rarer in the face of population growth, urbanization and changing climate.
There can be no development without water, but not all water can go towards development. In this context we examine the future of water. Securing water resources and their utilization now has to be considered in terms of time as well as space.
Thus “water security” has several complementary aspects:•First, human security, to meet basic needs, means having adequate water to nourish the world’s population and keep people healthy.
•Second, economic security, to ensure sufficient water to produce goods and services, means making water available in fair and affordable ways.
•Finally, what I call ecological security, to give water back to nature, means ensuring the quantity and quality of water needed for protecting biological diversity and the lives of future generations.
To guarantee the future of water for the planet is to accept the idea of the right to water as a basic human right, ensuring dignity for every person on Earth. In order to guarantee these securities and this right, we need to make sure that three basic elements are in place in support of water policy: finance, governance and knowledge. There is no national or local water policy without a clear and strong interaction between these three elements.
At this moment in the long history of water resources, we ask ourselves about the nature of growth in the decades to come. Will it be along the lines of blue economy or perhaps green growth? The problem with growth is not just its colour, but its character, its quality and its durability—and whether it is fair, equitable and shared.
The Government of the Republic of Korea was one of the first to initiate discussions on the important topic of green growth. How can we implement growth that does not exhaust nature? It proposed to the World Water Council to work together on a multiyear programme to examine the place and role that water plays in greening growth.
Now, on behalf of the water community, I wish to express my gratitude to the Korean officials, particularly those in the Ministry of Land, Transport and Maritime Affairs for the remarkable collaboration that has been
established. This report on Water and Green Growth is a testament to that effort. The focus on green growth at the 6th World Water Forum reflects that excellent collaboration.
Finally, on behalf of the World Water Council, I express the hope that the solutions from this Forum give new impetus to the preparations for the 7th World Water Forum in 2015, which the Republic of Korea will be organizing.
Loïc FauchonPresident World Water Council09 March 2012
7
FOREWORD FROM THE MINISTRy OF LAND, TRANSpORT AND MARITIME AFFAIRSOver recent decades, countries around the world have been working together to mitigate climate change, which threatens civilizations and mankind more seriously than ever before. In the year 2000, the heads of 191 nations from the United Nations gathered and adopted the Millennium Development Goals, among which are to significantly reduce poverty and to halve the proportion of people without sustainable access to clean drinking water and basic sanitation by 2015. There is an urgent need for countries to respond to climate change in a concerted manner and, at the same time, eradicate poverty and minimize environmental damage by adopting sustainable development practices. That implies improvement in water resources management to ensure better access to water and sanitation and to prepare for more extreme water-related events.
To this end, the Korean Government announced “Green Growth” as its new national agenda in 2008. The Green Growth policy aims to effectively implement climate change adaptation strategies nationally and inter-nationally, and thereby contributing to green growth and climate change adaptation in developing countries. Many international organizations have shown their keen interests in green growth which is a highly effective strategy for pursuing environmental protection and economic growth at the same time.
Since water is the most crucial element among the natural resources we need for green growth, water issues need to be urgently addressed. In this regard, it is very timely for the World Water Council and the Korean Government to jointly conduct a systematic research project under the theme of “Water and Green Growth”.
I am very pleased to introduce the first edition of the “Water and Green Growth” report. This report from our joint project summarizes the concept development on “Water and Green Growth” and analyses relevant case studies collected from all over the world. The synergy of this research suggests a feasible policy framework that highlights the role of water in realizing the green economic growth, while enhancing the quality of life and achieving sustainable development.
The 6th World Water Forum offers a good opportunity for exchanging diverse opinions on this concept and joining forces to emphasize the role and importance of water in achieving green growth. I hope this first edition of the “Water and Green Growth” report sheds new light on the role of water as a growth engine and raises active discussion. We expect that these discussions will continue at the United Nations Conference on Sustainable Development (Rio+20) in June 2012, with the aim of solving some of the many environmental, economic and social problems facing our global society.
Kwon, Do-YoupMinister of Land, Transport and Maritime Affairs
09 March 2012
WATER AND GREEN GROWTH
8
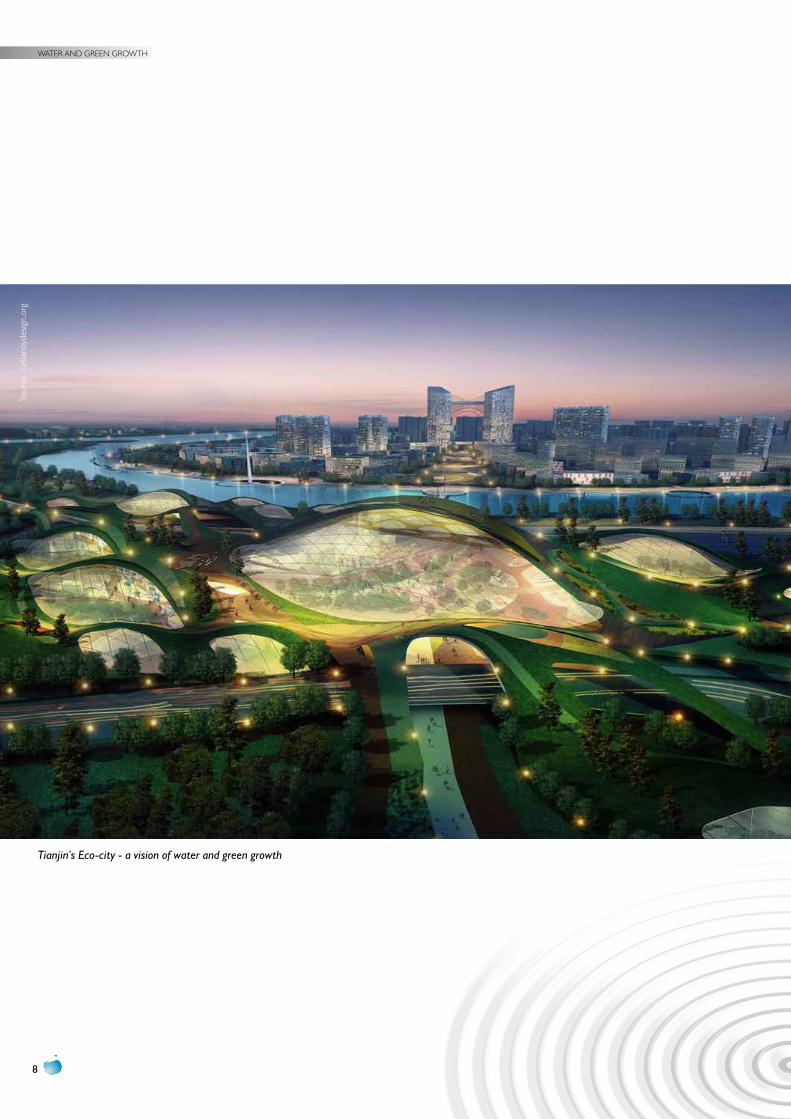
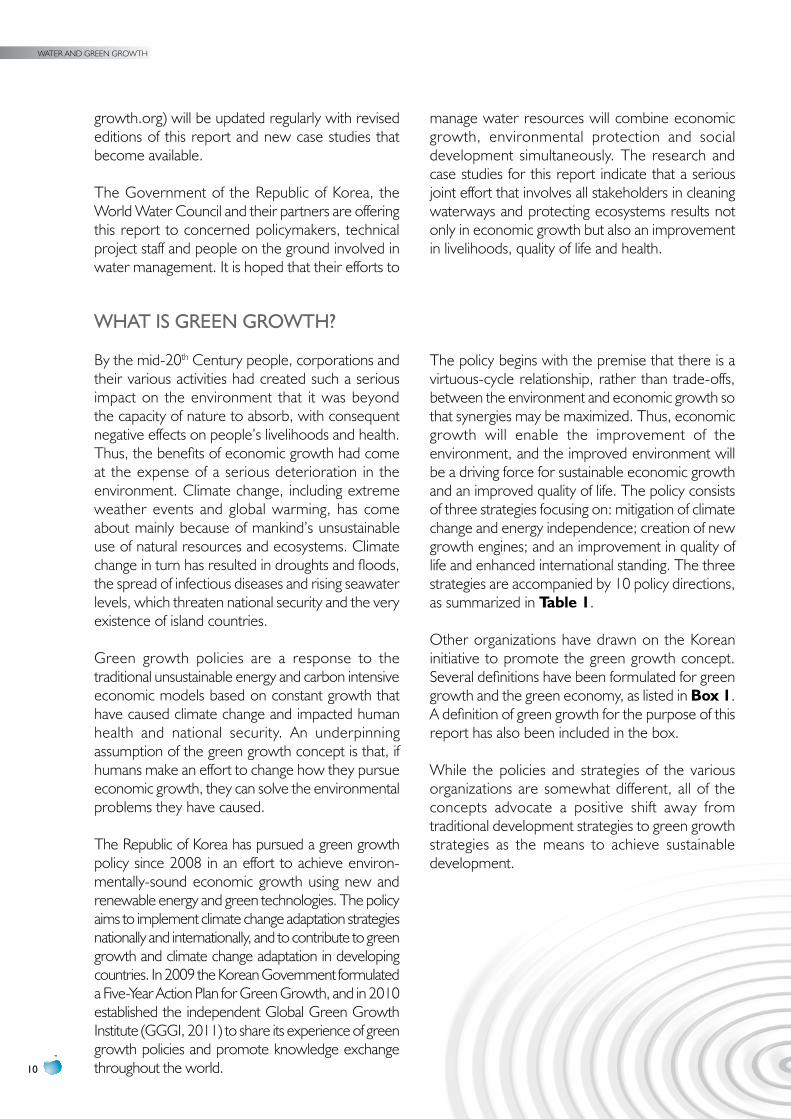
Tianjin’s Eco-city - a vision of water and green growth
Sour
ce :
urba
nbyd
esig
n.or
g
9
ExECuTIvE SuMMARy
1. Background
Water is a precious and essential resource, yet people no longer hold it sacred. It is degraded, misused and wasted in almost every part of the world. The serious environmental and water management challenges that face communities everywhere include: deteriorating water quality; inadequate access to clean water and sanitation for health; a decline in biological diversity; flooding, droughts and other natural disasters; and the need for ecosystem restoration, water treatment and wastewater management. To meet these challenges, water managers need to draw on innovative ideas and plans to build appropriate infrastructure in the face of climate change.
This report is the first major output of a project on Water and Green Growth, led by the Government of the Republic of Korea1 and the World Water Council (WWC)2. It is the result of over 12 months of research and analysis by an international group of experts. The purpose of the report is to examine the relationship between water and an emerging economic paradigm called “green growth”. It provides an analysis of 26 case studies that illustrate various aspects of water and green growth, and then uses the analysis to recommend a draft framework for policymakers.
1 . Ministry of Land, Transport and Maritime Affairs (MLTM), the Presi-dential Committee on Green Growth (PCGG), and the Korea Water Resources Corporation (K-water).
2 . An international membership-led NGO focusing on water and sanitation issues.
“Green growth” is an idea that emerged out of East Asia in the context of the global economic recession starting in 2008, after which public spending became increasingly restricted. It has evolved in response to the high environmental cost of rapid economic development and urbanization that has taken place there over the past several decades. The concept has been championed by the Republic of Korea, promoted by the United Nations Economic and Social Commission for Asia and the Pacific (UNESCAP) and adopted by the Organisation for Economic Cooperation and Development (OECD). What is not yet clear is how water management is being factored into green growth.
The full first edition of the report on Water and Green Growth3 is available on CD-ROM and on the project Web site. The report examines the origins and meaning of green growth, and considers the relationship of water to green growth. That discussion is then applied in the analysis of 26 real world case studies to draw out the key lessons learned from each. Based on the analysis, a draft Policy Framework for Water and Green Growth is drawn up, as shown in section 4 below. This framework will be further developed in 2012 and is aimed at stakeholders looking to adopt water and green growth policies at local, national and regional levels. The project Web site (www.waterandgreen-
3 . Co-authored by MLTM, PCGG, K-water and WWC, March 2012, and available at the project Web site: www.waterandgreengrowth.org.
WATER AND GREEN GROWTH
10
growth.org) will be updated regularly with revised editions of this report and new case studies that become available.
The Government of the Republic of Korea, the World Water Council and their partners are offering this report to concerned policymakers, technical project staff and people on the ground involved in water management. It is hoped that their efforts to
manage water resources will combine economic growth, environmental protection and social development simultaneously. The research and case studies for this report indicate that a serious joint effort that involves all stakeholders in cleaning waterways and protecting ecosystems results not only in economic growth but also an improvement in livelihoods, quality of life and health.
WHAT IS GREEN GROWTH?
By the mid-20th Century people, corporations and their various activities had created such a serious impact on the environment that it was beyond the capacity of nature to absorb, with consequent negative effects on people’s livelihoods and health. Thus, the benefits of economic growth had come at the expense of a serious deterioration in the environment. Climate change, including extreme weather events and global warming, has come about mainly because of mankind’s unsustainable use of natural resources and ecosystems. Climate change in turn has resulted in droughts and floods, the spread of infectious diseases and rising seawater levels, which threaten national security and the very existence of island countries.
Green growth policies are a response to the traditional unsustainable energy and carbon intensive economic models based on constant growth that have caused climate change and impacted human health and national security. An underpinning assumption of the green growth concept is that, if humans make an effort to change how they pursue economic growth, they can solve the environmental problems they have caused.
The Republic of Korea has pursued a green growth policy since 2008 in an effort to achieve environ-mentally-sound economic growth using new and renewable energy and green technologies. The policy aims to implement climate change adaptation strategies nationally and internationally, and to contribute to green growth and climate change adaptation in developing countries. In 2009 the Korean Government formulated a Five-Year Action Plan for Green Growth, and in 2010 established the independent Global Green Growth Institute (GGGI, 2011) to share its experience of green growth policies and promote knowledge exchange throughout the world.
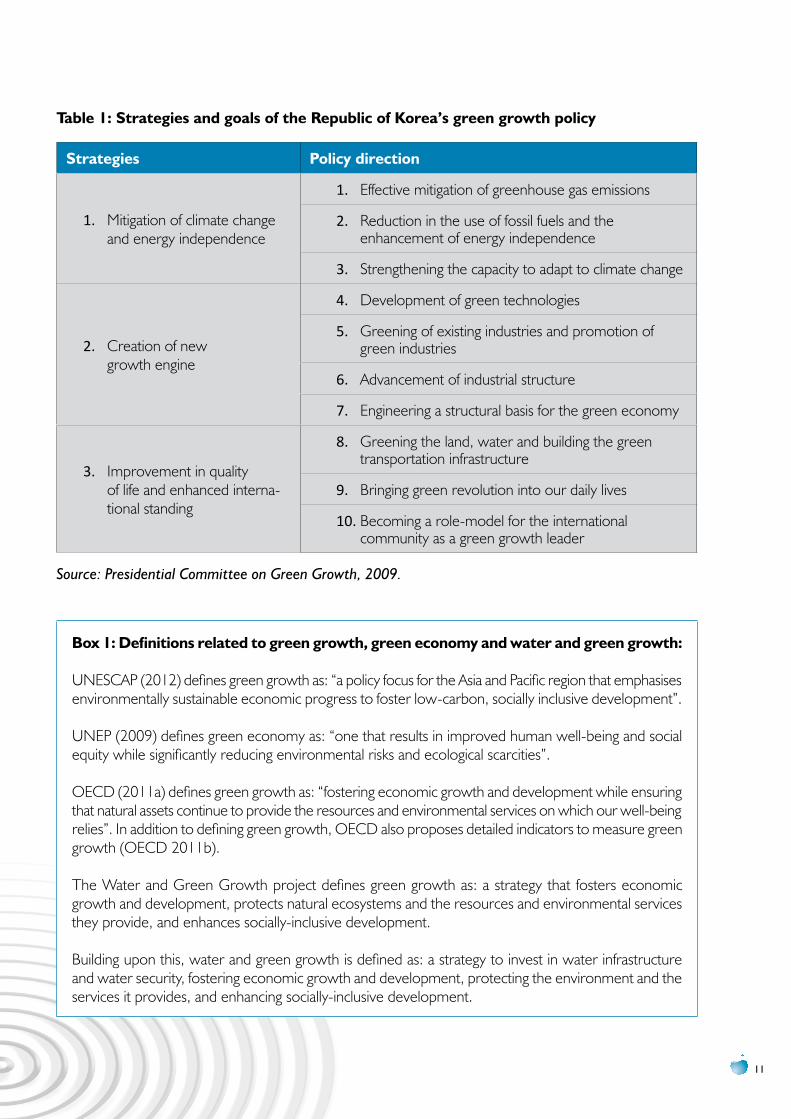
The policy begins with the premise that there is a virtuous-cycle relationship, rather than trade-offs, between the environment and economic growth so that synergies may be maximized. Thus, economic growth will enable the improvement of the environment, and the improved environment will be a driving force for sustainable economic growth and an improved quality of life. The policy consists of three strategies focusing on: mitigation of climate change and energy independence; creation of new growth engines; and an improvement in quality of life and enhanced international standing. The three strategies are accompanied by 10 policy directions, as summarized in Table 1.
Other organizations have drawn on the Korean initiative to promote the green growth concept. Several definitions have been formulated for green growth and the green economy, as listed in Box 1. A definition of green growth for the purpose of this report has also been included in the box.
While the policies and strategies of the various organizations are somewhat different, all of the concepts advocate a positive shift away from traditional development strategies to green growth strategies as the means to achieve sustainable development.
11
Table 1: Strategies and goals of the Republic of Korea’s green growth policy
Strategies Policy direction
1. Mitigation of climate change and energy independence
1. Effective mitigation of greenhouse gas emissions
2. Reduction in the use of fossil fuels and the enhancement of energy independence
3. Strengthening the capacity to adapt to climate change
2. Creation of new growth engine
4. Development of green technologies
5. Greening of existing industries and promotion of green industries
6. Advancement of industrial structure
7. Engineering a structural basis for the green economy
3. Improvement in quality of life and enhanced interna-tional standing
8. Greening the land, water and building the green transportation infrastructure
9. Bringing green revolution into our daily lives
10. Becoming a role-model for the international community as a green growth leader
Source: Presidential Committee on Green Growth, 2009.
Box 1: Definitions related to green growth, green economy and water and green growth:
UNESCAP (2012) defines green growth as: “a policy focus for the Asia and Pacific region that emphasises environmentally sustainable economic progress to foster low-carbon, socially inclusive development”.
UNEP (2009) defines green economy as: “one that results in improved human well-being and social equity while significantly reducing environmental risks and ecological scarcities”.
OECD (2011a) defines green growth as: “fostering economic growth and development while ensuring that natural assets continue to provide the resources and environmental services on which our well-being relies”. In addition to defining green growth, OECD also proposes detailed indicators to measure green growth (OECD 2011b). The Water and Green Growth project defines green growth as: a strategy that fosters economic growth and development, protects natural ecosystems and the resources and environmental services they provide, and enhances socially-inclusive development.
Building upon this, water and green growth is defined as: a strategy to invest in water infrastructure and water security, fostering economic growth and development, protecting the environment and the services it provides, and enhancing socially-inclusive development.
WATER AND GREEN GROWTH
12
HOW DOES WATER RELATE TO GREEN GROWTH?
The concept of water and green growth has been introduced as a strategy for sustainable economic development in tandem with environmental conser-vation, to meet the challenges arising from climate change and the impact of unrestrained economic growth on water resources.
Most developing countries still need more investment in water infrastructure to achieve water security, including structural measures such as multipurpose dams, as well as non-structural measures such as water reallocation and water tariff reform. One of the most crucial principles in establishing policies related to water and green growth is “integration”, and this relates directly to the integrated water resources management model. With regard to insti-tutional reform, the Korean Government is drafting a new law on water and green growth, based on its experience in enacting the “Basic Act on Low Carbon, Green Growth”.
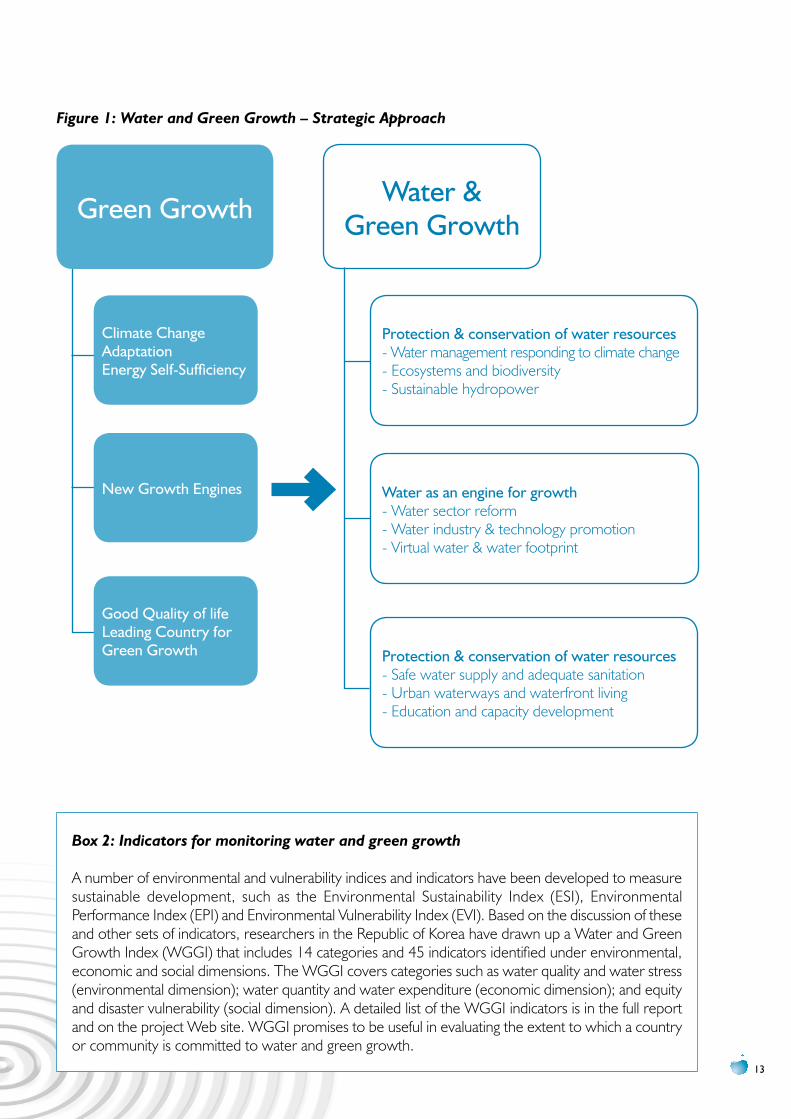
While the green growth strategy focuses primarily on economic development and environmental protection, it did not adequately extend into the social dimension, which is the third pillar of sustainable development. The addition of water resources development enables green growth to address social development goals more fully. Figure 1 illustrates a strategic approach to water and green growth that better addresses all three dimensions of sustainable development.
The vision for water and green growth includes many components. Improvements in systems and institu-tions for water management can enhance green growth and nurture resilience to climate change. Innovative approaches to limiting consumption of water resources, such as water recycling and reuse in domestic as well as industrial sectors, can protect the environment and help maximize the volume of water available for human use. Technological advancements and integrated approaches to water management can also improve efficiency of water use; i.e., rainwater harvesting, use of information technologies for decision making systems, more efficient irrigation systems, recycling in industry, and storm water and aquifer management (Grobicki 2010).
National legislation is imperative in establishing water and green growth policies and programmes in any country. Without a legal foundation, the relevant policies might not be appropriately implemented. There is no “one-size-fits-all” policy framework. The economic and industrial aspects of the strategy should be incorporated into the legal framework together with the means of providing basic water supply and sanitation services and technologies for water saving, irrigation, recycling and reuse. Institutional change may also be necessary in areas such as water pricing reform, pollution-based tax reform, river basin management, and water management that accounts for virtual water and the country’s water footprint. Most importantly, the public sector should provide a sound legal and institutional foundation for the private sector to focus on technology development, contribute efficient operational and management skills, and provide private investment for the water sector with adequate public support. A coordinating body is a prerequisite to setting priorities for the water and green growth agenda in a country. Korea’s experience suggests that the type of institution needed to oversee this policy would be a politically, administratively and financially powerful independent organization for water and green growth.
Climate variability and change have a direct impact on water availability and the frequency and magnitude of water-related natural disasters. In response, sustainable solutions and frameworks for water infrastructure planning and management have become global priorities. These include reengi-neering existing infrastructure and creating new green water infrastructure, as well as developing new water policies and regulations. Measures for monitoring water and green growth are briefly introduced in Box 2.
13
Box 2: Indicators for monitoring water and green growth
A number of environmental and vulnerability indices and indicators have been developed to measure sustainable development, such as the Environmental Sustainability Index (ESI), Environmental Performance Index (EPI) and Environmental Vulnerability Index (EVI). Based on the discussion of these and other sets of indicators, researchers in the Republic of Korea have drawn up a Water and Green Growth Index (WGGI) that includes 14 categories and 45 indicators identified under environmental, economic and social dimensions. The WGGI covers categories such as water quality and water stress (environmental dimension); water quantity and water expenditure (economic dimension); and equity and disaster vulnerability (social dimension). A detailed list of the WGGI indicators is in the full report and on the project Web site. WGGI promises to be useful in evaluating the extent to which a country or community is committed to water and green growth.
Figure 1: Water and Green Growth – Strategic Approach
Green Growth
Climate ChangeAdaptationEnergy Self-Sufficiency
protection & conservation of water resources- Water management responding to climate change- Ecosystems and biodiversity- Sustainable hydropower
Water as an engine for growth- Water sector reform- Water industry & technology promotion- Virtual water & water footprint
protection & conservation of water resources- Safe water supply and adequate sanitation- Urban waterways and waterfront living- Education and capacity development
Good Quality of lifeLeading Country forGreen Growth
New Growth Engines
Water &Green Growth
WATER AND GREEN GROWTH
14
INTERNATIONAL COOpERATION
Part of the Republic of Korea’s policy on green growth relates to its becoming a leader and role model for green growth, and imparting its experience to developing countries through international cooperation. As a country that has achieved rapid economic growth at the expense of protecting the environment, the Republic of Korea can influence developing countries to approach growth differently. Korea has successfully evolved from an aid recipient to a donor country in only half a century. Annual per capita income increased significantly from less than US$ 100 in the 1960s to US$ 20,000 in 2009. Korea’s example can encourage developing countries to participate in global efforts to reduce greenhouse gas emissions and promote sustainable development.
In order to move forward on a sustainable development path, developing countries will have to introduce or expand measures to protect the environment and mitigate or adapt to climate change. Developed countries have begun investing in green technologies and industries as part of their efforts to mitigate climate change. They have also started to introduce preferential policies for the purchase of environmentally-friendly products. Accordingly, developing countries would do well to begin manufacture of products in an environ-mentally-friendly way in their efforts to promote economic growth; otherwise they may be left behind in terms of international competitiveness.
Some developing countries argue that a shift to green growth and a low-carbon society will result in an increasing income gap with developed countries. Therefore, they are calling for the international community to compensate them for the income gap that will result from their adoption of green economic growth. Developed countries can assist by transferring technologies that apply eco-efficient production processes and technologies, using natural resources more efficiently and recycling. Developed countries can also provide official development assistance (ODA) and capacity building assistance to help developing countries narrow the income gap.
Assistance to developing countries in terms of technology transfer and ODA is considered necessary to effectively reduce greenhouse gas emissions to tackle climate change. The Republic of Korea has made an attempt to reclassify current ODA to reflect climate change policies. In line with Korea’s strategy, definitions for green growth ODA and water and green growth ODA are briefly introduced in Box 3.
The adoption of water and green growth ODA by donor countries would provide an international cooperative mechanism for water and green growth. The approach paves the way for the international community to collaborate on the enhancement of water management for greening development in times of uncertainty.
Box 3: Definitions of Official Development Assistance focused on Green Growth
“Green Growth ODA” is assistance that nurtures the capacity of developing countries to cope with climate change challenges, to create a springboard for constant economic growth with reduced environ-mental impacts, and to enable green lifestyles (S. J. Kang 2011, 14). Green growth ODA has been adopted by the Republic of Korea and reflects the relevant OECD Creditor Reporting System (CRS) codes related to climate change, environmental factors and economic growth.
“Water and Green Growth ODA” is the official development assistance that focuses on the diverse roles of water in economic growth and environmental protection, together with consideration of the complex uncertainties that characterize development scenarios, one of which is climate change. It includes CSR codes concerned with water transportation, business activities for public–private partnership, energy and mining issues, trading policy, and humanitarian assistance (disaster relief).
15
2. Main Lessons froM the case studies
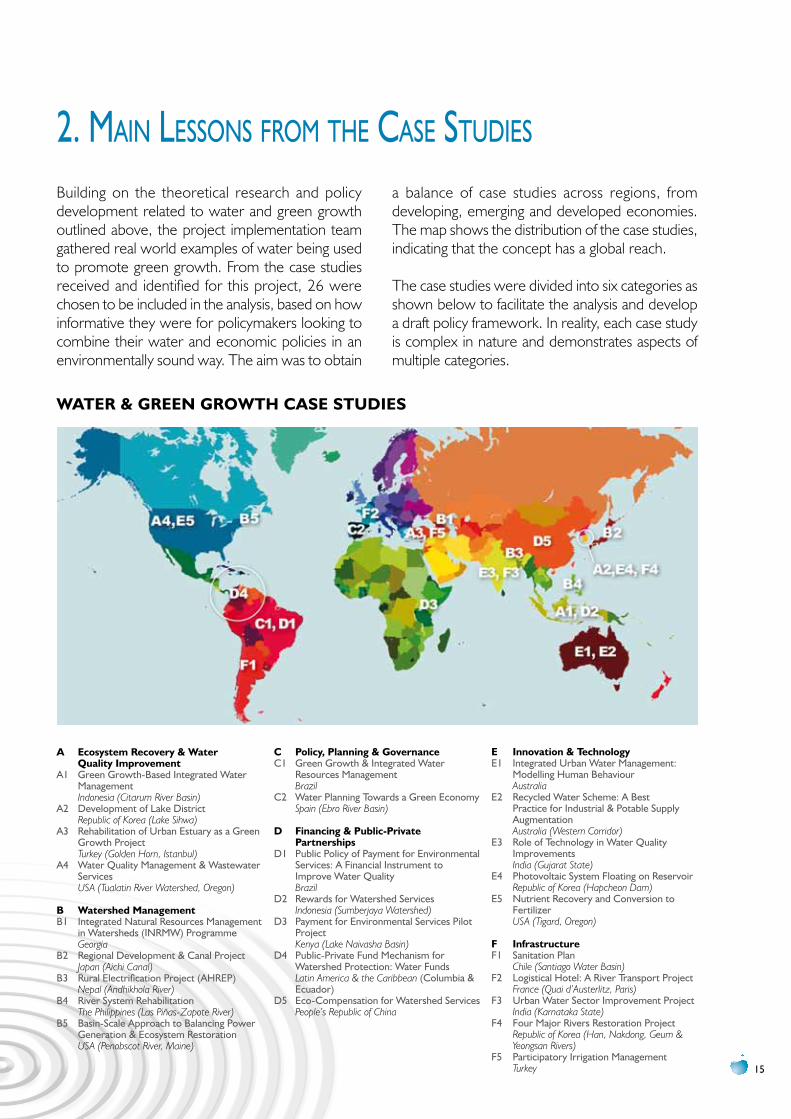
Building on the theoretical research and policy development related to water and green growth outlined above, the project implementation team gathered real world examples of water being used to promote green growth. From the case studies received and identified for this project, 26 were chosen to be included in the analysis, based on how informative they were for policymakers looking to combine their water and economic policies in an environmentally sound way. The aim was to obtain
a balance of case studies across regions, from developing, emerging and developed economies. The map shows the distribution of the case studies, indicating that the concept has a global reach.
The case studies were divided into six categories as shown below to facilitate the analysis and develop a draft policy framework. In reality, each case study is complex in nature and demonstrates aspects of multiple categories.
WATeR & GReen GRoWTh cASe STuDieS
A ecosystem Recovery & Water Quality improvement
A1 Green Growth-Based Integrated Water Management Indonesia (Citarum River Basin)
A2 Development of Lake District Republic of Korea (Lake Sihwa)
A3 Rehabilitation of urban Estuary as a Green Growth project Turkey (Golden Horn, Istanbul)
A4 Water Quality Management & Wastewater Services USA (Tualatin River Watershed, Oregon)
B Watershed ManagementB1 Integrated Natural Resources Management
in Watersheds (INRMW) programme Georgia
B2 Regional Development & Canal project Japan (Aichi Canal)
B3 Rural Electrification project (AHREp) Nepal (Andhikhola River)
B4 River System Rehabilitation The Philippines (Las Piñas-Zapote River)
B5 Basin-Scale Approach to Balancing power Generation & Ecosystem Restoration USA (Penobscot River, Maine)
c Policy, Planning & GovernanceC1 Green Growth & Integrated Water
Resources Management Brazil
C2 Water planning Towards a Green Economy Spain (Ebro River Basin)
D Financing & Public-Private Partnerships
D1 public policy of payment for Environmental Services: A Financial Instrument to Improve Water Quality Brazil
D2 Rewards for Watershed Services Indonesia (Sumberjaya Watershed)
D3 payment for Environmental Services pilot project Kenya (Lake Naivasha Basin)
D4 public-private Fund Mechanism for Watershed protection: Water Funds Latin America & the Caribbean (Columbia & Ecuador)
D5 Eco-Compensation for Watershed Services People’s Republic of China
e innovation & TechnologyE1 Integrated urban Water Management:
Modelling Human Behaviour Australia
E2 Recycled Water Scheme: A Best practice for Industrial & potable Supply Augmentation Australia (Western Corridor)
E3 Role of Technology in Water Quality Improvements India (Gujarat State)
E4 photovoltaic System Floating on Reservoir Republic of Korea (Hapcheon Dam)
E5 Nutrient Recovery and Conversion to Fertilizer USA (Tigard, Oregon)
F infrastructureF1 Sanitation plan
Chile (Santiago Water Basin)F2 Logistical Hotel: A River Transport project
France (Quai d’Austerlitz, Paris)F3 urban Water Sector Improvement project
India (Karnataka State)F4 Four Major Rivers Restoration project
Republic of Korea (Han, Nakdong, Geum & Yeongsan Rivers)
F5 participatory Irrigation Management Turkey
WATER AND GREEN GROWTH
16
A. ECOSySTEM RECOvERy AND WATER QuALITy IMpROvEMENT
The restoration of water-related ecosystems and water quality improvement provide long-term benefits in terms of public health, economic growth, aesthetic, recreational and cultural amenities, and improved well-being and livelihoods. Ecosystem restoration efforts require the support of people living in both the watershed area and in downstream municipal areas. In urban areas, restored waterfronts can become lively and popular catalysts for economic growth and urban revitalisation. When people get back in touch with their rivers, lakes, and oceans, they take better care of those ecosystems in line with conservation and sustainable development efforts.
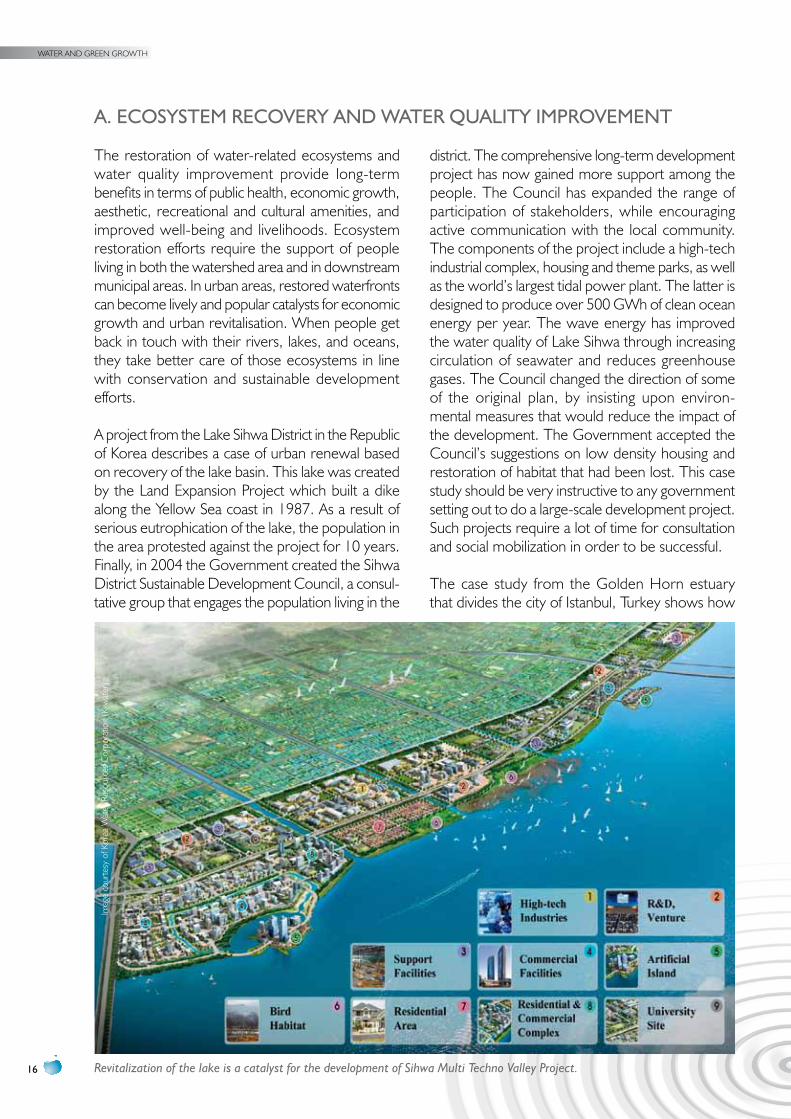
A project from the Lake Sihwa District in the Republic of Korea describes a case of urban renewal based on recovery of the lake basin. This lake was created by the Land Expansion Project which built a dike along the Yellow Sea coast in 1987. As a result of serious eutrophication of the lake, the population in the area protested against the project for 10 years. Finally, in 2004 the Government created the Sihwa District Sustainable Development Council, a consul-tative group that engages the population living in the
district. The comprehensive long-term development project has now gained more support among the people. The Council has expanded the range of participation of stakeholders, while encouraging active communication with the local community. The components of the project include a high-tech industrial complex, housing and theme parks, as well as the world’s largest tidal power plant. The latter is designed to produce over 500 GWh of clean ocean energy per year. The wave energy has improved the water quality of Lake Sihwa through increasing circulation of seawater and reduces greenhouse gases. The Council changed the direction of some of the original plan, by insisting upon environ-mental measures that would reduce the impact of the development. The Government accepted the Council’s suggestions on low density housing and restoration of habitat that had been lost. This case study should be very instructive to any government setting out to do a large-scale development project. Such projects require a lot of time for consultation and social mobilization in order to be successful.
The case study from the Golden Horn estuary that divides the city of Istanbul, Turkey shows how
Revitalization of the lake is a catalyst for the development of Sihwa Multi Techno Valley Project.
Imag
e co
urte
sy o
f Kor
ea W
ater
Res
ourc
es C
orpo
ratio
n (K
-wat
er)
17
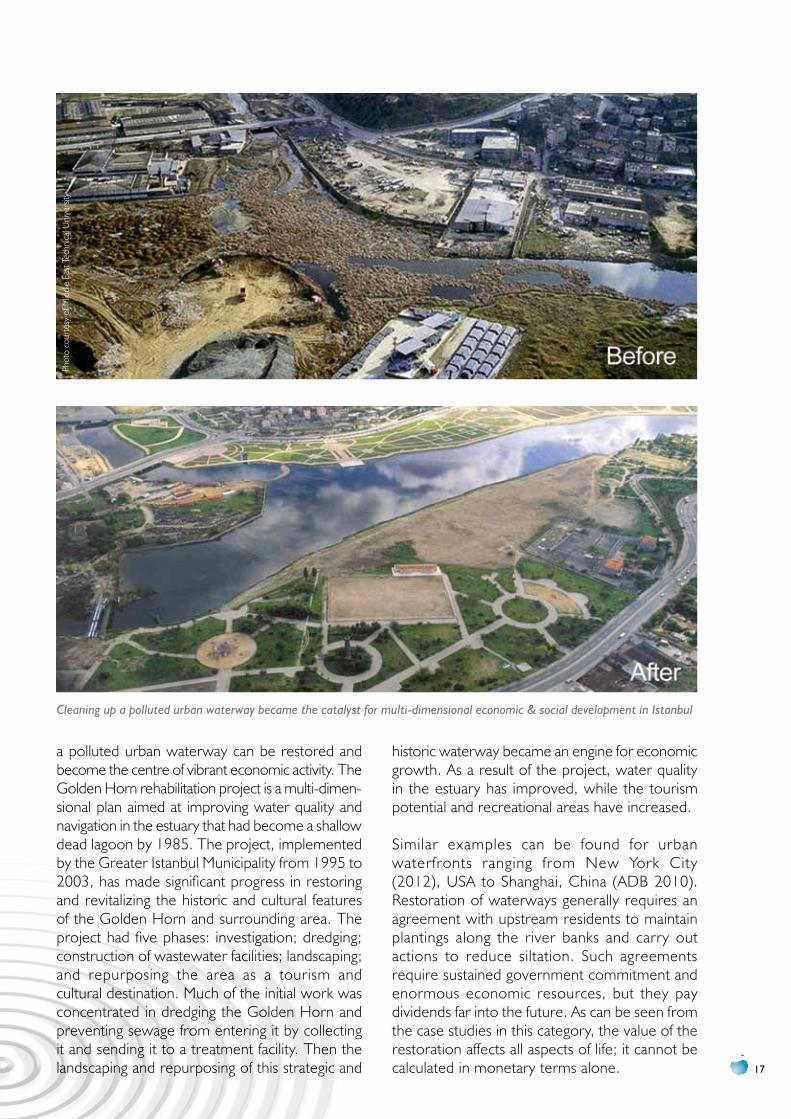
a polluted urban waterway can be restored and become the centre of vibrant economic activity. The Golden Horn rehabilitation project is a multi-dimen-sional plan aimed at improving water quality and navigation in the estuary that had become a shallow dead lagoon by 1985. The project, implemented by the Greater Istanbul Municipality from 1995 to 2003, has made significant progress in restoring and revitalizing the historic and cultural features of the Golden Horn and surrounding area. The project had five phases: investigation; dredging; construction of wastewater facilities; landscaping; and repurposing the area as a tourism and cultural destination. Much of the initial work was concentrated in dredging the Golden Horn and preventing sewage from entering it by collecting it and sending it to a treatment facility. Then the landscaping and repurposing of this strategic and
historic waterway became an engine for economic growth. As a result of the project, water quality in the estuary has improved, while the tourism potential and recreational areas have increased.
Similar examples can be found for urban waterfronts ranging from New York City (2012), USA to Shanghai, China (ADB 2010). Restoration of waterways generally requires an agreement with upstream residents to maintain plantings along the river banks and carry out actions to reduce siltation. Such agreements require sustained government commitment and enormous economic resources, but they pay dividends far into the future. As can be seen from the case studies in this category, the value of the restoration affects all aspects of life; it cannot be calculated in monetary terms alone.
Cleaning up a polluted urban waterway became the catalyst for multi-dimensional economic & social development in Istanbul
Phot
o co
urte
sy o
f Mid
dle
East
Tec
hnica
l Uni
vers
ity
WATER AND GREEN GROWTH
18
B. WATERSHED MANAGEMENT
Recent interest in the United States and other countries that have highly regulated river systems has concentrated on the preservation of watersheds to improve water quality for downstream users. Agreements have been forged between the residents of the watershed area, who agree to protect the reservoirs located in the watershed, and municipal areas downstream, which compensate them through taxes or payment for environmental services (PES). The preservation and restoration of natural landscape features (such as forests, floodplains and wetlands) are critical components of green watershed infrastructure. By protecting these ecologically sensitive areas, communities can improve water quality while providing wildlife habitat and opportunities for outdoor recreation.
Most of the world’s major rivers, particularly in developed countries, have been fragmented by dams, diversions and canals, resulting in siltation and water quality deterioration. The decline in flow levels of rivers as they move towards the sea threatens human and animal life and whole ecosystems. Coastal zones are among the most productive ecosystems on earth and depend vitally on the inflow of freshwater to their estuaries, deltas and wetlands.
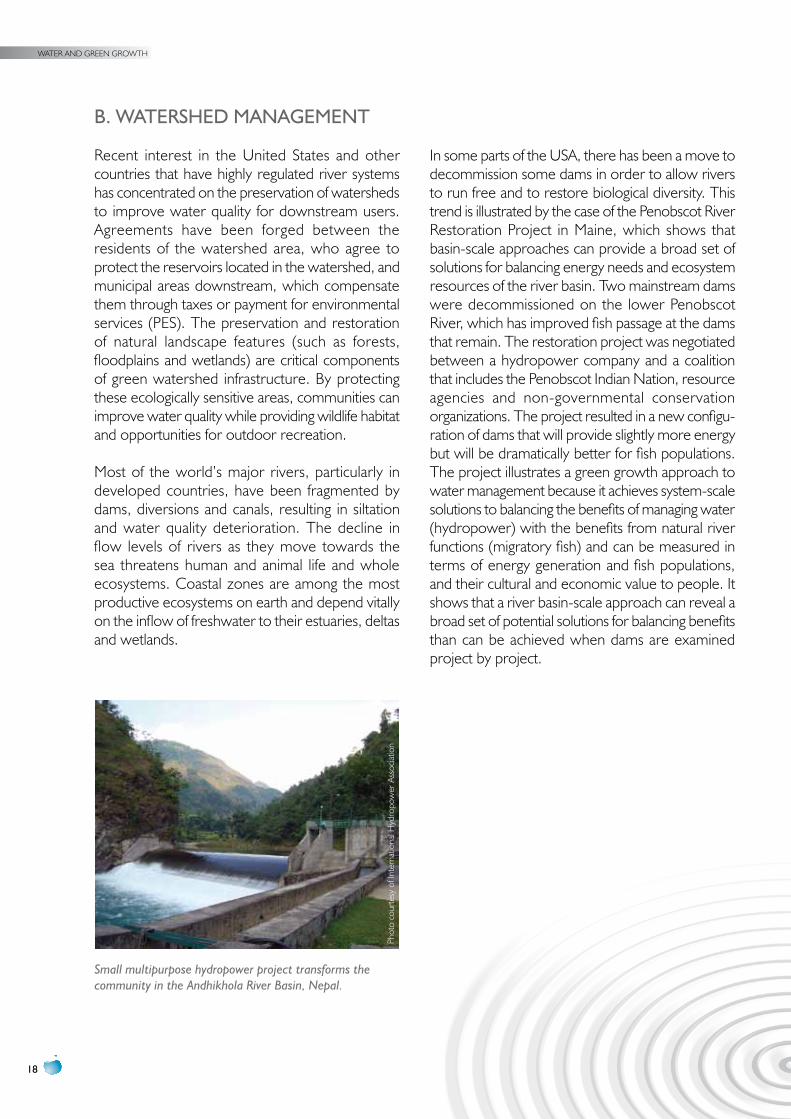
In some parts of the USA, there has been a move to decommission some dams in order to allow rivers to run free and to restore biological diversity. This trend is illustrated by the case of the Penobscot River Restoration Project in Maine, which shows that basin-scale approaches can provide a broad set of solutions for balancing energy needs and ecosystem resources of the river basin. Two mainstream dams were decommissioned on the lower Penobscot River, which has improved fish passage at the dams that remain. The restoration project was negotiated between a hydropower company and a coalition that includes the Penobscot Indian Nation, resource agencies and non-governmental conservation organizations. The project resulted in a new configu-ration of dams that will provide slightly more energy but will be dramatically better for fish populations. The project illustrates a green growth approach to water management because it achieves system-scale solutions to balancing the benefits of managing water (hydropower) with the benefits from natural river functions (migratory fish) and can be measured in terms of energy generation and fish populations, and their cultural and economic value to people. It shows that a river basin-scale approach can reveal a broad set of potential solutions for balancing benefits than can be achieved when dams are examined project by project.
Small multipurpose hydropower project transforms the community in the Andhikhola River Basin, Nepal.
Phot
o co
urte
sy o
f Int
erna
tiona
l Hyd
ropo
wer
Ass
ociat
ion
19
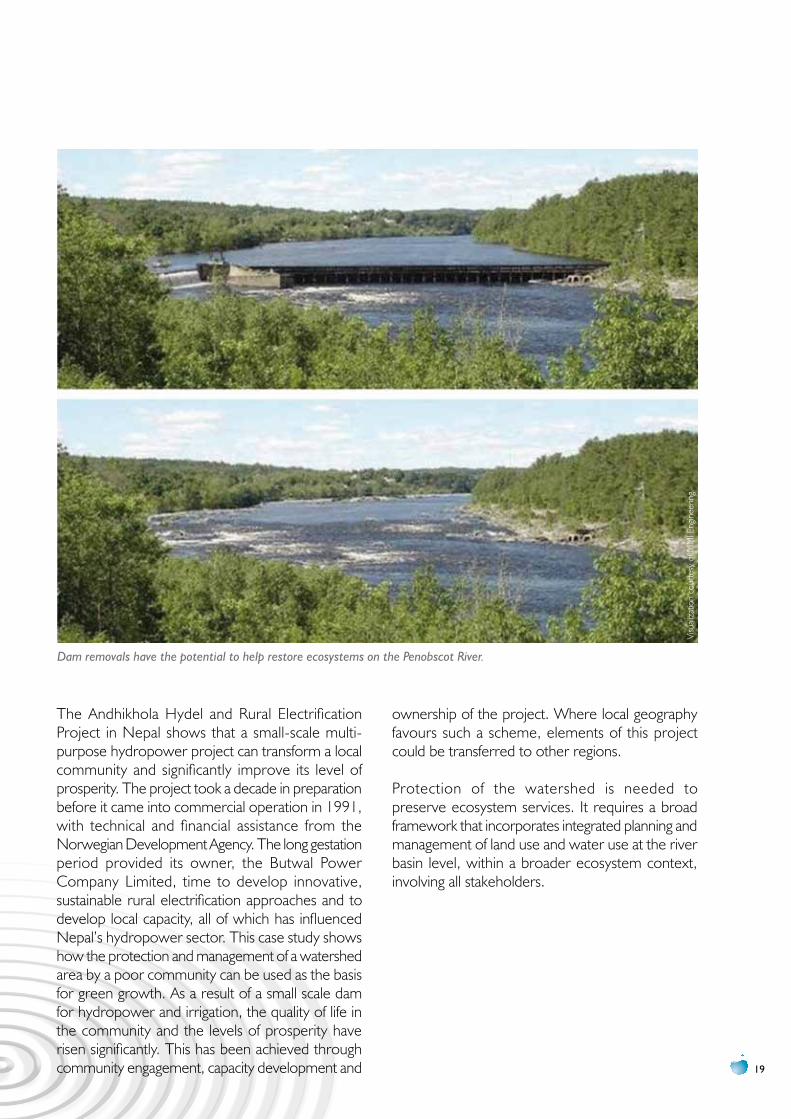
Dam removals have the potential to help restore ecosystems on the Penobscot River.
Visu
aliza
tion
cour
tesy
of M
MI E
ngin
eerin
g
The Andhikhola Hydel and Rural Electrification Project in Nepal shows that a small-scale multi-purpose hydropower project can transform a local community and significantly improve its level of prosperity. The project took a decade in preparation before it came into commercial operation in 1991, with technical and financial assistance from the Norwegian Development Agency. The long gestation period provided its owner, the Butwal Power Company Limited, time to develop innovative, sustainable rural electrification approaches and to develop local capacity, all of which has influenced Nepal’s hydropower sector. This case study shows how the protection and management of a watershed area by a poor community can be used as the basis for green growth. As a result of a small scale dam for hydropower and irrigation, the quality of life in the community and the levels of prosperity have risen significantly. This has been achieved through community engagement, capacity development and
ownership of the project. Where local geography favours such a scheme, elements of this project could be transferred to other regions.
Protection of the watershed is needed to preserve ecosystem services. It requires a broad framework that incorporates integrated planning and management of land use and water use at the river basin level, within a broader ecosystem context, involving all stakeholders.
WATER AND GREEN GROWTH
20
C. pOLICy, pLANNING AND GOvERNANCE
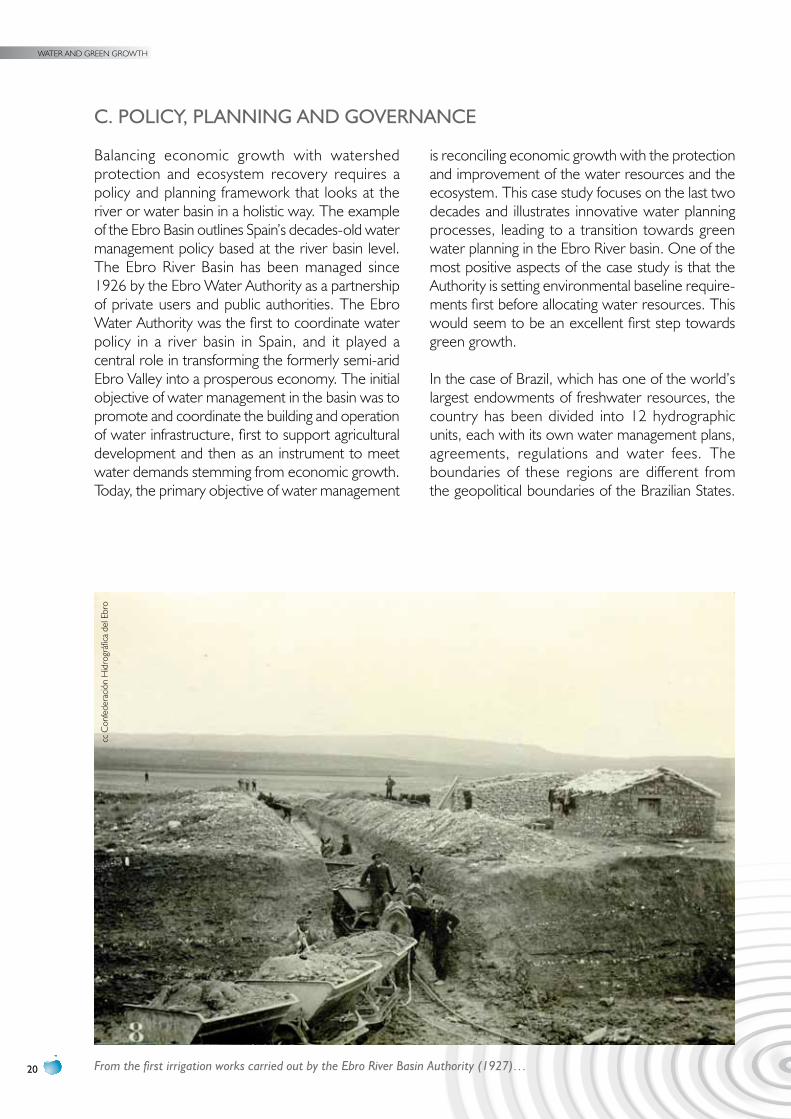
Balancing economic growth with watershed protection and ecosystem recovery requires a policy and planning framework that looks at the river or water basin in a holistic way. The example of the Ebro Basin outlines Spain’s decades-old water management policy based at the river basin level. The Ebro River Basin has been managed since 1926 by the Ebro Water Authority as a partnership of private users and public authorities. The Ebro Water Authority was the first to coordinate water policy in a river basin in Spain, and it played a central role in transforming the formerly semi-arid Ebro Valley into a prosperous economy. The initial objective of water management in the basin was to promote and coordinate the building and operation of water infrastructure, first to support agricultural development and then as an instrument to meet water demands stemming from economic growth. Today, the primary objective of water management
is reconciling economic growth with the protection and improvement of the water resources and the ecosystem. This case study focuses on the last two decades and illustrates innovative water planning processes, leading to a transition towards green water planning in the Ebro River basin. One of the most positive aspects of the case study is that the Authority is setting environmental baseline require-ments first before allocating water resources. This would seem to be an excellent first step towards green growth.
In the case of Brazil, which has one of the world’s largest endowments of freshwater resources, the country has been divided into 12 hydrographic units, each with its own water management plans, agreements, regulations and water fees. The boundaries of these regions are different from the geopolitical boundaries of the Brazilian States.
From the first irrigation works carried out by the Ebro River Basin Authority (1927)…
cc C
onfe
dera
ción
Hid
rogr
áfica
del
Ebr
o
21
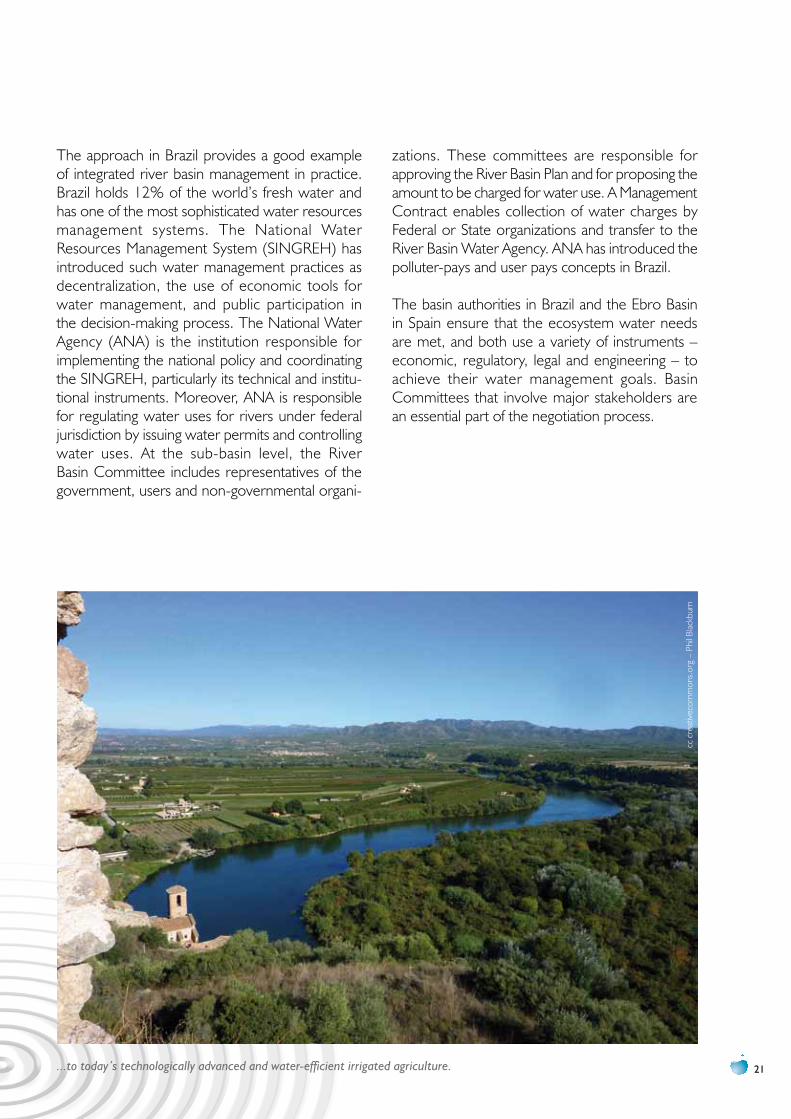
The approach in Brazil provides a good example of integrated river basin management in practice. Brazil holds 12% of the world’s fresh water and has one of the most sophisticated water resources management systems. The National Water Resources Management System (SINGREH) has introduced such water management practices as decentralization, the use of economic tools for water management, and public participation in the decision-making process. The National Water Agency (ANA) is the institution responsible for implementing the national policy and coordinating the SINGREH, particularly its technical and institu-tional instruments. Moreover, ANA is responsible for regulating water uses for rivers under federal jurisdiction by issuing water permits and controlling water uses. At the sub-basin level, the River Basin Committee includes representatives of the government, users and non-governmental organi-
zations. These committees are responsible for approving the River Basin Plan and for proposing the amount to be charged for water use. A Management Contract enables collection of water charges by Federal or State organizations and transfer to the River Basin Water Agency. ANA has introduced the polluter-pays and user pays concepts in Brazil.
The basin authorities in Brazil and the Ebro Basin in Spain ensure that the ecosystem water needs are met, and both use a variety of instruments – economic, regulatory, legal and engineering – to achieve their water management goals. Basin Committees that involve major stakeholders are an essential part of the negotiation process.
...to today’s technologically advanced and water-efficient irrigated agriculture.
cc c
reat
ivec
omm
ons.
org
– Ph
il Bl
ackb
urn
WATER AND GREEN GROWTH
22
D. FINANCING AND puBLIC-pRIvATE pARTNERSHIpS
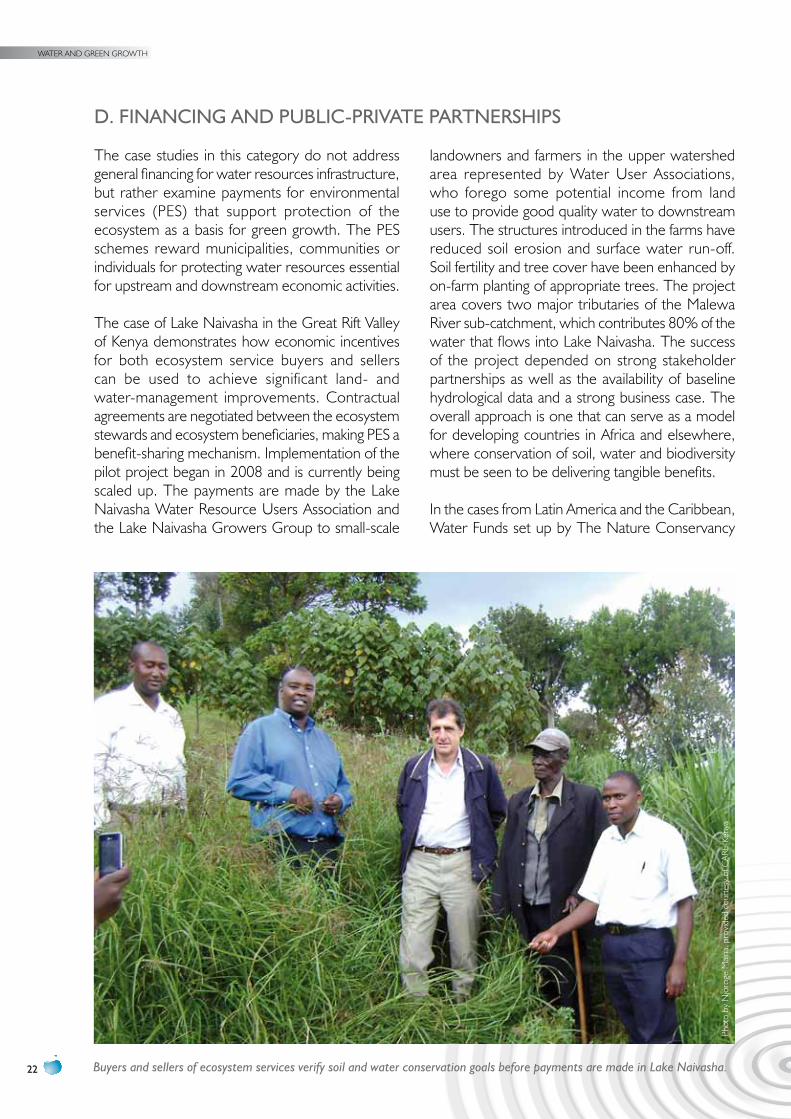
The case studies in this category do not address general financing for water resources infrastructure, but rather examine payments for environmental services (PES) that support protection of the ecosystem as a basis for green growth. The PES schemes reward municipalities, communities or individuals for protecting water resources essential for upstream and downstream economic activities.
The case of Lake Naivasha in the Great Rift Valley of Kenya demonstrates how economic incentives for both ecosystem service buyers and sellers can be used to achieve significant land- and water-management improvements. Contractual agreements are negotiated between the ecosystem stewards and ecosystem beneficiaries, making PES a benefit-sharing mechanism. Implementation of the pilot project began in 2008 and is currently being scaled up. The payments are made by the Lake Naivasha Water Resource Users Association and the Lake Naivasha Growers Group to small-scale
landowners and farmers in the upper watershed area represented by Water User Associations, who forego some potential income from land use to provide good quality water to downstream users. The structures introduced in the farms have reduced soil erosion and surface water run-off. Soil fertility and tree cover have been enhanced by on-farm planting of appropriate trees. The project area covers two major tributaries of the Malewa River sub-catchment, which contributes 80% of the water that flows into Lake Naivasha. The success of the project depended on strong stakeholder partnerships as well as the availability of baseline hydrological data and a strong business case. The overall approach is one that can serve as a model for developing countries in Africa and elsewhere, where conservation of soil, water and biodiversity must be seen to be delivering tangible benefits.
In the cases from Latin America and the Caribbean, Water Funds set up by The Nature Conservancy
Buyers and sellers of ecosystem services verify soil and water conservation goals before payments are made in Lake Naivasha.
Phot
o by
Njo
roge
Main
a, p
rovi
ded
cour
tesy
of C
ARE-
Keny
a
23
(TNC) are endowments to support watershed protection and promote green growth, rather than direct payments to individuals. The Funds require involvement of stakeholders upstream and downstream and spread both benefits and costs among industries, municipalities, communities, utilities and the ecosystem. Financing comes from the users, the government (including a percentage of the water company’s revenues) and international development banks and other donors. Although it is difficult to initiate them, these funds can serve as models for municipalities that are searching for ways to reduce costs of treatment and distribution. In the case of Quito, Ecuador, about 80% of the water for the city comes from three protected areas and their buffer zones. The Quito Water Conser-vation Fund (Fondo para la Conservación del Agua – FONAG), created with the help of The Nature Conservancy about 10 years ago, receives money from government, public utilities, electric companies, private companies and non-government organiza-tions. An independent financial manager invests the money, and the interest is used to fund activities for watershed protection. These include: control
and monitoring of protected areas, restoration of natural vegetation, environmental education, training in watershed management, and a hydro-logical monitoring programme. Local communities that live close to the water sources receive support from FONAG for environmental education and community-based projects. Initial funding for the Quito Water Fund included TNC and USAID grants. The Fund amounted to US$ 5.4 million at the end of 2008 and is now almost US$ 10 million.
The other case studies in this category show a wide variety of PES and similar schemes that provide monetary and non-monetary (including provisional land tenure) incentives to residents of the watershed to be stewards of the forest and water resources. Water Stewardship has now become an important model for restoration and protection of watershed resources and has spread internationally into the Alliance for Water Stewardship, spearheaded by the Nature Conservancy.
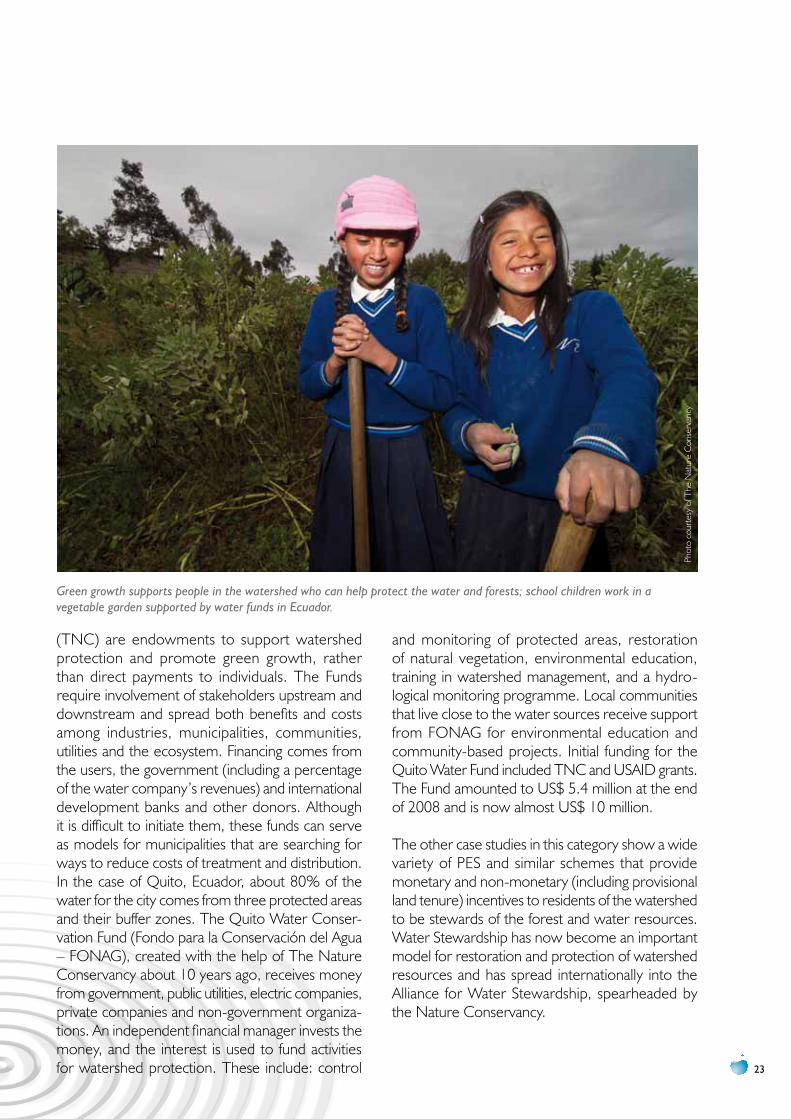
Green growth supports people in the watershed who can help protect the water and forests; school children work in a vegetable garden supported by water funds in Ecuador.
Phot
o co
urte
sy o
f The
Nat
ure
Con
serv
ancy
WATER AND GREEN GROWTH
24
E. INNOvATION AND TECHNOLOGy
Technological innovations can increase water avail-ability from water savings and pollution control. These are considered green growth solutions, as they improve the environment and reduce costs to users. Some of them include: recycling and reuse of water, low water using appliances, efficient irrigation systems, decentralized sewerage systems, rainwater catchments and reclamation of nutrients. With such green growth innovations, energy costs are also reduced, with savings on fossil fuel consumption, greenhouse gas emissions and climate change impacts. Other technological tools that contribute to green growth include information and communi-cations technologies that will assist water managers to encourage conservation and manage demand.
A case study from Australia describes an information technology model that measures the impact of changes in human behaviour and adoption of green technologies on urban water use. A software product developed by eWater Cooperative Research Centre4 models this information as an input to Integrated Urban Water Management (IUWM). Modellers can explore design scenarios which substitute tank water or grey water instead of tap for household water uses such as toilet, shower, washing machine or outdoor water use. The latest software tool incorporates all three urban water cycle services – potable, wastewater and storm water – within a single framework. It can simulate demand and supply interactions at sub-daily time scales, and can deal with catchment rainfall-runoff
4 .See: www.crc.gov.au.
responses at a range of scales. This software solution from Australia should be replicable in other countries as a support to urban water managers implementing demand management and conservation approaches to reduce consumption. It supports water and sanitation authorities that are introducing alternative options to building new supply systems, which could include use of non-potable water and re-use of grey water for outside purposes, flushing and fire fighting. As all nations will have to begin to use water more wisely, this water management tool could be useful in emerging economies. The next step would be to work with customers to see how they can participate in water-saving decisions.
The case study from Gujarat (India) chronicles a combination of huge investments in water infra-structure and modifications in water and energy policies that have affected millions of people throughout the State. One of the important lessons learned from the case study is that technological initiatives to improve water supply for domestic consumption and irrigation have to be comple-mented by grassroots people’s participation in management and distribution of water. The community managed water supply programme in Gujarat has proved to be a model for the entire country. Small innovations, such as micro-water harvesting, can make a large impact on agricultural production. For example, the Sardar Patel Partici-patory Conservation Project (SPPWCP) involves construction of check dams and village tanks or ponds by a designated beneficiary group, with
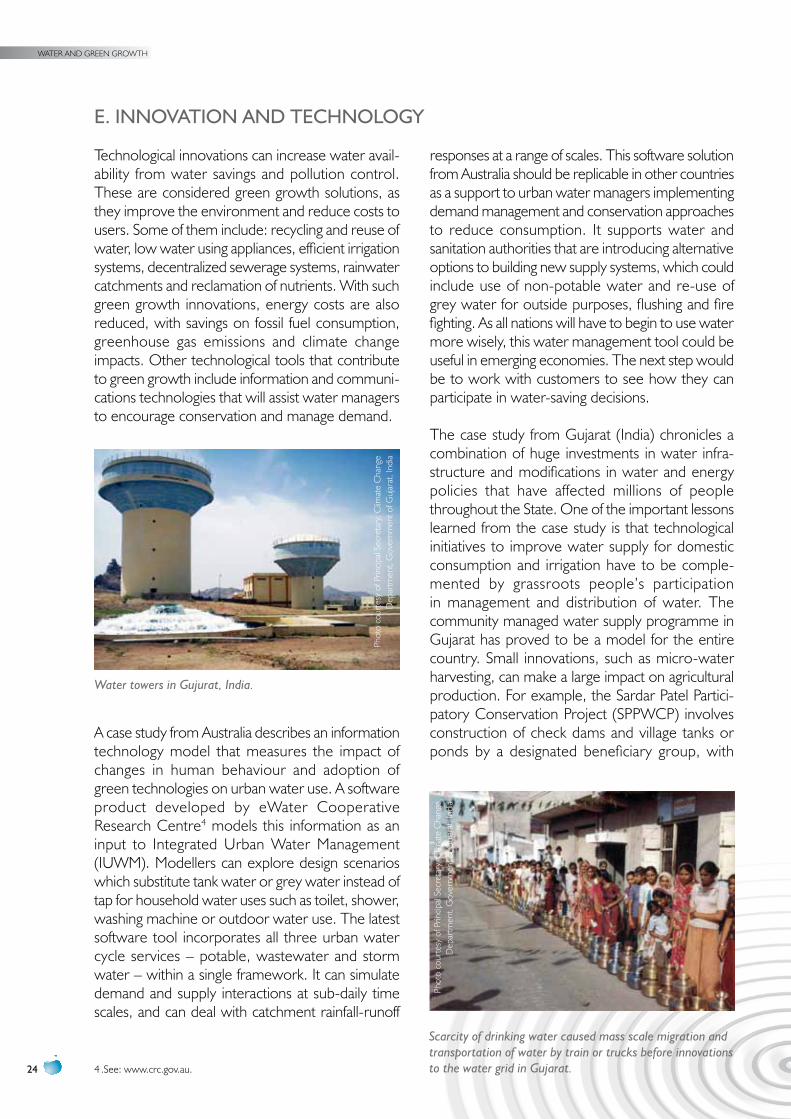
Water towers in Gujurat, India.
Phot
o co
urte
sy o
f Prin
cipal
Secr
etar
y, C
limat
e C
hang
e D
epar
tmen
t, G
over
nmen
t of G
ujar
at, I
ndia
Phot
o co
urte
sy o
f Prin
cipal
Secr
etar
y, C
limat
e C
hang
e D
epar
tmen
t, G
over
nmen
t of G
ujar
at, I
ndia
Scarcity of drinking water caused mass scale migration and transportation of water by train or trucks before innovations to the water grid in Gujarat.
25
technical and financial assistance from the district office. More than 350,000 check dams and village tanks or ponds were created in the last eight years, providing direct benefit to over 13 million people in rural Gujarat. Gujarat has also created the Gujarat Green Revolution Company Ltd. to popularize the adoption of drip irrigation among farmers. GGRC offers highly subsidized loans to farmers and has simplified the administrative procedures.
Other innovative solutions result in direct economic benefits; for example, one case study from Oregon (USA) shows that the nutrients removed from water and wastewater treatment can be sold as commercial fertilizer. Nutrient recovery contributes to a change in thinking through which wastewater treatment plants become resource recovery plants.
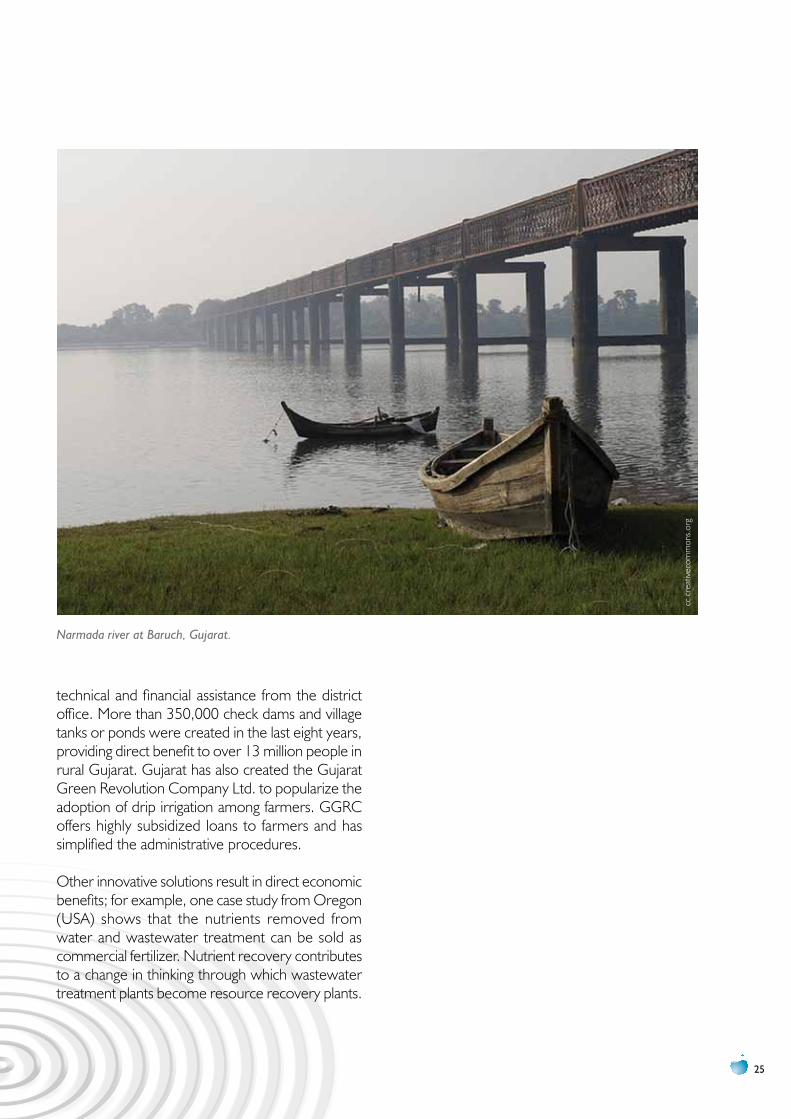
Narmada river at Baruch, Gujarat.
cc c
reat
ivec
omm
ons.
org
WATER AND GREEN GROWTH
26
F. INFRASTRuCTuRE
Extensive networks of ‘grey’ infrastructure have been built over the years that provide drinking water, wastewater and storm water services to the public. Dams, weirs and diversions generate electricity and supply irrigation water to farmers. Much of that infrastructure is now getting old, and is in need of repair or replacement. In the process of repairing and constructing infrastructure, new concepts are being introduced to reduce their negative environ-mental impact. At the basin level, a combination of grey and green infrastructure can include the preservation and restoration of natural landscape features, such as forests, floodplains and wetlands. Communities can participate in improving water quality while providing wildlife habitat and oppor-tunities for outdoor recreation. The case studies below address construction of grey infrastructure, as well as green infrastructure in restoration of waterways.
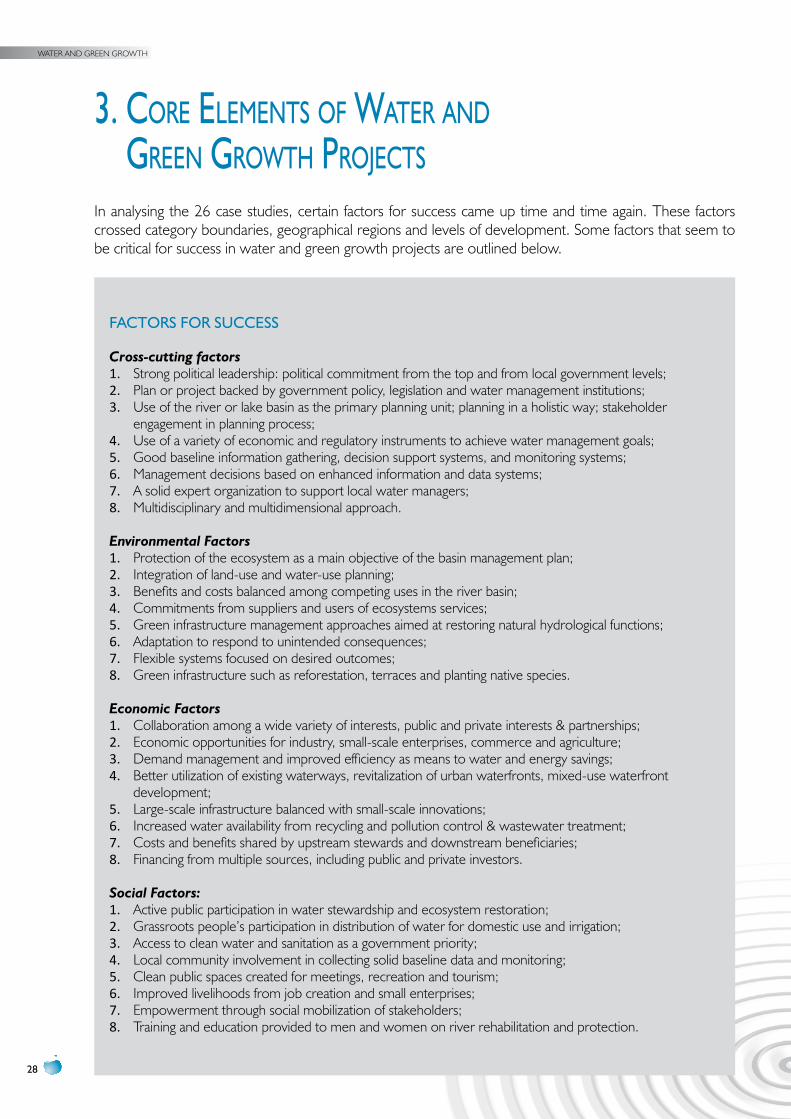
The ‘Sanitation Plan’ case study from Santiago, Chile focuses on wastewater treatment, for the Santiago water basin. The project is led by Aguas Andinas, the main water and sewerage utility in Santiago, which is partly owned by Agbar, an international water company with a presence in nine countries. Chile essentially privatized its water and sanitation services from 1998 to 2005, and this project was carried out by private sector companies in collaboration with the Government of Chile. The case study shows how the city of Santiago has cleaned the rivers in its watershed, reduced pollution and improved wastewater treatment. Residents of Santiago pay for the wastewater treatment and sewerage services they receive through tariffs. The project is financed by bonds issued by Aguas Andinas that will be repaid by tariffs over time. The case is important as it shows that a large urban metropolis can succeed in cleaning up its waterways, and that improvements in water quality can be a factor in green growth. While this project entailed a huge investment in treatment infrastructure, it has had many positive impacts on health, the economy and the environment.
The Republic of Korea’s Four Major Rivers Restoration Project, a massive infrastructure project, is a priority under the Government’s green investment programme. The Government is allocating 2% of its GDP per year over the 2009-13 period (approximately US$ 86 billion)
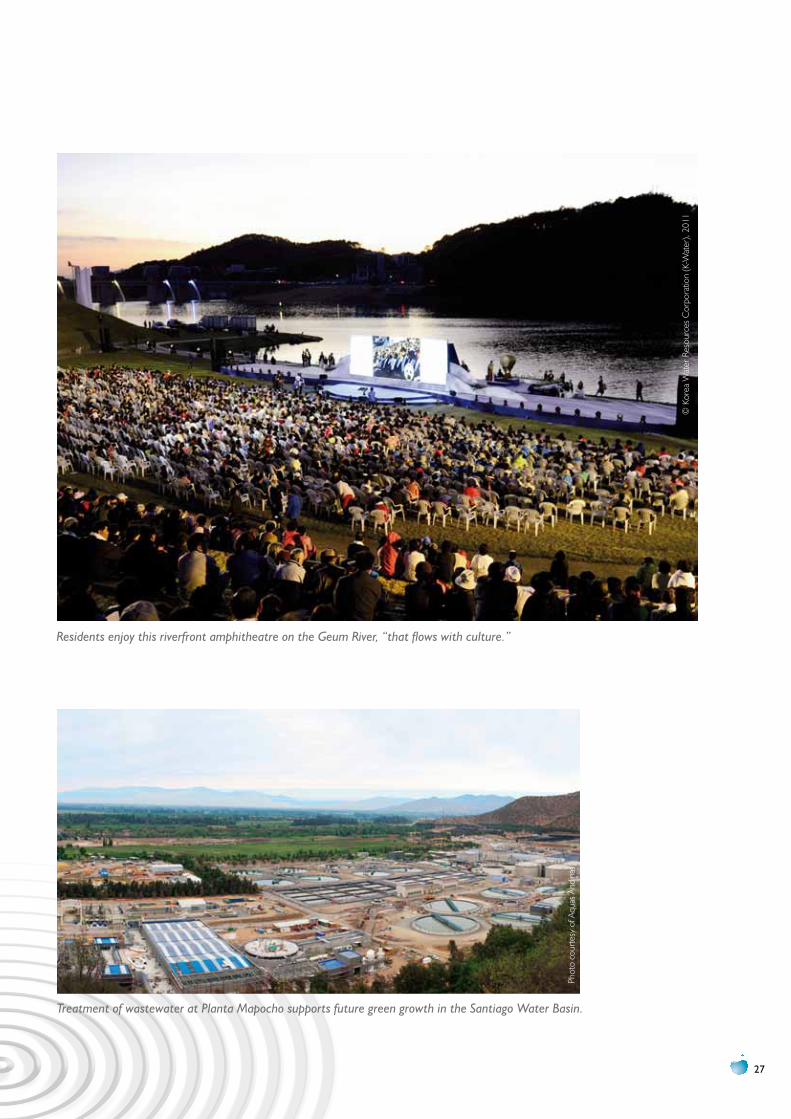
on green investment. Approximately 20% of the green budget is to be invested in the water sector through the Four Major Rivers Restoration Project. The project is designed to address the significant environmental challenges faced by the Han, Nakdong, Geum and Yeongsan Rivers. The organization in charge of project execution and coordination among various government agencies is the Office of National River Restoration in the Ministry of Land, Transport and Maritime Affairs. The Office itself has a high level of expertise, and it coordinates the work of five ministries and 78 local governments. The goals of the project are to: secure water supply (1.3 billion m3); manage floods and droughts; restore water ecosystems and improve water quality; develop river banks to ensure space for recreation; and develop the waterfront areas along the rivers. This has entailed extensive dredging of sediments, constructing new small-sized multipurpose dams and reservoirs, and removing pollutants, including in farming areas. More than 1,000 km of major streams have been restored, and another 10,000 km of minor streams are being restored. The government expects the project to generate approximately US$ 32.8 billion in positive economic benefits, and create 340,000 jobs in a time frame of 6-10 years.
While these case studies describe large infrastructure projects that seem to be implemented from the top, they have had positive environmental, economic and social impacts on the communities living in the project area. Experience indicates that it may be better to start small and scale up, so that large infra-structure solutions are tested and accepted by the communities where they are implemented.
27
Treatment of wastewater at Planta Mapocho supports future green growth in the Santiago Water Basin.
Phot
o co
urte
sy o
f Aqu
as A
ndin
as
© K
orea
Wat
er R
esou
rces
Cor
pora
tion
(K-W
ater
), 20
11
Residents enjoy this riverfront amphitheatre on the Geum River, “that flows with culture.”
WATER AND GREEN GROWTH
28
3. core eLeMents of Water and green groWth Projects
In analysing the 26 case studies, certain factors for success came up time and time again. These factors crossed category boundaries, geographical regions and levels of development. Some factors that seem to be critical for success in water and green growth projects are outlined below.
FACTORS FOR SuCCESS
Cross-cutting factors1. Strong political leadership: political commitment from the top and from local government levels; 2. Plan or project backed by government policy, legislation and water management institutions;3. Use of the river or lake basin as the primary planning unit; planning in a holistic way; stakeholder
engagement in planning process;4. Use of a variety of economic and regulatory instruments to achieve water management goals;5. Good baseline information gathering, decision support systems, and monitoring systems; 6. Management decisions based on enhanced information and data systems; 7. A solid expert organization to support local water managers;8. Multidisciplinary and multidimensional approach.
Environmental Factors 1. Protection of the ecosystem as a main objective of the basin management plan; 2. Integration of land-use and water-use planning;3. Benefits and costs balanced among competing uses in the river basin;4. Commitments from suppliers and users of ecosystems services;5. Green infrastructure management approaches aimed at restoring natural hydrological functions;6. Adaptation to respond to unintended consequences;7. Flexible systems focused on desired outcomes;8. Green infrastructure such as reforestation, terraces and planting native species.
Economic Factors1. Collaboration among a wide variety of interests, public and private interests & partnerships;2. Economic opportunities for industry, small-scale enterprises, commerce and agriculture;3. Demand management and improved efficiency as means to water and energy savings;4. Better utilization of existing waterways, revitalization of urban waterfronts, mixed-use waterfront
development; 5. Large-scale infrastructure balanced with small-scale innovations; 6. Increased water availability from recycling and pollution control & wastewater treatment; 7. Costs and benefits shared by upstream stewards and downstream beneficiaries; 8. Financing from multiple sources, including public and private investors.
Social Factors:1. Active public participation in water stewardship and ecosystem restoration;2. Grassroots people’s participation in distribution of water for domestic use and irrigation; 3. Access to clean water and sanitation as a government priority;4. Local community involvement in collecting solid baseline data and monitoring; 5. Clean public spaces created for meetings, recreation and tourism;6. Improved livelihoods from job creation and small enterprises;7. Empowerment through social mobilization of stakeholders; 8. Training and education provided to men and women on river rehabilitation and protection.
29
BENEFITS COMMON TO MANy OF THE WATER AND GREEN GROWTH pROjECTS
Environmental benefits from water and green growth projects include the following:• Improvement in Water Quality: improved health of ecosystems, reduction in siltation and erosion;• Decontamination of surface and groundwater bodies: lower levels of biological, agricultural and industrial
contaminants; drastic reduction in water pollution;• Restoration of natural river functions: maintenance of minimum flows; flood protection and drought
reduction; • Restoration of fish and wildlife habitat: higher level of biological diversity• Improved vegetation cover: reforestation; recovery of degraded soils; planting along river banks• Recharge of reservoirs and aquifers; • Reductions in CO2 emissions.
Economic benefits that have been identified in the water and green growth case studies include:• Engines of growth: waterfront developments in cities; light industry and high tech development along
waterfronts; sales of recycled products; growth in agricultural production; • Industrial expansion: growth in industrial production, small-scale enterprises and handicrafts; • Increased efficiency: more efficient irrigation systems and wastewater treatment systems; reduced wastage
from distribution of water supply and from collection of sewage; recycling and reuse of water and wastewater;• Employment opportunities: job creation from waterfront developments, small and medium-scale industries,
ecosystem restoration, handicrafts with local products; sales of waste products;• Improved hydropower capacity;• Fairer allocation of water among water-using sectors; • Shared costs and benefits: ecosystem service buyers and sellers; • Affordable green alternatives: avoidance of investment for large-scale infrastructure; • Reductions in public expenditures: savings on water treatment costs in municipal areas; reduction in public
health expenditures and improved human productivity;• Mobilization of funds: public and private sources, NGOs, multilateral and bilateral donors.
Social benefits that have been identified as a result of water and green growth projects include:• Access to clean water and sanitation: reduction in time spent fetching water, decrease in the cost of drinking
water; improvements in quality of life;• Health improvements: reduction in water-borne diseases, higher productivity, higher school attendance;• Rehabilitation of clean public spaces: improvements in landscapes; facilities for recreation, sports, tourism,
education;• Improved livelihoods: job creation; social entrepreneurship; agricultural production;• Training and education: programmes available for men and women; • Empowerment to influence change: participation in watershed management and decisions on water allocation;
consultations; fairer water distribution;• Greater security: water security for people in watershed areas, social inclusion;• Monetary and non-monetary compensation: farmers and communities in the watershed receive payments
or other compensation to protect the watershed and forest.
WATER AND GREEN GROWTH
30
REpLICATION
Many of the lessons learned from the case studies have the possibility to be scaled up, particularly to the national level. This is certainly the case with examples of technologies and of water fund schemes, many of which started with small pilot studies. When the scheme is set up successfully and begins to provide the anticipated benefits, it can encourage others to participate. It is also possible for international organizations or NGOs to spread the word about successful technologies or approaches to neighbouring regions or countries. This has happened with the Water Funds in Latin America and the Caribbean and the expansion of the Alliance for Water Stewardship.
On the other hand, some of the large-scale infrastructure projects may be too ambitious to implement all at once without a considerable commitment and coordination of public resources. It may make sense in some countries to either scale down or break up these huge top-down projects to more manageable size. Considering the large investment involved and the importance of engaging stakeholders and mobilizing communities, it might be worthwhile to ‘start small and scale up.’ The programme can be gradually expanded after the
benefits and the costs are measured. Such projects might be reconsidered as a step-by-step process where the results are measured according to agreed benchmarks before expanding up to the wider river basin level, and ultimately to other river basins. The evidence shows that watershed management is a delicate balance of economic, social and environ-mental concerns, and will not be successful if simply imposed from the top.
Each water and green growth initiative is specific to the area and country where it is implemented. The case studies that were analysed provide some direction through the factors for success that have been identified in each category. Each one depends on political commitment, stakeholder engagement and enabling conditions based on well-crafted government policy and regulation. In particular, government policy should be flexible enough to encourage a variety of innovative solutions that can come from public institutions, NGOs, the private sector or individuals for implementation at local, national or international levels. One thing that has been demonstrated clearly from the case studies is that partnerships at all levels are crucial for success.
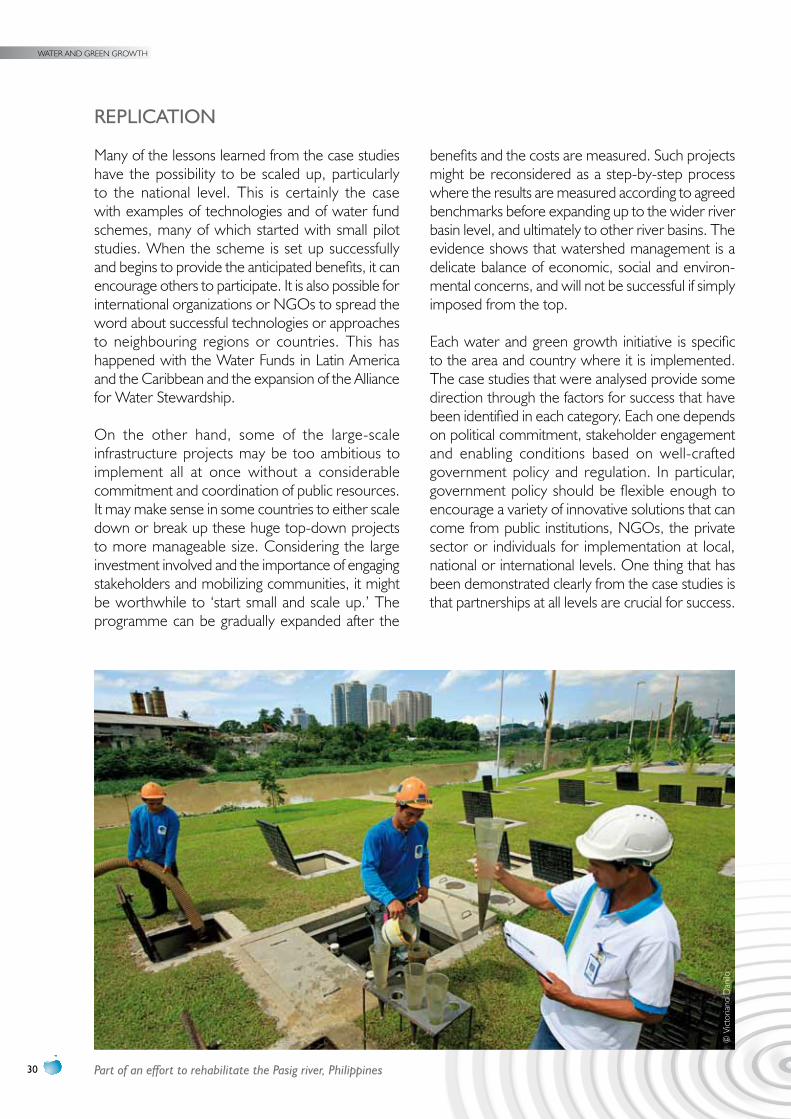
Part of an effort to rehabilitate the Pasig river, Philippines
© V
ictor
iano
Dan
ilo
31
4. draft PoLicy fraMeWork on Water and green groWth
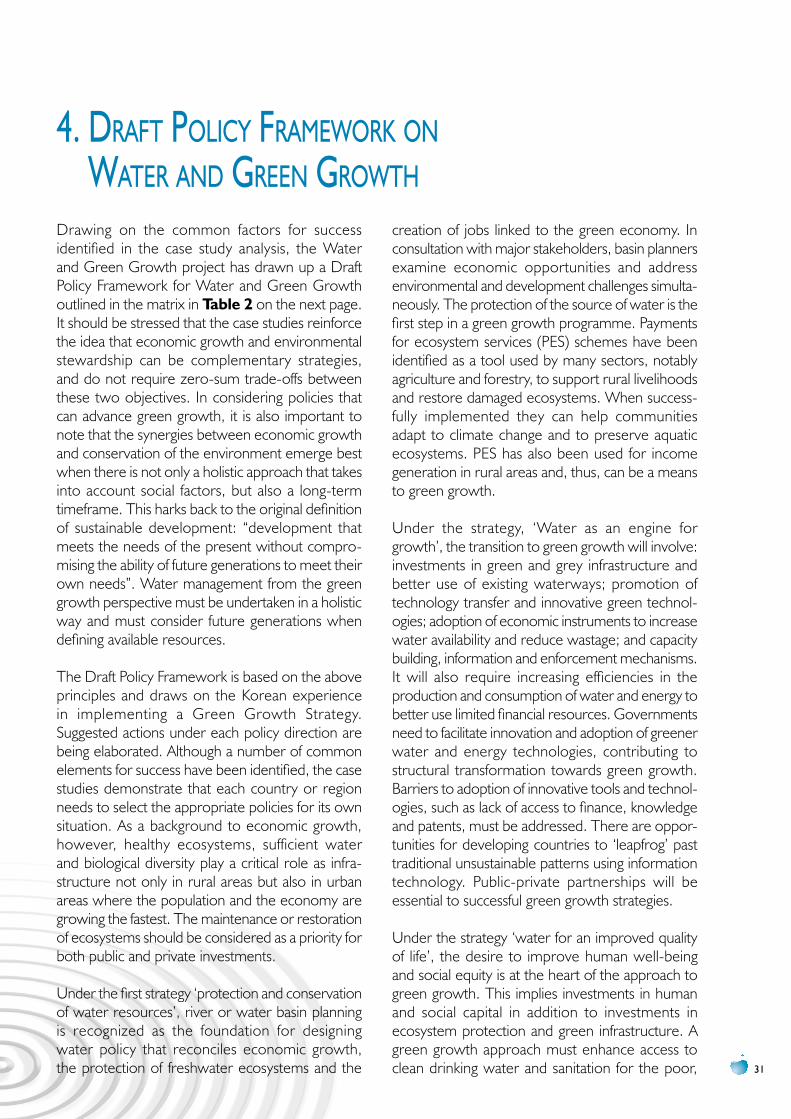
Drawing on the common factors for success identified in the case study analysis, the Water and Green Growth project has drawn up a Draft Policy Framework for Water and Green Growth outlined in the matrix in Table 2 on the next page. It should be stressed that the case studies reinforce the idea that economic growth and environmental stewardship can be complementary strategies, and do not require zero-sum trade-offs between these two objectives. In considering policies that can advance green growth, it is also important to note that the synergies between economic growth and conservation of the environment emerge best when there is not only a holistic approach that takes into account social factors, but also a long-term timeframe. This harks back to the original definition of sustainable development: “development that meets the needs of the present without compro-mising the ability of future generations to meet their own needs”. Water management from the green growth perspective must be undertaken in a holistic way and must consider future generations when defining available resources.
The Draft Policy Framework is based on the above principles and draws on the Korean experience in implementing a Green Growth Strategy. Suggested actions under each policy direction are being elaborated. Although a number of common elements for success have been identified, the case studies demonstrate that each country or region needs to select the appropriate policies for its own situation. As a background to economic growth, however, healthy ecosystems, sufficient water and biological diversity play a critical role as infra-structure not only in rural areas but also in urban areas where the population and the economy are growing the fastest. The maintenance or restoration of ecosystems should be considered as a priority for both public and private investments.
Under the first strategy ‘protection and conservation of water resources’, river or water basin planning is recognized as the foundation for designing water policy that reconciles economic growth, the protection of freshwater ecosystems and the
creation of jobs linked to the green economy. In consultation with major stakeholders, basin planners examine economic opportunities and address environmental and development challenges simulta-neously. The protection of the source of water is the first step in a green growth programme. Payments for ecosystem services (PES) schemes have been identified as a tool used by many sectors, notably agriculture and forestry, to support rural livelihoods and restore damaged ecosystems. When success-fully implemented they can help communities adapt to climate change and to preserve aquatic ecosystems. PES has also been used for income generation in rural areas and, thus, can be a means to green growth.
Under the strategy, ‘Water as an engine for growth’, the transition to green growth will involve: investments in green and grey infrastructure and better use of existing waterways; promotion of technology transfer and innovative green technol-ogies; adoption of economic instruments to increase water availability and reduce wastage; and capacity building, information and enforcement mechanisms. It will also require increasing efficiencies in the production and consumption of water and energy to better use limited financial resources. Governments need to facilitate innovation and adoption of greener water and energy technologies, contributing to structural transformation towards green growth. Barriers to adoption of innovative tools and technol-ogies, such as lack of access to finance, knowledge and patents, must be addressed. There are oppor-tunities for developing countries to ‘leapfrog’ past traditional unsustainable patterns using information technology. Public-private partnerships will be essential to successful green growth strategies.
Under the strategy ‘water for an improved quality of life’, the desire to improve human well-being and social equity is at the heart of the approach to green growth. This implies investments in human and social capital in addition to investments in ecosystem protection and green infrastructure. A green growth approach must enhance access to clean drinking water and sanitation for the poor,
WATER AND GREEN GROWTH
32
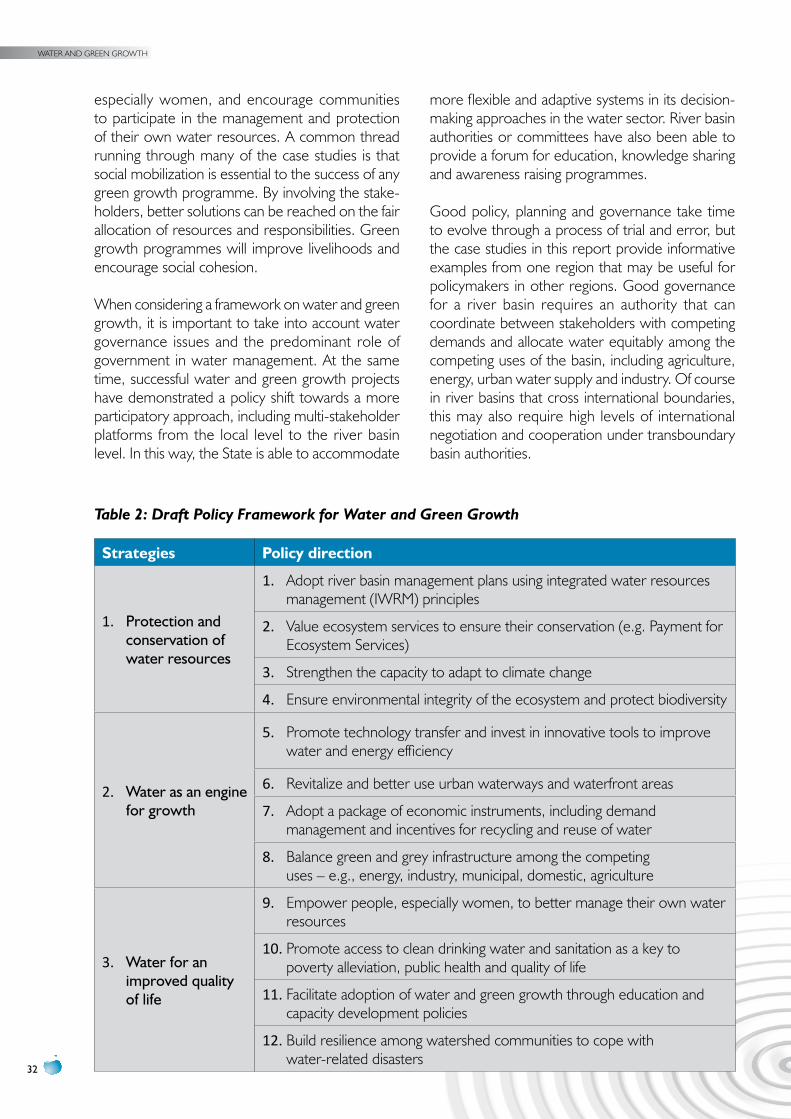
Table 2: Draft Policy Framework for Water and Green Growth
Strategies Policy direction
1. protection and conservation of water resources
1. Adopt river basin management plans using integrated water resources management (IWRM) principles
2. Value ecosystem services to ensure their conservation (e.g. Payment for Ecosystem Services)
3. Strengthen the capacity to adapt to climate change
4. Ensure environmental integrity of the ecosystem and protect biodiversity
2. Water as an engine for growth
5. Promote technology transfer and invest in innovative tools to improve water and energy efficiency
6. Revitalize and better use urban waterways and waterfront areas
7. Adopt a package of economic instruments, including demand management and incentives for recycling and reuse of water
8. Balance green and grey infrastructure among the competing uses – e.g., energy, industry, municipal, domestic, agriculture
3. Water for an improved quality of life
9. Empower people, especially women, to better manage their own water resources
10. Promote access to clean drinking water and sanitation as a key to poverty alleviation, public health and quality of life
11. Facilitate adoption of water and green growth through education and capacity development policies
12. Build resilience among watershed communities to cope with water-related disasters
especially women, and encourage communities to participate in the management and protection of their own water resources. A common thread running through many of the case studies is that social mobilization is essential to the success of any green growth programme. By involving the stake-holders, better solutions can be reached on the fair allocation of resources and responsibilities. Green growth programmes will improve livelihoods and encourage social cohesion.
When considering a framework on water and green growth, it is important to take into account water governance issues and the predominant role of government in water management. At the same time, successful water and green growth projects have demonstrated a policy shift towards a more participatory approach, including multi-stakeholder platforms from the local level to the river basin level. In this way, the State is able to accommodate
more flexible and adaptive systems in its decision-making approaches in the water sector. River basin authorities or committees have also been able to provide a forum for education, knowledge sharing and awareness raising programmes.
Good policy, planning and governance take time to evolve through a process of trial and error, but the case studies in this report provide informative examples from one region that may be useful for policymakers in other regions. Good governance for a river basin requires an authority that can coordinate between stakeholders with competing demands and allocate water equitably among the competing uses of the basin, including agriculture, energy, urban water supply and industry. Of course in river basins that cross international boundaries, this may also require high levels of international negotiation and cooperation under transboundary basin authorities.
33
5. next stePs
The policy framework will be further developed by the project implementation team, led by its Steering Committee and advised by a High Level Panel of Experts (HLP). It is proposed that the outputs from the 6th World Water Forum, held in Marseille France in March 2012, including the policy framework, shall be taken forward with the support of the HLP.
The Water and Green Growth project will require the collaboration of a wide variety of key stake-holders, many of whom are already working in the area of water and green growth. These include UN-Water, UNEP, the United Nations Regional Economic Commissions such as UNESCAP, OECD, GGGI and national governments at all levels of economic development. As nations everywhere are looking to continue growing and developing their economies, the lessons learned by past mistakes in managing environ-mental resources can offer both cost savings and encourage more stable economies in the future. This means catalysing innovation and investment which will underpin sustained growth and give rise to new economic opportunities.
By the end of 2012, a revised report on Water and Green Growth will be issued taking into account the outputs from the 6th World Water Forum and other international events related to water being held in 2012, as well as feedback from the Steering Committee and HLP. The revised report will present a refined version of the policy framework. This will then be promoted with the aim of getting several national policymaking bodies to adopt and test the framework.
The water and green growth approach will pave the way for the international community to collaborate on the enhancement of water management for greening development in times of uncertainty. The challenge over the next three years is to identify more case studies in areas and regions that were not covered so far, such as in water-scarce regions and in Sub-Saharan Africa. The transferability of the lessons from the case studies and policy framework should be tested in countries that
are under water stress and would like to adopt water and green growth strategies.
The 6th World Water Forum in Marseille is only the beginning of a global effort to bring water and green growth to the attention of governments and other stakeholders. The joint Water and Green Growth project between the Korean Government (MLTM, PCGG, K-water) and the WWC is scheduled to continue until the 7th World Water Forum in 2015. Between the 6th and 7th Forums, the project will continue to identify case studies on water and green growth and will also monitor on-going projects already identified in the project report, and will feed into the 7th World Water Forum to be held in Daegu-Gyeongbuk, Republic of Korea in 2015.
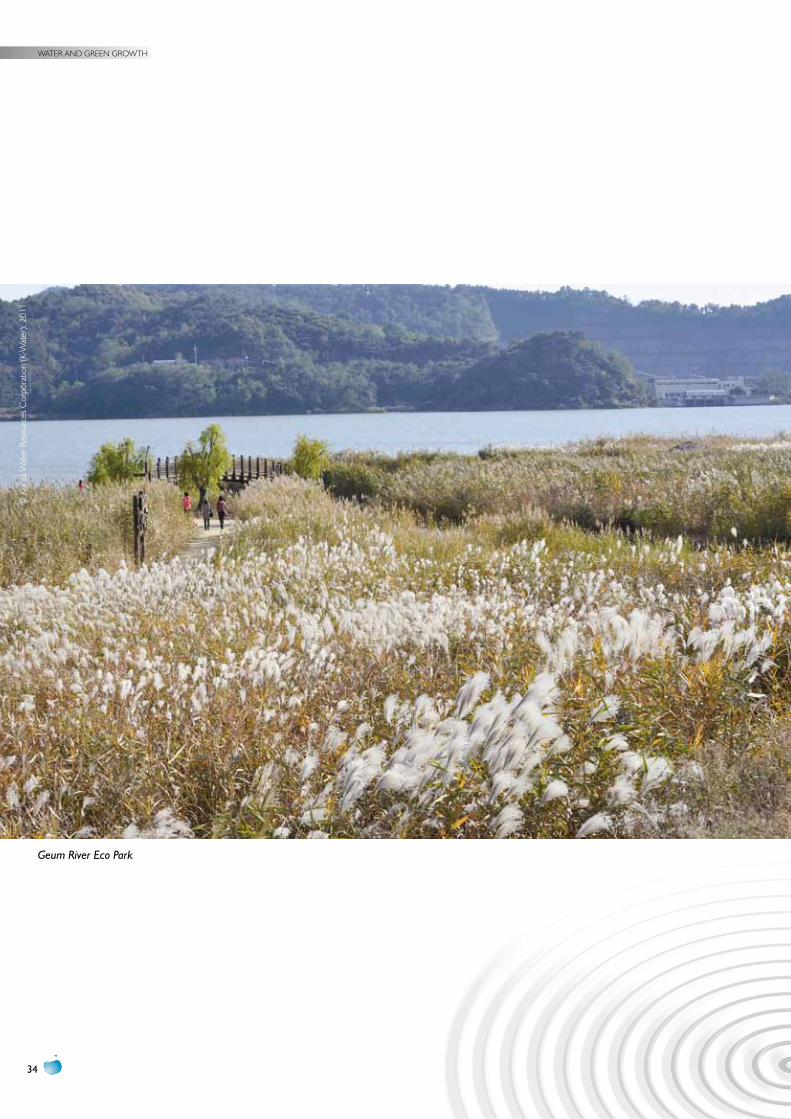
WATER AND GREEN GROWTH
34
Geum River Eco Park
© K
orea
Wat
er R
esou
rces
Cor
pora
tion
(K-W
ater
), 20
11
35
1. INTRODuCTION
1.1 PurPose
“Green growth” is an idea that has emerged in East Asia in response to the high environmental cost of rapid economic development and urbanization in that region over the past few decades. Public spending has increasingly been restricted during the current global economic crisis, while the cost of economic growth to the quality of life for all has been a catalyst for action. The idea has been championed by the Republic of Korea, promoted by the United Nations Economic and Social Commission for Asia and the Pacific (UNESCAP) and adopted by the Organisation for Economic Cooperation and Development (OECD). However, it is not yet clear what role water management plays in green growth.
While green growth has multiple definitions, this report considers it a strategy that fosters economic growth and development, protects natural ecosystems and the resources and environmental services they provide, and enhances socially inclusive development.
In this perspective, “water and green growth” should be understood as a strategy to invest in water infra-structure and water security that fosters economic growth and development, protects the environment and the services it provides, and enhances socially inclusive development.
This report on water and green growth is the first output of the Water and Green Growth Project. It is the result of over 12 months of research and analysis by an international group of experts led by
the Government of the Republic of Korea, including the Ministry of Land, Transport and Maritime Affairs, the Presidential Committee on Green Growth, and the Korea Water Resources Corporation (K-water), in cooperation with the World Water Council (WWC), a leading international membership-led non-governmental organization (NGO) focusing on water and sanitation issues. This report examines the relationship between water and the emerging economic paradigm called green growth and uses this analysis to recommend a draft framework for policymakers.
This report marks the first major milestone of this joint project, which will continue until at least 2015. A second edition of this report will be published by the end of 2012 in order to take account of the outputs of major stakeholder meetings taking place in 2012, including the 6th World Water Forum in Marseille, France (March); the 2nd Asia-Pacific Water Summit in Bangkok, Thailand (May); the United Nations Conference on Sustainable Development (Rio+20) in Rio de Janeiro, Brazil (June); and the World Water Week in Stockholm, Sweden (August). That report will include a refined version of the policy framework.
This report is also to be published with substantial background research and case studies on the joint project Web site: www.waterandgreengrowth.org.
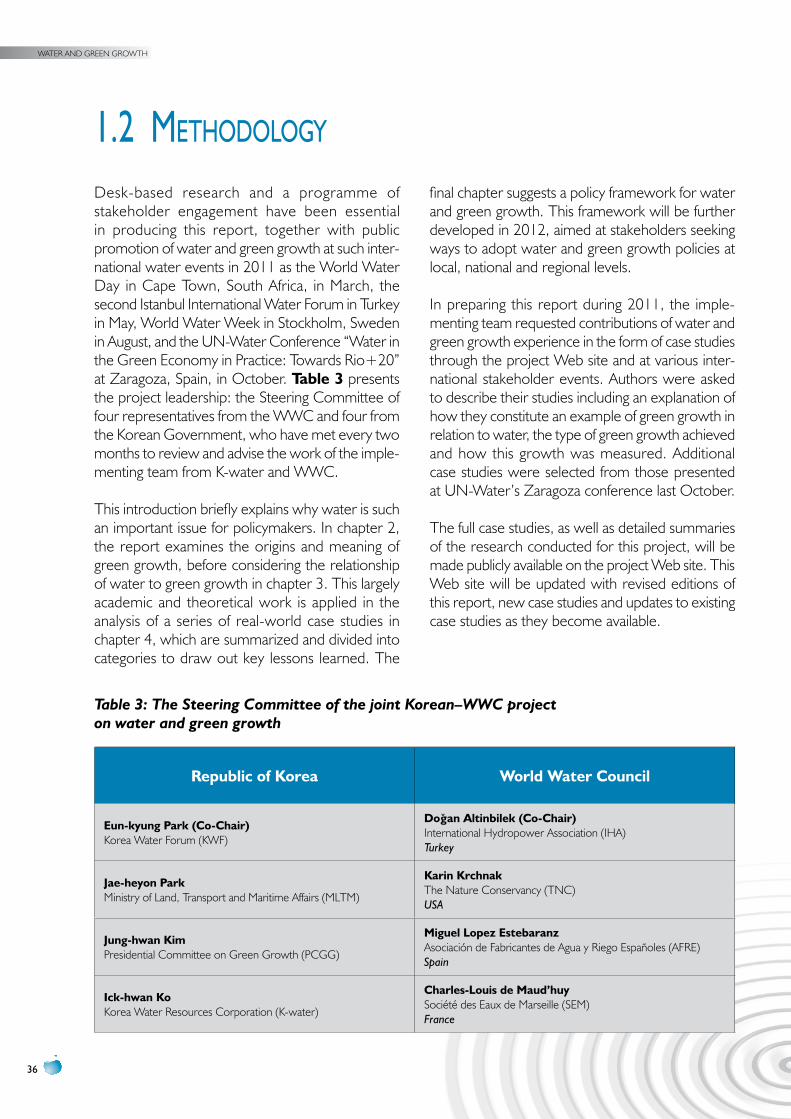
WATER AND GREEN GROWTH
36
1.2 MethodoLogy
Desk-based research and a programme of stakeholder engagement have been essential in producing this report, together with public promotion of water and green growth at such inter-national water events in 2011 as the World Water Day in Cape Town, South Africa, in March, the second Istanbul International Water Forum in Turkey in May, World Water Week in Stockholm, Sweden in August, and the UN-Water Conference “Water in the Green Economy in Practice: Towards Rio+20” at Zaragoza, Spain, in October. Table 3 presents the project leadership: the Steering Committee of four representatives from the WWC and four from the Korean Government, who have met every two months to review and advise the work of the imple-menting team from K-water and WWC.
This introduction briefly explains why water is such an important issue for policymakers. In chapter 2, the report examines the origins and meaning of green growth, before considering the relationship of water to green growth in chapter 3. This largely academic and theoretical work is applied in the analysis of a series of real-world case studies in chapter 4, which are summarized and divided into categories to draw out key lessons learned. The
final chapter suggests a policy framework for water and green growth. This framework will be further developed in 2012, aimed at stakeholders seeking ways to adopt water and green growth policies at local, national and regional levels.
In preparing this report during 2011, the imple-menting team requested contributions of water and green growth experience in the form of case studies through the project Web site and at various inter-national stakeholder events. Authors were asked to describe their studies including an explanation of how they constitute an example of green growth in relation to water, the type of green growth achieved and how this growth was measured. Additional case studies were selected from those presented at UN-Water’s Zaragoza conference last October.
The full case studies, as well as detailed summaries of the research conducted for this project, will be made publicly available on the project Web site. This Web site will be updated with revised editions of this report, new case studies and updates to existing case studies as they become available.
Table 3: The Steering Committee of the joint Korean–WWC project on water and green growth
Republic of Korea World Water council
eun-kyung Park (co-chair)Korea Water Forum (KWF)
Dogan Altinbilek (co-chair)International Hydropower Association (IHA) Turkey
Jae-heyon Park Ministry of Land, Transport and Maritime Affairs (MLTM)
Karin Krchnak The Nature Conservancy (TNC)USA
Jung-hwan Kim Presidential Committee on Green Growth (PCGG)
Miguel Lopez estebaranzAsociación de Fabricantes de Agua y Riego Españoles (AFRE)Spain
ick-hwan Ko Korea Water Resources Corporation (K-water)
charles-Louis de Maud’huySociété des Eaux de Marseille (SEM)France
37
1.3 gLoBaL Water issues
Water is a precious and essential resource, yet people no longer hold it sacred. Water is degraded, misused and wasted in almost every part of the world. The serious environmental and management challenges that face communities everywhere include deterio-rating water quality, inadequate access to clean water and sanitation for health, a decline in biodiversity; flooding, droughts and other natural disasters; and the need for ecosystem restoration, water treatment and wastewater management. To meet these challenges, water managers need to draw on innovative ideas and plans to build appropriate infrastructure in the face of climate change.
Climate change is one of the most serious challenges to the future of the planet. To rise to this challenge, we must widen our appreciation of our environment and the services it provides us. We cannot continue to destroy the earth’s ecosystems by using our industrial infrastructure and expect ever more economic growth. Humanity is diminishing its resource base, consuming ever-increasing supplies of water, energy and other resources in its insatiable quest for economic growth. The global human population continues to grow, with more than half its current number living in cities. These issues briefly described here are pursued in greater detail in the research for this report published in the project Web site. Strategies for managing the outcomes are elaborated in the review of case studies in chapter 4 of the report and in the Framework for Water and Green Growth in chapter 5.
WATER QuALITyThe pollution of water from toxic and human wastes being dumped into rivers, lakes and wetlands has reached alarming levels, as the pollutant loads exceed the self-purification capacity of water-related ecosystems. Water pollution grows ever more serious with the rapid global population growth, especially in urban areas, and increased industri-alization for economic development. As humans and plants depend on water for life and growth, drinking water must be clean and safe. Water containing excessive amounts of organic chemicals and heavy metals is potentially life-threatening, as is water polluted with domestic waste. Water from heavily polluted rivers and streams is also very costly
to collect, treat and manage, while such pollution, obviously, impedes economic growth. The preser-vation and restoration of ecosystem services are necessary to protect water quality for the maintenance of life and the growth of economies.
WATER AND SANITATION FOR HEALTHRecent figures from the WHO–UNICEF Joint Monitoring Programme for Water Supply and Sanitation show that in 2008 almost 900 million people still lacked access to improved drinking water and 2.6 billion (40% of the world’s population) lacked access to basic sanitation (WHO and UNICEF 2003-2010). Water is closely connected with every aspect of human health and development. Human beings cannot survive without a safe source of drinking water. Water-borne diseases cause the majority of illness and death among people in developing nations. With a major effort to improve water and sanitation, most water-related diseases can be prevented. Adequate quantities of good quality water are also necessary for food production; thus, water management is a key component in better nutrition and food security.
A green growth approach must enhance access to clean drinking water and sanitation for the poor, especially women, and encourage communities to participate in managing and protecting their own water resources. A recent WHO study has found that a US$ 1.00 investment in water and sanitation results in benefits of US$ 7.00 to US$ 32.00, depending on the country. The returns are measured mainly in terms of improved labour productivity and savings in public health expenditures (Hutton, Haller and Bartram, 2007).
BIODIvERSITy AND ECOSySTEM RESTORATIONThe future of biological diversity is threatened by the pollution of water, the fragmentation and destruction of habitat, the introduction of exotic species, and the stresses caused by overhunting and overfishing. Species found in and around freshwater habitats are in danger all over the globe. According to a recent calculation, as much as 12 million km2 of wetlands have already been destroyed. About 50% of wetlands located in North America, Europe and
WATER AND GREEN GROWTH
38
Oceania disappeared in the twentieth century. In particular, about 65% of freshwater ecosystems located inland are in danger of being lost (Vorosmarty et al. 2010). The deterioration and loss of fresh water habitats due to human activity have reduced the number of aquatic and semi-aquatic species. The International Union for the Conservation of Nature (IUCN) estimates that 126,000 species rely on freshwater habitats, including species of fishes, molluscs, reptiles, insects, plants, and mammals. As a result, the importance of freshwater species, ecosystems and services to human livelihoods and well-being is increasingly being recognized (IUNC 2012). The water and green growth project has confirmed the value of ecosystem restoration in promoting green growth. The restoration of water-related ecosystems and water quality improvement provide people with long-range benefits in economic growth, public health, recreational and cultural amenities, and improved well-being and livelihoods.
CLIMATE CHANGEClimate change owing to increases in greenhouse gas (GHG) emissions is an urgent environmental issue, especially for water resources. It directly impacts people and the environment with water-related disasters of increasing severity and frequency. The research for this report has examined climate change, including mitigation, adaptation and the implications for different sectors now and in the future. Specific water-related climate change impacts include floods, droughts, ecosystem deterioration and availability of water resources. While climate change issues are discussed at international conventions, water unfortunately holds a lower priority than carbon emissions and related issues at such forums, despite the central role of water management in climate change adaptation. Furthermore, while energy production is the main source of GHGs, water infrastructure offers a clean alternative source of power. The increasing awareness of and concern about climate change has been key in development of the green growth concept.
WATER-RELATED NATuRAL DISASTERS The human impacts on the environment that have caused climate change have also caused water-related weather disasters to rise steadily since the 1970s. Such hydro-meteorological disasters include floods, waves, storms, drought, landslides, avalanches and forest fires. Hydro-meteorological events accounted for 76% of all the natural disasters that occurred between 1990 and 2005. Geological disasters such as earthquakes and volcanic events have not similarly increased, indicating that water-related climatic conditions are affected by climate change and directly connected with hydro-meteo-rological events. A new strategy is needed for managing ”too much” or “too little” water resulting from the greater frequency and extremity of such weather events. The new strategy must also take into account the vulnerability of greater numbers of people to such disasters owing to rapid urbanization.
Issues of rapid urbanization and poverty alleviation, as well as their consequences on increasing demands for energy, food and natural resources, cut across all of the areas discussed above. Given the desire for green growth is driven by the desire to improve human well-being and social equity, society must invest in human and social capital as well as in ecosystem protection and green infrastructure.
39
1.4 ManageMent of Water
WATER pOLICyThe research for this report examines how agreed policy for international water resources management (IWRM) evolved from the principles set in the Mar del Plata Action Plan, which were formulated at the United Nations Conference on Water held at Mar del Plata, Argentina in March 1977, through the series of conferences organized by UN-Water in preparation for the World Summit on Sustainable Development (Rio+20) that will be held at Rio de Janeiro in June 2012. Beginning with a focus on water resources for use in agriculture, industry, household and other sectors, these principles grew into a holistic IWRM perspective that accounts for the needs of ecosystems, competing demands from economic development (agriculture, industry, energy, municipalities) and the basic survival needs for water and sanitation.
With growing awareness of the need to improve social and economic conditions in the world’s poorest countries, all world leaders present at the Millennium Summit in 2000 adopted a compre-hensive set of goals as part of the United Nations Millennium Declaration. Millennium Development Goal (MDG) 7 on environmental sustainability includes Target 7C to “halve, by 2015, the proportion of the population without sustainable access to safe drinking water and basic sanitation”. The importance of access to water and sanitation in turn impacts poverty eradication, health, gender equality and women’s empowerment. The target addresses the wide disparities that exist in access to water and sanitation between developing and developed countries. Almost 3.5 million people, most of whom come from developing countries, die every year from preventable diseases caused by contaminated and unsafe water.
In parallel with the United Nations, other major water organizations and conferences are striving to improve water policy. They include the WWC series of World Water Forums (the next to be held in Marseille, France in March 2012), the European Commission under its Water Policy Directive, and the OECD. Most new water policy increasingly reflects the so-called three pillars of sustainable development: environmental protection,
economic development and social development. Other regional and national approaches to water policy similarly reflect those priorities, such as in the United States (e.g., the California Water Management Program), Japan (IWRM in response to climate change), the United Kingdom (the UK Water Strategy), France (Integrated River Basin Management), and Australia (the Murray-Darling River Basin Authority). Elements of such policy direction and instruments, particularly those focusing on IWRM and river basin planning, have been incor-porated into the draft policy framework developed in chapter 5 of this report.
WATER FINANCEThe financing of the water industry comes from a variety of public and private sources that support national water resources infrastructure. They include governmental budget allocations and subsidies, water tariffs for users, polluter-pays fees, overseas development grants and loans, private sector investments and hybrid systems. Background research for this report involved a detailed analysis of water-pricing systems, cost-recovery measures, user-pays principles and public-private partner-ships. This research placed on the project Web site also includes details on international finance for adaptation to climate change and some country examples on financial support for coping with water-related disasters.
Chapter 4 of this report, on the other hand, focuses on sources of finance related to water and green growth. The case studies mainly concentrate on payments for environmental services that support the protection of the ecosystem as a basis for green growth. The case studies examine systems for rewarding municipalities, communities or individuals for protecting the watershed and the source of water resources needed for both upstream and downstream economic activities.
Despite the essential nature of water for the life of every creature, water has generally been considered a cost-free resource and used as if unlimited. However, with increased water scarcity owing to population growth and pollution, the perception of water is slowly changing to one of a valued
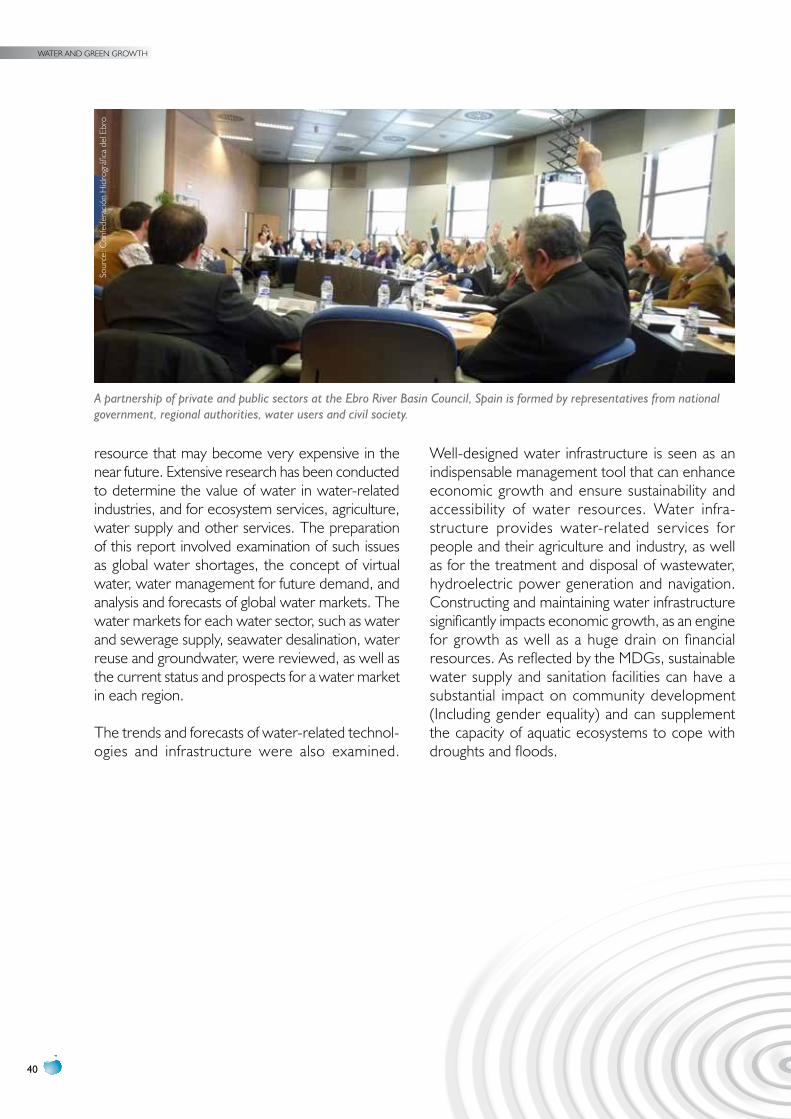
WATER AND GREEN GROWTH
40
resource that may become very expensive in the near future. Extensive research has been conducted to determine the value of water in water-related industries, and for ecosystem services, agriculture, water supply and other services. The preparation of this report involved examination of such issues as global water shortages, the concept of virtual water, water management for future demand, and analysis and forecasts of global water markets. The water markets for each water sector, such as water and sewerage supply, seawater desalination, water reuse and groundwater, were reviewed, as well as the current status and prospects for a water market in each region.
The trends and forecasts of water-related technol-ogies and infrastructure were also examined.
Well-designed water infrastructure is seen as an indispensable management tool that can enhance economic growth and ensure sustainability and accessibility of water resources. Water infra-structure provides water-related services for people and their agriculture and industry, as well as for the treatment and disposal of wastewater, hydroelectric power generation and navigation. Constructing and maintaining water infrastructure significantly impacts economic growth, as an engine for growth as well as a huge drain on financial resources. As reflected by the MDGs, sustainable water supply and sanitation facilities can have a substantial impact on community development (Including gender equality) and can supplement the capacity of aquatic ecosystems to cope with droughts and floods.
A partnership of private and public sectors at the Ebro River Basin Council, Spain is formed by representatives from national government, regional authorities, water users and civil society.
Sour
ce: C
onfe
dera
ción
Hid
rogr
áfica
del
Ebr
o
41
WATER GOvERNANCEA comprehensive view of water governance is “the range of political, social, economic and admin-istrative systems that are in place to regulate the development and management of water resources and provision of water services at different levels of society” (Rogers and Hall 2003, 7). Water governance calls for participatory and collaborative approaches to water management, since water issues have become complex and multidimensional. Many of the case studies in chapter 4 elaborate on this view. Complexity derives from the competing demands of different users (broadly, in agriculture, industry, municipal areas and the ecosystem), uncer-tainties intensified by climate change, and a reduction in water availability because of rapid urbanization, pollution, industrialization and population growth.
Much analysis of water governance in this report relates to the role of government, a predominant factor in water management, and the significance of accommodating a participatory approach in policymaking, including consultations with stake-holders at the river or water basin level. The State is thus encouraged to adopt flexible and adaptive systems and decision-making approaches in its water policy. The analysis examines principles of effective water governance, the role of multi-stakeholder platforms, and the success factors for delegated water governance. It also includes governance models from Brazil, Chile, the European Union (EU), Mexico, the Republic of Korea and Spain.
The improved governance mechanisms that emerge from the case studies in chapter 4 highlight the importance of involving all major stakeholders at the river basin level. River basin authorities or commissions have provided forums for education, knowledge-sharing and awareness-raising. With involvement of relevant stakeholders, resources and responsibilities have been allocated with enhanced fairness. The involvement of communities in green growth programmes can protect the environment, improve livelihoods, and encourage social cohesion. The case studies indicate that policy, planning and good governance improve over time and that the process is iterative. They show an intense State-wide effort with multiple components, both large and small in scale, that entails a large public investment and an IWRM approach. Good governance for a river basin requires an authority that can collect reliable data, coordinate stakeholders who represent competing demands, and allocate water equitably among competing users in the basin, including energy, industry, agriculture and urban water supply.
Other subjects researched in greater detail in this report include water for energy, urbanization and agriculture. Issues related to the management of transboundary waters through river basin agreements are also considered. All of the background research will be available on the project Web site (www.waterandgreengrowth.org) and will be published in a later version of this report.
Together with the water and green growth concepts in chapters 2 and 3, and their application in the real-world case studies in chapter 4, the issues reviewed in this chapter are accounted for in developing the draft policy framework that is proposed in chapter 5.
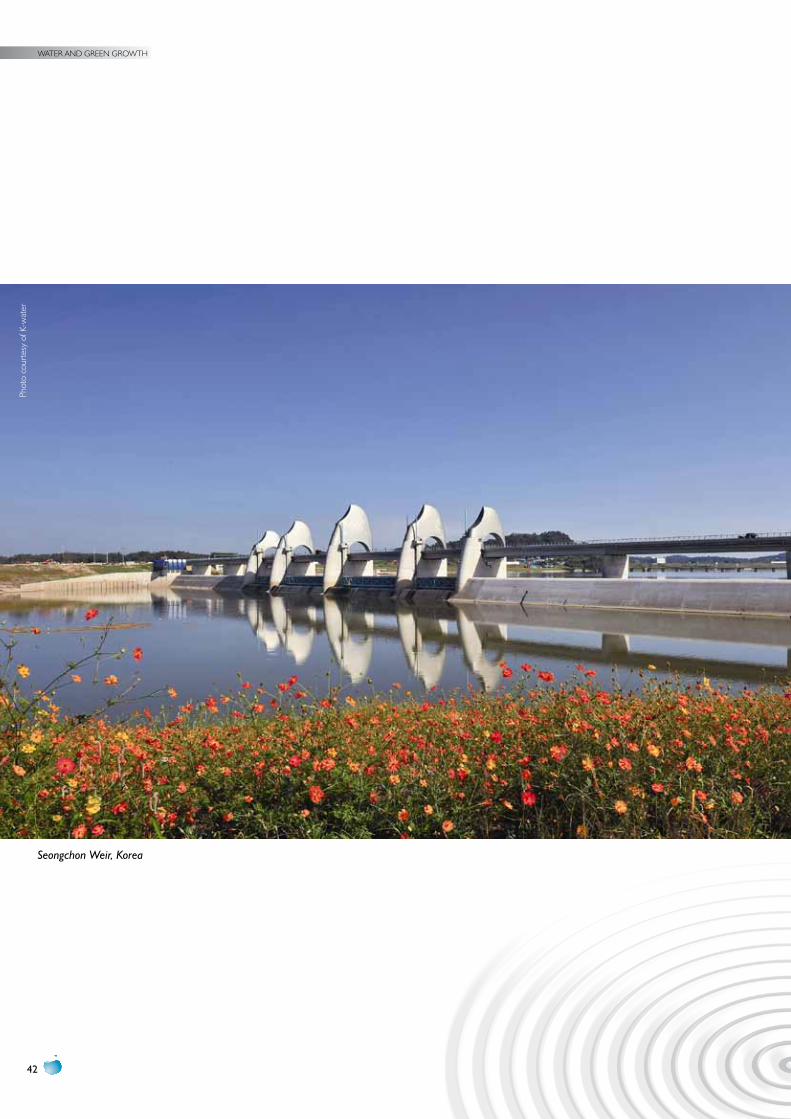
WATER AND GREEN GROWTH
42
Seongchon Weir, Korea
Phot
o co
urte
sy o
f K-w
ater
43
2. GREEN GROWTH AND SuSTAINABLE DEvELOpMENT
2.1 introduction
The Industrial Revolution of the nineteenth century brought with it mass production, rapid improvements in living standards and widespread environmental pollution. Environmental pollution had been manageable earlier because it was generally smaller in scale and more easily dealt with using natural systems. By the mid-twentieth century, environmental problems were beyond the capacity of nature to absorb, with consequent impacts on people’s livelihoods. The benefits of economic growth were thus won at the expense of serious deterioration of the environment.
The Republic of Korea has pursued a green growth policy since 2008 in an effort to achieve environmentally sound economic growth using new and renewable energy sources and green technologies. Climate change, including extreme weather events and global warming, is one of the most challenging environmental problems ever faced by mankind. Korea’s policy thus aims at implementing climate change adaptation strategies nationally and internationally, and involving the country in green growth and climate change adaptation efforts in developing countries.
In 2009 the Government of the Republic of Korea formulated its Five-Year Action Plan for Green Growth. In 2010 it founded the independent
Global Green Growth Institute (GGGI) for sharing the experience of green growth policies with others.
Korea’s green growth policy is different from global initiatives for climate change adaptation led by developed countries. The policy focuses not only on developing eco-efficiency and economic growth in Korea, but on evolving the global agenda and contributing to global progress. Korea’s Five-Year Action Plan for Green Growth places a focus on economic growth and environmental protection. While Korean green growth partially addresses social aspects (e.g., green society, education and job creation, among others), it focuses mainly on environmen-tally sound economic growth. Therefore, more concrete social development policies were also introduced to attain sustainable development.
This chapter analyses Korean green growth policy and compares it with similar strategies of other developed countries. The chapter also describes how green growth policy is integrated into the global agenda and international initiatives, including economic development plans in developing countries. Finally, the chapter examines the best practices of green growth policy in official development assistance (ODA).
WATER AND GREEN GROWTH
44
2.2 Brief history of green groWth
Green growth policies are a response to the traditional unsustainable energy and carbon intensive models that are based on perpetual economic growth. Green growth policies also respond to the challenges of climate change that impact human health and national security. The implication here is that people, if they make the effort to change the ways they pursue economic growth, could solve the environmental problems they have created.
In response to the global economic crisis of 2008, an opportunity was seen to promote green industries and invest in larger scale green infrastructure projects in a similar way to President Roosevelt’s “New Deal” in the United States of America; and so developed the idea of a “Green New Deal”.
Proposals for a Korean “Green New Deal” were to feed strongly into what has become “Green Growth”. Although green growth has strong links to sustainable development, the key difference is that sustainable development has largely been championed by environmental actors, while green growth has been supported by financial and economic proponents for the first time. Korea’s green growth resulted in a set of policies to help people develop their own capacities and guarantee
them fair opportunities to participate in sustainable economic growth. Its purpose is to improve social welfare through cooperation between the market and the Government. The policy provides direct support to people who have been excluded from entering the market because they have not been able to compete in a “business-as-usual” environment (PCFV, 2009).
While economic growth is needed in developing countries to sustain increasing populations and alleviate poverty, it cannot depend on current economic growth models based on energy-intensive strategies. Green growth strategies provide pathways to more eco-friendly ways, including environmental taxes and tariffs levied on products depending on their environmental impact. For example, European countries levy differential taxes on vehicles based on the level of emissions of exhaust gas. Such policies may extend to import duties on products from other countries, which are not produced in an environmentally sustainable way. Even though export-oriented economies may consider them as a trade barrier that deters their economic development, such policies are a global signal to drive greener development, rather than to punish traditional industrial activities.

45
2.3 green groWth and sustainaBLe deveLoPMent GREEN GROWTH DEFINEDThe Republic of Korea declared its adoption of a green growth policy in 2008. The policy is framed with an awareness that a virtuous-cycle relationship, rather than trade-offs, exists between the environment and economic growth so that synergies may be maximized. Thus, economic growth will enable the improvement of the environment, and the improved environment will be a driving force for sustainable economic growth and an improved quality of life.
Green growth is an attempt to integrate qualitative growth into quantitative growth. Green growth thus incorporates policy strategies to enhance social development, such as in education and green lifestyle, but it does not entail a comprehensive social development strategy.
The Korean national green growth development strategy seeks generally to change lifestyles as well as refocus economic and industrial activities in a low-carbon, environmentally sound manner. It aims to improve the quality of life by introducing green technologies that enhance energy efficiency, generate renewable energies and mitigate environ-mental pollution (PCFV 2009). It is expected that green technologies will enable industries to exploit promising new energy sources.
The Korean Basic Act on Low Carbon, Green Growth (Republic of Korea 2010) defines the term “green growth” as “growth achieved by saving and using energy and resources efficiently to reduce climate change and damage to the environment, securing new growth engines through research and development of green technology, creating new job opportunities, and achieving harmony between the economy and environment.”
With its experience of rapid economic growth and the consequent environmental damage, Korea has introduced the Seoul Initiatives for Green Growth to the international community as a model for sustainable economic growth that would at the same time help preserve the environment. The fifth Ministerial Conference on Environment and Development (UNESCAP 2006) adopted green growth in an effort to shift from previous energy-
intensive development plans towards a more desirable direction whereby green growth and economic development are compatible. UNESCAP (2012) defines green growth as “a policy focus for the Asia and Pacific region that emphasizes environ-mentally sustainable economic progress to foster low-carbon, socially inclusive development”.
Another term that conveys a similar meaning is eco-efficiency, which was first introduced by the World Business Council for Sustainable Development in 1992. It refers to a production strategy that minimizes energy use per unit of production. However, the term relates not only to sustainable business practices, but to a management philosophy that directs a company’s production to be environmentally friendly. It combines concepts of environmental accountability with high profitability (WBCSD 2000).
The “green economy” concept was introduced by UNEP in 2010. A green economy is “one that results in improved human well-being and social equity while significantly reducing environmental risks and ecological scarcities” (UNEP 2009). It differs from green growth or eco-efficiency in emphasizing social equity in addition to eco-friendly economic growth. The concept includes social equity without, however, itemizing the specific social factors. Green economy can be interpreted similarly to sustainable development.
The OECD (2011a) characterizes green growth as “fostering economic growth and development while ensuring that natural assets continue to provide the resources and environmental services on which our well-being relies.” Further, OECD proposes the following green growth indicator groups:
•Environmental and resource productivity of the economy
•The natural asset base•The environmental dimension of quality of life•Economic opportunities and policy responses•Socio-economic context and characteristics of growth (OECD 2011b).
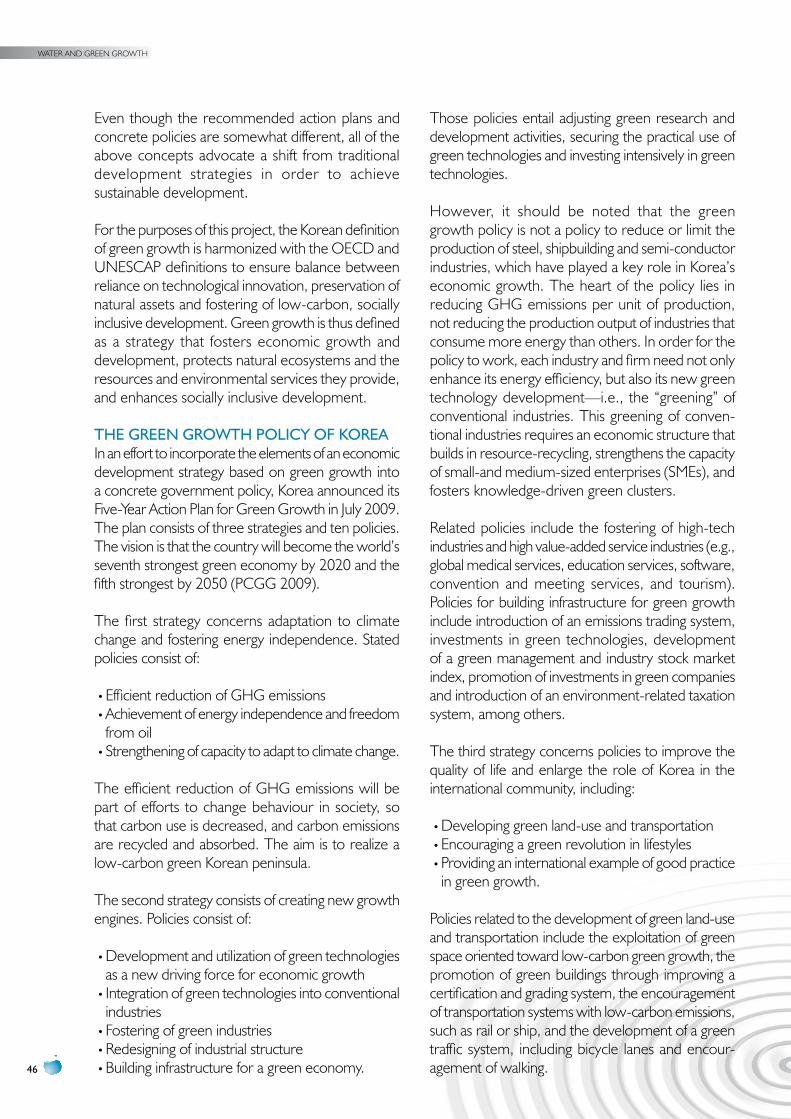
WATER AND GREEN GROWTH
46
Even though the recommended action plans and concrete policies are somewhat different, all of the above concepts advocate a shift from traditional development strategies in order to achieve sustainable development.
For the purposes of this project, the Korean definition of green growth is harmonized with the OECD and UNESCAP definitions to ensure balance between reliance on technological innovation, preservation of natural assets and fostering of low-carbon, socially inclusive development. Green growth is thus defined as a strategy that fosters economic growth and development, protects natural ecosystems and the resources and environmental services they provide, and enhances socially inclusive development.
THE GREEN GROWTH pOLICy OF KOREAIn an effort to incorporate the elements of an economic development strategy based on green growth into a concrete government policy, Korea announced its Five-Year Action Plan for Green Growth in July 2009. The plan consists of three strategies and ten policies. The vision is that the country will become the world’s seventh strongest green economy by 2020 and the fifth strongest by 2050 (PCGG 2009).
The first strategy concerns adaptation to climate change and fostering energy independence. Stated policies consist of:
•Efficient reduction of GHG emissions•Achievement of energy independence and freedom from oil
•Strengthening of capacity to adapt to climate change.
The efficient reduction of GHG emissions will be part of efforts to change behaviour in society, so that carbon use is decreased, and carbon emissions are recycled and absorbed. The aim is to realize a low-carbon green Korean peninsula.
The second strategy consists of creating new growth engines. Policies consist of:
•Development and utilization of green technologies as a new driving force for economic growth
•Integration of green technologies into conventional industries
•Fostering of green industries•Redesigning of industrial structure•Building infrastructure for a green economy.
Those policies entail adjusting green research and development activities, securing the practical use of green technologies and investing intensively in green technologies.
However, it should be noted that the green growth policy is not a policy to reduce or limit the production of steel, shipbuilding and semi-conductor industries, which have played a key role in Korea’s economic growth. The heart of the policy lies in reducing GHG emissions per unit of production, not reducing the production output of industries that consume more energy than others. In order for the policy to work, each industry and firm need not only enhance its energy efficiency, but also its new green technology development—i.e., the “greening” of conventional industries. This greening of conven-tional industries requires an economic structure that builds in resource-recycling, strengthens the capacity of small-and medium-sized enterprises (SMEs), and fosters knowledge-driven green clusters.
Related policies include the fostering of high-tech industries and high value-added service industries (e.g., global medical services, education services, software, convention and meeting services, and tourism). Policies for building infrastructure for green growth include introduction of an emissions trading system, investments in green technologies, development of a green management and industry stock market index, promotion of investments in green companies and introduction of an environment-related taxation system, among others.
The third strategy concerns policies to improve the quality of life and enlarge the role of Korea in the international community, including:
•Developing green land-use and transportation•Encouraging a green revolution in lifestyles•Providing an international example of good practice in green growth.
Policies related to the development of green land-use and transportation include the exploitation of green space oriented toward low-carbon green growth, the promotion of green buildings through improving a certification and grading system, the encouragement of transportation systems with low-carbon emissions, such as rail or ship, and the development of a green traffic system, including bicycle lanes and encour-agement of walking.
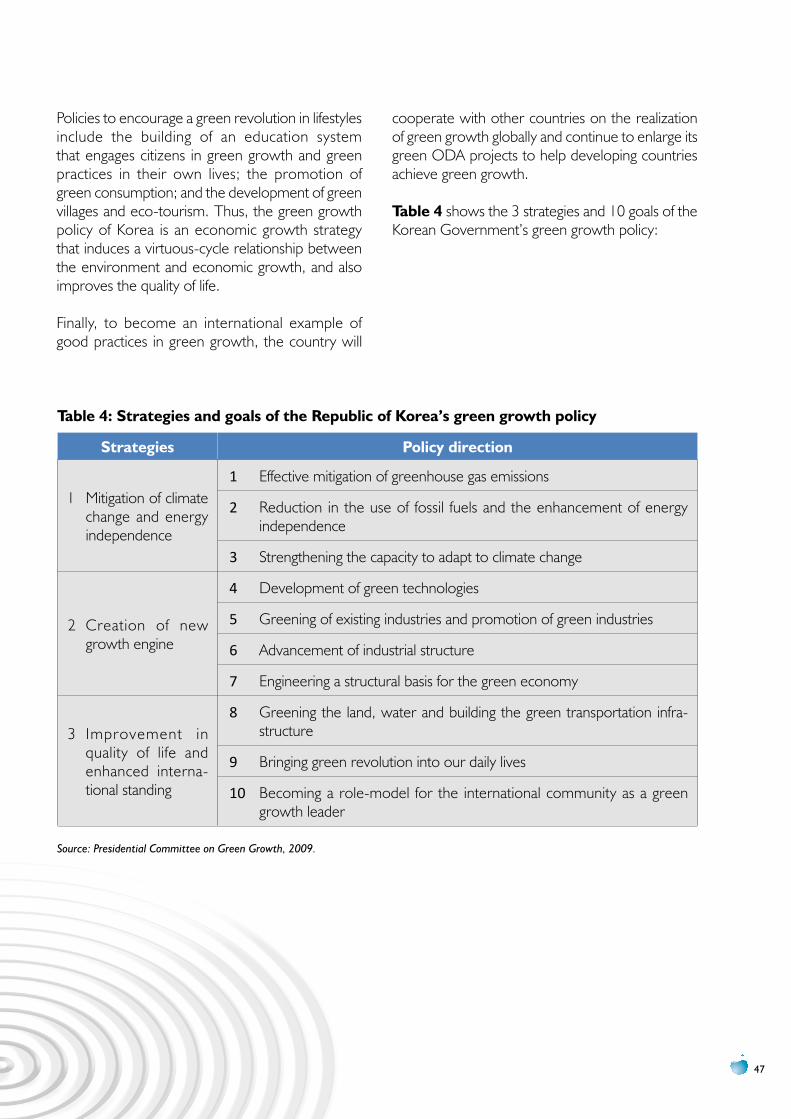
47
Policies to encourage a green revolution in lifestyles include the building of an education system that engages citizens in green growth and green practices in their own lives; the promotion of green consumption; and the development of green villages and eco-tourism. Thus, the green growth policy of Korea is an economic growth strategy that induces a virtuous-cycle relationship between the environment and economic growth, and also improves the quality of life.
Finally, to become an international example of good practices in green growth, the country will
cooperate with other countries on the realization of green growth globally and continue to enlarge its green ODA projects to help developing countries achieve green growth.
Table 4 shows the 3 strategies and 10 goals of the Korean Government’s green growth policy:
Table 4: Strategies and goals of the Republic of Korea’s green growth policy
Strategies Policy direction
1 Mitigation of climate change and energy independence
1 Effective mitigation of greenhouse gas emissions
2 Reduction in the use of fossil fuels and the enhancement of energy independence
3 Strengthening the capacity to adapt to climate change
2 Creation of new growth engine
4 Development of green technologies
5 Greening of existing industries and promotion of green industries
6 Advancement of industrial structure
7 Engineering a structural basis for the green economy
3 Improvement in quality of life and enhanced interna-tional standing
8 Greening the land, water and building the green transportation infra-structure
9 Bringing green revolution into our daily lives
10 Becoming a role-model for the international community as a green growth leader
Source: Presidential Committee on Green Growth, 2009.
WATER AND GREEN GROWTH
48
The green growth policies of the Republic of Korea are accompanied by specific national targets for each of the main green indicators corresponding to the three strategies. Targets for the first strategy include such indicators as carbon absorption by forests, the shares of new and renewable energy in total energy consumption, and the share of environmen-tally sound agricultural production. The targets for the second strategy include increasing the share in the global green technology market, the rate of recycling, the percentage of green goods exported by major enterprises, and the amount of energy used by poor households. The targets for the third strategy include green growth indicators such as the share of passengers transported by rail and the use of bicycle transportation, the share of mandatory procurement of low-carbon green goods in the public sector, and the percentage of green ODA as a total of all ODA projects. Korea is making an effort to put its green growth policies into practice globally, thereby fulfilling its goal to be an international good neighbour. Details of all targets up to 2020 and indicators that reflect the above policies can be found in the report of the Presidential Committee on Green Growth (2009).
The Korean green growth policy differs from measures for adaptation to climate change led by developed countries that focus mainly on energy and resources. The challenges are addressed not only in the first strategy, but also in the second one for creating new green industries and the greening of conventional industries for sustainable economic growth. That also holds true in the third strategy, which establishes Korea as a bridge between developed and developing countries in the interna-tional community. The three green growth strategies are part of a comprehensive development plan that extends Korean experience to developing countries in order to help them make their own compre-hensive economic development plans.
Korea’s green growth policy was developed in response to its rapid growth at the expense of protecting the environment. Korea can be persuasive in convincing developing countries to adopt measures for tackling climate change and conserving the environment as they pursue their
development objectives. Korea has successfully switched itself from an aid recipient to a donor country in only half a century. The income per capita increased significantly from less than US$ 100 in the 1960s to US$ 20,000 in 2009. Korea’s successful example can encourage developing countries to participate in global efforts and initiatives on the reduction of GHG emissions and the sustainable development of their economies.
MAjOR MEASuRES FOR GREEN GROWTH pOLICyThe Government of the Republic of Korea has consistently taken measures for the successful execution of its green growth policy since 2008. The following are some of these measures:
•The “Basic Act on Low Carbon, Green Growth” was brought into force in January 2010. This act abolished or merged existing acts on energy and climate change to provide the first institu-tional framework for putting the green growth policy into practice. The act has been enforced since April 2010, and was accompanied by an enforcement decree (Republic of Korea 2010).
•The Government also proposed a National Greenhouse Gas Reduction Target in late 2009 and declared that it would achieve a 30% reduction in GHGs on a business-as-usual basis by 2020. The proposed target was at the highest level of the range of targets (i.e., 15% to 30%) recommended by major EU countries that developing countries should reach.
•The Government also chose to invest in the development of 27 green technologies, which are energy saving and are considered to be relatively competitive with other global producers. These technologies are listed in Table 5.
•Finally, the Global Green Growth Institute (GGGI) was initiated by the Korean Government and established as a non-profit foundation by several governments and non-governmental organiza-tions in June 2010. GGGI (2011) is to share with other developing countries the experiences of the Republic of Korea with the green growth policy and help them achieve economic growth in an environmentally sound way.
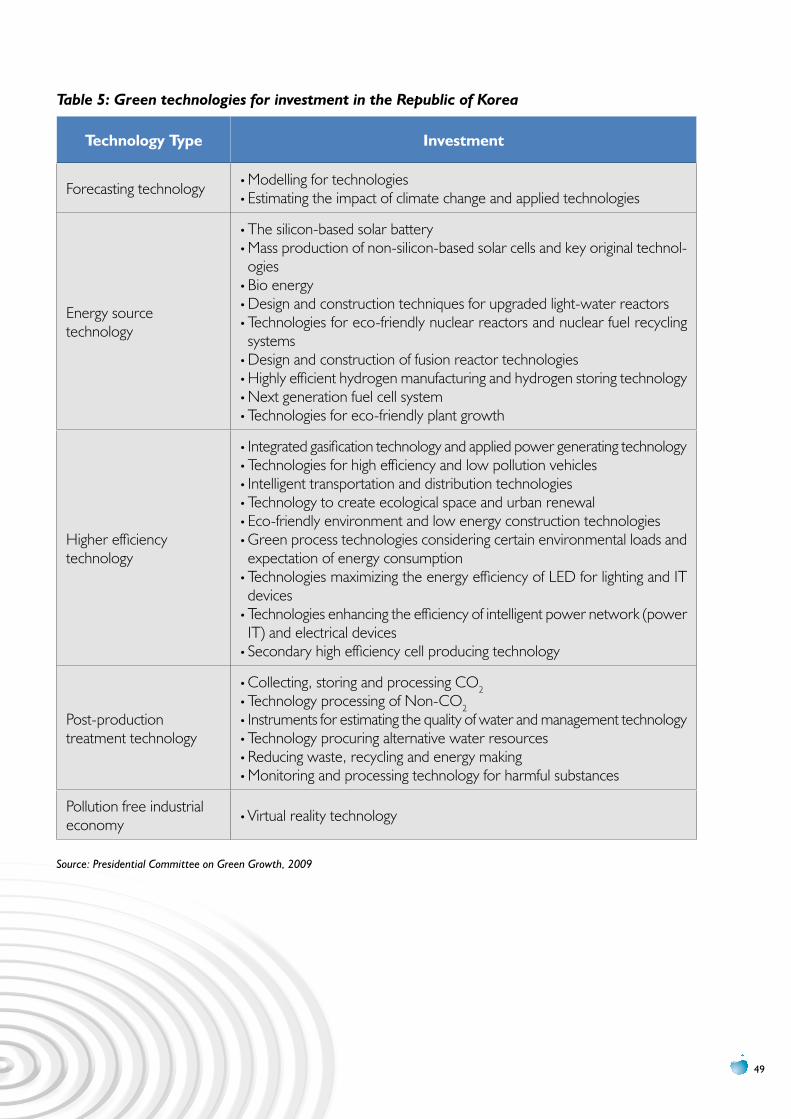
49
Table 5: Green technologies for investment in the Republic of Korea
Technology Type investment
Forecasting technology •Modelling for technologies •Estimating the impact of climate change and applied technologies
Energy source technology
•The silicon-based solar battery •Mass production of non-silicon-based solar cells and key original technol-ogies
•Bio energy •Design and construction techniques for upgraded light-water reactors •Technologies for eco-friendly nuclear reactors and nuclear fuel recycling systems
•Design and construction of fusion reactor technologies •Highly efficient hydrogen manufacturing and hydrogen storing technology •Next generation fuel cell system •Technologies for eco-friendly plant growth
Higher efficiency technology
•Integrated gasification technology and applied power generating technology •Technologies for high efficiency and low pollution vehicles •Intelligent transportation and distribution technologies •Technology to create ecological space and urban renewal•Eco-friendly environment and low energy construction technologies •Green process technologies considering certain environmental loads and expectation of energy consumption
•Technologies maximizing the energy efficiency of LED for lighting and IT devices
•Technologies enhancing the efficiency of intelligent power network (power IT) and electrical devices
•Secondary high efficiency cell producing technology
Post-production treatment technology
•Collecting, storing and processing CO2 •Technology processing of Non-CO2 •Instruments for estimating the quality of water and management technology •Technology procuring alternative water resources •Reducing waste, recycling and energy making •Monitoring and processing technology for harmful substances
Pollution free industrial economy •Virtual reality technology
Source: Presidential Committee on Green Growth, 2009
WATER AND GREEN GROWTH
50
SuSTAINABLE DEvELOpMENT Although mass production has improved the quality of life in most developed countries, it also involved substantial environmental costs, in terms of environ-mental pollution and climate change.
The first policy that was based on the relationship between the environment and economic growth was published in 1972 with The Limits to Growth (Meadows et al., 1972). If a country wanted to maintain environmental sustainability, it should pursue a steady-state economy (“zero economic growth”) rather than continually seek economic growth. However, neither developed nor developing countries were willing to pursue zero economic growth, pointing out that technological innovation or policy effectiveness could overcome environmental challenges and allow them to pursue economic growth. Developing countries asserted that their goal of poverty reduction could not be reached without economic growth.
The term “sustainable development” was coined by the World Commission on Environment and Development (1987; also known as the Brundtland Commission) in its report, Our Common Future. The report defined sustainable development as “development that meets the needs of the present without compromising the ability of future generations to meet their own needs.” According to many observers, the definition does not give any clear insights as to the type of concrete policies that should be pursued in order to achieve sustainable development. Since then, many have tried to develop a workable definition of sustainable development. The definitions have evolved, but all contain the three key pillars defined for the United Nations Conference on Environment and Development, at Rio de Janeiro in 1992: economic development, social development and environmental protection (United Nations, 2005; Munasinghe, 2007; Kemp and Martens, 2007). Economic development depends on factors such as increases in per-capita incomes, efficient use of energy and job creation. Social development concerns the realization of social goals, such as equitable income distribution, poverty reduction, social equality and inclusion, political cohesion and personal development (e.g., education, health, freedom). Environmental protection means the prevention of the depletion and pollution of natural resources and the protection of land and water resources and biological diversity.
Given these three factors, sustainable development implies a shift to the pursuit of not only quantitative growth but also qualitative development. The green growth concept goes further, as it sees that environmental protection and economic growth are compatible and can be complementary.
GREEN GROWTH AND SuSTAINABLE DEvELOpMENTGreen growth means a virtuous-cycle relationship between environmental protection and economic growth. However, social development has received less attention in the implementation of green growth policies. The issue of the social dimension within the green economy will be further discussed at the 2012 Rio+20 UNCSD (United Nations Conference on Sustainable Development), Brazil. Economic growth, even with attention to the environment, cannot be enough to improve automatically the quality of life. Economic growth can contribute to the reduction in absolute poverty, but may not be sufficient to solve problems related to socio-political conflicts, gender equality and relative poverty.
While Korea’s green growth policy includes strategies for creating an environmentally conscious society, they are not adequate for achieving social development as a pillar of sustainable development. For example, shifting to a low-carbon and resource-saving lifestyle might be achieved through policies that encourage energy savings, such as carbon taxes. However, that might create greater economic burdens on low-income households if there are no social welfare policies to support them, such as energy subsidies. Accordingly, pursuit of any green growth policy must be accompanied by equitable social development in order to enhance the quality of life and achieve sustainable development. Korea’s green growth strategy was therefore reinforced by its “Human New Deal” project. This project marks the beginning of a new social welfare model, aiming to reduce the cost of private education, commu-nication and renting houses, while also focusing on creating jobs including encouraging the launch of social enterprises and one-man businesses in high-tech industries. Together, green growth and the Human New Deal are bringing about a paradigm shift in the country’s socio-economic development.
51
OvERSEAS TRENDS IN GREEN GROWTH pOLICy
The European UnionEU-driven initiatives related to climate change and clean energy solutions are based on social consensus that has evolved through long-term consultation, coordi-nation and cooperation among civil society, the private sector and Governments. This section examines those initiatives and describes the differences between them and the green growth policy of the Republic of Korea.
The EU started to take the impacts of climate change more seriously before other regions did so. It has led efforts to adapt to climate change and reduce GHG emissions. A variety of climate-related initiatives have been implemented at EU and national levels since the early 1990s. The European Commission launched the European Climate Change Programme in 2000, working with industry, environmental organizations and other stakeholders to identify cost-effective measures to reduce emissions.
The Action Plan for Energy Efficiency, adopted by the Commission in October 2006, is one of the EU’s repre-sentative initiatives. The Action Plan was formulated to implement the goals in the Green Paper on Energy Efficiency (June 2005). In the Plan, the Commission proposed 10 priority actions covering all energy sectors to be initiated immediately and implemented as soon as possible for maximum effect.
A cornerstone of EU climate change policies is the EU’s Emissions Trading Scheme launched in 2005. EU Governments have set limits on how much CO2 some 10,500 power plants and energy-intensive factories are allowed to emit each year, accounting for almost half of the EU’s total CO2 emissions. The Scheme gives a financial incentive to reduce emissions by establishing a market-based trading system. Plants that emit less CO2 than their limits can sell their unused emission quotas to other companies that have emissions higher than their allowances. Companies that exceed their emission limits and do not cover them with emission rights bought from others have to pay hefty penalties. The Scheme ensures that emissions are cut where it is cheapest, and lowers the overall costs of reducing emissions.
Other measures of the European Climate Change Programme include:•improving the fuel efficiency of cars and the energy
efficiency of buildings (better insulation can reduce heating costs by 90%)
•increasing the use of renewable energy sources, such as wind, sun, tidal power, biomass (organic material such as wood, mill residues, plants or animal droppings) and geothermal power (heat from hot springs or volcanoes)
•reducing methane emissions from landfills.
A second phase of the Programme was launched in October 2005. The focus is on strengthening the Emissions Trading Scheme by tackling emissions from aviation and road transport, developing carbon capture and storage technology and funding measures to adapt to climate change. Agreements have been reached to include airlines in the Scheme and reduce CO2 emissions from new cars. Up-to-date information on current European affairs is available from the European Commission (2012).
The United States of AmericaThe United States President announced the Advanced Energy Initiative in January 2006, which proposed a 22% increase in funding for clean energy technology research at the Department of Energy. The Initiative supports new transportation and power technologies that would help achieve significant reductions of oil imports, air pollution and greenhouse gas emissions, and increase economic and energy security. Other initiatives include increasing the use of alternative fuels in the United States and reducing projected annual gasoline use by improving vehicle fuel economy.
In December 2007, the President signed the Energy Independence and Security Act of 2007, which responded to his “Twenty in Ten” challenge to improve vehicle fuel economy and increase alternative fuels. “Twenty in Ten” has the goal of reducing US gasoline usage by 20% in ten years (2007–2017).
JapanIn an effort to adapt to climate change, Japan announced various initiatives, including the:•Cool Earth-Innovative Energy Technology Programme (May 2007)
•Fukuda Vision (June 2008)•Action Plan for Achieving Low-Carbon Society (July 2008)
•Green Economy and Social Reform (April 2009)•Legislation of the Framework Act on Global Warming Countermeasures (in draft, March 2010).
WATER AND GREEN GROWTH
52
The Fukuda Vision is a plan to reduce 6% of carbon emissions by 2010 and 20% of greenhouse gas emissions by 2020 compared to 1990 levels. The Action Plan for Achieving Low-Carbon Society is an action plan to achieve those targets. Relevant policies include the commercialization of Carbon Capture and Storage, the promotion of solar power generation and hybrid and electric vehicles, the securing of energy efficiency requirements for products, the introduction of an emission trading system and a carbon footprint system, and the implementation of tax reform. The Green Economy and Social Reform announced in 2009 by the Ministry of the Environment is a policy to boost the economy and create jobs by enlarging consumption of domestic products, and attracting more investments.
The Legislation of the Framework Act on Global Warming Countermeasures includes measures to reduce by 25% the level of GHG emissions by 2020 compared with those in 1990, and increase the share of renewable energy in the total amount of primary energy supply up to 10% over the same period. However, the measures to reduce GHG emissions were conditional upon an international agreement on reduction targets and measures on climate change among major countries that has not been reached.
The People’s Republic of ChinaAs the country that emits the largest amount of GHG in the world, the People’s Republic of China has also tried to reduce its GHG emissions. It adopted the Renewable Energy Law of the People’s Republic of China in 2006, and amended it in 2009. Subsequent initiatives have included the:•Medium- and Long-term Programme for Renewable Energy (August 2007);
•Renewable Energy Development Plan for the Eleventh Five-year Plan Period (March 2008); and
•China’s Policies and Actions for Adaptation to Climate Change (October 2008) (Kang 2010b).
The 2006 Renewable Energy Law provides the framework for some important legislative initiatives designed to secure the strategic position and future development of renewable energy. It includes the following: •renewable energy share arrangements to increase the share of renewables to 15% by 2020
•mandatory power purchase arrangements that require national electricity providers to purchase the whole amount of RE-produced power
•power purchasing price arrangements determined by a combination of Government-fixed pricing and Government-guided pricing (i.e., competitive tendering)
•cost-sharing arrangements•financial support arrangements that mandate each level of government to mobilize a renewable energy development and promotion fund.
In its Eleventh Five-Year Plan for National Economy and Social Development (March 2006), the People’s Republic of China adopted a strategy to protect the environment and pursue environmentally-sound development under the policy of energy saving. It provides corporate tax incentives and value-added tax incentives, mandatory purchasing of renewable energy by the government, mandatory construction of transmission grids by transmission system providers, and support to renewable energy technologies and industrial systems.
53
2.4 green groWth and internationaL cooPeration
ADApTION TO CLIMATE CHANGE AND REALITy OF DEvELOpING COuNTRIESClimate change is an externality in that it has impacts on all countries around the world, regardless of what countries caused it. Thus, all countries, developed and developing, should participate in international commitments to reduce the threatening impacts of climate change. Since the signing of the Kyoto Protocol in 1987, developing countries have been pressed to join climate change agreements driven mainly by developed countries. With a strong desire for economic growth, however, they are asserting that they cannot participate uncondi-tionally, without considering implications on their economic growth.
They argue that developed countries are more responsible for climate change because of their high emissions of GHGs since the Industrial Revolution. They also argue that their emissions are high because their industries are often owned by multinational companies based in developed countries.
In 2008 about 45% of 30 billion tons of CO2 emissions originated in OECD member countries, having increased from 11.4 billion tonnes in 1990 to 13.4 billion tonnes in 2008, an increase of 2 billion tonnes over 28 years. On the other hand, non-OECD countries increased CO2 emissions by almost 7 billion tonnes over the same period.
Developing countries will have to introduce climate change mitigation and adaptation measures, similar to those in developed countries, and begin to prepare themselves for a low-carbon future. Developed countries have made, or will make, greater investments in green technologies and industries to put those measures into practice. They will also attempt to introduce preferential policies for the purchase of environmentally friendly products. Accordingly, developing countries having a strong desire for economic growth would do well to begin manufacture of products in an environ-mentally friendly way; otherwise they may be left
behind in terms of international competitiveness.Some developing countries argue that a shift to a low-carbon society will result in an increasing income gap with developed countries. Therefore, they expect the international community to provide financial compensation for the income gap that will result from adopting more environmentally responsible economic growth.
SuSTAINABLE DEvELOpMENT AND INTER-NATIONAL COOpERATIONTo persuade developing countries to introduce climate change mitigation and adaptation measures, they need evidence that such measures are not an obstacle to their economic growth.
Among the ways to convince developing countries to adopt such measures are:
•Demonstrating eco-efficient production processes and technologies, using natural resources more efficiently, creating new jobs and using recycled and reused resources.
•Providing Official Development Assistance, technology transfers and capacity building assistance to developing countries to help narrow the income gap with developed countries.
Munasinghe introduced the “sustainomics hypothesis” in his 2008 study. He suggested that, if developed countries could transfer their advanced technologies to developing countries through international cooperation, the receiving developing countries would cause less environ-mental damage while achieving economic growth than the developed countries did while achieving the corresponding economic growth.
The hypothesis suggests that developing countries can move to a more environmentally sound path if international cooperation is effective. If it is effective, developing countries could be persuaded to adopt climate change policies and more energy-efficient industries. Munasinghe’s hypothesis is further examined in chapter 3.
WATER AND GREEN GROWTH
54
The international community has continued to discuss cooperative assistance for developing countries related to climate change. At the sixteenth session of the Conference of the Parties (COP16) to the United Nations Framework Convention on Climate Change (UNFCCC; Cancún, Mexico, 2010), four institutions were established to oversee adaption to climate change, as follows:
1. The Green Climate Fund—for assisting the projects and policies of developing countries. It will manage and develop long-term funds to support developing countries.
2. The Technology Mechanism—for assisting green technology sectors aimed at mitigating the impacts of, and adapting to, climate change. It will be operated by two key organizations: the Technology Executive Committee and the Climate Technology Centre and Network.
3. An Adaptation Framework—for assisting developing countries with formulating policies on mitigation and adaptation to the impacts of climate change.
4. An emergency fund of US$ 3 billion—to be raised over the period 2010 to 2012. This fund will be used to help vulnerable countries adapt to, and mitigate the impacts of, climate change. Priority would be given to the least developed countries and small island states, which are very vulnerable to climate change.
The COP17 held in Durban, South Africa, adopted the final report on governance of the Green Climate Fund that was submitted by the transitional committee. It confirms the Cancún agreement on the Fund although the specific sources of the Fund were not resolved. (See UNFCCC 2012.)
INTERNATIONAL COOpERATION AND GREEN GROWTH ODAAs mentioned above, international cooperation between developed and developing countries is necessary to effectively reduce greenhouse gas emissions to tackle climate change. This is because developing countries are reluctant to switch their current energy-intensive development strategies to green growth models. Foreign assistance is an important means to help developing countries to cope with climate change. To carry out this policy, it is necessary to reclassify current ODA to reflect climate change policies.
The Korea International Cooperation Agency (KOICA) has introduced the concept of green ODA, which mainly consists of assistance for environmental policies to adapt to, and mitigate the impacts of, climate change. However, assistance for environment-friendly economic growth is not specif-ically included. Accordingly, this definition might not be satisfactory to persuade developing countries to participate in climate change measures. This is because developing countries have a more urgent need for economic growth, than for undertaking climate change measures. Green growth ODA expands upon green ODA, by reflecting climate change and economic growth at the same time.
As addressed earlier, the green growth strategy of the Republic of Korea is somewhat different from climate change measures taken by developed countries. In line with Korea’s strategy, green growth ODA can be defined as ODA for adaption to climate change combined with economic growth.
The KOICA definition of green ODA normally includes assistance to projects related to the imple-mentation of the agreed conventions, such as that on biological diversity, the UNFCCC and the United Nations Convention to Combat Desertifi-cation. The assistance is provided to sectors such as environment, forestry, energy, agriculture and water. Green growth ODA goes beyond green ODA in that it includes the economic structure and manufac-turing industries, as well as building capacity to adapt to climate change in the future.
55
2.5 concLusions
This chapter has examined the green growth policy adopted in the Republic of Korea. The policy is a comprehensive, inclusive economic growth plan that addresses climate change and energy measures, as well as economic growth. Moreover, the policy was supplemented by follow-up measures, including the “Basic Act on Low Carbon, Green Growth”, the National Greenhouse Gas Reduction Target, and the establishment of the GGGI to share knowledge and experiences related to green growth with other countries.
The difference between the green growth concept and sustainable development was discussed. Green growth addresses environmentally-sound economic growth; however, it is considered that the latter does not sufficiently encompass social development such as reduction of relative poverty, improvement of income inequality and various social conflict issues. Accordingly, the implementation of social welfare policies is required to reach sustainable development. To meet this requirement, the Korean Government has adopted a comprehensive social welfare policy (“Human New Deal”). The green growth policy and the Human New Deal policy together would be strategically used to reach sustainable development.
The need for ODA from developed to developing countries was considered essential to alleviate the potential effects on economic growth from the adoption of environmentally sound economic policies.
Finally, a definition of green growth ODA was introduced and will be further discussed in chapter 3. The Republic of Korea would like to share this concept with developing countries in their formulation and implementation of green growth policy. Based on the new definition, it was found that Japan showed the highest share of green growth ODA in its total ODA, while the share of green growth ODA in the Republic of Korea’s total ODA was also found to be very high.
In conclusion, it is very important that the successful implementation of the green growth policy requires not only climate change measures led by developed countries but also international cooperation to encourage developing countries to participate.
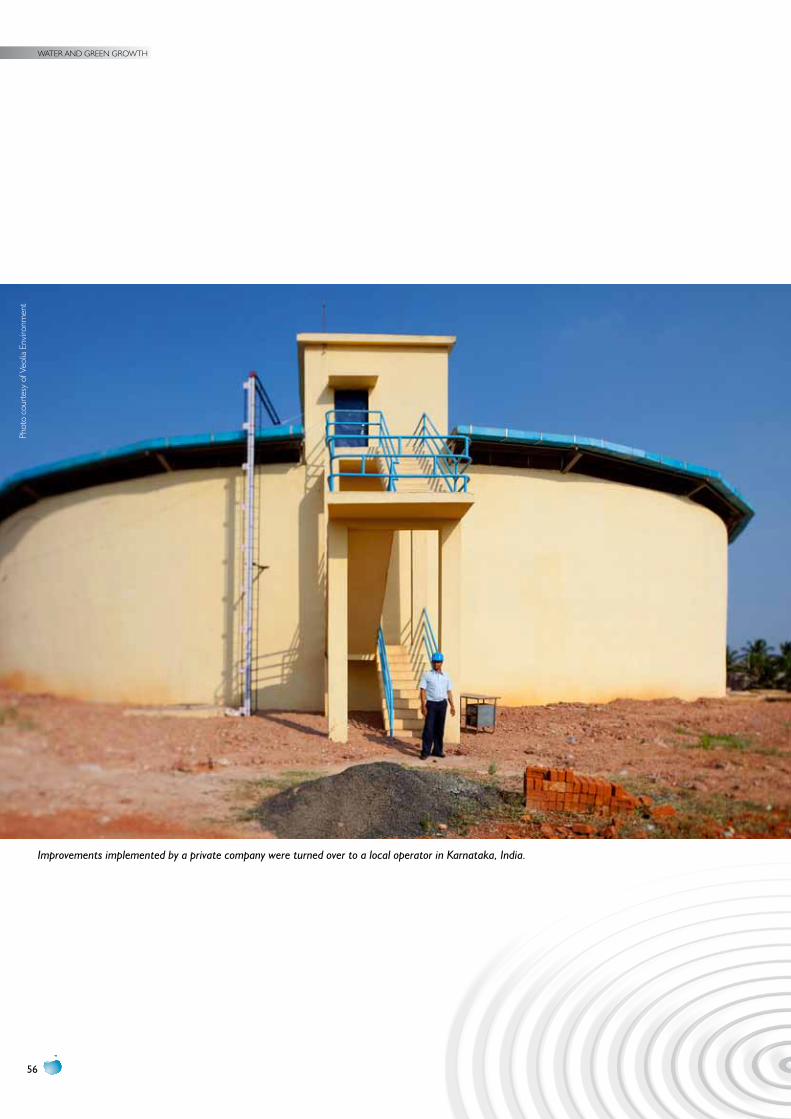
WATER AND GREEN GROWTH
56
Improvements implemented by a private company were turned over to a local operator in Karnataka, India.
Phot
o co
urte
sy o
f Veo
lia E
nviro
nmen
t
57
3. WATER AND GREEN GROWTH
3.1 introduction
The concept of water and green growth has been introduced as a strategy for sustainable economic development in tandem with environmental conservation, to meet the challenges arising from climate change and the world’s unbalanced drive for economic growth. A brief account of the vision is presented in this chapter, accompanied by a review of indicators suitable for monitoring water and green growth policies and projects. Policy suggestions for water and green growth action planning are discussed in light of the experience of the Republic of Korea. The chapter finishes with a description of the new form of ODA for water and green growth and an international cooperative mechanism.
Global water demand exceeds supply, and virtually no additional water resources remain. Population growth, especially among developing countries, continues to put pressure on food supplies and requires increased allocation of water for irrigation schemes. Increasing affluence will continue to raise water consumption levels, as will expansion of business activities from industrialization and services. Continuing investment in water infrastructure will be needed in the face of rapid urbanization, and massive investments will be needed to rehabil-itate aging infrastructure, particularly in developed countries, in order to maintain the current level of water and sanitation services.
The research presented in this chapter has revisited sustainable development first proposed by the World Commission on Environment and Development
(1987) with reference to its three “pillars”: economic development, social development and environ-mental protection. Particular attention has been paid to the Rio Declaration of 1992, which highlights ethical principles for building a just, sustainable and peaceful global society in the twenty-first century. “Agenda 21” is reviewed to emphasize the account-ability of individual countries in achieving sustainable development. This chapter also discusses green development that prioritizes environmental sustain-ability over economic and cultural considerations.
The research argues that a new perspective on global water issues is needed because the world faces elusive challenges in achieving economic growth together with environmental protection. Currently, the impacts of economic activities on environmental systems trigger imbalances, putting at risk economic growth and development. The absence of coherent strategies to tackle those imbalances causes uncertainty, inhibits investment and innovation, and results in sluggish economic growth and development. New strategies are required to increase industrial and agricultural productivity in developing countries while preserving ecosystems and ensuring water security.
Building on analysis of green growth in chapter 2, the following pages present the concept of water and green growth. A strategy for investing in water infrastructure and water security, water and green growth is conceived as a means of promoting economic growth, protecting the environment
WATER AND GREEN GROWTH
58
and fostering socially inclusive development. The vision for water and green growth for developing countries begins with an understanding of the link between the degree of investment in water infra-structure and water security. Developing countries need massive investment in water infrastructure, including structural measures such as multipurpose dams, as well as non-structural measures such as water reallocation and water tariff reform.
Indicators for monitoring water and green growth are reviewed in the light of the OECD framework for monitoring green growth, with four major indicators:
1. environmental and resource productivity2. the natural asset base3. environmental quality of life4. economic opportunities and policy responses.
A number of environmental and vulnerability indices and indicators are available for sustainable development, such as the Environmental Sustain-ability Index (ESI), Environmental Performance Index (EPI) and Environmental Vulnerability Index (EVI). Based on the discussions of earlier indicators, this study suggests indicators for a Water and Green Growth Index (WGGI). They extend in the three dimensions of current development models: environmental, economic and social. WGGI is especially promising in evaluating the extent to which a country or community is committed to water and green growth.
The research suggests that the most crucial principle in establishing policies related to water and green growth is “integration”, a modification of the integrated water resources management model. As for institutional reform, since the “Basic Act on Low Carbon, Green Growth” (Republic of Korea 2010) came into being, Korea is enacting a new law on water and green growth and revision of related laws. The study suggests setting up a politically, administratively and financially powerful independent organization for water and green growth.
The last section of this chapter explores ODA for water and green growth with a discussion of (a) the OECD Creditor Reporting System (CRS) relevant to green growth ODA; and (b) application of the system to water and green growth. The concept of water and green growth ODA adopted by the
Republic of Korea not only reflects all the CRS codes included in green growth ODA that emphasize climate change, the environment and economic growth, but also additional codes concerned with water transportation, business activities for public–private partnership, energy and mining issues, trading policy, and humanitarian assistance (disaster relief). As an international cooperative mechanism for water and green growth, the chapter evaluates Munasinghe’s tunnel effect (2008) that permits developing countries to avoid the path toward environmental disaster and to achieve sustainable development through international cooperation, aided by developed countries. The practical example of Korea’s East Asia Partnership is analysed and three cases are introduced: water and urbanization project in Mongolia; water security and economic growth project in Azerbaijan; and water and agricultural development in the Philippines.
Water and green growth has been designed as a new strategy for countering development challenges intertwined in issues of economy, industrialization, social welfare, environmental protection and water management. The concept may appear to overlap with ideas stemming from sustainable development, such as green growth, green economy and eco-efficiency. The approach may be criticized for seeming to offer nothing new. However, water and green growth affords a new window from which the international community can envisage what should be done to enhance water management and green development in today’s uncertain economic climate.
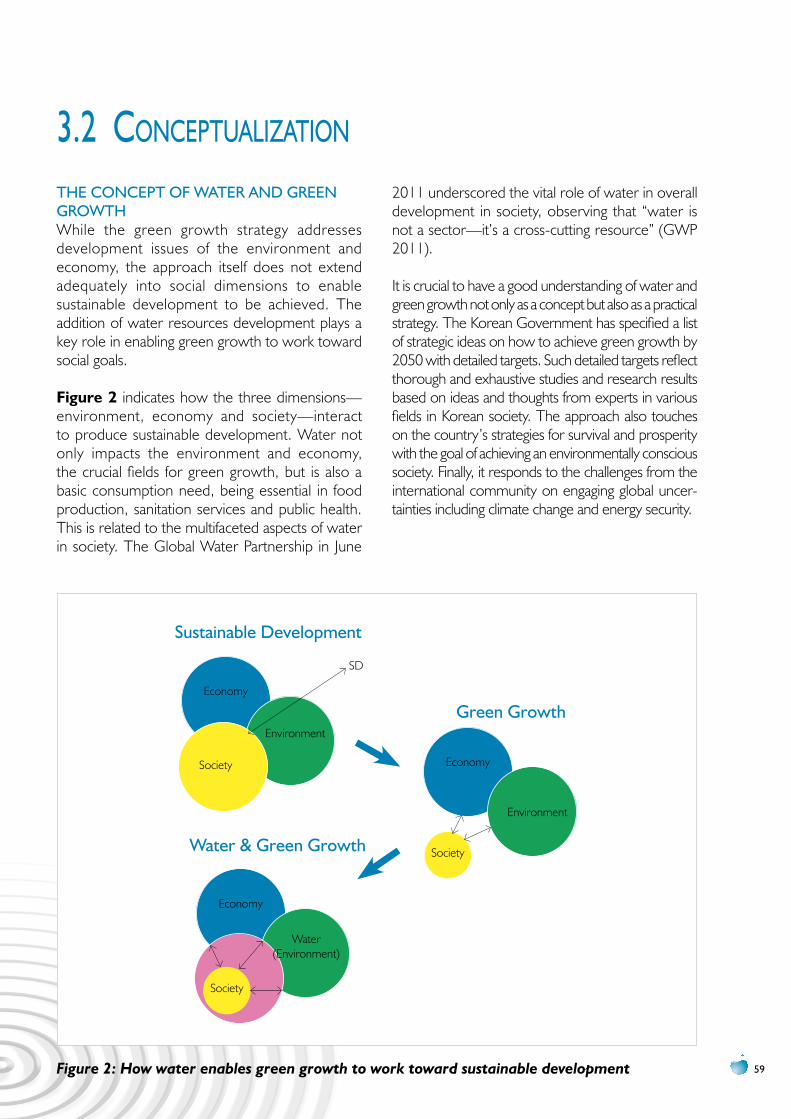
59Figure 2: How water enables green growth to work toward sustainable development
3.2 concePtuaLization
THE CONCEpT OF WATER AND GREEN GROWTHWhile the green growth strategy addresses development issues of the environment and economy, the approach itself does not extend adequately into social dimensions to enable sustainable development to be achieved. The addition of water resources development plays a key role in enabling green growth to work toward social goals.
Figure 2 indicates how the three dimensions—environment, economy and society—interact to produce sustainable development. Water not only impacts the environment and economy, the crucial fields for green growth, but is also a basic consumption need, being essential in food production, sanitation services and public health. This is related to the multifaceted aspects of water in society. The Global Water Partnership in June
2011 underscored the vital role of water in overall development in society, observing that “water is not a sector—it’s a cross-cutting resource” (GWP 2011).
It is crucial to have a good understanding of water and green growth not only as a concept but also as a practical strategy. The Korean Government has specified a list of strategic ideas on how to achieve green growth by 2050 with detailed targets. Such detailed targets reflect thorough and exhaustive studies and research results based on ideas and thoughts from experts in various fields in Korean society. The approach also touches on the country’s strategies for survival and prosperity with the goal of achieving an environmentally conscious society. Finally, it responds to the challenges from the international community on engaging global uncer-tainties including climate change and energy security.
Economy
Economy
Economy
Environment
SD
Environment
Water(Environment)
Society
Society
Society
Sustainable Development
Green Growth
Water & Green Growth
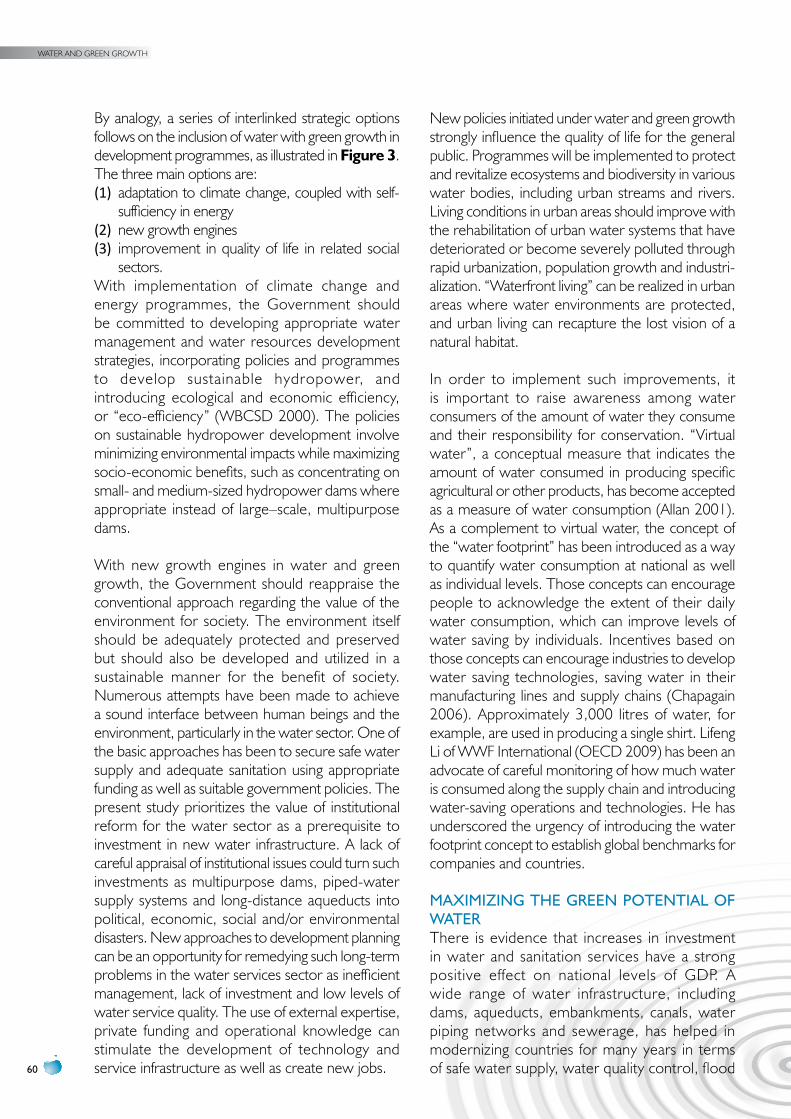
WATER AND GREEN GROWTH
60
By analogy, a series of interlinked strategic options follows on the inclusion of water with green growth in development programmes, as illustrated in Figure 3. The three main options are:(1) adaptation to climate change, coupled with self-
sufficiency in energy(2) new growth engines(3) improvement in quality of life in related social
sectors.With implementation of climate change and energy programmes, the Government should be committed to developing appropriate water management and water resources development strategies, incorporating policies and programmes to develop sustainable hydropower, and introducing ecological and economic efficiency, or “eco-efficiency” (WBCSD 2000). The policies on sustainable hydropower development involve minimizing environmental impacts while maximizing socio-economic benefits, such as concentrating on small- and medium-sized hydropower dams where appropriate instead of large–scale, multipurpose dams.
With new growth engines in water and green growth, the Government should reappraise the conventional approach regarding the value of the environment for society. The environment itself should be adequately protected and preserved but should also be developed and utilized in a sustainable manner for the benefit of society. Numerous attempts have been made to achieve a sound interface between human beings and the environment, particularly in the water sector. One of the basic approaches has been to secure safe water supply and adequate sanitation using appropriate funding as well as suitable government policies. The present study prioritizes the value of institutional reform for the water sector as a prerequisite to investment in new water infrastructure. A lack of careful appraisal of institutional issues could turn such investments as multipurpose dams, piped-water supply systems and long-distance aqueducts into political, economic, social and/or environmental disasters. New approaches to development planning can be an opportunity for remedying such long-term problems in the water services sector as inefficient management, lack of investment and low levels of water service quality. The use of external expertise, private funding and operational knowledge can stimulate the development of technology and service infrastructure as well as create new jobs.
New policies initiated under water and green growth strongly influence the quality of life for the general public. Programmes will be implemented to protect and revitalize ecosystems and biodiversity in various water bodies, including urban streams and rivers. Living conditions in urban areas should improve with the rehabilitation of urban water systems that have deteriorated or become severely polluted through rapid urbanization, population growth and industri-alization. “Waterfront living” can be realized in urban areas where water environments are protected, and urban living can recapture the lost vision of a natural habitat.
In order to implement such improvements, it is important to raise awareness among water consumers of the amount of water they consume and their responsibility for conservation. “Virtual water”, a conceptual measure that indicates the amount of water consumed in producing specific agricultural or other products, has become accepted as a measure of water consumption (Allan 2001). As a complement to virtual water, the concept of the “water footprint” has been introduced as a way to quantify water consumption at national as well as individual levels. Those concepts can encourage people to acknowledge the extent of their daily water consumption, which can improve levels of water saving by individuals. Incentives based on those concepts can encourage industries to develop water saving technologies, saving water in their manufacturing lines and supply chains (Chapagain 2006). Approximately 3,000 litres of water, for example, are used in producing a single shirt. Lifeng Li of WWF International (OECD 2009) has been an advocate of careful monitoring of how much water is consumed along the supply chain and introducing water-saving operations and technologies. He has underscored the urgency of introducing the water footprint concept to establish global benchmarks for companies and countries.
MAxIMIzING THE GREEN pOTENTIAL OF WATERThere is evidence that increases in investment in water and sanitation services have a strong positive effect on national levels of GDP. A wide range of water infrastructure, including dams, aqueducts, embankments, canals, water piping networks and sewerage, has helped in modernizing countries for many years in terms of safe water supply, water quality control, flood
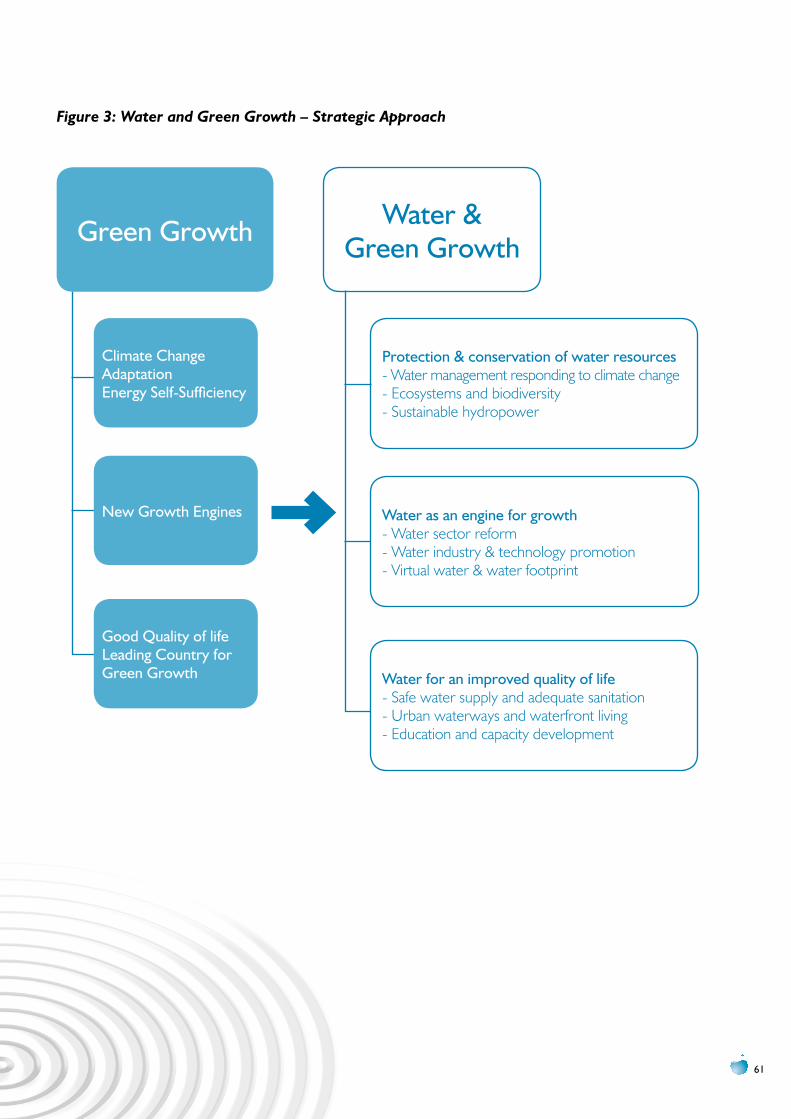
61
Figure 3: Water and Green Growth – Strategic Approach
Green Growth
Climate ChangeAdaptationEnergy Self-Sufficiency
protection & conservation of water resources- Water management responding to climate change- Ecosystems and biodiversity- Sustainable hydropower
Water as an engine for growth- Water sector reform- Water industry & technology promotion- Virtual water & water footprint
Water for an improved quality of life- Safe water supply and adequate sanitation- Urban waterways and waterfront living- Education and capacity development
Good Quality of lifeLeading Country forGreen Growth
New Growth Engines
Water &Green Growth
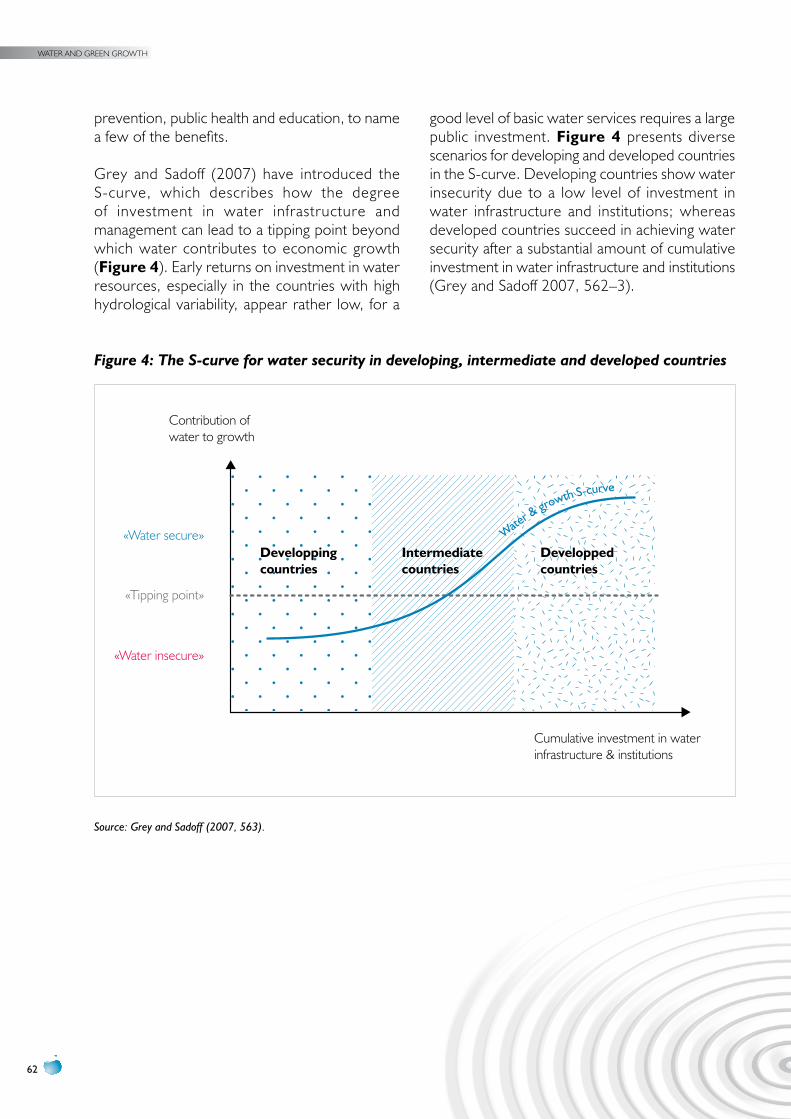
WATER AND GREEN GROWTH
62
prevention, public health and education, to name a few of the benefits.
Grey and Sadoff (2007) have introduced the S-curve, which describes how the degree of investment in water infrastructure and management can lead to a tipping point beyond which water contributes to economic growth (Figure 4). Early returns on investment in water resources, especially in the countries with high hydrological variability, appear rather low, for a
good level of basic water services requires a large public investment. Figure 4 presents diverse scenarios for developing and developed countries in the S-curve. Developing countries show water insecurity due to a low level of investment in water infrastructure and institutions; whereas developed countries succeed in achieving water security after a substantial amount of cumulative investment in water infrastructure and institutions (Grey and Sadoff 2007, 562–3).
Figure 4: The S-curve for water security in developing, intermediate and developed countries
Contribution of water to growth
Developping countries
Intermediate countries
Developped countries
«Water secure»
«Tipping point»
«Water insecure»
Cumulative investment in water infrastructure & institutions
Water &
growth S-curve
Source: Grey and Sadoff (2007, 563).
63
Multipurpose dams in many parts of the world have played a pivotal role in protecting property, assets, social infrastructure and people from floods and torrential rainfall, as well as in providing electricity for economic growth and facilitating inland navigation. Development of multipurpose dams following sustainable guidelines is especially important for developing countries. For example, Europe has invested massively in exploiting over 70% of its potential hydropower resources; whereas Africa has exploited only about 5% of its hydropower potential (Grey and Sadoff 2007, 554). Developing countries appear to benefit the most from sustainable dam development. Although multipurpose dams have often been criticized for their shortcomings, they are again in the spotlight for decision-makers as means of coping with challenges related to the reduction of GHG emissions and climate change adaptation. New interest in multipurpose dams highlights their potential contribution to enhancement of the environment and reconciliation of the interests of human beings and nature.
Improvements in systems and institutions for water management can lead to solutions for buttressing green growth and nurturing resilience against climate change. The misuse and overexploitation of water resources in much of the world may be difficult or impossible to compensate for. However, innovative approaches in limiting consumption of water resources, such as water recycling and reuse in domestic as well as industrial sectors, can help maximize the volume of water available for human use. Technological advancements and integrated approaches to water management can also induce improvements in efficiency of water use; i.e., rainwater harvesting, water management through remote sensing and geographical information
systems (GIS), large-scale management of reservoirs, and storm water and aquifer management (Grobicki 2010).
Water can provide a platform for economic growth or economic disaster. The multifaceted nature and social uses of water are a connecting thread across economic sectors that can support and accelerate green growth. However, if not well harnessed or safeguarded, water can become a threat to survival as seen in countless cases of flooding and drought throughout the world. The impacts of climate change only exacerbate the problem. Ensuring water security in all its diverse forms also safeguards human security and the security of nations (Grobicki 2010).
Some of the good practices with regard to water and green growth are found in Korea and France. Confronted with financial crises since 2008, the Korean Government embarked on its economic stimulus package that was similar to those of other OECD member countries. But the policy efforts of Korea were different, since the Government allocated 80% of its stimulus package to the sectors associated with green growth that are strongly focused on water—compared with just 35% in China and 10% in the United States (OECD 2009). Another good example is found with the French “Grenelle de l’Environnement” project, launched in 2007. The project required all relevant stakeholders to set economic and environmental aims. In the programme, a vast amount of investment (€400 billion) will be mobilized from both the public and private sector and invested in green initiatives, such as the enhancement of water distribution networks (OECD 2009).
WATER AND GREEN GROWTH
64
3.3 deveLoPMent of Water and green groWth PoLicy
NATIONAL pOLICyThe water and green growth approach to development is empirical and interdisciplinary, touching on diverse agendas in policymaking and implementation. The Korean experience indicates that several different Government bureaus have contributed to the strategies and targets that have been integrated into the various policies and programmes. The complexity of agendas embedded in green growth is increased by the incorporation of water in green growth.
Integration here refers to amalgamating or combining two elements to form a whole new idea and system (McDonnell 2008). In organiza-tional theory, the terms integration and coordination have been used interchangeably. Coordination has been defined as the process of creating a unitary action derived from interdependent activities. In the field of quality management in business studies, integration has been defined as the degree of harmonious alignment in an organization “where different departments and levels speak the same language and are tuned to the same wavelength.” Full integration would thus require total harmony and alignment of policy and purpose throughout the organization (Wilkinson and Dale 1999; Garvin 1991). The discourse here shows that integration processes should accommodate the individuality that might exist within diverse institutions and sectors. The practical achievement of integration succeeds through close cooperation of relevant entities.
Integration of policies in cross-cutting issues related to water and green growth is a separate issue for consideration. Water challenges have become increasingly complex and interconnected within such development sectors as agriculture, energy, industry, transport, the environment, health and regional development. The main purposes of water management are to enhance the standard and quality of life, to eradicate poverty, to achieve a more balanced income distribution and to protect the environment. Success in addressing such complex issues in social development cannot be achieved
through interventions in water management alone, but also through related natural resources interven-tions (Biswas 2008). The complexities are especially daunting for developing countries, which must juggle two policy-related challenges simultaneously: the traditional development path that emphasizes economic growth and the new international norm of environmentally sound green policies.
The Korean Government’s modifications to IWRM provide a useful example of how a sound basis can be established for national water and green growth policies. Regardless of conflicting views on the value of IWRM in resolving water issues, some elements in the approach and the process of incor-porating IWRM into the green growth strategies are important in setting national policies for water and green growth.
IWRM has been defined as a process that “promotes the coordinated development and management of water, land and related resources in order to maximize the resultant economic and social welfare in an equitable manner without compromising the sustainability of vital ecosystems” (GWP 2000). That definition suggests that IWRM emphasizes the equal status of economy, society and the environment in relation with water management, regarding not only issues of water management but also those of land and other related resources. IWRM also advocates maximization of the economic, social and environmental benefits associated with water can provide a sound platform for policies on water and green growth.
Table 6 presents policy approaches and actions under the IWRM framework and its application for water and green growth. Each approach entails specific actions. The most fundamental element in establishing water and green growth policy is political commitment. That is evident in the extent to which the State is willing to allocate relevant resources and to advocate water and green growth in a consistent policy direction. The Government must take responsibility in diffusing the innovative
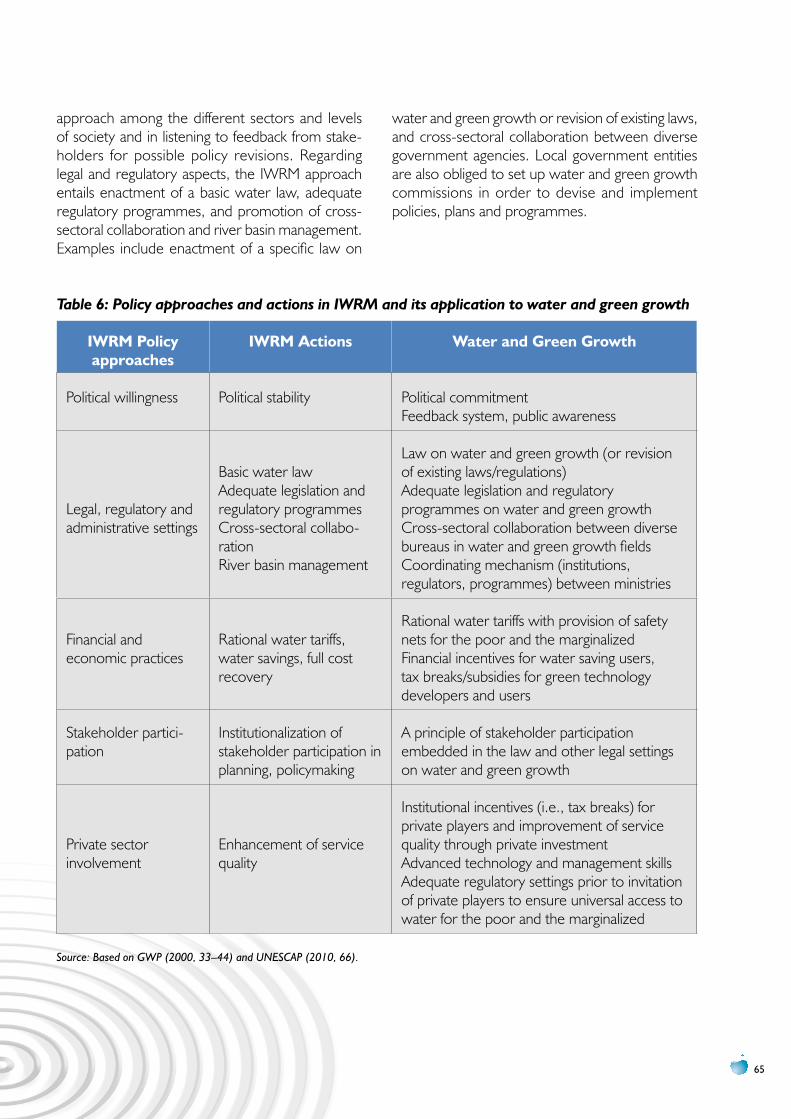
65
approach among the different sectors and levels of society and in listening to feedback from stake-holders for possible policy revisions. Regarding legal and regulatory aspects, the IWRM approach entails enactment of a basic water law, adequate regulatory programmes, and promotion of cross-sectoral collaboration and river basin management. Examples include enactment of a specific law on
water and green growth or revision of existing laws, and cross-sectoral collaboration between diverse government agencies. Local government entities are also obliged to set up water and green growth commissions in order to devise and implement policies, plans and programmes.
Table 6: Policy approaches and actions in IWRM and its application to water and green growth
iWRM Policy approaches
iWRM Actions Water and Green Growth
Political willingness Political stability Political commitmentFeedback system, public awareness
Legal, regulatory and administrative settings
Basic water lawAdequate legislation and regulatory programmesCross-sectoral collabo-rationRiver basin management
Law on water and green growth (or revision of existing laws/regulations)Adequate legislation and regulatory programmes on water and green growthCross-sectoral collaboration between diverse bureaus in water and green growth fieldsCoordinating mechanism (institutions, regulators, programmes) between ministries
Financial and economic practices
Rational water tariffs, water savings, full cost recovery
Rational water tariffs with provision of safety nets for the poor and the marginalized Financial incentives for water saving users, tax breaks/subsidies for green technology developers and users
Stakeholder partici-pation
Institutionalization of stakeholder participation in planning, policymaking
A principle of stakeholder participation embedded in the law and other legal settings on water and green growth
Private sector involvement
Enhancement of service quality
Institutional incentives (i.e., tax breaks) for private players and improvement of service quality through private investmentAdvanced technology and management skillsAdequate regulatory settings prior to invitation of private players to ensure universal access to water for the poor and the marginalized
Source: Based on GWP (2000, 33–44) and UNESCAP (2010, 66).
WATER AND GREEN GROWTH
66
With regard to financial and economic practices, such incentives as tax benefits for green technology developers, green financing and rate increases on electricity that is based on fossil fuels, can be good stimuli to encourage water and green growth policies. Similarly, the Government should be ready to promote not only ground-breaking R&D projects for water use and management—such as water saving, rainwater harvesting, water purification and desalination technologies—but consider as well various non-structural options for wise use of water resources, such as rationalization of water tariffs, an increase of investment in the water industry, and reallocation of water resources between different sectors.
Stakeholder participation has an essential part in legitimizing water and green growth policy. A social consensus is necessary for fairly allocating water resources among competing uses at the river basin level. Changing consumer behaviour requires arduous persuasion and education campaigns. The authorities will need to provide a forum where the general public can voice their views and opinions on how to achieve water and green growth for their society. Principles of stakeholder participation in decision-making at different levels must be upheld regarding the laws and regulations on water and green growth.
Private sector participation has been a major element in changing the climate of water services in many countries. The involvement of the private sector in water services has had positive impacts in enhancing water supply and sanitation services in numerous instances, although its presence has also attracted criticism, especially in poor countries. The private sector can, for instance, facilitate mobilization of capital, avoiding massive debt in the public sector, and improve service quality with new technologies and efficient operations and management. Such positive outcomes from public–private partner-ships in the water sector can be duplicated in water and green growth. The engagement of the private sector is particularly important in developing new growth engines—safe water supply and adequate sanitation, water sector reform and water industry promotion. The Singaporean experience as a water innovation hub is renowned for its successful outcomes using governmental support and private sector investment. Israel, too, has developed water management technologies through increased
investment, while its drip irrigation technology is world-class. Over 250 Israeli businesses involving water technologies exported US$ 1.4 billion worth of goods in 2008 (2030 WRG 2009).
INSTITuTIONAL REFORMNational legislation is imperative in establishing water and green growth policies and programmes in any country. Without a legal foundation, the relevant policies might not be appropriately implemented. The recent success in Korea of the Basic Act on Low-Carbon Green Growth is a case in point of good practice. It is a basic act for green growth that has priority over all the relevant legislation.
The key articles in the law provide for:
(a) A legal platform for the Presidential Committee on Green Growth (PCGG) and the mandate for PCGG to devise a national strategy for green growth;
(b) A series of green growth related policies, including support of green economy and industry and the transformation of conventional industries that are applying green technologies and management skills;
(c) Financial and budgetary issues, including promotion of financing for green technology R&D and green investment, and an intro-duction of environmentally sound tax reform;
(d) Addressing climate change, including the mandate to establish targets for GHG emission reduction, energy saving, energy security, and renewable energy supply;
(e) Obligatory reporting of GHG emissions by businesses and implementation of a cap-and-trade system in the country; and
(f) A number of policy issues on sustainable development, such as environmentally friendly land use, green building, low-carbon transpor-tation, and green consumption and production. (PCGG 2011, 11; Republic of Korea 2010.)
67
The implications of the law are threefold:
1. The law is the first that explicitly presents the ethos of green growth in national-level legislation that was negotiated between diverse agencies, civil society and the private sector.
2. The three pillars of the Korean green growth concept, i.e., energy, economy, and climate change, epitomized the thorough studies and considerations by the Korean Government on how to cope with complicated challenges in global development. The Government aims to achieve socio-economic development as well as environmental protection, not only for its own society but also for the global community.
3. The legislation focuses particular attention on economic and industrial dimensions in sustainable development—and includes a list of articles that refer to green economy, green industry, financing for green technology R&D and green investment, and green construction. Such provisions embody a main feature of the Korean approach, that of emphasizing the significance of continuous economic growth for developing countries in a sustainable fashion (Republic of Korea 2010).
The Korean “Basic Act on Low Carbon, Green Growth” illustrates for other countries how to accommodate their socio-economic needs in policies on water and green growth. There is no “one-size-fits-all” policy framework. Another crucial dimension in establishing a legal framework in water and green growth is a clear vision of the national objectives, based on benchmarking studies and wide-ranging discussions among the various stakeholders. The economic and industrial aspects of the vision should be incorporated into the legal framework together with the means of providing basic water supply and sanitation services and technologies for water saving, irrigation, recycling and reuse. Institutional change is also necessary in areas such as water pricing reform, pollution-based tax reform, river basin management, and water management that accounts for virtual water and the country’s water footprint. Most importantly, the public sector should provide a sound legal and institutional foundation for the private sector to focus on technology development, contribute efficient operational and management skills, and provide private investment for the water sector with adequate institutional support.
ORGANIzATIONAL REFORM Strong political leadership in prioritizing issues for action is essential in formulation of water and green growth policies. The PCGG in Korea consists of various policymaking bodies, including the Climate Change Office, the Energy Commission and the Sustainable Development Commission under the President’s office. Since PCGG is directly under the auspices of the presidential office, its policies and programmes usually receive strong political support that facilitates implementation of green growth policies and programmes (PCGG 2011, 4).
Establishing a coordinating body is a prerequisite to prioritizing the water and green growth agenda in a country. In setting up a coordinating body for water and green growth, the newly created institution must be endowed with political, administrative and financial autonomy. Otherwise, the different policy directions of the institutions might change in the socio-political and economic landscape. Previous experience in Korea and the United States—the latter’s independent regulatory commissions—would counsel establishment of water and green growth commissions rather than committees (Lee 2010, 45). In these two cases, the difference between them stems from whether the body has the power to enact laws and regulations and conduct regulatory activities based on its mandate. Commissions enjoy such power whereas committees do not.
In Korea a number of advisory committees exist that only provide advice and suggestions to the President and the administration. A few commissions also exist, such as the Fair Trade Commission, which has the mandate to establish laws and regulations and conduct enforcement measures. The variety of political landscapes in different countries can permit a new coordinating body to have a range of forms and functions. Some committees may enjoy the power of review or approval over relevant projects. With a sufficient degree of political support, such as the case with the PCGG, a committee can provide a good model for implementing water and green growth (Lee 2010, 45–6).
At the local level, institutions such as local water and green growth commissions may be established to implement policies, plans and programmes. The commissions may be given political, financial and administrative independence through a special fund that is based on green taxes and other measures at
WATER AND GREEN GROWTH
68
the local level. Such bodies should work closely with relevant bureaus and offices of local government together with river basin organizations in order to focus on concerns and issues of local residents.
FINANCING Priorities in water management depend on the particular circumstances in each country, whether developed or developing. Developed countries, most of whose water service facilities have been constructed, are largely concerned with renovation of aging water infrastructure. The United States needs to invest on a vast scale, of some US$ 23 billion over the next two decades, just to keep its current level of services in the water sector up to health and environmental standards. Other developed countries such as the United Kingdom and Japan require an increase in their water budget from 20% to 40% to renovate and maintain their water infrastructure.
According to WHO (2008), around US$ 18 billion is required for developing countries to rehabilitate their existing infrastructure in order to meet the needs specified in the water-related MDGs, which would necessitate doubling their current levels of spending. An estimated total of US$ 54 billion per annum should be provided to maintain water services for the current population (OECD 2011a, 69).
Confronted with such immense financing challenges for water services, the OECD Forum 2009 raised the sensitive yet significant question of why Governments often ignored environment-related measures in their fiscal stimulus packages.
Investments in water and sanitation are widely acknowledged to bring positive returns in the long term because water is a cross-cutting resource. It is difficult to calculate the environmental and social benefits of water management. Exhaustive and persuasive cost-benefit analysis tools and methods should be further developed in order to persuade decision-makers to prioritize water issues in their economic development plans (OECD 2009, 3).
OECD (2011a) highlighted three good financial allocation practices for green growth, which are useful in developing water and green growth policies and projects, as follows:
1. The Korean Government launched its National Strategy for Green Growth and the Five-Year Plan (2009–2013) with plans to contribute around 2% of annual GDP (US$ 90 billion in total) to green growth programmes and projects, including the programme to finance development of advanced water-treatment technologies and projects (PCGG 2009, 373).
2. Ireland is dealing with environmental challenges through its National Development Plan in allocating a large amount for investment in environmental sustainability between 2007 and 2013. Its investment in programmes related to environmental sustainability reached over €1.3 billion in 2007.
3. Rwanda set up the Economic Development and Poverty Reduction Strategy (2008–2012), which specified indicative financial allocations for environmental sustainability. A total of Rwandan francs (RWF) 62 billion (US$ 100 million) is allocated in the period for the sectors of the environment, land and forestry, which is equivalent to 1.8% of the total public expenditure. An amount of RWF 146 billion (US$ 240 million), accounting for 4.2% of the total public expenditure, is allocated to the water and sanitation sector (OECD 2011a, 73).
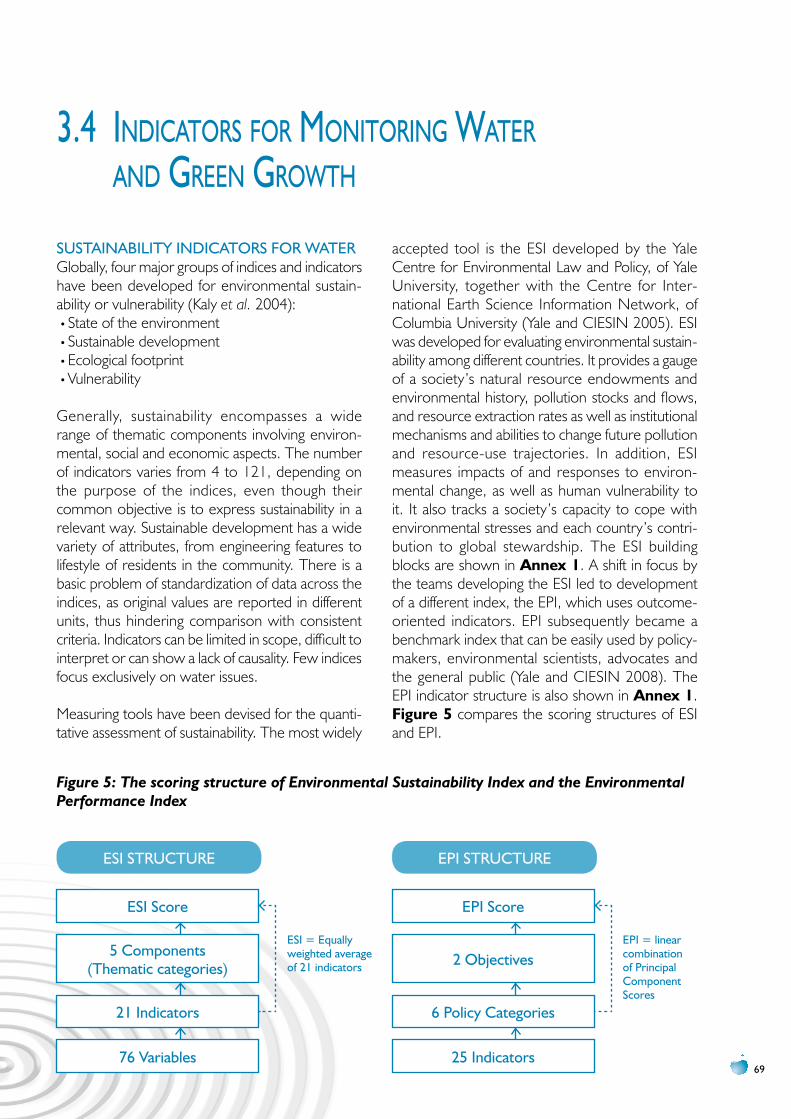
69
3.4 indicators for Monitoring Water and green groWth
SuSTAINABILITy INDICATORS FOR WATERGlobally, four major groups of indices and indicators have been developed for environmental sustain-ability or vulnerability (Kaly et al. 2004):•State of the environment•Sustainable development•Ecological footprint•Vulnerability
Generally, sustainability encompasses a wide range of thematic components involving environ-mental, social and economic aspects. The number of indicators varies from 4 to 121, depending on the purpose of the indices, even though their common objective is to express sustainability in a relevant way. Sustainable development has a wide variety of attributes, from engineering features to lifestyle of residents in the community. There is a basic problem of standardization of data across the indices, as original values are reported in different units, thus hindering comparison with consistent criteria. Indicators can be limited in scope, difficult to interpret or can show a lack of causality. Few indices focus exclusively on water issues.
Measuring tools have been devised for the quanti-tative assessment of sustainability. The most widely
accepted tool is the ESI developed by the Yale Centre for Environmental Law and Policy, of Yale University, together with the Centre for Inter-national Earth Science Information Network, of Columbia University (Yale and CIESIN 2005). ESI was developed for evaluating environmental sustain-ability among different countries. It provides a gauge of a society’s natural resource endowments and environmental history, pollution stocks and flows, and resource extraction rates as well as institutional mechanisms and abilities to change future pollution and resource-use trajectories. In addition, ESI measures impacts of and responses to environ-mental change, as well as human vulnerability to it. It also tracks a society’s capacity to cope with environmental stresses and each country’s contri-bution to global stewardship. The ESI building blocks are shown in Annex 1. A shift in focus by the teams developing the ESI led to development of a different index, the EPI, which uses outcome-oriented indicators. EPI subsequently became a benchmark index that can be easily used by policy-makers, environmental scientists, advocates and the general public (Yale and CIESIN 2008). The EPI indicator structure is also shown in Annex 1. Figure 5 compares the scoring structures of ESI and EPI.
Figure 5: The scoring structure of Environmental Sustainability Index and the Environmental Performance Index
ESI STRuCTuRE EpI STRuCTuRE
ESI = Equally weighted average of 21 indicators
EpI = linear combination of principal Component Scores
ESI Score EpI Score
21 Indicators 6 policy Categories
76 variables 25 Indicators
5 Components(Thematic categories) 2 Objectives
WATER AND GREEN GROWTH
70
In the ESI building blocks, eco-efficiency is associated with only the variables of “energy efficiency” and “hydropower and renewable energy production as a percentage of total energy consumption”. That illustrates a couple of practical aspects of eco-efficiency. First, even though the original definition refers to its potential application in general industries, its practical application can be found in some limited industrial sectors. Realization of eco-efficiency requires not only institutional preparedness but also technical preparedness. In many cases developing the technical knowhow for raising resource efficiency and environmental soundness requires an unreasonable level of time and investment, which can undermine eco-efficiency and decrease economic feasibility. Second, the energy industry has a profound impact on the global environment, resulting from climate variability and change. In respect of eco-efficiency, the energy industry has most weight in influencing regional or global levels of eco-efficiency. Fossil fuels are a major source of greenhouse gases, which are the target of global climate change mitigation strategies.
The water sector is the most impacted by the changing climate. Climate variability and change directly impact water availability and the frequency and magnitude of water-related natural disasters. In response, the reengineering of existing and the construction of new water infrastructure, as well as developing new water policies and regulation, are required. The conflicts between policymakers and environmentalists on building large-scale water infrastructure, including large dams, have long been global issues. Sustainable solutions and frameworks for water infrastructure planning and management have become global priorities and key references for eco-efficiency indicators.
The OECD’s new indicators measuring green growth performance are outlined in chapter 2. Unlike the earlier sustainability indicators, the OECD green growth indicators are meant to express multiple features within the socio-economic context, feedback between environment and resource productivity, and markets and prices, among others, which require combinations of economic and environmental information in a consistent way. The new System of Environmental and Economic Accounting will provide such a framework. Placing measurement efforts within this framework will maximize consistency and global comparability.
WATER AND GREEN GROWTH INDICATORS Based on the existing indicators for sustainable development—ESI, EPI, EVI and the recent OECD Green Growth Indicators—any proposed set of indicators for assessing water and green growth should take into account the unique characteristics of water as a resource. Some conditions for effective indicators are listed here (Hart 2009):
•Effective indicators are relevant; they show something about the system that must be known.
•Effective indicators are easy to understand, even by people who are not experts.
•Effective indicators are reliable; the information that the indicator provides is trustworthy.
•Effective indicators are based on accessible data; the information is available or can be gathered while there is still time to act.
•Effective indicators are evaluated quantitatively; they are based on objective measurements with consistent criteria.
•Effective indicators have scientific causality, which makes them logical and robust.
In this report, the Water and Green Growth Index has been created that consists of environmental, economic, and social components. The WGGI consists of 14 categories and 45 indicators.
The environmental dimension consists of four categories of water quality, ecosystem vitality, water stress and climate change impacts. The water stress indicator is the percentage of a country’s territory affected by overdraft of water resources. A high degree of water overdraft occurs when water use exceeds 40% of available supply (UN and SEI 1997). Countries can, to some extent, accommodate overdraft in one region with inter-basin transfers, water re-use and desalination; but some of those solutions have significant environmental impacts of their own. The Index is presented in Table 7.
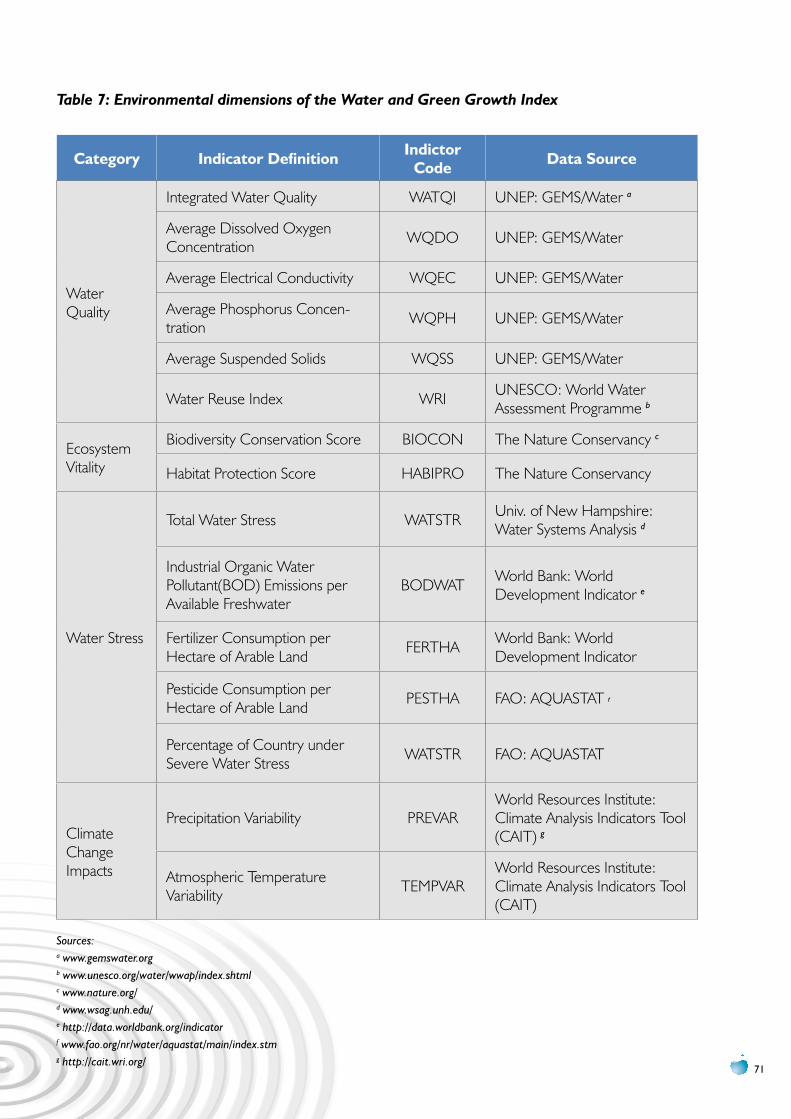
71
Table 7: Environmental dimensions of the Water and Green Growth Index
category indicator Definition indictor code Data Source
Water Quality
Integrated Water Quality WATQI UNEP: GEMS/Water a
Average Dissolved Oxygen Concentration WQDO UNEP: GEMS/Water
Average Electrical Conductivity WQEC UNEP: GEMS/Water
Average Phosphorus Concen-tration WQPH UNEP: GEMS/Water
Average Suspended Solids WQSS UNEP: GEMS/Water
Water Reuse Index WRI UNESCO: World Water Assessment Programme b
Ecosystem Vitality
Biodiversity Conservation Score BIOCON The Nature Conservancy c
Habitat Protection Score HABIPRO The Nature Conservancy
Water Stress
Total Water Stress WATSTR Univ. of New Hampshire: Water Systems Analysis d
Industrial Organic Water Pollutant(BOD) Emissions per Available Freshwater
BODWAT World Bank: World Development Indicator e
Fertilizer Consumption per Hectare of Arable Land FERTHA World Bank: World
Development Indicator
Pesticide Consumption per Hectare of Arable Land PESTHA FAO: AQUASTAT f
Percentage of Country under Severe Water Stress WATSTR FAO: AQUASTAT
Climate Change Impacts
Precipitation Variability PREVARWorld Resources Institute: Climate Analysis Indicators Tool (CAIT) g
Atmospheric Temperature Variability TEMPVAR
World Resources Institute: Climate Analysis Indicators Tool (CAIT)
Sources: a www.gemswater.org b www.unesco.org/water/wwap/index.shtml c www.nature.org/ d www.wsag.unh.edu/ e http://data.worldbank.org/indicatorf www.fao.org/nr/water/aquastat/main/index.stm g http://cait.wri.org/
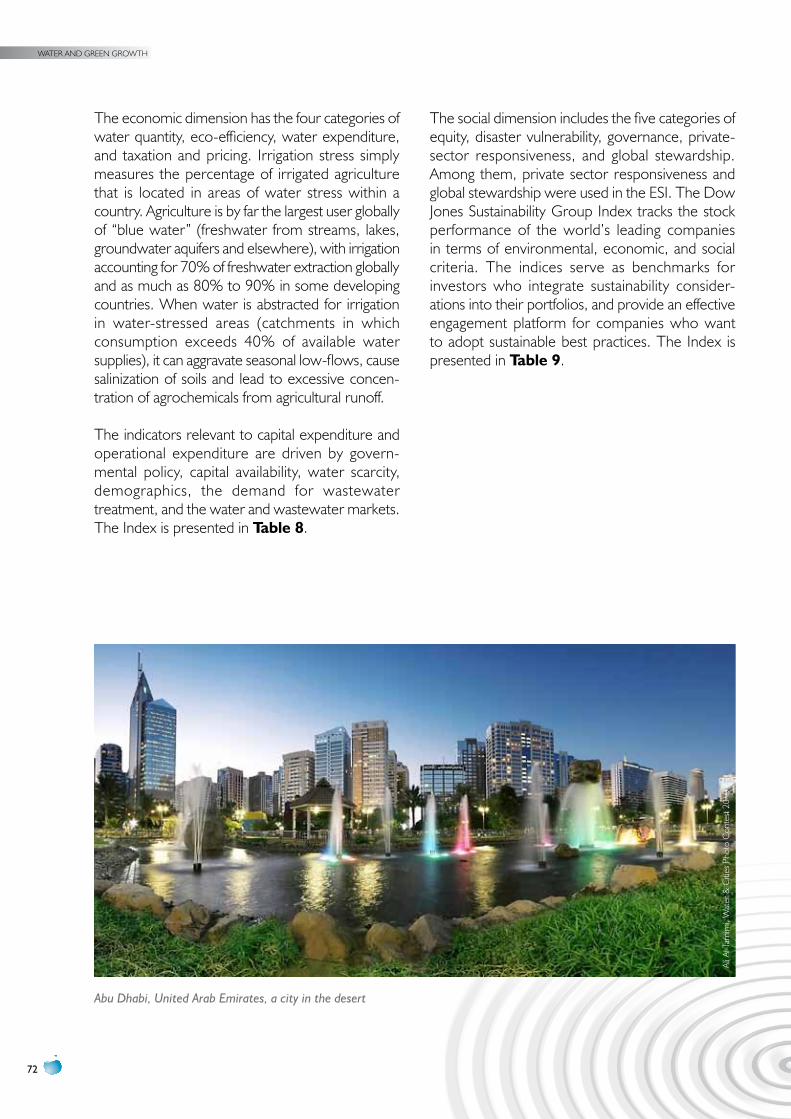
WATER AND GREEN GROWTH
72
The economic dimension has the four categories of water quantity, eco-efficiency, water expenditure, and taxation and pricing. Irrigation stress simply measures the percentage of irrigated agriculture that is located in areas of water stress within a country. Agriculture is by far the largest user globally of “blue water” (freshwater from streams, lakes, groundwater aquifers and elsewhere), with irrigation accounting for 70% of freshwater extraction globally and as much as 80% to 90% in some developing countries. When water is abstracted for irrigation in water-stressed areas (catchments in which consumption exceeds 40% of available water supplies), it can aggravate seasonal low-flows, cause salinization of soils and lead to excessive concen-tration of agrochemicals from agricultural runoff.
The indicators relevant to capital expenditure and operational expenditure are driven by govern-mental policy, capital availability, water scarcity, demographics, the demand for wastewater treatment, and the water and wastewater markets. The Index is presented in Table 8.
The social dimension includes the five categories of equity, disaster vulnerability, governance, private-sector responsiveness, and global stewardship. Among them, private sector responsiveness and global stewardship were used in the ESI. The Dow Jones Sustainability Group Index tracks the stock performance of the world’s leading companies in terms of environmental, economic, and social criteria. The indices serve as benchmarks for investors who integrate sustainability consider-ations into their portfolios, and provide an effective engagement platform for companies who want to adopt sustainable best practices. The Index is presented in Table 9.
Abu Dhabi, United Arab Emirates, a city in the desert
Ali A
l-Tam
imi,
Wat
er &
Citi
es P
hoto
Con
test
201
0
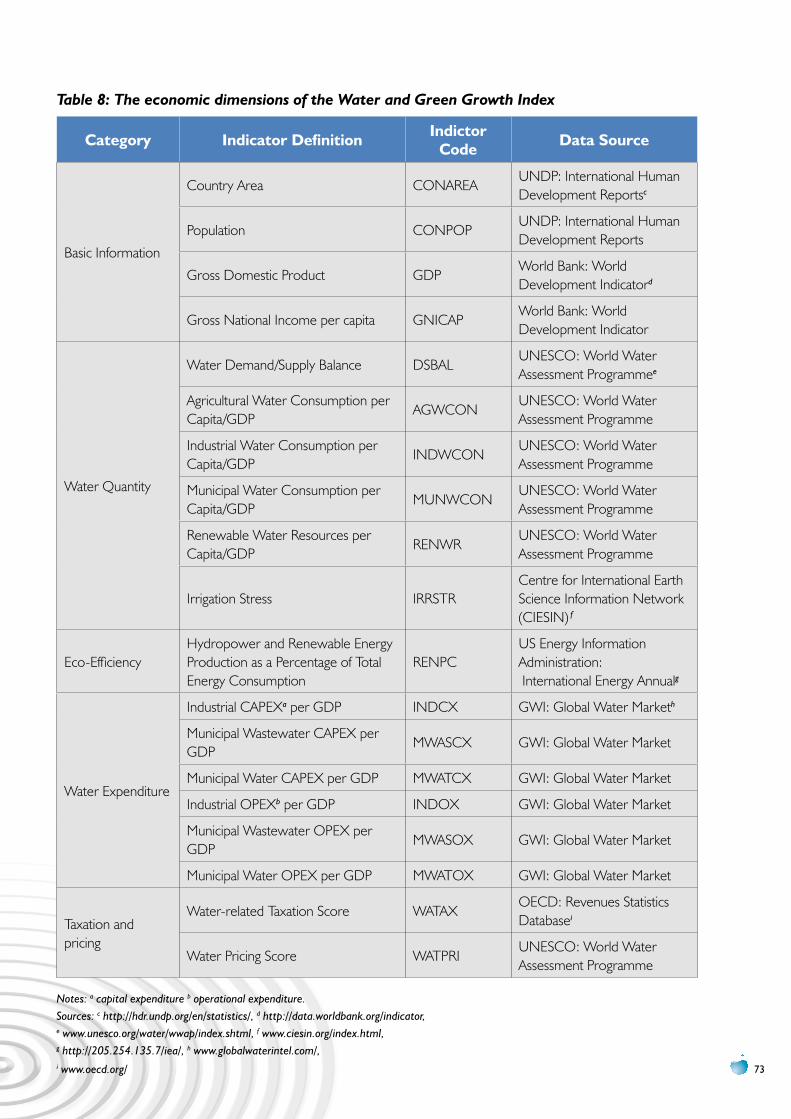
73
Table 8: The economic dimensions of the Water and Green Growth Index
category indicator Definition indictor code Data Source
Basic Information
Country Area CONAREAUNDP: International Human Development Reportsc
Population CONPOPUNDP: International Human Development Reports
Gross Domestic Product GDPWorld Bank: World Development Indicatord
Gross National Income per capita GNICAPWorld Bank: World Development Indicator
Water Quantity
Water Demand/Supply Balance DSBALUNESCO: World Water Assessment Programmee
Agricultural Water Consumption per Capita/GDP
AGWCONUNESCO: World Water Assessment Programme
Industrial Water Consumption per Capita/GDP
INDWCONUNESCO: World Water Assessment Programme
Municipal Water Consumption per Capita/GDP
MUNWCONUNESCO: World Water Assessment Programme
Renewable Water Resources per Capita/GDP
RENWRUNESCO: World Water Assessment Programme
Irrigation Stress IRRSTRCentre for International Earth Science Information Network (CIESIN) f
Eco-EfficiencyHydropower and Renewable Energy Production as a Percentage of Total Energy Consumption
RENPCUS Energy Information Administration: International Energy Annualg
Water Expenditure
Industrial CAPEXa per GDP INDCX GWI: Global Water Marketh
Municipal Wastewater CAPEX per GDP
MWASCX GWI: Global Water Market
Municipal Water CAPEX per GDP MWATCX GWI: Global Water Market
Industrial OPEXb per GDP INDOX GWI: Global Water Market
Municipal Wastewater OPEX per GDP
MWASOX GWI: Global Water Market
Municipal Water OPEX per GDP MWATOX GWI: Global Water Market
Taxation and pricing
Water-related Taxation Score WATAXOECD: Revenues Statistics Databasei
Water Pricing Score WATPRIUNESCO: World Water Assessment Programme
Notes: a capital expenditure b operational expenditure.Sources: c http://hdr.undp.org/en/statistics/, d http://data.worldbank.org/indicator,e www.unesco.org/water/wwap/index.shtml, f www.ciesin.org/index.html,g http://205.254.135.7/iea/, h www.globalwaterintel.com/,i www.oecd.org/
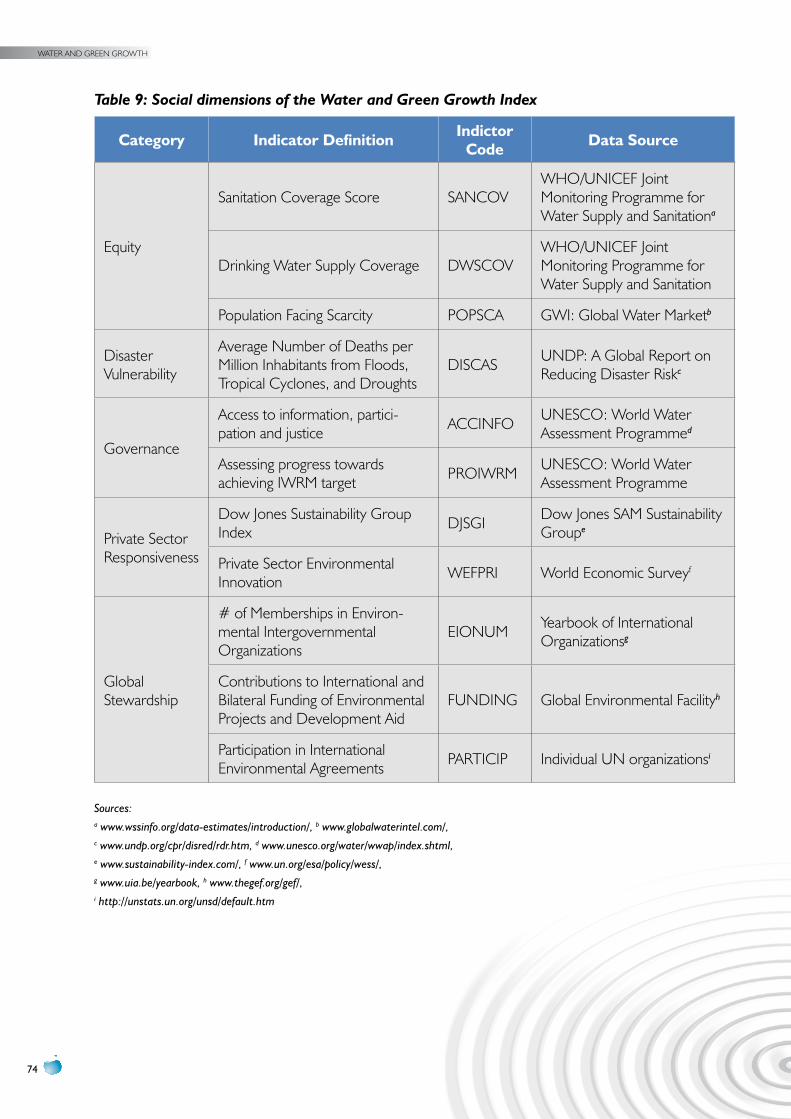
WATER AND GREEN GROWTH
74
Table 9: Social dimensions of the Water and Green Growth Index
category indicator Definition indictor code Data Source
Equity
Sanitation Coverage Score SANCOVWHO/UNICEF Joint Monitoring Programme for Water Supply and Sanitationa
Drinking Water Supply Coverage DWSCOVWHO/UNICEF Joint Monitoring Programme for Water Supply and Sanitation
Population Facing Scarcity POPSCA GWI: Global Water Marketb
Disaster Vulnerability
Average Number of Deaths per Million Inhabitants from Floods, Tropical Cyclones, and Droughts
DISCAS UNDP: A Global Report on Reducing Disaster Riskc
Governance
Access to information, partici-pation and justice ACCINFO UNESCO: World Water
Assessment Programmed
Assessing progress towards achieving IWRM target PROIWRM UNESCO: World Water
Assessment Programme
Private Sector Responsiveness
Dow Jones Sustainability Group Index DJSGI Dow Jones SAM Sustainability
Groupe
Private Sector Environmental Innovation WEFPRI World Economic Surveyf
Global Stewardship
# of Memberships in Environ-mental Intergovernmental Organizations
EIONUM Yearbook of International Organizationsg
Contributions to International and Bilateral Funding of Environmental Projects and Development Aid
FUNDING Global Environmental Facilityh
Participation in International Environmental Agreements PARTICIP Individual UN organizationsi
Sources:
a www.wssinfo.org/data-estimates/introduction/, b www.globalwaterintel.com/,c www.undp.org/cpr/disred/rdr.htm, d www.unesco.org/water/wwap/index.shtml,e www.sustainability-index.com/, f www.un.org/esa/policy/wess/,g www.uia.be/yearbook, h www.thegef.org/gef/,i http://unstats.un.org/unsd/default.htm
75
3.5 internationaL cooPeration in Water and green groWth
WATER AND GREEN GROWTH ODAInternational cooperation under the framework of water and green growth involves issues of support for programme development in terms of funding and institutional infrastructure.
“Green oDA”KOICA defines Green ODA as ODA that includes a variety of projects in the fields of biodiversity conser-vation, climate change adaptation and combating desertification. It also includes development issues concerning water, forestry, energy, agriculture and the environment. KOICA specifies the range of Green ODA with reference to the CRS proposed by the OECD Development Assistance Committee (S.J. Kang 2011). Green ODA encompasses projects primarily centred on issues of climate change and the environment.
“Green Growth oDA”Green Growth ODA has a scope beyond issues of climate change and the environment. Korean green growth strategies reflect the practical and strategic dimensions of green growth, such as the promotion of new growth engines (environment-oriented industry) and improvement in the quality of life through “green living”. Green Growth ODA can thus be defined as assistance that nurtures the capacity of developing countries to cope with the climate change challenges, to create a springboard for constant economic growth with reduced environ-mental impacts, and to enable green lifestyles (S.J. Kang 2011).
“Water and Green Growth oDA”ODA for water and green growth programmes can be benchmarked from the above concepts. The definition of water and green growth ODA is referred to as the official development assistance that focuses on the diverse roles of water in economic growth and environ-mental protection, together with consideration of the complex uncertainties that characterize development scenarios, one of which is climate change. Illustration of the meaning of water and green growth ODA is to be found in the relevant CRS codes in Annex 2.
A MECHANISM FOR INTERNATIONAL COOpERATION IN WATER AND GREEN GROWTHWater and green growth can play a pivotal role as a policy tool for implementing the MDGs through a variety of structural measures (such as construction of water infrastructure, provision of equipment for water supply and sanitation services, financing of water projects) as well as non-structural measures (such as education and training for efficient operation of water service facilities, institutional reform, and establishment of policies and plans for sustainable water management).
Developing countries could benefit from either structural or non-structural measures if they committed themselves to a water and green growth policy. However, as has been the case with climate change negotiations, developing countries have appeared reluctant to adopt the norms established by developed countries. A large gap remains between developed and developing countries in approaches to environmental issues where issues of economic growth overlap with environmental concerns.
As mentioned in chapter 2, Munasinghe (2008) argues that green growth can be accomplished through international cooperation for sustainable development. As a practical solution, he has proposed the theory of “sustainomics” coupled with international cooperation. As shown in Figure 6, he has revised the Environmental Kuznets Curve and maintains that least-developed countries could achieve environmen-tally sound economic growth if they received advanced technologies and knowledge from developed countries through international cooperation. Such a window of opportunity would enable the least-developed countries to bypass the most damaging stage of indus-trialization for the environment and reach a good level of quality of life with a reduced impact on the environment (Munasinghe 2008).
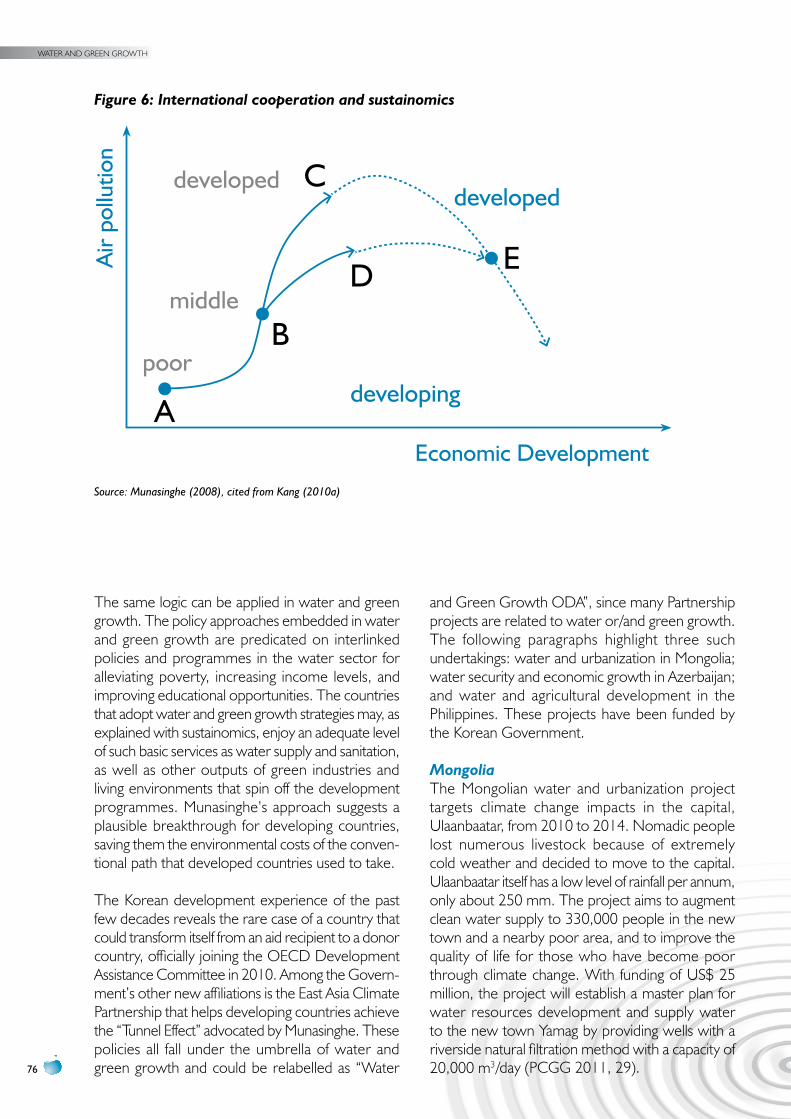
WATER AND GREEN GROWTH
76
Figure 6: International cooperation and sustainomicsA
ir po
llutio
n
Economic Development
developingpoor
middle
developeddeveloped
A
B
C
D E
Source: Munasinghe (2008), cited from Kang (2010a)
The same logic can be applied in water and green growth. The policy approaches embedded in water and green growth are predicated on interlinked policies and programmes in the water sector for alleviating poverty, increasing income levels, and improving educational opportunities. The countries that adopt water and green growth strategies may, as explained with sustainomics, enjoy an adequate level of such basic services as water supply and sanitation, as well as other outputs of green industries and living environments that spin off the development programmes. Munasinghe’s approach suggests a plausible breakthrough for developing countries, saving them the environmental costs of the conven-tional path that developed countries used to take.
The Korean development experience of the past few decades reveals the rare case of a country that could transform itself from an aid recipient to a donor country, officially joining the OECD Development Assistance Committee in 2010. Among the Govern-ment’s other new affiliations is the East Asia Climate Partnership that helps developing countries achieve the “Tunnel Effect” advocated by Munasinghe. These policies all fall under the umbrella of water and green growth and could be relabelled as “Water
and Green Growth ODA”, since many Partnership projects are related to water or/and green growth. The following paragraphs highlight three such undertakings: water and urbanization in Mongolia; water security and economic growth in Azerbaijan; and water and agricultural development in the Philippines. These projects have been funded by the Korean Government.
MongoliaThe Mongolian water and urbanization project targets climate change impacts in the capital, Ulaanbaatar, from 2010 to 2014. Nomadic people lost numerous livestock because of extremely cold weather and decided to move to the capital. Ulaanbaatar itself has a low level of rainfall per annum, only about 250 mm. The project aims to augment clean water supply to 330,000 people in the new town and a nearby poor area, and to improve the quality of life for those who have become poor through climate change. With funding of US$ 25 million, the project will establish a master plan for water resources development and supply water to the new town Yamag by providing wells with a riverside natural filtration method with a capacity of 20,000 m3/day (PCGG 2011, 29).
77
AzerbaijanThe second Partnership project targets water scarcity and contamination in Azerbaijan. The Kura-Araks River has been contaminated by chemical, industrial and radioactive pollutants. Moreover, water is scarce throughout the country and there are few groundwater resources. The severity of the situation could trigger transboundary water conflicts with upstream neighbours. In addition, rapid desertifi-cation threatens the northern part of the country. The project aims to:1) construct water and sewage facilities in eight
regions;2) construct wastewater reuse treatment facilities
with a capacity of 60,000 m3/day; and3) set up an IWRM system. The total cost of
the project is US$ 70 million over the period from 2010 to 2015 (PCGG 2011, 30; H. Kang 2011).
The PhilippinesThe water and agricultural development project in the Philippines also targets impacts of climate change: adverse effects of floods and droughts that have increased in frequency in recent years, and increase in the annual mean temperature over the last half a century that has accelerated evaporation from farmlands. Severe droughts triggered by El Niño have badly hit rice and corn production, putting many farmers in poverty. The project aims to construct water facilities, such as small and medium-sized dams less than 15m high, spillways, and irrigation channels, to help boost rice production; and an agricultural-industrial complex. The project is expected to cost up to US$ 20 million between 2010 and 2013. Part of the planned outcome is to help reinvigorate local economies by facilitating an influx of rural population into the agriculture-industrial complex (PCGG 2011, 31).
3.6 concLusion
This chapter has explored the concept of water and green growth and made policy suggestions on water and green growth. It has examined indicators for monitoring and suggested indicators for the WGGI. It will become a useful tool to evaluate the extent to which a country or community is committed to water and green growth.
The study has introduced the Korean green growth policy and suggested that a strategy for water and green growth should highlight environmental, economic and social dimensions, while continuing to emphasize the promotion of economic growth that has a lower impact on the environment.
Water and green growth is a new concept and strategy to tackle the complexity of development challenges in the fields of environmental protection, economics, industrialization, and social welfare as they relate to water. The research suggests that the most crucial principle in establishment of policies related to water and green growth is “integration”, similar to IWRM principles.
Finally, the chapter outlined a new concept of water and green growth ODA and recommended an international cooperative mechanism for water and green growth. The approach paves the way for the international community to collaborate on the enhancement of water management for greening development in times of uncertainty.
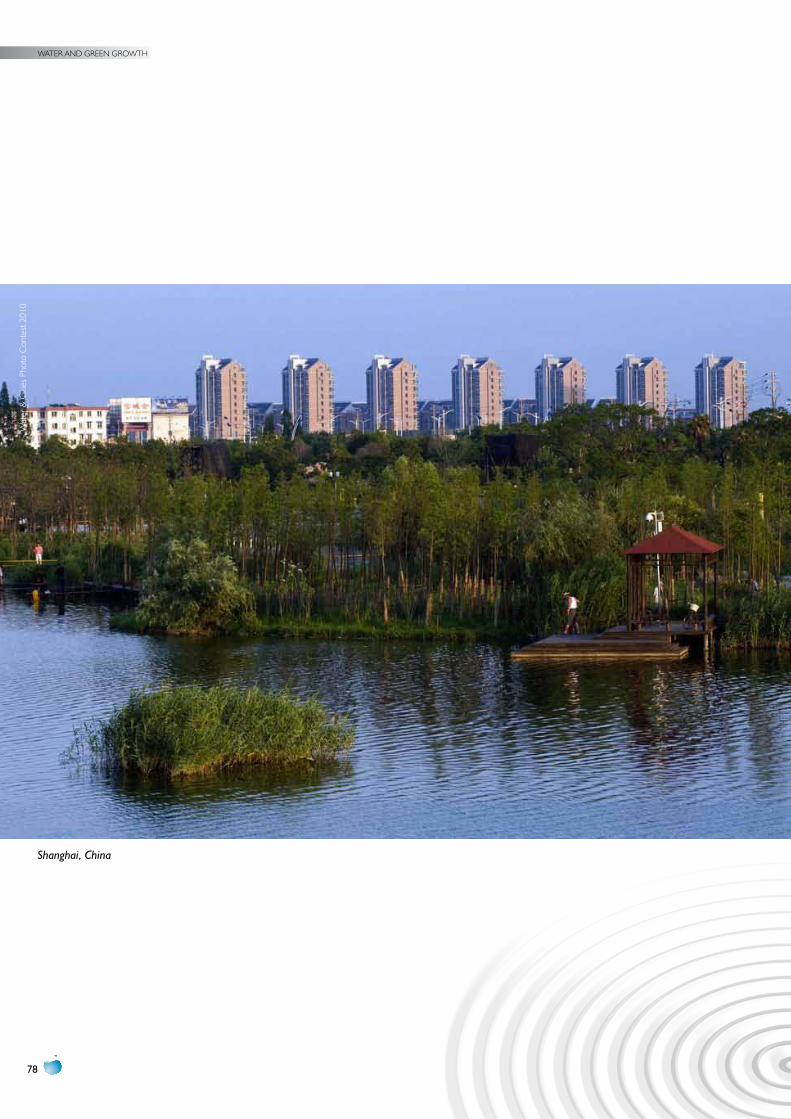
WATER AND GREEN GROWTH
78
Shanghai, China
Wat
er &
Citi
es P
hoto
Con
test
201
0
79
4. CASE STuDIES
4.1 MethodoLogy
A call for case studies of water and green growth was sounded in mid-2011 through the project Web site: www.waterandgreengrowth.org. Authors were asked to explain how their study constituted an example of green growth related to water resources, what type of green growth was achieved and how the growth was measured. Each case study had to give a brief history of its project from initial inception to the present day, along with proposed future activities. Authors had to describe their main sources of inspiration, where the funding and main support came from and how economic growth and environmental benefits were being measured. They had to identify the expected benefits from the projects, highlighting those directly coming from or affecting water, and the key obstacles (technological or political) and how they were overcome.
From the many case studies received and identified for this project, 26 were selected by an expert committee that were based on whether the cases would create an interesting narrative for policy-makers seeking a green way to combine their water and economic policies. The aim was to obtain a balance of case studies across regions, from developing, emerging and developed economies. The map in Figure 7 shows the distribution of the case studies referred to in this chapter, showing that green growth has a global reach.
The case studies were divided into subcategories that have facilitated the analysis necessary to develop the draft framework proposed in chapter 5. In reality,
each case study is complex in nature and demon-strates aspects of multiple categories. Case studies were therefore placed in the categories where they best relate to the analytical findings.
The categories used for analysis in the cases are:
A. Ecosystem recovery and water quality improvement
B. Watershed managementC. Policy, planning and governanceD. Financing and public–private partnershipsE. Innovation and technologyF. Infrastructure.
After the case analysis, core elements of green growth were examined, especially their environ-mental, economic, and social aspects. Possibilities for replication and transferability were explored in the final step. The analysis was combined with the theoretical analysis in chapters 2 and 3 as a beginning for a draft framework on water and green growth for policymakers in chapter 5.
Many more case studies relating to water and green growth were also identified on the Platform of Solutions (www.solutionsforwater.org) for the 6th World Water Forum to be held in 2012. Unfortu-nately the time has been insufficient to include them in the analysis for this edition. However, many of them will be included in the second edition of this report and placed them on the project Web site.
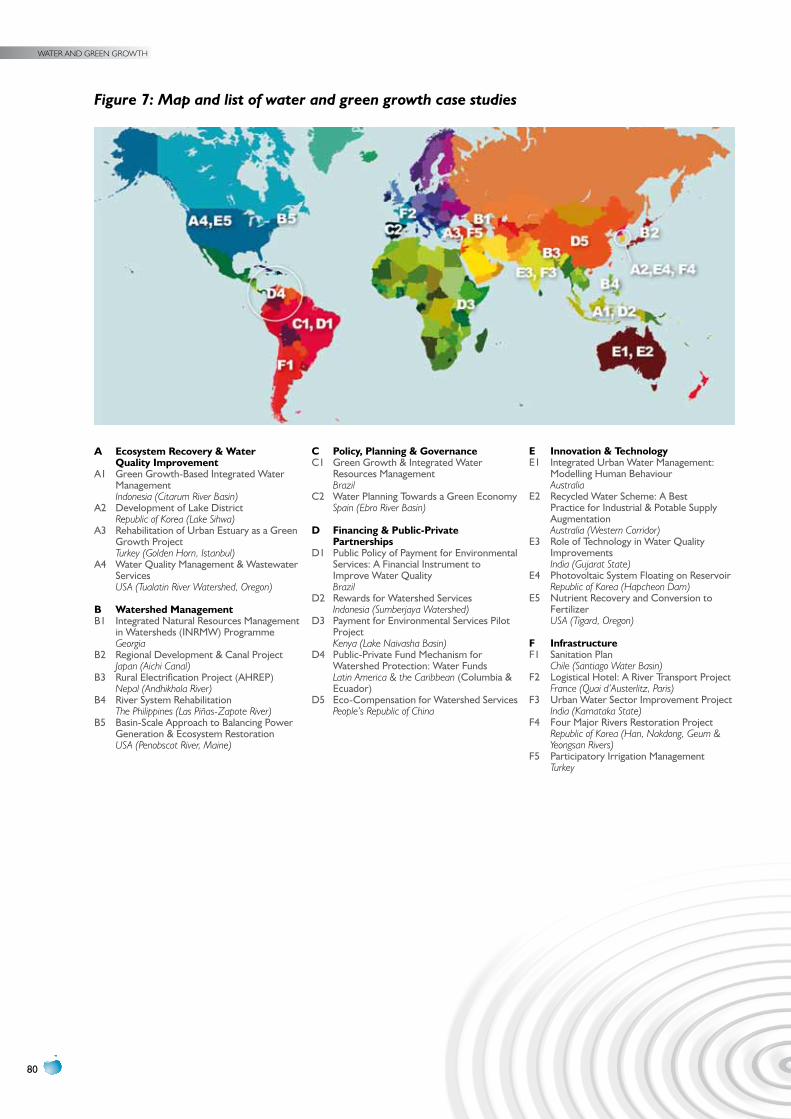
WATER AND GREEN GROWTH
80
Figure 7: Map and list of water and green growth case studies
A ecosystem Recovery & Water Quality improvement
A1 Green Growth-Based Integrated Water Management Indonesia (Citarum River Basin)
A2 Development of Lake District Republic of Korea (Lake Sihwa)
A3 Rehabilitation of urban Estuary as a Green Growth project Turkey (Golden Horn, Istanbul)
A4 Water Quality Management & Wastewater Services USA (Tualatin River Watershed, Oregon)
B Watershed ManagementB1 Integrated Natural Resources Management
in Watersheds (INRMW) programme Georgia
B2 Regional Development & Canal project Japan (Aichi Canal)
B3 Rural Electrification project (AHREp) Nepal (Andhikhola River)
B4 River System Rehabilitation The Philippines (Las Piñas-Zapote River)
B5 Basin-Scale Approach to Balancing power Generation & Ecosystem Restoration USA (Penobscot River, Maine)
c Policy, Planning & GovernanceC1 Green Growth & Integrated Water
Resources Management Brazil
C2 Water planning Towards a Green Economy Spain (Ebro River Basin)
D Financing & Public-Private Partnerships
D1 public policy of payment for Environmental Services: A Financial Instrument to Improve Water Quality Brazil
D2 Rewards for Watershed Services Indonesia (Sumberjaya Watershed)
D3 payment for Environmental Services pilot project Kenya (Lake Naivasha Basin)
D4 public-private Fund Mechanism for Watershed protection: Water Funds Latin America & the Caribbean (Columbia & Ecuador)
D5 Eco-Compensation for Watershed Services People’s Republic of China
e innovation & TechnologyE1 Integrated urban Water Management:
Modelling Human Behaviour Australia
E2 Recycled Water Scheme: A Best practice for Industrial & potable Supply Augmentation Australia (Western Corridor)
E3 Role of Technology in Water Quality Improvements India (Gujarat State)
E4 photovoltaic System Floating on Reservoir Republic of Korea (Hapcheon Dam)
E5 Nutrient Recovery and Conversion to Fertilizer USA (Tigard, Oregon)
F infrastructureF1 Sanitation plan
Chile (Santiago Water Basin)F2 Logistical Hotel: A River Transport project
France (Quai d’Austerlitz, Paris)F3 urban Water Sector Improvement project
India (Karnataka State)F4 Four Major Rivers Restoration project
Republic of Korea (Han, Nakdong, Geum & Yeongsan Rivers)
F5 participatory Irrigation Management Turkey
81
4.2. case study anaLysis
A. ECOSySTEM RECOvERy AND WATER QuALITy IMpROvEMENTResearch for this project has revealed how the value of ecosystem restoration efforts in promoting sustainable development has increas-ingly been recognized. Restoration of water-related ecosystems, together with water quality improve-ments, provide long-term benefits in terms of public health, economic growth, aesthetic, recreational and cultural amenities, and improved well-being and livelihoods.
For water-related ecosystems to remain viable in large urban areas, ecosystem restoration efforts must involve the community that relies on those resources. People living in the watershed area must support the efforts, which can become an engine for local economic growth. In urban areas, restored waterfronts can become lively and popular catalysts for economic growth and urban revitalization. When people are once again in touch with their rivers, lakes, and oceans as parts of larger ecosystems, they take better care of them in line with sustainable development principles.
The infrastructure project from the Republic of Korea (the Lake Sihwa case) describes a case of urban renewal based on recovery of the basin areas. The Government faced opposition from the population in the area until it created the Sihwa District Sustainable Development Council in 2004. The Council is a consultative group that engages the population living in the district, and the long-term development project has gained more support among the stakeholders and the Government has implemented projects suggested by the Council.
The case study from Istanbul, Turkey shows how a polluted urban waterway can be restored and become the centre of vibrant economic activity. The case study in Indonesia is working toward that same objective. Similar examples can be found for urban waterfronts ranging from the Hudson River in New York City (including Battery Park City and the World Financial Center) to Suzhou Creek in Shanghai, China (ADB 2010). Restoration of waterways is generally based on agreement with upstream residents to maintain plantings along the
river banks and to reduce siltation. Such agreements require sustained governmental commitment and enormous economic resources, but pay dividends far into the future. As seen in the Istanbul case study, the value of the restoration affects all aspects of life; it cannot be calculated in monetary terms alone.
Key factors for success•Political commitment from the top and local Government levels
•Targeting of the river or lake basin as the primary planning unit
•A multidisciplinary and multidimensional approach
•Support from national policy and legislation; collaboration among a wide variety of interests
•Financial support from both public and private investors
•Green infrastructure such as terraces and native species plantings
•Active participation by the community that will benefit from and contribute to the restoration
•Reliable baseline data and monitoring
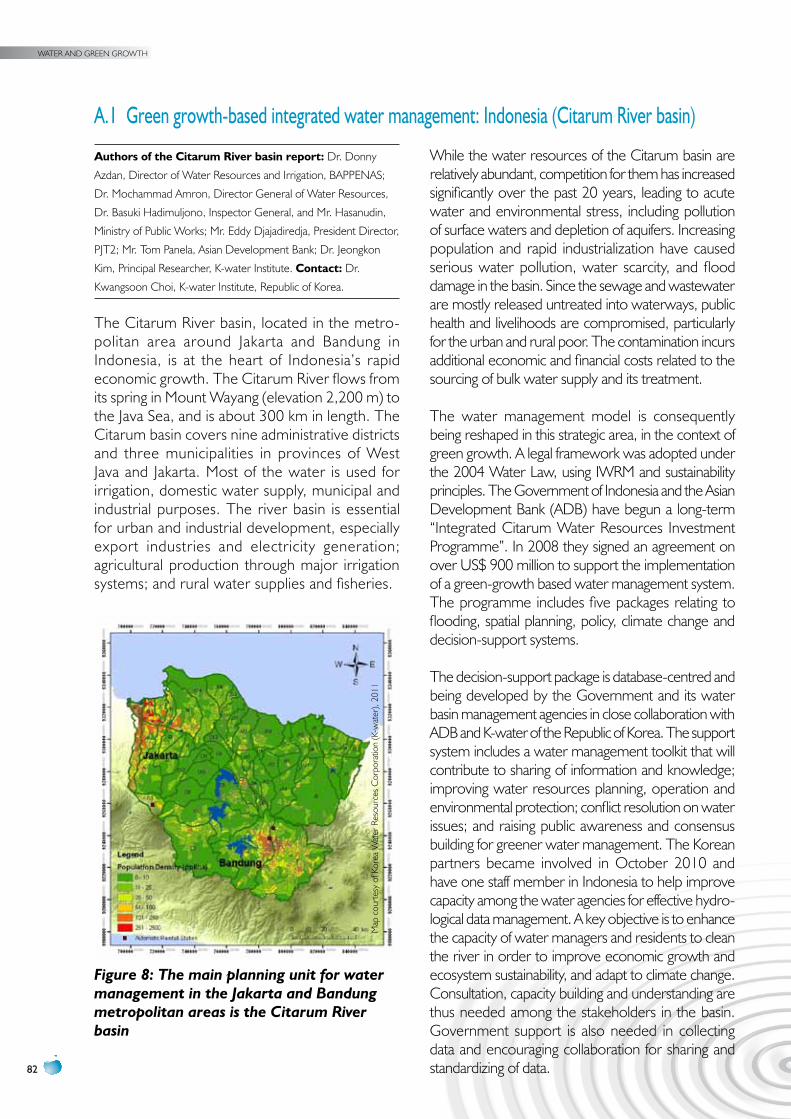
WATER AND GREEN GROWTH
82
A.1 Green growth-based integrated water management: Indonesia (Citarum River basin)
Authors of the citarum River basin report: Dr. Donny
Azdan, Director of Water Resources and Irrigation, BAPPENAS;
Dr. Mochammad Amron, Director General of Water Resources,
Dr. Basuki Hadimuljono, Inspector General, and Mr. Hasanudin,
Ministry of Public Works; Mr. Eddy Djajadiredja, President Director,
PJT2; Mr. Tom Panela, Asian Development Bank; Dr. Jeongkon
Kim, Principal Researcher, K-water Institute. contact: Dr.
Kwangsoon Choi, K-water Institute, Republic of Korea.
The Citarum River basin, located in the metro-politan area around Jakarta and Bandung in Indonesia, is at the heart of Indonesia’s rapid economic growth. The Citarum River flows from its spring in Mount Wayang (elevation 2,200 m) to the Java Sea, and is about 300 km in length. The Citarum basin covers nine administrative districts and three municipalities in provinces of West Java and Jakarta. Most of the water is used for irrigation, domestic water supply, municipal and industrial purposes. The river basin is essential for urban and industrial development, especially export industries and electricity generation; agricultural production through major irrigation systems; and rural water supplies and fisheries.
While the water resources of the Citarum basin are relatively abundant, competition for them has increased significantly over the past 20 years, leading to acute water and environmental stress, including pollution of surface waters and depletion of aquifers. Increasing population and rapid industrialization have caused serious water pollution, water scarcity, and flood damage in the basin. Since the sewage and wastewater are mostly released untreated into waterways, public health and livelihoods are compromised, particularly for the urban and rural poor. The contamination incurs additional economic and financial costs related to the sourcing of bulk water supply and its treatment.
The water management model is consequently being reshaped in this strategic area, in the context of green growth. A legal framework was adopted under the 2004 Water Law, using IWRM and sustainability principles. The Government of Indonesia and the Asian Development Bank (ADB) have begun a long-term “Integrated Citarum Water Resources Investment Programme”. In 2008 they signed an agreement on over US$ 900 million to support the implementation of a green-growth based water management system. The programme includes five packages relating to flooding, spatial planning, policy, climate change and decision-support systems.
The decision-support package is database-centred and being developed by the Government and its water basin management agencies in close collaboration with ADB and K-water of the Republic of Korea. The support system includes a water management toolkit that will contribute to sharing of information and knowledge; improving water resources planning, operation and environmental protection; conflict resolution on water issues; and raising public awareness and consensus building for greener water management. The Korean partners became involved in October 2010 and have one staff member in Indonesia to help improve capacity among the water agencies for effective hydro-logical data management. A key objective is to enhance the capacity of water managers and residents to clean the river in order to improve economic growth and ecosystem sustainability, and adapt to climate change. Consultation, capacity building and understanding are thus needed among the stakeholders in the basin. Government support is also needed in collecting data and encouraging collaboration for sharing and standardizing of data.
Figure 8: The main planning unit for water management in the Jakarta and Bandung metropolitan areas is the Citarum River basin
Map
cou
rtesy
of K
orea
Wat
er R
esou
rces
Cor
pora
tion
(K-w
ater
), 20
11
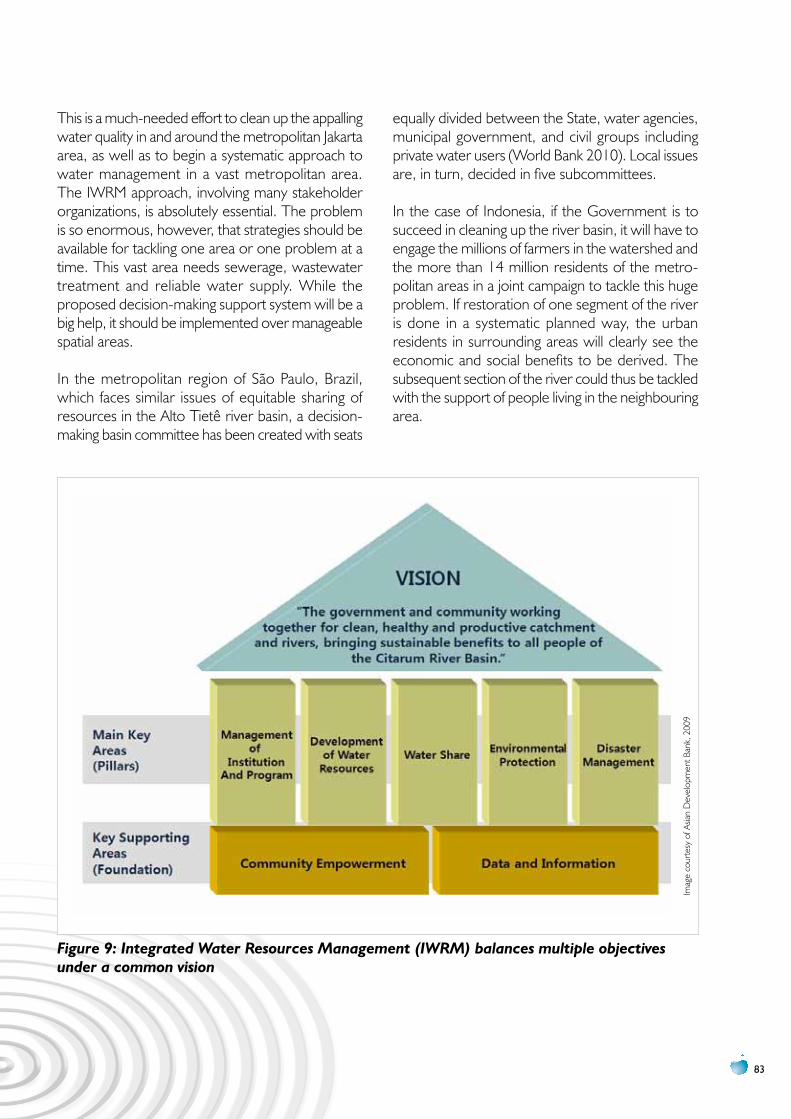
83
This is a much-needed effort to clean up the appalling water quality in and around the metropolitan Jakarta area, as well as to begin a systematic approach to water management in a vast metropolitan area. The IWRM approach, involving many stakeholder organizations, is absolutely essential. The problem is so enormous, however, that strategies should be available for tackling one area or one problem at a time. This vast area needs sewerage, wastewater treatment and reliable water supply. While the proposed decision-making support system will be a big help, it should be implemented over manageable spatial areas.
In the metropolitan region of São Paulo, Brazil, which faces similar issues of equitable sharing of resources in the Alto Tietê river basin, a decision-making basin committee has been created with seats
equally divided between the State, water agencies, municipal government, and civil groups including private water users (World Bank 2010). Local issues are, in turn, decided in five subcommittees.
In the case of Indonesia, if the Government is to succeed in cleaning up the river basin, it will have to engage the millions of farmers in the watershed and the more than 14 million residents of the metro-politan areas in a joint campaign to tackle this huge problem. If restoration of one segment of the river is done in a systematic planned way, the urban residents in surrounding areas will clearly see the economic and social benefits to be derived. The subsequent section of the river could thus be tackled with the support of people living in the neighbouring area.
Figure 9: Integrated Water Resources Management (IWRM) balances multiple objectives under a common vision
Imag
e co
urte
sy o
f Asia
n D
evel
opm
ent B
ank,
200
9
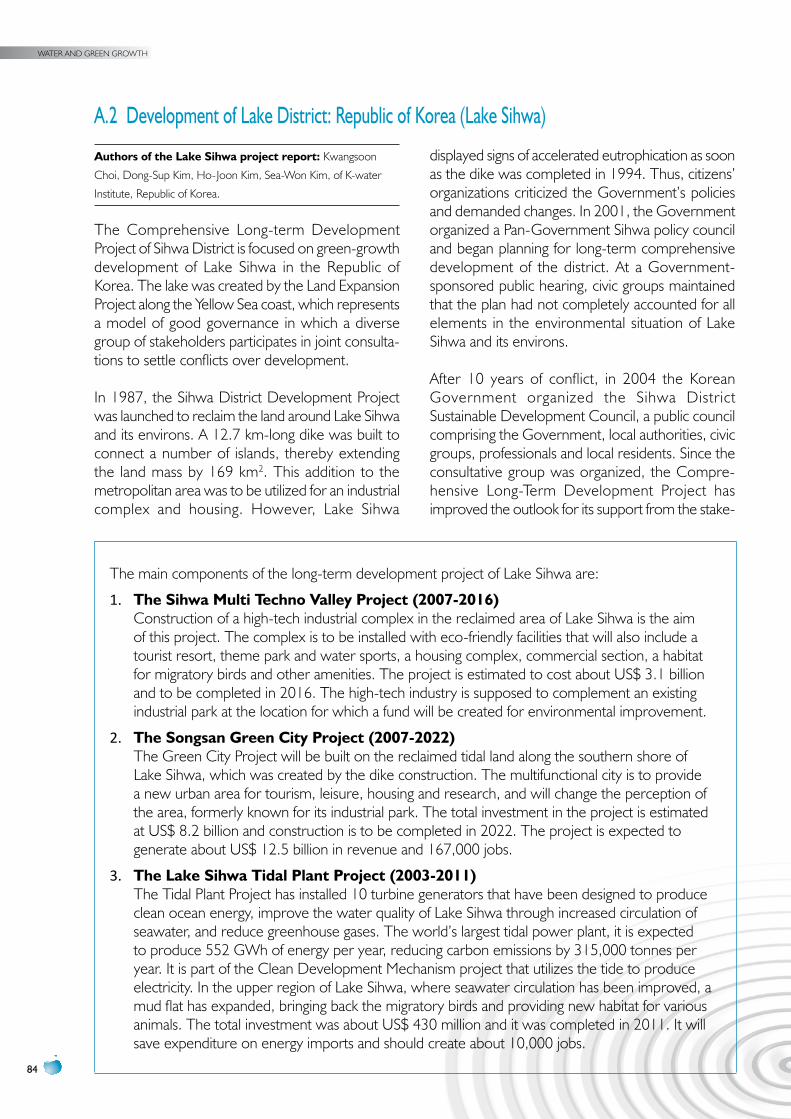
WATER AND GREEN GROWTH
84
A.2 Development of Lake District: Republic of Korea (Lake Sihwa)
Authors of the Lake Sihwa project report: Kwangsoon
Choi, Dong-Sup Kim, Ho-Joon Kim, Sea-Won Kim, of K-water
Institute, Republic of Korea.
The Comprehensive Long-term Development Project of Sihwa District is focused on green-growth development of Lake Sihwa in the Republic of Korea. The lake was created by the Land Expansion Project along the Yellow Sea coast, which represents a model of good governance in which a diverse group of stakeholders participates in joint consulta-tions to settle conflicts over development.
In 1987, the Sihwa District Development Project was launched to reclaim the land around Lake Sihwa and its environs. A 12.7 km-long dike was built to connect a number of islands, thereby extending the land mass by 169 km2. This addition to the metropolitan area was to be utilized for an industrial complex and housing. However, Lake Sihwa
displayed signs of accelerated eutrophication as soon as the dike was completed in 1994. Thus, citizens’ organizations criticized the Government’s policies and demanded changes. In 2001, the Government organized a Pan-Government Sihwa policy council and began planning for long-term comprehensive development of the district. At a Government-sponsored public hearing, civic groups maintained that the plan had not completely accounted for all elements in the environmental situation of Lake Sihwa and its environs.
After 10 years of conflict, in 2004 the Korean Government organized the Sihwa District Sustainable Development Council, a public council comprising the Government, local authorities, civic groups, professionals and local residents. Since the consultative group was organized, the Compre-hensive Long-Term Development Project has improved the outlook for its support from the stake-
The main components of the long-term development project of Lake Sihwa are:
1. The Sihwa Multi Techno Valley Project (2007-2016)Construction of a high-tech industrial complex in the reclaimed area of Lake Sihwa is the aim of this project. The complex is to be installed with eco-friendly facilities that will also include a tourist resort, theme park and water sports, a housing complex, commercial section, a habitat for migratory birds and other amenities. The project is estimated to cost about US$ 3.1 billion and to be completed in 2016. The high-tech industry is supposed to complement an existing industrial park at the location for which a fund will be created for environmental improvement.
2. The Songsan Green city Project (2007-2022)The Green City Project will be built on the reclaimed tidal land along the southern shore of Lake Sihwa, which was created by the dike construction. The multifunctional city is to provide a new urban area for tourism, leisure, housing and research, and will change the perception of the area, formerly known for its industrial park. The total investment in the project is estimated at US$ 8.2 billion and construction is to be completed in 2022. The project is expected to generate about US$ 12.5 billion in revenue and 167,000 jobs.
3. The Lake Sihwa Tidal Plant Project (2003-2011)The Tidal Plant Project has installed 10 turbine generators that have been designed to produce clean ocean energy, improve the water quality of Lake Sihwa through increased circulation of seawater, and reduce greenhouse gases. The world’s largest tidal power plant, it is expected to produce 552 GWh of energy per year, reducing carbon emissions by 315,000 tonnes per year. It is part of the Clean Development Mechanism project that utilizes the tide to produce electricity. In the upper region of Lake Sihwa, where seawater circulation has been improved, a mud flat has expanded, bringing back the migratory birds and providing new habitat for various animals. The total investment was about US$ 430 million and it was completed in 2011. It will save expenditure on energy imports and should create about 10,000 jobs.
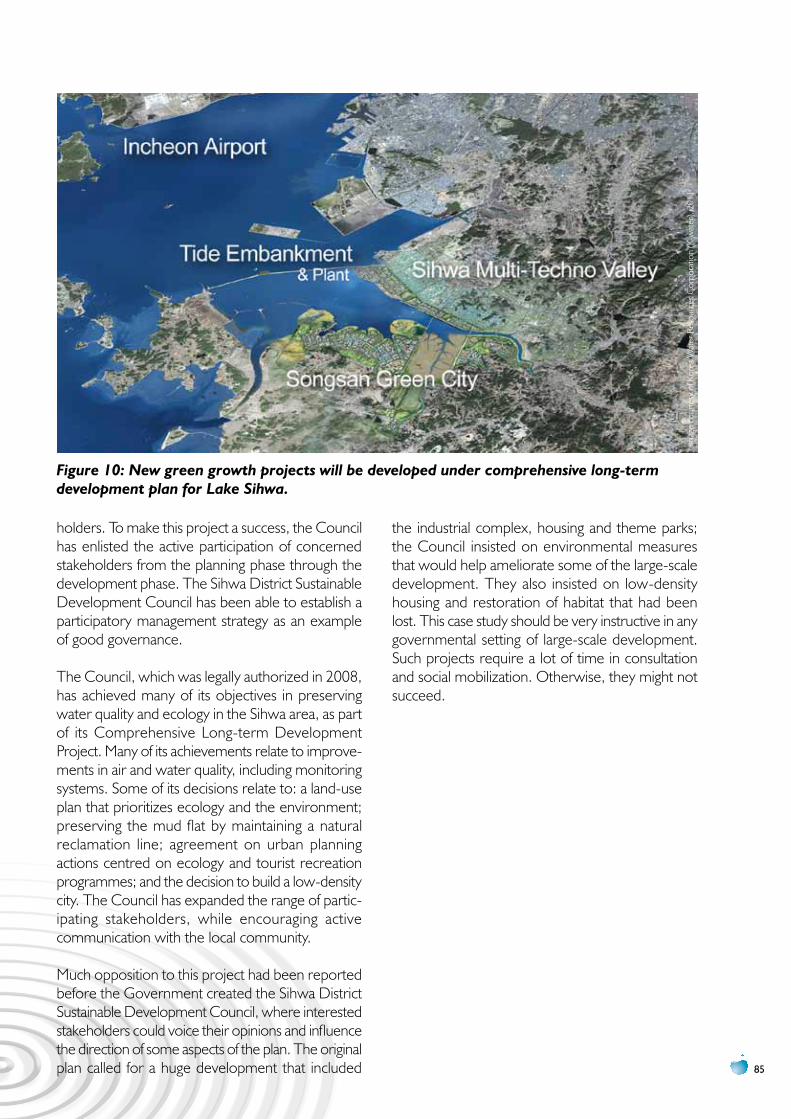
85
holders. To make this project a success, the Council has enlisted the active participation of concerned stakeholders from the planning phase through the development phase. The Sihwa District Sustainable Development Council has been able to establish a participatory management strategy as an example of good governance.
The Council, which was legally authorized in 2008, has achieved many of its objectives in preserving water quality and ecology in the Sihwa area, as part of its Comprehensive Long-term Development Project. Many of its achievements relate to improve-ments in air and water quality, including monitoring systems. Some of its decisions relate to: a land-use plan that prioritizes ecology and the environment; preserving the mud flat by maintaining a natural reclamation line; agreement on urban planning actions centred on ecology and tourist recreation programmes; and the decision to build a low-density city. The Council has expanded the range of partic-ipating stakeholders, while encouraging active communication with the local community.
Much opposition to this project had been reported before the Government created the Sihwa District Sustainable Development Council, where interested stakeholders could voice their opinions and influence the direction of some aspects of the plan. The original plan called for a huge development that included
the industrial complex, housing and theme parks; the Council insisted on environmental measures that would help ameliorate some of the large-scale development. They also insisted on low-density housing and restoration of habitat that had been lost. This case study should be very instructive in any governmental setting of large-scale development. Such projects require a lot of time in consultation and social mobilization. Otherwise, they might not succeed.
Figure 10: New green growth projects will be developed under comprehensive long-term development plan for Lake Sihwa.
Imag
e co
urte
sy o
f Kor
ea W
ater
Res
ourc
es C
orpo
ratio
n (K
-wat
er),
2011
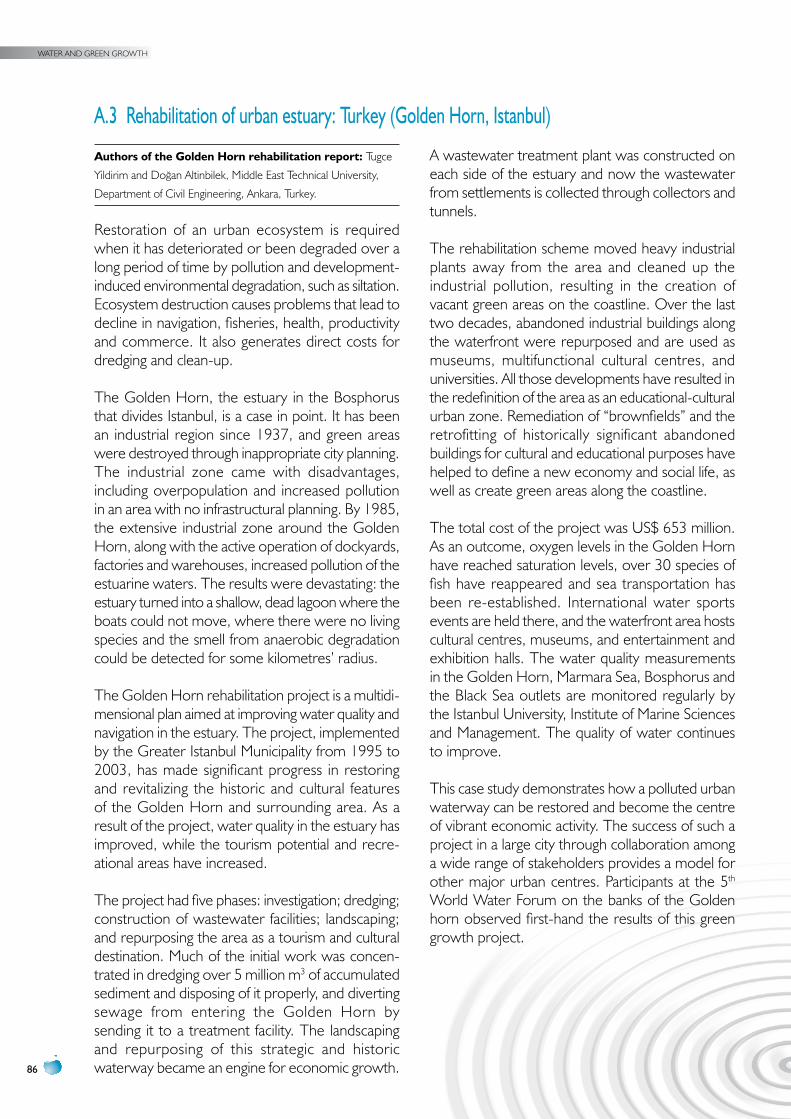
WATER AND GREEN GROWTH
86
A.3 Rehabilitation of urban estuary: Turkey (Golden Horn, Istanbul)
Authors of the Golden horn rehabilitation report: Tugce
Yildirim and Doğan Altinbilek, Middle East Technical University,
Department of Civil Engineering, Ankara, Turkey.
Restoration of an urban ecosystem is required when it has deteriorated or been degraded over a long period of time by pollution and development-induced environmental degradation, such as siltation. Ecosystem destruction causes problems that lead to decline in navigation, fisheries, health, productivity and commerce. It also generates direct costs for dredging and clean-up.
The Golden Horn, the estuary in the Bosphorus that divides Istanbul, is a case in point. It has been an industrial region since 1937, and green areas were destroyed through inappropriate city planning. The industrial zone came with disadvantages, including overpopulation and increased pollution in an area with no infrastructural planning. By 1985, the extensive industrial zone around the Golden Horn, along with the active operation of dockyards, factories and warehouses, increased pollution of the estuarine waters. The results were devastating: the estuary turned into a shallow, dead lagoon where the boats could not move, where there were no living species and the smell from anaerobic degradation could be detected for some kilometres’ radius.
The Golden Horn rehabilitation project is a multidi-mensional plan aimed at improving water quality and navigation in the estuary. The project, implemented by the Greater Istanbul Municipality from 1995 to 2003, has made significant progress in restoring and revitalizing the historic and cultural features of the Golden Horn and surrounding area. As a result of the project, water quality in the estuary has improved, while the tourism potential and recre-ational areas have increased.
The project had five phases: investigation; dredging; construction of wastewater facilities; landscaping; and repurposing the area as a tourism and cultural destination. Much of the initial work was concen-trated in dredging over 5 million m3 of accumulated sediment and disposing of it properly, and diverting sewage from entering the Golden Horn by sending it to a treatment facility. The landscaping and repurposing of this strategic and historic waterway became an engine for economic growth.
A wastewater treatment plant was constructed on each side of the estuary and now the wastewater from settlements is collected through collectors and tunnels.
The rehabilitation scheme moved heavy industrial plants away from the area and cleaned up the industrial pollution, resulting in the creation of vacant green areas on the coastline. Over the last two decades, abandoned industrial buildings along the waterfront were repurposed and are used as museums, multifunctional cultural centres, and universities. All those developments have resulted in the redefinition of the area as an educational-cultural urban zone. Remediation of “brownfields” and the retrofitting of historically significant abandoned buildings for cultural and educational purposes have helped to define a new economy and social life, as well as create green areas along the coastline.
The total cost of the project was US$ 653 million. As an outcome, oxygen levels in the Golden Horn have reached saturation levels, over 30 species of fish have reappeared and sea transportation has been re-established. International water sports events are held there, and the waterfront area hosts cultural centres, museums, and entertainment and exhibition halls. The water quality measurements in the Golden Horn, Marmara Sea, Bosphorus and the Black Sea outlets are monitored regularly by the Istanbul University, Institute of Marine Sciences and Management. The quality of water continues to improve.
This case study demonstrates how a polluted urban waterway can be restored and become the centre of vibrant economic activity. The success of such a project in a large city through collaboration among a wide range of stakeholders provides a model for other major urban centres. Participants at the 5th World Water Forum on the banks of the Golden horn observed first-hand the results of this green growth project.
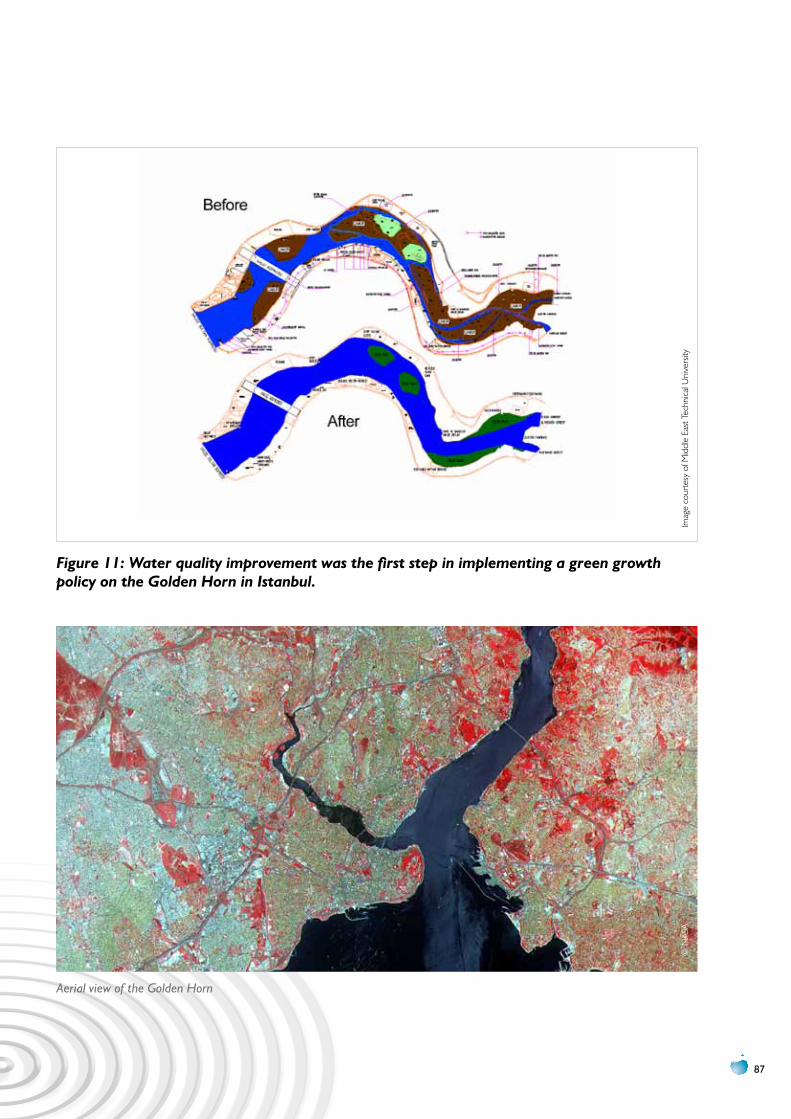
87
Figure 11: Water quality improvement was the first step in implementing a green growth policy on the Golden Horn in Istanbul.
Imag
e co
urte
sy o
f Mid
dle
East
Tec
hnica
l Uni
vers
ity
Aerial view of the Golden Horn
© N
ASA
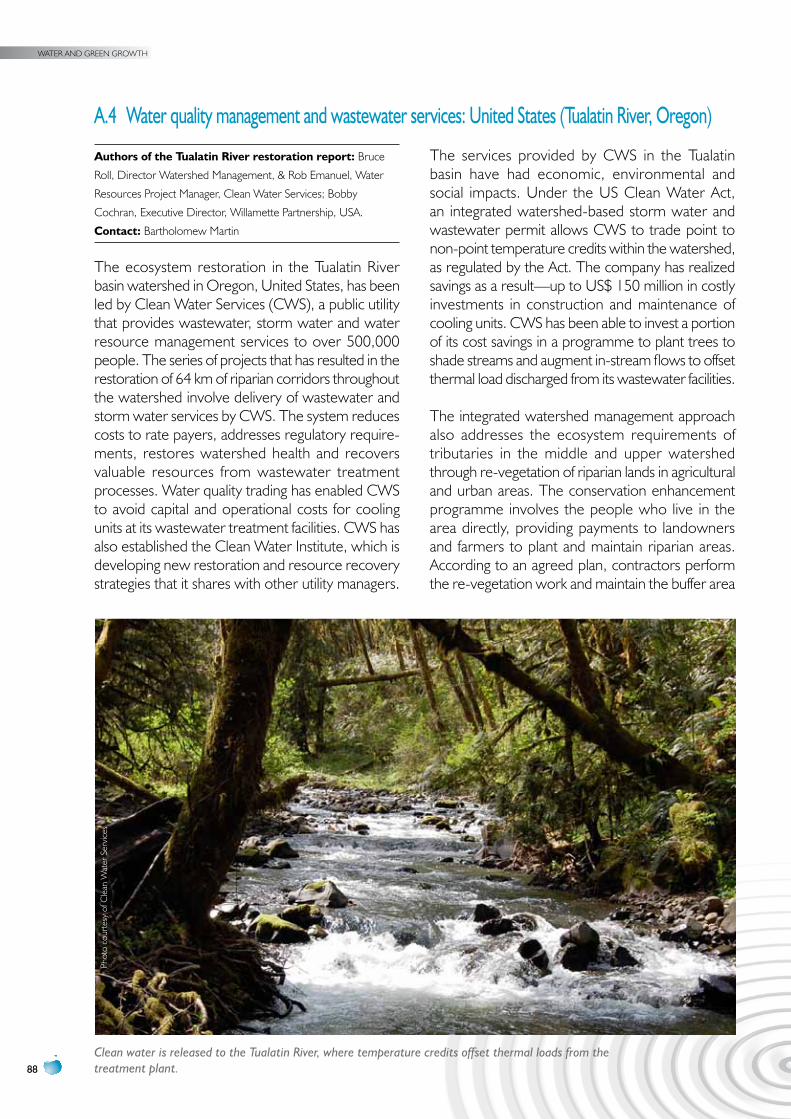
WATER AND GREEN GROWTH
88
A.4 Water quality management and wastewater services: united States (Tualatin River, Oregon)
Authors of the Tualatin River restoration report: Bruce
Roll, Director Watershed Management, & Rob Emanuel, Water
Resources Project Manager, Clean Water Services; Bobby
Cochran, Executive Director, Willamette Partnership, USA.
contact: Bartholomew Martin
The ecosystem restoration in the Tualatin River basin watershed in Oregon, United States, has been led by Clean Water Services (CWS), a public utility that provides wastewater, storm water and water resource management services to over 500,000 people. The series of projects that has resulted in the restoration of 64 km of riparian corridors throughout the watershed involve delivery of wastewater and storm water services by CWS. The system reduces costs to rate payers, addresses regulatory require-ments, restores watershed health and recovers valuable resources from wastewater treatment processes. Water quality trading has enabled CWS to avoid capital and operational costs for cooling units at its wastewater treatment facilities. CWS has also established the Clean Water Institute, which is developing new restoration and resource recovery strategies that it shares with other utility managers.
The services provided by CWS in the Tualatin basin have had economic, environmental and social impacts. Under the US Clean Water Act, an integrated watershed-based storm water and wastewater permit allows CWS to trade point to non-point temperature credits within the watershed, as regulated by the Act. The company has realized savings as a result—up to US$ 150 million in costly investments in construction and maintenance of cooling units. CWS has been able to invest a portion of its cost savings in a programme to plant trees to shade streams and augment in-stream flows to offset thermal load discharged from its wastewater facilities.
The integrated watershed management approach also addresses the ecosystem requirements of tributaries in the middle and upper watershed through re-vegetation of riparian lands in agricultural and urban areas. The conservation enhancement programme involves the people who live in the area directly, providing payments to landowners and farmers to plant and maintain riparian areas. According to an agreed plan, contractors perform the re-vegetation work and maintain the buffer area
Clean water is released to the Tualatin River, where temperature credits offset thermal loads from thetreatment plant.
Phot
o co
urte
sy o
f Cle
an W
ater
Ser
vice
s
89
during the life of the enrolment contract (from 10 to 15 years) in return for an initial lump sum payment plus annual payments per acre. Besides providing a livelihood to people in the area, planting riparian areas with native species yields multiple ecological benefits including nutrient cycling, filtration and purification of water, groundwater recharge, flood protection, maintenance of stream flows and temperatures, and the maintenance of habitats for fish and wildlife.
In urban areas, another programme focuses on planting trees and shrubs along urban streams. Cities agree to annual planting targets that identify the number of trees each city is willing to plant by 2025. CWS supplies resources in the form of planting standards, site preparation, native plant stock, and limited monitoring and maintenance services. Two environmental organizations work with the member cities on project oversight, volunteer recruitment, and publicizing planting events.
These programmes have resulted in an overall improvement in the health of the Tualatin River watershed. The lessons learned form the basis
of a collaborative and cost-effective watershed-based management strategy. The case study shows that a public utility can drive sustainable solutions to watershed protection, through wastewater treatment and replanting along rural and urban waterways. The company is self-financing; it supports integrated water resources management and involves stakeholders up and downstream. It appears to be sustainable in the long-term and supports green growth in the area through job and income creation. Planting local species has led to a revitalization of fish and wildlife. This type of scheme could probably be implemented with the support of community leaders and/or women’s groups in other watershed areas.
Similar programmes, including trading of temperature credits and payments for ecosystem services, could be used in other countries where clear environ-mental regulations, consistent incentive policies and enforcement exist. That might be the case in Argentina, Brazil and Chile. Where such national regulations are in place to protect natural resources, and are applied consistently, the likelihood of success increases for a trading programme.
Common ElementsAs the four case studies indicate, specific basic elements are required to make a reality of ecosystem recovery and water quality improvement:
•Political commitment from the top and from local authorities or municipality•River or water basin as the primary unit for planning•Multidimensional projects (with economic, social and environmental impacts) that build on the goal of cleaning up a polluted waterway
•Support from national policy and legislation (e.g., Clean Water Act of 1972)•Collaboration among a wide variety of interests, led by public utilities, in mobilizing resources to restore an invaluable ecological asset
•Financial support from both public and private investors•Green infrastructure approaches, such as construction of terraces and infiltration basins, planting native species along river banks, reforestation of protected areas
•Active participation by the community and citizens to contribute to and benefit from the restoration of the ecosystem, improved water quality and restoration of wildlife and fish habitat
•Reliable baseline data and monitoring.
ÎÎ environmental benefits: Improved clean water, flood protection, restoration of fish and wildlife habitat, biodiversity.ÎÎ economic benefits: Job creation, waterfront development as an engine of growth in cities, reduction in public health costs.ÎÎ Social benefits: Reduced water-borne disease, clean public spaces, improved livelihoods.
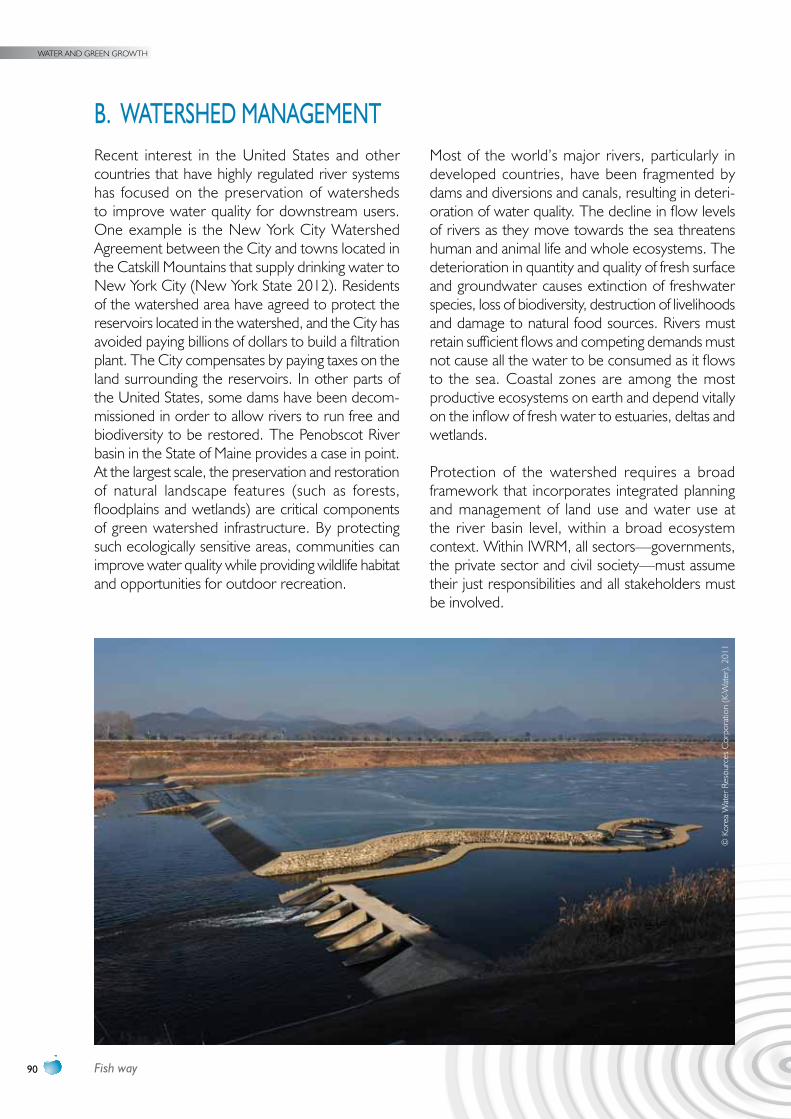
WATER AND GREEN GROWTH
90
B. WATERSHED MANAGEMENTRecent interest in the United States and other countries that have highly regulated river systems has focused on the preservation of watersheds to improve water quality for downstream users. One example is the New York City Watershed Agreement between the City and towns located in the Catskill Mountains that supply drinking water to New York City (New York State 2012). Residents of the watershed area have agreed to protect the reservoirs located in the watershed, and the City has avoided paying billions of dollars to build a filtration plant. The City compensates by paying taxes on the land surrounding the reservoirs. In other parts of the United States, some dams have been decom-missioned in order to allow rivers to run free and biodiversity to be restored. The Penobscot River basin in the State of Maine provides a case in point. At the largest scale, the preservation and restoration of natural landscape features (such as forests, floodplains and wetlands) are critical components of green watershed infrastructure. By protecting such ecologically sensitive areas, communities can improve water quality while providing wildlife habitat and opportunities for outdoor recreation.
Most of the world’s major rivers, particularly in developed countries, have been fragmented by dams and diversions and canals, resulting in deteri-oration of water quality. The decline in flow levels of rivers as they move towards the sea threatens human and animal life and whole ecosystems. The deterioration in quantity and quality of fresh surface and groundwater causes extinction of freshwater species, loss of biodiversity, destruction of livelihoods and damage to natural food sources. Rivers must retain sufficient flows and competing demands must not cause all the water to be consumed as it flows to the sea. Coastal zones are among the most productive ecosystems on earth and depend vitally on the inflow of fresh water to estuaries, deltas and wetlands.
Protection of the watershed requires a broad framework that incorporates integrated planning and management of land use and water use at the river basin level, within a broad ecosystem context. Within IWRM, all sectors—governments, the private sector and civil society—must assume their just responsibilities and all stakeholders must be involved.
Fish way
© K
orea
Wat
er R
esou
rces
Cor
pora
tion
(K-W
ater
), 20
11
91
As the case studies in this section show, it is possible to improve and protect watersheds where all the stakeholders are involved. The cases range from industrialized urban areas in Japan and the Philippines to rural watersheds in Georgia, Nepal and the United States. They indicate that it is possible to manage and protect watersheds to ensure water quality and quantity to people throughout the basin. The protection of the watershed has led to green growth in both upstream and downstream areas.
The cases illustrate the strong participation of users and farmers in the watershed areas, as well as collaboration with municipalities and local authorities downstream to share in the benefits of green growth. The case study from the country of Georgia illustrates the process and importance of social mobilization in involving people in sustainable management of natural resources—clearly, people are key to protection of the watershed. In addition, the results of the initial data gathering and consul-tative process can influence changes in existing policies that better reflect the need for watershed protection.
The Penobscot restoration project is relevant for regions that are undergoing new dam development. The key point is that a river basin-scale approach can reveal a broader set of potential solutions for balancing benefits than can be achieved when dams are examined project by project. The project resulted in a new configuration of dams that will provide slightly more energy but will be dramati-cally superior for fish populations. It would have
been better if decision-makers for the Penobscot had been presented with these two alternative configurations a century ago, before the dams were first constructed. Decisions that influence dam siting and operation—such as planning, environmental review and licensing—should be made within a system-scale or river basin-scale framework that fully integrates information on environmental and social resources.
To benefit fully from participation of the people living in the watershed area, it is important to engage both women and men in water management. The case presented from the Philippines shows that over 60% of the 9,000 residents from the various communities along the river who were trained on ecological solid waste and river management were female. Watershed protection and water management require equal participation by all—men and women—to succeed.
Key factors for success•Strong political leadership•River basin approach to better balance benefits across all uses
•Public participation in water management•A solid expert organization to support local water managers
•Training and education for men and women on river rehabilitation and protection
•Economic opportunities for industry, small-scale enterprises and employment
WATER AND GREEN GROWTH
92
B.1 Integrated Natural Resources Management in Watersheds programme: Georgia
Author of the Georgian watersheds report: Ryan Stoa,
Programme Executive Officer, Global Water for Sustainability
(GLOWS) Programme.
The country of Georgia has recently started to implement its Integrated Natural Resources Management in Watersheds of Georgia Programme, to help its citizens improve their lives by managing natural resources sustainably. Funded by the United States Agency for International Development (USAID), the Programme aims to introduce innovative and practical participatory approaches to integrated natural resources management in selected watersheds. The approaches involve reform and harmonization of national policies and building the capacity of national and regional institu-tions to replicate those approaches throughout the country.
Although Georgia is a country rich in natural resources, it has not adopted clear green growth policies, environmental laws and regulations governing pollution and natural resources conser-vation. Many surface waters are severely polluted, forests are illegally logged, and grasslands are overgrazed. Inappropriate irrigation and agricul-tural practices have degraded large areas of arable land through erosion and salination of soils. The combined effects of these impacts are: (a) widespread depletion of the natural resource base and ecosystem services on which Georgia depends for sustainable development and green growth; and (b) increased vulnerability to immediate natural disasters and longer-term climate change.
The Georgia Programme has been designed to respond to that situation. The initial stages have focused on gathering information and conducting assessments in the Rioni and Alazani-Iori River basins to ensure that proposed local and national activities are well-informed and organized for maximum impact. High-level scientific experts from Georgia have been engaged in the assessment. The proposed activities are supposed to engage stakeholders (governmental, civil society and private sector) at multiple levels, build capacity and transfer knowledge. With the information accumulated so far, participatory resource planning activities are being initiated in the watersheds of these two river basins and will move to community- and watershed-level implementation.
The selection of pilot watershed areas was highly consultative, with participation from Programme partners, representatives of other USAID programmes, and central and local authorities. Thirty-one communities were identified in upper watershed areas, and are being engaged in managing their natural resources. Lessons learned during the initial period, taking into account national policy and institutional assessments, will be the basis for reforming existing policy and institutional frameworks. Meetings were conducted with all 31 communities and municipal authorities to identify natural resources management issues. Expert teams are also being formed for detailed watershed assessments and other tasks.
Young people are being involved in the Programme through “ecoclub” activities in 20 secondary schools in the upper watershed areas of the pilot basins. Selected students and teachers were trained in various environment-related issues; the ecoclubs then developed a number of proposals to be supported by the programme. The ecoclub component has created a popular Facebook blog where students express their views on environ-mental issues. Dialogue has been enthusiastic between Programme staff and local authorities and municipalities. The programme team and a network of supermarkets have agreed to organize joint education/awareness tours for students.
The first half of 2012 will be dedicated to imple-menting small grants to selected communities in the pilot areas. In parallel, the team will move to pilot municipalities in the lower watershed areas to identify and select targeted communities for further engagement and to conduct detailed assessments of downstream pilot areas.
The Programme is expected to yield such green growth outcomes as (a) protection of watershed ecosystems; (b) improvements in water quality; (c) reduction in vulnerability to climate change; and (d) improved energy efficiency. Local communities and authorities will become involved in natural resource management through local governance mechanisms that they define. Particular attention will be paid to developing productive uses of resources or income generating activities linked to conser-vation. A multi-stakeholder learning alliance will also
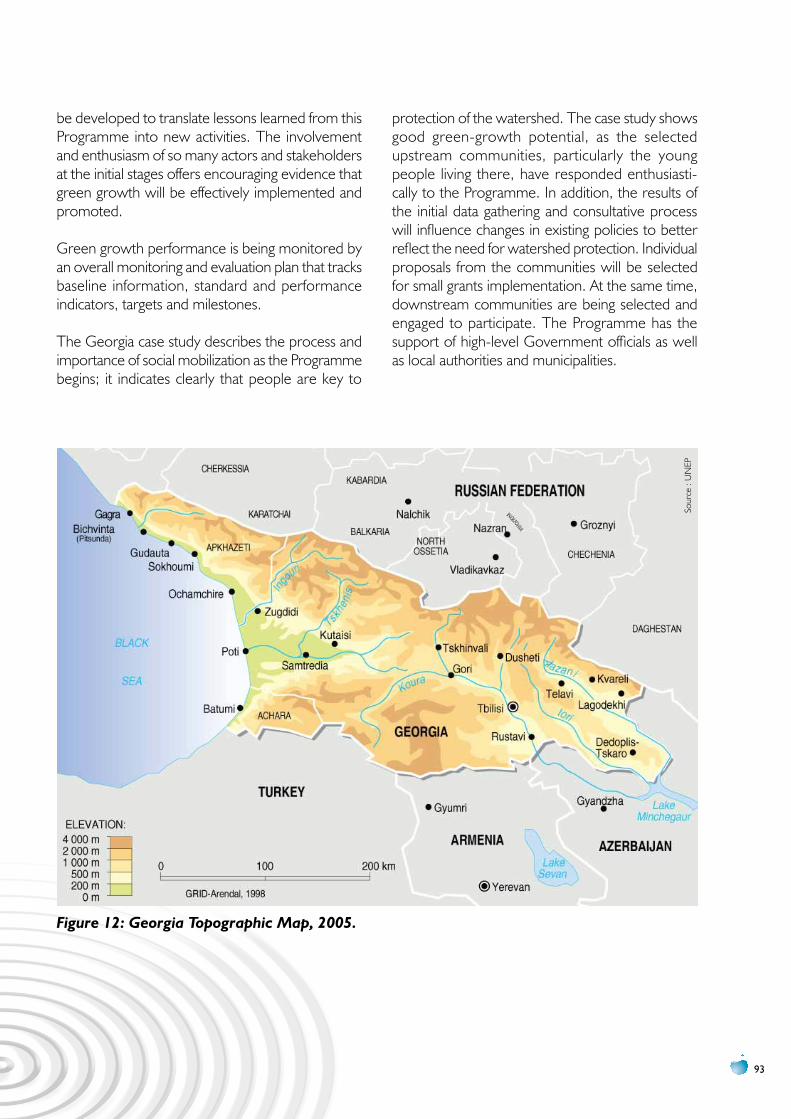
93
be developed to translate lessons learned from this Programme into new activities. The involvement and enthusiasm of so many actors and stakeholders at the initial stages offers encouraging evidence that green growth will be effectively implemented and promoted.
Green growth performance is being monitored by an overall monitoring and evaluation plan that tracks baseline information, standard and performance indicators, targets and milestones.
The Georgia case study describes the process and importance of social mobilization as the Programme begins; it indicates clearly that people are key to
protection of the watershed. The case study shows good green-growth potential, as the selected upstream communities, particularly the young people living there, have responded enthusiasti-cally to the Programme. In addition, the results of the initial data gathering and consultative process will influence changes in existing policies to better reflect the need for watershed protection. Individual proposals from the communities will be selected for small grants implementation. At the same time, downstream communities are being selected and engaged to participate. The Programme has the support of high-level Government officials as well as local authorities and municipalities.
Figure 12: Georgia Topographic Map, 2005.
Sour
ce :
UN
EP
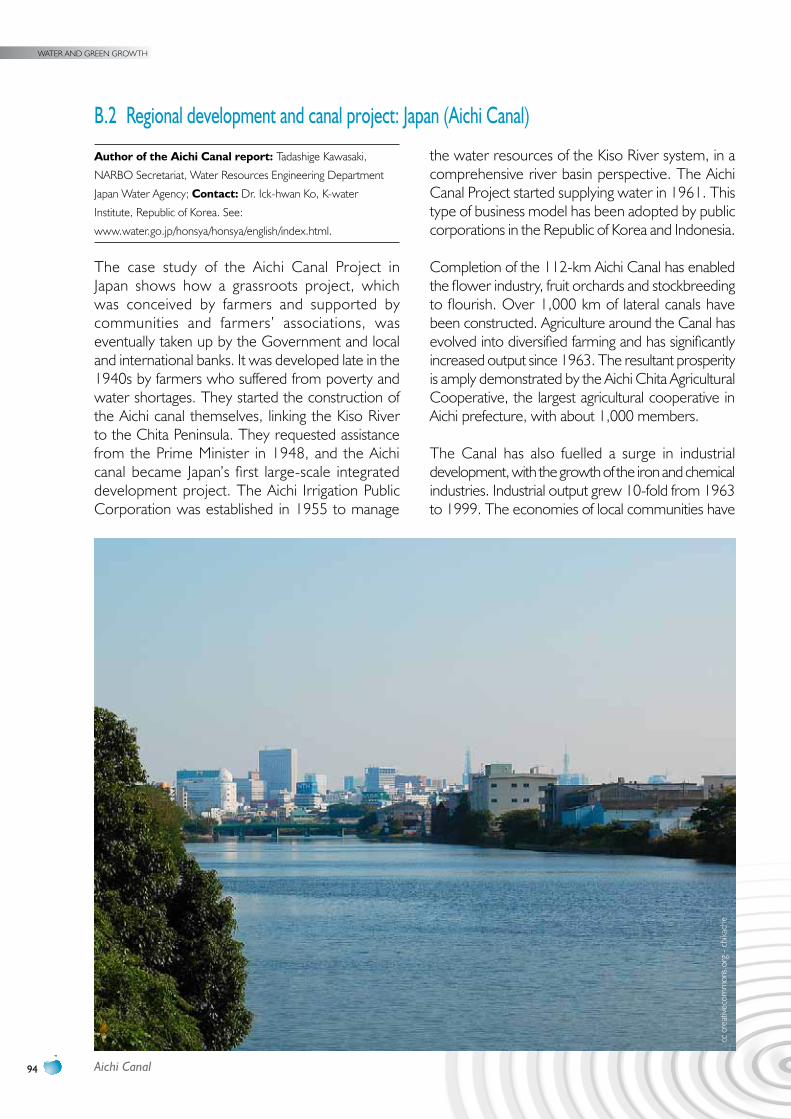
WATER AND GREEN GROWTH
94
B.2 Regional development and canal project: japan (Aichi Canal)
Author of the Aichi canal report: Tadashige Kawasaki,
NARBO Secretariat, Water Resources Engineering Department
Japan Water Agency; contact: Dr. Ick-hwan Ko, K-water
Institute, Republic of Korea. See:
www.water.go.jp/honsya/honsya/english/index.html.
The case study of the Aichi Canal Project in Japan shows how a grassroots project, which was conceived by farmers and supported by communities and farmers’ associations, was eventually taken up by the Government and local and international banks. It was developed late in the 1940s by farmers who suffered from poverty and water shortages. They started the construction of the Aichi canal themselves, linking the Kiso River to the Chita Peninsula. They requested assistance from the Prime Minister in 1948, and the Aichi canal became Japan’s first large-scale integrated development project. The Aichi Irrigation Public Corporation was established in 1955 to manage
the water resources of the Kiso River system, in a comprehensive river basin perspective. The Aichi Canal Project started supplying water in 1961. This type of business model has been adopted by public corporations in the Republic of Korea and Indonesia.
Completion of the 112-km Aichi Canal has enabled the flower industry, fruit orchards and stockbreeding to flourish. Over 1,000 km of lateral canals have been constructed. Agriculture around the Canal has evolved into diversified farming and has significantly increased output since 1963. The resultant prosperity is amply demonstrated by the Aichi Chita Agricultural Cooperative, the largest agricultural cooperative in Aichi prefecture, with about 1,000 members.
The Canal has also fuelled a surge in industrial development, with the growth of the iron and chemical industries. Industrial output grew 10-fold from 1963 to 1999. The economies of local communities have
Aichi Canal
cc c
reat
ivec
omm
ons.
org
- chi
kach
e
95
improved dramatically, generating trillions of yen in returns from agricultural and industrial trade. The Aichi Canal contributed to regional development and became an indispensable piece of infrastructure in this region.
The Aichi Canal Public Corporation was integrated into the Water Resources Development Public Corporation in 1968. The Japan Water Agency has taken over its projects and responsibilities, operating and maintaining the Canal with the support of farmers, water users and the public sector.
In order to raise awareness about water resources, such activities as exchange programmes and nature conservation programmes are conducted by beneficiaries in the watershed areas with those in downstream areas. Water resources management programmes are continuously implemented on a voluntary basis.
This case study provides an historical example of achieving green growth that could be helpful for others. The elements in its success (see box) could show stakeholders effective ways to help themselves by gaining Government support.
The most important elements in the success of the Aichi Canal project were:
•Participatory water management, focusing on the needs of residents and the participation of public-sector entities to meet them. Residents of the area wanted to improve their lives and requested assistance from the public sector. The public sector contributed to the project by using knowledge, funding and technology to realize residents’ needs.
•Establishment of an expert organization (Aichi Canal Public Corporation) to administer the Project was another factor in its success. Its systematic implementation contributed to improving equity in distributing the annual contribution from water users for maintenance.
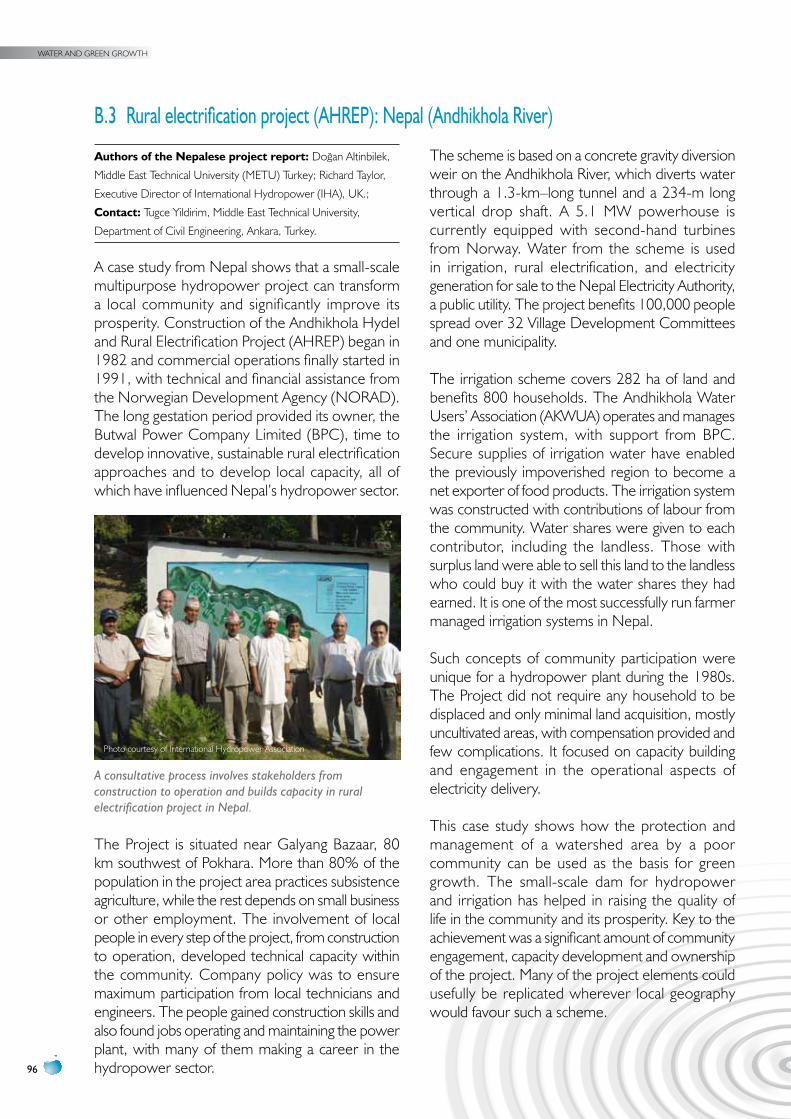
WATER AND GREEN GROWTH
96
B.3 Rural electrification project (AHREp): Nepal (Andhikhola River)
Authors of the nepalese project report: Doğan Altinbilek,
Middle East Technical University (METU) Turkey; Richard Taylor,
Executive Director of International Hydropower (IHA), UK.;
contact: Tugce Yildirim, Middle East Technical University,
Department of Civil Engineering, Ankara, Turkey.
A case study from Nepal shows that a small-scale multipurpose hydropower project can transform a local community and significantly improve its prosperity. Construction of the Andhikhola Hydel and Rural Electrification Project (AHREP) began in 1982 and commercial operations finally started in 1991, with technical and financial assistance from the Norwegian Development Agency (NORAD). The long gestation period provided its owner, the Butwal Power Company Limited (BPC), time to develop innovative, sustainable rural electrification approaches and to develop local capacity, all of which have influenced Nepal’s hydropower sector.
The Project is situated near Galyang Bazaar, 80 km southwest of Pokhara. More than 80% of the population in the project area practices subsistence agriculture, while the rest depends on small business or other employment. The involvement of local people in every step of the project, from construction to operation, developed technical capacity within the community. Company policy was to ensure maximum participation from local technicians and engineers. The people gained construction skills and also found jobs operating and maintaining the power plant, with many of them making a career in the hydropower sector.
The scheme is based on a concrete gravity diversion weir on the Andhikhola River, which diverts water through a 1.3-km–long tunnel and a 234-m long vertical drop shaft. A 5.1 MW powerhouse is currently equipped with second-hand turbines from Norway. Water from the scheme is used in irrigation, rural electrification, and electricity generation for sale to the Nepal Electricity Authority, a public utility. The project benefits 100,000 people spread over 32 Village Development Committees and one municipality.
The irrigation scheme covers 282 ha of land and benefits 800 households. The Andhikhola Water Users’ Association (AKWUA) operates and manages the irrigation system, with support from BPC. Secure supplies of irrigation water have enabled the previously impoverished region to become a net exporter of food products. The irrigation system was constructed with contributions of labour from the community. Water shares were given to each contributor, including the landless. Those with surplus land were able to sell this land to the landless who could buy it with the water shares they had earned. It is one of the most successfully run farmer managed irrigation systems in Nepal.
Such concepts of community participation were unique for a hydropower plant during the 1980s. The Project did not require any household to be displaced and only minimal land acquisition, mostly uncultivated areas, with compensation provided and few complications. It focused on capacity building and engagement in the operational aspects of electricity delivery.
This case study shows how the protection and management of a watershed area by a poor community can be used as the basis for green growth. The small-scale dam for hydropower and irrigation has helped in raising the quality of life in the community and its prosperity. Key to the achievement was a significant amount of community engagement, capacity development and ownership of the project. Many of the project elements could usefully be replicated wherever local geography would favour such a scheme.
A consultative process involves stakeholders from construction to operation and builds capacity in rural electrification project in Nepal.
Photo courtesy of International Hydropower Association
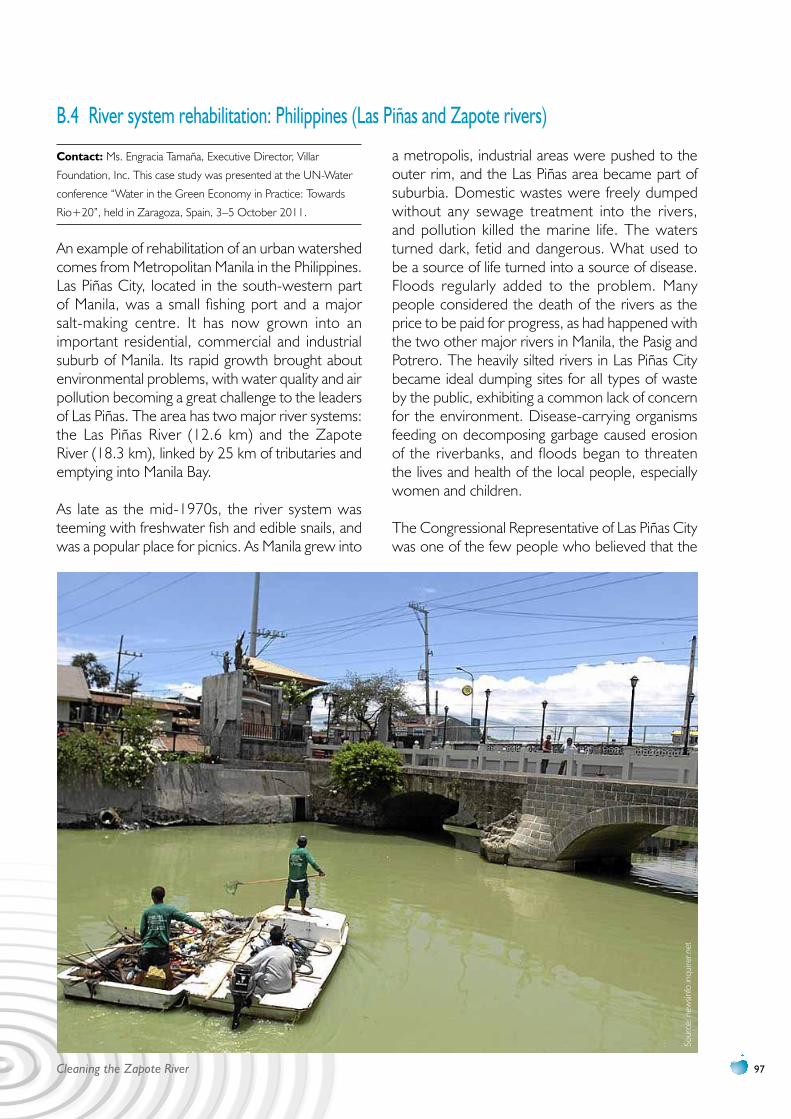
97
B.4 River system rehabilitation: philippines (Las piñas and zapote rivers)
contact: Ms. Engracia Tamaña, Executive Director, Villar
Foundation, Inc. This case study was presented at the UN-Water
conference “Water in the Green Economy in Practice: Towards
Rio+20”, held in Zaragoza, Spain, 3–5 October 2011.
An example of rehabilitation of an urban watershed comes from Metropolitan Manila in the Philippines. Las Piñas City, located in the south-western part of Manila, was a small fishing port and a major salt-making centre. It has now grown into an important residential, commercial and industrial suburb of Manila. Its rapid growth brought about environmental problems, with water quality and air pollution becoming a great challenge to the leaders of Las Piñas. The area has two major river systems: the Las Piñas River (12.6 km) and the Zapote River (18.3 km), linked by 25 km of tributaries and emptying into Manila Bay.
As late as the mid-1970s, the river system was teeming with freshwater fish and edible snails, and was a popular place for picnics. As Manila grew into
a metropolis, industrial areas were pushed to the outer rim, and the Las Piñas area became part of suburbia. Domestic wastes were freely dumped without any sewage treatment into the rivers, and pollution killed the marine life. The waters turned dark, fetid and dangerous. What used to be a source of life turned into a source of disease. Floods regularly added to the problem. Many people considered the death of the rivers as the price to be paid for progress, as had happened with the two other major rivers in Manila, the Pasig and Potrero. The heavily silted rivers in Las Piñas City became ideal dumping sites for all types of waste by the public, exhibiting a common lack of concern for the environment. Disease-carrying organisms feeding on decomposing garbage caused erosion of the riverbanks, and floods began to threaten the lives and health of the local people, especially women and children.
The Congressional Representative of Las Piñas City was one of the few people who believed that the
Cleaning the Zapote River
Sour
ce: n
ewsin
fo.in
quire
r.net
WATER AND GREEN GROWTH
98
environment should not be sacrificed to progress and development. She believed that the Las Piñas and Zapote rivers could be revived, so she launched the rehabilitation project in 2002 to bring life back into the rivers. Within the 56-km stretch of this river system, 30 km are regularly being cleaned, involving daily collection of floating garbage, as well as the installation of five units of steel garbage traps with wire mesh strainers to filter the waste.
A key feature of the project is training, education and communication on river rehabilitation and protection. From 2002 to 2005, over 9,000 residents (62% female) from various communities along the river system were trained in ecological solid waste and river management. Over 3,000 volunteers (44% female) have been trained and organized into river watch teams.
Among other development activities, the community became involved in urban forestry development by planting certain bamboo species to rehabilitate the riverbanks. A 5-km stretch of the Las Piñas riverbank was targeted for re-greening using bamboo, mangroves and other related species for soil erosion control. The bamboo contributes to generating income, as the mature poles are sold to handicraft and furniture makers.
Other social enterprises that have developed as part of the river rehabilitation effort include: composting and recycling from wet garbage; production of organic fertilizer; recycling of non-biodegradable materials; production of decorative items from bamboo, capiz shells and other local materials; basket weaving; and production of coco peat from coconut husks. In addition to jobs created in these industries, 62 workers were employed in the river dredging, clean-up, and re-greening activities.
This project has won a number of awards for good environmental stewardship. It started with cleaning up the river systems, and continued by using former waste products to produce income streams for residents of the area. It involves the strong involvement of the government as well as the private sector and social entrepreneurship. It shows a fine example of water and green growth, and illustrates the synergy between economic growth, environmental management and social development. The next step is to start working with local communities and industry to prevent waste from entering the river in the first place.
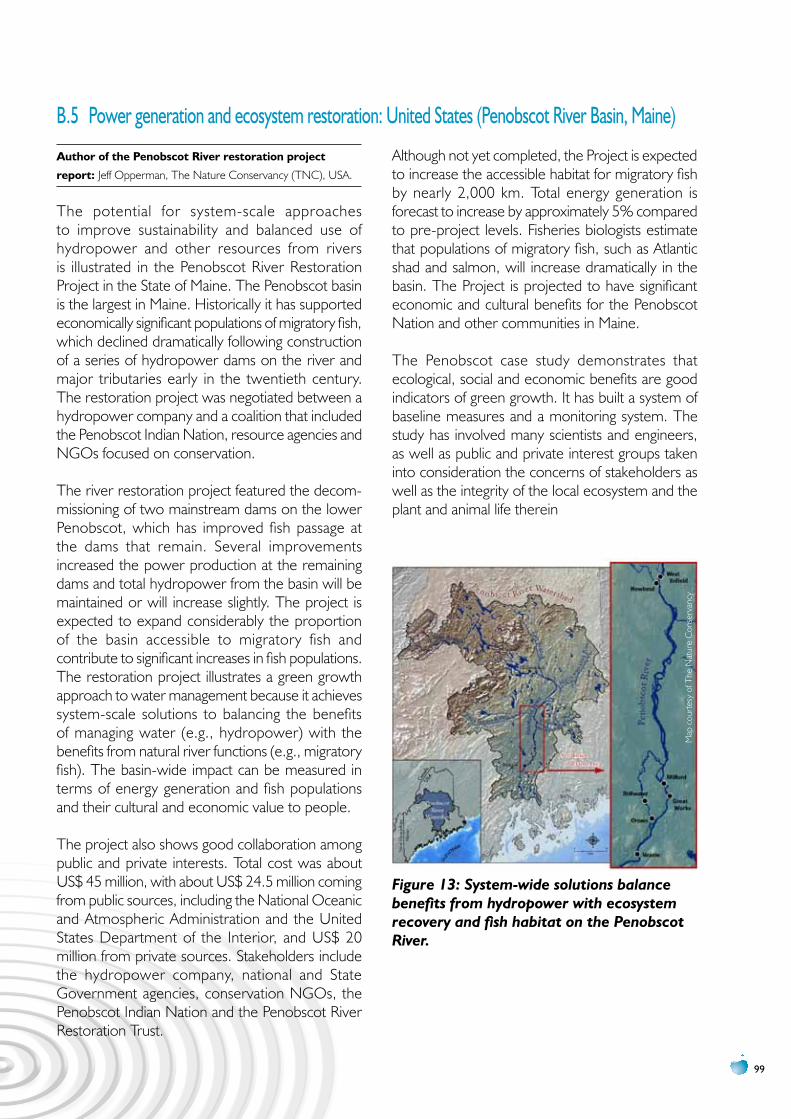
99
B.5 power generation and ecosystem restoration: united States (penobscot River Basin, Maine)
Author of the Penobscot River restoration project
report: Jeff Opperman, The Nature Conservancy (TNC), USA.
The potential for system-scale approaches to improve sustainability and balanced use of hydropower and other resources from rivers is illustrated in the Penobscot River Restoration Project in the State of Maine. The Penobscot basin is the largest in Maine. Historically it has supported economically significant populations of migratory fish, which declined dramatically following construction of a series of hydropower dams on the river and major tributaries early in the twentieth century. The restoration project was negotiated between a hydropower company and a coalition that included the Penobscot Indian Nation, resource agencies and NGOs focused on conservation.
The river restoration project featured the decom-missioning of two mainstream dams on the lower Penobscot, which has improved fish passage at the dams that remain. Several improvements increased the power production at the remaining dams and total hydropower from the basin will be maintained or will increase slightly. The project is expected to expand considerably the proportion of the basin accessible to migratory fish and contribute to significant increases in fish populations. The restoration project illustrates a green growth approach to water management because it achieves system-scale solutions to balancing the benefits of managing water (e.g., hydropower) with the benefits from natural river functions (e.g., migratory fish). The basin-wide impact can be measured in terms of energy generation and fish populations and their cultural and economic value to people.
The project also shows good collaboration among public and private interests. Total cost was about US$ 45 million, with about US$ 24.5 million coming from public sources, including the National Oceanic and Atmospheric Administration and the United States Department of the Interior, and US$ 20 million from private sources. Stakeholders include the hydropower company, national and State Government agencies, conservation NGOs, the Penobscot Indian Nation and the Penobscot River Restoration Trust.
Although not yet completed, the Project is expected to increase the accessible habitat for migratory fish by nearly 2,000 km. Total energy generation is forecast to increase by approximately 5% compared to pre-project levels. Fisheries biologists estimate that populations of migratory fish, such as Atlantic shad and salmon, will increase dramatically in the basin. The Project is projected to have significant economic and cultural benefits for the Penobscot Nation and other communities in Maine.
The Penobscot case study demonstrates that ecological, social and economic benefits are good indicators of green growth. It has built a system of baseline measures and a monitoring system. The study has involved many scientists and engineers, as well as public and private interest groups taken into consideration the concerns of stakeholders as well as the integrity of the local ecosystem and the plant and animal life therein
Figure 13: System-wide solutions balance benefits from hydropower with ecosystem recovery and fish habitat on the Penobscot River.
Map
cou
rtesy
of T
he N
atur
e C
onse
rvan
cy
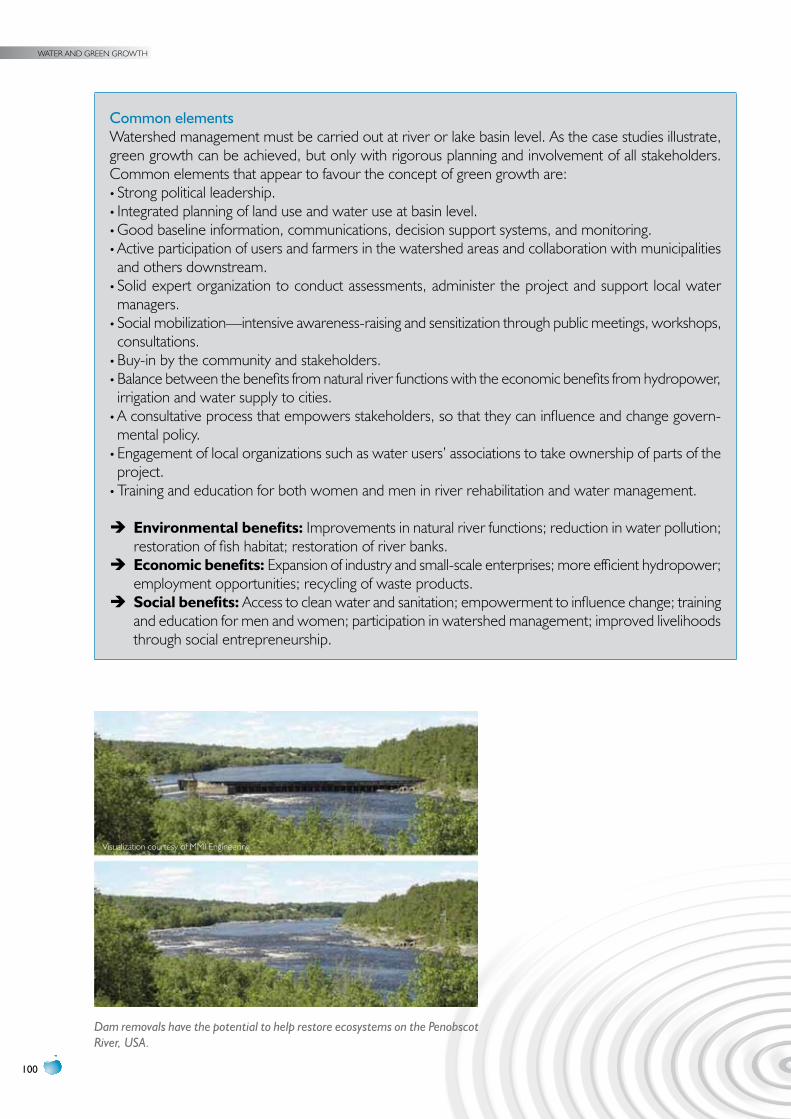
WATER AND GREEN GROWTH
100
Common elementsWatershed management must be carried out at river or lake basin level. As the case studies illustrate, green growth can be achieved, but only with rigorous planning and involvement of all stakeholders. Common elements that appear to favour the concept of green growth are: •Strong political leadership.•Integrated planning of land use and water use at basin level.•Good baseline information, communications, decision support systems, and monitoring.•Active participation of users and farmers in the watershed areas and collaboration with municipalities and others downstream.
•Solid expert organization to conduct assessments, administer the project and support local water managers.
•Social mobilization—intensive awareness-raising and sensitization through public meetings, workshops, consultations.
•Buy-in by the community and stakeholders.•Balance between the benefits from natural river functions with the economic benefits from hydropower, irrigation and water supply to cities.
•A consultative process that empowers stakeholders, so that they can influence and change govern-mental policy.
•Engagement of local organizations such as water users’ associations to take ownership of parts of the project.
•Training and education for both women and men in river rehabilitation and water management.
ÎÎ environmental benefits: Improvements in natural river functions; reduction in water pollution; restoration of fish habitat; restoration of river banks.ÎÎ economic benefits: Expansion of industry and small-scale enterprises; more efficient hydropower; employment opportunities; recycling of waste products.ÎÎ Social benefits: Access to clean water and sanitation; empowerment to influence change; training and education for men and women; participation in watershed management; improved livelihoods through social entrepreneurship.
Dam removals have the potential to help restore ecosystems on the Penobscot River, USA.
Visualization courtesy of MMI Engineering
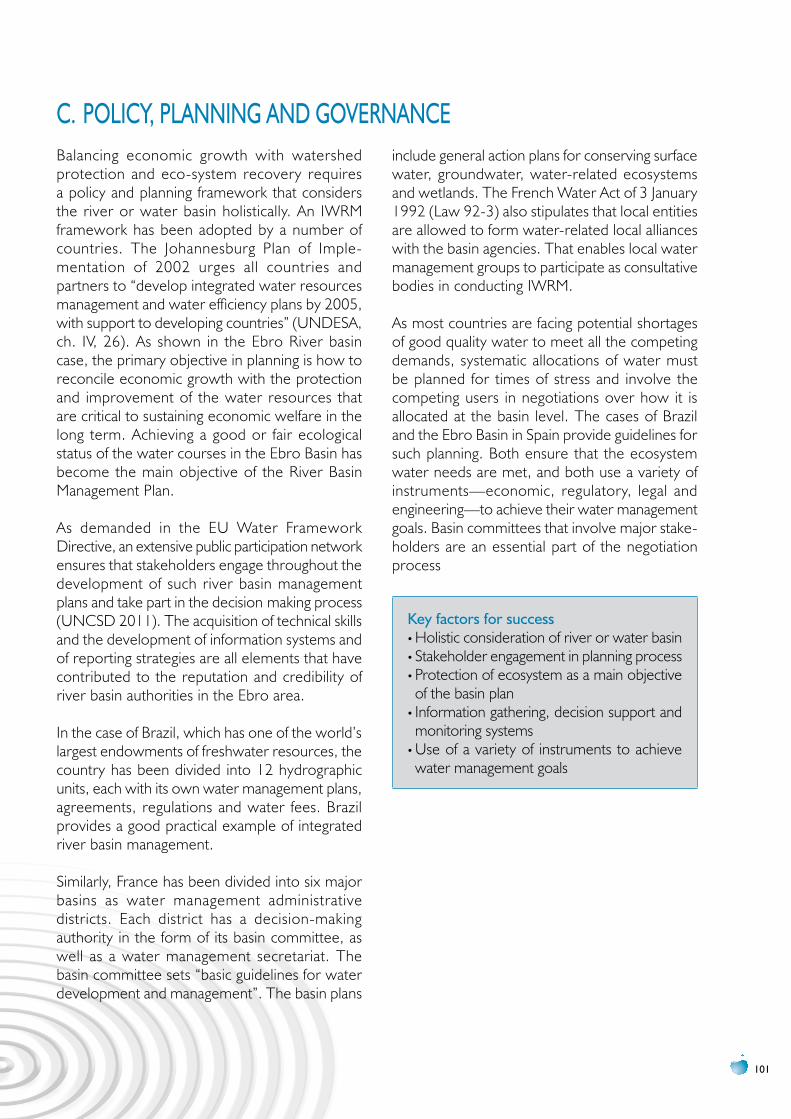
101
C. pOLICy, pLANNING AND GOvERNANCEBalancing economic growth with watershed protection and eco-system recovery requires a policy and planning framework that considers the river or water basin holistically. An IWRM framework has been adopted by a number of countries. The Johannesburg Plan of Imple-mentation of 2002 urges all countries and partners to “develop integrated water resources management and water efficiency plans by 2005, with support to developing countries” (UNDESA, ch. IV, 26). As shown in the Ebro River basin case, the primary objective in planning is how to reconcile economic growth with the protection and improvement of the water resources that are critical to sustaining economic welfare in the long term. Achieving a good or fair ecological status of the water courses in the Ebro Basin has become the main objective of the River Basin Management Plan.
As demanded in the EU Water Framework Directive, an extensive public participation network ensures that stakeholders engage throughout the development of such river basin management plans and take part in the decision€making process (UNCSD 2011). The acquisition of technical skills and the development of information systems and of reporting strategies are all elements that have contributed to the reputation and credibility of river basin authorities in the Ebro area.
In the case of Brazil, which has one of the world’s largest endowments of freshwater resources, the country has been divided into 12 hydrographic units, each with its own water management plans, agreements, regulations and water fees. Brazil provides a good practical example of integrated river basin management.
Similarly, France has been divided into six major basins as water management administrative districts. Each district has a decision-making authority in the form of its basin committee, as well as a water management secretariat. The basin committee sets “basic guidelines for water development and management”. The basin plans
include general action plans for conserving surface water, groundwater, water-related ecosystems and wetlands. The French Water Act of 3 January 1992 (Law 92-3) also stipulates that local entities are allowed to form water-related local alliances with the basin agencies. That enables local water management groups to participate as consultative bodies in conducting IWRM.
As most countries are facing potential shortages of good quality water to meet all the competing demands, systematic allocations of water must be planned for times of stress and involve the competing users in negotiations over how it is allocated at the basin level. The cases of Brazil and the Ebro Basin in Spain provide guidelines for such planning. Both ensure that the ecosystem water needs are met, and both use a variety of instruments—economic, regulatory, legal and engineering—to achieve their water management goals. Basin committees that involve major stake-holders are an essential part of the negotiation process
Key factors for success•Holistic consideration of river or water basin•Stakeholder engagement in planning process•Protection of ecosystem as a main objective of the basin plan
•Information gathering, decision support and monitoring systems
•Use of a variety of instruments to achieve water management goals
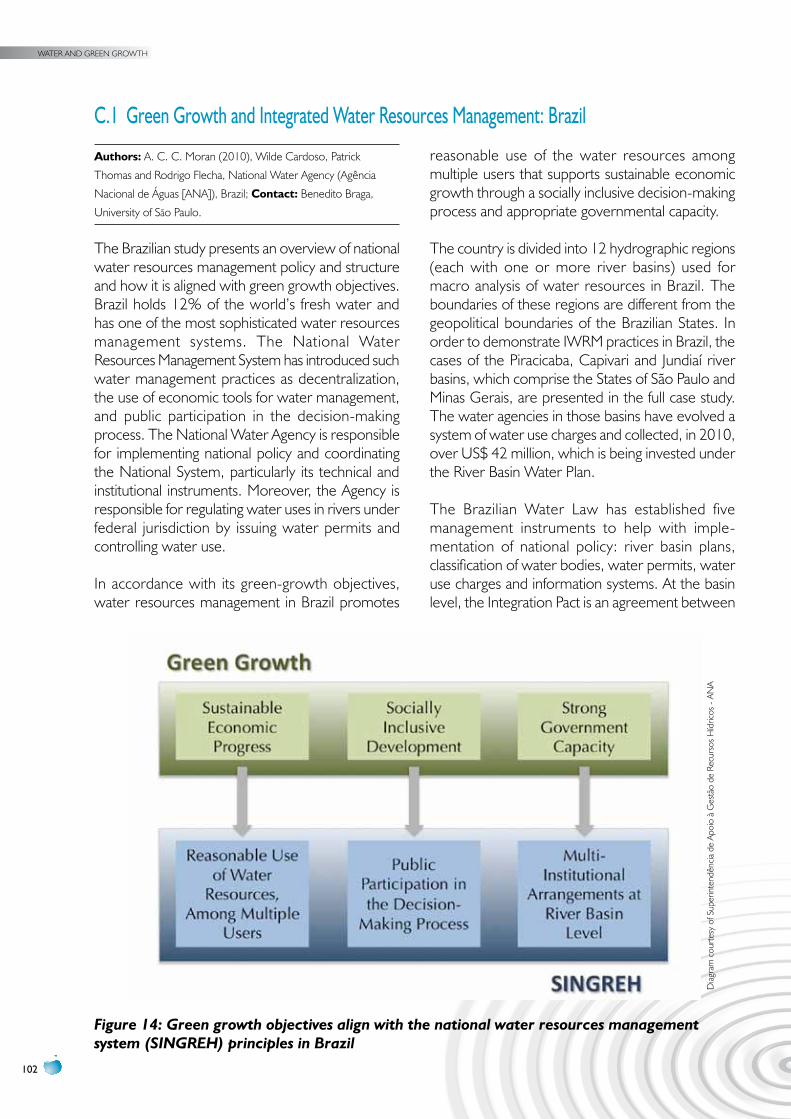
WATER AND GREEN GROWTH
102
C.1 Green Growth and Integrated Water Resources Management: Brazil
Authors: A. C. C. Moran (2010), Wilde Cardoso, Patrick
Thomas and Rodrigo Flecha, National Water Agency (Agência
Nacional de Águas [ANA]), Brazil; contact: Benedito Braga,
University of São Paulo.
The Brazilian study presents an overview of national water resources management policy and structure and how it is aligned with green growth objectives. Brazil holds 12% of the world’s fresh water and has one of the most sophisticated water resources management systems. The National Water Resources Management System has introduced such water management practices as decentralization, the use of economic tools for water management, and public participation in the decision-making process. The National Water Agency is responsible for implementing national policy and coordinating the National System, particularly its technical and institutional instruments. Moreover, the Agency is responsible for regulating water uses in rivers under federal jurisdiction by issuing water permits and controlling water use.
In accordance with its green-growth objectives, water resources management in Brazil promotes
reasonable use of the water resources among multiple users that supports sustainable economic growth through a socially inclusive decision-making process and appropriate governmental capacity.
The country is divided into 12 hydrographic regions (each with one or more river basins) used for macro analysis of water resources in Brazil. The boundaries of these regions are different from the geopolitical boundaries of the Brazilian States. In order to demonstrate IWRM practices in Brazil, the cases of the Piracicaba, Capivari and Jundiaí river basins, which comprise the States of São Paulo and Minas Gerais, are presented in the full case study. The water agencies in those basins have evolved a system of water use charges and collected, in 2010, over US$ 42 million, which is being invested under the River Basin Water Plan.
The Brazilian Water Law has established five management instruments to help with imple-mentation of national policy: river basin plans, classification of water bodies, water permits, water use charges and information systems. At the basin level, the Integration Pact is an agreement between
Figure 14: Green growth objectives align with the national water resources management system (SINGREH) principles in Brazil
Diag
ram
cou
rtesy
of S
uper
inte
ndên
cia d
e Ap
oio
à G
estã
o de
Rec
urso
s H
ídric
os -
ANA
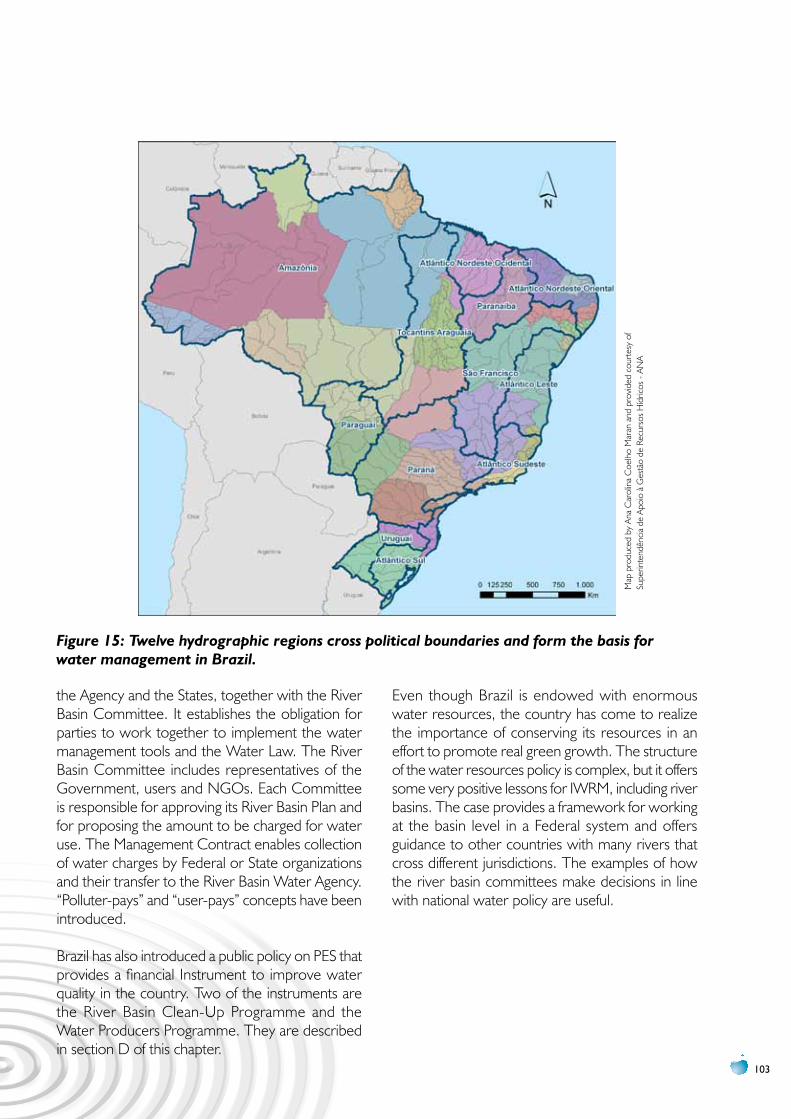
103
the Agency and the States, together with the River Basin Committee. It establishes the obligation for parties to work together to implement the water management tools and the Water Law. The River Basin Committee includes representatives of the Government, users and NGOs. Each Committee is responsible for approving its River Basin Plan and for proposing the amount to be charged for water use. The Management Contract enables collection of water charges by Federal or State organizations and their transfer to the River Basin Water Agency. “Polluter-pays” and “user-pays” concepts have been introduced.
Brazil has also introduced a public policy on PES that provides a financial Instrument to improve water quality in the country. Two of the instruments are the River Basin Clean-Up Programme and the Water Producers Programme. They are described in section D of this chapter.
Even though Brazil is endowed with enormous water resources, the country has come to realize the importance of conserving its resources in an effort to promote real green growth. The structure of the water resources policy is complex, but it offers some very positive lessons for IWRM, including river basins. The case provides a framework for working at the basin level in a Federal system and offers guidance to other countries with many rivers that cross different jurisdictions. The examples of how the river basin committees make decisions in line with national water policy are useful.
Figure 15: Twelve hydrographic regions cross political boundaries and form the basis for water management in Brazil.
Map
pro
duce
d by
Ana
Car
olin
a C
oelh
o M
aran
and
pro
vide
d co
urte
sy o
f Su
perin
tend
ência
de
Apoi
o à
Ges
tão
de R
ecur
sos
Híd
ricos
- AN
A
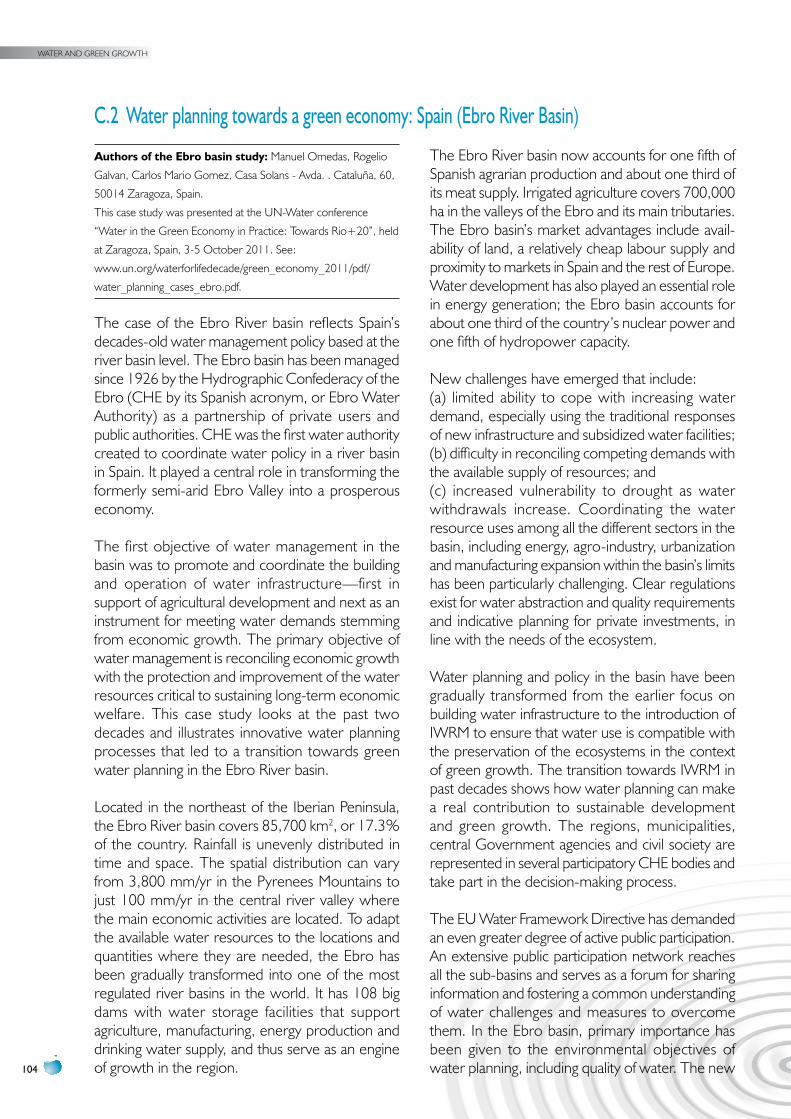
WATER AND GREEN GROWTH
104
C.2 Water planning towards a green economy: Spain (Ebro River Basin)
Authors of the ebro basin study: Manuel Omedas, Rogelio
Galvan, Carlos Mario Gomez, Casa Solans - Avda. . Cataluña, 60,
50014 Zaragoza, Spain.
This case study was presented at the UN-Water conference
“Water in the Green Economy in Practice: Towards Rio+20”, held
at Zaragoza, Spain, 3-5 October 2011. See:
www.un.org/waterforlifedecade/green_economy_2011/pdf/
water_planning_cases_ebro.pdf.
The case of the Ebro River basin reflects Spain’s decades-old water management policy based at the river basin level. The Ebro basin has been managed since 1926 by the Hydrographic Confederacy of the Ebro (CHE by its Spanish acronym, or Ebro Water Authority) as a partnership of private users and public authorities. CHE was the first water authority created to coordinate water policy in a river basin in Spain. It played a central role in transforming the formerly semi-arid Ebro Valley into a prosperous economy.
The first objective of water management in the basin was to promote and coordinate the building and operation of water infrastructure—first in support of agricultural development and next as an instrument for meeting water demands stemming from economic growth. The primary objective of water management is reconciling economic growth with the protection and improvement of the water resources critical to sustaining long-term economic welfare. This case study looks at the past two decades and illustrates innovative water planning processes that led to a transition towards green water planning in the Ebro River basin.
Located in the northeast of the Iberian Peninsula, the Ebro River basin covers 85,700 km2, or 17.3% of the country. Rainfall is unevenly distributed in time and space. The spatial distribution can vary from 3,800 mm/yr in the Pyrenees Mountains to just 100 mm/yr in the central river valley where the main economic activities are located. To adapt the available water resources to the locations and quantities where they are needed, the Ebro has been gradually transformed into one of the most regulated river basins in the world. It has 108 big dams with water storage facilities that support agriculture, manufacturing, energy production and drinking water supply, and thus serve as an engine of growth in the region.
The Ebro River basin now accounts for one fifth of Spanish agrarian production and about one third of its meat supply. Irrigated agriculture covers 700,000 ha in the valleys of the Ebro and its main tributaries. The Ebro basin’s market advantages include avail-ability of land, a relatively cheap labour supply and proximity to markets in Spain and the rest of Europe. Water development has also played an essential role in energy generation; the Ebro basin accounts for about one third of the country’s nuclear power and one fifth of hydropower capacity.
New challenges have emerged that include: (a) limited ability to cope with increasing water demand, especially using the traditional responses of new infrastructure and subsidized water facilities; (b) difficulty in reconciling competing demands with the available supply of resources; and (c) increased vulnerability to drought as water withdrawals increase. Coordinating the water resource uses among all the different sectors in the basin, including energy, agro-industry, urbanization and manufacturing expansion within the basin’s limits has been particularly challenging. Clear regulations exist for water abstraction and quality requirements and indicative planning for private investments, in line with the needs of the ecosystem.
Water planning and policy in the basin have been gradually transformed from the earlier focus on building water infrastructure to the introduction of IWRM to ensure that water use is compatible with the preservation of the ecosystems in the context of green growth. The transition towards IWRM in past decades shows how water planning can make a real contribution to sustainable development and green growth. The regions, municipalities, central Government agencies and civil society are represented in several participatory CHE bodies and take part in the decision-making process.
The EU Water Framework Directive has demanded an even greater degree of active public participation. An extensive public participation network reaches all the sub-basins and serves as a forum for sharing information and fostering a common understanding of water challenges and measures to overcome them. In the Ebro basin, primary importance has been given to the environmental objectives of water planning, including quality of water. The new
105
water policy framework allows for the actions and measures that will achieve environmental objectives and that generate minimal economic losses or maximum welfare gains.
The Ebro River Basin Management Plan 2010–2015 has 12 key elements that are summarized in the full version of this case study. They touch on: integrated management, social opportunities, environmental objectives, pollution control, a realistic environ-mental flow regime, sustainable development, improved irrigation efficiency, balanced allocation of resources, public participation, shared financial burdens, a commitment to cost recovery and an extensive monitoring network.
Setting the achievement of a good or fair ecological status of the water bodies as the main objective
of river basin management plans in the European Union has been an important element in the Ebro River basin plan and has helped make economic development compatible with environmental objectives.
This instructive study reveals the changes made in river basin planning over an 80-year period. While CHE seems to have adapted quite well to the changing needs, it is clearly difficult to make allocation decisions and get the numerous stake-holders to accept collective decisions. One of the most positive aspects of the case study is that the Authority has set environmental baseline require-ments before allocating water resources. That would seem to be an excellent first step towards green growth.
Common elementsThe Brazilian and Spanish case studies indicate that policy, planning and good governance evolve over a period and that the process is iterative. Both cases show an intense State-wide effort with multiple components, large and small in scale. They also require a large public investment. Among the common elements that have made those plans valuable in meeting green growth objectives are:
•Policy and planning framework that looks at the river or water basin holistically.•A water authority that can coordinate fragmented water resource agencies and competing uses among different sectors in the basin, including energy, industry, agriculture and urban water supply.
•A body that has authority to issue permits and control water use.•Clear regulations for water abstraction and quality requirements and indicative planning for private investments, in line with the needs of the ecosystem.
•Objectives that reconcile economic growth with protection and health of the ecosystem.•Creation of a basin committee or public council that includes major stakeholders—Government, local authorities, civic groups, professionals, local residents, private businesses—as part of the negotiation and decision-making process.
•Participatory management strategy as an example of good governance.•Development of information systems and acquisition of technical skills.
ÎÎ environmental benefits: improved ecological status of the river; conservation of wetlands and other fragile areas; drought reduction; pollution control.ÎÎ economic benefits: improved irrigation efficiency; hydropower capacity; job creation; balanced economic growth in water-using sectors; shared costs and benefits among stakeholders.ÎÎ Social benefits: access to water supply and sanitation; participation in decisions on water allocation; health improvements; social inclusion.
WATER AND GREEN GROWTH
106
D. FINANCING AND puBLIC–pRIvATE pARTNERSHIpSA variety of sources of public and private funds can be tapped to support national water resources infra-structure. They include governmental budgetary allocations and subsidies, water tariffs for users, polluter-pays fees, overseas development grants and loans, private sector investments and hybrid systems. This section focuses on sources of finance related to water and green growth. The case studies mainly concentrate on PES schemes that support protection of the ecosystem as a basis for green growth. All of the case studies examine systems for rewarding municipalities, communities or individuals for protecting the watershed and the source of water resources needed for both upstream and downstream economic activities.
The case of Brazil presents two types of payments—one to providers of sewerage systems and treatment plants, so that the Government does not have to construct such facilities; and the other for environ-mental services to farmers in strategic watershed areas. The programmes are solidly backed by national water management policy and institutions. Sumberjaya in Indonesia presents a case where a group of coffee farmers facing eviction was allowed to become part of a community forestry scheme when the evidence clearly demonstrated that their activities could support watershed functions. That experience is very relevant for governments that may have full control but have limited capacity to manage forests and watersheds. Demonstrably, research-based information accepted by policymakers can lead to changes in attitudes and actions towards sustainable forest and watershed management. Along with evidence from the case for eco-compen-sation in China, Government policy should be flexible and focus on desired outcomes, rather than rely on rigid formulas. Arrangements negotiated among the Government, private sector, local people and scientists with a shared understanding of the relations between land use and watershed functions led to such a positive outcome. The case of Lake Naivasha in Kenya demonstrates how economic incentives for both ecosystem service buyers and sellers can be used to achieve significant land- and water-management improvements. The contractual agreements are negotiated between the ecosystem stewards and ecosystem beneficiaries, making PES a benefit-sharing mechanism.
In the cases from Latin America and the Caribbean, the water funds set up by The Nature Conservancy are an endowment to support watershed protection and improve water quality and promote green growth, rather than direct payments to individuals. The funds require involvement of upstream and downstream stakeholders and spread both benefits and costs among industries, municipalities, communities and utilities as well as the ecosystem. Financing comes from the users, the Government (including a percentage of the water company’s revenues) and international development banks and other donors. Although it is difficult to initiate them, perhaps the operational examples can be models for municipalities that are searching for ways to reduce costs of water treatment and distribution. That could be the subject of some of the Water Operator Partnership discussions under the Water for Asian Cities and Water for African Cities programmes.
The potential constraint in scaling up the schemes described in this section is the amount of research and information gathering needed to structure a PES scheme and certify recipients of the funds. Substantial data are needed to inform decisions and to produce agreement on the conditions binding the contract. A considerable amount of trust needs to be built among the parties. As with other PES schemes around the world, especially those relating to watershed services, securing commitments from direct beneficiaries of those services is a challenge. In a situation where beneficiaries are already paying a statutory water fee to the regulating body, payment for PES appears as if it is a “double” payment. Engagement and capacity building are necessary to rectify this misperception.
Key factors for success:•Backing by Government policy and national water management institutions
•Commitments from suppliers and users of ecosystems services
•Costs and benefits shared by upstream stewards and downstream beneficiaries
•Financing from multiple sources•Good research and information gathering for baseline data and monitoring
•Flexible systems focused on desired outcomes
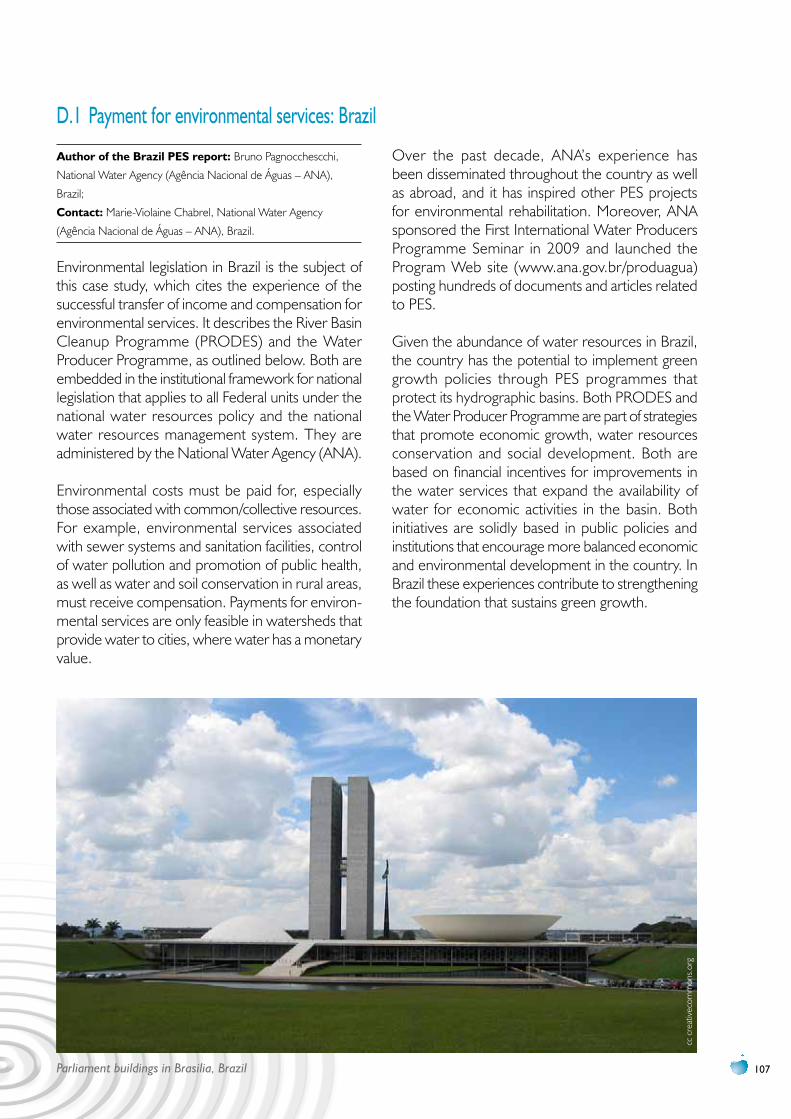
107
D.1 payment for environmental services: Brazil
Author of the Brazil PeS report: Bruno Pagnocchescchi,
National Water Agency (Agência Nacional de Águas – ANA),
Brazil;
contact: Marie-Violaine Chabrel, National Water Agency
(Agência Nacional de Águas – ANA), Brazil.
Environmental legislation in Brazil is the subject of this case study, which cites the experience of the successful transfer of income and compensation for environmental services. It describes the River Basin Cleanup Programme (PRODES) and the Water Producer Programme, as outlined below. Both are embedded in the institutional framework for national legislation that applies to all Federal units under the national water resources policy and the national water resources management system. They are administered by the National Water Agency (ANA).
Environmental costs must be paid for, especially those associated with common/collective resources. For example, environmental services associated with sewer systems and sanitation facilities, control of water pollution and promotion of public health, as well as water and soil conservation in rural areas, must receive compensation. Payments for environ-mental services are only feasible in watersheds that provide water to cities, where water has a monetary value.
Over the past decade, ANA’s experience has been disseminated throughout the country as well as abroad, and it has inspired other PES projects for environmental rehabilitation. Moreover, ANA sponsored the First International Water Producers Programme Seminar in 2009 and launched the Program Web site (www.ana.gov.br/produagua) posting hundreds of documents and articles related to PES.
Given the abundance of water resources in Brazil, the country has the potential to implement green growth policies through PES programmes that protect its hydrographic basins. Both PRODES and the Water Producer Programme are part of strategies that promote economic growth, water resources conservation and social development. Both are based on financial incentives for improvements in the water services that expand the availability of water for economic activities in the basin. Both initiatives are solidly based in public policies and institutions that encourage more balanced economic and environmental development in the country. In Brazil these experiences contribute to strengthening the foundation that sustains green growth.
cc c
reat
ivec
omm
ons.
org
Parliament buildings in Brasilia, Brazil
WATER AND GREEN GROWTH
108
1. The River Basin Cleanup ProgrammePRODES was initiated in 2001, after it was recognized that discharges of untreated human waste into water courses were the main cause of water pollution in the country. Despite the demand from rapidly growing urban areas, low investment in sanitation and sewerage systems for many years compromised the quality and quantity of water available for various uses—water supply, industry and irrigation, among others.
One response to the situation was to introduce payments to operators for collecting and treating sewage and improving water quality. Rather than constructing sewage treatment plants, the Government paid contractors to treat the wastes based on performance results.
PRODES allocates public funds from the Government budget directly to sewage treatment plant operators, on the basis of a signed contract, for evidence-based pollution reduction. Certification of goals is based on a self-evaluation submitted by the service provider and an audit to check management criteria and confirm the results. The programme contributes to green growth, as it concentrates on improving water quality and restoring health to the ecosystem. During its 10 years of operation, PRODES has invested about US$ 86 million for 42 contracts. Investment in sanitation and sewerage services by the contractors was three times greater than the funds made available by the programme, amounting to approximately US$ 264 million, which represents treatment systems to serve 5 million people.
2. The Water Producer ProgrammeIn line with the national water resources policy, ANA designed the “water producer” conservation project aimed at sustainable development of agricultural land in hydrographic basins. The goal was to control the impacts of non-point pollution and sedimentation in the watershed area to protect water supply for use downstream.
The Water Producer Programme practices PES to protect water resources by reducing erosion and siltation in important watershed areas. The Programme engages farmers in the watershed to restore ecosystem services, while promoting economic and social benefits for the basin and its population. Among actions eligible for PES are the construction of terraces and infiltration basins, watershed protection, reforestation of protected areas, and environmental sanitation. Rural producers’ remuneration will depend on prior inspection of the property. Projects selected for the PES scheme must comply with ANA guidelines. The commitment of the local population must be clear and ties with the managing agencies must be strong.
Projects under the PES scheme are paid for by metropolitan areas, because water has economic value to them. For example, in the State of Espirito Santo, the State Water Resources Fund (Fundágua) receives contributions from oil royalties, the power sector and the State budget. In Brasilia, payments come from local water and sanitation authorities, The Nature Conservancy, the University of Brasilia and private companies. In the Greater Rio de Janeiro Metropolitan Region, the Water and Forest Producers Project makes payments to protect water supply for the city and power generation.
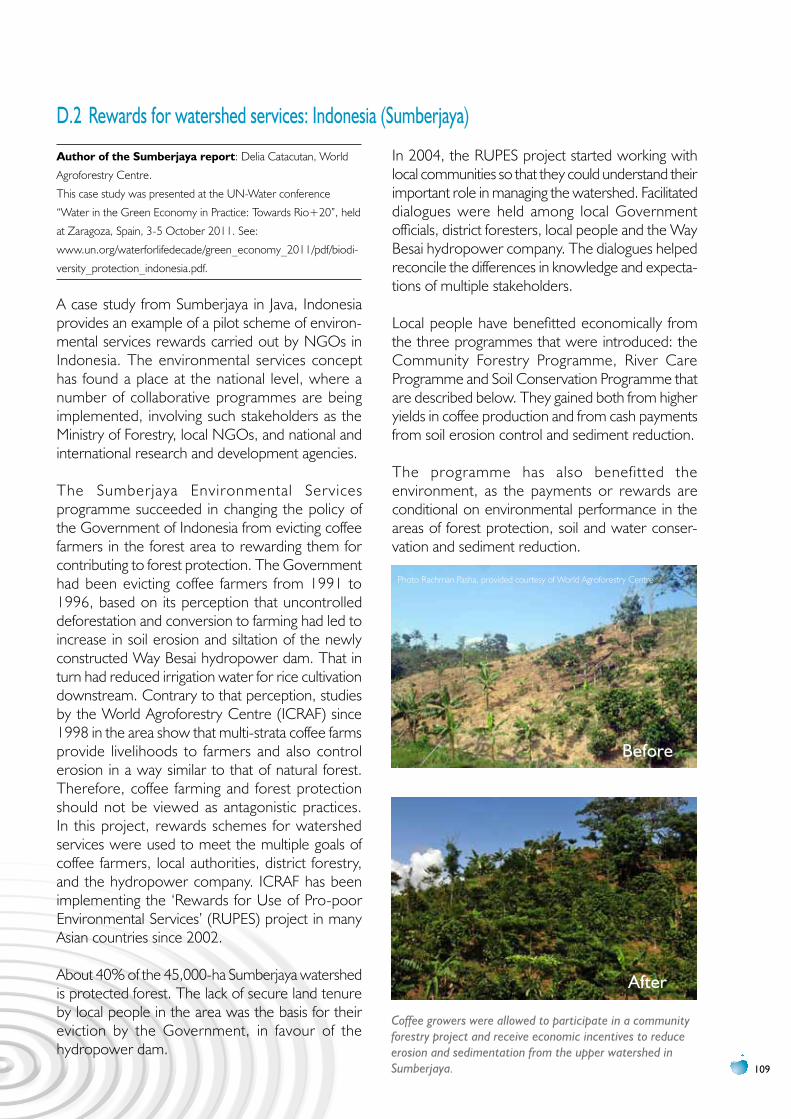
109
D.2 Rewards for watershed services: Indonesia (Sumberjaya)
Author of the Sumberjaya report: Delia Catacutan, World
Agroforestry Centre.
This case study was presented at the UN-Water conference
“Water in the Green Economy in Practice: Towards Rio+20”, held
at Zaragoza, Spain, 3-5 October 2011. See:
www.un.org/waterforlifedecade/green_economy_2011/pdf/biodi-
versity_protection_indonesia.pdf.
A case study from Sumberjaya in Java, Indonesia provides an example of a pilot scheme of environ-mental services rewards carried out by NGOs in Indonesia. The environmental services concept has found a place at the national level, where a number of collaborative programmes are being implemented, involving such stakeholders as the Ministry of Forestry, local NGOs, and national and international research and development agencies.
The Sumberjaya Environmental Services programme succeeded in changing the policy of the Government of Indonesia from evicting coffee farmers in the forest area to rewarding them for contributing to forest protection. The Government had been evicting coffee farmers from 1991 to 1996, based on its perception that uncontrolled deforestation and conversion to farming had led to increase in soil erosion and siltation of the newly constructed Way Besai hydropower dam. That in turn had reduced irrigation water for rice cultivation downstream. Contrary to that perception, studies by the World Agroforestry Centre (ICRAF) since 1998 in the area show that multi-strata coffee farms provide livelihoods to farmers and also control erosion in a way similar to that of natural forest. Therefore, coffee farming and forest protection should not be viewed as antagonistic practices. In this project, rewards schemes for watershed services were used to meet the multiple goals of coffee farmers, local authorities, district forestry, and the hydropower company. ICRAF has been implementing the ‘Rewards for Use of Pro-poor Environmental Services’ (RUPES) project in many Asian countries since 2002.
About 40% of the 45,000-ha Sumberjaya watershed is protected forest. The lack of secure land tenure by local people in the area was the basis for their eviction by the Government, in favour of the hydropower dam.
In 2004, the RUPES project started working with local communities so that they could understand their important role in managing the watershed. Facilitated dialogues were held among local Government officials, district foresters, local people and the Way Besai hydropower company. The dialogues helped reconcile the differences in knowledge and expecta-tions of multiple stakeholders.
Local people have benefitted economically from the three programmes that were introduced: the Community Forestry Programme, River Care Programme and Soil Conservation Programme that are described below. They gained both from higher yields in coffee production and from cash payments from soil erosion control and sediment reduction.
The programme has also benefitted the environment, as the payments or rewards are conditional on environmental performance in the areas of forest protection, soil and water conser-vation and sediment reduction.
Before
After
Coffee growers were allowed to participate in a community forestry project and receive economic incentives to reduce erosion and sedimentation from the upper watershed in Sumberjaya.
Photo Rachman Pasha, provided courtesy of World Agroforestry Centre
WATER AND GREEN GROWTH
110
The RUPES project is composed of the following three programmes.
1. Community Forestry Programme The RUPES Project helped local communities gain access to the Indonesian Government’s Community Forestry Programme (HKm), which provides farmers with conditional land tenure for forest protection. In exchange, farmers adopt environmentally friendly farming practices and protect the remaining natural forest. The HKm administrators eventually approved the granting of conditional land tenure to coffee farmers in Sumberjaya, and the programme now covers 70% of Sumberjaya’s protected forests and involves nearly 6,400 farmers, covering 13,000 hectares of forest. HKm represents a major success for farmers, who are no longer at risk of eviction. A recent impact study of land tenure in Sumberjaya found that community forestry provided more land tenure security to farmers, while doubling local land values and increasing income. It also resulted in: improved tree planting and agroforestry; improved soil and water conservation; and motivation for farmers to protect the remaining natural forest.
2. RiverCare ProgrammeIn order to reduce sedimentation in the reservoir, a pilot project was set up in one subcatchment area to develop a payment mechanism for reducing sediments through a “RiverCare” programme. A forum was formed at each subvillage consisting of hamlet administrators, community forestry administrators and mosque administrators. The forum is a medium for capacity building, social networking and conflict resolution. RiverCare members learn principles and practices of soil and water conservation, together with sediment monitoring and measurements. A Conservation Agreement was developed by the RiverCare group and the Way Besai Hydropower Company that covers construction, sedimentation, diversion, plantings in potential landslide hotspots, and installing water channels and piping systems to stabilize water flows. The Way Besai Hydropower Company is committed to pay for water quality via sediment reduction in the dam, as long as the RiverCare group delivers the service.
3. Soil Conservation Programme Another reward scheme is through a soil and water conservation programme. The scheme involves paying farmers for reducing erosion and sedimentation. The practices applied by farmers on their farms include terracing, sediment pit and strip weeding techniques.
All three programmes have also had positive social impacts. The conditional land tenure acquired by forest people is a step towards poverty reduction. Local people have a greater sense of security for their livelihoods. The local community has also gained respect from the local authorities, the hydropower company, the forest department, and scientists for being environmental stewards. The experiences of the three programmes provide good practice examples especially for contested forest areas in developing countries.
Among the lessons learned was that good social mobilization is key to success, along with access to good quality data on local geography and infra-structure. Policy responses should be site-specific rather than generic in approach.
This example of water and green growth shows how PES became a means to watershed protection and improvement in livelihoods at the same time. Here, the evidence showed that the concerns of the coffee farmers were compatible with the Government’s efforts to protect the forest and reduce siltation in the dam. The coffee farmers had an incentive to protect the watershed and an opportunity to improve their lives and gain access to ownership of their land. The farmers have increased their own production, while contributing to protecting the watershed. The private sector is involved, in that the hydropower company pays for water quality services as long as the farmers keep their side of the bargain.
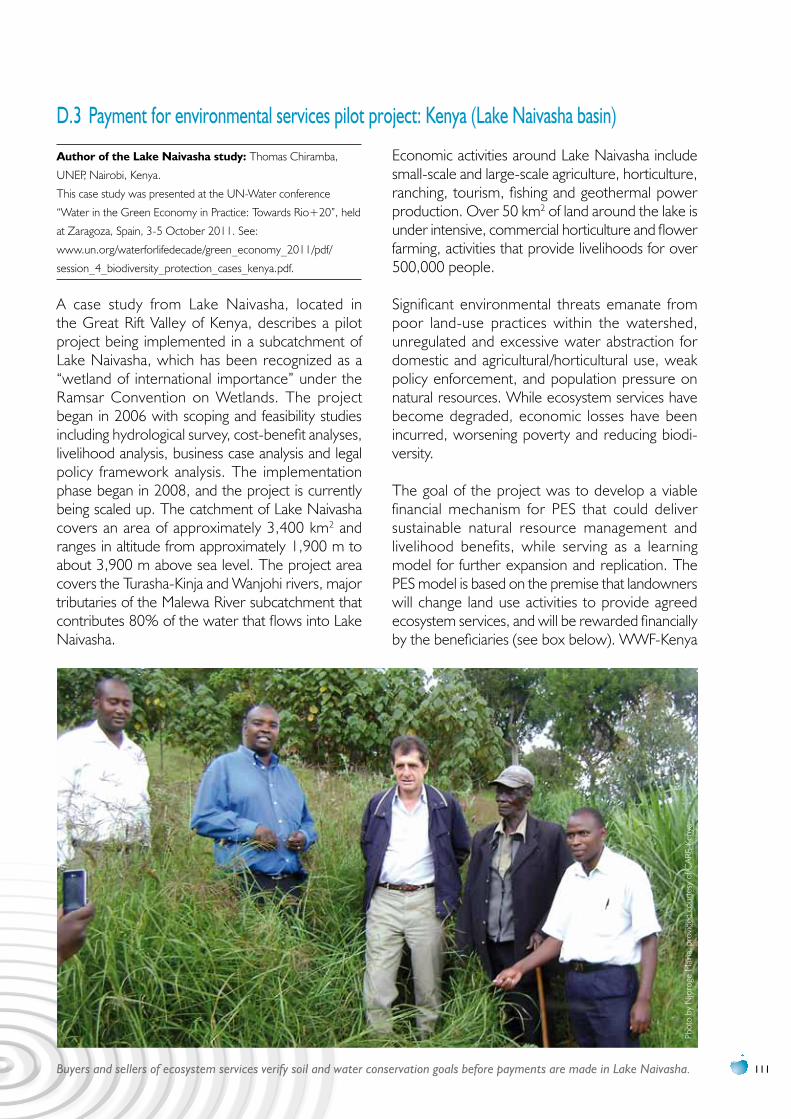
111
D.3 payment for environmental services pilot project: Kenya (Lake Naivasha basin)
Author of the Lake naivasha study: Thomas Chiramba,
UNEP, Nairobi, Kenya.
This case study was presented at the UN-Water conference
“Water in the Green Economy in Practice: Towards Rio+20”, held
at Zaragoza, Spain, 3-5 October 2011. See:
www.un.org/waterforlifedecade/green_economy_2011/pdf/
session_4_biodiversity_protection_cases_kenya.pdf.
A case study from Lake Naivasha, located in the Great Rift Valley of Kenya, describes a pilot project being implemented in a subcatchment of Lake Naivasha, which has been recognized as a “wetland of international importance” under the Ramsar Convention on Wetlands. The project began in 2006 with scoping and feasibility studies including hydrological survey, cost-benefit analyses, livelihood analysis, business case analysis and legal policy framework analysis. The implementation phase began in 2008, and the project is currently being scaled up. The catchment of Lake Naivasha covers an area of approximately 3,400 km2 and ranges in altitude from approximately 1,900 m to about 3,900 m above sea level. The project area covers the Turasha-Kinja and Wanjohi rivers, major tributaries of the Malewa River subcatchment that contributes 80% of the water that flows into Lake Naivasha.
Economic activities around Lake Naivasha include small-scale and large-scale agriculture, horticulture, ranching, tourism, fishing and geothermal power production. Over 50 km2 of land around the lake is under intensive, commercial horticulture and flower farming, activities that provide livelihoods for over 500,000 people. Significant environmental threats emanate from poor land-use practices within the watershed, unregulated and excessive water abstraction for domestic and agricultural/horticultural use, weak policy enforcement, and population pressure on natural resources. While ecosystem services have become degraded, economic losses have been incurred, worsening poverty and reducing biodi-versity.
The goal of the project was to develop a viable financial mechanism for PES that could deliver sustainable natural resource management and livelihood benefits, while serving as a learning model for further expansion and replication. The PES model is based on the premise that landowners will change land use activities to provide agreed ecosystem services, and will be rewarded financially by the beneficiaries (see box below). WWF-Kenya
Buyers and sellers of ecosystem services verify soil and water conservation goals before payments are made in Lake Naivasha.
Phot
o by
Njo
roge
Main
a, p
rovi
ded
cour
tesy
of C
ARE-
Keny
a
WATER AND GREEN GROWTH
112
and CARE-Kenya are providing funding and coordi-nation to develop the PES system as a market-based scheme for delivery of sustainable natural resource management and improved livelihoods.
The pilot project is an example of how improve-ments in environmental services (water and land-use practices) can result in economic benefits and improved livelihoods. The success of the project depended on strong stakeholder partnerships as well as the availability of baseline hydrological data and a strong business case. The market mechanism established for selling and buying of ecosystem services must be easy to use and trusted.
The structures introduced in the farms have dramat-ically reduced soil erosion and surface water run-off. Soil fertility and tree cover have been enhanced by on-farm planting of appropriate trees. However, these good results were dampened by prolonged drought conditions followed by heavy rainfall and soil erosion.
The pilot farmers’ on-farm benefits have triggered very high demand for change in the region. More than 300 additional farmers have joined the projects, stretching the existing project resources. Complex land ownership patterns in the pilot area also threaten the main pillar of the project, namely farm ownership.
This case study demonstrates how economic incentives for both ecosystem service buyers and sellers can be used to achieve significant land- and water-management improvements. The pilot project is still at an early stage of implementation, so the gains in water quality/quantity or livelihood improvements that result from management changes cannot yet be quantified. However, the overall approach is one that can serve as a model for elsewhere in Africa and other developing country contexts, where conservation of soil, water and biodiversity must be seen to be delivering tangible livelihood benefits.
Benefit Sharing Pilot Project for Lake Naivasha, Kenya
Contractual agreements are negotiated between the ecosystem stewards and ecosystem beneficiaries, making PES a benefit-sharing mechanism. In this case, the Lake Naivasha Water Resource Users Association and the Lake Naivasha Growers Group agreed to compensate small-scale landowners/farmers represented by the Upper Turasha-Kinja and Wanjohi Water Resource Users’ Associa-tions (WRUAs), who forego some potential income from land use to provide good quality water to downstream users. The two WRUAs were provided with an initial financial incentive of US$ 10,000, followed by a second payment of US$ 10,000. The first incentive was paid to 470 farmers and the second reward to 504 farmers.
Initial hydrological studies identified five degradation “hot-spots”. Two pilot sites were identified that were regarded as highly degraded and of critical importance for biodiversity conservation. “Hot-spot farms” were selected from target areas—located on steep slopes where no soil/water conservation measures were yet in place. The 565 farms in the selected pilot areas were mapped and marked.
Intensive awareness and sensitization sessions were conducted in community and public meetings, seminars, workshops and field days to enhance understanding and buy-in by the local community and all stakeholders. The communities identified some of the land management changes that could improve downstream water quality and quantity, such as grass strips or terraces to reduce runoff and erosion on steep slopes; reduced use of fertilizers and pesticides; planting native trees and high-yielding fruit trees; and training for livelihoods enhancement.
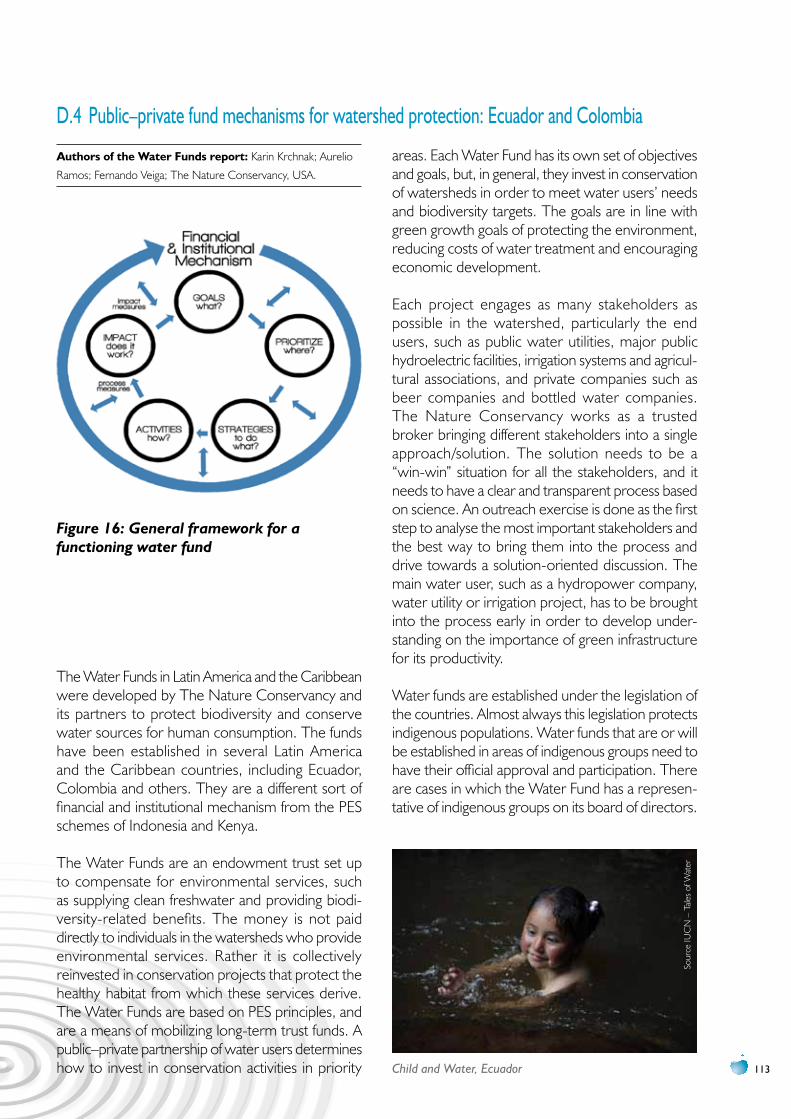
113
D.4 public–private fund mechanisms for watershed protection: Ecuador and Colombia
Authors of the Water Funds report: Karin Krchnak; Aurelio
Ramos; Fernando Veiga; The Nature Conservancy, USA.
The Water Funds in Latin America and the Caribbean were developed by The Nature Conservancy and its partners to protect biodiversity and conserve water sources for human consumption. The funds have been established in several Latin America and the Caribbean countries, including Ecuador, Colombia and others. They are a different sort of financial and institutional mechanism from the PES schemes of Indonesia and Kenya.
The Water Funds are an endowment trust set up to compensate for environmental services, such as supplying clean freshwater and providing biodi-versity-related benefits. The money is not paid directly to individuals in the watersheds who provide environmental services. Rather it is collectively reinvested in conservation projects that protect the healthy habitat from which these services derive. The Water Funds are based on PES principles, and are a means of mobilizing long-term trust funds. A public–private partnership of water users determines how to invest in conservation activities in priority
areas. Each Water Fund has its own set of objectives and goals, but, in general, they invest in conservation of watersheds in order to meet water users’ needs and biodiversity targets. The goals are in line with green growth goals of protecting the environment, reducing costs of water treatment and encouraging economic development.
Each project engages as many stakeholders as possible in the watershed, particularly the end users, such as public water utilities, major public hydroelectric facilities, irrigation systems and agricul-tural associations, and private companies such as beer companies and bottled water companies. The Nature Conservancy works as a trusted broker bringing different stakeholders into a single approach/solution. The solution needs to be a “win-win” situation for all the stakeholders, and it needs to have a clear and transparent process based on science. An outreach exercise is done as the first step to analyse the most important stakeholders and the best way to bring them into the process and drive towards a solution-oriented discussion. The main water user, such as a hydropower company, water utility or irrigation project, has to be brought into the process early in order to develop under-standing on the importance of green infrastructure for its productivity.
Water funds are established under the legislation of the countries. Almost always this legislation protects indigenous populations. Water funds that are or will be established in areas of indigenous groups need to have their official approval and participation. There are cases in which the Water Fund has a represen-tative of indigenous groups on its board of directors.
Figure 16: General framework for a functioning water fund
Sour
ce IU
CN
– T
ales
of W
ater
Child and Water, Ecuador
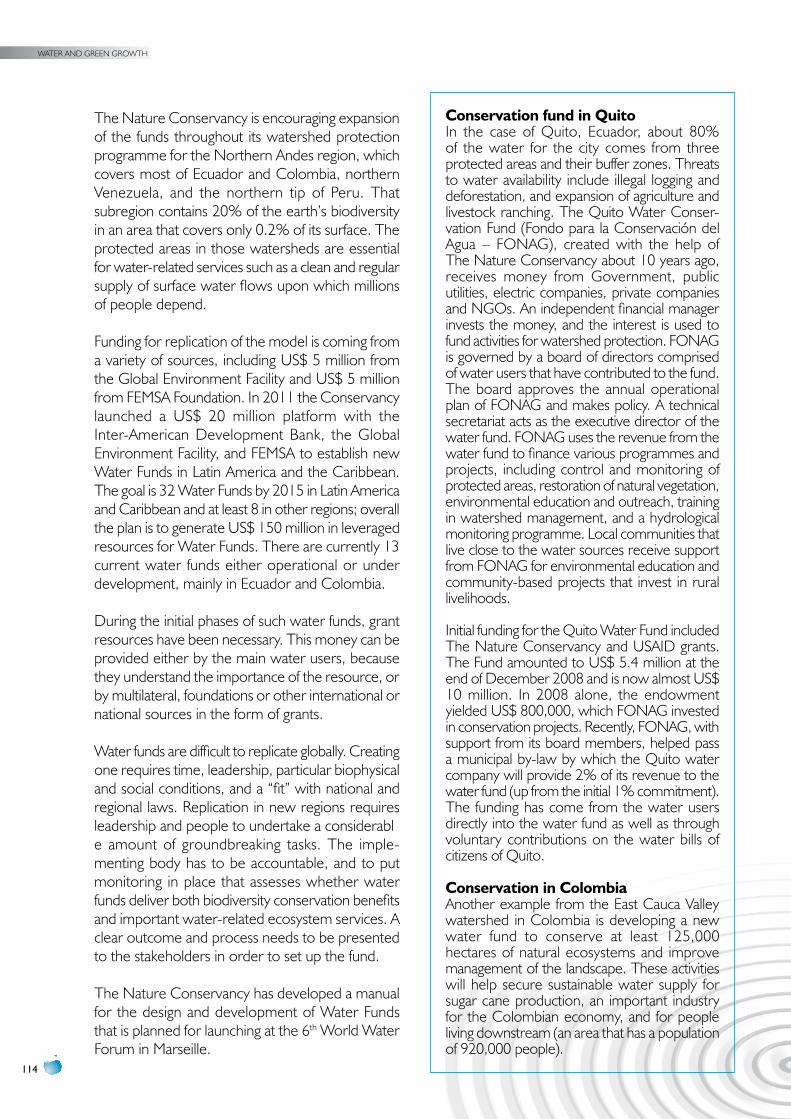
WATER AND GREEN GROWTH
114
The Nature Conservancy is encouraging expansion of the funds throughout its watershed protection programme for the Northern Andes region, which covers most of Ecuador and Colombia, northern Venezuela, and the northern tip of Peru. That subregion contains 20% of the earth’s biodiversity in an area that covers only 0.2% of its surface. The protected areas in those watersheds are essential for water-related services such as a clean and regular supply of surface water flows upon which millions of people depend.
Funding for replication of the model is coming from a variety of sources, including US$ 5 million from the Global Environment Facility and US$ 5 million from FEMSA Foundation. In 2011 the Conservancy launched a US$ 20 million platform with the Inter-American Development Bank, the Global Environment Facility, and FEMSA to establish new Water Funds in Latin America and the Caribbean. The goal is 32 Water Funds by 2015 in Latin America and Caribbean and at least 8 in other regions; overall the plan is to generate US$ 150 million in leveraged resources for Water Funds. There are currently 13 current water funds either operational or under development, mainly in Ecuador and Colombia.
During the initial phases of such water funds, grant resources have been necessary. This money can be provided either by the main water users, because they understand the importance of the resource, or by multilateral, foundations or other international or national sources in the form of grants.
Water funds are difficult to replicate globally. Creating one requires time, leadership, particular biophysical and social conditions, and a “fit” with national and regional laws. Replication in new regions requires leadership and people to undertake a considerable amount of groundbreaking tasks. The imple-menting body has to be accountable, and to put monitoring in place that assesses whether water funds deliver both biodiversity conservation benefits and important water-related ecosystem services. A clear outcome and process needs to be presented to the stakeholders in order to set up the fund.
The Nature Conservancy has developed a manual for the design and development of Water Funds that is planned for launching at the 6th World Water Forum in Marseille.
conservation fund in QuitoIn the case of Quito, Ecuador, about 80% of the water for the city comes from three protected areas and their buffer zones. Threats to water availability include illegal logging and deforestation, and expansion of agriculture and livestock ranching. The Quito Water Conser-vation Fund (Fondo para la Conservación del Agua – FONAG), created with the help of The Nature Conservancy about 10 years ago, receives money from Government, public utilities, electric companies, private companies and NGOs. An independent financial manager invests the money, and the interest is used to fund activities for watershed protection. FONAG is governed by a board of directors comprised of water users that have contributed to the fund. The board approves the annual operational plan of FONAG and makes policy. A technical secretariat acts as the executive director of the water fund. FONAG uses the revenue from the water fund to finance various programmes and projects, including control and monitoring of protected areas, restoration of natural vegetation, environmental education and outreach, training in watershed management, and a hydrological monitoring programme. Local communities that live close to the water sources receive support from FONAG for environmental education and community-based projects that invest in rural livelihoods.
Initial funding for the Quito Water Fund included The Nature Conservancy and USAID grants. The Fund amounted to US$ 5.4 million at the end of December 2008 and is now almost US$ 10 million. In 2008 alone, the endowment yielded US$ 800,000, which FONAG invested in conservation projects. Recently, FONAG, with support from its board members, helped pass a municipal by-law by which the Quito water company will provide 2% of its revenue to the water fund (up from the initial 1% commitment). The funding has come from the water users directly into the water fund as well as through voluntary contributions on the water bills of citizens of Quito.
conservation in colombiaAnother example from the East Cauca Valley watershed in Colombia is developing a new water fund to conserve at least 125,000 hectares of natural ecosystems and improve management of the landscape. These activities will help secure sustainable water supply for sugar cane production, an important industry for the Colombian economy, and for people living downstream (an area that has a population of 920,000 people).
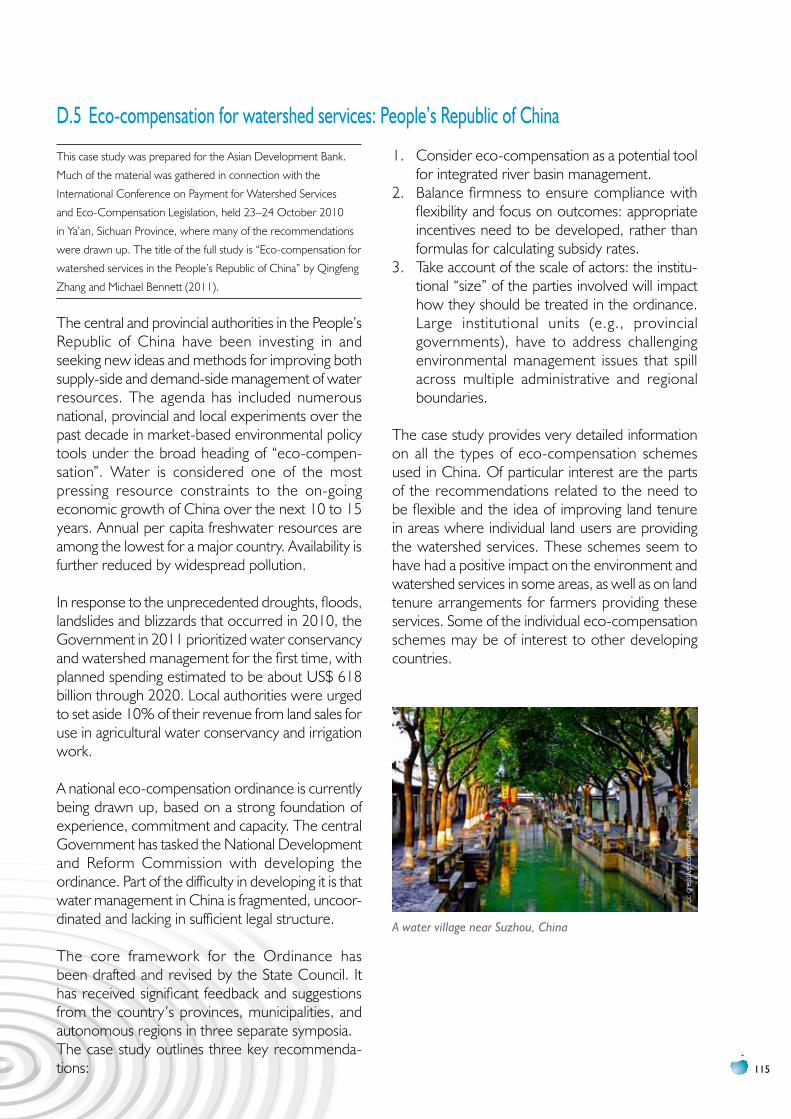
115
D.5 Eco-compensation for watershed services: people’s Republic of China
This case study was prepared for the Asian Development Bank.
Much of the material was gathered in connection with the
International Conference on Payment for Watershed Services
and Eco-Compensation Legislation, held 23–24 October 2010
in Ya’an, Sichuan Province, where many of the recommendations
were drawn up. The title of the full study is “Eco-compensation for
watershed services in the People’s Republic of China” by Qingfeng
Zhang and Michael Bennett (2011).
The central and provincial authorities in the People’s Republic of China have been investing in and seeking new ideas and methods for improving both supply-side and demand-side management of water resources. The agenda has included numerous national, provincial and local experiments over the past decade in market-based environmental policy tools under the broad heading of “eco-compen-sation”. Water is considered one of the most pressing resource constraints to the on-going economic growth of China over the next 10 to 15 years. Annual per capita freshwater resources are among the lowest for a major country. Availability is further reduced by widespread pollution.
In response to the unprecedented droughts, floods, landslides and blizzards that occurred in 2010, the Government in 2011 prioritized water conservancy and watershed management for the first time, with planned spending estimated to be about US$ 618 billion through 2020. Local authorities were urged to set aside 10% of their revenue from land sales for use in agricultural water conservancy and irrigation work.
A national eco-compensation ordinance is currently being drawn up, based on a strong foundation of experience, commitment and capacity. The central Government has tasked the National Development and Reform Commission with developing the ordinance. Part of the difficulty in developing it is that water management in China is fragmented, uncoor-dinated and lacking in sufficient legal structure.
The core framework for the Ordinance has been drafted and revised by the State Council. It has received significant feedback and suggestions from the country’s provinces, municipalities, and autonomous regions in three separate symposia. The case study outlines three key recommenda-tions:
1. Consider eco-compensation as a potential tool for integrated river basin management.
2. Balance firmness to ensure compliance with flexibility and focus on outcomes: appropriate incentives need to be developed, rather than formulas for calculating subsidy rates.
3. Take account of the scale of actors: the institu-tional “size” of the parties involved will impact how they should be treated in the ordinance. Large institutional units (e.g., provincial governments), have to address challenging environmental management issues that spill across multiple administrative and regional boundaries.
The case study provides very detailed information on all the types of eco-compensation schemes used in China. Of particular interest are the parts of the recommendations related to the need to be flexible and the idea of improving land tenure in areas where individual land users are providing the watershed services. These schemes seem to have had a positive impact on the environment and watershed services in some areas, as well as on land tenure arrangements for farmers providing these services. Some of the individual eco-compensation schemes may be of interest to other developing countries.
cc c
reat
ivec
omm
ons.
org
– Al
ika S
eu
A water village near Suzhou, China
WATER AND GREEN GROWTH
116
Examples of eco-compensation in ChinaThe largest PES afforestation scheme in the world is “Conversion of Cropland to Forests and Grassland”. It pays farmers annual subsidies to withdraw from farming and afforest or plant grasses on marginal or sloping cropland. Since its launch in 1999, it has covered more than 9 million ha of cropland and has invested more than US$ 26.9 billion. Another such project with major environmental impacts is the “Sloping Land Conversion Programme” that started in 1999. It is the largest land retirement programme in the developing world, having a primary goal of converting 15 million ha of cropland to forests (over 4 million of which is on land with slopes greater than 25˚) and a secondary goal of afforesting a roughly equal area of wasteland. These goals were to be achieved by 2010. The programme covers erosion-prone farmland within vulnerable areas of the watershed of the two largest rivers in Chinathe Yangtze and Yellow Riverscovering a total of about 40 million ha. Compensation is given in cash and/or grain supplies.
The expected environmental benefits of the programme include controlling soil erosion on 23 million ha and stopping desertification of 27 million ha, which will reduce sediment into the Yangtze and Huanghe Rivers by 260 million tonnes. Pending successful completion, the programme could represent a 10% to 20% increase in China’s national forest area and a 10% decrease in current cultivated area (Bennett 2008).
The National Forest Protection Programme aims to restructure the State forest sector to improve its economic and environmental sustainability. In addition to banning or significantly reducing logging in forest areas, the NFPP has introduced a menu of subsidies to State forest management units for affor-estation, reforestation and forest management tasks, with expenditures of more than US$ 1.1 billion.
The Forest Ecological Compensation Fund pays annual subsidies to households, communities, and the relevant local forest management authorities for the management and protection of pre-existing forestland that is deemed to be a “public benefit forest area”. It has already enrolled 70 million ha of forest and has invested US$ 4.6 billion since its launch in 2001. Furthermore, in 2010, the Government doubled the subsidy rate from the equivalent of approximately US$ 11.50 to $ 23.00 per hectare.
The Jinhua eco-compensation scheme illustrates how economic growth and improvement in livelihoods can be generated through water-use rights trading. A water-use rights transfer contract was drawn up in 2000 between two municipalities in the Jinhua River watershed in Zhejiang. Under the contract, the more developed lower-watershed Yiwu Municipality has agreed to pay US$ 32 million in water resource development funds to upper-watershed Dongyang Municipality for the purchase of use rights to 50 million m3 of high quality water. As part of this arrangement, Dongyang is improving water-saving measures and water-use efficiency, while Yiwu is contributing to the development and upgrading of the relevant infrastructure.
The total number of watershed eco-compensation schemes has surged from eight in 1999 to over 30 in 2008, covering about 290 million ha, and the value of annual transactions under these schemes has increased from an estimated US$ 860 million in 1999 to $ 7,800 million by 2008.
117
Common elementsSection D focuses on financing approaches that support green growth policies—payment for environ-mental services and other systems for rewarding municipalities, communities or individuals for protecting the watershed and the source of water resources. All involve partnerships among public and private stakeholders and all involve both upstream and downstream economic activities. Among the common elements that support green growth are: •Negotiated financing agreements that involve the Government, private sector, local people and scientists with an understanding of the relationship between land use and watershed functions.
•Backing by Government policy and national water management institutions.•Payment for services by the main users of water—industry, municipalities and downstream communities, water and sewerage utilities, hydropower producers, mining and oil companies, agricultural associa-tions and cooperatives.
•Variety of funding sources—Government budget, international donors, development banks, utilities, private companies, NGOs.
•Government policy that can be flexible to meet desired outcomes, rather than constrained by rigid formulas.
•Good social mobilization—support to people in the watershed who can protect the water and forest, including farmers in protected areas.
•Monetary and non-monetary compensation—conditional land tenure and other improvements in rural livelihoods.
•Funding schemes that spread benefits and costs among ecosystem service buyers and sellers—industries, municipalities, communities, utilities and the ecosystem.
•Payments and incentives conditional on results—farmers have to keep their share of the bargain.•Extensive research and information gathering required to structure a PES scheme, agree on the conditions binding the contract and certify recipients of the funds.
•Site-specific information needed on soils, geology, flow regime, roads, landscape, etc.—one size does not fit all.
•Innovative and adaptive governance models that engage citizens in community-level water management, community forestry, community conservation projects and decision-making—strong partnerships among NGOs, municipalities and central government agencies at the river basin level. Promotion of affordable green alternatives to large-scale infrastructure solutions, such as filtration plants and centralized sewerage systems.
ÎÎ environmental benefits: Reduced pollution; improved water quality and health of ecosystems; reduction in siltation and erosion; improved vegetation cover.ÎÎ economic benefits: Affordable green alternatives to large-scale infrastructure solutions; benefits and costs spread among ecosystem service buyers and sellers; savings on water treatment costs in municipal areas; mobilization of funds from a variety of sources.ÎÎ Social benefits: Payments and non-monetary compensation to farmers and communities in the watershed to protect the water and forest; improved health in upstream and downstream areas; greater security for people in watershed areas.
WATER AND GREEN GROWTH
118
E. INNOvATION AND TECHNOLOGy Traditional water and sanitation technologies were not designed to conserve water. Many were developed in the United States and Europe, where water was abundant. In many cases the technologies encouraged consumers to use more water rather than conserve it. In many parts of the United States, water charges are regressive, charging less per unit the more water a consumer uses, encouraging waste and discouraging conservation. In recent years, awareness of the need to conserve water has risen, but not sufficiently to induce people to use water more wisely. With water shortages looming in the future, municipalities, communities and individuals must consider the welfare of our environment and the need to conserve and protect our precious water resources.
Technological innovations can increase water avail-ability from water savings and pollution control. Considered green-growth solutions, they improve the environment and reduce costs to users. They include recycling and reuse of water, low water-using appliances, efficient irrigation systems, decen-tralized sewerage systems, rainwater catchments and reclamation of nutrients. With green-growth innovations, energy costs can also be reduced on fossil fuel consumption, GHG emissions and climate change impacts. Other technological tools that contribute to green growth include information and communications technologies that assist water managers to encourage conservation and manage demand. The software solution from Australia could be replicated by water managers in other countries who are trying to implement demand management to reduce consumption.
Innovations can also result in economic benefits: the case study from the State of Oregon shows that the nutrients removed from water and wastewater treatment can be sold as commercial fertilizer. This technological solution reuses a recovered “waste” product (phosphorus) to restore wildlife habitat. At the same time it helps the utility meet regulatory requirements. Nutrient recovery contributes to a change in thinking through which wastewater treatment plants become resource recovery plants.
The case study from Gujarat State chronicles a combination of huge investments in water infra-
structure and modifications in water and energy policies that have affected millions of people throughout the State. One of the important lessons learned from the case study is that technological initiatives to improve water supply for domestic consumption and irrigation have to be comple-mented by grassroots people’s participation in management and distribution of water. The community-managed water supply programme in Gujarat has proved to be a model for the entire country. Another significant lesson from this case is that large water resources development projects have to be balanced by small-scale innovations, such as micro-water harvesting, in order to make a large impact on agricultural production.
Key factors for success:•Demand management and improved efficiency as means to water conservation and energy savings
•Large-scale infrastructure balanced with small-scale innovations
•Increased water availability from water savings, recycling and pollution control
•Better management decisions from enhanced information and data systems
•Nutrient recovery from waste products
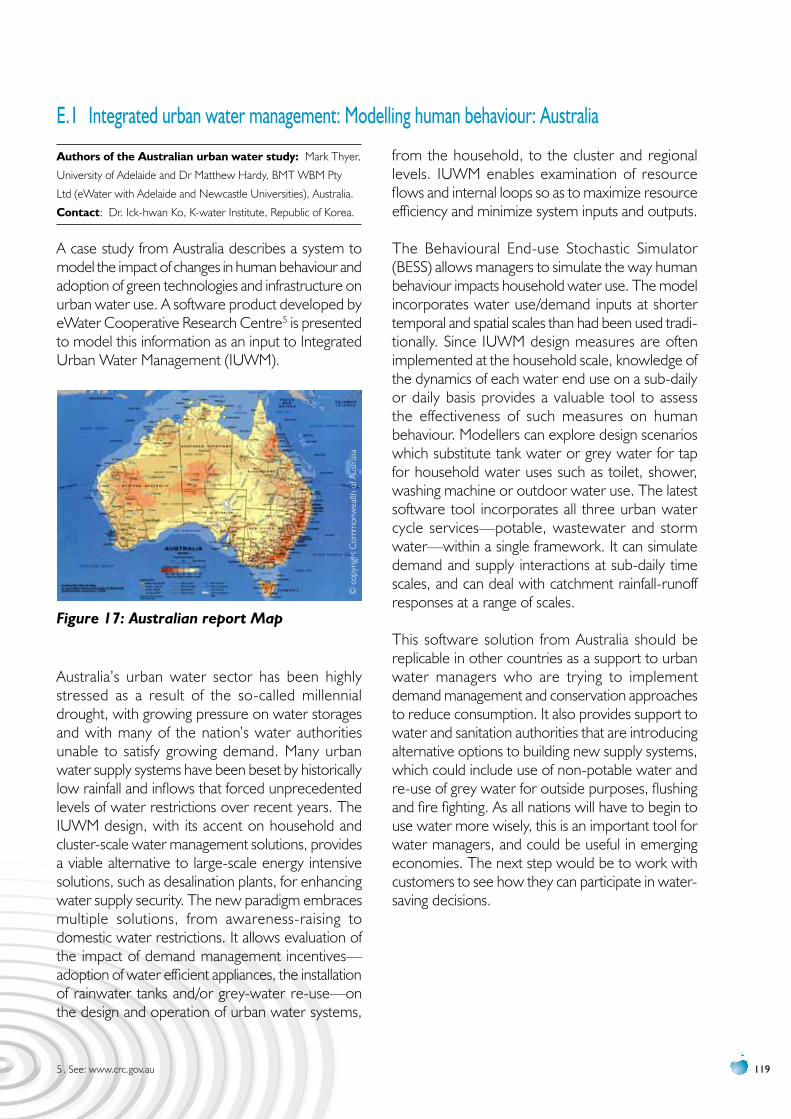
119
E.1 Integrated urban water management: Modelling human behaviour: Australia
Authors of the Australian urban water study: Mark Thyer,
University of Adelaide and Dr Matthew Hardy, BMT WBM Pty
Ltd (eWater with Adelaide and Newcastle Universities), Australia.
contact: Dr. Ick-hwan Ko, K-water Institute, Republic of Korea.
A case study from Australia describes a system to model the impact of changes in human behaviour and adoption of green technologies and infrastructure on urban water use. A software product developed by eWater Cooperative Research Centre5 is presented to model this information as an input to Integrated Urban Water Management (IUWM).
Australia’s urban water sector has been highly stressed as a result of the so-called millennial drought, with growing pressure on water storages and with many of the nation’s water authorities unable to satisfy growing demand. Many urban water supply systems have been beset by historically low rainfall and inflows that forced unprecedented levels of water restrictions over recent years. The IUWM design, with its accent on household and cluster-scale water management solutions, provides a viable alternative to large-scale energy intensive solutions, such as desalination plants, for enhancing water supply security. The new paradigm embraces multiple solutions, from awareness-raising to domestic water restrictions. It allows evaluation of the impact of demand management incentives—adoption of water efficient appliances, the installation of rainwater tanks and/or grey-water re-use—on the design and operation of urban water systems,
5 . See: www.crc.gov.au
from the household, to the cluster and regional levels. IUWM enables examination of resource flows and internal loops so as to maximize resource efficiency and minimize system inputs and outputs.
The Behavioural End-use Stochastic Simulator (BESS) allows managers to simulate the way human behaviour impacts household water use. The model incorporates water use/demand inputs at shorter temporal and spatial scales than had been used tradi-tionally. Since IUWM design measures are often implemented at the household scale, knowledge of the dynamics of each water end use on a sub-daily or daily basis provides a valuable tool to assess the effectiveness of such measures on human behaviour. Modellers can explore design scenarios which substitute tank water or grey water for tap for household water uses such as toilet, shower, washing machine or outdoor water use. The latest software tool incorporates all three urban water cycle services—potable, wastewater and storm water—within a single framework. It can simulate demand and supply interactions at sub-daily time scales, and can deal with catchment rainfall-runoff responses at a range of scales.
This software solution from Australia should be replicable in other countries as a support to urban water managers who are trying to implement demand management and conservation approaches to reduce consumption. It also provides support to water and sanitation authorities that are introducing alternative options to building new supply systems, which could include use of non-potable water and re-use of grey water for outside purposes, flushing and fire fighting. As all nations will have to begin to use water more wisely, this is an important tool for water managers, and could be useful in emerging economies. The next step would be to work with customers to see how they can participate in water-saving decisions.
© c
opyr
ight
Com
mon
wea
lth o
f Aus
tralia
Figure 17: Australian report Map
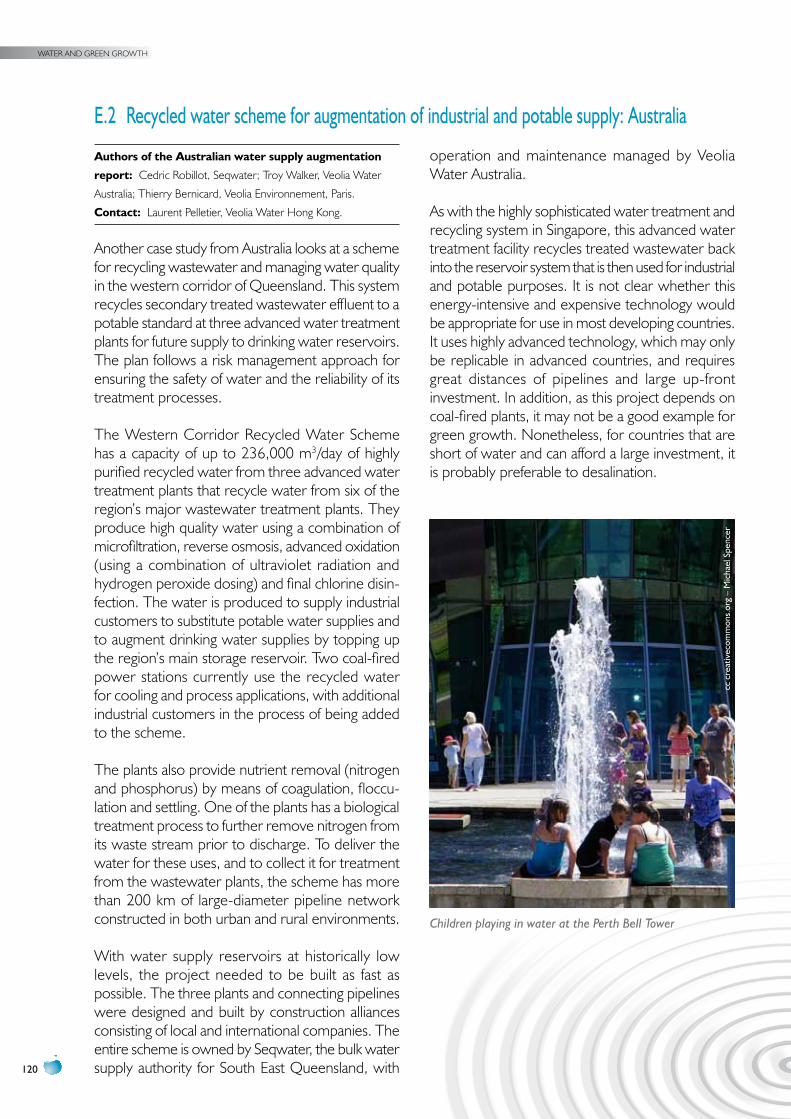
WATER AND GREEN GROWTH
120
E.2 Recycled water scheme for augmentation of industrial and potable supply: Australia
Authors of the Australian water supply augmentation
report: Cedric Robillot, Seqwater; Troy Walker, Veolia Water
Australia; Thierry Bernicard, Veolia Environnement, Paris.
contact: Laurent Pelletier, Veolia Water Hong Kong.
Another case study from Australia looks at a scheme for recycling wastewater and managing water quality in the western corridor of Queensland. This system recycles secondary treated wastewater effluent to a potable standard at three advanced water treatment plants for future supply to drinking water reservoirs. The plan follows a risk management approach for ensuring the safety of water and the reliability of its treatment processes.
The Western Corridor Recycled Water Scheme has a capacity of up to 236,000 m3/day of highly purified recycled water from three advanced water treatment plants that recycle water from six of the region’s major wastewater treatment plants. They produce high quality water using a combination of microfiltration, reverse osmosis, advanced oxidation (using a combination of ultraviolet radiation and hydrogen peroxide dosing) and final chlorine disin-fection. The water is produced to supply industrial customers to substitute potable water supplies and to augment drinking water supplies by topping up the region’s main storage reservoir. Two coal-fired power stations currently use the recycled water for cooling and process applications, with additional industrial customers in the process of being added to the scheme.
The plants also provide nutrient removal (nitrogen and phosphorus) by means of coagulation, floccu-lation and settling. One of the plants has a biological treatment process to further remove nitrogen from its waste stream prior to discharge. To deliver the water for these uses, and to collect it for treatment from the wastewater plants, the scheme has more than 200 km of large-diameter pipeline network constructed in both urban and rural environments.
With water supply reservoirs at historically low levels, the project needed to be built as fast as possible. The three plants and connecting pipelines were designed and built by construction alliances consisting of local and international companies. The entire scheme is owned by Seqwater, the bulk water supply authority for South East Queensland, with
operation and maintenance managed by Veolia Water Australia.
As with the highly sophisticated water treatment and recycling system in Singapore, this advanced water treatment facility recycles treated wastewater back into the reservoir system that is then used for industrial and potable purposes. It is not clear whether this energy-intensive and expensive technology would be appropriate for use in most developing countries. It uses highly advanced technology, which may only be replicable in advanced countries, and requires great distances of pipelines and large up-front investment. In addition, as this project depends on coal-fired plants, it may not be a good example for green growth. Nonetheless, for countries that are short of water and can afford a large investment, it is probably preferable to desalination.
cc c
reat
ivec
omm
ons.
org
– M
icha
el S
penc
er
Children playing in water at the Perth Bell Tower
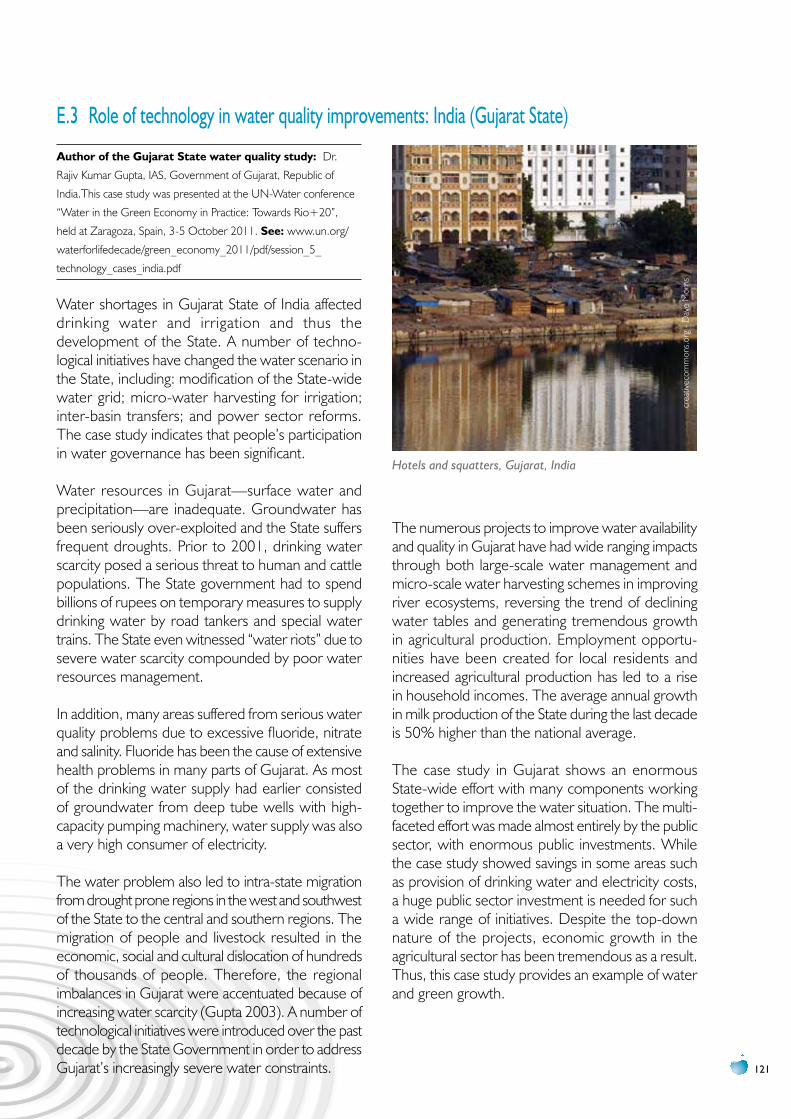
121
E.3 Role of technology in water quality improvements: India (Gujarat State)
Author of the Gujarat State water quality study: Dr.
Rajiv Kumar Gupta, IAS, Government of Gujarat, Republic of
India.This case study was presented at the UN-Water conference
“Water in the Green Economy in Practice: Towards Rio+20”,
held at Zaragoza, Spain, 3-5 October 2011. See: www.un.org/
waterforlifedecade/green_economy_2011/pdf/session_5_
technology_cases_india.pdf
Water shortages in Gujarat State of India affected drinking water and irrigation and thus the development of the State. A number of techno-logical initiatives have changed the water scenario in the State, including: modification of the State-wide water grid; micro-water harvesting for irrigation; inter-basin transfers; and power sector reforms. The case study indicates that people’s participation in water governance has been significant.
Water resources in Gujarat—surface water and precipitation—are inadequate. Groundwater has been seriously over-exploited and the State suffers frequent droughts. Prior to 2001, drinking water scarcity posed a serious threat to human and cattle populations. The State government had to spend billions of rupees on temporary measures to supply drinking water by road tankers and special water trains. The State even witnessed “water riots” due to severe water scarcity compounded by poor water resources management.
In addition, many areas suffered from serious water quality problems due to excessive fluoride, nitrate and salinity. Fluoride has been the cause of extensive health problems in many parts of Gujarat. As most of the drinking water supply had earlier consisted of groundwater from deep tube wells with high-capacity pumping machinery, water supply was also a very high consumer of electricity.
The water problem also led to intra-state migration from drought prone regions in the west and southwest of the State to the central and southern regions. The migration of people and livestock resulted in the economic, social and cultural dislocation of hundreds of thousands of people. Therefore, the regional imbalances in Gujarat were accentuated because of increasing water scarcity (Gupta 2003). A number of technological initiatives were introduced over the past decade by the State Government in order to address Gujarat’s increasingly severe water constraints.
The numerous projects to improve water availability and quality in Gujarat have had wide ranging impacts through both large-scale water management and micro-scale water harvesting schemes in improving river ecosystems, reversing the trend of declining water tables and generating tremendous growth in agricultural production. Employment opportu-nities have been created for local residents and increased agricultural production has led to a rise in household incomes. The average annual growth in milk production of the State during the last decade is 50% higher than the national average.
The case study in Gujarat shows an enormous State-wide effort with many components working together to improve the water situation. The multi-faceted effort was made almost entirely by the public sector, with enormous public investments. While the case study showed savings in some areas such as provision of drinking water and electricity costs, a huge public sector investment is needed for such a wide range of initiatives. Despite the top-down nature of the projects, economic growth in the agricultural sector has been tremendous as a result. Thus, this case study provides an example of water and green growth.
Hotels and squatters, Gujarat, India
crea
tivec
omm
ons.
org
- Dav
e M
orris
WATER AND GREEN GROWTH
122
Water-related initiatives in Gujarat State, india
improvements in the water gridThe State drew up an ambitious strategy for bulk water transmission from sustainable surface water resources to areas with shortages. The investment requirement in large-scale infrastructure was huge, including almost 2,000 km of bulk pipelines, more than 115,000 km of distribution pipelines and over 150 water filtration and treatment plants. Treated water is delivered to more than 10,500 villages and 127 towns in the State, ensuring water supply to about 65% of State’s population in drought-prone areas. This initiative has not only largely solved the problems of drinking water and improved water quality, but has also relieved the problem of excessive fluoride contamination.
Power sector reformsIn several villages, the operational hours for the bore wells have been reduced, and solar pumps have been commissioned in several hundred villages. In various parts of the State, including coastal and tribal areas, rooftop rainwater harvesting structures have also been installed in public buildings, schools and households, which have resulted in substantial energy savings. The Jyotigram Scheme is an initiative that uses an intelligent rationing system for farm power supply to limit the competitive pumping of water and to address the common property concerns inherent in groundwater irrigation. Better access to water allowed for production of high value fruits and vegetables, livestock and fisheries.
Rainwater harvesting for irrigationAnother technique used to improve water supply to small and marginal farmers was the introduction of rainwater harvesting for micro-irrigation. The Sardar Patel Participatory Conservation Project involves construction of check dams and village tanks/ponds by a designated beneficiary group or an NGO, with technical and financial assistance from the district office. Six prototype designs were circulated with a maximum cost of 1 million rupees. More than 350,000 check dams and village ponds/tanks have been created in the last eight years, providing direct benefit to over 13 million people in rural Gujarat. Gujarat has also created the Gujarat Green Revolution Company Ltd. to popularize the adoption of drip irrigation among farmers. The company offers highly subsidized loans to farmers and has simplified the administrative procedures for accessing them. Around 100,000 ha are covered by drip irrigation, mainly for high-value crops.
new water governance model The creation of the Water and Sanitation Management Organization was a significant shift in the role of Government from provider to facilitator by empowering village-level institutions through extensive capacity-building and facilitation. It has brought about effective citizen engagement through its innovative governance model for community-led water supply programme throughout the State of Gujarat. More than 16,700 village water and sanitation committees have been formed in the State and are ready to take responsibility for managing of service delivery and water resources at the decentralized level. More than 6,500 villages have already commissioned infrastructure and water conservation projects in a demand driven mode, with another 4,550 villages currently implementing community-managed rural water supply programmes.
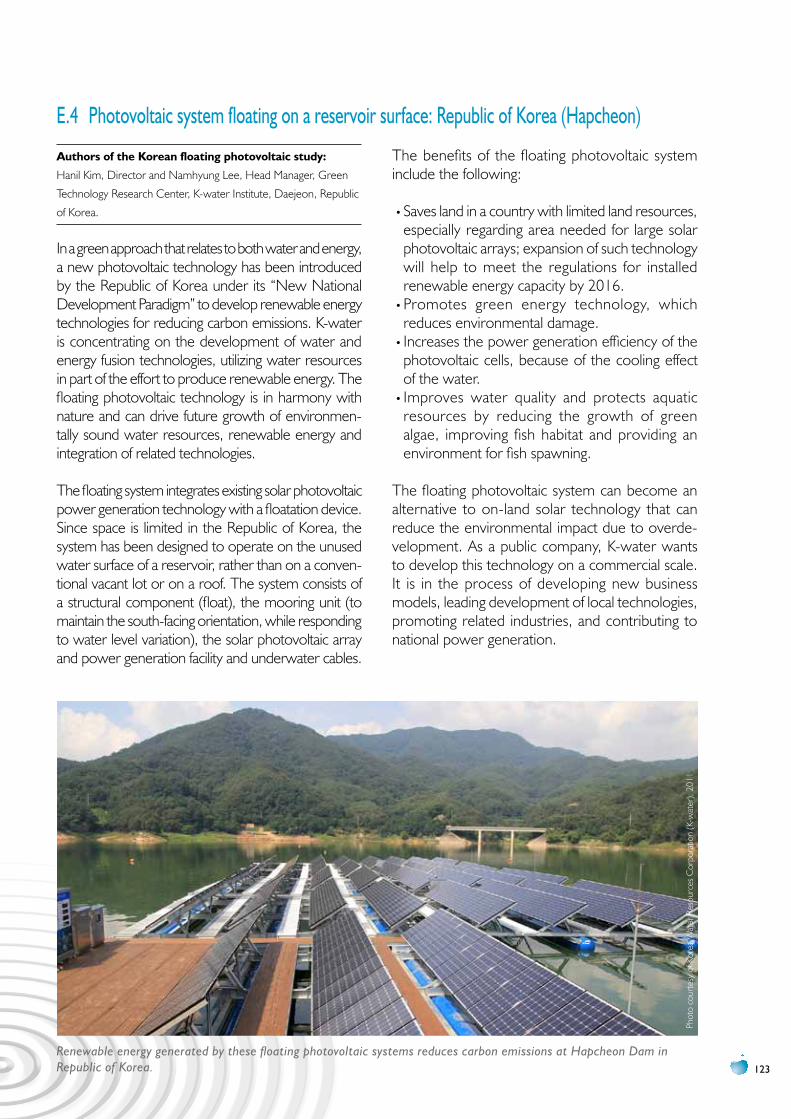
123
E.4 photovoltaic system floating on a reservoir surface: Republic of Korea (Hapcheon)
Authors of the Korean floating photovoltaic study:
Hanil Kim, Director and Namhyung Lee, Head Manager, Green
Technology Research Center, K-water Institute, Daejeon, Republic
of Korea.
In a green approach that relates to both water and energy, a new photovoltaic technology has been introduced by the Republic of Korea under its “New National Development Paradigm” to develop renewable energy technologies for reducing carbon emissions. K-water is concentrating on the development of water and energy fusion technologies, utilizing water resources in part of the effort to produce renewable energy. The floating photovoltaic technology is in harmony with nature and can drive future growth of environmen-tally sound water resources, renewable energy and integration of related technologies.
The floating system integrates existing solar photovoltaic power generation technology with a floatation device. Since space is limited in the Republic of Korea, the system has been designed to operate on the unused water surface of a reservoir, rather than on a conven-tional vacant lot or on a roof. The system consists of a structural component (float), the mooring unit (to maintain the south-facing orientation, while responding to water level variation), the solar photovoltaic array and power generation facility and underwater cables.
The benefits of the floating photovoltaic system include the following:
•Saves land in a country with limited land resources, especially regarding area needed for large solar photovoltaic arrays; expansion of such technology will help to meet the regulations for installed renewable energy capacity by 2016.
•Promotes green energy technology, which reduces environmental damage.
•Increases the power generation efficiency of the photovoltaic cells, because of the cooling effect of the water.
•Improves water quality and protects aquatic resources by reducing the growth of green algae, improving fish habitat and providing an environment for fish spawning.
The floating photovoltaic system can become an alternative to on-land solar technology that can reduce the environmental impact due to overde-velopment. As a public company, K-water wants to develop this technology on a commercial scale. It is in the process of developing new business models, leading development of local technologies, promoting related industries, and contributing to national power generation.
Phot
o co
urte
sy o
f Kor
ea W
ater
Res
ourc
es C
orpo
ratio
n (K
-wat
er),
2011
Renewable energy generated by these floating photovoltaic systems reduces carbon emissions at Hapcheon Dam in Republic of Korea.
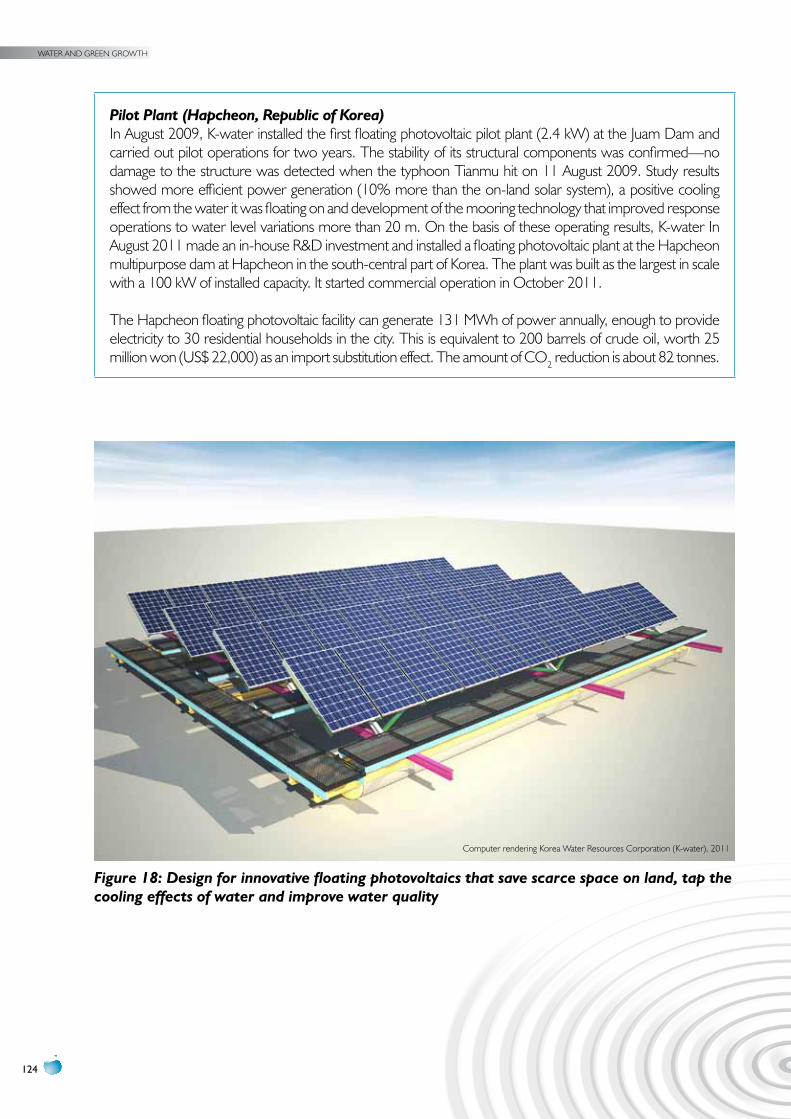
WATER AND GREEN GROWTH
124
Pilot Plant (Hapcheon, Republic of Korea)In August 2009, K-water installed the first floating photovoltaic pilot plant (2.4 kW) at the Juam Dam and carried out pilot operations for two years. The stability of its structural components was confirmed—no damage to the structure was detected when the typhoon Tianmu hit on 11 August 2009. Study results showed more efficient power generation (10% more than the on-land solar system), a positive cooling effect from the water it was floating on and development of the mooring technology that improved response operations to water level variations more than 20 m. On the basis of these operating results, K-water In August 2011 made an in-house R&D investment and installed a floating photovoltaic plant at the Hapcheon multipurpose dam at Hapcheon in the south-central part of Korea. The plant was built as the largest in scale with a 100 kW of installed capacity. It started commercial operation in October 2011.
The Hapcheon floating photovoltaic facility can generate 131 MWh of power annually, enough to provide electricity to 30 residential households in the city. This is equivalent to 200 barrels of crude oil, worth 25 million won (US$ 22,000) as an import substitution effect. The amount of CO2 reduction is about 82 tonnes.
Figure 18: Design for innovative floating photovoltaics that save scarce space on land, tap the cooling effects of water and improve water quality
Computer rendering Korea Water Resources Corporation (K-water), 2011
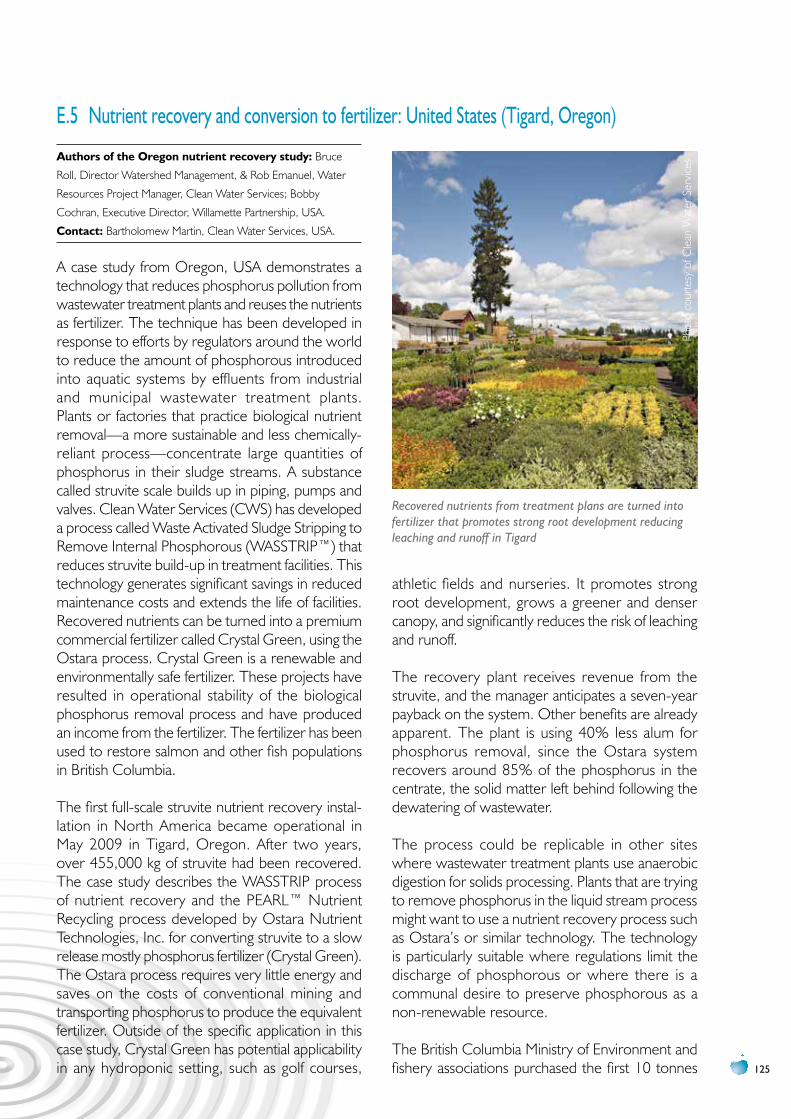
125
E.5 Nutrient recovery and conversion to fertilizer: united States (Tigard, Oregon)
Authors of the oregon nutrient recovery study: Bruce
Roll, Director Watershed Management, & Rob Emanuel, Water
Resources Project Manager, Clean Water Services; Bobby
Cochran, Executive Director, Willamette Partnership, USA.
contact: Bartholomew Martin, Clean Water Services, USA.
A case study from Oregon, USA demonstrates a technology that reduces phosphorus pollution from wastewater treatment plants and reuses the nutrients as fertilizer. The technique has been developed in response to efforts by regulators around the world to reduce the amount of phosphorous introduced into aquatic systems by effluents from industrial and municipal wastewater treatment plants. Plants or factories that practice biological nutrient removal—a more sustainable and less chemically-reliant process—concentrate large quantities of phosphorus in their sludge streams. A substance called struvite scale builds up in piping, pumps and valves. Clean Water Services (CWS) has developed a process called Waste Activated Sludge Stripping to Remove Internal Phosphorous (WASSTRIP™) that reduces struvite build-up in treatment facilities. This technology generates significant savings in reduced maintenance costs and extends the life of facilities. Recovered nutrients can be turned into a premium commercial fertilizer called Crystal Green, using the Ostara process. Crystal Green is a renewable and environmentally safe fertilizer. These projects have resulted in operational stability of the biological phosphorus removal process and have produced an income from the fertilizer. The fertilizer has been used to restore salmon and other fish populations in British Columbia.
The first full-scale struvite nutrient recovery instal-lation in North America became operational in May 2009 in Tigard, Oregon. After two years, over 455,000 kg of struvite had been recovered. The case study describes the WASSTRIP process of nutrient recovery and the PEARL™ Nutrient Recycling process developed by Ostara Nutrient Technologies, Inc. for converting struvite to a slow release mostly phosphorus fertilizer (Crystal Green). The Ostara process requires very little energy and saves on the costs of conventional mining and transporting phosphorus to produce the equivalent fertilizer. Outside of the specific application in this case study, Crystal Green has potential applicability in any hydroponic setting, such as golf courses,
athletic fields and nurseries. It promotes strong root development, grows a greener and denser canopy, and significantly reduces the risk of leaching and runoff.
The recovery plant receives revenue from the struvite, and the manager anticipates a seven-year payback on the system. Other benefits are already apparent. The plant is using 40% less alum for phosphorus removal, since the Ostara system recovers around 85% of the phosphorus in the centrate, the solid matter left behind following the dewatering of wastewater.
The process could be replicable in other sites where wastewater treatment plants use anaerobic digestion for solids processing. Plants that are trying to remove phosphorus in the liquid stream process might want to use a nutrient recovery process such as Ostara’s or similar technology. The technology is particularly suitable where regulations limit the discharge of phosphorous or where there is a communal desire to preserve phosphorous as a non-renewable resource.
The British Columbia Ministry of Environment and fishery associations purchased the first 10 tonnes
Phot
o co
urte
sy o
f Cle
an W
ater
Ser
vice
s
Recovered nutrients from treatment plans are turned into fertilizer that promotes strong root development reducing leaching and runoff in Tigard
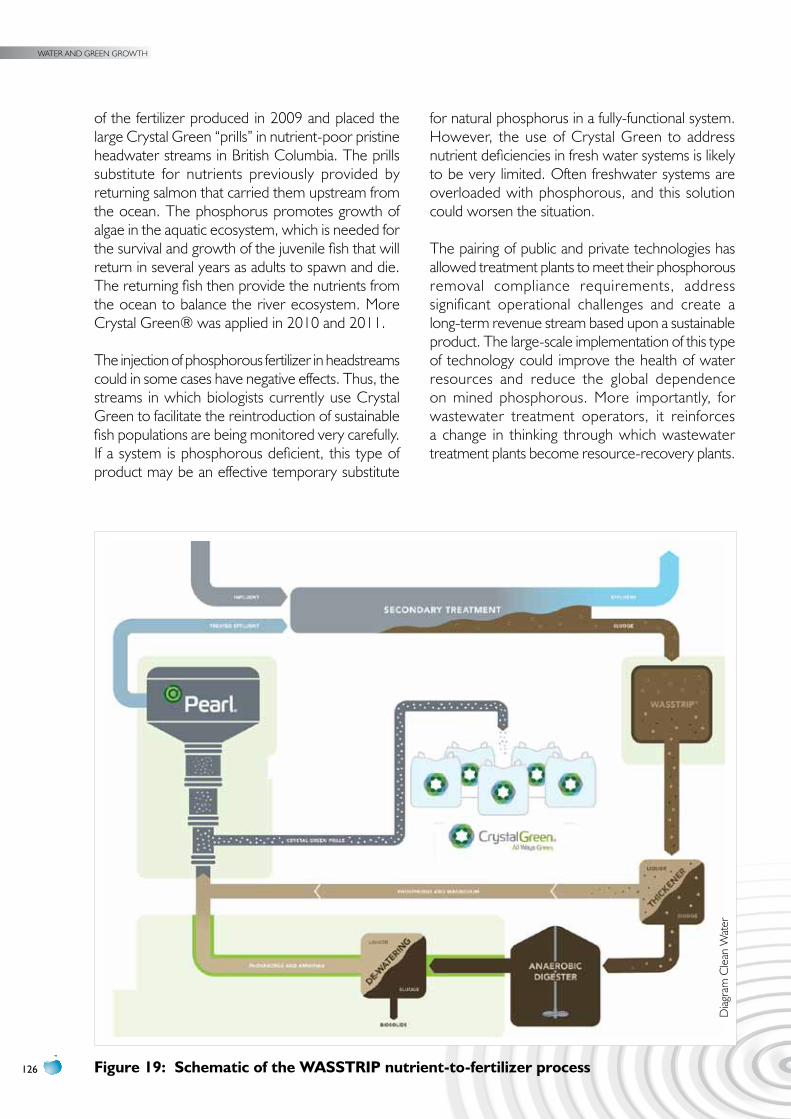
WATER AND GREEN GROWTH
126
of the fertilizer produced in 2009 and placed the large Crystal Green “prills” in nutrient-poor pristine headwater streams in British Columbia. The prills substitute for nutrients previously provided by returning salmon that carried them upstream from the ocean. The phosphorus promotes growth of algae in the aquatic ecosystem, which is needed for the survival and growth of the juvenile fish that will return in several years as adults to spawn and die. The returning fish then provide the nutrients from the ocean to balance the river ecosystem. More Crystal Green® was applied in 2010 and 2011.
The injection of phosphorous fertilizer in headstreams could in some cases have negative effects. Thus, the streams in which biologists currently use Crystal Green to facilitate the reintroduction of sustainable fish populations are being monitored very carefully. If a system is phosphorous deficient, this type of product may be an effective temporary substitute
for natural phosphorus in a fully-functional system. However, the use of Crystal Green to address nutrient deficiencies in fresh water systems is likely to be very limited. Often freshwater systems are overloaded with phosphorous, and this solution could worsen the situation.
The pairing of public and private technologies has allowed treatment plants to meet their phosphorous removal compliance requirements, address significant operational challenges and create a long-term revenue stream based upon a sustainable product. The large-scale implementation of this type of technology could improve the health of water resources and reduce the global dependence on mined phosphorous. More importantly, for wastewater treatment operators, it reinforces a change in thinking through which wastewater treatment plants become resource-recovery plants.
Figure 19: Schematic of the WASSTRiP nutrient-to-fertilizer process
Diag
ram
Cle
an W
ater
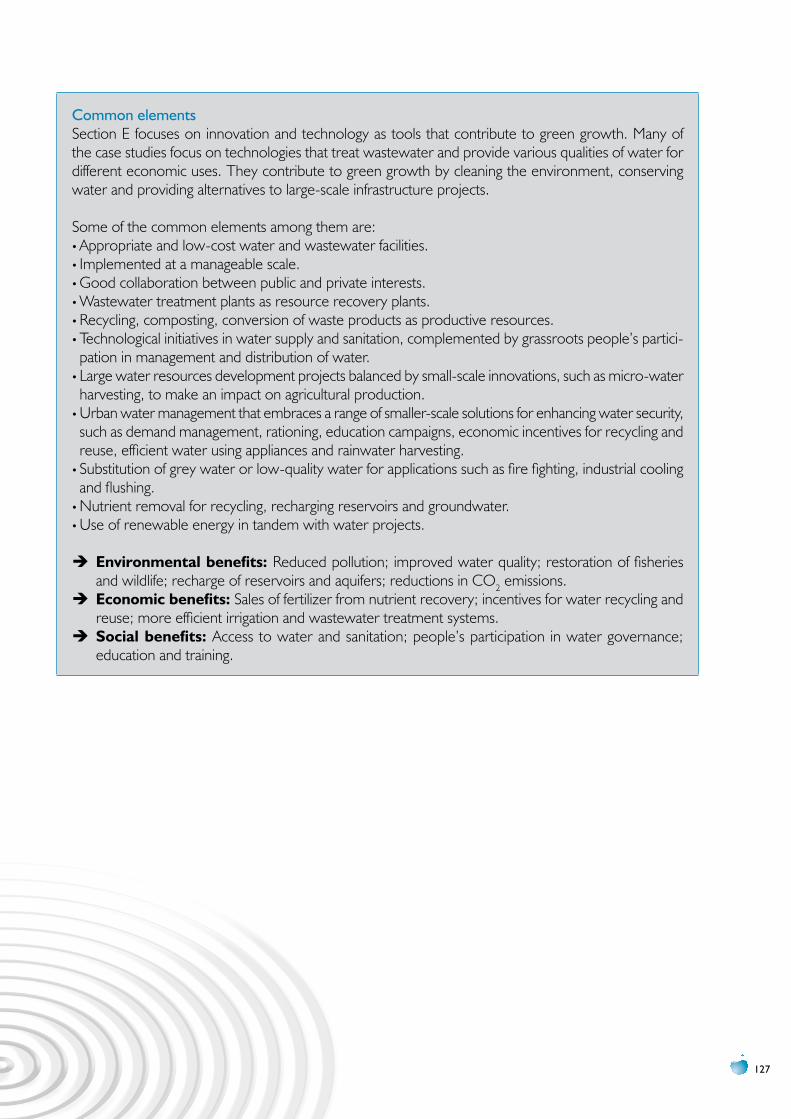
127
Common elementsSection E focuses on innovation and technology as tools that contribute to green growth. Many of the case studies focus on technologies that treat wastewater and provide various qualities of water for different economic uses. They contribute to green growth by cleaning the environment, conserving water and providing alternatives to large-scale infrastructure projects.
Some of the common elements among them are:•Appropriate and low-cost water and wastewater facilities.•Implemented at a manageable scale.•Good collaboration between public and private interests.•Wastewater treatment plants as resource recovery plants.•Recycling, composting, conversion of waste products as productive resources.•Technological initiatives in water supply and sanitation, complemented by grassroots people’s partici-pation in management and distribution of water.
•Large water resources development projects balanced by small-scale innovations, such as micro-water harvesting, to make an impact on agricultural production.
•Urban water management that embraces a range of smaller-scale solutions for enhancing water security, such as demand management, rationing, education campaigns, economic incentives for recycling and reuse, efficient water using appliances and rainwater harvesting.
•Substitution of grey water or low-quality water for applications such as fire fighting, industrial cooling and flushing.
•Nutrient removal for recycling, recharging reservoirs and groundwater.•Use of renewable energy in tandem with water projects.
ÎÎ environmental benefits: Reduced pollution; improved water quality; restoration of fisheries and wildlife; recharge of reservoirs and aquifers; reductions in CO2 emissions.ÎÎ economic benefits: Sales of fertilizer from nutrient recovery; incentives for water recycling and reuse; more efficient irrigation and wastewater treatment systems.ÎÎ Social benefits: Access to water and sanitation; people’s participation in water governance; education and training.
WATER AND GREEN GROWTH
128
F. INFRASTRuCTuREA combination of global economic growth and years of maintenance neglect has greatly increased demand for new water infrastructure and technology. Extensive networks of infrastructure have been built over the years that provide drinking water, wastewater and storm water services to the public. Dams, weirs and diversions have been built to generate electricity and supply irrigation water to farmers. Much of that infrastructure is ageing, and the level of renewal and reinvestment in the water sector has not kept pace with the need. As infrastructure is being repaired or replaced, new concepts are being introduced to reduce the negative environmental impact of such infra-structure.
In providing sustainable water infrastructure, the concepts of eco-efficiency and green infrastructure are gaining momentum in current planning and construction. Eco-efficient water infrastructure is supposed to adopt sustainable design, construction, operation and maintenance processes with lower environmental impacts. The concept also includes policy measures that encourage optimal water utilization and reduce wastage.
At the basin level, green infrastructure can include the preservation and restoration of natural landscape features, such as forests, floodplains and wetlands. On a smaller scale, green infrastructure practices include rain gardens, porous pavements, green roofs, infiltration planters, trees and tree boxes, and rainwater harvesting for non-potable uses such as toilet flushing and landscape irrigation.
Green infrastructure and low-impact development are cost-effective, sustainable, and environmen-tally friendly. Green infrastructure management approaches and technologies aim to restore natural hydrological functions through infiltration, capture, reuse and recycling of rainwater. Green infra-structure can play a significant role in urban areas where impervious surfaces such as streets increase surface water runoff. In New York City, for example, the Staten Island Bluebelt drains 16 watersheds spread over 10,000 acres (4,050 ha) and saves tens of millions of United States dollars in comparison with conventional storm sewers (New York City 2012). The Bluebelt is an integrated storm water management system that preserves natural drainage
corridors, including wetlands, streams and ponds that link with traditional storm sewers. The Bluebelt protects wildlife habitats, provides community open space, and helps protect both private properties and public streets from flooding. The Citizens Advisory Committee assists the Department of Environ-mental Protection. The success of the programme inspired the City to issue the citywide Green Infra-structure Plan in 2010.
The case study from France examines improved utilization of existing waterways through Paris, and replacement of road traffic with barges. It could be a good model for green growth, as it encourages economic development and new industries along the waterfront, while introducing means of transport that reduce CO2 emissions, noise and traffic. Waterfront revitalization has been successful in many places, and repurposing of warehouses could be a good use of urban space.
Passenger ferry systems can also use existing waterways to reduce traffic congestion and associated pollution. The Staten Island Ferry, for example, serves 19 million passengers a year and eliminates the equivalent of 20,000 two-way commuter trips per day into jobs in Lower Manhattan (NOAA 2009). Vehicle emissions have diminished and expensive maintenance costs on bridge and tunnel infrastructure have been reduced as a result.
Key factors for success:•Better utilization of existing waterways for passenger and freight transport
•Revitalization of urban waterways•Mixed-use waterfront development•Consultation with and social mobilization of stakeholders
129
Other case studies presented in this section describe large and costly water infrastructure projects that have benefited the area as part of economic development projects. They do not appear to have involved the beneficiaries directly in designing, planning or managing the projects. For example, the case studies on the Sanitation Plan implemen-tation in Santiago and the delivery of full-time water supply in Karnataka appear to be turnkey operations where private water and sewerage companies have provided everything, including billing services, equipment and repairs. Nonetheless, both projects have had positive economic, social and environ-mental impacts. The Santiago case study describes a massive cleanup of the urban waterways feeding into the city and the Karnataka case describes provision of a much improved and reliable water supply. Transparent collaboration with the Government and
communities is essential when the private sector takes charge of large infrastructure projects.
The Four Major Rivers Restoration Project in the Republic of Korea is a massive infrastructural plan that involves construction of dams and reservoirs and restoration of polluted waterways. Having faced opposition in the past, the Government is making an effort to improve communications about the project and engage the stakeholders who would be directly affected. Another large infrastructure project in Korea (the Lake Sihwa case, presented in section 4.2.A) also faced opposition until the Government created the Sihwa District Sustainable Development Council in 2004. The long-term development project has gained more support among stake-holders as a result.
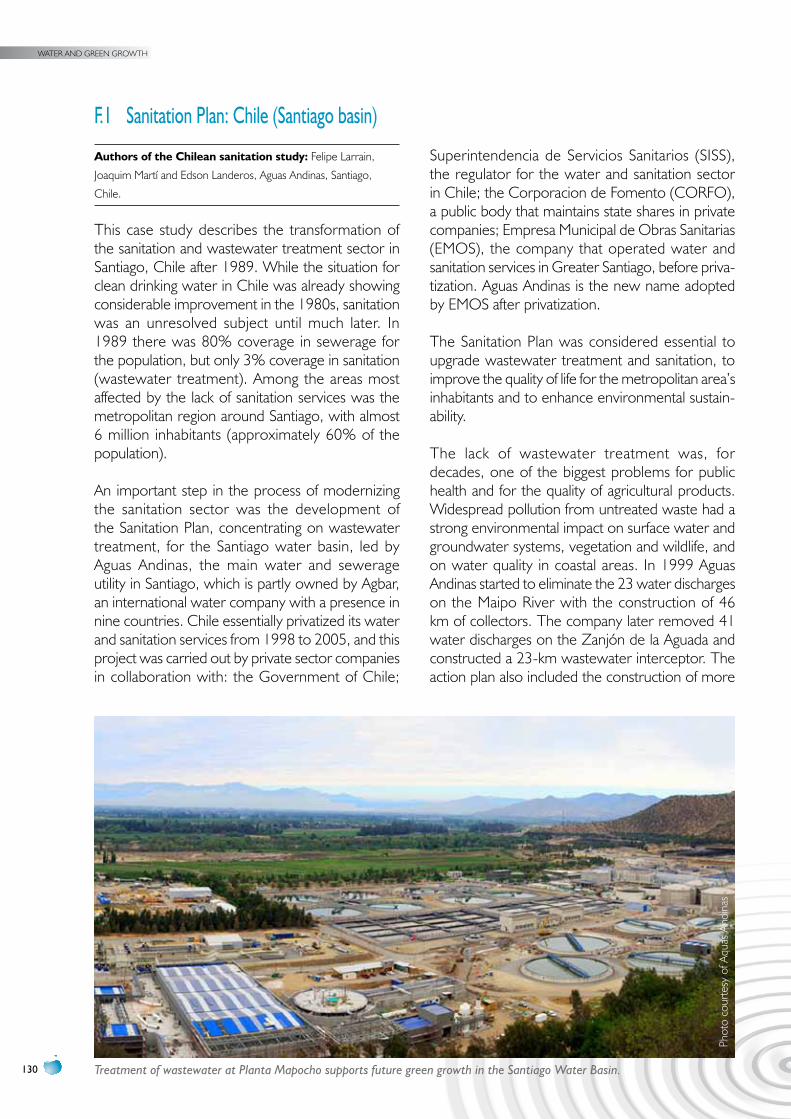
WATER AND GREEN GROWTH
130
F.1 Sanitation plan: Chile (Santiago basin)
Authors of the chilean sanitation study: Felipe Larrain,
Joaquim Martí and Edson Landeros, Aguas Andinas, Santiago,
Chile.
This case study describes the transformation of the sanitation and wastewater treatment sector in Santiago, Chile after 1989. While the situation for clean drinking water in Chile was already showing considerable improvement in the 1980s, sanitation was an unresolved subject until much later. In 1989 there was 80% coverage in sewerage for the population, but only 3% coverage in sanitation (wastewater treatment). Among the areas most affected by the lack of sanitation services was the metropolitan region around Santiago, with almost 6 million inhabitants (approximately 60% of the population).
An important step in the process of modernizing the sanitation sector was the development of the Sanitation Plan, concentrating on wastewater treatment, for the Santiago water basin, led by Aguas Andinas, the main water and sewerage utility in Santiago, which is partly owned by Agbar, an international water company with a presence in nine countries. Chile essentially privatized its water and sanitation services from 1998 to 2005, and this project was carried out by private sector companies in collaboration with: the Government of Chile;
Superintendencia de Servicios Sanitarios (SISS), the regulator for the water and sanitation sector in Chile; the Corporacion de Fomento (CORFO), a public body that maintains state shares in private companies; Empresa Municipal de Obras Sanitarias (EMOS), the company that operated water and sanitation services in Greater Santiago, before priva-tization. Aguas Andinas is the new name adopted by EMOS after privatization.
The Sanitation Plan was considered essential to upgrade wastewater treatment and sanitation, to improve the quality of life for the metropolitan area’s inhabitants and to enhance environmental sustain-ability.
The lack of wastewater treatment was, for decades, one of the biggest problems for public health and for the quality of agricultural products. Widespread pollution from untreated waste had a strong environmental impact on surface water and groundwater systems, vegetation and wildlife, and on water quality in coastal areas. In 1999 Aguas Andinas started to eliminate the 23 water discharges on the Maipo River with the construction of 46 km of collectors. The company later removed 41 water discharges on the Zanjón de la Aguada and constructed a 23-km wastewater interceptor. The action plan also included the construction of more
Phot
o co
urte
sy o
f Aqu
as A
ndin
as
Treatment of wastewater at Planta Mapocho supports future green growth in the Santiago Water Basin.
131
than 20 treatment plants, collectors and inter-ceptors. Three specific works are highlighted in the case study: the construction of two large treatment plants at El Trebal and La Farfana, and the “Mapocho Urbano Limpio” interceptor. Aguas Andinas made an investment of US$ 315 million in La Farfana, showing its commitment to the advancement of the project. The Mapocho interceptor required investment of US$ 115 million. The complete Sanitation Plan will cost an estimated US$ 1,000 million. The project is to be completed in 2012.
Residents of Santiago pay for the wastewater treatment and sewerage services they receive through tariffs. The project is financed by bonds issued by Aguas Andinas which will be repaid by tariffs over time.
The process of decontamination of surface water courses has led to major improvements in water quality in the basin, which impacts the different activities and systems in the basin environment. The wastewater treatment in the Maipo River basin allows for the use of reused water to irrigate vegetables and fruits for consumption in the Greater Santiago area. The Sanitation Plan has made it possible to use by-products from the various stages of treatment, such as bio-solids, adding environ-mental value that had not initially been considered.The implementation of the Sanitation Plan in the Maipo-Mapocho basin since 2000 has resulted in an increase in wastewater treatment coverage in the Santiago basin from 3% to 86%. It is estimated that by 2012 coverage will reach 100% with the start of operations at the Mapocho plant.
Among the social benefits are reduction in water-borne disease, rehabilitation of public spaces and improvements in the landscape of the lower basin. Economic benefits include: a decline in the cost of drinking water; more efficient irrigation systems; changes in agricultural production to higher value crops; and creation of jobs. The environmental benefits from the Sanitation Plan include restoration of ecosystem services in the Maipo-Mapocho River basins; decontamination of the aquifer; recovery of degraded soils; management of minimum flows; and changes in land-use planning that integrate the river into urban development.
This case study shows how the city of Santiago has cleaned the rivers in its watershed, reduced pollution and improved wastewater treatment. It is mainly about pollution reduction and control, rather than sanitation. The case is important as it shows that a large urban metropolis can succeed in cleaning up its waterways, and that improvements in water quality can be a factor in green growth. While this project entailed a huge investment in treatment infrastructure, it has had many positive impacts on health, the economy and the environment.
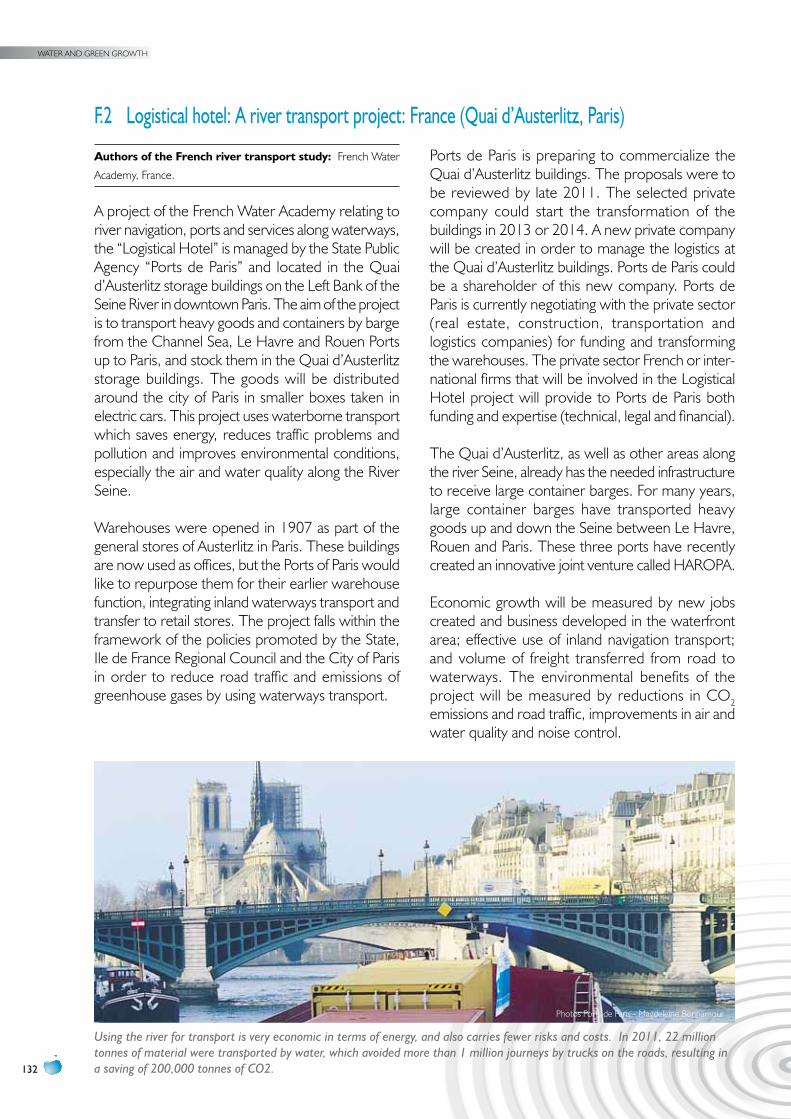
WATER AND GREEN GROWTH
132
F.2 Logistical hotel: A river transport project: France (Quai d’Austerlitz, paris)
Authors of the French river transport study: French Water
Academy, France.
A project of the French Water Academy relating to river navigation, ports and services along waterways, the “Logistical Hotel” is managed by the State Public Agency “Ports de Paris” and located in the Quai d’Austerlitz storage buildings on the Left Bank of the Seine River in downtown Paris. The aim of the project is to transport heavy goods and containers by barge from the Channel Sea, Le Havre and Rouen Ports up to Paris, and stock them in the Quai d’Austerlitz storage buildings. The goods will be distributed around the city of Paris in smaller boxes taken in electric cars. This project uses waterborne transport which saves energy, reduces traffic problems and pollution and improves environmental conditions, especially the air and water quality along the River Seine.
Warehouses were opened in 1907 as part of the general stores of Austerlitz in Paris. These buildings are now used as offices, but the Ports of Paris would like to repurpose them for their earlier warehouse function, integrating inland waterways transport and transfer to retail stores. The project falls within the framework of the policies promoted by the State, Ile de France Regional Council and the City of Paris in order to reduce road traffic and emissions of greenhouse gases by using waterways transport.
Ports de Paris is preparing to commercialize the Quai d’Austerlitz buildings. The proposals were to be reviewed by late 2011. The selected private company could start the transformation of the buildings in 2013 or 2014. A new private company will be created in order to manage the logistics at the Quai d’Austerlitz buildings. Ports de Paris could be a shareholder of this new company. Ports de Paris is currently negotiating with the private sector (real estate, construction, transportation and logistics companies) for funding and transforming the warehouses. The private sector French or inter-national firms that will be involved in the Logistical Hotel project will provide to Ports de Paris both funding and expertise (technical, legal and financial).
The Quai d’Austerlitz, as well as other areas along the river Seine, already has the needed infrastructure to receive large container barges. For many years, large container barges have transported heavy goods up and down the Seine between Le Havre, Rouen and Paris. These three ports have recently created an innovative joint venture called HAROPA.
Economic growth will be measured by new jobs created and business developed in the waterfront area; effective use of inland navigation transport; and volume of freight transferred from road to waterways. The environmental benefits of the project will be measured by reductions in CO2 emissions and road traffic, improvements in air and water quality and noise control.
Using the river for transport is very economic in terms of energy, and also carries fewer risks and costs. In 2011, 22 million tonnes of material were transported by water, which avoided more than 1 million journeys by trucks on the roads, resulting in a saving of 200,000 tonnes of CO2.
Photos Ports de Paris - Magdeleine Bonnamour
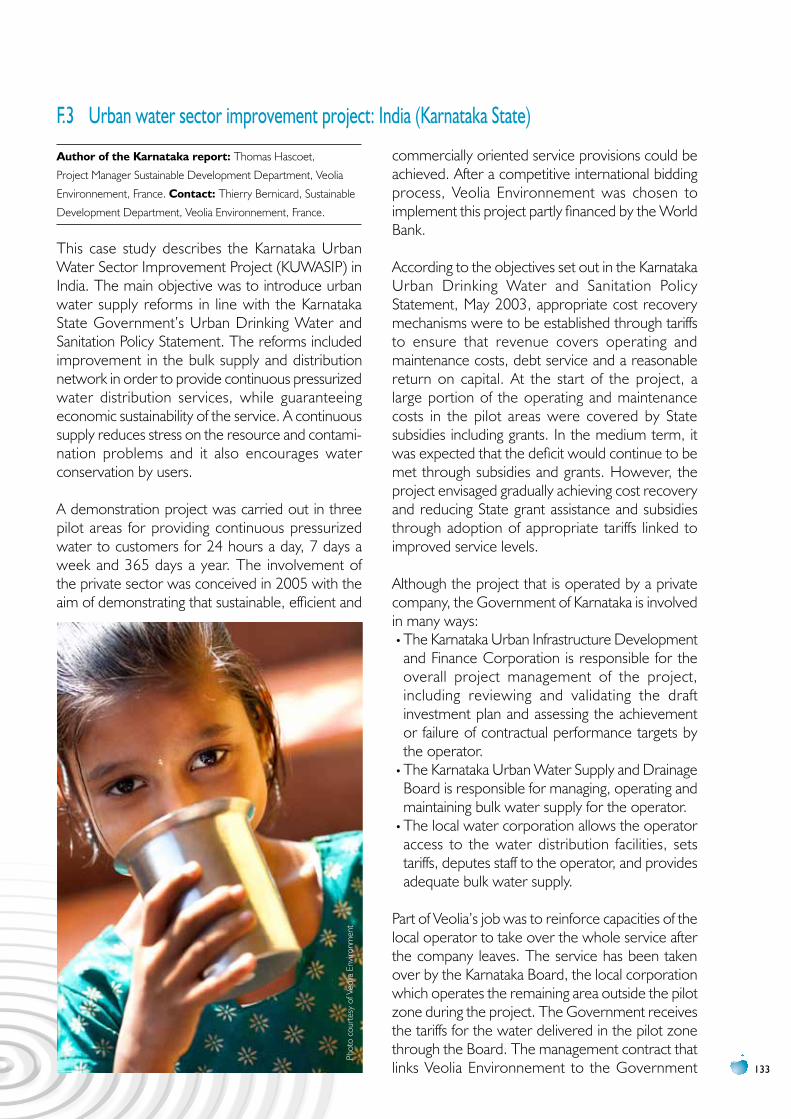
133
F.3 urban water sector improvement project: India (Karnataka State)
Author of the Karnataka report: Thomas Hascoet,
Project Manager Sustainable Development Department, Veolia
Environnement, France. contact: Thierry Bernicard, Sustainable
Development Department, Veolia Environnement, France.
This case study describes the Karnataka Urban Water Sector Improvement Project (KUWASIP) in India. The main objective was to introduce urban water supply reforms in line with the Karnataka State Government’s Urban Drinking Water and Sanitation Policy Statement. The reforms included improvement in the bulk supply and distribution network in order to provide continuous pressurized water distribution services, while guaranteeing economic sustainability of the service. A continuous supply reduces stress on the resource and contami-nation problems and it also encourages water conservation by users.
A demonstration project was carried out in three pilot areas for providing continuous pressurized water to customers for 24 hours a day, 7 days a week and 365 days a year. The involvement of the private sector was conceived in 2005 with the aim of demonstrating that sustainable, efficient and
commercially oriented service provisions could be achieved. After a competitive international bidding process, Veolia Environnement was chosen to implement this project partly financed by the World Bank.
According to the objectives set out in the Karnataka Urban Drinking Water and Sanitation Policy Statement, May 2003, appropriate cost recovery mechanisms were to be established through tariffs to ensure that revenue covers operating and maintenance costs, debt service and a reasonable return on capital. At the start of the project, a large portion of the operating and maintenance costs in the pilot areas were covered by State subsidies including grants. In the medium term, it was expected that the deficit would continue to be met through subsidies and grants. However, the project envisaged gradually achieving cost recovery and reducing State grant assistance and subsidies through adoption of appropriate tariffs linked to improved service levels.
Although the project that is operated by a private company, the Government of Karnataka is involved in many ways:•The Karnataka Urban Infrastructure Development and Finance Corporation is responsible for the overall project management of the project, including reviewing and validating the draft investment plan and assessing the achievement or failure of contractual performance targets by the operator.
•The Karnataka Urban Water Supply and Drainage Board is responsible for managing, operating and maintaining bulk water supply for the operator.
•The local water corporation allows the operator access to the water distribution facilities, sets tariffs, deputes staff to the operator, and provides adequate bulk water supply.
Part of Veolia’s job was to reinforce capacities of the local operator to take over the whole service after the company leaves. The service has been taken over by the Karnataka Board, the local corporation which operates the remaining area outside the pilot zone during the project. The Government receives the tariffs for the water delivered in the pilot zone through the Board. The management contract that links Veolia Environnement to the Government
Phot
o co
urte
sy o
f Veo
lia E
nviro
nmen
t
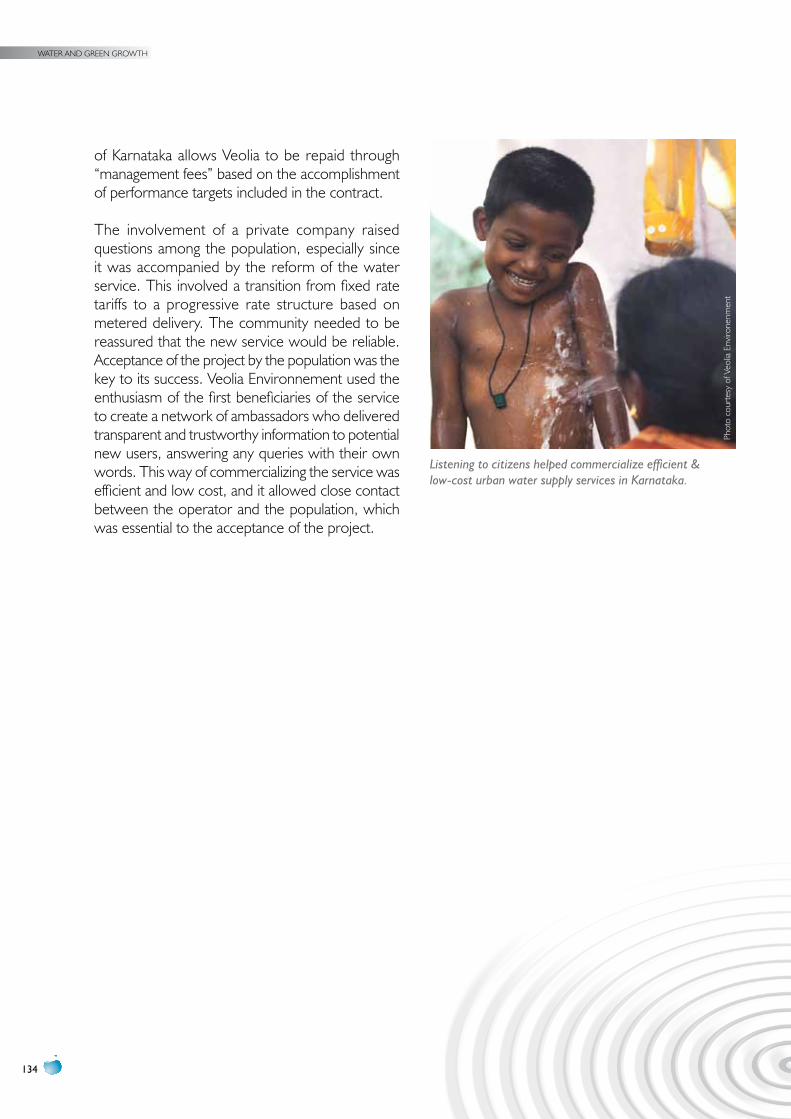
WATER AND GREEN GROWTH
134
of Karnataka allows Veolia to be repaid through “management fees” based on the accomplishment of performance targets included in the contract.
The involvement of a private company raised questions among the population, especially since it was accompanied by the reform of the water service. This involved a transition from fixed rate tariffs to a progressive rate structure based on metered delivery. The community needed to be reassured that the new service would be reliable. Acceptance of the project by the population was the key to its success. Veolia Environnement used the enthusiasm of the first beneficiaries of the service to create a network of ambassadors who delivered transparent and trustworthy information to potential new users, answering any queries with their own words. This way of commercializing the service was efficient and low cost, and it allowed close contact between the operator and the population, which was essential to the acceptance of the project.
Phot
o co
urte
sy o
f Veo
lia E
nviro
nenm
ent
Listening to citizens helped commercialize efficient & low-cost urban water supply services in Karnataka.
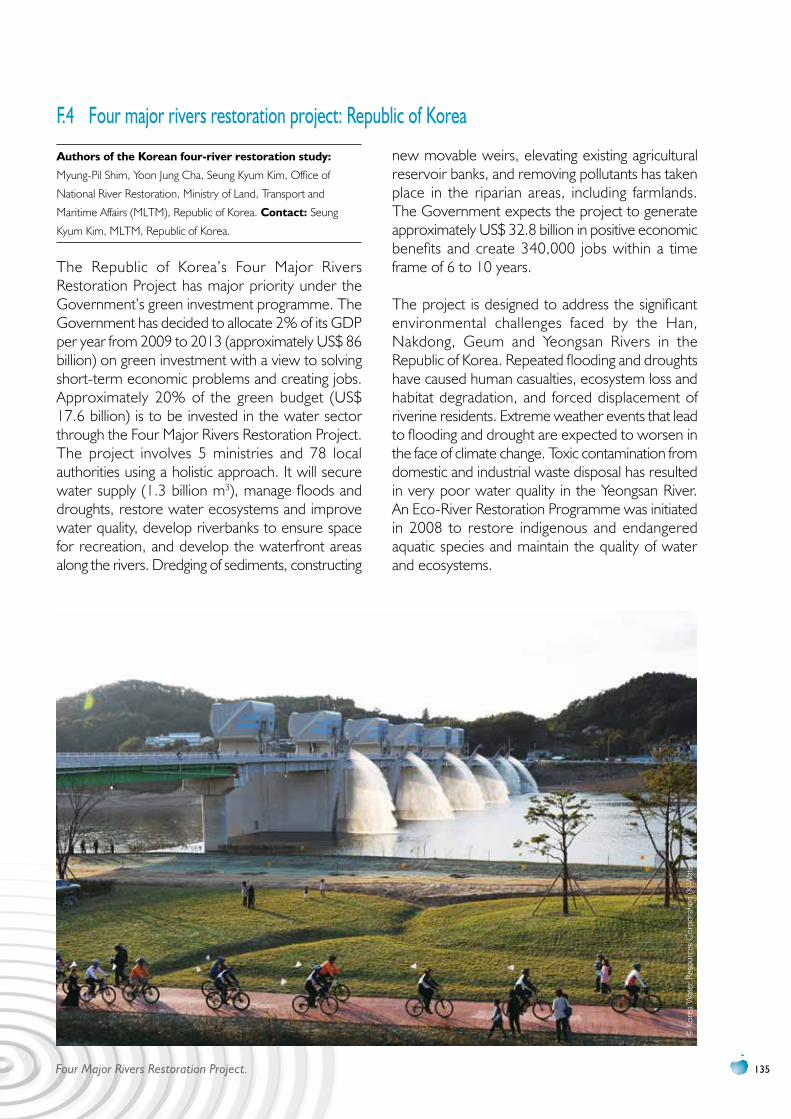
135
F.4 Four major rivers restoration project: Republic of Korea
Authors of the Korean four-river restoration study:
Myung-Pil Shim, Yoon Jung Cha, Seung Kyum Kim, Office of
National River Restoration, Ministry of Land, Transport and
Maritime Affairs (MLTM), Republic of Korea. contact: Seung
Kyum Kim, MLTM, Republic of Korea.
The Republic of Korea’s Four Major Rivers Restoration Project has major priority under the Government’s green investment programme. The Government has decided to allocate 2% of its GDP per year from 2009 to 2013 (approximately US$ 86 billion) on green investment with a view to solving short-term economic problems and creating jobs. Approximately 20% of the green budget (US$ 17.6 billion) is to be invested in the water sector through the Four Major Rivers Restoration Project. The project involves 5 ministries and 78 local authorities using a holistic approach. It will secure water supply (1.3 billion m3), manage floods and droughts, restore water ecosystems and improve water quality, develop riverbanks to ensure space for recreation, and develop the waterfront areas along the rivers. Dredging of sediments, constructing
new movable weirs, elevating existing agricultural reservoir banks, and removing pollutants has taken place in the riparian areas, including farmlands. The Government expects the project to generate approximately US$ 32.8 billion in positive economic benefits and create 340,000 jobs within a time frame of 6 to 10 years.
The project is designed to address the significant environmental challenges faced by the Han, Nakdong, Geum and Yeongsan Rivers in the Republic of Korea. Repeated flooding and droughts have caused human casualties, ecosystem loss and habitat degradation, and forced displacement of riverine residents. Extreme weather events that lead to flooding and drought are expected to worsen in the face of climate change. Toxic contamination from domestic and industrial waste disposal has resulted in very poor water quality in the Yeongsan River. An Eco-River Restoration Programme was initiated in 2008 to restore indigenous and endangered aquatic species and maintain the quality of water and ecosystems.
Four Major Rivers Restoration Project.
© K
orea
Wat
er R
esou
rces
Cor
pora
tion
(K-W
ater
), 20
11
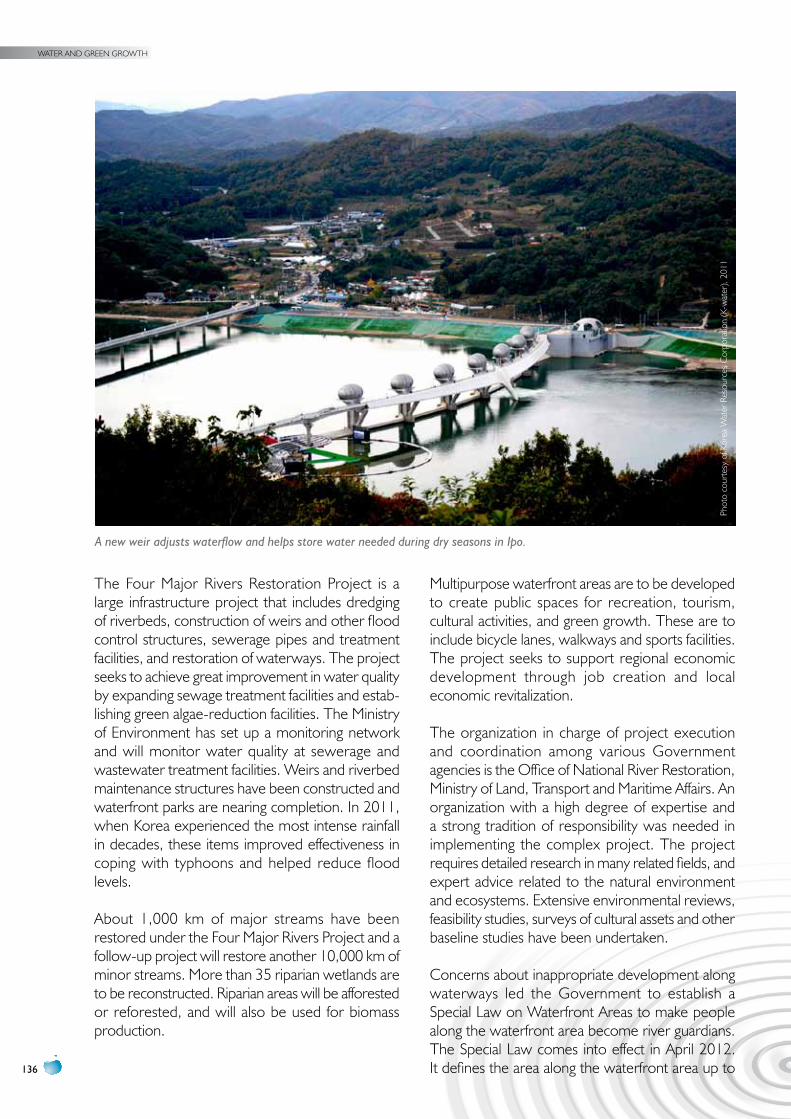
WATER AND GREEN GROWTH
136
The Four Major Rivers Restoration Project is a large infrastructure project that includes dredging of riverbeds, construction of weirs and other flood control structures, sewerage pipes and treatment facilities, and restoration of waterways. The project seeks to achieve great improvement in water quality by expanding sewage treatment facilities and estab-lishing green algae-reduction facilities. The Ministry of Environment has set up a monitoring network and will monitor water quality at sewerage and wastewater treatment facilities. Weirs and riverbed maintenance structures have been constructed and waterfront parks are nearing completion. In 2011, when Korea experienced the most intense rainfall in decades, these items improved effectiveness in coping with typhoons and helped reduce flood levels.
About 1,000 km of major streams have been restored under the Four Major Rivers Project and a follow-up project will restore another 10,000 km of minor streams. More than 35 riparian wetlands are to be reconstructed. Riparian areas will be afforested or reforested, and will also be used for biomass production.
Multipurpose waterfront areas are to be developed to create public spaces for recreation, tourism, cultural activities, and green growth. These are to include bicycle lanes, walkways and sports facilities. The project seeks to support regional economic development through job creation and local economic revitalization.
The organization in charge of project execution and coordination among various Government agencies is the Office of National River Restoration, Ministry of Land, Transport and Maritime Affairs. An organization with a high degree of expertise and a strong tradition of responsibility was needed in implementing the complex project. The project requires detailed research in many related fields, and expert advice related to the natural environment and ecosystems. Extensive environmental reviews, feasibility studies, surveys of cultural assets and other baseline studies have been undertaken.
Concerns about inappropriate development along waterways led the Government to establish a Special Law on Waterfront Areas to make people along the waterfront area become river guardians. The Special Law comes into effect in April 2012. It defines the area along the waterfront area up to
Phot
o co
urte
sy o
f Kor
ea W
ater
Res
ourc
es C
orpo
ratio
n (K
-wat
er),
2011
A new weir adjusts waterflow and helps store water needed during dry seasons in Ipo.
137
4 km inland. Developments along the waterfront are to be phased in slowly, and implemented with public organizations so that profits can be shared. A waterfront area mediation committee will supervise designation of sites to develop and implementation procedures.
The project is unprecedented in its size and budget—of more than US$ 17 billion. As such, there is a real need to establish a consensus among citizens and to collect citizen opinions, as well as to establish a strong project management link between headquarters and each Regional Construction and Management Administration. The headquarters is a pan-governmental taskforce of officials from several ministries, local Governments and public organiza-tions, together with public relations experts from the private sector.
Advisory committees were established at the headquarters composed of around 1,000 officials from different fields, including the academic sector, research institutes, and civic groups. Opinions are frequently collected from the expert advisory committee, the citizen advisory committee and others. The committee members come from different fields, including water resource, water quality, ecology and environment, culture, sports and tourism, and local development. Extensive opinions and advice are collected throughout the process.
How the government will engage all the people as river guardians in restoration and waterway
protection is unclear. Political opposition is a major challenge faced by this project. Continuous commu-nication, education and public relations are the main tools that are being used to overcome the barriers. A project advisory group was established with regional citizens, professionals, and academics who are gathering the views of stakeholders.
In many of the other case studies contained in this chapter, the idea of green growth is a step back from the enormous infrastructure projects of the past that involved construction of dams, canals and dikes. Green infrastructure seems to imply that restoration will involve the citizens who live in the area in restoration of waterways, rather than large-scale construction projects. This particular large-scale project will have to find ways to engage the stakeholders in an on-going dialogue at the river basin level to ensure that they are support the project. As it is a nation-wide project that engages many ministries and municipalities, it could provide a good green-growth example to be replicated elsewhere. However, a process for holding forums at the river basin level will be needed, so that the project components reflect the character of the city or region where they are implemented.
Because the investment is so large, this type of project may not be replicable elsewhere. However, certain of its components, such as restoration of streams and development of urban waterways, could be used as good practice examples in other settings.
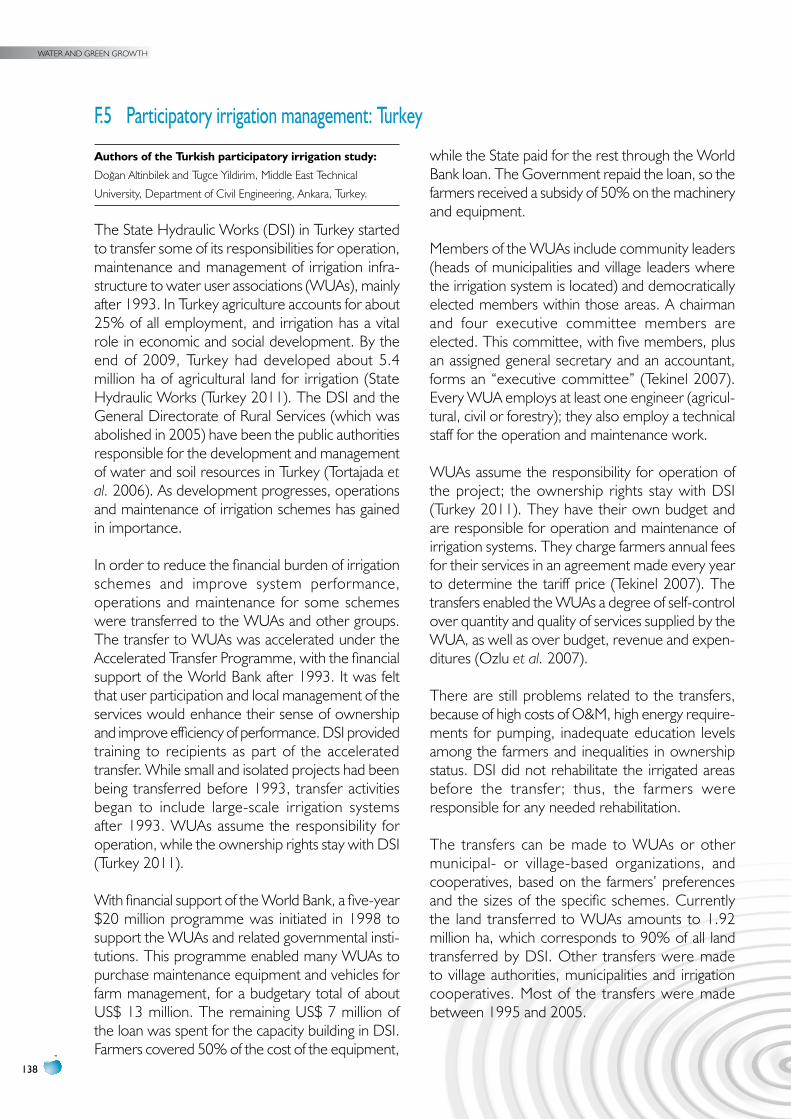
WATER AND GREEN GROWTH
138
F.5 participatory irrigation management: Turkey
Authors of the Turkish participatory irrigation study:
Doğan Altinbilek and Tugce Yildirim, Middle East Technical
University, Department of Civil Engineering, Ankara, Turkey.
The State Hydraulic Works (DSI) in Turkey started to transfer some of its responsibilities for operation, maintenance and management of irrigation infra-structure to water user associations (WUAs), mainly after 1993. In Turkey agriculture accounts for about 25% of all employment, and irrigation has a vital role in economic and social development. By the end of 2009, Turkey had developed about 5.4 million ha of agricultural land for irrigation (State Hydraulic Works (Turkey 2011). The DSI and the General Directorate of Rural Services (which was abolished in 2005) have been the public authorities responsible for the development and management of water and soil resources in Turkey (Tortajada et al. 2006). As development progresses, operations and maintenance of irrigation schemes has gained in importance.
In order to reduce the financial burden of irrigation schemes and improve system performance, operations and maintenance for some schemes were transferred to the WUAs and other groups. The transfer to WUAs was accelerated under the Accelerated Transfer Programme, with the financial support of the World Bank after 1993. It was felt that user participation and local management of the services would enhance their sense of ownership and improve efficiency of performance. DSI provided training to recipients as part of the accelerated transfer. While small and isolated projects had been being transferred before 1993, transfer activities began to include large-scale irrigation systems after 1993. WUAs assume the responsibility for operation, while the ownership rights stay with DSI (Turkey 2011).
With financial support of the World Bank, a five-year $20 million programme was initiated in 1998 to support the WUAs and related governmental insti-tutions. This programme enabled many WUAs to purchase maintenance equipment and vehicles for farm management, for a budgetary total of about US$ 13 million. The remaining US$ 7 million of the loan was spent for the capacity building in DSI. Farmers covered 50% of the cost of the equipment,
while the State paid for the rest through the World Bank loan. The Government repaid the loan, so the farmers received a subsidy of 50% on the machinery and equipment.
Members of the WUAs include community leaders (heads of municipalities and village leaders where the irrigation system is located) and democratically elected members within those areas. A chairman and four executive committee members are elected. This committee, with five members, plus an assigned general secretary and an accountant, forms an “executive committee” (Tekinel 2007). Every WUA employs at least one engineer (agricul-tural, civil or forestry); they also employ a technical staff for the operation and maintenance work.
WUAs assume the responsibility for operation of the project; the ownership rights stay with DSI (Turkey 2011). They have their own budget and are responsible for operation and maintenance of irrigation systems. They charge farmers annual fees for their services in an agreement made every year to determine the tariff price (Tekinel 2007). The transfers enabled the WUAs a degree of self-control over quantity and quality of services supplied by the WUA, as well as over budget, revenue and expen-ditures (Ozlu et al. 2007).
There are still problems related to the transfers, because of high costs of O&M, high energy require-ments for pumping, inadequate education levels among the farmers and inequalities in ownership status. DSI did not rehabilitate the irrigated areas before the transfer; thus, the farmers were responsible for any needed rehabilitation.
The transfers can be made to WUAs or other municipal- or village-based organizations, and cooperatives, based on the farmers’ preferences and the sizes of the specific schemes. Currently the land transferred to WUAs amounts to 1.92 million ha, which corresponds to 90% of all land transferred by DSI. Other transfers were made to village authorities, municipalities and irrigation cooperatives. Most of the transfers were made between 1995 and 2005.
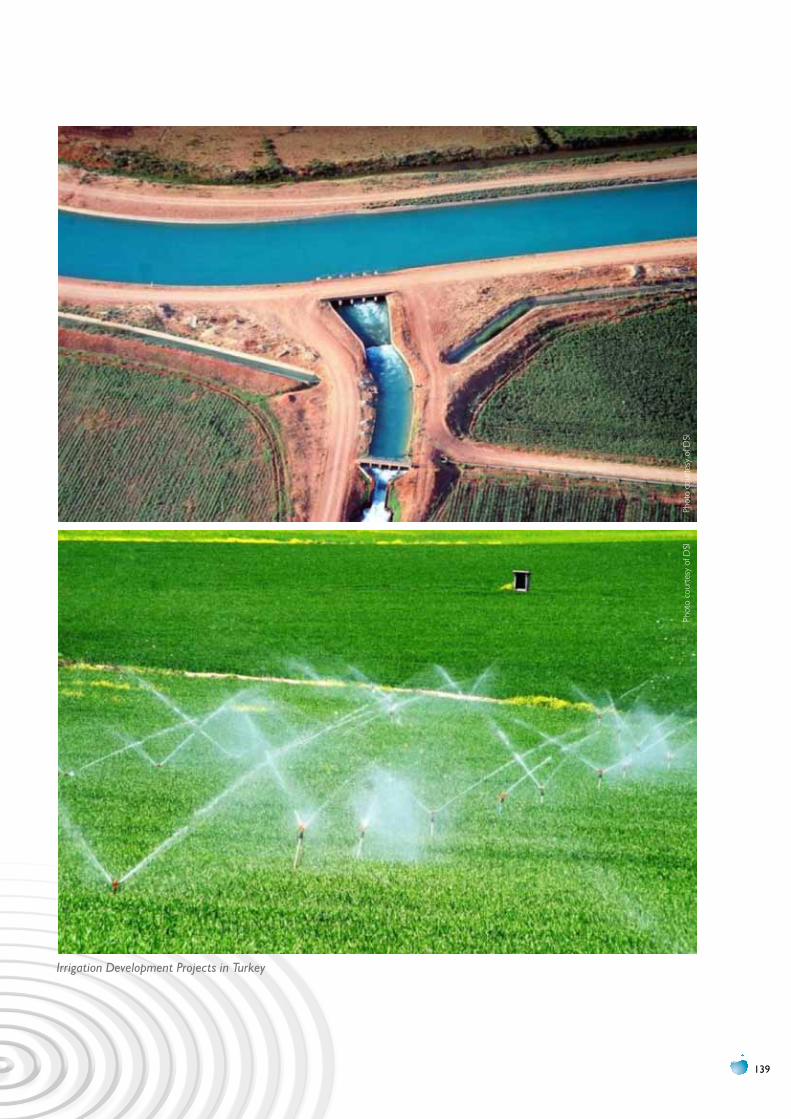
139
Irrigation Development Projects in Turkey
Phot
o co
urte
sy o
f DSI
Phot
o co
urte
sy o
f DSI
WATER AND GREEN GROWTH
140
According to a DSI evaluation (Turkey 2011), the situation improved after the transfers in the following ways:
•Water distribution is fairer.•The communication between the local adminis-trators and farmers became stronger.
•Unauthorized irrigation and interference with the facilities has decreased.
•Energy and other operation costs have declined.•Efficiency of the personnel and the work has increased.
•The irrigation water charge collection ratio has increased.
•Agricultural machinery has been used more effectively.
Participatory irrigation management activities have thus demonstrated some success in Turkey. The
sustainability of such activities can be enhanced by the continuation of training programmes, encour-agement of water savings with appropriate methods and improving irrigation efficiency.
As stated in Human Development Report 2006: “One of the most influential institutional changes in governance in recent years has been the intro-duction of participatory irrigation management and the development of water user associations. In the best cases—as in Indonesia, Mexico and Turkey—institutional reforms have transferred management to irrigation users, with marked increases in revenue collection, maintenance spending and irrigation returns. The lesson: where producers have more authority and responsibility for water management, transparency can improve pricing, cost-recovery and performance.” (Tortajada et al. 2006)
Common elementsSection F describes a variety of infrastructure projects that have already had or will have a large impact on urban and rural areas. Some of them do not appear to have a strong green growth component. Nonetheless, some common factors that do support green growth are the following:•Improvements in urban or rural water quality as the initial motivation.•Rehabilitation of highly regulated river basins—dredging, construction, planting, wastewater collection—at the community level with local cooperation.
•Green infrastructure management approaches aimed at restoring natural hydrological functions through infiltration, capture, reuse and recycling of rainwater.
•Community engagement to protect ecologically sensitive areas and improve water quality.•Importance of listening to the citizens living in the project area.•Changes in land-use planning that integrate the river into urban development.•Integrated management of storm water and natural wetlands and ponds in urban areas.•Public–private partnerships at every level.•Revitalization of urban waterways as an engine of growth—tourism, recreation, culture, commerce, industry, housing, wildlife and birds.
•Use of existing urban waterways to transport goods and people.•Commercialization of existing infrastructure, such as old buildings and warehouses.•Low-density solutions that involve restoration of habitat.•Improvements in cost recovery and efficiency of irrigation systems.•Adaptability in response to unintended consequences.
ÎÎ environmental benefits: Reduction in CO2 emissions; decontamination of surface water bodies; reforestation; flood control; recovery of degraded soils; management of minimum flows.ÎÎ economic benefits: Industrial development along waterfronts; reuse of water for irrigation; decline in the cost of drinking water; improvements in water and sewerage delivery; job creation; improvements in irrigation efficiency.ÎÎ Social benefits: Reduction in water-borne diseases; rehabilitation of public spaces; improvements in landscapes; participation in consultations; fairer water distribution.
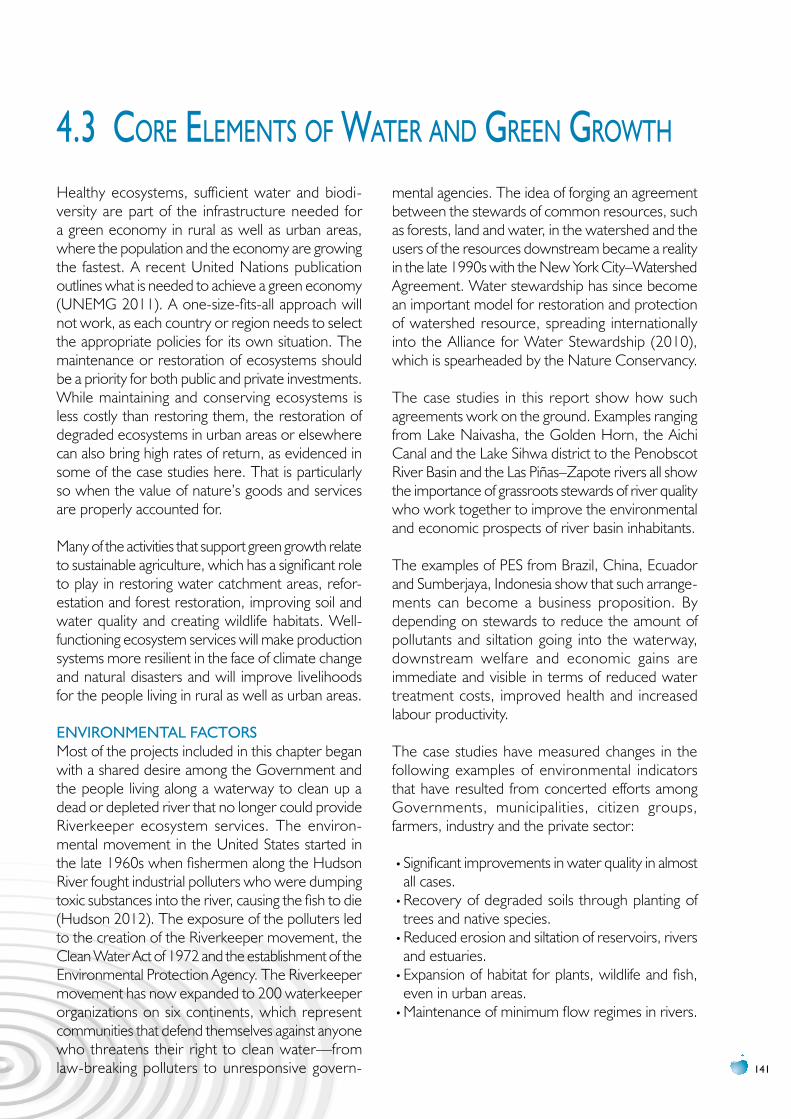
141
4.3 core eLeMents of Water and green groWth
Healthy ecosystems, sufficient water and biodi-versity are part of the infrastructure needed for a green economy in rural as well as urban areas, where the population and the economy are growing the fastest. A recent United Nations publication outlines what is needed to achieve a green economy (UNEMG 2011). A one-size-fits-all approach will not work, as each country or region needs to select the appropriate policies for its own situation. The maintenance or restoration of ecosystems should be a priority for both public and private investments. While maintaining and conserving ecosystems is less costly than restoring them, the restoration of degraded ecosystems in urban areas or elsewhere can also bring high rates of return, as evidenced in some of the case studies here. That is particularly so when the value of nature’s goods and services are properly accounted for.
Many of the activities that support green growth relate to sustainable agriculture, which has a significant role to play in restoring water catchment areas, refor-estation and forest restoration, improving soil and water quality and creating wildlife habitats. Well-functioning ecosystem services will make production systems more resilient in the face of climate change and natural disasters and will improve livelihoods for the people living in rural as well as urban areas.
ENvIRONMENTAL FACTORSMost of the projects included in this chapter began with a shared desire among the Government and the people living along a waterway to clean up a dead or depleted river that no longer could provide Riverkeeper ecosystem services. The environ-mental movement in the United States started in the late 1960s when fishermen along the Hudson River fought industrial polluters who were dumping toxic substances into the river, causing the fish to die (Hudson 2012). The exposure of the polluters led to the creation of the Riverkeeper movement, the Clean Water Act of 1972 and the establishment of the Environmental Protection Agency. The Riverkeeper movement has now expanded to 200 waterkeeper organizations on six continents, which represent communities that defend themselves against anyone who threatens their right to clean water—from law-breaking polluters to unresponsive govern-
mental agencies. The idea of forging an agreement between the stewards of common resources, such as forests, land and water, in the watershed and the users of the resources downstream became a reality in the late 1990s with the New York City–Watershed Agreement. Water stewardship has since become an important model for restoration and protection of watershed resource, spreading internationally into the Alliance for Water Stewardship (2010), which is spearheaded by the Nature Conservancy.
The case studies in this report show how such agreements work on the ground. Examples ranging from Lake Naivasha, the Golden Horn, the Aichi Canal and the Lake Sihwa district to the Penobscot River Basin and the Las Piñas–Zapote rivers all show the importance of grassroots stewards of river quality who work together to improve the environmental and economic prospects of river basin inhabitants.
The examples of PES from Brazil, China, Ecuador and Sumberjaya, Indonesia show that such arrange-ments can become a business proposition. By depending on stewards to reduce the amount of pollutants and siltation going into the waterway, downstream welfare and economic gains are immediate and visible in terms of reduced water treatment costs, improved health and increased labour productivity.
The case studies have measured changes in the following examples of environmental indicators that have resulted from concerted efforts among Governments, municipalities, citizen groups, farmers, industry and the private sector:
•Significant improvements in water quality in almost all cases.
•Recovery of degraded soils through planting of trees and native species.
•Reduced erosion and siltation of reservoirs, rivers and estuaries.
•Expansion of habitat for plants, wildlife and fish, even in urban areas.
•Maintenance of minimum flow regimes in rivers.
WATER AND GREEN GROWTH
142
Hence, a concerted policy to protect and restore ecosystem resources in watersheds has led to multiple benefits for downstream users and society as a whole. The protection of the source of water is the first step in a green growth programme.
ECONOMIC FACTORSIn many of the case studies, green growth and green job opportunities related to water resources have improved livelihoods and helped overcome poverty. Such opportunities can be part of ecosystem restoration or economic activity along restored urban waterways. Rural–urban migration and rural–rural migration can be reduced where reliable water and agricultural opportunities are available. Green growth thus makes a major contribution to economic development and social change. Society need not choose between the environment on one hand and employment and economic growth on the other. In addressing the root causes of poverty and inequity, however, green growth initiatives should include supportive social policies and measures to improve livelihoods in rural and urban areas.
PES is a tool used by many sectors, notably agriculture and forestry, to promote the management of land and water resources and provide incentives for restoring rural livelihoods and rehabilitating damaged ecosystems. Successful PES programmes can help in adaptation to climate change and preserving aquatic ecosystems. PES has also been used for income generation in rural areas and can thus be lead to green growth. Most of the PES systems described in the studies are voluntary, and payments can only be received after the agreed benefits (i.e., water quality improvements) have been met. There may be competition among potential participants especially where incentives include direct payments to individuals and acquisition of land tenure.
Other economic impacts identified in the case studies include improvements in drinking water quality and sanitation, as well as a reduction in the cost of drinking water. Achieving green growth economy is not possible without ensuring that everyone has access to basic water and sanitation services. Across the world, access to such services has been a critical step in lifting people out of the vicious cycle of poverty and environmental degradation. As adequate drinking water and sanitation are essential for life and are at the core of the MDGs, such an economic outcome is an accomplishment in itself.
Moreover, access to water and sanitation reduces women’s burden in many regions and provides them opportunities to engage in economic activities.
In addition, improvements in efficiency in irrigation were found in the studies to have resulted from policies to achieve green growth. High-value agriculture and horticultural crops including fruit orchards, vegetables and flowers are being produced in areas where reliable and good-quality water supply has become available. Improved agricultural production from more efficient water use can also improve food security and make water available for other uses.
Job creation was noted in several of the studies from new enterprises that relied on newly restored waterways, such as handicrafts, food processing, tourism and industry. Restored waterways in cities were found to be an engine of growth, and business development has been encouraged in the waterfront areas.
Finally, most of the case studies indicated a high level of cooperation among public and private interests. The private sector is increasingly adopting environ-mental management standards, with support for governmental policies aimed at reducing water and air pollution. Partnerships among all the major players are essential for successful green growth strategies.
SOCIAL AND COMMuNITy FACTORSAt the heart of the approach to green growth is the desire to improve human well-being and social equity, which implies investments in human and social capital in addition to investments in ecosystem protection and green infrastructure.
A green growth approach must enhance access to clean drinking water and sanitation for the poor, especially women, and encourage communities to participate in the management and protection of their own water resources. One of the most important elements found in the case studies was an improvement in water quality, which directly impacts reduction in water-borne disease. A recent WHO study has found that a US$1.00 investment in water and sanitation results in benefits of US$7.00 to US$32.00, depending on the country. These gains are mainly measured in terms of improved labour productivity and savings on public health
143
expenditures (Hutton et al. 2007). Many of the case studies also showed grassroots management of water for agriculture, community water supply and urban development.
Another common thread among many of the case studies (e.g., Georgia, Gujarat, Las Piñas, Lake Sihwa and Sumberjaya) is that social mobilization is essential to the success of any green growth programme. The linkage of green growth with human well-being and social equity requires that people are at the centre of their own economic development. Growth accompanies inclusive and pro-poor economic policies. Policies need to project a vision of a greener as well as a fairer economy and society (UNEMG 2011).
Aligning economic and social needs with environ-mental concerns is easier when dealing with the local environment, with short-term and visible impacts on welfare and economic activity. For instance, there are clear incentives to favour solutions with positive impacts on water quality and on health. The case studies show the positive impact on health and livelihoods from improved water and sanitation infrastructure.
Social mobilization requires intense efforts in training, education and communication for women and men—in water and ecological stewardship,
rehabilitation of landscapes, planting techniques and monitoring.
In order to benefit from green growth policies, people must adapt their skills to the needs in the emerging green job market. Training efforts might be most worthwhile for younger professionals as they should have a greater potential for adapting to the new job requirements and strengthening the new working environment.
On the other hand, older people living in watershed areas already have knowledge of how to preserve their environment. Consulting with them and working on joint campaigns to raise awareness may be very productive. All ages should contribute to the rehabilitation and improvements in the landscape and public places.
Improvements in governance mechanisms reflected in the case studies, particularly river basin committees that involved all major stakeholders, can become the forum for education and awareness-raising programmes. By involving the stakeholders, solutions for fair allocation of resources and respon-sibilities can be reached more easily. Involvement of communities in green growth programmes improves the environment and livelihoods, and encourages social cohesion.
WATER AND GREEN GROWTH
144
4.4 hoW to adoPt the Lessons Learned froM case studies
Case studies are interesting and often inspiring examples of what works in a particular region with a particular level of socio-economic development and a particular set of environmental factors. They can as well be valuable lessons for policymakers in different regions or working at different scales. A brief analysis follows regarding how the case studies in this report and others identified on the project Web site might be used by policymakers who are motivated to develop water and green growth programmes in their own regions. The common thread is that copying a project is neither easy nor wise between one area and another without adaptation to local conditions on some level. After all, one-size-fits-all solutions do not exist for water and green growth.
pOSSIBILITy OF SCALING up OR DOWN Many of the lessons learned from the case studies in this chapter may be scaled up, particularly to the national level. Examples of technologies and water fund schemes are cases in point. Many of them started with small pilot studies. When the scheme has been set up and begins to provide the anticipated benefits, it can encourage others to participate. Such was the case with the nutrient removal technology in the State of Oregon, United States, and the small-scale irrigation and rainwater catchment systems in Gujarat, India. Similarly, the pilot-scale water fund schemes introduced in Ecuador, Indonesia and Kenya have matured and are now extending to other areas. When the success of a technology or payment scheme is clear, the Government should try to extend it to other regions of the country. International organizations or NGOs may also spread the word about successful technologies or approaches to neighbouring regions or countries, as happened with the Nature Conser-vancy’s promotion of Water Funds in Latin America and the Caribbean and the expansion of the Alliance for Water Stewardship in many regions.
On the other hand, some of the case studies, such as the Citarum River Basin in Indonesia and the Four Major Rivers Restoration project in the Republic of Korea, may be too ambitious to implement all
at once without a considerable commitment and coordination of public resources. In some countries it might be best to scale down or break down the huge infrastructural projects to more manageable size. Considering the large investments involved and the importance of engaging stakeholders and mobilizing communities, it might be worthwhile to implement the programme at a smaller scale and then gradually expand the programme after the benefits and the costs are measured. Such projects might be reconsidered step-by-step so that the results may be measured according to agreed benchmarks before expanding to river basin level, then ultimately to other river basins and regions. The evidence shows that watershed management succeeds as a delicate balance of economic, social and environmental concerns, but not if imposed from the top.
pOSSIBILITy OF REpLICATING IN THE SAME OR SIMILAR REGIONSSome initiatives, such as the water funds in Latin America, have been transferred to other countries at similar levels of economic and political development. Such was the case in Colombia and Peru in adopting the example from Ecuador. Each case is site-specific, however, and large amounts of data and information need to be gathered before a new fund can be established. Moreover, successful transfer of such schemes requires strong political leadership using a consultative process to gain buy-in and participation by both the “sellers” and “buyers” of ecosystem services. Invariably a long process of social and community mobilization must take place. While the case studies indicate that water fund schemes can be successful in Latin America, Asia and Africa, replication is difficult and needs to be appropriate to the individual water basin. Robust Government policy and regulatory mechanisms need to be developed, tested and implemented to make such schemes work.
Technological solutions such as the decision support system from Australia, the small hydropower project in Nepal, and the various solutions in Gujarat, India, may also be easily replicable in similar circumstances
145
in the same country. Nonetheless, they are likely to be adopted only where communities can be convinced of the benefits compared with the costs of successful pilot projects elsewhere. In particular, green growth solutions that are introduced on a relatively small scale, such as those in Kenya, Nepal and the Philippines, have good potential to be replicated in the same or similar countries. The economic, social and environmental benefits of those solutions can be clearly demonstrated and seen by others who would like to obtain similar benefits. One of the important lessons drawn from such cases is that Government policy should be flexible enough to enable an innovative scheme to be introduced.
TRANSFERABILITy TO DIFFERENT REGIONSUnsurprisingly, the potential for transferring solutions from one to another region with different geographical or socio-economic conditions is more problematic. Most of the case studies here inves-tigated a river basin that had been degraded, but had flowing water for much of the year. Clearly, their solutions cannot be easily transferred to an arid region that suffers from severe water shortages and therefore does not use the river basin as the basis for water management. However, for those countries that are able to base their planning at river basin level, many of the lessons learned could be very useful. For example, the Ebro River basin project has evolved over many years and places the ecological status of the water course ahead of other objectives. Many of the cases of environmental restoration and
watershed protection may be replicable in other river basins elsewhere.
Water funds are potentially difficult to replicate globally. Creating a fund requires time, leadership, particular biophysical and social conditions, and compatibility with specific national and regional laws. To succeed in transferring water fund programmes to new regions requires the commitment of both leadership and resources to undertake the consid-erable number of tasks necessary to set them up. The implementing body has to be accountable, and put in place a monitoring system to assess whether water funds deliver both the important water-related ecosystem services and targeted biodiversity conservation benefits.
CONCLuSIONSEach water and green growth initiative is specific to the area and country where it is implemented. The case studies in this chapter provide some direction through the common elements that have been identified in successful projects. Each one depends on political commitment, stakeholder engagement and enabling conditions obtained from well-crafted governmental policy and regulation. In particular, policy should be flexible enough to encourage a variety of innovative solutions that can come from public institutions, NGOs, the private sector or individuals for implementation at international, national and local levels. The case studies have clearly demonstrated that partnerships at all levels are crucial to success.
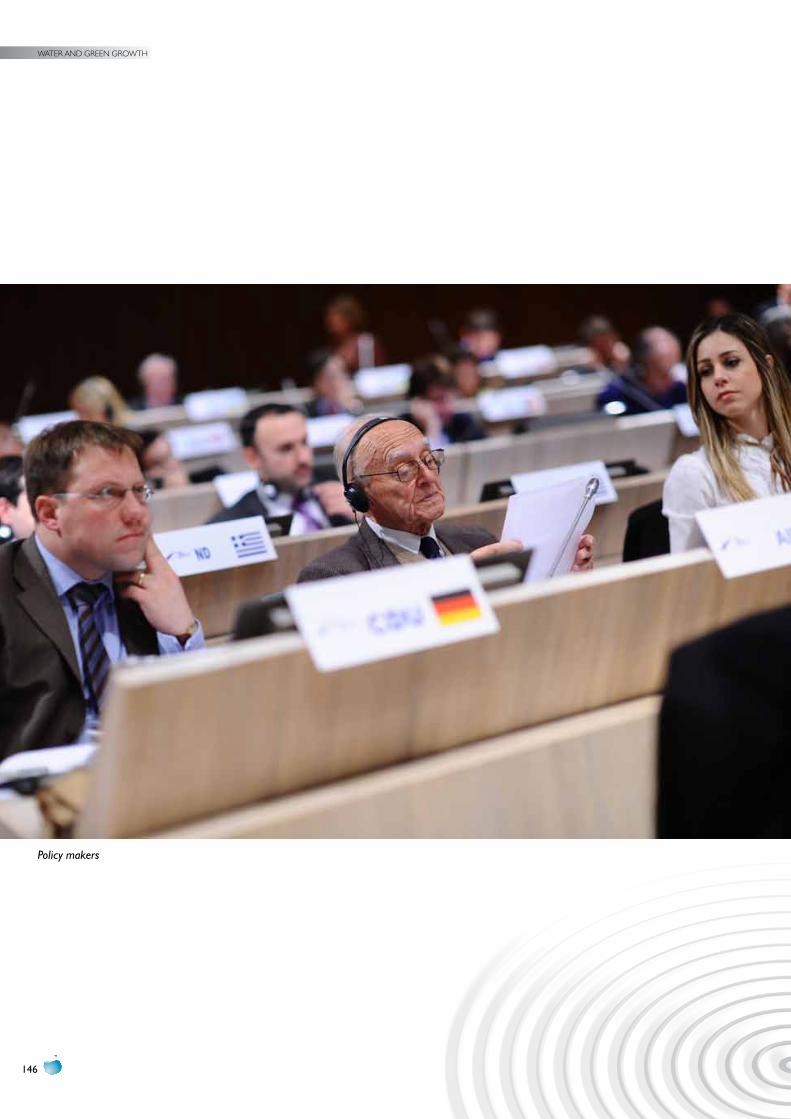
WATER AND GREEN GROWTH
146
Policy makers
147
5. pROpOSED INITIAL pOLICy FRAMEWORK ON WATER AND GREEN GROWTH
Chapter 5 identifies some characteristics common to the case studies that seem to have been intrinsic to the success of green growth. The case studies reinforce the notion that economic growth and environmental stewardship can be complementary and do not require zero-sum trade-offs between the two objectives. In considering policies that can advance green growth, synergies between economic growth and conservation of the environment emerge best when the approach takes into account social factors and has a long-term time frame. That harks back to the original definition of sustainable development: “development that meets the needs of the present without compromising the ability of future generations to meet their own needs.” Water management from the green growth perspective must be undertaken in a holistic way and must consider future generations when defining available resources.
This chapter represents a first attempt to formulate a policy framework for water and green growth. The draft framework is intended to spark discussion and debate at the 6th World Water Forum in Marseille, and beyond. Over the coming years it will evolve
into a tested framework that can be used by policymakers in a wide variety of contexts.
After an overview of policy and planning, this chapter presents specific strategies under environmental, economic and social aspects of policy that incorporate or expand the lessons learned from the earlier chapters in this report. Policy directions have also been derived from A Water Toolbox or Best Practice Guide of Actions (UNW–DPAC 2011). They have been modified in accordance with the effort to examine specifically policies aimed at green growth.
WATER AND GREEN GROWTH
148
5.1 overvieW: PoLicy, PLanning and governance
Green growth aims to ensure that social development and economic growth are compatible with the conservation of water-related ecosystems. Water planning is a powerful tool for identifying how to allocate equitably the available water resources to meet the competing demands of different users, including environmental requirements. Planning is essential to build governance and institutional capabilities to agree on, design and effectively implement long-term integrated water management plans in support of the transition towards green growth. The water or river basin authority must take into consideration the concerns of diverse water users in order to allocate limited water resources in an optimal way to strengthen the economic system. Water planning is also necessary to cope with environmental challenges such as water scarcity, water quality degradation and climate change risks.
River or water basin planning is the foundation for designing water policy that reconciles economic growth, the protection of freshwater ecosystems and the creation of jobs linked to the green economy. In consultation with major stakeholders, basin planners examine economic opportunities and address environmental and development challenges simultaneously.
The following cross-cutting measures were key elements to the success of many of the water and green growth case studies reviewed in chapter 4:
•Integrate land-use management with water management.
•Mobilize political support at national and local levels.
•Establish approaches that are multidisciplinary and multifaceted.
•Engage credible technical experts to conduct baseline assessments, gather reliable data, administer the programme and set up monitoring systems.
•Encourage partnerships among public and private interests both downstream and upstream.
•Share costs and benefits among all stakeholders, upstream and downstream.
•Target the use of ODA for water and green growth programmes.
•Improve governance and institutional arrangements in order to:
- Coordinate policies among fragmented water resources agencies and users, including municipalities, industry and energy producers.
- Incorporate flexibility and adaptability to changing circumstances.
- Enhance social dialogue and collaboration.- Improve management practices.- Promote participatory approaches and
empowerment for managing change.
Based on these principles and building on the Korean Green Growth Strategy examined in chapters 2 and 3 of this report, the matrix in Table 10 presents a suggested policy framework for water and green growth.
The European Union, in its Water Policy Directive 2000/60/EC and subsequent documents, established a framework for EC action in the field of water policy (EC 2010). Many of the concrete policy directions are in line with the principles above, and the directive provides excellent guidance to countries establishing integrated water resources and river basin management plans.
The Framework-Directive has a number of objectives, such as preventing and reducing pollution, promoting sustainable water usage, environmental protection, improving aquatic ecosystems and mitigating the effects of floods and droughts. Its ultimate objective is to achieve “good ecological and chemical status” for all Community waters by 2015 (as was shown in the Ebro River Basin case study in chapter 4). The Directive includes details on how each country is to fulfil its obligations and the timetable by which it should do so. It also encompasses a set of economic principles and measures.
Moreover, the Directive states that: “Member States shall encourage participation by all stakeholders in the implementation of this Framework-Directive, specifically with regard to the management plans for
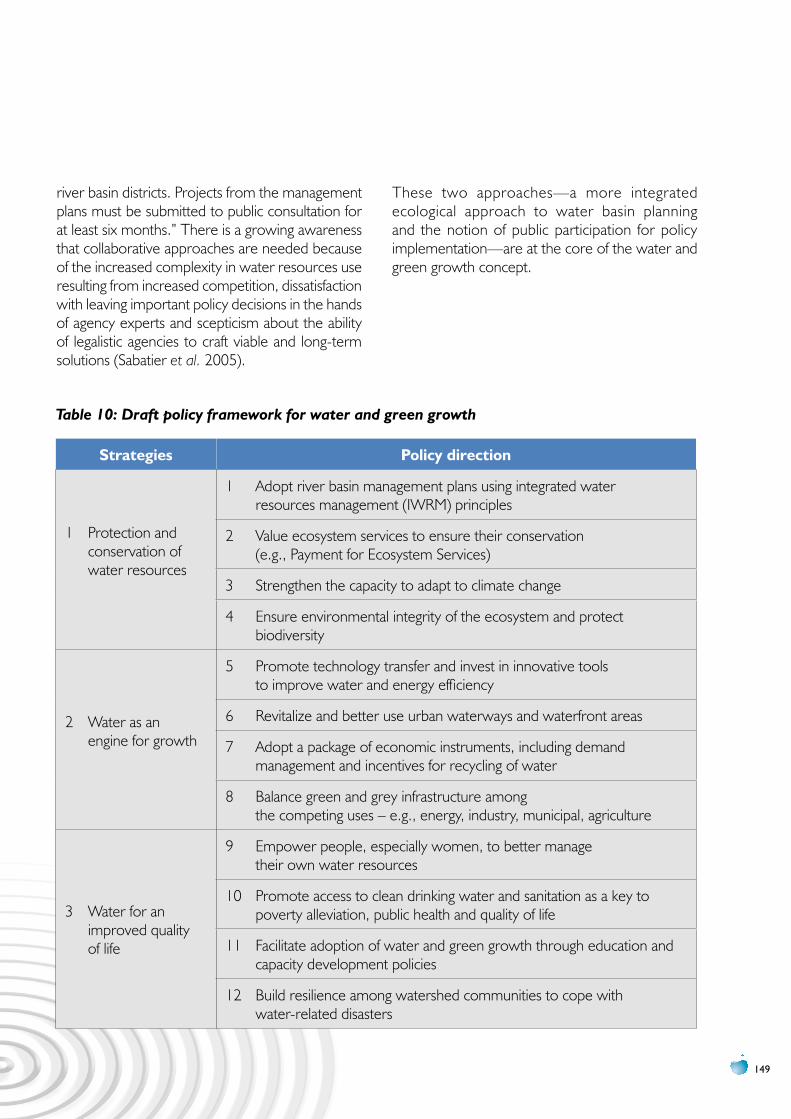
149
river basin districts. Projects from the management plans must be submitted to public consultation for at least six months.” There is a growing awareness that collaborative approaches are needed because of the increased complexity in water resources use resulting from increased competition, dissatisfaction with leaving important policy decisions in the hands of agency experts and scepticism about the ability of legalistic agencies to craft viable and long-term solutions (Sabatier et al. 2005).
These two approaches—a more integrated ecological approach to water basin planning and the notion of public participation for policy implementation—are at the core of the water and green growth concept.
Table 10: Draft policy framework for water and green growth
Strategies Policy direction
1 Protection and conservation of water resources
1 Adopt river basin management plans using integrated water resources management (IWRM) principles
2 Value ecosystem services to ensure their conservation (e.g., Payment for Ecosystem Services)
3 Strengthen the capacity to adapt to climate change
4 Ensure environmental integrity of the ecosystem and protect biodiversity
2 Water as an engine for growth
5 Promote technology transfer and invest in innovative tools to improve water and energy efficiency
6 Revitalize and better use urban waterways and waterfront areas
7 Adopt a package of economic instruments, including demand management and incentives for recycling of water
8 Balance green and grey infrastructure among the competing uses – e.g., energy, industry, municipal, agriculture
3 Water for an improved quality of life
9 Empower people, especially women, to better manage their own water resources
10 Promote access to clean drinking water and sanitation as a key to poverty alleviation, public health and quality of life
11 Facilitate adoption of water and green growth through education and capacity development policies
12 Build resilience among watershed communities to cope with water-related disasters
WATER AND GREEN GROWTH
150
5.2 Protection and conservation of Water resources
As set out in the UN-Water Toolbox for Rio+20, healthy freshwater ecosystems provide services that are crucial for human survival. Investing in the improvement of biodiversity is critical for sustaining or restoring the water-related services provided by ecosystems (UNW–DPAC 2011). Often the poor and indigenous people in watershed areas depend directly on water and other ecosystem services provided by rivers, lakes and wetlands for their livelihoods. There are real opportunities for PES schemes, which are proving a successful instrument for financing environmental protection not only in Latin America, but also in Africa and Asia. They are instruments to improve nature by rewarding its conservation and guaranteeing the continuous provision of the welfare benefits produced by ecosystems.
ADOpT RIvER BASIN MANAGEMENT pLANS uSING IWRM pRINCIpLESUnder the EU Water Policy Directive, management plans had been produced for each river basin district by 2009, taking account of the results of the analyses and studies carried out since 2000. These plans cover the period 2009–2015. They are to be revised in 2015 and thereafter every six years. It is a systematic approach to managing the diverse demands on a water basin, including ecosystem integrity.
In addition to the guidance available from the EU Water Directive, some of the approaches in the chapter 4 case studies that were successful in establishing river basin management plans in support of green growth are:
•Engage political leaders from the top and from the local government and municipalities in developing the plan. Political commitment and negotiation are essential to get agreement on and approval of a watershed protection project.
•Ensure that the river basin plan is supported by national policy and legislation (i.e., Clean Water Act).
•Scale up projects that started as a mutual desire to clean up a polluted waterway to become
multidimensional development plans, with economic, social and environmental impacts.
•Introduce measures to reduce pollution, restore waterways and improve biodiversity in the basin. This should include regulations to reduce point and non-point source pollution from industry, mining, livestock and agriculture.
•Engage a reliable organization to conduct initial baseline assessments, gather reliable data, administer the programme and support local water managers through rigorous decision support and monitoring systems.
•Provide a forum where experts and engineers can work closely with local authorities and where they can learn from each other.
•Endeavour to make decisions on large infrastructure projects in consultation and agreement with the people they will impact.
•Set provision of water supply and sanitation for residents of the watershed as a top priority.
•Ensure good communications with communities and farmers through public meetings, workshops and consultations. The consultative process should empower stakeholders, so that they can influence and change governmental policy.
•Work out the balance between the benefits from natural river functions and the economic benefits from hydropower, irrigation, water supply to cities and other uses.
•Engage local organizations such as water user associations and farmers’ cooperatives to take ownership of parts of the project.
•Secure financial support from both public and private investors.
•Explore economic opportunities for industry, small-scale enterprises and employment.
151
vALuE ECOSySTEM SERvICES TO ENSuRE THEIR CONSERvATIONThe concept of forging an agreement between the stewards of common resources, such as forests, land and water, in the watershed and the users of the resources downstream became a reality in the late 1990s with the New York City Watershed Agreement. “Water stewardship” has become a model for restoration and protection of watershed resources and has spread internationally, as evidenced by the Alliance for Water Stewardship, spearheaded by the Nature Conservancy. Many of the case studies in chapter 4 show how such agreements can have a positive impact on livelihoods, economic development and the environment.
In introducing PES programmes, the following approaches have proved to be effective:
•Adopt a ‘trial and error’ and ‘learning by doing’ process when introducing PES.
•Start small and scale up—better than trying to implement a full-fledged financial mechanism from the beginning.
•Provide convincing information to downstream water users about why they should contribute financially to the protection and restoration of ecosystem services by upstream landowners and managers.
•Identify beneficiaries and suppliers of ecosystem services and representatives of each group who
are able and willing to participate in discussions and negotiations on behalf of others. Stakeholders may include different categories of actors, some of whom are direct suppliers/sellers or users/buyers.
•Mobilize payments for services from the main users—industry, municipalities and downstream communities, water and sewerage utilities, hydropower producers, mining and oil companies, and agricultural associations and cooperatives.
•Include non-monetary payments for ecosystem services, such as conditional land tenure for upstream farmers (e.g., Indonesia).
•Make policy that can be flexible to meet desired outcomes, rather than constrained by rigid formulas.
•Prioritize good social mobilization and support for people in the watershed who can protect the water and forest, including farmers and indigenous people in protected areas.
•Invest in rural livelihoods and green jobs.•Make payments and incentives conditional on results—farmers have to keep their share of the bargain.
•Set aside funds and time for extensive research and information gathering to structure a PES scheme. Agree on the conditions binding the contract and certify recipients of the funds.
•Collect site-specific information on soils, geology, flow regime, roads, landscape, and the like—one size does not fit all.
WATER AND GREEN GROWTH
152
STRENGTHEN CApACITy TO ADApT TO CLIMATE CHANGEEffective management of water variability, ecosystem changes and the resulting impacts on livelihoods in a changing climate scenario are central to a climate-resilient green economy. The water cycle is primarily accelerated by climate change, thereby increasing the number of extreme weather events and resulting in more floods and droughts. Adaptation measures that include effective and robust water management can boost green growth approaches and minimize impacts on livelihoods (UN-Water 2012). Possible actions include:
•Restrict development zones in good agricultural areas located close to strategic waterways and to flood plains in watershed areas; reserve strategic areas for certain types of agriculture.
•Forge collaboration among a wide variety of interests in mobilizing resources to restore invaluable ecological assets. Active participation of users and farmers in the watershed areas and collaboration with municipalities and others downstream are essential.
•Provide a number of options for construction of green infrastructure to support water quality restoration, such as terraces and infiltration basins, planting native species along riverbanks and reforestation of protected areas.
ENSuRE ENvIRONMENTAL INTEGRITy OF ECOSySTEM AND pROTECT BIODIvERSITyAs borne out in Europe, setting the objective of reaching a good or fair ecological status of water bodies as the main objective of river basin management plans has proved to be the key means to make economic development compatible with the chosen environmental objectives. While this goal is not spelled out specifically in some other regions, a common objective in most of the case studies was to protect the watershed and restore the river.
Management plans under the EU Water Directive, which can be used as a guide, aim to:
•Prevent deterioration, enhance and restore bodies of surface water, achieve good chemical and ecological status of such water [by 2015 at the latest] and reduce pollution from discharges and emissions of hazardous substances.
•Protect, enhance and restore the status of all bodies of groundwater, prevent the pollution and deterioration of groundwater, and ensure a balance between groundwater abstraction and replenishment.
•Preserve protected areas.
153
5.3 Water, an engine for groWth
The transition to a green economy requires funds for:
•Investing in water and sanitation services and infrastructure.
•Fostering innovative green technologies.•Creating green job opportunities.•Improving water availability and reducing wastage.•Supporting capacity building, information and enforcement mechanisms.
It also requires increasing efficiencies in the production and consumption of water and energy to make better use of the limited financial resources available. Government investment should concentrate in areas that stimulate the greening of economic sectors and the reduction of spending in areas that deplete natural capital.
pROMOTE TECHNOLOGy TRANSFER AND INvEST IN INNOvATIvE TOOLSGovernments need to facilitate innovation and adoption of greener water and energy technologies, contributing to job creation and structural transformation towards green growth. Technologies help in closing the widening gap between water supply and demand by increasing water availability or increasing the efficiency of water use. Many innovative tools and efficient water and energy technologies for promoting sustainable development are already proven and ready for application on larger scales. However, barriers to adoption—such as lack of access to finance, knowledge and patents—must be addressed. There are opportunities for developing countries to “leapfrog” with information technology.
Suggested policies related to technology that promote green growth include:
•Explore a balance between small-scale technologies and large-scale infrastructure that may yield optimal results (e.g., both micro-harvesting and large water resources development projects in agriculture).
•Improve efficiency in water and energy technologies: o Reduce non-revenue water, leakages.o Adopt existing water and energy efficient
technologies.
o Improve billing and collection, reduce corruption.•Improve technology choice in both public and private sectors.
•Involve the private sector in improving efficiencies.•Transfer knowledge through information technology.
•Improve green skills and training.•Find compromise between high-tech and low-cost technologies.
•Transfer technology from developed to developing countries.
•Seek international financing sources to support adoption of clean technologies.
•Obtain international cooperation and collaboration in research and development.
REvITALIzE AND IMpROvE uSE OF uRBAN WATERWAyS AND WATERFRONT AREASRapid urbanization presents opportunities for green growth, but also poses numerous challenges that range from stress on water resources and waterways to inadequate drinking water supply and sanitation infrastructure. Where appropriate policies, planning and governance structures are in place, the movement of people into cities can result in expansion of the labour force into vital areas of the economy including green sectors, improvements in the quality of life, and well-organized settlements with up-to-date infrastructure. As shown in the case studies in chapter 4, when urban waterways and waterfront areas are cleaned up and protected, they can be exciting centres of green growth. Policies that support the revitalization and better use of existing waterways include:
•Clean up waterways by controlling pollution, improving decentralized sewage and collection systems, and using new green technologies for treating wastewater.
•Promote multi-use development along urban waterways, including parks, recreation, planted areas and carefully designed commercial and residential zones.
•Adapt investment decisions to local resource endowments.
•Move urban residents out of floodplain areas and improve storm water drainage and storage.
•Promote green forms of transport, such as barges
WATER AND GREEN GROWTH
154
and ferries on existing waterways, for movement of goods and people.
•Repurpose old buildings or warehouses to support new green industries.
•Get people involved in conserving protected zones in cities.
•Promote urban agriculture in neighbourhoods, backyards and vacant lots (Chaturavedi and Sarkar 2012).
ADOpT A pACKAGE OF ECONOMIC INSTRuMENTSGovernments need to commit themselves to building the foundation for water-resource-efficient green growth through demand management policies that promote conservation and improve use of water resources. A variety of economic instruments are available for reducing demand and improving efficiency. As over 70% of freshwater resources are used in agricultural production, economic measures must be introduced to increase water efficiency in agriculture. Similarly, all stakeholders are urged to reduce water losses and waste from the watershed down to the city, thus increasing the total availability of water for green growth and ecosystem services.
Demand management instruments can be designed to reduce waste and encourage conservation. They include:
•Establish incentives for recycling and reuse of water in agriculture, industry, cities:o Promote adoption of water-saving appliances
in households, industry and power generation.o Establish regulations on recycling and reuse by
industry.o Improve efficiency in irrigation through
technology and consultation with users.•Introduce equitable tariff systems:
o Progressive tariff rates for water use, with low rates for basic consumption and increasing block rates for higher consumption—to reduce wastage and encourage conservation.
o Polluter pays principles for industry and user pays tariff systems in agriculture.
o Tariff reforms to reflect the real financial, resource and environmental costs of water services.
•Introduce restrictions on water use in times of shortage.•Encourage more responsible water use through education campaigns.
Improve economic efficiency of municipal water and sewerage facilities:
•Require higher efficiency and economic returns in water utilities to attract funds and reduce risks.
•Improve efficiency in service provision to increase profitability and justify green tariffs that reflect financial and environmental costs.
•Provide support for leak detection and repair of distribution systems.
•Provide access to credit for providers on better terms, reducing reliance on public funds.
BALANCE GREEN AND GREy INFRASTRuCTuRE AMONG COMpETING uSESAmong current efforts to provide sustainable water infrastructure, the concepts of eco-efficiency and green infrastructure are gaining momentum in planning and construction. Eco-efficient water infrastructure is supposed to combine sustainable design, construction, operation and maintenance processes with lower environmental impacts. The concept also includes policy measures that encourage an optimal level of water utilization and less wastage.
At the basin level, green infrastructure can include the preservation and restoration of natural landscape features, such as forests, floodplains and wetlands. Green infrastructure management approaches and technologies aim to restore natural hydrological functions through infiltration, capture, reuse and recycling of rainwater.
In urban areas, water management infrastructure can include:
•Decentralization or extension of sewerage systems.
•Control of illegal disposal into water courses.•Improvements in drainage of existing rivers.•Expanded storm water storage areas.•Pollution control.
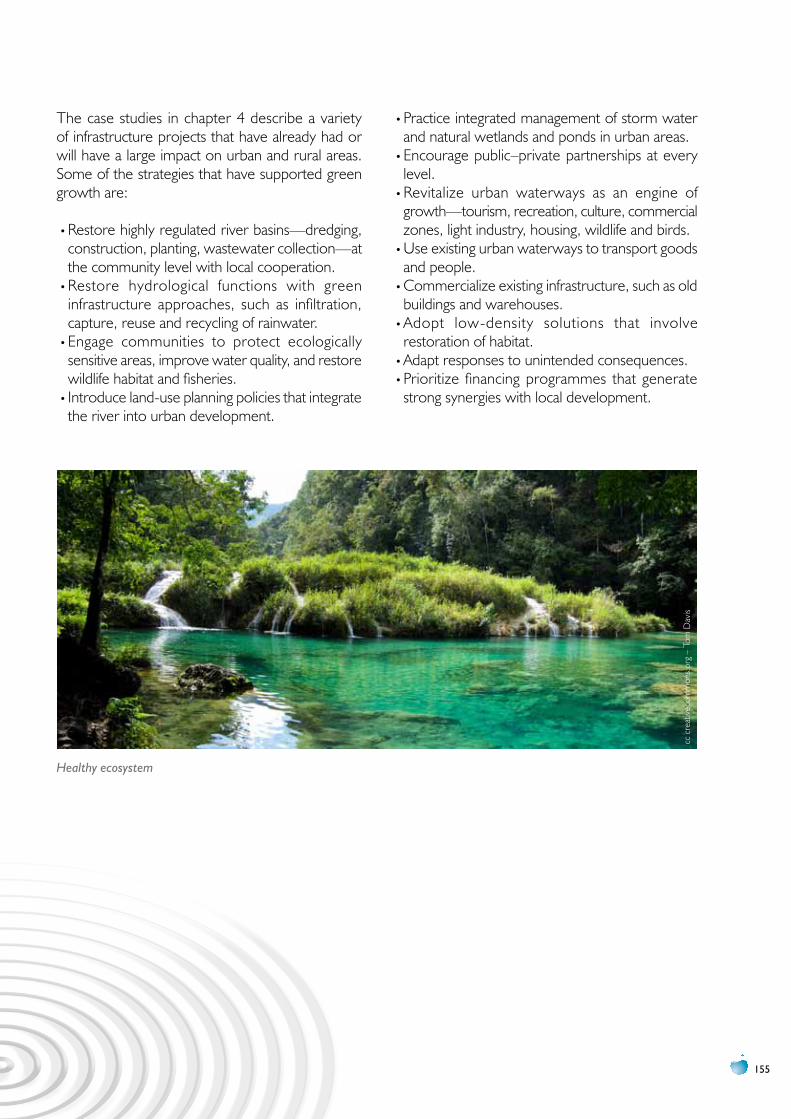
155
The case studies in chapter 4 describe a variety of infrastructure projects that have already had or will have a large impact on urban and rural areas. Some of the strategies that have supported green growth are:
•Restore highly regulated river basins—dredging, construction, planting, wastewater collection—at the community level with local cooperation.
•Restore hydrological functions with green infrastructure approaches, such as infiltration, capture, reuse and recycling of rainwater.
•Engage communities to protect ecologically sensitive areas, improve water quality, and restore wildlife habitat and fisheries.
•Introduce land-use planning policies that integrate the river into urban development.
•Practice integrated management of storm water and natural wetlands and ponds in urban areas.
•Encourage public–private partnerships at every level.
•Revitalize urban waterways as an engine of growth—tourism, recreation, culture, commercial zones, light industry, housing, wildlife and birds.
•Use existing urban waterways to transport goods and people.
•Commercialize existing infrastructure, such as old buildings and warehouses.
•Adopt low-density solutions that involve restoration of habitat.
•Adapt responses to unintended consequences.•Prioritize financing programmes that generate strong synergies with local development.
cc c
reat
ivec
omm
ons.
org
– To
m D
avis
Healthy ecosystem
WATER AND GREEN GROWTH
156
5.4 Water for iMProving the QuaLity of Life
Achieving a green growth economy is not possible without ensuring that everyone has access to basic water and sanitation services. Across the world, access to such services has proved to be a critical step in lifting people out of the vicious cycle of poverty and environmental degradation.
There is an important role for social dialogue and for communities in the provision of water services. Community initiatives are vital in places where governmental action does not extend. The pro-poor approach adopted by many governments and international organizations is paying off, with a greater focus on outcomes, social dialogue, social contracts and community participation. As stressed in the UN-Water paper for Rio+20 (UN–Water 2012), green economies can only be achieved if they are supported by green societies. Achieving sustainable development calls for enabling policies that take into account not only economic but also water-related scientific, social, educational and environmental considerations. This will foster “green societies” that promote a culture of sustainability together with a shift in behaviour and lifestyles. When the supportive measures and policies are in place, the transition to green practices and the promotion of green products and production processes should yield numerous job opportunities that will facilitate social inclusion and poverty reduction.
EMpOWER pEOpLE, ESpECIALLy WOMEN, TO BETTER MANAGE WATER RESOuRCESAs illustrated in our case studies, policies that promote green growth and empower communities and individuals to manage their water resources include actions to: •Engage the population where the projects are implemented.
•Establish a consultative mechanism to gain the confidence of the population before the scheme is implemented.
•Introduce training and capacity building programmes that are aimed at both women and men and strive for gender balance on water committees.
•Promote participatory irrigation management—through WUAs and farmer cooperatives.
pROMOTE ACCESS TO CLEAN DRINKING WATER AND SANITATIONGreen growth provides a critical opportunity to advance education, health, social protection, gender equality and equitable labour policies. In preparing river basin management plans, water and sanitation that meet basic minimum needs of the water basin residents must be assured a top priority. Thus, action will be needed to:
•Improve human health, livelihoods and economic development.
•Engage women and men in managing their water and sanitation facilities.
•Promote small-scale solutions such as rainwater harvesting, water and sanitation for schools, and kitchen gardening.
•Provide social protection during the transition to green growth.
•Protect the poor unskilled workers already in the traditional sectors and facilitate their inclusion as stewards in protecting the watershed through green infrastructure.
FACILITATE EDuCATION AND CApACITy DEvELOpMENT pOLICIES In developing water basin plans, local authorities need to provide education and knowledge-sharing opportunities to partners in the basin. That was found to be a crucial element in successful cases. Some of the actions that work include:
•Provide training and education for both women and men on river rehabilitation and water management.
•Introduce active education and capacity development policies in order to:
o Adapt workforce skills to the emerging green job market.
o Promote investments in human capital and in the acquisition of green skills.
o Increase effectiveness and reduce the costs of building competences in green technologies.
•Use public policy for education and training as a means to favour the inclusion of the poor in the green economy.
•Focus on younger professionals as they have better potential to propel permanent changes.
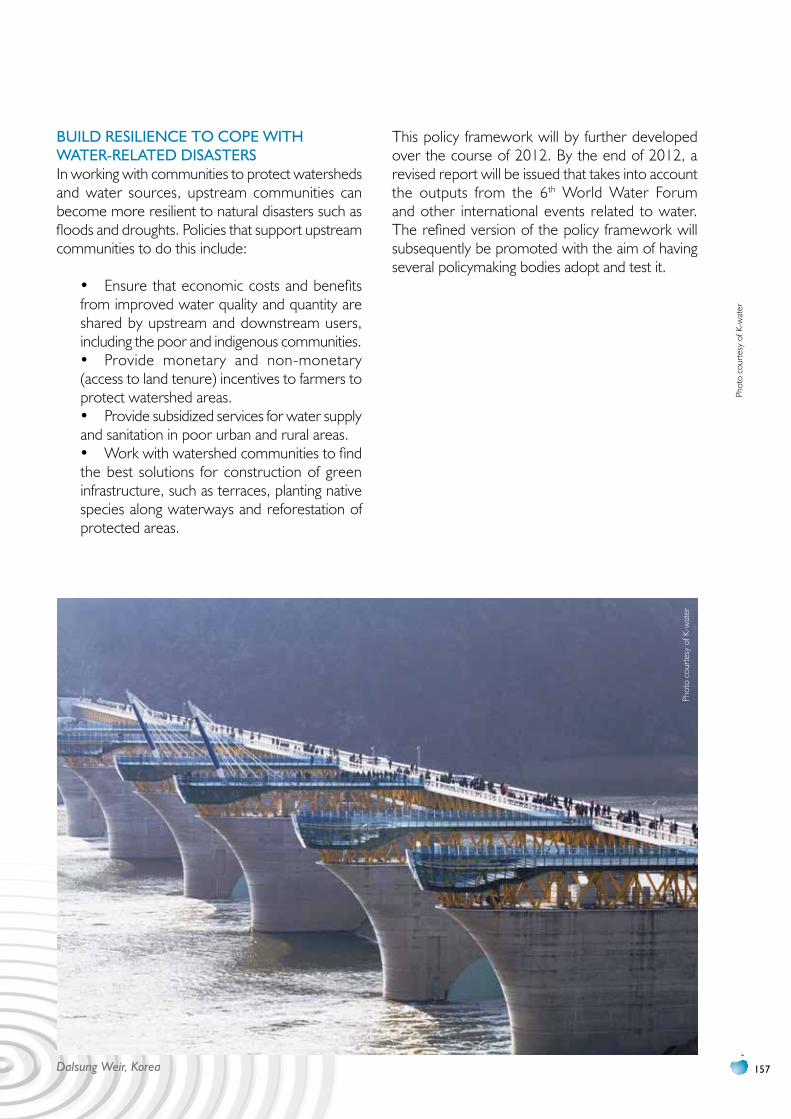
157
Phot
o co
urte
sy o
f K-w
ater
BuILD RESILIENCE TO COpE WITH WATER-RELATED DISASTERSIn working with communities to protect watersheds and water sources, upstream communities can become more resilient to natural disasters such as floods and droughts. Policies that support upstream communities to do this include:
• Ensure that economic costs and benefits from improved water quality and quantity are shared by upstream and downstream users, including the poor and indigenous communities.• Provide monetary and non-monetary (access to land tenure) incentives to farmers to protect watershed areas.• Provide subsidized services for water supply and sanitation in poor urban and rural areas.• Work with watershed communities to find the best solutions for construction of green infrastructure, such as terraces, planting native species along waterways and reforestation of protected areas.
This policy framework will by further developed over the course of 2012. By the end of 2012, a revised report will be issued that takes into account the outputs from the 6th World Water Forum and other international events related to water. The refined version of the policy framework will subsequently be promoted with the aim of having several policymaking bodies adopt and test it.
Phot
o co
urte
sy o
f K-w
ater
Dalsung Weir, Korea
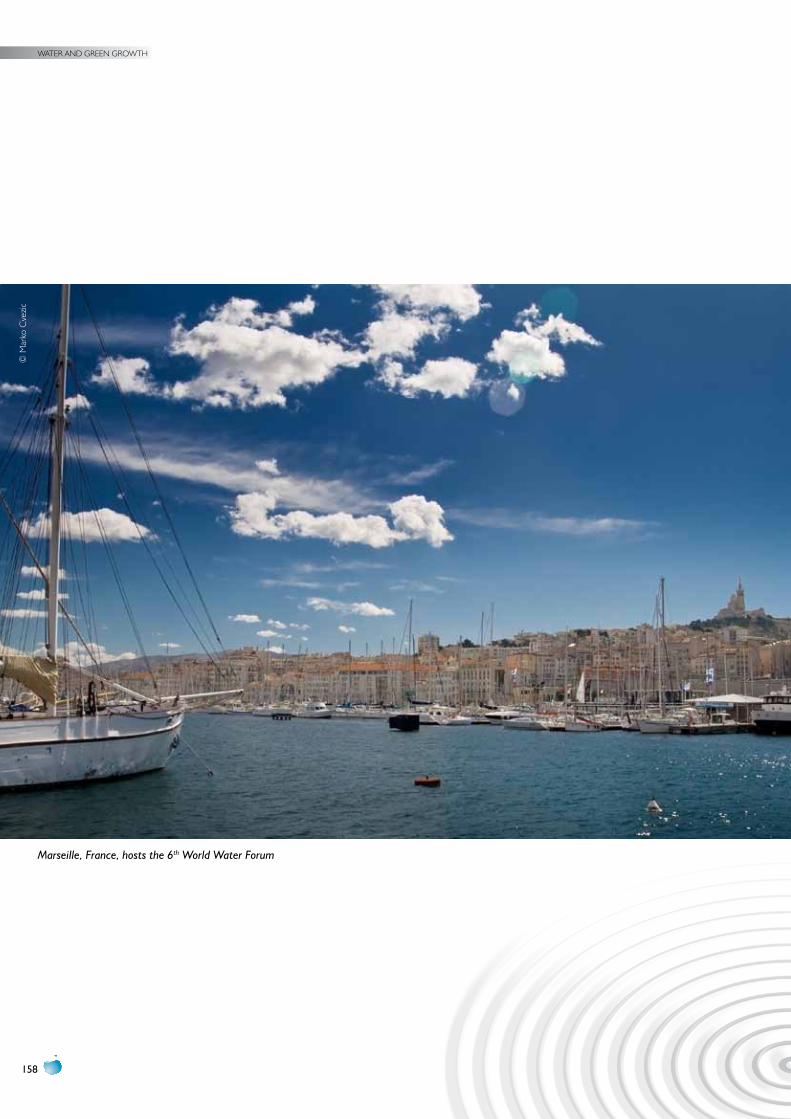
WATER AND GREEN GROWTH
158
Marseille, France, hosts the 6th World Water Forum
© M
arko
Cve
zic
159
6. CONCLuSIONS
Water and green growth is a positive and timely new paradigm that builds on the ideas of sustainable development and IWRM. It has the support of many environmental policymakers and, importantly, of economic policymakers. It has far-reaching, practical environmental, economic and social implications for countries at all stages of development. However, as with most economic paradigms, water and green growth policy needs to be flexible, as there is no one-size-fits-all solution.
This report by the Government of the Republic of Korea (the Ministry of Land, Transport and Maritime Affairs; the Presidential Commission on Green Growth; and K-water) and the World Water Council has brought together the work of a wide variety of individuals and organizations from around the world in the field of water and green growth. It provides a detailed description of how the concept of water and green growth has developed since its inception and provides a snapshot of different international water and green growth projects. The analysis of the case studies has been used in drafting a framework on water and green growth to support the efforts of policymakers at local, national and regional levels in both developing and developed countries. This framework is only an initial formulation based on the evidence provided by the research in chapters 2 and 3 and the case studies in chapter 4 of this report. All of the background research will be available at the Web site (www.waterandgreengrowth.org) and will be published in a later version of this report.
Chapter 2 has examined the comprehensive green growth policy adopted in the Republic of Korea that addresses not only climate change and energy measures, but also economic growth. The policy
has been supplemented by such measures as the Basic Act on Low Carbon, Green Growth and the establishment of GGGI for sharing knowledge and experiences related to green growth with other countries. The difference between the green growth concept and sustainable development was discussed.
The need for ODA from developed to developing countries is considered essential in alleviating the potential effects on economic growth from the adoption of environmentally sound economic policies. Chapter 2 provides a definition of green growth ODA and the rationale for international cooperation to encourage developing countries to participate in climate change agreements. Building on its experience of transitioning from an aid recipient country to an OECD member and aid donor country in less than 50 years, Korean policy stresses the role of ODA to alleviate the potentially negative side effects of economic growth, through the adoption of environmentally sound economic policies.
Chapter 3 has explored the concept of water and green growth and made relevant policy recommendations. It suggests that a strategy for water and green growth should highlight environmental, economic and social dimensions, while continuing to emphasize the promotion of economic growth that has a lower impact on the environment. Water and green growth is a new concept and strategy for tackling the complexity of development challenges in the fields of environmental protection, economics, industrialization and social welfare as they relate to water. The research suggests that the most crucial
WATER AND GREEN GROWTH
160
principle in establishment of policies related to water and green growth is “integration”, similar to IWRM principles.
The chapter has also examined indicators for monitoring, and suggested indicators for a WGGI that will become a useful tool in evaluating the extent to which a country or community is committed to water and green growth. Finally, the chapter has outlined a new concept of water and green growth ODA and recommended an international cooperative mechanism for water and green growth.
Chapter 4 has examined 26 case studies and found that (a) a one-size-fits-all approach will not work and (b) each country or region needs to select the appropriate policies for its own situation. As a background to economic growth, however, healthy ecosystems, sufficient water and biodiversity play a critical role as infrastructure in rural as well as urban areas, where the population and the economy are growing the fastest. The maintenance or restoration of ecosystems should be considered a priority for both public and private investments.
River or water basin planning is the foundation for designing water policy that reconciles economic growth, the protection of freshwater ecosystems and the creation of jobs linked to the green economy. Thus, a concerted policy to protect and restore ecosystem resources in the watershed has led to multiple benefits for downstream users and the society as a whole. The protection of the source of water is the first step in a green growth programme.
PES has been identified as a tool used by many sectors, notably agriculture and forestry, to promote the management of land and water resources and provide the necessary incentives for restoring rural livelihoods and for rehabilitating damaged ecosystems. PES has been used in income generation in rural areas and, thus, can be a means to green growth. Most of the case studies indicated a high level of cooperation among public and private interests. Partnerships among all the major players will be essential to success with green growth strategies.
At the heart of the approach to green growth is the desire to improve human well-being and social equity, which implies investments in human and social capital in addition to investments in ecosystem
protection and green infrastructure. A common thread running through many of the case studies is that social mobilization is essential to the success of any green growth programme. By involving the stakeholders, better solutions can be reached on the fair allocation of resources and responsibilities. Involvement of communities in green growth programmes will improve the environment and livelihoods, and will encourage social cohesion.
When considering a framework on water and green growth, it is important to take into account water governance issues and the predominant role of government in water management. At the same time, successful water and green growth projects have demonstrated a policy shift towards greater participation, including multi-stakeholder platforms from the local level to the river basin level. The State thus enhances its flexibility and adaptability in decision-making in the water sector. River basin authorities, committees or commissions have also been able to provide a forum for education, knowledge sharing and awareness-raising programmes.
Good policy, planning and governance take time to evolve through a process of trial and error. The case studies in this report provide informative examples from one region that may be useful for policymakers in other regions. Good governance in a river basin requires an authority that can coordinate stakeholders with competing demands and allocate water equitably among them, including agriculture, energy, urban water supply and industry. In river basins that cross international boundaries, high-level international negotiation and cooperation may be called for under transboundary basin authorities.
Based on the green growth policy adopted by the Republic of Korea, chapter 5 has presented a draft policy framework that includes three categories of strategy: 1. Protection and conservation of water resources.2. Water as an engine for growth.3. Water for an improved quality of life.
They are divided into 12 policy directions, as outlined in chapter 5. Cross-cutting issues are also included, such as: •Integration of land-use management with water management.
•Mobilization of political support at national and local levels.
161
•Approaches that are multidisciplinary and multi-faceted.
•Engagement of credible technical experts to conduct baseline assessments, administer the programme and set up monitoring systems.
•Partnerships among public and private interests.•Sharing of costs and benefits among all stake-holders, upstream and downstream.
•Targeted ODA for water and green growth programmes.
•Improved governance and institutional arrange-ments.
The policy framework will be further developed by the project implementation team, led by its Steering Committee and advised by a High-Level Panel of Experts. The outputs from the 6th World Water Forum in Marseille, including the policy framework, will be advanced with the support of the Panel.
The Water and Green Growth project will require the collaboration of a wide variety of key stakeholders, many of whom are already working in the area of water and green growth. These include UN-Water, UNEP, United Nations Regional Economic Commissions such as UNESCAP, OECD, GGGI and national governments at all levels of economic development. As nations everywhere are seeking to continue growing and developing their economies, the lessons learned through past mistakes in managing environmental resources can offer cost savings and encourage more stable economies in the future. That should help catalyze innovation and investment that will underpin sustained growth and give rise to new economic opportunities.
By the end of 2012, a revised report will be issued taking into account the outputs from the 6th World Water Forum and other international events related to water being held in 2012, as well as feedback from the Steering Committee and High-Level Panel. The revised report will present a refined version of the policy framework, which will subsequently be promoted with the aim of getting several policymaking bodies to adopt and test the framework.
The water and green growth approach will pave the way for the international community to collaborate in the enhancement of water management for greening development in a time of uncertainty. The challenge over the next three years is to identify more case studies in areas and regions that were not covered so far, such as in water-scarce regions and in sub-Saharan Africa. The transferability of the lessons from the case studies and policy framework should be tested in countries that are under water stress and would like to adopt water and green growth strategies.
The 6th World Water Forum in Marseille in March 2012 is only the beginning of a global effort to bring water and green growth to the attention of Governments and other stakeholders. The joint Water and Green Growth Project between the Korean Government and the WWC is scheduled to continue until the 7th World Water Forum in 2015. Between the two Forums, the project will continue to identify case studies on water and green growth, monitor on-going projects already identified in the project report, and feed into the 7th World Water Forum to be held in Daegu-Gyeongbuk, Republic of Korea in 2015.

WATER AND GREEN GROWTH
162
163
REFERENCES
2030 Water Resources Group. 2009. Charting Our Water Future. Available at: www.2030waterresourcesgroup.com/water_full/Charting_Our_Water_Future_Final.pdf; accessed on 12/02/12.
Alliance for Water Stewardship (AWS). 2010. Available at: www.allianceforwaterstewardship.org; accessed on 12/02/12.
Allan, J. A. 2001. The Middle East Water Question — Hydropolitics and the Global Economy. London: I. B. Tauris.
Asian Development Bank (ADB). 2009. Republic of Indonesia: Integrated Citarum Water Resources Management Investment Program. Vol. 1. Program Administration Memorandum (PAM).
———. 2010. Suzhou Creek Rehabilitation Project. Project information document 32121. Available at:www.adb.org/projects/project.asp?id=32121; accessed on 12/02/12.
Bennett, M. T. 2008. China’s sloping land conversion programme: Institutional innovation or business as usual? Ecological Economics 65(4):699–711.
Biswas, A. 2008. Integrated water resources management: Is it working? Water Resources Management 24(1):5–22.
Chapagain, A. K. 2006. Globalization of Water. Delft: Balkema Publishers.
Chaturavedi, A. and D. Sarker. 2012. Farms in cities: A case for urban agriculture in India. Down to Earth, 31 January. Available at: www.downtoearth.org.in/content/farms-cities; accessed on 12/02/12.
European Commission. 2010. Europa: Summaries of EU Legislation. Water protection and management (Water Framework Directive). Available at: http://europa.eu/legislation_summaries/agriculture/environment/l28002b_en.htm; accessed on 12/02/12.
———. 2012. Available at: http://ec.europa.eu/atoz_en.htm; accessed on 12/02/12.
Garvin, D., 1991. How the Baldrige Award really works. Harvard Business Review, November/December, 80–93.
Global Green Growth Institute (GGGI). 2011. Green Growth in Motion: Sharing Korea’s Experience. Available at www.gggi.org.
Global Water Partnership (GWP). 2000. Integrated Water Resources Management. TEC Background Paper No. 4. Stockholm. Also, see IWRM page of GWP Toolbox; available at www.gwptoolbox.org/index.php?option=com_content&view=article&id=8&Itemid=3; accessed 12/02/12.
———. 2011. Water is not a sector — It’s a cross cutting resource. GWP in Action – News and Activities, 14 June. Available at: www.gwp.org; accessed on 13/07/11.
Grey, D. and C. Sadoff. 2007. Sink or swim? Water security for growth and development. Water Policy 9:545–571.
Grobicki, A. 2010. Managing water for green growth: Supporting climate adaptation and building climate resilience. COP 16 Publication, Global Water Partnership. 118–121.
Gupta, R. K., 2003. Dams and water development for poverty reduction. Water Development and Poverty Reduction. Kluwer Academic Publishers, Part 4(Ch. 10):199–226.
Hart, M. 2009. Guide to Sustainable Community Indicators. 2nd ed. Hart Environmental Data.
Hudson Riverkeeper. 2012. Protection. Available at: www.riverkeeper.org/hudson-river/protection/; accessed on 12/02/12.
Hutton, G., L. Haller and J. Bartram. 2007. Global cost–benefit analysis of water supply and sanitation interventions. Journal of Water and Health 5(4):481–502. Available at: www.iwaponline.com/jwh/005/0481/0050481.pdf; accessed on 12/02/12.
International Union for the Conservation of Nature (IUCN). 2012. Available at: www.iucnredlist.org/initiatives/freshwater; accessed on 16/02/2012.
WATER AND GREEN GROWTH
164
Kaly, U. L., C. R. Pratt and J. Mitchell. 2004. The Environmental Vulnerability Index (EVI). South Pacific Applied Geoscience Commission Technical Report 384.
Kang, H. K. 2011. Green ODA to ease water disputes in Azerbaijan. Korea Times, 24 January.
Kang, S. J. 2010a. Green growth and the Korean economy. The Journal of Korean Economy, 28(1):153–177. [In Korean.]
———. 2010b. Policy proposals for the success of green growth policies in Korea. The Studies of International Affairs 10(1):1–40. [In Korean.]
———. 2010c. Water and green growth. Draft policy paper, not pub. Seoul.
———. 2011. Green growth official development assistance (ODA) and sustainable development. Draft policy paper, not pub. Seoul.
Kemp, R., and P. Martens. 2007. Sustainable Development: How to Manage Something That Is Subjective and Never Can Be Achieved? Sustainability: Science, Practice & Policy. 2:1–10.
Lee, S. H. 2010. Basic Water Bill Research. The 3rd Phase Report of the 21st Frontier Research Project. Water Resources Management Research Centre.
Maran, A. C. C., 2010. Multicriteria decision support system to delineate water resources planning and management regions. Doctoral dissertation. Colorado State University. Fort Collins, Colorado, USA.
McDonnell, A. 2008. Challenges for integrated water resources management: How do we provide the knowledge to support truly integrated thinking? International Journal of Water Resources Management 24(1):131–143.
Meadows, D. H., D. Meadows and J. Randers. 1972. The Limits to Growth. New York: Universe Books.
Munasinghe, M. 2007. Making Development More Sustainable: Sustainable Framework and Practical Applications. Colombo, Sri Lanka: Mind Press.
———. 2008. Addressing the Sustainable Development and Climate Change Challenges Together: Applying the Sustainomics Framework. Paper presented at the Beijing Forum, Beijing, China.
———, 2009. Sustainable Development in Practice: Sustainomics Methodology and Applications. Cambridge, Cambridge University Press.
National Oceanic and Atmospheric Administration (NOAA), United States Department of Commerce. 2009. Smart growth for coastal and waterfront communities. Available at http://coastalsmartgrowth.noaa.gov/report.html; accessed on 12/02/12.
New York City, Department of Environmental Protection. 2012. The Staten Island Bluebelt: A natural solution to storm water management. Available at http://home2.nyc.gov/html/dep/html/dep_projects/bluebelt.shtml; accessed on 12/02/12.
New York State, Department of Environmental Conservation. 2012. Facts about the NYC watershed. Available at: www.dec.ny.gov/lands/58524.html. Accessed on 12/02/12.
Organisation for Economic Co-operation and Development (OECD). 2009. Green growth and water. The Crisis and Beyond: OECD Forum 2009. Available at: www.oecd.org/dataoecd/42/28/43985301.pdf; accessed on 17/02/12.
———. 2011a. Towards Green Growth. Available at: www.oecd.org/dataoecd/37/34/48224539.pdf; accessed 12/02/12.
———. 2011b. OECD secretariat: Inputs to the Rio+20 compilation document. Available at: www.oecd.org/dataoecd/57/52/49030776.pdf; accessed 12/02/12.
Ozlu, H., O. Yorulmaz and S. A. Aytac, 2007. Irrigation Management Transfer to Water User Organizations in Turkey. Fourth Asian Regional Conference, Tehran, Iran.
Presidential Committee on Green Growth (PCGG). 2009. 5-Year Green Growth Plan (2009–2013).
———. 2011. Korea’s Green Growth Strategy: A Korean Approach on Green Growth. Presented at the Climate Change and Development Roundtable, Ljubljana, Slovenia, May 2011.
Presidential Council for Future and Vision (PCFV). 2009. The Road to Green Growth. Seoul: Joong Ang Books. [In Korean.]
Republic of Korea. 2010. Basic Act on Low Carbon, Green Growth. Available at: www.greengrowth.go.kr/?p=42578; accessed on 12/02/12.
Rogers, P. and A. W. Hall. 2003. Effective water governance. TEC Background Paper No. 7. Stockholm: Global Water Partnership Technical Committee. Available at: http://info.worldbank.org/etools/docs/library/80607/IWRM4_TEC07-EffWaterGovernance-Rogers%26Hall.pdf.
Sabatier, P. A. et al. 2005. Collaborative approaches to watershed management. P. A. Sabatier et al., eds. Swimming upstream: Collaborative approaches to watershed management, American and comparative environmental policy. Boston: MIT Press.
Schneider, K. 2011. Pipeline pressures in North China. Chinadialogue, June 3. Available at: www.chinadialogue.net/article/show/single/en/4332-Pipeline-pressures-in-north-China; accessed on 12/02/12.
Tekinel, O. 2007. Turkish experiences on participatory irrigation management, Options Méditerranéennes, Series B, 48:33–46.
Tortajada, C., S. Tigrek and J. J. Sánchez-Meza. 2006. Water governance with equity: Is decentralisation the answer? Decentralisation of the water sector in Mexico and intercomparison with practices from Turkey and Brazil. Background Paper for the Human Development Report, UNDP, 2006.
165
Turkey, State Hydraulic Works (DSI). 2011. Available at: www.dsi.gov.tr/hizmet-alanlari/tarim, accessed on 05/12/11.
United Nations. 2005. 2005 World Summit Outcome Document. Available at: http://daccess-dds-ny.un.org/doc/UNDOC/GEN/N05/487/60/PDF/N0548760.pdf?OpenElement.
United Nations and Stockholm Environment Institute (SEI). 1997. Comprehensive Assessment of the Freshwater Resources of the World. New York: United Nations Division for Sustainable Development. Available at: www.un.org/ecosocdev/geninfo/sustdev/waterrep.htm; accessed on 20/02/12.
United Nations Conference on Sustainable Development (UNCSD). 2011. Rio 2012 Issues Briefs: Water. Available at: www.uncsd2012.org/rio20/index.php?page=view&type=400&nr=231&menu=45; accessed on 12/02/12.
United Nations, Department of Economic and Social Affairs (UNDESA). 2002. Plan of Implementation of the World Summit on Sustainable Development. Available at: www.un.org/esa/sustdev/documents/WSSD_POI_PD/English/WSSD_PlanImpl.pdf; accessed on 12/02/12.
United Nations Economic and Social Commission for Asia and the Pacific (UNESCAP). 2006. The fifth Ministerial Meeting on Environment and Development in Asia and the Pacific. Available at: www.unescap.org/mced/mom/.
———, 2009. Green Growth. Available at: www.greengrowth.org; accessed on 22/02/12.
——— .2010. Guidelines for Establishment of the National Strategies for Eco-Efficient Water Infrastructure Development. Draft report. Bangkok: UNESCAP.
United Nations, Environment Management Group (UNEMG). 2011. Working towards a balanced and inclusive green economy: A United Nations System-wide perspective. Available at: www.unemg.org/MeetingsDocuments/IssueManagementGroups/GreenEconomy/GreenEconomyreport/tabid/79175/Default.aspx; accessed on 12/02/12.
United Nations Environment Programme (UNEP). 2009. Overview of the Republic of Korea’s Green Growth National Vision. Geneva.
United Nations Framework Convention on Climate Change (UNFCCC). 2012. http://unfccc.int/2860.php. Accessed 12/02/12.
UN–Water. 2012. Water in a green economy. A statement by UN–Water for the UN Conference on Sustainable Development 2010 (Rio+20 Summit). Available at: www.unwater.org/downloads/UNW_RIOSTATEMENT.pdf; accessed on 12/02/12.
UN–Water Decade Programme on Advocacy and Communication (UN–WDPAC). 2011. A water toolbox or best practice guide of actions. A contribution from the UN–Water Conference on Water in the
Green Economy in Practice: Towards Rio+20. Available at: www.un.org/waterforlifedecade/green_economy_2011/pdf/water_toolbox_for_rio+20.pdf; accessed on 12/02/12.
Vorosmarty, C. J. et al. 2010. Global threats to human water security and river biodiversity. Nature 467(30 September):555-561.
Water and Green Growth. 2011. Available at: www.waterandgreengrowth.org/; accessed on 12/02/12.
Wilkinson, G. and G. Dale. 1999. Integrated management system: An examination of the concept and theory. The TQM Magazine 11(2):95–104.
World Bank. 2010. São Paulo Case Study Overview. Climate change, disaster risk and the urban poor: Cities building resilience for a changing world. In consultation with the São Paulo Housing Secretariat and the Green and Environment Secretariat. Available at: http://siteresources.worldbank.org/INTURBANDEVELOPMENT/Resources/336387-1306291319853/CS_Sao_Paulo.pdf; accessed on 12/02/12.
World Business Council for Sustainable Development (WBCSD). 2000. Eco-efficiency: Creating More Value with Less Impact. Geneva.
World Commission on Environment and Development. 1987. Our Common Future. Oxford: Oxford University Press.
World Health Organization (WHO). 2008. Safer Water, Better Health: Costs, Benefits and Sustainability of Interventions to Protect and Promote Health. Available at: www.who.int/quantifying_ehimpacts/publications/saferwater/en/index.html; accessed on 27/02/12.
——— and United Nations Children’s Fund. 2003–2010. WHO/UNICEF Joint Monitoring Programme (JMP) for Water and Sanitation. Available at: www.wssinfo.org; accessed on 12/02/12.
Yale Center for Environmental Law and Policy, Yale University; and Center for International Earth Science Information Network (CIESIN), Columbia University. 2005. 2005 Environmental Sustainability Index: Benchmarking National Environmental Stewardship. Available at: http://www.yale.edu/epi; accessed on 18/02/12. New Haven: Yale Center for Environmental Law and Policy.
———. 2008. 2008 Environmental Performance Index. Available at: http://www.yale.edu/epi; accessed on 18/02/12. New Haven: Yale Center for Environmental Law and Policy.
Zhang, Q. and M. T. Bennett. 2011. Eco-compensation for watershed services in the People’s Republic of China. Publication Stock No. RPS113966. Mandaluyong City, Philippines: Asian Development Bank. Available at: http://beta.adb.org/sites/default/files/ecocompensation-watershed-prc.pdf; accessed on 12/02/12.
WATER AND GREEN GROWTH
166
ANNExES
annex 1: esi and ePi BuiLding BLocks: indicators and variaBLesMeasuring tools have been devised for the quantitative assessment of sustainability. The most widely accepted tool is the ESI developed by the Yale Centre for Environmental Law and Policy, of Yale University, together with the Centre for International Earth Science Information Network, of Columbia University (Yale and CIESIN 2005). ESI was developed for evaluating environmental sustainability among different countries. It provides a gauge of a society’s natural resource endowments and environmental history, pollution stocks and flows, and resource extraction rates as well as institutional mechanisms and abilities to change future pollution and resource-use trajectories. In
addition, ESI measures impacts of and responses to environmental change, as well as human vulnerability to it. It also tracks a society’s capacity to cope with environmental stresses and each country’s contribution to global stewardship. The ESI building blocks are shown in Table 11. A shift in focus by the teams developing the ESI led to development of a different index, the EPI, which uses outcome-oriented indicators. EPI subsequently became a benchmark index that can be easily used by policymakers, environmental scientists, advocates and the general public (Yale and CIESIN, 2008). The EPI indicator structure is shown in Table 12.
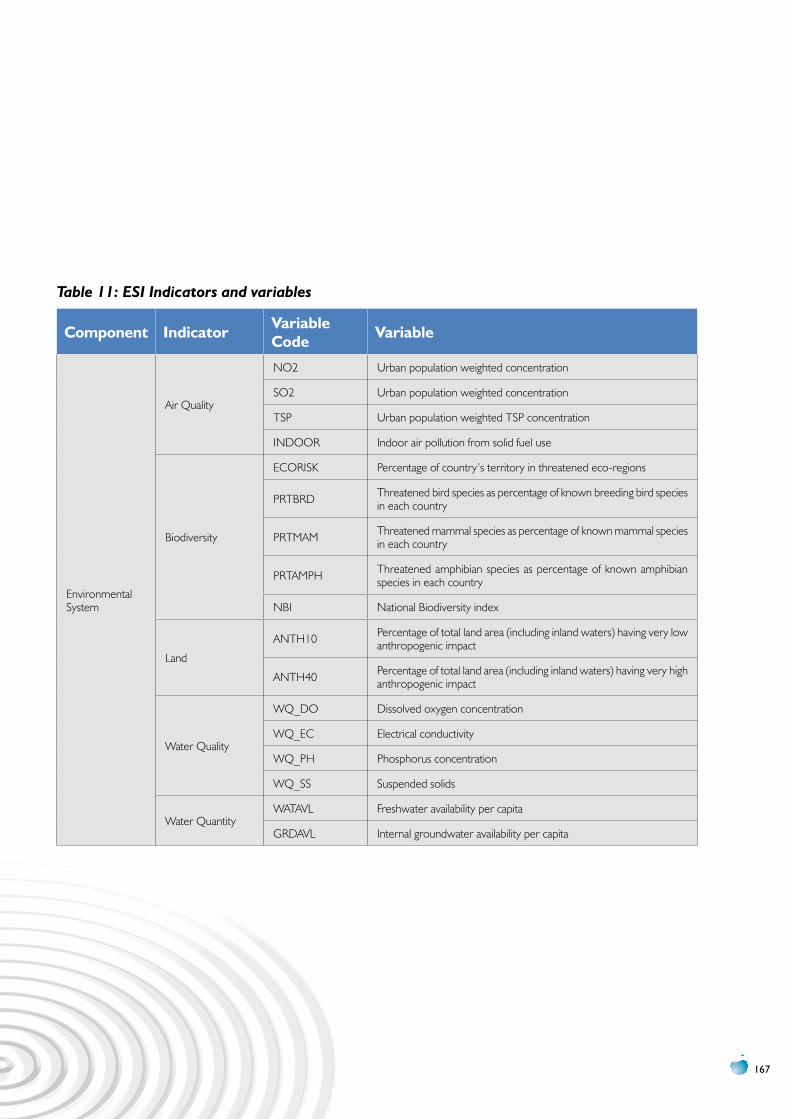
167
Table 11: ESI Indicators and variables
component indicator Variablecode Variable
Environmental System
Air Quality
NO2 Urban population weighted concentration
SO2 Urban population weighted concentration
TSP Urban population weighted TSP concentration
INDOOR Indoor air pollution from solid fuel use
Biodiversity
ECORISK Percentage of country’s territory in threatened eco-regions
PRTBRD Threatened bird species as percentage of known breeding bird species in each country
PRTMAM Threatened mammal species as percentage of known mammal species in each country
PRTAMPH Threatened amphibian species as percentage of known amphibian species in each country
NBI National Biodiversity index
Land
ANTH10 Percentage of total land area (including inland waters) having very low anthropogenic impact
ANTH40 Percentage of total land area (including inland waters) having very high anthropogenic impact
Water Quality
WQ_DO Dissolved oxygen concentration
WQ_EC Electrical conductivity
WQ_PH Phosphorus concentration
WQ_SS Suspended solids
Water QuantityWATAVL Freshwater availability per capita
GRDAVL Internal groundwater availability per capita
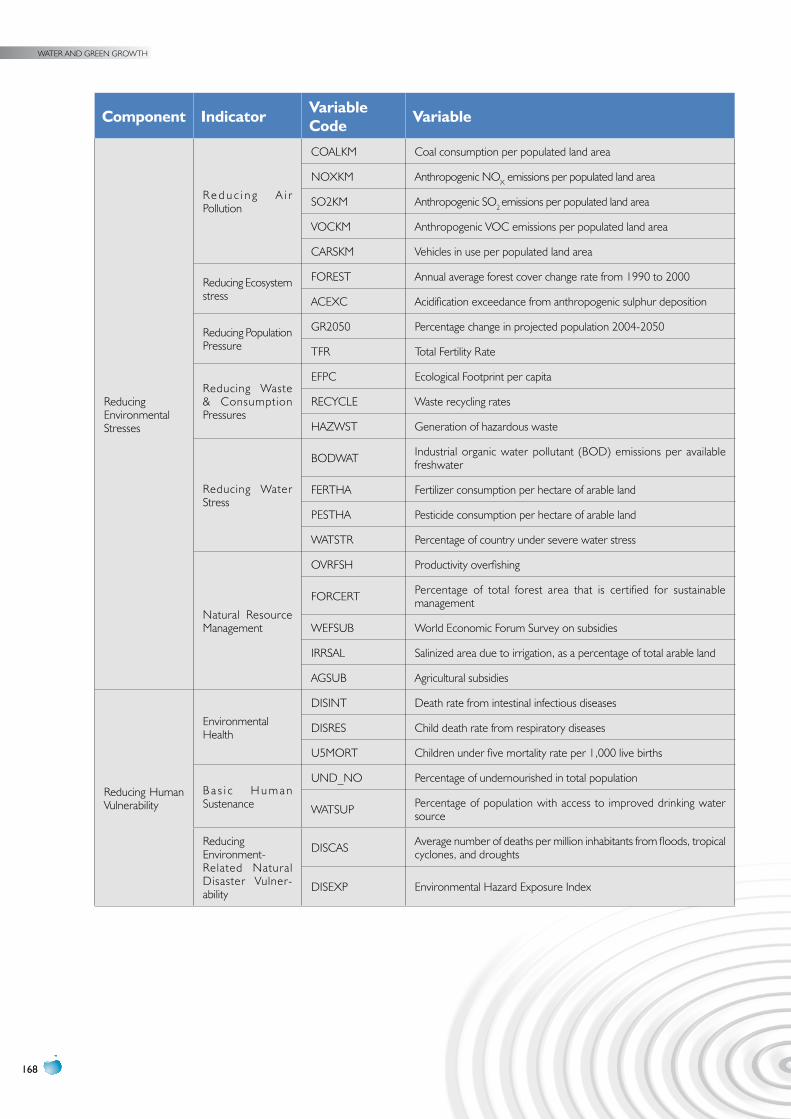
WATER AND GREEN GROWTH
168
component indicator Variablecode Variable
Reducing Environmental Stresses
R e d u c i n g A i r Pollution
COALKM Coal consumption per populated land area
NOXKM Anthropogenic NOX emissions per populated land area
SO2KM Anthropogenic SO2 emissions per populated land area
VOCKM Anthropogenic VOC emissions per populated land area
CARSKM Vehicles in use per populated land area
Reducing Ecosystem stress
FOREST Annual average forest cover change rate from 1990 to 2000
ACEXC Acidification exceedance from anthropogenic sulphur deposition
Reducing Population Pressure
GR2050 Percentage change in projected population 2004-2050
TFR Total Fertility Rate
Reducing Waste & Consumption Pressures
EFPC Ecological Footprint per capita
RECYCLE Waste recycling rates
HAZWST Generation of hazardous waste
Reducing Water Stress
BODWAT Industrial organic water pollutant (BOD) emissions per available freshwater
FERTHA Fertilizer consumption per hectare of arable land
PESTHA Pesticide consumption per hectare of arable land
WATSTR Percentage of country under severe water stress
Natural Resource Management
OVRFSH Productivity overfishing
FORCERT Percentage of total forest area that is certified for sustainable management
WEFSUB World Economic Forum Survey on subsidies
IRRSAL Salinized area due to irrigation, as a percentage of total arable land
AGSUB Agricultural subsidies
Reducing Human Vulnerability
Environmental Health
DISINT Death rate from intestinal infectious diseases
DISRES Child death rate from respiratory diseases
U5MORT Children under five mortality rate per 1,000 live births
B a s i c H u m a n Sustenance
UND_NO Percentage of undernourished in total population
WATSUP Percentage of population with access to improved drinking water source
Reducing Environment- Related Natural Disaster Vulner-ability
DISCAS Average number of deaths per million inhabitants from floods, tropical cyclones, and droughts
DISEXP Environmental Hazard Exposure Index
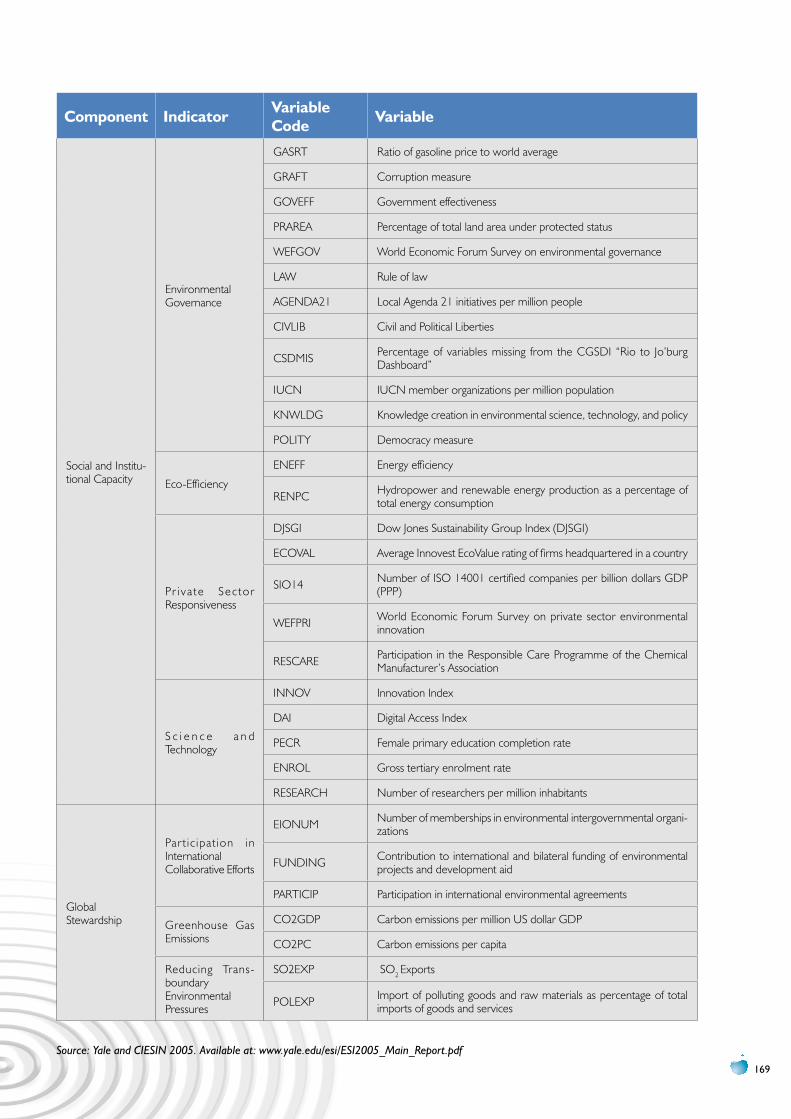
169
component indicator Variablecode Variable
Social and Institu-tional Capacity
Environmental Governance
GASRT Ratio of gasoline price to world average
GRAFT Corruption measure
GOVEFF Government effectiveness
PRAREA Percentage of total land area under protected status
WEFGOV World Economic Forum Survey on environmental governance
LAW Rule of law
AGENDA21 Local Agenda 21 initiatives per million people
CIVLIB Civil and Political Liberties
CSDMIS Percentage of variables missing from the CGSDI “Rio to Jo’burg Dashboard”
IUCN IUCN member organizations per million population
KNWLDG Knowledge creation in environmental science, technology, and policy
POLITY Democracy measure
Eco-Efficiency
ENEFF Energy efficiency
RENPC Hydropower and renewable energy production as a percentage of total energy consumption
Pr i va te Sec tor Responsiveness
DJSGI Dow Jones Sustainability Group Index (DJSGI)
ECOVAL Average Innovest EcoValue rating of firms headquartered in a country
SIO14 Number of ISO 14001 certified companies per billion dollars GDP (PPP)
WEFPRI World Economic Forum Survey on private sector environmental innovation
RESCARE Participation in the Responsible Care Programme of the Chemical Manufacturer’s Association
S c i e n c e a n d Technology
INNOV Innovation Index
DAI Digital Access Index
PECR Female primary education completion rate
ENROL Gross tertiary enrolment rate
RESEARCH Number of researchers per million inhabitants
Global Stewardship
Part ic ipat ion in International Collaborative Efforts
EIONUM Number of memberships in environmental intergovernmental organi-zations
FUNDING Contribution to international and bilateral funding of environmental projects and development aid
PARTICIP Participation in international environmental agreements
Greenhouse Gas Emissions
CO2GDP Carbon emissions per million US dollar GDP
CO2PC Carbon emissions per capita
Reducing Trans-boundary Environmental Pressures
SO2EXP SO2 Exports
POLEXP Import of polluting goods and raw materials as percentage of total imports of goods and services
Source: Yale and CIESIN 2005. Available at: www.yale.edu/esi/ESI2005_Main_Report.pdf
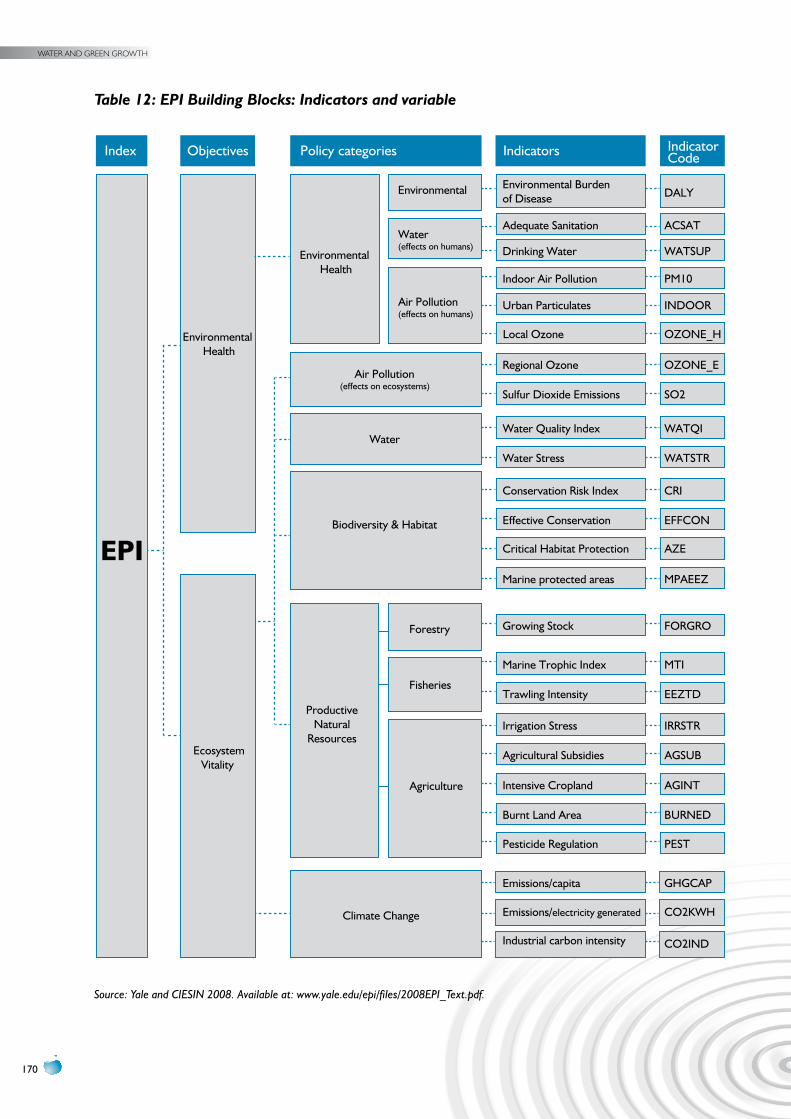
WATER AND GREEN GROWTH
170
Table 12: EPI Building Blocks: Indicators and variable
Indicators Indicator Code
Urban Particulates
EPI
Environmental Health
Index
Air Pollution (effects on ecosystems)
Productive Natural
Resources
Biodiversity & Habitat
Climate Change
Water
Objectives Policy categories
Indoor Air Pollution
Adequate Sanitation
Drinking Water
Environmental Burden of Disease
Local Ozone
Regional Ozone
Environmental Health
Sulfur Dioxide Emissions
Emissions/capita
Emissions/electricity generated
Industrial carbon intensity
Water Quality Index
Water Stress
Conservation Risk Index
Effective Conservation
Critical Habitat Protection
Marine protected areas
Growing Stock
Marine Trophic Index
Trawling Intensity
Irrigation Stress
Agricultural Subsidies
Intensive Cropland
Burnt Land Area
Forestry
Fisheries
Agriculture
EcosystemVitality
Environmental
Water (effects on humans)
Air Pollution (effects on humans)
Pesticide Regulation
INDOOR
PM10
ACSAT
WATSUP
DALY
OZONE_H
OZONE_E
SO2
GHGCAP
CO2KWH
CO2IND
WATQI
WATSTR
CRI
EFFCON
AZE
MPAEEZ
FORGRO
MTI
EEZTD
IRRSTR
AGSUB
AGINT
BURNED
PEST
Source: Yale and CIESIN 2008. Available at: www.yale.edu/epi/files/2008EPI_Text.pdf.
171
annex 2: coMParison BetWeen green groWth oda, and Water and green groWth odaResearchers in the Republic of Korea have outlined specific codes under the OECD Creditor Reporting System (CRS) to include water in Green ODA and Green Growth ODA. Categorizing CRS codes solely for water and green growth ODA presented difficulties, however, as many of them overlap, especially those related to water supply and sanitation, such as those for “large systems” (CRS 14020), basic drinking water supply and basic sanitation (CRS 14030), and river development (CRS 14040).
Nevertheless, a number of new CRS codes should be included in the water and green growth category. In the large category of SOC and services, two more codes have been added. The category of multisectoral aid for basic social services (CRS 16050) combines a wide range of aid activities related to drinking water supply and basic sanitation. The category of statistical capacity-building (16062) reveals the significance of providing an adequate level of data on water and green growth. Regarding the large category of economic overhead capital and services, four more codes must be added. A recent trend in waterfront living in tandem with river rehabilitation efforts requires the inclusion of the category of water transport (CRS 21040). Although questionable in terms of economic feasibility, inland water transport through rivers is one of the environmentally friendly options to reduce carbon dioxide emissions.
A business dimension has been added. The category of business support services and institutions (CRS 25010) should be reflected in water and green growth associated with institutional reform for business and investment climate; i.e., urban water supply and sanitation services. In addition, the category of privatization is crucial in terms of facilitating general State enterprise restructuring or de-monopolizing programmes and advice in the water sector in order to improve water services.
With regard to agricultural sectors, the categories of agricultural education/training (CRS 31181) and agricultural cooperatives (31194) are newly included.
Others include: provision of capacity-building for farmers in rural areas, particularly in developing countries; appropriate information on water-saving techniques; introduction of drought-resistant crops; and consideration of water rights reform for water trading. In a similar context, farmers are encouraged to establish their own organizations such as WUAs to sustainably maintain agricultural fields.
In the course of mineral prospecting and exploration (CRS 32220), water issues should never be ignored, since mineral extraction and processing procedures demand a massive amount of water. Therefore, it is imperative to apply water-saving technology, related economic principles, safety measures, and environmental management. Among various minerals, coal (CRS 32261) is added in Table 13, because in some countries such as China, the coal sector was responsible for 27% of national water consumption in 2010. The Chinese case is rather exceptional, since the country relies heavily on coal for power generation, up to 71% in 2008. Notably, the coal sector is not alone in consuming an excessive amount of water. Water is needed to cool nuclear power plants and to turn coal into fuels, chemicals, synthetic gas and other industrial products. Therefore, water-saving policies and programmes as well as clean coal technology development are worthy of serious consideration (Schneider 2011).
The category of trade policy and administrative management (CRS 33110) is necessary in presenting recent developments in the international effort to standardize activities of drinking water supply and wastewater systems. Technical Committee 224 of the International Organization for Standardization (ISO) shows its work in defining quality criteria in the service and performance indicators. This practice will yield positive impact in developing basic infrastructure in water and sanitation services in developing countries, as well as promotion of green industries and technology development. For instance, the Ministry of Environment in Korea has so far completed standardization of 72 performance indicators in urban water supply and 71 performance
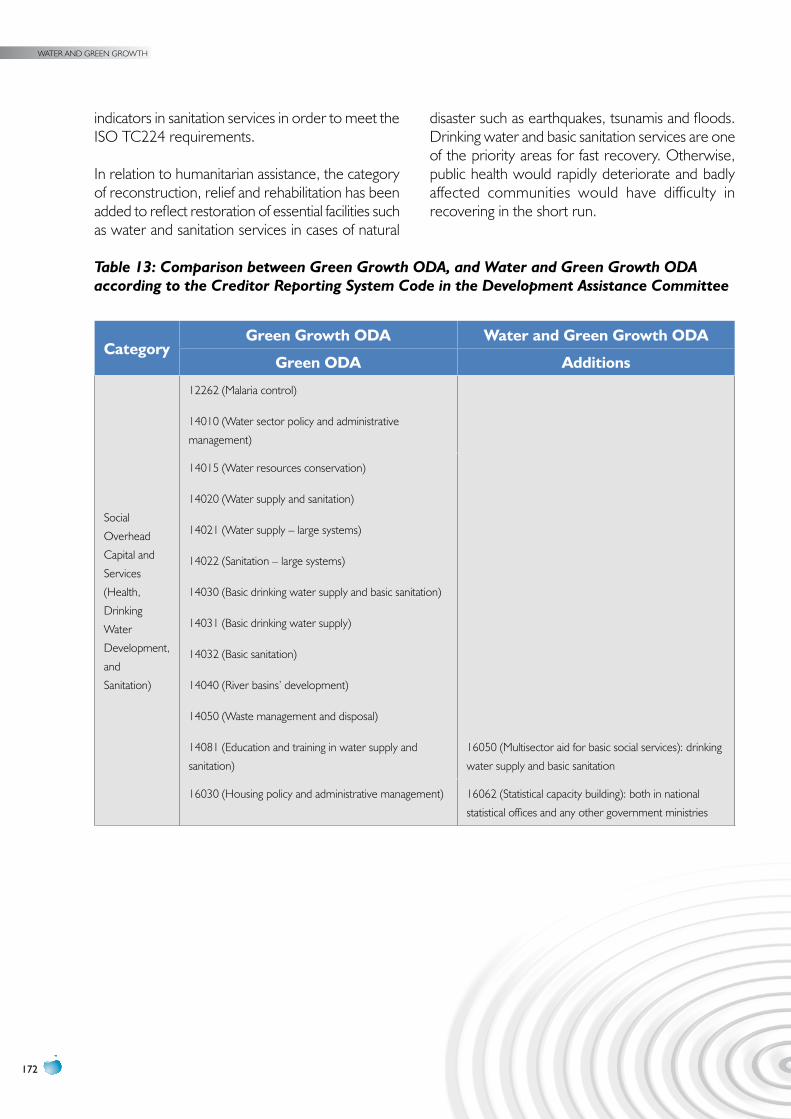
WATER AND GREEN GROWTH
172
indicators in sanitation services in order to meet the ISO TC224 requirements.
In relation to humanitarian assistance, the category of reconstruction, relief and rehabilitation has been added to reflect restoration of essential facilities such as water and sanitation services in cases of natural
disaster such as earthquakes, tsunamis and floods. Drinking water and basic sanitation services are one of the priority areas for fast recovery. Otherwise, public health would rapidly deteriorate and badly affected communities would have difficulty in recovering in the short run.
Table 13: Comparison between Green Growth ODA, and Water and Green Growth ODA according to the Creditor Reporting System Code in the Development Assistance Committee
categoryGreen Growth oDA Water and Green Growth oDA
Green oDA Additions
Social
Overhead
Capital and
Services
(Health,
Drinking
Water
Development,
and
Sanitation)
12262 (Malaria control)
14010 (Water sector policy and administrative
management)
14015 (Water resources conservation)
14020 (Water supply and sanitation)
14021 (Water supply – large systems)
14022 (Sanitation – large systems)
14030 (Basic drinking water supply and basic sanitation)
14031 (Basic drinking water supply)
14032 (Basic sanitation)
14040 (River basins’ development)
14050 (Waste management and disposal)
14081 (Education and training in water supply and
sanitation)
16050 (Multisector aid for basic social services): drinking
water supply and basic sanitation
16030 (Housing policy and administrative management) 16062 (Statistical capacity building): both in national
statistical offices and any other government ministries
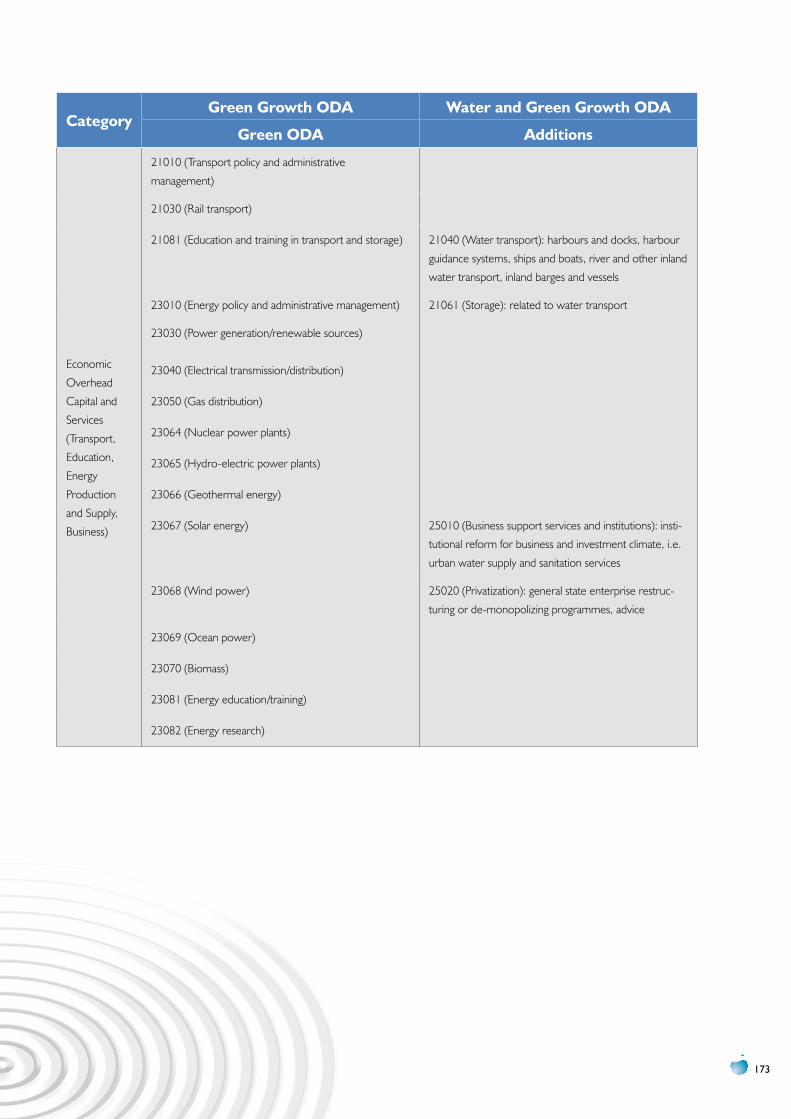
173
categoryGreen Growth oDA Water and Green Growth oDA
Green oDA Additions
Economic
Overhead
Capital and
Services
(Transport,
Education,
Energy
Production
and Supply,
Business)
21010 (Transport policy and administrative
management)
21030 (Rail transport)
21081 (Education and training in transport and storage) 21040 (Water transport): harbours and docks, harbour
guidance systems, ships and boats, river and other inland
water transport, inland barges and vessels
23010 (Energy policy and administrative management) 21061 (Storage): related to water transport
23030 (Power generation/renewable sources)
23040 (Electrical transmission/distribution)
23050 (Gas distribution)
23064 (Nuclear power plants)
23065 (Hydro-electric power plants)
23066 (Geothermal energy)
23067 (Solar energy) 25010 (Business support services and institutions): insti-
tutional reform for business and investment climate, i.e.
urban water supply and sanitation services
23068 (Wind power) 25020 (Privatization): general state enterprise restruc-
turing or de-monopolizing programmes, advice
23069 (Ocean power)
23070 (Biomass)
23081 (Energy education/training)
23082 (Energy research)
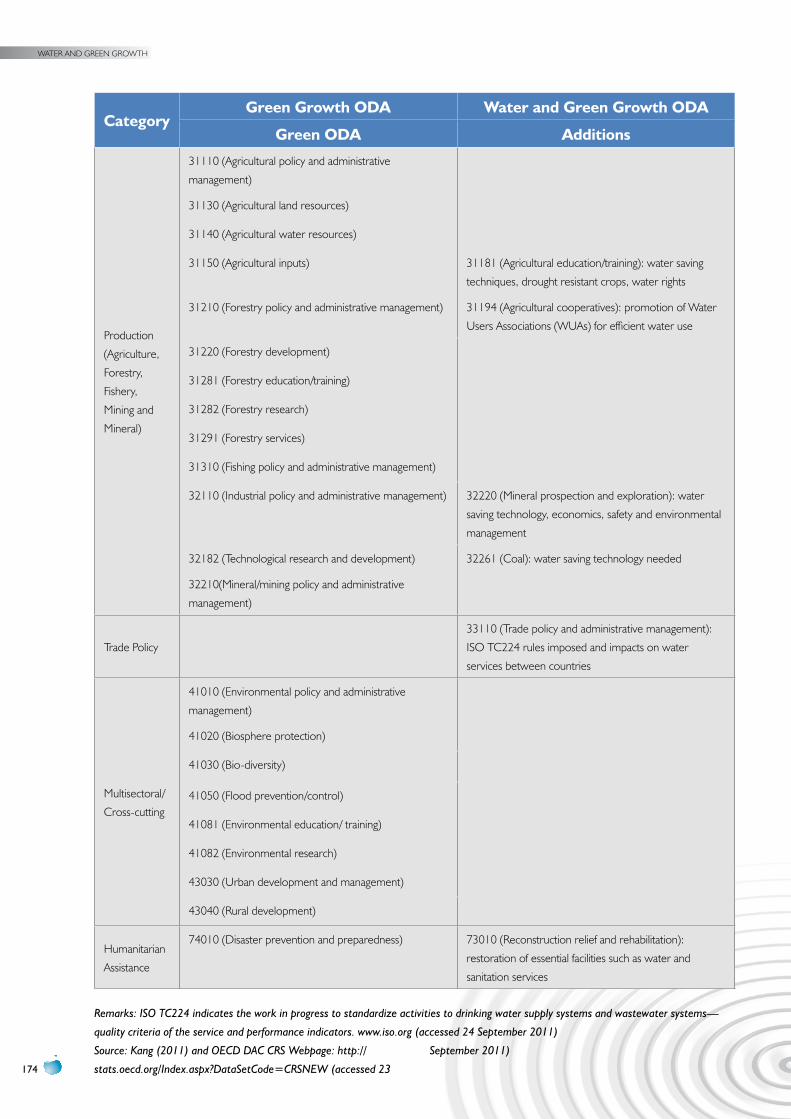
WATER AND GREEN GROWTH
174
categoryGreen Growth oDA Water and Green Growth oDA
Green oDA Additions
Production
(Agriculture,
Forestry,
Fishery,
Mining and
Mineral)
31110 (Agricultural policy and administrative
management)
31130 (Agricultural land resources)
31140 (Agricultural water resources)
31150 (Agricultural inputs) 31181 (Agricultural education/training): water saving
techniques, drought resistant crops, water rights
31210 (Forestry policy and administrative management) 31194 (Agricultural cooperatives): promotion of Water
Users Associations (WUAs) for efficient water use
31220 (Forestry development)
31281 (Forestry education/training)
31282 (Forestry research)
31291 (Forestry services)
31310 (Fishing policy and administrative management)
32110 (Industrial policy and administrative management) 32220 (Mineral prospection and exploration): water
saving technology, economics, safety and environmental
management
32182 (Technological research and development) 32261 (Coal): water saving technology needed
32210(Mineral/mining policy and administrative
management)
Trade Policy
33110 (Trade policy and administrative management):
ISO TC224 rules imposed and impacts on water
services between countries
Multisectoral/
Cross-cutting
41010 (Environmental policy and administrative
management)
41020 (Biosphere protection)
41030 (Bio-diversity)
41050 (Flood prevention/control)
41081 (Environmental education/ training)
41082 (Environmental research)
43030 (Urban development and management)
43040 (Rural development)
Humanitarian
Assistance
74010 (Disaster prevention and preparedness) 73010 (Reconstruction relief and rehabilitation):
restoration of essential facilities such as water and
sanitation services
Remarks: ISO TC224 indicates the work in progress to standardize activities to drinking water supply systems and wastewater systems—
quality criteria of the service and performance indicators. www.iso.org (accessed 24 September 2011)
Source: Kang (2011) and OECD DAC CRS Webpage: http://
stats.oecd.org/Index.aspx?DataSetCode=CRSNEW (accessed 23
September 2011)
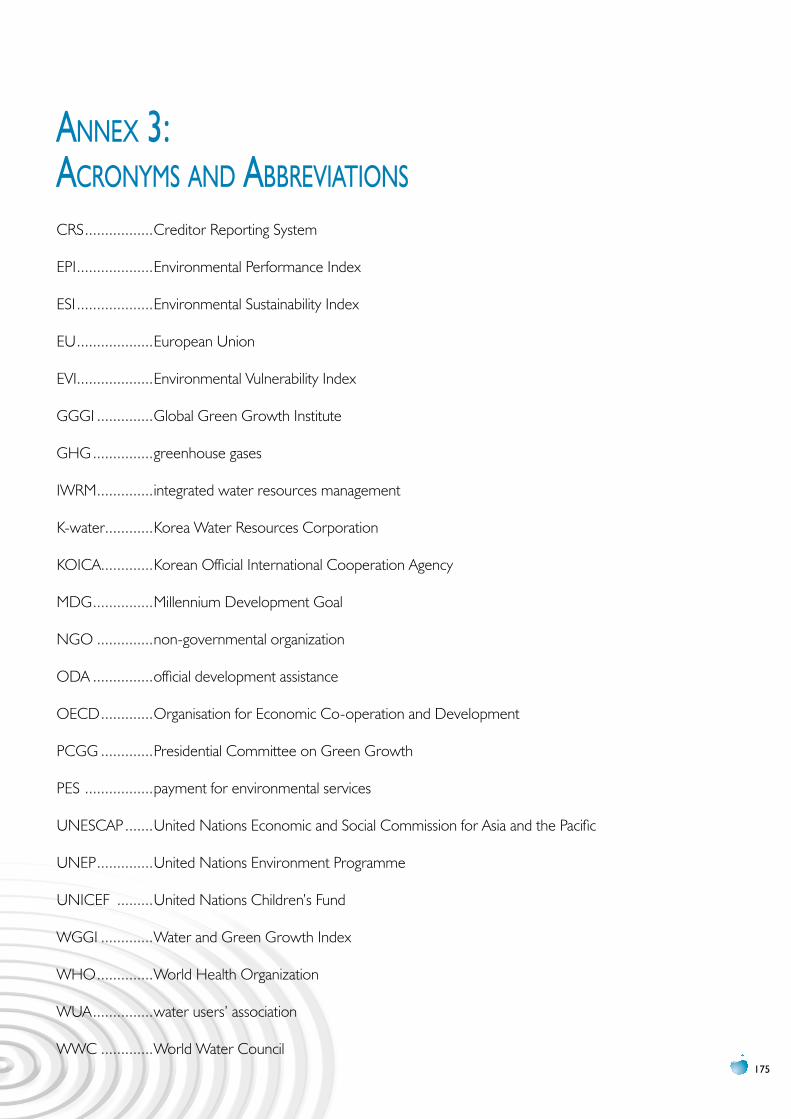
175
annex 3: acronyMs and aBBreviations
CRS .................Creditor Reporting System
EPI ...................Environmental Performance Index
ESI ...................Environmental Sustainability Index
EU ...................European Union
EVI...................Environmental Vulnerability Index
GGGI ..............Global Green Growth Institute
GHG ...............greenhouse gases
IWRM ..............integrated water resources management
K-water............Korea Water Resources Corporation
KOICA.............Korean Official International Cooperation Agency
MDG ...............Millennium Development Goal
NGO ..............non-governmental organization
ODA ...............official development assistance
OECD .............Organisation for Economic Co-operation and Development
PCGG .............Presidential Committee on Green Growth
PES .................payment for environmental services
UNESCAP .......United Nations Economic and Social Commission for Asia and the Pacific
UNEP ..............United Nations Environment Programme
UNICEF .........United Nations Children’s Fund
WGGI .............Water and Green Growth Index
WHO ..............World Health Organization
WUA ...............water users’ association
WWC .............World Water Council
MINISTRY OF LAND, TRANSPORT AND MARITIME AFFAIRS (MLTM)47, Gwanmunro, Gwancheon-City, Gyeonggi-Do, 427-712, Republic of Korea
Tel: +82-2-1599-0001 – Fax: +82-2-2150-1000E-Mail: [email protected]
Web site: http://english.mltm.go.kr
PRESIDENTIAL COMMITTEE ON GREEN GROWTH (PCGG)
Address: 14 Jongno-gu,Seoul, 110-729, Republic of KoreaTel: +82-2-735-2065 – Fax: +82-2-735-2161
E-Mail: [email protected] site: www.greengrowth.go.kr/english/
KOREA WATER RESOURCES CORPORATION (K-water)Address: San 6-2, Yeonchuk-dong, Daekeok-gu, Daejeon, 306711, Republic of Korea
Tel: +82-42-870-7436 – Fax: +82-42-870-7419E-Mail: [email protected]
Web site: http://english.kwater.or.kr/
WORLD WATER COUNCIL (WWC)Espace Gaymard - 2-4 Place d’Arvieux - 13002 Marseille - France
Tel: +33-4-9199-4100 - Fax: +33-4-9199-4101E-Mail: [email protected]
Web site: www.worldwatercouncil.org
www.waterandgreengrowth.org