Embed Size (px)
Citation preview
Water and Energy Nexus: A Literature Review
PR EPA R ED BY AUGUST 2013
A joint program of
Stanford Woods Institute for the Environment
and Bill Lane Center for the American West

About Water in the WestWater in the West is a partnership of the faculty, staff and students of the Stanford Woods Institute for the Environment and the Bill Lane Center for the American West. The mission of Water in the West is to design, articulate and advance sustainable water management for the people and environment of the American West. It links ideas to action by engaging in cutting-edge research, creative problem solving, active collaboration with decision makers and opinion leaders, effective public communications and hands-on education of students.
ContactWater in the WestStanford UniversityJerry Yang and Akiko Yamazaki (Y2E2) Building473 Via Ortega, MC 4205Stanford, CA [email protected]
Cover Photo Credits: WET-CAT
i
Table of Contents
Table of Contents
EXECUTIVE SUMMARY ............................................... 1
INTRODUCTION ............................................................. 7
ACKNOWLEDGMENTS .................................................. 8
SECTION I. ENERGY FOR WATER .............................. 9
Introduction ................................................................... 9
Energy for Water Extraction ......................................... 9
1. Surface Water ....................................................... 10
2. Groundwater ......................................................... 11
2.1 Groundwater Use in the U.S. ....................... 11
2.2 Next Steps ..................................................... 13
3. Desalination .......................................................... 13
3.1 Desalination Technologies ........................... 14
i. Reverse Osmosis (RO) ......................... 15
ii. Nanofiltration ........................................ 15
iii. Electrodialysis (ED) ............................ 16
iv. Multistage-Flash Distillation (MSF) ... 16
v. Multiple-Effect Distillation (MED) ..... 16
vi. Vapor Compression............................... 16
vii. Membrane Distillation (MD) or Hybrid .. 16
3.2 Energy Costs and Efficiency ........................ 18
3.3 Energy Costs of Disposal ............................. 19
4. Conclusion ............................................................. 20
Energy for Water Conveyance ....................................... 20
1. Water Conveyance ................................................ 21
1.1 Large Water Transfers ................................. 22
1.2 Distribution Networks .................................. 23
2. Policy ..................................................................... 24
3. Energy Savings Potential ..................................... 26
3.1 Pumps and Pipes .......................................... 26
3.2 In-Conduit Hydroelectricity ........................ 26
3.3 Losses ............................................................ 27
4. Conclusion ............................................................. 27
Energy for Water Treatment and Distribution ............ 281. Water Treatment .................................................. 30
1.1 Water Treatment Standards ........................ 30
1.2 Treatment Plants .......................................... 31i. Surface Water Treatment .................... 31ii. Groundwater Treatment ..................... 31iii. Trends ................................................... 31
1.3 Energy Conservation .................................... 34
1.4 Green Infrastructure .................................... 352. Water Distribution ................................................ 35
2.1 Water Distribution Regulations ................... 35
2.2 Water Distribution Networks ...................... 36
2.3 Reducing Embedded Energy ....................... 36i. Infrastructure Upgrades ...................... 36ii. Leak Management ................................ 37iii. In-Conduit Hydropower ....................... 37
3. Conclusion ............................................................. 38
Energy for Wastewater Treatment ............................... 381. Wastewater Collection .......................................... 402. Wastewater Treatment ......................................... 40
2.1 Wastewater Treatment Standards .............. 40
2.2 Wastewater Treatment Plants ..................... 42i. Publicly Owned Treatment
Works (POTW) ..................................... 42ii. Privately Operated Wastewater
Treatment Works .................................. 44
2.3 On-Site Sewage Facilities ............................ 45
2.4 Process Optimization ................................... 46
2.5 Energy Potential of Wastewater Treatment Plants .......................................... 46
2.6 Constructed Treatment Wetlands ................. 483. Recycled Water ..................................................... 49
3.1 Regulations and Policy ................................... 49i. Federal Level ............................................ 49ii. State Level ............................................... 50
Water and Energy Nexus: A Literature Review
ii
3.2 Water Reuse in the U.S. ................................. 51i. Non-Potable Reuse ................................... 52ii. Potable Reuse .......................................... 52
3.3 Energy Intensity of Water Recycling ............ 54i. Water Recycling Facilities ....................... 55ii. Engineered Natural Systems ................ 57
3.4 Barriers to Water Recycling........................... 574. Water Discharge ................................................... 585. Conclusion ............................................................. 59
SECTION II. WATER FOR ENERGY ............................. 61
Introduction ................................................................... 61
Coal ................................................................................. 611. Mining ................................................................... 632. Processing ............................................................. 653. Transportation ..................................................... 654. Conclusion ............................................................. 65
Natural Gas .................................................................... 681. Extraction ............................................................. 71
1.1 Conventional Natural Gas ............................ 71
1.2 Unconventional Natural Gas ........................ 72i. Shale and Tight Sand Gas ....................... 72ii. Coal Bed Methane ................................... 75
2. Processing and Storage ........................................ 77
2.1 Liquefied Natural Gas ..................................... 77
2.2 Gas-to-Liquids ................................................ 77
2.3 Gas Storage ..................................................... 783. Transportation ...................................................... 784. Conclusion ............................................................. 79
Uranium .......................................................................... 801. Mining ................................................................... 822. Processing and Transportation ........................... 843. Conclusion ............................................................. 85
Thermoelectric Generation ........................................... 881. Cooling Technologies ........................................... 89
1.1 Once-Through (Open-Loop) Cooling .......... 89
1.2 Closed-Loop (Wet) Cooling ......................... 90
1.3 Dry (Air) Cooling ......................................... 91
1.4. Hybrid Cooling .............................................. 922. Water Use for Thermoelectric Generation .......... 93
2.1 Survey Approach .......................................... 93
2.2 Technology Approach .................................. 94i. Fossil Fuels (Coal, Natural Gas, Oil, Biomass) ............................................ 95ii. Nuclear ..................................................... 95iii. Advanced Natural Gas Technologies .... 95iv. Advanced Coal-Fired Facilities ............. 98v. Solar Thermal .......................................... 98vi. Geothermal ............................................. 98
2.3 Understanding Discrepancies ..................... 993. Environmental Impact ......................................... 100
3.1. Freshwater Sources and Supplies ............... 100
3.2 Water Quality and Aquatic Life ................... 1024. Future Demand and Climate Change ................. 1035. Conclusion ............................................................. 103
Oil .................................................................................... 1041. Drilling and Extraction ........................................ 106
1.1 Conventional Oil ........................................... 106
1.2 Unconventional Oil ....................................... 108i. Oil Sands .............................................. 109ii. Oil Shale ................................................ 110
1.3 Water Rights and Regulations ..................... 111i. Water Rights ......................................... 111ii. Regulations ........................................... 112
2. Transportation ...................................................... 1123. Processing, Refining and Storage ....................... 1124. Conclusion ............................................................. 113
Transportation Biofuels ................................................ 1131. Feedstock Production .......................................... 116
1.1 Bioethanol ..................................................... 116i. Corn Ethanol ........................................ 116ii. Cellulosic Ethanol ................................ 117
1.2 Biodiesel ........................................................ 1172. Processing, Refining and Storage ....................... 118
2.1 Ethanol .......................................................... 118i. Corn Ethanol ........................................ 118ii. Cellulosic Ethanol ................................ 118
2.2 Biodiesel ........................................................ 1183. Transportation ...................................................... 1194. Life-Cycle Analyses and Water Balance ............. 1205. Conclusion ............................................................. 121
REFERENCES ................................................................. 123
iii
Table of Contents
Section I – List of Figures
Figure 1. Water Flowchart (Highlighting Water Extraction and Conveyance) ........................................ 10
Figure 2. Electricity Consumption in 2010 by Major California Water Supplies .............................................. 12
Figure 3. Energy Intensity of Inland Empire Utility Agency and San Diego (Calif.) Water Supply Options .. 14
Figure 4. U.S. Desalination Capacity by Source Water and Technology in 2005 .................................... 15
Figure 5. Simplified RO Scheme With Energy Recovery System ........................................................... 15
Figure 6. ED Process Principle .................................... 16
Figure 7. Simple MSF Distillation Process Scheme ... 17
Figure 8. Multiple Effect Distillation Process ............. 17
Figure 9. Vapor Compression Process .......................... 18
Figure 10. Brine Disposal Options for Desalination Plants in the U.S. ........................................................... 19
Figure 11. Water Flowchart (Highlighting Source) .... 21
Figure 12. Emerging Water Stress and Projected Population Growth ......................................................... 22
Figure 13. Energy Intensity of Water in Potatoes, Columbia River Basin .................................................... 23
Figure 14. Energy Intensity of IEUA Water Supply Options ........................................................................... 25
Figure 15. Water Flowchart (Highlighting Water Treatment and Water Distribution) .............................. 29
Figure 16. Typical Drinking Water Treatment Process ... 32
Figure 17. Water Treatment Energy Intensity ............. 32
Figure 18. Monthly Energy Consumption in 2010 by California Water Supplies ......................................... 34
Figure 19. Water Flowchart (Highlighting Water Collection, Treatment and Discharge) ......................... 39
Figure 20. Share of On-Site Wastewater Treatment for Households by State ................................................. 41
Figure 21. Total Documented Needs for Wastewater Treatment in the U.S. .................................................... 42
Figure 22. Typical Wastewater Treatment Process ... 43
Figure 23. Population Served by POTWs Nationwide Between 1940 and 2008 and Projected ....................... 43
Figure 24. Electricity Requirements for Activated Sludge Systems .............................................................. 44
Figure 25. Septic System .............................................. 45
Figure 26. Summary of Wastewater Solids Management in the U.S. ................................................ 47
Figure 27. Facilities With Anaerobic Digestion and Digester Gas Utilization in the U.S. ....................... 48
Figure 28. Unit Cost Information for Selected Resource Management Strategies ................................ 49
Figure 29. Reclaimed Water Utilization in Florida and California ................................................................ 51
Figure 30. Planned Direct Potable Reuse (DPR) and Examples of Implementation ................................. 53
Figure 31. Planned Indirect Potable Reuse (IPR) and Examples of Implementation ................................. 54
Figure 32. Energy Intensity of Water Supply Sources in Southern California .................................... 55
Water and Energy Nexus: A Literature Review
iv
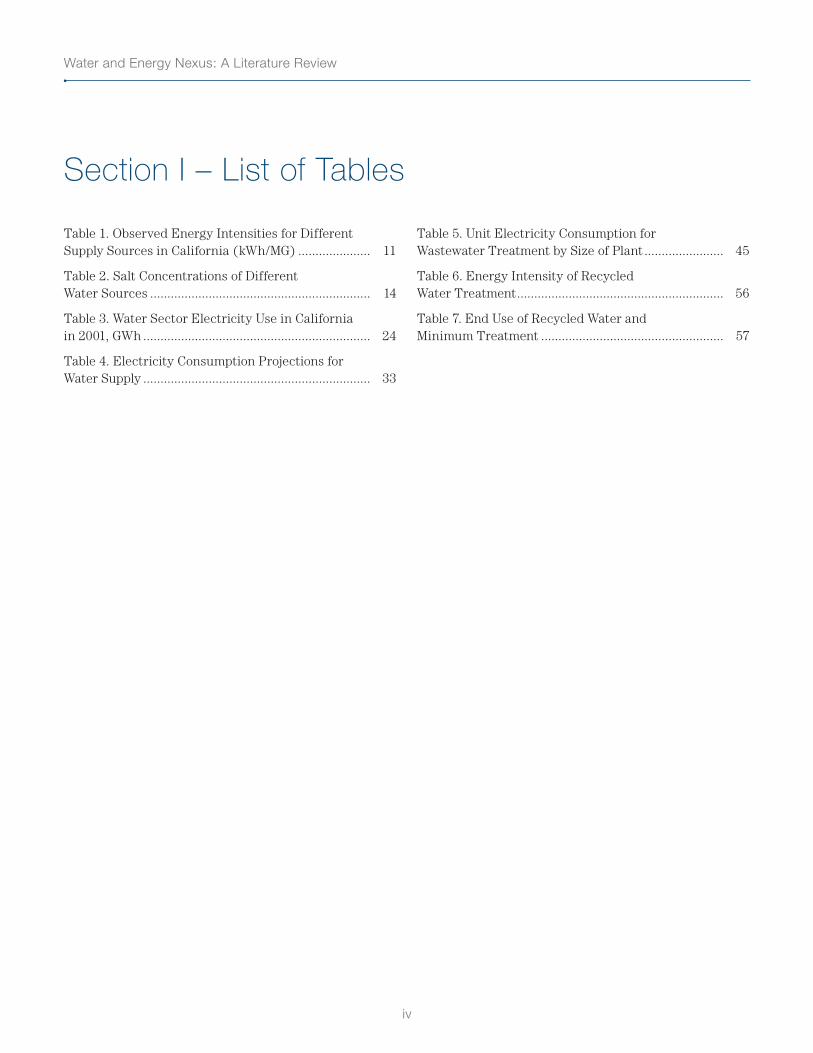
Section I – List of Tables
Table 1. Observed Energy Intensities for Different Supply Sources in California (kWh/MG) ..................... 11
Table 2. Salt Concentrations of Different Water Sources ................................................................ 14
Table 3. Water Sector Electricity Use in California in 2001, GWh .................................................................. 24
Table 4. Electricity Consumption Projections for Water Supply .................................................................. 33
Table 5. Unit Electricity Consumption for Wastewater Treatment by Size of Plant ....................... 45
Table 6. Energy Intensity of Recycled Water Treatment ............................................................ 56
Table 7. End Use of Recycled Water and Minimum Treatment ..................................................... 57
v
Table of Contents
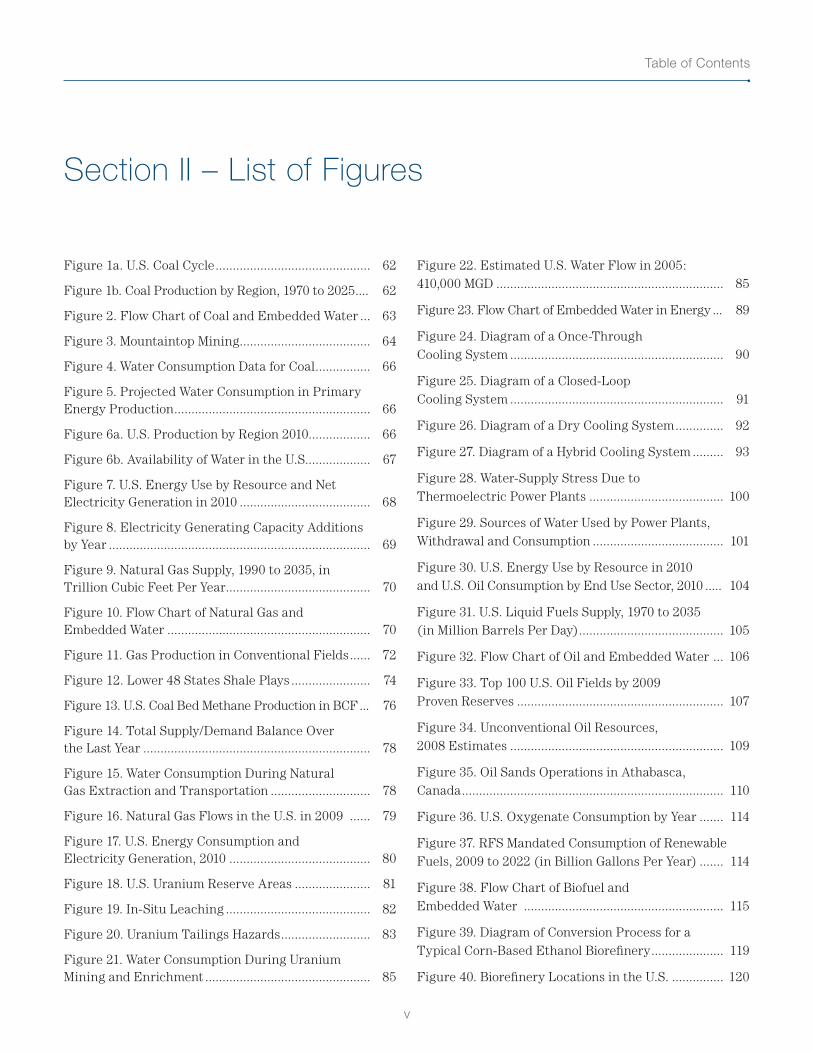
Section II – List of Figures
Figure 1a. U.S. Coal Cycle ............................................. 62
Figure 1b. Coal Production by Region, 1970 to 2025 .... 62
Figure 2. Flow Chart of Coal and Embedded Water ... 63
Figure 3. Mountaintop Mining ...................................... 64
Figure 4. Water Consumption Data for Coal ................ 66
Figure 5. Projected Water Consumption in Primary Energy Production ......................................................... 66
Figure 6a. U.S. Production by Region 2010.................. 66
Figure 6b. Availability of Water in the U.S................... 67
Figure 7. U.S. Energy Use by Resource and Net Electricity Generation in 2010 ...................................... 68
Figure 8. Electricity Generating Capacity Additions by Year ............................................................................ 69
Figure 9. Natural Gas Supply, 1990 to 2035, in Trillion Cubic Feet Per Year .......................................... 70
Figure 10. Flow Chart of Natural Gas and Embedded Water ........................................................... 70
Figure 11. Gas Production in Conventional Fields ...... 72
Figure 12. Lower 48 States Shale Plays ....................... 74
Figure 13. U.S. Coal Bed Methane Production in BCF ... 76
Figure 14. Total Supply/Demand Balance Over the Last Year .................................................................. 78
Figure 15. Water Consumption During Natural Gas Extraction and Transportation ............................. 78
Figure 16. Natural Gas Flows in the U.S. in 2009 ...... 79
Figure 17. U.S. Energy Consumption and Electricity Generation, 2010 ......................................... 80
Figure 18. U.S. Uranium Reserve Areas ...................... 81
Figure 19. In-Situ Leaching .......................................... 82
Figure 20. Uranium Tailings Hazards .......................... 83
Figure 21. Water Consumption During Uranium Mining and Enrichment ................................................ 85
Figure 22. Estimated U.S. Water Flow in 2005: 410,000 MGD .................................................................. 85
Figure 23. Flow Chart of Embedded Water in Energy ... 89
Figure 24. Diagram of a Once-Through Cooling System .............................................................. 90
Figure 25. Diagram of a Closed-Loop Cooling System .............................................................. 91
Figure 26. Diagram of a Dry Cooling System .............. 92
Figure 27. Diagram of a Hybrid Cooling System ......... 93
Figure 28. Water-Supply Stress Due to Thermoelectric Power Plants ....................................... 100
Figure 29. Sources of Water Used by Power Plants, Withdrawal and Consumption ...................................... 101
Figure 30. U.S. Energy Use by Resource in 2010 and U.S. Oil Consumption by End Use Sector, 2010 ..... 104
Figure 31. U.S. Liquid Fuels Supply, 1970 to 2035 (in Million Barrels Per Day) .......................................... 105
Figure 32. Flow Chart of Oil and Embedded Water ... 106
Figure 33. Top 100 U.S. Oil Fields by 2009 Proven Reserves ............................................................ 107
Figure 34. Unconventional Oil Resources, 2008 Estimates .............................................................. 109
Figure 35. Oil Sands Operations in Athabasca, Canada ............................................................................ 110
Figure 36. U.S. Oxygenate Consumption by Year ....... 114
Figure 37. RFS Mandated Consumption of Renewable Fuels, 2009 to 2022 (in Billion Gallons Per Year) ....... 114
Figure 38. Flow Chart of Biofuel and Embedded Water .......................................................... 115
Figure 39. Diagram of Conversion Process for a Typical Corn-Based Ethanol Biorefinery ..................... 119
Figure 40. Biorefinery Locations in the U.S. ............... 120
Water and Energy Nexus: A Literature Review
vi
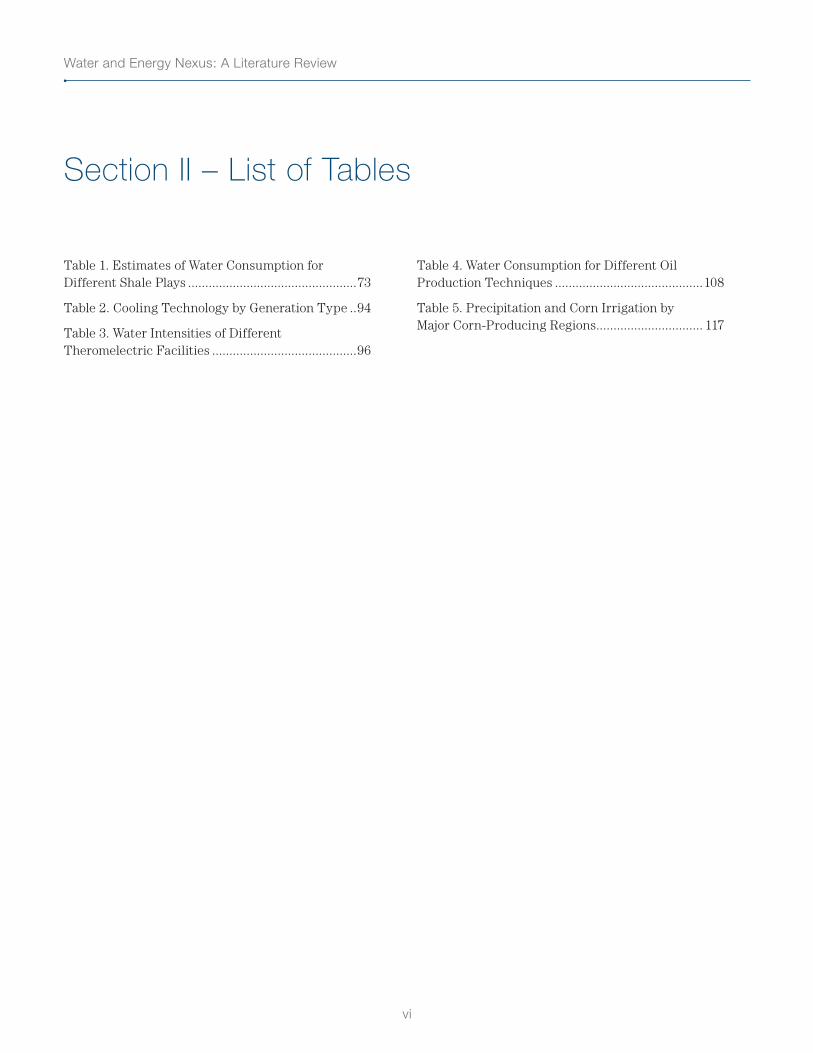
Section II – List of Tables
Table 1. Estimates of Water Consumption for Different Shale Plays .................................................73
Table 2. Cooling Technology by Generation Type ..94
Table 3. Water Intensities of Different Theromelectric Facilities ..........................................96
Table 4. Water Consumption for Different Oil Production Techniques ...........................................108
Table 5. Precipitation and Corn Irrigation by Major Corn-Producing Regions ............................... 117
1
Executive Summary
Executive Summary
INTRODUCTION
Our knowledge of the opportunities for, and the multiple benefits of, the conjoined management of water
and energy resources is not new. In his heralded 1994 Annual Review of Energy and the Environment
article, which established the field of integrated water-energy studies, Peter Gleick employed a full-scale life
cycle analysis of water and energy resources to explicate and quantify the water intensity of energy resource
development from extraction through power generation, as well as the energy intensity of the water sector
from extraction through conveyance, treatment, distribution and end use. Policy and planning for state and
national regulatory innovation have slowly emerged on a limited basis to foster the conjoined savings and
management of water and energy resources, and a limited array of water and energy utilities have initiated the
optimization of operations for integrated resource management. Yet the depth of Gleick’s call for regulatory
and operational innovation, and for more interdisciplinary research to capture the full benefits of integrated
water-energy resource management, largely remains unmet.
As we contemplated establishing a Stanford University interdisciplinary water-energy research program to
bring the university’s substantial faculty and research expertise to this still-nascent field, we determined
that a significant place to begin was to employ Gleick’s full water-energy life cycle approach to evaluate the
current state of the highly interdisciplinary water-energy studies field. This Water-Energy Literature Review
utilizes the full water and energy life cycle approach to survey the literature from the academic, government
and nonprofit sectors, and particularly underscores opportunities for future research to forward this critically
important research arena. This executive summary previews some of our more salient findings.
ENERGY USE IN THE WATER SECTOR: CRITICAL FINDINGS
Perhaps one of the most well-documented arenas of water-energy nexus research is the energy embedded in the water and wastewater sectors. Much of the energy in water research emanates from academic, nonprofit and state agency researchers and policy analysts in California, the nation’s first
state to adopt statewide energy efficiency programs, as well as to pass climate change legislation (AB 32, Global Warming Solutions Act of 2006).
While informed by California-based efforts, our research review particularly employs Gleick and Wilkinson’s water life cycle approach to
Water and Energy Nexus: A Literature Review
2
examine energy for water extraction, energy for water conveyance, energy for water treatment and distribution, and energy for wastewater treatment. Forthcoming sections of this review will address water and energy end use across the commercial, industrial and residential sectors.
Our review of existing literature on the energy for water extraction reveals the critically important challenge of developing a more robust database for groundwater supplies across the United States. A key research need is to encourage and develop national-scale groundwater data collection efforts to enumerate existing groundwater supplies and groundwater pump energy consumption at local, regional and state levels of aggregation. Case studies are also needed to assess the energy costs associated with the overdraft of aquifers, as depleted aquifers require pumping remaining water supplies from greater and greater depths, thereby requiring greater energy investments in water extraction. In order to better coordinate peak load energy demand management, localized studies of groundwater pump populations are critically important to better understand the energy use of these pumps across pump age, fuel, type and total number, among other attributes.
In California, along with energy employed in water distribution, the energy for water conveyance comprises the greatest source of energy use in the water sector, and managing energy use in water conveyance nationally is directly tied to reducing water loss during conveyance. Research is needed to investigate and quantify the magnitude of water losses across the nation’s large-scale local, regional, state and federal water conveyance projects, and to assess the energy embedded in those losses.
The energy deployed in water treatment and distribution is a principal target for reducing the embedded energy in the nation’s water supplies. Our research assessment reveals the need for developing and administering a national survey of water treatment plants to assess the potential differences in practices across the nation’s plants, and to analyze these findings in light of expert recommendations on
the benefits of, and processes and technologies for, achieving greater energy efficiency in the nation’s water sector. The potential for innovation in the nation’s regulation and processes for water treatment also merits serious attention. Life cycle analyses of recycled water are needed to explore whether the energy employed to build, maintain and operate new and separate water distribution systems would result in net energy savings when weighed against the energy saved by forgoing treatment of recycled water to national drinking water standards. Studies are needed as well to assess the energy intensity of advanced treatment systems such as nanofiltration, and forward and reverse osmosis.
As chemicals, or constituents, of emerging concern (CECs) – including pharmaceutical products, industrial by-products and fertilizers, among others – enter the nation’s water supplies, state and federal regulations are being developed to target their removal. Assessments are needed to determine how much additional energy will be required to remove CECs from the nation’s water supply using the existing treatment technologies, and to identify new technologies which might be used to remove CECs at lower energy intensities. Other research opportunities include the development of holistic methodologies to optimize municipal investments in green infrastructure and watershed protection in terms of avoided treatment costs and other benefits, including flood control and ecosystem management, among others. As the so-called smart technology/clean technology expands in the water/wastewater arena, assessments are also needed to explore the benefits which these new technologies may bring to capturing energy efficiency and greenhouse gas emissions reductions in water and wastewater treatment.
One of the greatest opportunities for reducing the energy intensity in the water sector is in the energy for wastewater treatment. In order to assess the prevalence of the deployment of Best Management Practices (BMPs) for energy efficiency and management in the wastewater treatment sector, comparative studies are needed to compare the data
3
Executive Summary
derived from the U.S. Environmental Protection Agency (EPA) surveys on in-situ wastewater practices with the current BMPs. On-site, decentralized sewage facilities are also gaining renewed attention as a means to generate new revenues through the development of new waste-to-energy products while reducing the energy intensities generally associated with larger, centralized municipal treatment systems. Research is needed to compare the benefits and costs of innovative on-site sewage facility technologies across centralized treatment plants and septic systems, where applicable. Finally, assessments are needed to identify the barriers to, and pathways toward, incentivizing the optimization of water treatment plants to lower their energy use. Interviews with operators and agency managers will provide critically important information about these barriers, as they are the industry’s practice leaders, daily engaged with the processes and mechanics which constitute ground zero for wastewater systems energy optimization.
WATER USE IN THE ENERGY SECTOR: CRITICAL FINDINGS
Our review enumerates and evaluates the body of literature assessing water-use intensities, and associated water quality and wider environmental impacts, across the extraction, processing, storage and transport of the array of energy sources, including coal, natural gas, uranium, thermoelectric generation, oil and transportation biofuels. A subsection on hydropower is forthcoming. Like Gleick, we identified the continuation of significant gaps in the collection and reporting of consistent and reliable water use data and water quality impacts across these energy resource arenas. As we discuss below, there remains a paucity of national and state regulatory requirements for quantifying the water use in, and assessing water quality impacts across, the energy sector. The need for energy-sector case studies and policy and regulatory innovation addressing water use consumption, as well
as water quality for produced water, continues to be a critical priority.
Though coal extraction and processing use substantially less water than that deployed in thermoelectric generation, substantial challenges remain to fully understanding the magnitude and impact of water use in the expanding extraction of coal in concentrated areas across the American West. The expansion of mountaintop mining using valley fill techniques merits assessment for the presence of, and extent of damage due to, the loss of headwaters and associated habitats as well as its impacts on freshwater supplies. Case studies are also needed to assess the impacts of both open-pit mining and mountaintop mining techniques on groundwater, including direct degradation from contaminated drainage and rainfall infiltration and indirect degradation employing blasting, respectively, as well as the effects of subsidence on overlaying aquifers. Coal processing has also produced numerous coal slurry spills, and case studies of the environmental impacts of these spills will make critical contributions to understanding the nexus of water and coal.
Natural gas extraction, processing and storage are currently expanding across the United States. The unconventional extraction of natural gas through the development of shale and tight sand gas supplies particularly calls for attention to the need for reporting requirements and research on the effects of such extraction on both consumed and produced water. Impact studies are needed to determine the effects of degraded flowback water containing chemical constituents, which are discharged into surrounding municipal water systems. Additional studies to evaluate the environmental impacts of the various disposal methods for contaminated flowback water are needed, including assessments of flowback re-injection at shallow depths and deeper formations, as well as evaporation into solid waste. Case studies of the environmental impacts of both groundwater extraction and wastewater/produced water reuse associated with coal bed methane extraction are also critically important to forward our understanding of the potential consequences of this form of natural
Water and Energy Nexus: A Literature Review
4
gas extraction on water supplies. Newer sources of natural gas employ a host of newer process technologies, and little information is available regarding the water intensity of the deployment of these process technologies. The water intensity of Liquefied Natural Gas also merits assessment through studies of the impact of water withdrawals at LNG terminals.
Uranium mining in the United States is now principally concentrated at four “In-Situ Leaching” (ISL) mines accounting for 90 percent of U.S. uranium production, and each is located in water-stressed regions across the West. Evaluations of the wider environmental impacts, of potential groundwater quality effects and of calculations of the water intensity of uranium mining are needed to fully understand the importance of uranium mining on water. The last studies of the water intensity of uranium mining were completed in the 1970s, and newer studies are needed to understand the current water intensity of uranium processing and transporting.
The thermoelectric generation power sector is particularly water intensive, accounting for almost 52 percent of surface freshwater withdrawals and 43 percent of total water withdrawals. While only 7 percent of this water is consumed by power plants and the remainder is returned to the environment, the impacts of both water withdrawals and the quality of returned water are a primary concern. Well-placed monitoring and assessments are critically important in order to understand the long-term impacts of groundwater withdrawals on aquifers coterminous with power plants located in rapidly growing areas of the American Southwest. There is also a need to evaluate the effects of closed-loop cooling system power plant operations on local water quality, with particular attention to the wide array of chemical constituents — i.e., chlorine, bromine, sulfuric acid, sodium hydroxide and hydrated lime — released in waste streams, as well as water quality issues associated with blowdown water with
high Total Dissolved Solids (TDS). The long-term effects of climate change on water supplies also call attention to the need for fostering technological innovation and research to develop, and to improve, dry and hybrid cooling technologies to achieve lower water intensities in power plant operations, and to generally target the causes of water loss in cooling towers. Equally important is enhancing opportunities for expanding the use of recycled water for power plant operations, including industrial and municipal wastewater, gray water and non-potable brackish water.
Data on the water intensity of the oil sector remains limited. Future analyses of the effects of transportation fuel and other petroleum goods on water resources should employ a full life cycle analysis extending from the production and transport to the storage of fuel. Research is also needed to estimate or determine the volume of leaked transportation fuels from underground fuel storage tanks into groundwater, and to evaluate the environmental impacts of leaked chemical compounds such as benzene and toluene associated with those fuel leaks.
The water and energy intensity of transportation biofuels particularly merits study as their popularity increases as a means of reducing the carbon footprint of the transportation fuel sector. Research addressing biofuel feedstock should include regional analyses of forest and switchgrass fuel potential based on water extraction costs, potential water quality impacts and production water intensities. More generally, there is both a need and an opportunity for the development and implementation of a water accounting system to evaluate biofuel production at local levels. Finally, a plethora of different metrics are currently employed to describe the water and energy intensity of biofuels, and there is a need to harmonize these metrics and to employ a single metric for publishing an Annual Biofuel Report as an additional component of the existing U.S. Energy Information Administration (EIA) annual report.
5
Executive Summary
CONCLUSION
This Water-Energy Literature Review is offered as a snapshot of current understanding about the water-energy nexus. It is meant to invite engagement and investments in future interdisciplinary research to target water use efficiency in the energy sector and energy efficiency, or reductions in energy intensities, in the water and wastewater sectors. While it constitutes a broad overview of national water-energy research, this Review has been informed by the robust public-policy and utility-sector efforts to address the energy intensity of California’s water supplies across the water life cycle. Readers interested in more information about the water-energy nexus are encouraged to delve deeper into the considerable literature reviewed in this document.

Water and Energy Nexus: A Literature Review
6
7
Introduction
Introduction
At a very young age, children are taught that electricity and water don’t mix. Every hair dryer sold in America
has a tag attached to the cord warning of the dangers. While no one would dispute the wisdom of such caution,
it is important to recognize that from a resources standpoint, energy and water are inextricably linked. As
many have pointed out, it takes water to produce energy and it takes energy to deliver, treat and heat water.
In the winter of 2011, a group of faculty and students at Stanford University began to explore the relationship between water and energy. This broad topic has enjoyed almost 20 years of evaluation and analysis, and this group wanted to better understand what it is we currently know, what it is we don’t know and what further research might contribute to informing the future management of both resources. Because the nature of both water and energy intersects with so many aspects of the economy, society and the environment, it became clear that one must approach these questions from an interdisciplinary perspective. Several meetings were held to explore ideas about what might be a helpful initial step, and what resulted is this literature review on the water and energy nexus. This review reflects the work of a number of people, but it is fundamentally a student product.
We began by exploring academic, government and private research, compiling more than 650 separate
publications. This is not an exhaustive list of research about the connections between water and energy, but we feel confident that we have identified and investigated the bulk of existing research. Once this literature was assembled, we set about organizing our review of the literature around two intertwining life cycles: water’s use of energy and energy’s use of water.
By organizing around these cycles, and in the case of water for energy around the different types and uses of energy, we were able to focus on the water and energy intensity of different steps, as well as the various technologies, economic factors and policies involved. Each of the individual sections of this report may be read independently or in sequence. The end users of both water and energy are generally the same, so our end use section (currently under development) brings the two life cycles together. We wish to especially acknowledge the work of Professor Robert Wilkinson of the Bren School of Public Policy, University of California at Santa Barbara, who graphically depicted the life cycle device for organizing discussions around the nexus of water and energy. Peter Gleick originally developed the analytical approach of the water and energy life cycle in 1994. Undoubtedly, there are some gaps in our approach and coverage of this subject, as well as some redundancies. We fully accept and acknowledge these shortcomings.
While we encourage readers to delve deeply into the review and corresponding analysis, we would like to point out several conclusions at the outset. The first of these is that much of the water and energy data
Water and Energy Nexus: A Literature Review
8
that underlie and support the research and analysis of this subject are old and out of date or have not even been collected. More data collection, monitoring and independent analysis need to be undertaken, particularly by the federal government. A second conclusion is that private industry and local agencies control a great deal of data and independent verification is extremely hard to achieve. A third conclusion is that, perhaps due in part to the limits of data and information, most researchers still rely on a small body of data and methods, in particular, from Gleick’s seminal work in 1994. Lastly, it is clear that where there have been rapid advances in technology (e.g., hydraulic fracturing and
directional drilling), research and analysis have had a hard time keeping up.
In publishing this literature review, we wanted to produce something that helps describe a baseline of knowledge about the nexus of water and energy. As with any literature review, this document began to become obsolete almost immediately. New publications have been produced and meetings held since we concluded our research, and others will soon follow. Our hope is to update this literature review on a somewhat regular basis, capturing those elements we might have missed and others that are forthcoming.
Acknowledgments
The principal author of this literature review was Paul Vidal de la Blache. The only thing more remarkable than the fact that Paul researched and wrote sections of this report in his second language of English is the fact that he did so while taking a full course load in fulfillment of his master’s degree in engineering. Stacy Kourlis, a law student at the time, also wrote several subsections of this report, focusing on legal and policy issues.
We would like to deeply thank the reviewers, Emily Grubert, Heather Cooley, Laurie Park and Eric Byous, for their suggestions, which greatly improved this literature review. We did our best to reflect their suggestions; any failure to do so is entirely the fault of the editors.
Dr. Cynthia Truelove and Andrew Fahlund served as authors of several subsections as well as editors and advisers to the project. Dr. Truelove was the author of the executive summary. Janny Choy also served as an editor and leader of the design and production phase of this project. Jodee Schwan, Paula
Wetzel, Terry Nagel and several others contributed significantly to the administration and management of this project, and we would not have been able to complete it without them. The team would also like to acknowledge several advisers who also contributed to the organization and content of this document and provided extensive comments and feedback: Barton “Buzz” Thompson, Dr. Lynn Orr, Dr. Robert Wilkinson and Dr. David Freyberg.
We would like to thank and recognize the generosity and support of the S.D. Bechtel Jr. Foundation for its financial contribution to this project. Finally, we would be remiss if we did not recognize and applaud the hundreds of scholars, researchers and authors of the more than 650 papers that were reviewed in the course of this report. Their efforts to explore and evaluate the many connections between water and energy have been pioneering, and we believe they will ultimately prove invaluable to future resource managers and efforts to achieve a more sustainable future.
9
Section I – Energy for Water
Section I. Energy for Water
INTRODUCTION
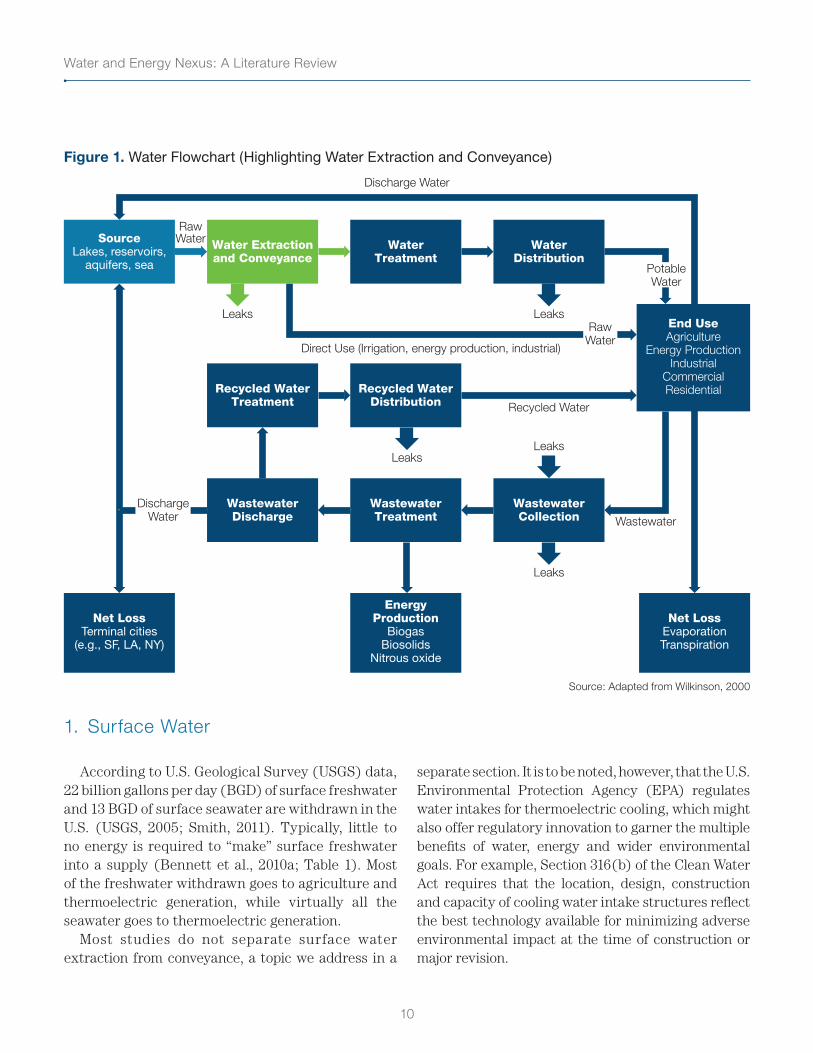
The water use cycle is relatively uniform and consistent among developed countries. Beginning with a water
source, water is extracted and conveyed, moving directly to an end use (e.g., irrigation) or to a treatment
plant, and from there it is distributed to customers. Once it is used by the end users, water then moves through
a wastewater collection system to a treatment plant and is typically discharged back into the environment,
not always to the same place from which it was originally extracted. In some limited cases, water may leave
the treatment plant to be used again before eventually being discharged. Every step along this cycle involves
energy inputs, outputs or both. The section explores the body of literature looking at the energy intensity of
water at each point from extraction to end use.
ENERGY FOR WATER EXTRACTION
More than three-quarters of the United States freshwater supply comes from rivers, lakes and streams, which collect rainfall and snowmelt (U.S. Geological Survey, 2005), although sources can be highly variable. Groundwater aquifers provide about 22 percent of U.S. freshwater and up to 30 percent in California (Wolff et al., 2004). Water supplies also tend to vary widely according to season.
While desalination is a fairly insubstantial contribution to water supply nationally, it is a source being considered and, in a few places, used by communities around the country, tapping sources such as brackish water or seawater (Wolff et al.,
2004). The extraction (or taking) of water from these different sources can require anywhere from modest to extreme amounts of energy.
This section explores and evaluates the literature around the energy use of water extraction (Figure 1). Most papers and reports come from and are centered on California, which has been very engaged in the water-energy nexus and water and energy conservation (Gleick, 1994; CEC, 2005; Cooley et al., 2008; Cooley & Wilkinson, 2012; Bennett et al., 2010 a&b), but there have been other studies done in Texas, New York, Wisconsin and parts of the Intermountain West.
Water and Energy Nexus: A Literature Review
10
Figure 1. Water Flowchart (Highlighting Water Extraction and Conveyance)
SourceLakes, reservoirs,
aquifers, sea
WaterTreatment
WaterDistribution
Water Extractionand Conveyance
Recycled WaterDistribution
Recycled WaterTreatment
End UseAgriculture
Energy ProductionIndustrial
CommercialResidential
Leaks
WastewaterTreatment
EnergyProduction
BiogasBiosolids
Nitrous oxide
Net LossTerminal cities
(e.g., SF, LA, NY)
Net LossEvaporationTranspiration
WastewaterCollection
WastewaterDischarge
Leaks
Leaks
Recycled Water
Leaks
Leaks
Discharge Water
Direct Use (Irrigation, energy production, industrial)
Wastewater
RawWater
RawWater
PotableWater
DischargeWater
Source: Adapted from Wilkinson, 2000
1. Surface Water
According to U.S. Geological Survey (USGS) data, 22 billion gallons per day (BGD) of surface freshwater and 13 BGD of surface seawater are withdrawn in the U.S. (USGS, 2005; Smith, 2011). Typically, little to no energy is required to “make” surface freshwater into a supply (Bennett et al., 2010a; Table 1). Most of the freshwater withdrawn goes to agriculture and thermoelectric generation, while virtually all the seawater goes to thermoelectric generation.
Most studies do not separate surface water extraction from conveyance, a topic we address in a
separate section. It is to be noted, however, that the U.S. Environmental Protection Agency (EPA) regulates water intakes for thermoelectric cooling, which might also offer regulatory innovation to garner the multiple benefits of water, energy and wider environmental goals. For example, Section 316(b) of the Clean Water Act requires that the location, design, construction and capacity of cooling water intake structures reflect the best technology available for minimizing adverse environmental impact at the time of construction or major revision.
11
Section I – Energy for Water
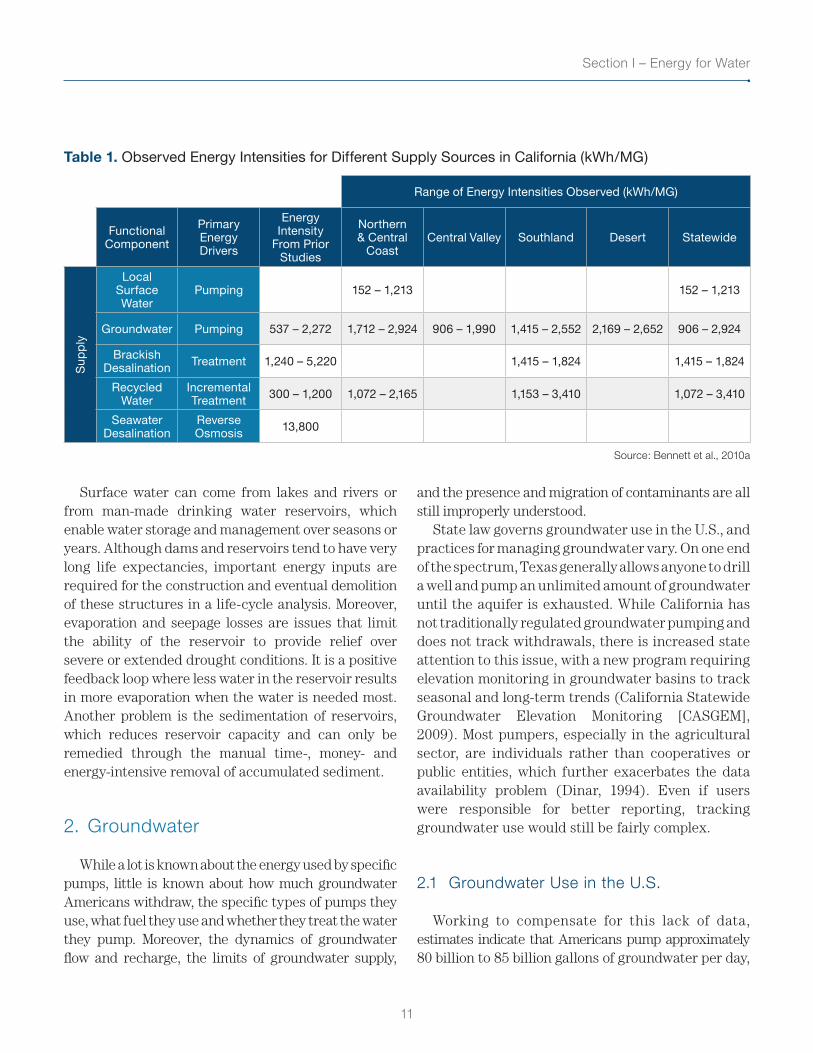
Table 1. Observed Energy Intensities for Different Supply Sources in California (kWh/MG)
Range of Energy Intensities Observed (kWh/MG)
Functional Component
Primary Energy Drivers
Energy Intensity
From Prior Studies
Northern & Central
CoastCentral Valley Southland Desert Statewide
Supp
ly
Local Surface Water
Pumping 152 – 1,213 152 – 1,213
Groundwater Pumping 537 – 2,272 1,712 – 2,924 906 – 1,990 1,415 – 2,552 2,169 – 2,652 906 – 2,924
Brackish Desalination Treatment 1,240 – 5,220 1,415 – 1,824 1,415 – 1,824
Recycled Water
Incremental Treatment 300 – 1,200 1,072 – 2,165 1,153 – 3,410 1,072 – 3,410
Seawater Desalination
Reverse Osmosis 13,800
Source: Bennett et al., 2010a
Surface water can come from lakes and rivers or from man-made drinking water reservoirs, which enable water storage and management over seasons or years. Although dams and reservoirs tend to have very long life expectancies, important energy inputs are required for the construction and eventual demolition of these structures in a life-cycle analysis. Moreover, evaporation and seepage losses are issues that limit the ability of the reservoir to provide relief over severe or extended drought conditions. It is a positive feedback loop where less water in the reservoir results in more evaporation when the water is needed most. Another problem is the sedimentation of reservoirs, which reduces reservoir capacity and can only be remedied through the manual time-, money- and energy-intensive removal of accumulated sediment.
2. Groundwater
While a lot is known about the energy used by specific pumps, little is known about how much groundwater Americans withdraw, the specific types of pumps they use, what fuel they use and whether they treat the water they pump. Moreover, the dynamics of groundwater flow and recharge, the limits of groundwater supply,
and the presence and migration of contaminants are all still improperly understood.
State law governs groundwater use in the U.S., and practices for managing groundwater vary. On one end of the spectrum, Texas generally allows anyone to drill a well and pump an unlimited amount of groundwater until the aquifer is exhausted. While California has not traditionally regulated groundwater pumping and does not track withdrawals, there is increased state attention to this issue, with a new program requiring elevation monitoring in groundwater basins to track seasonal and long-term trends (California Statewide Groundwater Elevation Monitoring [CASGEM], 2009). Most pumpers, especially in the agricultural sector, are individuals rather than cooperatives or public entities, which further exacerbates the data availability problem (Dinar, 1994). Even if users were responsible for better reporting, tracking groundwater use would still be fairly complex.
2.1 Groundwater Use in the U.S.
Working to compensate for this lack of data, estimates indicate that Americans pump approximately 80 billion to 85 billion gallons of groundwater per day,
Water and Energy Nexus: A Literature Review
12
and our dependence on groundwater is increasing (Alley, 2010; Smith et al., 2011). Worldwide, up to 2 billion people depend on underground aquifers for their drinking water; however, in the U.S., two-thirds of the groundwater pumped is used for irrigation.
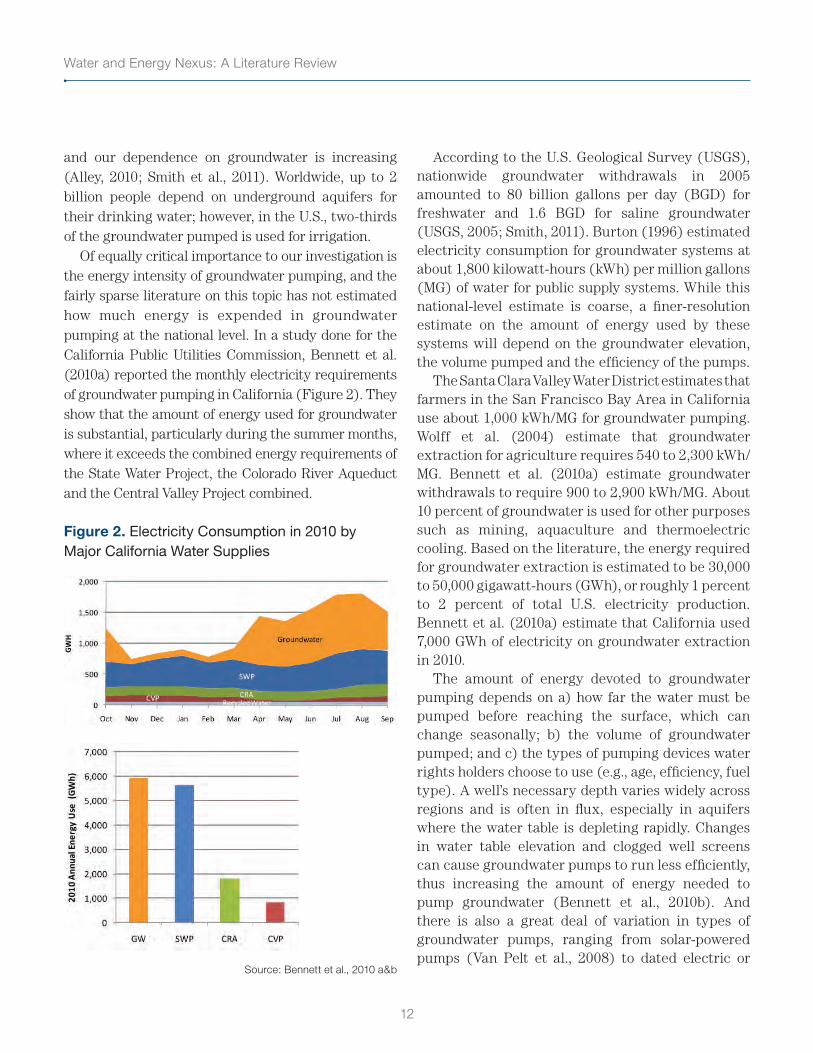
Of equally critical importance to our investigation is the energy intensity of groundwater pumping, and the fairly sparse literature on this topic has not estimated how much energy is expended in groundwater pumping at the national level. In a study done for the California Public Utilities Commission, Bennett et al. (2010a) reported the monthly electricity requirements of groundwater pumping in California (Figure 2). They show that the amount of energy used for groundwater is substantial, particularly during the summer months, where it exceeds the combined energy requirements of the State Water Project, the Colorado River Aqueduct and the Central Valley Project combined.
Figure 2. Electricity Consumption in 2010 by Major California Water Supplies
Source: Bennett et al., 2010 a&b
According to the U.S. Geological Survey (USGS), nationwide groundwater withdrawals in 2005 amounted to 80 billion gallons per day (BGD) for freshwater and 1.6 BGD for saline groundwater (USGS, 2005; Smith, 2011). Burton (1996) estimated electricity consumption for groundwater systems at about 1,800 kilowatt-hours (kWh) per million gallons (MG) of water for public supply systems. While this national-level estimate is coarse, a finer-resolution estimate on the amount of energy used by these systems will depend on the groundwater elevation, the volume pumped and the efficiency of the pumps.
The Santa Clara Valley Water District estimates that farmers in the San Francisco Bay Area in California use about 1,000 kWh/MG for groundwater pumping. Wolff et al. (2004) estimate that groundwater extraction for agriculture requires 540 to 2,300 kWh/MG. Bennett et al. (2010a) estimate groundwater withdrawals to require 900 to 2,900 kWh/MG. About 10 percent of groundwater is used for other purposes such as mining, aquaculture and thermoelectric cooling. Based on the literature, the energy required for groundwater extraction is estimated to be 30,000 to 50,000 gigawatt-hours (GWh), or roughly 1 percent to 2 percent of total U.S. electricity production. Bennett et al. (2010a) estimate that California used 7,000 GWh of electricity on groundwater extraction in 2010.
The amount of energy devoted to groundwater pumping depends on a) how far the water must be pumped before reaching the surface, which can change seasonally; b) the volume of groundwater pumped; and c) the types of pumping devices water rights holders choose to use (e.g., age, efficiency, fuel type). A well’s necessary depth varies widely across regions and is often in flux, especially in aquifers where the water table is depleting rapidly. Changes in water table elevation and clogged well screens can cause groundwater pumps to run less efficiently, thus increasing the amount of energy needed to pump groundwater (Bennett et al., 2010b). And there is also a great deal of variation in types of groundwater pumps, ranging from solar-powered pumps (Van Pelt et al., 2008) to dated electric or
13
Section I – Energy for Water
diesel-powered pumps (Robinson, 2002). High diesel prices have forced the shutdown of several pumps on the Ogallala aquifer (Gleick, 1994; Zhu et al., 2007). In California, improving air quality has been a main driver for replacing diesel pumps with natural gas or electric pumps.
2.2 Next Steps
In the absence of more data about actua l groundwater use, researchers could approach this question from another angle and begin their inquiry with the pumps themselves. The literature does not identify the kinds of pumps that are used and whether those pumps are the most energy efficient available. Bennett et al. (2010 a&b) identified that better (and more granular) water energy data on groundwater is necessary at the state and federal level. It could give not only a better idea of the state of aquifers in the country, but also of the energy requirements for groundwater in the U.S. With this information, public-sector energy-efficiency programs could more readily capture the full potential for energy savings from groundwater-pump optimization. Some utilities already offer free pump testing and rebates on old and inefficient pumps.
Still another approach would be to model the relative costs of energy needed to pump groundwater and the cost of buying wholesale surface water. While groundwater has historically been an inexpensive resource for agricultural producers, especially in states like Texas that do not limit groundwater use, increasing energy prices may become a substantial problem for farmers. (For a model – albeit somewhat outdated – that captures portions of this suggested analysis, see Dinar, 1994.)1 However, there is no indication that rising energy costs have historically triggered a decrease in groundwater pumping (Zhu
1 The Dinar study is only one example of a series of hypothetical models that shine some light on future energy use for groundwater pumping. For another example, see California Public Utilities Commission, Appendix G: Groundwater Use (2011).
et al., 2007). In addition, wholesale surface water is often heavily subsidized, which makes it difficult to determine the energy price point that forces switching from ground to surface water.
3. Desalination
More saline water sources such as brackish groundwater and seawater can be converted into usable water supplies by reducing the contents of total dissolved solids (TDS) or salt and minerals. Brackish water is a mixture of freshwater and seawater, being more saline than freshwater and less saline than seawater. In 2005, roughly 2,000 desalination plants larger than 0.3 MGD were operating in the U.S. with a total capacity of 1,600 MGD, and constituted less than 0.4 percent of total water use in the U.S., (Carter, 2011). The energy intensity of desalted water depends primarily on the volume of the water being desalted, the quality (i.e., saltiness) of the source water supply and the technology used to desalt the water (Bennett et al., 2010).
Brackish water has much lower TDS than ocean water and therefore takes much less energy to desalt (Tables 1 and 2), with energy intensities ranging from 1,400 to 1,800 kWh/MG (Bennett et al. 2010a). Energy intensities for seawater desalination vary greatly from one technology or one study to another (Chaudhry, 2003; California Energy Commission [CEC], 2005; Younos & Tulou, 2005; Cooley et al., 2006; Cooley & Wilkinson, 2012; National Research Council [NRC], 2008; Bennett et al., 2010a). However, multiple efforts are under way to increase the energy efficiency of desalination through improved membranes, dual pass processes and additional energy recovery systems such as Combined Heat and Power (CEC, 2005).
Water and Energy Nexus: A Literature Review
14
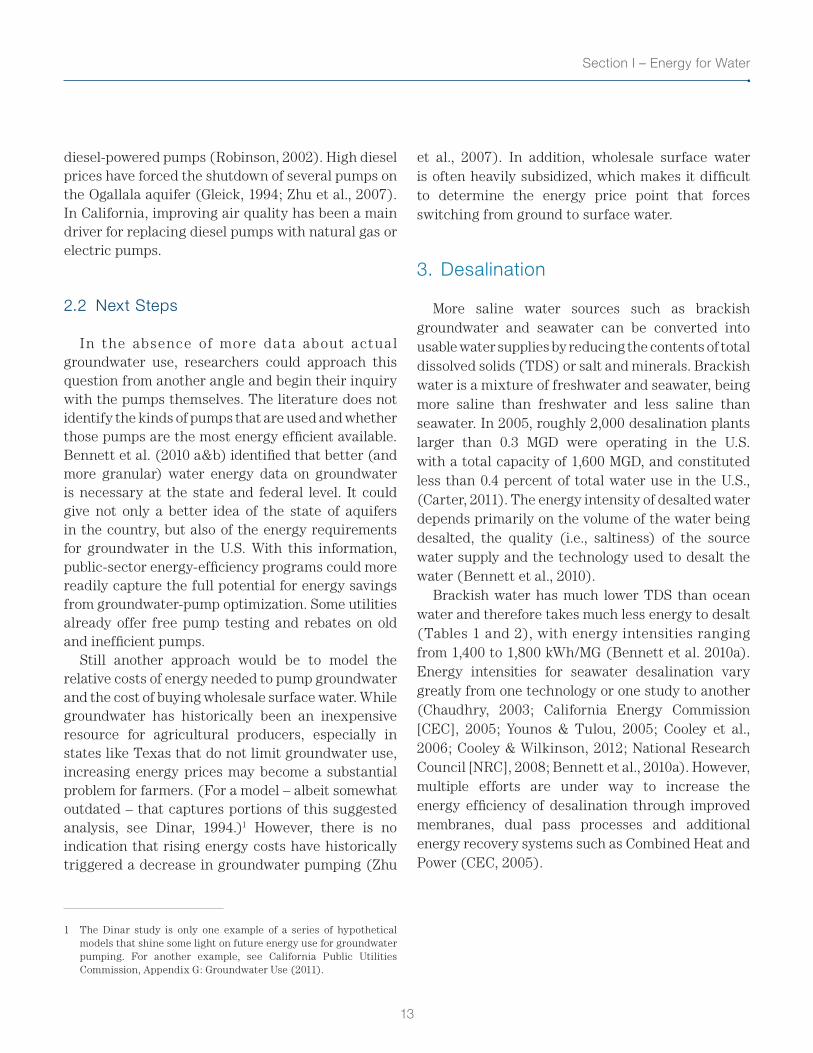
Table 2. Salt Concentrations of Different Water Sources
Water Source or TypeApproximate Salt
Concentration (grams per liter)
Brackish waters 0.5 to 3
North Sea (near estuaries) 21
Gulf of Mexico and coastal waters 23 to 33
Atlantic Ocean 35
Pacific Ocean 38
Persian Gulf 45
Dead Sea ~300
Source: Cooley et al., 2006
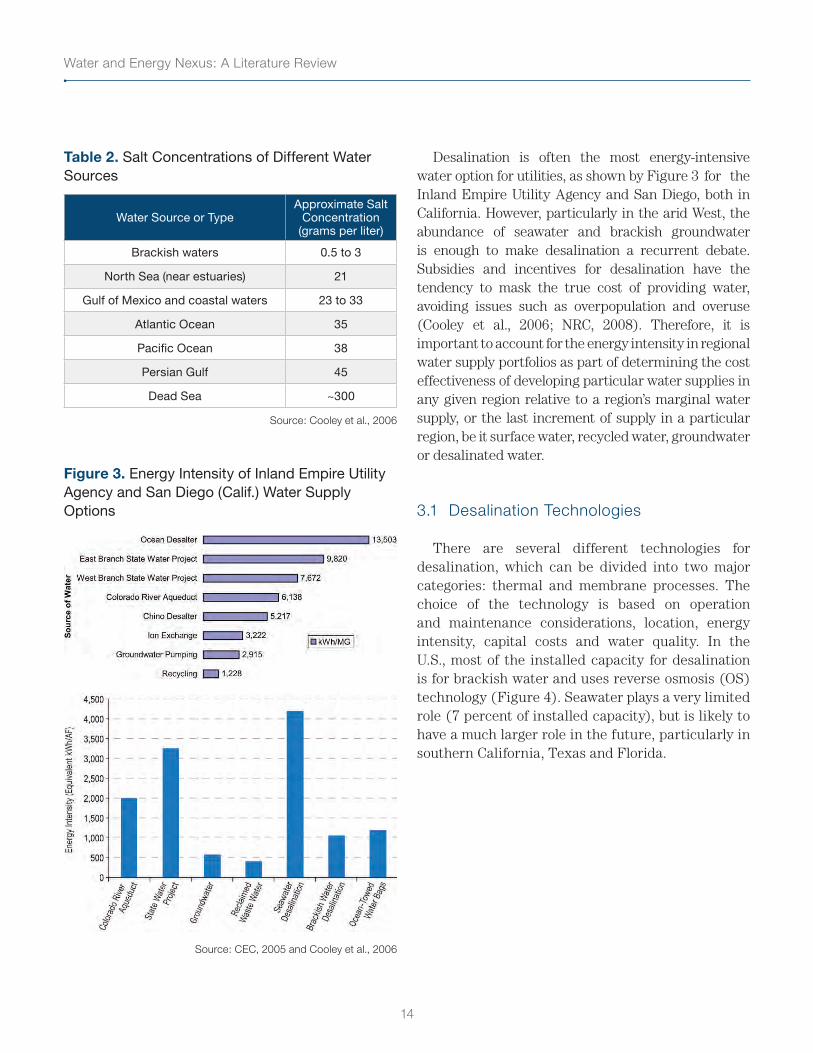
Figure 3. Energy Intensity of Inland Empire Utility Agency and San Diego (Calif.) Water Supply Options
Source: CEC, 2005 and Cooley et al., 2006
Desalination is often the most energy-intensive water option for utilities, as shown by Figure 3 for the Inland Empire Utility Agency and San Diego, both in California. However, particularly in the arid West, the abundance of seawater and brackish groundwater is enough to make desalination a recurrent debate. Subsidies and incentives for desalination have the tendency to mask the true cost of providing water, avoiding issues such as overpopulation and overuse (Cooley et al., 2006; NRC, 2008). Therefore, it is important to account for the energy intensity in regional water supply portfolios as part of determining the cost effectiveness of developing particular water supplies in any given region relative to a region’s marginal water supply, or the last increment of supply in a particular region, be it surface water, recycled water, groundwater or desalinated water.
3.1 Desalination Technologies
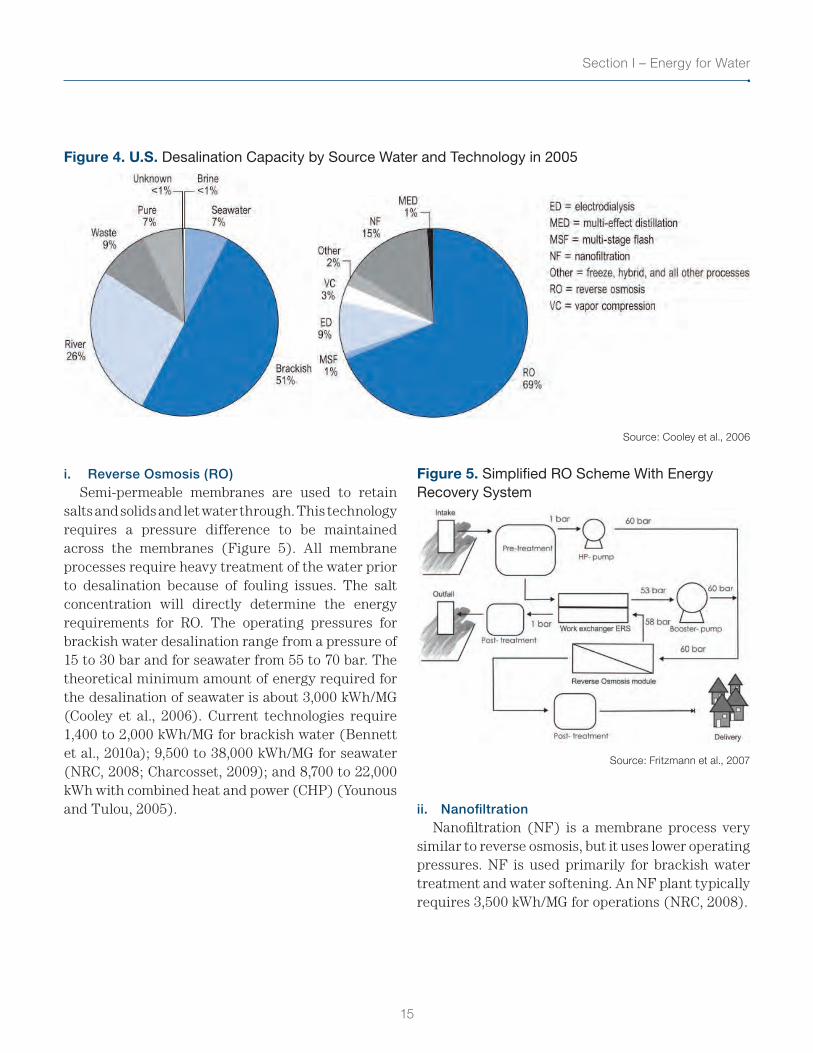
There are several different technologies for desalination, which can be divided into two major categories: thermal and membrane processes. The choice of the technology is based on operation and maintenance considerations, location, energy intensity, capital costs and water quality. In the U.S., most of the installed capacity for desalination is for brackish water and uses reverse osmosis (OS) technology (Figure 4). Seawater plays a very limited role (7 percent of installed capacity), but is likely to have a much larger role in the future, particularly in southern California, Texas and Florida.
15
Section I – Energy for Water
Figure 4. U.S. Desalination Capacity by Source Water and Technology in 2005
Source: Cooley et al., 2006
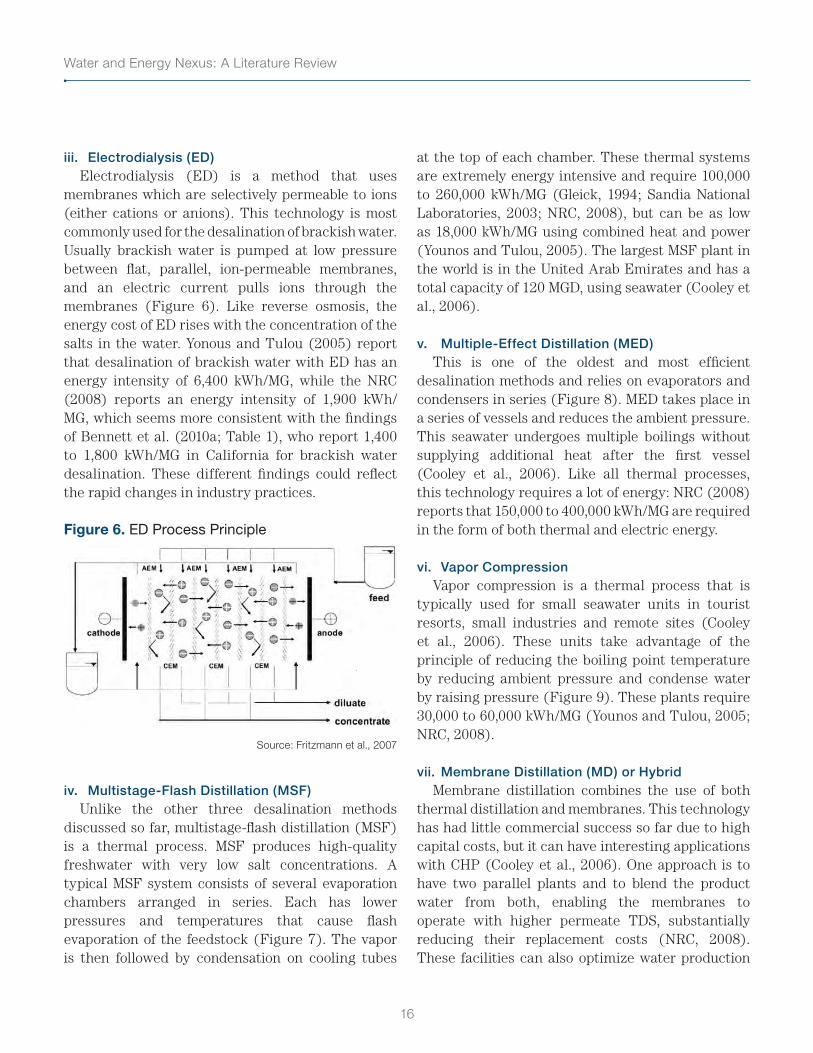
i. Reverse Osmosis (RO)Semi-permeable membranes are used to retain
salts and solids and let water through. This technology requires a pressure difference to be maintained across the membranes (Figure 5). All membrane processes require heavy treatment of the water prior to desalination because of fouling issues. The salt concentration will directly determine the energy requirements for RO. The operating pressures for brackish water desalination range from a pressure of 15 to 30 bar and for seawater from 55 to 70 bar. The theoretical minimum amount of energy required for the desalination of seawater is about 3,000 kWh/MG (Cooley et al., 2006). Current technologies require 1,400 to 2,000 kWh/MG for brackish water (Bennett et al., 2010a); 9,500 to 38,000 kWh/MG for seawater (NRC, 2008; Charcosset, 2009); and 8,700 to 22,000 kWh with combined heat and power (CHP) (Younous and Tulou, 2005).
Figure 5. Simplified RO Scheme With Energy Recovery System
Source: Fritzmann et al., 2007
ii. NanofiltrationNanofiltration (NF) is a membrane process very
similar to reverse osmosis, but it uses lower operating pressures. NF is used primarily for brackish water treatment and water softening. An NF plant typically requires 3,500 kWh/MG for operations (NRC, 2008).
Water and Energy Nexus: A Literature Review
16
iii. Electrodialysis (ED)Electrodialysis (ED) is a method that uses
membranes which are selectively permeable to ions (either cations or anions). This technology is most commonly used for the desalination of brackish water. Usually brackish water is pumped at low pressure between flat, parallel, ion-permeable membranes, and an electric current pulls ions through the membranes (Figure 6). Like reverse osmosis, the energy cost of ED rises with the concentration of the salts in the water. Yonous and Tulou (2005) report that desalination of brackish water with ED has an energy intensity of 6,400 kWh/MG, while the NRC (2008) reports an energy intensity of 1,900 kWh/MG, which seems more consistent with the findings of Bennett et al. (2010a; Table 1), who report 1,400 to 1,800 kWh/MG in California for brackish water desalination. These different findings could reflect the rapid changes in industry practices.
Figure 6. ED Process Principle
Source: Fritzmann et al., 2007
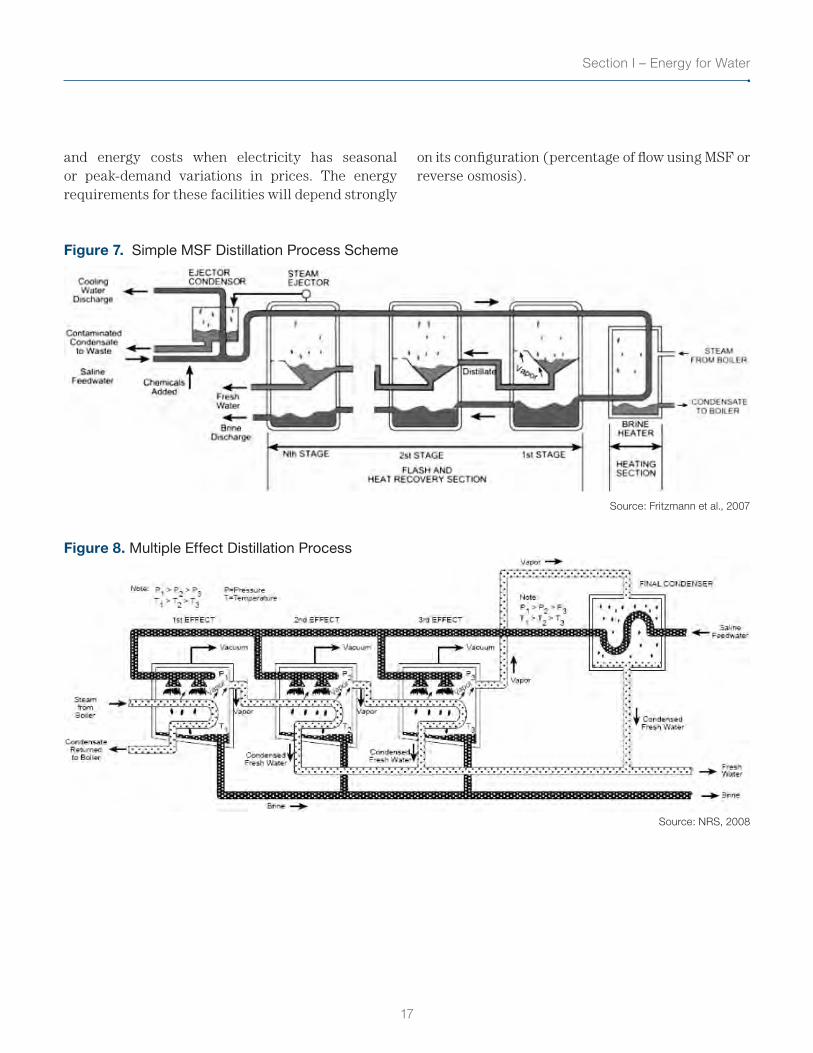
iv. Multistage-Flash Distillation (MSF)Unlike the other three desalination methods
discussed so far, multistage-flash distillation (MSF) is a thermal process. MSF produces high-quality freshwater with very low salt concentrations. A typical MSF system consists of several evaporation chambers arranged in series. Each has lower pressures and temperatures that cause flash evaporation of the feedstock (Figure 7). The vapor is then followed by condensation on cooling tubes
at the top of each chamber. These thermal systems are extremely energy intensive and require 100,000 to 260,000 kWh/MG (Gleick, 1994; Sandia National Laboratories, 2003; NRC, 2008), but can be as low as 18,000 kWh/MG using combined heat and power (Younos and Tulou, 2005). The largest MSF plant in the world is in the United Arab Emirates and has a total capacity of 120 MGD, using seawater (Cooley et al., 2006).
v. Multiple-Effect Distillation (MED)This is one of the oldest and most efficient
desalination methods and relies on evaporators and condensers in series (Figure 8). MED takes place in a series of vessels and reduces the ambient pressure. This seawater undergoes multiple boilings without supplying additional heat after the first vessel (Cooley et al., 2006). Like all thermal processes, this technology requires a lot of energy: NRC (2008) reports that 150,000 to 400,000 kWh/MG are required in the form of both thermal and electric energy.
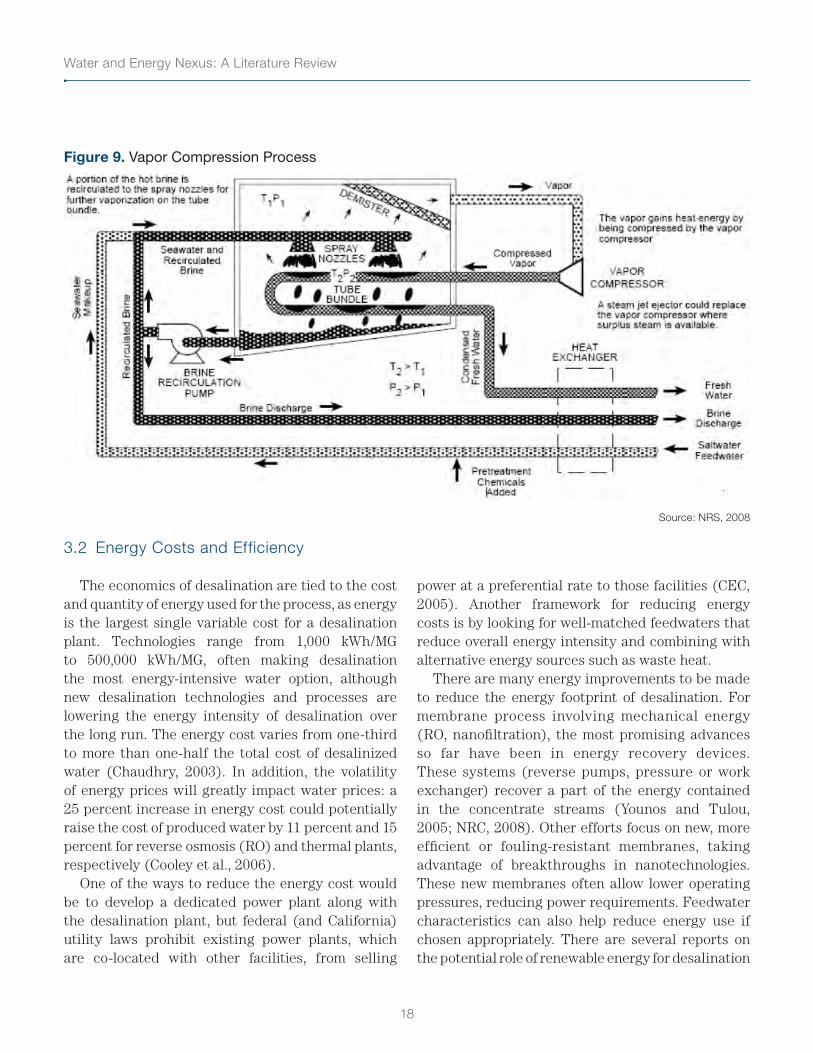
vi. Vapor CompressionVapor compression is a thermal process that is
typically used for small seawater units in tourist resorts, small industries and remote sites (Cooley et al., 2006). These units take advantage of the principle of reducing the boiling point temperature by reducing ambient pressure and condense water by raising pressure (Figure 9). These plants require 30,000 to 60,000 kWh/MG (Younos and Tulou, 2005; NRC, 2008).
vii. Membrane Distillation (MD) or HybridMembrane distillation combines the use of both
thermal distillation and membranes. This technology has had little commercial success so far due to high capital costs, but it can have interesting applications with CHP (Cooley et al., 2006). One approach is to have two parallel plants and to blend the product water from both, enabling the membranes to operate with higher permeate TDS, substantially reducing their replacement costs (NRC, 2008). These facilities can also optimize water production
17
Section I – Energy for Water
and energy costs when electricity has seasonal or peak-demand variations in prices. The energy requirements for these facilities will depend strongly
on its configuration (percentage of flow using MSF or reverse osmosis).
Figure 7. Simple MSF Distillation Process Scheme
Source: Fritzmann et al., 2007
Figure 8. Multiple Effect Distillation Process
Source: NRS, 2008
Water and Energy Nexus: A Literature Review
18
Figure 9. Vapor Compression Process
Source: NRS, 2008
3.2 Energy Costs and Efficiency
The economics of desalination are tied to the cost and quantity of energy used for the process, as energy is the largest single variable cost for a desalination plant. Technologies range from 1,000 kWh/MG to 500,000 kWh/MG, often making desalination the most energy-intensive water option, although new desalination technologies and processes are lowering the energy intensity of desalination over the long run. The energy cost varies from one-third to more than one-half the total cost of desalinized water (Chaudhry, 2003). In addition, the volatility of energy prices will greatly impact water prices: a 25 percent increase in energy cost could potentially raise the cost of produced water by 11 percent and 15 percent for reverse osmosis (RO) and thermal plants, respectively (Cooley et al., 2006).
One of the ways to reduce the energy cost would be to develop a dedicated power plant along with the desalination plant, but federal (and California) utility laws prohibit existing power plants, which are co-located with other facilities, from selling
power at a preferential rate to those facilities (CEC, 2005). Another framework for reducing energy costs is by looking for well-matched feedwaters that reduce overall energy intensity and combining with alternative energy sources such as waste heat.
There are many energy improvements to be made to reduce the energy footprint of desalination. For membrane process involving mechanical energy (RO, nanofiltration), the most promising advances so far have been in energy recovery devices. These systems (reverse pumps, pressure or work exchanger) recover a part of the energy contained in the concentrate streams (Younos and Tulou, 2005; NRC, 2008). Other efforts focus on new, more efficient or fouling-resistant membranes, taking advantage of breakthroughs in nanotechnologies. These new membranes often allow lower operating pressures, reducing power requirements. Feedwater characteristics can also help reduce energy use if chosen appropriately. There are several reports on the potential role of renewable energy for desalination
19
Section I – Energy for Water
(Younos and Tulou, 2005; Mathioulakis et al., 2007; Charcosset, 2009). Renewable energy may not reduce the energy footprint, but it may reduce the environmental footprint of the energy use.
3.3 Energy Costs of Disposal
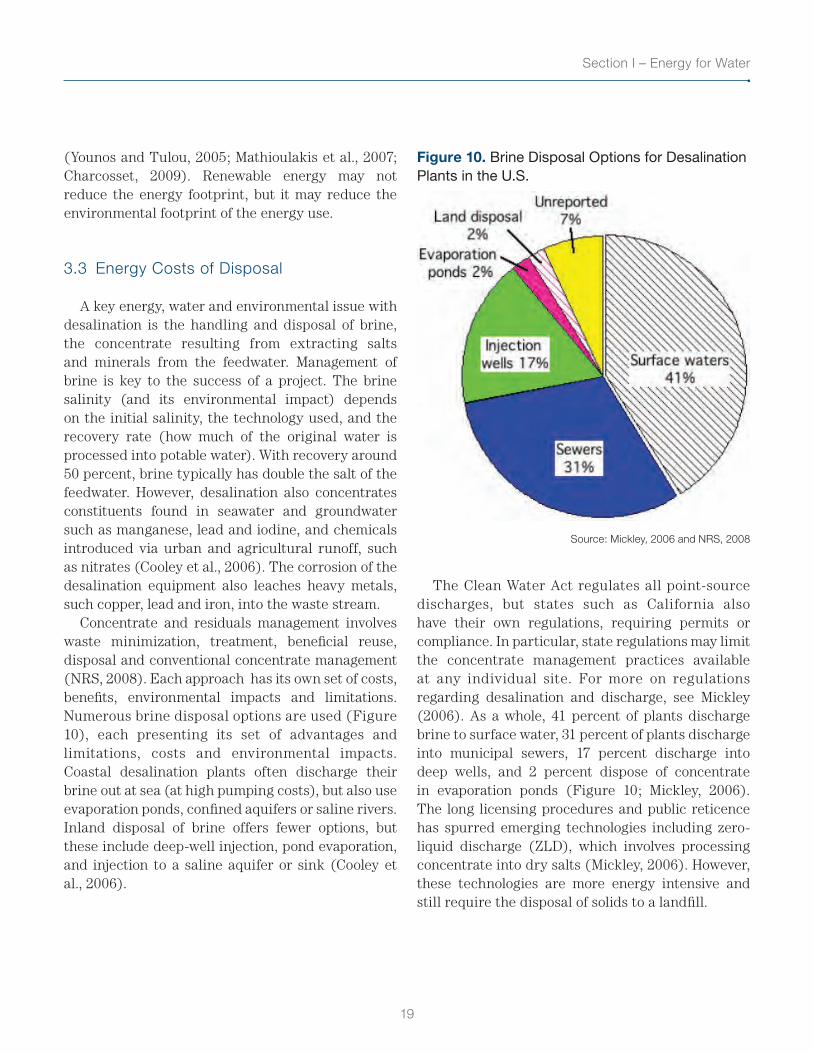
A key energy, water and environmental issue with desalination is the handling and disposal of brine, the concentrate resulting from extracting salts and minerals from the feedwater. Management of brine is key to the success of a project. The brine salinity (and its environmental impact) depends on the initial salinity, the technology used, and the recovery rate (how much of the original water is processed into potable water). With recovery around 50 percent, brine typically has double the salt of the feedwater. However, desalination also concentrates constituents found in seawater and groundwater such as manganese, lead and iodine, and chemicals introduced via urban and agricultural runoff, such as nitrates (Cooley et al., 2006). The corrosion of the desalination equipment also leaches heavy metals, such copper, lead and iron, into the waste stream.
Concentrate and residuals management involves waste minimization, treatment, beneficial reuse, disposal and conventional concentrate management (NRS, 2008). Each approach has its own set of costs, benefits, environmental impacts and limitations. Numerous brine disposal options are used (Figure 10), each presenting its set of advantages and limitations, costs and environmental impacts. Coastal desalination plants often discharge their brine out at sea (at high pumping costs), but also use evaporation ponds, confined aquifers or saline rivers. Inland disposal of brine offers fewer options, but these include deep-well injection, pond evaporation, and injection to a saline aquifer or sink (Cooley et al., 2006).
Figure 10. Brine Disposal Options for Desalination Plants in the U.S.
Source: Mickley, 2006 and NRS, 2008
The Clean Water Act regulates all point-source discharges, but states such as California also have their own regulations, requiring permits or compliance. In particular, state regulations may limit the concentrate management practices available at any individual site. For more on regulations regarding desalination and discharge, see Mickley (2006). As a whole, 41 percent of plants discharge brine to surface water, 31 percent of plants discharge into municipal sewers, 17 percent discharge into deep wells, and 2 percent dispose of concentrate in evaporation ponds (Figure 10; Mickley, 2006). The long licensing procedures and public reticence has spurred emerging technologies including zero-liquid discharge (ZLD), which involves processing concentrate into dry salts (Mickley, 2006). However, these technologies are more energy intensive and still require the disposal of solids to a landfill.
Water and Energy Nexus: A Literature Review
20
4. Conclusion
There is a substantial lack of data on the current state of the nation’s groundwater. Little is known about the amount of groundwater withdrawn, with the exception of adjudicated groundwater basins. In California, only 23 groundwater basins are adjudicated. Tracking and reporting of groundwater pumping by users would enable a better understanding of the energy costs associated with groundwater extraction. There are no indications that rising energy costs equated to a decrease in groundwater withdrawals. A study of the additional energy cost of aquifer overdraft is needed.
The Embedded Water Studies (Bennett et al., 2010 a&b) showed that in California, the extraction of groundwater in summer months is substantial, supplanting the combined electricity requirements of the State Water Project, the CRA and the Central Valley Project. Estimates show that about 1 percent of U.S. electricity production is consumed for groundwater extraction. Because of the energy demands from groundwater pumping, individual states need to track groundwater more closely. A better knowledge of the pump population (age, type, number, fuel, etc.) could help regulators and agencies plan for peak load and energy reductions.
In order to calculate the avoided energy in California’s water supply, there is a need to investigate the short-, mid- and long-term marginal water supply in California. Some investigators posit that the embedded energy of desalination is a logical proxy (GEI, 2012). Desalination requires much more investigation of topics, such as the co-location of power plants and desalination facilities, less energy-intensive processes, brackish water over seawater and environmental issues of brine discharge. In addition to the discussions above on surface water, groundwater and desalination, more research on water efficiency, reuse and recycling as less energy intensive options for meeting future water supply demands would broaden management options in terms of avoided energy cost.
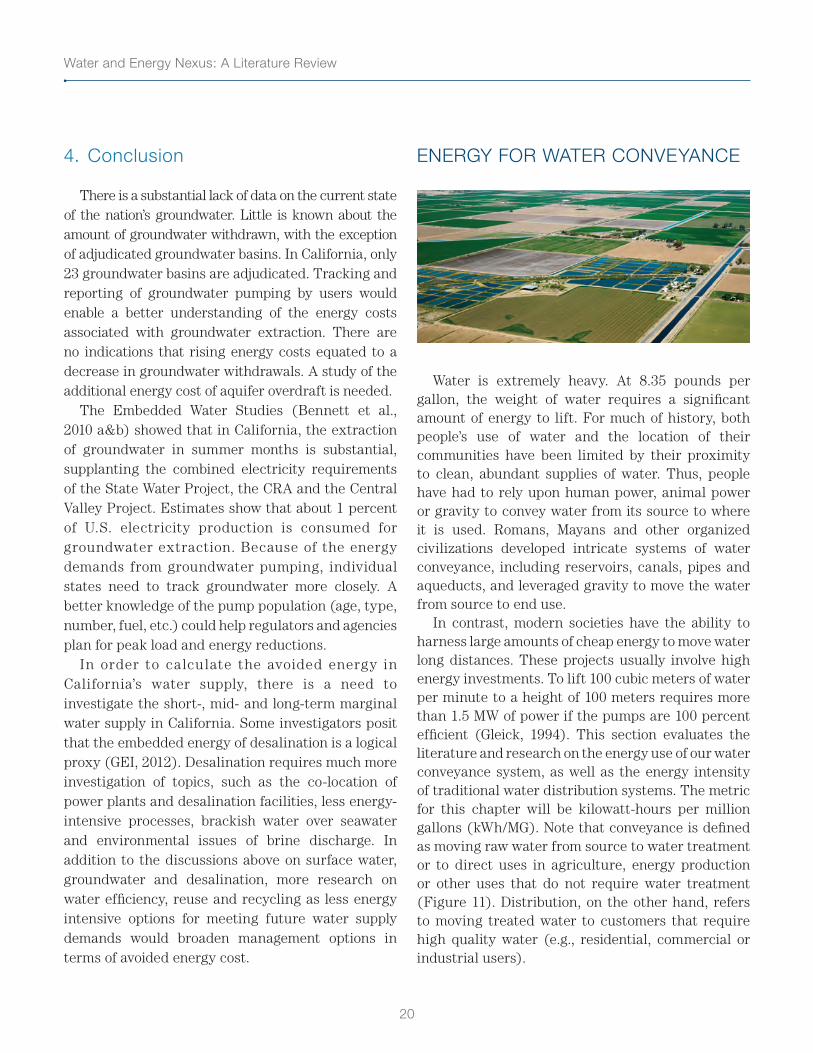
ENERGY FOR WATER CONVEYANCE
Water is extremely heavy. At 8.35 pounds per gallon, the weight of water requires a significant amount of energy to lift. For much of history, both people’s use of water and the location of their communities have been limited by their proximity to clean, abundant supplies of water. Thus, people have had to rely upon human power, animal power or gravity to convey water from its source to where it is used. Romans, Mayans and other organized civilizations developed intricate systems of water conveyance, including reservoirs, canals, pipes and aqueducts, and leveraged gravity to move the water from source to end use.
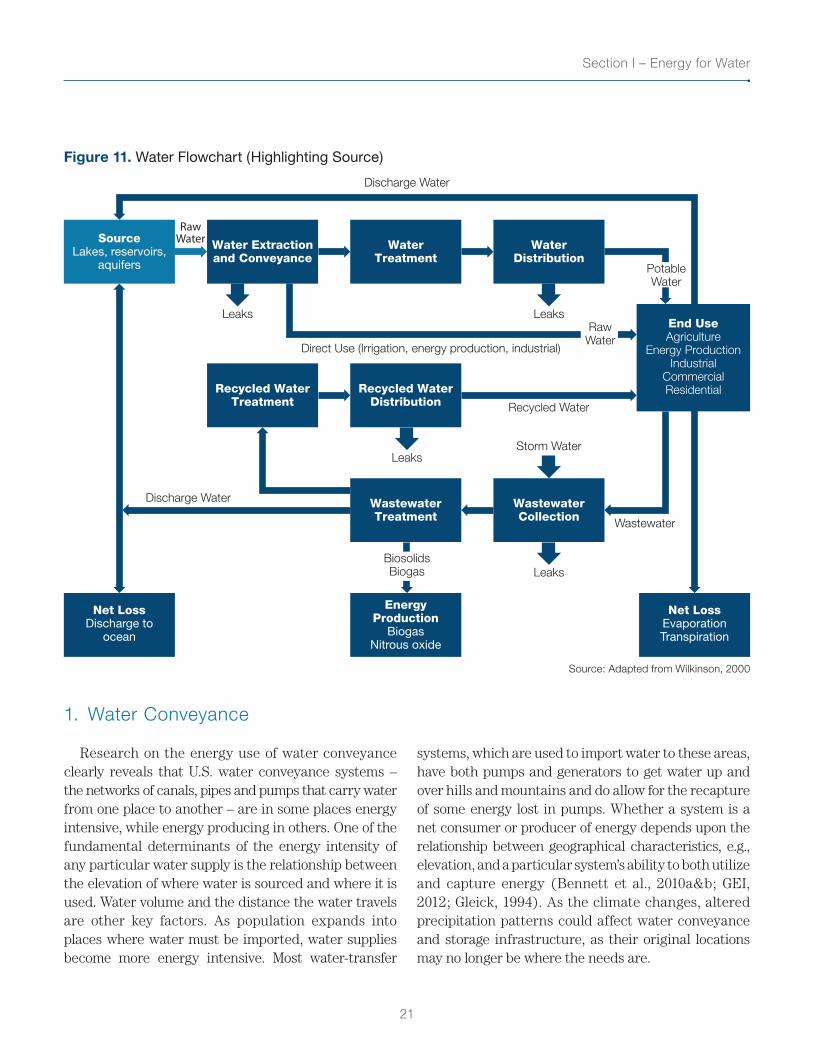
In contrast, modern societies have the ability to harness large amounts of cheap energy to move water long distances. These projects usually involve high energy investments. To lift 100 cubic meters of water per minute to a height of 100 meters requires more than 1.5 MW of power if the pumps are 100 percent efficient (Gleick, 1994). This section evaluates the literature and research on the energy use of our water conveyance system, as well as the energy intensity of traditional water distribution systems. The metric for this chapter will be kilowatt-hours per million gallons (kWh/MG). Note that conveyance is defined as moving raw water from source to water treatment or to direct uses in agriculture, energy production or other uses that do not require water treatment (Figure 11). Distribution, on the other hand, refers to moving treated water to customers that require high quality water (e.g., residential, commercial or industrial users).
21
Section I – Energy for Water
Figure 11. Water Flowchart (Highlighting Source)
SourceLakes, reservoirs,
aquifers
WaterTreatment
WaterDistribution
Water Extractionand Conveyance
Recycled WaterDistribution
Recycled WaterTreatment
End UseAgriculture
Energy ProductionIndustrial
CommercialResidential
Leaks
WastewaterTreatment
EnergyProduction
BiogasNitrous oxide
Net LossDischarge to
ocean
Net LossEvaporationTranspiration
WastewaterCollection
Leaks
Storm Water
Recycled Water
Leaks
Leaks
Discharge Water
Direct Use (Irrigation, energy production, industrial)
RawWater
RawWater
PotableWater
Wastewater
Discharge Water
BiosolidsBiogas
Source: Adapted from Wilkinson, 2000
1. Water Conveyance
Research on the energy use of water conveyance clearly reveals that U.S. water conveyance systems – the networks of canals, pipes and pumps that carry water from one place to another – are in some places energy intensive, while energy producing in others. One of the fundamental determinants of the energy intensity of any particular water supply is the relationship between the elevation of where water is sourced and where it is used. Water volume and the distance the water travels are other key factors. As population expands into places where water must be imported, water supplies become more energy intensive. Most water-transfer
systems, which are used to import water to these areas, have both pumps and generators to get water up and over hills and mountains and do allow for the recapture of some energy lost in pumps. Whether a system is a net consumer or producer of energy depends upon the relationship between geographical characteristics, e.g., elevation, and a particular system’s ability to both utilize and capture energy (Bennett et al., 2010a&b; GEI, 2012; Gleick, 1994). As the climate changes, altered precipitation patterns could affect water conveyance and storage infrastructure, as their original locations may no longer be where the needs are.
Water and Energy Nexus: A Literature Review
22
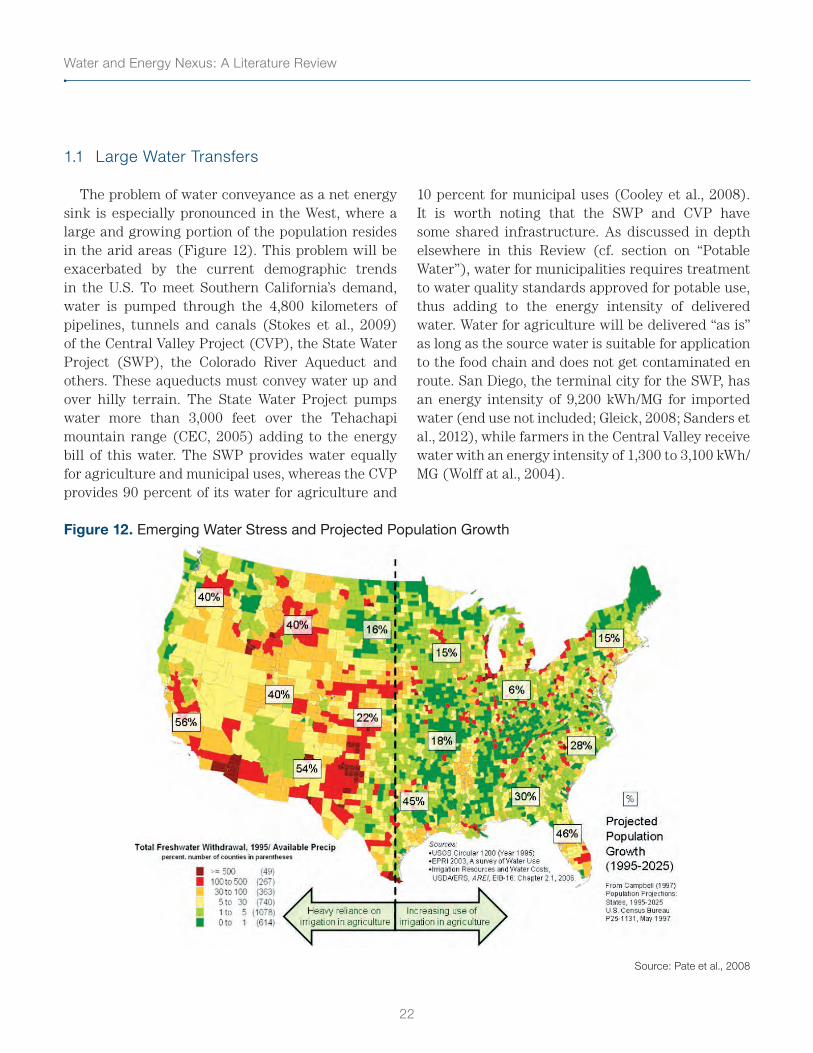
1.1 Large Water Transfers
The problem of water conveyance as a net energy sink is especially pronounced in the West, where a large and growing portion of the population resides in the arid areas (Figure 12). This problem will be exacerbated by the current demographic trends in the U.S. To meet Southern California’s demand, water is pumped through the 4,800 kilometers of pipelines, tunnels and canals (Stokes et al., 2009) of the Central Valley Project (CVP), the State Water Project (SWP), the Colorado River Aqueduct and others. These aqueducts must convey water up and over hilly terrain. The State Water Project pumps water more than 3,000 feet over the Tehachapi mountain range (CEC, 2005) adding to the energy bill of this water. The SWP provides water equally for agriculture and municipal uses, whereas the CVP provides 90 percent of its water for agriculture and
10 percent for municipal uses (Cooley et al., 2008). It is worth noting that the SWP and CVP have some shared infrastructure. As discussed in depth elsewhere in this Review (cf. section on “Potable Water”), water for municipalities requires treatment to water quality standards approved for potable use, thus adding to the energy intensity of delivered water. Water for agriculture will be delivered “as is” as long as the source water is suitable for application to the food chain and does not get contaminated en route. San Diego, the terminal city for the SWP, has an energy intensity of 9,200 kWh/MG for imported water (end use not included; Gleick, 2008; Sanders et al., 2012), while farmers in the Central Valley receive water with an energy intensity of 1,300 to 3,100 kWh/MG (Wolff at al., 2004).
Figure 12. Emerging Water Stress and Projected Population Growth
Source: Pate et al., 2008
23
Section I – Energy for Water
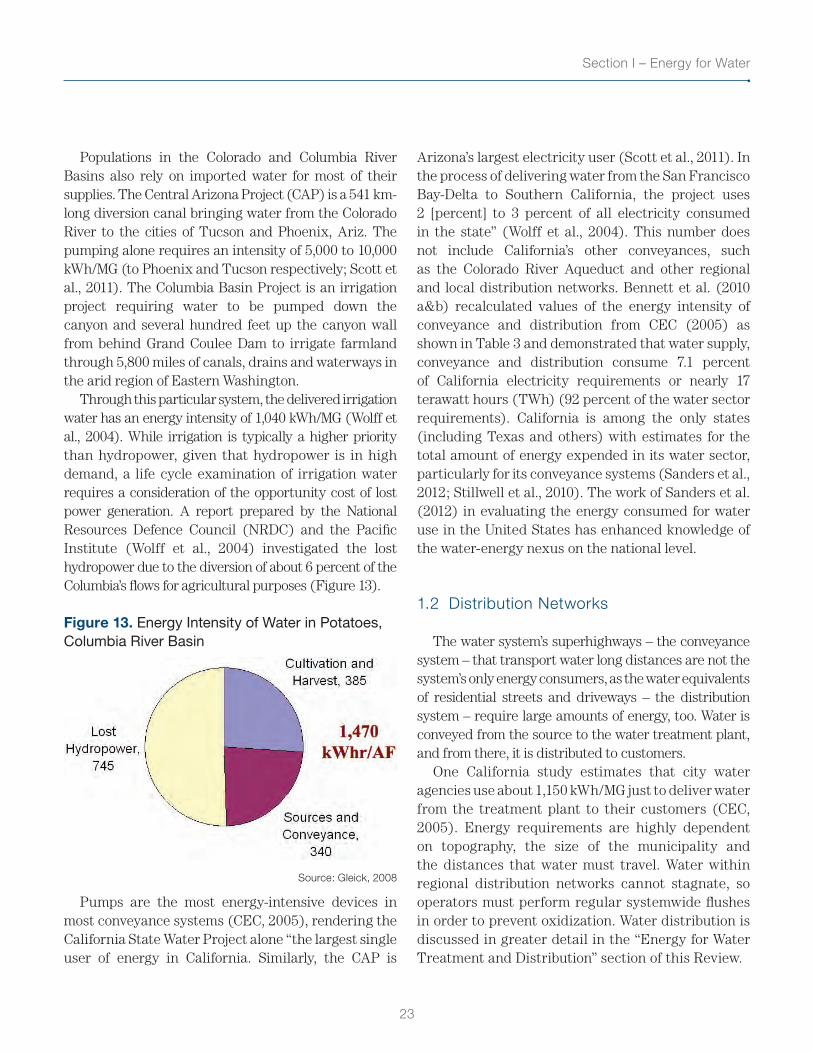
Populations in the Colorado and Columbia River Basins also rely on imported water for most of their supplies. The Central Arizona Project (CAP) is a 541 km-long diversion canal bringing water from the Colorado River to the cities of Tucson and Phoenix, Ariz. The pumping alone requires an intensity of 5,000 to 10,000 kWh/MG (to Phoenix and Tucson respectively; Scott et al., 2011). The Columbia Basin Project is an irrigation project requiring water to be pumped down the canyon and several hundred feet up the canyon wall from behind Grand Coulee Dam to irrigate farmland through 5,800 miles of canals, drains and waterways in the arid region of Eastern Washington.
Through this particular system, the delivered irrigation water has an energy intensity of 1,040 kWh/MG (Wolff et al., 2004). While irrigation is typically a higher priority than hydropower, given that hydropower is in high demand, a life cycle examination of irrigation water requires a consideration of the opportunity cost of lost power generation. A report prepared by the National Resources Defence Council (NRDC) and the Pacific Institute (Wolff et al., 2004) investigated the lost hydropower due to the diversion of about 6 percent of the Columbia’s flows for agricultural purposes (Figure 13).
Figure 13. Energy Intensity of Water in Potatoes, Columbia River Basin
Source: Gleick, 2008
Pumps are the most energy-intensive devices in most conveyance systems (CEC, 2005), rendering the California State Water Project alone “the largest single user of energy in California. Similarly, the CAP is
Arizona’s largest electricity user (Scott et al., 2011). In the process of delivering water from the San Francisco Bay-Delta to Southern California, the project uses 2 [percent] to 3 percent of all electricity consumed in the state” (Wolff et al., 2004). This number does not include California’s other conveyances, such as the Colorado River Aqueduct and other regional and local distribution networks. Bennett et al. (2010 a&b) recalculated values of the energy intensity of conveyance and distribution from CEC (2005) as shown in Table 3 and demonstrated that water supply, conveyance and distribution consume 7.1 percent of California electricity requirements or nearly 17 terawatt hours (TWh) (92 percent of the water sector requirements). California is among the only states (including Texas and others) with estimates for the total amount of energy expended in its water sector, particularly for its conveyance systems (Sanders et al., 2012; Stillwell et al., 2010). The work of Sanders et al. (2012) in evaluating the energy consumed for water use in the United States has enhanced knowledge of the water-energy nexus on the national level.
1.2 Distribution Networks
The water system’s superhighways – the conveyance system – that transport water long distances are not the system’s only energy consumers, as the water equivalents of residential streets and driveways – the distribution system – require large amounts of energy, too. Water is conveyed from the source to the water treatment plant, and from there, it is distributed to customers.
One California study estimates that city water agencies use about 1,150 kWh/MG just to deliver water from the treatment plant to their customers (CEC, 2005). Energy requirements are highly dependent on topography, the size of the municipality and the distances that water must travel. Water within regional distribution networks cannot stagnate, so operators must perform regular systemwide flushes in order to prevent oxidization. Water distribution is discussed in greater detail in the “Energy for Water Treatment and Distribution” section of this Review.
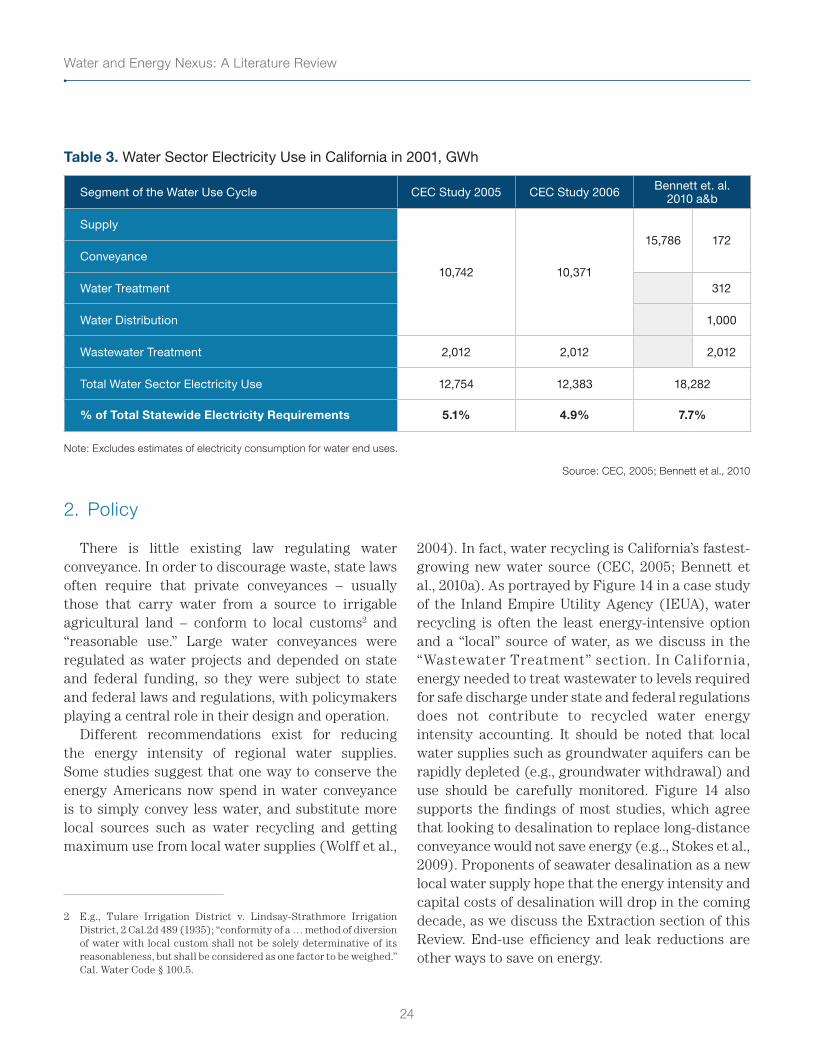
Water and Energy Nexus: A Literature Review
24
Table 3. Water Sector Electricity Use in California in 2001, GWh
Segment of the Water Use Cycle CEC Study 2005 CEC Study 2006 Bennett et. al. 2010 a&b
Supply
10,742 10,371
15,786 172Conveyance
Water Treatment 312
Water Distribution 1,000
Wastewater Treatment 2,012 2,012 2,012
Total Water Sector Electricity Use 12,754 12,383 18,282
% of Total Statewide Electricity Requirements 5.1% 4.9% 7.7%
Note: Excludes estimates of electricity consumption for water end uses.
Source: CEC, 2005; Bennett et al., 2010
2. Policy
There is little existing law regulating water conveyance. In order to discourage waste, state laws often require that private conveyances – usually those that carry water from a source to irrigable agricultural land – conform to local customs2 and “reasonable use.” Large water conveyances were regulated as water projects and depended on state and federal funding, so they were subject to state and federal laws and regulations, with policymakers playing a central role in their design and operation.
Different recommendations exist for reducing the energy intensity of regional water supplies. Some studies suggest that one way to conserve the energy Americans now spend in water conveyance is to simply convey less water, and substitute more local sources such as water recycling and getting maximum use from local water supplies (Wolff et al.,
2 E.g., Tulare Irrigation District v. Lindsay-Strathmore Irrigation District, 2 Cal.2d 489 (1935); “conformity of a … method of diversion of water with local custom shall not be solely determinative of its reasonableness, but shall be considered as one factor to be weighed.” Cal. Water Code § 100.5.
2004). In fact, water recycling is California’s fastest-growing new water source (CEC, 2005; Bennett et al., 2010a). As portrayed by Figure 14 in a case study of the Inland Empire Utility Agency (IEUA), water recycling is often the least energy-intensive option and a “local” source of water, as we discuss in the “Wastewater Treatment” section. In California, energy needed to treat wastewater to levels required for safe discharge under state and federal regulations does not contribute to recycled water energy intensity accounting. It should be noted that local water supplies such as groundwater aquifers can be rapidly depleted (e.g., groundwater withdrawal) and use should be carefully monitored. Figure 14 also supports the findings of most studies, which agree that looking to desalination to replace long-distance conveyance would not save energy (e.g.., Stokes et al., 2009). Proponents of seawater desalination as a new local water supply hope that the energy intensity and capital costs of desalination will drop in the coming decade, as we discuss the Extraction section of this Review. End-use efficiency and leak reductions are other ways to save on energy.
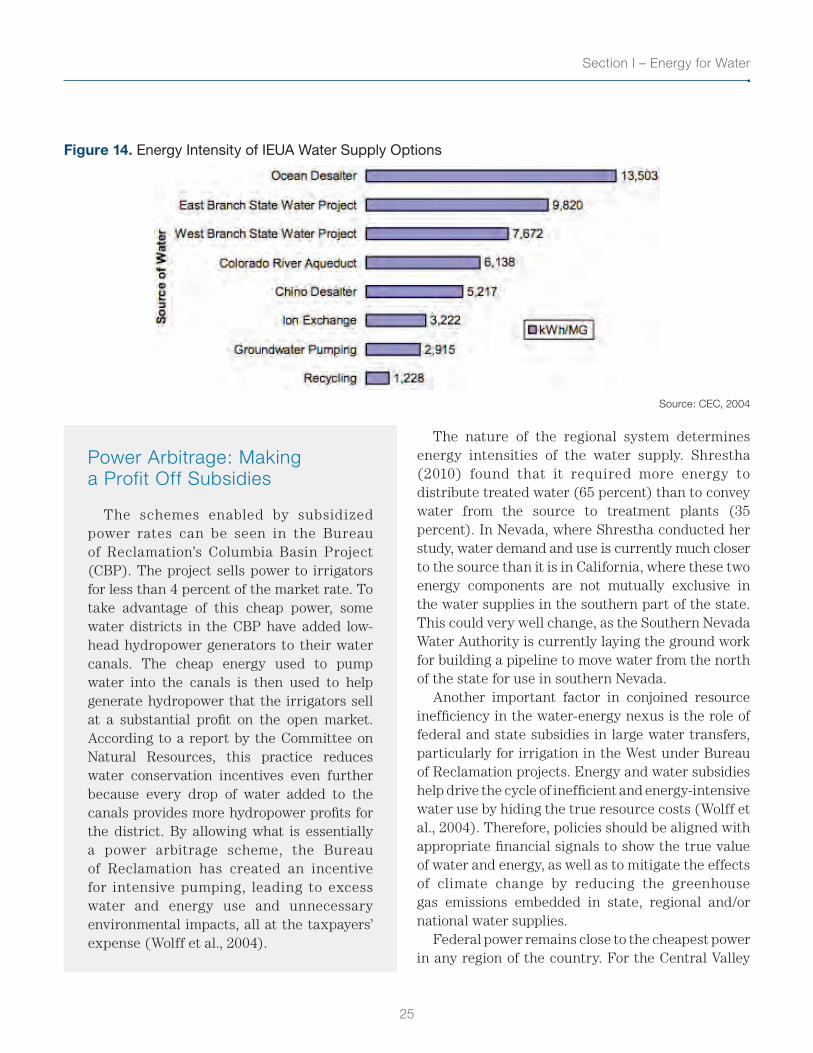
25
Section I – Energy for Water
Figure 14. Energy Intensity of IEUA Water Supply Options
Source: CEC, 2004
Power Arbitrage: Making a Profit Off Subsidies
The schemes enabled by subsidized power rates can be seen in the Bureau of Reclamation’s Columbia Basin Project (CBP). The project sells power to irrigators for less than 4 percent of the market rate. To take advantage of this cheap power, some water districts in the CBP have added low-head hydropower generators to their water canals. The cheap energy used to pump water into the canals is then used to help generate hydropower that the irrigators sell at a substantial profit on the open market. According to a report by the Committee on Natural Resources, this practice reduces water conservation incentives even further because every drop of water added to the canals provides more hydropower profits for the district. By allowing what is essentially a power arbitrage scheme, the Bureau of Reclamation has created an incentive for intensive pumping, leading to excess water and energy use and unnecessary environmental impacts, all at the taxpayers’ expense (Wolff et al., 2004).
The nature of the regional system determines energy intensities of the water supply. Shrestha (2010) found that it required more energy to distribute treated water (65 percent) than to convey water from the source to treatment plants (35 percent). In Nevada, where Shrestha conducted her study, water demand and use is currently much closer to the source than it is in California, where these two energy components are not mutually exclusive in the water supplies in the southern part of the state. This could very well change, as the Southern Nevada Water Authority is currently laying the ground work for building a pipeline to move water from the north of the state for use in southern Nevada.
Another important factor in conjoined resource inefficiency in the water-energy nexus is the role of federal and state subsidies in large water transfers, particularly for irrigation in the West under Bureau of Reclamation projects. Energy and water subsidies help drive the cycle of inefficient and energy-intensive water use by hiding the true resource costs (Wolff et al., 2004). Therefore, policies should be aligned with appropriate financial signals to show the true value of water and energy, as well as to mitigate the effects of climate change by reducing the greenhouse gas emissions embedded in state, regional and/or national water supplies.
Federal power remains close to the cheapest power in any region of the country. For the Central Valley
Water and Energy Nexus: A Literature Review
26
Project, for example, energy charges vary widely, but a representative estimate was a charge of 1 cent per kWh, when the price of electricity in California is usually around 10 cents per kWh (Wolff et al., 2004).
3. Energy Savings Potential
3.1 Pumps and Pipes
As noted previously, pumps are the main consumer of energy used for conveyance. More than 6 percent of electricity used in California is used solely for pumps transporting water (GEI, 2012). There are many ways to reduce the energy and costs of water conveyance. Replacing older pumps with variable speed drives (VSD) can substantially improve pump performance by 5 percent to 50 percent, particularly when functioning at lower loads, as pumps are more efficient closer to full load (Wolff et al., 2004; U.S. Government Accountability Office, 2011). It is also very important to perform required repairs and maintenance, since aging electric motors are responsible for important phase shifts (when current and voltage are no longer in phase), which causes problems on the grid and leads to heavy fines from the public utilities. Well-maintained pumps used at their correct duties can help to easily avoid these fines. The goal of the CPUC “Embedded Energy in Water Pilot Programs” was to help water utilities optimize pumping, but the pilot led to disappointing results and further investigation is recommended (ECONorthwest, 2011). One best practice in agency-specific engineering studies is optimizing groundwater pumping on a well-field basis (rather than one well at a time), which can accrue energy savings.
There are other energy improvements available for energy efficiency improvements, such as increasing pipe diameter to reduce friction losses and the requisite pumping requirements, installing a parallel pipe system, and changing pump impellers and lining pipes to reduce friction losses (CEC, 2005). Moreover, net energy use is only part of the problem. Peak load is a major issue, and switching pumping
loads to off-peak is also a major goal for public utility commissions. Micro-pumped storage activities such as pumping at night to upgradient storage to be released at peak use with in-conduit hydropower generation is one option for energy savings. It is estimated that total maximum water-related electric demand might be as high as 4,000 MW in California annually (GEI Consultants, 2012). This shows that there are probably no other sectors that have as much potential to reduce summer peak demand. Experts are calling for more dual fuel pumps (natural gas and electricity) and increased surface storage capacity to this goal (Park and Bower, 2012). An estimated 1,000 MW could be avoided in peak power from increased storage in urban areas (CEC, 2005).
3.2 In-Conduit Hydroelectricity
Power can be generated from water flowing in a canal, ditch, aqueduct or pipeline. This power, called conduit hydroelectricity, has been used historically, but there is more potential for gain. Major water transfer projects already use in-conduit hydroelectricity. Many water systems, such as the Hetch Hetchy and the Central Valley Project, provide potable water and also produce electricity through traditional hydropower facilities. Although we visit the traditional hydropower arena in a separate section of this Review, additional opportunities to develop new or retrofitted generation in California’s existing water systems warrant mentioning here. The potential ranges for new or retrofitted generation in the latter systems vary from small, e.g., 1 or 2 kW, to about 1 MW (CEC, 2005). The CEC study estimates that with the potential roughly evenly split between municipal and irrigation district systems, about 255 MW of additional generation could be installed in California with an annual production of approximately 1,100 GWh. The most promising technology is through the replacement of pressure-reducing valves (PRVs) with a “reverse pump” which can reduce the pressure in a water system while simultaneously generating electricity. PRVs are used in water supply systems and industry to reduce the buildup of fluid pressure (Campbell,2010). Several
27
Section I – Energy for Water
companies like Community Hydro, with the motto “There’s power in your pipes,” are already offering solutions to water utilities to take advantage of this power generation.
In some situations, regulations prevent development of in-conduit hydropower, although this is changing. See CEC (2005), House (2010), GEI Consultants (2012) and the National Water Resources Association (NWRA) website for more information.
In most states, the regulatory context is still not favorable for self-generation. Most produced power, such as in-conduit hydro, cannot be directly connected to an existing load; it must be sold into the wholesale bulk power market. Some members of Congress want to provide further support for small hydropower and nonfederal hydropower at federal sites (Bracmort et al., 2012). For example, the House of Representatives passed the Bureau of Reclamation Small Conduit Hydropower Development and Rural Jobs Act of 2012 (H.R. 2842). This act would amend the Reclamation Power Act of 1939 to authorize the Secretary of the Interior to contract for the development of small conduit hydropower (1.5 MW or less) at Reclamation facilities and exempt small conduit hydropower development from the National Environmental Policy Act of 1969 (NEPA), among other things (Bracmort et al., 2012).
3.3 Losses
When conveyance systems leak, the energy embedded in that water, including the energy expended in its conveyance and/or treatment, is also lost (Chakravorty et al., 1995). Most of the literature agrees that water losses in conveyance systems are around 10 percent in the U.S., with highs over 50 percent and lows of less than 5 percent. Water utilities have primarily reacted to water leaks rather than take preventative measures. Conveyance systems can be difficult to repair. Many are critical conduits without redundancy, so it is a long process to take the system out of service for repairs. In addition, much of it is buried underground, making it challenging to find leaks and very expensive to excavate and repair.
Wolff et al. (2004) report that neither the State Water Project nor the Central Valley Project (CVP) have done an analysis of conveyance losses, but both estimate these losses to be 5 percent (conveyance losses for evaporation and seepage). Note again the shared infrastructure between these two projects. In their update to the CEC 2005 study, Bennett et al. (2010 a&b) incorporate losses to their calculations, estimating that losses are of about 10 percent. They call for more research on the issue of losses, particularly in state or federal large water conveyance projects. As the CVP accounts for 20 percent of freshwater used in California, this represents a sizable amount of water, and therefore energy, embedded its conveyance.
The “Embedded Energy Water Pilot Programs” showed that the most efficient programs for both water and energy savings were those focused on leak detection and repair, conducted conjointly by investor owned electric utilities and public water utilities (ECONorthwest, 2011). Reducing water losses is one of three main strategies in the “Pathways to implementation,” particularly for Southern California by GEI (2012). The other strategies are reducing the energy intensity of the water supply portfolio in California and reducing summer pumping loads. Among the options recommended are covering water storage, detecting and repairing pipeline breaks and leaks, and lining reservoirs and canals to reduce seepage. Large-scale leak detection of conveyance systems would offer substantial water and energy savings.
4. Conclusion
Although this is hardly a new field of study (e.g., Blaisdell et al., 1963), more research on the total amount of energy water conveyance systems consume is needed and called for. For example, Rothausen et al. (2011) published a review indicating that the literature is dominated by government agency, private-sector and nongovernmental organization reports, or gray literature. The same paper calls for more holistic studies of the water sector’s carbon footprint.
Water and Energy Nexus: A Literature Review
28
Perhaps the most obvious gap in the quantitative literature is that surrounding conveyance construction. There are various rough estimates of the energy required to maintain a conveyance system, but the research completely overlooks the energy expended in building these intricate systems.3 In California, where large portions of the populations live in dry regions, conveyance is an expensive undertaking from an energy perspective, so other relatively energy-intensive processes, like recycling, become cost effective. Meanwhile, for agricultural land, or even for some urban users near a surface water source, conveyance can rely on gravity to carry water from the source to demand instead of energy. While there is some information available about the California Water Project’s energy use, few other states or regions have mapped out the energy spent on conveyance in detail (Bennett et al., 2010 a&b). Such a map would aid with planning and help weigh the cost of transporting more water against other options for meeting future demand.
The CEC study (2005) is often cited by researchers and has proven valuable for water energy nexus efforts in California. While Stillwell et al. (2010) have done similar work for Texas and Sanders (2012) for Texas and nationwide, other states could benefit from higher-resolution analysis in this field. There is a strong need to examine the efficiency of California’s Renewable and Distributed Energy Programs and find ways to simplify the programs when possible. Opportunities for using public-private partnerships to achieve desired goals could be explored.
ENERGY FOR WATER TREATMENT AND DISTRIBUTION
This section explores the literature that evaluates the energy used to treat and distribute potable water (Figure 15). While few studies explicitly address this nexus, there are myriad articles about individual processes and techniques that have wide-reaching
3 Table 1 in Stokes et al., 2009, suggests that the energy requirements for construction are significantly smaller than those for maintenance but does not numerically estimate the size of that use.
implications for energy use. The bulk of the literature points to a report commissioned by EPRI in 1996 (Burton, 1996). This report relies upon model treatment plants, best management practices (issued by state or federal agencies or institutions such as the American Water Works Association) and engineering handbooks. Because the water industry is often slow to incorporate what may be costly, yet cost-effective, changes over the long term, the 1996 findings may still accurately describe many of today’s treatment plants. Although the U.S. Environmental Protection Agency (EPA) offers energy audit support, it does not collect information the way the Energy Information Administration does. A survey of water treatment plants to analyze differences between industry practices at treatment plants around the country and available expert findings on the benefits of, and processes and technologies for, achieving greater energy efficiency in the nation’s water sector is needed. This represents a fairly significant gap in the research in this arena.
Water supply treatment is the process of removing contaminants from water, making it clean enough for its desired use, most often to drinking water standards. This chapter does not investigate wastewater treatment, which is covered in the next section. The metric used for the energy intensity of water in this section is kWh per million gallons (kWh/MG).
According to the EPA (2012b), there are a number of threats to drinking water: improperly disposed-of chemicals, animal waste, pesticides, human threats, wastes injected underground and naturally occurring substances. Water supply treatment can be achieved through a combination of physical, chemical and biological processes; however, because contaminants vary across water sources and by seasons, there is no single standard treatment process. Since most municipal distribution systems do not have separate infrastructure for drinking water and water put to other uses (e.g., irrigation, toilet flushing), treatment plants are almost all designed to produce potable water.
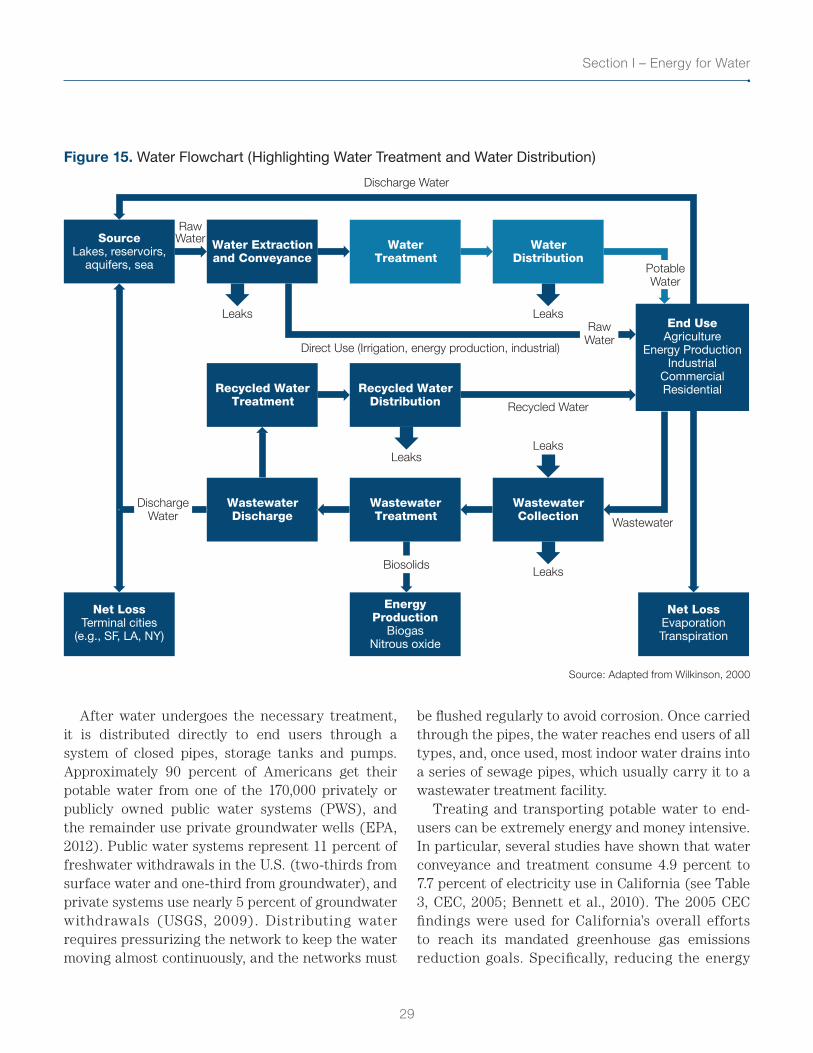
29
Section I – Energy for Water
Figure 15. Water Flowchart (Highlighting Water Treatment and Water Distribution)
SourceLakes, reservoirs,
aquifers, sea
WaterTreatment
WaterDistribution
Water Extractionand Conveyance
Recycled WaterDistribution
Recycled WaterTreatment
End UseAgriculture
Energy ProductionIndustrial
CommercialResidential
Leaks
WastewaterTreatment
EnergyProduction
BiogasNitrous oxide
Net LossTerminal cities
(e.g., SF, LA, NY)
Net LossEvaporationTranspiration
WastewaterCollection
WastewaterDischarge
Leaks
Leaks
Recycled Water
Leaks
Leaks
Discharge Water
Direct Use (Irrigation, energy production, industrial)
RawWater
PotableWater
Wastewater
DischargeWater
Biosolids
RawWater
Source: Adapted from Wilkinson, 2000
After water undergoes the necessary treatment, it is distributed directly to end users through a system of closed pipes, storage tanks and pumps. Approximately 90 percent of Americans get their potable water from one of the 170,000 privately or publicly owned public water systems (PWS), and the remainder use private groundwater wells (EPA, 2012). Public water systems represent 11 percent of freshwater withdrawals in the U.S. (two-thirds from surface water and one-third from groundwater), and private systems use nearly 5 percent of groundwater withdrawals (USGS, 2009). Distributing water requires pressurizing the network to keep the water moving almost continuously, and the networks must
be flushed regularly to avoid corrosion. Once carried through the pipes, the water reaches end users of all types, and, once used, most indoor water drains into a series of sewage pipes, which usually carry it to a wastewater treatment facility.
Treating and transporting potable water to end-users can be extremely energy and money intensive. In particular, several studies have shown that water conveyance and treatment consume 4.9 percent to 7.7 percent of electricity use in California (see Table 3, CEC, 2005; Bennett et al., 2010). The 2005 CEC findings were used for California’s overall efforts to reach its mandated greenhouse gas emissions reduction goals. Specifically, reducing the energy
Water and Energy Nexus: A Literature Review
30
intensity of the state’s water supplies through conservation and water use efficiency measures, as well as through water systems optimization to reduce leaks, were included in the 2008 Scoping Plan for implementing the California Global Warming Solutions Act of 2006. More recently, in May 2012, the California Public Utilities Commission (CPUC) requested that regulated Investor Owned Energy Utilities include water-energy projects in their energy-efficiency programs portfolios where cost effective for the 2013-14 program cycle. The CPUC is further examining the possibility of allowing for the investment of future energy-efficiency program dollars to reduce the energy embedded in the state’s water supplies through projects to save water and energy in the water utility and end user sectors (Bennett et al., 2010; GEI, 2012).
1. Water Treatment
1.1 Water Treatment Standards
At the federal level, the Safe Drinking Water Act of 1974 (SDWA)4 sets federal standards for drinking water treatment. The EPA’s ensuing National Primary Drinking Water Regulations more specifically define the maximum contaminant level (MCL) of more than 90 potentially harmful compounds in drinking water. When capping contaminant levels, the EPA considers health risks of the contaminant concentration for humans, as well as the available technology and cost of meeting the MCL (Rideout, 2011). But, as recently as the early 1990s, more than 36 million Americans were drinking water that violated SDWA standards (NRDC, 1993), pushing Congress to amend the SDWA in 1996 to implement additional disclosure requirements, among other changes. However, The New York Times reported that 20 percent of public water systems across the country still violated SDWA
4 42 U.S.C. §300(f) et seq. (1974).
standards between 2004 and 2009, and few offenders faced fines or other penalties (Duhigg, 2009).
There is literature highlighting the SDWA’s failure to address the contaminants of emerging concern such as trace pharmaceuticals and personal care products increasingly found in drinking water in the U.S. (Congressional Research Service, 2010). In fact, the Congressional Research Service, the U.S. Geological Survey and the U.S. Government Accountability Office have repeatedly recognized a lack of research on the extent of the problem and its potential impact on human and animal health (CRS, 2010; Associated Press, 2009; GAO, 2011). Congress has made several fleeting attempts to mandate such research but has taken no decisive action (e.g., H.R. 1145 and H.R. 1262).
States have also started to address this problem. In California, the State Water Resources Control Board (SWRCB) issued a Recycled Water Policy report in 2009 by the CEC Advisory Panel, which, among other efforts, attempted to include the most current scientific knowledge on CECs into regulatory policies for use by various state agencies. This report provides guidance for developing monitoring programs that assess potential CEC threats from various water practices (SWRCB website). Thus, although nanofiltration and reverse osmosis technologies can remove pharmaceuticals from water sources with increasing effectiveness (Redjenovic et al., 2008), public water systems seldom use them in traditional water treatment facilities. These systems are also extremely energy intensive, requiring high pressure (EPRI, 2002).
Naturally, when potable water comes from a cleaner source, far less treatment – and far less energy investment in such treatment – is necessary, so one of the primary ways to save energy on water supply treatment is to protect sources from being contaminated in the first place. There is a great deal of literature describing regulatory efforts to accomplish this goal, including detailed EPA records (EPA, 1999) and various policy reviews (Turner, 1994; Rideout, 2011). The Safe Drinking Water Act (SDWA) works to protect underground water sources by regulating five classes of injection wells and funding “comprehensive analysis of geology,
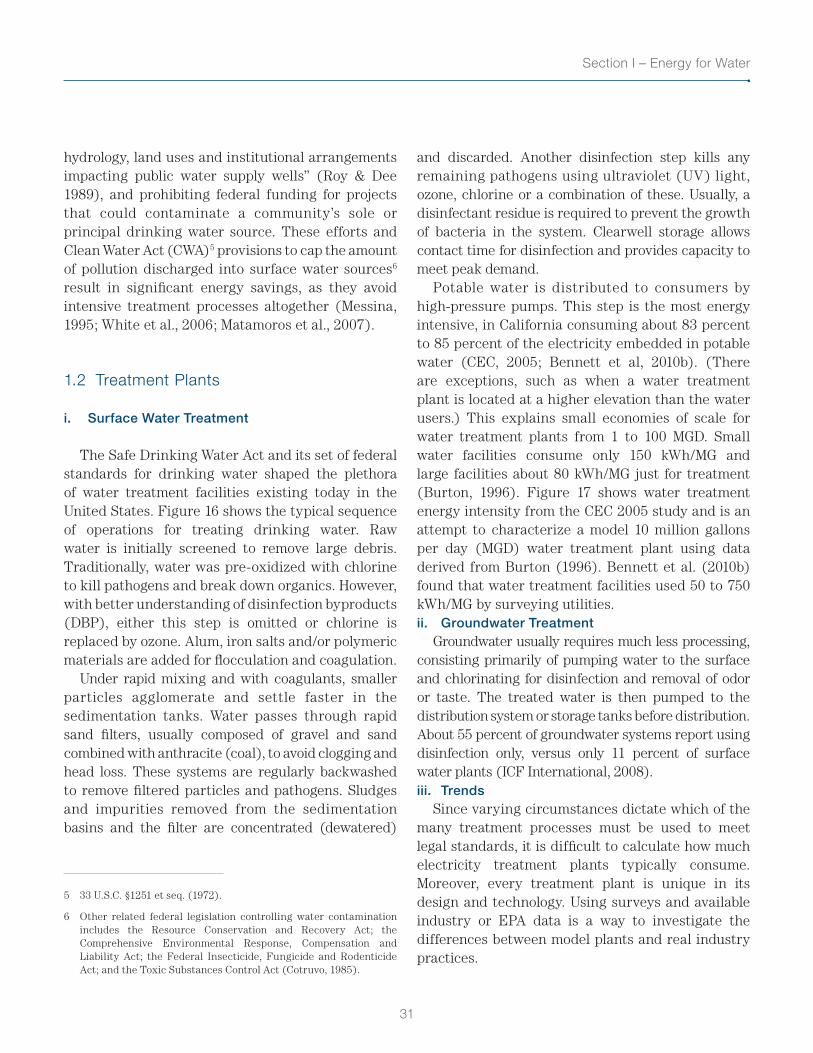
31
Section I – Energy for Water
hydrology, land uses and institutional arrangements impacting public water supply wells” (Roy & Dee 1989), and prohibiting federal funding for projects that could contaminate a community’s sole or principal drinking water source. These efforts and Clean Water Act (CWA)5 provisions to cap the amount of pollution discharged into surface water sources6 result in significant energy savings, as they avoid intensive treatment processes altogether (Messina, 1995; White et al., 2006; Matamoros et al., 2007).
1.2 Treatment Plants
i. Surface Water Treatment
The Safe Drinking Water Act and its set of federal standards for drinking water shaped the plethora of water treatment facilities existing today in the United States. Figure 16 shows the typical sequence of operations for treating drinking water. Raw water is initially screened to remove large debris. Traditionally, water was pre-oxidized with chlorine to kill pathogens and break down organics. However, with better understanding of disinfection byproducts (DBP), either this step is omitted or chlorine is replaced by ozone. Alum, iron salts and/or polymeric materials are added for flocculation and coagulation.
Under rapid mixing and with coagulants, smaller particles agglomerate and settle faster in the sedimentation tanks. Water passes through rapid sand filters, usually composed of gravel and sand combined with anthracite (coal), to avoid clogging and head loss. These systems are regularly backwashed to remove filtered particles and pathogens. Sludges and impurities removed from the sedimentation basins and the filter are concentrated (dewatered)
5 33 U.S.C. §1251 et seq. (1972).
6 Other related federal legislation controlling water contamination includes the Resource Conservation and Recovery Act; the Comprehensive Environmental Response, Compensation and Liability Act; the Federal Insecticide, Fungicide and Rodenticide Act; and the Toxic Substances Control Act (Cotruvo, 1985).
and discarded. Another disinfection step kills any remaining pathogens using ultraviolet (UV) light, ozone, chlorine or a combination of these. Usually, a disinfectant residue is required to prevent the growth of bacteria in the system. Clearwell storage allows contact time for disinfection and provides capacity to meet peak demand.
Potable water is distributed to consumers by high-pressure pumps. This step is the most energy intensive, in California consuming about 83 percent to 85 percent of the electricity embedded in potable water (CEC, 2005; Bennett et al, 2010b). (There are exceptions, such as when a water treatment plant is located at a higher elevation than the water users.) This explains small economies of scale for water treatment plants from 1 to 100 MGD. Small water facilities consume only 150 kWh/MG and large facilities about 80 kWh/MG just for treatment (Burton, 1996). Figure 17 shows water treatment energy intensity from the CEC 2005 study and is an attempt to characterize a model 10 million gallons per day (MGD) water treatment plant using data derived from Burton (1996). Bennett et al. (2010b) found that water treatment facilities used 50 to 750 kWh/MG by surveying utilities.ii. Groundwater Treatment
Groundwater usually requires much less processing, consisting primarily of pumping water to the surface and chlorinating for disinfection and removal of odor or taste. The treated water is then pumped to the distribution system or storage tanks before distribution. About 55 percent of groundwater systems report using disinfection only, versus only 11 percent of surface water plants (ICF International, 2008).iii. Trends
Since varying circumstances dictate which of the many treatment processes must be used to meet legal standards, it is difficult to calculate how much electricity treatment plants typically consume. Moreover, every treatment plant is unique in its design and technology. Using surveys and available industry or EPA data is a way to investigate the differences between model plants and real industry practices.
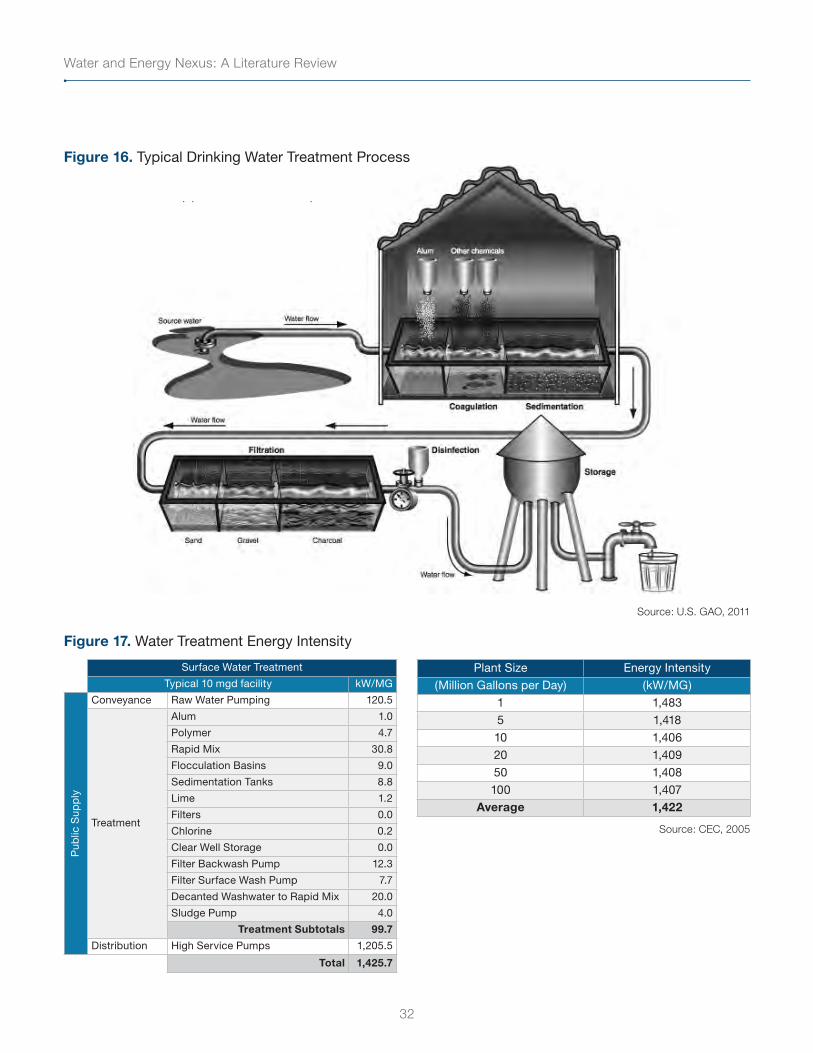
Water and Energy Nexus: A Literature Review
32
Figure 16. Typical Drinking Water Treatment Process
Source: U.S. GAO, 2011
Figure 17. Water Treatment Energy Intensity
Surface Water Treatment
Typical 10 mgd facility kW/MG
Pub
lic S
upp
ly
Conveyance Raw Water Pumping 120.5
Treatment
Alum 1.0
Polymer 4.7
Rapid Mix 30.8
Flocculation Basins 9.0
Sedimentation Tanks 8.8
Lime 1.2
Filters 0.0
Chlorine 0.2
Clear Well Storage 0.0
Filter Backwash Pump 12.3
Filter Surface Wash Pump 7.7
Decanted Washwater to Rapid Mix 20.0
Sludge Pump 4.0
Treatment Subtotals 99.7
Distribution High Service Pumps 1,205.5
Total 1,425.7
Plant Size Energy Intensity
(Million Gallons per Day) (kW/MG)
1 1,483
5 1,418
10 1,406
20 1,409
50 1,408
100 1,407Average 1,422
Source: CEC, 2005
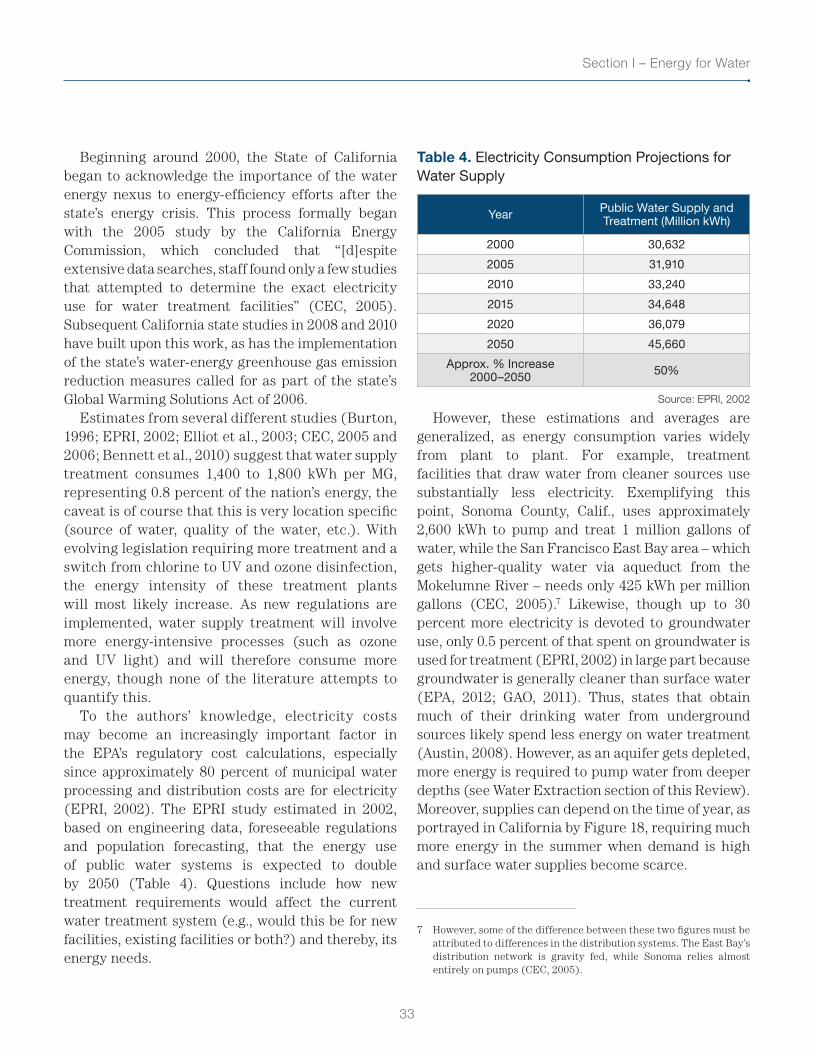
33
Section I – Energy for Water
Beginning around 2000, the State of California began to acknowledge the importance of the water energy nexus to energy-efficiency efforts after the state’s energy crisis. This process formally began with the 2005 study by the California Energy Commission, which concluded that “[d]espite extensive data searches, staff found only a few studies that attempted to determine the exact electricity use for water treatment facilities” (CEC, 2005). Subsequent California state studies in 2008 and 2010 have built upon this work, as has the implementation of the state’s water-energy greenhouse gas emission reduction measures called for as part of the state’s Global Warming Solutions Act of 2006.
Estimates from several different studies (Burton, 1996; EPRI, 2002; Elliot et al., 2003; CEC, 2005 and 2006; Bennett et al., 2010) suggest that water supply treatment consumes 1,400 to 1,800 kWh per MG, representing 0.8 percent of the nation’s energy, the caveat is of course that this is very location specific (source of water, quality of the water, etc.). With evolving legislation requiring more treatment and a switch from chlorine to UV and ozone disinfection, the energy intensity of these treatment plants will most likely increase. As new regulations are implemented, water supply treatment will involve more energy-intensive processes (such as ozone and UV light) and will therefore consume more energy, though none of the literature attempts to quantify this.
To the authors’ knowledge, electricity costs may become an increasingly important factor in the EPA’s regulatory cost calculations, especially since approximately 80 percent of municipal water processing and distribution costs are for electricity (EPRI, 2002). The EPRI study estimated in 2002, based on engineering data, foreseeable regulations and population forecasting, that the energy use of public water systems is expected to double by 2050 (Table 4). Questions include how new treatment requirements would affect the current water treatment system (e.g., would this be for new facilities, existing facilities or both?) and thereby, its energy needs.
Table 4. Electricity Consumption Projections for Water Supply
Year Public Water Supply and Treatment (Million kWh)
2000 30,6322005 31,9102010 33,2402015 34,6482020 36,0792050 45,660
Approx. % Increase 2000–2050 50%
Source: EPRI, 2002
However, these estimations and averages are generalized, as energy consumption varies widely from plant to plant. For example, treatment facilities that draw water from cleaner sources use substantially less electricity. Exemplifying this point, Sonoma County, Calif., uses approximately 2,600 kWh to pump and treat 1 million gallons of water, while the San Francisco East Bay area – which gets higher-quality water via aqueduct from the Mokelumne River – needs only 425 kWh per million gallons (CEC, 2005).7 Likewise, though up to 30 percent more electricity is devoted to groundwater use, only 0.5 percent of that spent on groundwater is used for treatment (EPRI, 2002) in large part because groundwater is generally cleaner than surface water (EPA, 2012; GAO, 2011). Thus, states that obtain much of their drinking water from underground sources likely spend less energy on water treatment (Austin, 2008). However, as an aquifer gets depleted, more energy is required to pump water from deeper depths (see Water Extraction section of this Review). Moreover, supplies can depend on the time of year, as portrayed in California by Figure 18, requiring much more energy in the summer when demand is high and surface water supplies become scarce.
7 However, some of the difference between these two figures must be attributed to differences in the distribution systems. The East Bay’s distribution network is gravity fed, while Sonoma relies almost entirely on pumps (CEC, 2005).
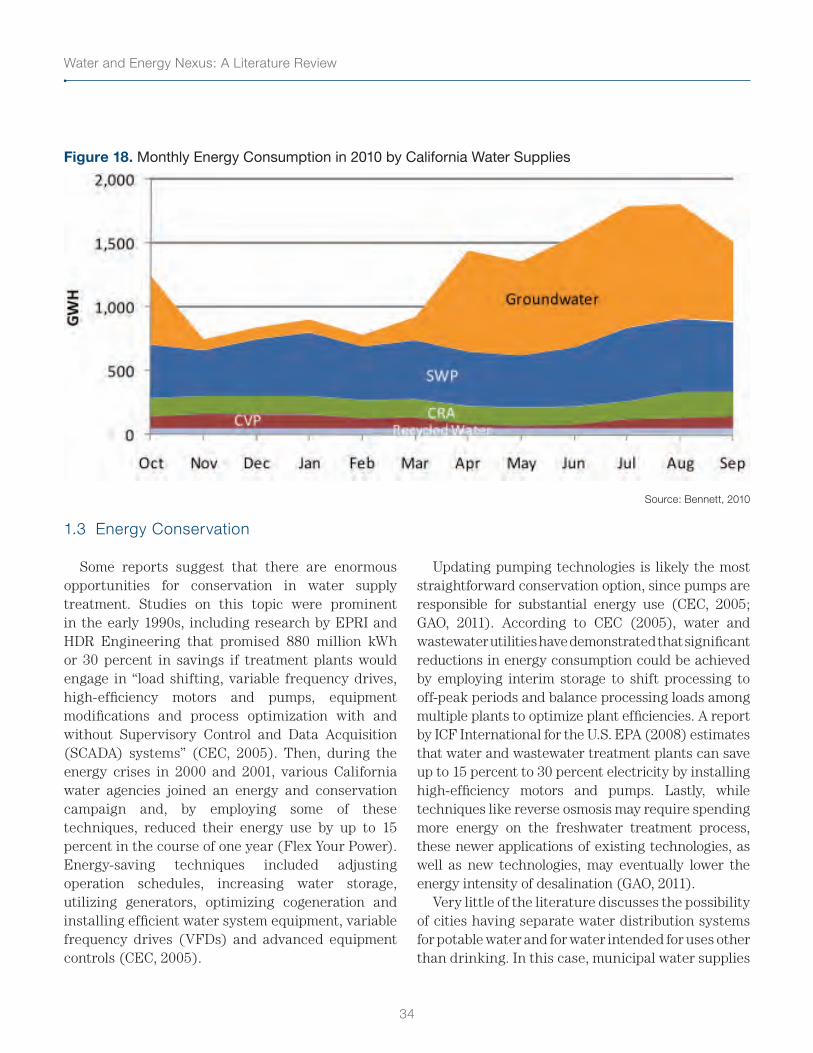
Water and Energy Nexus: A Literature Review
34
Figure 18. Monthly Energy Consumption in 2010 by California Water Supplies
Source: Bennett, 2010
1.3 Energy Conservation
Some reports suggest that there are enormous opportunities for conservation in water supply treatment. Studies on this topic were prominent in the early 1990s, including research by EPRI and HDR Engineering that promised 880 million kWh or 30 percent in savings if treatment plants would engage in “load shifting, variable frequency drives, high-efficiency motors and pumps, equipment modifications and process optimization with and without Supervisory Control and Data Acquisition (SCADA) systems” (CEC, 2005). Then, during the energy crises in 2000 and 2001, various California water agencies joined an energy and conservation campaign and, by employing some of these techniques, reduced their energy use by up to 15 percent in the course of one year (Flex Your Power). Energy-saving techniques included adjusting operation schedules, increasing water storage, utilizing generators, optimizing cogeneration and installing efficient water system equipment, variable frequency drives (VFDs) and advanced equipment controls (CEC, 2005).
Updating pumping technologies is likely the most straightforward conservation option, since pumps are responsible for substantial energy use (CEC, 2005; GAO, 2011). According to CEC (2005), water and wastewater utilities have demonstrated that significant reductions in energy consumption could be achieved by employing interim storage to shift processing to off-peak periods and balance processing loads among multiple plants to optimize plant efficiencies. A report by ICF International for the U.S. EPA (2008) estimates that water and wastewater treatment plants can save up to 15 percent to 30 percent electricity by installing high-efficiency motors and pumps. Lastly, while techniques like reverse osmosis may require spending more energy on the freshwater treatment process, these newer applications of existing technologies, as well as new technologies, may eventually lower the energy intensity of desalination (GAO, 2011).
Very little of the literature discusses the possibility of cities having separate water distribution systems for potable water and for water intended for uses other than drinking. In this case, municipal water supplies
35
Section I – Energy for Water
would require far less water treatment and less energy. Water for landscaping and sanitation does not need to be as clean as the water we drink, but cities must treat it as thoroughly because they often do not have sufficient infrastructure to separately deliver the two distinct water supplies. Recycled water, which is discussed in another chapter, is the fastest-growing new source of water in California (ICF International, 2008), particularly for large users in industry (refineries, agriculture) and in commercial irrigation facilities (golf courses). Building new water distribution systems is extremely expensive, with large capital and operations and maintenance costs. There have not been any studies on the life-cycle analysis of recycled water, investigating whether the energy saved in treatment would result in net savings despite the energy needed to build, maintain and operate a new distribution system.
1.4 Green Infrastructure
Building or improving treatment plants is not the only way to deliver potable water. There is a fairly large body of literature establishing that protected areas can be maintained to avoid significant costs and associated energy demands of traditional treatment works (White et al., 2006; Matamoros et al., 2007). In fact, New York City (Catskills region), San Francisco (Hetch Hetchy) and Portland, Ore. (Bull Run), all rely almost exclusively on watershed protection and management for their potable supply treatment (EPA, 2002). Of course, natural ecosystems clean water without using any energy and are therefore by far the most energy-efficient “treatment” process. These systems can provide net energy gains provided that distribution systems are comparable. This is the case of the San Francisco Hetch Hetchy system, which does not treat water except for the introduction of chloramine and generates revenues from hydropower within the system. Another category of green infrastructure worth mentioning is groundwater recharge zones, which will be further discussed in the Wastewater Treatment chapter.
2. Water Distribution
Energy used in distribution is a somewhat less controversial topic, generating less policy-based literature to complement the wealth of technological articles. One large body of literature questions municipal water systems’ rate structures (Renzetti, 1999). Literature on volumetric sales of water and the rates charged to retail water customers are often not aligned with the energy intensity of that water. The literature also discusses privatization, another significant trend in the water utilities sphere (Gassner et al., 2009), but it unfortunately does not evaluate the potential implications that private ownership of distribution networks might have on incentives to upgrade infrastructure and employ management strategies to conserve energy. Instead, these studies evaluate the effects on employment, price, low-income consumers, the number of residential connections to the network and other elements of service quality (Gassner et al., 2009).
2.1 Water Distribution Regulations
State and local entities are primarily responsible for regulating water distribution networks, but very little of this regulation governs energy use. The bulk of the law caps the rates utilities can charge consumers and lays out infrastructure planning processes (e.g., the Water Resources Planning Act). In fact, many water utilities look to the American Water Works Association and other nongovernmental organizations, rather than to lawmakers, to set minimum standards (EPA, 2009; Olson, 2009). The absence of integrated regulatory approaches to water and energy, while perhaps creating more flexibility, also inhibits the coordinated management of water and energy resources. But, since the federal government has recently offered financial incentives to support green water supply treatment and distribution infrastructure, some state and local governments are becoming engaged in distribution-related policy discussions. For example, the state of Texas received $160.7 million under the
Water and Energy Nexus: A Literature Review
36
American Recovery and Reinvestment Act, at least 20 percent of which was allocated for green distribution infrastructure building (Combs, 2012).
2.2 Water Distribution Networks
There are few case studies on the energy performance of individual water distribution systems. However, rough national estimates indicate public water systems use about 1,200 kWh/MG to deliver water to their customers (CEC, 2005). The energy required for distribution pumping is mainly driven by size, elevation, system age and configuration of the system. Pressure system pumps account for the bulk of the power consumption: the survey done by Bennett et al. (2010) with California water utilities shows maintaining constant pressure in the system requires 360 to 2,500 kWh/MG. This study also attempted to break down the energy cost of booster pumps according to topography: 40 to 60 kWh/MG for flat terrain, 50 to 1,000 kWh/MG for moderate terrain and 400 to 1,600 kWh/MG for hilly terrain.
Unlike water treatment plants, water distribution systems often do not have the luxury of moving the bulk of their load off-peak. Not only must pumps maintain constant pressure within the network, but it is the end user who ultimately determines when the system bears the most load, much like with electrical power grids. Better knowledge of demand and the use of storage tanks and water towers can help remedy these difficulties. In California, water and wastewater treatment requires approximately 3GW of electricity at peak load; this peak load could be reduced by as much as 30 percent from increased water storage in urban areas (CEC, 2005).
2.3 Reducing Embedded Energy
i. Infrastructure UpgradesThere are several clear energy-efficiency and
demand-management opportunities in the water/wastewater sector. Pumps account for up to 95 percent
of the energy used to distribute drinking water (CEC, 2005; GAO, 2011), so any management technique that can enhance pump efficiency could have significant impacts on distribution’s energy consumption. For example, many distribution systems rely on gravity to propel water into and through the pipe network. Systems that do not have such beneficial topography can employ algorithms to create temporal rules dictating when a pump should be turned on or off to maximize energy efficiency (Boulos, 2002). All of these distribution systems still require regular system flushes, which account for significant energy consumption and pump use (CEC, 2005), so minimizing the need to flush the system is likely an effective conservation strategy. For example, changing the pH of the water or adding corrosion inhibitors slows pipe degradation.
Similarly, changing old piping can be helpful. Traditionally pipes were made out of iron, which corrodes and degrades over time, thereby weakening their structure and leading to leaks and ruptures. As pipes age, they are prone to a mineral build up inside the tube, a process known as tuberculation. This increases friction and causes unnecessary head loss, requiring extra pumping (EPRI, 2002). Moreover, these aging systems can have significant losses. There is on average 8 percent and up to 20 percent of unaccounted for or “non-revenue” water in distribution systems (CBO, 2002). It is, however, to be noted that unaccounted for water is not necessarily due to leaks, but also includes accounting errors, unauthorized connections, malfunctioning meters and distribution systems, reservoir leakages, reservoir overflow and authorized unmetered water use. Switching to PVC pipes, which are smoother, not prone to corrosion and protect against bacteria growth, and following best management practices of the American Water Works Association could solve some of these problems (AWWA, 2001; WSO, 2009; Baird, 2011). Other significant improvements include leak detection sensor technologies for new installations and retrofits, or pipe lining (e.g., epoxy coating) to repair aged systems. Generally, a system audit is recommended before conducting specific leak detection and pipeline replacement activities.
37
Section I – Energy for Water
Up to one-third of water utilities in the U.S. are not adequately maintaining their distribution assets and likely lack the funding to correct this problem (GAO, 2002). The average pipe is more than 40 years old (EPA, 2009). Given a lack of regulatory requirements for updates and a lack of government funding, utilities undertake water pipeline rehabilitation work when direct and indirect costs of these leaks become unbearable. The economic benefits of asset management with systematic replacement can be large – generally it is four times more expensive to replace parts at failure. Energy costs may play a small role in this formula, but are likely not a sufficient impetus for change. Indeed, ratepayers largely bear the burden of passed-through power costs, which further causes water utilities to operate with energy cost neutrality.
Moreover, water price structures are generally so low that water lost to leaks does not incent leak remediation to save either energy or water, as shown by the inaction of water utilities when it comes to leaks. The Congressional Budget Office (2002) and the U.S. EPA estimated that between $220 billion and $250 billion were needed over 20 years, just under the current capital spending of $10 billion (ICF International, 2008). However, these estimates could be grossly undervalued, as there is a very poor knowledge of the current state of distribution systems.
ii. Leak ManagementIn a study on California’s water distribution system,
WSO (2009) estimated that about 0.9 million acre-feet (MAF) of water are lost per year in leakage. This is about the amount that Southern California will need in the next decade. According to WSO, about a third of this lost water, or 0.35 MAF, is economically recoverable. This corresponds to water for roughly 2 million people or 5 percent of the population of California. It is also 20 percent of the “20 by 2020” goal set by former Gov. Arnold Schwarzenegger, and would be responsible for 1 billion kWh in energy savings. Still, according to WSO, for every million dollars invested, there is a return of $2.8 million in
savings and the creation of 22 jobs. Extrapolated to the U.S., with the caveat that California is quite unique in water and energy use, leaks could account for 5 MAF, with 2 MAF that could be recoverable, an economy of $1.7 billion per year.
The “Embedded Energy Water Pilot Programs” showed that the most efficient programs for both water and energy savings were those focused on leak detection and repair, conducted conjointly by investor-owned electric utilities and public water utilities (ECONorthwest, 2011). Reducing water losses is one of three main strategies in the “pathways to implementation,” particularly for Southern California, by GEI Consultants (2012). The other strategies are reducing the energy intensity of the water supply portfolio in California and reducing summer pumping loads. Among the options recommended are covering water storage, detecting and repairing pipeline breaks and leaks, and lining reservoirs and canals to reduce seepage.
iii. In-Conduit HydropowerPerhaps the largest unanswered question in
this area stems from the possibility that water distribution systems can be energy generators rather than energy consumers. Installing micro-hydro technologies – discussed in more detail in the “Conveyance” chapter of this Review – in the larger pipes can convert energy from the pressure and flow into electricity (Alexander et al., 2008 and 2009). These systems could be an energy-producing way to regulate pressure rather than using pressure valves. However, the literature has not yet revealed how micro-hydro would work in a domestic water supply system rather than in larger conveyances. While the continuous movement would likely result in continuous generation, unlike in dams and other conveyances, there may be other mitigating factors. For example, the pipes may be too small for current technologies or may generate too little power to be economically effective and power transmission from the point of in-conduit hydro generation may not be easily accomplished unless the systems are located in proximity to transmission lines.
Water and Energy Nexus: A Literature Review
38
3. Conclusion
Most of the literature relies on the work done in 1996 by the EPRI (Burton, 1996). Other work includes the “Embedded Energy Studies” done by the CPUC in California (Bennett et al., 2010 a&b) and the Sanders (2012) work on Texas and nationwide. There are limited available federal data on water and wastewater treatment plants to be able to distinguish discrepancies between real industry practices and engineering handbooks. Much useful information could be gained for further research if the U.S. EPA conducted surveys of the water and wastewater utilities, as the Energy Information Administration does for electric utilities.
Efficiency is one of the highest priorities, in the author’s perspective. Other areas include research to determine how much energy cutting-edge treatment techniques (such as nanofiltration and reverse osmosis) consume, and how these technologies could affect projections for energy spent on water supply treatment in the future. How much additional energy will advanced treatment require to remove emerging contaminants? What new technologies look most promising for reducing that energy burden, and what stands in the way of their development? The potential impact on the energy performance of water treatment plants and wastewater treatment plants has not been sufficiently investigated for contaminants of emerging concern (including pharmaceuticals and personal care products).
Another way to reduce embedded energy is through green infrastructure and watershed protection. However, is it possible to calculate green infrastructure’s value in terms of avoided treatment costs and to develop proxies? Can we optimize the best places for cities to invest in watershed management to avoid treatment costs? How do watershed investments yield benefits in other areas (e.g., flood control, habitat)?
Research questions also arise on the future role of separate water distribution networks for non-potable water: Would the reduction in treatment result in net energy savings despite the energy required
for the added distribution and the energy cost of construction and retrofitting?
There is a dearth of literature about local water distribution policies that might incentivize energy conservation. Do governments regularly consider municipal water distribution systems eligible for energy savings grants? If so, to what effect? More work needs to be done on the issue of bifurcated regulation. There are regulatory hurdles to using energy ratepayer dollars to save water. This is due to statutes against cross-subsidization unless there are demonstrable cost-effective direct energy savings. The California administration is currently considering methodologies to account for the energy embedded in water supplies so that it becomes possible to assign values to the embedded energy in conserved water.
ENERGY FOR WASTEWATER TREATMENT
Wastewater management and treatment has long been considered an important instrument for public health and the control of pathogens. It took some time, however, to recognize its importance for water quality and environmental protection. Rapid economic development in the Eastern U.S. and a demographic boom following World War II greatly altered the quality of water, particularly in the Great Lakes Region. By the 1970s, water pollution had reached spectacular levels, fish kills and dead zones were current, and the nation was brutally reminded of the dire condition of American rivers during the infamous river fires in Ohio. Concomitantly, the environmental movement picked up speed in the wake of Rachel Carson’s Silent Spring.
The Clean Water Act in 1972 started to regulate wastewater discharge, spurring the wastewater treatment plant (WWTP) growth spurt. Considerable progress has been made since the 1970s, although this has come at a high expense to municipalities due to the capital and energy intensity of the processes. Indeed, this section will detail how wastewater
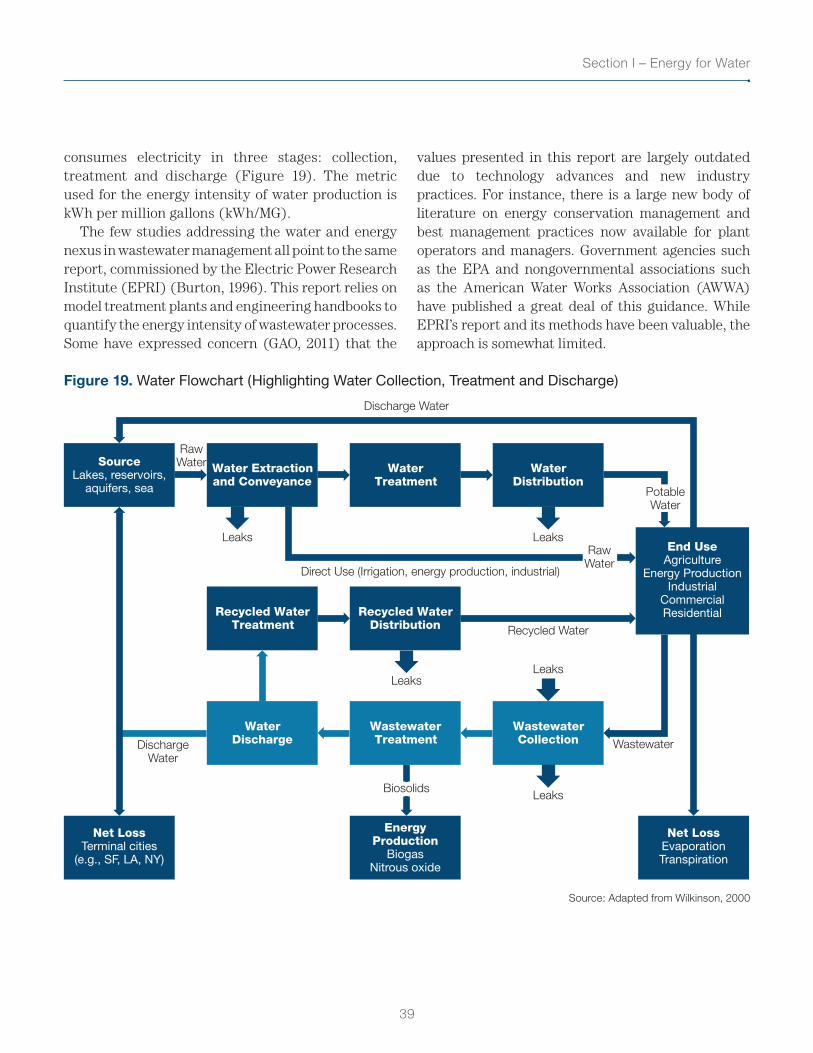
39
Section I – Energy for Water
consumes electricity in three stages: collection, treatment and discharge (Figure 19). The metric used for the energy intensity of water production is kWh per million gallons (kWh/MG).
The few studies addressing the water and energy nexus in wastewater management all point to the same report, commissioned by the Electric Power Research Institute (EPRI) (Burton, 1996). This report relies on model treatment plants and engineering handbooks to quantify the energy intensity of wastewater processes. Some have expressed concern (GAO, 2011) that the
values presented in this report are largely outdated due to technology advances and new industry practices. For instance, there is a large new body of literature on energy conservation management and best management practices now available for plant operators and managers. Government agencies such as the EPA and nongovernmental associations such as the American Water Works Association (AWWA) have published a great deal of this guidance. While EPRI’s report and its methods have been valuable, the approach is somewhat limited.
Figure 19. Water Flowchart (Highlighting Water Collection, Treatment and Discharge)
SourceLakes, reservoirs,
aquifers, sea
WaterTreatment
WaterDistribution
Water Extractionand Conveyance
Recycled WaterDistribution
Recycled WaterTreatment
End UseAgriculture
Energy ProductionIndustrial
CommercialResidential
Leaks
WastewaterTreatment
EnergyProduction
BiogasNitrous oxide
Net LossTerminal cities
(e.g., SF, LA, NY)
Net LossEvaporationTranspiration
WastewaterCollection
WaterDischarge
LeaksBiosolidsBiosolids
Leaks
Recycled Water
Leaks
Leaks
Discharge Water
Direct Use (Irrigation, energy production, industrial)
RawWater
PotableWater
WastewaterDischargeWater
RawWater
Source: Adapted from Wilkinson, 2000
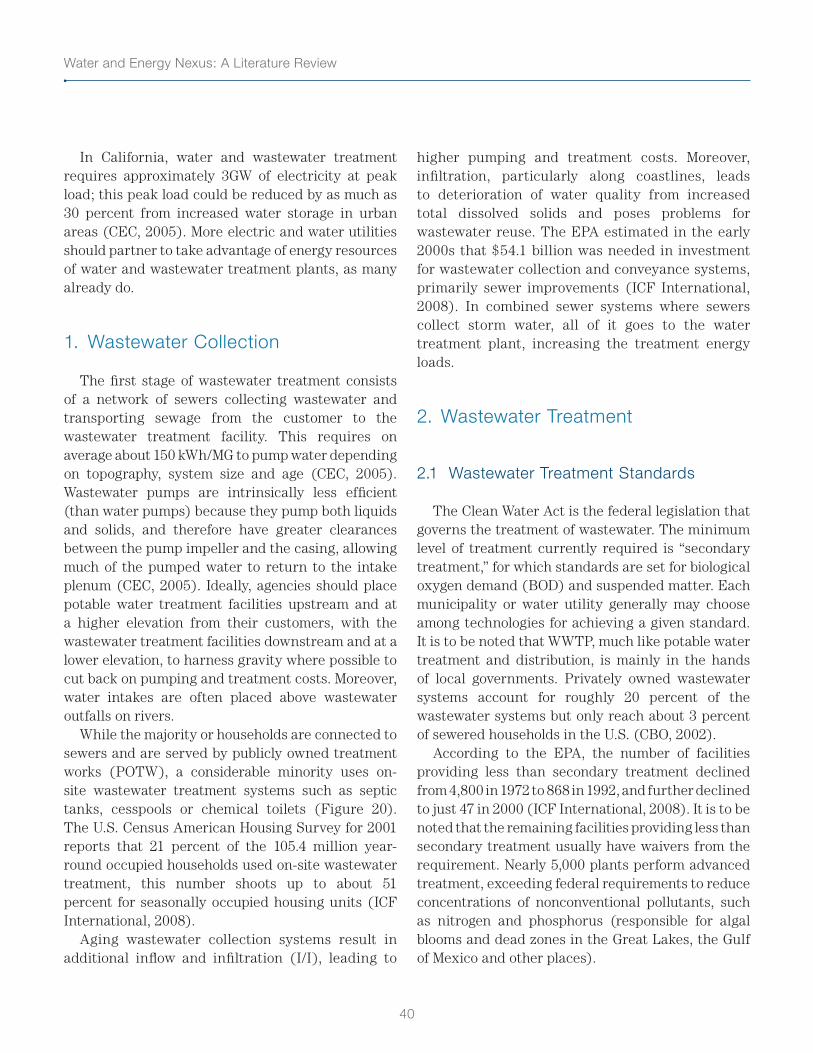
Water and Energy Nexus: A Literature Review
40
In California, water and wastewater treatment requires approximately 3GW of electricity at peak load; this peak load could be reduced by as much as 30 percent from increased water storage in urban areas (CEC, 2005). More electric and water utilities should partner to take advantage of energy resources of water and wastewater treatment plants, as many already do.
1. Wastewater Collection
The first stage of wastewater treatment consists of a network of sewers collecting wastewater and transporting sewage from the customer to the wastewater treatment facility. This requires on average about 150 kWh/MG to pump water depending on topography, system size and age (CEC, 2005). Wastewater pumps are intrinsically less efficient (than water pumps) because they pump both liquids and solids, and therefore have greater clearances between the pump impeller and the casing, allowing much of the pumped water to return to the intake plenum (CEC, 2005). Ideally, agencies should place potable water treatment facilities upstream and at a higher elevation from their customers, with the wastewater treatment facilities downstream and at a lower elevation, to harness gravity where possible to cut back on pumping and treatment costs. Moreover, water intakes are often placed above wastewater outfalls on rivers.
While the majority or households are connected to sewers and are served by publicly owned treatment works (POTW), a considerable minority uses on-site wastewater treatment systems such as septic tanks, cesspools or chemical toilets (Figure 20). The U.S. Census American Housing Survey for 2001 reports that 21 percent of the 105.4 million year-round occupied households used on-site wastewater treatment, this number shoots up to about 51 percent for seasonally occupied housing units (ICF International, 2008).
Aging wastewater collection systems result in additional inflow and infiltration (I/I), leading to
higher pumping and treatment costs. Moreover, infiltration, particularly along coastlines, leads to deterioration of water quality from increased total dissolved solids and poses problems for wastewater reuse. The EPA estimated in the early 2000s that $54.1 billion was needed in investment for wastewater collection and conveyance systems, primarily sewer improvements (ICF International, 2008). In combined sewer systems where sewers collect storm water, all of it goes to the water treatment plant, increasing the treatment energy loads.
2. Wastewater Treatment
2.1 Wastewater Treatment Standards
The Clean Water Act is the federal legislation that governs the treatment of wastewater. The minimum level of treatment currently required is “secondary treatment,” for which standards are set for biological oxygen demand (BOD) and suspended matter. Each municipality or water utility generally may choose among technologies for achieving a given standard. It is to be noted that WWTP, much like potable water treatment and distribution, is mainly in the hands of local governments. Privately owned wastewater systems account for roughly 20 percent of the wastewater systems but only reach about 3 percent of sewered households in the U.S. (CBO, 2002).
According to the EPA, the number of facilities providing less than secondary treatment declined from 4,800 in 1972 to 868 in 1992, and further declined to just 47 in 2000 (ICF International, 2008). It is to be noted that the remaining facilities providing less than secondary treatment usually have waivers from the requirement. Nearly 5,000 plants perform advanced treatment, exceeding federal requirements to reduce concentrations of nonconventional pollutants, such as nitrogen and phosphorus (responsible for algal blooms and dead zones in the Great Lakes, the Gulf of Mexico and other places).
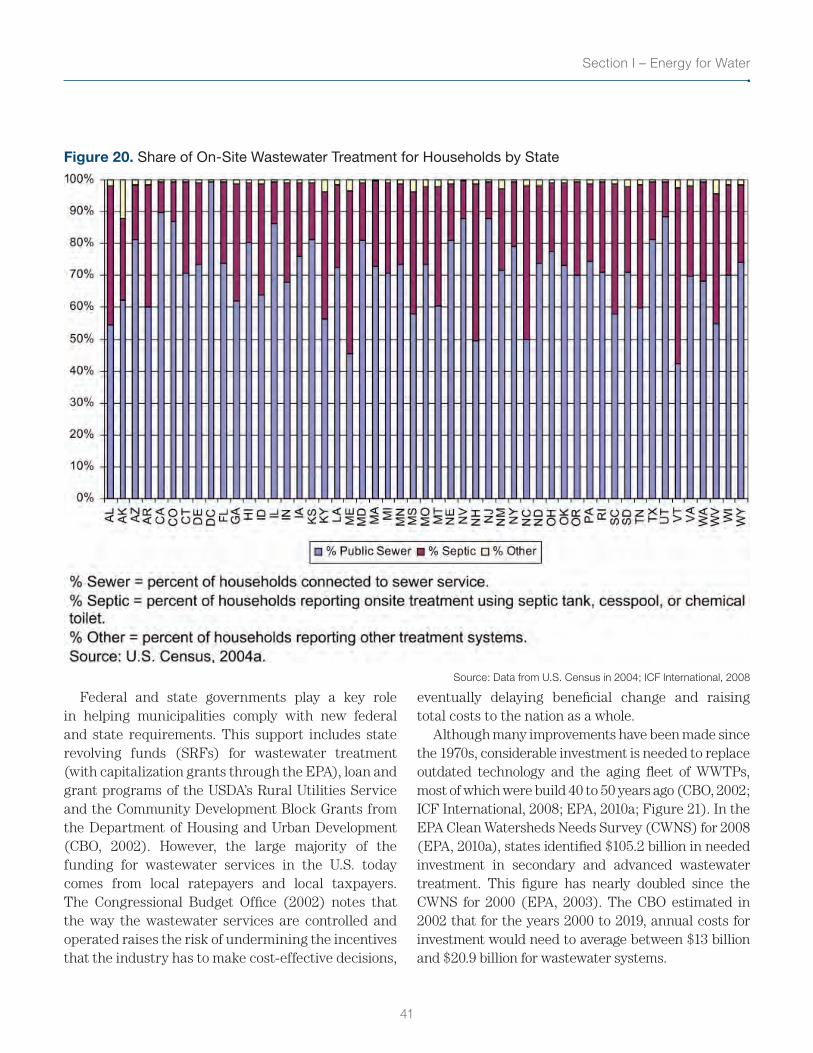
41
Section I – Energy for Water
Figure 20. Share of On-Site Wastewater Treatment for Households by State
Source: Data from U.S. Census in 2004; ICF International, 2008
Federal and state governments play a key role in helping municipalities comply with new federal and state requirements. This support includes state revolving funds (SRFs) for wastewater treatment (with capitalization grants through the EPA), loan and grant programs of the USDA’s Rural Utilities Service and the Community Development Block Grants from the Department of Housing and Urban Development (CBO, 2002). However, the large majority of the funding for wastewater services in the U.S. today comes from local ratepayers and local taxpayers. The Congressional Budget Office (2002) notes that the way the wastewater services are controlled and operated raises the risk of undermining the incentives that the industry has to make cost-effective decisions,
eventually delaying beneficial change and raising total costs to the nation as a whole.
Although many improvements have been made since the 1970s, considerable investment is needed to replace outdated technology and the aging fleet of WWTPs, most of which were build 40 to 50 years ago (CBO, 2002; ICF International, 2008; EPA, 2010a; Figure 21). In the EPA Clean Watersheds Needs Survey (CWNS) for 2008 (EPA, 2010a), states identified $105.2 billion in needed investment in secondary and advanced wastewater treatment. This figure has nearly doubled since the CWNS for 2000 (EPA, 2003). The CBO estimated in 2002 that for the years 2000 to 2019, annual costs for investment would need to average between $13 billion and $20.9 billion for wastewater systems.
Water and Energy Nexus: A Literature Review
42
Figure 21. Total Documented Needs for Wastewater Treatment in the U.S.
Source: CWNS, in 2008 dollars; EPA, 2010a
2.2 Wastewater Treatment Plants
i. Publicly Owned Treatment Works (POTW)Centralized wastewater treatment is provided
to more than 220 million Americans by about 16,000 POTWs (EPA, 2010a). To treat wastewater, suspended solids such as sand and grit, pathogens, organic matter and other pollutants are removed from the water to an acceptable level before discharge. Wastewater regulations do not require specific technologies, and thus systems for collecting, treating and disposing of municipal wastewater vary widely in terms of the equipment and processes used (GAO, 2011). There are typically three levels of treatment, the national standard being secondary (biological) treatment (Figure 22). The majority of the population is served by POTW performing tertiary (advanced) treatment (Figure 23). “No discharge” refers to recycled and reclaimed water.
After collection through sewers, wastewater is first screened to remove large debris such as rags, branches and trash. The large debris must be dewatered and processed, and then is burned or sent to a landfill. A grit removal system then separates smaller gravel and sand. Primary treatment consists of solids removal through sedimentation (large settling basins). Some chemicals may be added to assist with solids removal, similarly to potable water treatment. The solids removed during this step are usually treated and reused for fertilizers, incinerated or disposed of in landfills. The more solids there are, the higher the energy requirements are for disposal and incineration (which can require large amounts of natural gas).
These initial physical processes are followed by secondary treatment to remove organic matter and remaining suspended solids through biological treatment. Activated sludge, which relies on aerobic microorganisms to digest and mineralize organic matter, is the most commonly used in WWTP. Wastewater is pumped into an aeration tank; providing oxygen for these organisms is the most energy-intensive step of the process (Figure 24) and is where most energy-efficiency gains are possible. Another aerobic treatment is the trickling filter.
After primary treatment, wastewater is passed over a medium (rocks or plastic). Bacteria attached in biofilms at the surface of the substrate digest the organic material. This method is much less energy intensive but performs more poorly than activated sludge. Finally, wastewater can also be digested anaerobically (in the absence of oxygen) by microorganisms to produce biogas (a mix of about 60 percent methane and about 40 percent carbon dioxide). This method may require electricity or natural gas to maintain an optimal temperature; this can be offset by direct reuse of biogas in combined heating and power (CHP). Produced biosolids are removed in a secondary settling tank (clarifier). Stillwell et al. (2010), Sanders et al. & Webber (2012), Burton (1996) and EPRI (2002) are studies that really break down the energy implications of these steps.
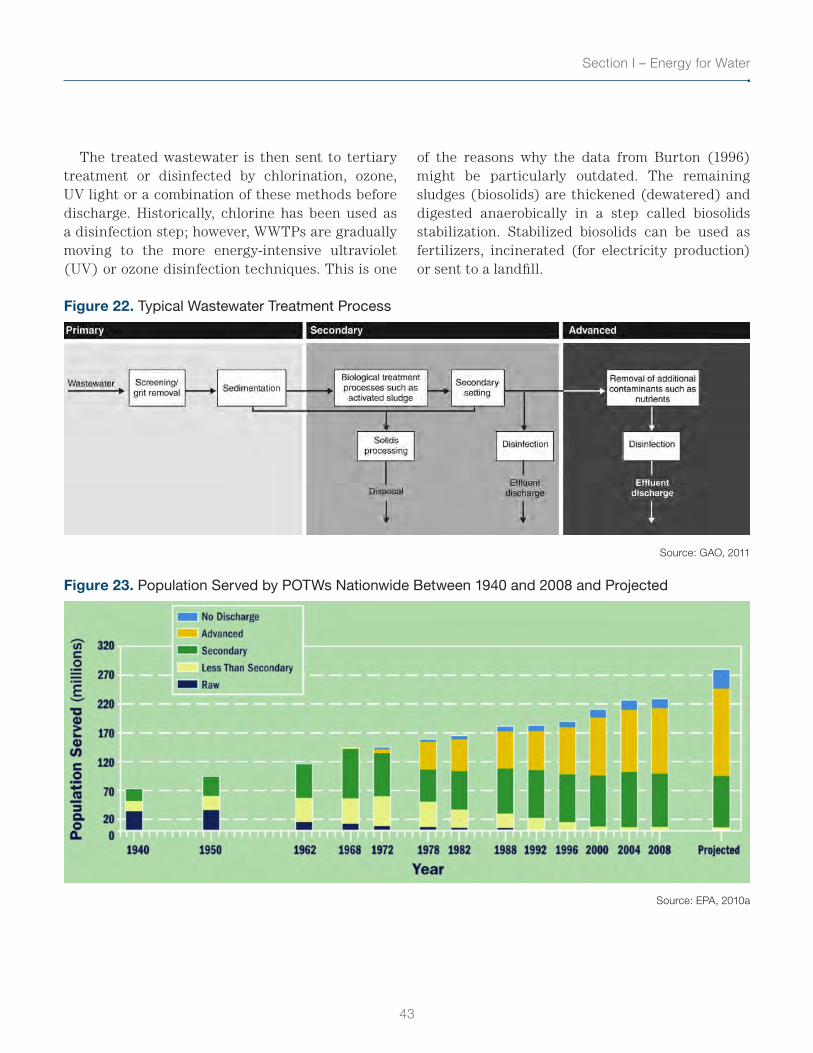
43
Section I – Energy for Water
The treated wastewater is then sent to tertiary treatment or disinfected by chlorination, ozone, UV light or a combination of these methods before discharge. Historically, chlorine has been used as a disinfection step; however, WWTPs are gradually moving to the more energy-intensive ultraviolet (UV) or ozone disinfection techniques. This is one
of the reasons why the data from Burton (1996) might be particularly outdated. The remaining sludges (biosolids) are thickened (dewatered) and digested anaerobically in a step called biosolids stabilization. Stabilized biosolids can be used as fertilizers, incinerated (for electricity production) or sent to a landfill.
Figure 22. Typical Wastewater Treatment Process
Source: GAO, 2011
Figure 23. Population Served by POTWs Nationwide Between 1940 and 2008 and Projected
Source: EPA, 2010a
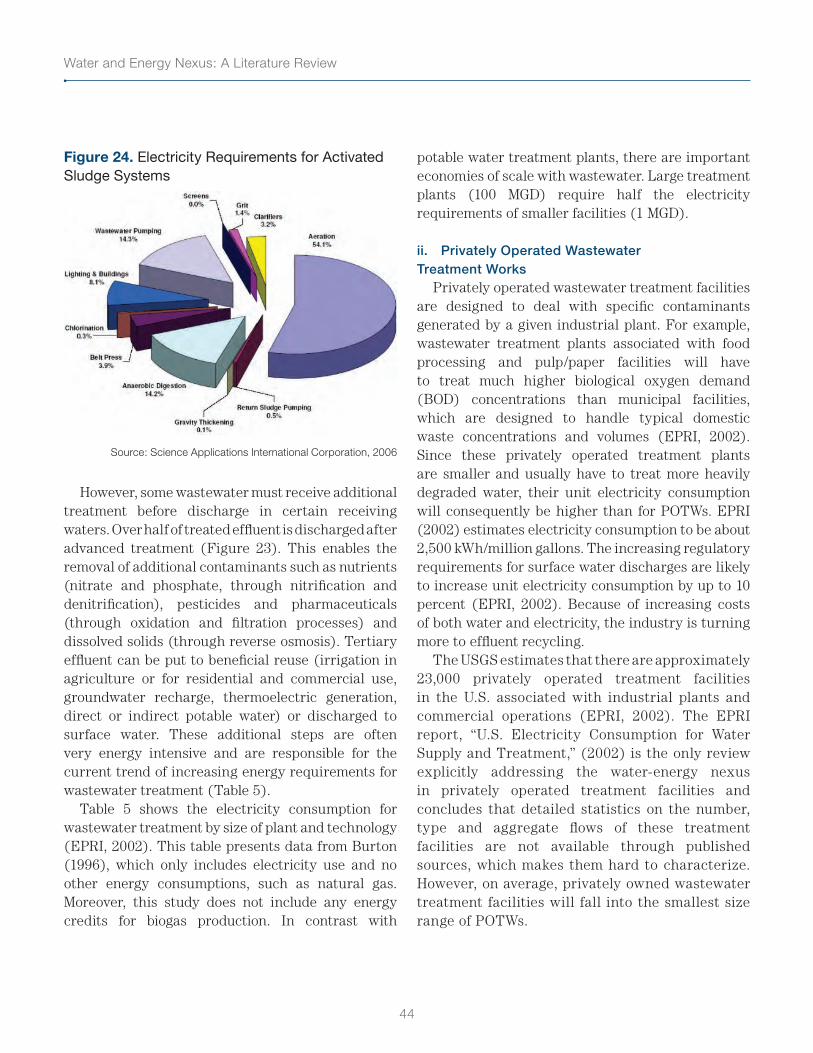
Water and Energy Nexus: A Literature Review
44
Figure 24. Electricity Requirements for Activated Sludge Systems
Source: Science Applications International Corporation, 2006
However, some wastewater must receive additional treatment before discharge in certain receiving waters. Over half of treated effluent is discharged after advanced treatment (Figure 23). This enables the removal of additional contaminants such as nutrients (nitrate and phosphate, through nitrification and denitrification), pesticides and pharmaceuticals (through oxidation and filtration processes) and dissolved solids (through reverse osmosis). Tertiary effluent can be put to beneficial reuse (irrigation in agriculture or for residential and commercial use, groundwater recharge, thermoelectric generation, direct or indirect potable water) or discharged to surface water. These additional steps are often very energy intensive and are responsible for the current trend of increasing energy requirements for wastewater treatment (Table 5).
Table 5 shows the electricity consumption for wastewater treatment by size of plant and technology (EPRI, 2002). This table presents data from Burton (1996), which only includes electricity use and no other energy consumptions, such as natural gas. Moreover, this study does not include any energy credits for biogas production. In contrast with
potable water treatment plants, there are important economies of scale with wastewater. Large treatment plants (100 MGD) require half the electricity requirements of smaller facilities (1 MGD).
ii. Privately Operated Wastewater Treatment Works
Privately operated wastewater treatment facilities are designed to deal with specific contaminants generated by a given industrial plant. For example, wastewater treatment plants associated with food processing and pulp/paper facilities will have to treat much higher biological oxygen demand (BOD) concentrations than municipal facilities, which are designed to handle typical domestic waste concentrations and volumes (EPRI, 2002). Since these privately operated treatment plants are smaller and usually have to treat more heavily degraded water, their unit electricity consumption will consequently be higher than for POTWs. EPRI (2002) estimates electricity consumption to be about 2,500 kWh/million gallons. The increasing regulatory requirements for surface water discharges are likely to increase unit electricity consumption by up to 10 percent (EPRI, 2002). Because of increasing costs of both water and electricity, the industry is turning more to effluent recycling.
The USGS estimates that there are approximately 23,000 privately operated treatment facilities in the U.S. associated with industrial plants and commercial operations (EPRI, 2002). The EPRI report, “U.S. Electricity Consumption for Water Supply and Treatment,” (2002) is the only review explicitly addressing the water-energy nexus in privately operated treatment facilities and concludes that detailed statistics on the number, type and aggregate flows of these treatment facilities are not available through published sources, which makes them hard to characterize. However, on average, privately owned wastewater treatment facilities will fall into the smallest size range of POTWs.
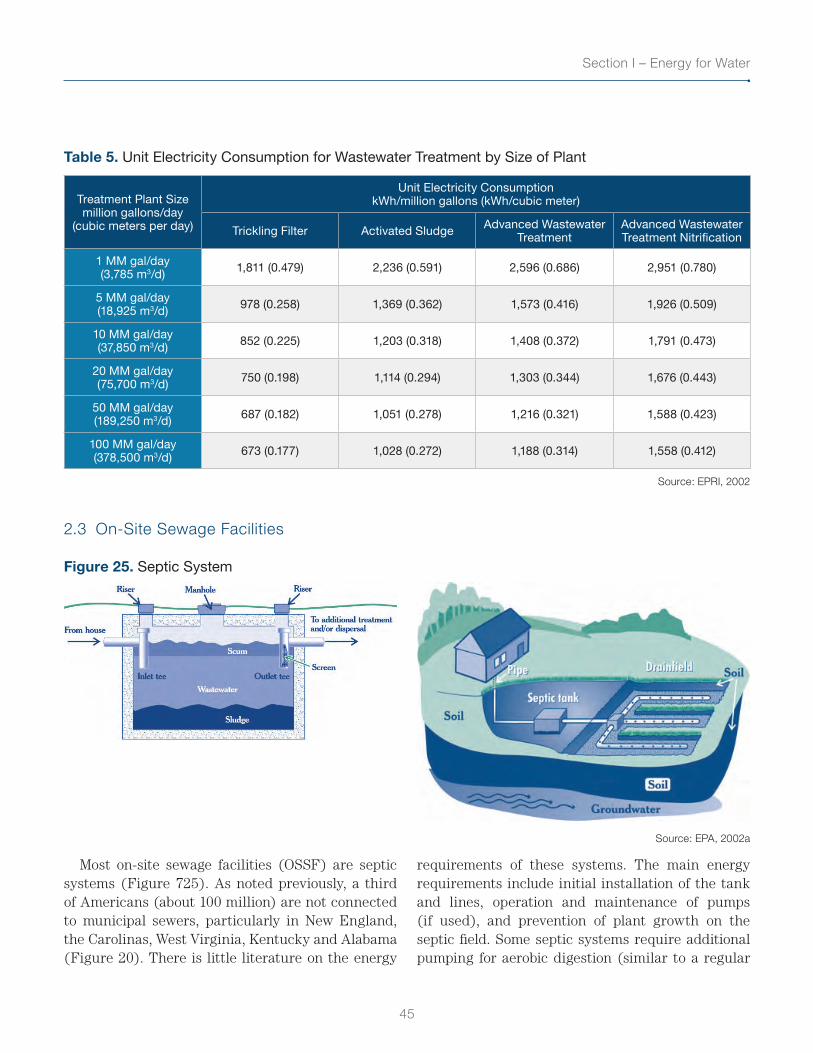
45
Section I – Energy for Water
Table 5. Unit Electricity Consumption for Wastewater Treatment by Size of Plant
Treatment Plant Size million gallons/day
(cubic meters per day)
Unit Electricity Consumption kWh/million gallons (kWh/cubic meter)
Trickling Filter Activated Sludge Advanced Wastewater Treatment
Advanced Wastewater Treatment Nitrification
1 MM gal/day (3,785 m3/d) 1,811 (0.479) 2,236 (0.591) 2,596 (0.686) 2,951 (0.780)
5 MM gal/day (18,925 m3/d) 978 (0.258) 1,369 (0.362) 1,573 (0.416) 1,926 (0.509)
10 MM gal/day (37,850 m3/d) 852 (0.225) 1,203 (0.318) 1,408 (0.372) 1,791 (0.473)
20 MM gal/day (75,700 m3/d) 750 (0.198) 1,114 (0.294) 1,303 (0.344) 1,676 (0.443)
50 MM gal/day (189,250 m3/d) 687 (0.182) 1,051 (0.278) 1,216 (0.321) 1,588 (0.423)
100 MM gal/day (378,500 m3/d) 673 (0.177) 1,028 (0.272) 1,188 (0.314) 1,558 (0.412)
Source: EPRI, 2002
2.3 On-Site Sewage Facilities
Figure 25. Septic System
Source: EPA, 2002a
Most on-site sewage facilities (OSSF) are septic systems (Figure 725). As noted previously, a third of Americans (about 100 million) are not connected to municipal sewers, particularly in New England, the Carolinas, West Virginia, Kentucky and Alabama (Figure 20). There is little literature on the energy
requirements of these systems. The main energy requirements include initial installation of the tank and lines, operation and maintenance of pumps (if used), and prevention of plant growth on the septic field. Some septic systems require additional pumping for aerobic digestion (similar to a regular
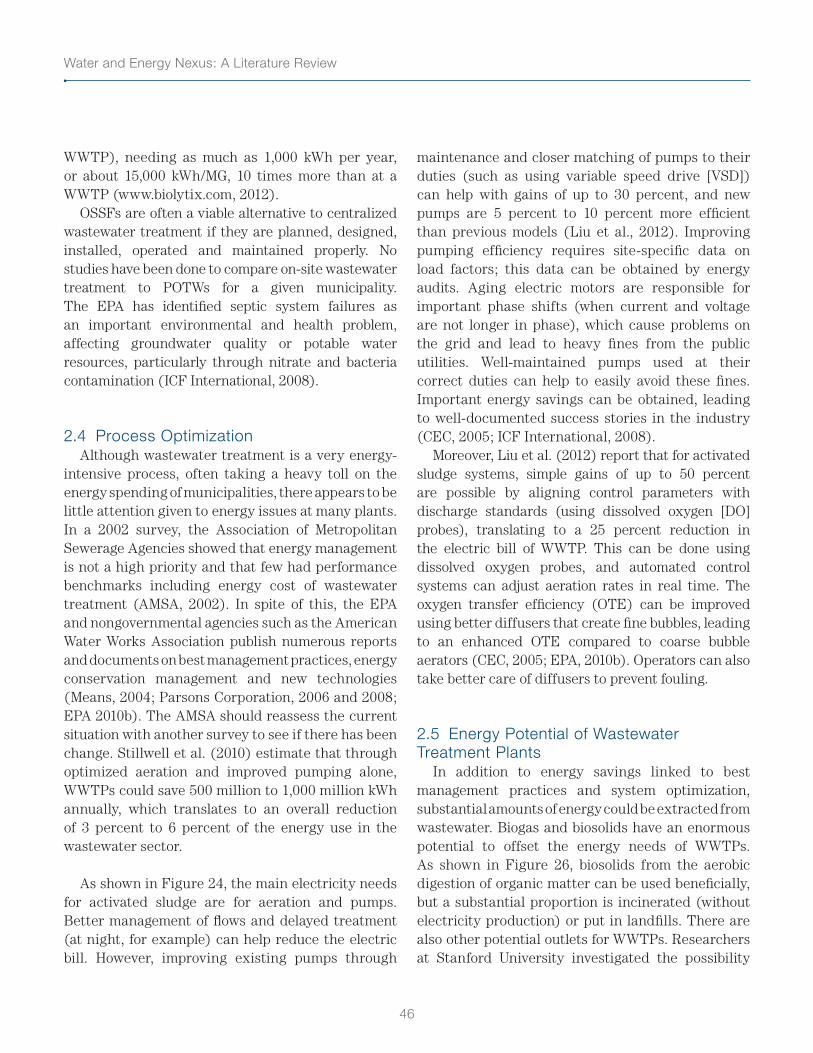
Water and Energy Nexus: A Literature Review
46
WWTP), needing as much as 1,000 kWh per year, or about 15,000 kWh/MG, 10 times more than at a WWTP (www.biolytix.com, 2012).
OSSFs are often a viable alternative to centralized wastewater treatment if they are planned, designed, installed, operated and maintained properly. No studies have been done to compare on-site wastewater treatment to POTWs for a given municipality. The EPA has identified septic system failures as an important environmental and health problem, affecting groundwater quality or potable water resources, particularly through nitrate and bacteria contamination (ICF International, 2008).
2.4 Process OptimizationAlthough wastewater treatment is a very energy-
intensive process, often taking a heavy toll on the energy spending of municipalities, there appears to be little attention given to energy issues at many plants. In a 2002 survey, the Association of Metropolitan Sewerage Agencies showed that energy management is not a high priority and that few had performance benchmarks including energy cost of wastewater treatment (AMSA, 2002). In spite of this, the EPA and nongovernmental agencies such as the American Water Works Association publish numerous reports and documents on best management practices, energy conservation management and new technologies (Means, 2004; Parsons Corporation, 2006 and 2008; EPA 2010b). The AMSA should reassess the current situation with another survey to see if there has been change. Stillwell et al. (2010) estimate that through optimized aeration and improved pumping alone, WWTPs could save 500 million to 1,000 million kWh annually, which translates to an overall reduction of 3 percent to 6 percent of the energy use in the wastewater sector.
As shown in Figure 24, the main electricity needs for activated sludge are for aeration and pumps. Better management of flows and delayed treatment (at night, for example) can help reduce the electric bill. However, improving existing pumps through
maintenance and closer matching of pumps to their duties (such as using variable speed drive [VSD]) can help with gains of up to 30 percent, and new pumps are 5 percent to 10 percent more efficient than previous models (Liu et al., 2012). Improving pumping efficiency requires site-specific data on load factors; this data can be obtained by energy audits. Aging electric motors are responsible for important phase shifts (when current and voltage are not longer in phase), which cause problems on the grid and lead to heavy fines from the public utilities. Well-maintained pumps used at their correct duties can help to easily avoid these fines. Important energy savings can be obtained, leading to well-documented success stories in the industry (CEC, 2005; ICF International, 2008).
Moreover, Liu et al. (2012) report that for activated sludge systems, simple gains of up to 50 percent are possible by aligning control parameters with discharge standards (using dissolved oxygen [DO] probes), translating to a 25 percent reduction in the electric bill of WWTP. This can be done using dissolved oxygen probes, and automated control systems can adjust aeration rates in real time. The oxygen transfer efficiency (OTE) can be improved using better diffusers that create fine bubbles, leading to an enhanced OTE compared to coarse bubble aerators (CEC, 2005; EPA, 2010b). Operators can also take better care of diffusers to prevent fouling.
2.5 Energy Potential of Wastewater Treatment Plants
In addition to energy savings linked to best management practices and system optimization, substantial amounts of energy could be extracted from wastewater. Biogas and biosolids have an enormous potential to offset the energy needs of WWTPs. As shown in Figure 26, biosolids from the aerobic digestion of organic matter can be used beneficially, but a substantial proportion is incinerated (without electricity production) or put in landfills. There are also other potential outlets for WWTPs. Researchers at Stanford University investigated the possibility
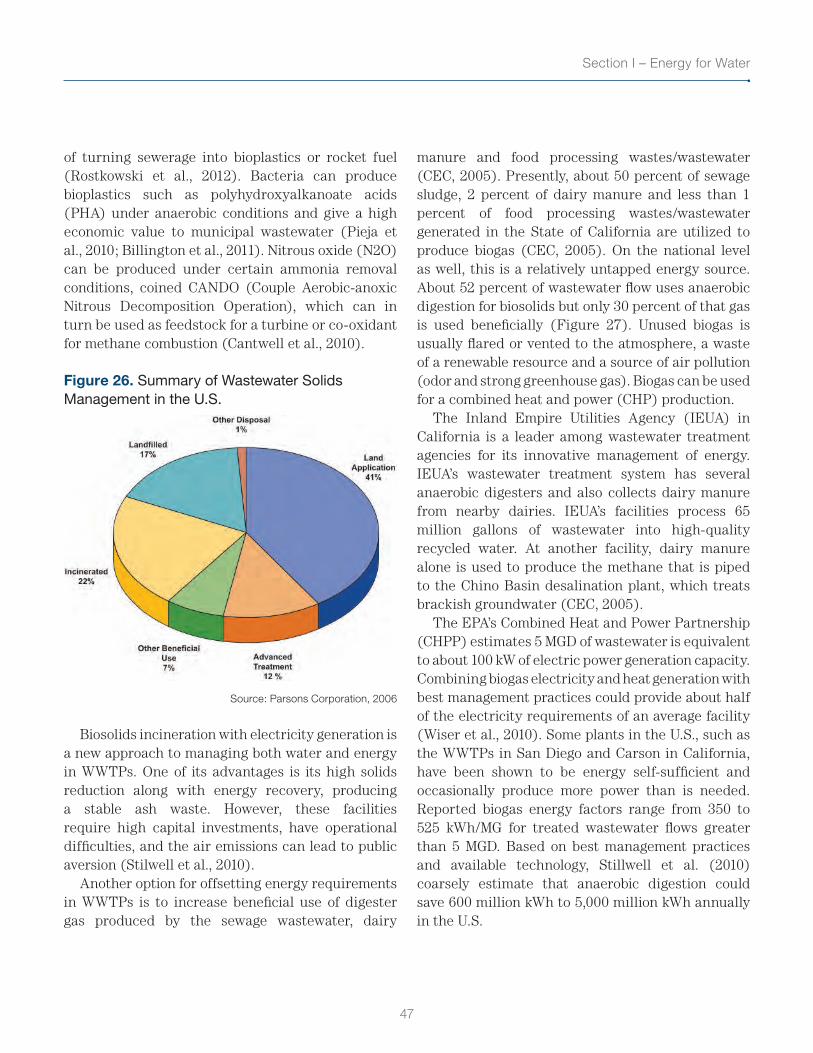
47
Section I – Energy for Water
of turning sewerage into bioplastics or rocket fuel (Rostkowski et al., 2012). Bacteria can produce bioplastics such as polyhydroxyalkanoate acids (PHA) under anaerobic conditions and give a high economic value to municipal wastewater (Pieja et al., 2010; Billington et al., 2011). Nitrous oxide (N2O) can be produced under certain ammonia removal conditions, coined CANDO (Couple Aerobic-anoxic Nitrous Decomposition Operation), which can in turn be used as feedstock for a turbine or co-oxidant for methane combustion (Cantwell et al., 2010).
Figure 26. Summary of Wastewater Solids Management in the U.S.
Source: Parsons Corporation, 2006
Biosolids incineration with electricity generation is a new approach to managing both water and energy in WWTPs. One of its advantages is its high solids reduction along with energy recovery, producing a stable ash waste. However, these facilities require high capital investments, have operational difficulties, and the air emissions can lead to public aversion (Stilwell et al., 2010).
Another option for offsetting energy requirements in WWTPs is to increase beneficial use of digester gas produced by the sewage wastewater, dairy
manure and food processing wastes/wastewater (CEC, 2005). Presently, about 50 percent of sewage sludge, 2 percent of dairy manure and less than 1 percent of food processing wastes/wastewater generated in the State of California are utilized to produce biogas (CEC, 2005). On the national level as well, this is a relatively untapped energy source. About 52 percent of wastewater flow uses anaerobic digestion for biosolids but only 30 percent of that gas is used beneficially (Figure 27). Unused biogas is usually flared or vented to the atmosphere, a waste of a renewable resource and a source of air pollution (odor and strong greenhouse gas). Biogas can be used for a combined heat and power (CHP) production.
The Inland Empire Utilities Agency (IEUA) in California is a leader among wastewater treatment agencies for its innovative management of energy. IEUA’s wastewater treatment system has several anaerobic digesters and also collects dairy manure from nearby dairies. IEUA’s facilities process 65 million gallons of wastewater into high-quality recycled water. At another facility, dairy manure alone is used to produce the methane that is piped to the Chino Basin desalination plant, which treats brackish groundwater (CEC, 2005).
The EPA’s Combined Heat and Power Partnership (CHPP) estimates 5 MGD of wastewater is equivalent to about 100 kW of electric power generation capacity. Combining biogas electricity and heat generation with best management practices could provide about half of the electricity requirements of an average facility (Wiser et al., 2010). Some plants in the U.S., such as the WWTPs in San Diego and Carson in California, have been shown to be energy self-sufficient and occasionally produce more power than is needed. Reported biogas energy factors range from 350 to 525 kWh/MG for treated wastewater flows greater than 5 MGD. Based on best management practices and available technology, Stillwell et al. (2010) coarsely estimate that anaerobic digestion could save 600 million kWh to 5,000 million kWh annually in the U.S.
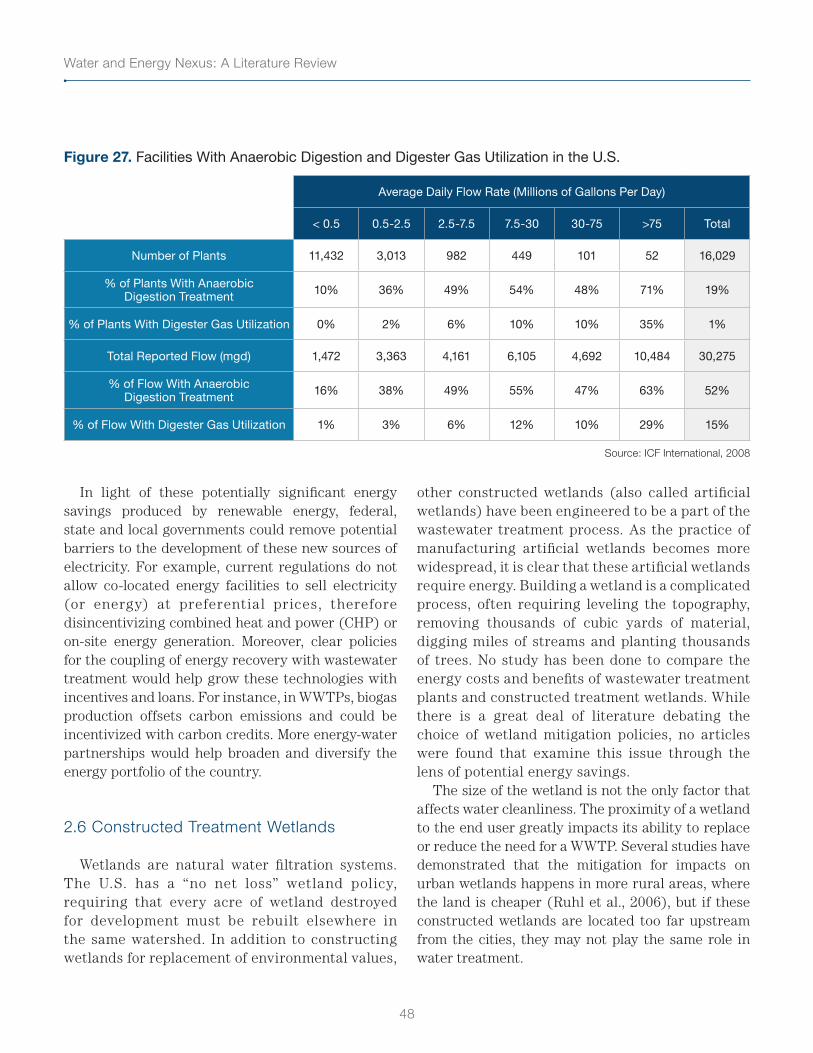
Water and Energy Nexus: A Literature Review
48
Figure 27. Facilities With Anaerobic Digestion and Digester Gas Utilization in the U.S.
Average Daily Flow Rate (Millions of Gallons Per Day)
< 0.5 0.5-2.5 2.5-7.5 7.5-30 30-75 >75 Total
Number of Plants 11,432 3,013 982 449 101 52 16,029
% of Plants With Anaerobic Digestion Treatment 10% 36% 49% 54% 48% 71% 19%
% of Plants With Digester Gas Utilization 0% 2% 6% 10% 10% 35% 1%
Total Reported Flow (mgd) 1,472 3,363 4,161 6,105 4,692 10,484 30,275
% of Flow With Anaerobic Digestion Treatment 16% 38% 49% 55% 47% 63% 52%
% of Flow With Digester Gas Utilization 1% 3% 6% 12% 10% 29% 15%
Source: ICF International, 2008
In light of these potentially significant energy savings produced by renewable energy, federal, state and local governments could remove potential barriers to the development of these new sources of electricity. For example, current regulations do not allow co-located energy facilities to sell electricity (or energy) at preferential pr ices, therefore disincentivizing combined heat and power (CHP) or on-site energy generation. Moreover, clear policies for the coupling of energy recovery with wastewater treatment would help grow these technologies with incentives and loans. For instance, in WWTPs, biogas production offsets carbon emissions and could be incentivized with carbon credits. More energy-water partnerships would help broaden and diversify the energy portfolio of the country.
2.6 Constructed Treatment Wetlands
Wetlands are natural water filtration systems. The U.S. has a “no net loss” wetland policy, requiring that every acre of wetland destroyed for development must be rebuilt elsewhere in the same watershed. In addition to constructing wetlands for replacement of environmental values,
other constructed wetlands (also called artificial wetlands) have been engineered to be a part of the wastewater treatment process. As the practice of manufacturing artificial wetlands becomes more widespread, it is clear that these artificial wetlands require energy. Building a wetland is a complicated process, often requiring leveling the topography, removing thousands of cubic yards of material, digging miles of streams and planting thousands of trees. No study has been done to compare the energy costs and benefits of wastewater treatment plants and constructed treatment wetlands. While there is a great deal of literature debating the choice of wetland mitigation policies, no articles were found that examine this issue through the lens of potential energy savings.
The size of the wetland is not the only factor that affects water cleanliness. The proximity of a wetland to the end user greatly impacts its ability to replace or reduce the need for a WWTP. Several studies have demonstrated that the mitigation for impacts on urban wetlands happens in more rural areas, where the land is cheaper (Ruhl et al., 2006), but if these constructed wetlands are located too far upstream from the cities, they may not play the same role in water treatment.
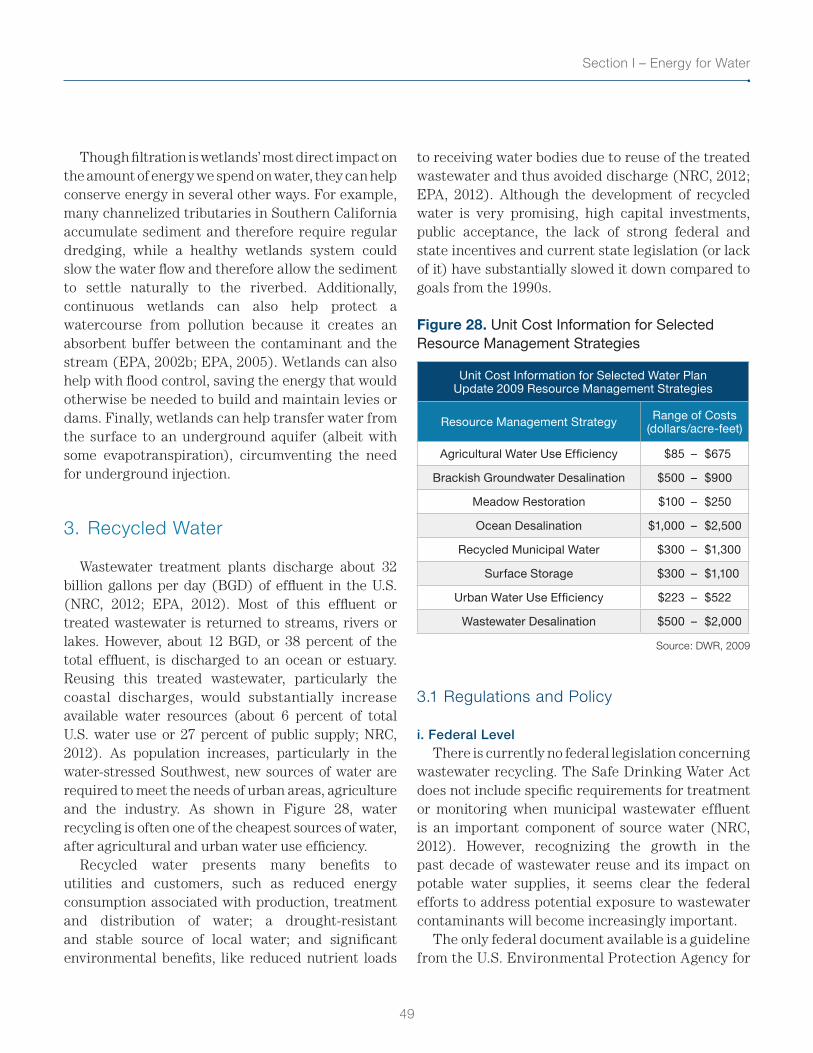
49
Section I – Energy for Water
Though filtration is wetlands’ most direct impact on the amount of energy we spend on water, they can help conserve energy in several other ways. For example, many channelized tributaries in Southern California accumulate sediment and therefore require regular dredging, while a healthy wetlands system could slow the water flow and therefore allow the sediment to settle naturally to the riverbed. Additionally, continuous wetlands can also help protect a watercourse from pollution because it creates an absorbent buffer between the contaminant and the stream (EPA, 2002b; EPA, 2005). Wetlands can also help with flood control, saving the energy that would otherwise be needed to build and maintain levies or dams. Finally, wetlands can help transfer water from the surface to an underground aquifer (albeit with some evapotranspiration), circumventing the need for underground injection.
3. Recycled Water
Wastewater treatment plants discharge about 32 billion gallons per day (BGD) of effluent in the U.S. (NRC, 2012; EPA, 2012). Most of this effluent or treated wastewater is returned to streams, rivers or lakes. However, about 12 BGD, or 38 percent of the total effluent, is discharged to an ocean or estuary. Reusing this treated wastewater, particularly the coastal discharges, would substantially increase available water resources (about 6 percent of total U.S. water use or 27 percent of public supply; NRC, 2012). As population increases, particularly in the water-stressed Southwest, new sources of water are required to meet the needs of urban areas, agriculture and the industry. As shown in Figure 28, water recycling is often one of the cheapest sources of water, after agricultural and urban water use efficiency.
Recycled water presents many benefits to utilities and customers, such as reduced energy consumption associated with production, treatment and distribution of water; a drought-resistant and stable source of local water; and significant environmental benefits, like reduced nutrient loads
to receiving water bodies due to reuse of the treated wastewater and thus avoided discharge (NRC, 2012; EPA, 2012). Although the development of recycled water is very promising, high capital investments, public acceptance, the lack of strong federal and state incentives and current state legislation (or lack of it) have substantially slowed it down compared to goals from the 1990s.
Figure 28. Unit Cost Information for Selected Resource Management Strategies
Unit Cost Information for Selected Water Plan Update 2009 Resource Management Strategies
Resource Management Strategy Range of Costs (dollars/acre-feet)
Agricultural Water Use Efficiency $85 – $675
Brackish Groundwater Desalination $500 – $900
Meadow Restoration $100 – $250
Ocean Desalination $1,000 – $2,500
Recycled Municipal Water $300 – $1,300
Surface Storage $300 – $1,100
Urban Water Use Efficiency $223 – $522
Wastewater Desalination $500 – $2,000
Source: DWR, 2009
3.1 Regulations and Policy
i. Federal LevelThere is currently no federal legislation concerning
wastewater recycling. The Safe Drinking Water Act does not include specific requirements for treatment or monitoring when municipal wastewater effluent is an important component of source water (NRC, 2012). However, recognizing the growth in the past decade of wastewater reuse and its impact on potable water supplies, it seems clear the federal efforts to address potential exposure to wastewater contaminants will become increasingly important.
The only federal document available is a guideline from the U.S. Environmental Protection Agency for
Water and Energy Nexus: A Literature Review
50
non-potable reuse (EPA, 2012). It is partly based on a review and evaluation of current state regulations, not on rigorous risk assessment methodology (NRC, 2012; EPA, 2012). Scientifically supportable risk-based federal regulations for non-potable water reuse and indirect potable water reuse would provide the nation with minimum acceptable standards and could facilitate water recycling projects, particularly by increasing public acceptance (NRC, 2012). U.S. EPA Region 9 (California, Nevada and Arizona) is the only region to have a website dedicated to water recycling.
ii. State LevelRegulations concerning wastewater reuse vary
widely from one state to another. Most states do not have anything more than the guidelines from the EPA. Currently, water rights laws affect the ability of water authorities to promote water-recycling projects. As of 2012, 30 states and one U.S. territory have adopted regulations and 15 states have guidelines or design standards that govern water reuse (EPA, 2012). These water rights laws and regulations concerning wastewater reuse vary by state, and projects can proceed through the acquisition of water rights after water rights have been clarified through legislation or court decisions (NRC, 2012). State water reuse regulations or guidelines for non-potable reuse are not based on rigorous risk assessment methodology that can be used to identify and manage risks. 2012 Guidelines for Water Reuse by the EPA has an extensive review of state regulations concerning recycled water (EPA, 2012).
Most of the literature on the subject of water reuse is from California’s state agencies, institutes and universities. The State of California has long identified the potential of water recycling as a new water supply to meet future demand and mitigate the loss of water rights to the Colorado River and the San Joaquin River Delta. Recycled water is California’s fastest-growing new source of water (CEC, 2005). The California Water Code defines recycled water as “water which, as a result
of treatment of waste, is suitable for a direct beneficial use or controlled use that would not otherwise occur.” The Water Recycling Act of 1991 describes the environmental benefits and public safety of using recycled water; it is considered as a reliable and cost-effective method to help meet California’s water supply needs (Department of Water Resources [DWR], 2009). The act set a statewide goal to recycle 700,000 acre-feet per year (AFY) by the year 2000 and 1 million AFY by 2010. Although these goals were not met, they set the foundation for recycled water in California.
According to the California Department of Water Resources, the Department of Public Health (CDPH) adopted water recycling criteria which are based on water source and quality, and specify sufficient treatment based on intended use and human exposure. These criteria are regulated by the Regional Water Quality Control Boards (Regional Water Boards) through permits specifying wastewater treatment methods, approved uses of recycled water and performance standards (DWR, 2009). The objectives of the criteria are to remove pathogens and excess nutrients through enhanced treatment, making the water clean and safe for the intended uses.
Recycled water in California is most commonly used for groundwater recharge or for landscape or irrigation purposes and industrial processes. It has been identified that by 2020, more than 2.5 BGD will be generated annually by California’s urban coastal areas, and much of this could be recycled (Wolff et al., 2004). While the state is only recycling about 500,000 AFY, the Department of Water Resources has set a goal of 1.5 million AFY by 2020 and 2.5 million AFY by 2030 (DWR, 2009). To meet these goals, numerous projects are being funded at the federal (Bureau of Reclamation), state ($1.25 billion through the Safe, Clean and Reliable Drinking Water Act of 2010) and local (Metropolitan Water District and others) levels. The State Water Resources Control Board issued a mandate to increase wastewater reuse levels from 2009 by 200,000 AFY in 2020 and by an additional 300,000 AFY in 2030.
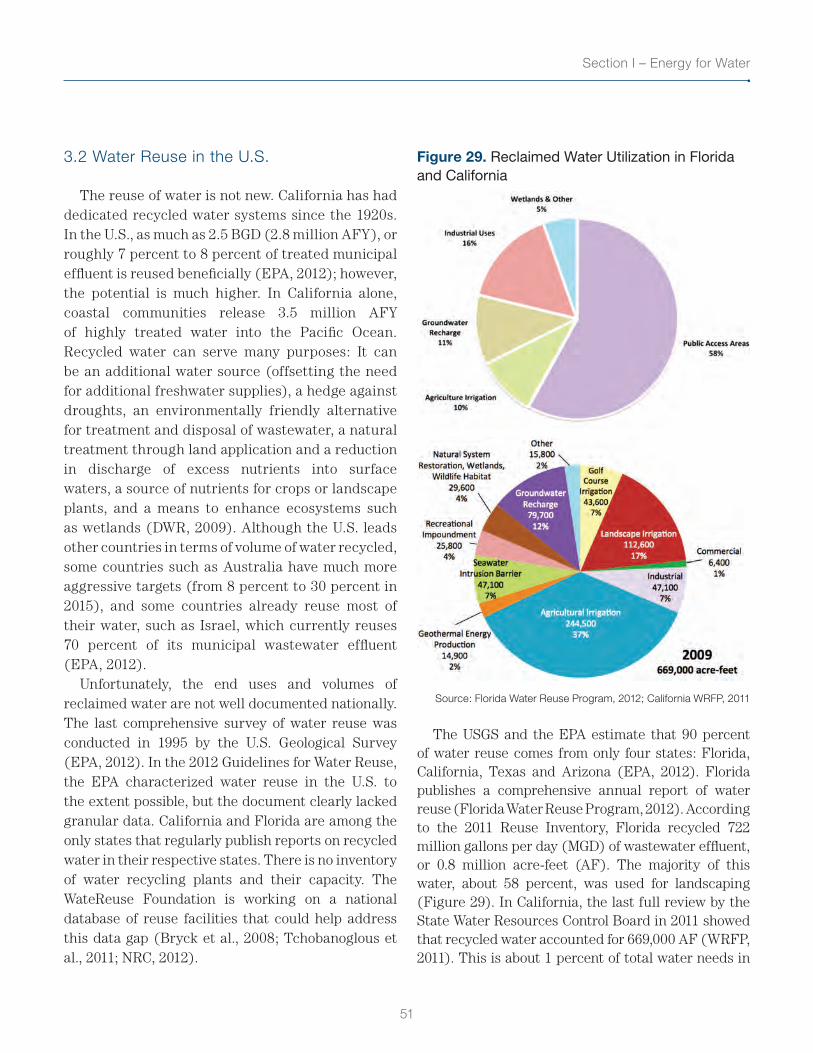
51
Section I – Energy for Water
3.2 Water Reuse in the U.S.
The reuse of water is not new. California has had dedicated recycled water systems since the 1920s. In the U.S., as much as 2.5 BGD (2.8 million AFY), or roughly 7 percent to 8 percent of treated municipal effluent is reused beneficially (EPA, 2012); however, the potential is much higher. In California alone, coastal communities release 3.5 million AFY of highly treated water into the Pacific Ocean. Recycled water can serve many purposes: It can be an additional water source (offsetting the need for additional freshwater supplies), a hedge against droughts, an environmentally friendly alternative for treatment and disposal of wastewater, a natural treatment through land application and a reduction in discharge of excess nutrients into surface waters, a source of nutrients for crops or landscape plants, and a means to enhance ecosystems such as wetlands (DWR, 2009). Although the U.S. leads other countries in terms of volume of water recycled, some countries such as Australia have much more aggressive targets (from 8 percent to 30 percent in 2015), and some countries already reuse most of their water, such as Israel, which currently reuses 70 percent of its municipal wastewater effluent (EPA, 2012).
Unfortunately, the end uses and volumes of reclaimed water are not well documented nationally. The last comprehensive survey of water reuse was conducted in 1995 by the U.S. Geological Survey (EPA, 2012). In the 2012 Guidelines for Water Reuse, the EPA characterized water reuse in the U.S. to the extent possible, but the document clearly lacked granular data. California and Florida are among the only states that regularly publish reports on recycled water in their respective states. There is no inventory of water recycling plants and their capacity. The WateReuse Foundation is working on a national database of reuse facilities that could help address this data gap (Bryck et al., 2008; Tchobanoglous et al., 2011; NRC, 2012).
Figure 29. Reclaimed Water Utilization in Florida and California
Source: Florida Water Reuse Program, 2012; California WRFP, 2011
The USGS and the EPA estimate that 90 percent of water reuse comes from only four states: Florida, California, Texas and Arizona (EPA, 2012). Florida publishes a comprehensive annual report of water reuse (Florida Water Reuse Program, 2012). According to the 2011 Reuse Inventory, Florida recycled 722 million gallons per day (MGD) of wastewater effluent, or 0.8 million acre-feet (AF). The majority of this water, about 58 percent, was used for landscaping (Figure 29). In California, the last full review by the State Water Resources Control Board in 2011 showed that recycled water accounted for 669,000 AF (WRFP, 2011). This is about 1 percent of total water needs in
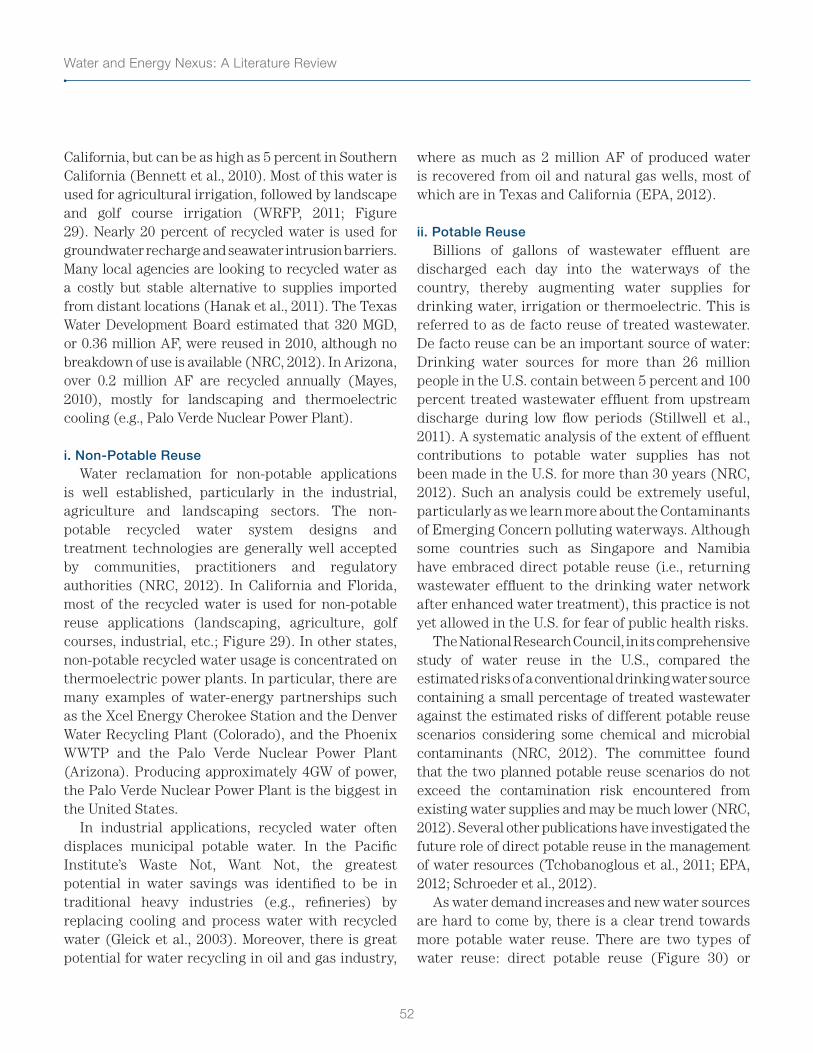
Water and Energy Nexus: A Literature Review
52
California, but can be as high as 5 percent in Southern California (Bennett et al., 2010). Most of this water is used for agricultural irrigation, followed by landscape and golf course irrigation (WRFP, 2011; Figure 29). Nearly 20 percent of recycled water is used for groundwater recharge and seawater intrusion barriers. Many local agencies are looking to recycled water as a costly but stable alternative to supplies imported from distant locations (Hanak et al., 2011). The Texas Water Development Board estimated that 320 MGD, or 0.36 million AF, were reused in 2010, although no breakdown of use is available (NRC, 2012). In Arizona, over 0.2 million AF are recycled annually (Mayes, 2010), mostly for landscaping and thermoelectric cooling (e.g., Palo Verde Nuclear Power Plant).
i. Non-Potable ReuseWater reclamation for non-potable applications
is well established, particularly in the industrial, agriculture and landscaping sectors. The non-potable recycled water system designs and treatment technologies are generally well accepted by communities, practitioners and regulatory authorities (NRC, 2012). In California and Florida, most of the recycled water is used for non-potable reuse applications (landscaping, agriculture, golf courses, industrial, etc.; Figure 29). In other states, non-potable recycled water usage is concentrated on thermoelectric power plants. In particular, there are many examples of water-energy partnerships such as the Xcel Energy Cherokee Station and the Denver Water Recycling Plant (Colorado), and the Phoenix WWTP and the Palo Verde Nuclear Power Plant (Arizona). Producing approximately 4GW of power, the Palo Verde Nuclear Power Plant is the biggest in the United States.
In industrial applications, recycled water often displaces municipal potable water. In the Pacific Institute’s Waste Not, Want Not, the greatest potential in water savings was identified to be in traditional heavy industries (e.g., refineries) by replacing cooling and process water with recycled water (Gleick et al., 2003). Moreover, there is great potential for water recycling in oil and gas industry,
where as much as 2 million AF of produced water is recovered from oil and natural gas wells, most of which are in Texas and California (EPA, 2012).
ii. Potable ReuseBillions of gallons of wastewater effluent are
discharged each day into the waterways of the country, thereby augmenting water supplies for drinking water, irrigation or thermoelectric. This is referred to as de facto reuse of treated wastewater. De facto reuse can be an important source of water: Drinking water sources for more than 26 million people in the U.S. contain between 5 percent and 100 percent treated wastewater effluent from upstream discharge during low flow periods (Stillwell et al., 2011). A systematic analysis of the extent of effluent contributions to potable water supplies has not been made in the U.S. for more than 30 years (NRC, 2012). Such an analysis could be extremely useful, particularly as we learn more about the Contaminants of Emerging Concern polluting waterways. Although some countries such as Singapore and Namibia have embraced direct potable reuse (i.e., returning wastewater effluent to the drinking water network after enhanced water treatment), this practice is not yet allowed in the U.S. for fear of public health risks.
The National Research Council, in its comprehensive study of water reuse in the U.S., compared the estimated risks of a conventional drinking water source containing a small percentage of treated wastewater against the estimated risks of different potable reuse scenarios considering some chemical and microbial contaminants (NRC, 2012). The committee found that the two planned potable reuse scenarios do not exceed the contamination risk encountered from existing water supplies and may be much lower (NRC, 2012). Several other publications have investigated the future role of direct potable reuse in the management of water resources (Tchobanoglous et al., 2011; EPA, 2012; Schroeder et al., 2012).
As water demand increases and new water sources are hard to come by, there is a clear trend towards more potable water reuse. There are two types of water reuse: direct potable reuse (Figure 30) or
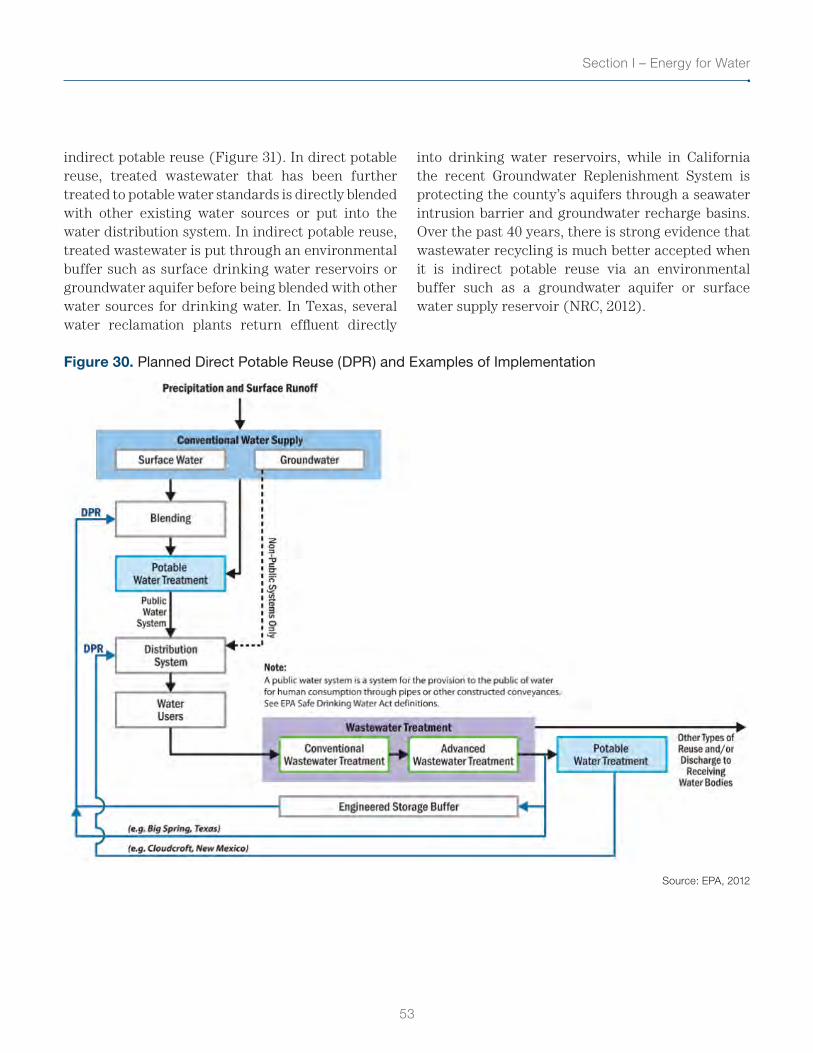
53
Section I – Energy for Water
indirect potable reuse (Figure 31). In direct potable reuse, treated wastewater that has been further treated to potable water standards is directly blended with other existing water sources or put into the water distribution system. In indirect potable reuse, treated wastewater is put through an environmental buffer such as surface drinking water reservoirs or groundwater aquifer before being blended with other water sources for drinking water. In Texas, several water reclamation plants return effluent directly
into drinking water reservoirs, while in California the recent Groundwater Replenishment System is protecting the county’s aquifers through a seawater intrusion barrier and groundwater recharge basins. Over the past 40 years, there is strong evidence that wastewater recycling is much better accepted when it is indirect potable reuse via an environmental buffer such as a groundwater aquifer or surface water supply reservoir (NRC, 2012).
Figure 30. Planned Direct Potable Reuse (DPR) and Examples of Implementation
Source: EPA, 2012
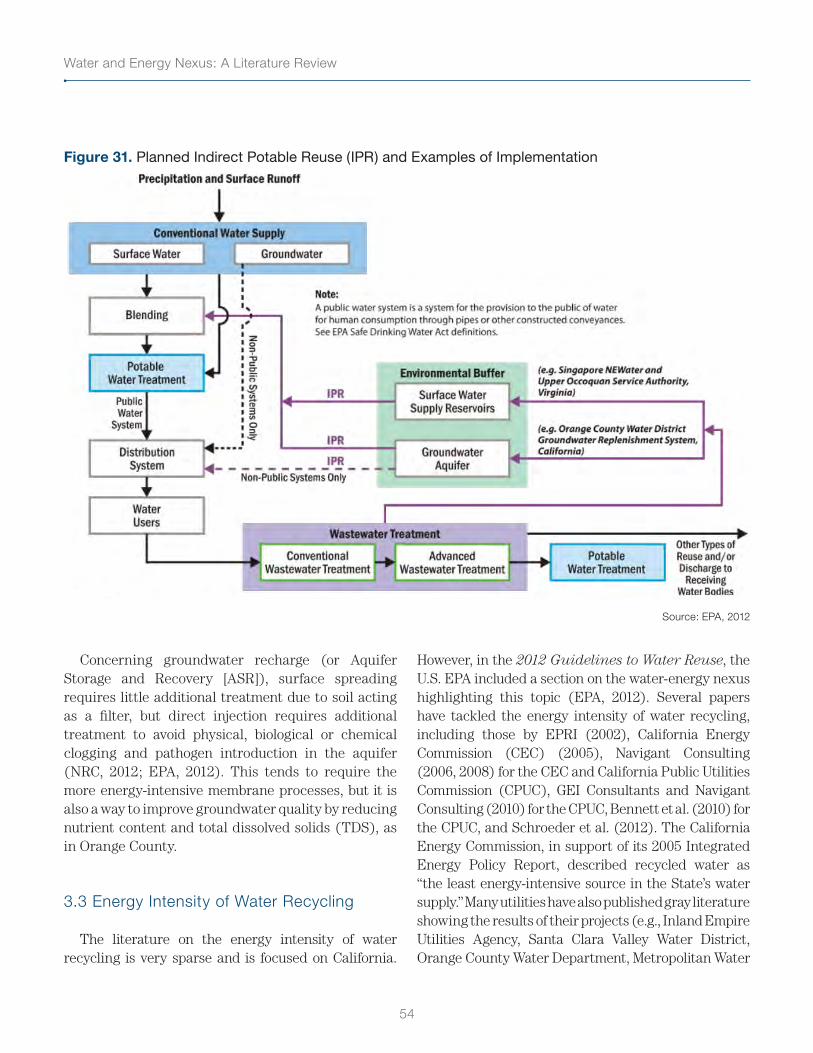
Water and Energy Nexus: A Literature Review
54
Figure 31. Planned Indirect Potable Reuse (IPR) and Examples of Implementation
Source: EPA, 2012
Concerning groundwater recharge (or Aquifer Storage and Recovery [ASR]), surface spreading requires little additional treatment due to soil acting as a filter, but direct injection requires additional treatment to avoid physical, biological or chemical clogging and pathogen introduction in the aquifer (NRC, 2012; EPA, 2012). This tends to require the more energy-intensive membrane processes, but it is also a way to improve groundwater quality by reducing nutrient content and total dissolved solids (TDS), as in Orange County.
3.3 Energy Intensity of Water Recycling
The literature on the energy intensity of water recycling is very sparse and is focused on California.
However, in the 2012 Guidelines to Water Reuse, the U.S. EPA included a section on the water-energy nexus highlighting this topic (EPA, 2012). Several papers have tackled the energy intensity of water recycling, including those by EPRI (2002), California Energy Commission (CEC) (2005), Navigant Consulting (2006, 2008) for the CEC and California Public Utilities Commission (CPUC), GEI Consultants and Navigant Consulting (2010) for the CPUC, Bennett et al. (2010) for the CPUC, and Schroeder et al. (2012). The California Energy Commission, in support of its 2005 Integrated Energy Policy Report, described recycled water as “the least energy-intensive source in the State’s water supply.” Many utilities have also published gray literature showing the results of their projects (e.g., Inland Empire Utilities Agency, Santa Clara Valley Water District, Orange County Water Department, Metropolitan Water
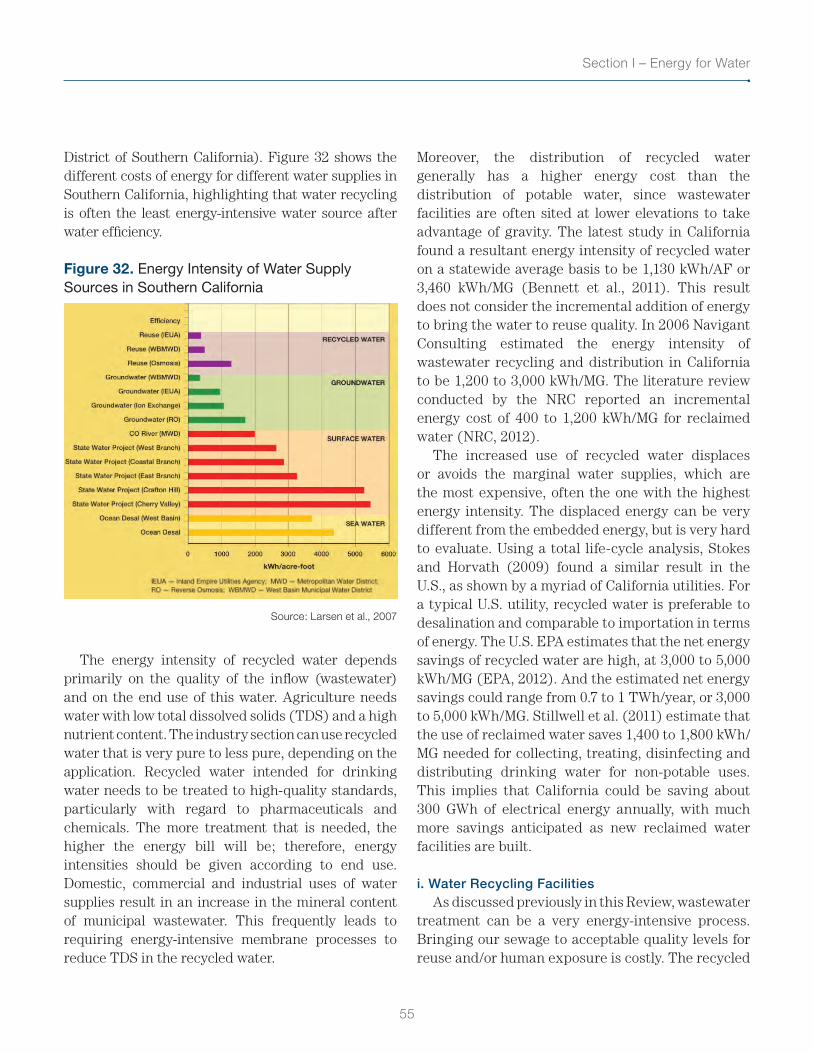
55
Section I – Energy for Water
District of Southern California). Figure 32 shows the different costs of energy for different water supplies in Southern California, highlighting that water recycling is often the least energy-intensive water source after water efficiency.
Figure 32. Energy Intensity of Water Supply Sources in Southern California
Source: Larsen et al., 2007
The energy intensity of recycled water depends primarily on the quality of the inflow (wastewater) and on the end use of this water. Agriculture needs water with low total dissolved solids (TDS) and a high nutrient content. The industry section can use recycled water that is very pure to less pure, depending on the application. Recycled water intended for drinking water needs to be treated to high-quality standards, particularly with regard to pharmaceuticals and chemicals. The more treatment that is needed, the higher the energy bill will be; therefore, energy intensities should be given according to end use. Domestic, commercial and industrial uses of water supplies result in an increase in the mineral content of municipal wastewater. This frequently leads to requiring energy-intensive membrane processes to reduce TDS in the recycled water.
Moreover, the distribution of recycled water generally has a higher energy cost than the distribution of potable water, since wastewater facilities are often sited at lower elevations to take advantage of gravity. The latest study in California found a resultant energy intensity of recycled water on a statewide average basis to be 1,130 kWh/AF or 3,460 kWh/MG (Bennett et al., 2011). This result does not consider the incremental addition of energy to bring the water to reuse quality. In 2006 Navigant Consulting estimated the energy intensity of wastewater recycling and distribution in California to be 1,200 to 3,000 kWh/MG. The literature review conducted by the NRC reported an incremental energy cost of 400 to 1,200 kWh/MG for reclaimed water (NRC, 2012).
The increased use of recycled water displaces or avoids the marginal water supplies, which are the most expensive, often the one with the highest energy intensity. The displaced energy can be very different from the embedded energy, but is very hard to evaluate. Using a total life-cycle analysis, Stokes and Horvath (2009) found a similar result in the U.S., as shown by a myriad of California utilities. For a typical U.S. utility, recycled water is preferable to desalination and comparable to importation in terms of energy. The U.S. EPA estimates that the net energy savings of recycled water are high, at 3,000 to 5,000 kWh/MG (EPA, 2012). And the estimated net energy savings could range from 0.7 to 1 TWh/year, or 3,000 to 5,000 kWh/MG. Stillwell et al. (2011) estimate that the use of reclaimed water saves 1,400 to 1,800 kWh/MG needed for collecting, treating, disinfecting and distributing drinking water for non-potable uses. This implies that California could be saving about 300 GWh of electrical energy annually, with much more savings anticipated as new reclaimed water facilities are built.
i. Water Recycling FacilitiesAs discussed previously in this Review, wastewater
treatment can be a very energy-intensive process. Bringing our sewage to acceptable quality levels for reuse and/or human exposure is costly. The recycled
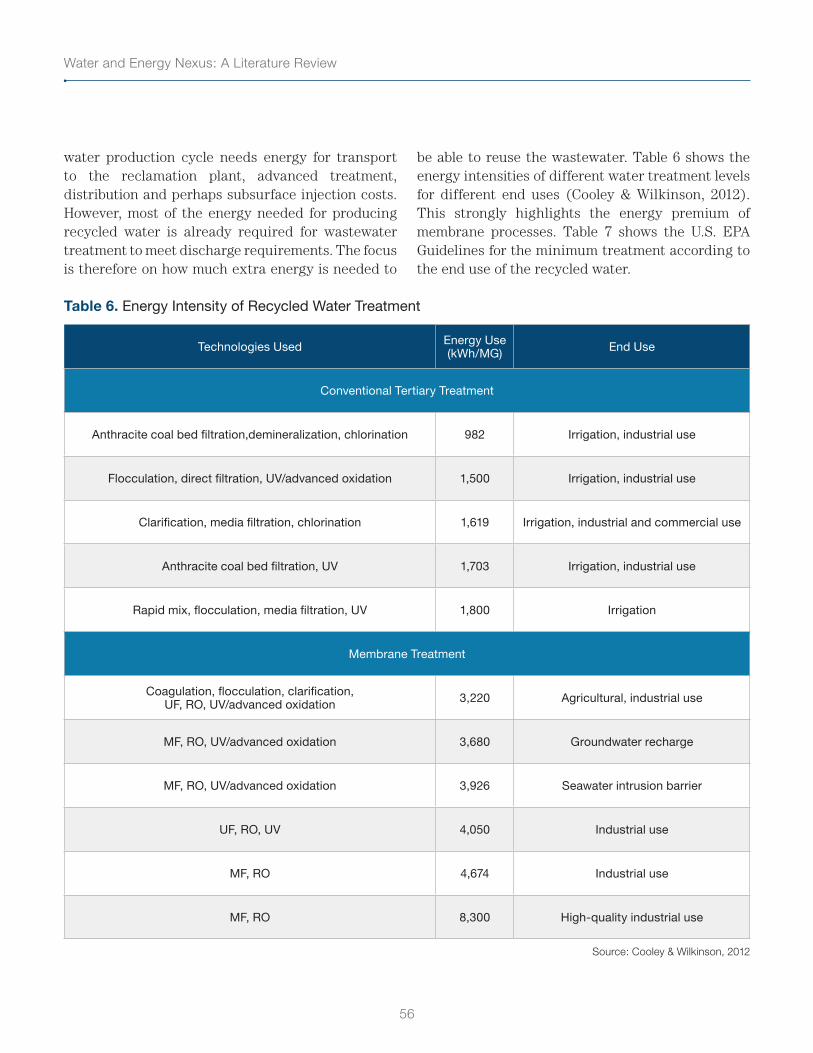
Water and Energy Nexus: A Literature Review
56
water production cycle needs energy for transport to the reclamation plant, advanced treatment, distribution and perhaps subsurface injection costs. However, most of the energy needed for producing recycled water is already required for wastewater treatment to meet discharge requirements. The focus is therefore on how much extra energy is needed to
be able to reuse the wastewater. Table 6 shows the energy intensities of different water treatment levels for different end uses (Cooley & Wilkinson, 2012). This strongly highlights the energy premium of membrane processes. Table 7 shows the U.S. EPA Guidelines for the minimum treatment according to the end use of the recycled water.
Table 6. Energy Intensity of Recycled Water Treatment
Technologies Used Energy Use (kWh/MG) End Use
Conventional Tertiary Treatment
Anthracite coal bed filtration,demineralization, chlorination 982 Irrigation, industrial use
Flocculation, direct filtration, UV/advanced oxidation 1,500 Irrigation, industrial use
Clarification, media filtration, chlorination 1,619 Irrigation, industrial and commercial use
Anthracite coal bed filtration, UV 1,703 Irrigation, industrial use
Rapid mix, flocculation, media filtration, UV 1,800 Irrigation
Membrane Treatment
Coagulation, flocculation, clarification, UF, RO, UV/advanced oxidation 3,220 Agricultural, industrial use
MF, RO, UV/advanced oxidation 3,680 Groundwater recharge
MF, RO, UV/advanced oxidation 3,926 Seawater intrusion barrier
UF, RO, UV 4,050 Industrial use
MF, RO 4,674 Industrial use
MF, RO 8,300 High-quality industrial use
Source: Cooley & Wilkinson, 2012
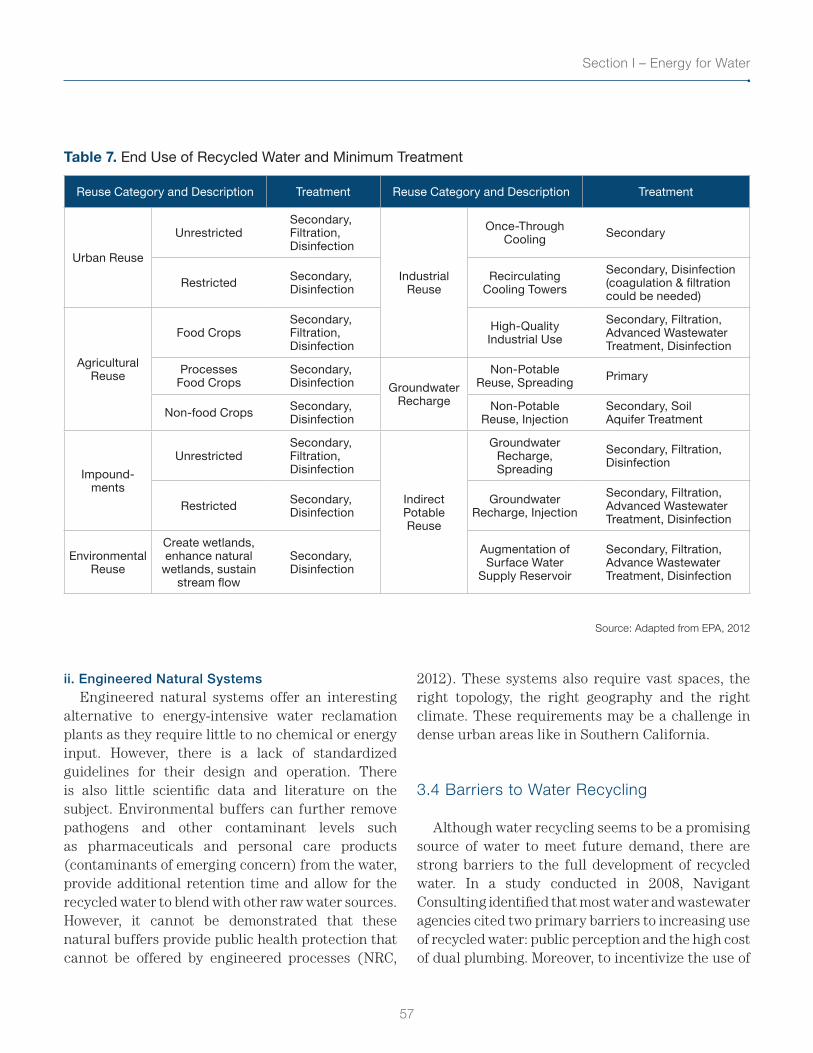
57
Section I – Energy for Water
Table 7. End Use of Recycled Water and Minimum Treatment
Reuse Category and Description Treatment Reuse Category and Description Treatment
Urban Reuse
UnrestrictedSecondary, Filtration, Disinfection
Industrial Reuse
Once-Through Cooling Secondary
Restricted Secondary, Disinfection
Recirculating Cooling Towers
Secondary, Disinfection (coagulation & filtration could be needed)
Agricultural Reuse
Food CropsSecondary, Filtration, Disinfection
High-Quality Industrial Use
Secondary, Filtration, Advanced Wastewater Treatment, Disinfection
Processes Food Crops
Secondary, Disinfection Groundwater
Recharge
Non-Potable Reuse, Spreading Primary
Non-food Crops Secondary, Disinfection
Non-Potable Reuse, Injection
Secondary, Soil Aquifer Treatment
Impound-ments
UnrestrictedSecondary, Filtration, Disinfection
Indirect Potable Reuse
Groundwater Recharge, Spreading
Secondary, Filtration, Disinfection
Restricted Secondary, Disinfection
Groundwater Recharge, Injection
Secondary, Filtration, Advanced Wastewater Treatment, Disinfection
Environmental Reuse
Create wetlands, enhance natural
wetlands, sustain stream flow
Secondary, Disinfection
Augmentation of Surface Water
Supply Reservoir
Secondary, Filtration, Advance Wastewater Treatment, Disinfection
Source: Adapted from EPA, 2012
ii. Engineered Natural Systems Engineered natural systems offer an interesting
alternative to energy-intensive water reclamation plants as they require little to no chemical or energy input. However, there is a lack of standardized guidelines for their design and operation. There is also little scientific data and literature on the subject. Environmental buffers can further remove pathogens and other contaminant levels such as pharmaceuticals and personal care products (contaminants of emerging concern) from the water, provide additional retention time and allow for the recycled water to blend with other raw water sources. However, it cannot be demonstrated that these natural buffers provide public health protection that cannot be offered by engineered processes (NRC,
2012). These systems also require vast spaces, the right topology, the right geography and the right climate. These requirements may be a challenge in dense urban areas like in Southern California.
3.4 Barriers to Water Recycling
Although water recycling seems to be a promising source of water to meet future demand, there are strong barriers to the full development of recycled water. In a study conducted in 2008, Navigant Consulting identified that most water and wastewater agencies cited two primary barriers to increasing use of recycled water: public perception and the high cost of dual plumbing. Moreover, to incentivize the use of
Water and Energy Nexus: A Literature Review
58
recycled water, current rates do not typically return the full cost of treating and delivering reclaimed water to customers (NRC, 2012).
Development and use of recycled water will require significant capital investments, both for water utilities and customers. To offset these capital costs, water and wastewater agencies could be compensated through incentives equivalent to the avoided cost of energy and of water. Customers would also bear the burden of dual plumbing, retrofits being much more expensive than dual plumbing in new buildings. Therefore, it is to be expected that most of the development of recycled water will come from the new construction. For example, on the Stanford University campus, all new buildings are connected to a network of purple recycled water pipes. The Navigant Consulting report identified that in California the high cost of dual plumbing is the major barrier to beneficially use the 90,000 AF of high-quality tertiary treated wastewater effluent currently discharged in the ocean.
The media has played and continues to play a major role in the public perception of water recycling. The “toilet-to-tap” expression, coined by opponents to water reuse, still resonates strongly. However, since the turn of the century, public dialogue about reuse has increased, particularly in areas of water scarcity, and there is greater public knowledge and acceptance about water reuse as an option. In urban areas in Florida, California, Arizona and Texas, where 90 percent of total U.S. reuse occurs, a survey in 2009 by the WateReuse Research Foundation found that two-thirds of respondents knew what recycled water is (EPA, 2012). It has also been found that the language used to describe the process and the purified water plays a major role in public acceptance.
Public involvement with water reuse projects is extremely important for its success, as research has shown that a community has a more favorable attitude toward a project as its level of familiarity with water reuse increases (USBR, 2004). Public outreach, education and involvement programs that put water reuse into perspective and promote shared decision-making help to develop public understanding.
Implementation of public information and education programs can be assisted by guidelines posted by the Bureau of Reclamation (USBR, 2004). Outreach channels can include a website, press releases, mail campaigns, tours and briefings (schools and others), cable television ads, telephone surveys, focus groups and legislative lobbying. But intensive campaigns come at a price, and can have a significant impact on the total cost of a project. Singapore has carried out a successful public awareness campaign to build a national commitment to water reuse. There, the NeWater project is now operational, effectively blending ultra-pure treated wastewater into the drinking water supply.
4. Water Discharge
The Clean Water Act governs the discharge of pollutants into the waters in the United States Industrial and municipal WWTP facilities, ensuring that it complies with the National Pollutant Discharge Elimination System (NPDES) that governs the amount of pollutants that facilities are allowed to discharge.
In 2000 Congress amended the Clean Water Act to require permits for discharges from combined sewers (which transport both wastewater and storm water) to WWTPs (GAO, 2011). This was a means to match the EPA’s Combined Sewer Overflow Control Policy, which requires facilities to implement certain minimum pollution control practices. Combined sewers are prone to overflow during heavy precipitation, resulting in the uncontrolled discharge of untreated sewage into receiving water bodies. A report by the CBO (2002) identified that $50.6 billion was needed to correct problems with sewer systems that combine storm runoff with wastewater. The EPA (2010a) estimated that $63.6 billion was needed for combined sewer overflow and $42.3 billion was needed for urban storm water management.
The EPA has identified sanitary sewer overflows (SSOs) and combined sewer overflows as a major environmental problem, contaminating waters and
59
Section I – Energy for Water
causing serious water quality problems, and it is looking for means to reduce them (EPA, 2004; NRC, 2008). The EPA estimates that there are at least 23,000 to 75,000 SSOs per year (not including sewage backups into buildings). These types of discharges have a variety of causes, including blockages, line breaks, sewer defects that allow storm water and groundwater to overload the system, lapses in sewer system operation and maintenance, power failures, inadequate sewer design and vandalism.
5. Conclusion
The two major studies cited regularly in the literature were conducted by EPRI (2002) and Burton (1996). There are concerns that these studies are outdated and do not reflect the stricter treatment processes implemented over the last decade. This suggests that they underestimate the energy needed to treat water (GAO, 2011). Moreover, these studies only investigated the electricity requirements of WWTPs and did not investigate other energy needs such as natural gas, which can be significant (Park & Bower, 2012). Several new energy-intensive advance treatment processes and technologies are being deployed in the water and wastewater utility sector and there are needs to investigate possibilities to reduce their energy footprint.
There is also a need to identify and optimize existing policies, practices and perceptions to lower energy consumption associated with conveyance, treatment, distribution, use and reclamation of water and wastewater. In addition, development of energy optimization policies and practices should be continued. A knowledge gap exists in understanding how to engage operators and managers in the energy savings potential of new energy optimization technologies and practices.
The potential for decentralization of wastewater treatment to generate energy savings or costs is little understood. Investigating the potential benefits and limitations of decentralizing wastewater treatment would benefit the research and discourse in this field.

Water and Energy Nexus: A Literature Review
60
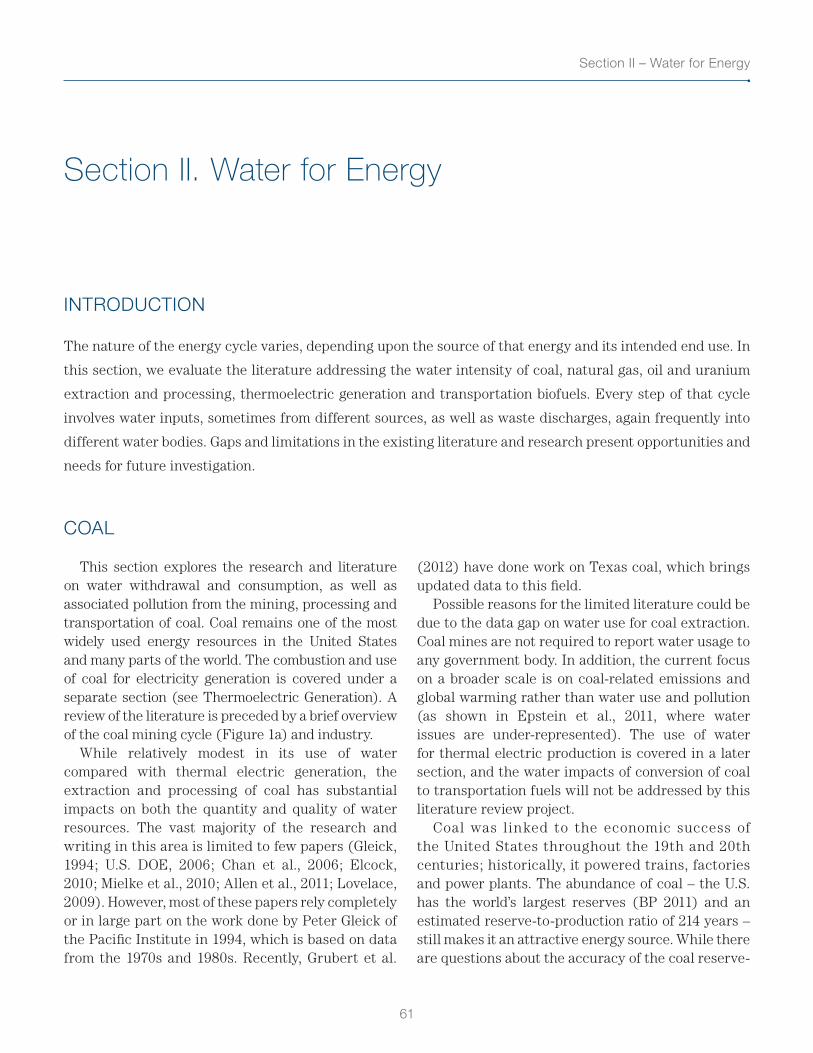
61
Section II – Water for Energy
Section II. Water for Energy
INTRODUCTION
The nature of the energy cycle varies, depending upon the source of that energy and its intended end use. In
this section, we evaluate the literature addressing the water intensity of coal, natural gas, oil and uranium
extraction and processing, thermoelectric generation and transportation biofuels. Every step of that cycle
involves water inputs, sometimes from different sources, as well as waste discharges, again frequently into
different water bodies. Gaps and limitations in the existing literature and research present opportunities and
needs for future investigation.
COAL
This section explores the research and literature on water withdrawal and consumption, as well as associated pollution from the mining, processing and transportation of coal. Coal remains one of the most widely used energy resources in the United States and many parts of the world. The combustion and use of coal for electricity generation is covered under a separate section (see Thermoelectric Generation). A review of the literature is preceded by a brief overview of the coal mining cycle (Figure 1a) and industry.
While relatively modest in its use of water compared with thermal electric generation, the extraction and processing of coal has substantial impacts on both the quantity and quality of water resources. The vast majority of the research and writing in this area is limited to few papers (Gleick, 1994; U.S. DOE, 2006; Chan et al., 2006; Elcock, 2010; Mielke et al., 2010; Allen et al., 2011; Lovelace, 2009). However, most of these papers rely completely or in large part on the work done by Peter Gleick of the Pacific Institute in 1994, which is based on data from the 1970s and 1980s. Recently, Grubert et al.
(2012) have done work on Texas coal, which brings updated data to this field.
Possible reasons for the limited literature could be due to the data gap on water use for coal extraction. Coal mines are not required to report water usage to any government body. In addition, the current focus on a broader scale is on coal-related emissions and global warming rather than water use and pollution (as shown in Epstein et al., 2011, where water issues are under-represented). The use of water for thermal electric production is covered in a later section, and the water impacts of conversion of coal to transportation fuels will not be addressed by this literature review project.
Coal was l inked to the economic success of the United States throughout the 19th and 20th centuries; historically, it powered trains, factories and power plants. The abundance of coal – the U.S. has the world’s largest reserves (BP 2011) and an estimated reserve-to-production ratio of 214 years – still makes it an attractive energy source. While there are questions about the accuracy of the coal reserve-
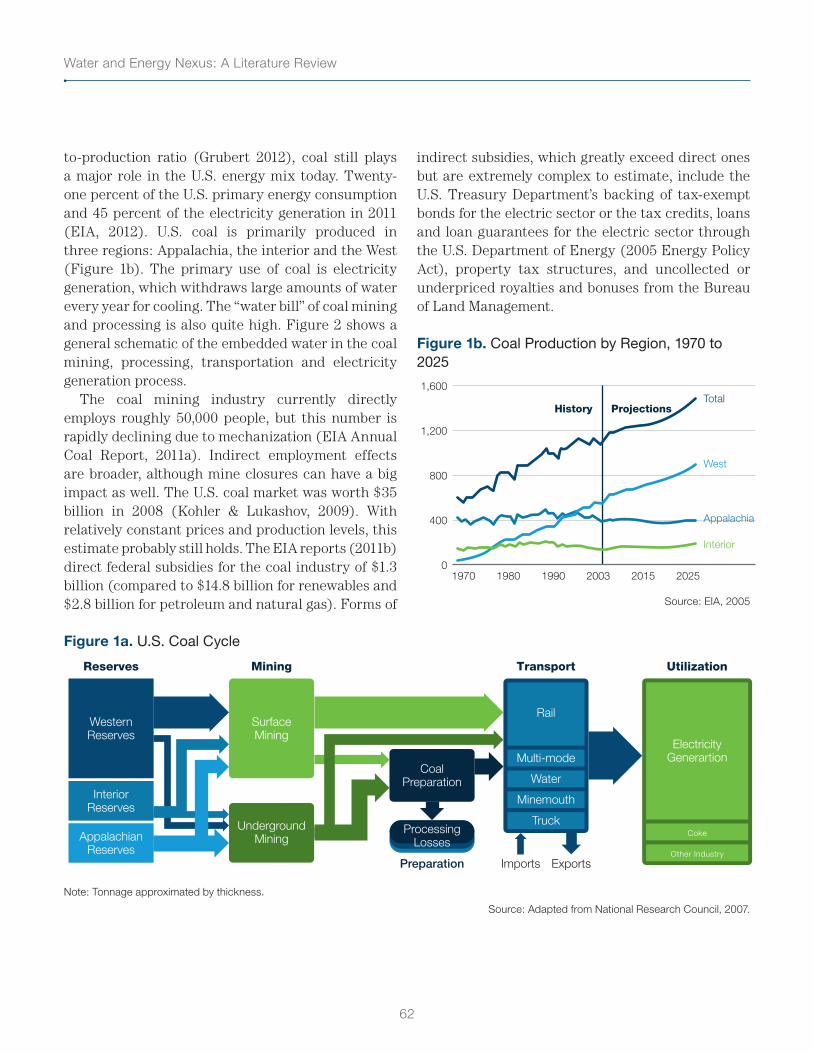
Water and Energy Nexus: A Literature Review
62
to-production ratio (Grubert 2012), coal still plays a major role in the U.S. energy mix today. Twenty-one percent of the U.S. primary energy consumption and 45 percent of the electricity generation in 2011 (EIA, 2012). U.S. coal is primarily produced in three regions: Appalachia, the interior and the West (Figure 1b). The primary use of coal is electricity generation, which withdraws large amounts of water every year for cooling. The “water bill” of coal mining and processing is also quite high. Figure 2 shows a general schematic of the embedded water in the coal mining, processing, transportation and electricity generation process.
The coal mining industry currently directly employs roughly 50,000 people, but this number is rapidly declining due to mechanization (EIA Annual Coal Report, 2011a). Indirect employment effects are broader, although mine closures can have a big impact as well. The U.S. coal market was worth $35 billion in 2008 (Kohler & Lukashov, 2009). With relatively constant prices and production levels, this estimate probably still holds. The EIA reports (2011b) direct federal subsidies for the coal industry of $1.3 billion (compared to $14.8 billion for renewables and $2.8 billion for petroleum and natural gas). Forms of
indirect subsidies, which greatly exceed direct ones but are extremely complex to estimate, include the U.S. Treasury Department’s backing of tax-exempt bonds for the electric sector or the tax credits, loans and loan guarantees for the electric sector through the U.S. Department of Energy (2005 Energy Policy Act), property tax structures, and uncollected or underpriced royalties and bonuses from the Bureau of Land Management.
Figure 1b. Coal Production by Region, 1970 to 2025
01970 1980 1990 2003 2015 2025
400
800
1,200
1,600Total
West
Appalachia
Interior
History Projections
Source: EIA, 2005
Figure 1a. U.S. Coal Cycle
WesternReserves
InteriorReserves
AppalachianReserves
Reserves Mining Transport
ProcessingLosses
Preparation
ScalesTonnage represented by thickness
Imports
75
0Operations (Mu/yr)
Exports
Utilization
SurfaceMining
UndergroundMining
CoalPreparation
Rail
Multi-mode
Water
Minemouth
TruckCoke
Other Industry
ElectricityGenerartion
16
0Reserves (GI) Flows (Mu/yr)
150
0
Note: Tonnage approximated by thickness.
Source: Adapted from National Research Council, 2007.
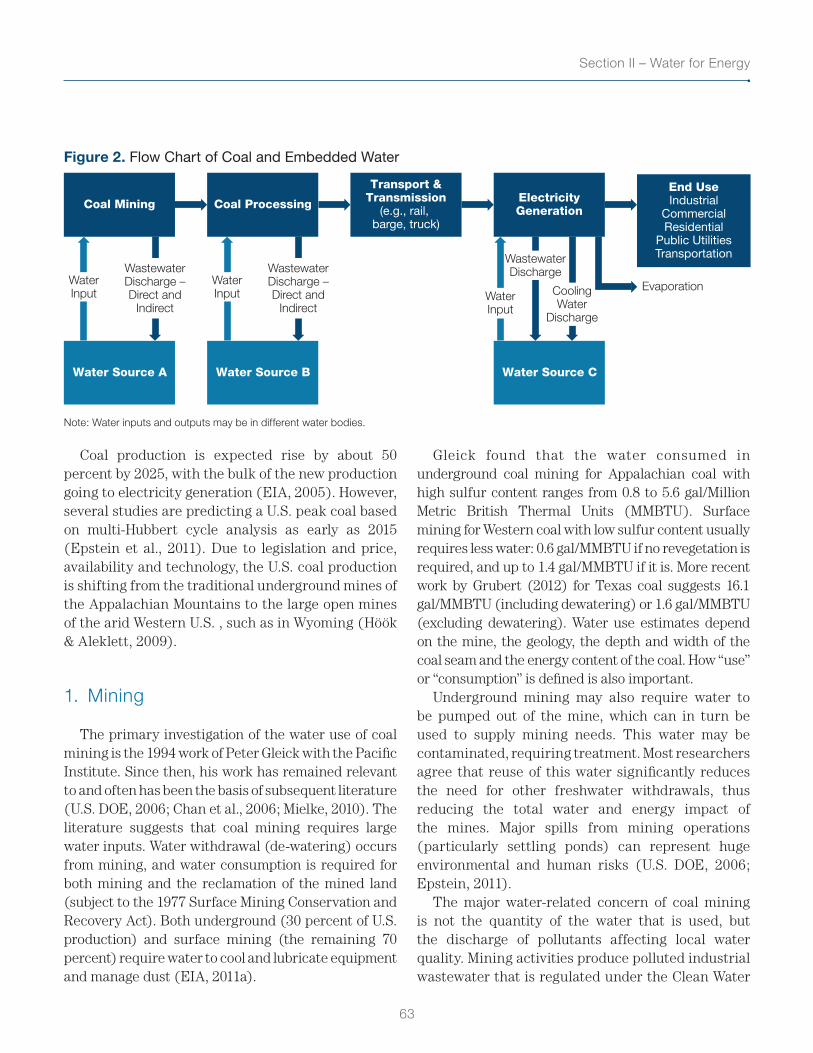
63
Section II – Water for Energy
Figure 2. Flow Chart of Coal and Embedded Water
Coal Mining
Water Source A
Coal Processing
Water Source B
Transport &Transmission
(e.g., rail, barge, truck)
End UseIndustrial
CommercialResidential
Public UtilitiesTransportation
ElectricityGeneration
Water Source C
WastewaterDischarge –Direct and
Indirect
WaterInput
WastewaterDischarge –Direct and
Indirect
WaterInput
WastewaterDischarge
CoolingWater
Discharge
EvaporationWaterInput
Note: Water inputs and outputs may be in different water bodies.
Coal production is expected rise by about 50 percent by 2025, with the bulk of the new production going to electricity generation (EIA, 2005). However, several studies are predicting a U.S. peak coal based on multi-Hubbert cycle analysis as early as 2015 (Epstein et al., 2011). Due to legislation and price, availability and technology, the U.S. coal production is shifting from the traditional underground mines of the Appalachian Mountains to the large open mines of the arid Western U.S. , such as in Wyoming (Höök & Aleklett, 2009).
1. Mining
The primary investigation of the water use of coal mining is the 1994 work of Peter Gleick with the Pacific Institute. Since then, his work has remained relevant to and often has been the basis of subsequent literature (U.S. DOE, 2006; Chan et al., 2006; Mielke, 2010). The literature suggests that coal mining requires large water inputs. Water withdrawal (de-watering) occurs from mining, and water consumption is required for both mining and the reclamation of the mined land (subject to the 1977 Surface Mining Conservation and Recovery Act). Both underground (30 percent of U.S. production) and surface mining (the remaining 70 percent) require water to cool and lubricate equipment and manage dust (EIA, 2011a).
Gleick found that the water consumed in underground coal mining for Appalachian coal with high sulfur content ranges from 0.8 to 5.6 gal/Million Metric British Thermal Units (MMBTU). Surface mining for Western coal with low sulfur content usually requires less water: 0.6 gal/MMBTU if no revegetation is required, and up to 1.4 gal/MMBTU if it is. More recent work by Grubert (2012) for Texas coal suggests 16.1 gal/MMBTU (including dewatering) or 1.6 gal/MMBTU (excluding dewatering). Water use estimates depend on the mine, the geology, the depth and width of the coal seam and the energy content of the coal. How “use” or “consumption” is defined is also important.
Underground mining may also require water to be pumped out of the mine, which can in turn be used to supply mining needs. This water may be contaminated, requiring treatment. Most researchers agree that reuse of this water significantly reduces the need for other freshwater withdrawals, thus reducing the total water and energy impact of the mines. Major spills from mining operations (particularly settling ponds) can represent huge environmental and human risks (U.S. DOE, 2006; Epstein, 2011).
The major water-related concern of coal mining is not the quantity of the water that is used, but the discharge of pollutants affecting local water quality. Mining activities produce polluted industrial wastewater that is regulated under the Clean Water
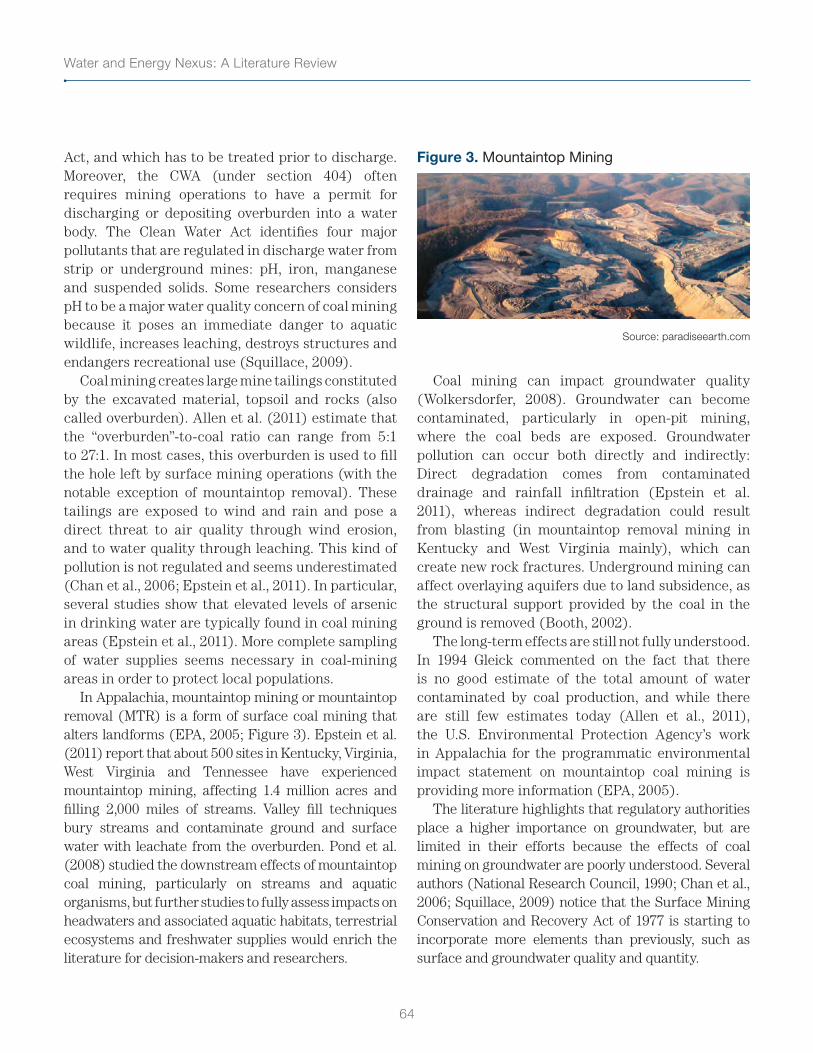
Water and Energy Nexus: A Literature Review
64
Act, and which has to be treated prior to discharge. Moreover, the CWA (under section 404) often requires mining operations to have a permit for discharging or depositing overburden into a water body. The Clean Water Act identifies four major pollutants that are regulated in discharge water from strip or underground mines: pH, iron, manganese and suspended solids. Some researchers considers pH to be a major water quality concern of coal mining because it poses an immediate danger to aquatic wildlife, increases leaching, destroys structures and endangers recreational use (Squillace, 2009).
Coal mining creates large mine tailings constituted by the excavated material, topsoil and rocks (also called overburden). Allen et al. (2011) estimate that the “overburden”-to-coal ratio can range from 5:1 to 27:1. In most cases, this overburden is used to fill the hole left by surface mining operations (with the notable exception of mountaintop removal). These tailings are exposed to wind and rain and pose a direct threat to air quality through wind erosion, and to water quality through leaching. This kind of pollution is not regulated and seems underestimated (Chan et al., 2006; Epstein et al., 2011). In particular, several studies show that elevated levels of arsenic in drinking water are typically found in coal mining areas (Epstein et al., 2011). More complete sampling of water supplies seems necessary in coal-mining areas in order to protect local populations.
In Appalachia, mountaintop mining or mountaintop removal (MTR) is a form of surface coal mining that alters landforms (EPA, 2005; Figure 3). Epstein et al. (2011) report that about 500 sites in Kentucky, Virginia, West Virginia and Tennessee have experienced mountaintop mining, affecting 1.4 million acres and filling 2,000 miles of streams. Valley fill techniques bury streams and contaminate ground and surface water with leachate from the overburden. Pond et al. (2008) studied the downstream effects of mountaintop coal mining, particularly on streams and aquatic organisms, but further studies to fully assess impacts on headwaters and associated aquatic habitats, terrestrial ecosystems and freshwater supplies would enrich the literature for decision-makers and researchers.
Figure 3. Mountaintop Mining
Source: paradiseearth.com
Coal mining can impact groundwater quality (Wolkersdorfer, 2008). Groundwater can become contaminated, particularly in open-pit mining, where the coal beds are exposed. Groundwater pollution can occur both directly and indirectly: Direct degradation comes from contaminated drainage and rainfall infiltration (Epstein et al. 2011), whereas indirect degradation could result from blasting (in mountaintop removal mining in Kentucky and West Virginia mainly), which can create new rock fractures. Underground mining can affect overlaying aquifers due to land subsidence, as the structural support provided by the coal in the ground is removed (Booth, 2002).
The long-term effects are still not fully understood. In 1994 Gleick commented on the fact that there is no good estimate of the total amount of water contaminated by coal production, and while there are still few estimates today (Allen et al., 2011), the U.S. Environmental Protection Agency’s work in Appalachia for the programmatic environmental impact statement on mountaintop coal mining is providing more information (EPA, 2005).
The literature highlights that regulatory authorities place a higher importance on groundwater, but are limited in their efforts because the effects of coal mining on groundwater are poorly understood. Several authors (National Research Council, 1990; Chan et al., 2006; Squillace, 2009) notice that the Surface Mining Conservation and Recovery Act of 1977 is starting to incorporate more elements than previously, such as surface and groundwater quality and quantity.
65
Section II – Water for Energy
2. Processing
Very little literature dwells on coal processing per se, although some studies report the recurrent environmental impacts of coal slurry spills (Epstein et al., 2011). The 1994 estimates by Gleick are still used as the reference in the literature corpus on the water intensity of coal processing.
After being excavated and crushed, coal may be washed to reduce sulfur content (pursuant to the Clean Air Act), reduce the amount of ash produced and increase the heat content of the coal by removing impurities. Western coals have low sulfur contents, therefore are seldom washed, but an estimated 80 percent of Appalachian coal goes through this process (U.S. DOE, 2006). Water requirements for washing are rather high (1 to 2 gal/MMBTU, Gleick, 1994) and necessitate treatment of the wash water prior to discharge into the environment. Moreover, chemicals can also be used to enhance cleaning performances. These chemicals further degrade the quality of the water.
Coal gasification and coal-to-liquid (CTL) processes are thought by some to hold a promise for the future, particularly in reducing demand for foreign sources of oil. Both processes require large amounts of water. While commercial CTL only exists in South Africa and China (Younos et al., 2009), coal gasification is already in use in the U.S. Coal is converted into a mixture of carbon monoxide and hydrogen (syngas) by putting it under pressure and subjecting it to steam. This process requires 11 to 26 gal/MMBTU (Younos et al., 2009). Syngas can then be used in gas turbines, such as in Integrated Gasification Combined-Cycle (IGCC) power plants. Currently, only two IGCC power plants are operational (U.S. DOE website), but several others are under construction or planned.
3. Transportation
Even though coal is usually associated with rail (70 percent of coal, U.S. DOE, 2006, which represents 70 percent of U.S. rail traffic, NRC, 2010), 10 percent of the coal used in the U.S. is barged along waterways. The
U.S. DOE report (2006) and estimates by Gleick (1994) are once again the cornerstone studies for the water intensity of the transportation of coal. These studies identify the transport of coal through waterways as an energy management challenge during low flow periods along these rivers and a water management challenge due to the water cost in lock operations. The report estimates that reservoirs can lose 2 million to 10 million gallons of water for each operation.
Sulfur emission regulations, availability of coal reserves and changes in mining technology are all working together to slowly shift coal production westward toward more arid regions, even though most coal is still consumed by power plants in the East. This geographic shift increases the energetic and water intensity of coal transportation. The U.S. DOE 2006 report estimates that this shift to Western coal has corresponded to an increase of up to 12 billion gallons per year in water use.
4. Conclusion
There is no consensus around the actual water withdrawals/consumption by the coal mining industry. By looking at Lovelace (2005), the 2011 EIA Annual Coal Report (1,084.4 million short tons produced in 2010) and the results from Mielke et al. (2010), an estimate of U.S. water consumption for coal extraction (mining and processing) is 185 million gallons per day (MGD). This is the water needed for a city like Dallas, or about 1.2 million people, since the U.S. average is 150 gallons per person per day.
In a report for the DOE’s National Energy Technology Laboratory, Chan et al. (2006) estimate the freshwater withdrawals to range from 86 to 235 MGD (3 percent to 13 percent of freshwater withdrawals from the mining sector, which accounts for 2 billion gallons per day). By considering the U.S. Geological Survey (USGS) estimate that in mining operations, approximately 30 percent of the freshwater withdrawn is consumed (i.e., not reusable or discharged), coal-mining activities would account for 26 to 70 MGD in freshwater consumption. In line with this, Averyt et al. (2011), in a report for the Union of Concerned Scientists, estimate a water use of 70 to 260 MGD for the U.S. coal mining industry.
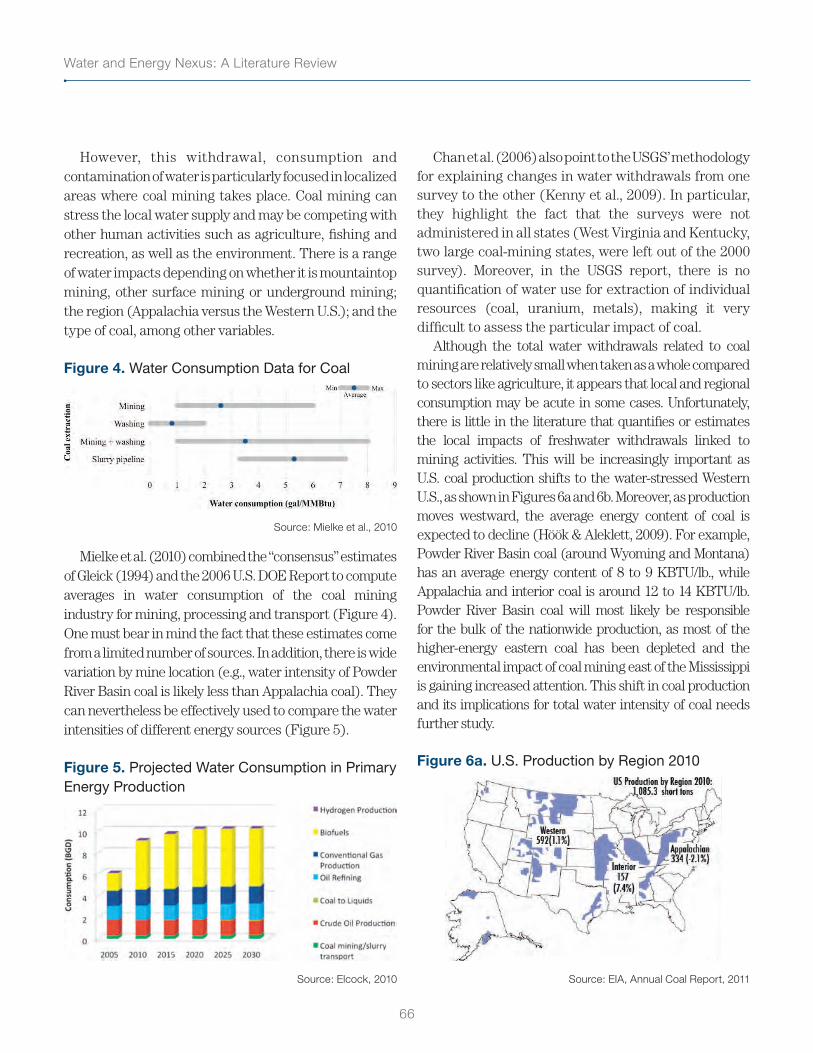
Water and Energy Nexus: A Literature Review
66
However, this withdrawal, consumption and contamination of water is particularly focused in localized areas where coal mining takes place. Coal mining can stress the local water supply and may be competing with other human activities such as agriculture, fishing and recreation, as well as the environment. There is a range of water impacts depending on whether it is mountaintop mining, other surface mining or underground mining; the region (Appalachia versus the Western U.S.); and the type of coal, among other variables.
Figure 4. Water Consumption Data for Coal
Source: Mielke et al., 2010
Mielke et al. (2010) combined the “consensus” estimates of Gleick (1994) and the 2006 U.S. DOE Report to compute averages in water consumption of the coal mining industry for mining, processing and transport (Figure 4). One must bear in mind the fact that these estimates come from a limited number of sources. In addition, there is wide variation by mine location (e.g., water intensity of Powder River Basin coal is likely less than Appalachia coal). They can nevertheless be effectively used to compare the water intensities of different energy sources (Figure 5).
Figure 5. Projected Water Consumption in Primary Energy Production
Source: Elcock, 2010
Chan et al. (2006) also point to the USGS’ methodology for explaining changes in water withdrawals from one survey to the other (Kenny et al., 2009). In particular, they highlight the fact that the surveys were not administered in all states (West Virginia and Kentucky, two large coal-mining states, were left out of the 2000 survey). Moreover, in the USGS report, there is no quantification of water use for extraction of individual resources (coal, uranium, metals), making it very difficult to assess the particular impact of coal.
Although the total water withdrawals related to coal mining are relatively small when taken as a whole compared to sectors like agriculture, it appears that local and regional consumption may be acute in some cases. Unfortunately, there is little in the literature that quantifies or estimates the local impacts of freshwater withdrawals linked to mining activities. This will be increasingly important as U.S. coal production shifts to the water-stressed Western U.S., as shown in Figures 6a and 6b. Moreover, as production moves westward, the average energy content of coal is expected to decline (Höök & Aleklett, 2009). For example, Powder River Basin coal (around Wyoming and Montana) has an average energy content of 8 to 9 KBTU/lb., while Appalachia and interior coal is around 12 to 14 KBTU/lb. Powder River Basin coal will most likely be responsible for the bulk of the nationwide production, as most of the higher-energy eastern coal has been depleted and the environmental impact of coal mining east of the Mississippi is gaining increased attention. This shift in coal production and its implications for total water intensity of coal needs further study.
Figure 6a. U.S. Production by Region 2010
Source: EIA, Annual Coal Report, 2011
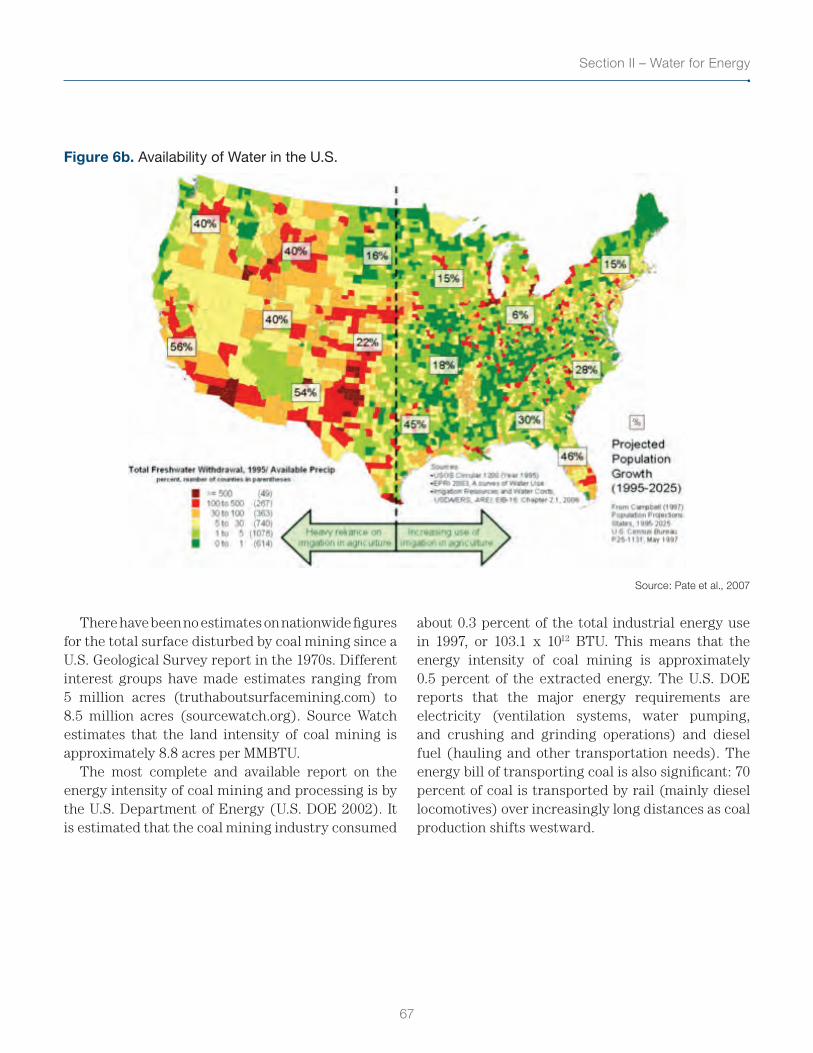
67
Section II – Water for Energy
Figure 6b. Availability of Water in the U.S.
Source: Pate et al., 2007
There have been no estimates on nationwide figures for the total surface disturbed by coal mining since a U.S. Geological Survey report in the 1970s. Different interest groups have made estimates ranging from 5 million acres (truthaboutsurfacemining.com) to 8.5 million acres (sourcewatch.org). Source Watch estimates that the land intensity of coal mining is approximately 8.8 acres per MMBTU.
The most complete and available report on the energy intensity of coal mining and processing is by the U.S. Department of Energy (U.S. DOE 2002). It is estimated that the coal mining industry consumed
about 0.3 percent of the total industrial energy use in 1997, or 103.1 x 10¹² BTU. This means that the energy intensity of coal mining is approximately 0.5 percent of the extracted energy. The U.S. DOE reports that the major energy requirements are electricity (ventilation systems, water pumping, and crushing and grinding operations) and diesel fuel (hauling and other transportation needs). The energy bill of transporting coal is also significant: 70 percent of coal is transported by rail (mainly diesel locomotives) over increasingly long distances as coal production shifts westward.
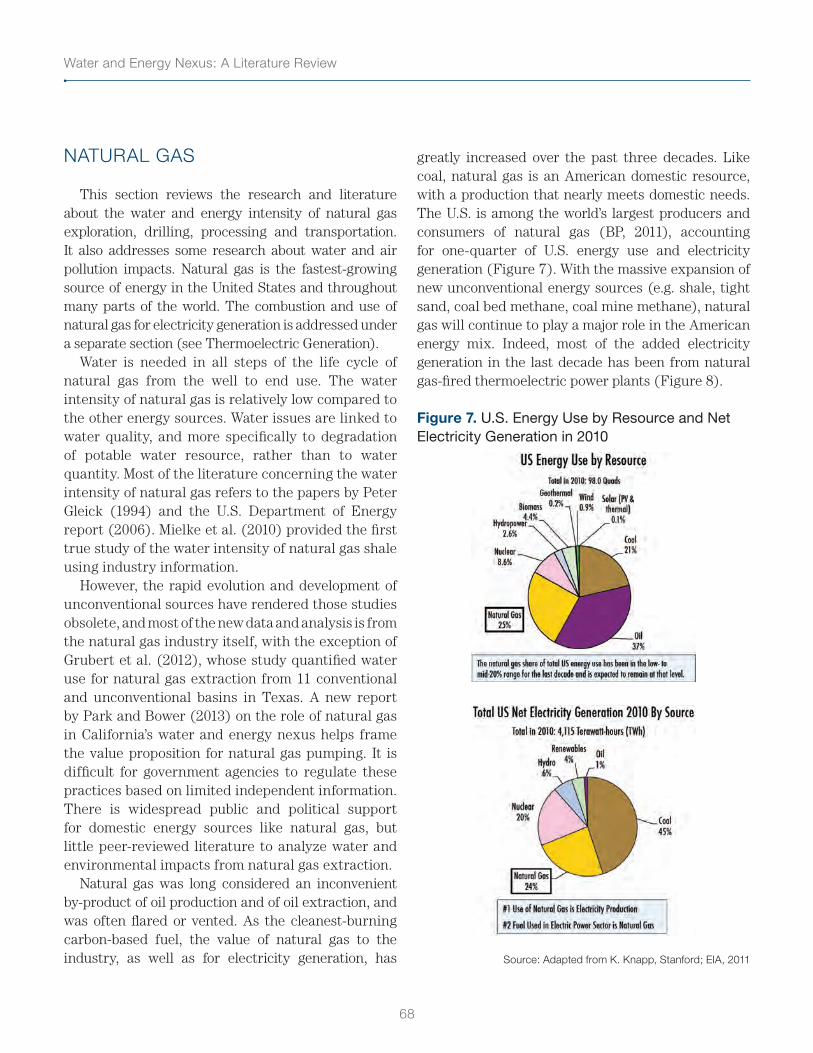
Water and Energy Nexus: A Literature Review
68
NATURAL GAS
This section reviews the research and literature about the water and energy intensity of natural gas exploration, drilling, processing and transportation. It also addresses some research about water and air pollution impacts. Natural gas is the fastest-growing source of energy in the United States and throughout many parts of the world. The combustion and use of natural gas for electricity generation is addressed under a separate section (see Thermoelectric Generation).
Water is needed in all steps of the life cycle of natural gas from the well to end use. The water intensity of natural gas is relatively low compared to the other energy sources. Water issues are linked to water quality, and more specifically to degradation of potable water resource, rather than to water quantity. Most of the literature concerning the water intensity of natural gas refers to the papers by Peter Gleick (1994) and the U.S. Department of Energy report (2006). Mielke et al. (2010) provided the first true study of the water intensity of natural gas shale using industry information.
However, the rapid evolution and development of unconventional sources have rendered those studies obsolete, and most of the new data and analysis is from the natural gas industry itself, with the exception of Grubert et al. (2012), whose study quantified water use for natural gas extraction from 11 conventional and unconventional basins in Texas. A new report by Park and Bower (2013) on the role of natural gas in California’s water and energy nexus helps frame the value proposition for natural gas pumping. It is difficult for government agencies to regulate these practices based on limited independent information. There is widespread public and political support for domestic energy sources like natural gas, but little peer-reviewed literature to analyze water and environmental impacts from natural gas extraction.
Natural gas was long considered an inconvenient by-product of oil production and of oil extraction, and was often flared or vented. As the cleanest-burning carbon-based fuel, the value of natural gas to the industry, as well as for electricity generation, has
greatly increased over the past three decades. Like coal, natural gas is an American domestic resource, with a production that nearly meets domestic needs. The U.S. is among the world’s largest producers and consumers of natural gas (BP, 2011), accounting for one-quarter of U.S. energy use and electricity generation (Figure 7). With the massive expansion of new unconventional energy sources (e.g. shale, tight sand, coal bed methane, coal mine methane), natural gas will continue to play a major role in the American energy mix. Indeed, most of the added electricity generation in the last decade has been from natural gas-fired thermoelectric power plants (Figure 8).
Figure 7. U.S. Energy Use by Resource and Net Electricity Generation in 2010
Source: Adapted from K. Knapp, Stanford; EIA, 2011
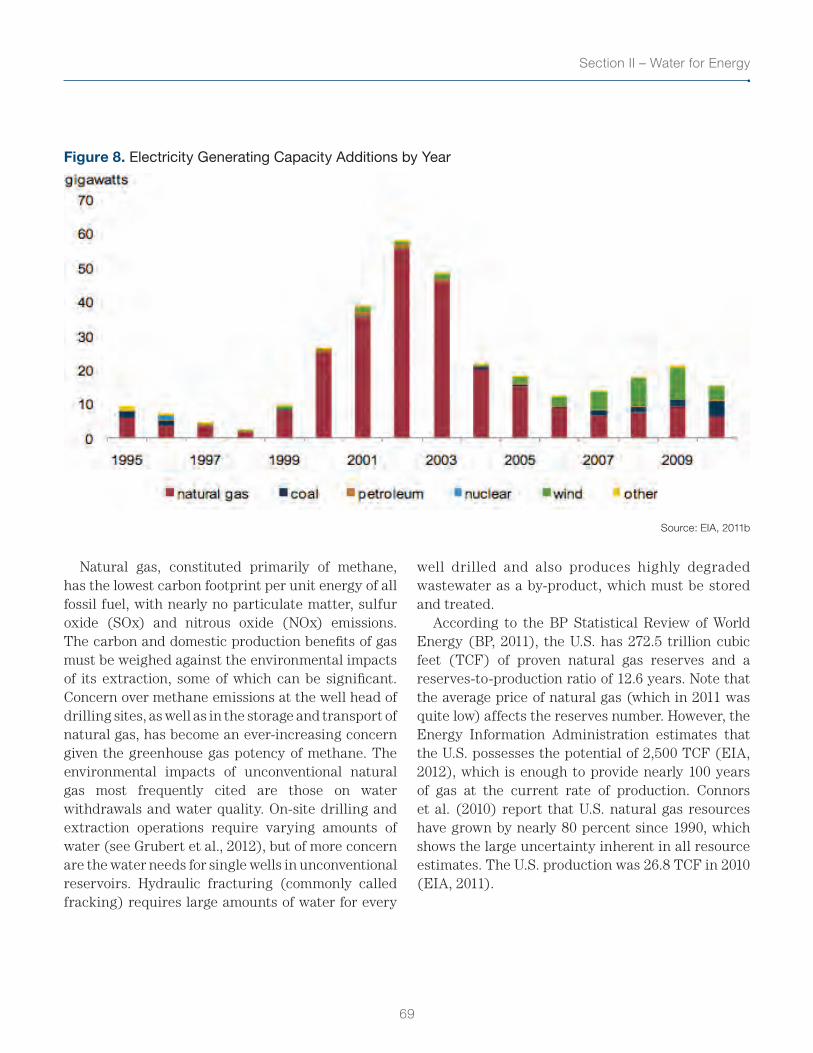
69
Section II – Water for Energy
Figure 8. Electricity Generating Capacity Additions by Year
Source: EIA, 2011b
Natural gas, constituted primarily of methane, has the lowest carbon footprint per unit energy of all fossil fuel, with nearly no particulate matter, sulfur oxide (SOx) and nitrous oxide (NOx) emissions. The carbon and domestic production benefits of gas must be weighed against the environmental impacts of its extraction, some of which can be significant. Concern over methane emissions at the well head of drilling sites, as well as in the storage and transport of natural gas, has become an ever-increasing concern given the greenhouse gas potency of methane. The environmental impacts of unconventional natural gas most frequently cited are those on water withdrawals and water quality. On-site drilling and extraction operations require varying amounts of water (see Grubert et al., 2012), but of more concern are the water needs for single wells in unconventional reservoirs. Hydraulic fracturing (commonly called fracking) requires large amounts of water for every
well drilled and also produces highly degraded wastewater as a by-product, which must be stored and treated.
According to the BP Statistical Review of World Energy (BP, 2011), the U.S. has 272.5 trillion cubic feet (TCF) of proven natural gas reserves and a reserves-to-production ratio of 12.6 years. Note that the average price of natural gas (which in 2011 was quite low) affects the reserves number. However, the Energy Information Administration estimates that the U.S. possesses the potential of 2,500 TCF (EIA, 2012), which is enough to provide nearly 100 years of gas at the current rate of production. Connors et al. (2010) report that U.S. natural gas resources have grown by nearly 80 percent since 1990, which shows the large uncertainty inherent in all resource estimates. The U.S. production was 26.8 TCF in 2010 (EIA, 2011).
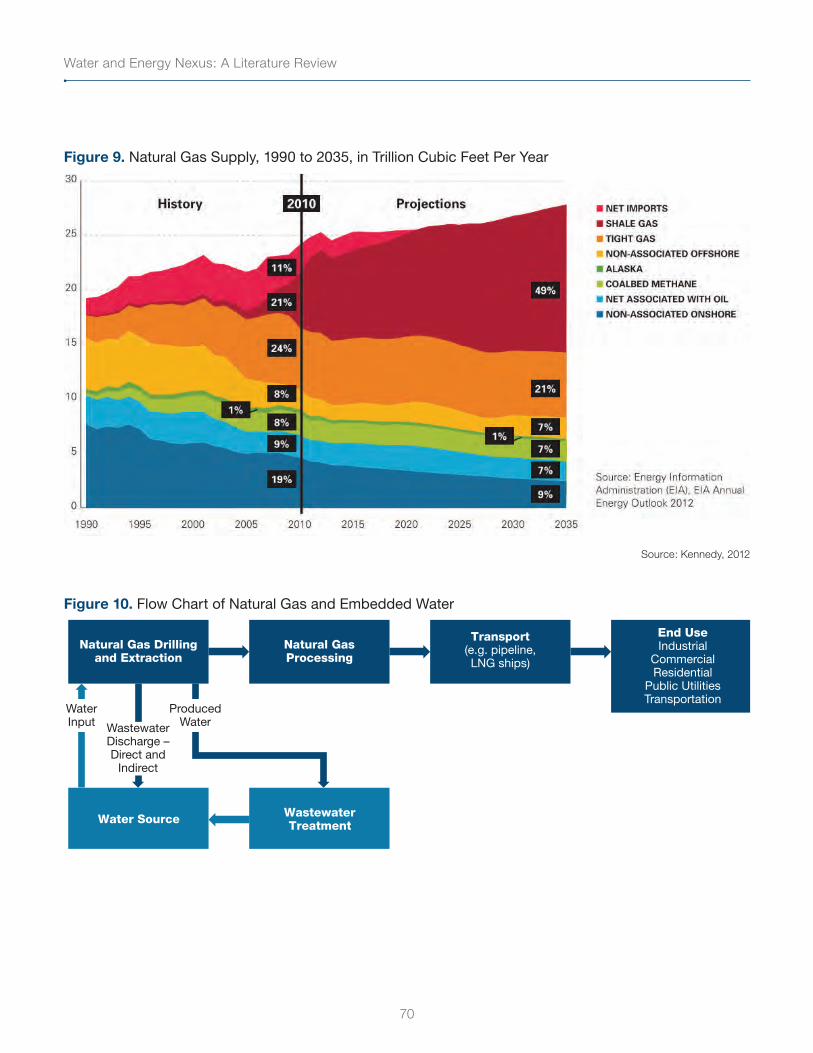
Water and Energy Nexus: A Literature Review
70
Figure 9. Natural Gas Supply, 1990 to 2035, in Trillion Cubic Feet Per Year
Source: Kennedy, 2012
Figure 10. Flow Chart of Natural Gas and Embedded Water
WastewaterTreatment
Natural Gas Drillingand Extraction
Natural GasProcessing
Transport(e.g. pipeline,LNG ships)
ProducedWater
WaterInput
Water Source
End UseIndustrial
CommercialResidential
Public UtilitiesTransportation
WastewaterDischarge –Direct and
Indirect
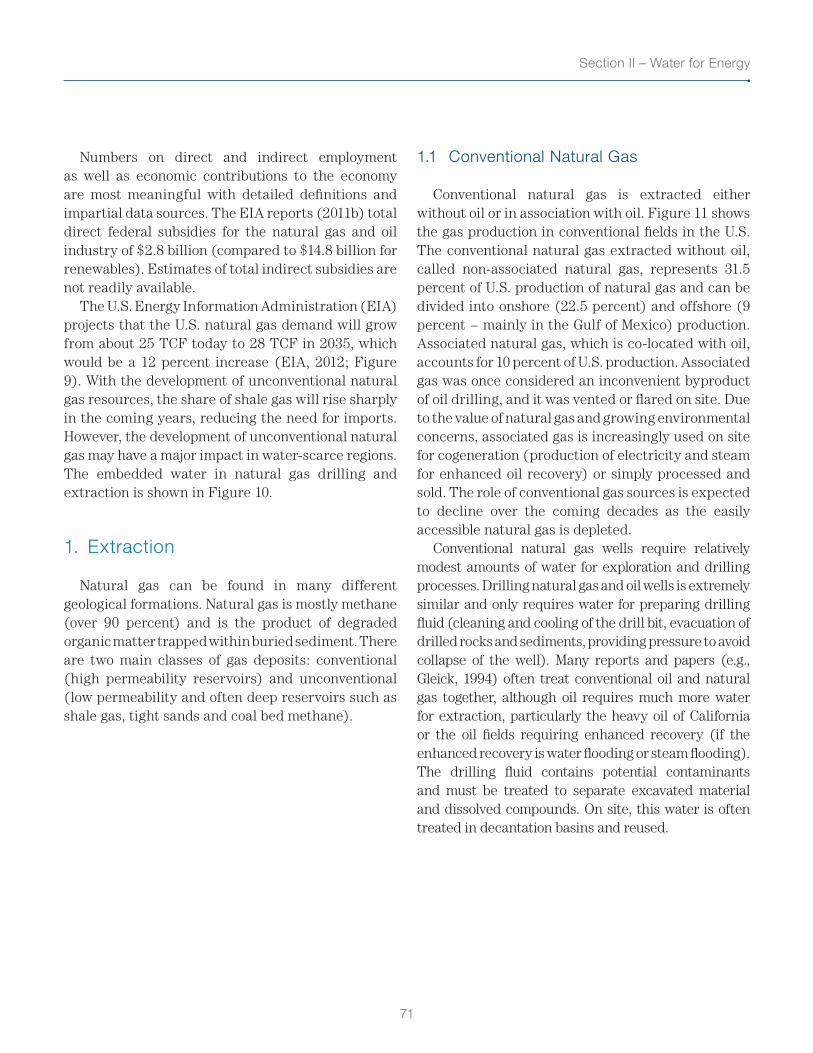
71
Section II – Water for Energy
Numbers on direct and indirect employment as well as economic contributions to the economy are most meaningful with detailed definitions and impartial data sources. The EIA reports (2011b) total direct federal subsidies for the natural gas and oil industry of $2.8 billion (compared to $14.8 billion for renewables). Estimates of total indirect subsidies are not readily available.
The U.S. Energy Information Administration (EIA) projects that the U.S. natural gas demand will grow from about 25 TCF today to 28 TCF in 2035, which would be a 12 percent increase (EIA, 2012; Figure 9). With the development of unconventional natural gas resources, the share of shale gas will rise sharply in the coming years, reducing the need for imports. However, the development of unconventional natural gas may have a major impact in water-scarce regions. The embedded water in natural gas drilling and extraction is shown in Figure 10.
1. Extraction
Natural gas can be found in many different geological formations. Natural gas is mostly methane (over 90 percent) and is the product of degraded organic matter trapped within buried sediment. There are two main classes of gas deposits: conventional (high permeability reservoirs) and unconventional (low permeability and often deep reservoirs such as shale gas, tight sands and coal bed methane).
1.1 Conventional Natural Gas
Conventional natural gas is extracted either without oil or in association with oil. Figure 11 shows the gas production in conventional fields in the U.S. The conventional natural gas extracted without oil, called non-associated natural gas, represents 31.5 percent of U.S. production of natural gas and can be divided into onshore (22.5 percent) and offshore (9 percent − mainly in the Gulf of Mexico) production. Associated natural gas, which is co-located with oil, accounts for 10 percent of U.S. production. Associated gas was once considered an inconvenient byproduct of oil drilling, and it was vented or flared on site. Due to the value of natural gas and growing environmental concerns, associated gas is increasingly used on site for cogeneration (production of electricity and steam for enhanced oil recovery) or simply processed and sold. The role of conventional gas sources is expected to decline over the coming decades as the easily accessible natural gas is depleted.
Conventional natural gas wells require relatively modest amounts of water for exploration and drilling processes. Drilling natural gas and oil wells is extremely similar and only requires water for preparing drilling fluid (cleaning and cooling of the drill bit, evacuation of drilled rocks and sediments, providing pressure to avoid collapse of the well). Many reports and papers (e.g., Gleick, 1994) often treat conventional oil and natural gas together, although oil requires much more water for extraction, particularly the heavy oil of California or the oil fields requiring enhanced recovery (if the enhanced recovery is water flooding or steam flooding). The drilling fluid contains potential contaminants and must be treated to separate excavated material and dissolved compounds. On site, this water is often treated in decantation basins and reused.
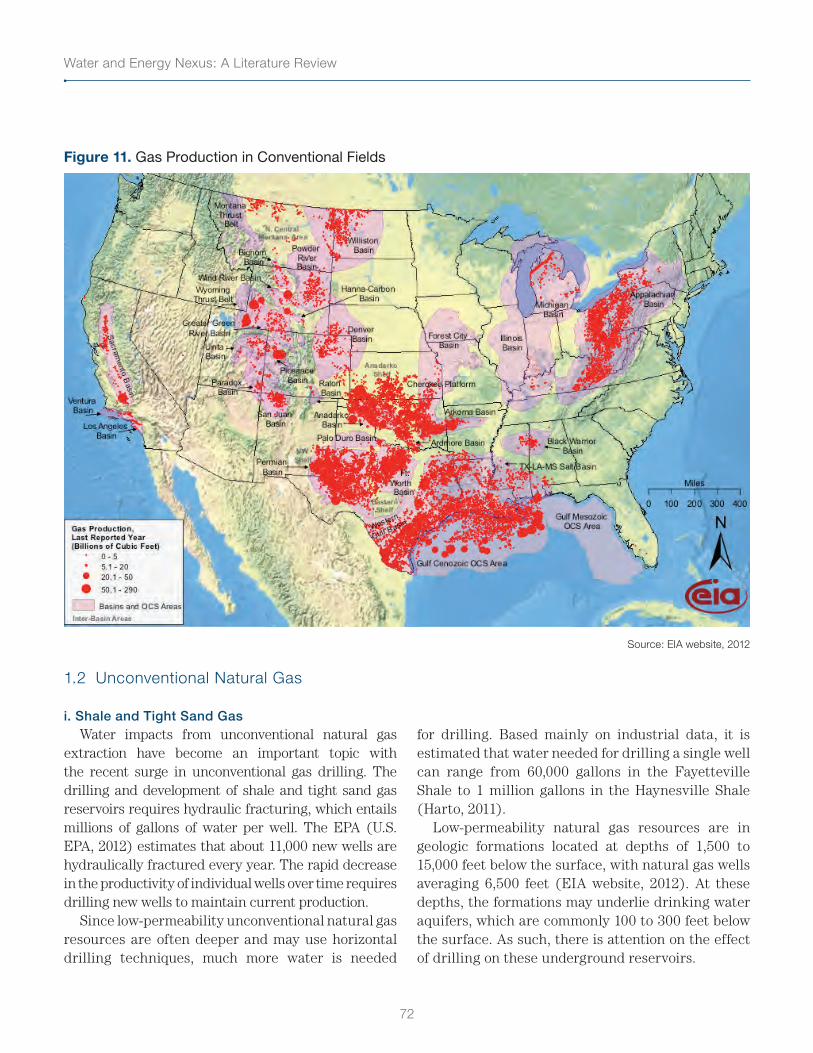
Water and Energy Nexus: A Literature Review
72
Figure 11. Gas Production in Conventional Fields
Source: EIA website, 2012
1.2 Unconventional Natural Gas
i. Shale and Tight Sand GasWater impacts from unconventional natural gas
extraction have become an important topic with the recent surge in unconventional gas drilling. The drilling and development of shale and tight sand gas reservoirs requires hydraulic fracturing, which entails millions of gallons of water per well. The EPA (U.S. EPA, 2012) estimates that about 11,000 new wells are hydraulically fractured every year. The rapid decrease in the productivity of individual wells over time requires drilling new wells to maintain current production.
Since low-permeability unconventional natural gas resources are often deeper and may use horizontal drilling techniques, much more water is needed
for drilling. Based mainly on industrial data, it is estimated that water needed for drilling a single well can range from 60,000 gallons in the Fayetteville Shale to 1 million gallons in the Haynesville Shale (Harto, 2011).
Low-permeability natural gas resources are in geologic formations located at depths of 1,500 to 15,000 feet below the surface, with natural gas wells averaging 6,500 feet (EIA website, 2012). At these depths, the formations may underlie drinking water aquifers, which are commonly 100 to 300 feet below the surface. As such, there is attention on the effect of drilling on these underground reservoirs.
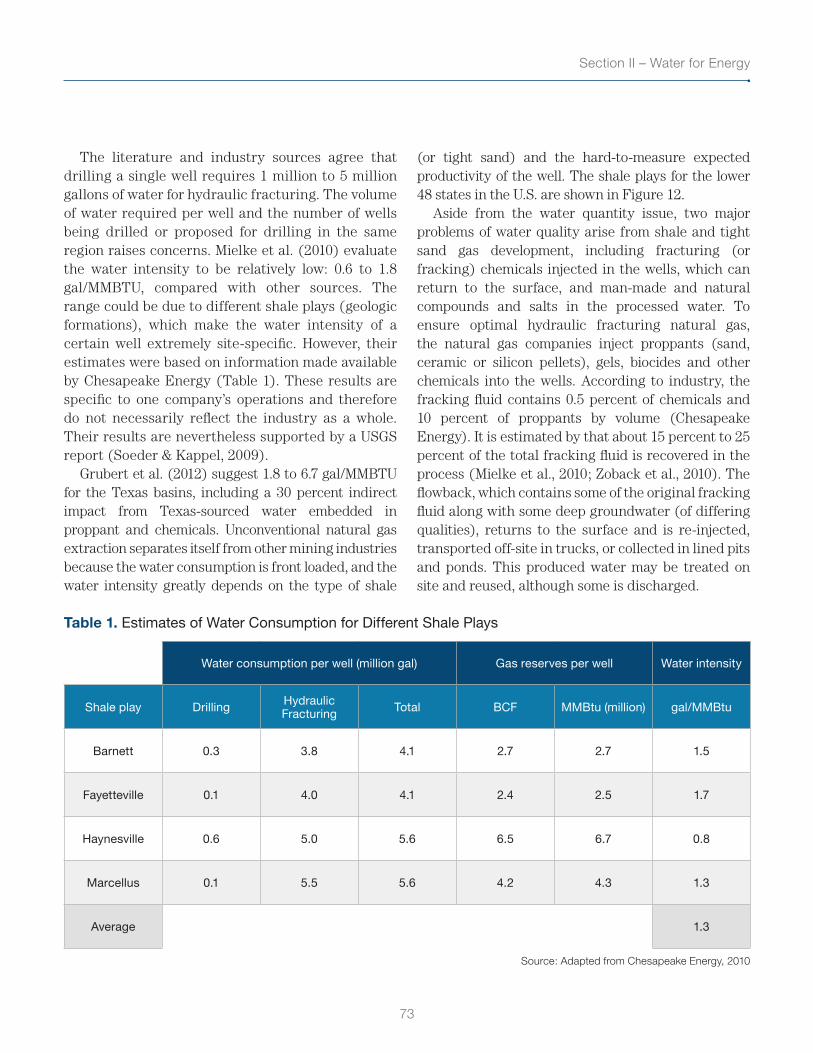
73
Section II – Water for Energy
The literature and industry sources agree that drilling a single well requires 1 million to 5 million gallons of water for hydraulic fracturing. The volume of water required per well and the number of wells being drilled or proposed for drilling in the same region raises concerns. Mielke et al. (2010) evaluate the water intensity to be relatively low: 0.6 to 1.8 gal/MMBTU, compared with other sources. The range could be due to different shale plays (geologic formations), which make the water intensity of a certain well extremely site-specific. However, their estimates were based on information made available by Chesapeake Energy (Table 1). These results are specific to one company’s operations and therefore do not necessarily reflect the industry as a whole. Their results are nevertheless supported by a USGS report (Soeder & Kappel, 2009).
Grubert et al. (2012) suggest 1.8 to 6.7 gal/MMBTU for the Texas basins, including a 30 percent indirect impact from Texas-sourced water embedded in proppant and chemicals. Unconventional natural gas extraction separates itself from other mining industries because the water consumption is front loaded, and the water intensity greatly depends on the type of shale
(or tight sand) and the hard-to-measure expected productivity of the well. The shale plays for the lower 48 states in the U.S. are shown in Figure 12.
Aside from the water quantity issue, two major problems of water quality arise from shale and tight sand gas development, including fracturing (or fracking) chemicals injected in the wells, which can return to the surface, and man-made and natural compounds and salts in the processed water. To ensure optimal hydraulic fracturing natural gas, the natural gas companies inject proppants (sand, ceramic or silicon pellets), gels, biocides and other chemicals into the wells. According to industry, the fracking fluid contains 0.5 percent of chemicals and 10 percent of proppants by volume (Chesapeake Energy). It is estimated by that about 15 percent to 25 percent of the total fracking fluid is recovered in the process (Mielke et al., 2010; Zoback et al., 2010). The flowback, which contains some of the original fracking fluid along with some deep groundwater (of differing qualities), returns to the surface and is re-injected, transported off-site in trucks, or collected in lined pits and ponds. This produced water may be treated on site and reused, although some is discharged.
Table 1. Estimates of Water Consumption for Different Shale Plays
Water consumption per well (million gal) Gas reserves per well Water intensity
Shale play Drilling Hydraulic Fracturing Total BCF MMBtu (million) gal/MMBtu
Barnett 0.3 3.8 4.1 2.7 2.7 1.5
Fayetteville 0.1 4.0 4.1 2.4 2.5 1.7
Haynesville 0.6 5.0 5.6 6.5 6.7 0.8
Marcellus 0.1 5.5 5.6 4.2 4.3 1.3
Average 1.3
Source: Adapted from Chesapeake Energy, 2010
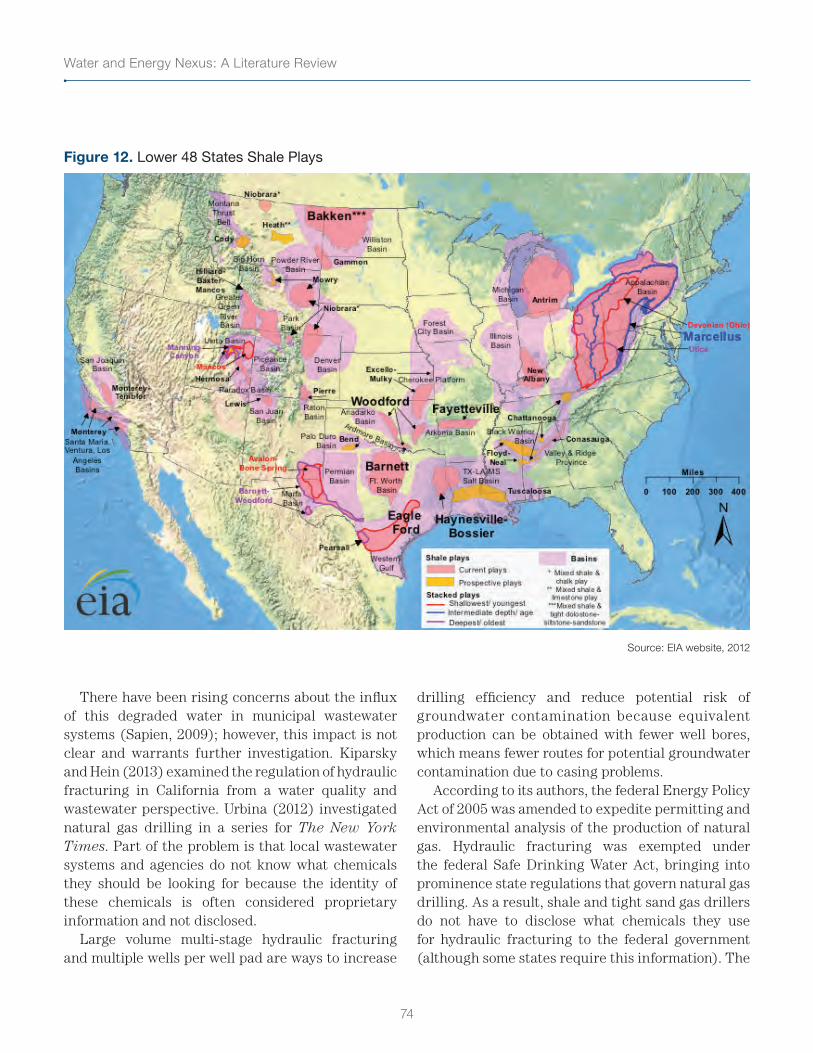
Water and Energy Nexus: A Literature Review
74
Figure 12. Lower 48 States Shale Plays
Source: EIA website, 2012
There have been rising concerns about the influx of this degraded water in municipal wastewater systems (Sapien, 2009); however, this impact is not clear and warrants further investigation. Kiparsky and Hein (2013) examined the regulation of hydraulic fracturing in California from a water quality and wastewater perspective. Urbina (2012) investigated natural gas drilling in a series for The New York Times. Part of the problem is that local wastewater systems and agencies do not know what chemicals they should be looking for because the identity of these chemicals is often considered proprietary information and not disclosed.
Large volume multi-stage hydraulic fracturing and multiple wells per well pad are ways to increase
drilling efficiency and reduce potential risk of groundwater contamination because equivalent production can be obtained with fewer well bores, which means fewer routes for potential groundwater contamination due to casing problems.
According to its authors, the federal Energy Policy Act of 2005 was amended to expedite permitting and environmental analysis of the production of natural gas. Hydraulic fracturing was exempted under the federal Safe Drinking Water Act, bringing into prominence state regulations that govern natural gas drilling. As a result, shale and tight sand gas drillers do not have to disclose what chemicals they use for hydraulic fracturing to the federal government (although some states require this information). The
75
Section II – Water for Energy
EPA is currently conducting a multi-year study to evaluate the impacts of hydraulic fracturing on water resources (U.S. EPA, 2011). In April 2012 the EPA (U.S. EPA, 2012) issued a set of regulations for the oil and natural gas industries, but under the Clean Air Act (only addressing emissions, leaks and spills) and not the Safe Drinking Water Act (pumping chemicals underground). In 2009 and again in 2011 a Fracturing Responsibility and Awareness of Chemical Act (the FRAC Act) was proposed in Congress but was not passed. The proposed act would have required producers to publicly disclose a list of all chemical constituents, though not proprietary formulas, in their fracking fluids.
In addition to the proprietary fracking chemicals, flowback water may also contain high concentrations of sodium, chloride, bromide, arsenic, barium and other heavy metals leached from the subsurface, as well as radionuclides that significantly exceed drinking-water standards (Soeder & Kappel, 2009). These high concentrations of inorganics are not usually successfully treated by municipal wastewater facilities and require much more expensive industrial-grade systems. There are reports that link higher salinity measurement in some Appalachian rivers to the disposal of this degraded water in Marcellus Shale operations (Soeder & Kappel, 2009). It is not clear whether these industrial grade systems are widely utilized by the industry or whether the technologies are sufficient to adequately remove all of these contaminants.
The USGS reports that another disposal option is re-injection of the flowback at shallower depth (Barnett Shale) or into deeper formations (Oriskany or Potsdam Sandstones). However, there is much concern about the contamination of underground water supplies. Another more expensive and energy-
intensive option is to evaporate the wastewater in large tanks and treat the dry residue as solid waste. The EPA categorizes the wastes generated during the exploration, development and production of natural gas as “special wastes.” These wastes are exempt from federal hazardous waste regulations of the Resource Conservation and Recovery Act. Much work is needed by the industry and competent agencies to assess the different environmental impacts of each disposal method.
ii. Coal Bed MethaneAnother source of unconventional natural gas
is coal bed methane, which currently accounts for approximately 9 percent of U.S. production (EIA, 2012), although its importance is not expected to rise in the next 20 years. Most of the production comes from New Mexico, Utah and Wyoming (Figure 13). Coal bed methane extraction produces a large amount of water because the coal bed itself is an aquifer. Individual wells can produce from 1.3 to 161 gal/MMBTU in Colorado and Wyoming, respectively (U.S. DOE, 2006). Some of the produced water can be used for drilling, but much more is produced than can be used. Some states consider this produced water as a waste, while others consider it as a beneficial byproduct (National Research Council, 2010). Disposal of the produced water into natural streams can also create water quality problems as the geomorphology of a receiving stream is developed for a particular range of natural flows. There could be significant water quality problems from coal bed methane extraction if hydraulic fracturing is used, because the fracturing would be taking place in an aquifer, and some wells are not lined (or cased), enabling potential migration of fracturing chemicals into the aquifer.
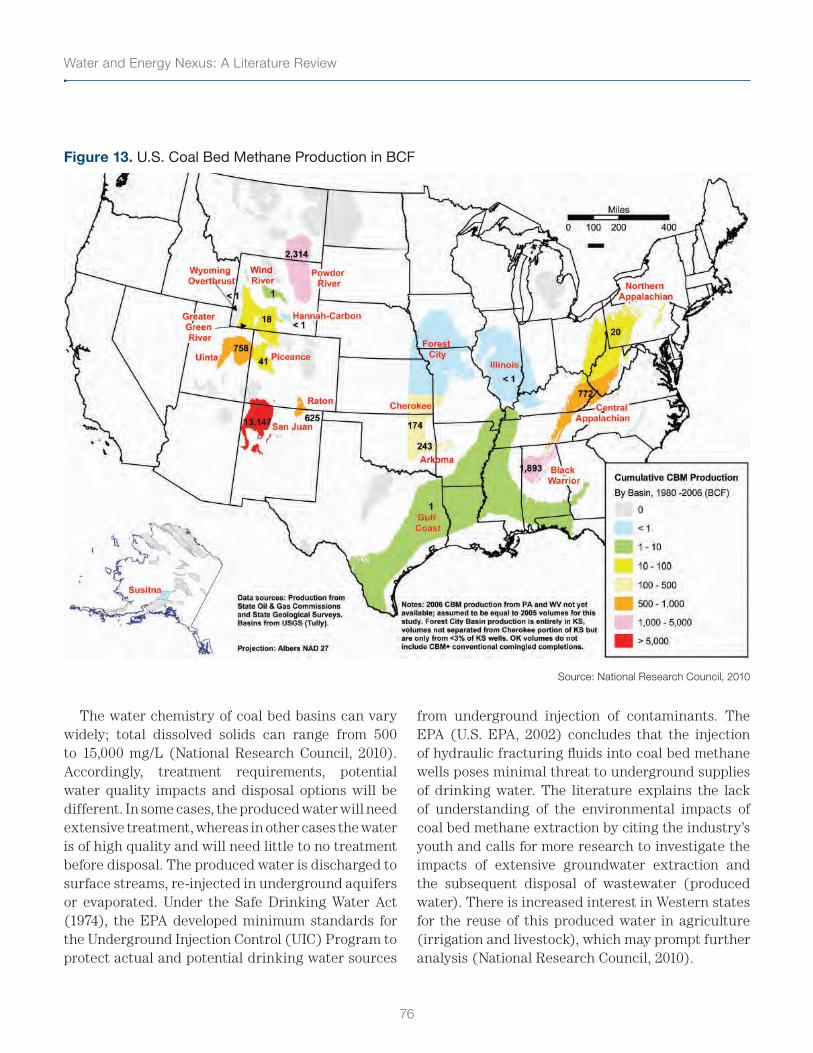
Water and Energy Nexus: A Literature Review
76
Figure 13. U.S. Coal Bed Methane Production in BCF
Source: National Research Council, 2010
The water chemistry of coal bed basins can vary widely; total dissolved solids can range from 500 to 15,000 mg/L (National Research Council, 2010). Accordingly, treatment requirements, potential water quality impacts and disposal options will be different. In some cases, the produced water will need extensive treatment, whereas in other cases the water is of high quality and will need little to no treatment before disposal. The produced water is discharged to surface streams, re-injected in underground aquifers or evaporated. Under the Safe Drinking Water Act (1974), the EPA developed minimum standards for the Underground Injection Control (UIC) Program to protect actual and potential drinking water sources
from underground injection of contaminants. The EPA (U.S. EPA, 2002) concludes that the injection of hydraulic fracturing fluids into coal bed methane wells poses minimal threat to underground supplies of drinking water. The literature explains the lack of understanding of the environmental impacts of coal bed methane extraction by citing the industry’s youth and calls for more research to investigate the impacts of extensive groundwater extraction and the subsequent disposal of wastewater (produced water). There is increased interest in Western states for the reuse of this produced water in agriculture (irrigation and livestock), which may prompt further analysis (National Research Council, 2010).
77
Section II – Water for Energy
2. Processing and Storage
Unlike oil, extracted natural gas is very close to the end product and requires minimal refining. Natural gas processing plants remove water, hydrocarbon liquids (which can have substantial market value), helium (the totality of global helium production comes from natural gas processing), carbon dioxide, hydrogen sulfide and other contaminants. These processing plants are often located very close to production sites and often receive the natural gas directly from the well heads. Because natural gas is naturally odorless, sulfur compounds are added to it for safety reasons (methyl mercaptan or thiophane).
Water is needed in these processes for scrubbing purposes and cooling. Gleick (1994) reports that approximately two gallons of water per MMBTU are consumed for gas processing, but there has been little independent evaluation of the water intensity of processing newer sources of natural gas using more modern technologies. Mielke et al. (2010) estimate that water consumption varies between 0 to 2 gal/MMBTU.
2.1 Liquefied Natural Gas
Overseas imported natural gas is shipped as liquefied natural gas (LNG). Approximately 15 percent of U.S. natural gas imports are LNG (EIA, 2011). Aside from the energy required for liquefying and cooling the gas, water is needed for regasification in an open-loop system (LNG is gasified in a heat exchanger using sea or river water). Similarly to thermoelectric cooling, this requires significant volumes of water as coolant, and poses the same environmental problems (marine life disruption, salinity changes, heat transfers). The Thermoelectric Generation section of this Review has additional information.
There is very little data available on the withdrawals or consumption of water for LNG terminals. Only the U.S. DOE (2006) mentions water withdrawals of up to 200 MGD per terminal. The Federal Energy
Regulatory Commission (FERC) website states that as of April 2012 there are 12 LNG terminals currently active in the U.S. for a total capacity of 19 billion cubic feet per day (BFCD), ranging from 0.5 to 4.0 BCFD, while the U.S. imports only 1.2 BCFD as LNG. Assuming that 200 MGD corresponds to the maximum capacity terminal of 4.0 BCFD, this would mean the water intensity of LNG terminals is extremely high: about 50 gallons per MMBTU. The potential impact of these water withdrawals seems to have been largely overlooked and will certainly need closer attention. This will be particularly true in the event that the U.S. does not meet its energetic independence vis-à-vis natural gas and has to rely in the future on imported LNG from the Middle East or Russia. The FERC website reports that there are as many as 40 LNG terminals planned in the U.S., but most may not be built unless prices go up.
2.2 Gas-to-Liquids
Gas-to-Liquids (GTL) refers to the conversion of natural gas into petrol distillates such as transportation fuel (gasoline or diesel) or other chemicals. Similar to Coal-to-Liquids (CTL), there are not yet any GTL plants in the U.S., although one is planned and designed for Louisiana (Krauss, 2012). Widespread use of GTL is limited by high capital investment costs and the uncertainty of natural gas prices. The water-intensity average is 42 gallons per MMBTU and ranges from 19 to 86 gal/MMBTU (Mielke et al., 2010). There are very few running GTL plants in the world. In 2010, GTL and CTL comprise less than 0.3 percent of world liquid fuels and are projected by the EIA to remain less than 2 percent by 2035. The 2006 Annual Energy Outlook (EIA, 2006) projects domestic GTL production to originate in Alaska in an attempt to monetize the natural gas resources on the North Slope. The GTL liquid would be transported in the continental U.S. for refining.
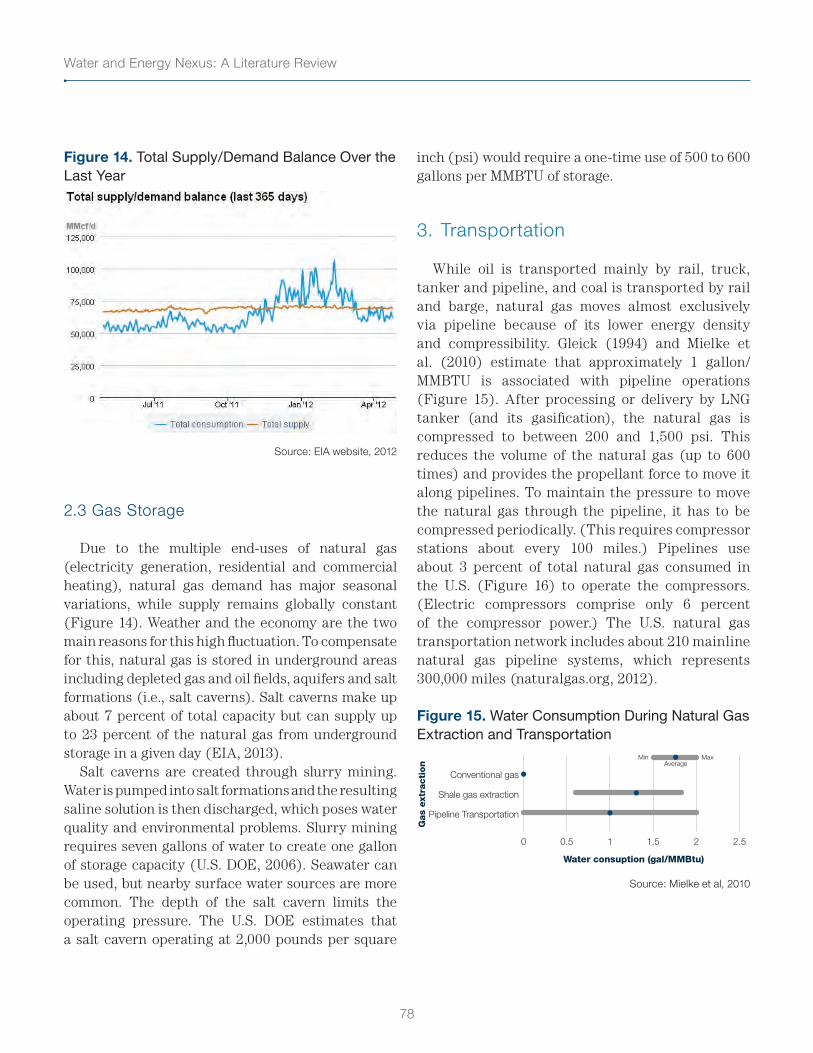
Water and Energy Nexus: A Literature Review
78
Figure 14. Total Supply/Demand Balance Over the Last Year
Source: EIA website, 2012
2.3 Gas Storage
Due to the multiple end-uses of natural gas (electricity generation, residential and commercial heating), natural gas demand has major seasonal variations, while supply remains globally constant (Figure 14). Weather and the economy are the two main reasons for this high fluctuation. To compensate for this, natural gas is stored in underground areas including depleted gas and oil fields, aquifers and salt formations (i.e., salt caverns). Salt caverns make up about 7 percent of total capacity but can supply up to 23 percent of the natural gas from underground storage in a given day (EIA, 2013).
Salt caverns are created through slurry mining. Water is pumped into salt formations and the resulting saline solution is then discharged, which poses water quality and environmental problems. Slurry mining requires seven gallons of water to create one gallon of storage capacity (U.S. DOE, 2006). Seawater can be used, but nearby surface water sources are more common. The depth of the salt cavern limits the operating pressure. The U.S. DOE estimates that a salt cavern operating at 2,000 pounds per square
inch (psi) would require a one-time use of 500 to 600 gallons per MMBTU of storage.
3. Transportation
While oil is transported mainly by rail, truck, tanker and pipeline, and coal is transported by rail and barge, natural gas moves almost exclusively via pipeline because of its lower energy density and compressibility. Gleick (1994) and Mielke et al. (2010) estimate that approximately 1 gallon/MMBTU is associated with pipeline operations (Figure 15). After processing or delivery by LNG tanker (and its gasification), the natural gas is compressed to between 200 and 1,500 psi. This reduces the volume of the natural gas (up to 600 times) and provides the propellant force to move it along pipelines. To maintain the pressure to move the natural gas through the pipeline, it has to be compressed periodically. (This requires compressor stations about every 100 miles.) Pipelines use about 3 percent of total natural gas consumed in the U.S. (Figure 16) to operate the compressors. (Electric compressors comprise only 6 percent of the compressor power.) The U.S. natural gas transportation network includes about 210 mainline natural gas pipeline systems, which represents 300,000 miles (naturalgas.org, 2012).
Figure 15. Water Consumption During Natural Gas Extraction and Transportation
Conventional gas
Shale gas extraction
Pipeline Transportation
0 0.5 1 1.5 2 2.5
Water consuption (gal/MMBtu)
Gas
ext
racti
on Average
MaxMin
Source: Mielke et al, 2010
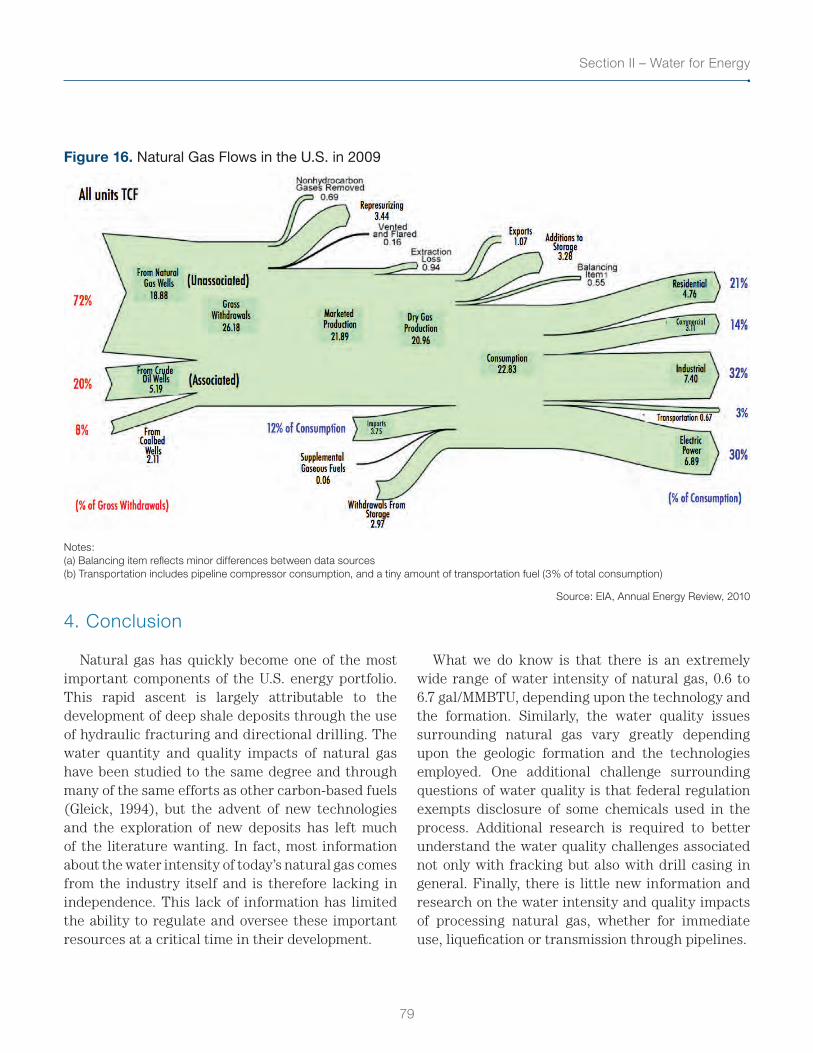
79
Section II – Water for Energy
Figure 16. Natural Gas Flows in the U.S. in 2009
Notes: (a) Balancing item reflects minor differences between data sources (b) Transportation includes pipeline compressor consumption, and a tiny amount of transportation fuel (3% of total consumption)
Source: EIA, Annual Energy Review, 2010
4. Conclusion
Natural gas has quickly become one of the most important components of the U.S. energy portfolio. This rapid ascent is largely attributable to the development of deep shale deposits through the use of hydraulic fracturing and directional drilling. The water quantity and quality impacts of natural gas have been studied to the same degree and through many of the same efforts as other carbon-based fuels (Gleick, 1994), but the advent of new technologies and the exploration of new deposits has left much of the literature wanting. In fact, most information about the water intensity of today’s natural gas comes from the industry itself and is therefore lacking in independence. This lack of information has limited the ability to regulate and oversee these important resources at a critical time in their development.
What we do know is that there is an extremely wide range of water intensity of natural gas, 0.6 to 6.7 gal/MMBTU, depending upon the technology and the formation. Similarly, the water quality issues surrounding natural gas vary greatly depending upon the geologic formation and the technologies employed. One additional challenge surrounding questions of water quality is that federal regulation exempts disclosure of some chemicals used in the process. Additional research is required to better understand the water quality challenges associated not only with fracking but also with drill casing in general. Finally, there is little new information and research on the water intensity and quality impacts of processing natural gas, whether for immediate use, liquefication or transmission through pipelines.
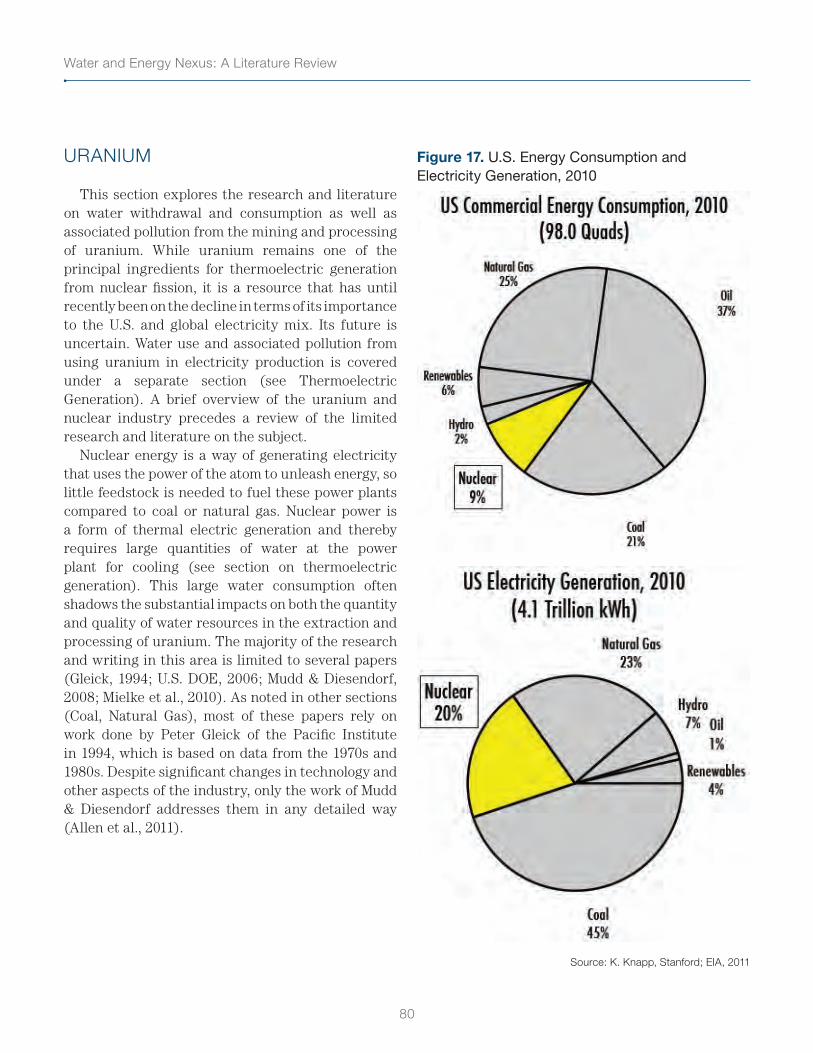
Water and Energy Nexus: A Literature Review
80
URANIUM
This section explores the research and literature on water withdrawal and consumption as well as associated pollution from the mining and processing of uranium. While uranium remains one of the principal ingredients for thermoelectric generation from nuclear fission, it is a resource that has until recently been on the decline in terms of its importance to the U.S. and global electricity mix. Its future is uncertain. Water use and associated pollution from using uranium in electricity production is covered under a separate section (see Thermoelectric Generation). A brief overview of the uranium and nuclear industry precedes a review of the limited research and literature on the subject.
Nuclear energy is a way of generating electricity that uses the power of the atom to unleash energy, so little feedstock is needed to fuel these power plants compared to coal or natural gas. Nuclear power is a form of thermal electric generation and thereby requires large quantities of water at the power plant for cooling (see section on thermoelectric generation). This large water consumption often shadows the substantial impacts on both the quantity and quality of water resources in the extraction and processing of uranium. The majority of the research and writing in this area is limited to several papers (Gleick, 1994; U.S. DOE, 2006; Mudd & Diesendorf, 2008; Mielke et al., 2010). As noted in other sections (Coal, Natural Gas), most of these papers rely on work done by Peter Gleick of the Pacific Institute in 1994, which is based on data from the 1970s and 1980s. Despite significant changes in technology and other aspects of the industry, only the work of Mudd & Diesendorf addresses them in any detailed way (Allen et al., 2011).
Figure 17. U.S. Energy Consumption and Electricity Generation, 2010
Source: K. Knapp, Stanford; EIA, 2011
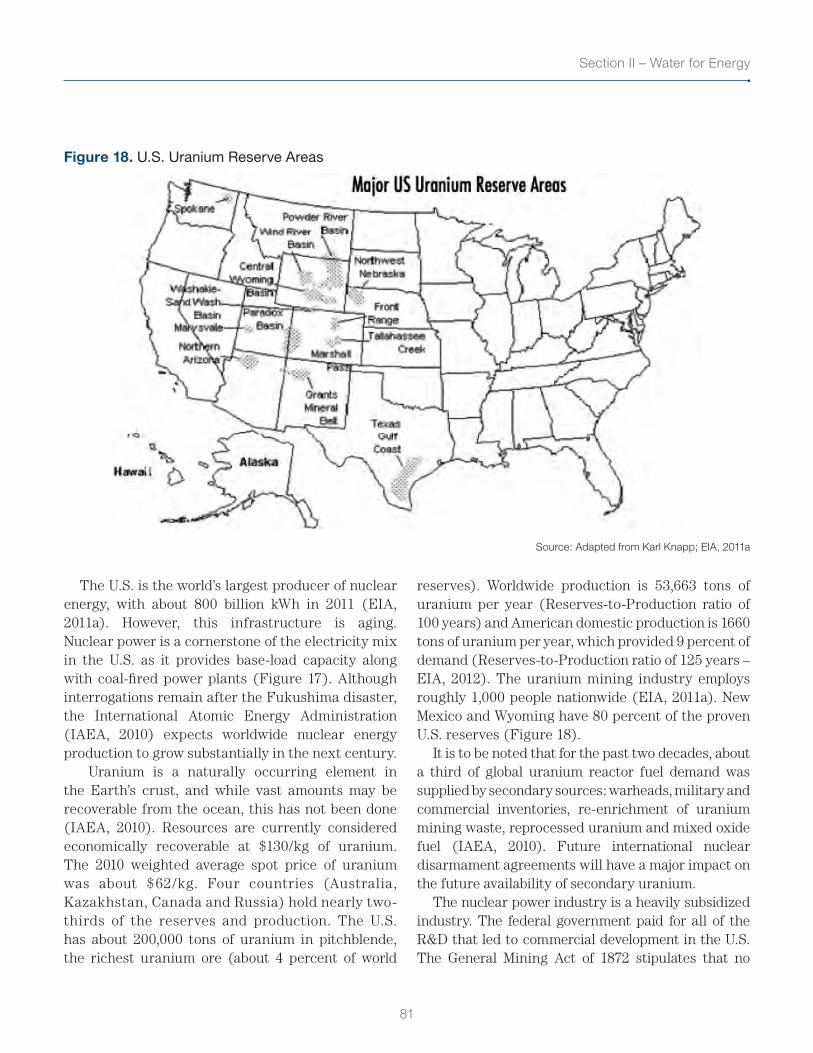
81
Section II – Water for Energy
Figure 18. U.S. Uranium Reserve Areas
Source: Adapted from Karl Knapp; EIA, 2011a
The U.S. is the world’s largest producer of nuclear energy, with about 800 billion kWh in 2011 (EIA, 2011a). However, this infrastructure is aging. Nuclear power is a cornerstone of the electricity mix in the U.S. as it provides base-load capacity along with coal-fired power plants (Figure 17). Although interrogations remain after the Fukushima disaster, the International Atomic Energy Administration (IAEA, 2010) expects worldwide nuclear energy production to grow substantially in the next century.
Uranium is a naturally occurring element in the Earth’s crust, and while vast amounts may be recoverable from the ocean, this has not been done (IAEA, 2010). Resources are currently considered economically recoverable at $130/kg of uranium. The 2010 weighted average spot price of uranium was about $62/kg. Four countries (Australia, Kazakhstan, Canada and Russia) hold nearly two-thirds of the reserves and production. The U.S. has about 200,000 tons of uranium in pitchblende, the richest uranium ore (about 4 percent of world
reserves). Worldwide production is 53,663 tons of uranium per year (Reserves-to-Production ratio of 100 years) and American domestic production is 1660 tons of uranium per year, which provided 9 percent of demand (Reserves-to-Production ratio of 125 years – EIA, 2012). The uranium mining industry employs roughly 1,000 people nationwide (EIA, 2011a). New Mexico and Wyoming have 80 percent of the proven U.S. reserves (Figure 18).
It is to be noted that for the past two decades, about a third of global uranium reactor fuel demand was supplied by secondary sources: warheads, military and commercial inventories, re-enrichment of uranium mining waste, reprocessed uranium and mixed oxide fuel (IAEA, 2010). Future international nuclear disarmament agreements will have a major impact on the future availability of secondary uranium.
The nuclear power industry is a heavily subsidized industry. The federal government paid for all of the R&D that led to commercial development in the U.S. The General Mining Act of 1872 stipulates that no
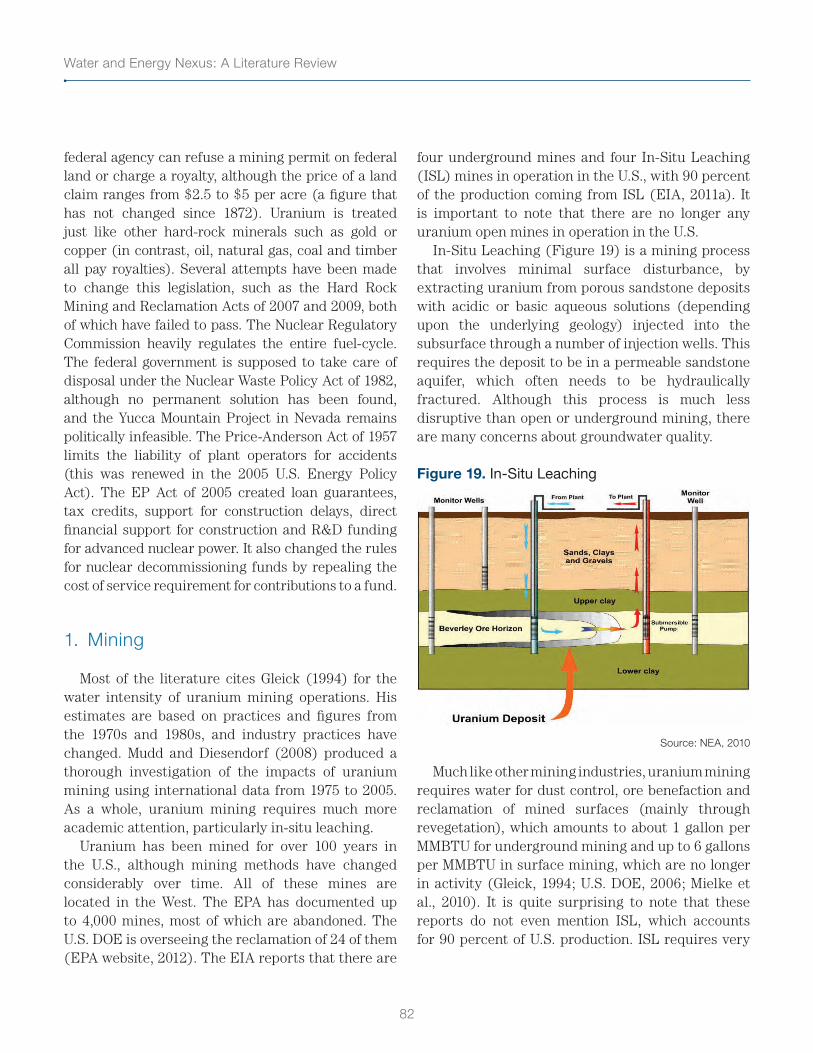
Water and Energy Nexus: A Literature Review
82
federal agency can refuse a mining permit on federal land or charge a royalty, although the price of a land claim ranges from $2.5 to $5 per acre (a figure that has not changed since 1872). Uranium is treated just like other hard-rock minerals such as gold or copper (in contrast, oil, natural gas, coal and timber all pay royalties). Several attempts have been made to change this legislation, such as the Hard Rock Mining and Reclamation Acts of 2007 and 2009, both of which have failed to pass. The Nuclear Regulatory Commission heavily regulates the entire fuel-cycle. The federal government is supposed to take care of disposal under the Nuclear Waste Policy Act of 1982, although no permanent solution has been found, and the Yucca Mountain Project in Nevada remains politically infeasible. The Price-Anderson Act of 1957 limits the liability of plant operators for accidents (this was renewed in the 2005 U.S. Energy Policy Act). The EP Act of 2005 created loan guarantees, tax credits, support for construction delays, direct financial support for construction and R&D funding for advanced nuclear power. It also changed the rules for nuclear decommissioning funds by repealing the cost of service requirement for contributions to a fund.
1. Mining
Most of the literature cites Gleick (1994) for the water intensity of uranium mining operations. His estimates are based on practices and figures from the 1970s and 1980s, and industry practices have changed. Mudd and Diesendorf (2008) produced a thorough investigation of the impacts of uranium mining using international data from 1975 to 2005. As a whole, uranium mining requires much more academic attention, particularly in-situ leaching.
Uranium has been mined for over 100 years in the U.S., although mining methods have changed considerably over time. All of these mines are located in the West. The EPA has documented up to 4,000 mines, most of which are abandoned. The U.S. DOE is overseeing the reclamation of 24 of them (EPA website, 2012). The EIA reports that there are
four underground mines and four In-Situ Leaching (ISL) mines in operation in the U.S., with 90 percent of the production coming from ISL (EIA, 2011a). It is important to note that there are no longer any uranium open mines in operation in the U.S.
In-Situ Leaching (Figure 19) is a mining process that involves minimal surface disturbance, by extracting uranium from porous sandstone deposits with acidic or basic aqueous solutions (depending upon the underlying geology) injected into the subsurface through a number of injection wells. This requires the deposit to be in a permeable sandstone aquifer, which often needs to be hydraulically fractured. Although this process is much less disruptive than open or underground mining, there are many concerns about groundwater quality.
Figure 19. In-Situ Leaching
Source: NEA, 2010
Much like other mining industries, uranium mining requires water for dust control, ore benefaction and reclamation of mined surfaces (mainly through revegetation), which amounts to about 1 gallon per MMBTU for underground mining and up to 6 gallons per MMBTU in surface mining, which are no longer in activity (Gleick, 1994; U.S. DOE, 2006; Mielke et al., 2010). It is quite surprising to note that these reports do not even mention ISL, which accounts for 90 percent of U.S. production. ISL requires very
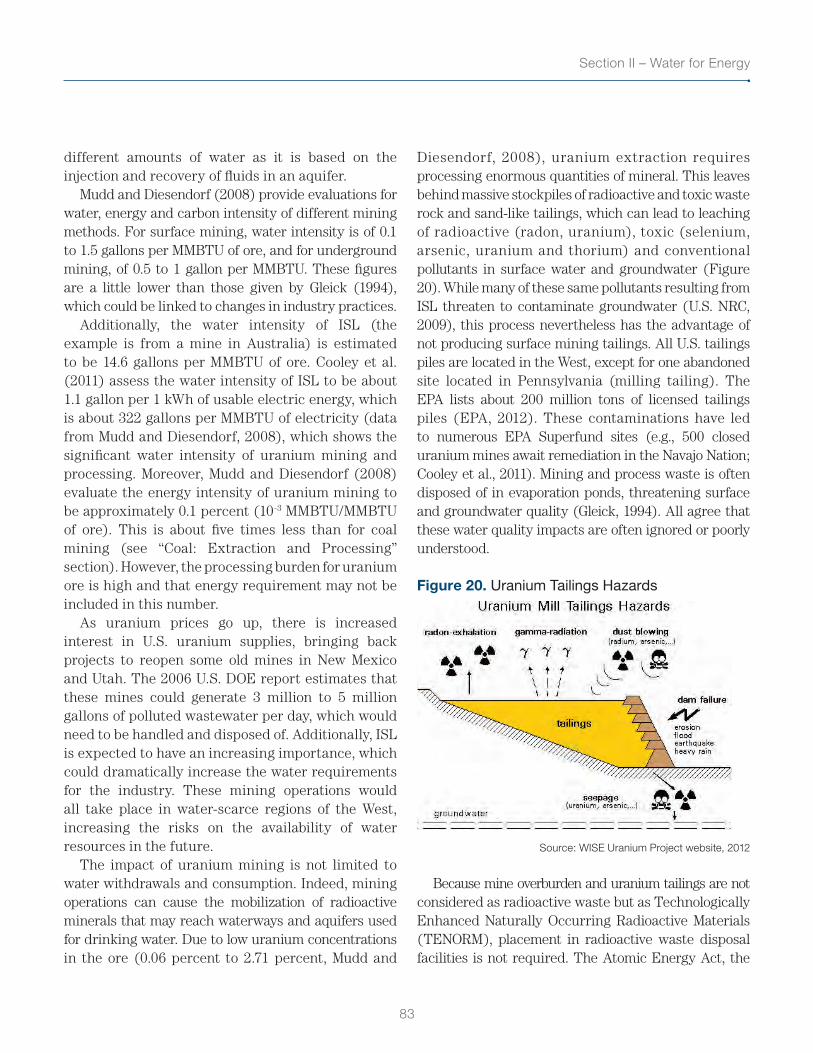
83
Section II – Water for Energy
different amounts of water as it is based on the injection and recovery of fluids in an aquifer.
Mudd and Diesendorf (2008) provide evaluations for water, energy and carbon intensity of different mining methods. For surface mining, water intensity is of 0.1 to 1.5 gallons per MMBTU of ore, and for underground mining, of 0.5 to 1 gallon per MMBTU. These figures are a little lower than those given by Gleick (1994), which could be linked to changes in industry practices.
Additionally, the water intensity of ISL (the example is from a mine in Australia) is estimated to be 14.6 gallons per MMBTU of ore. Cooley et al. (2011) assess the water intensity of ISL to be about 1.1 gallon per 1 kWh of usable electric energy, which is about 322 gallons per MMBTU of electricity (data from Mudd and Diesendorf, 2008), which shows the significant water intensity of uranium mining and processing. Moreover, Mudd and Diesendorf (2008) evaluate the energy intensity of uranium mining to be approximately 0.1 percent (10-3 MMBTU/MMBTU of ore). This is about five times less than for coal mining (see “Coal: Extraction and Processing” section). However, the processing burden for uranium ore is high and that energy requirement may not be included in this number.
As uranium prices go up, there is increased interest in U.S. uranium supplies, bringing back projects to reopen some old mines in New Mexico and Utah. The 2006 U.S. DOE report estimates that these mines could generate 3 million to 5 million gallons of polluted wastewater per day, which would need to be handled and disposed of. Additionally, ISL is expected to have an increasing importance, which could dramatically increase the water requirements for the industry. These mining operations would all take place in water-scarce regions of the West, increasing the risks on the availability of water resources in the future.
The impact of uranium mining is not limited to water withdrawals and consumption. Indeed, mining operations can cause the mobilization of radioactive minerals that may reach waterways and aquifers used for drinking water. Due to low uranium concentrations in the ore (0.06 percent to 2.71 percent, Mudd and
Diesendorf, 2008), uranium extraction requires processing enormous quantities of mineral. This leaves behind massive stockpiles of radioactive and toxic waste rock and sand-like tailings, which can lead to leaching of radioactive (radon, uranium), toxic (selenium, arsenic, uranium and thorium) and conventional pollutants in surface water and groundwater (Figure 20). While many of these same pollutants resulting from ISL threaten to contaminate groundwater (U.S. NRC, 2009), this process nevertheless has the advantage of not producing surface mining tailings. All U.S. tailings piles are located in the West, except for one abandoned site located in Pennsylvania (milling tailing). The EPA lists about 200 million tons of licensed tailings piles (EPA, 2012). These contaminations have led to numerous EPA Superfund sites (e.g., 500 closed uranium mines await remediation in the Navajo Nation; Cooley et al., 2011). Mining and process waste is often disposed of in evaporation ponds, threatening surface and groundwater quality (Gleick, 1994). All agree that these water quality impacts are often ignored or poorly understood.
Figure 20. Uranium Tailings Hazards
Source: WISE Uranium Project website, 2012
Because mine overburden and uranium tailings are not considered as radioactive waste but as Technologically Enhanced Naturally Occurring Radioactive Materials (TENORM), placement in radioactive waste disposal facilities is not required. The Atomic Energy Act, the
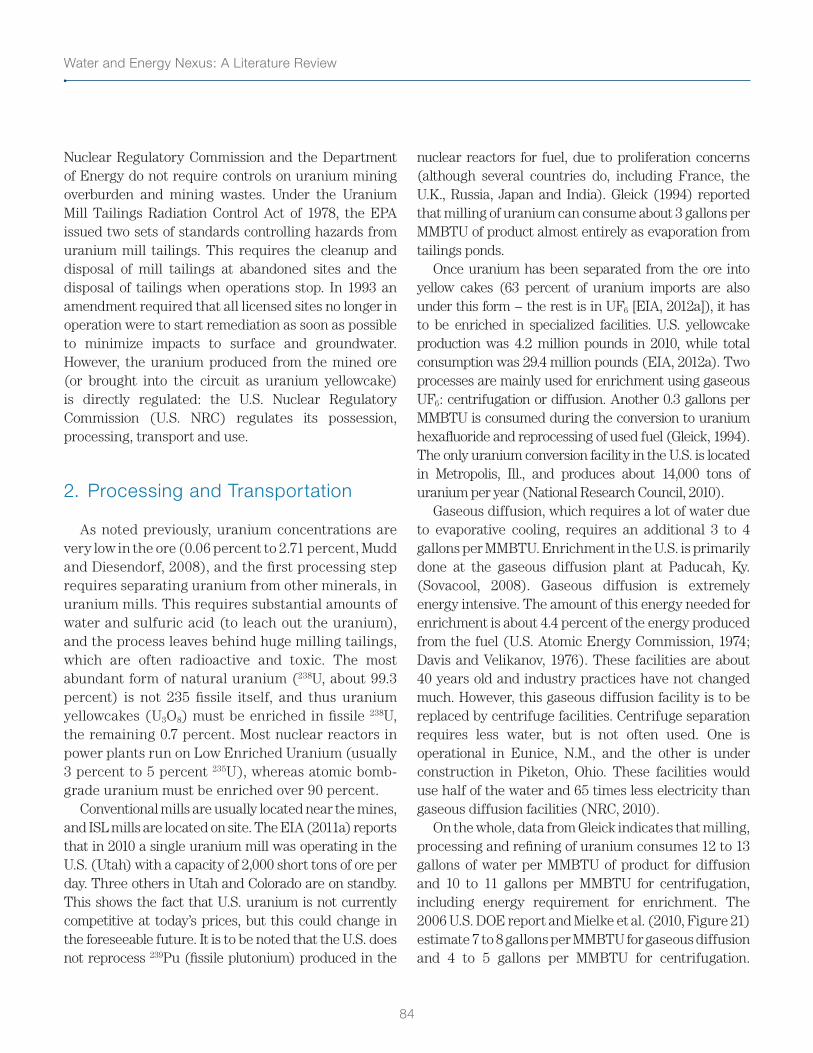
Water and Energy Nexus: A Literature Review
84
Nuclear Regulatory Commission and the Department of Energy do not require controls on uranium mining overburden and mining wastes. Under the Uranium Mill Tailings Radiation Control Act of 1978, the EPA issued two sets of standards controlling hazards from uranium mill tailings. This requires the cleanup and disposal of mill tailings at abandoned sites and the disposal of tailings when operations stop. In 1993 an amendment required that all licensed sites no longer in operation were to start remediation as soon as possible to minimize impacts to surface and groundwater. However, the uranium produced from the mined ore (or brought into the circuit as uranium yellowcake) is directly regulated: the U.S. Nuclear Regulatory Commission (U.S. NRC) regulates its possession, processing, transport and use.
2. Processing and Transportation
As noted previously, uranium concentrations are very low in the ore (0.06 percent to 2.71 percent, Mudd and Diesendorf, 2008), and the first processing step requires separating uranium from other minerals, in uranium mills. This requires substantial amounts of water and sulfuric acid (to leach out the uranium), and the process leaves behind huge milling tailings, which are often radioactive and toxic. The most abundant form of natural uranium (238U, about 99.3 percent) is not 235 fissile itself, and thus uranium yellowcakes (U3O8) must be enriched in fissile 238U, the remaining 0.7 percent. Most nuclear reactors in power plants run on Low Enriched Uranium (usually 3 percent to 5 percent 235U), whereas atomic bomb-grade uranium must be enriched over 90 percent.
Conventional mills are usually located near the mines, and ISL mills are located on site. The EIA (2011a) reports that in 2010 a single uranium mill was operating in the U.S. (Utah) with a capacity of 2,000 short tons of ore per day. Three others in Utah and Colorado are on standby. This shows the fact that U.S. uranium is not currently competitive at today’s prices, but this could change in the foreseeable future. It is to be noted that the U.S. does not reprocess 239Pu (fissile plutonium) produced in the
nuclear reactors for fuel, due to proliferation concerns (although several countries do, including France, the U.K., Russia, Japan and India). Gleick (1994) reported that milling of uranium can consume about 3 gallons per MMBTU of product almost entirely as evaporation from tailings ponds.
Once uranium has been separated from the ore into yellow cakes (63 percent of uranium imports are also under this form − the rest is in UF6 [EIA, 2012a]), it has to be enriched in specialized facilities. U.S. yellowcake production was 4.2 million pounds in 2010, while total consumption was 29.4 million pounds (EIA, 2012a). Two processes are mainly used for enrichment using gaseous UF6: centrifugation or diffusion. Another 0.3 gallons per MMBTU is consumed during the conversion to uranium hexafluoride and reprocessing of used fuel (Gleick, 1994). The only uranium conversion facility in the U.S. is located in Metropolis, Ill., and produces about 14,000 tons of uranium per year (National Research Council, 2010).
Gaseous diffusion, which requires a lot of water due to evaporative cooling, requires an additional 3 to 4 gallons per MMBTU. Enrichment in the U.S. is primarily done at the gaseous diffusion plant at Paducah, Ky. (Sovacool, 2008). Gaseous diffusion is extremely energy intensive. The amount of this energy needed for enrichment is about 4.4 percent of the energy produced from the fuel (U.S. Atomic Energy Commission, 1974; Davis and Velikanov, 1976). These facilities are about 40 years old and industry practices have not changed much. However, this gaseous diffusion facility is to be replaced by centrifuge facilities. Centrifuge separation requires less water, but is not often used. One is operational in Eunice, N.M., and the other is under construction in Piketon, Ohio. These facilities would use half of the water and 65 times less electricity than gaseous diffusion facilities (NRC, 2010).
On the whole, data from Gleick indicates that milling, processing and refining of uranium consumes 12 to 13 gallons of water per MMBTU of product for diffusion and 10 to 11 gallons per MMBTU for centrifugation, including energy requirement for enrichment. The 2006 U.S. DOE report and Mielke et al. (2010, Figure 21) estimate 7 to 8 gallons per MMBTU for gaseous diffusion and 4 to 5 gallons per MMBTU for centrifugation.
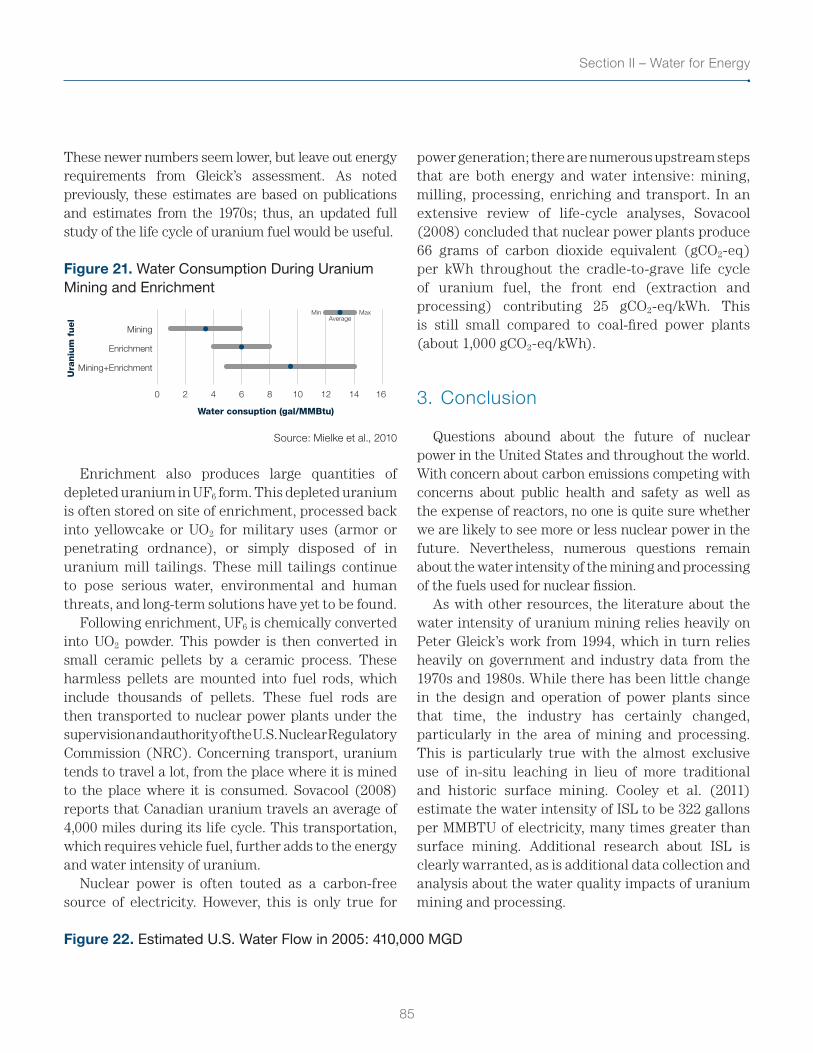
85
Section II – Water for Energy
These newer numbers seem lower, but leave out energy requirements from Gleick’s assessment. As noted previously, these estimates are based on publications and estimates from the 1970s; thus, an updated full study of the life cycle of uranium fuel would be useful.
Figure 21. Water Consumption During Uranium Mining and Enrichment
Mining
Enrichment
Mining+Enrichment
0 2 4 6 8 10 12 14 16
Water consuption (gal/MMBtu)
Ura
niu
m f
uel Average
MaxMin
Source: Mielke et al., 2010
Enrichment also produces large quantities of depleted uranium in UF6 form. This depleted uranium is often stored on site of enrichment, processed back into yellowcake or UO2 for military uses (armor or penetrating ordnance), or simply disposed of in uranium mill tailings. These mill tailings continue to pose serious water, environmental and human threats, and long-term solutions have yet to be found.
Following enrichment, UF6 is chemically converted into UO2 powder. This powder is then converted in small ceramic pellets by a ceramic process. These harmless pellets are mounted into fuel rods, which include thousands of pellets. These fuel rods are then transported to nuclear power plants under the supervision and authority of the U.S. Nuclear Regulatory Commission (NRC). Concerning transport, uranium tends to travel a lot, from the place where it is mined to the place where it is consumed. Sovacool (2008) reports that Canadian uranium travels an average of 4,000 miles during its life cycle. This transportation, which requires vehicle fuel, further adds to the energy and water intensity of uranium.
Nuclear power is often touted as a carbon-free source of electricity. However, this is only true for
power generation; there are numerous upstream steps that are both energy and water intensive: mining, milling, processing, enriching and transport. In an extensive review of life-cycle analyses, Sovacool (2008) concluded that nuclear power plants produce 66 grams of carbon dioxide equivalent (gCO2-eq) per kWh throughout the cradle-to-grave life cycle of uranium fuel, the front end (extraction and processing) contributing 25 gCO2-eq/kWh. This is still small compared to coal-fired power plants (about 1,000 gCO2-eq/kWh).
3. Conclusion
Questions abound about the future of nuclear power in the United States and throughout the world. With concern about carbon emissions competing with concerns about public health and safety as well as the expense of reactors, no one is quite sure whether we are likely to see more or less nuclear power in the future. Nevertheless, numerous questions remain about the water intensity of the mining and processing of the fuels used for nuclear fission.
As with other resources, the literature about the water intensity of uranium mining relies heavily on Peter Gleick’s work from 1994, which in turn relies heavily on government and industry data from the 1970s and 1980s. While there has been little change in the design and operation of power plants since that time, the industry has certainly changed, particularly in the area of mining and processing. This is particularly true with the almost exclusive use of in-situ leaching in lieu of more traditional and historic surface mining. Cooley et al. (2011) estimate the water intensity of ISL to be 322 gallons per MMBTU of electricity, many times greater than surface mining. Additional research about ISL is clearly warranted, as is additional data collection and analysis about the water quality impacts of uranium mining and processing.
Figure 22. Estimated U.S. Water Flow in 2005: 410,000 MGD
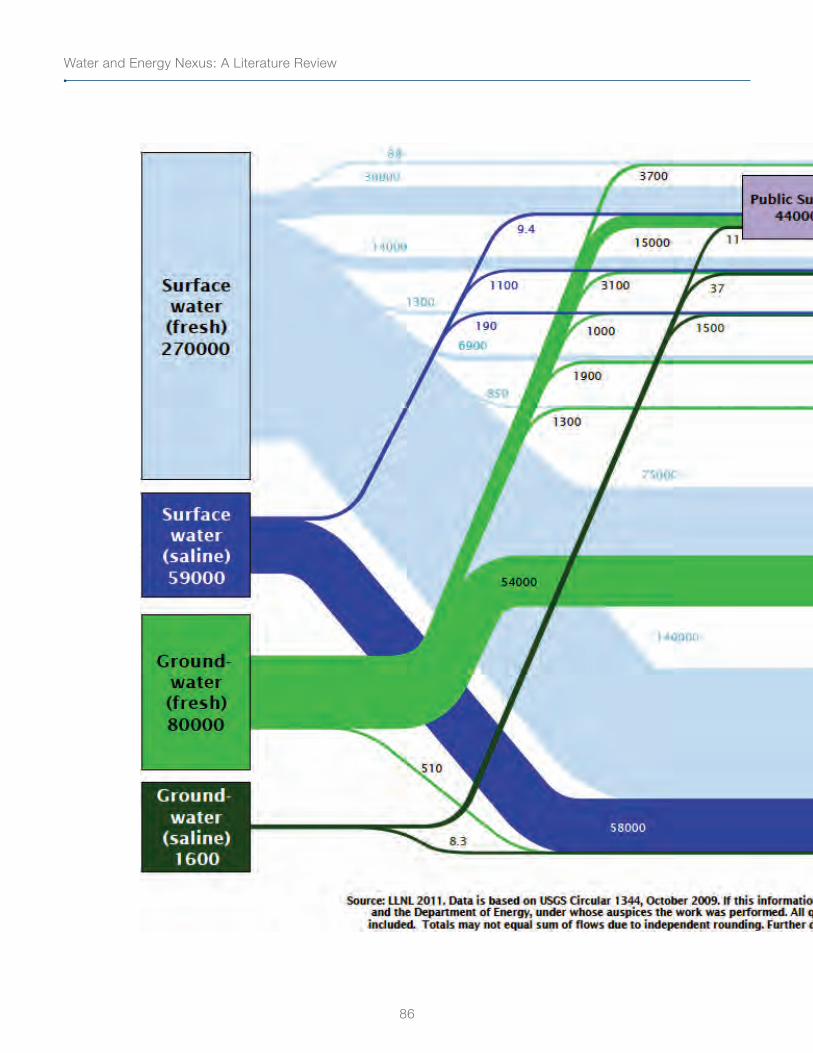
Water and Energy Nexus: A Literature Review
86
Source: Smith et al., 2011
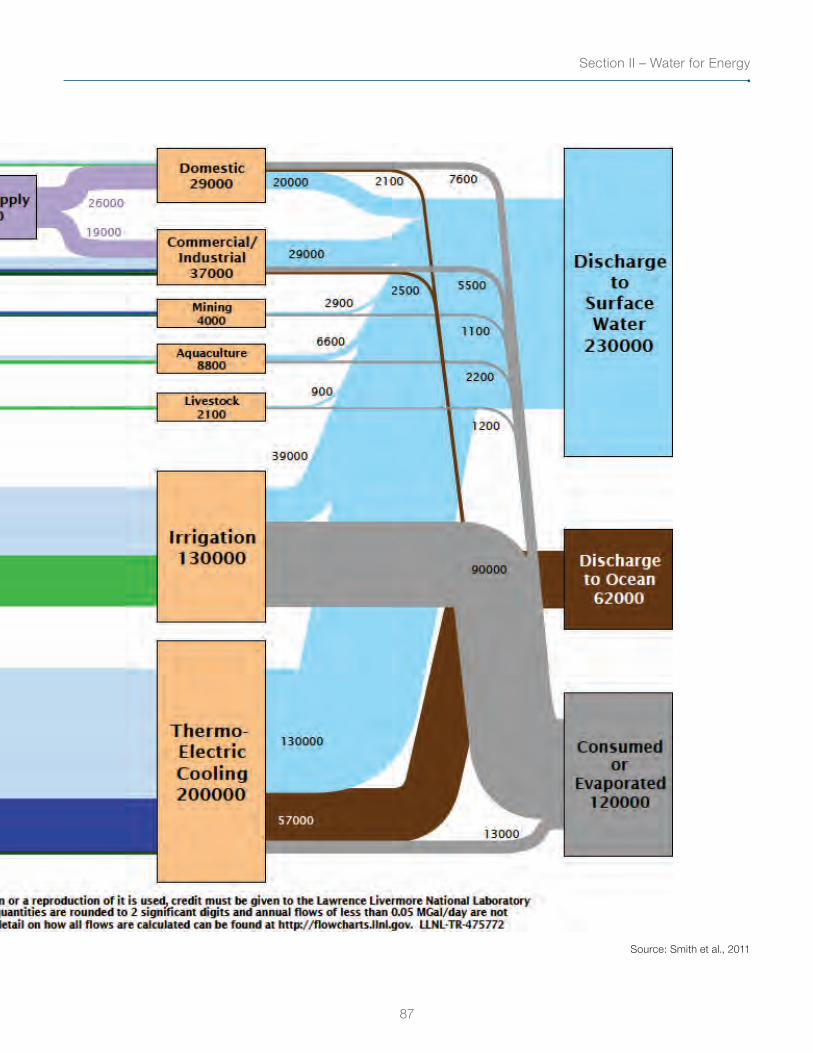
87
Section II – Water for Energy
Source: Smith et al., 2011
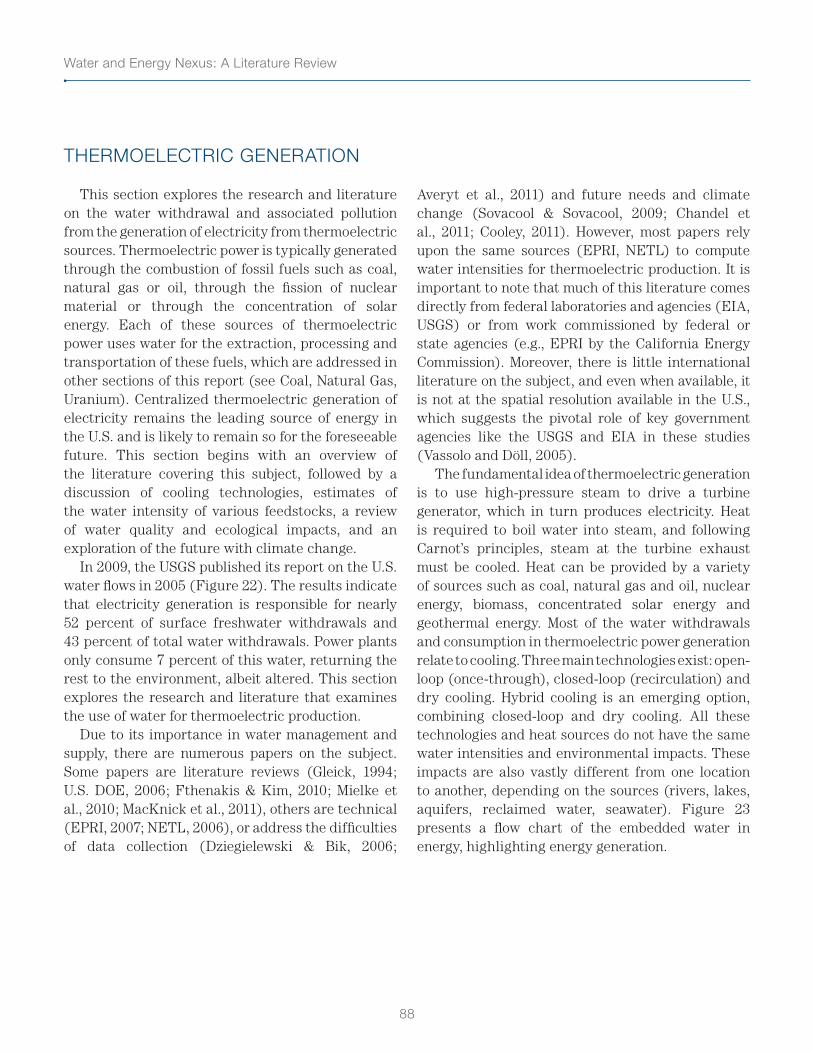
Water and Energy Nexus: A Literature Review
88
THERMOELECTRIC GENERATION
This section explores the research and literature on the water withdrawal and associated pollution from the generation of electricity from thermoelectric sources. Thermoelectric power is typically generated through the combustion of fossil fuels such as coal, natural gas or oil, through the fission of nuclear material or through the concentration of solar energy. Each of these sources of thermoelectric power uses water for the extraction, processing and transportation of these fuels, which are addressed in other sections of this report (see Coal, Natural Gas, Uranium). Centralized thermoelectric generation of electricity remains the leading source of energy in the U.S. and is likely to remain so for the foreseeable future. This section begins with an overview of the literature covering this subject, followed by a discussion of cooling technologies, estimates of the water intensity of various feedstocks, a review of water quality and ecological impacts, and an exploration of the future with climate change.
In 2009, the USGS published its report on the U.S. water flows in 2005 (Figure 22). The results indicate that electricity generation is responsible for nearly 52 percent of surface freshwater withdrawals and 43 percent of total water withdrawals. Power plants only consume 7 percent of this water, returning the rest to the environment, albeit altered. This section explores the research and literature that examines the use of water for thermoelectric production.
Due to its importance in water management and supply, there are numerous papers on the subject. Some papers are literature reviews (Gleick, 1994; U.S. DOE, 2006; Fthenakis & Kim, 2010; Mielke et al., 2010; MacKnick et al., 2011), others are technical (EPRI, 2007; NETL, 2006), or address the difficulties of data collection (Dziegielewski & Bik, 2006;
Averyt et al., 2011) and future needs and climate change (Sovacool & Sovacool, 2009; Chandel et al., 2011; Cooley, 2011). However, most papers rely upon the same sources (EPRI, NETL) to compute water intensities for thermoelectric production. It is important to note that much of this literature comes directly from federal laboratories and agencies (EIA, USGS) or from work commissioned by federal or state agencies (e.g., EPRI by the California Energy Commission). Moreover, there is little international literature on the subject, and even when available, it is not at the spatial resolution available in the U.S., which suggests the pivotal role of key government agencies like the USGS and EIA in these studies (Vassolo and Döll, 2005).
The fundamental idea of thermoelectric generation is to use high-pressure steam to drive a turbine generator, which in turn produces electricity. Heat is required to boil water into steam, and following Carnot’s principles, steam at the turbine exhaust must be cooled. Heat can be provided by a variety of sources such as coal, natural gas and oil, nuclear energy, biomass, concentrated solar energy and geothermal energy. Most of the water withdrawals and consumption in thermoelectric power generation relate to cooling. Three main technologies exist: open-loop (once-through), closed-loop (recirculation) and dry cooling. Hybrid cooling is an emerging option, combining closed-loop and dry cooling. All these technologies and heat sources do not have the same water intensities and environmental impacts. These impacts are also vastly different from one location to another, depending on the sources (rivers, lakes, aquifers, reclaimed water, seawater). Figure 23 presents a flow chart of the embedded water in energy, highlighting energy generation.
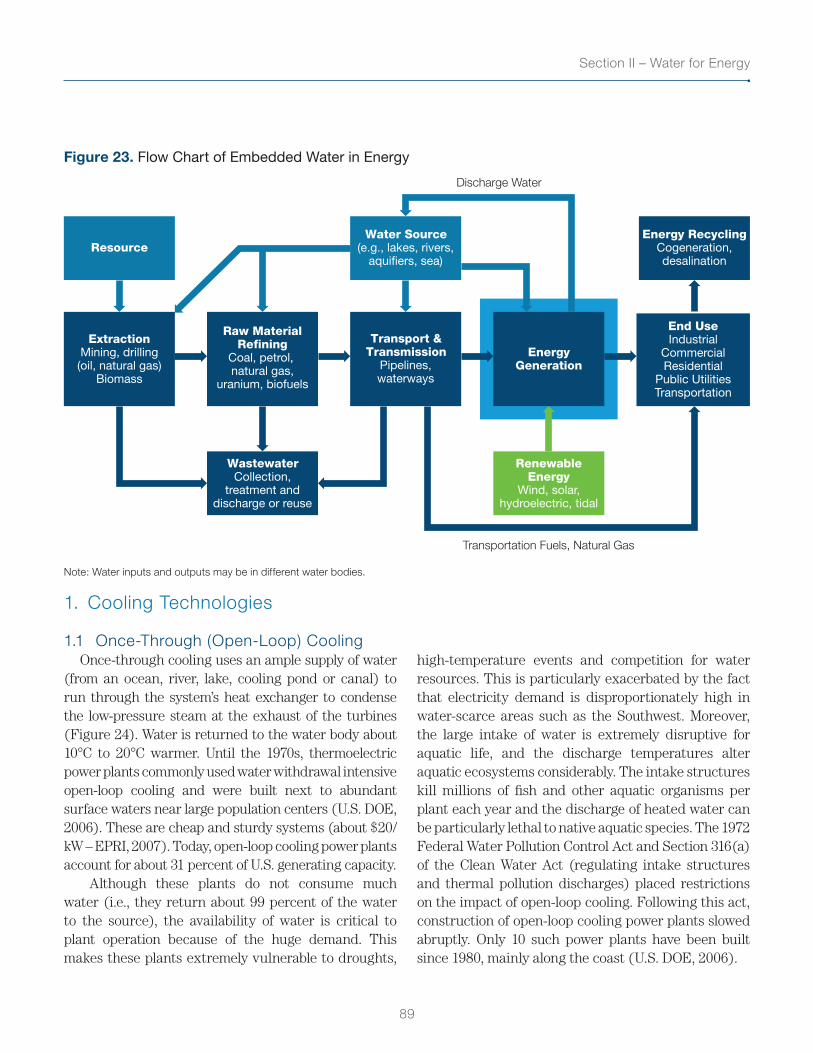
89
Section II – Water for Energy
Figure 23. Flow Chart of Embedded Water in Energy
ExtractionMining, drilling(oil, natural gas)
Biomass
WastewaterCollection,
treatment anddischarge or reuse
Resource
Raw MaterialRefining
Coal, petrol, natural gas,
uranium, biofuels
RenewableEnergy
Wind, solar,hydroelectric, tidal
Water Source(e.g., lakes, rivers,
aquifiers, sea)
Energy RecyclingCogeneration,desalination
Transport &Transmission
Pipelines,waterways
End UseIndustrial
CommercialResidential
Public UtilitiesTransportation
EnergyGeneration
Discharge Water
Transportation Fuels, Natural Gas
Note: Water inputs and outputs may be in different water bodies.
1. Cooling Technologies
1.1 Once-Through (Open-Loop) CoolingOnce-through cooling uses an ample supply of water
(from an ocean, river, lake, cooling pond or canal) to run through the system’s heat exchanger to condense the low-pressure steam at the exhaust of the turbines (Figure 24). Water is returned to the water body about 10°C to 20°C warmer. Until the 1970s, thermoelectric power plants commonly used water withdrawal intensive open-loop cooling and were built next to abundant surface waters near large population centers (U.S. DOE, 2006). These are cheap and sturdy systems (about $20/kW – EPRI, 2007). Today, open-loop cooling power plants account for about 31 percent of U.S. generating capacity.
Although these plants do not consume much water (i.e., they return about 99 percent of the water to the source), the availability of water is critical to plant operation because of the huge demand. This makes these plants extremely vulnerable to droughts,
high-temperature events and competition for water resources. This is particularly exacerbated by the fact that electricity demand is disproportionately high in water-scarce areas such as the Southwest. Moreover, the large intake of water is extremely disruptive for aquatic life, and the discharge temperatures alter aquatic ecosystems considerably. The intake structures kill millions of fish and other aquatic organisms per plant each year and the discharge of heated water can be particularly lethal to native aquatic species. The 1972 Federal Water Pollution Control Act and Section 316(a) of the Clean Water Act (regulating intake structures and thermal pollution discharges) placed restrictions on the impact of open-loop cooling. Following this act, construction of open-loop cooling power plants slowed abruptly. Only 10 such power plants have been built since 1980, mainly along the coast (U.S. DOE, 2006).
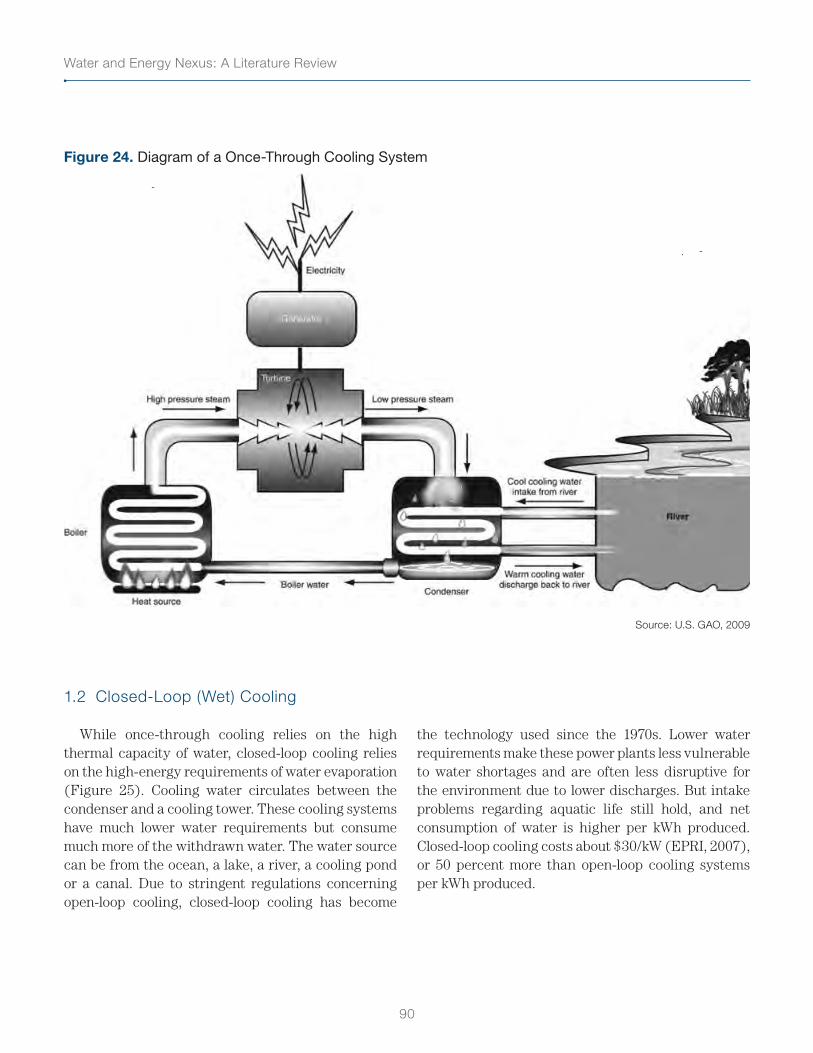
Water and Energy Nexus: A Literature Review
90
Figure 24. Diagram of a Once-Through Cooling System
Source: U.S. GAO, 2009
1.2 Closed-Loop (Wet) Cooling
While once-through cooling relies on the high thermal capacity of water, closed-loop cooling relies on the high-energy requirements of water evaporation (Figure 25). Cooling water circulates between the condenser and a cooling tower. These cooling systems have much lower water requirements but consume much more of the withdrawn water. The water source can be from the ocean, a lake, a river, a cooling pond or a canal. Due to stringent regulations concerning open-loop cooling, closed-loop cooling has become
the technology used since the 1970s. Lower water requirements make these power plants less vulnerable to water shortages and are often less disruptive for the environment due to lower discharges. But intake problems regarding aquatic life still hold, and net consumption of water is higher per kWh produced. Closed-loop cooling costs about $30/kW (EPRI, 2007), or 50 percent more than open-loop cooling systems per kWh produced.
91
Section II – Water for Energy
Figure 25. Diagram of a Closed-Loop Cooling System
Source: U.S. GAO, 2009
1.3 Dry (Air) Cooling
Dry cooling systems are very similar to closed-loop systems, but air replaces water to cool the circulating cooling fluid, thus eliminating water withdrawal and consumption (Figure 26). However, this greatly impacts plant efficiency due to a lower thermodynamic theoretical maximum (Carnot cycle) and high electricity use for powering the massive fans used in cooling. Dry cooling is heavily impacted by ambient temperatures and humidity and will perform less well than wet cooling, particularly in hot
and dry climates (where the use of such technologies is most desirable). The average loss of output is about 2 percent annually (Mielke et al., 2010), but can be as high as 25 percent at the peak of summer when demand is highest (U.S. DOE, 2006). Moreover, the capital cost of such a system is about 10 times more than that of an open-loop system (about $180/kW, EPRI, 2007), which makes it very unattractive to utilities without massive subsidies and grants.
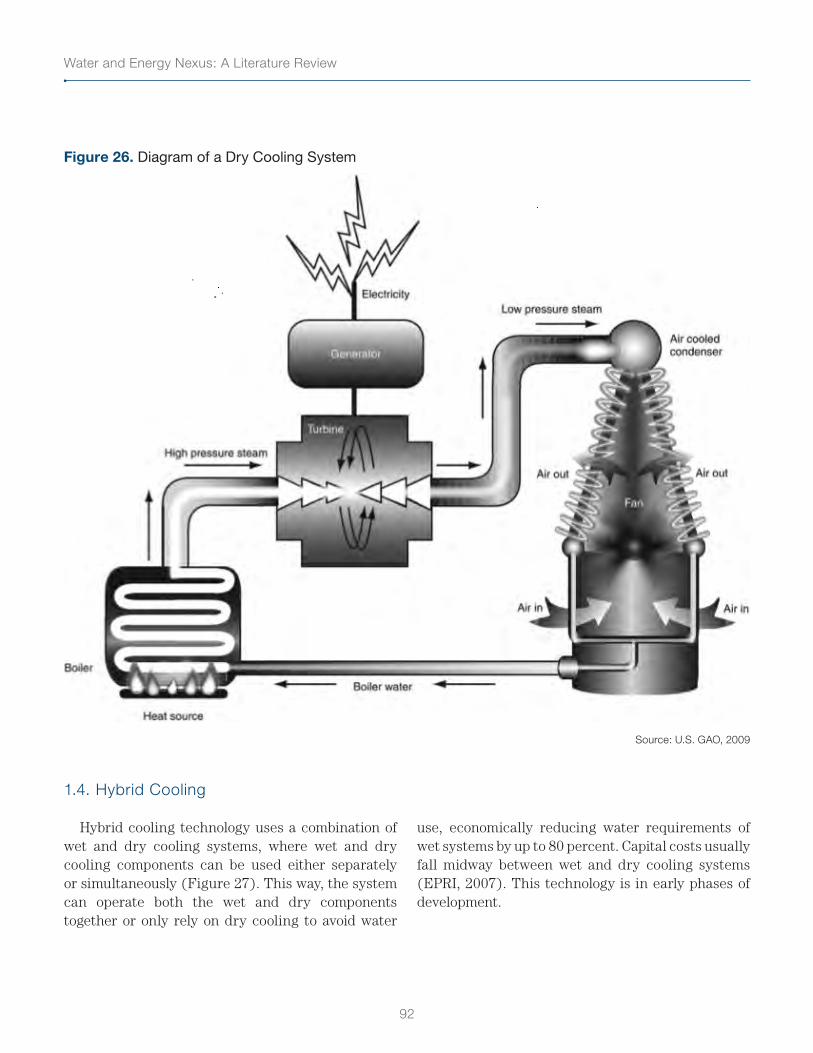
Water and Energy Nexus: A Literature Review
92
Figure 26. Diagram of a Dry Cooling System
Source: U.S. GAO, 2009
1.4. Hybrid Cooling
Hybrid cooling technology uses a combination of wet and dry cooling systems, where wet and dry cooling components can be used either separately or simultaneously (Figure 27). This way, the system can operate both the wet and dry components together or only rely on dry cooling to avoid water
use, economically reducing water requirements of wet systems by up to 80 percent. Capital costs usually fall midway between wet and dry cooling systems (EPRI, 2007). This technology is in early phases of development.
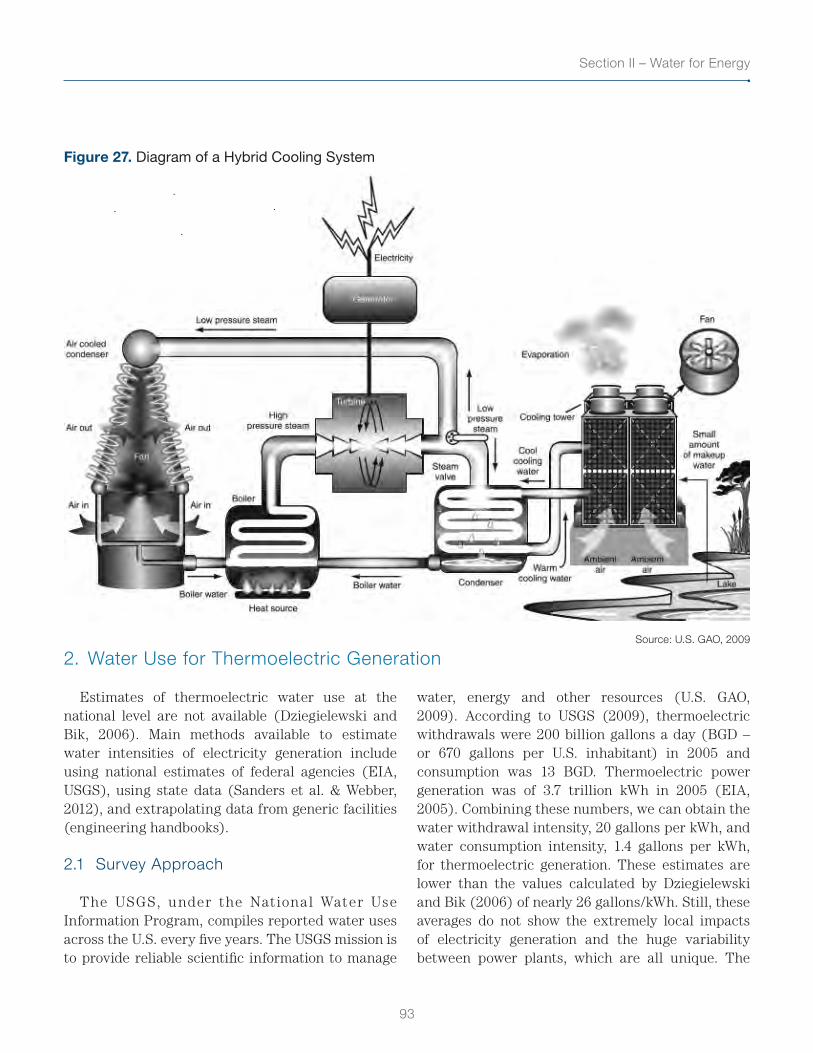
93
Section II – Water for Energy
Figure 27. Diagram of a Hybrid Cooling System
Source: U.S. GAO, 2009
2. Water Use for Thermoelectric Generation
Estimates of thermoelectric water use at the national level are not available (Dziegielewski and Bik, 2006). Main methods available to estimate water intensities of electricity generation include using national estimates of federal agencies (EIA, USGS), using state data (Sanders et al. & Webber, 2012), and extrapolating data from generic facilities (engineering handbooks).
2.1 Survey Approach
The USGS, under the Nat iona l Water Use Information Program, compiles reported water uses across the U.S. every five years. The USGS mission is to provide reliable scientific information to manage
water, energy and other resources (U.S. GAO, 2009). According to USGS (2009), thermoelectric withdrawals were 200 billion gallons a day (BGD – or 670 gallons per U.S. inhabitant) in 2005 and consumption was 13 BGD. Thermoelectric power generation was of 3.7 trillion kWh in 2005 (EIA, 2005). Combining these numbers, we can obtain the water withdrawal intensity, 20 gallons per kWh, and water consumption intensity, 1.4 gallons per kWh, for thermoelectric generation. These estimates are lower than the values calculated by Dziegielewski and Bik (2006) of nearly 26 gallons/kWh. Still, these averages do not show the extremely local impacts of electricity generation and the huge variability between power plants, which are all unique. The
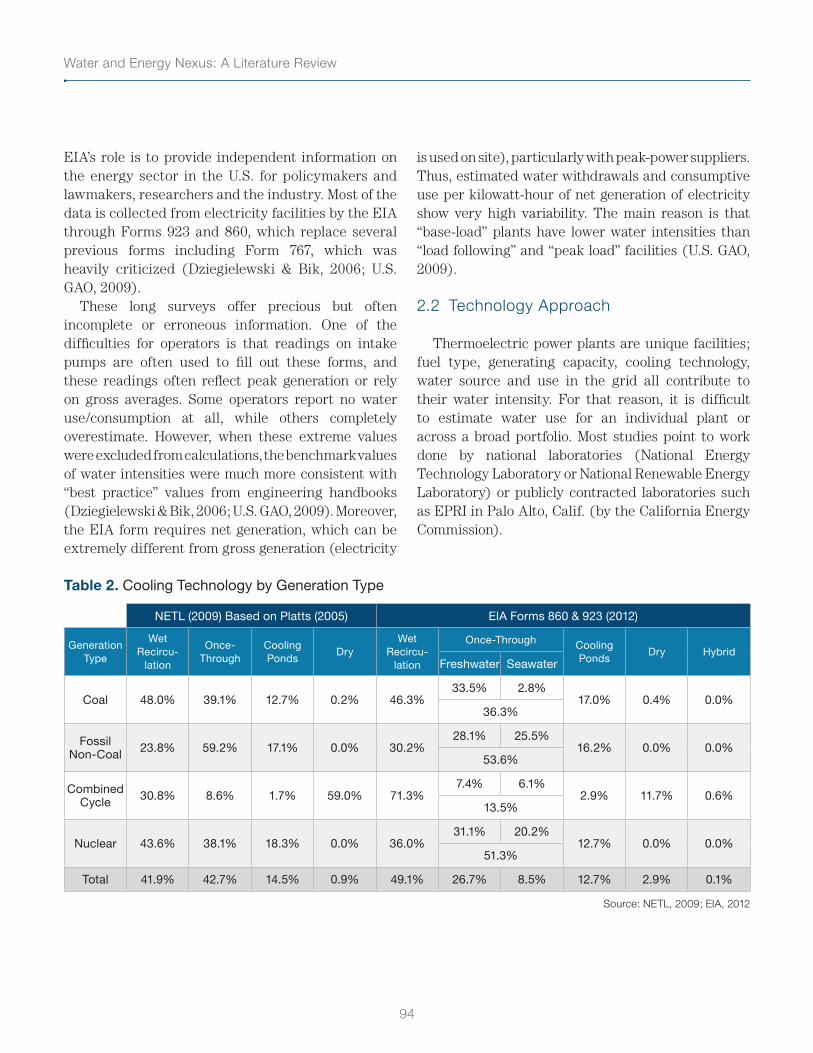
Water and Energy Nexus: A Literature Review
94
EIA’s role is to provide independent information on the energy sector in the U.S. for policymakers and lawmakers, researchers and the industry. Most of the data is collected from electricity facilities by the EIA through Forms 923 and 860, which replace several previous forms including Form 767, which was heavily criticized (Dziegielewski & Bik, 2006; U.S. GAO, 2009).
These long surveys offer precious but often incomplete or erroneous information. One of the difficulties for operators is that readings on intake pumps are often used to fill out these forms, and these readings often reflect peak generation or rely on gross averages. Some operators report no water use/consumption at all, while others completely overestimate. However, when these extreme values were excluded from calculations, the benchmark values of water intensities were much more consistent with “best practice” values from engineering handbooks (Dziegielewski & Bik, 2006; U.S. GAO, 2009). Moreover, the EIA form requires net generation, which can be extremely different from gross generation (electricity
is used on site), particularly with peak-power suppliers. Thus, estimated water withdrawals and consumptive use per kilowatt-hour of net generation of electricity show very high variability. The main reason is that “base-load” plants have lower water intensities than “load following” and “peak load” facilities (U.S. GAO, 2009).
2.2 Technology Approach
Thermoelectric power plants are unique facilities; fuel type, generating capacity, cooling technology, water source and use in the grid all contribute to their water intensity. For that reason, it is difficult to estimate water use for an individual plant or across a broad portfolio. Most studies point to work done by national laboratories (National Energy Technology Laboratory or National Renewable Energy Laboratory) or publicly contracted laboratories such as EPRI in Palo Alto, Calif. (by the California Energy Commission).
Table 2. Cooling Technology by Generation Type
NETL (2009) Based on Platts (2005) EIA Forms 860 & 923 (2012)
Generation Type
Wet Recircu-
lation
Once- Through
Cooling Ponds Dry
Wet Recircu-
lation
Once-Through Cooling Ponds Dry Hybrid
Freshwater Seawater
Coal 48.0% 39.1% 12.7% 0.2% 46.3%33.5% 2.8%
17.0% 0.4% 0.0%36.3%
Fossil Non-Coal 23.8% 59.2% 17.1% 0.0% 30.2%
28.1% 25.5%16.2% 0.0% 0.0%
53.6%
Combined Cycle 30.8% 8.6% 1.7% 59.0% 71.3%
7.4% 6.1%2.9% 11.7% 0.6%
13.5%
Nuclear 43.6% 38.1% 18.3% 0.0% 36.0%31.1% 20.2%
12.7% 0.0% 0.0%51.3%
Total 41.9% 42.7% 14.5% 0.9% 49.1% 26.7% 8.5% 12.7% 2.9% 0.1%
Source: NETL, 2009; EIA, 2012
95
Section II – Water for Energy
Table 2 shows the NETL values for cooling technologies by generation type (from Platts, 2005) and the values based on EIA Forms 860 and 923. The information extracted from EIA information is based on generated electricity in 2011 and not nameplate. This information should be explicitly published by the EIA, being of importance to understand the water intensity of electricity generation. Table 3 summarizes the results of different studies and literature reviews examining the water intensities of different thermoelectric facilities. The results of this analysis show the strong variability within fuel types and cooling types. It also highlights the distinction between water consumption and water withdrawals for these different technologies.
i. Fossil Fuels (Coal, Natural Gas, Oil, Biomass)Fossil-fuel plants often have similar thermal
efficiencies and display similar technologies (Integrated Gasification Combined Cycle and Natural Gas Combined Cycle excluded). However, the overall system efficiencies are extremely dependent on the steam pressure at the outlet of the generating turbine. Coal-fired power plants tend to withdraw and consume more water than natural gas-fired plants. This is partially due to the fact that additional water is used in coal-fired power plants for dust suppression, ash handling, flue-gas desulfurization and other plant operations; and also because natural gas combined cycle plants are partially air-cooled (the gas turbine part) (Gleick, 1994).
Steam turbine (coal, gas, biomass) (gal/kWh)
Once-through Closed-loop Dry
Low High Ave. Low High Ave. Low High Ave.
Withdrawal
10.00 60.00 35.00 0.10 1.46 0.64 0.00 0.03 0.00
Consumption
0.09 0.14 0.11 0.16 1.17 0.56 0.00 0.03 0.00
ii. NuclearNuclear power plants typically withdraw and
consume more water than fossil-fuel plants. This is mainly due to technological characteristics and restrictions. Fossil-fuel plants can discharge waste heat through flue gas and there are limits to maximum steam temperature (Gleick, 1994). Many U.S. nuclear power plants built in the 1970s also have once-through cooling, which is the most water-intensive form of energy production. Some of these nuclear power plants use saltwater, which is water withdrawal-intensive, but not water consumption-intensive (although entrainment and impingement are notable environmental impacts).
Steam turbine (nuclear) (gal/kWh)
Once-through Closed-loop
Low High Ave. Low High Ave.
Withdrawal
25 61 42 0.53 2.60 1.25
Consumption
0.10 0.43 0.31 0.40 0.90 0.86
iii. Advanced Natural Gas TechnologiesNew generations of natural gas facilities, using
combined-cycle gas turbines, are much less water-intensive and have higher efficiencies than traditional natural gas power plants. These power plants combine a gas turbine and a steam turbine, powered by heat drawn from flue gas of the gas turbine. These facilities have higher capital costs.
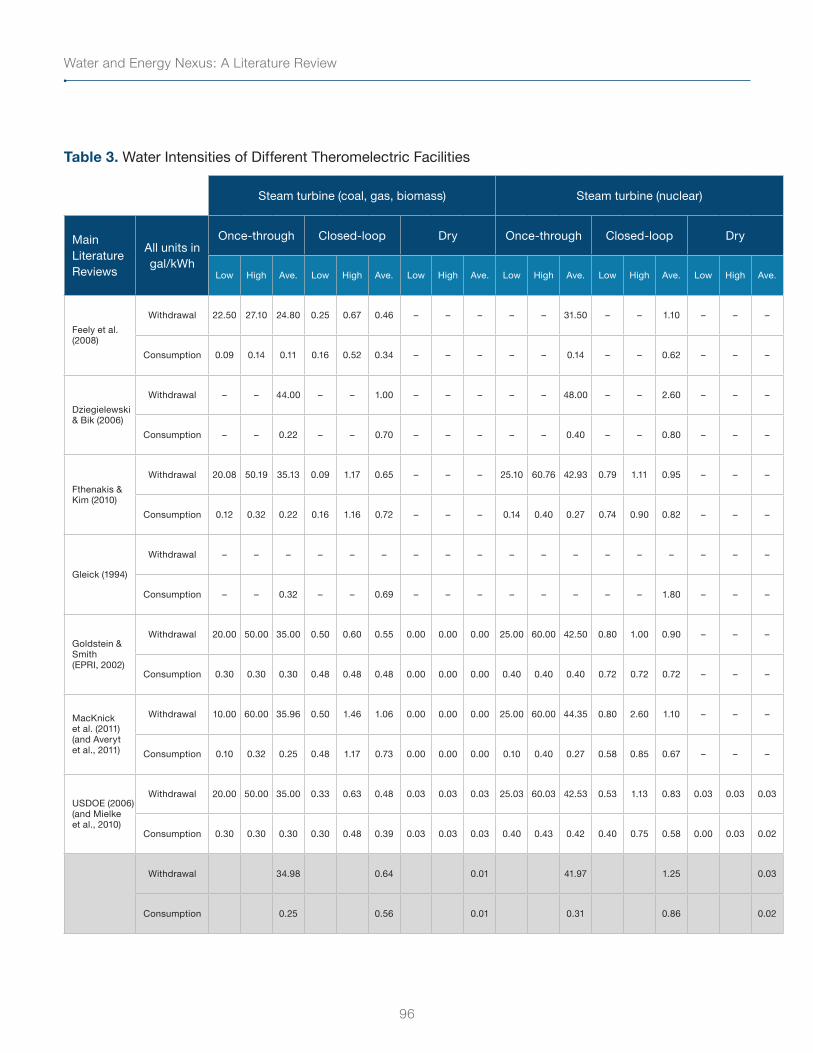
Water and Energy Nexus: A Literature Review
96
Table 3. Water Intensities of Different Theromelectric Facilities
Steam turbine (coal, gas, biomass) Steam turbine (nuclear) Combined-cycle gas turbine IGCC (coal) Geothermal Steam Solar trough Solar tower
SourcesMain Literature Reviews
All units in gal/kWh
Once-through Closed-loop Dry Once-through Closed-loop Dry Once-through Closed-loop Dry Closed-loop Closed-loop Closed-loop Closed-loop
Low High Ave. Low High Ave. Low High Ave. Low High Ave. Low High Ave. Low High Ave. Low High Ave. Low High Ave. Low High Ave. Low High Ave. Low High Ave. Low High Ave. Low High Ave.
Feely et al. (2008)
Withdrawal 22.50 27.10 24.80 0.25 0.67 0.46 – – – – – 31.50 – – 1.10 – – – – – 9.01 – – 0.15 – – – – – 0.23 – – – – – – – – –NETL (2006), EIA
AEO 2006, EIA-860Consumption 0.09 0.14 0.11 0.16 0.52 0.34 – – – – – 0.14 – – 0.62 – – – – – 0.00 – – 0.13 – – – – – 0.17 – – – – – – – – –
Dziegielewski & Bik (2006)
Withdrawal – – 44.00 – – 1.00 – – – – – 48.00 – – 2.60 – – – – – – – – – – – – – – – – – – – – – – – –Form EIA-767
(USDOE)Consumption – – 0.22 – – 0.70 – – – – – 0.40 – – 0.80 – – – – – – – – – – – – – – – – – – – – – – – –
Fthenakis & Kim (2010)
Withdrawal 20.08 50.19 35.13 0.09 1.17 0.65 – – – 25.10 60.76 42.93 0.79 1.11 0.95 – – – 7.40 20.08 11.37 0.15 0.50 0.29 – – 0.00 0.23 0.82 0.41 1.80 2.00 1.90 0.82 1.00 0.91 0.77 0.85 0.81 NETL (2009), EPRI (2002), NETL (2007),
NETL (2005), USDOE (2006)Consumption 0.12 0.32 0.22 0.16 1.16 0.72 – – – 0.14 0.40 0.27 0.74 0.90 0.82 – – – 0.02 0.10 0.06 0.13 0.50 0.31 – – 0.00 0.17 0.83 0.37 1.40 1.80 1.60 0.82 1.00 0.91 0.77 0.85 0.81
Gleick (1994)
Withdrawal – – – – – – – – – – – – – – – – – – – – – – – – – – – – – – – – – – – – – – –
Consumption – – 0.32 – – 0.69 – – – – – – – – 1.80 – – – – – – – – – – – – – – – – – 1.80 – – 1.06 – – –
Goldstein & Smith (EPRI, 2002)
Withdrawal 20.00 50.00 35.00 0.50 0.60 0.55 0.00 0.00 0.00 25.00 60.00 42.50 0.80 1.00 0.90 – – – 7.50 20.00 13.75 0.23 0.23 0.23 0.00 0.00 0.00 – – – – – – – – – – – – EPRI reports, federal agencies (NRC, EIA,
USGS), engineer-ing handbooksConsumption 0.30 0.30 0.30 0.48 0.48 0.48 0.00 0.00 0.00 0.40 0.40 0.40 0.72 0.72 0.72 – – – 0.10 0.10 0.10 0.18 0.18 0.18 0.00 0.00 0.00 – – – – – – – – – – – –
MacKnick et al. (2011) (and Averyt et al., 2011)
Withdrawal 10.00 60.00 35.96 0.50 1.46 1.06 0.00 0.00 0.00 25.00 60.00 44.35 0.80 2.60 1.10 – – – 7.50 20.00 11.38 0.15 0.28 0.25 0.00 0.00 0.00 0.36 0.68 0.53 – – – – – – – – – EPRI (2002), NETL (2009), NETL (2010),
USDOE (2006), Gleick (1994) and othersConsumption 0.10 0.32 0.25 0.48 1.17 0.73 0.00 0.00 0.00 0.10 0.40 0.27 0.58 0.85 0.67 – – – 0.02 0.10 0.10 0.13 0.30 0.20 0.00 0.00 0.00 0.32 0.44 0.37 0.01 3.96 1.98 0.73 1.06 0.87 0.74 0.86 0.79
USDOE (2006) (and Mielke et al., 2010)
Withdrawal 20.00 50.00 35.00 0.33 0.63 0.48 0.03 0.03 0.03 25.03 60.03 42.53 0.53 1.13 0.83 0.03 0.03 0.03 7.53 20.03 13.78 0.26 0.26 0.26 0.03 0.03 0.03 0.39 0.39 0.39 2.00 2.00 2.00 0.76 0.92 0.84 0.75 0.75 0.75 EPRI (2002), CEC (2002), CEC (2006),
Grande (2005), Leitner (2002),
Cohen et al. (1999)Consumption 0.30 0.30 0.30 0.30 0.48 0.39 0.03 0.03 0.03 0.40 0.43 0.42 0.40 0.75 0.58 0.00 0.03 0.02 0.10 0.13 0.12 0.18 0.21 0.20 0.00 0.03 0.02 0.34 0.40 0.37 1.40 1.40 1.40 0.76 0.92 0.84 0.75 0.75 0.75
Withdrawal 34.98 0.64 0.01 41.97 1.25 0.03 11.86 0.24 0.01 0.39 1.95 0.88 0.78
Consumption 0.25 0.56 0.01 0.31 0.86 0.02 0.08 0.20 0.01 0.32 1.70 0.92 0.78

97
Section II – Water for Energy
Table 3. Water Intensities of Different Theromelectric Facilities
Steam turbine (coal, gas, biomass) Steam turbine (nuclear) Combined-cycle gas turbine IGCC (coal) Geothermal Steam Solar trough Solar tower
SourcesMain Literature Reviews
All units in gal/kWh
Once-through Closed-loop Dry Once-through Closed-loop Dry Once-through Closed-loop Dry Closed-loop Closed-loop Closed-loop Closed-loop
Low High Ave. Low High Ave. Low High Ave. Low High Ave. Low High Ave. Low High Ave. Low High Ave. Low High Ave. Low High Ave. Low High Ave. Low High Ave. Low High Ave. Low High Ave.
Feely et al. (2008)
Withdrawal 22.50 27.10 24.80 0.25 0.67 0.46 – – – – – 31.50 – – 1.10 – – – – – 9.01 – – 0.15 – – – – – 0.23 – – – – – – – – –NETL (2006), EIA
AEO 2006, EIA-860Consumption 0.09 0.14 0.11 0.16 0.52 0.34 – – – – – 0.14 – – 0.62 – – – – – 0.00 – – 0.13 – – – – – 0.17 – – – – – – – – –
Dziegielewski & Bik (2006)
Withdrawal – – 44.00 – – 1.00 – – – – – 48.00 – – 2.60 – – – – – – – – – – – – – – – – – – – – – – – –Form EIA-767
(USDOE)Consumption – – 0.22 – – 0.70 – – – – – 0.40 – – 0.80 – – – – – – – – – – – – – – – – – – – – – – – –
Fthenakis & Kim (2010)
Withdrawal 20.08 50.19 35.13 0.09 1.17 0.65 – – – 25.10 60.76 42.93 0.79 1.11 0.95 – – – 7.40 20.08 11.37 0.15 0.50 0.29 – – 0.00 0.23 0.82 0.41 1.80 2.00 1.90 0.82 1.00 0.91 0.77 0.85 0.81 NETL (2009), EPRI (2002), NETL (2007),
NETL (2005), USDOE (2006)Consumption 0.12 0.32 0.22 0.16 1.16 0.72 – – – 0.14 0.40 0.27 0.74 0.90 0.82 – – – 0.02 0.10 0.06 0.13 0.50 0.31 – – 0.00 0.17 0.83 0.37 1.40 1.80 1.60 0.82 1.00 0.91 0.77 0.85 0.81
Gleick (1994)
Withdrawal – – – – – – – – – – – – – – – – – – – – – – – – – – – – – – – – – – – – – – –
Consumption – – 0.32 – – 0.69 – – – – – – – – 1.80 – – – – – – – – – – – – – – – – – 1.80 – – 1.06 – – –
Goldstein & Smith (EPRI, 2002)
Withdrawal 20.00 50.00 35.00 0.50 0.60 0.55 0.00 0.00 0.00 25.00 60.00 42.50 0.80 1.00 0.90 – – – 7.50 20.00 13.75 0.23 0.23 0.23 0.00 0.00 0.00 – – – – – – – – – – – – EPRI reports, federal agencies (NRC, EIA,
USGS), engineer-ing handbooksConsumption 0.30 0.30 0.30 0.48 0.48 0.48 0.00 0.00 0.00 0.40 0.40 0.40 0.72 0.72 0.72 – – – 0.10 0.10 0.10 0.18 0.18 0.18 0.00 0.00 0.00 – – – – – – – – – – – –
MacKnick et al. (2011) (and Averyt et al., 2011)
Withdrawal 10.00 60.00 35.96 0.50 1.46 1.06 0.00 0.00 0.00 25.00 60.00 44.35 0.80 2.60 1.10 – – – 7.50 20.00 11.38 0.15 0.28 0.25 0.00 0.00 0.00 0.36 0.68 0.53 – – – – – – – – – EPRI (2002), NETL (2009), NETL (2010),
USDOE (2006), Gleick (1994) and othersConsumption 0.10 0.32 0.25 0.48 1.17 0.73 0.00 0.00 0.00 0.10 0.40 0.27 0.58 0.85 0.67 – – – 0.02 0.10 0.10 0.13 0.30 0.20 0.00 0.00 0.00 0.32 0.44 0.37 0.01 3.96 1.98 0.73 1.06 0.87 0.74 0.86 0.79
USDOE (2006) (and Mielke et al., 2010)
Withdrawal 20.00 50.00 35.00 0.33 0.63 0.48 0.03 0.03 0.03 25.03 60.03 42.53 0.53 1.13 0.83 0.03 0.03 0.03 7.53 20.03 13.78 0.26 0.26 0.26 0.03 0.03 0.03 0.39 0.39 0.39 2.00 2.00 2.00 0.76 0.92 0.84 0.75 0.75 0.75 EPRI (2002), CEC (2002), CEC (2006),
Grande (2005), Leitner (2002),
Cohen et al. (1999)Consumption 0.30 0.30 0.30 0.30 0.48 0.39 0.03 0.03 0.03 0.40 0.43 0.42 0.40 0.75 0.58 0.00 0.03 0.02 0.10 0.13 0.12 0.18 0.21 0.20 0.00 0.03 0.02 0.34 0.40 0.37 1.40 1.40 1.40 0.76 0.92 0.84 0.75 0.75 0.75
Withdrawal 34.98 0.64 0.01 41.97 1.25 0.03 11.86 0.24 0.01 0.39 1.95 0.88 0.78
Consumption 0.25 0.56 0.01 0.31 0.86 0.02 0.08 0.20 0.01 0.32 1.70 0.92 0.78
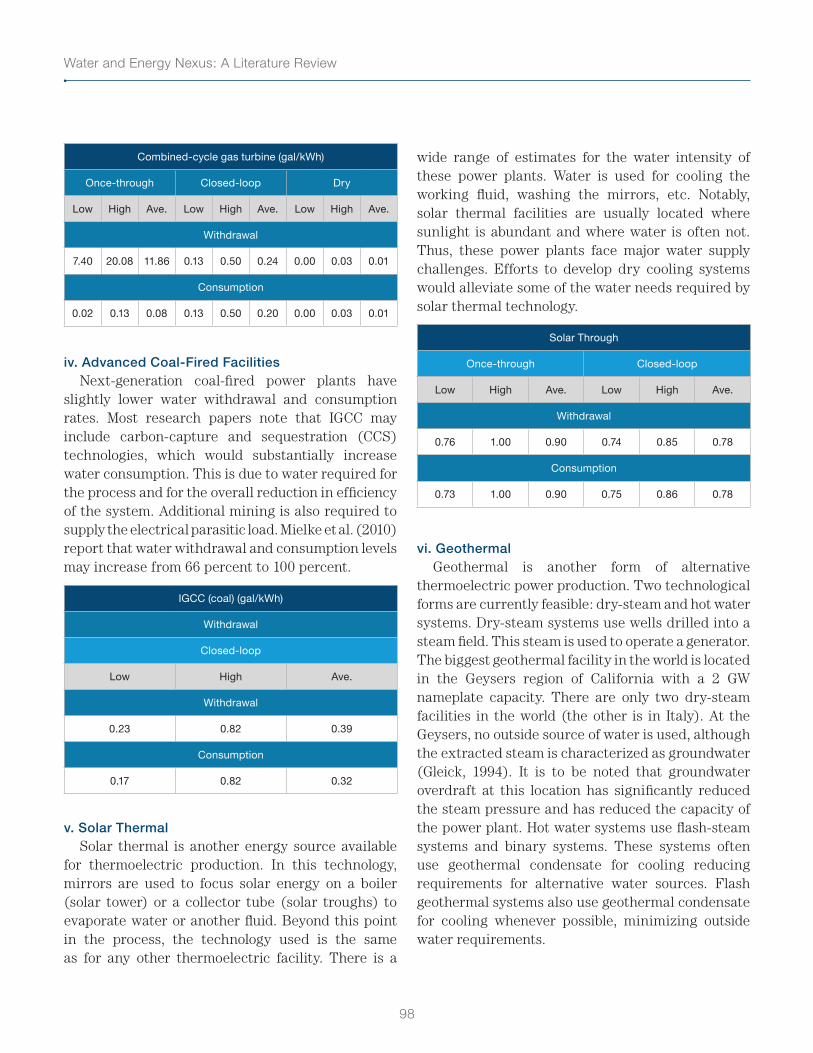
Water and Energy Nexus: A Literature Review
98
Combined-cycle gas turbine (gal/kWh)
Once-through Closed-loop Dry
Low High Ave. Low High Ave. Low High Ave.
Withdrawal
7.40 20.08 11.86 0.13 0.50 0.24 0.00 0.03 0.01
Consumption
0.02 0.13 0.08 0.13 0.50 0.20 0.00 0.03 0.01
iv. Advanced Coal-Fired FacilitiesNext-generation coal-fired power plants have
slightly lower water withdrawal and consumption rates. Most research papers note that IGCC may include carbon-capture and sequestration (CCS) technologies, which would substantially increase water consumption. This is due to water required for the process and for the overall reduction in efficiency of the system. Additional mining is also required to supply the electrical parasitic load. Mielke et al. (2010) report that water withdrawal and consumption levels may increase from 66 percent to 100 percent.
IGCC (coal) (gal/kWh)
Withdrawal
Closed-loop
Low High Ave.
Withdrawal
0.23 0.82 0.39
Consumption
0.17 0.82 0.32
v. Solar ThermalSolar thermal is another energy source available
for thermoelectric production. In this technology, mirrors are used to focus solar energy on a boiler (solar tower) or a collector tube (solar troughs) to evaporate water or another fluid. Beyond this point in the process, the technology used is the same as for any other thermoelectric facility. There is a
wide range of estimates for the water intensity of these power plants. Water is used for cooling the working fluid, washing the mirrors, etc. Notably, solar thermal facilities are usually located where sunlight is abundant and where water is often not. Thus, these power plants face major water supply challenges. Efforts to develop dry cooling systems would alleviate some of the water needs required by solar thermal technology.
Solar Through
Once-through Closed-loop
Low High Ave. Low High Ave.
Withdrawal
0.76 1.00 0.90 0.74 0.85 0.78
Consumption
0.73 1.00 0.90 0.75 0.86 0.78
vi. GeothermalGeothermal is another form of alternative
thermoelectric power production. Two technological forms are currently feasible: dry-steam and hot water systems. Dry-steam systems use wells drilled into a steam field. This steam is used to operate a generator. The biggest geothermal facility in the world is located in the Geysers region of California with a 2 GW nameplate capacity. There are only two dry-steam facilities in the world (the other is in Italy). At the Geysers, no outside source of water is used, although the extracted steam is characterized as groundwater (Gleick, 1994). It is to be noted that groundwater overdraft at this location has significantly reduced the steam pressure and has reduced the capacity of the power plant. Hot water systems use flash-steam systems and binary systems. These systems often use geothermal condensate for cooling reducing requirements for alternative water sources. Flash geothermal systems also use geothermal condensate for cooling whenever possible, minimizing outside water requirements.
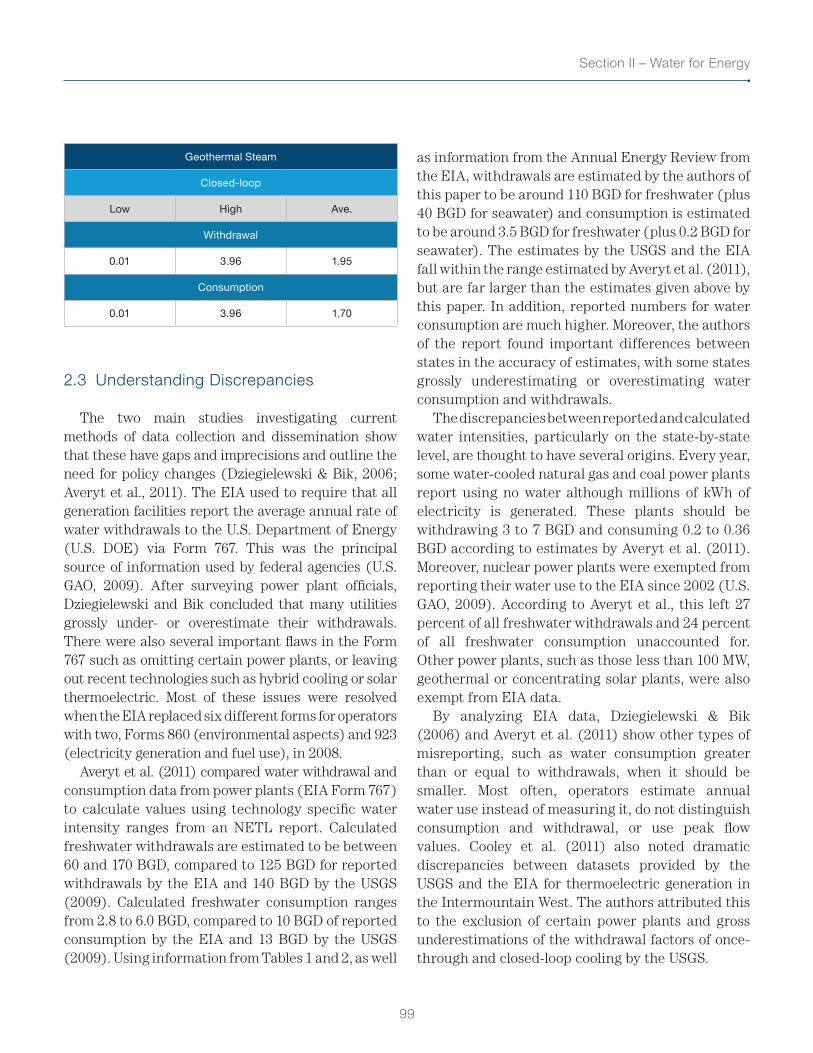
99
Section II – Water for Energy
Geothermal Steam
Closed-loop
Low High Ave.
Withdrawal
0.01 3.96 1.95
Consumption
0.01 3.96 1.70
2.3 Understanding Discrepancies
The two main studies investigating current methods of data collection and dissemination show that these have gaps and imprecisions and outline the need for policy changes (Dziegielewski & Bik, 2006; Averyt et al., 2011). The EIA used to require that all generation facilities report the average annual rate of water withdrawals to the U.S. Department of Energy (U.S. DOE) via Form 767. This was the principal source of information used by federal agencies (U.S. GAO, 2009). After surveying power plant officials, Dziegielewski and Bik concluded that many utilities grossly under- or overestimate their withdrawals. There were also several important flaws in the Form 767 such as omitting certain power plants, or leaving out recent technologies such as hybrid cooling or solar thermoelectric. Most of these issues were resolved when the EIA replaced six different forms for operators with two, Forms 860 (environmental aspects) and 923 (electricity generation and fuel use), in 2008.
Averyt et al. (2011) compared water withdrawal and consumption data from power plants (EIA Form 767) to calculate values using technology specific water intensity ranges from an NETL report. Calculated freshwater withdrawals are estimated to be between 60 and 170 BGD, compared to 125 BGD for reported withdrawals by the EIA and 140 BGD by the USGS (2009). Calculated freshwater consumption ranges from 2.8 to 6.0 BGD, compared to 10 BGD of reported consumption by the EIA and 13 BGD by the USGS (2009). Using information from Tables 1 and 2, as well
as information from the Annual Energy Review from the EIA, withdrawals are estimated by the authors of this paper to be around 110 BGD for freshwater (plus 40 BGD for seawater) and consumption is estimated to be around 3.5 BGD for freshwater (plus 0.2 BGD for seawater). The estimates by the USGS and the EIA fall within the range estimated by Averyt et al. (2011), but are far larger than the estimates given above by this paper. In addition, reported numbers for water consumption are much higher. Moreover, the authors of the report found important differences between states in the accuracy of estimates, with some states grossly underestimating or overestimating water consumption and withdrawals.
The discrepancies between reported and calculated water intensities, particularly on the state-by-state level, are thought to have several origins. Every year, some water-cooled natural gas and coal power plants report using no water although millions of kWh of electricity is generated. These plants should be withdrawing 3 to 7 BGD and consuming 0.2 to 0.36 BGD according to estimates by Averyt et al. (2011). Moreover, nuclear power plants were exempted from reporting their water use to the EIA since 2002 (U.S. GAO, 2009). According to Averyt et al., this left 27 percent of all freshwater withdrawals and 24 percent of all freshwater consumption unaccounted for. Other power plants, such as those less than 100 MW, geothermal or concentrating solar plants, were also exempt from EIA data.
By analyzing EIA data, Dziegielewski & Bik (2006) and Averyt et al. (2011) show other types of misreporting, such as water consumption greater than or equal to withdrawals, when it should be smaller. Most often, operators estimate annual water use instead of measuring it, do not distinguish consumption and withdrawal, or use peak flow values. Cooley et al. (2011) also noted dramatic discrepancies between datasets provided by the USGS and the EIA for thermoelectric generation in the Intermountain West. The authors attributed this to the exclusion of certain power plants and gross underestimations of the withdrawal factors of once-through and closed-loop cooling by the USGS.
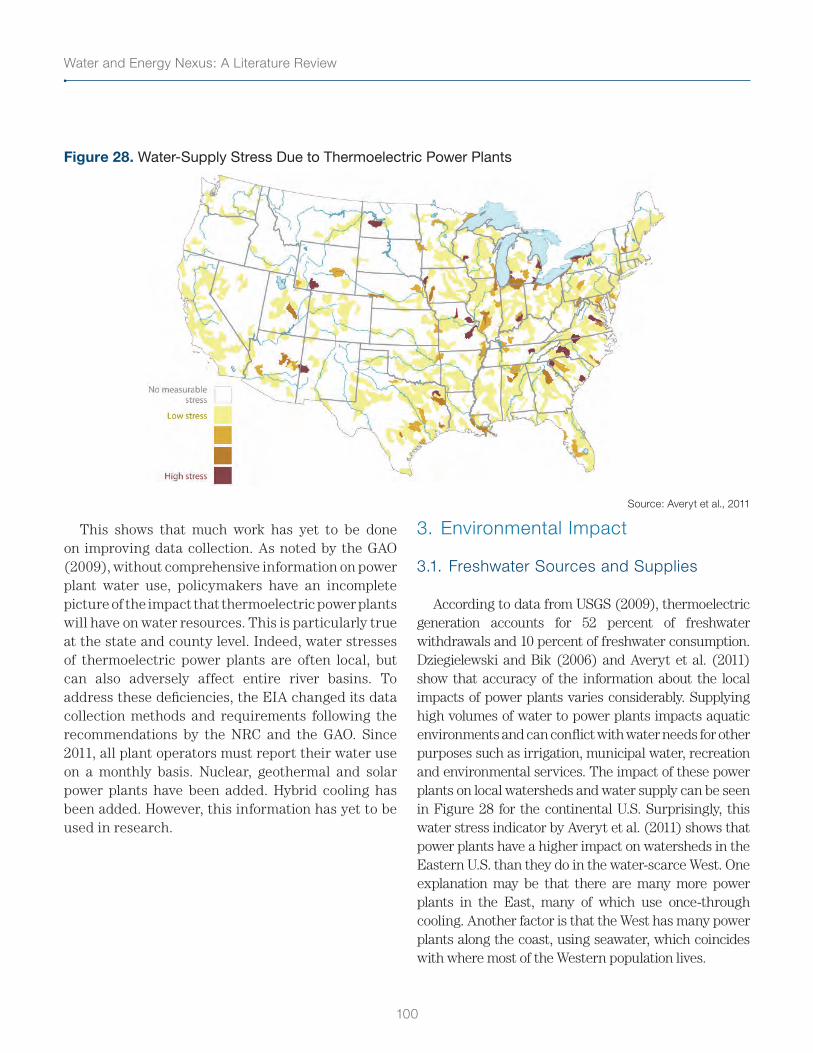
Water and Energy Nexus: A Literature Review
100
Figure 28. Water-Supply Stress Due to Thermoelectric Power Plants
Source: Averyt et al., 2011
This shows that much work has yet to be done on improving data collection. As noted by the GAO (2009), without comprehensive information on power plant water use, policymakers have an incomplete picture of the impact that thermoelectric power plants will have on water resources. This is particularly true at the state and county level. Indeed, water stresses of thermoelectric power plants are often local, but can also adversely affect entire river basins. To address these deficiencies, the EIA changed its data collection methods and requirements following the recommendations by the NRC and the GAO. Since 2011, all plant operators must report their water use on a monthly basis. Nuclear, geothermal and solar power plants have been added. Hybrid cooling has been added. However, this information has yet to be used in research.
3. Environmental Impact
3.1. Freshwater Sources and Supplies
According to data from USGS (2009), thermoelectric generation accounts for 52 percent of freshwater withdrawals and 10 percent of freshwater consumption. Dziegielewski and Bik (2006) and Averyt et al. (2011) show that accuracy of the information about the local impacts of power plants varies considerably. Supplying high volumes of water to power plants impacts aquatic environments and can conflict with water needs for other purposes such as irrigation, municipal water, recreation and environmental services. The impact of these power plants on local watersheds and water supply can be seen in Figure 28 for the continental U.S. Surprisingly, this water stress indicator by Averyt et al. (2011) shows that power plants have a higher impact on watersheds in the Eastern U.S. than they do in the water-scarce West. One explanation may be that there are many more power plants in the East, many of which use once-through cooling. Another factor is that the West has many power plants along the coast, using seawater, which coincides with where most of the Western population lives.
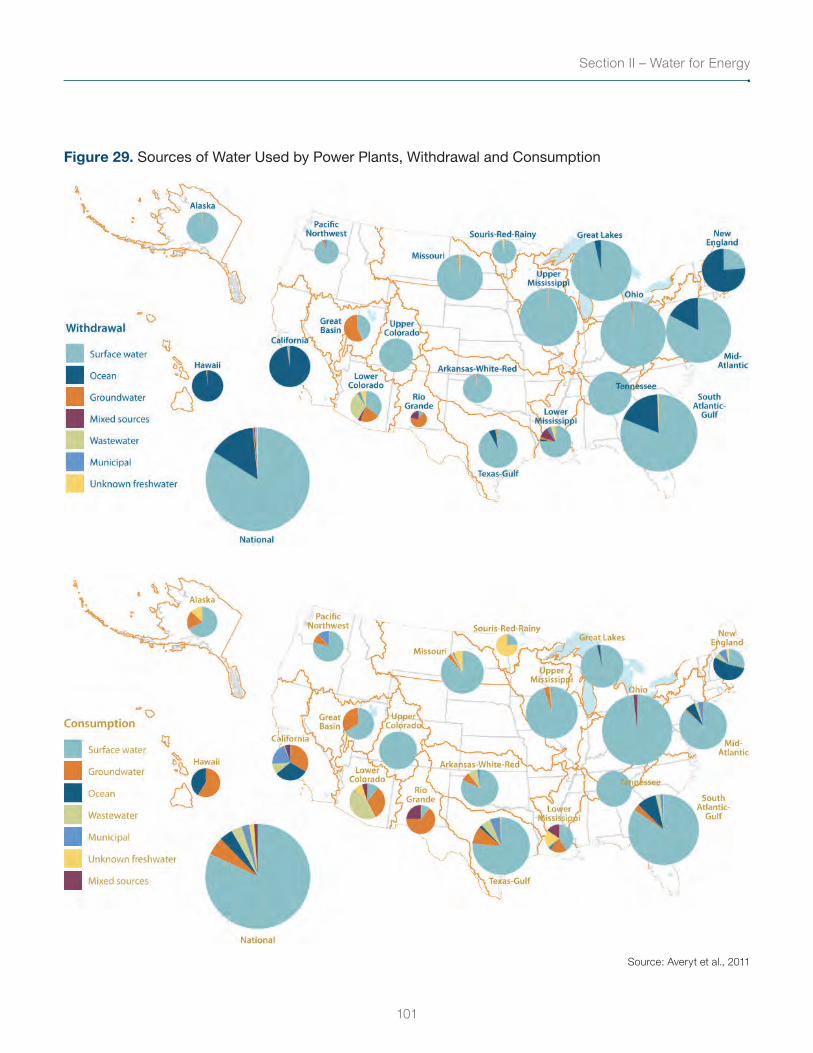
101
Section II – Water for Energy
Figure 29. Sources of Water Used by Power Plants, Withdrawal and Consumption
Source: Averyt et al., 2011
Water and Energy Nexus: A Literature Review
102
Most power plants using wet technologies are located near a large water body. Averyt et al. (2011) report that these sources, such as a river, a lake or ocean, account for 94 percent of water withdrawals, and roughly 86 percent of consumption, by thermoelectric power plants. Other sources are groundwater, treated wastewater or municipal sources. These sources are often used where surface water is scarce, such as in the Southwest (Figure 29). Wastewater is increasingly used in power plants close to large population areas, such as the 3.3 gigawatt (GW) nuclear power plant in Palo Verde near Phoenix, Ariz. In some of these places, thermoelectric power plants are largely contributing to the overdraft of rapidly declining aquifers (Alley, 2010). A monitoring of these aquifers would provide much-needed information on local impacts of power plants, particularly around the rapidly growing and extremely dry regions around Las Vegas, Phoenix and Tucson, Ariz.
3.2 Water Quality and Aquatic Life
There are significant environmental impacts linked to the water intakes for once-through cooling, although the Clean Water Act requires new plants to utilize the best technology available to minimize these effects. The EPA follows a regulatory schedule (currently in Phase II of III due to litigation) which requires that intake facilities reduce the impingement mortality of aquatic organisms and in some cases must reduce the intake of small aquatic life.
Aside from the fact that power plants are the largest withdrawers of surface freshwater in the U.S., power plants are also the largest dischargers of thermal pollution. Warm water reduces dissolved oxygen and elevates metabolic rates, leading to higher oxygen and food needs. It can also disrupt food chains. There are documented fish kills linked to both effects. In the Great Lakes, for example, it is estimated that power plants kill more than 100 million fish a year due to impingement (trapping against a screen) and 1.3 billion larval fish through entrainment (pulling
through the cooling process) (Averyt et al., 2011). Under the Clean Water Act (2002), plants may be shut down, seasonal restrictions may be applied on water pumping, or additional once-through systems may be prevented where streams and rivers are being impacted by thermal pollution. However, it is to be noted that only 10 percent of power plants (none of which are nuclear power plants) reported temperature data to the EIA in 2008, making it once again very hard to fully assess the impact of thermal pollution on the environment.
During the process of electrical generation in wet systems (closed-loop cooling), treated water used for the boiler, called boiler make-up, enters the boiler and collects impurities over time. To maintain quality, this impurities-laden water is periodically purged from the boiler and is called “boiler blowdown.” Boiler blowdown is usually alkaline and contains the chemical additives used to control scale and corrosion, as well as trace amounts of copper, iron and nickel that leach from boiler parts (Baum et al., 2003). Local regulations may limit disposal options, sometimes requiring alternatives such as brine concentration or evaporation, having a significant impact on the system cost (EPRI, 2002).
Moreover, for daily operations of wet cooling systems, scaling and biofouling chemicals are used, and there are thus concerns over water treatment chemicals and waste streams (EPRI, 2007; Baum et al., 2003). Chlorine and bromine compounds used for biological fouling control can be found in large quantities on site and are often used at high doses. For scaling and fouling, acids and bases (sulfuric acid, sodium hydroxide, hydrated lime) are often used in pH control. Baum et al. (2003) also underlined the presence of copper and other metals in boiler blowdown due to leeching of boilers and pipes. All these aspects of water quality are very poorly understood or researched (Baum et al., 2003; Cooley et al., 2011).
Although indirectly linked to thermoelectric generation, coal power plants also have a large impact on water quality. Indeed, large quantities of water are used for flue-gas desulfurization and ash
103
Section II – Water for Energy
handling (for an overview of water use for these systems, see Grubert et al. [2012] and Grubert & Kitasei [2010]). Water is used in flue-gas scrubbers to remove SO2, which causes acid rain. This water must then be retreated before discharge. According to the EPA, coal fly ash is “one of the largest waste streams generated in the United States.” Coal fly ash is often stored on site with water (ash slurry) in retention ponds. This ash is particularly loaded with heavy metals and naturally occurring radionucleotides. These retention ponds are of great concern, as shown by the TVA Kingston Fossil Plant coal fly ash slurry spill in December 2008, where 1.1 billion gallons of slurry was spilled into the Emory and Clinch Rivers (tributaries of the Tennessee River), causing human and environmental devastation. The volume of the spill gives an idea of the large amount of highly polluted water stocked at these coal-fired facilities.
4. Future Demand and Climate Change
Several recent studies have examined the future water demands of the electricity sector (Feeley et al., 2008; Elcock, 2010; Shuster, 2009; Sovacool & Sovacool, 2009; Cooley et al., 2011). Most groups used projections from the EIA and federal population projections. Under different scenarios (status quo, different types of regulations, mainly coal, mainly natural gas, mainly nuclear, mainly renewables), these groups showed similar results for projections in 2025 to 2035: Electricity generation will increase sharply (by about 20 percent between 2010 and 2035), and water withdrawals are likely to increase or decrease slightly while consumption is expected to increase dramatically, except in cases with expanded use of renewables (Cooley et al., 2011). This can be explained by a shift from once-through cooling to closed-loop cooling technologies.
The water intensity of electricity production is expected to drop as more efficient facilities replace old ones. For example, current trends in the power industry, especially the predominance of natural
gas-fired, combined-cycle plants for new capacity, are decreasing the quantity of water consumed per MWh generated (Goldstein & Smith, 2002). Chandel et al. (2011) studied the impact of climate-change policy on water withdrawals and consumption in the U.S. The impacts on water consumption are approximately the same as the ones stated above if stronger climate-change policy is adopted. However, water intensity of electricity production could rise sharply if carbon capture and sequestration (CCS) is further developed and widely adopted.
However, the impacts from these changes will have very strong regional variations, particularly in the West, which is expected to bear most of the population growth (Sovacool & Sovacool, 2009) and to be the most impacted by climate change (Cooley et al., 2011). Increased population will induce energy and water needs in a region that seems to have exceeded its carrying capacity, increasing the stress on an already dire situation. Several studies noted that due to water limitations, construction and operating permits could be increasingly hard to obtain due to water limitations.
Water-energy conflicts are most important during a drought and “summer water deficits” (Sovacool & Sovacool, 2009), when energy demands are high and water availability is especially low. These extreme weather conditions are likely to be exacerbated by climate change (Cooley et al., 2011). During these heat waves, such as the one in France in 2003 or the recurrent droughts in Texas since 2007, thermoelectric power plants are forced to shut down because of low water availability despite record electricity demand, causing major blackouts (U.S. GAO, 2009; Averyt et al., 2011; Cooley et al., 2011). Finally, rising temperature will negatively affect power plant efficiencies and drive electricity demand for cooling.
5. Conclusion
Aside from collecting better information on water withdrawals and consumption from power plants, there are many fields that need to be addressed by
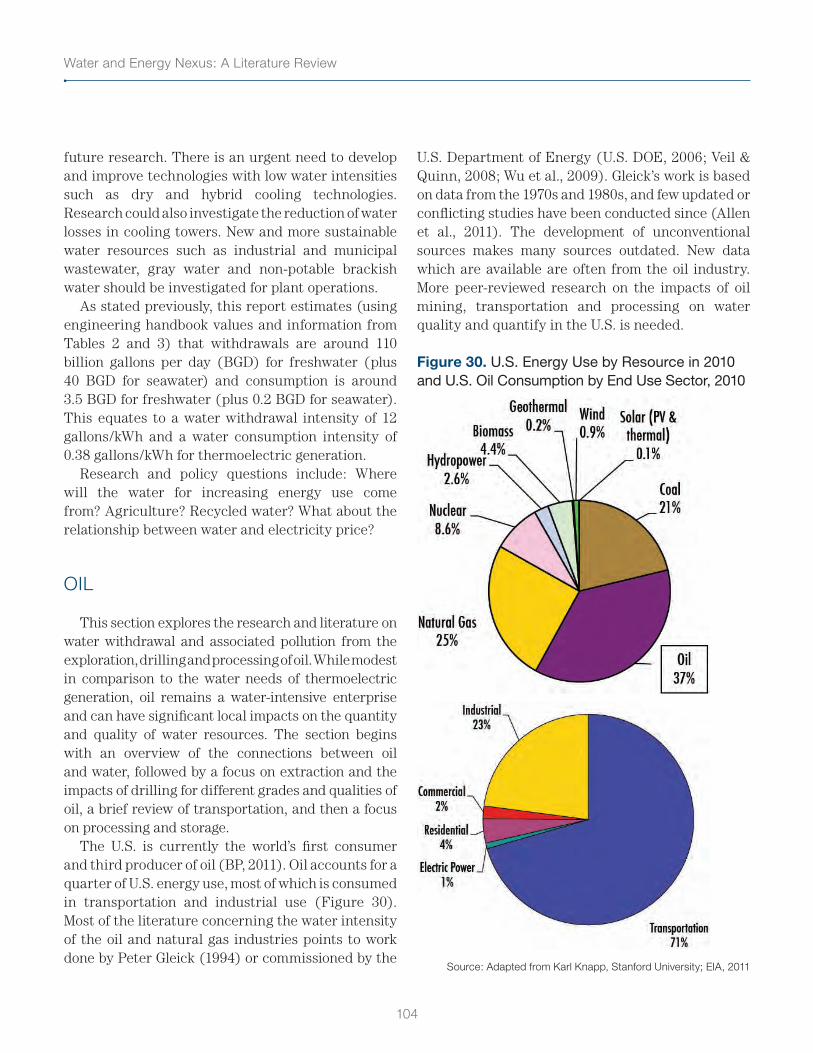
Water and Energy Nexus: A Literature Review
104
future research. There is an urgent need to develop and improve technologies with low water intensities such as dry and hybrid cooling technologies. Research could also investigate the reduction of water losses in cooling towers. New and more sustainable water resources such as industrial and municipal wastewater, gray water and non-potable brackish water should be investigated for plant operations.
As stated previously, this report estimates (using engineering handbook values and information from Tables 2 and 3) that withdrawals are around 110 billion gallons per day (BGD) for freshwater (plus 40 BGD for seawater) and consumption is around 3.5 BGD for freshwater (plus 0.2 BGD for seawater). This equates to a water withdrawal intensity of 12 gallons/kWh and a water consumption intensity of 0.38 gallons/kWh for thermoelectric generation.
Research and policy questions include: Where will the water for increasing energy use come from? Agriculture? Recycled water? What about the relationship between water and electricity price?
OIL
This section explores the research and literature on water withdrawal and associated pollution from the exploration, drilling and processing of oil. While modest in comparison to the water needs of thermoelectric generation, oil remains a water-intensive enterprise and can have significant local impacts on the quantity and quality of water resources. The section begins with an overview of the connections between oil and water, followed by a focus on extraction and the impacts of drilling for different grades and qualities of oil, a brief review of transportation, and then a focus on processing and storage.
The U.S. is currently the world’s first consumer and third producer of oil (BP, 2011). Oil accounts for a quarter of U.S. energy use, most of which is consumed in transportation and industrial use (Figure 30). Most of the literature concerning the water intensity of the oil and natural gas industries points to work done by Peter Gleick (1994) or commissioned by the
U.S. Department of Energy (U.S. DOE, 2006; Veil & Quinn, 2008; Wu et al., 2009). Gleick’s work is based on data from the 1970s and 1980s, and few updated or conflicting studies have been conducted since (Allen et al., 2011). The development of unconventional sources makes many sources outdated. New data which are available are often from the oil industry. More peer-reviewed research on the impacts of oil mining, transportation and processing on water quality and quantify in the U.S. is needed.
Figure 30. U.S. Energy Use by Resource in 2010 and U.S. Oil Consumption by End Use Sector, 2010
Source: Adapted from Karl Knapp, Stanford University; EIA, 2011
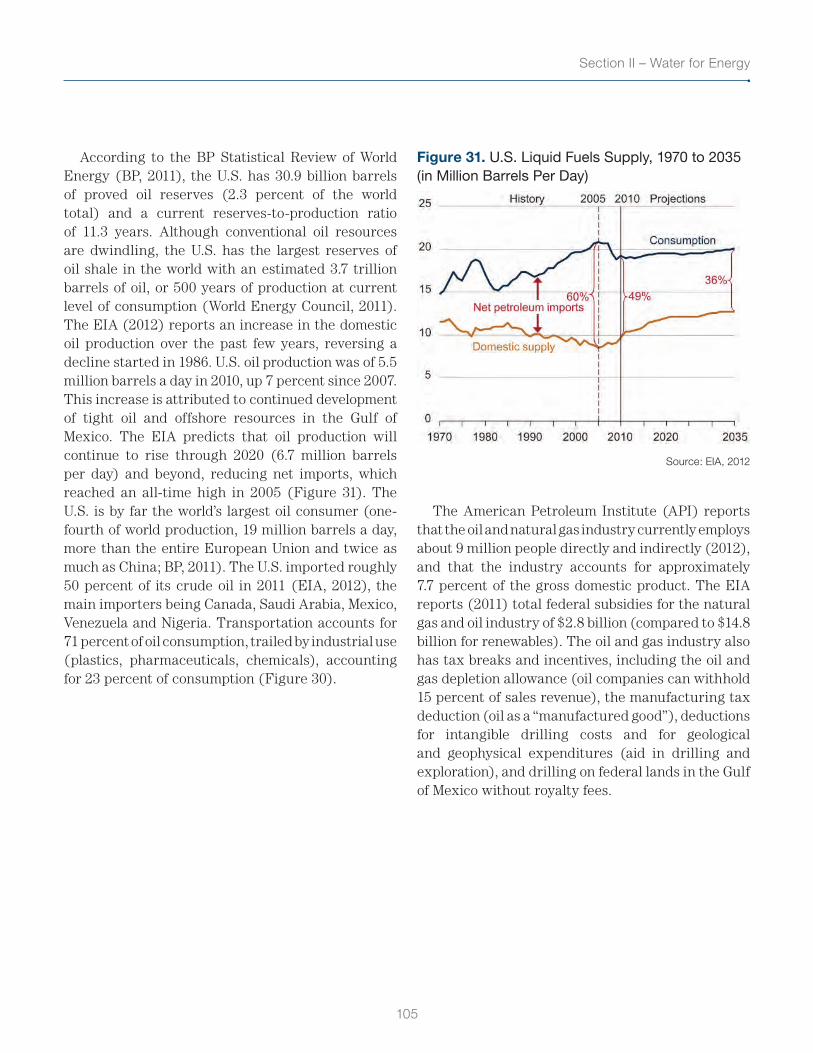
105
Section II – Water for Energy
According to the BP Statistical Review of World Energy (BP, 2011), the U.S. has 30.9 billion barrels of proved oil reserves (2.3 percent of the world total) and a current reserves-to-production ratio of 11.3 years. Although conventional oil resources are dwindling, the U.S. has the largest reserves of oil shale in the world with an estimated 3.7 trillion barrels of oil, or 500 years of production at current level of consumption (World Energy Council, 2011). The EIA (2012) reports an increase in the domestic oil production over the past few years, reversing a decline started in 1986. U.S. oil production was of 5.5 million barrels a day in 2010, up 7 percent since 2007. This increase is attributed to continued development of tight oil and offshore resources in the Gulf of Mexico. The EIA predicts that oil production will continue to rise through 2020 (6.7 million barrels per day) and beyond, reducing net imports, which reached an all-time high in 2005 (Figure 31). The U.S. is by far the world’s largest oil consumer (one-fourth of world production, 19 million barrels a day, more than the entire European Union and twice as much as China; BP, 2011). The U.S. imported roughly 50 percent of its crude oil in 2011 (EIA, 2012), the main importers being Canada, Saudi Arabia, Mexico, Venezuela and Nigeria. Transportation accounts for 71 percent of oil consumption, trailed by industrial use (plastics, pharmaceuticals, chemicals), accounting for 23 percent of consumption (Figure 30).
Figure 31. U.S. Liquid Fuels Supply, 1970 to 2035 (in Million Barrels Per Day)
Source: EIA, 2012
The American Petroleum Institute (API) reports that the oil and natural gas industry currently employs about 9 million people directly and indirectly (2012), and that the industry accounts for approximately 7.7 percent of the gross domestic product. The EIA reports (2011) total federal subsidies for the natural gas and oil industry of $2.8 billion (compared to $14.8 billion for renewables). The oil and gas industry also has tax breaks and incentives, including the oil and gas depletion allowance (oil companies can withhold 15 percent of sales revenue), the manufacturing tax deduction (oil as a “manufactured good”), deductions for intangible drilling costs and for geological and geophysical expenditures (aid in drilling and exploration), and drilling on federal lands in the Gulf of Mexico without royalty fees.
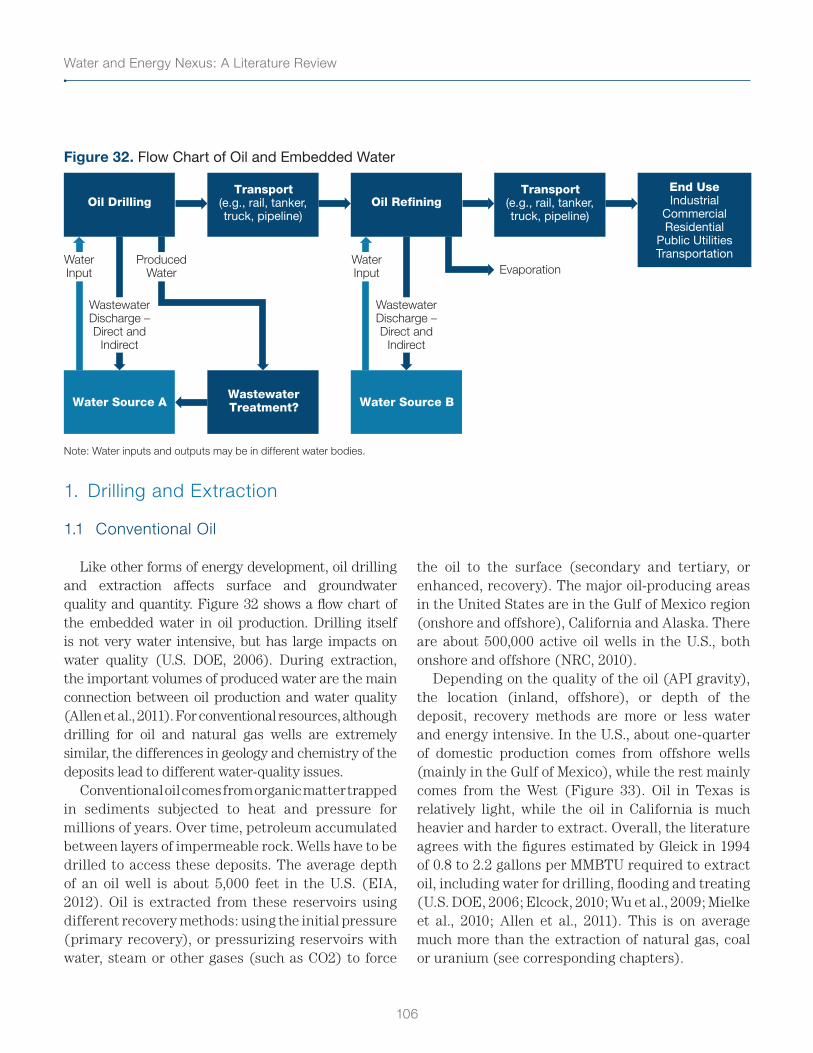
Water and Energy Nexus: A Literature Review
106
Figure 32. Flow Chart of Oil and Embedded Water
Oil Drilling
Water Source A Water Source B
Transport(e.g., rail, tanker,truck, pipeline)
Oil RefiningEnd UseIndustrial
CommercialResidential
Public UtilitiesTransportation
Transport(e.g., rail, tanker,truck, pipeline)
WastewaterTreatment?
WastewaterDischarge –Direct and
Indirect
ProducedWater
WaterInput
WastewaterDischarge –Direct and
Indirect
EvaporationWaterInput
Note: Water inputs and outputs may be in different water bodies.
1. Drilling and Extraction
1.1 Conventional Oil
Like other forms of energy development, oil drilling and extraction affects surface and groundwater quality and quantity. Figure 32 shows a flow chart of the embedded water in oil production. Drilling itself is not very water intensive, but has large impacts on water quality (U.S. DOE, 2006). During extraction, the important volumes of produced water are the main connection between oil production and water quality (Allen et al., 2011). For conventional resources, although drilling for oil and natural gas wells are extremely similar, the differences in geology and chemistry of the deposits lead to different water-quality issues.
Conventional oil comes from organic matter trapped in sediments subjected to heat and pressure for millions of years. Over time, petroleum accumulated between layers of impermeable rock. Wells have to be drilled to access these deposits. The average depth of an oil well is about 5,000 feet in the U.S. (EIA, 2012). Oil is extracted from these reservoirs using different recovery methods: using the initial pressure (primary recovery), or pressurizing reservoirs with water, steam or other gases (such as CO2) to force
the oil to the surface (secondary and tertiary, or enhanced, recovery). The major oil-producing areas in the United States are in the Gulf of Mexico region (onshore and offshore), California and Alaska. There are about 500,000 active oil wells in the U.S., both onshore and offshore (NRC, 2010).
Depending on the quality of the oil (API gravity), the location (inland, offshore), or depth of the deposit, recovery methods are more or less water and energy intensive. In the U.S., about one-quarter of domestic production comes from offshore wells (mainly in the Gulf of Mexico), while the rest mainly comes from the West (Figure 33). Oil in Texas is relatively light, while the oil in California is much heavier and harder to extract. Overall, the literature agrees with the figures estimated by Gleick in 1994 of 0.8 to 2.2 gallons per MMBTU required to extract oil, including water for drilling, flooding and treating (U.S. DOE, 2006; Elcock, 2010; Wu et al., 2009; Mielke et al., 2010; Allen et al., 2011). This is on average much more than the extraction of natural gas, coal or uranium (see corresponding chapters).
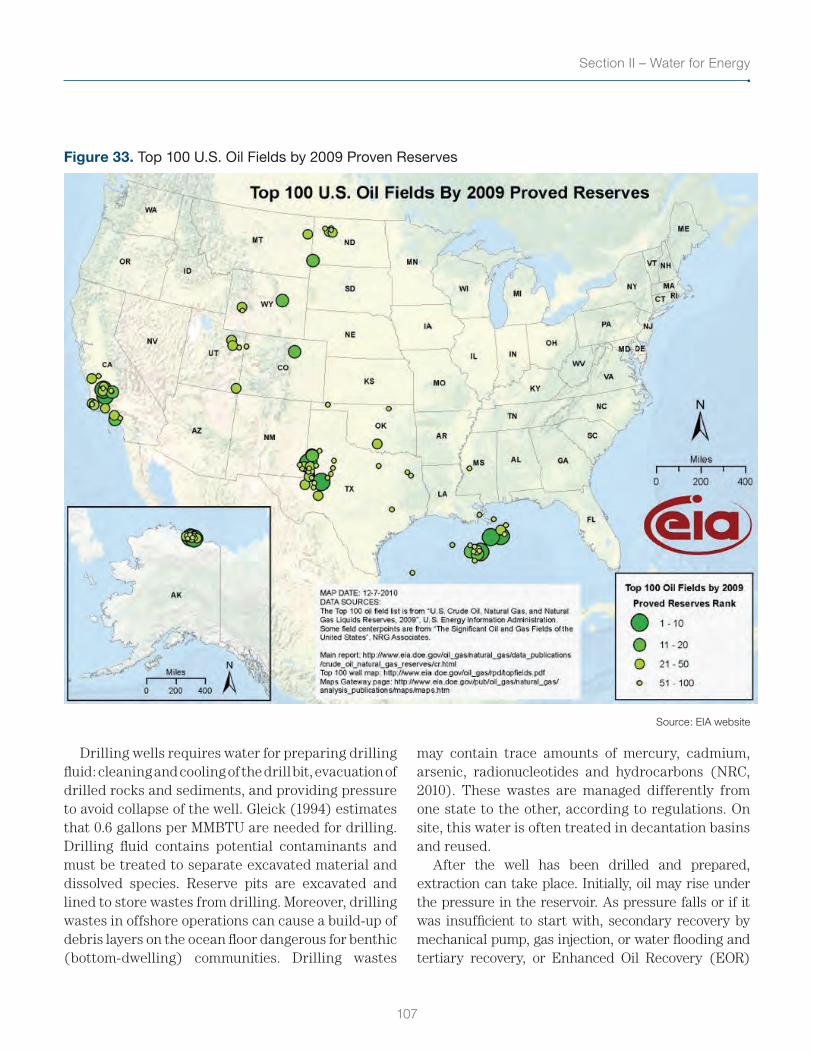
107
Section II – Water for Energy
Figure 33. Top 100 U.S. Oil Fields by 2009 Proven Reserves
Source: EIA website
Drilling wells requires water for preparing drilling fluid: cleaning and cooling of the drill bit, evacuation of drilled rocks and sediments, and providing pressure to avoid collapse of the well. Gleick (1994) estimates that 0.6 gallons per MMBTU are needed for drilling. Drilling fluid contains potential contaminants and must be treated to separate excavated material and dissolved species. Reserve pits are excavated and lined to store wastes from drilling. Moreover, drilling wastes in offshore operations can cause a build-up of debris layers on the ocean floor dangerous for benthic (bottom-dwelling) communities. Drilling wastes
may contain trace amounts of mercury, cadmium, arsenic, radionucleotides and hydrocarbons (NRC, 2010). These wastes are managed differently from one state to the other, according to regulations. On site, this water is often treated in decantation basins and reused.
After the well has been drilled and prepared, extraction can take place. Initially, oil may rise under the pressure in the reservoir. As pressure falls or if it was insufficient to start with, secondary recovery by mechanical pump, gas injection, or water flooding and tertiary recovery, or Enhanced Oil Recovery (EOR)
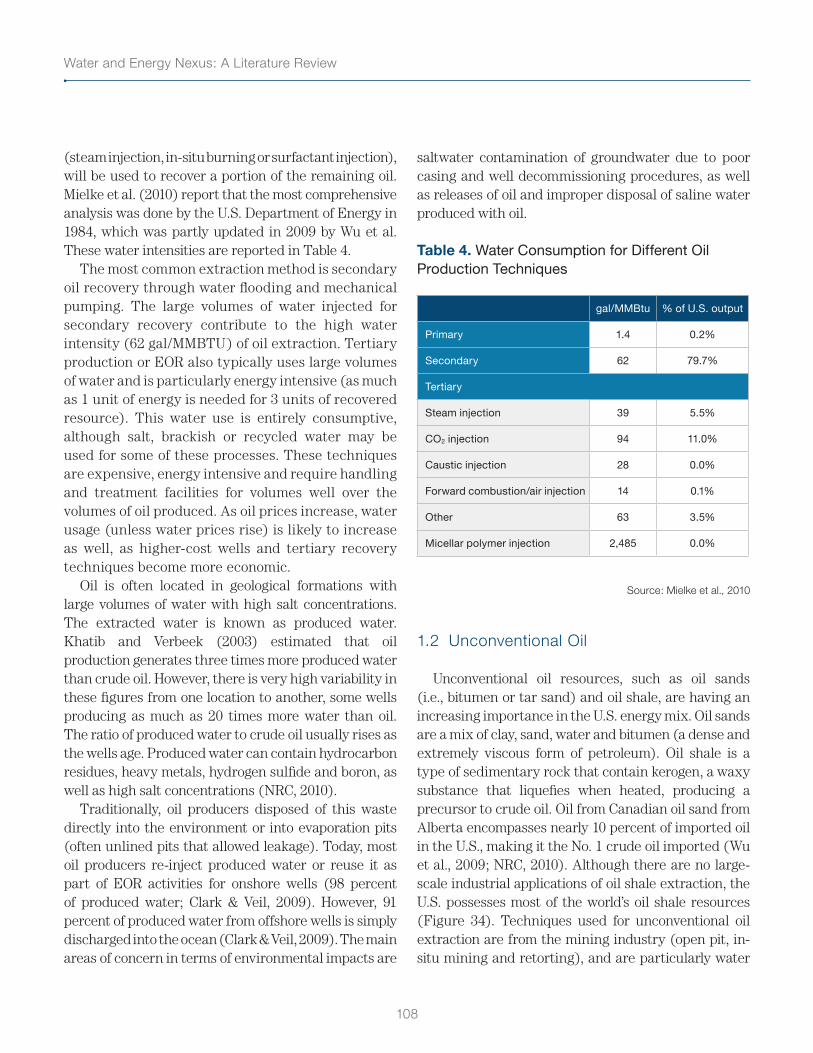
Water and Energy Nexus: A Literature Review
108
(steam injection, in-situ burning or surfactant injection), will be used to recover a portion of the remaining oil. Mielke et al. (2010) report that the most comprehensive analysis was done by the U.S. Department of Energy in 1984, which was partly updated in 2009 by Wu et al. These water intensities are reported in Table 4.
The most common extraction method is secondary oil recovery through water flooding and mechanical pumping. The large volumes of water injected for secondary recovery contribute to the high water intensity (62 gal/MMBTU) of oil extraction. Tertiary production or EOR also typically uses large volumes of water and is particularly energy intensive (as much as 1 unit of energy is needed for 3 units of recovered resource). This water use is entirely consumptive, although salt, brackish or recycled water may be used for some of these processes. These techniques are expensive, energy intensive and require handling and treatment facilities for volumes well over the volumes of oil produced. As oil prices increase, water usage (unless water prices rise) is likely to increase as well, as higher-cost wells and tertiary recovery techniques become more economic.
Oil is often located in geological formations with large volumes of water with high salt concentrations. The extracted water is known as produced water. Khatib and Verbeek (2003) estimated that oil production generates three times more produced water than crude oil. However, there is very high variability in these figures from one location to another, some wells producing as much as 20 times more water than oil. The ratio of produced water to crude oil usually rises as the wells age. Produced water can contain hydrocarbon residues, heavy metals, hydrogen sulfide and boron, as well as high salt concentrations (NRC, 2010).
Traditionally, oil producers disposed of this waste directly into the environment or into evaporation pits (often unlined pits that allowed leakage). Today, most oil producers re-inject produced water or reuse it as part of EOR activities for onshore wells (98 percent of produced water; Clark & Veil, 2009). However, 91 percent of produced water from offshore wells is simply discharged into the ocean (Clark & Veil, 2009). The main areas of concern in terms of environmental impacts are
saltwater contamination of groundwater due to poor casing and well decommissioning procedures, as well as releases of oil and improper disposal of saline water produced with oil.
Table 4. Water Consumption for Different Oil Production Techniques
gal/MMBtu % of U.S. output
Primary 1.4 0.2%
Secondary 62 79.7%
Tertiary
Steam injection 39 5.5%
CO2 injection 94 11.0%
Caustic injection 28 0.0%
Forward combustion/air injection 14 0.1%
Other 63 3.5%
Micellar polymer injection 2,485 0.0%
Source: Mielke et al., 2010
1.2 Unconventional Oil
Unconventional oil resources, such as oil sands (i.e., bitumen or tar sand) and oil shale, are having an increasing importance in the U.S. energy mix. Oil sands are a mix of clay, sand, water and bitumen (a dense and extremely viscous form of petroleum). Oil shale is a type of sedimentary rock that contain kerogen, a waxy substance that liquefies when heated, producing a precursor to crude oil. Oil from Canadian oil sand from Alberta encompasses nearly 10 percent of imported oil in the U.S., making it the No. 1 crude oil imported (Wu et al., 2009; NRC, 2010). Although there are no large-scale industrial applications of oil shale extraction, the U.S. possesses most of the world’s oil shale resources (Figure 34). Techniques used for unconventional oil extraction are from the mining industry (open pit, in-situ mining and retorting), and are particularly water
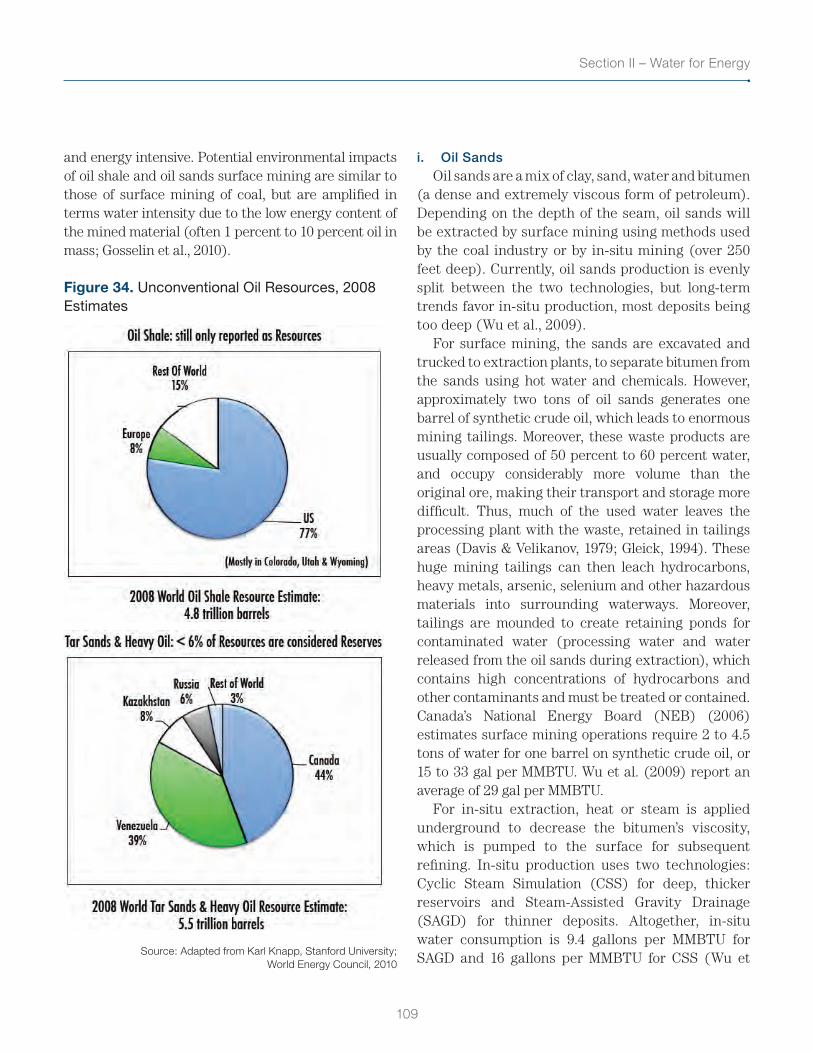
109
Section II – Water for Energy
and energy intensive. Potential environmental impacts of oil shale and oil sands surface mining are similar to those of surface mining of coal, but are amplified in terms water intensity due to the low energy content of the mined material (often 1 percent to 10 percent oil in mass; Gosselin et al., 2010).
Figure 34. Unconventional Oil Resources, 2008 Estimates
Source: Adapted from Karl Knapp, Stanford University; World Energy Council, 2010
i. Oil Sands Oil sands are a mix of clay, sand, water and bitumen
(a dense and extremely viscous form of petroleum). Depending on the depth of the seam, oil sands will be extracted by surface mining using methods used by the coal industry or by in-situ mining (over 250 feet deep). Currently, oil sands production is evenly split between the two technologies, but long-term trends favor in-situ production, most deposits being too deep (Wu et al., 2009).
For surface mining, the sands are excavated and trucked to extraction plants, to separate bitumen from the sands using hot water and chemicals. However, approximately two tons of oil sands generates one barrel of synthetic crude oil, which leads to enormous mining tailings. Moreover, these waste products are usually composed of 50 percent to 60 percent water, and occupy considerably more volume than the original ore, making their transport and storage more difficult. Thus, much of the used water leaves the processing plant with the waste, retained in tailings areas (Davis & Velikanov, 1979; Gleick, 1994). These huge mining tailings can then leach hydrocarbons, heavy metals, arsenic, selenium and other hazardous materials into surrounding waterways. Moreover, tailings are mounded to create retaining ponds for contaminated water (processing water and water released from the oil sands during extraction), which contains high concentrations of hydrocarbons and other contaminants and must be treated or contained. Canada’s National Energy Board (NEB) (2006) estimates surface mining operations require 2 to 4.5 tons of water for one barrel on synthetic crude oil, or 15 to 33 gal per MMBTU. Wu et al. (2009) report an average of 29 gal per MMBTU.
For in-situ extraction, heat or steam is applied underground to decrease the bitumen’s viscosity, which is pumped to the surface for subsequent refining. In-situ production uses two technologies: Cyclic Steam Simulation (CSS) for deep, thicker reservoirs and Steam-Assisted Gravity Drainage (SAGD) for thinner deposits. Altogether, in-situ water consumption is 9.4 gallons per MMBTU for SAGD and 16 gallons per MMBTU for CSS (Wu et
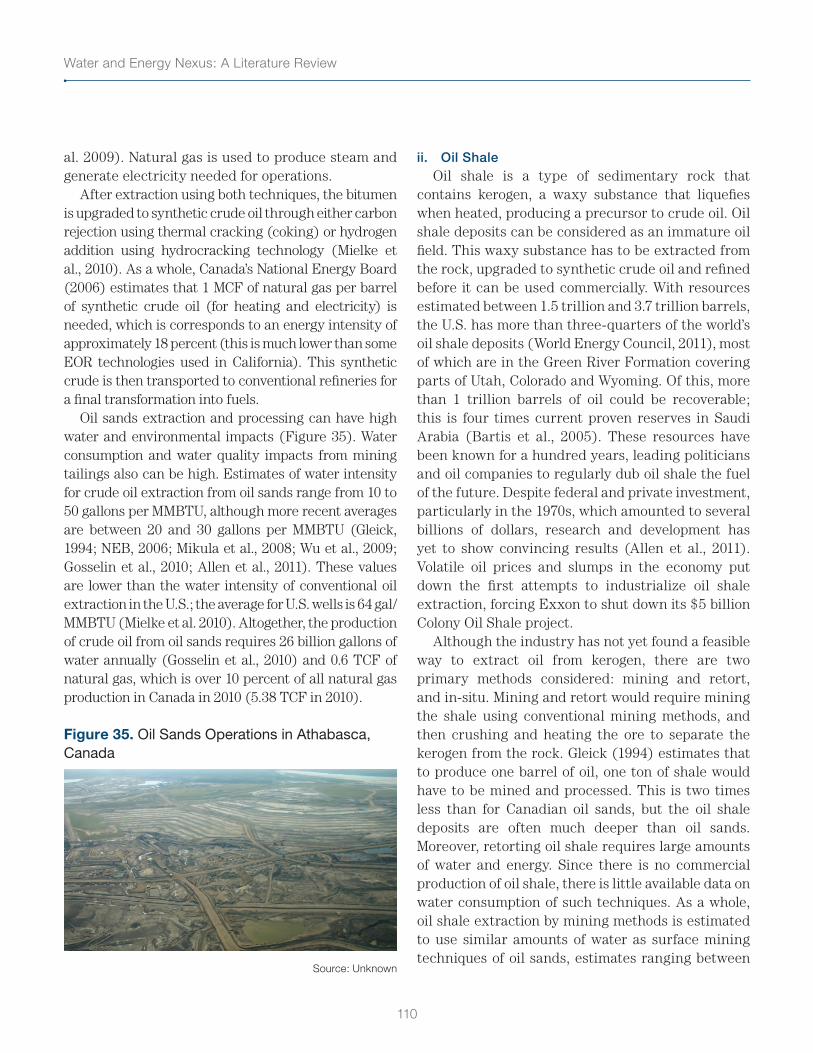
Water and Energy Nexus: A Literature Review
110
al. 2009). Natural gas is used to produce steam and generate electricity needed for operations.
After extraction using both techniques, the bitumen is upgraded to synthetic crude oil through either carbon rejection using thermal cracking (coking) or hydrogen addition using hydrocracking technology (Mielke et al., 2010). As a whole, Canada’s National Energy Board (2006) estimates that 1 MCF of natural gas per barrel of synthetic crude oil (for heating and electricity) is needed, which is corresponds to an energy intensity of approximately 18 percent (this is much lower than some EOR technologies used in California). This synthetic crude is then transported to conventional refineries for a final transformation into fuels.
Oil sands extraction and processing can have high water and environmental impacts (Figure 35). Water consumption and water quality impacts from mining tailings also can be high. Estimates of water intensity for crude oil extraction from oil sands range from 10 to 50 gallons per MMBTU, although more recent averages are between 20 and 30 gallons per MMBTU (Gleick, 1994; NEB, 2006; Mikula et al., 2008; Wu et al., 2009; Gosselin et al., 2010; Allen et al., 2011). These values are lower than the water intensity of conventional oil extraction in the U.S.; the average for U.S. wells is 64 gal/MMBTU (Mielke et al. 2010). Altogether, the production of crude oil from oil sands requires 26 billion gallons of water annually (Gosselin et al., 2010) and 0.6 TCF of natural gas, which is over 10 percent of all natural gas production in Canada in 2010 (5.38 TCF in 2010).
Figure 35. Oil Sands Operations in Athabasca, Canada
Source: Unknown
ii. Oil ShaleOil shale is a type of sedimentary rock that
contains kerogen, a waxy substance that liquefies when heated, producing a precursor to crude oil. Oil shale deposits can be considered as an immature oil field. This waxy substance has to be extracted from the rock, upgraded to synthetic crude oil and refined before it can be used commercially. With resources estimated between 1.5 trillion and 3.7 trillion barrels, the U.S. has more than three-quarters of the world’s oil shale deposits (World Energy Council, 2011), most of which are in the Green River Formation covering parts of Utah, Colorado and Wyoming. Of this, more than 1 trillion barrels of oil could be recoverable; this is four times current proven reserves in Saudi Arabia (Bartis et al., 2005). These resources have been known for a hundred years, leading politicians and oil companies to regularly dub oil shale the fuel of the future. Despite federal and private investment, particularly in the 1970s, which amounted to several billions of dollars, research and development has yet to show convincing results (Allen et al., 2011). Volatile oil prices and slumps in the economy put down the first attempts to industrialize oil shale extraction, forcing Exxon to shut down its $5 billion Colony Oil Shale project.
Although the industry has not yet found a feasible way to extract oil from kerogen, there are two primary methods considered: mining and retort, and in-situ. Mining and retort would require mining the shale using conventional mining methods, and then crushing and heating the ore to separate the kerogen from the rock. Gleick (1994) estimates that to produce one barrel of oil, one ton of shale would have to be mined and processed. This is two times less than for Canadian oil sands, but the oil shale deposits are often much deeper than oil sands. Moreover, retorting oil shale requires large amounts of water and energy. Since there is no commercial production of oil shale, there is little available data on water consumption of such techniques. As a whole, oil shale extraction by mining methods is estimated to use similar amounts of water as surface mining techniques of oil sands, estimates ranging between
111
Section II – Water for Energy
7.2 to 38 gal/MMBTU (Gleick, 1994; Bartis, 2005; U.S. DOE, 2006). Most of this water goes for processing the shale, upgrading the kerogen to synthetic crude oil through hydrogenation, for cooling, and for disposing of the tailings. Because oil shale deposits are located in some of the driest parts of the U.S., one of the challenges for the industry is to secure already-stressed local and regional water resources.
In-situ mining, also called the In-situ Conversion Process (ICP), accelerates the natural process of oil and gas maturation by a slow heating of the oil shale. This is accomplished by drilling holes into shale layers and inserting electric heaters. The shale rock is heated for three to four years to about 400°C, requiring about 250 to 300 kWh of electricity per barrel of oil to drive the process (U.S. DOE, 2006). During the heating process, kerogen is converted to very light crude oil and natural gas. Unlike the mining and retort process of oil shale extraction, in-situ mining does not involve surface mining or create mining tailings. Shell has been studying this method for more than 30 years at the Mahogany Ridge project (O’Connor, 2008). Shell and DOE experts believe that ICP could produce as much as a million barrels per acre of high quality crude oil. Shell estimates an extraction price of $30/barrel (O’Connor, 2008), while EIA analysts estimate that three times this amount ($90/barrel) is needed (EIA, 2009). In-situ mining is the most promising method for oil shale, but is not likely to be fully developed for another decade (Bartis, 2005; Allen, 2011).
The water embedded in the electricity required for the process dominates water consumption associated with ICP. However, processing and decommissioning operations also use water. U.S. DOE (2006) estimates that the total amount of natural gas produced (about a third of the energy content) by the process would have to be used for extraction (production of electricity or heat). Although it would depend on the electricity source, the water intensity of the process could be 8 to 9 gallons per MMBTU (U.S. DOE, 2006), if natural gas is used. Another in-situ method being explored is the separation of the kerogen via chemical processes.
In addition to the carbon footprint of oil shale extraction, water quality and quantity impacts from oil shale development are potentially significant. The large quantities of mining tailings from mining and retort are a very important threat to water resources, as they potentially leach hydrocarbons, salts, nitrate, arsenic, boron, barium, iron, lead, selenium and strontium into surface-water and groundwater supplies (Bartis, 2005; NRC, 2010; Allen et al., 2011). Oil shale extraction could generate large quantities of produced water in similar quantities to oil sands. This water must be reinjected or withheld in retention ponds. These ponds are extremely dangerous to waterfowl and could leak, contaminating surface and groundwater.
1.3 Water Rights and Regulations
i. Water Rights
Production of crude oil in the U.S., from conventional or unconventional sources, requires and produces large quantities of water. Figure 33 shows that the biggest U.S. oil fields are in some of the driest places of the nation (Southern California, Western Texas, Utah, Colorado, Wyoming). Thus, water is not always available in desirable volumes to meet agricultural, domestic, commercial and industrial demand. In the West, water resources are subject to complicated water rights provisions and are often already allocated to other uses. Obtaining water rights is a prerequisite for production, and may be one of the hurdles to the development of oil shale, for example. States have their own procedures regarding water rights, described by Veil et al. (2007). Usually, groundwater rights relate to land rights. But several systems exist: absolute dominion (rule of capture), reasonable use (American rule), restatement of torts and correlative rights (common resource rule) (Veil & Quinn, 2008). In other states, groundwater is state property and rights are based on special authorizations.
Water and Energy Nexus: A Literature Review
112
ii. RegulationsMost regulations concerning water for the oil and
natural gas industry regard the disposal of water, which requires regulatory approval. Discharge of wastewater or process water to surface water bodies requires a National Pollutant Discharge Elimination System (NPDES) permit under the Clean Water Act (CWA). The EPA can authorize states, territories and tribes to implement all or parts of the program. The injection of fluids for production activities or for disposal requires a permit or from the EPA’s Underground Injection Control (UIC) program under the Safe Drinking Water Act (SWDA). Wastes generated during the exploration, development and production of crude oil, natural gas and geothermal energy are categorized by EPA as “special wastes” and are exempt from federal hazardous waste regulations under Subtitle C of the Resource Conservation and Recovery Act (RCRA) (EPA, 2012).
2. Transportation
Oil imported to the U.S. is mainly transported by ocean tanker, except for imports from Canada, which flow through several pipelines that connect with the U.S. pipeline system. This system consists of a network of about 30,000 to 40,000 gathering pipelines and 55,000 trunk pipelines (NRC, 2010). Crude oil is transported from oil fields and terminals to refineries by barges, rail cars, tank trucks and pipelines. Transport and distribution of oil is a major source of air pollution (evaporative losses) and water pollution, through oil leaks, spills and large-scale accidents (1989 Exxon Valdez, 2008 Deepwater Horizon oil spills). For on-shore spills, surface water contamination via runoff and seepage into groundwater are major concerns. Oil spills from wells are not uncommon and can pollute vast areas. Offshore spills can have a huge variety of effects, depending on distance to the shore, depth of the well, etc. (NRC, 2010). In the U.S., freshwater spills systems occur more frequently than marine spills: between 1995 and 1996, 77 percent of all spills
greater than 1,000 gallons and 88 percent of spills greater than 10,000 gallons were inland spills, the majority of which were from oil pipelines (Allen et al., 2011).
3. Processing, Refining and Storage
Once crude oil has been extracted, it must be separated into its different constituents (fuels, lubricants, chemical feedstocks and other oil-based products) before use. Water consumption in a refinery depends on its design and on the type of oil that it is refining. The higher the API gravity, the lighter the crude oil will be and the more valuable the distillates will be (gasoline, kerosene and diesel). Before the 1980s, refineries only used crude distillation. They used an average water withdrawal demand of 80 gallons per MMBTU of crude-oil input and an average consumption of 6.4 gallons per MMBTU (Davis & Velikanov, 1979).
Most of the withdrawn water is used in different cooling processes at different stages of the refining processes. Some of these traditional factories still exist today (Gleick, 1994; U.S. DOE, 2006; Mielke et al., 2010). Most U.S. refineries also have Fluid Catalytic Cracking units, using catalytic reforming and hydrogenation to restructure hydrocarbons into more valuable molecules. Water is used as a source of hydrogen, and large cooling requirements are needed.
There are no consensus values for these systems, which can be very different from one to another for the reasons stated above. Gleick (1994) considers that these systems use as much as 32 gallons per MMBTU. Wu et al. (2009), after thoroughly investigating available literature, estimate that between 7.2 and 13 gallons of water per MMBTU of crude oil are needed. Newer facilities are more water efficient and are often at the lower end of this range. The disposal of process and cooling water, degraded with organic compounds, sulfur, ammonia and heavy metals, is of major concern (Davis & Velikanov, 1979; Allen et al., 2011). It is important to note that many
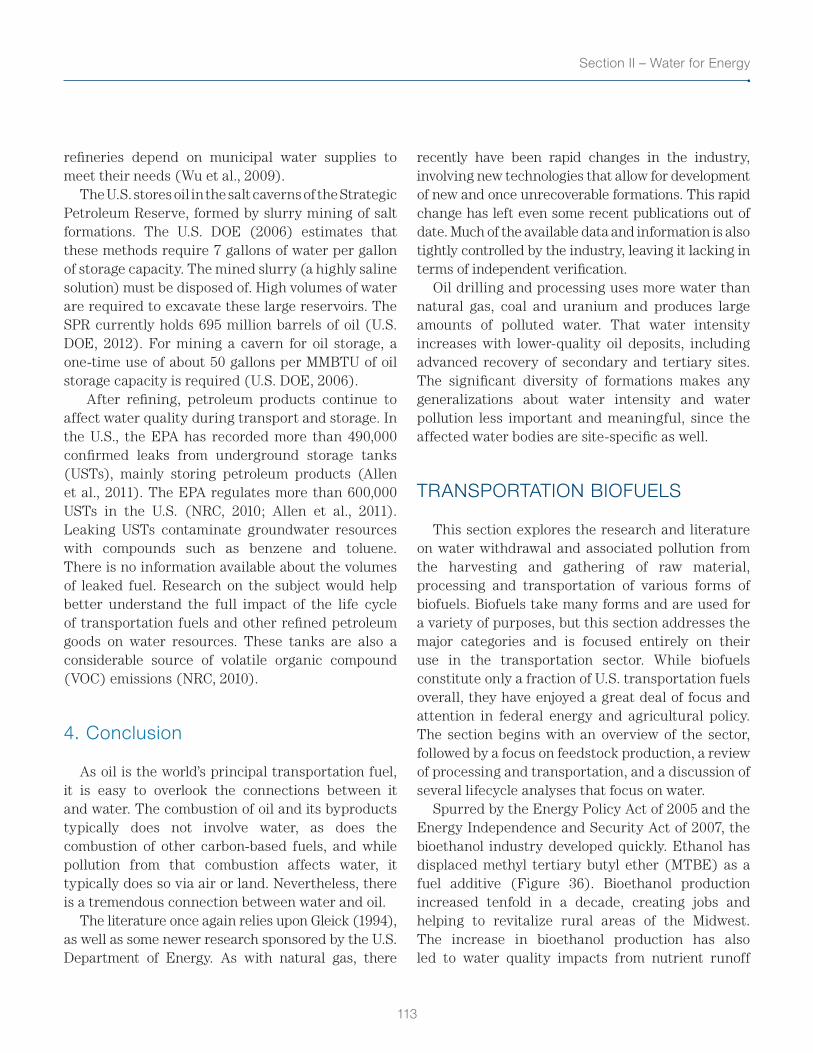
113
Section II – Water for Energy
refineries depend on municipal water supplies to meet their needs (Wu et al., 2009).
The U.S. stores oil in the salt caverns of the Strategic Petroleum Reserve, formed by slurry mining of salt formations. The U.S. DOE (2006) estimates that these methods require 7 gallons of water per gallon of storage capacity. The mined slurry (a highly saline solution) must be disposed of. High volumes of water are required to excavate these large reservoirs. The SPR currently holds 695 million barrels of oil (U.S. DOE, 2012). For mining a cavern for oil storage, a one-time use of about 50 gallons per MMBTU of oil storage capacity is required (U.S. DOE, 2006).
After refining, petroleum products continue to affect water quality during transport and storage. In the U.S., the EPA has recorded more than 490,000 confirmed leaks from underground storage tanks (USTs), mainly storing petroleum products (Allen et al., 2011). The EPA regulates more than 600,000 USTs in the U.S. (NRC, 2010; Allen et al., 2011). Leaking USTs contaminate groundwater resources with compounds such as benzene and toluene. There is no information available about the volumes of leaked fuel. Research on the subject would help better understand the full impact of the life cycle of transportation fuels and other refined petroleum goods on water resources. These tanks are also a considerable source of volatile organic compound (VOC) emissions (NRC, 2010).
4. Conclusion
As oil is the world’s principal transportation fuel, it is easy to overlook the connections between it and water. The combustion of oil and its byproducts typically does not involve water, as does the combustion of other carbon-based fuels, and while pollution from that combustion affects water, it typically does so via air or land. Nevertheless, there is a tremendous connection between water and oil.
The literature once again relies upon Gleick (1994), as well as some newer research sponsored by the U.S. Department of Energy. As with natural gas, there
recently have been rapid changes in the industry, involving new technologies that allow for development of new and once unrecoverable formations. This rapid change has left even some recent publications out of date. Much of the available data and information is also tightly controlled by the industry, leaving it lacking in terms of independent verification.
Oil drilling and processing uses more water than natural gas, coal and uranium and produces large amounts of polluted water. That water intensity increases with lower-quality oil deposits, including advanced recovery of secondary and tertiary sites. The significant diversity of formations makes any generalizations about water intensity and water pollution less important and meaningful, since the affected water bodies are site-specific as well.
TRANSPORTATION BIOFUELS
This section explores the research and literature on water withdrawal and associated pollution from the harvesting and gathering of raw material, processing and transportation of various forms of biofuels. Biofuels take many forms and are used for a variety of purposes, but this section addresses the major categories and is focused entirely on their use in the transportation sector. While biofuels constitute only a fraction of U.S. transportation fuels overall, they have enjoyed a great deal of focus and attention in federal energy and agricultural policy. The section begins with an overview of the sector, followed by a focus on feedstock production, a review of processing and transportation, and a discussion of several lifecycle analyses that focus on water.
Spurred by the Energy Policy Act of 2005 and the Energy Independence and Security Act of 2007, the bioethanol industry developed quickly. Ethanol has displaced methyl tertiary butyl ether (MTBE) as a fuel additive (Figure 36). Bioethanol production increased tenfold in a decade, creating jobs and helping to revitalize rural areas of the Midwest. The increase in bioethanol production has also led to water quality impacts from nutrient runoff
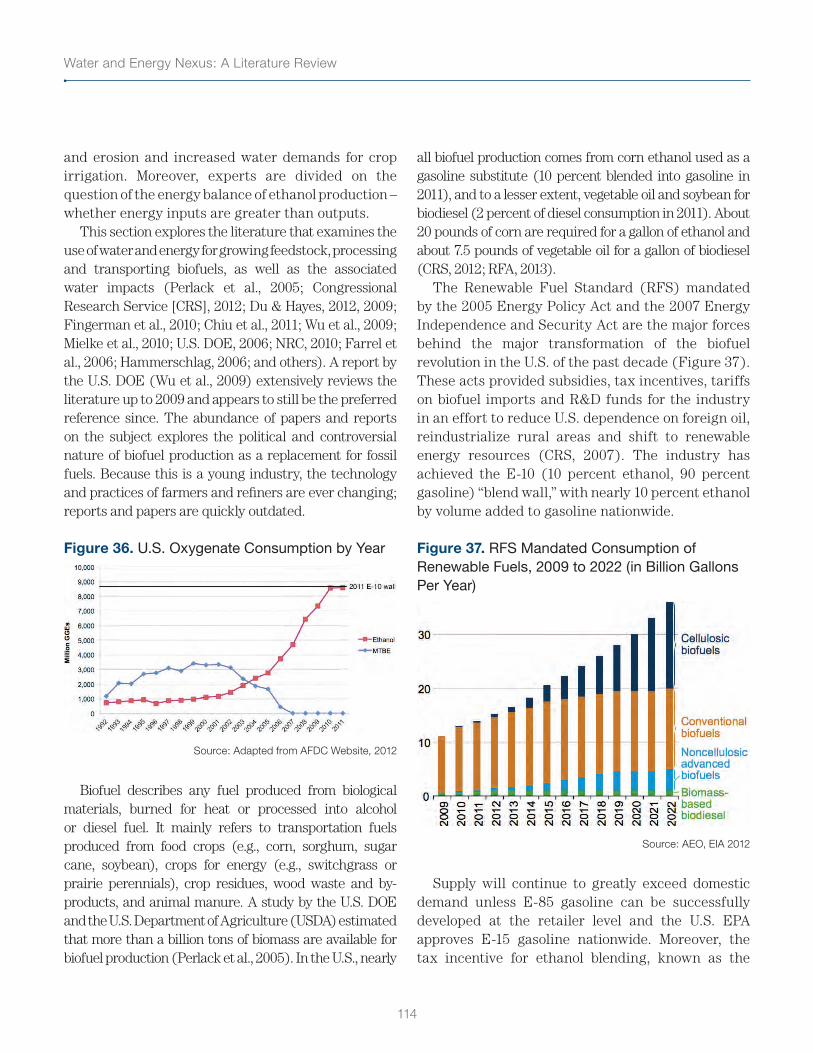
Water and Energy Nexus: A Literature Review
114
and erosion and increased water demands for crop irrigation. Moreover, experts are divided on the question of the energy balance of ethanol production – whether energy inputs are greater than outputs.
This section explores the literature that examines the use of water and energy for growing feedstock, processing and transporting biofuels, as well as the associated water impacts (Perlack et al., 2005; Congressional Research Service [CRS], 2012; Du & Hayes, 2012, 2009; Fingerman et al., 2010; Chiu et al., 2011; Wu et al., 2009; Mielke et al., 2010; U.S. DOE, 2006; NRC, 2010; Farrel et al., 2006; Hammerschlag, 2006; and others). A report by the U.S. DOE (Wu et al., 2009) extensively reviews the literature up to 2009 and appears to still be the preferred reference since. The abundance of papers and reports on the subject explores the political and controversial nature of biofuel production as a replacement for fossil fuels. Because this is a young industry, the technology and practices of farmers and refiners are ever changing; reports and papers are quickly outdated.
Figure 36. U.S. Oxygenate Consumption by Year
Source: Adapted from AFDC Website, 2012
Biofuel describes any fuel produced from biological materials, burned for heat or processed into alcohol or diesel fuel. It mainly refers to transportation fuels produced from food crops (e.g., corn, sorghum, sugar cane, soybean), crops for energy (e.g., switchgrass or prairie perennials), crop residues, wood waste and by-products, and animal manure. A study by the U.S. DOE and the U.S. Department of Agriculture (USDA) estimated that more than a billion tons of biomass are available for biofuel production (Perlack et al., 2005). In the U.S., nearly
all biofuel production comes from corn ethanol used as a gasoline substitute (10 percent blended into gasoline in 2011), and to a lesser extent, vegetable oil and soybean for biodiesel (2 percent of diesel consumption in 2011). About 20 pounds of corn are required for a gallon of ethanol and about 7.5 pounds of vegetable oil for a gallon of biodiesel (CRS, 2012; RFA, 2013).
The Renewable Fuel Standard (RFS) mandated by the 2005 Energy Policy Act and the 2007 Energy Independence and Security Act are the major forces behind the major transformation of the biofuel revolution in the U.S. of the past decade (Figure 37). These acts provided subsidies, tax incentives, tariffs on biofuel imports and R&D funds for the industry in an effort to reduce U.S. dependence on foreign oil, reindustrialize rural areas and shift to renewable energy resources (CRS, 2007). The industry has achieved the E-10 (10 percent ethanol, 90 percent gasoline) “blend wall,” with nearly 10 percent ethanol by volume added to gasoline nationwide.
Figure 37. RFS Mandated Consumption of Renewable Fuels, 2009 to 2022 (in Billion Gallons Per Year)
Source: AEO, EIA 2012
Supply will continue to greatly exceed domestic demand unless E-85 gasoline can be successfully developed at the retailer level and the U.S. EPA approves E-15 gasoline nationwide. Moreover, the tax incentive for ethanol blending, known as the
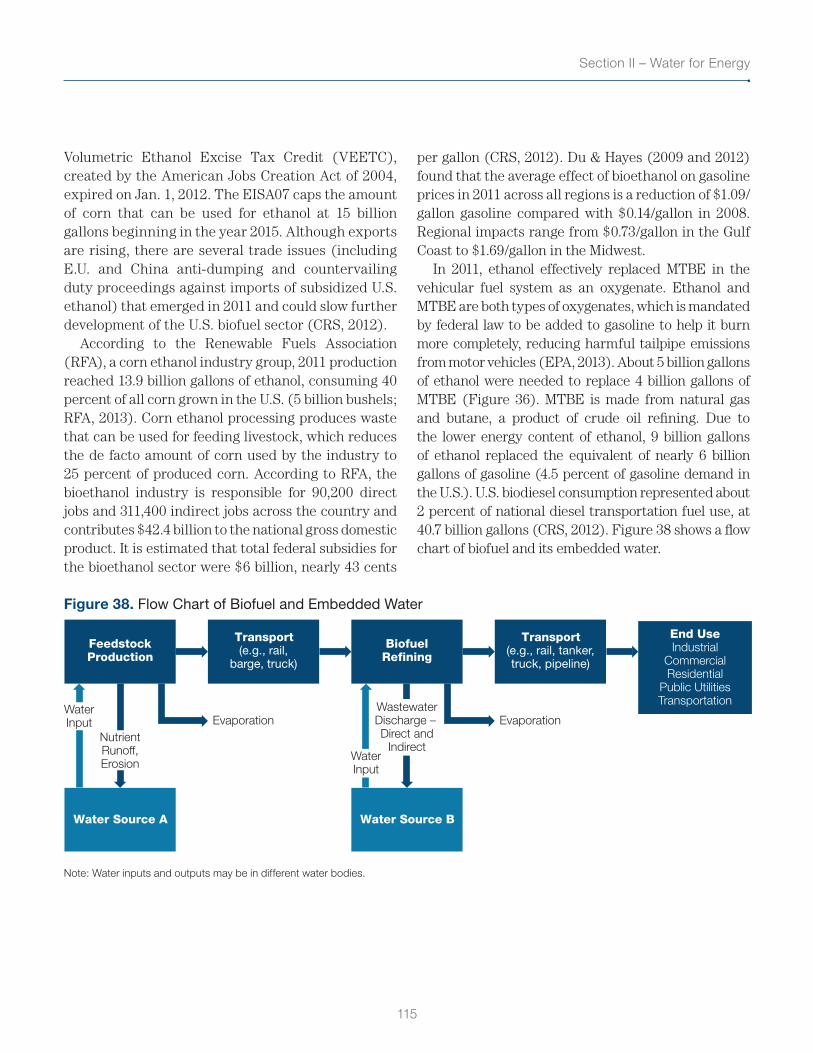
115
Section II – Water for Energy
Volumetric Ethanol Excise Tax Credit (VEETC), created by the American Jobs Creation Act of 2004, expired on Jan. 1, 2012. The EISA07 caps the amount of corn that can be used for ethanol at 15 billion gallons beginning in the year 2015. Although exports are rising, there are several trade issues (including E.U. and China anti-dumping and countervailing duty proceedings against imports of subsidized U.S. ethanol) that emerged in 2011 and could slow further development of the U.S. biofuel sector (CRS, 2012).
According to the Renewable Fuels Association (RFA), a corn ethanol industry group, 2011 production reached 13.9 billion gallons of ethanol, consuming 40 percent of all corn grown in the U.S. (5 billion bushels; RFA, 2013). Corn ethanol processing produces waste that can be used for feeding livestock, which reduces the de facto amount of corn used by the industry to 25 percent of produced corn. According to RFA, the bioethanol industry is responsible for 90,200 direct jobs and 311,400 indirect jobs across the country and contributes $42.4 billion to the national gross domestic product. It is estimated that total federal subsidies for the bioethanol sector were $6 billion, nearly 43 cents
per gallon (CRS, 2012). Du & Hayes (2009 and 2012) found that the average effect of bioethanol on gasoline prices in 2011 across all regions is a reduction of $1.09/gallon gasoline compared with $0.14/gallon in 2008. Regional impacts range from $0.73/gallon in the Gulf Coast to $1.69/gallon in the Midwest.
In 2011, ethanol effectively replaced MTBE in the vehicular fuel system as an oxygenate. Ethanol and MTBE are both types of oxygenates, which is mandated by federal law to be added to gasoline to help it burn more completely, reducing harmful tailpipe emissions from motor vehicles (EPA, 2013). About 5 billion gallons of ethanol were needed to replace 4 billion gallons of MTBE (Figure 36). MTBE is made from natural gas and butane, a product of crude oil refining. Due to the lower energy content of ethanol, 9 billion gallons of ethanol replaced the equivalent of nearly 6 billion gallons of gasoline (4.5 percent of gasoline demand in the U.S.). U.S. biodiesel consumption represented about 2 percent of national diesel transportation fuel use, at 40.7 billion gallons (CRS, 2012). Figure 38 shows a flow chart of biofuel and its embedded water.
Figure 38. Flow Chart of Biofuel and Embedded Water
FeedstockProduction
Water Source A
Transport(e.g., rail,
barge, truck)
Water Source B
BiofuelRefining
End UseIndustrial
CommercialResidential
Public UtilitiesTransportation
Transport(e.g., rail, tanker,truck, pipeline)
WaterInput Evaporation
NutrientRunoff,Erosion
Evaporation
WaterInput
WastewaterDischarge – Direct and
Indirect
Note: Water inputs and outputs may be in different water bodies.
Water and Energy Nexus: A Literature Review
116
1. Feedstock Production
1.1 Bioethanol
Corn ethanol and cellulosic ethanol are two main forms of bioethanol discussed in this section. Sugarcane and sugar beet ethanol, while not included in this literature review, are other forms of bioethanol currently under consideration in Hawaii and on the U.S. mainland.
i. Corn EthanolCorn is the primary feedstock in the U.S. for
bioethanol production and is converted to ethanol through dry-milling or wet-milling production processes. One bushel of corn (56 pounds) produces about 2.8 gallons of ethanol. In 2011, the bioethanol industry used 40 percent of all corn grown in the U.S., and an equivalent of 15 percent of the production was returned to the market in the form of animal feed. The world’s second biggest ethanol producer is Brazil, where sugar cane is the primary crop input (the U.S accounts for 60 percent of worldwide production and Brazil 30 percent).
Corn production takes up much of the water needs
of the whole bioethanol cycle (Gerbens-Leenes et al., 2009). Water use is variable among and within the states (Fingerman et al., 2010; Chiu et al., 2011), mostly depending on climate conditions and related annual rainfall. Producing one bushel of corn in USDA Region 7 (North Dakota, South Dakota, Nebraska and Kansas) consumes 865 gallon of freshwater from irrigation. Producing one bushel of corn in USDA Regions 5 (Iowa, Indiana, Illinois, Ohio and Missouri) and 6 (Minnesota, Wisconsin and Michigan) requires only 19 and 38 gallons respectively, because of sufficient water from precipitation (Table 5; Wu et al., 2009). These three regions produce about 90 percent of U.S. corn and 95 percent of corn ethanol. This is an average of 263 gallons per bushel, or 94 gallons of water per gallon of ethanol, or, to be consistent with the other sections, 1,200 gallons of water per MMBTU, just for the feedstock.
In all three regions, most of the water used for irrigation is withdrawn from groundwater aquifers and particularly from the immense Ogallala Aquifer, one of the largest fossil water aquifers. The extensive corn agriculture in Nebraska in particular is displacing fossil fuel dependence for fossil water dependence. Although the previous figure is derived from national averages given by the USDA, Chiu et al. (2011) report from studying existing literature that with irrigated agriculture, ranges are from 250 to 1,600 gallons of water per gallon of ethanol, or 3,300 to 21,000 gallons per MMBTU. The origin of the feedstock is therefore extremely important when considering the water footprint of bioethanol. Various sources report that about 15 percent of corn production is irrigated (Wu et al., 2009; RFA, 2012).
An estimated 71 percent of the water input from irrigation is consumed via evapotranspiration, with the remaining 29 percent becoming surface runoff and groundwater recharge (Wu et al., 2009). This water is potentially available for reuse as irrigation water but is often degraded due to intensive use of fertilizers and pesticides for corn production. Water management has become a major concern in the agricultural sector in recent years; the amount of irrigation water applied for corn declined 27 percent despite consistent corn yield increase over the past 20 years (Wu et al., 2009). This trend is likely to continue, particularly as breakthroughs are made in genetic engineering. Monsanto and DuPont are soon expected to commercialize drought-resistant corn.
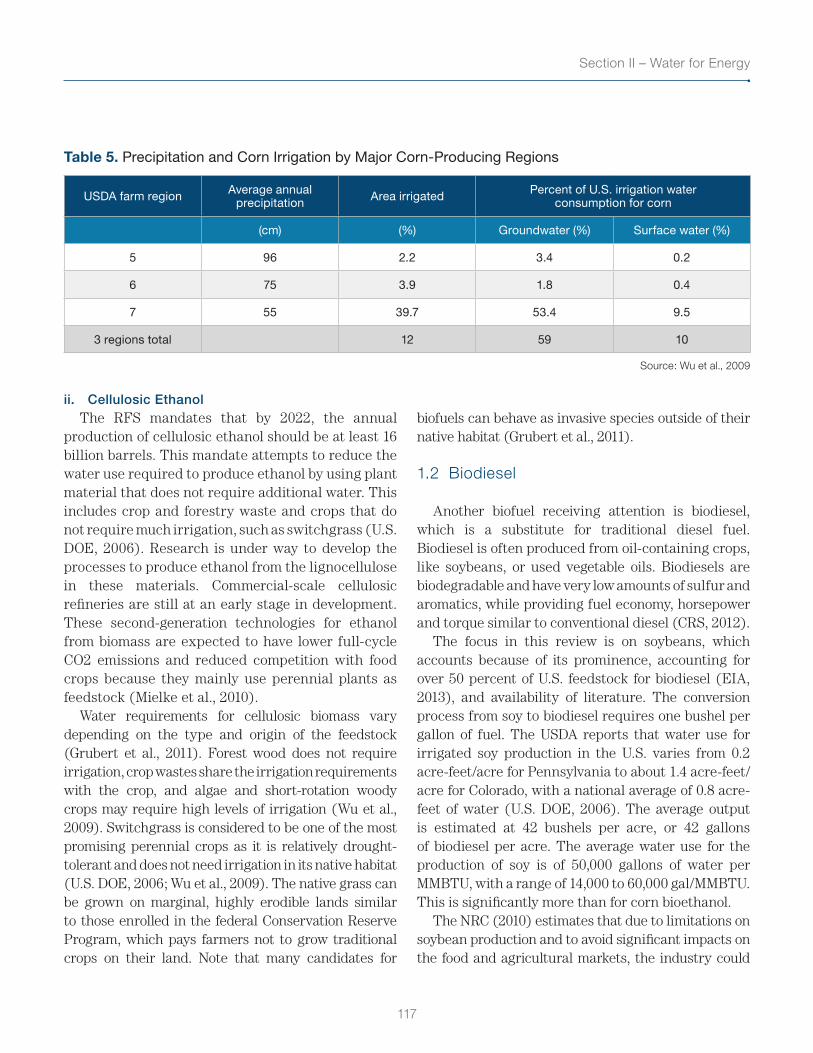
117
Section II – Water for Energy
Table 5. Precipitation and Corn Irrigation by Major Corn-Producing Regions
USDA farm region Average annual precipitation Area irrigated Percent of U.S. irrigation water
consumption for corn
(cm) (%) Groundwater (%) Surface water (%)
5 96 2.2 3.4 0.2
6 75 3.9 1.8 0.4
7 55 39.7 53.4 9.5
3 regions total 12 59 10
Source: Wu et al., 2009
ii. Cellulosic EthanolThe RFS mandates that by 2022, the annual
production of cellulosic ethanol should be at least 16 billion barrels. This mandate attempts to reduce the water use required to produce ethanol by using plant material that does not require additional water. This includes crop and forestry waste and crops that do not require much irrigation, such as switchgrass (U.S. DOE, 2006). Research is under way to develop the processes to produce ethanol from the lignocellulose in these materials. Commercial-scale cellulosic refineries are still at an early stage in development. These second-generation technologies for ethanol from biomass are expected to have lower full-cycle CO2 emissions and reduced competition with food crops because they mainly use perennial plants as feedstock (Mielke et al., 2010).
Water requirements for cellulosic biomass vary depending on the type and origin of the feedstock (Grubert et al., 2011). Forest wood does not require irrigation, crop wastes share the irrigation requirements with the crop, and algae and short-rotation woody crops may require high levels of irrigation (Wu et al., 2009). Switchgrass is considered to be one of the most promising perennial crops as it is relatively drought-tolerant and does not need irrigation in its native habitat (U.S. DOE, 2006; Wu et al., 2009). The native grass can be grown on marginal, highly erodible lands similar to those enrolled in the federal Conservation Reserve Program, which pays farmers not to grow traditional crops on their land. Note that many candidates for
biofuels can behave as invasive species outside of their native habitat (Grubert et al., 2011).
1.2 Biodiesel
Another biofuel receiving attention is biodiesel, which is a substitute for traditional diesel fuel. Biodiesel is often produced from oil-containing crops, like soybeans, or used vegetable oils. Biodiesels are biodegradable and have very low amounts of sulfur and aromatics, while providing fuel economy, horsepower and torque similar to conventional diesel (CRS, 2012).
The focus in this review is on soybeans, which accounts because of its prominence, accounting for over 50 percent of U.S. feedstock for biodiesel (EIA, 2013), and availability of literature. The conversion process from soy to biodiesel requires one bushel per gallon of fuel. The USDA reports that water use for irrigated soy production in the U.S. varies from 0.2 acre-feet/acre for Pennsylvania to about 1.4 acre-feet/acre for Colorado, with a national average of 0.8 acre-feet of water (U.S. DOE, 2006). The average output is estimated at 42 bushels per acre, or 42 gallons of biodiesel per acre. The average water use for the production of soy is of 50,000 gallons of water per MMBTU, with a range of 14,000 to 60,000 gal/MMBTU. This is significantly more than for corn bioethanol.
The NRC (2010) estimates that due to limitations on soybean production and to avoid significant impacts on the food and agricultural markets, the industry could
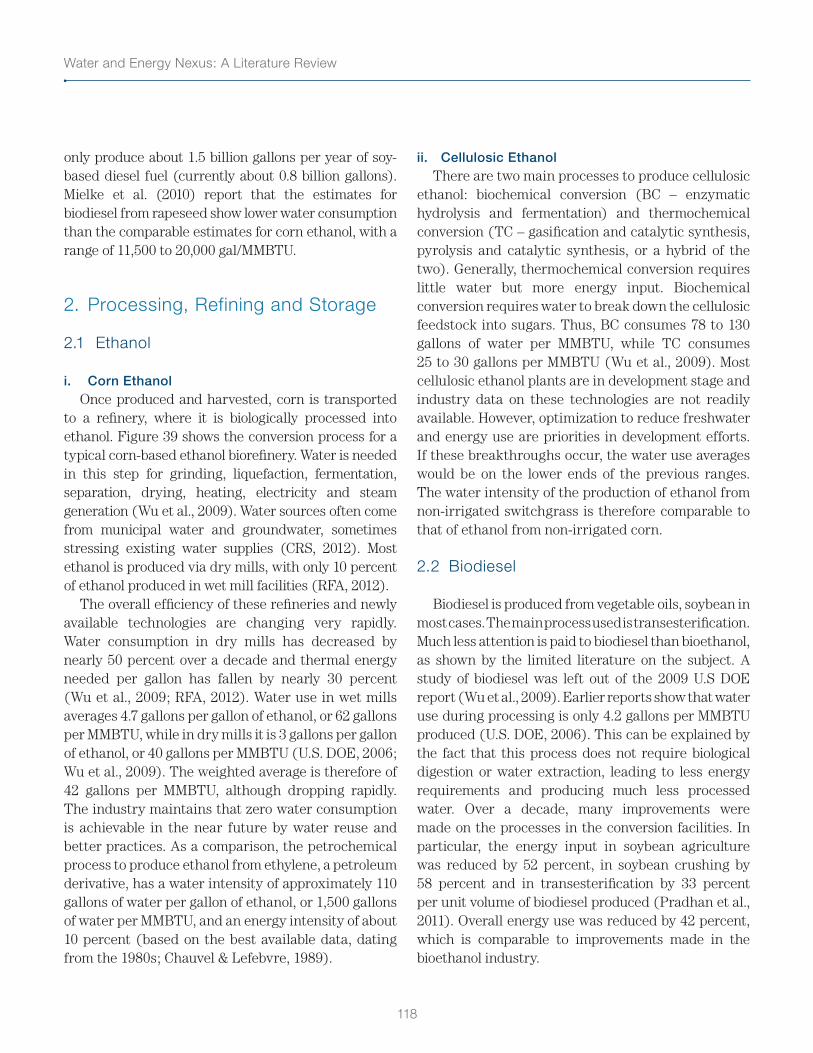
Water and Energy Nexus: A Literature Review
118
only produce about 1.5 billion gallons per year of soy-based diesel fuel (currently about 0.8 billion gallons). Mielke et al. (2010) report that the estimates for biodiesel from rapeseed show lower water consumption than the comparable estimates for corn ethanol, with a range of 11,500 to 20,000 gal/MMBTU.
2. Processing, Refining and Storage
2.1 Ethanol
i. Corn EthanolOnce produced and harvested, corn is transported
to a refinery, where it is biologically processed into ethanol. Figure 39 shows the conversion process for a typical corn-based ethanol biorefinery. Water is needed in this step for grinding, liquefaction, fermentation, separation, drying, heating, electricity and steam generation (Wu et al., 2009). Water sources often come from municipal water and groundwater, sometimes stressing existing water supplies (CRS, 2012). Most ethanol is produced via dry mills, with only 10 percent of ethanol produced in wet mill facilities (RFA, 2012).
The overall efficiency of these refineries and newly available technologies are changing very rapidly. Water consumption in dry mills has decreased by nearly 50 percent over a decade and thermal energy needed per gallon has fallen by nearly 30 percent (Wu et al., 2009; RFA, 2012). Water use in wet mills averages 4.7 gallons per gallon of ethanol, or 62 gallons per MMBTU, while in dry mills it is 3 gallons per gallon of ethanol, or 40 gallons per MMBTU (U.S. DOE, 2006; Wu et al., 2009). The weighted average is therefore of 42 gallons per MMBTU, although dropping rapidly. The industry maintains that zero water consumption is achievable in the near future by water reuse and better practices. As a comparison, the petrochemical process to produce ethanol from ethylene, a petroleum derivative, has a water intensity of approximately 110 gallons of water per gallon of ethanol, or 1,500 gallons of water per MMBTU, and an energy intensity of about 10 percent (based on the best available data, dating from the 1980s; Chauvel & Lefebvre, 1989).
ii. Cellulosic EthanolThere are two main processes to produce cellulosic
ethanol: biochemical conversion (BC – enzymatic hydrolysis and fermentation) and thermochemical conversion (TC – gasification and catalytic synthesis, pyrolysis and catalytic synthesis, or a hybrid of the two). Generally, thermochemical conversion requires little water but more energy input. Biochemical conversion requires water to break down the cellulosic feedstock into sugars. Thus, BC consumes 78 to 130 gallons of water per MMBTU, while TC consumes 25 to 30 gallons per MMBTU (Wu et al., 2009). Most cellulosic ethanol plants are in development stage and industry data on these technologies are not readily available. However, optimization to reduce freshwater and energy use are priorities in development efforts. If these breakthroughs occur, the water use averages would be on the lower ends of the previous ranges. The water intensity of the production of ethanol from non-irrigated switchgrass is therefore comparable to that of ethanol from non-irrigated corn.
2.2 Biodiesel
Biodiesel is produced from vegetable oils, soybean in most cases. The main process used is transesterification. Much less attention is paid to biodiesel than bioethanol, as shown by the limited literature on the subject. A study of biodiesel was left out of the 2009 U.S DOE report (Wu et al., 2009). Earlier reports show that water use during processing is only 4.2 gallons per MMBTU produced (U.S. DOE, 2006). This can be explained by the fact that this process does not require biological digestion or water extraction, leading to less energy requirements and producing much less processed water. Over a decade, many improvements were made on the processes in the conversion facilities. In particular, the energy input in soybean agriculture was reduced by 52 percent, in soybean crushing by 58 percent and in transesterification by 33 percent per unit volume of biodiesel produced (Pradhan et al., 2011). Overall energy use was reduced by 42 percent, which is comparable to improvements made in the bioethanol industry.
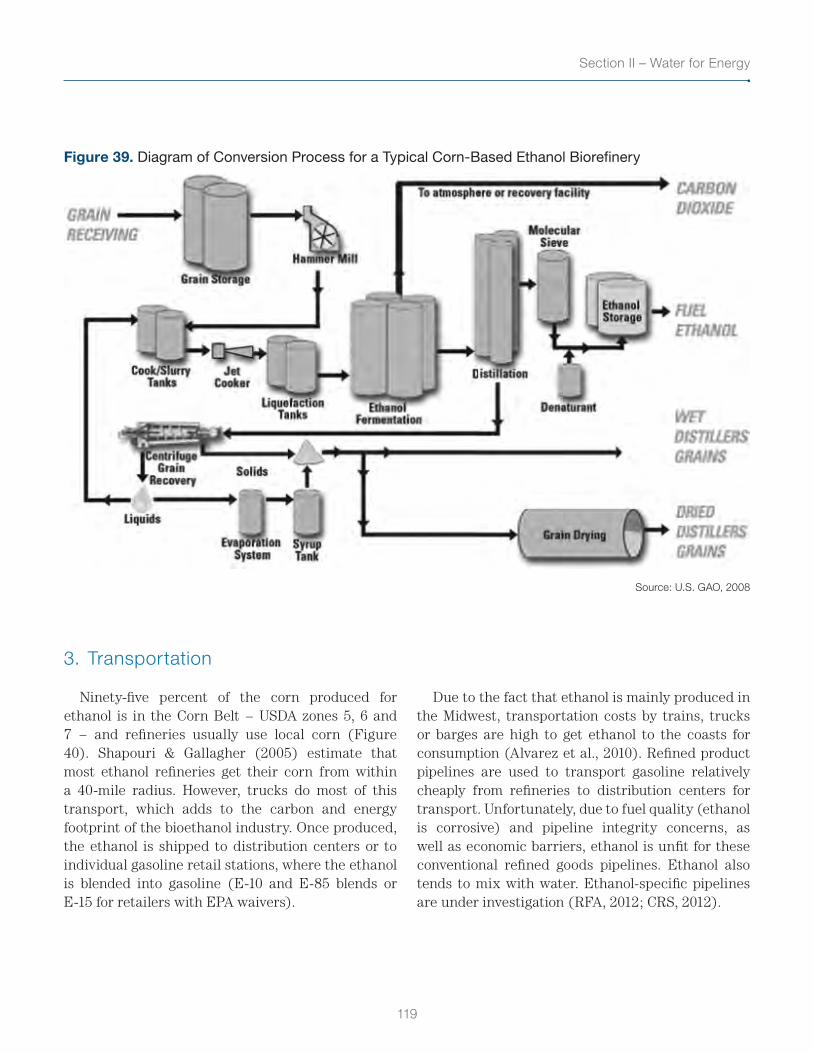
119
Section II – Water for Energy
Figure 39. Diagram of Conversion Process for a Typical Corn-Based Ethanol Biorefinery
Source: U.S. GAO, 2008
3. Transportation
Ninety-five percent of the corn produced for ethanol is in the Corn Belt − USDA zones 5, 6 and 7 − and refineries usually use local corn (Figure 40). Shapouri & Gallagher (2005) estimate that most ethanol refineries get their corn from within a 40-mile radius. However, trucks do most of this transport, which adds to the carbon and energy footprint of the bioethanol industry. Once produced, the ethanol is shipped to distribution centers or to individual gasoline retail stations, where the ethanol is blended into gasoline (E-10 and E-85 blends or E-15 for retailers with EPA waivers).
Due to the fact that ethanol is mainly produced in the Midwest, transportation costs by trains, trucks or barges are high to get ethanol to the coasts for consumption (Alvarez et al., 2010). Refined product pipelines are used to transport gasoline relatively cheaply from refineries to distribution centers for transport. Unfortunately, due to fuel quality (ethanol is corrosive) and pipeline integrity concerns, as well as economic barriers, ethanol is unfit for these conventional refined goods pipelines. Ethanol also tends to mix with water. Ethanol-specific pipelines are under investigation (RFA, 2012; CRS, 2012).
Water and Energy Nexus: A Literature Review
120
Figure 40. Biorefinery Locations in the U.S.
Source: USDA website, 2012
Ethanol and biodiesels are biodegradable and have a very short half-life in the environment, particularly when compared to gasoline components such as benzene and toluene. Ethanol has replaced MTBE, which is thought to be potentially carcinogenic at high levels, according to the EPA. Low to high levels of MTBE (less than 20 ppb to 610 ppb) have been detected in ground and surface waters due to leaking underground storage tanks − in a severe case, contamination led the city of Santa Monica, Calif., to shut down pumping from its aquifers and buy replacement water (EPA, 2013). According to the literature, the preferential degradation of ethanol will cause gasoline plumes to spread farther than when MTBE was used as an additive (Patzek et al., 2005; U.S. GAO, 2009; Alvarez et al., 2010).
4. Life-Cycle Analyses and Water Balance
Much more attention has been paid to life-cycle analyses (LCA) of different biofuels rather than their water intensity and their local impact on water resources. There are numerous conflicting reports on the net positive or negative energy benefit of biofuels and particularly of corn ethanol (Farrel et al., 2006; Hammerschlag, 2006). One of the major causes of the discrepancies in energy LCA reports is the difference in the way the energy is allocated among the coproducts (Farrel et al., 2006; Pradhan et al., 2011). Recent literature seems to agree that ethanol has shifted from an energy sink in the early
121
Section II – Water for Energy
1990s to a net energy producer as well as a net greenhouse gas (GHG) sink, although at a cost to the environment and to water resources. The latest estimates by the USDA on the energy balance of corn ethanol, using recent industry data, are that for each unit of energy invested, 1.9 to 2.3 units of ethanol are produced; this is an energy intensity of 53 percent to 43 percent respectively (Shapouri et al., 2010). Cellulosic ethanol energy returns on investment are somewhat higher, reported to range from 4.5 to 10, or an energy intensity of 22 percent to 10 percent respectively (Farrel et al., 2006; Mulder et al., 2010). Biodiesel is reported to have an energy return of 2.3 to 5.5, or an energy intensity of 43 percent to 18 percent (Mulder et al., 2010; Pradhan et al., 2011).
In 2011, 13.9 billion gallons of ethanol were produced, mainly using corn as a feedstock. According to previous sections, this corresponds to an average of 3.5 billion gallons of freshwater a day (BGD), although irrigation does not occur year round. According to the USGS report of water use in 2005 (Kenny et al., 2009), irrigation used 130 BGD; therefore approximately 3 percent of all irrigation in the U.S. goes to the production of corn as feedstock for the bioethanol industry. Another 0.2 BGD goes to processing corn in biorefineries. If the Renewable Fuel Standard (RFS) were only met by corn ethanol, this would more than double this amount, requiring 9 BGD for feedstock production and 0.5 BGD for ethanol fermentation. If the current RFS remains unchanged, and corn ethanol production does not continue to rise while the rest of the mandated 36 billion gallons comes from cellulosic using rain-fed perennial plants, feedstock production would probably require the same level of water, while about 0.5 BGD would be needed in refineries.
Concerning biodiesels, approximately half of the production comes from soybeans, a water-intensive crop. According to the USDA, nearly 100 million bushels of soybeans are used yearly for biodiesels. Approximately 1.5 BGD are thus used to produce 1 percent of diesel consumption in the U.S., using the reported water intensity of growing soybeans (Wu et al., 2009; Mielke et al., 2010). This represents 1.1
percent of all irrigation in the U.S. If production of soy biodiesel reached the 1.5 billion-gallon limit estimated by the NRC (2010), this would require 24 BGD, or 18 percent, of 2005 irrigation in the U.S.
5. Conclusion
As a whole, there is an important need to assess the water impact of biofuels at a local level, similar to the studies done by Chiu et al. (2011) and Fingerman et al. (2010), on Minnesota and California, respectively. Often, the impacts of this rapidly changing and maturing industry are unknown. This calls for the implementation of a water accounting system, to better track the embedded water of biofuels in different feedstock. Fingerman et al. (2010) report that increased corn production for ethanol in California would actually reduce overall freshwater withdrawals, replacing more water-intensive crops such as rice and alfalfa. However, irrigated California corn would still have a higher water intensity than rain-fed corn grown in Minnesota. Research should be conducted to incorporate water consumption into regulatory frameworks instead of simply GHG emissions and energy intensity.
The literature shows that many different metrics are used to describe the water or energy intensity of biofuels: L water/L ethanol, gal water/MMBTU ethanol, L of water/MJ ethanol, MJ of invested energy/MJ of ethanol, gal water/mile traveled, etc. A harmonization of these metrics would benefit the industry and researchers alike. Published official data through the EIA could achieve this. The EIA also needs to do much more on the topic of biofuels. Although data is available, it is often outdated and misleading. The addition of an Annual Biofuel Report may be useful.
The corn ethanol industry has largely exceeded expectations. This underlines the need for government agencies like the USDA, GAO, CRS and U.S. DOE to continue to publish reports on the industry and updating previous reports. The water intensity of irrigated feedstock for biofuels shows
Water and Energy Nexus: A Literature Review
122
that work needs to be done to change agricultural practices to increase water efficiency, such as through precision farming.
The estimations made in the previous section demonstrate the need for federal quantitative data on the water consumption required for the production of biofuels in the U.S. A quantitative forecast of the national impact of the RFS should be conducted under several different scenarios.
123
References
References
SECTION I. ENERGY FOR WATER
Ahlfeld, D., and M. Laverty. “Analytical Solutions for Minimization of Energy Use for Groundwater Pumping.” Water Resources Research, 47 (6): 1-9 (2011).
Alexander, K., and E. Giddens. “Microhydro: Cost-Effective, Modular Systems for Low Heads.” Renewable Energy, 33 (6): 1379-1391 (2008).
Alexander, K., E. Giddens and A. Fuller. “Axial-Flow Turbines for Low Head Microhydro Systems.” Renewable Energy, 34 (1): 1379-1391 (2009).
Alley, W. “Tracking U.S. Groundwater: Reserves for the Future?” Environment, 48 (3): 37-41(2010).
AMSA. “AMSA 2002 Financial Survey.” Association of Metropolitan Sewerage Agencies (2002).
AWWA. “Dawn of the Replacement Era – Reinvesting in Drinking Water Infrastructure.” American Water Works Association (2001).
Baird, G. “The Silver Bullet for Aging Water Distribution Systems?” Journal of American Water Works Association (2011).
Bennett, B., L. Park and R. Wilkinson. “Embedded Energy in Water Studies: Statewide and Regional Water-Energy Relationship.” California Public Utilities Commission (2010b).
Bennett, B., L. Park and R. Wilkinson. “Embedded Energy in Water Studies: Water Agency and Function Component Study and Embedded Energy − Water Load Profiles.” California Public Utilities Commission (2010a).
Billington, S., C. Criddle, C. Frank, M. Morse, S. Christian and A. Pieja. “Bacterial Poly (Hydroxy Alkanoate) Polymer and Natural Fiber Composites.” U.S. Patent No. US 2011/0112257 A1 (2011).
Biolytix Wastewater Systems. Accessed online at www.biolytix.com (2012).
Blaisdell, F., and P. Manson. “Loss of Energy at Sharp-Edged Pipe Junctions in Water Conveyance Systems.” U.S. Department of Agriculture, Technical Bulletin No. 1283 (1963).
Boulos, P., Z. Wu, C. Orr, M. Moore, P. Hsiung and D. Thomas. “Optimal Pump Operation of Water Distribution Systems Using Genetic Algorithms” (2002).
Bracmort, K., C. Stern and A. Vann, A. “Hydropower: Federal and Nonfederal Investment.” Congressional Research Service (2012).
Burton, F. “Water and Wastewater Industries: Characteristics and Energy Management Opportunities.” Electric Power Research Institute (EPRI) (1996).
Water and Energy Nexus: A Literature Review
124
California Statewide Groundwater Elevation Monitoring (CASGEM). “SBX7 6: An Amendment to the Water Code.” Department of Water Resources (2009).
Campbell, R. “Small Hydro and Low-Head Hydro Power Technologies and Prospects.” Congressional Research Service (2010).
Cantwell, B., C. Criddle, K. Lohner, Y. Sherson, G. Wells, B. Johnson, K. Mayer-Blackwell and X. Xie. “Microbial Production of Nitrous Oxide Coupled With Chemical Reactions of Gaseous Nitrous Oxide.” U.S. Patent No. US 2010/0272626 A1 (2010).
Carter, N. “Desalination: Technologies, Use and Congressional Issues.” Congressional Research Service (2011).
CBO “Future Investment in Drinking Water and Wastewater Infrastructure.” Congressional Budget Office (2002).
CEC (Klein, G., M. Krebs, V. Hall, T. O’Brien and B. Blevins). “California’s Water–Energy Relationship.” California Energy Commission (2005).
CEC (Park, L.). “Statewide Small Hydropower Assessment.” California Energy Commission (2006).
Chakravorty, U., E. Hochman and D. Zilberman. “A Spatial Model of Optimal Water Conveyance.” Journal of Environmental Economics and Management, 29: 25-41 (1995).
Chamberlain, D., E. Stewart, F. Yeh and M. Stift. “Design Considerations for Hydropower Development in a Water Distribution System.” SHP News (2004).
Charcosset, C. “A Review of Membrane Processes and Renewable Energies for Desalination.” Desalination, 245 (1-3): 214–231 (2009).
Chaudhry, S. “Unit Cost of Desalination.” California Desalination Task Force, California Energy Commission (2003).
Combs, S. “American Recovery and Reinvestment Act.” State of Texas Window on State Government website, accessed online at window.state.tx.us/recovery (2012).
Cooley, H., J. Christian-Smith and P. Gleick. “More With Less: Agricultural Water Conservation and Efficiency in California.” Pacific Institute (2008).
Cooley, H., P. Gleick and G. Wolff. “Desalination, With a Grain of Salt: A California Perspective.” Pacific Institute (2006).
Cooley, H. and R. Wilkinson. “Implications of Future Water Supply Sources for Energy Demands.” WateReuse Research Foundation (2012).
Cotruvo, J. “Ensuring Safe Drinking Water.” U.S. Environmental Protection Agency (1985).
Cox, W. “Water Supply Planning: Current Issues.” Virginia Water Science Center (April 2012).
CRS. “Safe Drinking Water Act (SDWA): Selected Regulatory and Legislative Issues.” Congressional Research Service (2010).
DeMonsabert, S., A. Bakhshi, C. Maas and B. Liner. “Incorporating Energy Impacts Into Water Supply and Wastewater Management.” ACEEE Summer Study on Energy Efficiency in Industry, 13-21(2009).
125
References
Diaz-Valbuena, L., H. Leverenz, C. Cappa, G. Tchobanoglous, W. Horwath and J. Darby. “Methane, Carbon Dioxide, and Nitrous Oxide Emissions from Septic Tank Systems.” Environmental Science and Technology, 45: 2741–2747 (2011).
Dinar, A. “Impact of Energy Cost and Water Resource Availability on Agriculture and Groundwater Quality in California.” Resource and Energy Economics, 16: 47-66 (1994).
Donn, J., M. Mendoza and J. Pritchard. “Pharmawater.” Associated Press (March 2009).
Duhigg, C. “Millions in U.S. Drink Dirty Water, Records Show.” The New York Times (Dec. 7, 2009).
ECONorthwest. “Embedded Energy in Water Pilot Programs Impact Evaluation.” California Public Utilities Commission (2011).
Elliott, T., B. Zeier, I. Xagoraraki and G.W. Harrington. “Energy Use at Wisconsin’s Drinking Water Facilities.” Energy Center of Wisconsin (2003).
EPRI (Goldstein, R., and W. Smith). “Water and Sustainability: U.S. Electricity Consumption for Water Supply and Treatment.” Electric Power Research Institute (2002).
Flex Your Power. “Water-Wastewater Guide: Reduce Energy Use in Water and Wastewater Facilities Through Conservation and Efficiency Measures.” California Energy Commission, Efficiency Partnership Program (2002).
Fritzmann, C., J. Löwenberg, T. Wintgens and T. Melin. “State-of-the-Art of Reverse Osmosis Desalination.” Desalination, 216 (1-3):1–76 (2007).
Gassner, K., A. Popov and N. Pushak. “Does Private Sector Participation Improve Performance in Electricity and Water Distribution?” The World Bank (2009).
GEI. “California’s Water-Energy Nexus: Pathways to Implementation.” WET- CAT, Governor of California’s Office (2012).
GEI. “Water-Energy Nexus Research: Recommendations for Future Opportunities.” GEI Consultants (2013).
Gleick, P. “Water and Energy.” Annual Review of Energy and the Environment, 19: 267–299 (1994).
Gleick, P. “Water and Energy (and Climate) Critical Links.” National Academy of Sciences (2008).
Gleick, P. “Water Use.” Annual Review of Environment and Resources, 28 (1): 275-314 (2003).
Glennon, R. “The Price of Water.” Journal of Land Resources and Environmental Law, 24 (2004).
Hammer, M. “Water and Wastewater Technology.” Prentice Hall, 6th edition (2007).
House, L. “Recapturing Embedded Energy in Water Systems: A White Paper on In-Conduit Generation Issues and Policies.” Hydro Collaborative, University of California, Davis (2010).
Hussey, K., and J. Pittock. “The Energy-Water Nexus: Managing the Links Between Energy and Water for a Sustainable Future.” Ecology and Society, 17 (1):31 (2012).
ICF International. “Water and Energy: Leveraging Voluntary Programs to Save Both Water and Energy.” U.S. Environmental Protection Agency (2008).
Water and Energy Nexus: A Literature Review
126
Leverenz, H., G. Tchobanoglous and J. Darby. “Evaluation of Greenhouse Gas Emissions From Septic Systems.” Water Environment Research Foundation (2010).
Liu, F., A. Ouedraogo, S. Manghee and A. Danilenko. “A Primer on Energy Efficiency for Municipal Water and Wastewater Utilities.” The World Bank (2012).
Matamoros, V., C. Arias, H. Brix and J. Bayona. “Removal of Pharmaceuticals and Personal Care Products (PPCPs) From Urban Wastewater in a Pilot Vertical Flow Constructed Wetland and a Sand Filter.” Environmental Science and Technology, 41 (23): 8171-8177 (2007).
Mathioulakis, E., V. Belessiotis and E. Delyannis. “Desalination by Using Alternative Energy: Review and State-of-the-Art.” Desalination, 203 (1-3): 346–365 (2007).
Means, E.. “Water and Wastewater Industry Energy Efficiency: A Research Roadmap.” AWWA Research Foundation (2004).
Mehta, M. “Volumetric Pricing for Sanitary Sewer Service in California Would Save Water and Money.” Natural Resources Defense Council (2012).
Messina, E. “Filtration Avoidance Under the Safe Drinking Water Act.” Vermont Law Review, 19: 557 (1995).
Mickley, M. “Membrane Concentrate Disposal: Practices and Regulation.” U.S. Bureau of Reclamation (2006).
National Research Council (NRC). “Desalination: A National Perspective.” The National Academies Press (2008).
National Research Council (NRC). “Urban Stormwater Management in the United States.” The National Academies Press (2008).
National Research Council (NRC). “Water Reuse: Potential for Expanding the Nation’s Water Supply Through Reuse of Municipal Wastewater.” The National Academies Press (2012).
Natural Resources Defense Council. “Think Before You Drink.” (1993).
Olson, P. “How Can My Utility Benefit From AWWA Standards?” American Water Works Association − Opflow (2009).
Park, L., and J. Bower. “The Role of Natural Gas in California’s Water-Energy Nexus.” WaterEnergy Innovations (2012).
Parsons Corporation. “Emerging Technologies for Biosolids Management.” U.S. Environmental Protection Agency (2006).
Parsons Corporation. “Emerging Technologies for Wastewater Treatment and In-Plant Wet Weather Management.” U.S. Environmental Protection Agency (2008).
Pate, R., M. Hightower, C. Cameron and W. Einfeld. “Overview of Energy-Water Interdependencies and the Emerging Energy Demands on Water Resources.” Sandia National Laboratories (2007).
Pieja, A., P. McCarty, C. Criddle and E. Sundstrom. “Use of Hydroxyalkanoid Acids as Substrates for Production of Poly-Hydroxyalkanoated Acids by Methane-Oxidizing Bacteria.” International Patent No. PCT/US2010/003148 (2010).
127
References
Radjenovic, J., M. Petrovic, F. Ventura and D. Barceló. “Rejection of Pharmaceuticals in Nanofiltration and Reverse Osmosis Membrane Drinking Water Treatment.” Water Research, 42 (14): 3601-10 (2008).
Renzetti, S. “Municipal Water Supply and Sewage Treatment: Costs, Prices, and Distortions.” The Canadian Journal of Economics, 32 (3): 688-704 (1999).
Rideout, C. “Where Are All the Citizens Suits: The Failure of Safe Drinking Water Enforcement in the United States.” Health Matrix, 21(2): 655-695 (2011).
Robinson, D. “Construction and Operating Costs of Groundwater Pumps for Irrigation in the Riverine Plain.” CSIRO Land and Water (2002).
Rostkowski, K.H., C.S. Criddle and M.D. Lepech. “Cradle-to-Gate Life Cycle Assessment for a Cradle-to-Cradle Cycle: Biogas to Bioplastic (and Back).” Environmental Science and Technology, 46 (18) (2012).
Rothausen, S., and D. Conway. “Greenhouse-Gas Emissions From Energy Use in the Water Sector.” Nature Climate Change (2011).
Roy, S., and N. Dee. “Groundwater Issues − Wellhead Protection Under the Safe Drinking Act.” U.S. Environmental Protection Agency (1989).
Ruhl, J., and J.S. Alzman. “The Effects of Wetland Mitigation Banking on People.” National Wetlands Newsletter − Environmental Law Institute, 28 (2): 7-13 (2006).
Sanders, K.T., and M.E. Webber. “Evaluating the Energy Consumed for Water Use in the United States.” Environmental Research Letters, 7 (3) (2012).
Sandia National Laboratories. “Desalination and Water Purification Technology Roadmap.” U.S. Department of Energy (2003).
Santa Clara Valley Water District. “From Watts to Water” (2011).
Science Applications International Corporation. “Water and Wastewater Industry − Energy Best Practice.” Wisconsin Department of Administration (2006).
Scott, C., S. Pierce, M. Pasqualetti, A. Jones, B. Montz and J. Hoover. “Policy and Institutional Dimensions of the Water-Energy Nexus.” Energy Policy, 39 (10): 6622–6630 (2011).
Shermer, S. “The Drinking Water Security and Safety Amendments of 2002: Is America’s Drinking Water Infrastructure Safer Four Years Later?” UCLA Journal of Environmental Law and Policy, 24: 355-356 (2005).
Shrestha, E. “Evaluating the Energy and Carbon Footprint of Water Conveyance System and Future Water Supply Options for Las Vegas, Nevada.” University of Nevada, Las Vegas (2010).
Smith, C., A.J. Simon and R. Belles. “Estimated Water Flows in 2005: United States.” Lawrence Livermore National Laboratory (2011).
State Water Resources Control Board (SWRCB). “Recycled Water Policy.” Accessed online July 2013 at http://www.waterboards.ca.gov/water_issues/programs/water_recycling_policy/. California Environmental Protection Agency (2009).
Water and Energy Nexus: A Literature Review
128
Sterling, R., L. Wang and R. Morrison. “Rehabilitation of Wastewater Collection and Water Distribution Systems.” U.S. Environmental Protection Agency, EPA/600/R-09/048 (2009).
Stillwell, A.S., C.W. King, M.E. Webber, J. Duncan and A. Hardberger. “The Energy-Water Nexus in Texas.” Ecology and Society 16 (1) (2010).
Stokes, J., and A. Horvath. “Energy and Air Emission Effects of Water Supply.” Environmental Science and Technology, 43 (8): 2680–2687 (2009).
Summit Blue Consulting. “Small Hydropower Technology and Market Assessment.” Energy Trust of Oregon (2009).
Taher, S., and J. Labadie. “Optimal Design of Water-Distribution Networks With GIS.” Journal of Water Resources Planning and Management, 122: 301-311 (1996).
Turner, A.. “Federal Groundwater Regulation and Policy: Improvements Under the Horizon.” Journal of Natural Resources and Environmental Law, 10: 323 (1994).
Union of Concerned Scientists. “The Energy-Water Collision: 10 Things You Should Know” (2010).
U.S. EPA. “A Homeowner’s Guide to Septic Systems.” U.S. Environmental Protection Agency (2002a).
U.S. EPA. “Assessing New York City’s Watershed Protection Program.” U.S. Environmental Protection Agency (2000).
U.S. EPA. “Clean Watersheds Needs Survey 2000.” U.S. Environmental Protection Agency, EPA- 832-R-03-001 (2003).
U.S. EPA. “Clean Watersheds Needs Survey 2008.” U.S. Environmental Protection Agency, EPA- 832-R-10-002 (2010a).
U.S. EPA. “Drinking Water Treatment.” U.S. Environmental Protection Agency (2004).
U.S. EPA. “Evaluation of Energy Conservation Measures for Wastewater Treatment Facilities.” U.S. Environmental Protection Agency, EPA 832-R-10-005 (2010b).
U.S. EPA. “Methods for Evaluating Wetland Condition: Using Vegetation to Assess Environmental Conditions in Wetlands.” U.S. Environmental Protection Agency, EPA-822-R-02- 020 (2002b).
U.S. EPA. “National Management Measures to Protect and Restore Wetlands and Riparian Areas for the Abatement of Nonpoint Source Pollution.” U.S. Environmental Protection Agency, EPA-841-B-05-003 (2005).
U.S. EPA. “Public Drinking Water Systems Programs.” U.S. Environmental Protection Agency website (2012).
U.S. EPA. “Quantification of Methane Emissions and Discussion of Nitrous Oxide and Ammonia from Septic Tanks, Latrines, and Stagnant Open Sewers in the World.” U.S. Environmental Protection Agency, EPA-600-R-99-089 (1999).
U.S. EPA. “Report to Congress on the Impacts and Control of CSOs and SSOs.” U.S. Environmental Protection Agency, EPA-833-R-04-001 (2004).
U.S. EPA. “Safe Drinking Water Act, Section 1429 Ground Water Report to Congress.” U.S. Environmental Protection Agency, EPA/816/R-99/016 (1999).
129
References
U.S. EPA. “Understanding the Safe Drinking Water Act.” U.S. Environmental Protection Agency (2004).
U.S. GAO. “Energy-Water Nexus: Amount of Energy Needed to Supply, Use, and Treat Water Is Location-Specific and Can Be Reduced by Certain Technologies and Approaches.” U.S. Government Accountability Office (2011).
U.S. GAO. “Water Infrastructure: Comprehensive Asset Management Has Potential to Help Utilities Better Identify Needs and Plan Future Investments.” U.S. Government Accountability Office, GAO-04-461 (2004).
U.S. GAO. “Action Needed to Sustain Agencies’ Collaboration on Pharmaceuticals in Drinking Water.” U.S. Government Accountability Office, GAO-11-346 (2011).
USGS. “Total Water Withdrawals by Source and State.” U.S. Geological Survey (2005).
USGS (Kenny, J., N. Barber, S. Hutson, K. Linsey, J. Lovelace and M. Maupin). “Estimated Use of Water in the United States in 2005.” U.S. Geological Survey (2009).
Van Pelt, R., and R. Waskom. “Solar-Powered Groundwater Pumping Systems.” Colorado State University − Natural Resources Series, 6 (2008).
Water Education Foundation. “Where Does Southern California’s Water Come From?” Aquafornia: The California Water News Blog (April 2012).
Weissman, S., and L. Miller. “The California Public Utilities Commission’s Pilot Program to Exploit the Nexus of Energy Efficiency and Water Conservation.” Pacific McGeorge Global Business amd Development Law Journal, 22:257 (2009).
White, J., M. Belmont and C. Metcalfe. “Pharmaceutical Compounds in Wastewater: Wetland Treatment as a Potential Solution.” The Scientific World Journal, 6:1731-1736 (2006).
Wilkinson, R. “Methodology for Analysis of the Energy Intensity of California’s Water Systems.” University of California, Santa Barbara (2000).
Wiser, J., J. Schettler and J. Willis. “Evaluation of Combined Heat and Power Technologies for Wastewater Facilities.” Brown and Caldwell (2010).
Wolff, G., R. Cohen, E. Cousins and B. Greenfield. “Energy Down the Drain: The Hidden Costs of California’s Water Supply.” Natural Resources Defense Council (2004).
WSO. “Secondary Research for Water Leak Detection Program and Water System Loss Control Study.” Water Systems Optimization and Southern California Edison (2009).
Younos, T., and K. Tulou. “Energy Needs, Consumption and Sources.” Journal of Contemporary Water Research and Education, 132 (1): 27–38 (2009).
Younos, T., and K.E. Tulou. “Overview of Desalination Techniques in Desalination: A Primer.” Journal of Contemporary Water Research and Education. Issue 132 (2005).
Zhu, T., C. Ringler and X. Cai. “Energy Price and Groundwater Extraction for Agriculture: Exploring the Energy Water Food Nexus at the Global and Basin Levels.” International Water Management Institute (2007).
Water and Energy Nexus: A Literature Review
130
SECTION II. WATER FOR ENERGY
Allen, L., M. Cohen, D. Abelson and B. Miller. “Fossil Fuels and Water Quality.” The World’s Water, Chapter 4 (2011).
Alley, W. “Tracking U.S. Groundwater: Reserves for the Future?” Environment, 48 (3) (2010).
Alvarez, P., J. Burken, J. Coan, M. Dias de Olivera, R. Domingues-Faus, D. Gomez, A. Meyers-Jaffe et al. “Fundamentals of a Sustainable U.S. Biofuels Policy.” Rice University (2010).
American Natural Gas Alliance. Accessed online April 2012 at http://www.anga.us (2012).
American Petroleum Institute. Accessed online at www.api.org (2012).
Averyt, K., J. Fisher, A. Huber-Lee, A. Lewis, J. Macknick, N. Madden, J. Rogers and S. Tellinghuisen. “Freshwater Use by U.S. Power Plants: Electricity’s Thirst for a Precious Resource.” Union of Concerned Scientists (2011).
Bartis, J., T. LaTourrette, L. Dixon, D. Peterson and G. Cecchine. “Oil Shale Development in the United States: Prospects and Policy Issues.” National Energy Technology Laboratory (2005).
Baum, E., J. Chaisson, L. Evans, J. Lewis, D. Marshall, J. Thompson, B. Warren et al. “The Last Straw: Water Use by Power Plants in the Arid West.” Clean Air Task Force (2003).
BP. “Statistical Review of World Energy” (2011).
Booth, C.J. “The Effects of Longwall Coal Mining on Overlying Aquifers.” Geological Society, London, Special Publications, v. 198 (2002).
Canadian National Energy Board. “Canada’s Oil Sands: Opportunities and Challenges to 2015 − An Update.” National Energy Board (2006).
Chan, M., J. Duda, S. Forbes, T. Rodosta, R. Vagnetti and H. McIlvried. “Emerging Issues for Fossil Energy and Water.” National Energy Technology Laboratory Report, No. DOE/NETL- 2006/1233 (2006).
Chandel, M., L. Pratson and R. Jackson. “The Potential Impacts of Climate-Change Policy on Freshwater Use in Thermoelectric Power Generation.” Energy Policy, 39 (10): 6234-6242 (2011).
Chauvel, A., and G. Lefebvre. “Petrochemical Processes” (1989). Editions Technip (1989).
Chesapeake Energy. “Chesapeake Energy − Shale Gas Information.” Accessed online at www.chk.com (2012).
Chiu, Y.-W., S. Suh, S. Pfister, S. Hellweg and A. Koehler. “Measuring Ecological Impact of Water Consumption by Bioethanol Using Life Cycle Impact Assessment.” The International Journal of Life Cycle Assessment (2011).
Ciferno, J., R. Munson and J. Murphy. “Water-Energy Interface Research Program.” U.S. Department of Energy (2010).
Clark, C., and J. Veil. “Produced Water Volumes and Management Practices in the United States.” Argonne National Laboratory (2009).
131
References
Connors, S., J. Hezir, G. McRae, H. Michaels and C. Ruppel. “The Future of Natural Gas.” MIT Energy Initiative (2010).
Cooley, H., J. Fulton and P. Gleick. “Water for Energy: Future Water Needs for Electricity in the Intermountain West.” Pacific Institute (2011).
CRS. “Agriculture-Based Biofuels: Overview and Emerging Issues.” Congressional Research Service (2012).
CRS. “Energy Independence and Security Act of 2007: A Summary of Major Provisions.” Congressional Research Service (2007).
Davis, G., and A. Velikanov. “Hydrological Problems Arising From the Development of Energy.” UNESCO (1977).
Du, X., and D. Hayes. “The Impact of Ethanol Production on U.S. and Regional Gasoline Markets.” Energy Policy, 37 (8): 3227-3234 (2009).
Du, X., and D. Hayes. “The Impact of Ethanol Production on U.S. and Regional Gasoline Markets: An Update to 2012.” Center for Agricultural and Rural Development, Iowa State University (2012).
Dziegielewski, B., and T. Bik. “Water Use Benchmarks for Thermoelectric Power Generation.” Department of Geography and Environmental Resources − Southern Illinois University, Carbondale (2006).
EIA. “2011 Uranium Marketing Annual Report.” U.S. Energy Information Administration (2012a).
EIA. “Annual Coal Report.” U.S. Energy Information Administration (2011a).
EIA. “Annual Energy Outlook.” U.S. Energy Information Administration (2005).
EIA. “Annual Energy Outlook.” U.S. Energy Information Administration (2009).
EIA. “Annual Energy Outlook.” U.S. Energy Information Administration (2012).
EIA. “Direct Federal Financial Interventions and Subsidies in Energy in Fiscal Year 2010.” U.S. Energy Information Administration (2011).
EIA. “Domestic Uranium Production Report.” U.S. Energy Information Administration (2011a).
EIA. “Electric Power Annual Report.” U.S. Energy Information Administration (2005).
EIA. “Monthly Biodiesel Production Reports.” Accessed online July 2013 at http://www.eia.gov/biofuels/biodiesel/production/. U.S. Department of Energy (2013).
EIA. “Today in Energy.” Accessed online July 2013 at http://www.eia.gov/todayinenergy/detail.cfm?id=3190. Energy Information Administration (2013).
Elcock, D. “Future U.S. Water Consumption: The Role of Energy Production.” Journal of the American Water Resources Association, 46 (3): 447-460 (2010).
Elcock, D., and J.A. Kuiper. “Water Vulnerabilities for Existing Coal-fired Power Plants.” National Energy Technology Laboratory (2010).
EPRI. “Program on Technology Innovation: Power Generation and Water Sustainability.” Electric Power Research Institute (2007).
Water and Energy Nexus: A Literature Review
132
Epstein, P., J. Buonocore, K. Eckerle, M. Hendryx, B. Stout and R. Heinberg. “Full Cost Accounting for the Life Cycle of Coal.” Annals of the New York Academy of Sciences, 2019: 79-98 (2011).
Farrell, A., R. Plevin, B. Turner, A. Jones, M. O’Hare and D. Kammen. “Ethanol Can Contribute to Energy and Environmental Goals.” Science, 311 (5760): 506-8 (2006).
Feeley, T.J., T.J. Skone, G. Stiegel, A. McNemar, M. Nemeth, B. Schimmoller, J. Murphy et al. “Water: A Critical Resource in the Thermoelectric Power Industry.” Energy, 33 (1): 1-11 (2008).
Fingerman, K., M. Torn, M. O’Hare and D. Kammen. “Accounting for the Water Impacts of Ethanol Production.” Environmental Research Letters, 5 (1) (2010).
Fthenakis, V., and H. Kim. “Land Use and Electricity Generation: A Life-Cycle Analysis.” Renewable and Sustainable Energy Reviews, 13 (6-7): 1465-1474 (2009).
Fthenakis, V., and H. Kim. “Life-Cycle Uses of Water in U.S. Electricity Generation.” Renewable and Sustainable Energy Reviews, 14 (7): 2039-2048 (2010).
GEI. “Water-Energy Nexus Research: Recommendations for Future Opportunities.” GEI Consultants (2013).
Gerbens-Leenes, W., A.Y. Hoekstra and T.H. van der Meer. “The Water Footprint of Bioenergy.” Proceedings of the National Academy of Sciences, 106 (25) (2009).
Gleick, P.H. “Water and Energy.” Annual Review of Energy and the Environment, 19: 267-99 (1994).
Goldstein, R. “Electric Power/Water Sustainability.” Electric Power Research Institute. Racine, Wisc.: Johnson Foundation Environmental Forum (2009).
Goldstein, R. A., and W. Smith. “Water and Sustainability (Volume 3): U.S. Water Consumption for Power Production − The Next Half Century.” Electric Power Research Institute (Vol. 3) (2002).
Gosselin, P., S. Hrudey, A. Plourde, R. Therrien, G. Van Der Kraak and Z. Xu. “Environmental and Health Impacts of Canada’s Oil Sands Industry.” The Royal Society of Canada (2010).
Grubert, E.A. “Reserve Reporting in the United States Coal Industry.” Energy Policy 44 (2012).
Grubert, E.A., F.C. Beach and M.E. Webber. “Can Switching Fuels Save Water? A Life Cycle Quantification of Freshwater Consumption for Texas Coal and Natural Gas-Fired Electricity.” Environmental Research Letters, 7 (4) (2012).
Grubert, E., C.W. King and M.E. Webber. “Water for Biomass-Based Energy on Maui, Hawaii.” Proceedings of the ASME 2011 International Mechanical Engineering Congress (2011).
Grubert, E., and S. Kitasei. “How Energy Choices Affect Fresh Water Supplies: A Comparison of U.S. Coal and Natural Gas.” World Watch Institute (2010).
Hammerschlag, R. “Ethanol’s Energy Return on Investment: A Survey of the Literature 1990-Present.” Environmental Science and Technology, 40(6): 1744-1750 (2006).
Harto, C. “Shale Gas – The Energy-Water Nexus.” Argonne National Laboratory, 2011. AWRA Spring Specialty Conference Baltimore (2011).
Höök, M., and K. Aleklett. “Historical Trends in American Coal Production and a Possible Future Outlook.” International Journal of Coal Geology, 78 (3): 201-216 (2009).
133
References
International Atomic Energy Administration (IAEA). “Uranium 2009: Resources, Production and Demand, the ‘Red Book’” (2010).
Kennedy, K. “The Role of Natural Gas in America’s Energy Mix.” Natural Resource Defense Council Report (2012).
Kenny, J.F., N.L. Barber, S.S. Hutson, K.S. Linsey, J.K. Lovelace and M.A. Maupin. “Estimated Use of Water in the United States in 2005: U.S. Geological Survey Circular.” U.S. Geological Survey (2009).
Khatib, Z., and P. Verbeek. “Water to Value – Produced Water Management for Sustainable Field Development of Mature and Green Fields.” Journal of Petroleum Technology (2003).
Kiparsky, M., and J. Hein. “Regulation of Hydraulic Fracturing in California: A Wastewater and Water Quality Perspective.” University of California, Berkeley (2013).
Kohler, E., and I. Lukashov. “U.S. Coal Production.” Yale School of Management (2009).
Krauss, C. “South African Company to Build U.S. Plant to Convert Gas to Liquid Fuels.” The New York Times, accessed online July 2013 at http://www.nytimes.com/2012/12/04/business/energy-environment/sasol-plans-first-gas-to-liquids-plant-in-us.html (2012).
Lovelace, J.K. “Methods for Estimating Water Withdrawals for Mining in the United States, 2005.” U.S. Geological Survey (2009).
Mielke, E., L. Diaz Anadon and V. Narayanamurti. “Water Consumption of Energy Resource Extraction, Processing, and Conversion, A Review of the Literature for Estimates of Water Intensity of Energy-Resource Extraction, Processing to Fuels, and Conversion to Electricity.” Energy Technology Innovation Policy Discussion Paper No. 2010-15, Harvard University (2010).
Mikula, R.J., V.A. Munoz and O. Omotoso. “Water Use in Bitumen Production: Tailings Management in Surface Mined Oil Sands.” Canadian International Petroleum Conference, Society of Petroleum Engineers (2008).
Mudd, G., and M. Diesendorf. “Sustainability of Uranium Mining and Milling: Toward Quantifying Resources and Eco-Efficiency.” Environmental Science and Technology, 42: 2624–2630 (2008).
Mulder, K., N. Hagens and B. Fisher. “Burning Water: A Comparative Analysis of the Energy Return on Water Invested.” Ambio, 39 (1): 30-39 (2010).
National Research Council. “Coal: Research and Development to Support National Energy Policy.” National Academies Press (2007).
National Research Council. “Hidden Costs of Energy: Unpriced Consequences of Energy Production and Use.” National Academies Press (2010).
National Research Council. “Management and Effects of Coalbed Methane Produced Water in the United States.” National Academies Press (2010).
National Research Council. “Surface Coal Mining Effects on Ground Water Recharge Committee on Ground Water Recharge in Surface-Mined Areas.” National Academies Press (1990).
Nuclear Energy Agency. “In Situ Leach Mining of Uranium.” NEA website (2012).
Water and Energy Nexus: A Literature Review
134
O’Connor, T. Testimony of Terry O’Connor, Vice President, External and Regulatory Affairs, Shell Exploration and Production Company, Unconventional Oil, Before the United States Senate Energy Committee. Royal Dutch Shell (2008).
Park, L., and J. Bower. “The Role of Natural Gas in California’s Water-Energy Nexus.” WaterEnergy Innovations (2012).
Pate, R., M. Hightower, C. Cameron and W. Einfeld. “Overview of Energy-Water Interdependencies and the Emerging Energy Demands on Water Resources,” Sandia National Laboratories Report, No. SAND 2007-1349C (2007).
Patzek, T., S.-M. Anti, R. Campos, K. Ha, J. Lee, B. Li, J. Padnick et al. “Ethanol From Corn: Clean Renewable Fuel for the Future, or Drain on Our Resources and Pockets?” Environment, Development and Sustainability, 7(3): 319-336 (2005).
Perlack, R., L. Wright, R. Graham, A. Turhollow, B. Stokes and D. Erbach. “Biomass as Feedstock for a Bioenergy and Bioproducts Industry: The Technical Feasibility of a Billion-Ton Annual Supply.” USDA and U.S. DOE (2005).
Peter, B. “EPA Water Intake Rules Fall Short of the Disaster Scenario.” The New York Times (April 8, 2011).
Pond, G.J., M.E. Passmore, F.A. Borsuk, L. Reynolds and C.J. Rose. “Downstream Effects of Mountaintop Coal Mining: Comparing Biological Conditions Using Family- and Genus-Level Macroinvertebrate Bioassessment Tools.” U.S. Environmental Protection Agency, Region 3 (2008).
Pradhan, A., D. Shrestha, A. McAloon, W. Yee, M. Haas and J. Duffield. “Energy Life-Cycle Assessment of Soybean Biodiesel Revisited.” American Society of Agricultural and Biological Engineers, 54 (3): 1031-1039 (2011).
Renewable Fuels Association (RFA) “Ethanol and the U.S. Corn Crop.” Accessed online July 2013 at http://www.ethanolrfa.org/page/-/objects/documents/1898/corn_use_facts (2013).
Riffat, S., and X. Ma, X. “Improving the Coefficient of Performance of Thermoelectric Cooling Systems: A Review.” International Journal of Energy Research, 28 (9): 753-768 (2004).
Rowe, D. “Thermoelectric Waste Heat Recovery as a Renewable Energy Source.” International Journal of Innovations in Energy Systems and Power, 1 (1): 13-23 (2006).
Roy, S., K. Summers and R. Goldstein. “Water Sustainability in the United States and Cooling Water Requirements for Power Generation.” Universities Council on Water Resources − Water Resources Update, 126: 94-99 (2003).
Sanders, K.T., and M.E. Webber. “Evaluating the Energy Consumed for Water Use in the United States.” Environmental Resources Letters, 7(3) (2012).
Sapien, J. “With Natural Gas Drilling Boom, Pennsylvania Faces an Onslaught of Wastewater.” ProPublica (2009).
Shapouri, H., and P. Gallagher. “USDA’s 2002 Ethanol Cost-of-Production Survey.” U.S. Department of Agriculture (2005).
135
References
Shapouri, H., P. Gallagher, W. Nefstead, R. Schwartz, S. Noe and R. Conway. “2008 Energy Balance for the Corn-Ethanol Industry Abstract.” U.S. Department of Agriculture (2010).
Shuster, E. “Estimating Freshwater Needs to Meet Future Thermoelectric Generation Requirements.” National Energy Technology Laboratory (2009).
Smith, C., A.J. Simon and R. Belles. “Estimated Water Flows in 2005: United States.” Lawrence Livermore National Laboratories (2011).
Soeder, D.J., and W.M.Kappel. “Water Resources and Natural Gas Production From the Marcellus Shale.” U.S. Geological Survey, Baltimore, Md. (2009).
Sovacool, B. “Valuing the Greenhouse Gas Emissions From Nuclear Power: A Critical Survey.” Energy Policy, 36: 2940–2953 (2008).
Sovacool, B. and K. Sovacool. “Identifying Future Electricity-Water Tradeoffs in the United States.” Energy Policy, 37 (7): 2763-2773 (2009).
Squillace, M. “The Strip Mining Handbook.” Environmental Policy Institute (2009).
Stillwell, A., M. Clayton and M. Webber. “Technical Analysis of a River Basin-Based Model of Advanced Power Plant Cooling Technologies for Mitigating Water Management Challenges.” Environmental Research Letters, 6 (3): 1-11 (2011).
Torcellini, P., N. Long and R. Judkoff. “Consumptive Water Use for U.S. Power Production.” National Renewable Energy Laboratory (2003).
Union of Concerned Scientists. “The Energy-Water Collision: Power and Water at Risk” (2011).
U.S. AEC. “Environmental Survey of the Uranium Fuel Cycle.” U.S. Atomic Energy Commission (1974).
USDA. “Biobased Economy Indicators − A Report to the U.S. Congress.” U.S. Department of Agriculture (2011).
U.S. DOE. “Energy and Environmental Profile of the U.S. Mining Industry.” U.S. Department of Energy (2002).
U.S. DOE. “Energy Demand on Water Resources − Report to Congress on the Interdependency of Energy and Water.” U.S. Department of Energy (2006).
U.S. DOE. “Strategic Petroleum Reserve.” Accessed online at http://energy.gov/fe/services/petroleum-reserves. U.S. Department of Energy (2012).
U.S. EPA. “Draft Plan to Study the Potential Impacts of Hydraulic Fracturing on Drinking Water Resources.” U.S. Environmental Protection Agency, EPA/600/D-11/001 (2011).
U.S. EPA. “EPA Issues Oil and Natural Gas Air Pollution Standards − Fact Sheet.” U.S. Environmental Protection Agency (2012).
U.S. EPA. “Evaluation of Impacts to Underground Sources of Drinking Water by Hydraulic Fracturing of Coalbed Methane Reservoirs; National Study Final Report.” U.S. Environmental Protection Agency (2002).
U.S. EPA. “Final Programmatic Environmental Impact Statement on Mountaintop Mining/Valley Fills in Appalachia − 2005.” U.S. Environmental Protection Agency (2005).
Water and Energy Nexus: A Literature Review
136
U.S. EPA. “Methyl Tertiary Butyl Ether (MTBE).” Accessed online July 2013 at http://www.epa.gov/mtbe/gas.htm. U.S. Environmental Protection Agency (2013).
U.S. EPA. “National Pollutant Discharge Elimination System; Establishing Requirements for Cooling Water Intake Structures at Phase III Facilities; Final Rule.” U.S. Environmental Protection Agency, Federal Register, 71 (116): 1-42. (2006).
U.S. EPA. “Uranium Mine Tailings.” Accessed online at http://www.epa.gov/radiation/docs/radwaste/402-k-94-001-umt.html. U.S. Environmental Protection Agency (2012).
U.S. GAO. “Energy-Water Nexus: Improvements to Federal Water Use Data Would Increase Understanding of Trends in Power Plant Water Use.” U.S. Government Accountability Office (2009).
USGS (Kenny, J., N. Barber, S. Hutson, K. Linsey, J. Lovelace and M. Maupin). “Estimated Use of Water in the United States in 2005.” U.S. Geological Survey (2009).
U.S. NRC. “Generic Environmental Impact Statement for In-Situ Leach Uranium Milling Facilities.” U.S. Nuclear Regulatory Commission (2009).
Urbina, I. “Drilling Down.” Accessed online July 2013 at http://www.nytimes.com/interactive/us/DRILLING_DOWN_SERIES.html?_r=0. The New York Times (2012).
Vassolo, S., and P. Döll. “Global Scale Gridded Estimates of Thermoelectric Power and Manufacturing Water Use.” Water Resources Research, 41(10) (2005).
Veil, J., D. Elcock, N. Ranek and M. Puder. “Chapter 32: Legal Framework for Groundwater Protection in the United States.” Handbook of Groundwater Engineering (2007).
Veil, J., and J. Quinn. “Water Issues Associated With Heavy Oil Production.” Argonne National Laboratory (2008).
Whistance, J., and W. Thompson. “How Does Increased Corn-Ethanol Production Affect U.S. Natural Gas Prices?” Energy Policy, 38 (5): 2315-2325 (2010).
Wolkersdorfer, C. “Water Management at Abandoned Flooded Underground Mines: Fundamentals, Tracer Tests, Modeling, Water Treatment.” Springer (2008).
World Energy Council. “2010 Survey of Energy Resources” (2011).
World Nuclear Association. “Power Plant Water Use for Cooling” (2011).
Wu, M., M. Mintz, M. Wang and S. Arora. “Consumptive Water Use in the Production of Bioethanol and Petroleum Gasoline.” Argonne National Laboratory (2008).
Wu, M., M. Mintz, M. Wang and S. Arora. “Water Consumption in the Production of Ethanol and Petroleum Gasoline.” Environmental Management, 44 (5): 981-97 (2009).
Yang, X., and B. Dziegielewski. “Water Use by Thermoelectric Power Plants in the United States.” Journal of the American Water Resources Association, 43 (1) (2007).
Younos, T., R. Hill and H. Pool. “Water Dependency of Energy Production and Power Generation Systems.” Virginia Tech, Virginia Water Resources Research Center Special Report, No. SR46-2009 (2009).
Zoback, M., B. Copithorne and S. Kitasei. “Addressing the Environmental Risks from Shale Gas Development.” Worldwatch Institute (2010).