Embed Size (px)
Citation preview

Water 2070 Audio Options
TO USE YOUR COMPUTER’S AUDIO:When the Webinar begins, you will beconnected to audio using your computer’smicrophone and speakers (VOIP)
TO USE YOUR TELEPHONE:If you prefer to use your phone, select“Use Telephone” after joining the webinar.

1000 Friends of Florida Thanks the Sponsorsof the Dr. John M. DeGrove Webinar Series
FLORIDA STEWARD The Archibald Foundation, Inc.
FLORIDA GUARDIAN John M. DeGrove Eminent Scholar Chair, Florida Atlantic University
PRESIDENT'S CLUB Mosaic Fertilizer, LLC
FRIEND Cobb ColeCodina Management, LLCMs. Kimberly A. DeGrove and Dr. William PartinWilliam Howard Flowers, Jr. FoundationKitson Evergreen, LLCLaw Offices of Robert L. Parks, P.L.The Perkins Charitable FoundationMr. Robert M. Rhodes

1000 Friends of Florida Thanks the Sponsorsof the Dr. John M. DeGrove Webinar Series
SPONSOR Ronald Book, PACambridge SystematicsMr. William M. De Grove
SUPPORTER American Planning Association,
Florida ChapterMr. Thomas J. BairdMr. David M. OrshefskyMs. Nancy Ellen StroudTallahassee State BankThomson Brock Luger & CompanyTreasure Coast RPCMr. & Mrs. Peter R. and Helen Wallace
Dr. John M. DeGrove

This Webinar Has Been Approved for:
• 1.5 AICP CM credits for planners (#9109130) • 2 CLE credits for the Florida Bar (#1606410N) • .15 CEU for certified environmental health
professionals

Upcoming Dr. John M. DeGrove WebinarsFebruary 15, 2016, 12 noon to 1:30pmImplementing Water 2070: WaterConservation Planning for FloridaCommunities
Visit www.1000friendsofflorida.org/webinarto find out more!

The PowerPoint and materials are available at www.1000friendsofflorida.org/florida2070
If you have questions:
• Your webinar control panelincludes a “Questions” box
• Please click on “+” sign andtype any questions in this box
• Please refer to the slide numberand/or speaker when you postyour question
• We will do our best to answerall questions as time permits

Project partners and panelists:
1000 Friends of Florida
Founded in 1986, 1000 Friends of Florida is a501(c)(3) not-for-profit organization that focuses onsaving special places and building better communitiesin one of the fastest growing states in thenation. Visit www.1000friendsofflorida.org for moreinformation on 1000 Friends.
Panelists
Vivian Young, AICP, Communications Director
Ryan Smart, President

Project partners and panelists:
The Florida Department of Agriculture andConsumer Services supports and promotes Floridaagriculture, protects the environment, safeguardsconsumers, and ensures the safety andwholesomeness of food. Our programs and activitiesare so varied and extensive, they touch the life ofjust about every Floridian. For more informationplease visit www.freshfromflorida.com.
Panelists
Cori Hermle, Environmental Consultant, Office ofAgricultural Water Policy, Florida Department ofAgriculture and Consumer Services

Project partners and panelists:Established in 1984, Geoplan is a multidisciplinaryGIS laboratory located in the University of Florida’sSchool of Landscape Architecture and Planning,College of Design, Construction and Planning. It wasdeveloped in response to the need for a teaching andresearch environment for Geographic InformationSystems, or GIS. Under its auspices spatial analysisis conducted in support of a broad range of academicdisciplines. Additional information is available atwww.geoplan.ufl.edu.
Panelists
Margaret H. Carr, Professor, Department ofLandscape Architecture, University of Florida
Paul D. Zwick, Ph.D., Professor, Department ofUrban and Regional Planning, University of Florida

Mapping Florida’s Future Alternative Patterns of
Water Use in 2070

One of the biggestissues facing Floridatoday is the availabilityof sufficient water tomeet the needs ofpeople, agriculture andthe environment.
The Life BeneathMac Stone Photography

A finite water supplyand declining qualitycombined with agrowing populationmake the traditionalcompetition betweenthese users evenmore intense.
David Moynahan Photography

In poll after poll,protection of drinkingwater consistentlyranks as a topenvironmentalconcern for thepublic.
NeedlerushMac Stone Photography

Clean and abundantwater also is neededto ensure that Florida’sagriculture andtourism industries –the mainstays of thisstate’s economy –remain strong andviable over the longterm.
M & B Products, TampaFlorida Department of Agriculture and Consumer Services
2007 Ag-Environmental Leadership Award: Buck Island Ranch in Lake Placid

Moderate projectionsindicate that Florida willhave 15 million newresidents by 2070.
The Florida 2070 studyshows the impacts of theassociated developmenton Florida’s lands.
But what about theimpact of 15 million newresidents on Florida’swaters?
Great BlueMac Stone Photography

THE WATER 2070 PROJECT2010 BASELINE

Florida 2070 provides the foundation for Water 2070.
The top map shows existingdevelopment and conservation landsin 2010.
The bottom left map shows Florida in2070 with 15 million new residents,if current development andconservation patterns continue.
The bottom right map shows Floridain 2070 with 15 million newresidents, but more compactdevelopment patterns and greaterconservation lands.
Visitwww.1000friendsofflorida.org/florida2070 for more information on Florida2070
2010
Developed
Protected
Other
2070Trend
Developed
Protected
Other
2070Alternative
Developed
Protected
Other

Florida 2070 in a Nutshell• If we don’t change the way we are developing more than 1/3 of Florida
will be paved over
• If we protect natural lands identified on current Florida Forever andGreenways Priorities 1 and 2 lists, a little less than half of the state’sland would be permanently protected
• If we protect these natural lands and promote more compactdevelopment, close to ¼ of the state’s lands will remain in agriculturalproduction
• With either 2070 development scenario, lands used for timber andmining will be most significantly impacted

Methodology & Assumptions for Water 2070 Baseline
• The baseline demand is based on the actual 2010 distribution of population,agriculture, and protected lands
• Using data from a United States Geological Survey study, the 2010 baseline percapita gallons per day (GPD) demand for each Florida county is established andused to determine total development-related demand for each county
• Based on an Alachua County study prepared at the University of Florida, it isassumed that rural/suburban census blocks (those with less than 2000people/square mile) use three times as much water as urban census blocks (thosewith > = 2000 people/square mile)
• Agriculture irrigation demand is based on data from a study prepared for theDepartment of Agriculture and Consumer Services which estimates water demandfor crops, livestock and aquaculture

Florida 2070 Baseline Water 2070 Baseline

2010 Water Use2010 Baseline
Developement Demand (GPD) 3,139,370,035
Agriculture Demand (GPD) 2,129,941,436
Total 5,269,311,481
This study only includes water use associated with development andagriculture and does not encompass water needed for mining/industrialactivities, power generation, or to support Florida’s natural systems
WATER 2070 TRENDWITH CURRENT DEVELOPMENTAND WATER DEMAND PATTERNS

Florida 2070 Trend Results
What happens if newdevelopment follows currenttrends and continues to sprawl atlow densities?
• More than 1/3 of the state willbe developed
• Roughly 5 million acres(including 2 million acres ofFlorida’s agricultural and naturallands) could convert from ruralto urban use
What impact would this have onwater use in Florida in 2070?

• The 2070 Trend is based on the addition of 15 million newresidents, assuming 2010 development patterns continue
• Using the baseline per capita gallons per day (GPD) demand foreach Florida county and the assumption that suburban/rural censusblocks use more water than urban census blocks, each county’swater demand quantity is increased to reflect its population increaseand the spatial distribution of that population
• Because some irrigated agricultural lands become developed, totalagricultural demand decreases.
Water 2070 Trend Methodology & Assumptions

Florida 2070 Trend Water 2070 Trend

Water 2070 Baseline Water 2070 Trend

Let’s Compare
2010 Baseline 2070 Trend% Change
Baseline Trend
Developement Demand (GPD)
3,139,370,035 6,480,557,237 106%
Agriculture Demand (GPD)
2,129,941,436 1,614,305,600 -24%
Total 5,269,311,481 8,094,962,839 54%

ALTERNATIVE 2070 USING LAND AND WATER CONSERVATION STRATEGIES

Florida 2070 Alternative Results
What happens by 2070 if newdevelopment is more compact,important conservation lands areprotected, and good agriculturallands aren’t developed?Florida will: • Save 1.8 million acres of land
from development
• Protect 5.8 million acres ofconservation lands
• Keep 1.1 million more acres ofagricultural lands in production
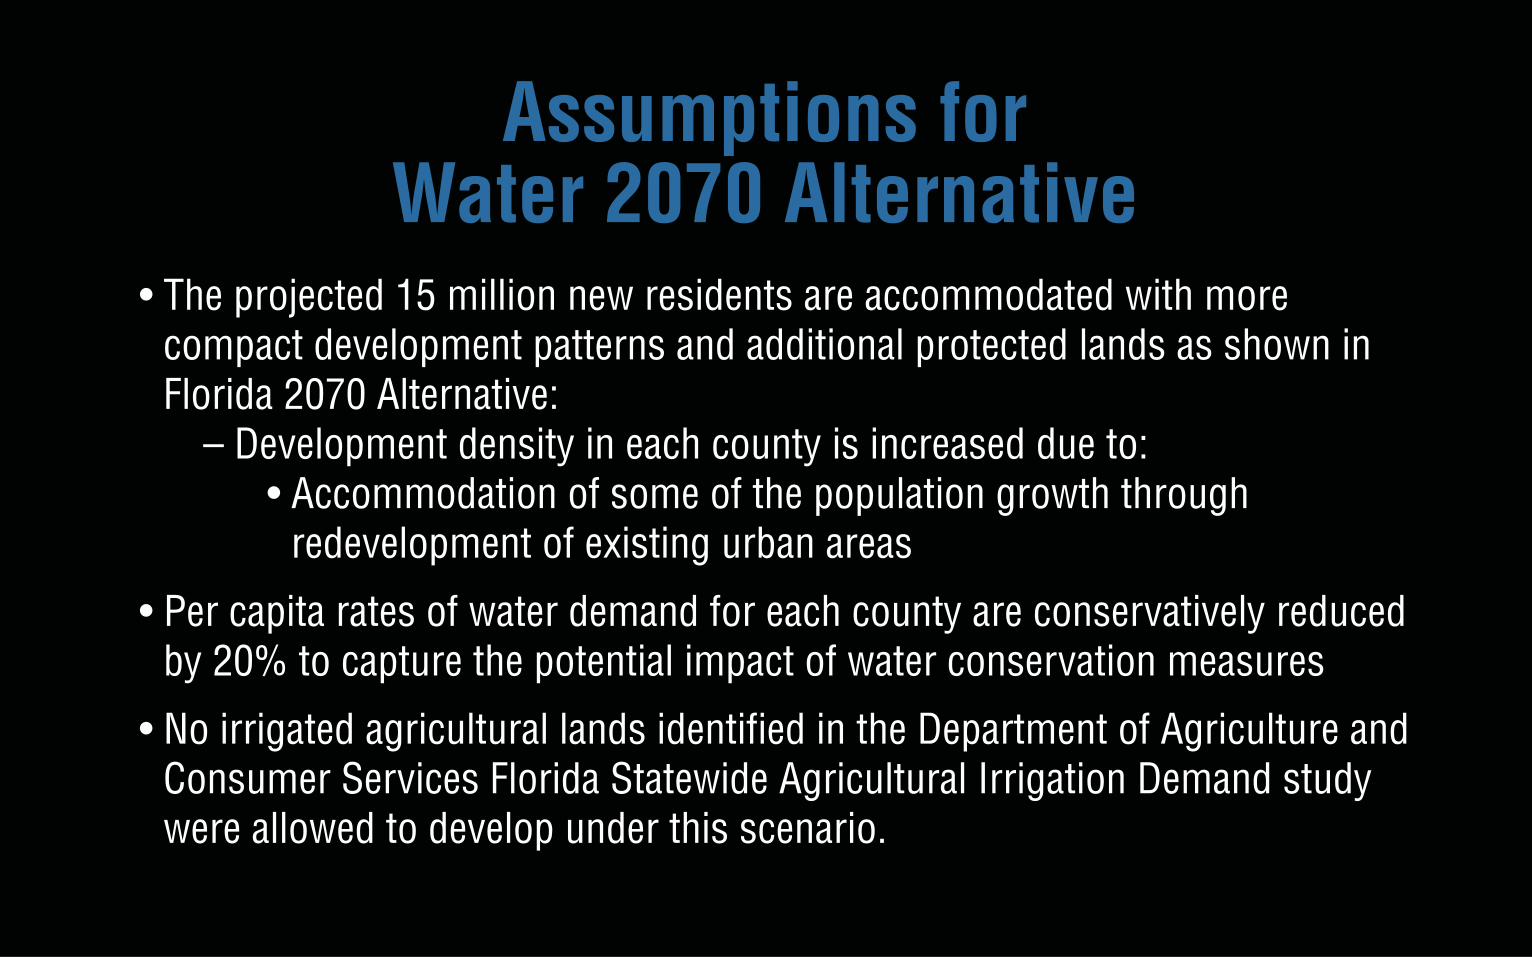
• The projected 15 million new residents are accommodated with morecompact development patterns and additional protected lands as shown inFlorida 2070 Alternative:
– Development density in each county is increased due to:• Accommodation of some of the population growth through
redevelopment of existing urban areas
• Per capita rates of water demand for each county are conservatively reducedby 20% to capture the potential impact of water conservation measures
• No irrigated agricultural lands identified in the Department of Agriculture andConsumer Services Florida Statewide Agricultural Irrigation Demand studywere allowed to develop under this scenario.
Assumptions for Water 2070 Alternative

Florida 2070 Alternative Water 2070 Alternative
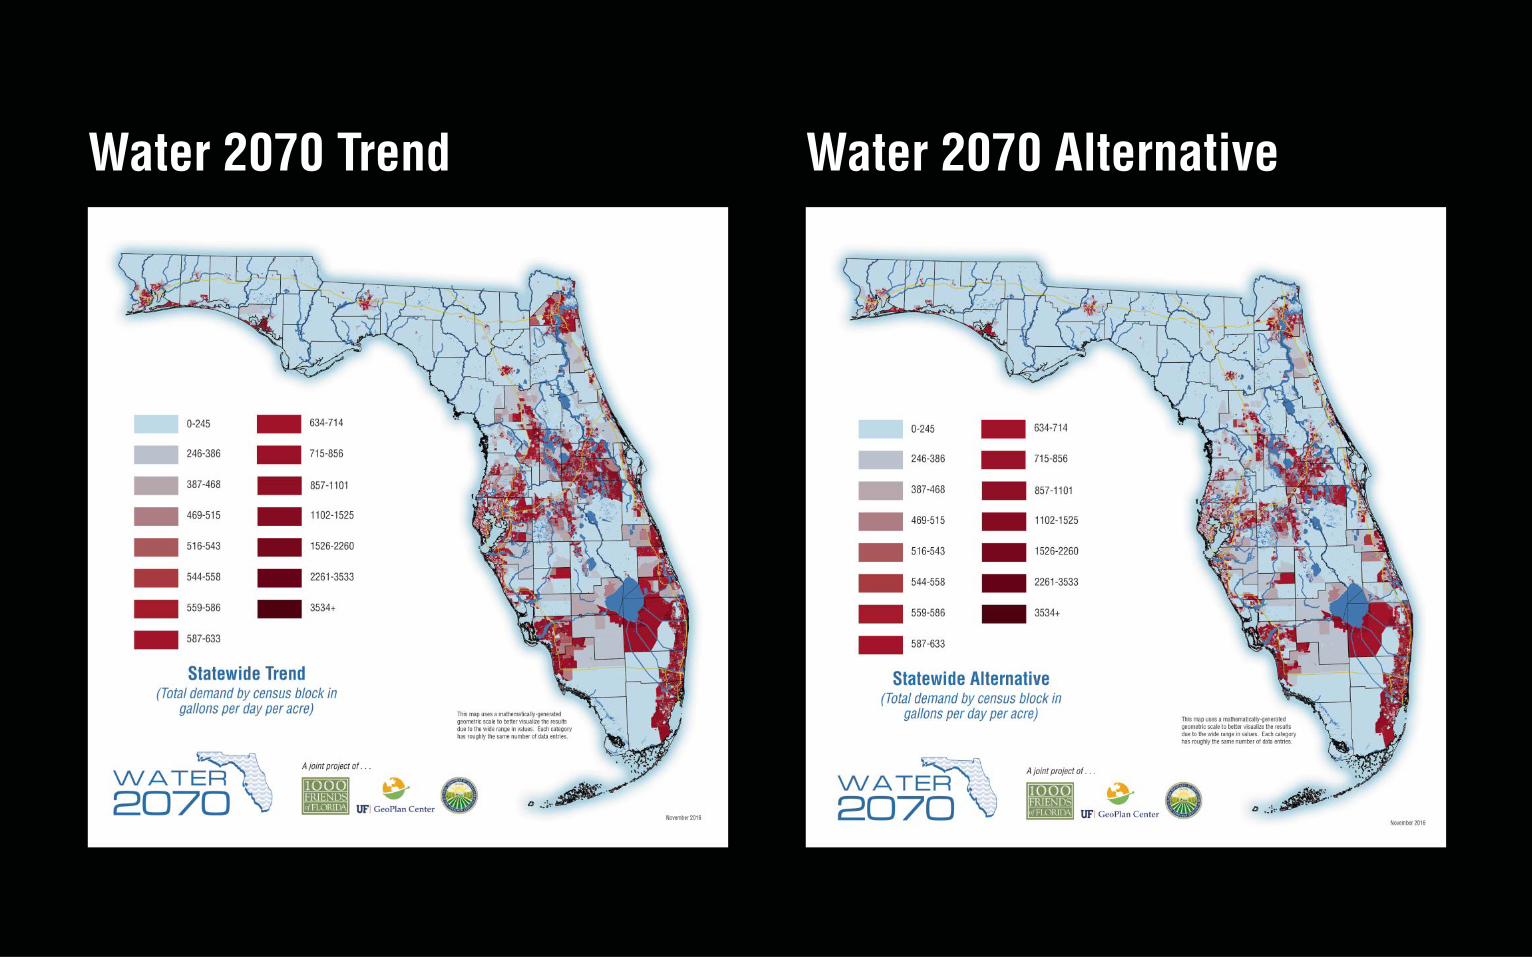
Water 2070 Trend Water 2070 Alternative

Let’s Compare
2010 Baseline 2070 Trend% Change
Baseline Trend2070 Alternative
% Change
Baseline Alternative
% Change
Trend Alternative
Developement Demand (GPD)
3,139,370,035 6,480,557,237 106% 4,704,530,221 50% -27%
Agriculture Demand (GPD)
2,129,941,436 1,614,305,600 -24% 2,150,253,570 1% 33%
Total 5,269,311,481 8,094,962,839 54% 6,854,783,791 30% -15%

• Water 2070 Trend reveals that development-related waterdemand will increase by more than 100% compared to the2010 Baseline
• With more compact development and a modest 20%increase in water conservation, Alternative 2070 would onlyincrease development-related water demand half as much asthe 2070 Trend
• However, Alternative 2070 development-related waterdemand is still 50% higher than the 2010 Baseline

• Compared to the 2010 Baseline, statewide agricultureirrigation demand in the 2070 Trend is 24% less due to theloss of agriculture lands to development
• Statewide agriculture irrigation demand is slightly greater inthe 2070 Alternative than the 2010 Baseline because thereare more agricultural lands projected for 2035 in theirrigation demand study prepared in 2015 by the Departmentof Agriculture and Consumer Services
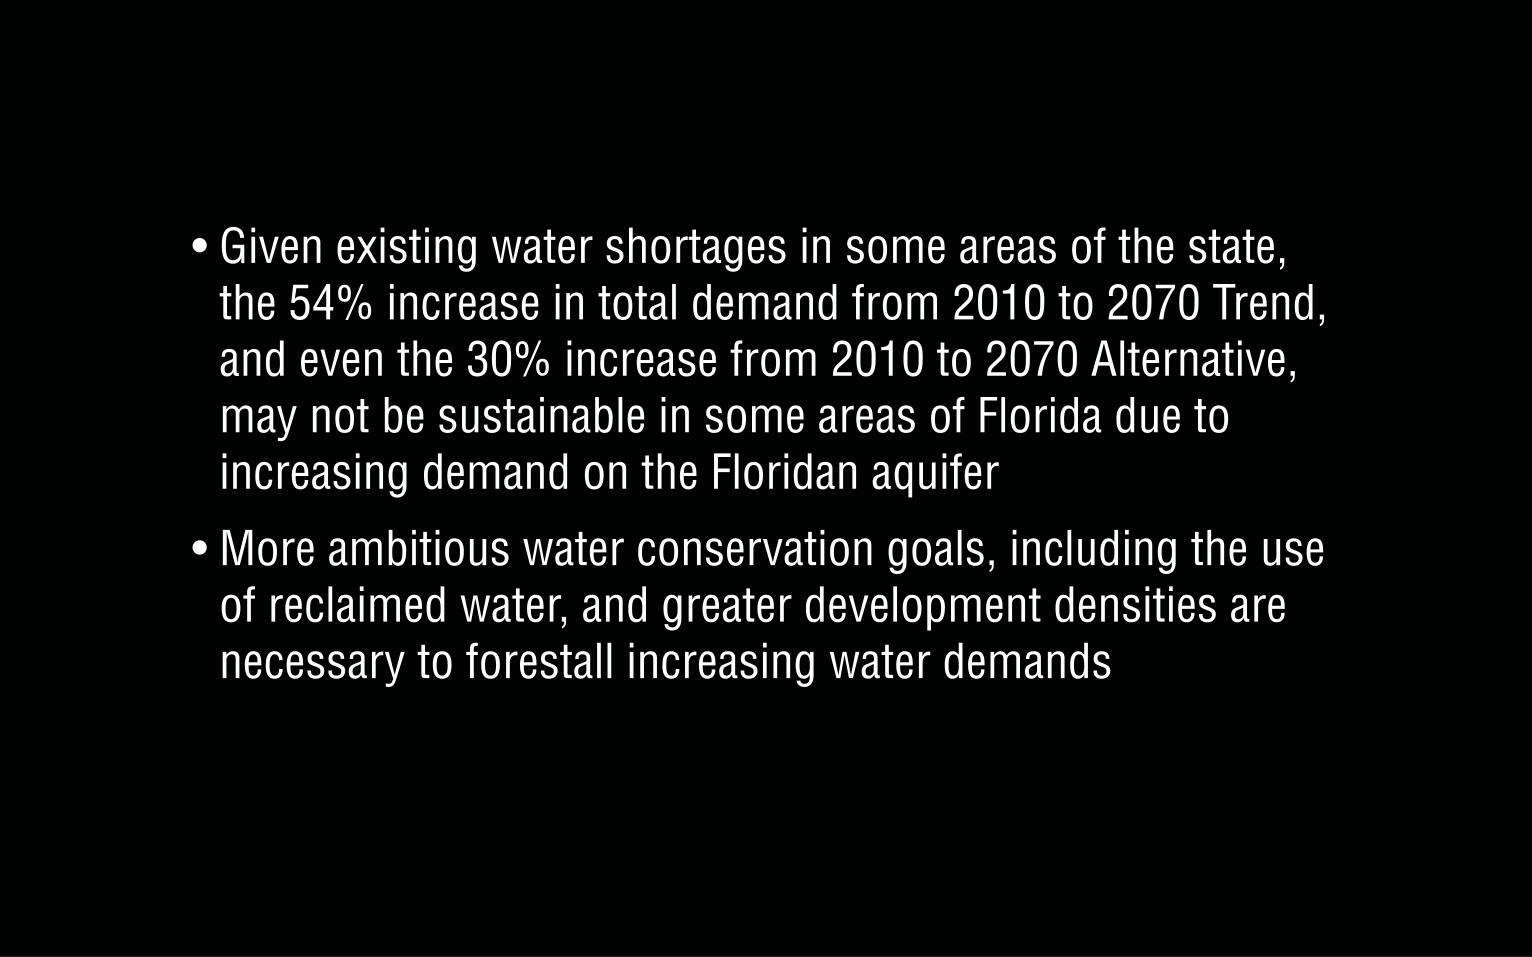
• Given existing water shortages in some areas of the state,the 54% increase in total demand from 2010 to 2070 Trend,and even the 30% increase from 2010 to 2070 Alternative,may not be sustainable in some areas of Florida due toincreasing demand on the Floridan aquifer
• More ambitious water conservation goals, including the useof reclaimed water, and greater development densities arenecessary to forestall increasing water demands

Take AwaysThe clear takeaway is that development-related water demand is the major driver of increased
water consumption in Florida by 2070, and that thecombination of more compact development patternsand modest water conservation measures can slow
the rate of growth in demand on groundwater resources.

Take AwaysHowever, given existing water supply shortfalls in
some areas of the state, going beyond Water Alternative 2070 by promoting even more
compact development and increasing water conservation efforts is essential if Florida is
to accommodate 15 million more residents andmaintain agricultural productivity and protect
natural systems in 2070

WHAT’S HAPPENING IN MY PART OF THE STATE?
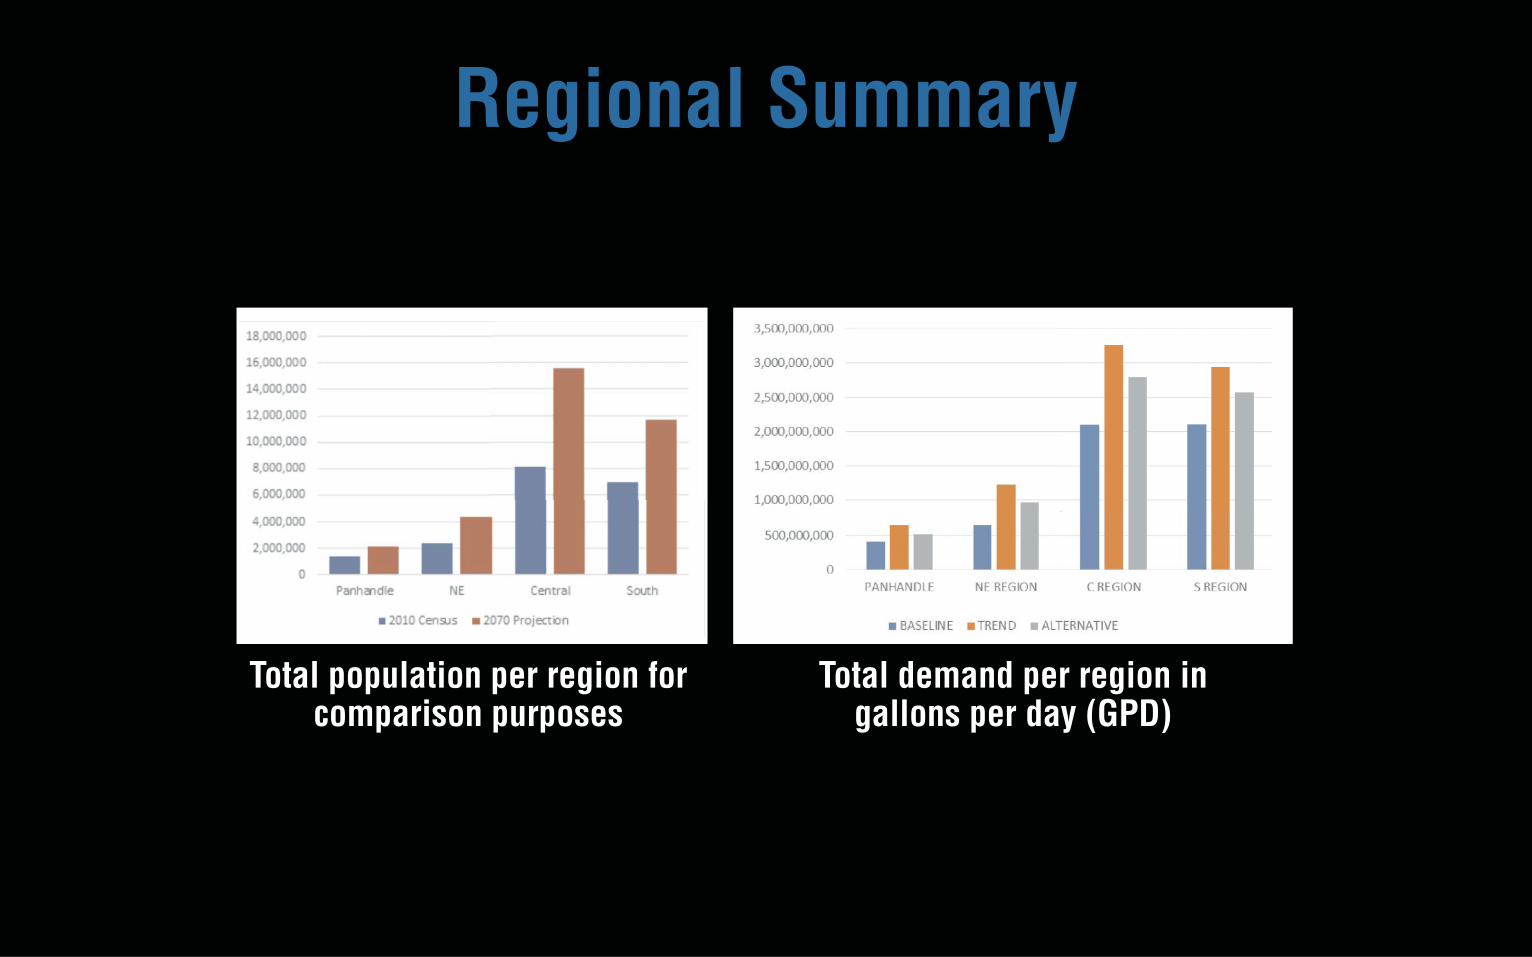
Regional Summary
Total population per region forcomparison purposes
Total demand per region in gallons per day (GPD)

Development-related and agriculturewater demand in total gallons per day
for the 3 scenarios in 4 regions

Panhandle Region
Baseline
Alternative
Trend
0-245
246-386
387-468
469-515
516-543
857-1101
1102-1525
1526-2260
2261-3533
3534+
634-714
715-856
544-558
559-586
587-633
This map uses a mathematically-generated geometric scale to better visualize the results due to the wide range in values. Each category has roughly the same number of data entries.

• A 61% increase in overall water demand between2010 baseline and 2070 trend.
• A 28% increase in overall water demand between2010 baseline and 2070 alternative, a 21% savingsover trend.
• Agriculture water demand to increase by 31%between 2010 baseline and the 2070 trend becausethe acreage of agricultural land in the Panhandle isprojected to increase.
• Agriculture water demand projected to increase by33% between 2010 baseline and the 2070alternative, with the fact that irrigated agriculturallands were not developed in the 2070 alternativeaccounting for this difference.
• Development-related water demand clearly theleading factor in increased water demand in thetrend scenario, with both development-related waterdemand and agriculture water demand causing theincrease between 2010 trend and the 2070alternative scenario.
Panhandle Region
2010 Baseline 2070 TrendDifference
Trend minusBaseline
2070 Alternative
DifferenceAlternative
minus Baseline
Difference Alternative
minus Trend
Agriculture 62,656,690 82,383,033 19,726,343 83,145,736 20,489,046 762,703
Development 341,425,469 568,858,108 227,432,639 433,238,192 91,812,723 -135,619,916
Total 404,082,159 651,241,141 247,158,982 516,383,928 112,301,769 -134,857,213

Northeast Florida Region
Baseline Trend Alternative
469-515
516-543 857-1101
1102-1525
1526-2260
2261-3533
3534+634-714
715-856
544-558
559-586
587-633
0-245
246-386
387-468
This map uses a mathematically-generated geometric scale to better visualize the results due to the wide range in values. Each category has roughly the same number of data entries.

Northeast Florida Region • An 88% increase in overall water demand between
2010 baseline and 2070 trend.
• A 48% increase in overall water demand between2010 baseline and 2070 alternative, a 21% savingsover trend.
• Agriculture water demand to increase by only 1% inthe 2070 trend due to the loss of irrigatedagricultural lands.
• Because irrigated agriculture lands were notdeveloped in the 2070 alternative, agricultural waterdemand is projected to increase by 25% between the2010 trend and the 2070 alternative.
• Development-related water demand increases by120% from the 2010 baseline to 2070 trend, and by57% when comparing 2010 baseline with 2070alternative.
2010 Baseline 2070 TrendDifference
Trend minusBaseline
2070 Alternative
DifferenceAlternative
minus Baseline
Difference Alternative
minus Trend
Agriculture 175,664,784 177,659,419 1,994,635 219,224,707 43,559,923 41,565,288
Development 479,689,711 1,054,252,410 574,562,699 753,637,390 273,947,679 -300,615,020
Total 655,354,495 1,231,911,829 576,557,334 972,862,097 317,507,602 -259,049,732
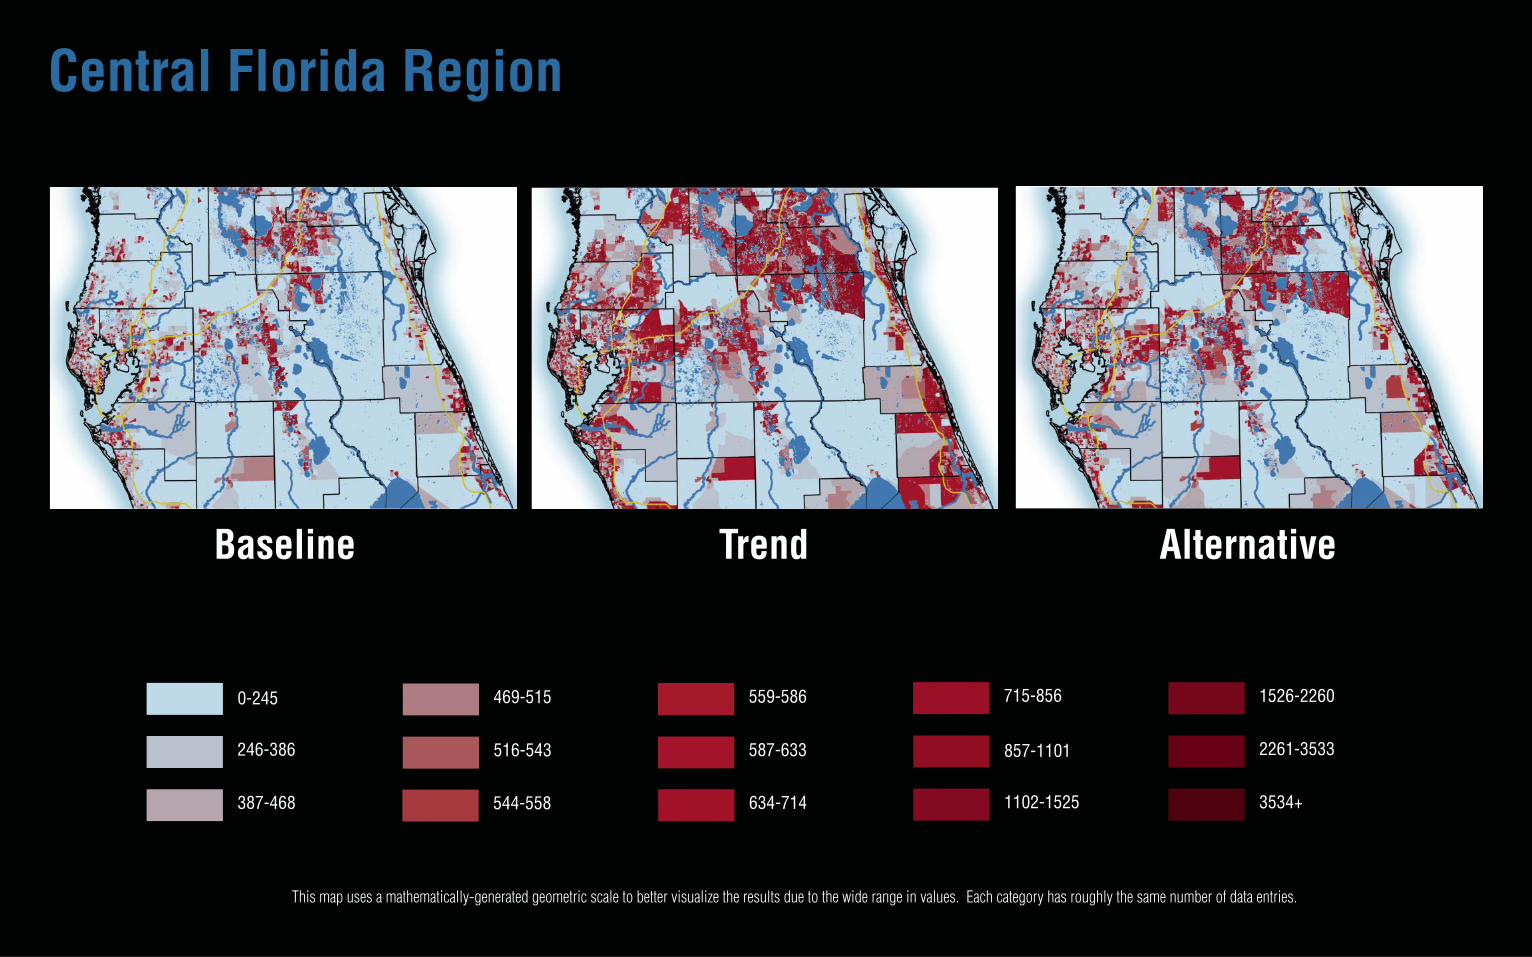
Central Florida Region
Baseline Trend Alternative
469-515
516-543 857-1101
1102-1525
1526-2260
2261-3533
3534+634-714
715-856
544-558
559-586
587-633
0-245
246-386
387-468
This map uses a mathematically-generated geometric scale to better visualize the results due to the wide range in values. Each category has roughly the same number of data entries.

• A 55% increase in overall water demand between2010 baseline and 2070 trend.
• A 33% increase in overall water demand between2010 baseline and 2070 alternative, a 14% savingsover 2070 trend.
• Agriculture water demand to decline by 31%comparing the 2010 baseline to the 2070 trend,and by 12% comparing the 2010 baseline to the2070 alternative.
• Both 2070 scenarios reflect a significant projectedloss of agricultural lands in Central Florida.
• Development-related water demand increases by112% from the 2010 baseline to 2070 trend, andby 62% when comparing the 2010 baseline with2070 alternative.
2010 Baseline 2070 TrendDifference
Trend minusBaseline
2070 Alternative
DifferenceAlternative
minus Baseline
Difference Alternative
minus Trend
Agriculture 829,465,491 570,861,745 -258,603,746 732,548,298 -96,917,193 161,686,553
Development 1,272,162,173 2,691,896,944 1,419,734,771 2,059,321,097 787,158,924 -632,575,847
Total 2,101,627,664 3,262,758,689 1,161,131,025 2,791,869,395 690,241,731 -470,889,294
Central Florida Region

South Florida Region
AlternativeTrendBaseline
469-515
516-543 857-1101
1102-1525
1526-2260
2261-3533
3534+634-714
715-856
544-558
559-586
587-633
0-245
246-386
387-468
This map uses a mathematically-generated geometric scale to better visualize the results due to the wide range in values. Each category has roughly the same number of data entries.

South Florida Region• A 40% increase in overall water demand between
2010 baseline and 2070 trend.
• A 22% increase in overall water demand between2010 baseline and 2070 alternative, a 13% savingsover 2070 trend.
• Agriculture water demand to decline by 26%comparing baseline to the 2070 trend, due to theloss of agricultural lands.
• Agriculture water demand to increase by 5%comparing the 2010 baseline to the 2070alternative because irrigated agricultural lands donot development and their rates of demand areprojected to increase.
• Development-related water demand increases by107% from the 2010 baseline to 2070 trend, andby 39% when comparing the 2010 baseline with2070 alternative.
2010 Baseline 2070 TrendDifference
Trend minusBaseline
2070 Alternative
DifferenceAlternative
minus Baseline
Difference Alternative
minus Trend
Agriculture 1,062,154,471 783,401,403 -278,753,068 1,115,334,829 53,180,358 331,933,426
Development 1,046,092,682 2,165,549,775 1,119,457,093 1,458,333,542 412,240,860 -707,216,233
Total 2,108,247,153 2,948,951,178 840,704,025 2,573,668,371 465,421,218 -375,282,807

HOW DO WE BETTER CONSERVE FLORIDA’S LIMITED WATER RESOURCES?

• Increase supply through alternative sources– Reclaim water– Desalinization – prohibitively expensive
• Decrease demand– Water conservation– More compact development patterns
Water conservation and reclaiming water both providesignificant and cost-effective results
Increase Supply, Reduce Demand

• Water reclamation geared to irrigation– City of Pompano Beach – OASIS water reuse
plant and incentivizing single family residentialconnections to the plant
– University of Florida – All water for irrigationfrom reclaimed water
Many more examples around Florida
Increase Water Supply

• University of Florida IFAS Florida-Friendly Landscaping™ Program – At least 50% of water usedby households is used outdoors for landscape irrigation.
• University of Florida Program for Resource Efficient Communities, Establishing WaterConsumption Baselines for Alachua County – Single family homes with an automated irrigationsystem consumed an average of 358 gallons of water per day (GPD), while those withoutconsumed an average of 190 GPD, a 47% reduction.
• Another study by the same group, Reduced Impact Development Practices at ‘Restoration’ –Installing soil moisture sensors which override timer-based controls on irrigation systems canreduce the amount of water used for landscape irrigation by more than 50%.
The single most effective strategy to reduce water demand in Florida is to significantly reduce theamount of water used for landscape irrigation.
Benefits:• Conserve water
• Savings to homeowners through reduced water bills
• Community costs associated with supplying water and addressing sewage and stormwater canbe significantly reduced, resulting in tax savings.
Reduce Water Demand
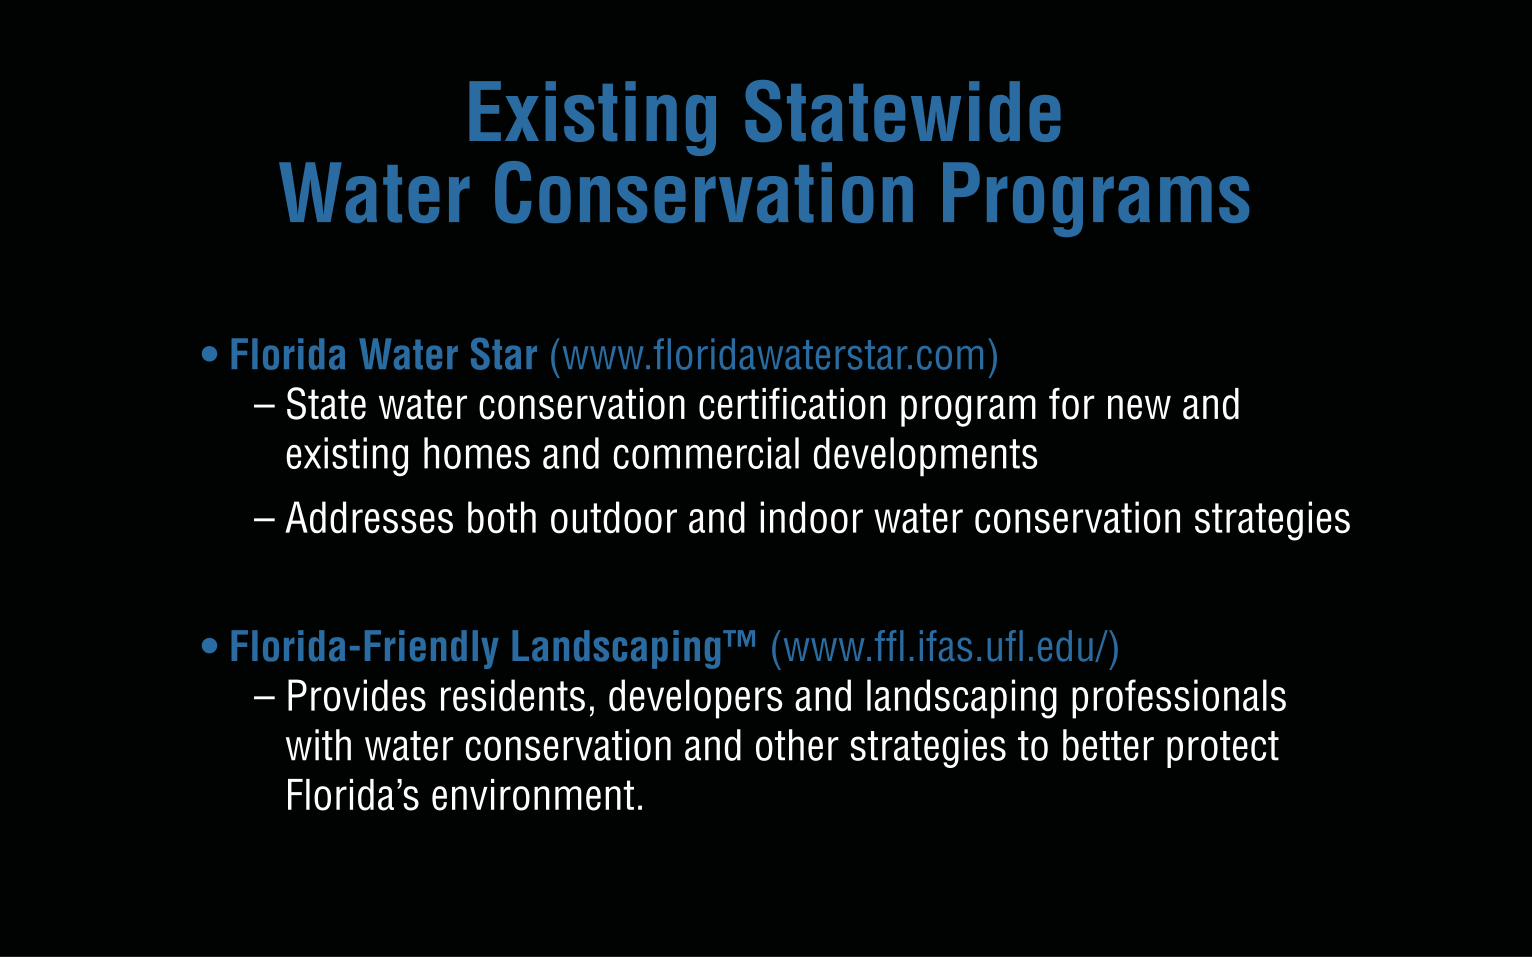
• Florida Water Star (www.floridawaterstar.com) – State water conservation certification program for new and
existing homes and commercial developments
– Addresses both outdoor and indoor water conservation strategies
• Florida-Friendly Landscaping™ (www.ffl.ifas.ufl.edu/)– Provides residents, developers and landscaping professionals
with water conservation and other strategies to better protectFlorida’s environment.
Existing Statewide Water Conservation Programs

Florida 2070 calls foradditional protectionof lands on theFlorida ForeverAcquisition list andlands identified asPriorities 1 & 2 inthe Florida EcologicalGreenways Network
Protect Natural Lands
Existing Conservationand Working Lands
With Florida Forever and Florida Greenwayspriorities 1 and 2 lands
Protected
Other
Protected
Other

• Help recharge Florida’s aquifer – the source of much of thestate’s water supply
• Cleanse our drinking water
• Provide boundless recreational opportunities for residentsand visitors alike
• Shelter and sustain Florida’s wildlife
While not within the scope of this study, the value of naturallands in the protection of Florida’s water supply should not beunderestimated

RECOMMENDATIONSVISIT WWW.1000FRIENDSOFFLORIDA.ORG/FLORIDA2070/FOR MORE DETAILED INFORMATION

Expand Public Water Conservation Efforts
City of Pompano Beach OASIS Reuse Water Facilitie

• Increase funding and outreach for the Florida Water Star andFlorida-Friendly Landscaping™ programs to promote greaterwater conservation in new and existing development
• Require Florida Friendly Landscaping™, manual irrigation,soil moisture sensors, or comparable water conservationtechnology for all new development
• Require permitted major water users to monitor the amountof groundwater used by major users
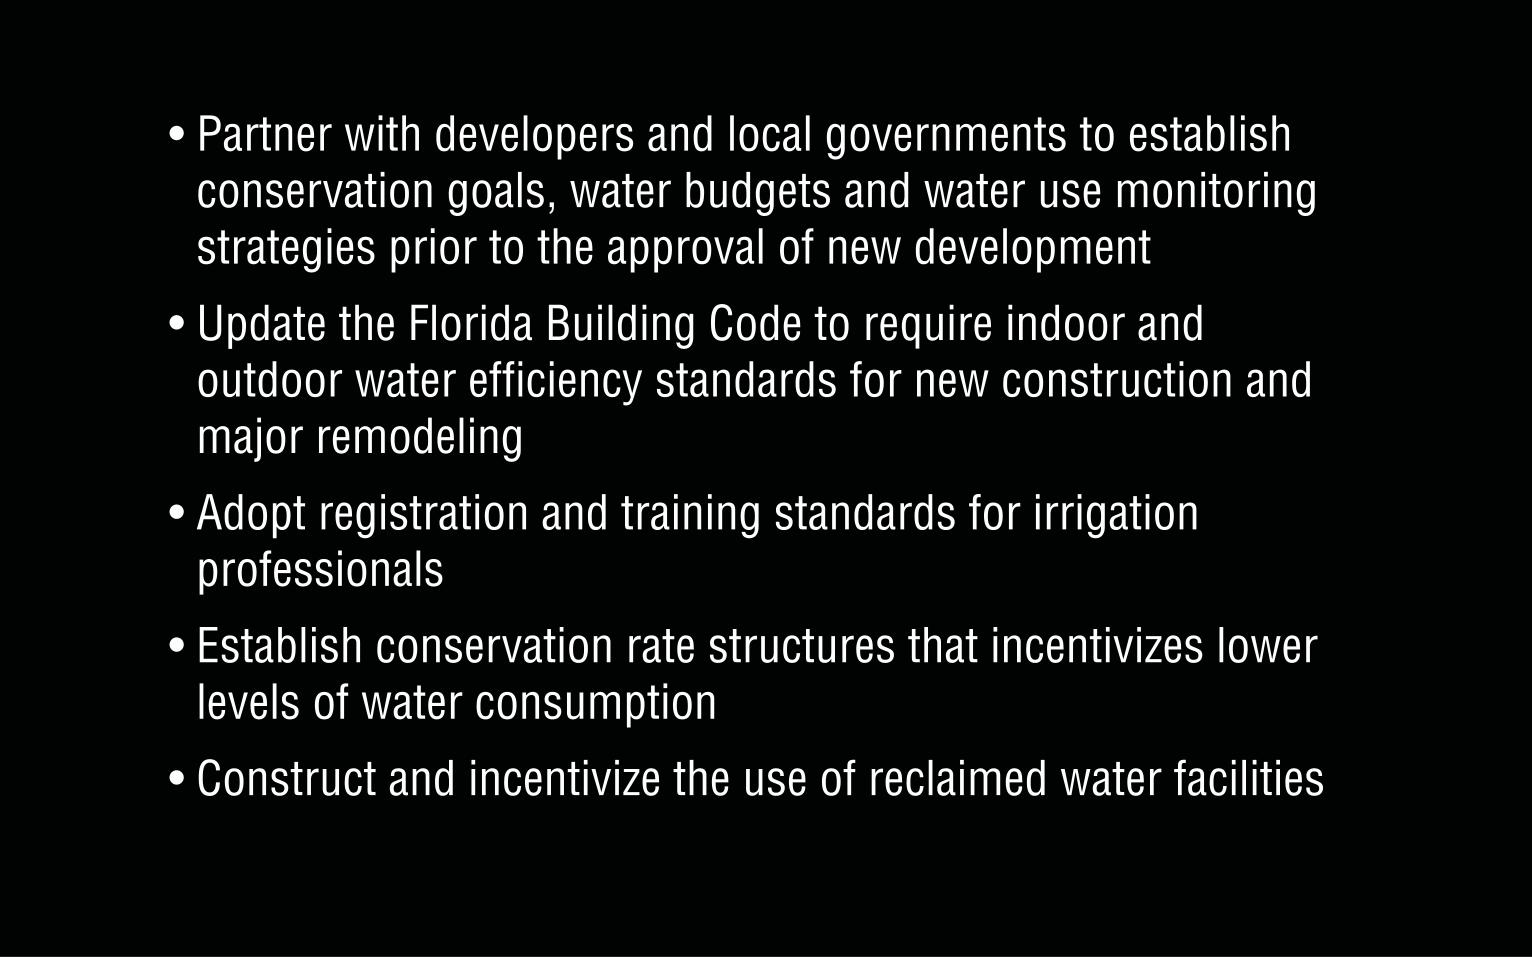
• Partner with developers and local governments to establishconservation goals, water budgets and water use monitoringstrategies prior to the approval of new development
• Update the Florida Building Code to require indoor andoutdoor water efficiency standards for new construction andmajor remodeling
• Adopt registration and training standards for irrigationprofessionals
• Establish conservation rate structures that incentivizes lowerlevels of water consumption
• Construct and incentivize the use of reclaimed water facilities

Reduce Personal Water Use
An efficient micro-spray systemFlorida Water Star

• Use Florida-Friendly Landscaping™ and other measures to reduceor eliminate landscaping water use, and seek formal Florida-Friendly Landscaping™ recognition
• Lessen the need for irrigation by using the right plants in the rightlocations, grouping them according to water needs, and using rainbarrels or cisterns to capture rainwater for irrigation
• Reduce stormwater runoff through mulching plant beds, usingporous surfaces for patios, walkways and driveways, and creatingswales or low areas to hold and filter water on your property

• If an automated irrigation system is used, ensure that it is designedand operated to meet strict water conservation criteria includingdrip systems, soil moisture sensors, automatic rain shutoff sensorsand/or other technology to significantly reduce water use
• Make sure the irrigation system is calibrated correctly and check itregularly for breaks and head alignment
• Do not water if it has rained in the last 24 hours or if rain is forecastin the next 24 hours
• Select Florida Water Star certified properties when purchasing anew home, and follow Water Star guidelines when remodeling anexisting home
• Use Water-Sense labeled high-efficiency appliances to significantlyreduce indoor water consumption

How Do You Envision Florida’s Future Water Demand?

If you have questions:
• Your webinar control panelincludes a “Questions” box
• Please click on “+” sign andtype any questions in this box
• Please refer to the slide numberand/or speaker when you postyour question
• We will do our best to answerall questions as time permits

This Webinar Has Been Approved for:
• 1.5 AICP CM credits for planners (#9109130) • 2 CLE credits for the Florida Bar (#1606410N) • .15 CEU for certified environmental health
professionals

Upcoming Dr. John M. DeGrove WebinarsFebruary 15, 2016, 12 noon to 1:30pmImplementing Water 2070: WaterConservation Planning for FloridaCommunities
Visit www.1000friendsofflorida.org/webinarto find out more!

The PowerPoint and materials are available at www.1000friendsofflorida.org/florida2070