Embed Size (px)
Citation preview

Water: Market Intelligence Report 2020 i
Water
2020Market Intelligence Report
Water: Market Intelligence Report 2020 Water: Market Intelligence Report 2020ii iii
GreenCapeGreenCape is a non-profit organisation that works at the interface of business,
government, and academia to identify and remove barriers to economically
viable green economy infrastructure solutions. Working in developing countries,
GreenCape catalyses the replication and large-scale uptake of these solutions
to enable each country and its citizens to prosper.
AcknowledgementsWe thank Ashton Mpofu, Raldo Kruger and Jane Reddick for the time and effort
that they have put into compiling this market intelligence report. We also thank
Chantal Ramcharan-Kotze from the Water Research Commission (WRC) for her
feedback on draft versions of the report.
DisclaimerWhile every attempt has been made to ensure that the information published in
this report is accurate, no responsibility is accepted for any loss or damage to
any person or entity relying on any of the information contained in this report.
Copyright © GreenCape 2020
This document may be downloaded at no charge from www.greencape.co.za. All rights reserved.
Subscribe to receive e-mail alerts or GreenCape news, events and publications
by registering as a member on our website: www.greencape.co.za.
Cover image courtesy of: Bruce Sutherland (City of Cape Town)
18 Roeland Street, Cape Town, 8001, South Africa
Authors: Ashton Busani Mpofu, Raldo Kruger, and Jane Reddick
Editorial and review: Cilnette Pienaar, Lauren Basson, Claire Pengelly
and Nicholas Fordyce
Images: GreenCape, Markus Spiske, Unsplash and Bruce
Sutherland (City of Cape Town)
Layout and design: Tamlin Lockhart Art Direction
Water: Market Intelligence Report 2020 Water: Market Intelligence Report 2020iv v
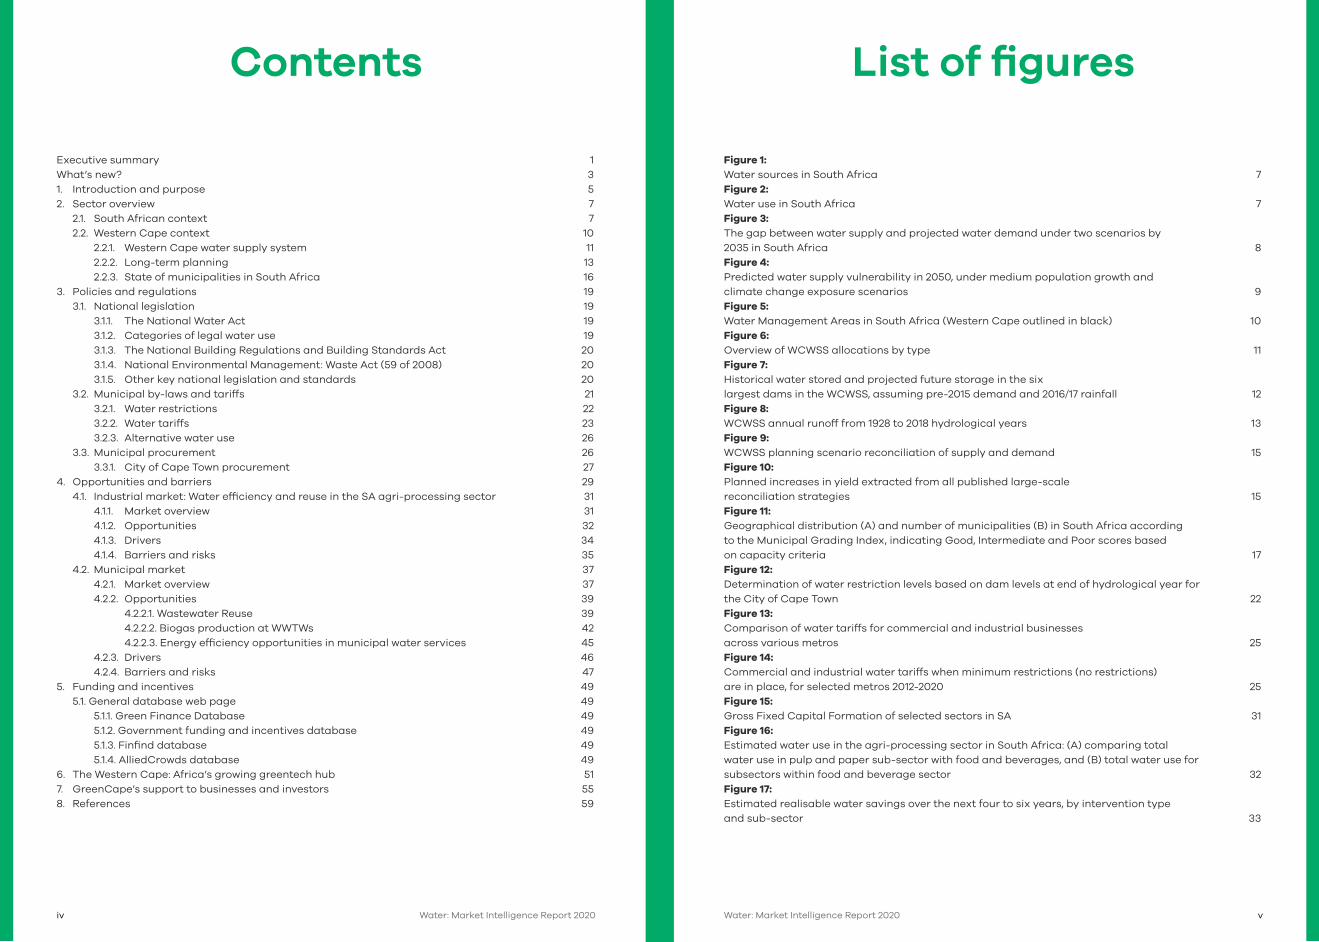
Contents List of figures
Figure 1: Water sources in South Africa 7Figure 2: Water use in South Africa 7Figure 3: The gap between water supply and projected water demand under two scenarios by2035 in South Africa 8Figure 4: Predicted water supply vulnerability in 2050, under medium population growth andclimate change exposure scenarios 9Figure 5: Water Management Areas in South Africa (Western Cape outlined in black) 10Figure 6: Overview of WCWSS allocations by type 11Figure 7: Historical water stored and projected future storage in the sixlargest dams in the WCWSS, assuming pre-2015 demand and 2016/17 rainfall 12Figure 8: WCWSS annual runoff from 1928 to 2018 hydrological years 13Figure 9: WCWSS planning scenario reconciliation of supply and demand 15Figure 10: Planned increases in yield extracted from all published large-scalereconciliation strategies 15Figure 11: Geographical distribution (A) and number of municipalities (B) in South Africa according to the Municipal Grading Index, indicating Good, Intermediate and Poor scores based on capacity criteria 17Figure 12: Determination of water restriction levels based on dam levels at end of hydrological year for the City of Cape Town 22Figure 13: Comparison of water tariffs for commercial and industrial businessesacross various metros 25Figure 14: Commercial and industrial water tariffs when minimum restrictions (no restrictions)are in place, for selected metros 2012-2020 25Figure 15: Gross Fixed Capital Formation of selected sectors in SA 31Figure 16: Estimated water use in the agri-processing sector in South Africa: (A) comparing totalwater use in pulp and paper sub-sector with food and beverages, and (B) total water use forsubsectors within food and beverage sector 32Figure 17: Estimated realisable water savings over the next four to six years, by intervention typeand sub-sector 33
Executive summary 1What’s new? 31. Introduction and purpose 52. Sector overview 7 2.1. South African context 7 2.2. Western Cape context 10 2.2.1. Western Cape water supply system 11 2.2.2. Long-term planning 13 2.2.3. State of municipalities in South Africa 163. Policies and regulations 19 3.1. National legislation 19 3.1.1. The National Water Act 19 3.1.2. Categories of legal water use 19 3.1.3. The National Building Regulations and Building Standards Act 20 3.1.4. National Environmental Management: Waste Act (59 of 2008) 20 3.1.5. Other key national legislation and standards 20 3.2. Municipal by-laws and tariffs 21 3.2.1. Water restrictions 22 3.2.2. Water tariffs 23 3.2.3. Alternative water use 26 3.3. Municipal procurement 26 3.3.1. City of Cape Town procurement 274. Opportunities and barriers 29 4.1. Industrial market: Water efficiency and reuse in the SA agri-processing sector 31 4.1.1. Market overview 31 4.1.2. Opportunities 32 4.1.3. Drivers 34 4.1.4. Barriers and risks 35 4.2. Municipal market 37 4.2.1. Market overview 37 4.2.2. Opportunities 39 4.2.2.1. Wastewater Reuse 39 4.2.2.2. Biogas production at WWTWs 42 4.2.2.3. Energy efficiency opportunities in municipal water services 45 4.2.3. Drivers 46 4.2.4. Barriers and risks 475. Funding and incentives 49 5.1. General database web page 49 5.1.1. Green Finance Database 49 5.1.2. Government funding and incentives database 49 5.1.3. Finfind database 49 5.1.4. AlliedCrowds database 49 6. The Western Cape: Africa’s growing greentech hub 517. GreenCape’s support to businesses and investors 558. References 59

Water: Market Intelligence Report 2020 Water: Market Intelligence Report 2020vi vii
Figure 18: Estimated realisable water savings for key agri-processing sub-sectors over the nextfour to six years and required investment 34Figure 19:Expenditure trends for the Water Trading Entity from 2015/16 to 2018/19 (actual) andfrom 2019/20 to 2021/22 (estimated medium-term) 38Figure 20: Capital expenditure on water and sanitation projects undertaken by metropolitanmunicipalities between 2014/15 and 2017/18 38Figure 21: Theoretical investment potential for water reuse projects (at 2019 costs)summed by province 39Figure 22: Planned water reuse augmentation projects and estimated capital investmentpotential in Western Cape (WC) district municipalities 40Figure 23: Total investment cost of financially viable CHP projects at wastewater treatmentplants aggregated by province 42Figure 24: Indicative potential energy and cost savings from energy efficiency retrofits(efficient pumps and VSDs) in wastewater treatment plants in South African metros 45Figure 25: GreenCape’s focus areas 56
List of tables
Table 1: Required, budgeted and projected public sector funding for water & sanitation services & infrastructure 10Table 2: Water tariffs for selected metros (minimum restriction levels in place) for FY 2019/20 24Table 3: Sanitation tariffs for selected metros (minimum restriction levels in place) for FY 2019/20 24Table 4: Summary of market opportunities 30Table 5: Summary of current municipal scale projects (reuse, biogas/CHP) at various stages of development 41

Water: Market Intelligence Report 2020 Water: Market Intelligence Report 2020viii ix
List of abbreviations and acronyms
AADD Annual Average Daily DemandAD Anaerobic digestionB-BBEE Broad-based Black Economic EmpowermentBOT Build-Operate-Transfer C&I Commercial and IndustrialCCCI Cape Chamber of Commerce and IndustryCCT City of Cape TownCHP Combined Heat and PowerCSAG Climate System Analysis GroupDEADP Department of Environmental Affairs and Development PlanningDFI Direct Foreign Investment DHSWS Department of Human Settlements, Water and Sanitation DLG Department of Local Government (Western Cape Government)dti Department of Trade and Industrydtic Department of Trade, Industry and CompetitionDWA Department of Water Affairs (now DHSWS)DWAF Department of Water Affairs and Forestry (now DHSWS)DWS Department of Water and Sanitation (now DHSWS)EME Exempted Micro EnterpriseGA General AuthorisationGDP Gross Domestic ProductGFCF Gross Fixed Capital FormationGTAC Government Technical Advisory CentreGVA Gross Value AddILI Infrastructure Leakage IndexMFMA Municipal Finance Management Act No. 56 of 2003MIR Market Intelligence ReportMLD Megalitres (million litres) per dayNBI National Business Initiative NBR National Building RegulationsNRW Non-Revenue WaterNWA National Water ActPPP Public Private PartnershipQSE Qualifying Small Business Enterprise RFQ Request for Quotation SABIA Southern African Biogas Industry AssociationSANS South African National Standard SIV System input volumeVAT Value Added Tax WCWDM Water Conservation and Water Demand ManagementWCWSS Western Cape Water Supply SystemWC Western CapeWCG Western Cape GovernmentWEF World Economic ForumWMA Water Management AreaWRC Water Research CommissionWSI Water Services IntermediaryWUL Water Use Licence WWF World Wide Fund for NatureWWTW Wastewater Treatment Works
Conversions
1 Megalitre = 1 million litres = 1 000 000 litres = 1 000 kl = 1 000 m3

Water: Market Intelligence Report 2020 Water: Market Intelligence Report 2020x 1
Executive summaryThis market intelligence report (MIR) is aimed at investors interested
in the South African urban water sector.
Water scarcity has been a key driver for investment in the Western Cape water sector due to severe drought conditions and expected longer-term water constraints in the region. Based on population and economic growth projections, South Africa could have a 17% gap between supply and demand by 2030. However, a more recent analysis indicates that if water use is reduced by just 7.5%, and planned additional water supply projects are implemented, this gap can be narrowed significantly by 2035. This year’s report draws on market trends and emerging longer-term investment opportunities to improve water security and resilience, as key enablers of economic development. Specifically, the report focuses on insights and opportunities relating to two key urban water markets in South Africa:
■ industrial market (opportunities in agri-processing sector); and
■ municipal market (opportunities in water works and wastewater treatment works).
Key drivers in these markets are:
■ water security: both private companies and municipalities are motivated to invest in water projects to secure sufficient water supply for their operations;
■ cost-reflective water tariffs: enhancing the investment case for municipal water projects (as costs can be recovered through water sales), and for private companies (as the business case for water projects is improved);
■ regulatory compliance: water restrictions in drought areas, and wastewater discharge limits;
■ policies and government support/incentives: the National Water and Sanitation Masterplan Volume 1 (2019) encourages cost-reflective tariffs, alternative water source development, and private sector financing for municipal infrastructure, while the agri-processing sector is targeted for growth via incentives (including incentives for resource efficiency).
While the municipal sector represents the largest opportunity for investors, there are a few barriers specific to this market. They are related to the ability to access funding, capacity constraints, procurement processes, and revenue collection. Barriers specific to the uptake of water technologies in the agri-processing sector include poor business cases in municipalities where water tariffs are low, regulatory challenges related to management of brine, and complex and lengthy licensing and authorisation for water projects.
© Bruce Sutherland (City of Cape Town)
Water: Market Intelligence Report 20202 3Water: Market Intelligence Report 2020
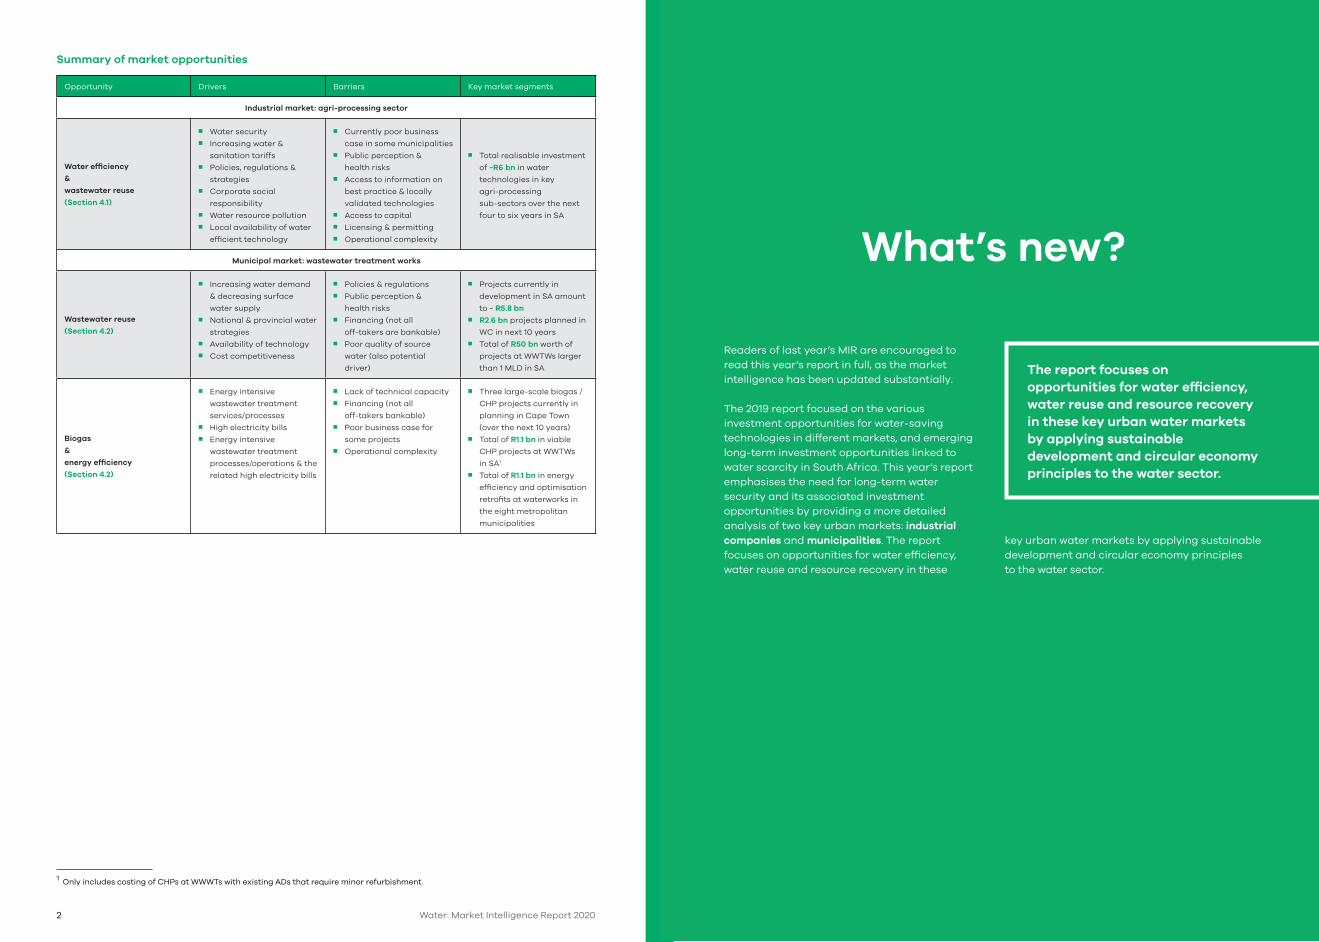
Summary of market opportunities
Opportunity Drivers Barriers Key market segments
Industrial market: agri-processing sector
Water efficiency
&
wastewater reuse
(Section 4.1)
■ Water security ■ Increasing water &
sanitation tariffs■ Policies, regulations &
strategies■ Corporate social
responsibility■ Water resource pollution ■ Local availability of water
efficient technology
■ Currently poor business
case in some municipalities■ Public perception &
health risks■ Access to information on
best practice & locally
validated technologies■ Access to capital■ Licensing & permitting■ Operational complexity
■ Total realisable investment
of ~R6 bn in water
technologies in key
agri-processing
sub-sectors over the next
four to six years in SA
Municipal market: wastewater treatment works
Wastewater reuse
(Section 4.2)
■ Increasing water demand
& decreasing surface
water supply■ National & provincial water
strategies■ Availability of technology■ Cost competitiveness
■ Policies & regulations ■ Public perception &
health risks■ Financing (not all
off-takers are bankable) ■ Poor quality of source
water (also potential
driver)
■ Projects currently in
development in SA amount
to ~ R5.8 bn■ R2.6 bn projects planned in
WC in next 10 years■ Total of R50 bn worth of
projects at WWTWs larger
than 1 MLD in SA
Biogas
&
energy efficiency
(Section 4.2)
■ Energy intensive
wastewater treatment
services/processes ■ High electricity bills ■ Energy intensive
wastewater treatment
processes/operations & the
related high electricity bills
■ Lack of technical capacity ■ Financing (not all
off-takers bankable)■ Poor business case for
some projects■ Operational complexity
■ Three large-scale biogas /
CHP projects currently in
planning in Cape Town
(over the next 10 years)■ Total of R1.1 bn in viable
CHP projects at WWTWs
in SA1
■ Total of R1.1 bn in energy
efficiency and optimisation
retrofits at waterworks in
the eight metropolitan
municipalities
1 Only includes costing of CHPs at WWWTs with existing ADs that require minor refurbishment.
What’s new?
Readers of last year’s MIR are encouraged to read this year’s report in full, as the market intelligence has been updated substantially.
The 2019 report focused on the various investment opportunities for water-saving technologies in different markets, and emerging long-term investment opportunities linked to water scarcity in South Africa. This year’s report emphasises the need for long-term water security and its associated investment opportunities by providing a more detailed analysis of two key urban markets: industrial companies and municipalities. The report focuses on opportunities for water efficiency, water reuse and resource recovery in these
key urban water markets by applying sustainable development and circular economy principles to the water sector.
The report focuses on opportunities for water efficiency, water reuse and resource recovery in these key urban water markets by applying sustainable development and circular economy principles to the water sector.

Water: Market Intelligence Report 2020 Water: Market Intelligence Report 20204 5
The key drivers of growth and long-term investment in the water sector in the Western Cape and more broadly in South Africa are two-fold: increasing resilience to extreme climate events, and ensuring that water is not a constraint to economic growth and development. This year’s report focuses on investment opportunities within key markets: the agri-processing sector in the industrial market and bulk water and wastewater infrastructure in municipalities.
The report provides a sector overview (Section 2), which outlines water scarcity in both the South African and Western Cape context. This is followed by an overview of policies and regulations (Section 3) that are relevant to water technology investment opportunities and barriers (Section 4). The final sections focus on finance and incentives
2 www.greencape.co.za/market-intelligence/
(Section 5), gives an overview of the Western Cape as Africa’s growing greentech hub (Section 6), and explain GreenCape’s work within the green economy (Section 7).
While this report focuses on urban water markets, there are inherent links between agricultural and urban water use. Similarly, there are links between organic waste valorisation and energy production related to treating wastewater, as well as energy efficiency opportunities throughout the water value chain. We have included these opportunities where they fall within the water value chain, however please consult the 2020 Sustainable Agriculture Market Intelligence Report, Waste Market Intelligence Report and two Energy Market Intelligence Reports2 for opportunities specific to those sectors.
© GreenCape
© Bruce Sutherland (City of Cape Town)
1Introduction and purpose
This market intelligence report (MIR) has been compiled by GreenCape’s Water Sector Desk. It is aimed at investors interested in the South African urban water
sector, with particular emphasis on opportunities in metropolitan areas.

Water: Market Intelligence Report 2020 Water: Market Intelligence Report 20206 7
© GreenCape
68+13+13+6 SURFACE WATER
RETURN FLOWS
GROUNDWATER
OTHERS
(seawater/
brackish water
desalination)
68%
13%
13%
6% 62+27+3+3+3+2 AGRICULTURE
MUNICIPAL
(3% rural,
24% urban)
MINING
INDUSTRY
AFFORESTATION
ENERGY
62%
27%
3%
3%
3%
2%
2Sector overview
Water scarcity is a major challenge in South Africa. Water conservation and demand management measures represent a substantial opportunity
for investors and businesses in the water sector.
2.1. South African contextSouth Africa (SA) is ranked as the 30th driest country in the world. In 2019, behind unemployment which is currently at a rate of 29% (WEF 2019), the country’s water crisis was ranked as the second highest risk for doing business in SA. SA is a water-scarce country characterised by uneven rainfall distribution, and extreme climate and evaporation rates that often exceed precipitation. The country has a reliable yield (i.e. supply from current infrastructure) of around 15 billion kl/year
(at 98% assurance of supply – or 2% annual probability of supply failure), of which the majority is from surface water (68%) and return flows that support surface water (13%), as shown in Figure 1 (DWS 2017a). Agriculture is the largest water-use sector (62%), followed by municipalities (27%), which include residential, commercial and industrial water users (DWS 2017a). The relative proportion of municipal and agricultural use differs between provinces and municipalities, depending on settlement patterns and local economy.
Figure 1: Water sources in South Africa
Despite being a water-scarce country, consumption is around 237 litres/capita/day (l/c/d), much higher than the international benchmark of 173 l/c/d (NWRS2)3. Forecasts indicate that water demand will exceed supply by 17% by 2030 (McKinsey and Company 2010), and that this will be driven by increased water demand in the municipal, industrial and agricultural sectors (Donnenfeld et al. 2018). The growth in demand by the municipal sector is
3 These figures are based on the system input volume divided by the population served. The system input volume includes commercial and industrial demand, and water losses through infrastructure leaks.
Figure 2: Water use in South Africa
expected to be the greatest, which is partly driven by urbanisation but also by increased industrial production and growth. The Industrial Policy Action Plan (IPAP) sets out the intentions of expanding the manufacturing sector, with agri-processing earmarked for national growth and development (DWS 2017a; NWSMP 2019). Thus agri-processing is expected to be a significant contributor to economic growth and opportunities for water technologies.
Water: Market Intelligence Report 2020 Water: Market Intelligence Report 20208 9
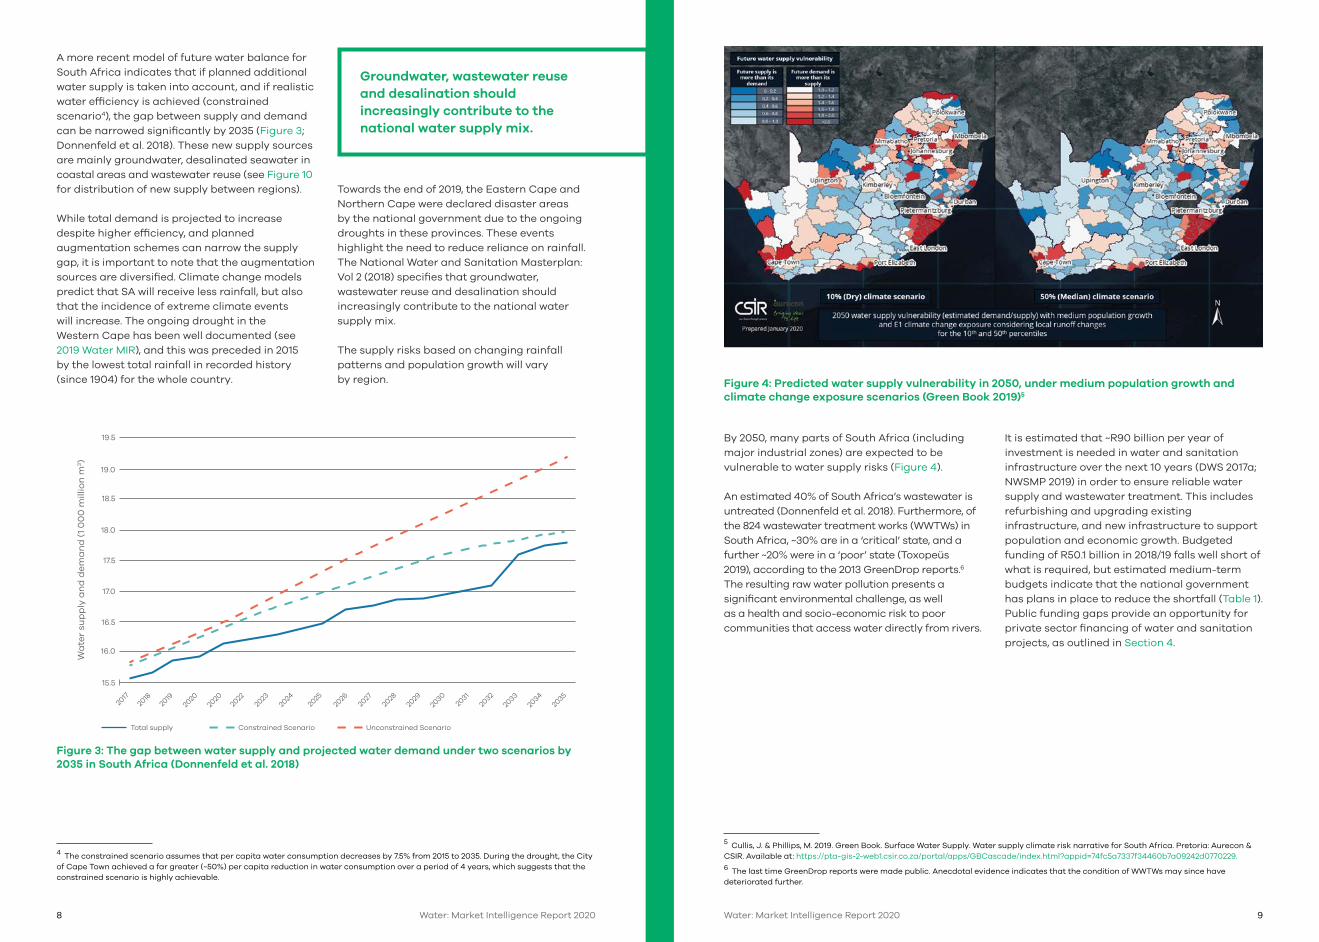
A more recent model of future water balance for South Africa indicates that if planned additional water supply is taken into account, and if realistic water efficiency is achieved (constrained scenario4), the gap between supply and demand can be narrowed significantly by 2035 (Figure 3; Donnenfeld et al. 2018). These new supply sources are mainly groundwater, desalinated seawater in coastal areas and wastewater reuse (see Figure 10 for distribution of new supply between regions).
While total demand is projected to increase despite higher efficiency, and planned augmentation schemes can narrow the supply gap, it is important to note that the augmentation sources are diversified. Climate change models predict that SA will receive less rainfall, but also that the incidence of extreme climate events will increase. The ongoing drought in the Western Cape has been well documented (see 2019 Water MIR), and this was preceded in 2015 by the lowest total rainfall in recorded history (since 1904) for the whole country.
4 The constrained scenario assumes that per capita water consumption decreases by 7.5% from 2015 to 2035. During the drought, the City of Cape Town achieved a far greater (~50%) per capita reduction in water consumption over a period of 4 years, which suggests that the constrained scenario is highly achievable.
Towards the end of 2019, the Eastern Cape and Northern Cape were declared disaster areas by the national government due to the ongoing droughts in these provinces. These events highlight the need to reduce reliance on rainfall. The National Water and Sanitation Masterplan: Vol 2 (2018) specifies that groundwater, wastewater reuse and desalination should increasingly contribute to the national water supply mix.
The supply risks based on changing rainfall patterns and population growth will vary by region.
Groundwater, wastewater reuse and desalination should increasingly contribute to the national water supply mix.
Figure 4: Predicted water supply vulnerability in 2050, under medium population growth and climate change exposure scenarios (Green Book 2019)5
Figure 3: The gap between water supply and projected water demand under two scenarios by 2035 in South Africa (Donnenfeld et al. 2018)
2033
2034
2035
Wa
ter
sup
ply
an
d d
em
an
d (
1 0
00
mill
ion
m3)
15.5
16.0
16.5
17.0
17.5
18.0
18.5
19.0
19.5
2017
2018
2019
2020
2020
2022
2023
2024
2025
2026
2027
2028
2029
2030
2031
2032
Total supply Constrained Scenario Unconstrained Scenario
By 2050, many parts of South Africa (including major industrial zones) are expected to be vulnerable to water supply risks (Figure 4).
An estimated 40% of South Africa’s wastewater is untreated (Donnenfeld et al. 2018). Furthermore, of the 824 wastewater treatment works (WWTWs) in South Africa, ~30% are in a ‘critical’ state, and a further ~20% were in a ‘poor’ state (Toxopeüs 5 2019), according to the 2013 GreenDrop reports.6 The resulting raw water pollution presents a significant environmental challenge, as well as a health and socio-economic risk to poor communities that access water directly from rivers.
5 Cullis, J. & Phillips, M. 2019. Green Book. Surface Water Supply. Water supply climate risk narrative for South Africa. Pretoria: Aurecon & CSIR. Available at: https://pta-gis-2-web1.csir.co.za/portal/apps/GBCascade/index.html?appid=74fc5a7337f34460b7a09242d0770229.6 The last time GreenDrop reports were made public. Anecdotal evidence indicates that the condition of WWTWs may since have deteriorated further.
It is estimated that ~R90 billion per year of investment is needed in water and sanitation infrastructure over the next 10 years (DWS 2017a; NWSMP 2019) in order to ensure reliable water supply and wastewater treatment. This includes refurbishing and upgrading existing infrastructure, and new infrastructure to support population and economic growth. Budgeted funding of R50.1 billion in 2018/19 falls well short of what is required, but estimated medium-term budgets indicate that the national government has plans in place to reduce the shortfall (Table 1). Public funding gaps provide an opportunity for private sector financing of water and sanitation projects, as outlined in Section 4.

Water: Market Intelligence Report 2020 Water: Market Intelligence Report 202010 11
!
!
!
BreedeGouritz
Mzimvubu-Tsitsikamma
Orange
Limpopo
InkomathiUsuthu
Olifants
Vaal
PongoloMzimkulu
BergOlifants
eThekwini (Durban)
Johannesburg
Cape Town 0 30 60 120 180 240
Kilometers
N
Table 1: Required, budgeted and projected public sector funding for water & sanitation services & infrastructure
Funding (R bn) Required7 Budgeted 2017/188
Budgeted 2018/199
Medium-term estimates 2019/20
Medium-term estimates 2020/21
Medium-term estimates 2021/22
Municipal infrastructure
grant
– – 15.3 14.8 15.6 16.8
Regional & local water &
sanitation services
– – 10.7 10.6 11.2 12.1
Water resource & bulk
infrastructure
– – 24.1 27.1 29.7 33.6
Total water & sanitation
services & infrastructure89.9 56.6 50.1 52.5 56.6 62.5
Funding shortfall – 33.3 38.9 36.4 32.4 26.5
789
2.2. Western Cape contextThe Western Cape Province in the south-west corner of South Africa falls predominantly within two water management areas (WMAs), the Breede-Gouritz and the Berg-Olifants (Figure 5). Irrigation to support agriculture constitutes the main water use in these two WMAs, followed by urban water use.
Figure 5: Water Management Areas in South Africa (Western Cape outlined in black)
7 According to DWS 2017 planning document.8 Due to changes in line items from 2017/18 to subsequent years, only the total is given. See previous MIR for details of this year.9 Budget Review 2019 (http://www.treasury.gov.za/documents/national%20budget/2019/review/FullBR.pdf)
Western Cape Province
2.2.1 Western Cape Water Supply SystemThe Western Cape water supply system (WCWSS), which supplies water to several municipalities within the Berg-Olifants WMA, is one of the most important supply systems in the country. It supplies water to a region that produces 84% of the province’s gross domestic product (GDP) and approximately 14% of national GDP (Quantec 2017). The WCWSS is a complex, interlinked system of dams, pipelines, and distribution networks that supplies water to the City of Cape Town (CCT), West Coast District Municipality (which supplies water to Swartland, Saldanha Bay, and Bergrivier local municipalities), Stellenbosch, Drakenstein, and Witzenberg local municipality, and certain agricultural users (see 2019 Water MIR for map with details).
10 This is the most recent data for total water use in the WCWSS.
The total water allocation for the system is 590 million m3 per year, which is allocated to various end users (Figure 6). Approximately two-thirds of the allocation is for urban use (including residential, commercial, and industrial use), and the remainder is allocated for agriculture, which is predominantly used in the summer months (DWS 2015). Even without making provision for the ecological reserve, the total allocations exceed the revised system yield of 545 million m3 per year (DWS 2018). There are no further opportunities to build additional large dams to augment the supply (DWS 2015). Consequently, even prior to the drought, the system was already constrained. The estimated average combined urban and agricultural water demand for 2009/10 to 2015/6 was 556 million m3 (DWS 2018). However, in 2016/1710 the demand was 16% lower at 469 million m3 due to the drought and associated water restrictions.
59.4%
32.0%
5.3%
1.8%
0.7%
0.4%
0.1%
0.1%
URBAN: CITY OF CAPE TOWN
AGRICULTURAL (CAPPED)
URBAN: WEST COAST DISTRICT
URBAN: STELLENBOSCH
URBAN: OVERBERG WATER
URBAN: DRAKENSTEIN
URBAN: PIKETBERG
URBAN: OTHER
Figure 6: Overview of WCWSS allocations by type (DWS 2018)

Water: Market Intelligence Report 2020 Water: Market Intelligence Report 202012 13
Data: City of Cape Town, Figure: © Climate System Analysis Group, University of Cape Town
Da
m s
tora
ge
(m
illio
n m
3)
Year
0
250
500
750
1 000
2008
Most recent value on: 31 Oct 2019
“maximum storage” (100%)
“unavailable storage” (10% of total)
2010 2012 2014 2016 2018 2020
600
400
200
0
800
1000
1200
1400
An
nu
al I
nfl
ow
s (M
illio
n m
3/y
ea
r)
Hydrological Year
1920/30s drought
Long-term Average
1970s drought
Current drought
The drought, which is linked to below-average rainfall, particularly in 2016 and 2017, placed additional strain on the WCWSS. In March 2017 and April 2018 respectively (Figure 7), the WCWSS dams reached their lowest levels in recorded history (~20% of capacity), and narrowly avoided the need for extreme water rationing. By the end of the 2018 and 2019 hydrological years (31 October), the WCWSS dam levels had recovered
to ~75% and ~84% (Figure 7), respectively. Water restrictions for the CCT were raised to 650 MLD at the end of the 2018 hydrological year (previously 500 MLD), and demand has remained well below this level for most of the year. Restriction levels are usually adjusted at the end of the hydrological year, but at the time of publishing, new restriction levels had not been announced yet.
Figure 7: Historical water stored (thin line) and projected future storage (thick line) in the six largest dams in the WCWSS, assuming pre-2015 demand and 2016/17 rainfall (CSAG11)
11
The ongoing effective demand-side management and resultant lower water use has been the key driver in the recovery of dam levels. While the total rainfall has increased somewhat in the last two years, it is still well below the historical long-term average, and indications are that the drought is not over (Figure 8). This highlights the importance and effectiveness of effective demand-side management and water efficiency interventions, and the key role it plays in managing water resources. Projections using pre-2015 demand and long-term average rainfall indicate that dam levels will recover to 100% in the next rainfall season, but the lower than average rainfall will necessitate ongoing demand-side reduction to avoid dam levels approaching the 10% level (Figure 7).
11 Historical dam storage levels up to 31 October 2019. To model various future scenarios, visit the Climate System Analysis Group (CSAG) website: http://cip.csag.uct.ac.za/monitoring/bigsix.html
While the total rainfall has increased somewhat in the last two years, it is still well below the historical long-term average, and indications are that the drought is not over (Figure 8). This highlights the importance and effectiveness of effective demand-side management and water efficiency interventions, and the key role it plays in managing water resources.
1928
193
019
32
193
419
36
193
819
40
194
219
44
194
619
48
1950
1952
1954
1956
1958
196
019
62
196
419
66
196
819
7019
7219
7419
7619
7819
8019
8219
8419
8619
8819
90
199
219
94
199
619
98
200
020
02
200
420
06
200
820
1020
1220
1420
1620
18
Figure 8: WCWSS annual runoff from 1928 to 2018 hydrological years (updated end of October 2019; City of Cape Town 2019)
2.2.2. Long-term planningThe climate projections for the Western Cape indicate a warming trend as well as projected drying in many areas, with longer periods between increasingly intense rainfall events (DEADP 2014). It also remains to be seen whether the drought represents a ‘step-change’ in the rainfall patterns (such as was experienced by Perth in the 1970s), or whether the decrease in average annual rainfall will occur gradually. Additionally, population and economic growth will place an additional burden on water supply systems. In turn it will have a negative impact on the province and consequently the country’s economy, and particularly the contribution of the agri-processing sector12. Water security will continue to be a focus for the Western Cape. It presents a platform on which government, business, investors and citizens can collectively implement water efficiency and resource recovery (water, energy and/or materials) initiatives, particularly in agri-processing, to increase resilience.
12 The gross value add (GVA) of agriculture in the Western Cape is ~R19 billion (22% of South Africa’s agricultural GVA) and export revenues exceed R40 billion per year. Around 216 000 people are employed in primary agriculture and 250 000 in agri-processing in the province (Jacobs 2017).
To address future water constraints, reconciliation studies are conducted to reconcile the gap between future demand and supply. The WCWSS reconciliation strategy study was completed in 2007, and annual status updates are produced by the Department of Human Settlements, Water and Sanitation (DHSWS, formerly the Department of Water Affairs and Forestry, DWAF and later the Department of Water and Sanitation, DWS). The annual update for 2018 compares several future water balance assessment scenarios. Figure 9 presents the scenario considered to be the most realistic base scenario without additional water conservation and demand management interventions. It assumes a projected 2% p.a. growth rate in water demand (DWS 2018). Dashed lines show water demand projections under different scenarios (scenario 1 being applicable to the graph). Solid fills show the planned water supply interventions, along with their height (or stacked thickness) indicating the estimated yields for the different interventions. These interventions include potable water reuse (from

Water: Market Intelligence Report 2020 Water: Market Intelligence Report 202014 15
© Bruce Sutherland (City of Cape Town)
WWTWs), groundwater development (new resources and artificial recharge), and large-scale permanent seawater desalination. In this regard, long-term plans have been in place for several years, and many of the planned projects were brought forward and re-assessed considering the drought and need of economic water resilience. Section 4.2.2 outlines in more detail some of the planned projects for the WCWSS.
Similar reconciliation strategies for other catchments in South Africa indicate the plans for additional supply sources to meet increasing demand. A summary of the large-scale reconciliation strategies indicates that existing water sources will decline, and that future additional water supply sources are spread throughout the country, and between different catchments (Figure 10). The largest new water sources are planned in the Orange River and Vaal River catchments, followed by the Western Cape and Richard’s Bay (Donnenfeld et al. 2018).
Wa
ter
Re
qu
ire
me
nts
(m
illio
n m
3/y
ea
r)
Figure 9: WCWSS planning scenario reconciliation of supply and demand (DWS 2018) (A larger version of this figure is available on request)
Figure 10: Planned increases in yield extracted from all published large-scale reconciliation strategies
Year
2032
2031
2030
2029
2028
2027
2033
2034
2035
2006
2007
2008
2009
2010
2011
2012
2013
2014
2015
2016
2017
2018
2019
2020
2021
2022
2023
2024
2025
2026
Yie
ld (
100
0 m
illio
n m
3)
14.5
15.0
15.5
16.0
16.5
17.0
17.5
18.0
18.5
Algoa
Oliphants
Amatole
Orange
KZN coastal metropolitan
Richards Bay
Luvuvhu and Letaba
Vaal
Manguang
Western Cape
Mbombela
Existing yield

Water: Market Intelligence Report 2020 Water: Market Intelligence Report 202016 17
2.2.3 State of Municipalities in South AfricaMunicipalities play an important role in providing water and sanitation services, and as such they constitute a key market in the water sector. However, there are a number of barriers within the market, one of which can generally be described as capacity. An analysis of municipalities in South Africa that captures various aspects of ‘capacity’ as they relate to water projects, indicates that only about 23% of municipalities have a ‘good’ score related to capacity13 to implement water projects (Figure 11).
Similarly, the National Business Initiative (NBI) found that only ~20% of municipalities in South Africa were suitable for public-private partnerships (PPPs) (NBI 2019). One further barrier is that smaller municipalities do not have credit ratings to compete in credit markets to
13 The criteria used included skills / capacity of senior/executive municipal staff to manage municipal finances effectively and manage infrastructure projects; financial standing of the municipality to access commercial or development finance institution (DFI) finance; skills / capacity among water department staff to successfully motivate for and implement water infrastructure projects.14 https://www.globalwaters.org/WASH-FIN
access finance. WASH-FIN14 has recently assessed the credit-rating of 21 select intermediary (secondary) municipalities, with 18 of them resulting in an investment grading. This indicates that there is greater potential for external financing for intermediate municipalities than is currently realised. There may be several reasons for this, which could vary among municipalities, but could include low appetite for debt, the long-term nature of infrastructure financing vs shorter term political cycles, or technical and managerial staff turnover.
The municipalities with ‘intermediate scores’ on the Municipal Grading Index in most cases need select interventions to assist them in accessing credit for infrastructure projects. In addition, they are well suited to projects that do not necessarily require debts, such as bulk water and wastewater treatment efficiency and optimisation retrofits.
Figure 11: Geographical distribution (A) and number of municipalities (B) in South Africa according to the Municipal Grading Index (UNIDO 2019, GreenCape analysis), indicating Good (green), Intermediate (yellow) and Poor (red) scores based on capacity criteria (see text and footnotes for details)15
15 An interactive version of this map can be found at https://www.greencape.co.za/content/map-mg/.
Poor Intermediate Good
Nu
mb
er
of
mu
nic
ipa
litie
s
A
B
0
20
40
60
80
100
120
140
20%
57%
23%
© GreenCape

Water: Market Intelligence Report 2020 Water: Market Intelligence Report 202018 19
© Bruce Sutherland (City of Cape Town)
3Policies and regulations
This section provides an overview of the regulatory environmentin the urban water sector.16
3.1. National legislation
3.1.1. The National Water Act16
The National Water Act (36 of 1998) (NWA) provides the legal framework for the effective and sustainable management of water resources (including surface water and groundwater) by the Department of Human Settlement, Water and Sanitation (DHSWS) on behalf of the national government. The NWA gives DHSWS the overall responsibility and authority to manage the use of water; protect water quality; allocate water; and promote inclusive water management.
The NWA, under Section 21, describes 11 different ‘water use’ activities, which include taking and storing water, reduction of stream flow, waste discharges and disposals, altering of watercourses, abstraction of groundwater, recreation, and any controlled activities that detrimentally affect water resources. Section 26 regulates water use activities, design, construction and operation of any waterworks, including the registration of respective personnel. This is particularly relevant to alternative water supply projects, including water reuse. Generally, a water use must be licensed, unless it is listed in Schedule I, is an existing lawful use (ELU), is permissible under a general authorisation (GA), or if the need for a water use licence (WUL) is waived.
3.1.2. Categories of legal water useThe NWA classifies any lawful water use under four categories:
16 The section does not comprehensively cover all relevant legislation; it highlights key information that may be useful to potential investors. 17 Although in some cases the local municipality may require registration.18 Municipalities may still require registration of boreholes or well points – see Section 3.2.3.19 https://cer.org.za/virtual-library/legislation/national/water/national-water-act-1998
Schedule 1: Generally applies to low volume (reasonable) water use with low impact activities, consistent with domestic use (non-commercial uses), recreational use, livestock watering, and for emergencies. This water use is permissible and does not require licensing or registration.17 Residents may use groundwater on their properties for reasonable domestic use without a licence.18 However, water use entitlement under Schedule 1 does not supersede, and is subject to, any limitation by any other law, ordinance, by-law, or regulation set by the responsible authority in that area.
Existing lawful use: Legal water use obtained under the Water Act (54 of 1956) two years prior to the commencement of NWA is considered as existing lawful use (ELU), and is subject to terms and registration under the NWA. However, such users must prove with relevant records that their water use existed before 1998. This must be verified and validated by the DHSWS.
General authorisation: GA replaces the need for a licence in terms of Section 21 of the NWA as outlined in Government Notice (GN), and is site specific. There is a GN for each water use activity that sets the limits and circumstances suitable for the issuance of a GA19. Businesses involved in water use activities that are neither registrable under Schedule 1, nor under ELU, must register the use(s) under a GA or apply for a WUL. The free registration of a GA through DHSWS typically takes a few weeks.

Water: Market Intelligence Report 2020 Water: Market Intelligence Report 202020 21
Water use licence: Applies if the water use activities cannot be covered under Schedule 1, ELU or GA in accordance with Section 21 of the NWA. A WUL application may take up to 300 working days. The government has committed to ensuring that for the following sectors, a WUL is issued within a shorter timeframe: 60 days for agriculture, 80 to 95 days for infrastructure projects from state-owned enterprises and municipalities, and 120 days for mining.
3.1.3. The National Building Regulations and Building Standards ActIn terms of design and construction, water systems must be consistent with the National Building Regulations (NBRs) under the National Building Regulations and Building Standards Act, Act 103 of 1977, which governs all building and construction work in South Africa. At present, the NBRs do not include provisions relating to water efficiency or alternative water supply; however,
20 Relevant to sludge produced at agri-processing and municipal WWTWs.21 For more details, please refer to the Waste Market Intelligence Report 2020.
the Department of Trade and Industry (dti) has initiated the process to include these aspects. It is unclear how long this process will take, but draft water efficiency standards are being written.
3.1.4. National Environmental Management: Waste Act (59 of 2008)The national norms and standards under the Act prohibit landfill disposal of: ■ liquid waste with a moisture content >40%,
angle of repose <5°, free flowing when transported, or at ≤60 °C (banned since 2019);
■ brine or waste with a high salt content (>5%) and a leachable concentration for total dissolved solids of >100 000 mg/l, (ban effective from 2021).
The Act targets organic waste20 diversion from landfill of 50% by 2022, and 100% by 2027 (only applicable to Western Cape Province)21.
3.1.5. Other key national legislation and standardsOther key national laws and regulations that may be relevant to projects in the water sector include the following:
■ The National Water and Sanitation Masterplan (2019), while it is not an act or legislation, is an important guiding document to inform the development of the water sector according to national priorities.
■ The Water Services Act (108 of 1997), is relevant to the regulation of water and sanitation services provided by municipalities.
■ The National Environmental Management Act (107 of 1998) is relevant to environmental authorisations.
■ The National Environmental Management: Integrated Coastal Management Act (24 of 2008) regulates the discharge of brine to the ocean.
■ The National Environmental Management: Air Quality Act (39 of 2004).
■ The Industrial Policy Action Plan (IPAP) highlights water and sanitation as a key sectoral focus area.
■ The South African National Standard for Drinking Water (SANS 241: 2015).
■ The Preferential Procurement Policy Framework Act (.5 of 2000) provides for the Department of Trade, Industry and Competition (dtic) to designate certain areas for local production and content. Local content designation is assessed according to the South African Bureau of Standards (SABS) through the technical specification numbers SATS 1286:2011 and SANS 1286:2017.
It should be noted that during emergency situations (e.g. disasters due to drought) certain authorisations can be fast-tracked or are no longer required.
Further information can be obtained from the responsible authorities.
3.2. Municipal by-laws and tariffs Municipalities have the constitutional competence to enact laws (known as by-laws) in respect of water and sanitation services. The Department of Water Affairs and Forestry (DWAF), as it was known at the time, developed model water services by-laws for municipalities in the early 2000s. The model by-laws included provisions to empower municipalities to prevent wasteful use of water, impose water restrictions, require large users to submit annual water audits, and specify standards relating to the quality of fittings. The by-laws contained general clauses relating to water efficiency, but left the specifics to the municipality to decide. Several municipalities have developed water by-laws based on these model by-laws.
Municipal by-laws also include provisions relating to the discharge of wastewater and industrial effluent to sewer. Such provisions may include the maximum discharge limits for various water quality parameters, and the requirement for an industrial discharge permit. Wastewater that exceeds the water quality limits may incur surcharges, or denial of a permit to discharge to sewer.
© GreenCape

Water: Market Intelligence Report 2020 Water: Market Intelligence Report 202022 23
3.2.1. Water restrictionsThe national Department of Human Settlements, Water and Sanitation (DHSWS) is responsible for imposing restrictions on different user categories in catchments facing water supply constraints. Municipalities then pass these restrictions on to their water users. Restriction levels impose volume limits, time limitations, and bans on certain types of water use in order to decrease demand during periods of water insecurity. Restriction levels and their requirements vary from municipality to municipality. Most municipalities have up to five restriction levels –
22 https://www.capetown.gov.za/Family%20and%20home/residential-utility-services/residential-water-and-sanitation-services/Residen-tial-water-restrictions-explained
the higher the restriction level, the greater the limitations imposed. At the time of writing, water restrictions were still in place in most of the municipalities in the Western Cape. The CCT has recently simplified its restriction levels (and associated water tariffs), so that it effectively has four restriction levels (previously nine levels). The levels will be pre-determined based on the dam levels in the WCWSS at the end of the hydrological year (see Figure 12), and adjusted annually at that time. Previously this was done on an ad hoc basis. Refer to the CCT website22 for an overview of new water restrictions in the CCT.
Figure 12: Determination of water restriction levels based on dam levels at end of hydrological yearfor the City of Cape Town
3.2.2. Water tariffsMunicipalities either purchase untreated raw water from DWS, taken directly from dams, springs, rivers and boreholes, or purchase bulk water from bulk water providers, e.g. Water Boards, which is then treated to a potable standard. The CCT owns some dams, and together with other municipalities in the WCWSS also purchase raw water from DHSWS-owned dams. The water is then treated in municipal-owned facilities. The 2019/20 consumptive raw water charges (which include water management and infrastructure charges, and a water research fund levy) ranged between R0.05/kl and R21.04/kl nationally (DWS 2019). The 2018/19 bulk water tariffs averaged R9.27/kl, varying from R5.04/kl to R17.52/kl. The tariff would depend on various factors, such as the availability of water, water quality, distance of distribution, and cost of infrastructure finance (DWS 2017a).
Municipalities distribute potable water to their consumers and charge a retail tariff. Revenue from water sales accounts for around 13% of municipal
23 Minimum restriction level tariffs. Residential tariffs are for non-indigent, single dwelling houses (post-paid) at minimum (synonymous with no restriction level; we have used this convention since the exact terminology varies between municipalities). The sanitation charges exclude any industrial effluent surcharges if effluent exceeds discharge limits. Sanitation charges apply to an assumed sewage discharge volume that is linked to water consumption, as shown in Table 3 of the 2019 Water MIR.
operating revenue (DWS 2017a). Each municipality is responsible for setting its own tariffs, which may differentiate between users. Most municipalities have separate tariffs for residential, commercial, and industrial water users, and provide a free basic allowance of water (6kl/month) to indigent households. In South Africa, around 56% of households do not pay for water and sanitation services (in 2015), because they are either unable (indigent) or unwilling to do so (StatsSA 2016a).
Municipalities generally use a rising block (stepped) tariff structure, where R/kl tariffs increase as usage increases (see Figure 13). However, in some cases a fixed volumetric rate (R/kl) applies, e.g. CCT and eThekwini’s water and sanitation tariffs for commercial and industrial water users. In addition, the tariffs are linked to restriction levels, with tariffs increasing as restrictions increase. Water (Table 2) and sanitation (Table 3) tariffs (excluding fixed charges and surcharges), and tariff structures vary between metros23, which have an impact on the business case for water technologies.
Novem
ber
Da
m L
eve
l
Month
0%
10%
20%
30%
40%
50%
60%
70%
80%
90%
100%
Novem
ber
December
January
February
Marc
hApril
May
JuneJuly
August
Septem
ber
October
Waterwise
Level 1
© Bruce Sutherland (City of Cape Town)
Level 2
Level 3
Emergency Response

Water: Market Intelligence Report 2020 Water: Market Intelligence Report 202024 25
Table 2: Water tariffs for selected metros (minimum restriction levels in place) for FY 2019/20
Cape Town eThekwini Tshwane Ekurhuleni Johannesburg
Monthly use (kl)
R/kl Monthly use (kl)
R/kl Monthly use (kl)
R/kl Monthly use (kl)
R/kl Monthly use (kl)
R/kl
Re
sid
en
tia
l
Step 1 0-6 14.45 0-6 21.39 0-6 11.61 0-6 11.74 0-6 9.10
Step 2 6-10.5 19.86 6-25 25.30 7-12 16.56 7-15 19.34 6-10 9.66
Step 3 10.5-35 26.99 25-30 33.70 13-18 21.75 16-30 23.69 10-15 16.49
Step 4 >35 49.80 30-45 51.98 19-24 25.16 31-45 29.47 15-20 23.99
Step 5 – – >45 57.15 25-30 28.76 >45 36.35 20-30 32.96
Step 6 – – – – 31-42 31.08 – – 30-40 36.51
Step 7 – – – – 43-72 33.26 – – 40-50 46.62
Step 8 – – – – >72 35.61 – – >50 49.66
Co
mm
erc
ial &
In
du
stri
al Step 1
Not stepped
25.88Not stepped
33.35
0 - 100 000
24.51 0-5 000 25.37 0-200 42.19
Step 210 001- 100 000
23.265 001 -25 000
25.77 >200 44.50
Step 3 >100 000 21.68 >25 000 26.89 – –
Table 3: Sanitation tariffs for selected metros (minimum restriction levels in place) FY 2019/20
Cape Town L1 eThekwini Tshwane Ekurhuleni Johannesburg
Monthly water use (kl)
R/kl of sewage
Monthly water use (kl)
R/kl of sewage
Monthly water use (kl)
R/kl of sewage
Monthly water use (kl)
R/kl of sewage
Property size (m2)
R (Res) or R/kl (C&I)
Re
sid
en
tia
l
Step 1 0-6 12.7 0-6 3.57 0-6 8.21 0-6 16.29 0-300 213.94
Step 2 6-10.5 17.45 6-25 5.95 7-12 11.08 7-15 13.03 301-1000 416.47
Step 3 10.5-35 24.51 25-30 11.37 13-18 14.27 16-30 5.541 001 -2 000
630.05
Step 4 >35 38.55 30-45 17.67 19-24 14.27 31-45 5.09 >2 000 907.80
Step 5 – – >45 19.72 25-30 14.27 >45 3.47 – –
Step 6 – – – – 31-42 14.27 – – – –
Step 7 – – – – >42 14.27 – – – –
Co
mm
erc
ial
& In
du
stri
al Step 1
Not stepped
23.25Not stepped
9.02Not stepped
9.14
0-5 000 10.22
Not stepped
31.54Step 25 001- 25 000
5.45
Step 3 >25 000 3.54
0
200
400
600
800
1000
1200
1400
Cape Town L1 eThekwini Tshwane Ekurhuleni Johannesburg
6 kl 12 kl 25 kl 40 kl
Co
st o
f w
ate
r p
er
mo
nth
(R
; ex
VA
T)
Figure 13: Comparison of water tariffs for commercial and industrial businesses across various metros24
The National Water and Sanitation Masterplan developed by the then Department of Water and Sanitation (now DHSWS), states that water and sanitation tariffs should be determined on the principle of cost recovery, although historically this has not been the case. As the raw water quality and quantities decline, the cost of more expensive alternative water sources to increase
supply will lead to increased tariffs. Tariffs have been increasing across selected metros at an annual average of approximately 7% (Figure 14), although future tariff increases are expected to be higher. The DHSWS has proposed raw-water price increases of at least 16.5%, effective from March 2020 (SAGNA 2019).
Figure 14: Commercial and industrial water tariffs when minimum restrictions (no restrictions) are in place, for selected metros 2012-2020 (GreenCape analysis)25
24 The figure reflects the consumptive water charges only (excluding any fixed charges or sanitation charges) at minimum or no restrictions..25 The figure reflects the consumptive water tariffs only (excluding any fixed charges or sanitation charges) at minimum or no restrictions. The tariffs are for the first tariff step only.
10
15
20
25
30
35
40
45
Jul-12 Jul-13 Jul-14 Jul-15 Jul-16 Jul-17 Jul-18 Jul-19 Jul-20
Co
nsu
mp
tive
wa
ter
tari
ffs
(R/k
l; ex
VA
T)
eThekwini
Johannesburg
TshwaneCape Town
Ekurhuleni

Water: Market Intelligence Report 2020 Water: Market Intelligence Report 202026 27
3.2.3. Alternative water useThe CCT Water Amendment By-law (2018) requires that all new developments (C&I or residential) install water-saving measures or alternative water systems, as well as sub-metering of multi-unit properties (by October 2020 for existing properties). The By-law stipulates that only municipal potable water can be used for domestic purposes (drinking, ablution and culinary, excluding toilets and urinals). However, businesses and residential developments can use alternative water for domestic purposes if they enter into a contract with CCT to become a Water Services Intermediary (WSI)26. The contract outlines various conditions that must be adhered to, including water quality monitoring and compliance.
To address the absence of national standards for the installation of alternative water systems (such as greywater, rainwater, groundwater, and treated effluent), CCT has developed summary installation guidelines27. The guidelines outline the required measures to protect the municipal supply and the water users within the property, in line with the CCT’s Water Amendment By-law 2018. Approvals are required from the CCT for all plumbing installations for alternative water systems, and a Certificate of Compliance is required once the installation has been completed.
26 http://cct.gov.za/bC2nV 27 http://resource.capetown.gov.za/documentcentre/Documents/Procedures,%20guidelines%20and%20regulations/Guidelines%20for%20Alternative%20Water%20Installations.pdf 28 More information can be found here: www.greencape.co.za/assets/Uploads/Wesgro-B-BBEE-Info-Sheet-2018.pdf 29 Enterprises with an annual turnover of less than R10 million, or recently formed or incorporated entities that have been in operation for less than one year.30 A business with an annual turnover of more than R10 million but less than R50 million.
3.3. Municipal procurementMunicipal procurement is regulated by the Municipal Finance Management Act (56 of 2003) and its regulations, including the Municipal Supply Chain Management Regulations (2005). These regulations specify the minimum requirements, but municipalities are allowed to apply stricter standards. The Municipal Finance Management Act (MFMA) outlines the competitive procurement processes, and unsolicited bids are not encouraged. National Treasury also sets further requirements such as local content under designated sectors through the Preferential Procurement Framework Act (5 of 2000).
As stipulated by National Treasury (2017), for projects worth more than R30 000 but less than R50 million (incl. VAT), the price contributes 80 points of the total score, and the Broad-based Black Economic Empowerment (B-BBEE)28 status contributes 20 points. For projects above R50 million, the price contributes 90 points and B-BBEE status 10 points.
Municipalities can also specify prequalification criteria to limit the competition to certain groups. These groups include companies with higher B-BBEE scores, exempted micro enterprises (EMEs)29 and qualifying small business enterprises (QSEs)30. Municipalities are also allowed to issue directives on emergency procurement procedures when a state of disaster has been declared under Section 55(2) of the Disaster Management Act (2002).
The CCT Water Amendment By-law requires that all new developments install water-saving measures or alternative water systems mainly for non-domestic purposes. However, businesses and residential developments may use alternative water for domestic purposes if they enter into a contract with CCT to become a Water Services Intermediary (WSI).
3.3.1. City of Cape Town procurementCompanies wishing to do business with CCT must first register with the City’s supplier database31, the national Central Supplier Database (CSD)32, and then register on the procurement portal33 and/or tender portal34.
The CCT publishes Requests for Quotations (RFQs) on its portal for goods and services worth less than R200 000, while those exceeding R200 000 (VAT included) require a formal bidding (tender) process. Tenders are also advertised in local newspapers and on the national tender portal35. The bidding process for tenders valued at more than R10 million is more extensive and requires additional documentation.
31 https://www.capetown.gov.za/City-Connect/Register/Business-and-trade/Register-as-a-supplier 32 https://secure.csd.gov.za/ 33 http://web1.capetown.gov.za/web1/procurementportal34 http://web1.capetown.gov.za/web1/TenderPortal35 https://etenders.treasury.gov.za/36 http://www.capetown.gov.za/Work%20and%20business/Doing-business-in-the-City37 http://www.capetown.gov.za/Work%20and%20business/Doing-business-with-the-city/Tenders-RFQs-and-supply/Tenders-received
For more information on the procurement processes, please visit the CCT website36. The list of tenders received by the City, and their prices, can be viewed here37.
New Technology PlatformThe CCT has set up a New Technology Platform to gain an understanding of innovative water technologies in the market. It gives companies the opportunity to present their products and services to government in a fair manner. For information on how to submit information to the committee, please contact [email protected].
© GreenCape
Water: Market Intelligence Report 2020 Water: Market Intelligence Report 202028 29
© GreenCape
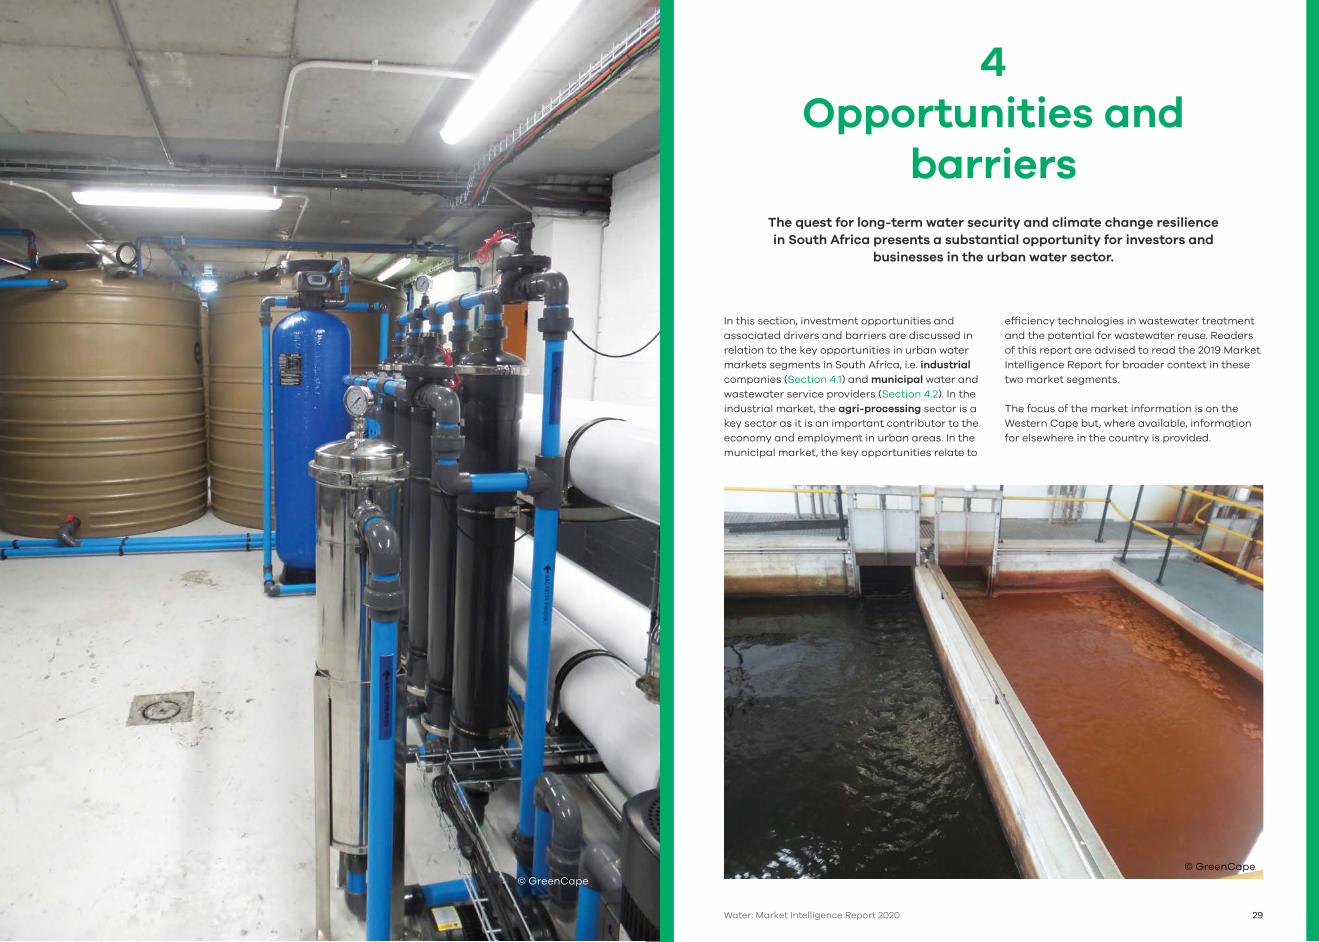
4 Opportunities and
barriersThe quest for long-term water security and climate change resilience in South Africa presents a substantial opportunity for investors and
businesses in the urban water sector.
In this section, investment opportunities and associated drivers and barriers are discussed in relation to the key opportunities in urban water markets segments in South Africa, i.e. industrial companies (Section 4.1) and municipal water and wastewater service providers (Section 4.2). In the industrial market, the agri-processing sector is a key sector as it is an important contributor to the economy and employment in urban areas. In the municipal market, the key opportunities relate to
efficiency technologies in wastewater treatment and the potential for wastewater reuse. Readers of this report are advised to read the 2019 Market Intelligence Report for broader context in these two market segments.
The focus of the market information is on the Western Cape but, where available, information for elsewhere in the country is provided.
© GreenCape
Water: Market Intelligence Report 2020 Water: Market Intelligence Report 202030 31
Table 4: Summary of market opportunities
Opportunity Drivers Barriers Key market segments
Industrial market: agri-processing sector
Water
efficiency
&
wastewater
reuse
(Section 4.1)
■ Water security ■ Increasing water & sanitation tariffs■ Policies, regulations & strategies■ Corporate social responsibility■ Water resource pollution ■ Local availability of water
efficient technology
■ Currently poor business case in some
municipalities■ Public perception &
health risks■ Access to information on best practice
& locally validated technologies■ Access to capital■ Licensing & permitting■ Operational complexity
■ Total realisable
investment of ~R6 bn in
water technologies in
key agri-processing
sub-sectors over the
next four to six years
in SA
Municipal market: wastewater treatment works
Wastewater
reuse
(Section 4.2)
■ Increasing water demand
& decreasing surface
water supply■ National & provincial water
strategies■ Availability of technology■ Cost competitiveness
■ Policies & regulations ■ Public perception &
health risks■ Financing (not all off-takers are
bankable) ■ Poor quality of source water (also
potential driver)
■ Projects currently in
development in SA
amount to ~ R5.8 bn■ R2.6 bn projects
planned in WC in next
10 years■ Total of R50 bn worth
of projects at WWTWs
larger than 1 MLD in SA
Biogas
&
energy
efficiency
(Section 4.2)
■ Energy intensive wastewater
treatment services/processes ■ High electricity bills ■ Energy intensive wastewater
treatment processes/operations &
the related high electricity bills
■ Lack of technical capacity ■ Financing (not all off-takers bankable)■ Poor business case for some projects■ Operational complexity
■ Three large-scale
biogas / CHP projects
currently in planning in
Cape Town (over the
next 10 years)■ Total of R1.1 bn in viable
CHP projects at
WWTWs
in SA38
■ Total of R1.1 bn in
energy efficiency and
optimisation retrofits
at waterworks in the
eight metropolitan
municipalities
38 Only includes costing of CHPs at WWWTs with existing ADs that require minor refurbishment.
4.1. Industrial Market: Water efficiency and reuse in the SA agri-processing sector
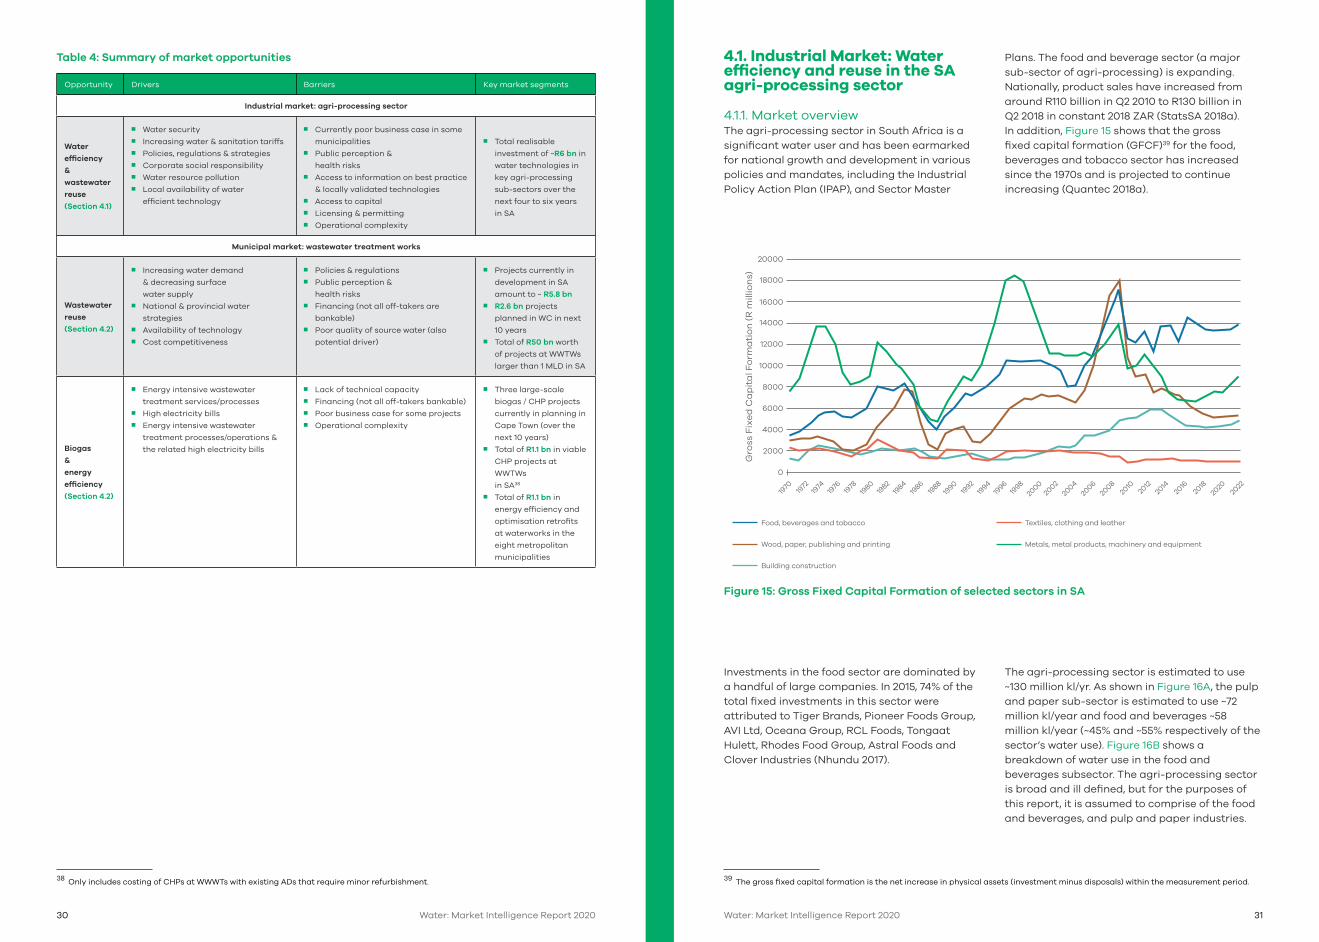
4.1.1. Market overviewThe agri-processing sector in South Africa is a significant water user and has been earmarked for national growth and development in various policies and mandates, including the Industrial Policy Action Plan (IPAP), and Sector Master
Plans. The food and beverage sector (a major sub-sector of agri-processing) is expanding. Nationally, product sales have increased from around R110 billion in Q2 2010 to R130 billion in Q2 2018 in constant 2018 ZAR (StatsSA 2018a). In addition, Figure 15 shows that the gross fixed capital formation (GFCF)39 for the food, beverages and tobacco sector has increased since the 1970s and is projected to continue increasing (Quantec 2018a).
Figure 15: Gross Fixed Capital Formation of selected sectors in SA
Wood, paper, publishing and printing Metals, metal products, machinery and equipment
Building construction
Food, beverages and tobacco Textiles, clothing and leather
39
Investments in the food sector are dominated by a handful of large companies. In 2015, 74% of the total fixed investments in this sector were attributed to Tiger Brands, Pioneer Foods Group, AVI Ltd, Oceana Group, RCL Foods, Tongaat Hulett, Rhodes Food Group, Astral Foods and Clover Industries (Nhundu 2017).
39 The gross fixed capital formation is the net increase in physical assets (investment minus disposals) within the measurement period.
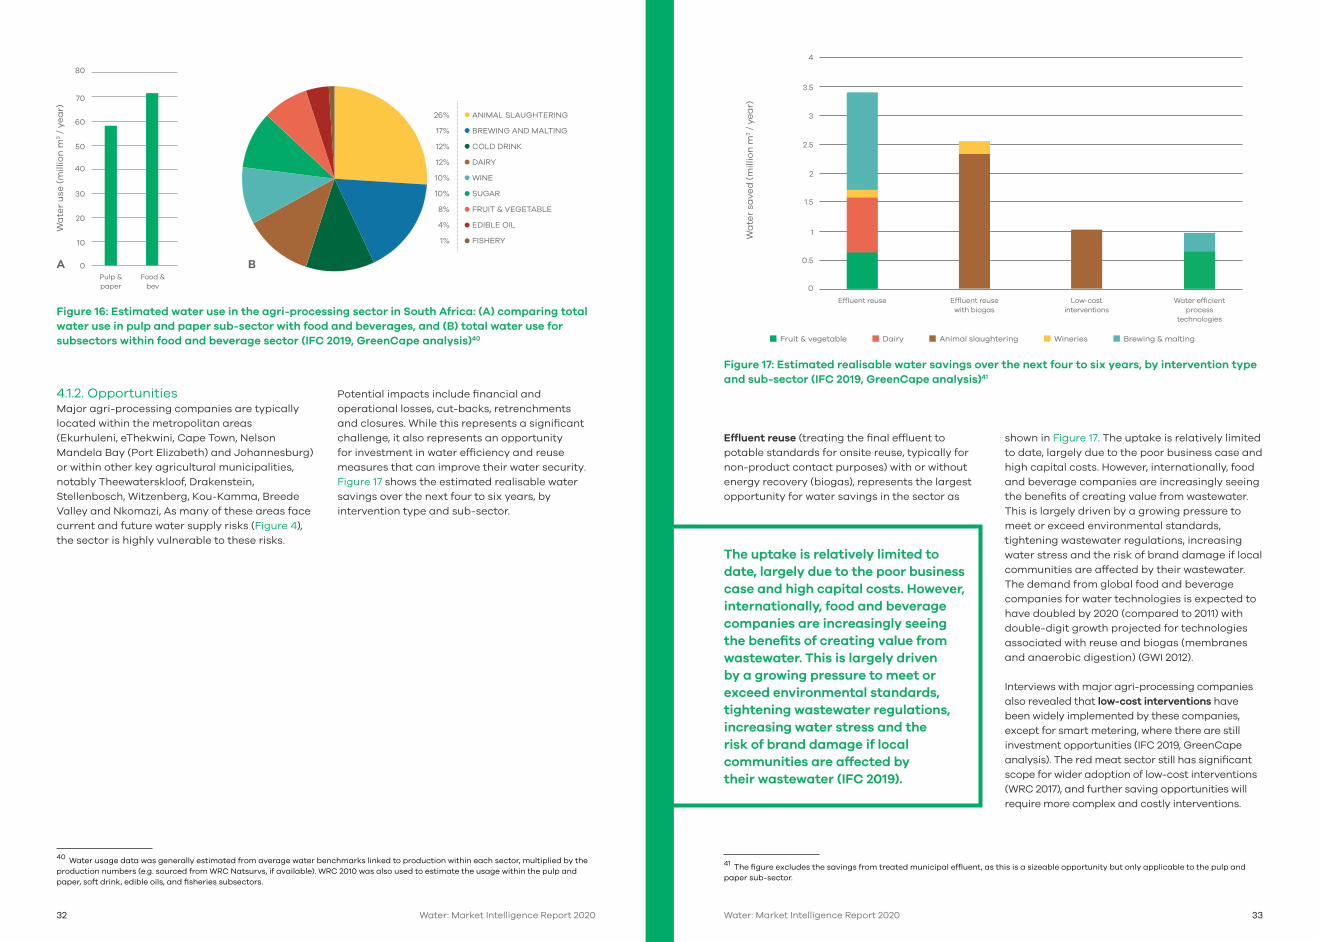
The agri-processing sector is estimated to use ~130 million kl/yr. As shown in Figure 16A, the pulp and paper sub-sector is estimated to use ~72 million kl/year and food and beverages ~58 million kl/year (~45% and ~55% respectively of the sector’s water use). Figure 16B shows a breakdown of water use in the food and beverages subsector. The agri-processing sector is broad and ill defined, but for the purposes of this report, it is assumed to comprise of the food and beverages, and pulp and paper industries.
2010
2012
2014
2016
2018
2020
2022
Gro
ss F
ixe
d C
ap
ita
l Fo
rma
tio
n (
R m
illio
ns)
0
2000
4000
6000
8000
10000
12000
14000
16000
18000
20000
1970 19
7219
7419
7619
7819
8019
8219
8419
8619
8819
9019
9219
9419
9619
9820
0020
0220
0420
0620
08
Water: Market Intelligence Report 2020 Water: Market Intelligence Report 202032 33
41
Effluent reuse (treating the final effluent to potable standards for onsite reuse, typically for non-product contact purposes) with or without energy recovery (biogas), represents the largest opportunity for water savings in the sector as
41 The figure excludes the savings from treated municipal effluent, as this is a sizeable opportunity but only applicable to the pulp and paper sub-sector.
shown in Figure 17. The uptake is relatively limited to date, largely due to the poor business case and high capital costs. However, internationally, food and beverage companies are increasingly seeing the benefits of creating value from wastewater. This is largely driven by a growing pressure to meet or exceed environmental standards, tightening wastewater regulations, increasing water stress and the risk of brand damage if local communities are affected by their wastewater. The demand from global food and beverage companies for water technologies is expected to have doubled by 2020 (compared to 2011) with double-digit growth projected for technologies associated with reuse and biogas (membranes and anaerobic digestion) (GWI 2012).
Interviews with major agri-processing companies also revealed that low-cost interventions have been widely implemented by these companies, except for smart metering, where there are still investment opportunities (IFC 2019, GreenCape analysis). The red meat sector still has significant scope for wider adoption of low-cost interventions (WRC 2017), and further saving opportunities will require more complex and costly interventions.
The uptake is relatively limited to date, largely due to the poor business case and high capital costs. However, internationally, food and beverage companies are increasingly seeing the benefits of creating value from wastewater. This is largely driven by a growing pressure to meet or exceed environmental standards, tightening wastewater regulations, increasing water stress and the risk of brand damage if local communities are affected by their wastewater (IFC 2019).
26+17+12+12+10+10+8+4+1 ANIMAL SLAUGHTERING
BREWING AND MALTING
COLD DRINK
DAIRY
WINE
SUGAR
FRUIT & VEGETABLE
EDIBLE OIL
FISHERY
26%
17%
12%
12%
10%
10%
8%
4%
1%
Figure 16: Estimated water use in the agri-processing sector in South Africa: (A) comparing total water use in pulp and paper sub-sector with food and beverages, and (B) total water use for subsectors within food and beverage sector (IFC 2019, GreenCape analysis)40
0
10
20
30
40
50
60
70
80
Pulp & paper
Food & bev
Wa
ter
use
(m
illio
n m
3 /
ye
ar)
40
4.1.2. OpportunitiesMajor agri-processing companies are typically located within the metropolitan areas (Ekurhuleni, eThekwini, Cape Town, Nelson Mandela Bay (Port Elizabeth) and Johannesburg) or within other key agricultural municipalities, notably Theewaterskloof, Drakenstein, Stellenbosch, Witzenberg, Kou-Kamma, Breede Valley and Nkomazi, As many of these areas face current and future water supply risks (Figure 4), the sector is highly vulnerable to these risks.
40 Water usage data was generally estimated from average water benchmarks linked to production within each sector, multiplied by the production numbers (e.g. sourced from WRC Natsurvs, if available). WRC 2010 was also used to estimate the usage within the pulp and paper, soft drink, edible oils, and fisheries subsectors.
Potential impacts include financial and operational losses, cut-backs, retrenchments and closures. While this represents a significant challenge, it also represents an opportunity for investment in water efficiency and reuse measures that can improve their water security. Figure 17 shows the estimated realisable water savings over the next four to six years, by intervention type and sub-sector.
Figure 17: Estimated realisable water savings over the next four to six years, by intervention type and sub-sector (IFC 2019, GreenCape analysis)41
0
0.5
1
1.5
2
2.5
3
3.5
4
Effluent reuse Effluent reuse with biogas
Low-cost interventions
Water efficient process
technologies
Fruit & vegetable Dairy Animal slaughtering Wineries Brewing & malting
Wa
ter
save
d (
mill
ion
m3 /
ye
ar)
A B

Water: Market Intelligence Report 2020 Water: Market Intelligence Report 202034 35
Figure 18 shows the breakdown, by sub-sector, of the potential water savings, the associated water cost savings and the investment potential for the water efficiency and reuse opportunities, referred to in Figure 19 (including treated municipal effluent opportunities in the pulp and paper sub-sector). The pulp and paper industry
(~45% of total agri-processing water use) presents the highest water-saving potential. However, cost savings are relatively low as the industry generally sources its process water directly from low-cost raw water supplies, rather than municipal supplies.
0%
10%
20%
30%
40%
50%
60%
70%
80%
90%
100%
Water savings Water cost savings
Investment
Fruit & vegetable Dairy Animal slaughtering Wineries Breweries Pulp & paper
Figure 18: Estimated realisable water savings for key agri-processing sub-sectors over the next four to six years and required investment (IFC 2019, GreenCape analysis)
Total: ~30million m3/year
Total: ~R265 million/year Total: ~R6 billion
The total investment potential over the next four to six years for water efficiency and reuse on the South African agri-processing sector is estimated to be ~R6 bn, with significant investment opportunities in the animal slaughtering, pulp and paper, fruit and vegetable, and dairy sectors (Figure 17). However, many water efficiency investment opportunities are driven by local factors (e.g. water tariffs and by-laws specific to a municipality), rather than subsector-specific factors. Irrespective of sector, there are companies within all the key sub-sectors that provide water efficiency savings and investment opportunities.
4.1.3. Drivers Water security risks, pressure to comply with wastewater discharge regulations, high water and sanitation tariffs, and corporate social responsibility are all drivers for water-efficiency interventions that vary from site to site and affect agri-processors across the sector. In 2019, the World Economic Forum ranked ‘water crises’ as the second highest risk for doing business in South Africa (WEF 2019).
Business continuity risk, linked to these water security risks, is the dominant driver for investment in water efficiency in the sector (IFC 2019, GreenCape analysis). Where these risks are serious, companies are willing to invest in water efficiency and reuse projects that provide water security, even when traditional paybacks are unfavourable.
Wastewater discharge regulations and charges are often a driver for investment in wastewater treatment equipment, and further investment in non-potable and/or potable reuse projects becomes attractive. Companies that discharge wastewater to the environment or via the municipal sewer system must be in possession of a licence or authorisation stipulating the discharge standards that must be adhered to. If the effluent does not meet the required standards it attracts surcharges or penalties. DHSWS is in the process of constituting an Anti-Pollution Task Team (APTT) that will deal with escalating incidents of water resource pollution across the country.
Furthermore, recent and forthcoming regulations (Section 3.1) to divert organic waste from landfills in the Western Cape will necessitate further treatment of sludge or organic load from wastewater. It presents opportunities for technologies to do this on-site, or services that
collect and treat off-site. Furthermore, technologies that enable resource recovery from organic wastewater could offset some of the additional costs associated with the extra treatment required, resulting in more viable on-site wastewater treatment and reuse projects.
Agri-processors are also more likely to invest in efficiency or reuse in areas where the water and sanitation tariffs are higher (e.g. City of Johannesburg), or if the company has a strong corporate social responsibility mandate (typically large multi-national companies).
42 The low conversion rate could be due to several factors, such as applicants failing the onerous application process, or projects being abandoned or postponed by the client.
4.1.4. Barriers and risksThe single greatest barrier to implementing capital-intensive water efficiency and reuse measures is the poor business case for investment. This is due to a number of factors:■ Low water tariffs (see Section 3.2.2) result in
paybacks of typically not less than seven to eight years for effluent reuse or biogas projects, or longer if cheap raw water (ground or surface water) is used. Agri-processors are generally only interested in investments with paybacks of less than three years. They are therefore unlikely to invest in these types of water projects, unless there are other drivers (e.g. business continuity risks, corporate social responsibility, regulatory compliance, expansion) (IFC 2019, GreenCape analysis).
■ The seasonal nature of the sector reduces the business case, as many agri-processors only operate for part of the year.
■ There is currently a lack of incentives for investment in water efficiency. The Agri-Processing Support Scheme was established in 2017 by the Department of Trade and Industry (dti), as it was known then (now dtic), to part-fund capital infrastructure investments. In 2017/18, despite 23 approved projects, there were no disbursements from the R1 bn grant fund. In 2018/19 of the 56 approved projects only one received disbursement42 (~R19 m, which included the cost of a reverse osmosis plant). Municipalities are also generally reluctant to incentivise projects that reduce revenue from their services.
Brine management: Treatment of effluent by reverse osmosis results in brine (wastewater) with high concentrations of contaminants, which can be difficult and expensive to dispose of legally. Municipalities will not permit brine to be discharged to sewer or to storm water if the water quality discharge limits are exceeded (see Section 3.2). In addition, liquids and saline wastes can no longer be sent to landfill from 2019 and 2021, respectively (see Section 3.1.4). Many water treatment projects cannot proceed due to the lack of a cost-effective brine management solution.
DHSWS is in the process of constituting an Anti-Pollution Task Team (APTT) that will deal with escalating incidents of water resource pollution across the country. Furthermore, recent and forthcoming regulations (Section 3.1) to divert organic waste from landfills in the Western Cape will necessitate further treatment of sludge or organic load from wastewater. It presents opportunities for technologies to do this on-site, or services that collect and treat off-site. Furthermore, technologies that enable resource recovery from organic wastewater could offset some of the additional costs associated with the extra treatment required, resulting in more viable on-site wastewater treatment and reuse projects.

Water: Market Intelligence Report 2020 Water: Market Intelligence Report 202036 37
Licensing and authorising: As outlined in Section 3.1.1, obtaining the licences and authorisations needed for water-related projects can be a complex and lengthy process. These regulatory challenges can deter investment. Regulations on product requirements, high health and safety standards, and public perception fosters a reluctance in many food and beverage companies to consider advanced water projects, such as wastewater reuse. An outbreak of listeriosis in SA in 2017 has further prioritised health concerns in this sector. Furthermore, there is concern over contaminants of emerging concern43 (CECs) that are currently not monitored under SANS:241, and require more advanced and expensive treatment steps. A further hurdle is that water analysis for CECs is currently done internationally, which is both expensive and takes a long time to produce results.
Increased operational complexity: Advanced water projects often increase the operational complexity to beyond the operations and management (O&M) skills available within industrial companies (and this is more so in small to medium sized operations). This can lead to operational risks, and a reluctance to proceed with more complex water projects.
43 Pollutants that may cause ecological or human health impacts, and are typically not regulated under current environmental laws, such as pharmaceuticals, natural and synthetic hormones, and personal care products.
Skills development or upskilling of existing staff is required, which adds to the cost of the project. There is an opportunity for innovative procurement models that place the operational responsibilities on the technology and service providers. Although agri-processors are generally reluctant to enter into long-term contracts or water purchase agreements, a few poultry producers have successfully entered into water purchase agreements with project developers.
Access to finance: While a number of financing organisations are eager to provide funding for water projects, such funding is typically only for very large projects where the cost of feasibility studies and transaction costs can be recovered over the tenor of debt. Most large companies finance water projects off balance sheet, or access existing lines of credit (effectively unsecured), and prioritise projects with a payback period of less than three years (GreenCape analysis of companies in the WC). Intermediate and smaller companies often do not have the internal funds to finance water projects, nor do they have the internal capacity to procure such projects, and as such cannot motivate for access to finance water specific projects.
4.2. Municipal marketThe urban water and wastewater market is centered around municipalities, which are typically the Water Services Authorities and Providers for urban areas. In most cases, municipalities are supplied with raw or bulk water by the National Department of Human Settlements, Water and Sanitation or their local water boards. Information related to these entities is therefore included in this section as part of the broader municipal market value chain.
4.2.1. Market overviewGlobally, utilities accounted for 67% (~US$580 billion) of the water and sanitation (W&S) market in 2016, followed by the industrial sector (15% or ~US$130 billion; TIPS 2018, GWI data). In South Africa, municipalities represent a significantly larger and growing market for W&S technologies and services than the other urban markets. SA’s W&S annual capital and operational expenditure is projected to increase from ~US$7 bn (~R92 bn at 2018 exchange rate) in 2015 to ~US$12 bn (~R159 bn at 2018 exchange rate) in 2022 (TIPS 2018, GWI data), with municipalities accounting for a significant portion of this spend.
In 2017, DHSWS projected that ~R90 bn per annum for the next 10 years is required to provide adequate water and sanitation services. In 2018/19, the total budgeted expenditure for water and sanitation infrastructure was ~R39.4 bn (with and additional R10.7 bn allocated to water and sanitation services; Table 1), amounting to a shortfall of R38.9 bn. In addition, DHSWS estimates that a further R17 bn in funding was needed each year by municipalities to refurbish and upgrade existing W&S infrastructure (DWS
44 The Water Trading Entity was established by DWAF (later DWS and now DHSWS), and accountability for its functioning is vested in DHWSW. The core activities involve construction of new water resources and the rehabilitation and refurbishment of existing ones. Functions related to resources management include the management of water quality, water conservation, and the allocation of water through catchment management agencies to ensure sustainable water supply for both domestic and industrial use. Click here for more information: http://www.dwa.gov.za/NWRI/45 10 MLD and larger; according to data on WWTWs in the GreenDrop 2013 reports for each province.
2017a). Medium-term estimated budgets project that the funding gap will close somewhat in the next three years (to R26.5 bn by 2021/22).
The SA government’s 2019 budget committed to spending ~15.3% of public-sector infrastructure expenditure on W&S infrastructure over the next three years. During this period, 4 mega, 34 large and 295 regional bulk water and sanitation projects are planned to be completed (National Treasury 2019a). This grant funding will prioritise infrastructure investment for the 27 poorest district municipalities. The Water Trading Entity44 will receive a large portion of the total budget. The annual capital expenditure of the Water Trading Entity has increased by an average of ~5.9% (approximately inflation rate) over the previous four financial years. According to medium-term budgets this is set to increase by an average of 9.6% (i.e. higher than inflation) for the next three financial years, indicating an upward trend in capital expenditure (Figure 19).
Metropolitan municipalities account for the largest segment of the municipal market in SA. Approximately 87% of the total volume of municipal wastewater is treated by the largest 16% of WWTWs45, which are predominantly located in the metropolitan municipalities. Capital expenditure on W&S related projects by the eight metropolitan municipalities in SA was just over R5 bn in the most recent financial year (Figure 20), made up of a combination of grant, internal and loan financing. The average year-on-year increase between 2014/15 and 2017/18 was ~3% (less than inflation), with the exception being the City of Cape Town, where annual spend has increased by 14% or more in each of the financial years represented.
© GreenCape
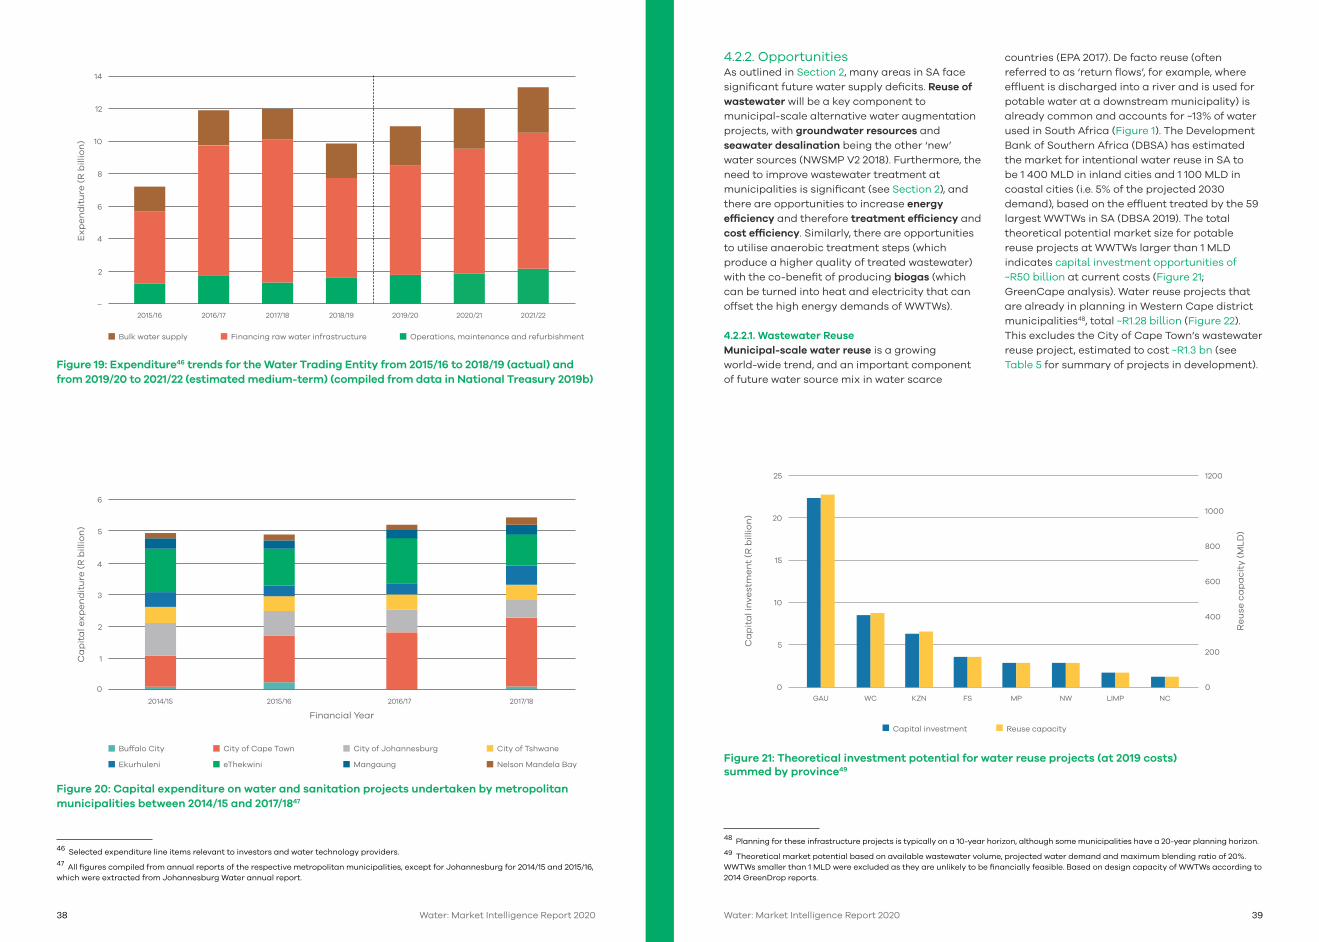
Water: Market Intelligence Report 2020 Water: Market Intelligence Report 202038 39
Figure 19: Expenditure46 trends for the Water Trading Entity from 2015/16 to 2018/19 (actual) and from 2019/20 to 2021/22 (estimated medium-term) (compiled from data in National Treasury 2019b)
Figure 20: Capital expenditure on water and sanitation projects undertaken by metropolitan municipalities between 2014/15 and 2017/1847
46 Selected expenditure line items relevant to investors and water technology providers.47 All figures compiled from annual reports of the respective metropolitan municipalities, except for Johannesburg for 2014/15 and 2015/16, which were extracted from Johannesburg Water annual report.
–
2
4
6
8
10
12
14
2015/16 2016/17 2017/18 2018/19 2019/20 2020/21 2021/22
Ex
pe
nd
itu
re (
R b
illio
n)
Bulk water supply Financing raw water infrastructure Operations, maintenance and refurbishment
0
1
2
3
4
5
6
2014/15 2015/16 2016/17 2017/18
Buffalo City City of Cape Town City of Johannesburg City of Tshwane
Ekurhuleni eThekwini Mangaung Nelson Mandela Bay
Ca
pit
al e
xp
en
dit
ure
(R
bill
ion
)
Financial Year
4.2.2. OpportunitiesAs outlined in Section 2, many areas in SA face significant future water supply deficits. Reuse of wastewater will be a key component to municipal-scale alternative water augmentation projects, with groundwater resources and seawater desalination being the other ‘new’ water sources (NWSMP V2 2018). Furthermore, the need to improve wastewater treatment at municipalities is significant (see Section 2), and there are opportunities to increase energy efficiency and therefore treatment efficiency and cost efficiency. Similarly, there are opportunities to utilise anaerobic treatment steps (which produce a higher quality of treated wastewater) with the co-benefit of producing biogas (which can be turned into heat and electricity that can offset the high energy demands of WWTWs).
4.2.2.1. Wastewater ReuseMunicipal-scale water reuse is a growing world-wide trend, and an important component of future water source mix in water scarce
48 Planning for these infrastructure projects is typically on a 10-year horizon, although some municipalities have a 20-year planning horizon.49 Theoretical market potential based on available wastewater volume, projected water demand and maximum blending ratio of 20%. WWTWs smaller than 1 MLD were excluded as they are unlikely to be financially feasible. Based on design capacity of WWTWs according to 2014 GreenDrop reports.
countries (EPA 2017). De facto reuse (often referred to as ‘return flows’, for example, where effluent is discharged into a river and is used for potable water at a downstream municipality) is already common and accounts for ~13% of water used in South Africa (Figure 1). The Development Bank of Southern Africa (DBSA) has estimated the market for intentional water reuse in SA to be 1 400 MLD in inland cities and 1 100 MLD in coastal cities (i.e. 5% of the projected 2030 demand), based on the effluent treated by the 59 largest WWTWs in SA (DBSA 2019). The total theoretical potential market size for potable reuse projects at WWTWs larger than 1 MLD indicates capital investment opportunities of ~R50 billion at current costs (Figure 21; GreenCape analysis). Water reuse projects that are already in planning in Western Cape district municipalities48, total ~R1.28 billion (Figure 22). This excludes the City of Cape Town’s wastewater reuse project, estimated to cost ~R1.3 bn (see Table 5 for summary of projects in development).
Figure 21: Theoretical investment potential for water reuse projects (at 2019 costs) summed by province49
0 0GAU WC KZN FS MP NW LIMP NC
Capital investment Reuse capacity
5200
10
400
15
600
20
800
25
1000
1200
Re
use
ca
pa
cit
y (M
LD
)
Ca
pit
al i
nve
stm
en
t (R
bill
ion
)

Water: Market Intelligence Report 2020 Water: Market Intelligence Report 202040 41
0 0Cape
WinelandsGarden Route
West Coast Overberg Central Karoo
Capital investment Reuse capacity
100
200
5
300
10
400
500
15
600
20
25
30
Ca
pit
al i
nve
stm
en
t (R
mill
ion
)
Re
use
ca
pa
cit
y (M
LD
)
Figure 22: Planned water reuse augmentation projects and estimated capital investment potential in Western Cape (WC) district municipalities50 (the City of Cape Town’s planned water reuse project, which is estimated to cost ~R1.3 bn, is not included here)
50 Data from planning documents (which are subject to change) from the Western Cape Department of Local Government for the 24 local municipalities in the Western Cape (aggregated by district municipality). The planning horizon for these projects is 10 years.
Table 5. Summary of current municipal scale projects (reuse, biogas/CHP) at various stages of development
City Detail Type of procurement Stage of procurement
REUSE PROJECTS
City of Cape Town Potable reuse (70 – 100
MLD)
EPC Design
Drakenstein Non-potable (industrial
water)
Likely PPP (BOT
concession)
Seeking council
approval
uMhlathuze wastewater services
Non-potable (industrial
water)
PPP Feasibility
eThekwini (Kwa-Mashu and Northern WWTWs)
– Likely PPP (with 20-year
BOOT concession)
Feasibility complete;
appointing
transactional advisor
BIOGAS / CHP51
City of Cape Town (3 centralised projects)
Sludge (dewatered)
from surrounding
WWTWs; and
commercial & industrial
organics in later phases
Possible BOO for
first phase
3 phases, to be
completed in next 10
years
OTHER
Sedibeng Water & Sanitation EPC Feasibility
Westonaria / Randfontein (Zuurbekom)
Water & Sanitation EPC Design
51 See Waste Market Intelligence Report 2020 (https://www.greencape.co.za/market-intelligence/) for more detail.
© GreenCape
EPC=Engineering, procurement, construction and commissioning
PPP= Public Private Partnership
BOOT=Build, operate, Own and Transfer
BOO=Build, Own and Operate
BOT= Build, Operate and Transfer

Water: Market Intelligence Report 2020 Water: Market Intelligence Report 202042 43
4.2.2.2. Biogas production at WWTWs South African WWTWs produce a large amount of sewage sludge (~632 749 tonnes in 2017; DEA 2018). Many WWTWs in SA already have anaerobic digesters (ADs), but these are in various states of disrepair, and where biogas (methane) is produced, it is flared (or just released into the atmosphere52). The opportunity to utilise this biogas by-product to offset the energy requirements of the WWTWs requires the implementation of combined heat and power (CHP) technology, and in many cases requires refurbishment of the existing ADs.
Sewage sludge from WWTWs provides relatively constant feedstock volumes and quality for ADs (unlike most commercial and industrial effluent). ADs have an average yield of ~35 m3 biogas per tonne of sewage sludge digested, which can be converted into ~70 kWh (SABIA 2016). Electricity generated from biogas could potentially replace ~40% to 100% of the electricity requirements of
52 Methane is a greenhouse gas that contributes to global climate change.53 Dependent on the quantity and/or composition of the sludge, process employed at each specific WWTW and the quality of biogas produced. The composition of sewage sludge is also dependent on the community that the WWTW services.54 Includes WWTWs with required essential infrastructure to produce biogas but may not necessarily be technically feasible or financially viable for CHP projects.55 WWTWs that will recover invested capital as well as operational and maintenance expenditure over the projected life cycle of ~15 years, through electricity cost savings.56 An indicative CAPEX cost for a biogas plant is R40 million/MW provided by industry experts.
the WWTWs. As a guideline, only WWTWs53 that have a capacity of 10 MLD or greater are likely to have financially viable biogas and CHP projects. In SA, 87 WWTWs plants have potential for biogas projects54, and of these 39 plants could have financially viable CHP projects55 (SABIA 2016; see Figure 23 for distribution between provinces), with a total investment opportunity of ~1.1 bn. The DHSWS in collaboration with the WRC is currently undertaking a full needs assessment of SA WWTWs, and is investigating additional revenue streams through sludge beneficiation (see 2020 Waste MIR), which will likely increase the number of financially viable projects. The City of Cape Town is currently developing biogas and CHP projects at three of the WWTWs. These three centralised sites are being designed to process sludge from all the surrounding WWTWs (thus increasing economies of scale), and are planned to be completed over the next 10 years(see Table 5 for details). 56
0 0FS EC NW LIMP
Capital investment Potential electrical power
10020 000
20040 000
60 000
300
80 000
400100 000
600
500 120 000
140 000
Ca
pit
al i
nve
stm
en
t (R
mill
ion
)
Po
ten
tia
l ele
ctr
ica
l po
we
r (M
Wh
/yr)
GAU WC KZN
Figure 23: Total investment cost of financially viable CHP projects at wastewater treatment plants aggregated by province56 (compiled from data in SABIA 2016)
© GreenCape

Water: Market Intelligence Report 2020 Water: Market Intelligence Report 202044 45
Figure 24: Indicative potential energy and cost savings from energy efficiency retrofits57 (efficient pumps and VSDs) in wastewater treatment plants in South African metros (compiled from data in SEA 2017)58
57 Assuming an average of 22% energy efficiency on the retrofits.58 Average energy charge for Eskom direct energy users in 2019/20 of 131.32 c/kWh was used to calculate the cost savings.
4.2.2.3. Energy efficiency opportunities in municipal water servicesThe operating cost of water boards in SA is expected to increase by 10.9% annually (well above inflation), mainly due to increased energy costs; other factors include increasing cost of chemicals, labour and price of raw water (National Treasury 2019a). At municipalities, the electricity costs related to bulk water and wastewater treatment works account for ~25% of the municipal electricity costs and ~17% of the total energy consumption in a typical SA metro (SEA 2017). In metropolitan municipalities specifically, the energy efficiency (EE) opportunities in WWTWs represent ~48% of the known electricity efficiency opportunities within the overall operations of a municipality (SACN, 2014). Energy savings of ~10 to 30% can be achieved through implementation of established technologies with payback periods of less than
five years (Feng et al. 2012). Improving existing pumps and pumping systems through optimisation, maintenance and matching using variable speed drives (VSDs), or upgrading to more energy efficient pumps, can result in energy savings of up to ~30% (SEA 2017). In processes that use aeration (e.g. activated sludge process), optimisation, and upgrading to energy efficient blowers and mixers can yield energy savings of up to ~50% (SEA 2017).
In metropolitan municipalities, the total estimated energy saving from these interventions is 358 460 MWh/year, which represents ~R216 million/year in cost saving (Figure 24). The capital investment in EE and energy optimisation technologies in metropolitan municipalities is estimated to be ~R1.1bn within metropolitan municipalities alone (based on an assumed five-year payback for these technologies).
0 0Cape Town
Johannesburg Mangaung EThekwini Ekurhuleni Nelson Mandela Bay
Tshwane
EE Cost Savings EE Electricity Savings
10
20
30
10 000
40
20 000
30 000
40 00050
60
7050 000
80 60 000
Co
st s
avi
ng
s (R
mill
ion
/ y
ea
r)
Ele
ctr
icit
y sa
vin
gs
(MW
h/y
ea
r)
© Bruce Sutherland (City of Cape Town)

Water: Market Intelligence Report 2020 Water: Market Intelligence Report 202046 47
The proposed ~16.5% escalation of end-user water tariffs in 2020 will contribute towards higher cost-recovery for water and wastewater services, and can improve municipal finances to enable further infrastructure investments.
4.2.3. Drivers Future water supply deficits (water security) as outlined in Section 2, is a key driver of water-related projects in the municipal market. While some regions in South Africa have potential for new surface water projects, others like the WCWSS have limited further surface water potential. Thus alternative water sources, such as reuse, groundwater, and desalination are the only viable options for increasing supply.
Project preparation support from national government to municipalities for water and wastewater infrastructure projects has increased. The Project Preparation Facility will be led by the DBSA (allocated R400 million) and supported by the Government Technical Advisory Centre (GTAC; allocated R60 million) and the Presidential Infrastructure Coordinating Commissions’ (PICC) Technical Project Management Unit (allocated R165 million). These units will prepare infrastructure projects by funding and facilitating technical and feasibility studies, increasing the pipeline of projects that can potentially be funded by direct foreign investments (DFIs) or private sector finance.
Waste and wastewater discharge regulations, such as the recent ban on the landfilling of liquid waste, are key drivers for biogas and resource recovery projects at WWTWs. In the Western Cape the imminent plan to divert organic waste from landfill (targeted 50% diversion by 2022 and 100% by 2027) is already a key driver. Many WWTWs currently dispose of sewerage sludge at landfills and will now need to find alternative ways to dispose of it. AD and biogas generation to power provide a financially viable option, since the beneficiation results in additional revenue and/or cost saving streams that can fund the required upgrades in infrastructure. However, currently these projects are only viable at WWTWs that are ~10 MLD or larger (roughly 17% of WWTWs). AD also results in a higher quality of treated effluent, which helps municipalities comply with standards for disposal. This could reverse the trend of increasing incidences of non-compliance and pollution of water resources linked to municipal WWTWs. Higher quality of treated effluent implies that water reuse projects require fewer further treatment steps, resulting in lower capital and operational costs for such projects.
59 Energy Security Master Plan – Electricity 2007-2025 by the Department of Minerals and Energy, can be accessed at https://www.gov.za/sites/default/files/gcis_document/201409/energysecmasterplan0.pdf 60 https://www.savingenergy.org.za/municipal-eedsm/
Furthermore, the 2017 amendment to Schedule 2 of the Electricity Regulation Act provides the policy and regulatory framework for municipalities to develop their own electricity generation, such as biogas and CHP projects. Increasing cost of electricity of ~27% over the next three years (Eskom 2019b) and raw water will enhance financial benefits of investing in energy efficiency technologies and more efficient water treatment technologies. In addition, escalating water tariffs for end users of ~16.5% in 2020 (SAGNA 2019) implies that municipalities will be in a better position to recover the cost of new infrastructure investments, as well as be eligible for private sector financing or PPPs, if the additional revenue is ring-fenced for water projects.
National, provincial and municipal water and energy strategies such as the NWSM V1 2019 and the Energy Security Master Plan (ESMP59) identified water reuse and energy efficiency as interventions to improve the country’s water and energy security, respectively. It implies that future grant funding and support for private sector funding to develop such projects will increase. The Energy Efficiency and Demand Side Management60 grant funding for municipalities is managed by the Department of Mineral Resources and Energy (DMRE). This fund can be applied to energy efficiency (EE) interventions at municipalities, including those at bulk and wastewater works (including smart meters, and all EE interventions). The total funding available in 2018/19 was approximately R200 million and is increasing every year.
Technology and service providers could assist capacity-constrained municipalities in applying for the grant, although there may be some challenges to this, as outlined below.
4.2.4. Barriers and risksWhile there are considerable opportunities for private sector investment in municipal-scale projects, there are also significant barriers, as set out below.
Municipal Finances. Municipalities together with Water Boards currently owe the DHSWS ~R9.8 billion. Municipalities alone owe Eskom more than R17 billion (DHSWS 2019; The Citizen 2019). Municipal-scale projects are capital intensive, and ability to access to funding can be a major constraint. Grant funding for infrastructure projects is limited (Section 2), and only a small number of municipalities have the capacity and financial standing to access private sector financing or procure infrastructure projects using PPPs (Figure 11).
Public perception (the “yuck factor”) and safety concerns regarding the reuse of treated wastewater for potable purposes represent one of the major barriers to these projects. Furthermore, the poor state of many WWTWs does not evoke trust in municipalities to operate existing services effectively. By extension, more complex reuse projects that pose a greater risk to the public health may encounter a lot of resistance. Contaminants of emerging concern (CECs), such as endocrine disruptors, pharmaceuticals, and personal care products in reclaimed potable water need to be addressed adequately in order to gain public support.
Negative perception regarding new technologies and services due to poorly developed business cases or poorly managed prior projects is a major barrier. Furthermore, in some cases engineering consultants are not prepared to carry the risk of recommending new technologies. Thus the designs provided to municipalities are based on tried and tested technologies, as they present less reputation risk for the consultant and less operational risk for the municipality.
61 For more information on PPPs, the Government Technical Advisory Centre (GTAC), which is an agency of National Treasury, provides a number of valuable resources, including guidelines and manuals for establishing PPPs. Visit: www.gtac.gov.za/Pages/mmg.aspx
Operational complexity often increases with new technologies, and most municipalities do not have the required skills to operate them effectively. Nationally, the ratio of civil engineering staff per 100 000 people is less than half of what is required to adequately plan, deliver, operate and maintain services, including water services (Lawless 2017). Such technical capacity constraints can hamper the procurement of new technologies, although it simultaneously provides an opportunity for the projects to be procured in ways where operational skills are part of the project procurement (e.g. PPP, BOT, BOOT).
Municipal procurement processes (as outlined in Section 3.3) can be lengthy. Tenders are often poorly specified, and unsolicited bids are typically not entertained. In addition, municipalities are hesitant to enter into Public Private Partnerships (PPP), which are relatively rare in the South African water sector, and can be complex and difficult to arrange61. Furthermore, procurement processes can hinder municipalities’ ability to trial innovative technologies. Municipalities often cite the Municipal Finance Management Act (MFMA) as prohibiting service-level agreements for contracts longer than three years, since the payback on many technologies is greater than three years. However, the MFMA does make provision for contracts longer than three years, although it requires additional steps to pass through council approval, including public participation.
Regulations such as the landfill ban of liquid waste and imminent landfill ban of saline wastes in 2021 (see Section 3.1.4), introduce risks and potential increased costs for brine management related to water reuse projects using technologies that produce brine, especially for inland municipalities. This also provides a simultaneous opportunity for cost-effective brine management solutions or technologies.

Water: Market Intelligence Report 2020 Water: Market Intelligence Report 202048 49
© Bruce Sutherland (City of Cape Town)
5Funding and Incentives
A range of general and sector-funding solutions and incentives is available to investors, manufacturers and service companies in the green economy.
It covers international sources, such as Development Finance Institutions (DFI), local funding pools including the public and private sector, and a considerable range of tax incentives.
5.1. General database web pageThe GreenCape Finance Desk hosts a web page62 with a number of Green Finance resources that cover funding and incentives available to companies in the green economy. A few of the available database are highlighted below.
5.1.1. Green Finance Database In conjunction with the South African National Energy Development Institute (SANEDI), GreenCape maintains a database of funding sources and primarily dti-driven incentives that may be relevant to green economy investors. The database contains information on more than 100 funding opportunities, including an overview of the opportunity and its contact details and links. It is ideal for any entity seeking a broad range of funding solutions and financial incentives, with South African institutions being the main source of opportunities. The database is available to view and download online63.
5.1.2. Government funding and incentives databaseAn updated document focused on South African government funding and incentives is available to view and download online64.
62 https://www.greencape.co.za/content/focusarea/green-finance-databases63 https://www.greencape.co.za/assets/Uploads/GreenCape-Finance-Database-v6.xlsx64 https://www.greencape.co.za/assets/Uploads/Government-Funding-and-Incentive-Booklet.pdf65 www.finfindeasy.co.za66 https://alliedcrowds.com/
5.1.3. Finfind database Finfind65 is an innovative online finance solution that brings together SME finance providers and finance seekers. With a focus on finance readiness, Finfind has more than 200 lenders and over 350 loan products available to SMEs. The database is ideal for South African SMMEs who are seeking funding and/or business advisory services, and those who want to improve their understanding of finance.
5.1.4. AlliedCrowds database AlliedCrowds66 is the first complete aggregator and directory of alternative finance providers in the developing world. Sign-up is free and allows users to access a global database where one can filter for sector (including greentech, agriculture and social impact), type of capital (equity, lending, grant), and type of funding (crowdfunding, angel investing, venture capital, impact investing). In addition:■ Themed databases around the Sustainable
Development Goals (SDGs) and the World Green Economy Organisation (WGEO) are available.
■ Reports, including a number specifically about African funding sources, can also be downloaded for free.
■ You can also contact Allied Crowds to create a customised funding database for you.
This resource is ideal for any entity seeking a broad range of financial solutions on a global scale.

Water: Market Intelligence Report 2020 Water: Market Intelligence Report 202050 51
The province provides businesses and investors with prime locations, modern infrastructure, a skilled workforce, low operational costs and an abundance of natural resources. It is also a sought-after place to live, with unrivalled natural beauty, vibrant culture, excellent schools and universities, and an outstanding quality of life. In 2017, Cape Town was ranked among the top 21 global investment destinations by Foreign Direct Investment (fDi) Intelligence, a division of the Financial Times.
A green economy business hubThere are compelling reasons why the Western Cape Province is viewed by many as Africa’s green economy hub. Coupled with a strong and rapidly growing market for green technology and services in South Africa and beyond, the Western Cape offers:
■ Africa’s renewable energy (RE) and cleantech hub, with a critical mass of leading companies present.
■ Local presence of major professional services and financiers.
■ Significant market opportunities for businesses and investors in agriculture, energy services, utility scale solar and wind, waste, water, bioeconomy and resource efficiency.
■ A supportive government that has made ease of doing business and the green economy key priorities.
■ Five universities with comprehensive R&D capabilities and dedicated green economy skills programmes.
■ A range of investment incentives in the Atlantis Special Economic Zone (SEZ) for Green Technologies.
Supporting businesses and investorsThe province also offers dedicated support for businesses and investors focusing on greentech and services, including:
InvestSA One Stop Shop: Offers convenient investor support on permits, licensing and registrations - all under one roof.
GreenCape: Provides dedicated support and market intelligence to green economy sectors.
Wesgro: The official investment and trade promotion agency for the Western Cape.
SAREBI: A business incubator providing non-financial support to green entrepreneurs.
SARETEC: Offers specialised industry-related and accredited training for the wind and solar industries.
Market opportunities in the provinceand South AfricaSome of the major market opportunity areas in the province and South Africa in the next five years are outlined in the graphic on the next page (see individual MIRs and the GreenCape website for more information).
R&D capabilities and skillsThe region’s five universities – University of Cape Town, Stellenbosch University, University of the Western Cape, the Cape Peninsula University of Technology and the George campus of the Nelson Mandela Metropolitan University – underpin all of this with comprehensive research and development (R&D) capabilities and dedicated green economy skills programmes.
6The Western Cape: Africa’s
green economy hubThe Western Cape is a world-class investment destination.
© Bruce Sutherland (City of Cape Town)

Water: Market Intelligence Report 2020 Water: Market Intelligence Report 202052 53
Atlantis Special Economic Zone for Green Technologies
The Atlantis SEZ is a zone dedicated to the manufacturing and provision of services in the green technology space - technologies that reduce or reverse the impact of people on the planet. Wind turbines, solar panels, insulation, biofuels, electric vehicles, materials recycling and green building materials are all examples of green technologies that will be welcomed to the zone.
The zone welcomes manufacturers, service providers, suppliers and other players in the value chains of different green technologies.
The SEZ is situated in the Atlantis industrial area north of Cape Town, south of Wesfleur, east of Dassenberg Road, and west of the Witsand community.
Why invest in the Atlantis SEZ?There are strong and growing South African and African markets for greentech. The South African greentech manufacturing market is worth at least R30bn; with a growing greentech market in the neighbouring countries. South Africa has opportunities in energy, waste, agriculture, transport and other sectors and is a great entry point for the SADC market.
Atlantis is a great location and development ready. 93 hectares of zoned City of Cape Town land is available for leasing to investors. Bulk infrastructure is in place and Atlantis has new public transport and shipping links and fibre connectivity. Atlantis is also close to major ports, roads, universities and greentech markets.
Investors have access to extensive investment support through the One Stop Shop for investor support and the rest of the investor support ecosystem, which includes InvestSA, GreenCape, the City of Cape Town, and Wesgro. Together the ecosystem provides information and advocacy; market intelligence; facilitated access to permits and licenses, planning and development approval; and skills training.
Investors and tenants are accessing attractive incentives in the form of tax relief and allowances, employment tax incentives, fast-tracked development approvals, fee exemptions and subsidies.
There is an attractive, wide-ranging skills base to recruit from with 5 universities and many more colleges in the province, and a large range of unskilled, semi-skilled, technical and professional candidates.
For more information, contact the SEZ’s: interim Chief Executive Officer, Pierre Voges [email protected]
© GreenCape

Water: Market Intelligence Report 2020 Water: Market Intelligence Report 202054 55
7GreenCape’s support to businesses and investors
GreenCape is a non-profit organisation that works at the interface of business, government and academia to identify and remove barriers
to economically viable green economy infrastructure solutions.Our vision is a thriving prosperous Africa, mobilised by the green economy.
Working in developing countries, GreenCape catalyses the replication and large-scale uptake of green economy solutions to enable each country and its citizens to prosper.
We work with businesses, investors, academia and government to help unlock the investment and employment potential of greentech and services, and to support a transition to a resilient green economy.
We assist businesses by removing barriers to their establishment and growth and provide our members with:■ free, credible and impartial market
information and insights■ access to networks of key players in
government, industry, finance and academia■ an advocacy platform to help create an
enabling policy and regulatory environment for green business
We assist local, provincial and national government to build a resilient green economy by providing:■ support on the development of standards,
regulations, tools and policies■ expert technical knowledge on key sectors in
the green economy■ access to networks of key players across
business, academia, and internationally
Since inception in 2010, GreenCape has grown to a multi-disciplinary team of over 40 staff members, representing backgrounds in finance, engineering, environmental science and economics.
Our market intelligence reports form part of a working body of information generated by sector desks and projects within GreenCape’s three main programmes – energy, waste and resources.
Figure 25 overleaf shows the different focus areas within each of our programmes.
Benefits of becoming a GreenCape memberWe currently have over 1 100 members, and offer free membership. Becoming a member of GreenCape will give you access to the latest information regarding developments in the various sectors; access to tools, reports, and project information; and offer you the opportunity – through our networking events – to meet and interact with various stakeholders in the green economy.
We have facilitated and supported R17bn of investments in renewable energy projects and manufacturing. From these investments, more than 10 000 jobs have been created. Through our WISP (industrial symbiosis) programme, by connecting businesses with waste / under- used resources, we have to date diverted nearly 63,000 tonnes of waste from landfill.
© Bruce Sutherland (City of Cape Town)

Water: Market Intelligence Report 2020 Water: Market Intelligence Report 202056 57
Renewable EnergyUtility-scale projects, localisation of component manufacturing, incentives & financing options, wheeling & energy trading.
Energy ServicesEnergy efficiency & embedded generation, alternative basic electrification, incentives & financing options.
Electric MobilityElectric vehicles & financing options.
Alternative Waste TreatmentMunicipal decision-making & policy & legislative tools on alternative waste treatment options; small-scale biogas, recycling & reuse (dry recyclables, construction & demolition waste).
Figure 25: GreenCape’s focus areas
Support through the International Cleantech NetworkGreenCape’s membership of the International Cleantech Network (ICN) gives our members access to international business opportunities in countries where other cleantech clusters are based (mainly Europe and North America).
Western Cape Industrial Symbiosis Programme (WISP)The team matches businesses to share unused resources, cut costs & create value. They also support entrepreneurs to identify & realise new business opportunities in the waste industry.
WaterWater provision & economic development; greentech opportunities for water use efficiency, treatment & reuse, business water resilience.
Sustainable AgriculturePrecision-, conservation- and controlled environment- agriculture; valorisation of wastes to high value bio- products, including bio-energy.
To become a member or to get your ICN passport, please contact GreenCape or visit our website: www.greencape.co.za
Our focus areas
Cle
an
&
Effi
cien
t ENERGY
Sustainable use of natural RESOURCES
Circu
lar
ECONOMY
1
3
5
7 2
6
1
2
3
4
5
6
7
4
© Markus Spiske Unsplash

Water: Market Intelligence Report 2020 Water: Market Intelligence Report 202058 59
© Bruce Sutherland (City of Cape Town)
8References
Cape Town Water Strategy - never waste a good crises. 2019. Michael John Webster. Presentation at public launch of Water Strategy, available at: http://resource.capetown.gov.za/documentcentre/Documents/Graphics%20and%20educational%20material/Water_Strategy_Launch_Presentation.pdf
City of Cape Town (CCT) 2018a. Water Outlook 2018 (updated May 2018). Available from: http://resource.capetown.gov.za/documentcentre/Documents/City%20research%20reports%20and%20review/Water%20Outlook%202018%20-%20Summary.pdf
City of Cape Town (CCT) 2018b. Water Strategy. Presentation given at the Section 80 committee meeting, November 2018.
Climate System Analysis Group (CSAG). 2019. Bix Six Monitor. Available from http://cip.csag.uct.ac.za/monitoring/bigsix.html
Department of Environmental Affairs and Development Planning (DEADP). 2014. Western Cape Climate Change Response Strategy. Cape Town, Western Cape Government. Available from https://www.westerncape.gov.za/text/2015/march/western_cape_climate_change_response_strategy_2014.pdf
Department of Environmental Affairs (DEA). 2018. South Africa State of Waste. A report on the state of the environment. Second draft report. Pretoria, Department of Environmental Affairs. Available from http://sawic.environment.gov.za/documents/9066.pdf
Department of Water and Sanitation (DWS). 2015. Support to the continuation of the water reconciliation strategy for the Western Cape water supply system: status report. October 2015. Pretoria, South African Government.
Department of Water and Sanitation (DWS) and Strategic Water Partners Network (SWPN). 2015. “2015 No Drop Report First order assessment of water loss, water use efficiency and non-revenue water in municipalities.
Department of Water and Sanitation (DWS) 2017a. Strategic overview of the water sector in South Africa 2017. Pretoria, South African Government.
Department of Water and Sanitation (DWS) 2017b. Benchmarking of water loss, water use efficiency and non-revenue water in South African municipalities (2004/05 to 2015/16). PEP: WP11084 (WP11047 – PEP4). Pretoria, South African Government.
Department of Water and Sanitation (DWS). 2018. The support for the Implementation and maintenance of the water reconciliation strategy for the Western Cape Water Supply System, Final Annual Report (November 2018).
Department of Water and Sanitation (DWS). 2019. The national water and sanitation master plan, Final report (November 2019). Pretoria, South African Government. Available from:https://www.gov.za/sites/default/files/gcis_document/201911/national-water-and-sanitation-master-plandf.pdf
Department of Human Settlement, Water and Sanitation (DHSWS) 2019. Approved domestic & industrial raw water tariffs 2019/20. Pretoria, South African Government. Available from: http://www.dwa.gov.za/Projects/WARMS/Revenue/Copy%20of%20APPROVED%20WRI%20TARIFFS%202019-20%20FY%20%20INTERNET.pdf
Development Bank of South Africa (DBSA) 2019. Programmatic and funding approach to establishing water reuse infrastructure as a new asset class in South Africa. Johann Lübbe, DBSA (at WISA water reclamation and reuse symposium September 2019, Gauteng).
Donnenfeld, Zachary.; Crookes, Courtney; Hedden, Steve. 2018. A delicate balance: water scarcity in South Africa. Institute for Security Studies.
Environmental Protection Agency 2017. Potable Reuse Compendium 2017. United States Environmental Protection Agency.

Water: Market Intelligence Report 2020 Water: Market Intelligence Report 202060 61
Eskom 2019a. Eskom schedule of standard prices 2019/20, 1 April 2019 to 31 March 2020 for non-local authority supplies, and 1 July 2019 to 30 June 2020 for local authority supplies. Revision 1. Available from: http://www.eskom.co.za/CustomerCare/TariffsAndCharges/Documents/Eskom%20schedule%20of%20standard%20prices%202019_20%20Rev00%20%28full%20version%20excl%20Transflex%29.pdf
Eskom 2019b. The 2019/20 Nersa-approved price increase. Available from: http://www.eskom.co.za/CustomerCare/TariffsAndCharges/Documents/Connect%202019_20.pdf
Global Water Intelligence (GWI). 2012. Water for Food and Beverage. Available from: https://www.globalwaterintel.com/client_media/uploaded/Food%20&%20Beverage/Water_for_F&B_sample%20chapter.pdf
Jacobs, Darryl. 2017. Presentation to agricultural stakeholders; update on the disasters (natural and biological) in the agricultural sector in the Western Cape Province. Cape Town, Western Cape Government.
Jacobs, H.E., Geustyn, L.C., Loubser B.F. 2006. Water – How it is used at home. CEs Consulting Engineers. Stellenbosch, South Africa.
Lawless, Allyson. 2017. Numbers and needs in local government – where are we now? Civil Engineering, January/February 2017: pp 15-26.
McKinsey and Company. 2010. Confronting South Africa’s water challenge. www.mckinsey.com/business-functions/sustainability-and-resource-productivity/our-insights/confronting-south-africas-water-challenge
MSCI 2018. Insights for performance: IPD Annual Green Property Index. Presentation by Phil Barttram.
National Business Initiative (NBI) 2019: Water PPP Opportunities in South Africa. https://www.nbi.org.za/wp-content/uploads/2019/05/NBI_KYM-Report-4_Water-PPP-Opportunities.pdf
National Treasury 2017: Preferential Procurement Policy Framework Act, No 5 of 2000. Preferential Procurement Regulations, 2017. Available from: www.dti.gov.za/economic_empowerment/docs/PPPFA%20Regulation.pdf
National Treasury 2019: Budget Estimates and Expenditure vote 36: Water and Sanitation. Available from http://www.treasury.gov.za/documents/National%20Budget/2019/enebooklets/Vote%2036%20Water%20and%20Sanitation.pdf
Quantec 2017. Regional Output and GVA at basic prices by industry and 2011 local municipal/ward-based metro region level 1993-2016 (v2 18Aug17), Online: Quantec.co.za.
Quantec 2018a. Gross Fixed Capital Formation. Online: Quantec.co.za.
Statistics South Africa (Stats SA). 2016a. GHS Series Volume VIII: Water and Sanitation, In-depth analysis of the General Household Survey 2002-2015 and Community Survey 2016 data.
Statistics South Africa (Stats SA). 2018a. Manufacturing volume and sales from 1998. Retrieved August 2018
Statistics South Africa (Stats SA). 2018b. Quarterly financial statistics of municipalities; March 2018. www.statssa.gov.za/publications/P9110/P9110March2018.pdf
The South African Government News Agency. 2019. Department consults stakeholders on water tariffs increase. Available from: https://www.sanews.gov.za/south-africa/department-consults-stakeholders-water-tariffs-increase
Trade & Industrial Policy Strategies (TIPS). 2018. Global water and sanitation market dynamics: Implications for South Africa’s industrial development.
Toxopeüs, Michelle. 2019. The state of sanitation and wastewater treatment services in South Africa. Helen Suzman Foundation (part of research projects financed by the Friedrich Naumann Foundation). Available from: https://hsf.org.za/publications/hsf-briefs/the-state-of-sanitation-and-wastewater-treatment-services-in-south-africa
Van Lin, M., Van den Bos, A., Sterras, N. 2018. The Current State of Fruit & Vegetable Agri-Processing in South Africa: Challenges and Opportunities. Netherlands Enterprise Agency. Available from: https://agbiz.co.za/uploads/AgbizNews19/190215_Current-state-of-agro-processing-in%20SA.pdf
Water Research Commission (WRC). 2010. A first order inventory of water use and effluent production by SA industrial, mining and electricity generation sectors. WRC Report No. 1547/1/10.
World Economic Forum. 2019. Global risks of highest concern. Available from: http://reports.weforum.org/global-risks-2019/survey-results/global-risks-of-highest-concern-for-doing-business-2019/
World Resources Institute (WRI). 2015. Aqueduct projected water stress country rankings. Available from: https://goo.gl/o4UrqN

The writing of this MIR was made possible with the generous support of the Western Cape Government of South Africa.