Embed Size (px)
Citation preview
Waste Management and ‘Take-Back’ Processes in a Dedicated Shopping Centre
Results from the WestQuay shopping centre Managers Survey
Maria Triantafyllou (PhD student) Dr Tom Cherrett (Lecturer)
April 2010
Transportation Research Group School of Civil Engineering and the Environment
University of Southampton
i
Table of Contents
List of Figures ..................................................................................................... iii List of Tables ........................................................................................................ v Acronyms ............................................................................................................. vi Glossary... ............................................................................................................ vii Chapter 1: Introduction ...................................................................................... 1 Chapter 2: Retail Waste Logistics in the U.K. .................................................. 2 Chapter 3: Legislation impacting on Retail Waste Logistics ........................... 4
3.1 Waste Framework Directive [2008/98/EC] and European Waste Catalogue ...... 4 3.1.1 ‘The Duty of Care’. A Code of Practice (S.34, EPA 1990) ........................ 4 3.1.2 Environmental Act 1995.............................................................................. 5
3.2 Landfill Directive [1999/31/EC] and Pre-treatment Requirements ..................... 5 3.2.1 Landfill (England and Wales) (Amendment) Regulations 2005 ................. 5
3.3 Directive on Packaging and Packaging Waste Directive [1994/62/EC] .............. 6 3.3.1 The Packaging (Essential Requirements) Regulations [2003/1941/SI] ...... 6 3.3.2 The Producer Responsibility Obligation (Packaging Waste) Regulations
2007............................................................................................................. 6 3.4 Hazardous Waste Directive [91/689/EEC] .......................................................... 7
3.4.1 Hazardous Waste (England and Wales) Regulations 2005 ......................... 7 3.4.2 Clinical Waste ............................................................................................. 8
3.4.2.1 ‘07-01: Safe Management of Healthcare Waste’ - Environment and Sustainability Health Technical Memorandum ................................... 8
3.4.2.2 ‘07-06: Disposal of Pharmaceutical Waste in Community Pharmacies’ – Environment and Sustainability Health Technical Manual ................................................................................................. 8
3.5 Waste Electrical and Electronic Equipment Directive (WEEE) [2002/96/EC] and Restriction of Hazardous Substances Directive (RoHS) [2002/95/EC] ........ 8 3.5.1 UK WEEE (Amendment) Regulations 2007 (SI No.3454) ........................ 9
3.6 Batteries, Accumulators and their Wastes Directive [2006/66/EC] .................. 10 3.6.1 Batteries and Accumulators (Placing on the Market Regulations) 2008 .. 10 3.6.2 The Waste Batteries and Accumulators Regulations 2009 ....................... 10
3.7 Energy Efficiency Requirements for Ballasts for Fluorescent Lighting Directive [2000/55/EC] ...................................................................................................... 11 3.7.1 Energy Efficiency (Ballasts for Fluorescent Lighting) Regulations
[2001/3316/SI] .......................................................................................... 11 3.8 EC Animal By-Products Regulation - Guidance on Cooking Oil
[2002/2774/EC] .................................................................................................. 11 3.8.1 Animal By-Products Regulations England [2347/2005] ........................... 11
Chapter 4: Case Study: WestQuay Shopping Centre .................................... 12
4.1 WestQuay Business Profile ................................................................................ 13 4.2 Hammerson’s Guide and Requirements on Tenants Sustainability ................... 14 4.3 WestQuay’s Environmental Policy .................................................................... 14
4.3.1 Energy Saving ........................................................................................... 14
ii
4.3.2 Sustainable Waste Management ................................................................ 15 4.3.3 Sustainable Water Usage ........................................................................... 15 4.3.4 Sustainable Visitors Travel........................................................................ 15
4.4 Waste generation at WestQuay .......................................................................... 16 4.5 WestQuay’s Operational Plan for on-site Waste Management .......................... 19 4.6 Local and Regional Development ...................................................................... 20
Chapter 5:Interviews with WestQuay Retailers .............................................. 22
5.1. Data Collection Plan ......................................................................................... 22 5.1.1 Questionnaire Design and Administration ................................................ 22 5.1.2 Response Rate ........................................................................................... 22
5.2 Waste Logistics Management Practices ............................................................. 24 5.3 Waste Generation ............................................................................................... 26
5.3.1 Waste Types Produced .............................................................................. 26 5.3.2 Hazardous Waste Produced ....................................................................... 28
5.3.2.1 WEEE Take-Back ............................................................................... 30 5.3.3 Waste Storage Location ............................................................................. 30 5.3.4 Waste Packaging ....................................................................................... 32
5.3.4.1 In-store Waste Storage Devices ......................................................... 32 5.3.4.2 Re-usable Packaging ......................................................................... 37
5.3.5 Waste Production (by number of packaging units) ................................... 38 5.3.5.1 Seasonal Variation in Waste Generation .......................................... 39 5.3.5.2 Disposable Packaging Items .............................................................. 40 5.3.5.3 Filled Packaging Items ...................................................................... 42
5.3.6 Waste Production (by litres capacity) ........................................................ 43 5.3.7 Waste Collections ...................................................................................... 46
5.3.7.1. Waste Collectors ............................................................................... 46 5.3.7.2 Collection Vehicles ............................................................................ 48 5.3.7.3. Frequency of Collections .................................................................. 49 5.3.7.4 Types of Collection Services .............................................................. 50 5.3.7.5 Destination of Collected Waste ......................................................... 51
5.4 Factors affecting Recycling Performance .......................................................... 56 5.5 Sharing Services................................................................................................. 57
Chapter 6: Key Findings ................................................................................... 58 References ........................................................................................................... 60
iii
List of Figures Figure 1: WestQuay’s setting in Southampton city centre .......................................... 12 Figure 2: WestQuay’s catchment ............................................................................. 12 Figure 3: Monthly waste tonnage produced in WestQuay and monthly waste tonnage
diverted from landfill. ............................................................................ 16 Figure 4: Waste Management Characteristics (%) for WestQuay. .............................. 17 Figure 5: Monthly tonnage of recycled/recovered waste materials produced in
WestQuay from January 2006 to August 2008. ........................................ 18 Figure 6: WestQuay’s floor plan indicating the location of the 3 service yards and the
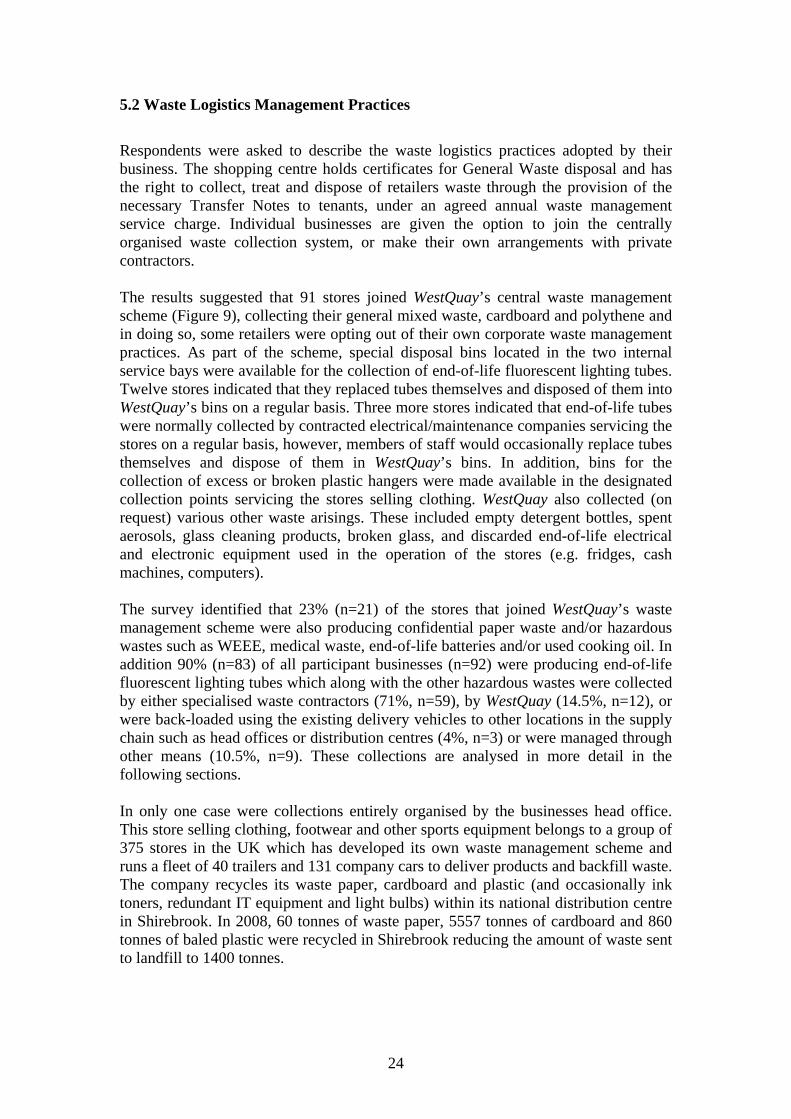
28 internal waste collection points .......................................................... 19 Figure 7: WestQuay’s extension plans ...................................................................... 20 Figure 8: IKEA’s setting next to WestQuay’s site ..................................................... 21 Figure 9: Organisation of individual stores waste collections in WestQuay. ............... 25 Figure 10: Waste management systems used by businesses operating in WestQuay. ... 25 Figure 11: Waste types produced by different business types operating in WestQuay. 26 Figure 12: Percentage of separate and non-separated waste collections in WestQuay. . 27 Figure 13: Separate collections of mixed paper produced by businesses operating in
WestQuay. ............................................................................................. 27 Figure 14: Separate collections of polythene produced by businesses operating in
WestQuay. ............................................................................................. 28 Figure 15: Hazardous waste produced by different business types operating in
WestQuay. ............................................................................................. 29 Figure 16: Hazardous waste produced by different business types operating in
WestQuay. ............................................................................................. 29 Figure 17: WEEE take-back services offered by businesses selling electronics in
WestQuay. ............................................................................................. 30 Figure 18: Storage location of waste produced by businesses operating in WestQuay. 31 Figure 19: Location of bins at stores in WestQuay. ................................................... 32 Figure 20: Examples of equivalent bin sizes used by businesses operating in WestQuay.
(These illustrations may not relate to the actual bins used) ....................... 33 Figure 21: Quantities of large/medium/small bins used by businesses operating in
WestQuay. ............................................................................................. 34 Figure 22: Examples of recycling waste sacks used by retailers operating in WestQuay.
(These illustrations may not relate to the actual sacks used) ...................... 35 Figure 23: Typical roll-pallet cages used for the collection of recycling bags and
flattened cardboard boxes produced by retailers operating in WestQuay ... 35 Figure 24: Examples of recycling boxes used for batteries, WEEE, fluorescent tubes
and medical waste collection used by retail outlets. .................................. 36 Figure 25: Example of barrel used by catering units for the recycling of used cooking
oil. ........................................................................................................ 36 Figure 26: Types of re-usable and non re-usable food containers used by catering units
operating in WestQuay. .......................................................................... 37 Figure 27: Types of re-usable and non re-usable cardboard boxes used by retailers
selling paintings, footwear, clothing and other products in WestQuay. ...... 38 Figure 28: Types of re-usable packaging units used by retailers operating in WestQuay
to ship clothing. ..................................................................................... 38
iv
Figure 29: Busy months in terms of increases in waste produced by businesses operating in WestQuay by more than 50%. .............................................. 39
Figure 30: Percentage of WestQuay stores by business types stating busy months in terms of waste production. ...................................................................... 39
Figure 31: Number of packaging units/week used for the collection of waste produced by businesses operating in WestQuay. ..................................................... 40
Figure 32: Breakdown of waste types per packaging units produced by businesses operating in WestQuay. .......................................................................... 40
Figure 33: Monthly variation in number of packaging units used for the collection of waste produced by businesses operating in WestQuay. ............................. 41
Figure 34: ANOVA test for polythene/plastic, cardboard, paper and general mixed waste packaging items produced by businesses operating in WestQuay. .... 41
Figure 35: Packaging units delivered during a week by different business types operating in WestQuay. .......................................................................... 42
Figure 36: Breakdown of re-usable and non re-usable packaging units used by different business types operating in WestQuay. .................................................... 43
Figure 37: Breakdown of waste types per volumes estimated to be produced by businesses operating in WestQuay. .......................................................... 43
Figure 38: Breakdown of waste types per volumes estimated to be produced by businesses operating in WestQuay. .......................................................... 44
Figure 39: Monthly commercial activity in terms of deliveries received by businesses operating in WestQuay. .......................................................................... 45
Figure 40: Satisfaction with the waste storage facilities used by businesses operating in WestQuay. ............................................................................................. 45
Figure 41: Type of waste collector by waste type produced by retailers operating in WestQuay. ............................................................................................. 47
Figure 42: Type of vehicle collecting packaging/waste/recyclate on a dedicated collection contract for businesses operating in WestQuay. ........................ 48
Figure 43: Type of vehicle back-loading packaging/waste/recyclate produced by businesses operating in WestQuay. .......................................................... 48
Figure 44: Types of collection services provided to businesses operating in WestQuay.50 Figure 45: Types of fluorescent lighting tubes and WEEE and batteries collection
services provided to businesses operating in WestQuay. ........................... 51 Figure 46: Map presenting all the locations where collected hazardous and confidential
waste produced by businesses operating in WestQuay is transferred to. ..... 52 Figure 47: Map presenting destinations of product returns from businesses operating in
WestQuay. ............................................................................................. 53 Figure 48: Map showing the destinations of packaging returns from businesses
operating in WestQuay. .......................................................................... 54 Figure 49: Map showing the origins of the deliveries received by businesses operating
in WestQuay. ......................................................................................... 55 Figure 50: Factors affecting the recycling performance of businesses operating in
WestQuay. ............................................................................................. 56 Figure 51: Level of interest for sharing services with other businesses operating in
WestQuay. ............................................................................................. 57
v
List of Tables
Table 1: National and Business specific recycling targets under the Producer Responsibility Obligation (Packaging Waste) Regulations 2007 ...................... 6
Table 2: Business Classification under the ‘UK Standards Industrial Classification of Economic Activities – SIC 2007’ Code. (n = sample) ................................... 13
Table 3: Survey response rate of businesses operating in WestQuay (n = sample) ........ 23 Table 4: Average ‘bin’ units per retail units for business types operating in WestQuay. 33 Table 5: Waste collectors of hazardous and confidential waste produced by businesses
operating in WestQuay. ................................................................................ 47 Table 6: Weekly frequency of dedicated and back-loaded collections of specialised
waste/recyclate produced by retailers operating in WestQuay. ........................ 50
vi
Acronyms ABP Associated British Ports AC Alternating Current BBC British Broadcasting Corporation BERR Business Enterprise and Regulatory Reform BPEO Best Practicable Environmental Option Ca Cadmium CE Conformite Europeenne DC Direct Current DfT Department for Transport EA Environment Agency EC European Commission EEE Electrical and Electronic Equipment EMS Environmental Management Standards EPA Environmental Protection Act EPR Extended Polluter Responsibility EU European Union EWC European Waste Catalogue GIC Global Investment Company IKEA Ingvar Kamprad Elmtaryd Agunnaryd ISO International Organisation for Standardisation IT Information Technology JL John Lewis LoW List of Wastes MRF Materials Reprocessing Facility M&S Marks and Spencer PhD Doctor of Philosophy RoHS Restriction of Hazardous Substances SI Statutory Instrument SIC Standards Industrial Classification TRG Transportation Research Group UK United Kingdom WEEE Waste Electrical and Electronic Equipment
vii
Glossary ‘Ballast’ (light) is an electrical device for starting and regulating fluorescent and discharge lamps. ‘Best Practicable Environmental Option (BPEO)’ emphasises the protection and conservation of the environment across land, air and water. The BPEO procedure establishes for a given set of objectives, the option that provides the most benefits or the least damage to the environment, as a whole, at acceptable cost, in the long term as well as in the short term. ‘Busy Periods in terms of Waste Production’ are considered to be the periods during which waste production increases by more than 50% when compared to the production rates during standard periods. ‘Catering Waste’ is all waste food including used cooking oil originating from restaurants, catering facilities and kitchens including central kitchens and household kitchens (excluding sandwich making kitchens). Raw meats are also included. ‘Clinical Waste’ is any waste which poses a threat of infection to humans (e.g. human or animal tissue, blood or other bodily fluids, drugs or other pharmaceutical products, syringes, needles or other sharp instruments). ‘Consignee’ (in the context of hazardous waste) is considered to be any hazardous waste receiver. ‘Controlled Waste’ means waste from households, commerce or industry and includes hazardous/special wastes. ‘Corrosive’: substances and preparations which may destroy living tissue on contact. ‘Cytotoxic and Cytostatic Medicines’ are medical products that have one or more of the following hazardous properties: toxic, carcinogenic, mutagenic, or toxic for reproduction. ‘Duty of Care’ is a legal obligation imposed on an individual requiring that they adhere to a standard of reasonable care whilst performing any acts that could foreseeably harm others. With regard to waste it applies to anyone who is a ‘holder’ of ‘controlled waste’. ‘Explosive’: substances and preparations which may explode under the effect of flame or which are more sensitive to shocks or friction than dinitrobenzene. ‘Flammable’: liquid substances and preparations having a flash point equal to or greater than 21 °C and less than or equal to 55 °C. ‘Hazardous Waste’ is any waste that has properties that may make it harmful to human health or the environment. ‘Healthcare Waste’ is waste from natal care, diagnosis, treatment or prevention of disease in humans/animals (e.g. infectious/anatomical/sharps/medicinal waste, laboratory cultures/chemicals, offensive/hygiene waste from wards or other health care areas). ‘Holder’ means a person who imports, produces, carries, keeps, treats, or disposes of ‘controlled waste’ or, as a broker, has control of it.
viii
‘Infectious Waste’ means all substances containing viable micro-organisms or their toxins which are known or reliably believed to cause disease in man or other living organisms". ‘Oxidizing’: substances and preparations which exhibit highly exothermic reactions when in contact with other substances, particularly flammable substances. The ‘Polluter Pays’ principle is an environmental policy principle which requires that the costs of pollution be borne by those who cause it. It is also known as ‘Extended Polluter Responsibility (EPR)’ which seeks to shift the responsibility of dealing with waste from governments and society to the entities producing it. In effect, it internalises the cost of waste into the cost of the product, meaning that the producers will improve the waste profile of their products, thus decreasing waste and increasing the possibilities for reuse and recycling. ‘Primary’ or ‘Sales Packaging’ forms a sales unit for the user or final consumer. ‘Producer’ means anyone whose activities produce waste or who carries waste or carries out pre-processing, mixing or other operations resulting in a change in its nature or composition. ‘Producer Responsibility’ is a policy tool aimed at ensuring that businesses who place products on the market take the responsibility for those products once they have reached the end of their life. ‘Retail Waste’ includes all products other than waste from an on-site restaurant. Any raw or lightly cooked meats or raw eggs and their packaging are covered. ‘Secondary’ or ‘Grouped Packaging’ contains a number of sales units. ‘Tertiary’ or ‘Transport Packaging’ is used to group secondary packaging together to aid handling and transportation and prevent physical handling and transport damage to the units. ‘Trade Waste’ has been defined as ‘the commercial element of municipal waste’ and covers the waste products produced by retail establishments, offices, hotels and restaurants. A ‘Typical Week’ is one not falling during the peak business periods of the year. ‘Waste’ is defined under the [75/442/EEC] as amended by directives [91/156/EEC] and [91/692/EEC] as any substance or object which the producer or the person in possession of it discards or intends or is required to discard. ‘Waste Broker’ means any person that arranges the transfer of waste between a ‘producer’ and a ‘waste manager’ to such an extent that he/she controls what happens to the waste, or is taking responsibility for the legality of the arrangement. ‘Waste Carrier’ means any person for authorised transport purposes of ‘controlled waste’. ‘Waste Cooking Oil’ otherwise known as ‘used cooking oil’ or ‘recovered vegetable oil’ results from the cooking of food by food manufacturers and catering establishments such as restaurants and industrial kitchens.
1
Chapter 1
Introduction This report forms part of a wider piece of a PhD research, linked to module 10 of the ‘Green Logistics Project’ (www.greenlogistics.org). The aim of the study is to investigate the feasibility of implementing more collaborative approaches to waste/recyclate and returns collections using the established returns networks, largely used in isolation by the various businesses and associated supply chains in a dedicated shopping centre. The results are being used to develop a logistics assessment model to quantify the collective environmental impacts of current reverse logistics activities and assess the potential benefits of more collaborative operating scenarios. To this end, this research project uses WestQuay shopping centre located in Southampton UK as a case study example to provide a detailed picture of the issues impacting on the logistics and environmental footprint of retailers operating out of a dedicated shopping centre. This report provides insights into the environmental strategy developed by the landlord company and a number of legislative and operational issues impacting on retailer waste management performance. Qualitative and quantitative data provided by WestQuay’s management company and collected through interview surveys with 96% of the retailers (n=92) operating in the shopping centre have helped to identify the logistics implications of current waste management activities and possible methods for reducing the freight transport footprint. This report aims to:
Provide a general overview of retail waste logistics in the UK. Understand how current legislation influences ‘recyclate’ generation and
waste management. Using a dedicated shopping centre as a case study example:
- Provide a description of the corporate environmental strategy in place, - Provide an overview of the waste management activities and resources
utilised by the management company to manage certain types of waste. - Describe the data collection plan developed to survey retailers operating in
WestQuay. - Identify the type of recyclables currently produced and quantify their
volumes. - Quantify the frequency of waste collections. - Review the collection and disposition methods employed. - Identify the associated waste contractors currently used. - Compare current practices employed among different business types and
identify best practice examples in ‘recyclate’ and waste management. This research has been made possible through the kind co-operation of Hammerson and the staff and retailers at West Quay Southampton. The views expressed in this report are those of the author’s.
2
Chapter 2
Retail Waste Logistics in the U.K. Waste logistics is an integral component of sustainable supply chains, and currently taking more precedence in the retail agenda as a result of increasing environmental awareness, heightened customer expectations and pressures on the bottom line. Regulatory-driven in Europe, profit-driven in North America or still incipient in many other countries, reverse logistics decisions including freight consolidation, mode and carrier selection, materials handling and back-haul management have a direct impact on supply chain configurations and performance. With few retailers seemingly co-ordinating their waste logistics, sub-optimally loaded delivery vehicles coupled to a general lack of waste/recyclate back-hauling out to the points of disposal, result in unnecessary handling and associated increases in vehicle traffic (Shakantu et al, 2002). In the UK, the retail sector, including community shopping centres, department stores, out-of-town developments and retail parks produces an estimated 12.7 million tonnes of waste annually (Envirowise, 2002). According to the Environmental Agency (2004), 48% of the commercial waste ends up in landfills with the main commercial waste stream consisting of packaging and solids (Envirowise, 2007). A 2003 survey conducted on businesses operating in Cardiff city centre identified 143 different waste streams including paper and cardboard, plastic, glass, wood and biodegradable kitchen and canteen waste (Keep Wales Tidy, 2003). Cutting out waste generation in retail activities has become central due to pressures exerted by the government to fulfil European Union (EU) targets. Based on the ‘Producer’s Responsibility’ concept which imposes a ‘Duty of Care’ on anyone that imports, treats or disposes of waste, a series of European directives have been transposed into the national regulatory framework aiming to reduce the amount of waste ending up in landfill, while promoting recycling and re-use practices. In 2007, the U.K. government issued the ‘Waste Strategy for England 2007’ to map out the direction over the medium and long term for waste management. Its aim was to create incentives that reflect the waste hierarchy and to create opportunities for the reduction, re-use, and recycling of waste, and recovery of energy from waste. On the basis of the policies set out, the levels of commercial waste landfilled are expected to fall by 20% by 2010 compared to 2004. In England, typical waste disposition routes include recycling, reuse, incineration and land filling. The recycling industry in the UK is continually developing and as of 2007 included 125 electronic and precious metal recyclers, 52 fridge re-processors, 59 glass and cullet merchants and processors, 683 metal merchants, 279 paper and board recyclers, 217 plastic processors, 92 textile merchants and 136 wood waste processors (Richards et al, 2007). Therefore, a wide range of local, regional and national opportunities exist to manage waste affordably, that also meet the exacting legislative requirements. Commercial waste is collected by contractors, local authorities or through other routes e.g. in-house management (Cherrett et al, 2007). Waste contractors may be national
3
concerns (e.g. BIFFA, Veolia, Serco, Sita, Onyx) or local companies, offering flexible services at competitive prices, with larger retailers sometimes using several different contractors to service their needs. Third party contractors can operate in a number of different ways offering dedicated/exclusive, shared, specialized, occasional, transit-only and/or multi-client services (Rushton et al, 2001). Although some retailers have made great strides in terms of minimising their waste generation and maximising their recyclate recovery, the sector as a whole shows a steady increase in total commercial waste production, currently at 3% per annum (Cheeseman, 2002). Alternative disposition routes can often add to the overall transport burden associated with waste logistics which could be mitigated if back-loading was more widely adopted (only 40% of trucks are full according to some industry estimates, Shore 2006). The ‘WEEE Directive’, enacted in the UK in 2007, is expected to create an additional 100,000 vehicle movements a year (Bernon, 2005) which can be translated into millions of additional running kilometres, considering the general lack of local markets and uncoordinated collection systems currently employed. The current situation calls for a more co-ordinated approach to managing return waste flows to better make use of the existing channels and maximise recyclate generation. This could be achieved through the promotion of synergistic alliances between retailers.
4
Chapter 3
Legislation impacting on Retail Waste Logistics The retail sector is bound by several pieces of European legislation transposed into national laws and regulations. The legislation imposes a ‘Duty of Care’ on commercial premises to make satisfactory arrangements for their waste management and places a ‘Producer’s Responsibility’ on retailers based on the ‘Polluter Pays’ principle, requiring the set-up and management of recyclate and material take-back schemes. 3.1 Waste Framework Directive [2008/98/EC] and European Waste Catalogue
The ‘Waste Directive’ aims to ensure that all necessary measures will be taken ensuring that waste is recovered or disposed of without endangering human health and without using processes/methods that could harm the environment. Currently, the initial 1975 version of the directive is transposed into UK law through the ‘Environmental Protection Act 1990’ and the ‘Environmental Act 1995’. The directive was revised in November 2008 but its transposition into UK law will not be completed until December 2010.
3.1.1 ‘The Duty of Care’. A Code of Practice (S.34, EPA 1990) Under the ‘Duty of Care’, businesses as ‘waste producers’ have the legal responsibility to ensure that ‘controlled waste’ is stored, treated and disposed of properly. Retailers should ensure that they:
Pack waste safely in proper containers, prevent the mixing of incompatible wastes, ensure the health and safety of all their employees/other persons that may be affected by waste use, handling, storage or transport actions and put waste out for collection near the advertised collection times,
Transfer waste to an ‘authorised person’: - Registered: waste ‘holders’ such as ‘waste carriers’ or ‘waste brokers’
registered with the Environmental Agency, or - Exempt: charities, voluntary organisations, local authorities, ship operators
disposing waste under license at sea and persons authorised under the Animal-By-Product Order 1992 to hold or deal with animal waste,
Complete with the carriers, sign and keep a copy of a written waste transfer note describing the waste type and origin, and
Ensure legal treatment of waste by carriers. A ‘waste carrier’ has to:
Be an authorised (registered or exempt) carrier of controlled waste, Ensure proper packaging of waste while being under its control, Properly complete documentation including the transfer note,
5
Inspect waste to see it matches producer’s description and consider provision of a new description when waste is altered in some way (mixed, treated or repacked). A new description is necessary when waste is deteriorated or decomposed or altered in any way that matters for handling and disposal, and
Ensure proper description is provided and treatment is made by ‘waste producers’
A ‘waste broker’ (person that arranges the transfer of waste between a ‘producer’ and a ‘waste manager’ including ‘waste carriers’) has to:
Ensure that a correct and adequate description is transferred, the waste is within the scope of any waste licence or exemption and is transferred only by a registered or exempt carrier, and documentation is properly completed.
Undertake the same level of checks after transfer and the same action of any cause of suspicion, as a waste holder.
3.1.2 Environmental Act 1995 Apart from the requirement to produce a National Waste and a National Air Quality Strategy, this Act was largely concerned with changes to the legal and institutional arrangements for waste management. In this context, it introduced the Best Practicable Environmental Option (BPEO) and introduced the Producer Responsibility Obligations Section 93 (Packaging Waste) regulations, described in Section 3.3.2. 3.2 Landfill Directive [1999/31/EC] and Pre-treatment Requirements
The directive’s overall aim is to prevent or reduce as far as possible negative environmental impacts by setting maximum quantities for the landfill disposal of biodegradable municipal waste. The new ‘Pre-Treatment Requirements’ under the ‘Landfill Directive’ mean all waste destined for landfill disposal must first undergo treatment in the form of either a physical, thermal or biological process. Commercial waste producers can meet these requirements by either separating different waste streams for recycling, or by making arrangements for their waste contractors to treat the waste before disposing of it.
3.2.1 Landfill (England and Wales) (Amendment) Regulations 2005 The directive was brought into force in the UK on June 2002 as the Landfill (England and Wales) Regulations 2002, and amended in 2005. The Regulations set out a pollution control regime by banning the co-disposal of hazardous waste with non-hazardous waste in landfills, and since 2004, accepting materials in hazardous and non-hazardous sites only when they are permitted by their licences. In addition, the directive bans liquid wastes, used tyres, healthcare and infectious clinical wastes, animal-by-products, explosive/corrosive/flammable/oxidising wastes and chemicals. It also brings with it tighter site monitoring and engineering standards.
6
3.3 Directive on Packaging and Packaging Waste Directive [1994/62/EC]
The objective of this directive is to increase recovery and recycling levels of packaging waste produced across the various commercial sectors including sales outlets. Packaging includes all products used to contain, protect, handle, deliver or present products and includes returnable and non-returnable units (boxes, pallets, plastic totes, bags, drums etc.). This piece of legislation is harmonised in the UK through two regulations that also obligate businesses to take back customers packaging when returned in-store and increase the level of reusable containers used for the transport of their core goods, product returns and waste.
3.3.1 The Packaging (Essential Requirements) Regulations [2003/1941/SI] The ‘Packaging Regulations’ set design criteria and requirements for sales (primary and secondary) and transport (tertiary) of packaging in such a way as to maximise its recovery, reuse and recycling potential whilst reducing the level of any hazardous materials to a minimum. The use of re-usable plastic crates and glass is legislated under the [1999/177/EC] and [2001/171/EC] Commission Decisions that define the physical properties and the requirements of recoverable packaging for treatment at the end of their life.
3.3.2 The Producer Responsibility Obligation (Packaging Waste) Regulations 2007
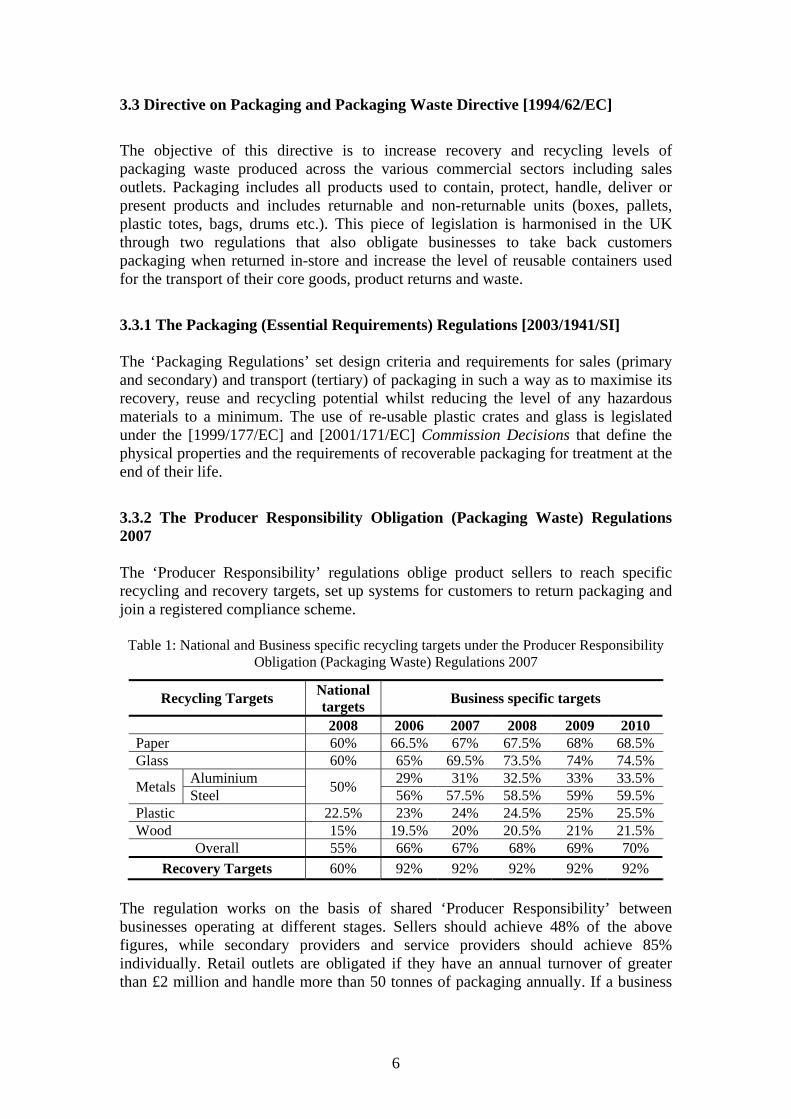
The ‘Producer Responsibility’ regulations oblige product sellers to reach specific recycling and recovery targets, set up systems for customers to return packaging and join a registered compliance scheme.
Table 1: National and Business specific recycling targets under the Producer Responsibility Obligation (Packaging Waste) Regulations 2007
Recycling Targets National targets Business specific targets
2008 2006 2007 2008 2009 2010 Paper 60% 66.5% 67% 67.5% 68% 68.5% Glass 60% 65% 69.5% 73.5% 74% 74.5%
Metals Aluminium 50% 29% 31% 32.5% 33% 33.5% Steel 56% 57.5% 58.5% 59% 59.5%
Plastic 22.5% 23% 24% 24.5% 25% 25.5% Wood 15% 19.5% 20% 20.5% 21% 21.5%
Overall 55% 66% 67% 68% 69% 70% Recovery Targets 60% 92% 92% 92% 92% 92%
The regulation works on the basis of shared ‘Producer Responsibility’ between businesses operating at different stages. Sellers should achieve 48% of the above figures, while secondary providers and service providers should achieve 85% individually. Retail outlets are obligated if they have an annual turnover of greater than £2 million and handle more than 50 tonnes of packaging annually. If a business
7
belongs to a group of companies, these requirements apply to the total amount of packaging handled by the group and its total annual turnover. 3.4 Hazardous Waste Directive [91/689/EEC]
Hazardous waste is waste that may be harmful to humans or the environment, and there is a mandatory requirement to identify and record such arisings. Appropriate measures have to be undertaken to ensure that companies disposing of, recovering, collecting or transporting hazardous waste do not mix different categories of hazardous waste or mix hazardous waste with non-hazardous waste. In the course of collection, transportation and temporary storage, waste must be properly packaged and labelled in compliance with international law. Hazardous waste is defined on the basis of the ‘European Waste Catalogue (EWC) 2002’ which classifies waste materials (20 main categories) according to how they were produced (650 codes). For example, the following commercial waste types are considered as hazardous under the EWC:
Separately collected fractions excluding packaging waste and their mixtures (e.g. fluorescent tubes and other mercury-containing waste, non-edible oil and fat, detergents containing dangerous substances, cytotoxic and cytostatic medicines, batteries and accumulators, discarded electrical and electronic equipment containing hazardous wastes)
Packaging, including separately collected municipal packaging waste (packaging containing residues of, or contaminated by dangerous substances, and metallic packaging containing a dangerous solid porous matrix (for example asbestos) and empty pressurised containers.
Wastes from natal care, diagnosis, treatment or prevention of disease in humans (sharps and other wastes whose collection and disposal is subject to special requirements in order to prevent infection, chemicals consisting of or containing dangerous substances, cytotoxic and cytostatic medicines and amalgam waste from dental care).
Batteries and accumulators (lead, nicelium-cadmium and mercury containing batteries and separately collected electrolyte from batteries and accumulators).
3.4.1 Hazardous Waste (England and Wales) Regulations 2005 The ‘Hazardous Waste Directive’ is transposed by the ‘Hazardous Waste (England and Wales) Regulations 2005’, currently being amended (2009). According to these regulations, retail outlets producing any type of hazardous waste under the ‘List of Waste (England Regulations) (LoW)’ must pre-register with the Environmental Agency, and ‘consignees’ must keep records of all consignments received. Any mixing of hazardous and non hazardous materials is prohibited. In accordance with the ‘European Waste Catalogue (EWC) 2002’, an identical list of codes for all waste types is currently used in England and Wales (List of Waste (England and Wales (LoW)). The use of these codes is a legal requirement of the
8
‘Duty of Care’ and must be included in the description of controlled waste in any waste transfer or consignment note.
3.4.2 Clinical Waste Regulation of clinical waste comes under health and safety and waste management legislation. Under the European and domestic legislation on hazardous waste, certain types of clinical wastes are considered as hazardous, and under the ‘Duty of Care’ any individuals concerned with its management must ensure its proper handling. The Department of Health has issued several guidance documents some of which are addressed to retail outlets selling pharmaceutical products or operating as surgeries.
3.4.2.1 ‘07-01: Safe Management of Healthcare Waste’ - Environment and Sustainability Health Technical Memorandum Waste produced as a consequence of health care activities in hospitals and community settings (such as retail outlets authorised to operate as surgeries) must be segregated so it can be disposed of appropriately on the basis of the hazard it poses. Clinical waste must be classified under the EWC codes and infectious waste (e.g. anatomical waste, sharps), cytotoxic and cytostatic medicines, healthcare chemicals and other wastes having hazardous properties must be stored safely before being transported to authorised treatment/disposal sites. Storage areas should be secure from non authorised entry and sufficient in size to allow packaged waste to be segregated and so as to avoid waste of different classifications being stored together in the same area. All transport packaging items e.g. bags or other containers must be approved, labelled and accompanied when in large quantities by appropriate documentation.
3.4.2.2 ‘07-06: Disposal of Pharmaceutical Waste in Community Pharmacies’ – Environment and Sustainability Health Technical Manual On-site storage of pharmaceutical waste produced in community pharmacies or being returned from patients does not normally require a licence from the Environmental Agency, except if more than 200kg of hazardous waste is produced by a pharmacy in total (including other hazardous waste produced such as fluorescent lighting tubes etc). In the same context to hospitals or other healthcare settings producing hazardous clinical waste, secure storage and authorised collection and transport must be ensured. 3.5 Waste Electrical and Electronic Equipment Directive (WEEE) [2002/96/EC] and Restriction of Hazardous Substances Directive (RoHS) [2002/95/EC]
The ‘WEEE Directive’ aims to minimise the impact of electrical and electronic goods on the environment, by increasing re-use and recycling and reducing the amount of WEEE going to landfill. It seeks to achieve this by making producers responsible for financing the collection, treatment, and recovery of waste electrical equipment, and by obliging distributors to establish an infrastructure for collecting WEEE in such a way that EEE users have the possibility of returning WEEE free of charge. The directive provides a list with 10 product categories having a voltage of up to 1000 volts AC or up to 1500 volts DC (large or small household appliances, IT & telecommunications
9
equipment, consumer equipment, lighting equipment, electrical and electronic tools, toys leisure and sports equipment, medical devices, monitoring and control instruments and automatic dispensers). Closely linked to the ‘WEEE Directive’, the RoHS and its current revised version RoHS2 restrict the use of six hazardous materials (including heavy metals such as lead, mercury and cadmium, and flame retardants used in plastics) in the manufacture of various types of electronic and electrical equipment. The directive covers the same scope of the ‘WEEE Directive’ (ten product categories) except for medical devices and monitoring and control instruments. It does not cover batteries and excludes certain types of fluorescent lamps, glass of cathode ray tubes and electronic components and fluorescent tubes. The directive requires compliance through self declaration and retailers should sell approved products and establish return and take-back schemes as required by the ‘WEEE Directive’.
3.5.1 UK WEEE (Amendment) Regulations 2007 (SI No.3454) In the UK, the Department for Business, Enterprise & Regulatory Reform (BERR) is responsible for overseeing the passage of the ‘WEEE Directive’ into the domestic regulatory frame. Retailers and distributors selling electrical and electronic equipment (EEE) must:
Store, collect, treat, recycle and dispose of WEEE separately from other waste. Obtain/keep proof that WEEE was given to a waste management company and
was treated and disposed of in an environmentally sound way. Discharge WEEE for free if EEE was sold after 13 August 2005 or WEEE was
replaced by new equivalent EEE, or it is WEEE from private households (separated and unmixed with other waste).
Discharge WEEE at a cost when EEE was purchased before 13 August 2005, or when it is not possible to trace the producer or its compliance scheme, or have made special arrangements with the producer to bear future costs.
In addition, they must provide customers with information on:
The environmental impacts of EEE and WEEE, The reasons for separating WEEE from other waste, The meaning of the crossed out wheeled bin symbol and How WEEE can be safely deposited for proper treatment and recycling free of
charge.
Retailers and distributors must set up a system for customers to dispose of WEEE free of charge and explain it to them. There are generally two customer take-back systems offered by retail outlets:
In-store take-back where all types of waste are accepted - The amount of items received by category must be recorded - Separately collected WEEE must be removed through a producer
compliance scheme or a waste carrier registered with/ licensed by the environmental regulator (the business may not need to have a waste management license).
10
Provision of a pre-paid mail order sack or pre-paid label (dependent on appliance size)
Separate collections of large household appliances, gas discharge lamps, cooling appliances, display equipment containing cathode ray tubes and all other WEEE must be made, however, if it is not possible due to containers size, the streams may be mixed up to 15% by weight of material in a single consignment as long as gas discharge tubes and display equipment containing cathode ray tubes remain separate from each other. 3.6 Batteries, Accumulators and their Wastes Directive [2006/66/EC]
The directive entitles members of the public to deposit, free of charge, all waste batteries at appropriate retail outlets. Retailers are only obligated to take-back batteries of a type they supply.
3.6.1 Batteries and Accumulators (Placing on the Market Regulations) 2008 The regulations specify the main technical requirements of the batteries or accumulators (rechargeable batteries) or products that contain batteries or accumulators placed on the market. Any person placing these in the market should use batteries containing acceptable levels of mercury and cadmium, label them properly, place on the market legally certified types of batteries and meet all requirements that certain appliances are designed in such a way that waste batteries can be easily removed.
3.6.2 The Waste Batteries and Accumulators Regulations 2009 Further UK regulations on the treatment, recycling and disposal of batteries and accumulators were recently published and came into force in May 2009 while the first compliance scheme began in January 2010. The upcoming regulations state that retailers putting less than 1kg of portable batteries on the market are exempted from the take-back duty and any other funding obligation for batteries collection, treatment and recycling however they will still have to register with the Environment Agency. For the retailers being obligated, the upcoming regulations give them the right to request, free of charge, any battery compliance scheme which must ensure the collection of batteries within a reasonable time (within 21 days of the request). Interim targets for collecting waste portable batteries are equivalent to 25% of sales by 2012 and 45% by 2016. Currently, batteries have to be removed according to the WEEE legislation, however, they are included in declarations of weight of electrical and electronic products. From January 2010 the weight of such batteries will be declared on the amount of batteries put in the market and WEEE producers will have to pay for their initial collection from consumers.
11
3.7 Energy Efficiency Requirements for Ballasts for Fluorescent Lighting Directive [2000/55/EC]
The directive aims at reducing energy consumption for ballasts for fluorescent lighting by moving gradually towards more efficient ballasts which may also offer extensive energy-saving features, ensuring a high level of protection for both the environment and consumer. When ballasts are placed in the market, either as single component or incorporated in luminaires, they must bear the ‘CE’ marking and meet all technical requirements set by the directive.
3.7.1 Energy Efficiency (Ballasts for Fluorescent Lighting) Regulations [2001/3316/SI] Under the amended ‘Hazardous Waste Regulations’, fluorescent lighting tubes are classified as hazardous waste and its disposal in landfill is prohibited due to high levels of heavy metals (e.g. mercury). Although the tubes are safe provided they are not broken, mercury when released can be very damaging to health. Legislated under the ‘WEEE Directive’ and the ‘RoHS Directive’, retailers are allowed to distribute certain types of lighting equipment and collect, store and dispose of end-of-life lighting tubes separately from general waste to enable proper disposal. 3.8 EC Animal By-Products Regulation - Guidance on Cooking Oil [2002/2774/EC]
Under this regulation, used cooking oil from catering units must not be poured down drains or sewers to avoid odour, blockage and pollution of watercourses. Instead, businesses are obligated to properly store and arrange collection of oil by authorised collectors who transfer it to authorised treatment sites for recovery or disposal. After November 2004, cooking oils can no longer be used as calorie enhancers in animal feed to avoid spreading any risk material, but can be used in the production of biodiesel to power vehicles.
3.8.1 Animal By-Products Regulations England [2347/2005] This regulation is in accordance with the ‘Duty of Care’ imposing on anyone that produces, imports, treats, stores, transfers or disposes of controlled waste the obligation to take all appropriate measures for its safe treatment. Producers of waste cooking oil such as restaurants and other catering units must store cooking oil safely and arrange for its authorised collection. ‘Carriers’ must be licensed and registered with the Environmental Agency and must have a transfer note accompanying the consignment, retaining it for 2 years.
12
Chapter 4
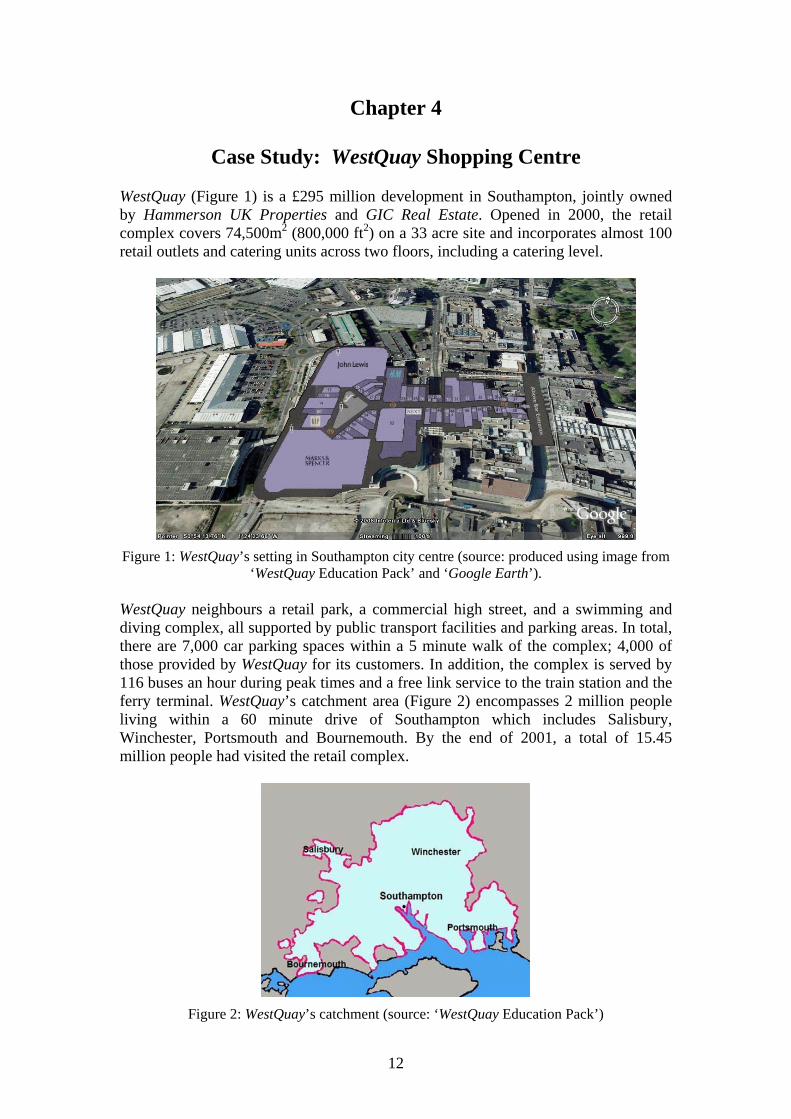
Case Study: WestQuay Shopping Centre WestQuay (Figure 1) is a £295 million development in Southampton, jointly owned by Hammerson UK Properties and GIC Real Estate. Opened in 2000, the retail complex covers 74,500m2 (800,000 ft2) on a 33 acre site and incorporates almost 100 retail outlets and catering units across two floors, including a catering level.
Figure 1: WestQuay’s setting in Southampton city centre (source: produced using image from
‘WestQuay Education Pack’ and ‘Google Earth’). WestQuay neighbours a retail park, a commercial high street, and a swimming and diving complex, all supported by public transport facilities and parking areas. In total, there are 7,000 car parking spaces within a 5 minute walk of the complex; 4,000 of those provided by WestQuay for its customers. In addition, the complex is served by 116 buses an hour during peak times and a free link service to the train station and the ferry terminal. WestQuay’s catchment area (Figure 2) encompasses 2 million people living within a 60 minute drive of Southampton which includes Salisbury, Winchester, Portsmouth and Bournemouth. By the end of 2001, a total of 15.45 million people had visited the retail complex.
Figure 2: WestQuay’s catchment (source: ‘WestQuay Education Pack’)
13
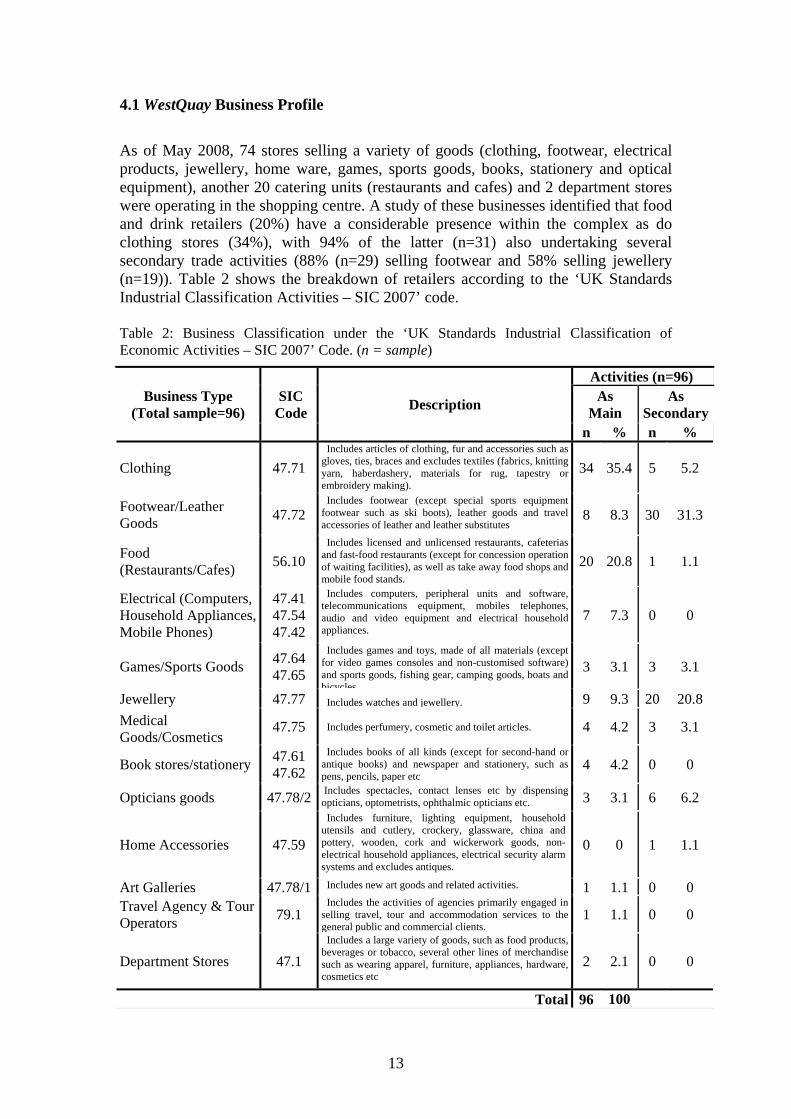
4.1 WestQuay Business Profile
As of May 2008, 74 stores selling a variety of goods (clothing, footwear, electrical products, jewellery, home ware, games, sports goods, books, stationery and optical equipment), another 20 catering units (restaurants and cafes) and 2 department stores were operating in the shopping centre. A study of these businesses identified that food and drink retailers (20%) have a considerable presence within the complex as do clothing stores (34%), with 94% of the latter (n=31) also undertaking several secondary trade activities (88% (n=29) selling footwear and 58% selling jewellery (n=19)). Table 2 shows the breakdown of retailers according to the ‘UK Standards Industrial Classification Activities – SIC 2007’ code. Table 2: Business Classification under the ‘UK Standards Industrial Classification of Economic Activities – SIC 2007’ Code. (n = sample)
Business Type (Total sample=96)
SIC Code Description
Activities (n=96) As
Main As
Secondaryn % n %
Clothing 47.71 Includes articles of clothing, fur and accessories such as gloves, ties, braces and excludes textiles (fabrics, knitting yarn, haberdashery, materials for rug, tapestry or embroidery making).
34 35.4 5 5.2
Footwear/Leather Goods 47.72
Includes footwear (except special sports equipment footwear such as ski boots), leather goods and travel accessories of leather and leather substitutes
8 8.3 30 31.3
Food (Restaurants/Cafes) 56.10
Includes licensed and unlicensed restaurants, cafeterias and fast-food restaurants (except for concession operation of waiting facilities), as well as take away food shops and mobile food stands.
20 20.8 1 1.1
Electrical (Computers, Household Appliances, Mobile Phones)
47.41 47.54 47.42
Includes computers, peripheral units and software, telecommunications equipment, mobiles telephones, audio and video equipment and electrical household appliances.
7 7.3 0 0
Games/Sports Goods 47.64 47.65
Includes games and toys, made of all materials (except for video games consoles and non-customised software) and sports goods, fishing gear, camping goods, boats and bicycles
3 3.1 3 3.1
Jewellery 47.77
Includes watches and jewellery. 9 9.3 20 20.8
Medical Goods/Cosmetics
47.75 Includes perfumery, cosmetic and toilet articles. 4 4.2 3 3.1
Book stores/stationery 47.61 47.62
Includes books of all kinds (except for second-hand or antique books) and newspaper and stationery, such as pens, pencils, paper etc
4 4.2 0 0
Opticians goods 47.78/2 Includes spectacles, contact lenses etc by dispensing opticians, optometrists, ophthalmic opticians etc. 3 3.1 6 6.2
Home Accessories 47.59
Includes furniture, lighting equipment, household utensils and cutlery, crockery, glassware, china and pottery, wooden, cork and wickerwork goods, non-electrical household appliances, electrical security alarm systems and excludes antiques.
0 0 1 1.1
Art Galleries 47.78/1 Includes new art goods and related activities. 1 1.1 0 0Travel Agency & Tour Operators 79.1
Includes the activities of agencies primarily engaged in selling travel, tour and accommodation services to the general public and commercial clients.
1 1.1 0 0
Department Stores 47.1 Includes a large variety of goods, such as food products, beverages or tobacco, several other lines of merchandise such as wearing apparel, furniture, appliances, hardware, cosmetics etc
2 2.1 0 0
Total 96 100
14
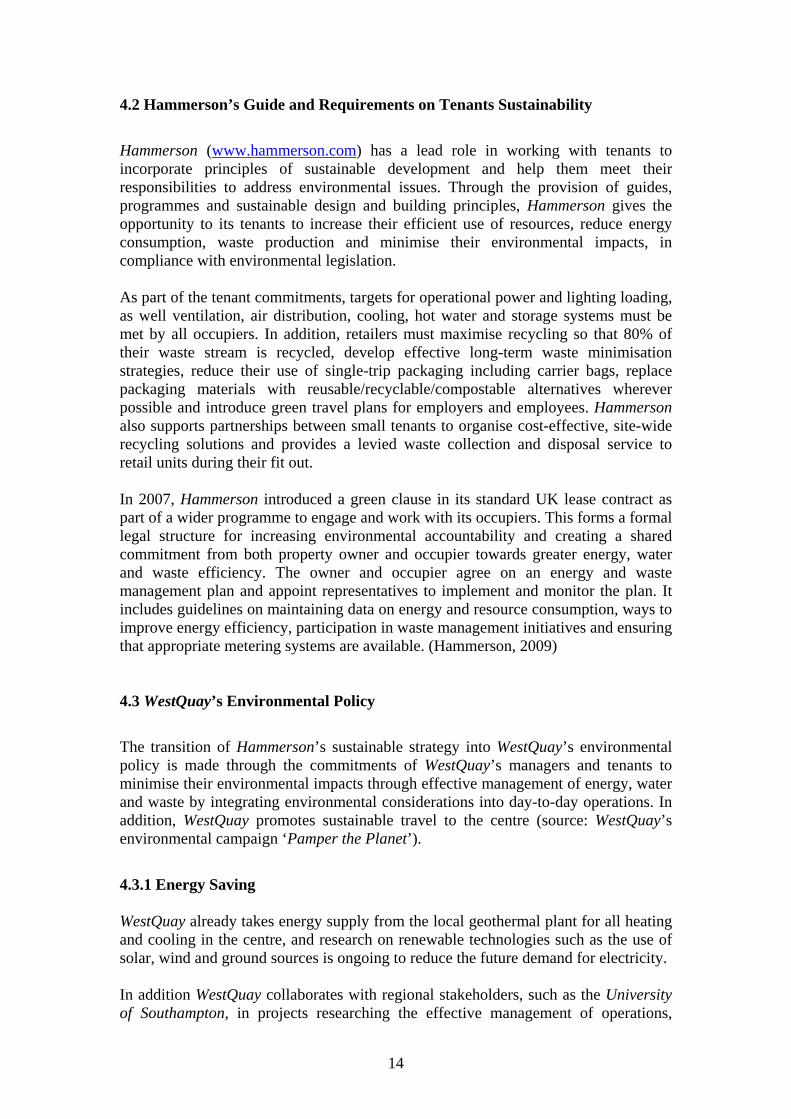
4.2 Hammerson’s Guide and Requirements on Tenants Sustainability
Hammerson (www.hammerson.com) has a lead role in working with tenants to incorporate principles of sustainable development and help them meet their responsibilities to address environmental issues. Through the provision of guides, programmes and sustainable design and building principles, Hammerson gives the opportunity to its tenants to increase their efficient use of resources, reduce energy consumption, waste production and minimise their environmental impacts, in compliance with environmental legislation. As part of the tenant commitments, targets for operational power and lighting loading, as well ventilation, air distribution, cooling, hot water and storage systems must be met by all occupiers. In addition, retailers must maximise recycling so that 80% of their waste stream is recycled, develop effective long-term waste minimisation strategies, reduce their use of single-trip packaging including carrier bags, replace packaging materials with reusable/recyclable/compostable alternatives wherever possible and introduce green travel plans for employers and employees. Hammerson also supports partnerships between small tenants to organise cost-effective, site-wide recycling solutions and provides a levied waste collection and disposal service to retail units during their fit out. In 2007, Hammerson introduced a green clause in its standard UK lease contract as part of a wider programme to engage and work with its occupiers. This forms a formal legal structure for increasing environmental accountability and creating a shared commitment from both property owner and occupier towards greater energy, water and waste efficiency. The owner and occupier agree on an energy and waste management plan and appoint representatives to implement and monitor the plan. It includes guidelines on maintaining data on energy and resource consumption, ways to improve energy efficiency, participation in waste management initiatives and ensuring that appropriate metering systems are available. (Hammerson, 2009) 4.3 WestQuay’s Environmental Policy
The transition of Hammerson’s sustainable strategy into WestQuay’s environmental policy is made through the commitments of WestQuay’s managers and tenants to minimise their environmental impacts through effective management of energy, water and waste by integrating environmental considerations into day-to-day operations. In addition, WestQuay promotes sustainable travel to the centre (source: WestQuay’s environmental campaign ‘Pamper the Planet’).
4.3.1 Energy Saving
WestQuay already takes energy supply from the local geothermal plant for all heating and cooling in the centre, and research on renewable technologies such as the use of solar, wind and ground sources is ongoing to reduce the future demand for electricity. In addition WestQuay collaborates with regional stakeholders, such as the University of Southampton, in projects researching the effective management of operations,
15
facilities and systems to reduce its overall environmental impact. In autumn 2008, six groups of Environmental Science postgraduate students from the University of Southampton assessed WestQuay’s activities in common areas, such as waste and energy management through heating, cooling and lighting, lifts and escalators, public and retailer waste, car parking and the service yard, to develop an ‘environmental management standard (EMS)’ and gain international environmental management standard ISO 14001 for WestQuay.
4.3.2 Sustainable Waste Management
In 2007, WestQuay recycled over 434 tonnes of waste, while the remaining waste was sent to an Energy Recovery Facility and used to produce electricity to power around 100 homes. In addition, during 2007, the centre launched a course of ‘Retailer Waste Co-ordinator’ training sessions in which each retailer sent a representative to learn more about waste management within the centre and how to improve their retail unit’s performance. This training was offered in 2008 to keep retailers up-to-date with the schemes that were in operation. In 2008, Hammerson improved their recycling rate by introducing new waste streams for recycling, working more closely with those retailers struggling to comply with their obligations and ensuring that they maximised the efficiency of their own waste management systems. More detailed information on waste arisings and recycling rates are provided in section 4.4 ‘Waste Generation at WestQuay’.
4.3.3 Sustainable Water Usage During 2008, the centre installed equipment and sanitary ware to start capturing data relating to water usage. In addition, the feasibility of alternative technologies such as rain and grey water harvesting are being investigated along with a review of the way water is used for watering and cleaning to see if these procedures can be made more efficient.
4.3.4 Sustainable Visitors Travel The centre encourages its visitors to make use of public transport (train and bus) and/or bike/walk to the centre whenever possible. In 2008 WestQuay announced the availability of three ‘pay the hour’ rental low-emission and low-cost cars in the multi-storey car park provided by WhizzGo. The company provides a network of low emission cars at a monthly registration fee of £5 and an hourly cost of £5.99 in dedicated parking bays currently located in 12 towns and cities across the UK. In Southampton these cars can be found in 8 dedicated parking bays including WestQuay’s car park. The system requires registration with WhizzGo, instant online or over the phone booking and usage of personal smart card and pin (www.whizzgo.co.uk).
16
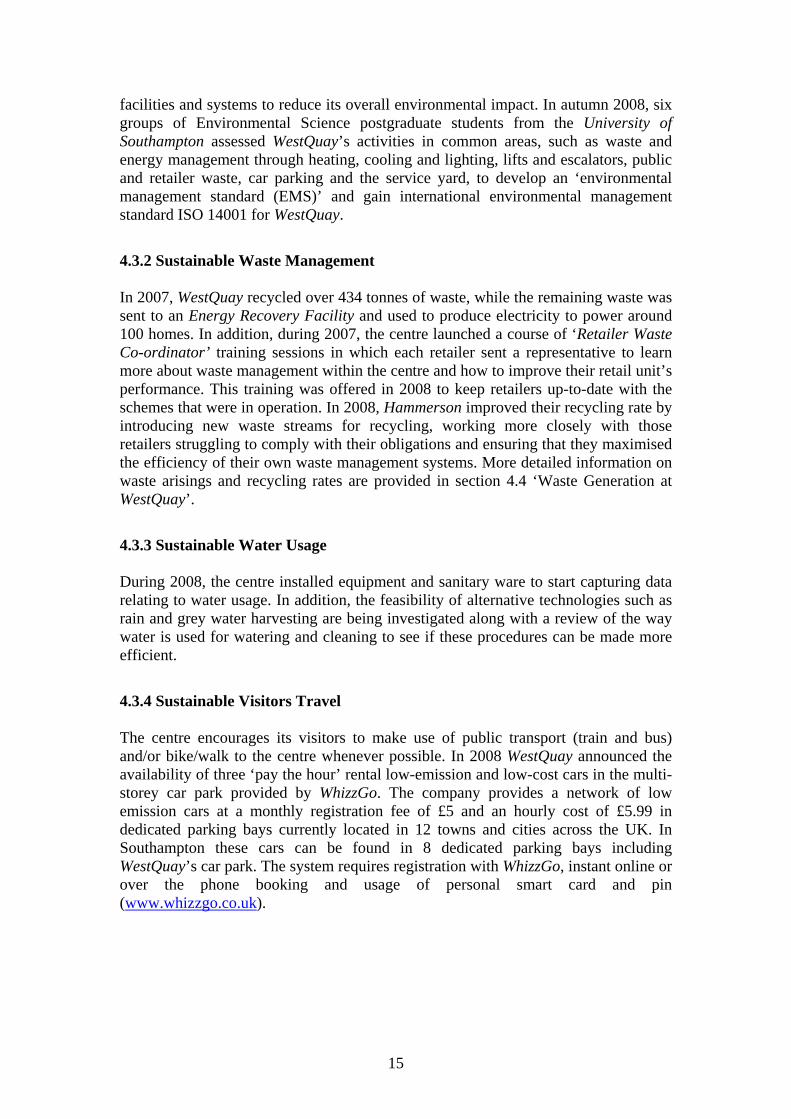
4.4 Waste generation at WestQuay Monthly waste statistics for the period January 2006 to August 2008 were provided by WestQuay’s management company. The first data set concerned monthly waste arisings produced by the entire shopping centre including waste produced by retailers in individual stores, waste produced by customers in all public areas and waste produced by WestQuay’s staff in common/designated areas such as service yards and offices. In addition, another data set concerning the quantities of waste being diverted from landfill were provided. Both datasets referred to the period starting January 2006 and ending on August 2008 (Figure 3).
Figure 3: Monthly waste tonnage produced in WestQuay and monthly waste tonnage diverted
from landfill. The figures indicate a slight increase in total waste tonnage produced in WestQuay. Temporal variations in waste production are usually caused by changes in visitation/spending patterns (e.g. during school holidays, the annual boat show and sale periods). Waste production tends to peak in Nov/Dec for the Christmas period and then stay low until Easter when momentum starts to build again. Despite the trend of slightly increasing waste arisings, a t-test showed that there were significant differences in the mean waste tonnage being diverted from landfill between the periods January 2006 to April 2007 (mean: 26.1 tonnes) and May 2007 to August 2008 (mean=142.5 tonnes). The difference in waste tonnage diverted for the period January 2006 to April 2007 versus the period May 2007 to August 2008 was significant at the 0.05 error level T(30)=12.71, p<0.05 (t at 30 degrees of freedom is
17
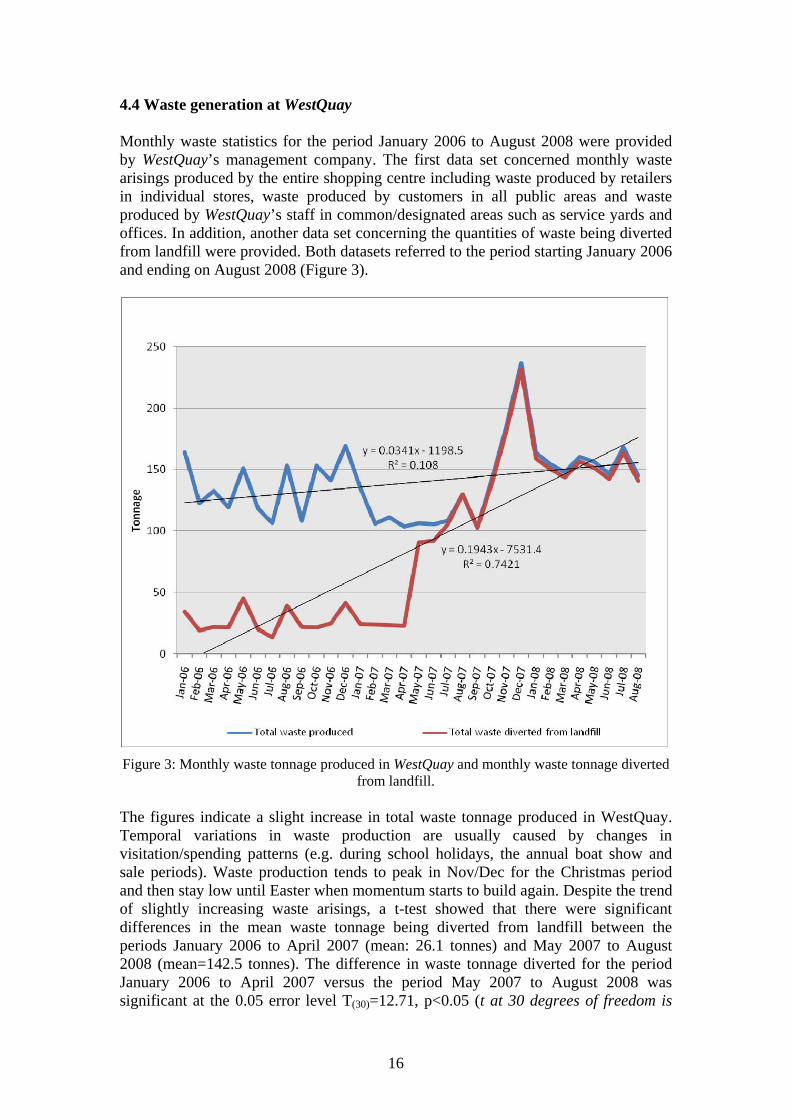
12.71.There is less than a 5% chance that the difference in waste tonnage diverted from landfill is due to mere chance). This large observed difference in waste tonnage diverted from landfill was mainly due to the increase in recycling and recovery rates. In 2006, only 19.7% (323 tonnes) of the total waste produced by the retail complex (1642 tonnes) was recycled/recovered, while in 2007 this figure had increased to 28% (442 tonnes) and an additional 46% was incinerated (726 tonnes), while the total annual waste tonnage (1575 tonnes) slightly decreased when compared to 2006 figures. During the first 8 months of 2008, recycling/recovery rates had further increased with 47% of the total waste produced being recycled/recovered and exceeding the overall 2007 figures (577 tonnes). Another 51% was incinerated (631 tonnes) indicating a total decrease in the proportion of the waste (2.4%) being landfilled (30 tonnes), Figure 4.
Figure 4: Waste Management Characteristics (%) for WestQuay.
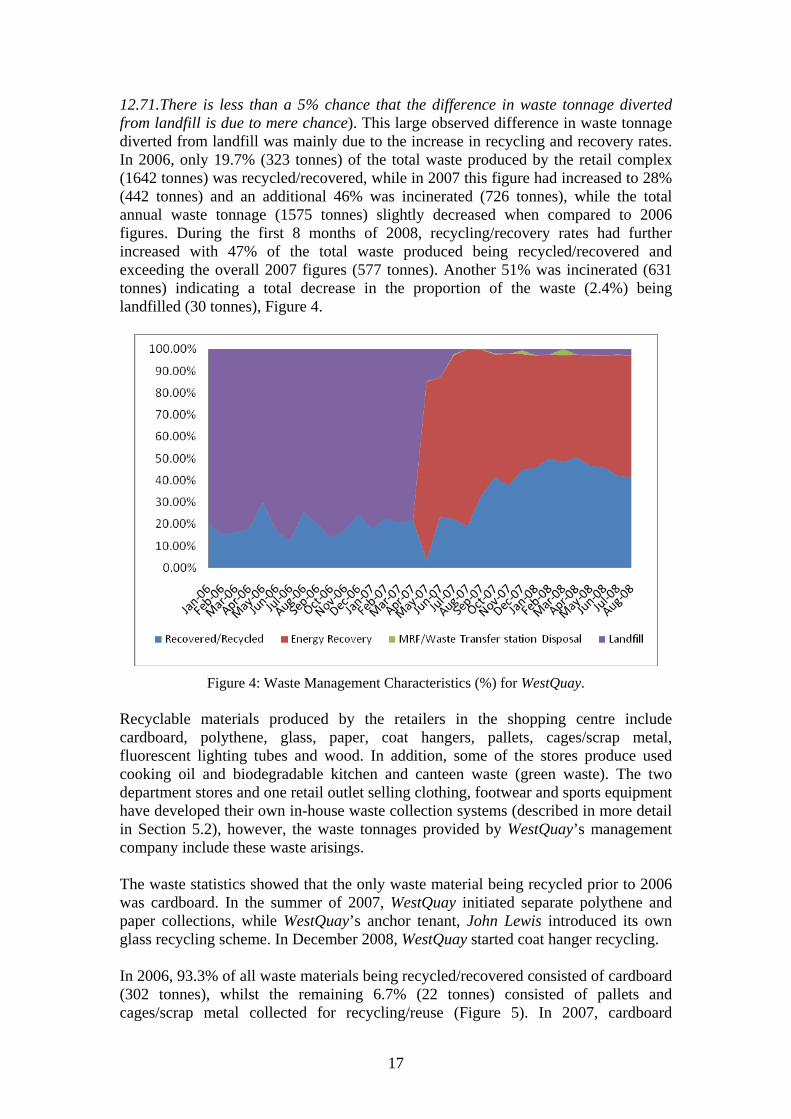
Recyclable materials produced by the retailers in the shopping centre include cardboard, polythene, glass, paper, coat hangers, pallets, cages/scrap metal, fluorescent lighting tubes and wood. In addition, some of the stores produce used cooking oil and biodegradable kitchen and canteen waste (green waste). The two department stores and one retail outlet selling clothing, footwear and sports equipment have developed their own in-house waste collection systems (described in more detail in Section 5.2), however, the waste tonnages provided by WestQuay’s management company include these waste arisings. The waste statistics showed that the only waste material being recycled prior to 2006 was cardboard. In the summer of 2007, WestQuay initiated separate polythene and paper collections, while WestQuay’s anchor tenant, John Lewis introduced its own glass recycling scheme. In December 2008, WestQuay started coat hanger recycling. In 2006, 93.3% of all waste materials being recycled/recovered consisted of cardboard (302 tonnes), whilst the remaining 6.7% (22 tonnes) consisted of pallets and cages/scrap metal collected for recycling/reuse (Figure 5). In 2007, cardboard
18
recycling accounted for 69% (305 tonnes), while pallets collected by waste contractors for repair, reuse or recycling accounted for 11% (48 tonnes) of the overall recycling rate. Polythene recycling accounted for 8.2% (37 tonnes), while glass, paper and hanger recycling accounted for 9% (40 tonnes) of overall recycling. The remaining 2.7% was waste being transferred to a materials reprocessing facility (MRF) (12 tonnes) where any remaining value was extracted. During the first 8 months of 2008, packaging recycling fell to 63% of the overall recycling rate but yielded more recyclate tonnage (366 tonnes) compared to 2007. Polythene and hanger recycling rates had increased, reaching 16% (94 tonnes) and 8% (47 tonnes) of overall recycling/recovery rates respectively. Glass (27 tonnes), paper (20 tonnes), and pallets (17 tonnes) collectively account for 11% of the overall recycling rate.
Figure 5: Monthly tonnage of recycled/recovered waste materials produced in WestQuay from January 2006 to August 2008.
At the time of the research, WestQuay had a contract with ‘Veolia’ to collect general mixed waste and mixed paper produced by WestQuay staff and retailers who had joined the central waste collection system, general mixed waste produced by customers in WestQuay public areas, as well as hazardous waste and WEEE produced by WestQuay staff, and in some cases, by stores as part of their day-to-day commercial operations (e.g. fluorescent lighting tubes, fridges and cash registers). Businesses obligated under legislation to provide specialised collection and disposal of WEEE and other hazardous wastes such as used cooking oil and clinical waste had made arrangements with several specialised waste contractors for the collection and disposal of those wastes. General mixed waste, mixed paper and WEEE/hazardous waste collected by ‘Veolia’ was moved and incinerated at the local incinerator in Marchwood. Individually managed hazardous wastes along with confidential waste are analysed in more detail in Section 5.3. Cardboard and polythene collected and consolidated by WestQuay were collected by ‘Futur’ and sent to Kent when 42 bales had been consolidated. Hangers were baled and collected by ‘What a Waste’ and sent to Derby.
19
With regard to the two department stores that had developed in-house waste collection systems, one moved all waste types (except for general mixed and glass waste) to a distribution centre located in Southampton’s Quays (a short distance from WestQuay) where it was further consolidated and processed. This business was considering using electric vehicles for transporting waste from WestQuay to the distribution centre in the Quays. Biffa collected the general mixed waste which was landfilled and glass. The general mixed waste generated by the other department store was managed by WestQuay and was collected by ‘Veolia’ on their behalf. Cardboard, polythene and hangers were taken to Wincanton. Finally, the retail outlet selling clothing, footwear and sports equipment used in-house collection mechanisms to manage the waste produced (Section 5.2). The recycling statistics suggested that the sustainable waste policy adopted by WestQuay and implemented by the retailers was having positive impacts in terms of reducing the landfill impact and increasing material recovery. Through the on-going investment programme and new recycling schemes, WestQuay’s management company aims to further increase recycling levels to 80%. 4.5 WestQuay’s Operational Plan for on-site Waste Management
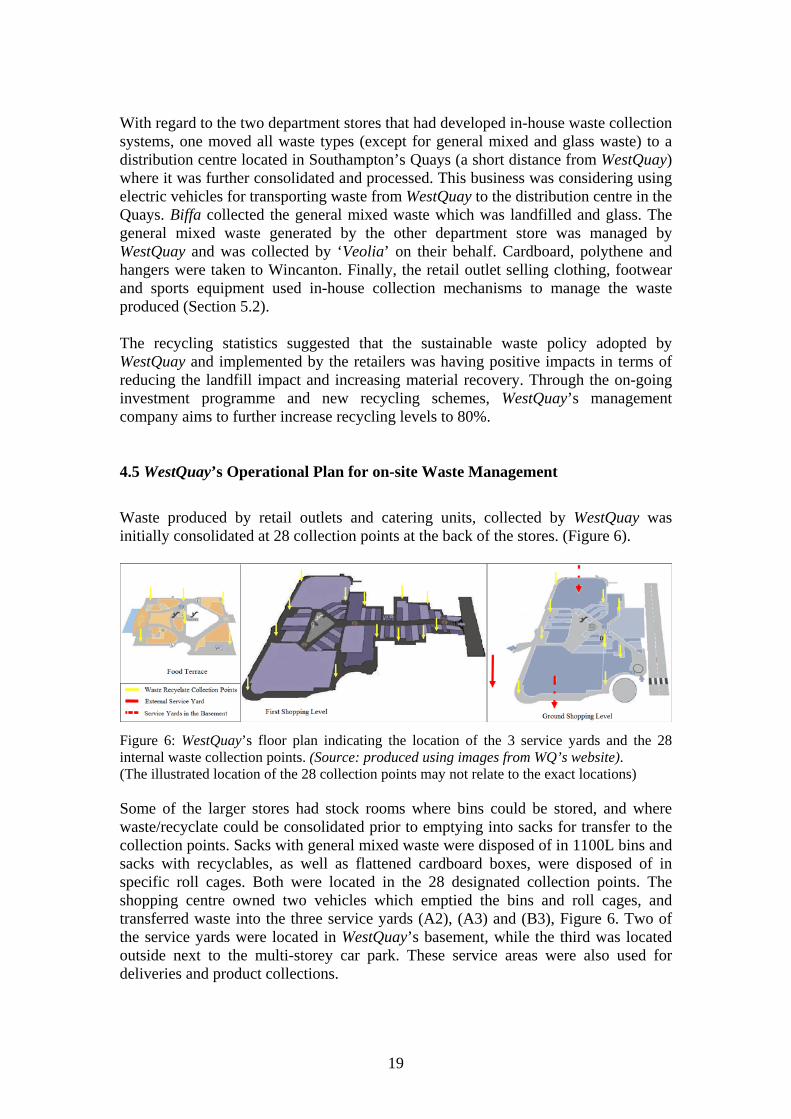
Waste produced by retail outlets and catering units, collected by WestQuay was initially consolidated at 28 collection points at the back of the stores. (Figure 6).
Figure 6: WestQuay’s floor plan indicating the location of the 3 service yards and the 28 internal waste collection points. (Source: produced using images from WQ’s website). (The illustrated location of the 28 collection points may not relate to the exact locations) Some of the larger stores had stock rooms where bins could be stored, and where waste/recyclate could be consolidated prior to emptying into sacks for transfer to the collection points. Sacks with general mixed waste were disposed of in 1100L bins and sacks with recyclables, as well as flattened cardboard boxes, were disposed of in specific roll cages. Both were located in the 28 designated collection points. The shopping centre owned two vehicles which emptied the bins and roll cages, and transferred waste into the three service yards (A2), (A3) and (B3), Figure 6. Two of the service yards were located in WestQuay’s basement, while the third was located outside next to the multi-storey car park. These service areas were also used for deliveries and product collections.
20
4.6 Local and Regional Development
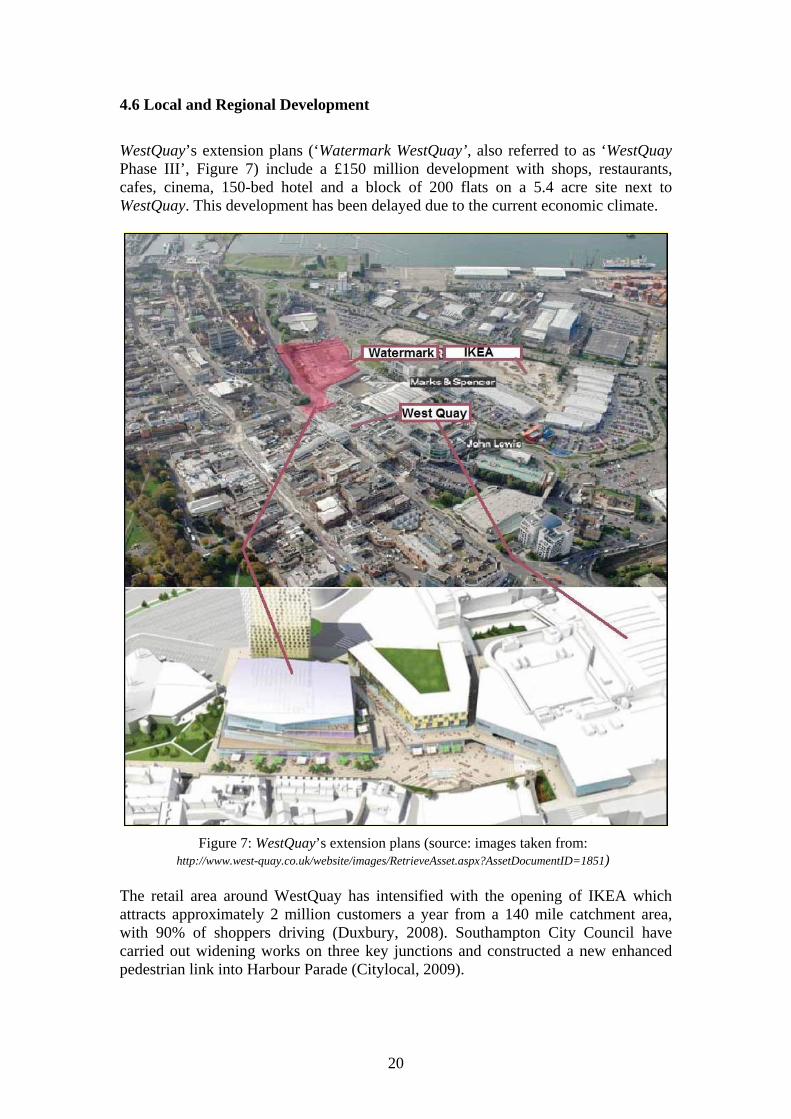
WestQuay’s extension plans (‘Watermark WestQuay’, also referred to as ‘WestQuay Phase III’, Figure 7) include a £150 million development with shops, restaurants, cafes, cinema, 150-bed hotel and a block of 200 flats on a 5.4 acre site next to WestQuay. This development has been delayed due to the current economic climate.
Figure 7: WestQuay’s extension plans (source: images taken from:
http://www.west-quay.co.uk/website/images/RetrieveAsset.aspx?AssetDocumentID=1851) The retail area around WestQuay has intensified with the opening of IKEA which attracts approximately 2 million customers a year from a 140 mile catchment area, with 90% of shoppers driving (Duxbury, 2008). Southampton City Council have carried out widening works on three key junctions and constructed a new enhanced pedestrian link into Harbour Parade (Citylocal, 2009).
21
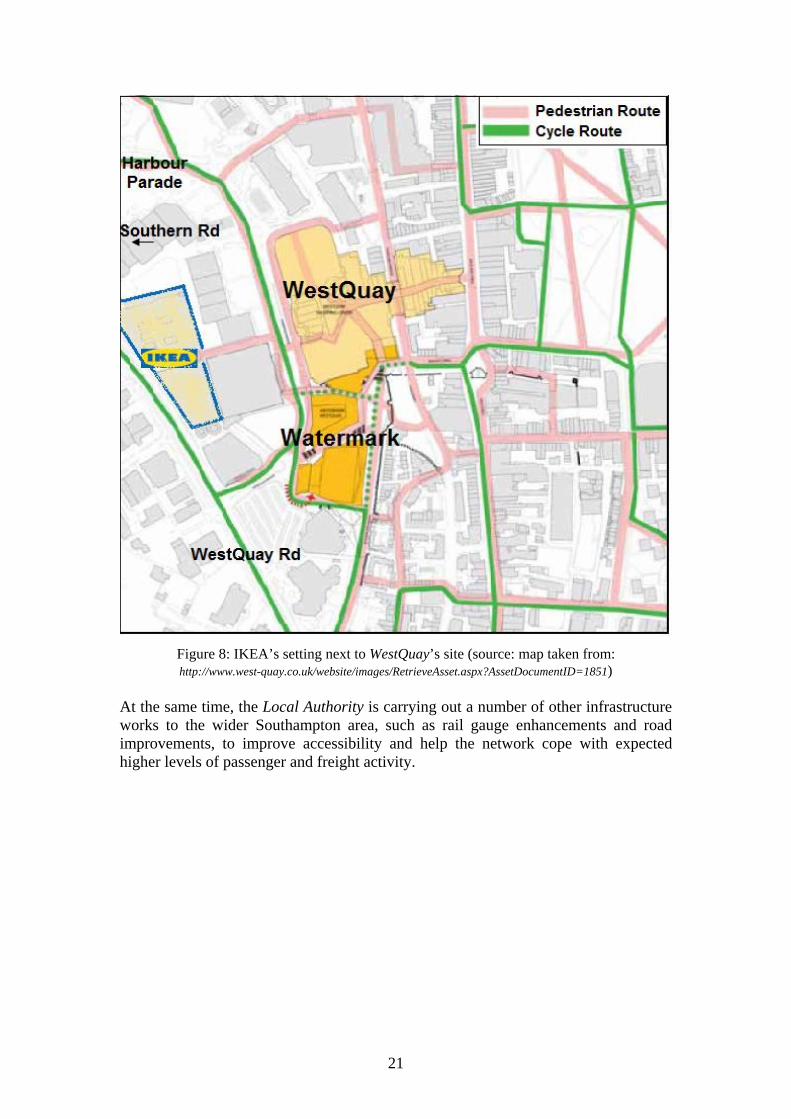
Figure 8: IKEA’s setting next to WestQuay’s site (source: map taken from: http://www.west-quay.co.uk/website/images/RetrieveAsset.aspx?AssetDocumentID=1851)
At the same time, the Local Authority is carrying out a number of other infrastructure works to the wider Southampton area, such as rail gauge enhancements and road improvements, to improve accessibility and help the network cope with expected higher levels of passenger and freight activity.
22
Chapter 5
Interviews with WestQuay Retailers
As part of this study, interviews with the managers of 96% (92 out of 96) of the retail outlets and catering units operating in WestQuay were held to gather information related to individual waste management operations and associated logistics procedures in order to identify specific problems and potential solutions. 5.1. Data Collection Plan
Based on a number of recent urban freight survey methodologies (Cherrett and Hickford, 2002; DfT, 2008; TRG, 2006; DfT, 2004), a mixture of qualitative and quantitative questions were created as part of a structured interview questionnaire.
5.1.1 Questionnaire Design and Administration Due to the detailed nature of the data being sought, an interview approach was adopted as opposed to a self-completion questionnaire. Questions were grouped under three different categories (core goods deliveries, waste management and waste collection practices). Although questions were closed with respondents choosing from a list of options, multiple responses were available and the details of all discussions were recorded by the interviewer. Flow questions in the form of tables to connect questions consequent upon earlier answers were also used. The interview questionnaire was piloted in a local commercial high street in order to identify problems and inefficiencies. The trials revealed the need to carefully distinguish between retailers who used largely centralised distribution systems with one main logistics provider supplying goods from a central distribution point, and those having many separate suppliers (decentralised systems) visiting their premises. The WestQuay target population consisted of all store managers operating in the shopping centre. Respondents initially received a cover letter from the management company describing the background to the research and the need for them to participate in the survey. Follow-up phone contacts and visits were made to ensure availability and to schedule interviews. It also emerged that at the time of the interviews, 15% of the stores had undergone changes in management personnel since the initial approach 2 months earlier.
5.1.2 Response Rate In total, 96% (n=92) of the retailers operating in the retail complex were interviewed during a 5 week period between April and May 2008.
23
Table 3: Survey response rate of businesses operating in WestQuay (n = sample)
Business Type
Total Units
(Main
Activity)
Response Level
(%)
Main Activity
(%)
Secondary Activity
(%) (ntot=92)
Clothing 34 97 35.8 (n=33) 5.4 (n=5)
Footwear/Leather Goods 8 100 7.6 (n=8) 32.6 (n=30)
Food (Restaurants/Cafes) 20 100 21.7 (n=20) 1.1 (n=1)
Electrical (Computers, Household Appliances, Mobile Phones)
7 100 7.6 (n=7) 0 (n=0)
Games/Sports Goods 3 100 4.4 (n=3) 3.3 (n=3)
Jewellery 9 89 8.7 (n=8) 21.7 (n=20)
Medical Goods/Cosmetics 4 100 4.4 (n=4) 3.3 (n=3)
Book stores/stationery 4 100 4.4 (n=4) 0.0 (n=0)
Opticians goods 3 100 3.2 (n=3) 6.6 (n=6)
Home Accessories 0 100 0.0 (n=0) 1.1 (n=1)
Commercial Arts Galleries 1 100 1.1 (n=1) 0.0 (n=0)
Travel Agency & Tour Operators
1 100 1.1 (n=1) 0.0 (n=0)
Department Stores 2 0 0 (n=0) 0 (n=0)
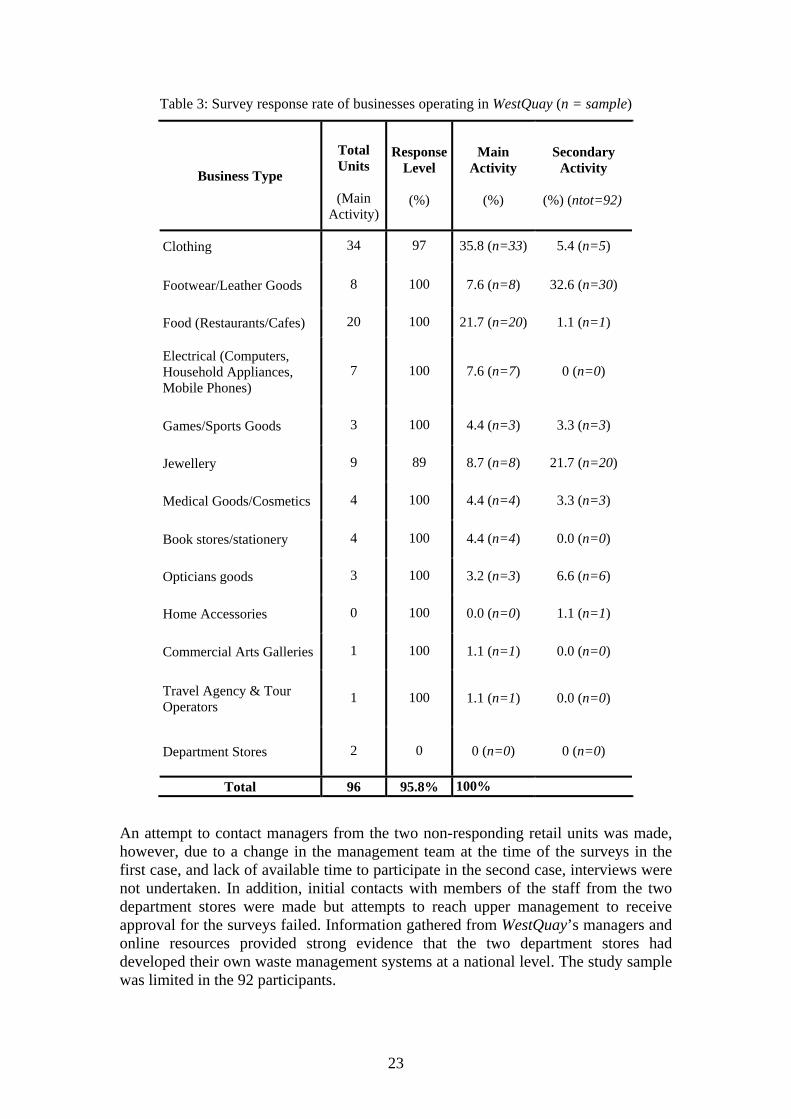
Total 96 95.8% 100% An attempt to contact managers from the two non-responding retail units was made, however, due to a change in the management team at the time of the surveys in the first case, and lack of available time to participate in the second case, interviews were not undertaken. In addition, initial contacts with members of the staff from the two department stores were made but attempts to reach upper management to receive approval for the surveys failed. Information gathered from WestQuay’s managers and online resources provided strong evidence that the two department stores had developed their own waste management systems at a national level. The study sample was limited in the 92 participants.
24
5.2 Waste Logistics Management Practices
Respondents were asked to describe the waste logistics practices adopted by their business. The shopping centre holds certificates for General Waste disposal and has the right to collect, treat and dispose of retailers waste through the provision of the necessary Transfer Notes to tenants, under an agreed annual waste management service charge. Individual businesses are given the option to join the centrally organised waste collection system, or make their own arrangements with private contractors. The results suggested that 91 stores joined WestQuay’s central waste management scheme (Figure 9), collecting their general mixed waste, cardboard and polythene and in doing so, some retailers were opting out of their own corporate waste management practices. As part of the scheme, special disposal bins located in the two internal service bays were available for the collection of end-of-life fluorescent lighting tubes. Twelve stores indicated that they replaced tubes themselves and disposed of them into WestQuay’s bins on a regular basis. Three more stores indicated that end-of-life tubes were normally collected by contracted electrical/maintenance companies servicing the stores on a regular basis, however, members of staff would occasionally replace tubes themselves and dispose of them in WestQuay’s bins. In addition, bins for the collection of excess or broken plastic hangers were made available in the designated collection points servicing the stores selling clothing. WestQuay also collected (on request) various other waste arisings. These included empty detergent bottles, spent aerosols, glass cleaning products, broken glass, and discarded end-of-life electrical and electronic equipment used in the operation of the stores (e.g. fridges, cash machines, computers). The survey identified that 23% (n=21) of the stores that joined WestQuay’s waste management scheme were also producing confidential paper waste and/or hazardous wastes such as WEEE, medical waste, end-of-life batteries and/or used cooking oil. In addition 90% (n=83) of all participant businesses (n=92) were producing end-of-life fluorescent lighting tubes which along with the other hazardous wastes were collected by either specialised waste contractors (71%, n=59), by WestQuay (14.5%, n=12), or were back-loaded using the existing delivery vehicles to other locations in the supply chain such as head offices or distribution centres (4%, n=3) or were managed through other means (10.5%, n=9). These collections are analysed in more detail in the following sections. In only one case were collections entirely organised by the businesses head office. This store selling clothing, footwear and other sports equipment belongs to a group of 375 stores in the UK which has developed its own waste management scheme and runs a fleet of 40 trailers and 131 company cars to deliver products and backfill waste. The company recycles its waste paper, cardboard and plastic (and occasionally ink toners, redundant IT equipment and light bulbs) within its national distribution centre in Shirebrook. In 2008, 60 tonnes of waste paper, 5557 tonnes of cardboard and 860 tonnes of baled plastic were recycled in Shirebrook reducing the amount of waste sent to landfill to 1400 tonnes.
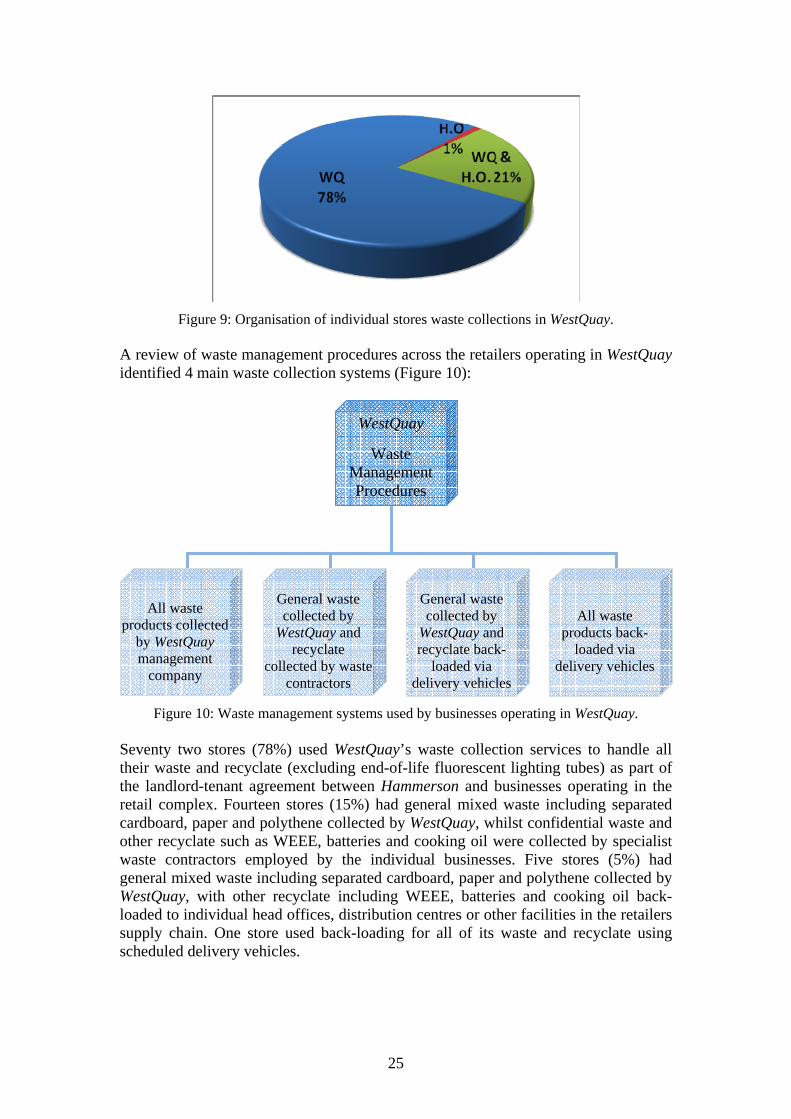
25
Figure 9: Organisation of individual stores waste collections in WestQuay.
A review of waste management procedures across the retailers operating in WestQuay identified 4 main waste collection systems (Figure 10):
Figure 10: Waste management systems used by businesses operating in WestQuay.
Seventy two stores (78%) used WestQuay’s waste collection services to handle all their waste and recyclate (excluding end-of-life fluorescent lighting tubes) as part of the landlord-tenant agreement between Hammerson and businesses operating in the retail complex. Fourteen stores (15%) had general mixed waste including separated cardboard, paper and polythene collected by WestQuay, whilst confidential waste and other recyclate such as WEEE, batteries and cooking oil were collected by specialist waste contractors employed by the individual businesses. Five stores (5%) had general mixed waste including separated cardboard, paper and polythene collected by WestQuay, with other recyclate including WEEE, batteries and cooking oil back-loaded to individual head offices, distribution centres or other facilities in the retailers supply chain. One store used back-loading for all of its waste and recyclate using scheduled delivery vehicles.
WestQuay
Waste Management Procedures
All waste
products collected by WestQuay management
company
General waste collected by
WestQuay and recyclate
collected by waste contractors
General waste collected by
WestQuay and recyclate back-
loaded via delivery vehicles
All waste products back-
loaded via delivery vehicles
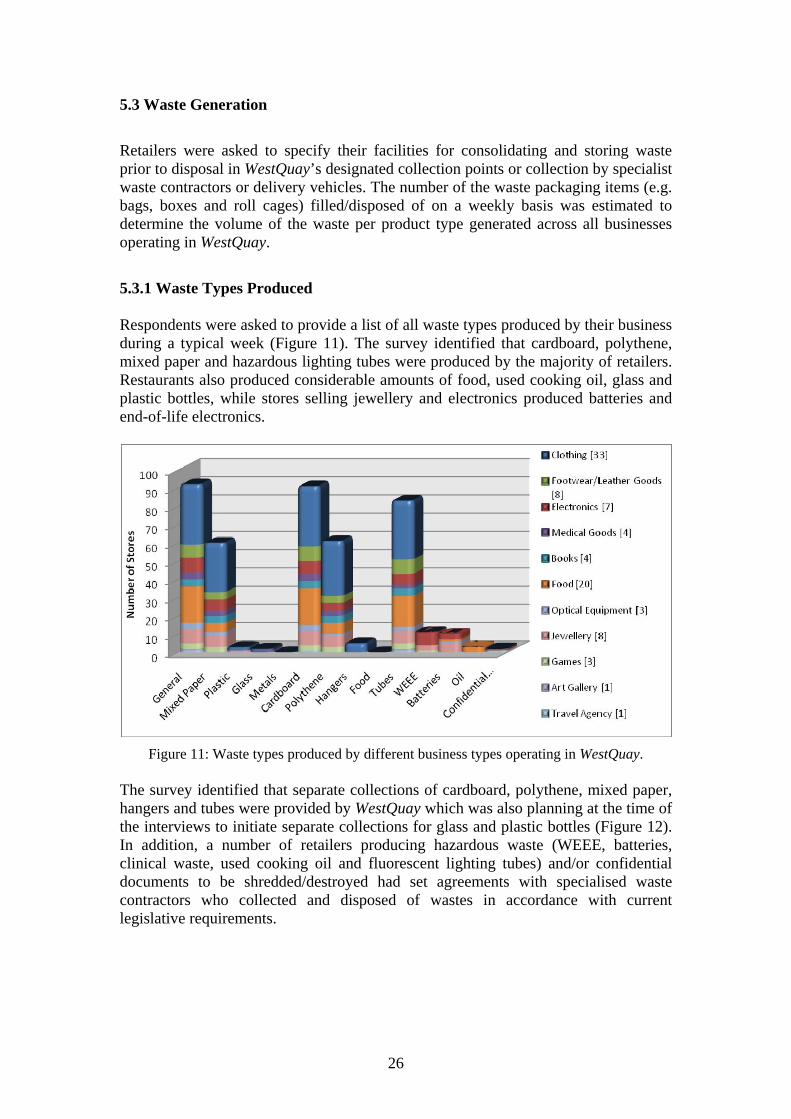
26
5.3 Waste Generation
Retailers were asked to specify their facilities for consolidating and storing waste prior to disposal in WestQuay’s designated collection points or collection by specialist waste contractors or delivery vehicles. The number of the waste packaging items (e.g. bags, boxes and roll cages) filled/disposed of on a weekly basis was estimated to determine the volume of the waste per product type generated across all businesses operating in WestQuay.
5.3.1 Waste Types Produced Respondents were asked to provide a list of all waste types produced by their business during a typical week (Figure 11). The survey identified that cardboard, polythene, mixed paper and hazardous lighting tubes were produced by the majority of retailers. Restaurants also produced considerable amounts of food, used cooking oil, glass and plastic bottles, while stores selling jewellery and electronics produced batteries and end-of-life electronics.
Figure 11: Waste types produced by different business types operating in WestQuay.
The survey identified that separate collections of cardboard, polythene, mixed paper, hangers and tubes were provided by WestQuay which was also planning at the time of the interviews to initiate separate collections for glass and plastic bottles (Figure 12). In addition, a number of retailers producing hazardous waste (WEEE, batteries, clinical waste, used cooking oil and fluorescent lighting tubes) and/or confidential documents to be shredded/destroyed had set agreements with specialised waste contractors who collected and disposed of wastes in accordance with current legislative requirements.
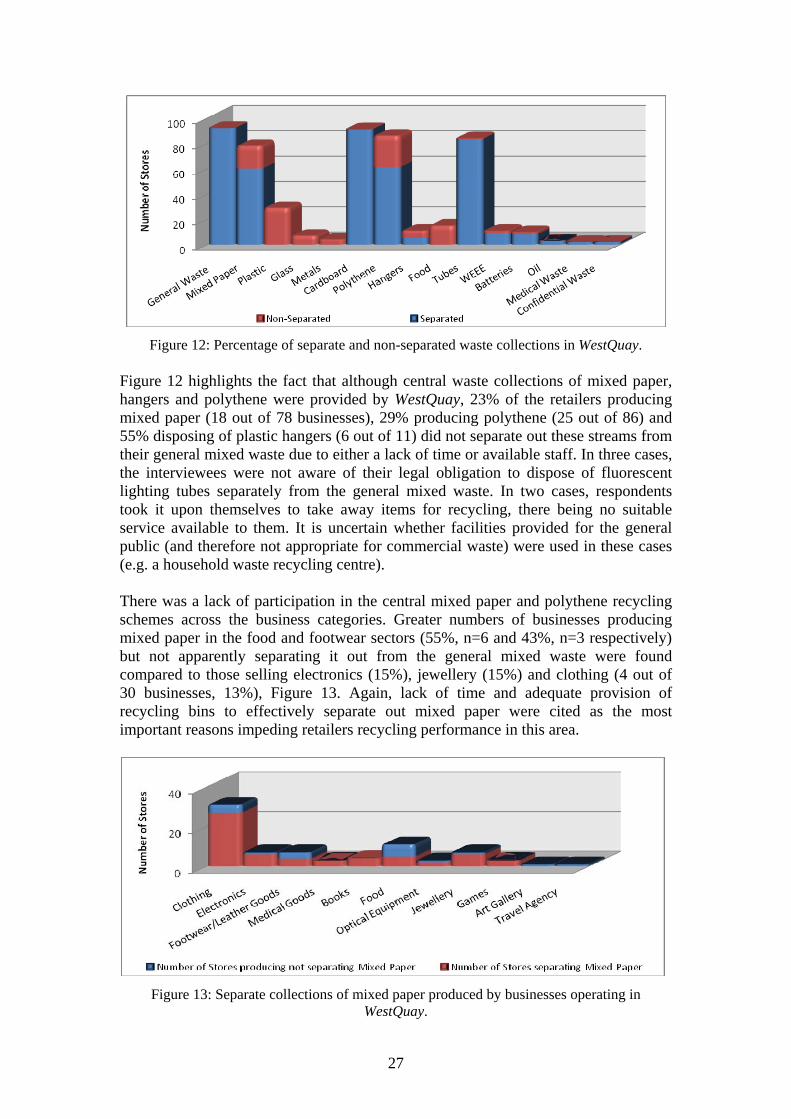
27
Figure 12: Percentage of separate and non-separated waste collections in WestQuay. Figure 12 highlights the fact that although central waste collections of mixed paper, hangers and polythene were provided by WestQuay, 23% of the retailers producing mixed paper (18 out of 78 businesses), 29% producing polythene (25 out of 86) and 55% disposing of plastic hangers (6 out of 11) did not separate out these streams from their general mixed waste due to either a lack of time or available staff. In three cases, the interviewees were not aware of their legal obligation to dispose of fluorescent lighting tubes separately from the general mixed waste. In two cases, respondents took it upon themselves to take away items for recycling, there being no suitable service available to them. It is uncertain whether facilities provided for the general public (and therefore not appropriate for commercial waste) were used in these cases (e.g. a household waste recycling centre). There was a lack of participation in the central mixed paper and polythene recycling schemes across the business categories. Greater numbers of businesses producing mixed paper in the food and footwear sectors (55%, n=6 and 43%, n=3 respectively) but not apparently separating it out from the general mixed waste were found compared to those selling electronics (15%), jewellery (15%) and clothing (4 out of 30 businesses, 13%), Figure 13. Again, lack of time and adequate provision of recycling bins to effectively separate out mixed paper were cited as the most important reasons impeding retailers recycling performance in this area.
Figure 13: Separate collections of mixed paper produced by businesses operating in WestQuay.
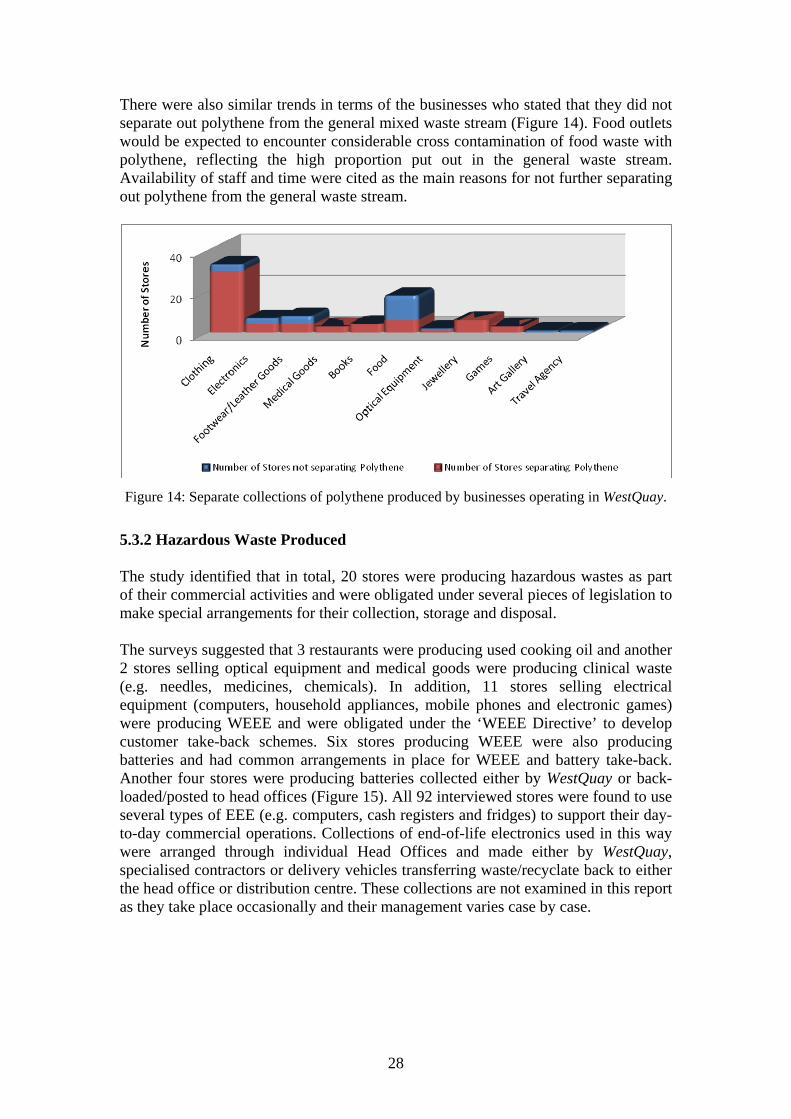
28
There were also similar trends in terms of the businesses who stated that they did not separate out polythene from the general mixed waste stream (Figure 14). Food outlets would be expected to encounter considerable cross contamination of food waste with polythene, reflecting the high proportion put out in the general waste stream. Availability of staff and time were cited as the main reasons for not further separating out polythene from the general waste stream.
Figure 14: Separate collections of polythene produced by businesses operating in WestQuay.
5.3.2 Hazardous Waste Produced The study identified that in total, 20 stores were producing hazardous wastes as part of their commercial activities and were obligated under several pieces of legislation to make special arrangements for their collection, storage and disposal. The surveys suggested that 3 restaurants were producing used cooking oil and another 2 stores selling optical equipment and medical goods were producing clinical waste (e.g. needles, medicines, chemicals). In addition, 11 stores selling electrical equipment (computers, household appliances, mobile phones and electronic games) were producing WEEE and were obligated under the ‘WEEE Directive’ to develop customer take-back schemes. Six stores producing WEEE were also producing batteries and had common arrangements in place for WEEE and battery take-back. Another four stores were producing batteries collected either by WestQuay or back-loaded/posted to head offices (Figure 15). All 92 interviewed stores were found to use several types of EEE (e.g. computers, cash registers and fridges) to support their day-to-day commercial operations. Collections of end-of-life electronics used in this way were arranged through individual Head Offices and made either by WestQuay, specialised contractors or delivery vehicles transferring waste/recyclate back to either the head office or distribution centre. These collections are not examined in this report as they take place occasionally and their management varies case by case.
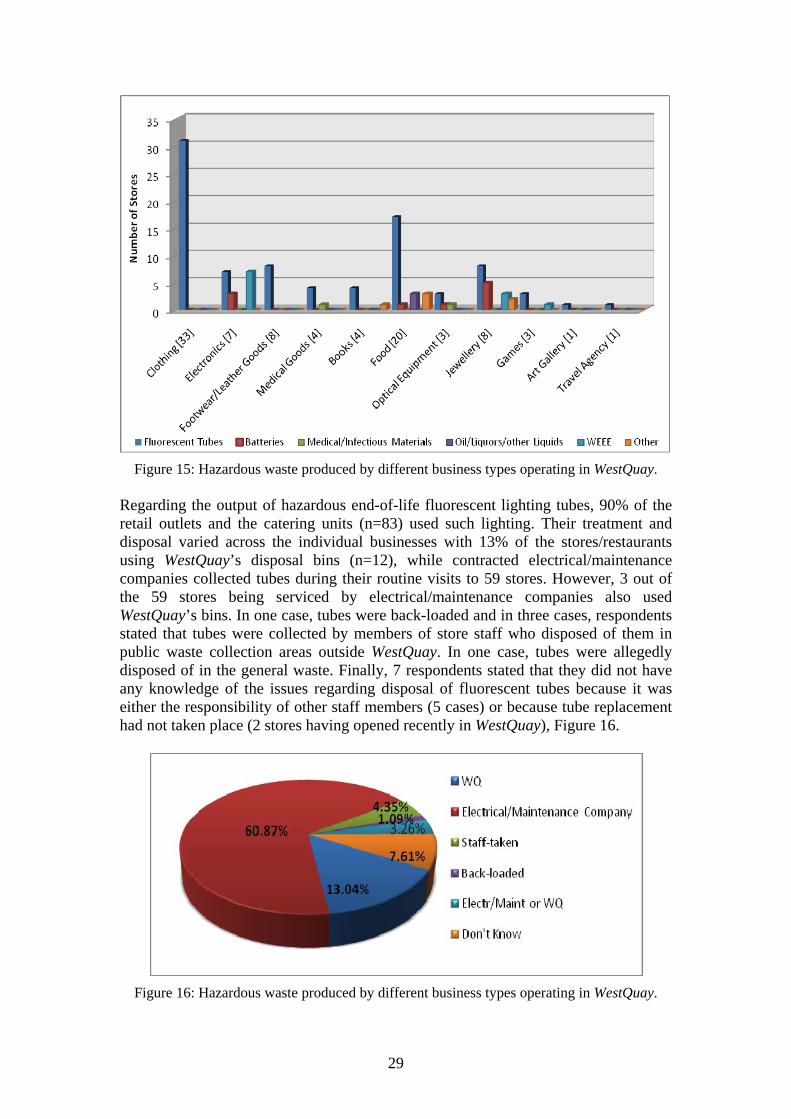
29
Figure 15: Hazardous waste produced by different business types operating in WestQuay.
Regarding the output of hazardous end-of-life fluorescent lighting tubes, 90% of the retail outlets and the catering units (n=83) used such lighting. Their treatment and disposal varied across the individual businesses with 13% of the stores/restaurants using WestQuay’s disposal bins (n=12), while contracted electrical/maintenance companies collected tubes during their routine visits to 59 stores. However, 3 out of the 59 stores being serviced by electrical/maintenance companies also used WestQuay’s bins. In one case, tubes were back-loaded and in three cases, respondents stated that tubes were collected by members of store staff who disposed of them in public waste collection areas outside WestQuay. In one case, tubes were allegedly disposed of in the general waste. Finally, 7 respondents stated that they did not have any knowledge of the issues regarding disposal of fluorescent tubes because it was either the responsibility of other staff members (5 cases) or because tube replacement had not taken place (2 stores having opened recently in WestQuay), Figure 16.
Figure 16: Hazardous waste produced by different business types operating in WestQuay.
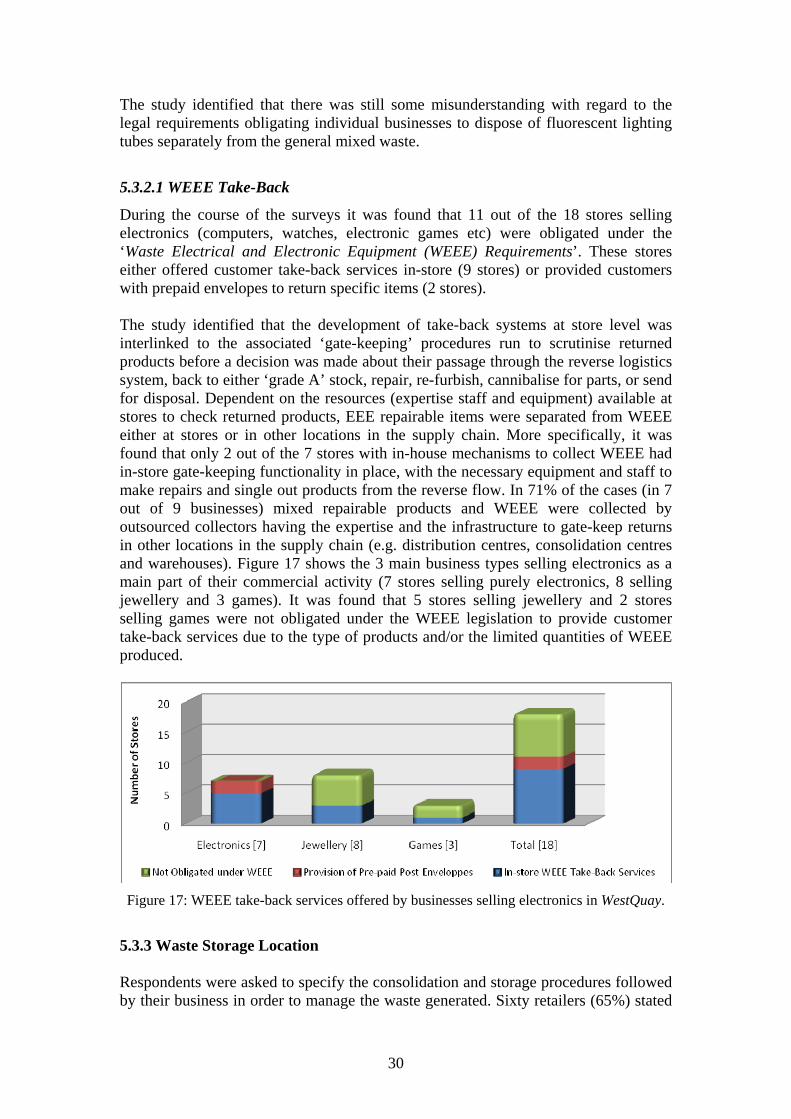
30
The study identified that there was still some misunderstanding with regard to the legal requirements obligating individual businesses to dispose of fluorescent lighting tubes separately from the general mixed waste.
5.3.2.1 WEEE Take-Back
During the course of the surveys it was found that 11 out of the 18 stores selling electronics (computers, watches, electronic games etc) were obligated under the ‘Waste Electrical and Electronic Equipment (WEEE) Requirements’. These stores either offered customer take-back services in-store (9 stores) or provided customers with prepaid envelopes to return specific items (2 stores). The study identified that the development of take-back systems at store level was interlinked to the associated ‘gate-keeping’ procedures run to scrutinise returned products before a decision was made about their passage through the reverse logistics system, back to either ‘grade A’ stock, repair, re-furbish, cannibalise for parts, or send for disposal. Dependent on the resources (expertise staff and equipment) available at stores to check returned products, EEE repairable items were separated from WEEE either at stores or in other locations in the supply chain. More specifically, it was found that only 2 out of the 7 stores with in-house mechanisms to collect WEEE had in-store gate-keeping functionality in place, with the necessary equipment and staff to make repairs and single out products from the reverse flow. In 71% of the cases (in 7 out of 9 businesses) mixed repairable products and WEEE were collected by outsourced collectors having the expertise and the infrastructure to gate-keep returns in other locations in the supply chain (e.g. distribution centres, consolidation centres and warehouses). Figure 17 shows the 3 main business types selling electronics as a main part of their commercial activity (7 stores selling purely electronics, 8 selling jewellery and 3 games). It was found that 5 stores selling jewellery and 2 stores selling games were not obligated under the WEEE legislation to provide customer take-back services due to the type of products and/or the limited quantities of WEEE produced.
Figure 17: WEEE take-back services offered by businesses selling electronics in WestQuay.
5.3.3 Waste Storage Location Respondents were asked to specify the consolidation and storage procedures followed by their business in order to manage the waste generated. Sixty retailers (65%) stated
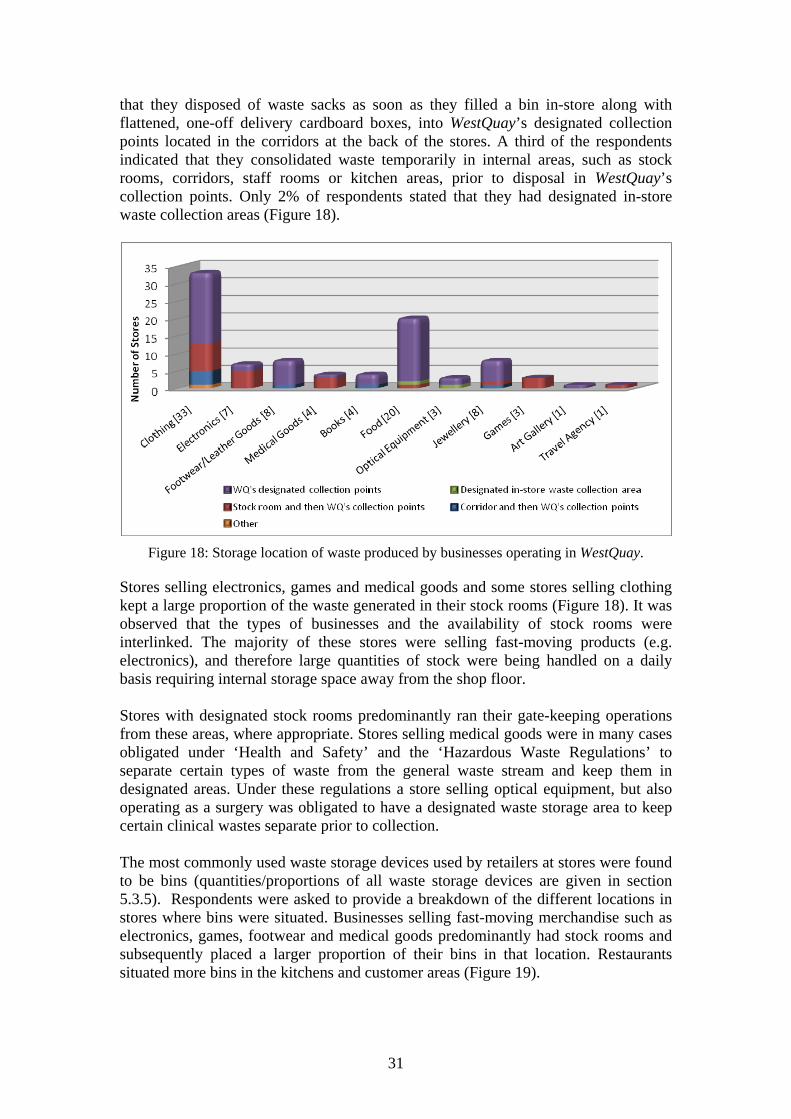
31
that they disposed of waste sacks as soon as they filled a bin in-store along with flattened, one-off delivery cardboard boxes, into WestQuay’s designated collection points located in the corridors at the back of the stores. A third of the respondents indicated that they consolidated waste temporarily in internal areas, such as stock rooms, corridors, staff rooms or kitchen areas, prior to disposal in WestQuay’s collection points. Only 2% of respondents stated that they had designated in-store waste collection areas (Figure 18).
Figure 18: Storage location of waste produced by businesses operating in WestQuay.
Stores selling electronics, games and medical goods and some stores selling clothing kept a large proportion of the waste generated in their stock rooms (Figure 18). It was observed that the types of businesses and the availability of stock rooms were interlinked. The majority of these stores were selling fast-moving products (e.g. electronics), and therefore large quantities of stock were being handled on a daily basis requiring internal storage space away from the shop floor. Stores with designated stock rooms predominantly ran their gate-keeping operations from these areas, where appropriate. Stores selling medical goods were in many cases obligated under ‘Health and Safety’ and the ‘Hazardous Waste Regulations’ to separate certain types of waste from the general waste stream and keep them in designated areas. Under these regulations a store selling optical equipment, but also operating as a surgery was obligated to have a designated waste storage area to keep certain clinical wastes separate prior to collection. The most commonly used waste storage devices used by retailers at stores were found to be bins (quantities/proportions of all waste storage devices are given in section 5.3.5). Respondents were asked to provide a breakdown of the different locations in stores where bins were situated. Businesses selling fast-moving merchandise such as electronics, games, footwear and medical goods predominantly had stock rooms and subsequently placed a larger proportion of their bins in that location. Restaurants situated more bins in the kitchens and customer areas (Figure 19).
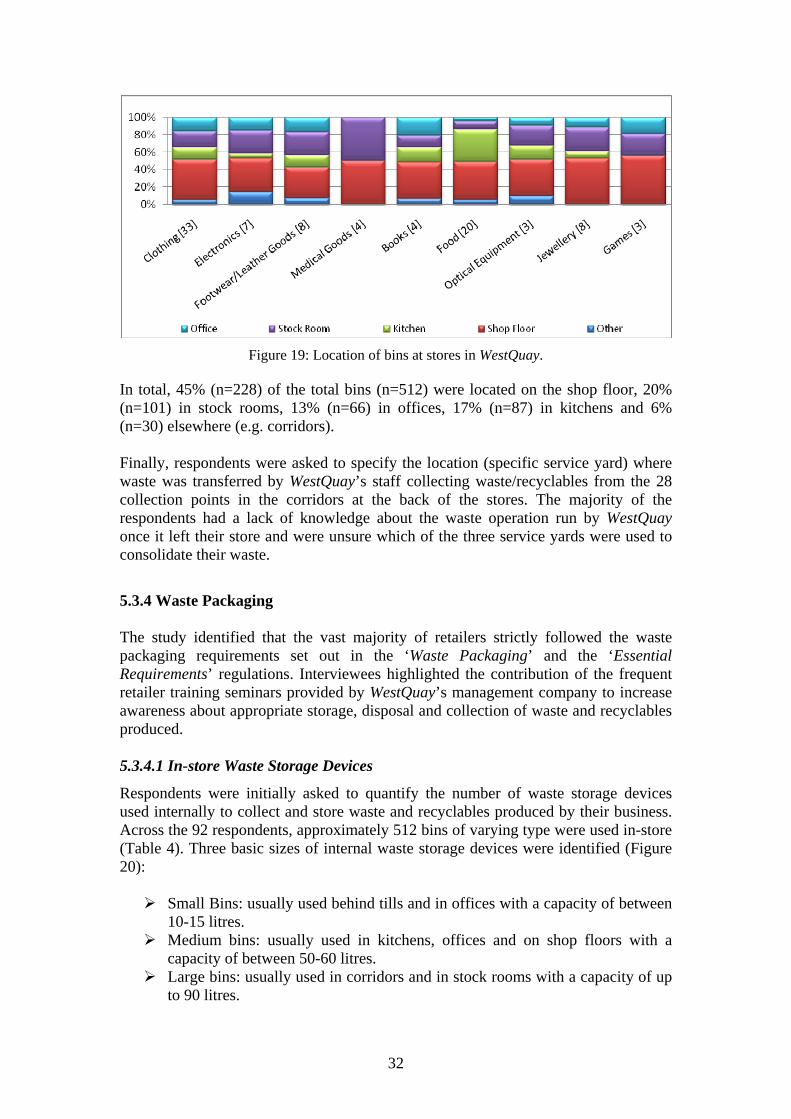
32
Figure 19: Location of bins at stores in WestQuay.
In total, 45% (n=228) of the total bins (n=512) were located on the shop floor, 20% (n=101) in stock rooms, 13% (n=66) in offices, 17% (n=87) in kitchens and 6% (n=30) elsewhere (e.g. corridors). Finally, respondents were asked to specify the location (specific service yard) where waste was transferred by WestQuay’s staff collecting waste/recyclables from the 28 collection points in the corridors at the back of the stores. The majority of the respondents had a lack of knowledge about the waste operation run by WestQuay once it left their store and were unsure which of the three service yards were used to consolidate their waste.
5.3.4 Waste Packaging The study identified that the vast majority of retailers strictly followed the waste packaging requirements set out in the ‘Waste Packaging’ and the ‘Essential Requirements’ regulations. Interviewees highlighted the contribution of the frequent retailer training seminars provided by WestQuay’s management company to increase awareness about appropriate storage, disposal and collection of waste and recyclables produced. 5.3.4.1 In-store Waste Storage Devices
Respondents were initially asked to quantify the number of waste storage devices used internally to collect and store waste and recyclables produced by their business. Across the 92 respondents, approximately 512 bins of varying type were used in-store (Table 4). Three basic sizes of internal waste storage devices were identified (Figure 20):
Small Bins: usually used behind tills and in offices with a capacity of between 10-15 litres.
Medium bins: usually used in kitchens, offices and on shop floors with a capacity of between 50-60 litres.
Large bins: usually used in corridors and in stock rooms with a capacity of up to 90 litres.
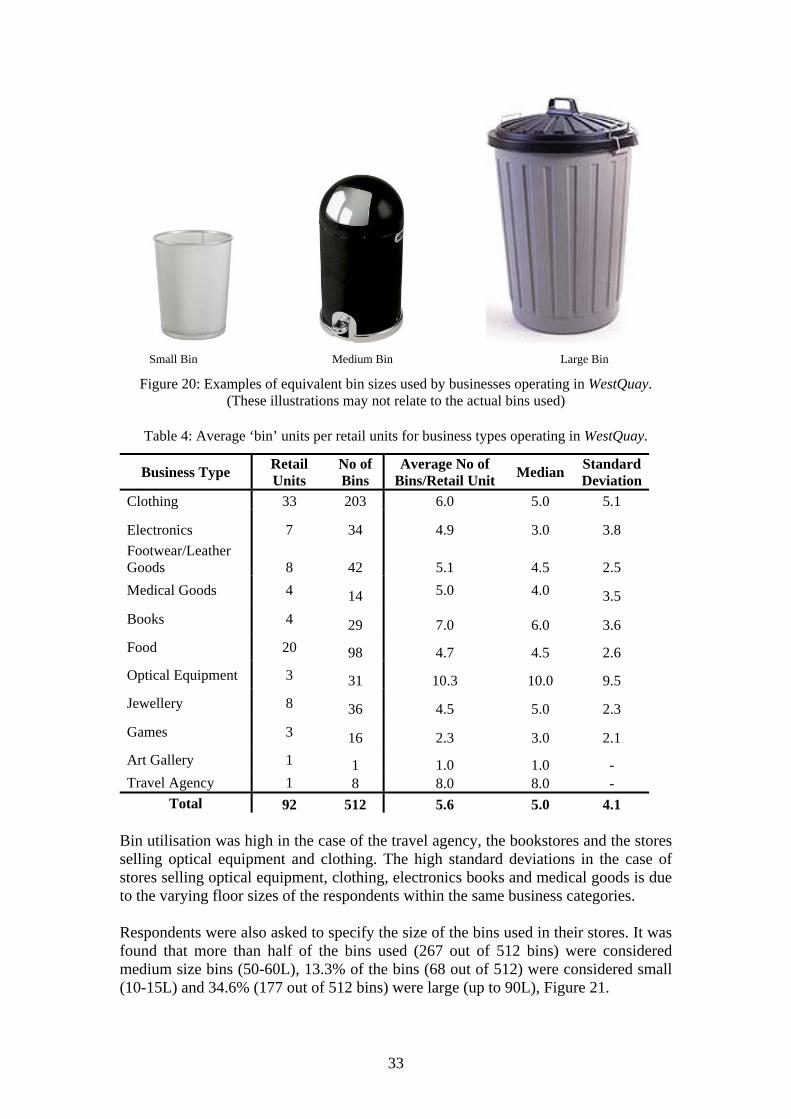
33
Small Bin Medium Bin Large Bin
Figure 20: Examples of equivalent bin sizes used by businesses operating in WestQuay. (These illustrations may not relate to the actual bins used)
Table 4: Average ‘bin’ units per retail units for business types operating in WestQuay.
Business Type Retail Units
No of Bins
Average No of Bins/Retail Unit Median Standard
Deviation Clothing 33 203 6.0 5.0 5.1
Electronics 7 34 4.9 3.0 3.8 Footwear/Leather Goods 8 42 5.1 4.5 2.5 Medical Goods 4 14 5.0 4.0 3.5 Books 4 29 7.0 6.0 3.6 Food 20 98 4.7 4.5 2.6 Optical Equipment 3 31 10.3 10.0 9.5 Jewellery 8 36 4.5 5.0 2.3 Games 3 16 2.3 3.0 2.1 Art Gallery 1 1 1.0 1.0 - Travel Agency 1 8 8.0 8.0 -
Total 92 512 5.6 5.0 4.1 Bin utilisation was high in the case of the travel agency, the bookstores and the stores selling optical equipment and clothing. The high standard deviations in the case of stores selling optical equipment, clothing, electronics books and medical goods is due to the varying floor sizes of the respondents within the same business categories. Respondents were also asked to specify the size of the bins used in their stores. It was found that more than half of the bins used (267 out of 512 bins) were considered medium size bins (50-60L), 13.3% of the bins (68 out of 512) were considered small (10-15L) and 34.6% (177 out of 512 bins) were large (up to 90L), Figure 21.
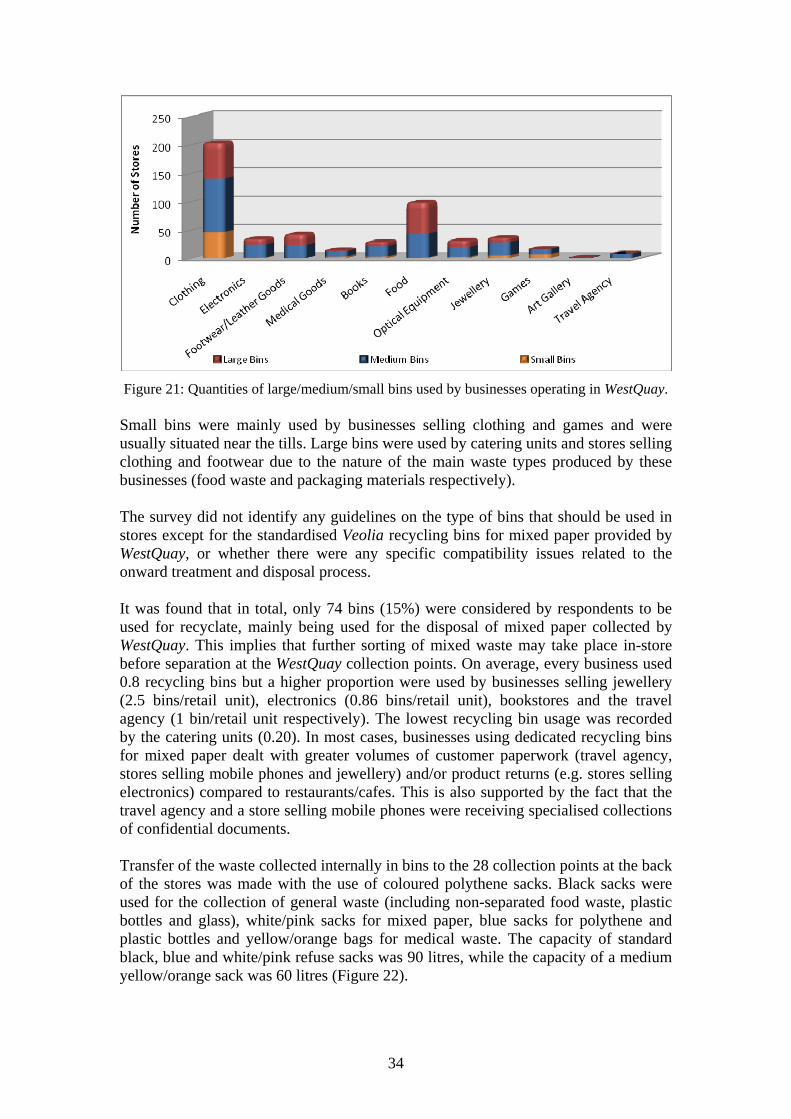
34
Figure 21: Quantities of large/medium/small bins used by businesses operating in WestQuay. Small bins were mainly used by businesses selling clothing and games and were usually situated near the tills. Large bins were used by catering units and stores selling clothing and footwear due to the nature of the main waste types produced by these businesses (food waste and packaging materials respectively). The survey did not identify any guidelines on the type of bins that should be used in stores except for the standardised Veolia recycling bins for mixed paper provided by WestQuay, or whether there were any specific compatibility issues related to the onward treatment and disposal process. It was found that in total, only 74 bins (15%) were considered by respondents to be used for recyclate, mainly being used for the disposal of mixed paper collected by WestQuay. This implies that further sorting of mixed waste may take place in-store before separation at the WestQuay collection points. On average, every business used 0.8 recycling bins but a higher proportion were used by businesses selling jewellery (2.5 bins/retail unit), electronics (0.86 bins/retail unit), bookstores and the travel agency (1 bin/retail unit respectively). The lowest recycling bin usage was recorded by the catering units (0.20). In most cases, businesses using dedicated recycling bins for mixed paper dealt with greater volumes of customer paperwork (travel agency, stores selling mobile phones and jewellery) and/or product returns (e.g. stores selling electronics) compared to restaurants/cafes. This is also supported by the fact that the travel agency and a store selling mobile phones were receiving specialised collections of confidential documents. Transfer of the waste collected internally in bins to the 28 collection points at the back of the stores was made with the use of coloured polythene sacks. Black sacks were used for the collection of general waste (including non-separated food waste, plastic bottles and glass), white/pink sacks for mixed paper, blue sacks for polythene and plastic bottles and yellow/orange bags for medical waste. The capacity of standard black, blue and white/pink refuse sacks was 90 litres, while the capacity of a medium yellow/orange sack was 60 litres (Figure 22).
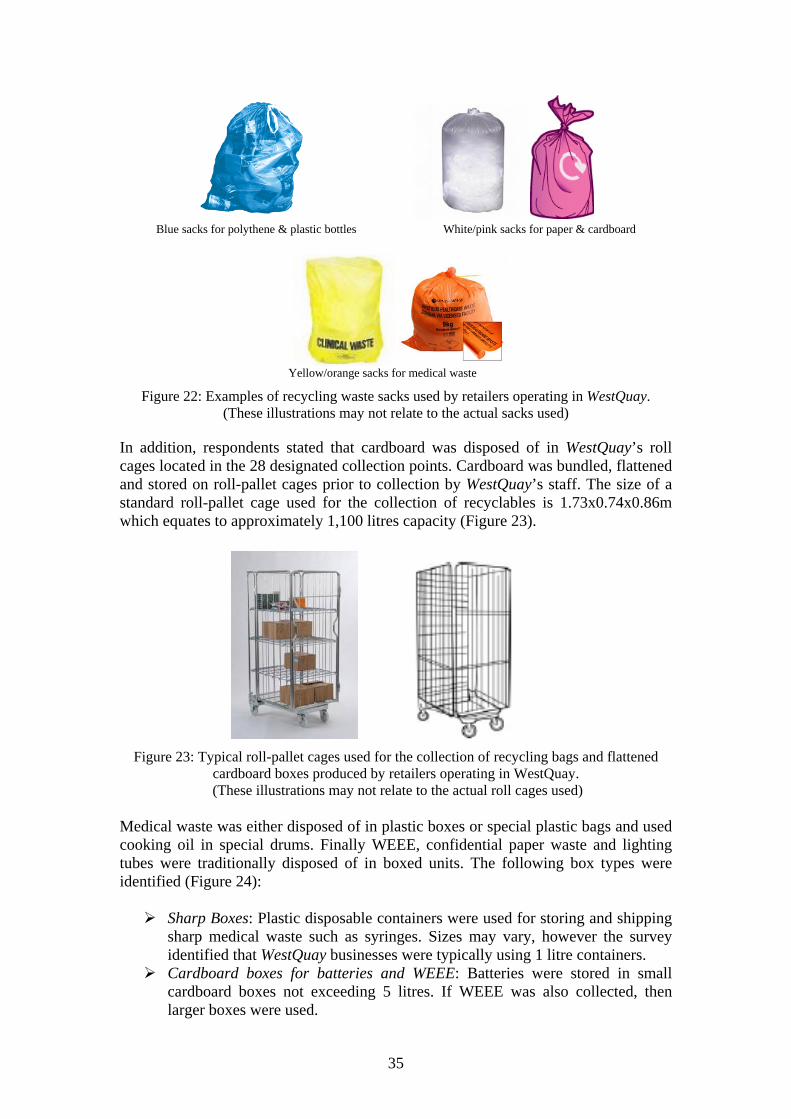
35
Blue sacks for polythene & plastic bottles White/pink sacks for paper & cardboard
Yellow/orange sacks for medical waste
Figure 22: Examples of recycling waste sacks used by retailers operating in WestQuay. (These illustrations may not relate to the actual sacks used)
In addition, respondents stated that cardboard was disposed of in WestQuay’s roll cages located in the 28 designated collection points. Cardboard was bundled, flattened and stored on roll-pallet cages prior to collection by WestQuay’s staff. The size of a standard roll-pallet cage used for the collection of recyclables is 1.73x0.74x0.86m which equates to approximately 1,100 litres capacity (Figure 23).
Figure 23: Typical roll-pallet cages used for the collection of recycling bags and flattened cardboard boxes produced by retailers operating in WestQuay.
(These illustrations may not relate to the actual roll cages used)
Medical waste was either disposed of in plastic boxes or special plastic bags and used cooking oil in special drums. Finally WEEE, confidential paper waste and lighting tubes were traditionally disposed of in boxed units. The following box types were identified (Figure 24):
Sharp Boxes: Plastic disposable containers were used for storing and shipping sharp medical waste such as syringes. Sizes may vary, however the survey identified that WestQuay businesses were typically using 1 litre containers.
Cardboard boxes for batteries and WEEE: Batteries were stored in small cardboard boxes not exceeding 5 litres. If WEEE was also collected, then larger boxes were used.
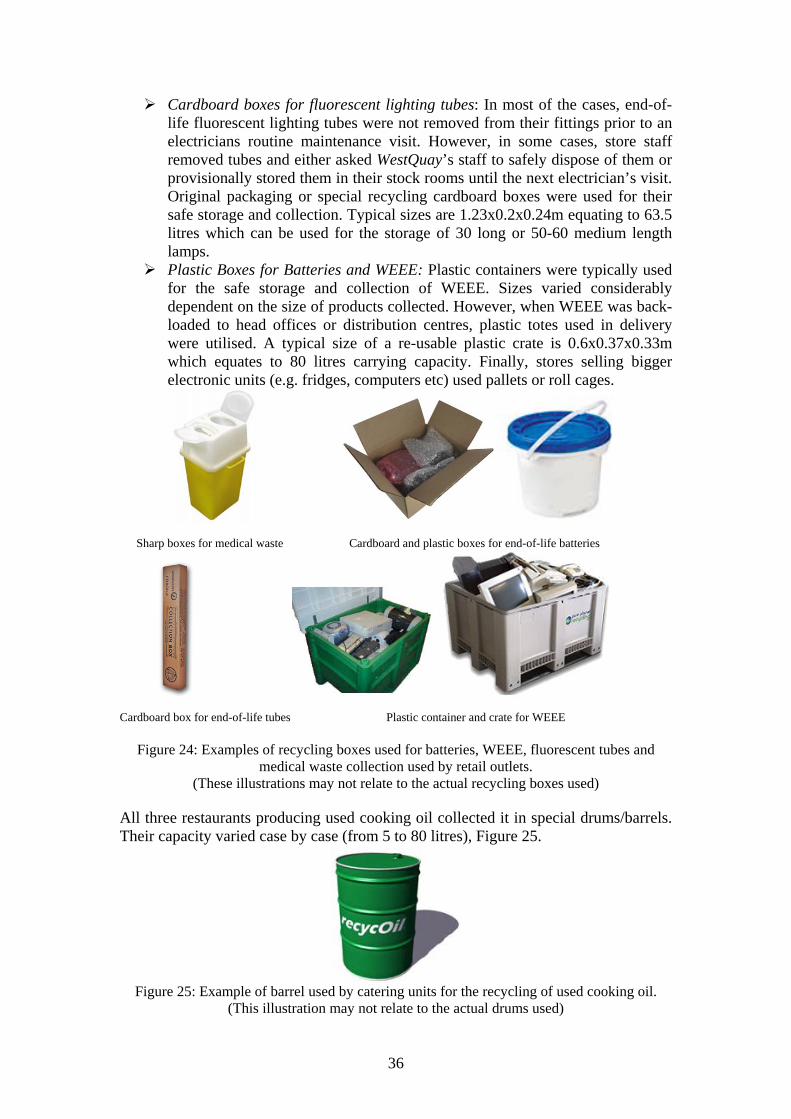
36
Cardboard boxes for fluorescent lighting tubes: In most of the cases, end-of-life fluorescent lighting tubes were not removed from their fittings prior to an electricians routine maintenance visit. However, in some cases, store staff removed tubes and either asked WestQuay’s staff to safely dispose of them or provisionally stored them in their stock rooms until the next electrician’s visit. Original packaging or special recycling cardboard boxes were used for their safe storage and collection. Typical sizes are 1.23x0.2x0.24m equating to 63.5 litres which can be used for the storage of 30 long or 50-60 medium length lamps.
Plastic Boxes for Batteries and WEEE: Plastic containers were typically used for the safe storage and collection of WEEE. Sizes varied considerably dependent on the size of products collected. However, when WEEE was back-loaded to head offices or distribution centres, plastic totes used in delivery were utilised. A typical size of a re-usable plastic crate is 0.6x0.37x0.33m which equates to 80 litres carrying capacity. Finally, stores selling bigger electronic units (e.g. fridges, computers etc) used pallets or roll cages.
Sharp boxes for medical waste Cardboard and plastic boxes for end-of-life batteries
Cardboard box for end-of-life tubes Plastic container and crate for WEEE
Figure 24: Examples of recycling boxes used for batteries, WEEE, fluorescent tubes and
medical waste collection used by retail outlets. (These illustrations may not relate to the actual recycling boxes used)
All three restaurants producing used cooking oil collected it in special drums/barrels. Their capacity varied case by case (from 5 to 80 litres), Figure 25.
Figure 25: Example of barrel used by catering units for the recycling of used cooking oil.
(This illustration may not relate to the actual drums used)
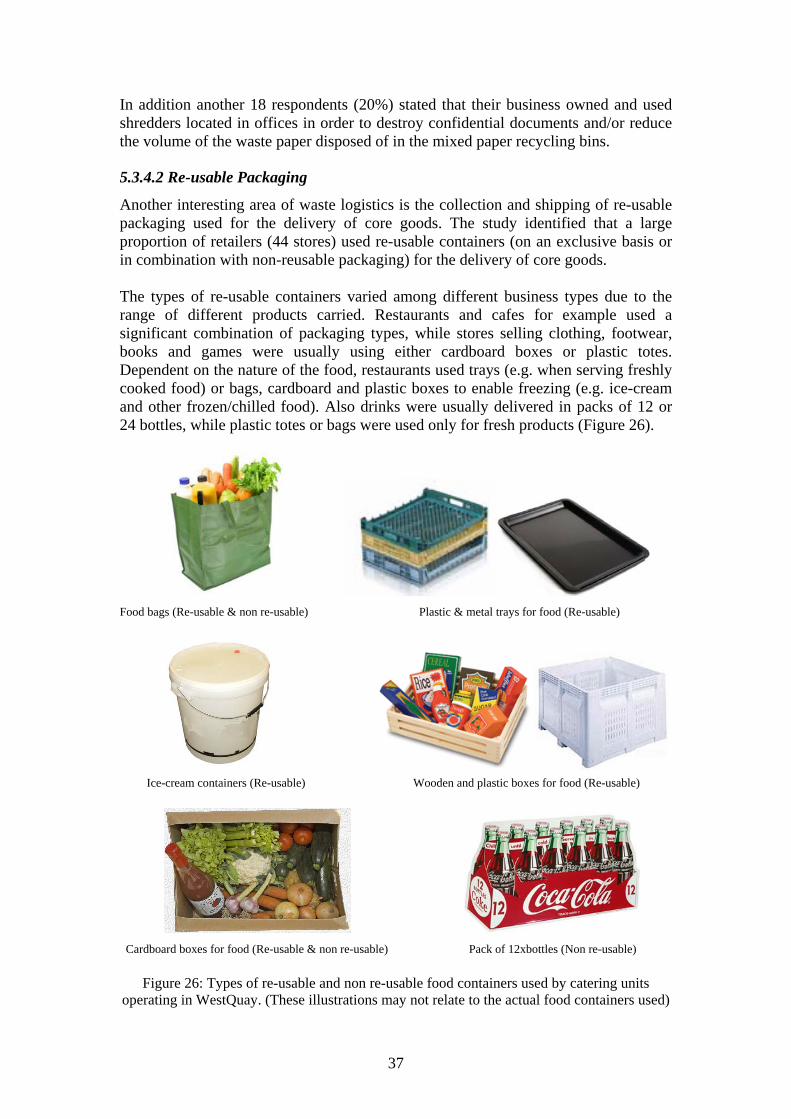
37
In addition another 18 respondents (20%) stated that their business owned and used shredders located in offices in order to destroy confidential documents and/or reduce the volume of the waste paper disposed of in the mixed paper recycling bins. 5.3.4.2 Re-usable Packaging
Another interesting area of waste logistics is the collection and shipping of re-usable packaging used for the delivery of core goods. The study identified that a large proportion of retailers (44 stores) used re-usable containers (on an exclusive basis or in combination with non-reusable packaging) for the delivery of core goods. The types of re-usable containers varied among different business types due to the range of different products carried. Restaurants and cafes for example used a significant combination of packaging types, while stores selling clothing, footwear, books and games were usually using either cardboard boxes or plastic totes. Dependent on the nature of the food, restaurants used trays (e.g. when serving freshly cooked food) or bags, cardboard and plastic boxes to enable freezing (e.g. ice-cream and other frozen/chilled food). Also drinks were usually delivered in packs of 12 or 24 bottles, while plastic totes or bags were used only for fresh products (Figure 26).
Food bags (Re-usable & non re-usable) Plastic & metal trays for food (Re-usable)
Ice-cream containers (Re-usable) Wooden and plastic boxes for food (Re-usable)
Cardboard boxes for food (Re-usable & non re-usable) Pack of 12xbottles (Non re-usable)
Figure 26: Types of re-usable and non re-usable food containers used by catering units operating in WestQuay. (These illustrations may not relate to the actual food containers used)
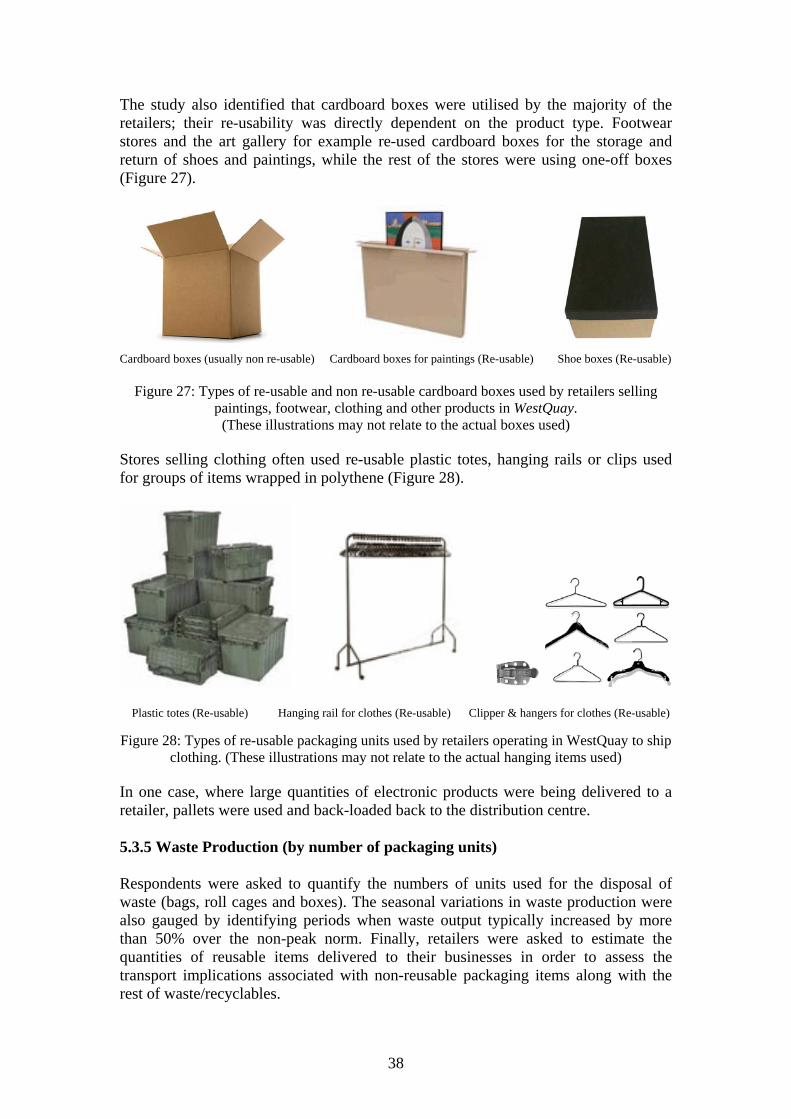
38
The study also identified that cardboard boxes were utilised by the majority of the retailers; their re-usability was directly dependent on the product type. Footwear stores and the art gallery for example re-used cardboard boxes for the storage and return of shoes and paintings, while the rest of the stores were using one-off boxes (Figure 27).
Cardboard boxes (usually non re-usable) Cardboard boxes for paintings (Re-usable) Shoe boxes (Re-usable)
Figure 27: Types of re-usable and non re-usable cardboard boxes used by retailers selling paintings, footwear, clothing and other products in WestQuay.
(These illustrations may not relate to the actual boxes used)
Stores selling clothing often used re-usable plastic totes, hanging rails or clips used for groups of items wrapped in polythene (Figure 28).
Plastic totes (Re-usable) Hanging rail for clothes (Re-usable) Clipper & hangers for clothes (Re-usable) Figure 28: Types of re-usable packaging units used by retailers operating in WestQuay to ship
clothing. (These illustrations may not relate to the actual hanging items used)
In one case, where large quantities of electronic products were being delivered to a retailer, pallets were used and back-loaded back to the distribution centre. 5.3.5 Waste Production (by number of packaging units) Respondents were asked to quantify the numbers of units used for the disposal of waste (bags, roll cages and boxes). The seasonal variations in waste production were also gauged by identifying periods when waste output typically increased by more than 50% over the non-peak norm. Finally, retailers were asked to estimate the quantities of reusable items delivered to their businesses in order to assess the transport implications associated with non-reusable packaging items along with the rest of waste/recyclables.
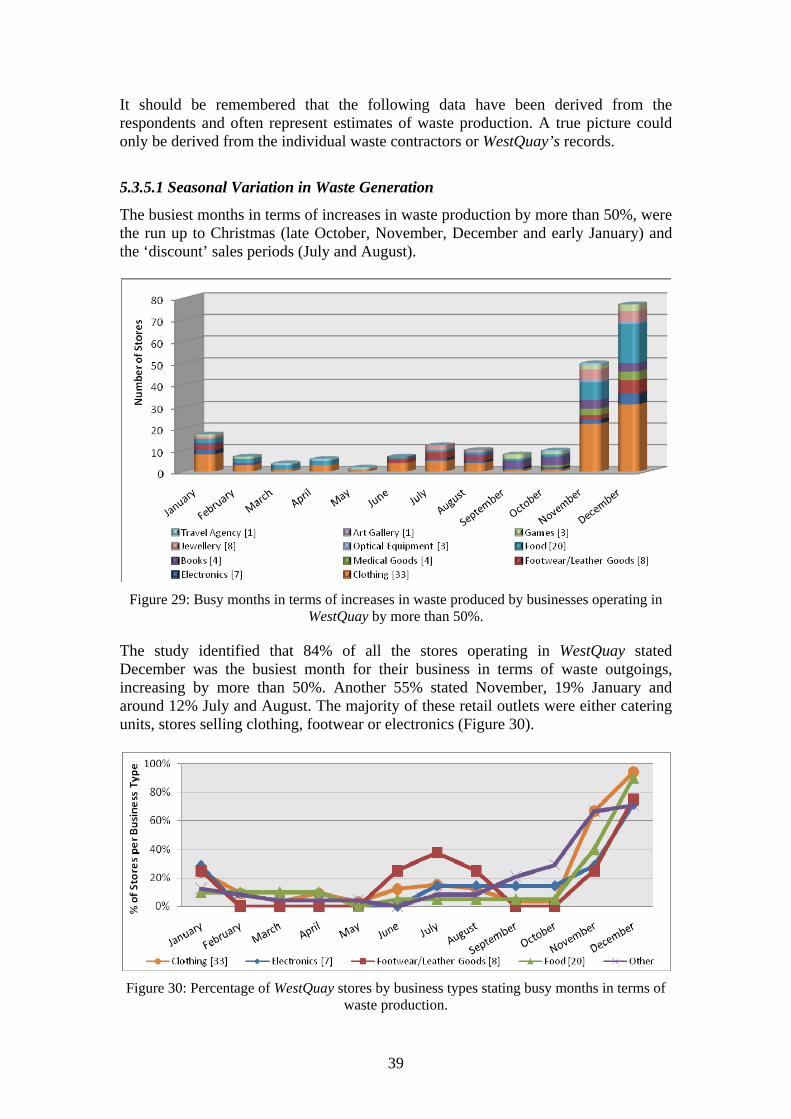
39
It should be remembered that the following data have been derived from the respondents and often represent estimates of waste production. A true picture could only be derived from the individual waste contractors or WestQuay’s records.
5.3.5.1 Seasonal Variation in Waste Generation
The busiest months in terms of increases in waste production by more than 50%, were the run up to Christmas (late October, November, December and early January) and the ‘discount’ sales periods (July and August).
Figure 29: Busy months in terms of increases in waste produced by businesses operating in
WestQuay by more than 50%.
The study identified that 84% of all the stores operating in WestQuay stated December was the busiest month for their business in terms of waste outgoings, increasing by more than 50%. Another 55% stated November, 19% January and around 12% July and August. The majority of these retail outlets were either catering units, stores selling clothing, footwear or electronics (Figure 30).
Figure 30: Percentage of WestQuay stores by business types stating busy months in terms of
waste production.
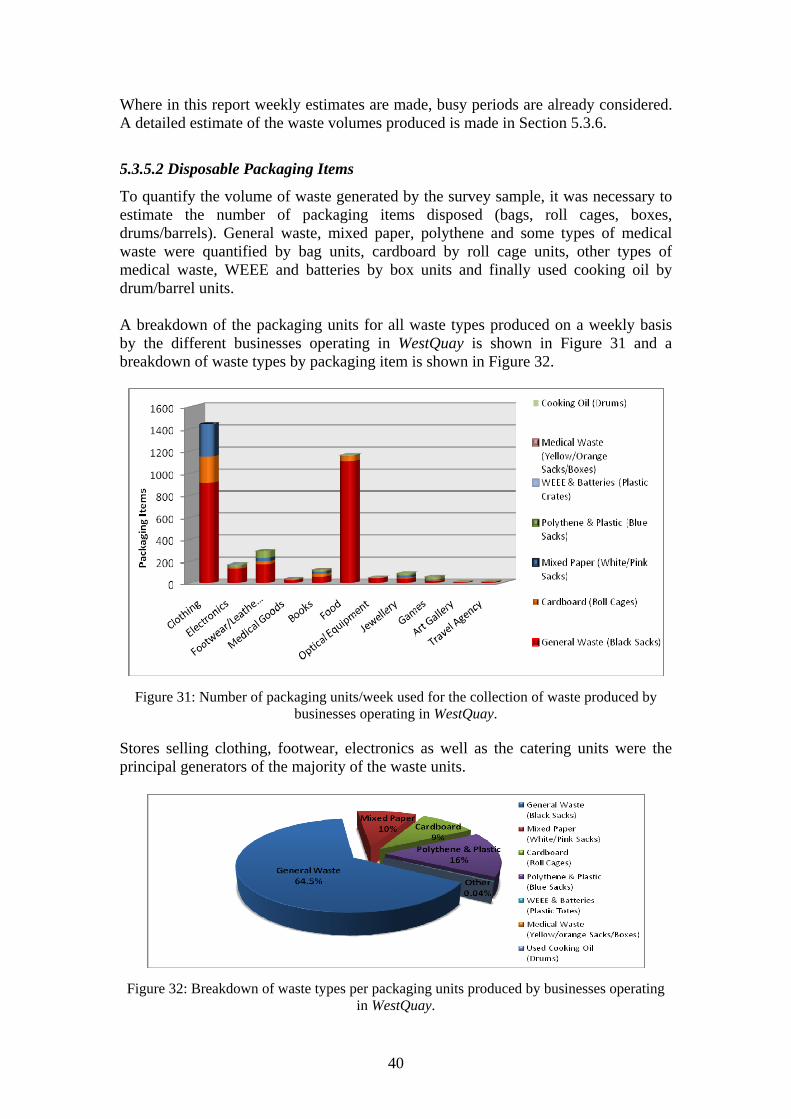
40
Where in this report weekly estimates are made, busy periods are already considered. A detailed estimate of the waste volumes produced is made in Section 5.3.6.
5.3.5.2 Disposable Packaging Items
To quantify the volume of waste generated by the survey sample, it was necessary to estimate the number of packaging items disposed (bags, roll cages, boxes, drums/barrels). General waste, mixed paper, polythene and some types of medical waste were quantified by bag units, cardboard by roll cage units, other types of medical waste, WEEE and batteries by box units and finally used cooking oil by drum/barrel units. A breakdown of the packaging units for all waste types produced on a weekly basis by the different businesses operating in WestQuay is shown in Figure 31 and a breakdown of waste types by packaging item is shown in Figure 32.
Figure 31: Number of packaging units/week used for the collection of waste produced by
businesses operating in WestQuay.
Stores selling clothing, footwear, electronics as well as the catering units were the principal generators of the majority of the waste units.
Figure 32: Breakdown of waste types per packaging units produced by businesses operating in WestQuay.
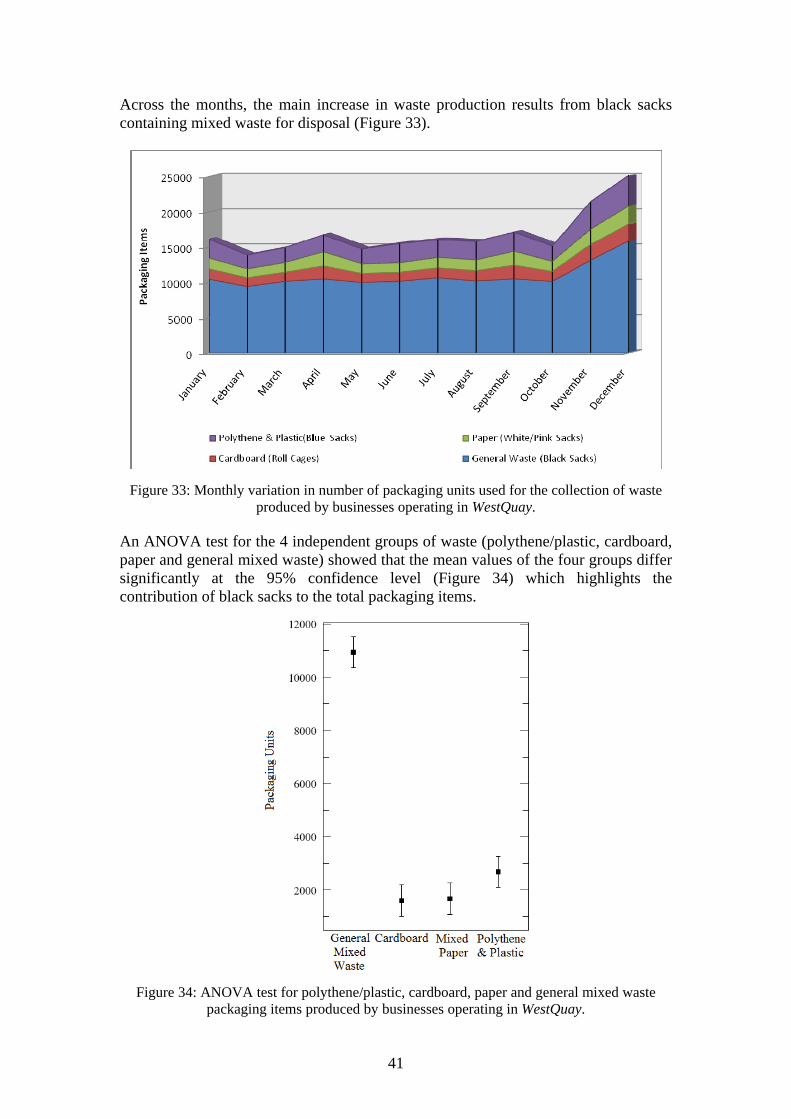
41
Across the months, the main increase in waste production results from black sacks containing mixed waste for disposal (Figure 33).
Figure 33: Monthly variation in number of packaging units used for the collection of waste
produced by businesses operating in WestQuay. An ANOVA test for the 4 independent groups of waste (polythene/plastic, cardboard, paper and general mixed waste) showed that the mean values of the four groups differ significantly at the 95% confidence level (Figure 34) which highlights the contribution of black sacks to the total packaging items.
Figure 34: ANOVA test for polythene/plastic, cardboard, paper and general mixed waste packaging items produced by businesses operating in WestQuay.
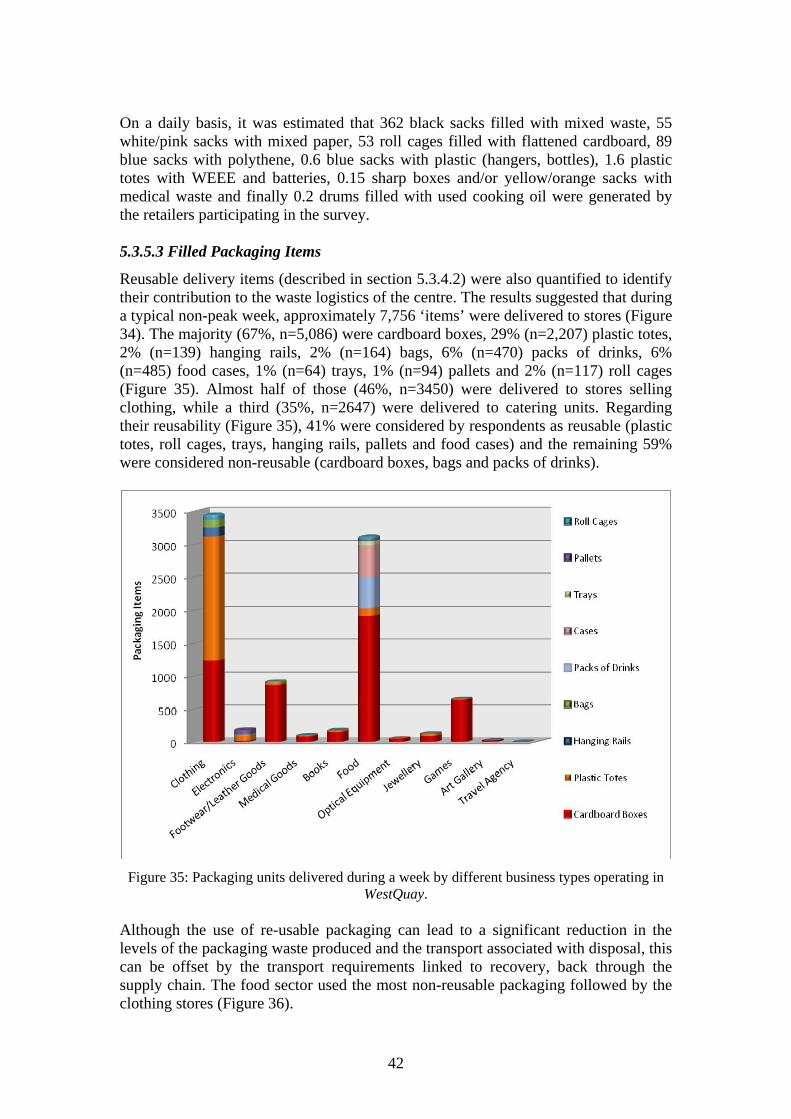
42
On a daily basis, it was estimated that 362 black sacks filled with mixed waste, 55 white/pink sacks with mixed paper, 53 roll cages filled with flattened cardboard, 89 blue sacks with polythene, 0.6 blue sacks with plastic (hangers, bottles), 1.6 plastic totes with WEEE and batteries, 0.15 sharp boxes and/or yellow/orange sacks with medical waste and finally 0.2 drums filled with used cooking oil were generated by the retailers participating in the survey. 5.3.5.3 Filled Packaging Items
Reusable delivery items (described in section 5.3.4.2) were also quantified to identify their contribution to the waste logistics of the centre. The results suggested that during a typical non-peak week, approximately 7,756 ‘items’ were delivered to stores (Figure 34). The majority (67%, n=5,086) were cardboard boxes, 29% (n=2,207) plastic totes, 2% (n=139) hanging rails, 2% (n=164) bags, 6% (n=470) packs of drinks, 6% (n=485) food cases, 1% (n=64) trays, 1% (n=94) pallets and 2% (n=117) roll cages (Figure 35). Almost half of those (46%, n=3450) were delivered to stores selling clothing, while a third (35%, n=2647) were delivered to catering units. Regarding their reusability (Figure 35), 41% were considered by respondents as reusable (plastic totes, roll cages, trays, hanging rails, pallets and food cases) and the remaining 59% were considered non-reusable (cardboard boxes, bags and packs of drinks).
Figure 35: Packaging units delivered during a week by different business types operating in WestQuay.
Although the use of re-usable packaging can lead to a significant reduction in the levels of the packaging waste produced and the transport associated with disposal, this can be offset by the transport requirements linked to recovery, back through the supply chain. The food sector used the most non-reusable packaging followed by the clothing stores (Figure 36).
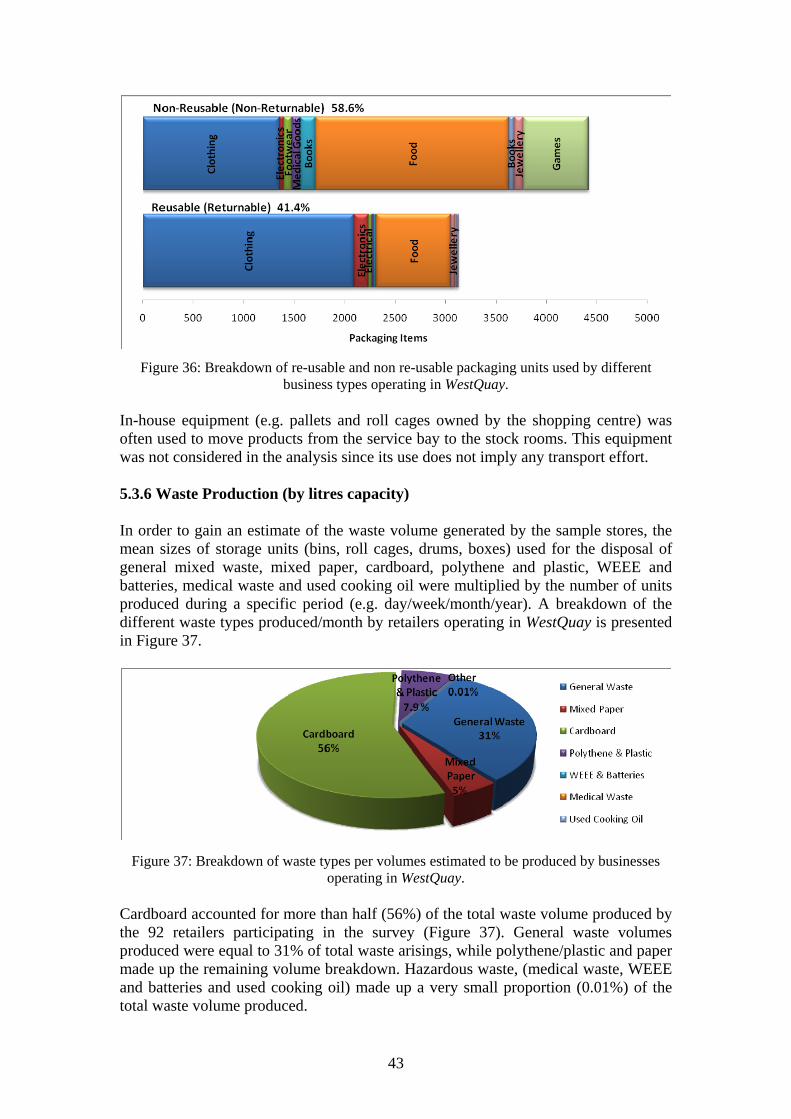
43
Figure 36: Breakdown of re-usable and non re-usable packaging units used by different business types operating in WestQuay.
In-house equipment (e.g. pallets and roll cages owned by the shopping centre) was often used to move products from the service bay to the stock rooms. This equipment was not considered in the analysis since its use does not imply any transport effort. 5.3.6 Waste Production (by litres capacity) In order to gain an estimate of the waste volume generated by the sample stores, the mean sizes of storage units (bins, roll cages, drums, boxes) used for the disposal of general mixed waste, mixed paper, cardboard, polythene and plastic, WEEE and batteries, medical waste and used cooking oil were multiplied by the number of units produced during a specific period (e.g. day/week/month/year). A breakdown of the different waste types produced/month by retailers operating in WestQuay is presented in Figure 37.
Figure 37: Breakdown of waste types per volumes estimated to be produced by businesses
operating in WestQuay. Cardboard accounted for more than half (56%) of the total waste volume produced by the 92 retailers participating in the survey (Figure 37). General waste volumes produced were equal to 31% of total waste arisings, while polythene/plastic and paper made up the remaining volume breakdown. Hazardous waste, (medical waste, WEEE and batteries and used cooking oil) made up a very small proportion (0.01%) of the total waste volume produced.
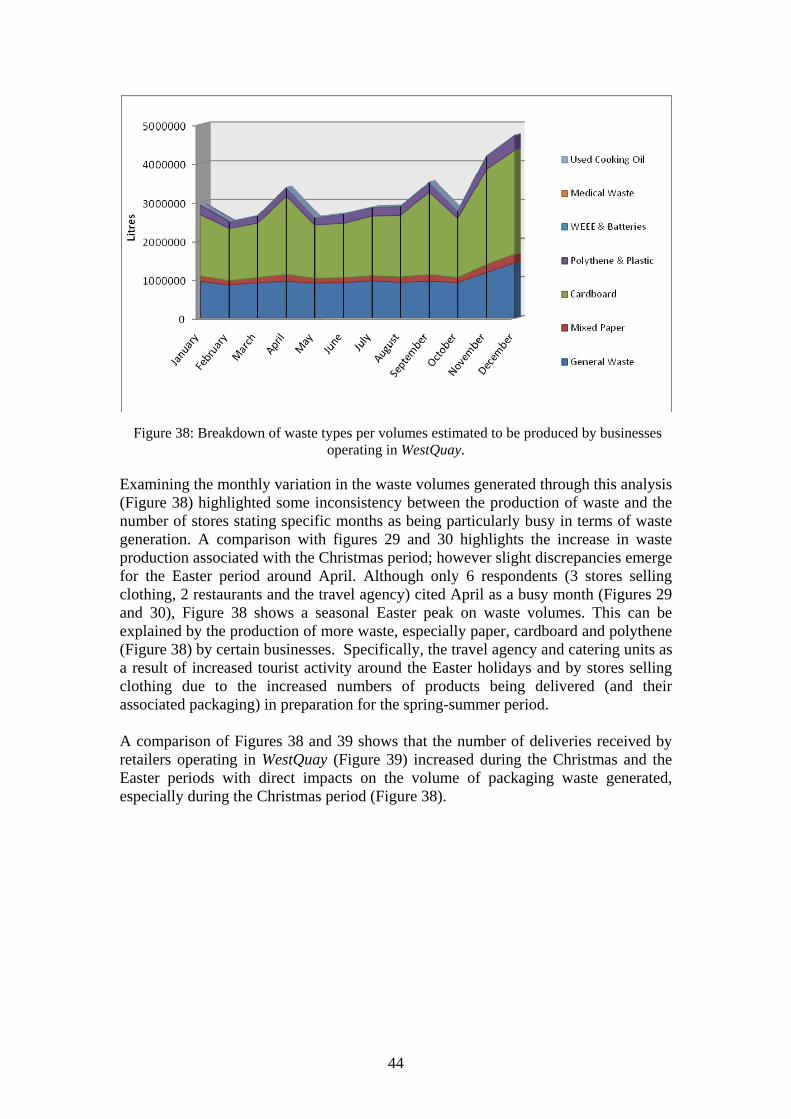
44
Figure 38: Breakdown of waste types per volumes estimated to be produced by businesses
operating in WestQuay.
Examining the monthly variation in the waste volumes generated through this analysis (Figure 38) highlighted some inconsistency between the production of waste and the number of stores stating specific months as being particularly busy in terms of waste generation. A comparison with figures 29 and 30 highlights the increase in waste production associated with the Christmas period; however slight discrepancies emerge for the Easter period around April. Although only 6 respondents (3 stores selling clothing, 2 restaurants and the travel agency) cited April as a busy month (Figures 29 and 30), Figure 38 shows a seasonal Easter peak on waste volumes. This can be explained by the production of more waste, especially paper, cardboard and polythene (Figure 38) by certain businesses. Specifically, the travel agency and catering units as a result of increased tourist activity around the Easter holidays and by stores selling clothing due to the increased numbers of products being delivered (and their associated packaging) in preparation for the spring-summer period. A comparison of Figures 38 and 39 shows that the number of deliveries received by retailers operating in WestQuay (Figure 39) increased during the Christmas and the Easter periods with direct impacts on the volume of packaging waste generated, especially during the Christmas period (Figure 38).
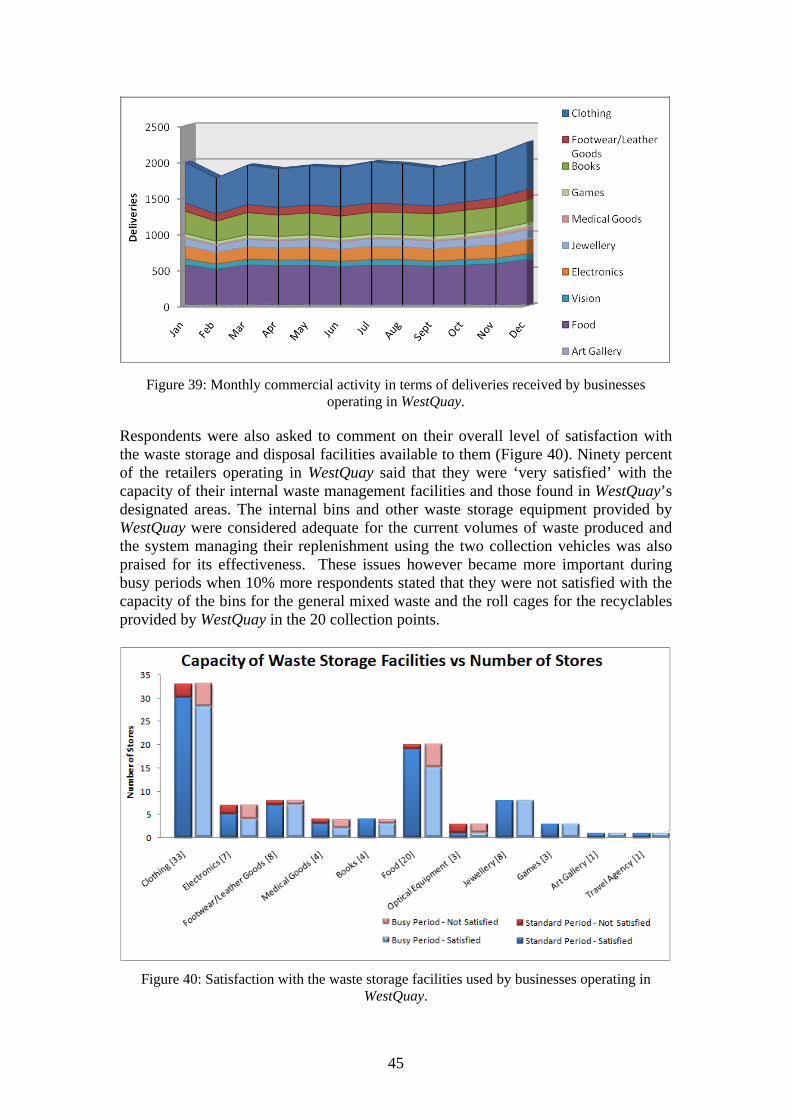
45
Figure 39: Monthly commercial activity in terms of deliveries received by businesses
operating in WestQuay. Respondents were also asked to comment on their overall level of satisfaction with the waste storage and disposal facilities available to them (Figure 40). Ninety percent of the retailers operating in WestQuay said that they were ‘very satisfied’ with the capacity of their internal waste management facilities and those found in WestQuay’s designated areas. The internal bins and other waste storage equipment provided by WestQuay were considered adequate for the current volumes of waste produced and the system managing their replenishment using the two collection vehicles was also praised for its effectiveness. These issues however became more important during busy periods when 10% more respondents stated that they were not satisfied with the capacity of the bins for the general mixed waste and the roll cages for the recyclables provided by WestQuay in the 20 collection points.
Figure 40: Satisfaction with the waste storage facilities used by businesses operating in
WestQuay.
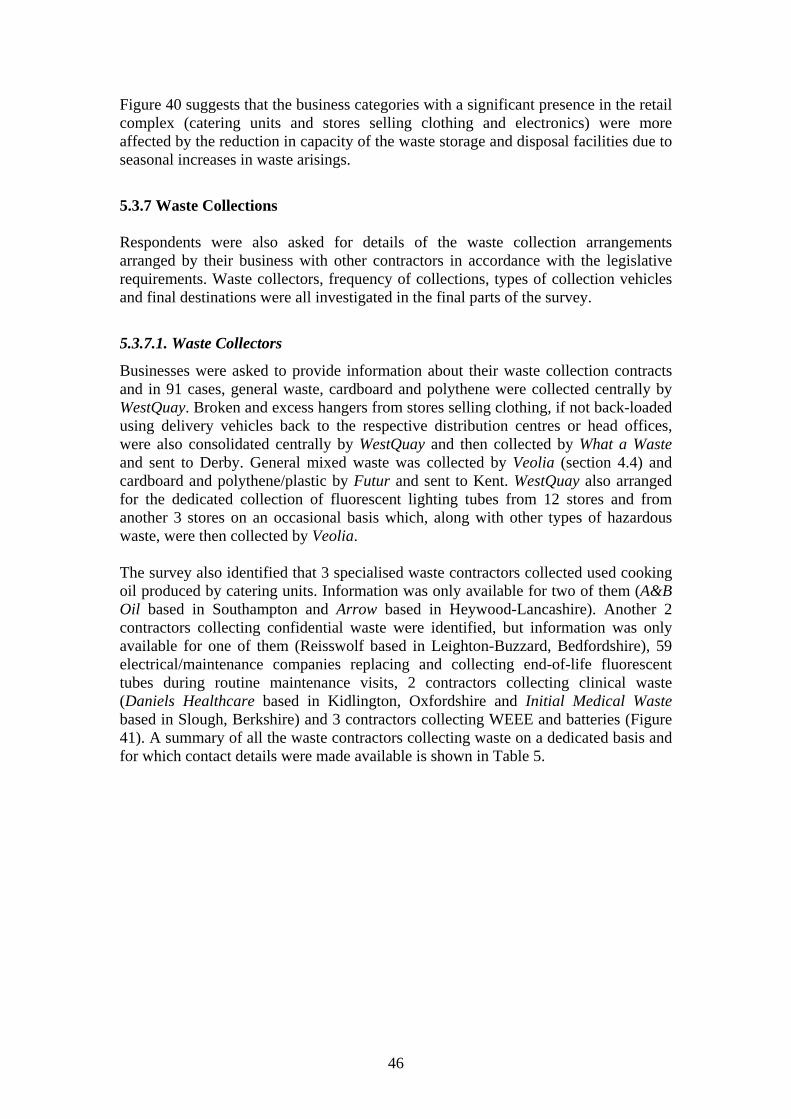
46
Figure 40 suggests that the business categories with a significant presence in the retail complex (catering units and stores selling clothing and electronics) were more affected by the reduction in capacity of the waste storage and disposal facilities due to seasonal increases in waste arisings.
5.3.7 Waste Collections Respondents were also asked for details of the waste collection arrangements arranged by their business with other contractors in accordance with the legislative requirements. Waste collectors, frequency of collections, types of collection vehicles and final destinations were all investigated in the final parts of the survey.
5.3.7.1. Waste Collectors
Businesses were asked to provide information about their waste collection contracts and in 91 cases, general waste, cardboard and polythene were collected centrally by WestQuay. Broken and excess hangers from stores selling clothing, if not back-loaded using delivery vehicles back to the respective distribution centres or head offices, were also consolidated centrally by WestQuay and then collected by What a Waste and sent to Derby. General mixed waste was collected by Veolia (section 4.4) and cardboard and polythene/plastic by Futur and sent to Kent. WestQuay also arranged for the dedicated collection of fluorescent lighting tubes from 12 stores and from another 3 stores on an occasional basis which, along with other types of hazardous waste, were then collected by Veolia. The survey also identified that 3 specialised waste contractors collected used cooking oil produced by catering units. Information was only available for two of them (A&B Oil based in Southampton and Arrow based in Heywood-Lancashire). Another 2 contractors collecting confidential waste were identified, but information was only available for one of them (Reisswolf based in Leighton-Buzzard, Bedfordshire), 59 electrical/maintenance companies replacing and collecting end-of-life fluorescent tubes during routine maintenance visits, 2 contractors collecting clinical waste (Daniels Healthcare based in Kidlington, Oxfordshire and Initial Medical Waste based in Slough, Berkshire) and 3 contractors collecting WEEE and batteries (Figure 41). A summary of all the waste contractors collecting waste on a dedicated basis and for which contact details were made available is shown in Table 5.
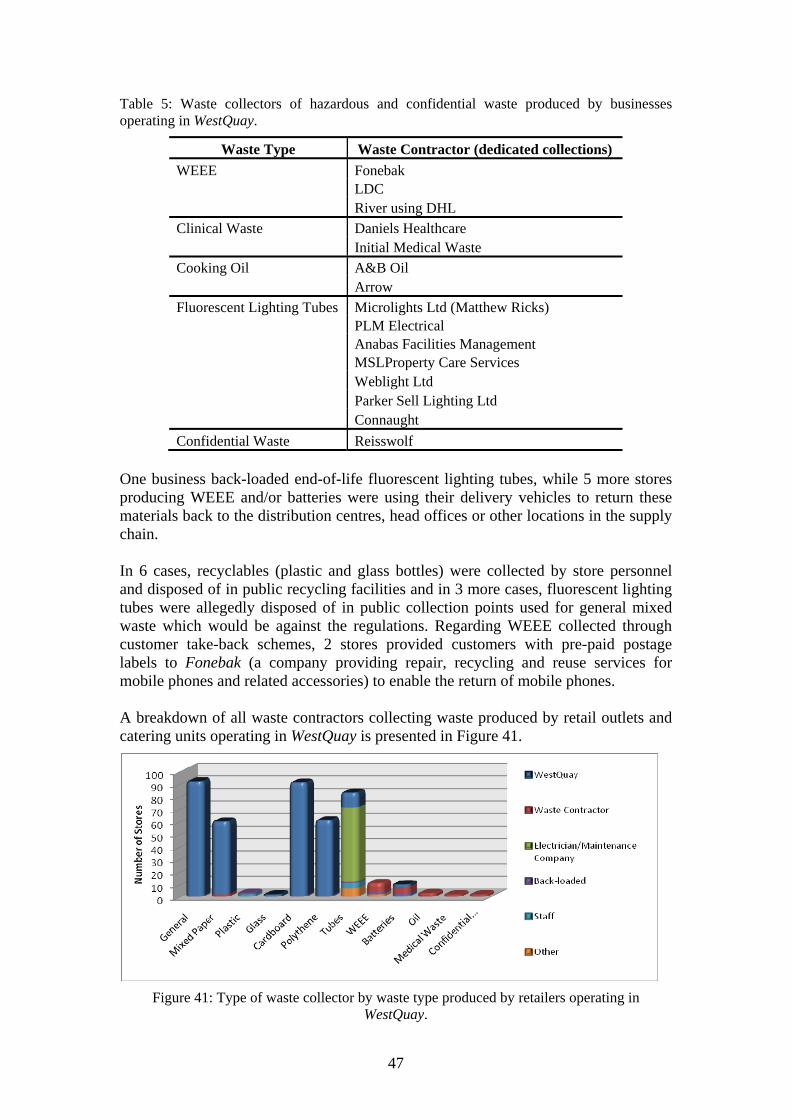
47
Table 5: Waste collectors of hazardous and confidential waste produced by businesses operating in WestQuay.
Waste Type Waste Contractor (dedicated collections) WEEE Fonebak LDC River using DHL Clinical Waste Daniels Healthcare Initial Medical Waste Cooking Oil A&B Oil Arrow Fluorescent Lighting Tubes Microlights Ltd (Matthew Ricks) PLM Electrical Anabas Facilities Management MSLProperty Care Services Weblight Ltd Parker Sell Lighting Ltd Connaught Confidential Waste Reisswolf
One business back-loaded end-of-life fluorescent lighting tubes, while 5 more stores producing WEEE and/or batteries were using their delivery vehicles to return these materials back to the distribution centres, head offices or other locations in the supply chain. In 6 cases, recyclables (plastic and glass bottles) were collected by store personnel and disposed of in public recycling facilities and in 3 more cases, fluorescent lighting tubes were allegedly disposed of in public collection points used for general mixed waste which would be against the regulations. Regarding WEEE collected through customer take-back schemes, 2 stores provided customers with pre-paid postage labels to Fonebak (a company providing repair, recycling and reuse services for mobile phones and related accessories) to enable the return of mobile phones. A breakdown of all waste contractors collecting waste produced by retail outlets and catering units operating in WestQuay is presented in Figure 41.
Figure 41: Type of waste collector by waste type produced by retailers operating in WestQuay.
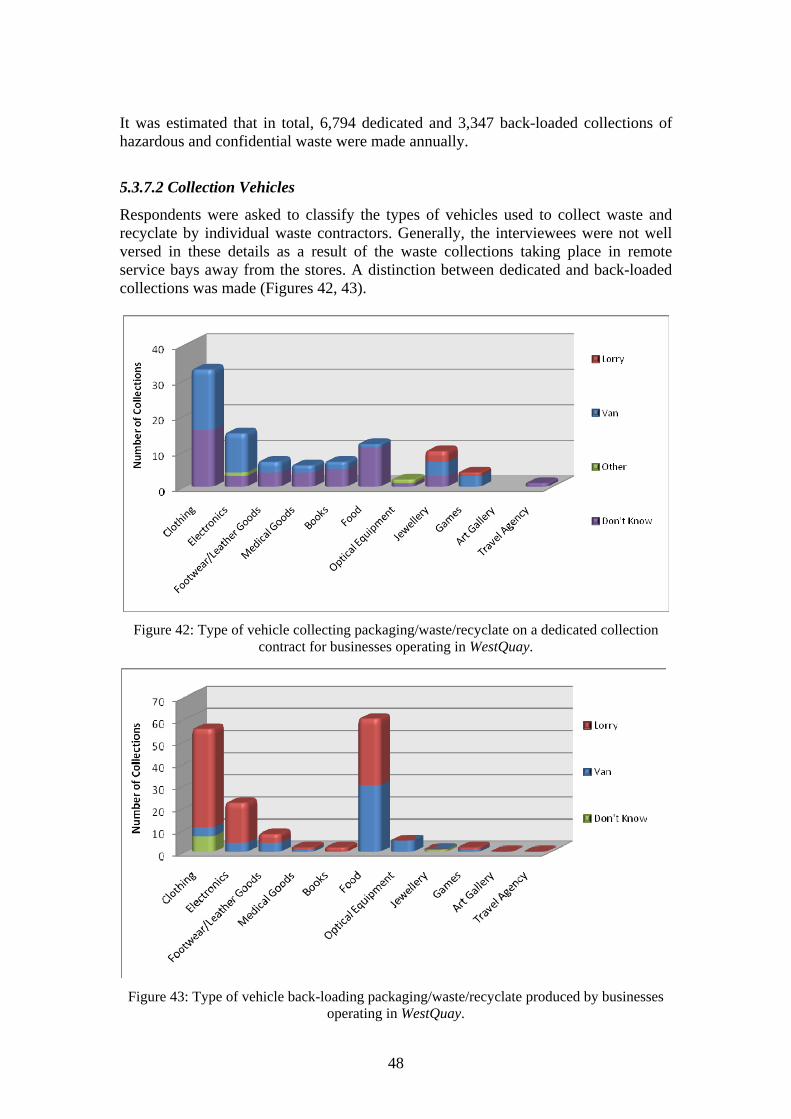
48
It was estimated that in total, 6,794 dedicated and 3,347 back-loaded collections of hazardous and confidential waste were made annually.
5.3.7.2 Collection Vehicles
Respondents were asked to classify the types of vehicles used to collect waste and recyclate by individual waste contractors. Generally, the interviewees were not well versed in these details as a result of the waste collections taking place in remote service bays away from the stores. A distinction between dedicated and back-loaded collections was made (Figures 42, 43).
Figure 42: Type of vehicle collecting packaging/waste/recyclate on a dedicated collection contract for businesses operating in WestQuay.
Figure 43: Type of vehicle back-loading packaging/waste/recyclate produced by businesses operating in WestQuay.
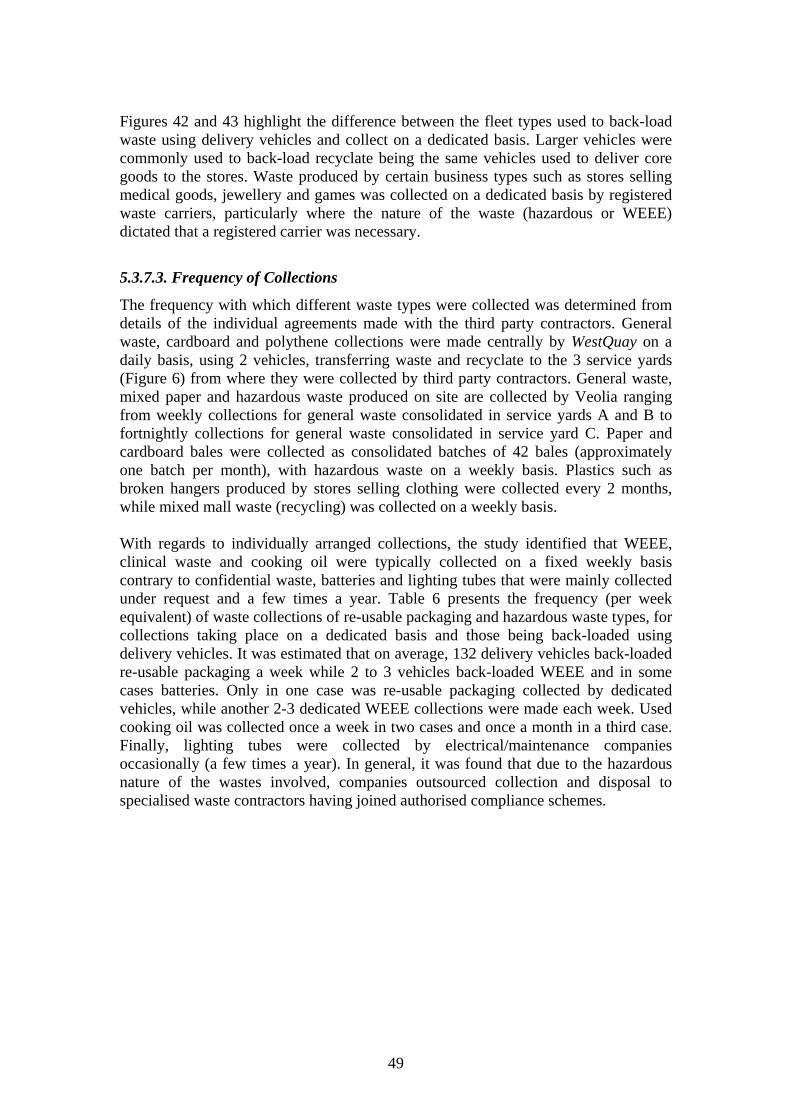
49
Figures 42 and 43 highlight the difference between the fleet types used to back-load waste using delivery vehicles and collect on a dedicated basis. Larger vehicles were commonly used to back-load recyclate being the same vehicles used to deliver core goods to the stores. Waste produced by certain business types such as stores selling medical goods, jewellery and games was collected on a dedicated basis by registered waste carriers, particularly where the nature of the waste (hazardous or WEEE) dictated that a registered carrier was necessary.
5.3.7.3. Frequency of Collections
The frequency with which different waste types were collected was determined from details of the individual agreements made with the third party contractors. General waste, cardboard and polythene collections were made centrally by WestQuay on a daily basis, using 2 vehicles, transferring waste and recyclate to the 3 service yards (Figure 6) from where they were collected by third party contractors. General waste, mixed paper and hazardous waste produced on site are collected by Veolia ranging from weekly collections for general waste consolidated in service yards A and B to fortnightly collections for general waste consolidated in service yard C. Paper and cardboard bales were collected as consolidated batches of 42 bales (approximately one batch per month), with hazardous waste on a weekly basis. Plastics such as broken hangers produced by stores selling clothing were collected every 2 months, while mixed mall waste (recycling) was collected on a weekly basis. With regards to individually arranged collections, the study identified that WEEE, clinical waste and cooking oil were typically collected on a fixed weekly basis contrary to confidential waste, batteries and lighting tubes that were mainly collected under request and a few times a year. Table 6 presents the frequency (per week equivalent) of waste collections of re-usable packaging and hazardous waste types, for collections taking place on a dedicated basis and those being back-loaded using delivery vehicles. It was estimated that on average, 132 delivery vehicles back-loaded re-usable packaging a week while 2 to 3 vehicles back-loaded WEEE and in some cases batteries. Only in one case was re-usable packaging collected by dedicated vehicles, while another 2-3 dedicated WEEE collections were made each week. Used cooking oil was collected once a week in two cases and once a month in a third case. Finally, lighting tubes were collected by electrical/maintenance companies occasionally (a few times a year). In general, it was found that due to the hazardous nature of the wastes involved, companies outsourced collection and disposal to specialised waste contractors having joined authorised compliance schemes.
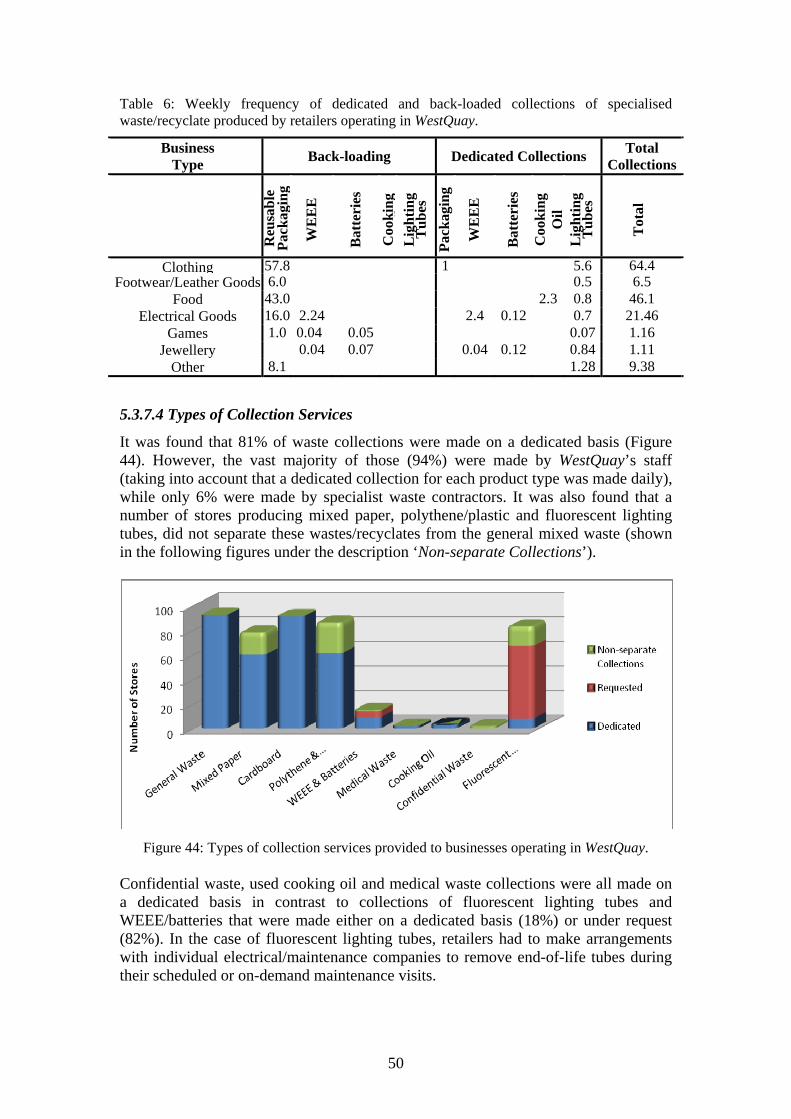
50
Table 6: Weekly frequency of dedicated and back-loaded collections of specialised waste/recyclate produced by retailers operating in WestQuay.
Business Type Back-loading Dedicated Collections Total
Collections
Reu
sabl
e Pa
ckag
ing
WE
EE
Bat
teri
es
Coo
king
O
ilL
ight
ing
Tub
es
Pack
agin
g
WE
EE
Bat
teri
es
Coo
king
O
il L
ight
ing
Tub
es
T
otal
Clothing 57.8 1 5.6 64.4Footwear/Leather Goods 6.0 0.5 6.5
Food 43.0 2.3 0.8 46.1Electrical Goods 16.0 2.24 2.4 0.12 0.7 21.46
Games 1.0 0.04 0.05 0.07 1.16Jewellery 0.04 0.07 0.04 0.12 0.84 1.11
Other 8.1 1.28 9.38
5.3.7.4 Types of Collection Services
It was found that 81% of waste collections were made on a dedicated basis (Figure 44). However, the vast majority of those (94%) were made by WestQuay’s staff (taking into account that a dedicated collection for each product type was made daily), while only 6% were made by specialist waste contractors. It was also found that a number of stores producing mixed paper, polythene/plastic and fluorescent lighting tubes, did not separate these wastes/recyclates from the general mixed waste (shown in the following figures under the description ‘Non-separate Collections’).
Figure 44: Types of collection services provided to businesses operating in WestQuay. Confidential waste, used cooking oil and medical waste collections were all made on a dedicated basis in contrast to collections of fluorescent lighting tubes and WEEE/batteries that were made either on a dedicated basis (18%) or under request (82%). In the case of fluorescent lighting tubes, retailers had to make arrangements with individual electrical/maintenance companies to remove end-of-life tubes during their scheduled or on-demand maintenance visits.
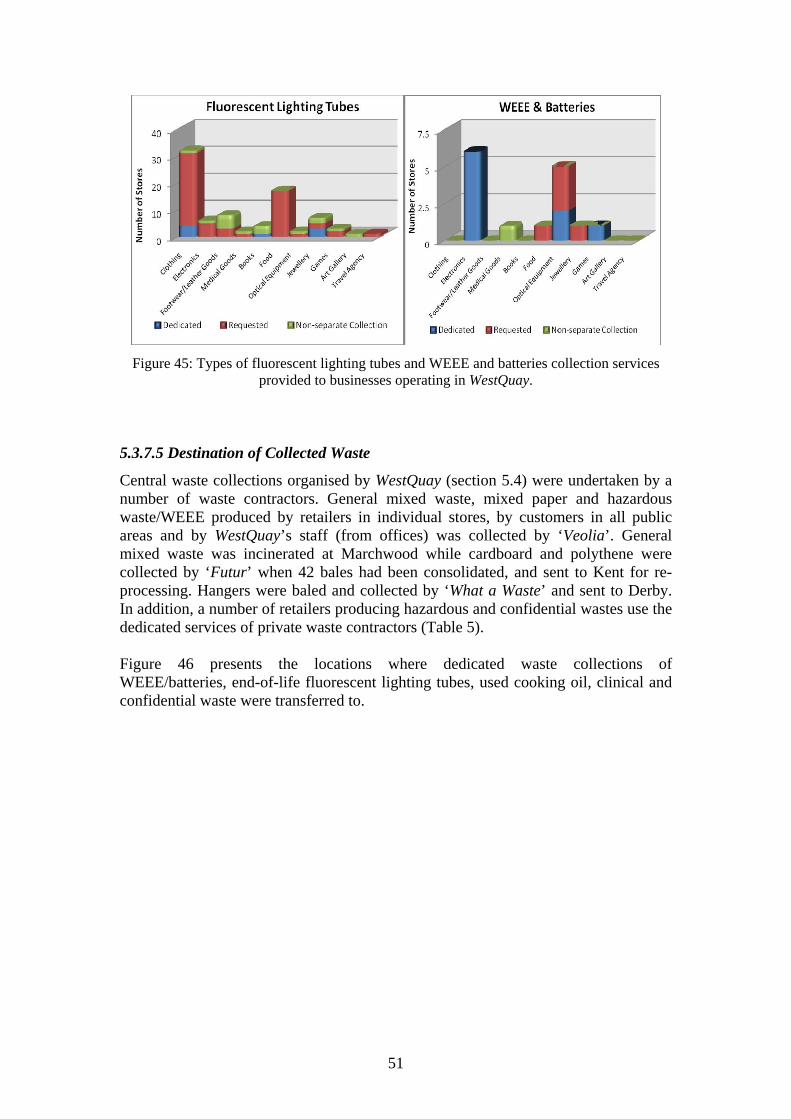
51
Figure 45: Types of fluorescent lighting tubes and WEEE and batteries collection services provided to businesses operating in WestQuay.
5.3.7.5 Destination of Collected Waste
Central waste collections organised by WestQuay (section 5.4) were undertaken by a number of waste contractors. General mixed waste, mixed paper and hazardous waste/WEEE produced by retailers in individual stores, by customers in all public areas and by WestQuay’s staff (from offices) was collected by ‘Veolia’. General mixed waste was incinerated at Marchwood while cardboard and polythene were collected by ‘Futur’ when 42 bales had been consolidated, and sent to Kent for re-processing. Hangers were baled and collected by ‘What a Waste’ and sent to Derby. In addition, a number of retailers producing hazardous and confidential wastes use the dedicated services of private waste contractors (Table 5). Figure 46 presents the locations where dedicated waste collections of WEEE/batteries, end-of-life fluorescent lighting tubes, used cooking oil, clinical and confidential waste were transferred to.
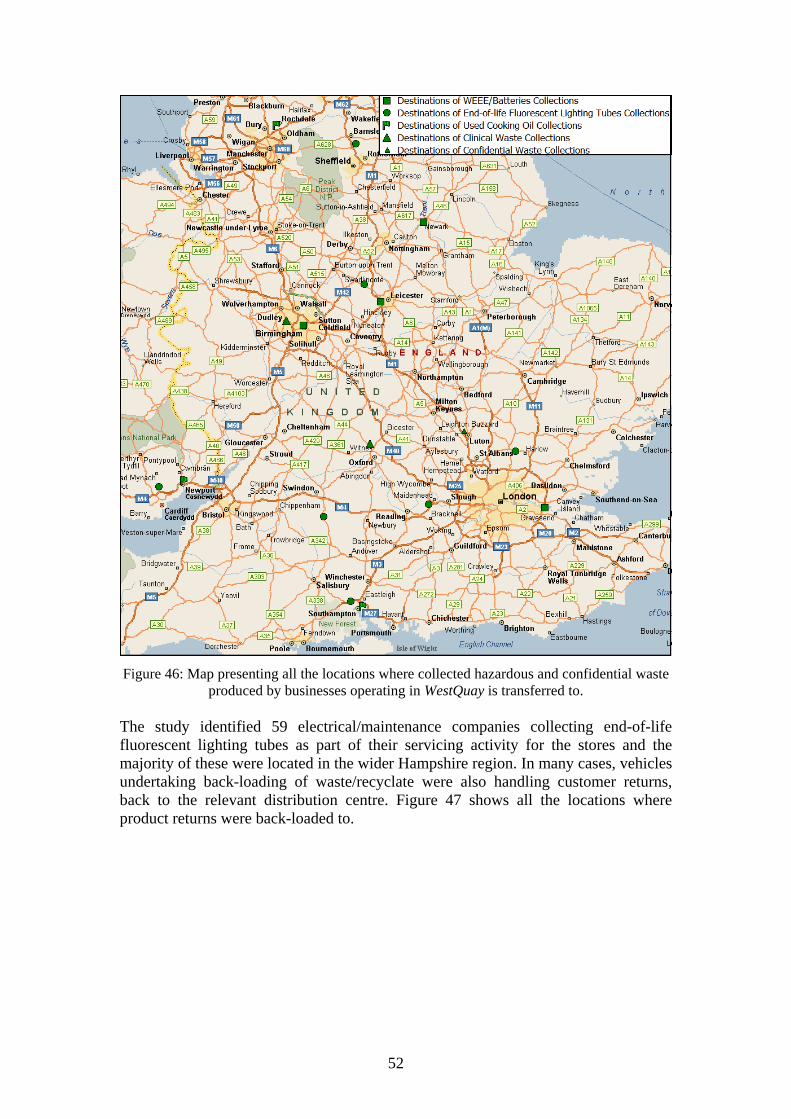
52
Figure 46: Map presenting all the locations where collected hazardous and confidential waste produced by businesses operating in WestQuay is transferred to.
The study identified 59 electrical/maintenance companies collecting end-of-life fluorescent lighting tubes as part of their servicing activity for the stores and the majority of these were located in the wider Hampshire region. In many cases, vehicles undertaking back-loading of waste/recyclate were also handling customer returns, back to the relevant distribution centre. Figure 47 shows all the locations where product returns were back-loaded to.
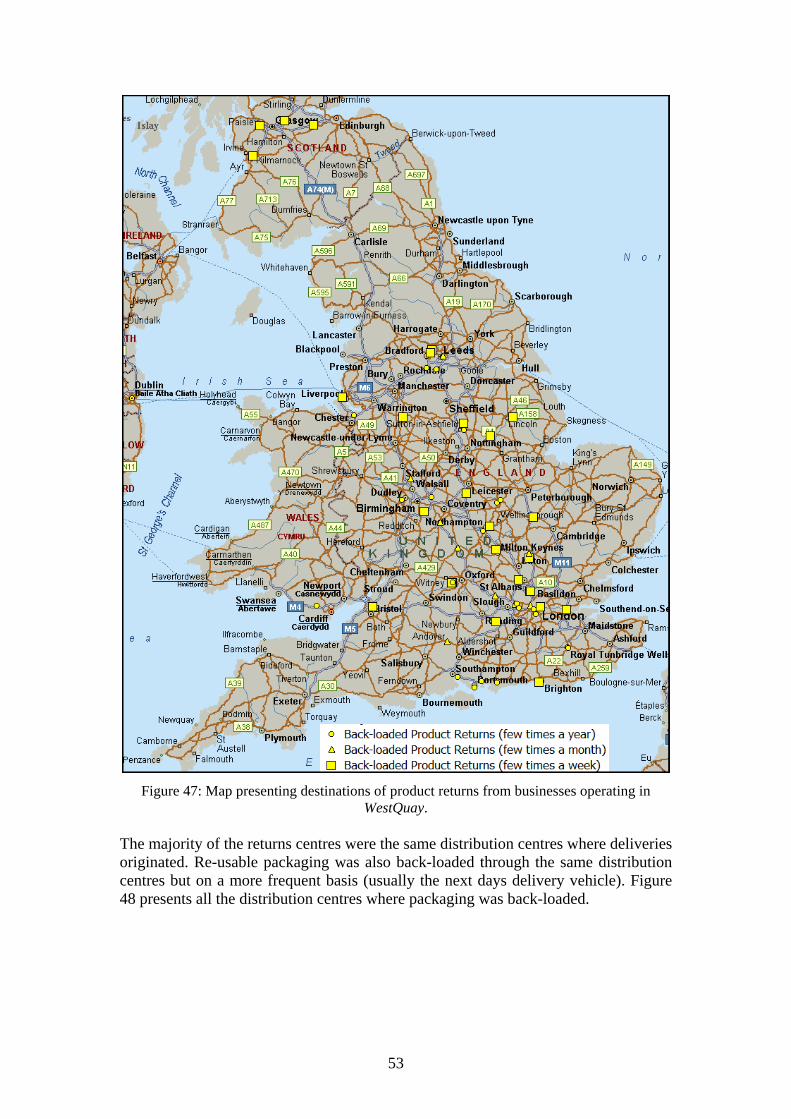
53
Figure 47: Map presenting destinations of product returns from businesses operating in WestQuay.
The majority of the returns centres were the same distribution centres where deliveries originated. Re-usable packaging was also back-loaded through the same distribution centres but on a more frequent basis (usually the next days delivery vehicle). Figure 48 presents all the distribution centres where packaging was back-loaded.
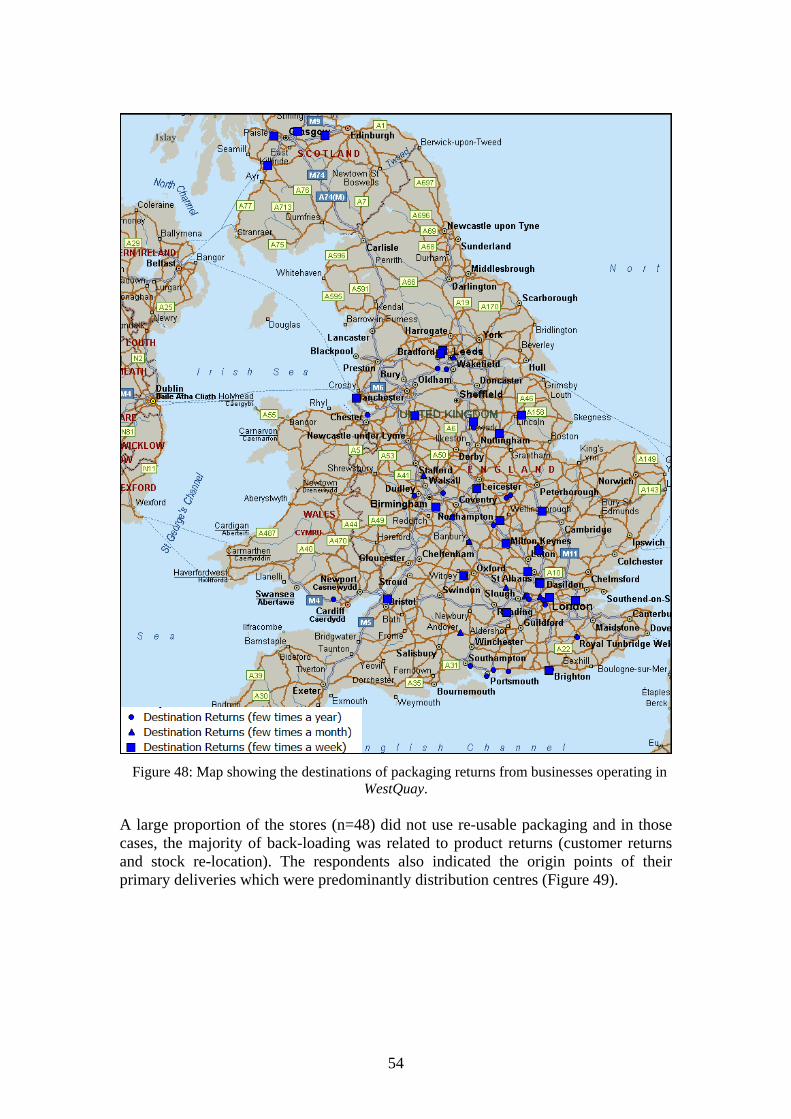
54
Figure 48: Map showing the destinations of packaging returns from businesses operating in WestQuay.
A large proportion of the stores (n=48) did not use re-usable packaging and in those cases, the majority of back-loading was related to product returns (customer returns and stock re-location). The respondents also indicated the origin points of their primary deliveries which were predominantly distribution centres (Figure 49).
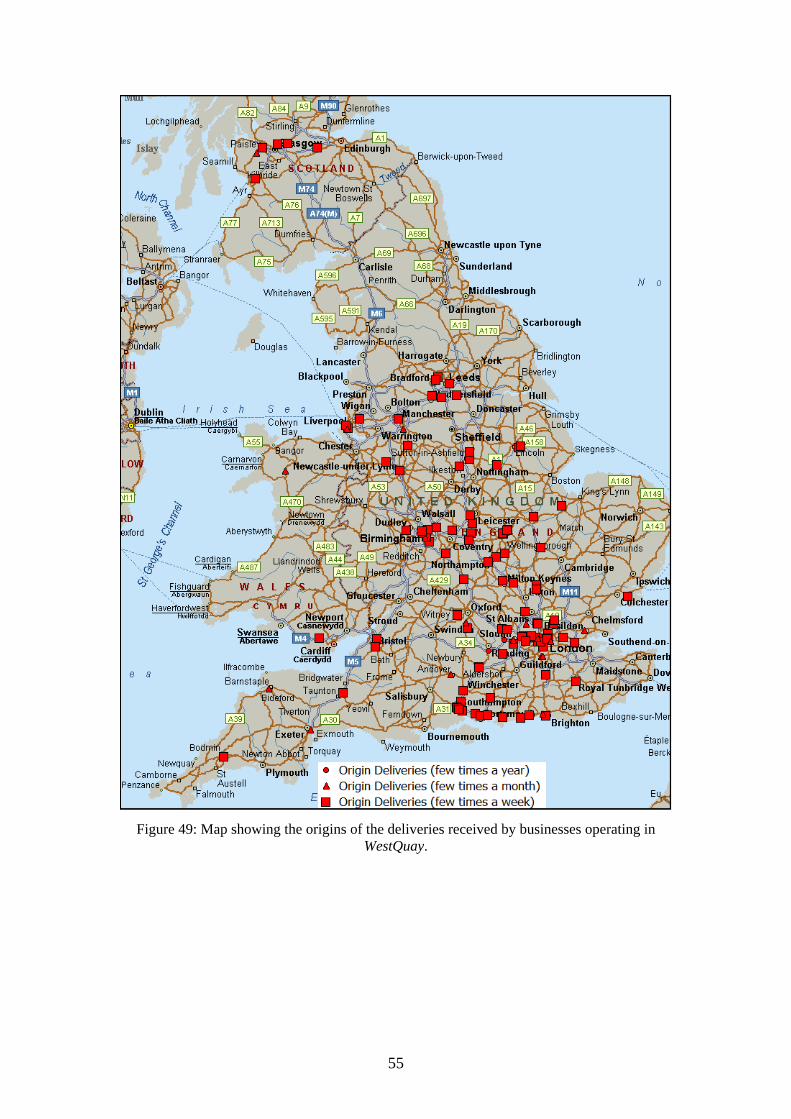
55
Figure 49: Map showing the origins of the deliveries received by businesses operating in WestQuay.
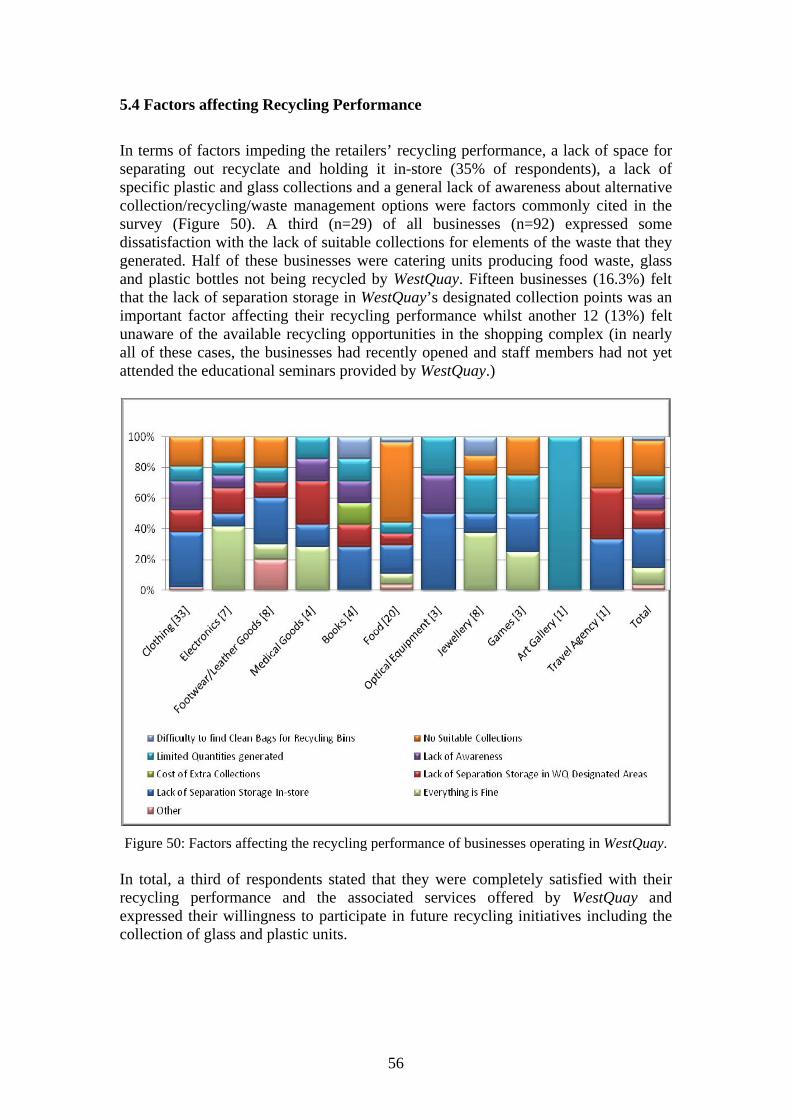
56
5.4 Factors affecting Recycling Performance
In terms of factors impeding the retailers’ recycling performance, a lack of space for separating out recyclate and holding it in-store (35% of respondents), a lack of specific plastic and glass collections and a general lack of awareness about alternative collection/recycling/waste management options were factors commonly cited in the survey (Figure 50). A third (n=29) of all businesses (n=92) expressed some dissatisfaction with the lack of suitable collections for elements of the waste that they generated. Half of these businesses were catering units producing food waste, glass and plastic bottles not being recycled by WestQuay. Fifteen businesses (16.3%) felt that the lack of separation storage in WestQuay’s designated collection points was an important factor affecting their recycling performance whilst another 12 (13%) felt unaware of the available recycling opportunities in the shopping complex (in nearly all of these cases, the businesses had recently opened and staff members had not yet attended the educational seminars provided by WestQuay.)
Figure 50: Factors affecting the recycling performance of businesses operating in WestQuay.
In total, a third of respondents stated that they were completely satisfied with their recycling performance and the associated services offered by WestQuay and expressed their willingness to participate in future recycling initiatives including the collection of glass and plastic units.
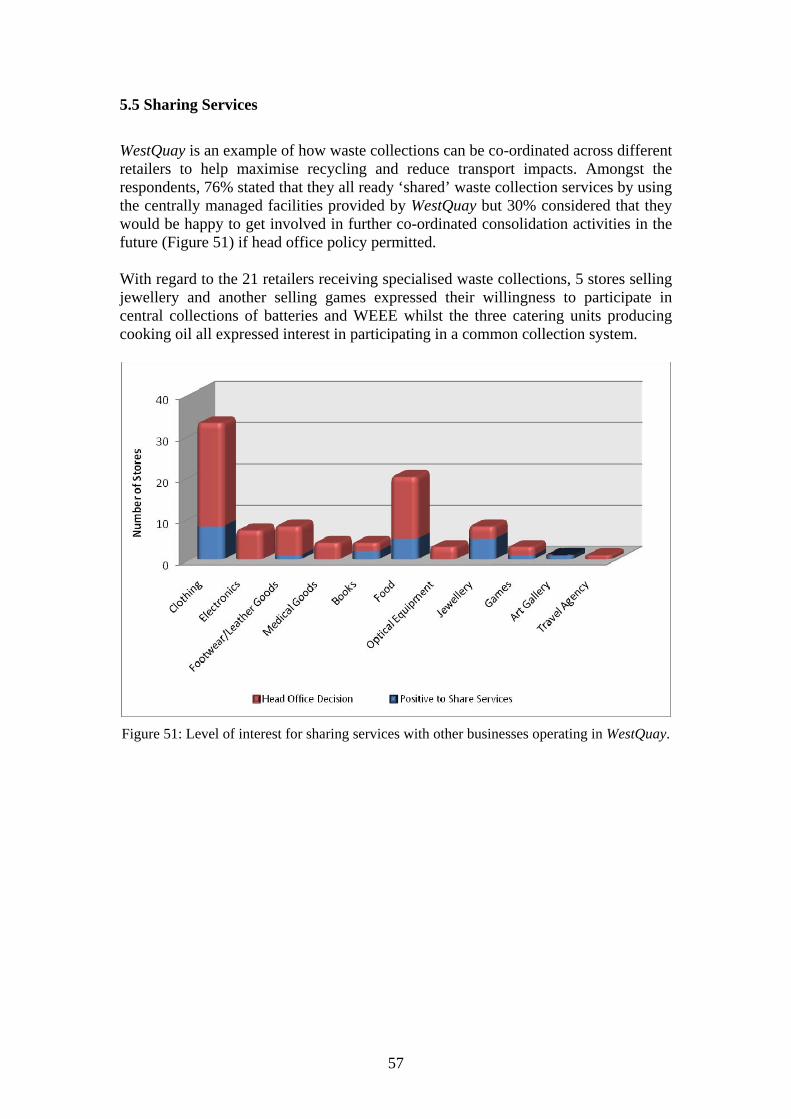
57
5.5 Sharing Services
WestQuay is an example of how waste collections can be co-ordinated across different retailers to help maximise recycling and reduce transport impacts. Amongst the respondents, 76% stated that they all ready ‘shared’ waste collection services by using the centrally managed facilities provided by WestQuay but 30% considered that they would be happy to get involved in further co-ordinated consolidation activities in the future (Figure 51) if head office policy permitted. With regard to the 21 retailers receiving specialised waste collections, 5 stores selling jewellery and another selling games expressed their willingness to participate in central collections of batteries and WEEE whilst the three catering units producing cooking oil all expressed interest in participating in a common collection system.
Figure 51: Level of interest for sharing services with other businesses operating in WestQuay.
58
Chapter 6 Key Findings
Waste management procedures and the associated logistics activities undertaken by the businesses operating in WestQuay are driven by the current European and domestic regulatory framework. In many respects, the recycling initiatives operated by WestQuay and many of the individual businesses operating in the complex are exceeding the national guidelines and targets that have been set. This can be largely attributed to WestQuay’s, ‘Retailer Waste Co-ordinator’ training sessions which were started in 2007, increasing businesses awareness of their responsibilities, but also, the methods by which their waste and recyclate could be effectively managed. WestQuay has developed a well organised, centrally managed collection service for the main waste types generated (mixed general waste, cardboard and polythene). Using a range of equipment to store and consolidate waste (pallets, roll cages, bins, balers and compactors), and through coordinating the collection across retailers, WestQuay has improved its recycling rates, with a significant increase in the mean waste tonnage being diverted from landfill between the periods January 2006 to April 2007 (mean: 26 tonnes) and May 2007 to August 2008 (mean=143 tonnes), whilst minimising its waste logistics. The survey identified that where the recycling performance of individual businesses was compromised, this was often because of a shortage of personnel, lack of available time for material management, absence of a corporate waste management strategy, insufficient storage space for recyclate in-store or a lack of equipment to manage waste and recyclate in-store. Almost half of the catering units and the stores selling electronics stated that they did not separate mixed paper and polythene from their general mixed waste. Such issues highlight the potential advantages of scheduled centralised waste collection systems against go-it-alone approaches where additional recyclate can be generated to meet legislative requirements at little additional cost to the retailer. In general, the waste management procedures used by the businesses operating in WestQuay were aligned to the individual characteristics of the specific waste types produced, and the associated legal requirements related to their storage, collection, transfer and disposal. In addition, customer take-back schemes also contributed to the volumes of waste requiring special handling by businesses. The study identified 21 stores which had contracts in place with specialised waste contractors collecting confidential documents and/or hazardous end-of life materials such as WEEE, batteries, fluorescent lighting tubes, clinical waste and cooking oil. These created approximately 130 dedicated and 822 back-loaded collections annually. Despite the number of vehicle movements, estimates of the volumes of waste produced showed that these materials accounted for a very small proportion (0.01%) of the overall waste arisings. A correlation between the increase in waste generation and the increase in commercial activity (deliveries) was found. The study identified that the principal waste generators were the stores with a significant presence in the complex (catering units and stores selling clothing, footwear and electronics). According to the volume estimates, cardboard accounted for more than half and general mixed waste, more
59
than a third of overall waste arisings. In terms of storage systems used for waste containment, bins were used for general mixed waste, mixed paper, polythene and hangers, boxes for WEEE, batteries and lighting tubes, roll cages for cardboard, drums for cooking oil and pallets for larger WEEE items. It was estimated that the businesses surveyed generated 507 sacks, 53 roll cages, 1.6 plastic totes, 0.15 sharp boxes and 0.2 drums on a weekly basis. The study also identified the contribution reusable packaging had in reducing waste output with almost half of the respondents using reusable plastic containers, trays, cases, hanging rails and pallets, back-loading them to distribution centres using the delivery vehicles. Back-loading practices therefore impacted on the type of vehicles used to collect waste and recyclables with larger articulated vehicles being typically used when back-loading was taking place. The frequency of collection varied by waste type and type of business with clinical waste, used cooking oil and WEEE typically collected on fixed weekly visits, while fluorescent lighting tubes and batteries were collected by request and often, only a few times a year.
60
References Allen, J., M. Browne, T. Cherrett and F. McLeod. (2008) Review of UK Urban Freight Studies, Green Logistics Project, Universities of Westminster and Southampton, November, 2008. Available from: http://www.greenlogistics.org/PageView.aspx?id=145 [Accessed: 5 November 2008] Bernon, M. (2005) The challenge of EU corporate producer responsibility legislation - and the impact on the supply chain. Management Focus [Online], Winter 2005 (23), 13-15. Available from: http://www.som.cranfield.ac.uk/som/news/manfocus/downloads/focus23/eu%20challenge.pdf [Accessed: 18 April 2007] Cherrett, T., G. McLay and M. McDonald. (2002) Effects of Freight Movements in Winchester. Final Report, University of Southampton. Southampton, 2002 Cherrett, T., F. McLeod, A. Hickford, S. Maynard, (2007) WM10: Developing Innovative and more Sustainable Approaches to Reverse Logistics for the Collection, Recycling and Disposal of Waste Products from Urban Centres. Literature Review and Identification of Opportunities. Unpublished. Cheeseman, K. (2002), Waste Minimization: A Practical Guide, Chadwick House Publishing, London. Citylocal (2009) Southampton City Council – IKEA – 2009-02-12. Available from: http://www.citylocal.co.uk/cities/Southampton/events/event/10521/ [Accessed: 15 March 2009] DfT (2004) The Efficiency of Reverse Logistics. Cranfield School of Management, Sheffield Hallam University and the Chartered Institute of Logistics and Transport. Duxbury, N (2008) Will Ikea’s arrival in Southampton town centre next year will cause traffic chaos? Property Week.com, 04 April 2008. Available from: http://www.propertyweek.com/story.asp?sectioncode=39&storycode=3110439 [Accessed: 08 March 2009] ENVIROWISE (2002) Increasing Profits by Reducing Waste in Managed Shopping Centres (GG324). Good Practice Guide Series. Oxfordshire, March 2002. Available from: http://www.envirowise.gov.uk/page.aspx?o=117594 [Accessed: 27 June2007] ENVIROWISE (2007) Retail's Main Waste Stream: Packaging & Solids [Online]. Available from: http://www.envirowise.gov.uk/175225 [Accessed: 16 October 2007] Freight Best Practice. Research Papers. Department for Transport, U.K. Available from: http://www.freightbestpractice.org.uk/default.aspx?appid=1960&cid=43. [Accessed: 13 March 2008]
61
Hammerson (2009) Retail Delivery. Tenants Sustainability Guide and Requirements. Available from: http://media.corporate-ir.net/media_files/irol/13/133289/pdfs/TenantsSustainabilityGuide.pdf [Accessed: 13 March 2009] Richards, F., T. Freyberg, G. Faulkner, (2007) Recycling & Waste World Handbook. A&D Media Ltd, Wiltshire. Rushton, A., J. Oxley, P. Croucher, (2001) The handbook of logistics and distribution management, 2nd edition, The Institute of Logistics and Transport, Kogan Page. Shakantu, W., J.E., Tookey, P.A., Bowen, (2002) Defining the role of reverse logistics in attaining sustainable integration of materials delivery with construction and demolition waste management. In Proceedings of Creating a Sustainable Construction Industry. Conference of CIB W10: Creating a Sustainable Construction Industry in Developing Countries, South Africa (2002). Available from: http://buildnet.csir.co.za/cdcproc/docs/3rd/shakantu.pdf [Accessed: 28 October 2007] Shore, J. (2006) Reverse Logistics. Extended Retail Solutions Newsletter [Online], 1 (118), 147. Available from: http://www.extendedretail.com/pastissue/article.asp?art=24202&issue=118 [Accessed: 26 July 2007] WestQuay, 2009. Pamper the Planet. WestQuay’s Environmental Campaign. Available from: http://www.west-quay.co.uk/Website/Event.ashx?ParentSectionId=d920ffc5-e61f-4fb6-8776-187867b184e2&ContentInstanceId=4ab732e1-ccd1-4091-aa28-c4b65d7cbfa5&mode=event,event,event [Accessed: 10 March 2009]