Embed Size (px)
Citation preview
Sustainable
Living
SUSTAINABILITY
WASTE DIVERSION
&
City of Chicago

Table of Contents
1. Our Problem 2
i. Introduction 3
ii. Plastic Oceans 7
iii. Why the Confusion? 9
iv. What Is In Our E-Waste? 13
2. Why Don’t We Recycle? 18
i. What is the root cause? 19
3. Our Goal Our Plan 22
i. Goal: Zero Waste 23
ii. Plan: Copy and Refine 25
References
"Scripps Study Finds Plastic in Nine Percent of 'Garbage Patch' Fishes. "Scripps
Study Finds Plastic in Nine Percent of 'Garbage Patch' Fishes. N.p., 30 June 2011. Web. 05 Apr. 2016.
"Climate Change and Waste." Climate Change and Waste. USEPA, n.d. Web. 04 Apr. 2016
McLinden, Steve. "Buying Property That Was Literally A Dump | Bank rate.com." Buying Property That Was Literally A Dump | Bank rate.com. Bankrate.com, 26 Feb. 2012. Web. 04 Apr. 2016.
Waste Characterization Study. Chicago, IL: SCS Engineers, 1987. Chicago De-partment of Environment. 2 Apr. 2010. Web. 4 Apr. 2016.
"“Circuits of Misery” -Problem of Electronic Waste Disposal." The Sane Age. N.p., 28 Aug. 2015. Web. 23 Mar. 2016.
"About Blue Cart Recycling." City of Chicago. N.p., n.d. Web. 18 Apr. 2016
"The Swedish Recycling Revolution." Official Website of Sweden. N.p., n.d. Web. 10 Apr. 2016. <https://sweden.se/nature/the-swedish-recycling-revolution/>.
Bentley, Chris. "What Really Happens to Chicago's Blue Cart Recycling? "What Re ally Happens to Chicago’s Blue Cart Recycling? Curious City, 1 July 2015.
Web. 18 Apr. 2016.
HOW CAN THIS BE
IMPLEMENTED?
The countries and cities that divert the most waste from landfills have implemented
strict laws that enforce the recycling and diversion programs. These government
bodies have also found ways to raise extra funds for other projects, or plans. As
stated before, Sweden imports trash from England and other countries that have a
hard time implementing an efficient program, and they are able to heavily charge
these countries for their exports.
Is there anything new in this system? Absolutely not. We have to make an action
plan, and enforce it, in order to make our city more livable for the future. It is pro-
jected that the amount of waste that will be added to landfills annually will double
by the year 2050. This will put a huge strain on current landfills, and will force us to
increase the amount of land used for landfills. This will cause longer travel times for
the waste industry, and will cause a larger carbon footprint if we do not take action.
This problem is so large, we decided to attack it from the root of the cause. That
root is ourselves. We are our own worst enemy, and we have the ability to change
the way we do things. So therefore, our plan is to:

INCENTIVES
Through the gamification process, data can be accumulated so we can implement
an incentive system. This plan has not been drawn out, but through the increase in
recycled, re-used, and power and heat production through incineration, this pro-
gram could be funded
Another option might be to allow for tax credits. This tax credit would be through
the city or state, and would probably require a raise in taxes. This would be the
least wanted incentive system. Yet, it is still an option.
Psychological studies have shown that incentive based reinforcement causes better
results than punishment. This incentive based system could help with the efficiency
of the sorting of recycling, before the recycled load makes it to the recycling plant.
Comparative cost analysis would allow for waste management companies to come
up with the incentive program that would allow for continued profits.
Ou
r Pro
ble
m
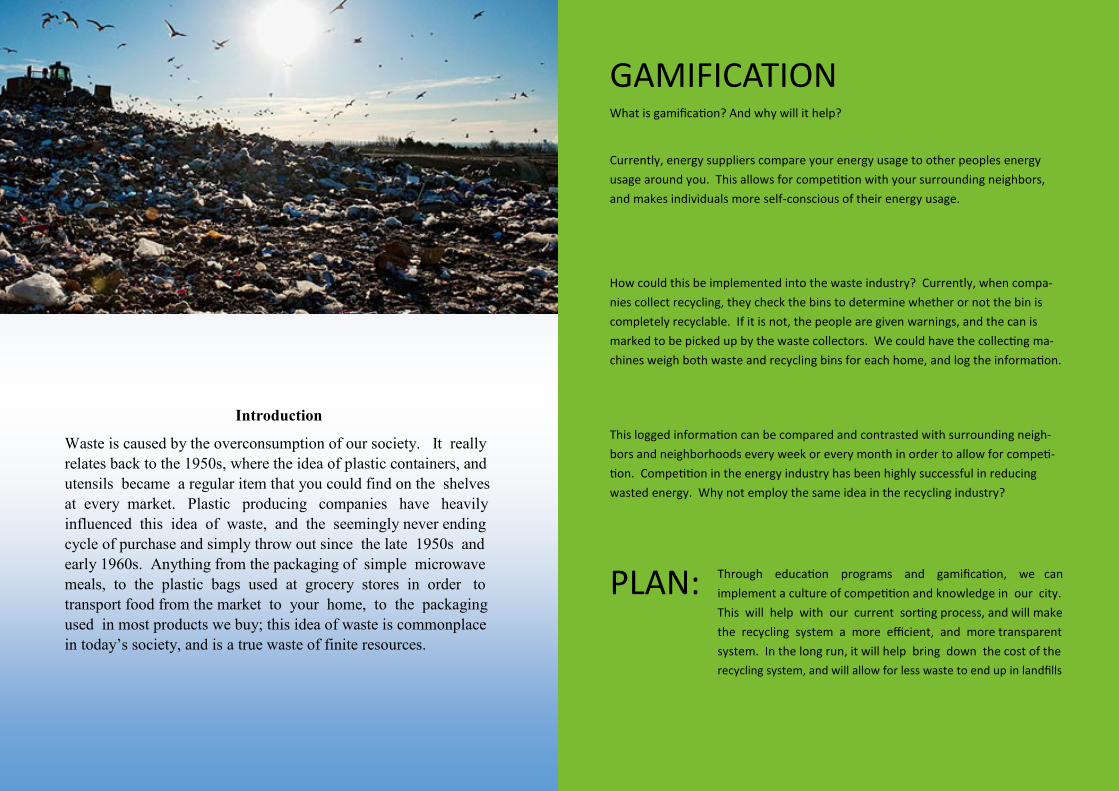
Introduction
Waste is caused by the overconsumption of our society. It really
relates back to the 1950s, where the idea of plastic containers, and
utensils became a regular item that you could find on the shelves
at every market. Plastic producing companies have heavily
influenced this idea of waste, and the seemingly never ending
cycle of purchase and simply throw out since the late 1950s and
early 1960s. Anything from the packaging of simple microwave
meals, to the plastic bags used at grocery stores in order to
transport food from the market to your home, to the packaging
used in most products we buy; this idea of waste is commonplace
in today’s society, and is a true waste of finite resources.
GAMIFICATION What is gamification? And why will it help?
Currently, energy suppliers compare your energy usage to other peoples energy
usage around you. This allows for competition with your surrounding neighbors,
and makes individuals more self-conscious of their energy usage.
How could this be implemented into the waste industry? Currently, when compa-
nies collect recycling, they check the bins to determine whether or not the bin is
completely recyclable. If it is not, the people are given warnings, and the can is
marked to be picked up by the waste collectors. We could have the collecting ma-
chines weigh both waste and recycling bins for each home, and log the information.
This logged information can be compared and contrasted with surrounding neigh-
bors and neighborhoods every week or every month in order to allow for competi-
tion. Competition in the energy industry has been highly successful in reducing
wasted energy. Why not employ the same idea in the recycling industry?
PLAN: Through education programs and gamification, we can
implement a culture of competition and knowledge in our city.
This will help with our current sorting process, and will make
the recycling system a more efficient, and more transparent
system. In the long run, it will help bring down the cost of the
recycling system, and will allow for less waste to end up in landfills

EDUCATION ONE OF THE BIGGEST ISSUES FACING
RECYCLING IS THAT PEOPLE ARE
UNEDUCATED. PEOPLE HAVE VERY
LITTLE IDEA OF EXACTLY WHAT IS
RECYCLABLE AND HOW TO RECYCLE IT
Public and private elementary schools should make an effort to show kids
exactly what is recyclable and how to recycle it. This will inform the next
generation of the issues we face, and the potential solutions we can implement
Exhibits and workshops could also help raise awareness on our current waste issues
Informative commercials and huge ad campaigns focused on the city of Chicago
should be used in order to help educate the general public. Even though this may
come at a large cost, in the end, with the amount of recycled goods that will be
added to the system, it will help fund and pay off the initial cost in time.
THE AVERAGE AMERICAN PRODUCES
4.5 POUNDS OF WASTE DAILY
POPULATION IS EXPECTED TO
INCREASE 25% BY 2050 AND
WASTE IS EXPECTED TO DOUBLE CHEMICALS FROM BLEACH, AND
AMMONIA END UP IN LANDFILLS AND
CAN PRODUCE TOXIC GAS, WHICH CAN
EFFECT THE QUALITY OF AIR AROUND
THE LANDFILLS CLEANING CHEMICALS MIX TO-
GATHER AND FORM A TOXIC FLUID.
WILDLIFE WILL INGEST THIS FLUID
AND PLANTS AFFECTED BY THESE
CHEMICALS CAUSING PAINFUL
DEATH AND DISRUPTIONS IN THE
FOOD CHAIN IN CHICAGO, AN ESTIMATED 5%
OF ALL GREENHOUSE GAS
EMISSIONS ARE CONTRIBUTED
BY THE WASTE SYSTEM
WHY is there a
PROBLEM?
Heavy metals, and chemicals make their way back to
the underground aquifers. And eventually will make
it’s way into our own water used for drinking and
agriculture. Essentially, we are poisoning
ourselves with the way we handle our trash.

Beverage Containers—milk and juice cartons/boxes, coated, water bottles—.8% HHW—Latex paint, oil paint, plant/organism/pest control/growth, used oil/filters, automotive fluids, mercury-containing items, sharps and infectious waste, ash, sludge, industrial processed waste, sewage solids—.2% Inorganics—Televisions, computer monitors, computer equipment/peripherals, electronic equipment, lead-acid batteries, other batteries, tires, household bulky items, fluorescent lights—1.1% Glass—Recyclable glass bottles and jars, flat glass, other glass—4.9% Metals—Aluminum cans, other aluminum, HVACs ducting, tin cans, other ferrous metals, other non-ferrous metals, other metals—3.9% Textiles—Carpet, carpet padding, clothing, etc.—6.2% Plastics—#PET containers, #2HDPE clear, and non clear containers, #6 Polystyrene packaging, all #3-#7 plastics, including, other rigid plastics, grocery bags, trash bags, commercial film, other film, other composite plastic—12.5% Organics—Yard waste (compostable and hardwood), food scraps, bottom fines and dirt, diapers, other organic waste—29% Construction & Demolition—Clean dimensional lumber, clean engineered wood, wood pallets, painted wood, treated wood, con-crete, reinforced concrete, asphalt, rock, bricks, painted and unpainted gypsum board, housing shingles, roofing materials, ceramics, porcelain, etc.—12% Paper—Newsprint, high grade office paper, magazines/catalogs, uncoated OCC/Kraft, boxboard, mixed paper (recyclable and com-postable) etc.—29.5%
In 2010, Food Waste was the single
LARGEST COMPONENT
of municipal solid waste to reach landfills
OVER 70% OF ALL WASTE CAN BE
RECYCLED OR REPURPOSED
TRANSPARENCY
CHICAGO IS THE LEAST TRANSPARENT MAJOR CITY
IN THE COUNTRY WHEN IT COMES TO RECYCLING.
The only easily accessible data available is
from a 2009/2010 EPA statistical analysis of
Chicago’s waste system.
In the Sustainable Chicago Action Agenda,
Chicago makes claims that we have a cur-
rent recycling rate of 45%. Yet, they only
took statistical data from industry, and
any homes that the city of Chicago is
“responsible for”
The city of Chicago states that buildings of 4 or
less homes are of their concern, and any mu-
nicipalities of a greater amount of households
is the landlord’s issue to supply recycling ser-
vices.
I BELIEVE CHICAGO’S STATISTICS ARE DECEPTIVE AND NONTRANSPARENT
PLAN: Be truthful, and upfront about the statistical data. Give monthly
numbers, and keep people up-to-date with recycling data.
Without numbers being easy to find, and without numbers
continuously reminding us of the progress we have made, we
become unaware, and stop caring about our initiative.

OUR PLAN:
COPY &
REFINE
40%
OF FOOD IN
AMERICA GOES
UNEATEN
33.8 MILLION TONS OF FOOD WAS
WASTED IN 2010 IN THE
U.S.
ALL OF THIS WASTED FOOD COULD
BE COMPOSTED, AND USED TO
REPLENISH THE FARMING LAND OF
THE NECESSARY NUTRIENTS & MINER-
ALS NEEDED TO GROW CROPS AND
SUSTAIN OUR EVERGROWING FOOD
DEMAND
THE GREENHOUSE GASES PRODUCED FROM THE
ROTTING OF WASTED FOOD GENERATED 140
MILLION METRIC TONS OF CARBON
DIOXIDE, AND 175 MILLION
METRIC TONS OF METHANE.
METHANE HAS A GLOBAL
WARMING EFFECT 21 TIMES THAT OF CARBON DIOXIDE
ABOUT 12 METRIC TONS OF
CO2 IS PRODUCED TO MEET
THE AVERAGE ANNUAL
ENERGY DEMAND OF A TYPI-
CAL AMERICAN HOUSHOLD

PLASTIC OCEANS
192 COUNTRIES BORDER THE ATLANTIC, PACIFIC, AND INDIAN OCEANS, AND THE
MEDITERANIAN AND BLACK SEAS. 2.5 BILLION METRIC TONS OF SOLID WASTE WAS
PRODUCED IN 2010 BY THESE COUNTRIES. AN ESTIMATED 8 MILLION MET-
RIC TONS OF PLASTIC ENTERED THESE MAJOR BODIES OF WATER IN THAT SAME YEAR
EVEN THOUGH CHICAGO IS NOT NEAR
ONE OF THESE MAJOR BODIES OF WATER,
IT GOES TO SHOW THE COMPLETE MIS-
MANAGEMENT OF THE CURRENT WASTE
SYSTEM WORLDWIDE. ONLY 5% OF PLASTIC
WATER BOTTLES ARE
RECYCLED IN THE
CHICAGOLAND AREA.
IT TAKES 450 YEARS FOR PLASTIC BOTTLES TO BIODEGRADE
Annually, the plastic bottles produced,
that ended up in landfills, if lined up
from end to end, would circle the earth
4 TIMES
THE RECYCLING OF PLASTIC IS CONFUSING, AND A
LABOR STRICKEN PROCESS FOR ALL PARTIES IN-
VOLVED. THERE ARE MANY DIFFERENT KINDS OF
PLASTIC. AND ONE KIND OF PLASTIC CANNOT BE
RECYCLED WITH ANY OTHER KINDS OF PLASTIC,
WHICH MAKES THIS PROCESS MORE DIFFICULT, AND
ECONOMICALLY CHALLENGING.
THE GOLD
STANDARD
Why is Sweden the leader in waste diversion? Not
only do they divert almost all of their own waste
from landfills, but they import a considerable amount
of waste. What are they doing differently?
950,000 HOMES ARE
HEATED USING TRASH
ANOTHER 260,000 HOMES ARE SUPPLIED
ELECTRICITY FROM INCINERATED WASTE
There is a problem, not only in Sweden, but in Germany, Denmark and many other
European countries. That problem is, they are running out of trash to help power
and heat homes. Therefore, Sweden has been importing trash. In fact,
800,000 tons every year to help meet energy demands.
START
Sweden has the
most efficient waste
diversion system in
the world. Their
system should be
copied world-wide.
There are ways to
make the system
more efficient, but
the ultimate goal of
zero-waste ultimately
relies on our ability
to emulate Sweden

ZERO WASTE
Sweden is the gold standard for waste diversion. They recycle 47% of all waste,
incinerate 52% of waste. This means 1% of waste ends up in landfills. Sweden im-
ports 800,000 tons of trash every year.
Norway is RUNNING OUT OF TRASH. They incinerate a considerable amount of
trash for power production
The cities in the U.S. that have an incredibly high diversion rate use these same
tactics. The recycling rate is only about 35-40%. The rest is composted or inciner-
ated for power.
Chicago is the least transparent when it comes to recycling rates. The Chicago Recycling
Coalition states that it is extremely difficult to find any waste information for Chicago
GOAL:
A Scripps study,
performed at UC
San Diego, showed
that 9.2% of all mid-
water fish studied
1000 miles off the
coast of California
contained some
form of plastic in
their stomachs. As
explained in the
study, this figure is
too low, because
it did not take into
account for the fish
that had died from
plastic ingestion, nor
did it account for
any fish that had
already completely
digested the plastic.
www.abc.net.au
http://www.ellenmacarthurfoundation.org/news/the-new-plastics-economy-rethinking-the-future-of-plastics-infographics

WHY THE
CONFUSION?
The confusion is caused by the numerous amounts of plastic that are available on
the open market. The different numerical values are used by the recycling man-
agement system to separate the different kinds of plastic from one another. This
is a tedious system, and mistakes can happen at any given time. When a mistake
is made, and different plastics are melted down for reuse, the entire batch of
melted down plastic is then ruined.
There is something utterly deceptive
about this simplistic value for the
“other” plastic. This “other” plastic has
to be further separated, and has the
exact same recycling issues as the first 6.
These are just a few of the major issue with the recycling system. Most people
don’t know that there are multiple types of plastic being used by each container
you purchase. Water bottles contain both PETE, and HDPE. The PETE is the con-
tainer itself, and the HDPE is the cap, and the locking mechanism used for the cap.
Also plastic bags are virtually impossible to recycle. Recycling plastic bags is
economically impossible due to the fact that it costs $4000 to recycle 1 ton of
plastic bags and it only sells for $32 per ton.
OU
R G
OA
L OU
R P
LAN

This infographic shows that we really don’t have a true understanding of what we
can recycle. Also, when we don’t know what is recyclable, we don’t take the
time to look it up before throwing it in the garbage bin.
Our biggest issue is lack of knowledge, and lack
of information. Also, most people do not have a
true understanding of the benefits of recycling.
We have to make a concerted
effort to not only inform
ourselves, but to inform future
generations on the importance
of recycling and repurposing.
http://www.upworthy.com/here-are-the-top-5-reasons-people-do-and-dont-recycle
THESE ARE THE TIPICAL BOTTLES THAT YOU WILL SEE IN EVERY
CONVENIENT STORE. THE BLUE TOP IS USUALLY MADE OF HDPE, WHILE
THE BOTTLE ITSELF IS MADE OF PETE. IT IS EXTREMELY DIFFICULT TO
REMOVE THE LOCKING MECHANISM (WHICH IS MADE OF HDPE) FROM
THE BOTTLE. IF THE TWO DIFFERENT PLASTICS ARE NOT SEPARATED,
THE PLASTIC WHEN MELTED DOWN WILL LOOK DISCOLORED, AND THE
POLYMER STRUCTURE IS THEN RUINED. TO SUM IT UP, THIS RUINS ANY
PLASTIC THAT IS MIXED. THIS PROCESS IS DONE BY HUMAN WORKERS,
THEREFORE THE SORTING PROCESS HAS A HIGH RATE OF FAILURE, AND
A LOW EFFICIENCY.

NEARLY
OF GLASS ENDED UP IN LANDFILLS
LAST YEAR IN THE CITY OF CHICAGO
100% RECYCLABLE, AND CAN BE
RECYCLED
USING RECYCLED GLASS RATHER THAN NEW PRODUCES
AND
less AIR
less WATER
GLASS IS
RECYCLING 1000 TONS OF GLASS
CREATES ROUGHLY 8 JOBS.
IN CHICAGO ALONE, THIS
WOULD HAVE CREATED
3008 TOTAL JOBS THERE ARE MORE THAN 5000 PEOPLE
LIVING ON THE STREETS OF CHICAGO
DUE TO ECONOMIC HARDSHIP. WE
COULD THEORETICALLY SOLVE THIS
ECONOMIC HARDSHIP FOR 60% OF THE HOMELESS POPULATION
The largest contributor to weak
recycling statistics is that a recycling
plant isn’t easily accessible. This is
huge in multi-residential buildings.
The city of Chicago is extremely
poor when it comes to recycling
rates, and statistical information is
difficult to find.
NATION-WIDE STATISTICS
The recycling rate for Chicago’s Blue Cart Program was 10.23% in 2015. This only
accounts for buildings of 4 separate housing units or less. According to the nation-
wide statistics, if we use the same ratio, then buildings of 5 housing units or more
would have a recycling rate of about 4%.
http://www.upworthy.com/here-are-the-top-5-reasons-people-do-and-dont-recycle

WHAT IS
THE ROOT
CAUSE?
There is a huge correlation between education, age, and location to recycling hab-
its. Even so, the fact that the highest rate of recycling is college graduates, AND a
little bit less than 3 in every 5 recycle daily, is worrisome.
Another surprising fact is that people understand the benefits of recycling. A much
higher percentage of people understand that there are positives to the recycling
process, yet many of us do not make the effort to recycle. Why is that?
http://www.upworthy.com/here-are-the-top-5-reasons-people-do-and-dont-recycle
http://www.upworthy.com/here-are-the-top-5-reasons-people-do-and-dont-recycle
THE AMOUNT OF METAL THAT ENDED UP IN CHICAGO LANDFILLS LAST YEAR
ABOUT 25% OF THAT METAL
WAS FROM ALUMINUM CANS
OR
75,000 TONS
THIS INFOGRAPHIC SHOWS THAT
THE RECYCLING AND CONSERVA-
TION OF ALUMINUM IS AN ISSUE
THROUGHOUT THE UNITED STATES.
ALUMINUM IS 100% RECYCLABLE
AND HAS NO LIMIT TO THE AMOUNT
OF TIMES THAT IT CAN BE RECYCLED
http://infographiclist.com/2013/10/27/the-power-of-aluminum-infographic/

WHAT IS IN OUR
ELECTRONIC
WASTE?
LAST YEAR, OVER 84,000 TONS OF
ELECTRONICS ENDED UP IN LANDFILLS. THIS
REPRESENTS JUST 1.1% OF ALL WASTE, YET
ACCOUNTS FOR 70% OF ALL TOXIC WASTE.
BROMINATED FLAME RETARDANTS
ARE USED IN CIRCUIT BOARDS AND
PLASTIC CASTINGS. THESE DO NOT
BIODEGRADE EASILY AND BUILD UP
IN THE ENVIRONMENT. THE CATHODE RAY TUBES USED
IN MONITORS AND TELEVISION SETS
SOLD WORLDWIDE CONTAIN TENS
OF THOUSANDS OF TONS OF LEAD.
CADMIUM
USED IN RECHARGEABLE COMPUTER BATTERIES, CONTACTS AND SWITCHES. CADMIUM CAN ACCUMULATE IN THE ENVIRONMENT AND IS
HIGHLY TOXIC
MERCURY, USED IN LIGHTING
DEVICES AND FLAT-SCREEN
DISPLAYS, EVENTUALLY WILL MAKE
ITS’ WAY INTO OUR WATER SUPPLY
HEXAVALETN CHROMIUM,
USED IN THE PRODUCTION OF
METAL HOUSINGS ARE HIGHLY
TOXIC AND CARCINOGENIC TO
LIVING ORGANISMS POLYVINYL CHLORIDE (PVC) IS A PLASTIC
USED IN SOME ELECTRONIC PRODUCTS AND FOR
INSULATION ON WIRES AND CABLES.
CHLORINATED DIOXINS AND FURANS ARE
RELEASED WHEN PVC IS PRODUCED OR DISPOSED
OF BY INCINERATION. THESE CHEMICALS ARE
HIGHLY PERSISTENT IN THE ENVIRONMENT
ALL ELEC
TR
ON
ICS
AR
E OV
ER 9
5%
REC
YC
LEAB
LE
EMB
AR
AS
SIN
GLY
,
WO
RLD
WID
E, WE O
NLY
REC
YC
LE
12
.5%
OF A
LL ELECT
RO
NIC
S
WH
Y DO
N’T W
E REC
YCLE?

HOW ARE WE AFFECTING OURSELVES?
THERE ARE MANY WAYS THAT TOXIC CHEMICALS SUCH AS LEAD, CADMIUM, CHROMIUM, BROMINATED FLAME RETARDANTS, AND A NUMBER OF PLASTIC COMPONENTS CAN ENTER THE HUMAN BODY. DIRECT EXPOSURE, INHALATION OF TOXIC FUMES, AND ACCUMULATION OF THESE CHEMICALS IN SOIL, WATER AND FOOD
Exposure to these toxic elements has significant health consequences. Some prevalent health im-pacts of electronic waste exposure include:
Alterations in the function of the thyroid
Lung function can be affected from exposure to chromium, manganese, and nickel
Adverse birth outcomes (preterm birth, low birth weight, stillbirth, and congenital malfor-mations)
Height and weight are significantly lower in e-waste exposed populations
Behavioral alterations
Alterations in cellular levels and function, including DNA damage
PCB, and PBDE exposure can cause an in-creased risk of certain cancers of the digestive tract, liver and skin. Can also cause reproduc-
tive deficiencies, reduced growth rates, re-tarded development, and other neurological defects. Can also have adverse effects on the immune system.
Lead and cadmium exposure may alter bone development, and increase the risk of osteo-porosis later in life.
Environmental and occupational exposure to mercury has been associated with nephrotoxi-city and neurological, cardiovascular, and immune system alterations.
Significantly higher levels of lead were found in the blood and placenta of residents who live in an e-waste recycling town in compari-son to non-exposed populations.
Yet, for some reason, we have had little to no regu-lation by government bodies, when it comes to e-waste. Even worse, we do very little to educate ourselves on the adverse effects of the way we dispose our old electronics
https://thesaneage.wordpress.com/2015/08/28/circuits-of-misery-problem-of-electronic-waste-disposal/

JUST IN THE UNITED STATES ALONE, IN 2010, WE THREW AWAY 135 MILLION CELL PHONES, WHICH ACCOUNTS FOR:
2680 LBS. OF PALLADIUM
7150 LBS. OF GOLD
74500 LBS. OF SILVER
2,680,000 LBS. OF COPPER
THIS IS EQUAL TO
$173 MILLION IN PRECIOUS METALS FROM CELL PHONE WASTE ANNUALLY.
For every 10,000 tons
of solid waste going to
landfills, just 1 job is created
FOR THAT SAME AMOUNT OF WASTE BEING KEPT
OUT OF LANDFILLS, 10 RECYCLING JOBS, OR 75
MATERIALS REUSE JOBS CAN BE CREATED
All according to the U.S. EPA Using these statistics, the city of Chicago could realistically create a total of anywhere from
5,000 to 35,000 new jobs.
http://www.fastcoexist.com/1681368/visualizing-the-worlds-e-waste-problem