Embed Size (px)
Citation preview
WSQA Lite
Washington State Quality Award Assessment Application
WSDOT South Central Region
Monday, December 29, 2008
ii | WSDOT South Central Region :: WSQA Lite Assessment December 2008
Glossary of Acronyms ............................................ iii
WSDOT Organizational Chart ................................ iv
WSDOT Regional Map.............................................v
Section One Preface
Organizational Descriptions ................................ P1
Organizational Challenges .................................. P5
Section Two Assessment Criteria
1 Leadership ...........................................................1
2 Strategic Planning ...............................................3
3 Customer and Market Focus ..............................6
4 Measurement, Analysis,
and Knowledge Management ............................8
5 Workforce Focus ...............................................10
6 Process Management ......................................12
7 Organizational Results ......................................16
Table of Contents
Table of Graphs
Age of state highway concrete pavement ..................................... 6Construction Cost Indices: Washington State, FHWA, and selected Western states ............................................................ 6WSDOT asphalt, crude oil & diesel fuel indices ........................ 7WSDOT turnover by key job classifi cation ................................. 7WSDOT retirement forecast, 2008-2018 ..................................... 7WSDOT Management Principles ................................................. 1SR 24/SR241 to Cold Creek Road – Add lanes ........................... 5WSDOT turnover by key job classifi cation ...............................10Compliance ratings for mandatory training for all employees: SCR vs. WSDOT average .........................................11Highway collision and fatality data comparing South Central Region with state-wide statistics ...................................17I-90 Snoqualmie Pass snowfall and eastbound/westbound highway closures ...........................................................................18State highway pavement trends, 1975-2006 ..............................18Bridge structural condition ratings for FY 2007 ......................18Maintenance Accountability Program (MAP) ratings South Central Region vs all WSDOT regions ...........................18Number of identifi ed environmental compliance incidents by risk level, per quarter ..............................................19Cumulative performance on Nickel and TPA project delivery ...........................................................................................19Engineer’s estimate vs. bid ...........................................................19SCR Communications and public outreach statistics ..............20Number of SCR FTEs vs. fi scal year running average .............20

WSDOT South Central Region :: WSQA Lite Assessment December 2008 | iii
Insertion space for application letter

iv | WSDOT South Central Region :: WSQA Lite Assessment December 2008 Front matter
A
ARA: Assistant Regional Administrator
ATMS: Th e Automated Training Management System is a resource developed to assist anyone in WSDOT who manages training, as well as the employees who require and receive training throughout their career within the department.
C
CIPP: Th e Capital Improvement and Preservation Program lists groups of projects by transportation mode, which include Highway Capital, Traffi c Operations, Washington State Ferries, Rail Capital, Local Programs, and Capital Facilities.
CRA: Cost Risk Assessment is a broad program of risk based assessment being conducted within WSDOT. A key diff erence between conventional estimating and CRA is the expression of project cost and schedule as a distribution (range) rather than as a single number. To develop this outcome, some of the components of an estimate are described as variables, or risks. A major part of CRA is to take a conventional project estimate and to separate out the parts of the estimate that represent base from those representing risk. Th e risk elements are then described in terms of their possible consequences and likeli-hood of occurrence.
E
EAP: Th e Employee Assistance Program helps employees from government, universities, colleges, and multiple governmen-tal programs resolve personal or work-related problems. Th e program is voluntary and available at no cost to both employ-ees and their family members.
ECRB: External Civil Rights Board.
EIS: Th e Environmental Impact Statement is a detailed written statement of project environmental eff ects required by state and/or federal law. Th is term refers to either a draft or fi nal EIS, or both, depending on context.
EMP: Th e Environmental Management Program was devel-oped by WSDOT specifi cally for construction activities. Th e program is based on regional environmental compliance plans, training, and work procedures that apply to construc-tion activities. At this time WSDOT measures environmental performance based on its ability to comply with applicable environmental requirements.
F
FAHP: Federal-Aid Highway Program.
FHWA: Th e Federal Highway Administration is the section of
the United Stated Department of Transportation with juris-diction over the use of federal funds for state highways, local streets, and road improvements.
FTA: Th e Federal Transit Administration is one of operating administrations within the U.S. Department of Transporta-tion. Th e FTA supports locally planned and operated public mass transit systems throughout the United States.
FTE: Full-time equivalent staff position.
G
GEC: General Engineering Consultant.
GMA: Th e Growth Management Act was passed by the state legislature in . It requires state and local governments to manage Washington’s growth by identifying and protecting critical areas and natural resource lands, designating urban growth areas, preparing comprehensive plans and imple-menting them through capital investments and development regulations.
GMAP: Government Management Accountability Perfor-mance is the cornerstone of the Governor’s accountability initiative. GMAP is a management tool that promotes the sharing of current performance data to achieve better results.
GNB: Th e Gray Notebook is a periodic report prepared by WSDOT staff to track a variety of performance and account-ability measures for routine review. Th e GNB anchors WSDOT’s management philosophy and is the basis for exter-nal performance reporting.
H
HAR: Highway Advisory Radio.
HMA: Hot Mix Asphalt.
HRMS: Th e Human Resources Management Report.
HSP: Th e Highway System Plan is a WSDOT planning document that addresses the state highway system element of the Washington Transportation Plan. Th e HSP defi nes service objectives, action strategies and costs to maintain, operate, preserve, and improve the state highway system for years. It is the basis for the state highway element of the six-year plan and the biennial state highway program. It is periodically updated to refl ect completed work, changing transportation needs, polices, and revenues. It compares highway needs to revenues, describes the “fi nancially constrained” costs of the highway programs, and provides details of conceptual needs in the Improvement program.
HQ: Headquarters is located in Olympia and is a concentration of WSDOT strategic leadership and executive management and
Glossary
of Terms and Abbreviations

Front matter WSDOT South Central Region :: WSQA Lite Assessment December 2008 | v
planning functions. HQ takes full responsibility for managing WSDOT activities.
HR: Human Resources department of WSDOT.
HRMS: Human Resources Management System.
I
ICRB: Internal Civil Rights Branch.
IRT: Th e Incident Response Team serves a crucial role in keeping Washington on the move. IRT staff is a specifi cally trained group of WSDOT maintenance employees who respond to blocking incidents on our state’s freeways and highways. Th eir main function is to clear roads and help drivers and restore the normal fl ow of traffi c as safely and as quickly as possible.
L
Lane mile: One mile of one lane of road. One mile of a roadway with four lanes is four lane miles
LOS: Th e Level of Service is a qualitative measure that incor-porates the collective factors of speed travel time, traffi c interruptions, freedom to maneuver, safety, driving comfort and convenience, and operating costs provided by a highway facility under a particular volume condition. Traffi c opera-tional characteristics range from LOS A (free fl ow) to LOS F (low speeds and frequent stoppages).
M
MAP: Maintenance Accountability Process. Twice a year, each region’s maintenance offi ce is graded on its performance and effi ciency from a large list of regular maintenance activi-ties. Th ese activities include pavement patching and repairs, shoulder maintenance, culvert maintenance, litter removal, vegetation management, bridge repairs, snow and ice removal, guardrail maintenance and much more.
MPO: Th e Metropolitan Planning Organization is the local agency designated by the Governor to administer the feder-ally required transportation planning process in metropolitan areas with populations over ,. Th e MPO is responsible for the -year long-range plan and the Transportation Improve-ment Program (TIP).
MO: Maintenance and operations.
N
NEPA: National Environmental Policy Act.
‘Nickel’: Th e Funding Package for transportation capital improvements.
NWR: Northwest Region.
O
OEO: Offi ce of Equal Opportunity.
OFM: Th e Offi ce of Financial Management provides vital information, fi scal services and policy support that the Gover-nor, Legislature, and state agencies need to serve the people of Washington State.
P
PASP: Pre-activity safety plans help managers and employ-ees carry out work activities in a safe manner. Staff use the PASP process to identify potential hazards and how they can be controlled. PASPs are reviewed by all persons involved in a given task prior to the activity. Th e safety offi ce maintains a library of PASPs for common activities.
PCCP: Portland Cement Concrete Pavement is a hydraulic cement made by heating a limestone and clay mixture in a kiln and pulverizing the resulting material.
PD: Project delivery is a way for WSDOT to show customers its eff ectiveness by delivering projects and programs of the highest quality and in a timely and fi scally responsible manner.
PE: Project engineers work in both design and construction. Design PEs are responsible for designing highways and other facilities that integrate all modes of transportation. Construc-tion PEs work closely with contractors to ensure projects are delivered on time and on budget.
PEO: Project engineer offi ces include all members of a design or construction team.
PM: Program management.
PMP: Performance Management Program.
PMRS: Th e Project Management and Reporting System provides WSDOT with a system that enables its staff to eff ec-tively deliver capital projects effi ciently, on time and within budget. Th e PMRS provides accurate, transparent, clear and useful information for progressive implementation through June .
POG: Priorities of Government.
Glossary
of Terms and Abbreviations
vi | WSDOT South Central Region :: WSQA Lite Assessment December 2008 Front matter
Q
QPR: Quarterly Project Report.
R
RA: Regional Administrator.
RCW: Revised Code of Washington.
ROW: Right-of-way is part of the WSDOT Design Offi ce, providing technical support in the disciplines of right-of-way plan development and survey support to WSDOT headquar-ters and regional offi ces.
RTPO: Th e Regional Transportation Planning Organization is a planning organization authorized by the Legislature in as part of the Growth Management Act. Th e RTPO is a voluntary organization with representatives from state and local governments and is responsible for coordinating trans-portation planning activities within a region.
S
SAO: Strategic Assessment Offi ce.
SCR: South Central Region.
SEPA: State Environmental Policy Act.
SIP: Strategic Implementation Plan.
SPMG: Statewide Program Management Group.
SR: State Route.
STIP: Th e Statewide Transportation Improvement Program is a planning document that includes all federally funded projects and other regionally signifi cant projects for a three-year period. Th e STIP is a compilation of all projects that are in the Transportation Improvement Programs (TIPs) developed by the regional planning organization (MPOs and RTPOs). A new STIP must be developed every two years or less and is approved jointly by FHWA and FTA for compliance with statutory requirements and fi nancial feasibility.
T
The Pass: Refers to Interstate Snoqualmie Pass, which is the main east-west corridor across Washington State. Th is corridor is crucial to the state’s economy, and vital to the lives of those who travel it. WSDOT is planning on expanding I- to meet both the current and future needs of those who travel the Pass.
TIP: Transportation Improvement Programs.
TMC: Th ere are seven Traffi c Management Centers in Washing-ton. It’s a way for WSDOT crews to keep an eye on traffi c and highways throughout the state. Th e TMC is the nerve center of highway monitoring and operations.
TPA: Th e Transportation Partnership Account funding package for transportation capital improvements.
TRB: Th e Transportation Research Board works to provide leadership in transportation innovation and progress through research and information exchange, conducted within a setting that is objective, interdisciplinary, and multimodal.
V
VE: Value Engineering is a systematic process using a team from a variety of disciplines to improve the value of a project through the analysis of its functions. Th e VE process incorpo-rates, to the extent possible, the values of design; construction; maintenance; contractor; state, local and federal approval agencies; other stakeholders; and the public.
VMS: A Variable Message Sign is an electronic traffi c sign used on roadways to give travelers information about special events. WSDOT uses these signs to warn traffi c of congestion, colli-sions, roadwork, or speed limits on specifi c state highways.
W
WA: Washington State.
WDFW: Washington State Department of Fish & Wildlife.
WFSE: Washington Federation of State Employees.
WSDOT: Th e Washington State Department of Transportation.
WSP: Th e Washington State Patrol.
WTP: Th e Washington Transportation Plan is a WSDOT planning document developed in coordination with local governments, regional agencies, and private transportation providers. It addresses the future of transportation facilities owned and operated by the state and those the state does not own but has an interest in. It presents a -year vision for these various modes of transportation. It identifi es signifi cant trans-portation investments that are needed to maintain the system, improve safety, provide mobility to a growing population, and keep the economy moving. Th ese transportation needs are defi ned by service objectives which are specifi c, desired outcomes for each mode of transportation. Each service objec-tive is supported by one or more action strategies.
WTSC: Washington Traffi c Safety Commission.
Glossary
of Terms and Abbreviations
Front matter WSDOT South Central Region :: WSQA Lite Assessment December 2008 | vii
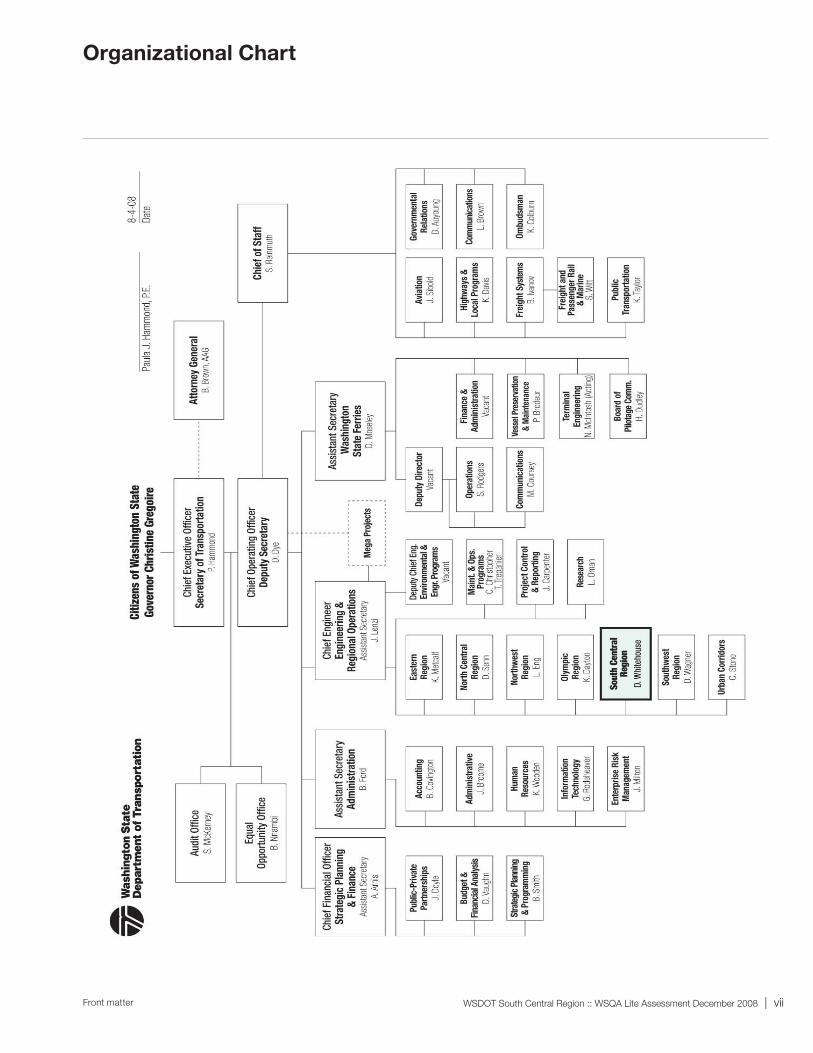
Organizational Chart
viii | WSDOT South Central Region :: WSQA Lite Assessment December 2008 Front matter
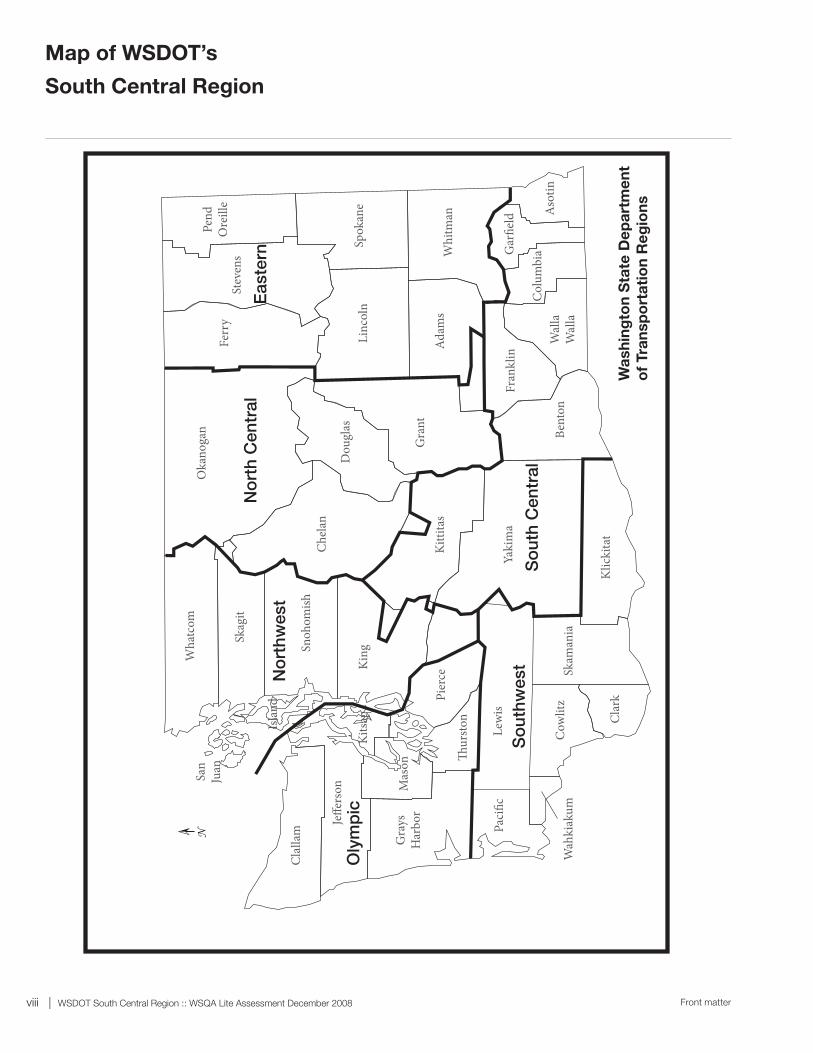
Map of WSDOT’s
South Central Region
Stev
ens
Pend
Ore
ille
So
uthw
est
San
Juan
Isla
nd
Kits
apO
lym
pic
Eas
tern
No
rth
Cen
tral
No
rthw
est
So
uth
Cen
tral
Wa
sh
ing
ton
Sta
te D
ep
art
me
nt
of
Tra
nsp
ort
ati
on
Re
gio
ns
Wha
tcom
Skag
it
Snoh
omish
King
Pier
ce
Thur
ston
Oka
noga
n
Chel
an
Dou
glas
Ferr
y
Clal
lam
Jeffe
rson
Gra
ysH
arbo
rM
ason
Paci
ficLe
wis
Wah
kiak
umC
owlit
z
Clar
k
Skam
ania
Klic
kita
t
Spok
ane
Linc
oln
Whi
tman
Adam
sG
rant
Kitti
tas
Aso
tin
Gar
field
Wal
laW
alla
Fran
klin
Bent
on
Yaki
ma
Col
umbi
a
N
Section One: Section P Preface WSDOT South Central Region :: WSQA Lite Assessment December 2008 | P-1
P.1a Organizational Environment
P.1a (1) Main products, services and delivery mechanisms Th e Washington State Department of Transportation (WSDOT) is a multi-modal transportation agency in one of the fastest growing states in the country, responsible for planning, building and operating a complex highway system in addition to operating a freight and passenger rail system and the largest auto ferry fl eet in the world. Located in central Washington state, the South Central Region (SCR) of WSDOT is respon-sible for two main functions:
. Project Delivery (PD) Building, improving, and preserving state freeways, highways and other transportation facilities:
In the - biennium, SCR plans to deliver more than $ million in projects to improve safety, reduce congestion and preserve infrastructure. Th e - Washington Trans-portation Plan (WTP) establishes goals for WSDOT that are consistent with the direction provided by the Legislature in RCW ... Th e Washington State Highway System Plan (HSP) is the element of the WTP that addresses current and forecasted state highway needs based on the investment options identifi ed in the WTP. Th ese long-range planning documents assess current and future transportation needs.
SCR planning engineers identify needs and solutions for state highways in the region through a collaborative planning process with local governments, regional planning agencies, tribes, and private transportation providers. Th ese improvements are prioritized statewide and submitted to the Washington State Legislature for funding. Funded improvements become part of the Capital Improvement and Preservation Program (CIPP).
SCR program management (PM) staff review funded projects to ensure that all state and federal accounting requirements are met. Next, design teams work closely with right-of-way experts, materials engineers, utility engineers, surveyors and environmental staff to ensure that SCR is in compliance with local, state and federal regulations. Design teams employ special processes such as Value Engineering (VE) and Cost Risk Assessments (CRA) to ensure that projects are designed as cost-eff ectively as possible and to minimize risks to the project schedule, budget, and scope.
Fully designed projects are advertised and awarded to the contractor with the lowest qualifi ed bid. Construction offi ces then coordinate with the contractor’s construction schedule, ensure the project is built to the design plans and specifi cations,
ensure that safety precautions are followed to protect the traveling public and workers, and inspect and approve the fi nal product.
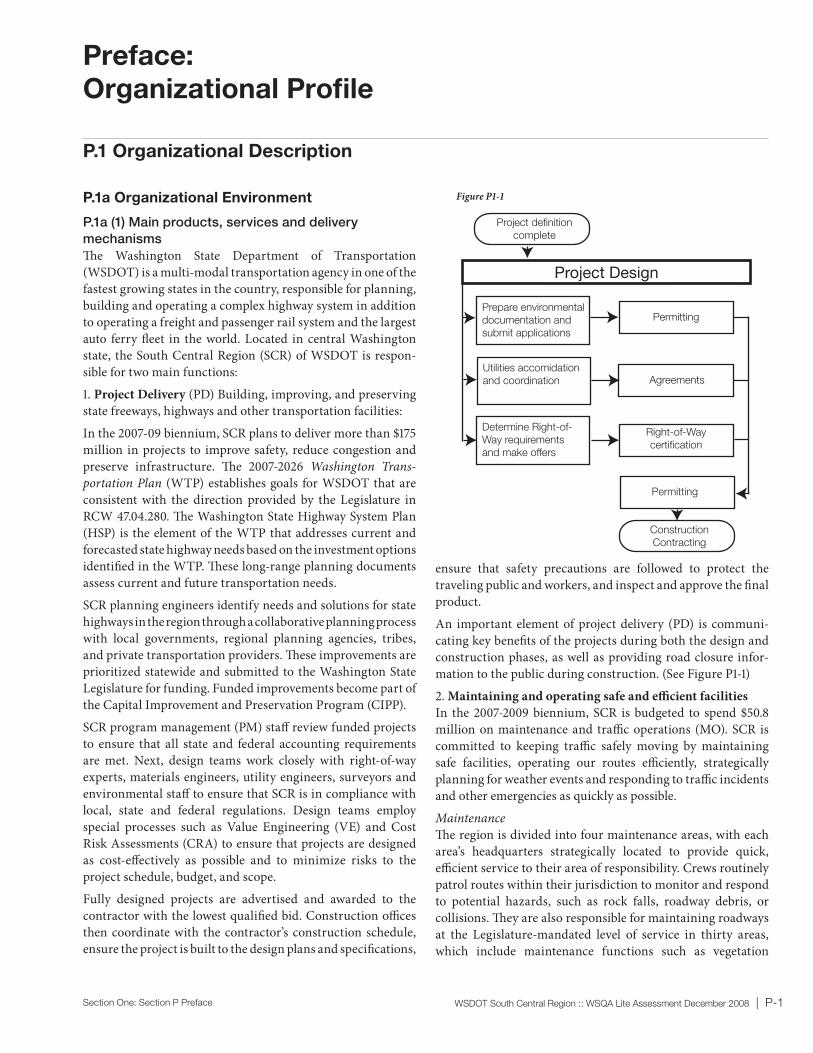
An important element of project delivery (PD) is communi-cating key benefi ts of the projects during both the design and construction phases, as well as providing road closure infor-mation to the public during construction. (See Figure P-)
. Maintaining and operating safe and effi cient facilities In the - biennium, SCR is budgeted to spend $. million on maintenance and traffi c operations (MO). SCR is committed to keeping traffi c safely moving by maintaining safe facilities, operating our routes effi ciently, strategically planning for weather events and responding to traffi c incidents and other emergencies as quickly as possible.
MaintenanceTh e region is divided into four maintenance areas, with each area’s headquarters strategically located to provide quick, effi cient service to their area of responsibility. Crews routinely patrol routes within their jurisdiction to monitor and respond to potential hazards, such as rock falls, roadway debris, or collisions. Th ey are also responsible for maintaining roadways at the Legislature-mandated level of service in thirty areas, which include maintenance functions such as vegetation
P.1 Organizational Description
Project Design
Prepare environmental
documentation and
submit applications
Utilities accomidation
and coordination
Determine Right-of-
Way requirements
and make offers
Permitting
Agreements
Right-of-Way
certification
Permitting
Project definition
complete
Construction
Contracting
Preface:
Organizational Profi le
Figure P1-1

P-2 | WSDOT South Central Region :: WSQA Lite Assessment December 2008 Section One: Section P Preface
management, roadway sweeping, snow and ice removal, and pavement striping.
SCR maintenance crews face the additional challenge of keeping several mountain passes open during the winter months. SCR is wholly or partially responsible for four mountain passes, and has sole responsibility for Snoqualmie Pass – the state’s major east-west crossing of the Cascade Mountain Range. SCR has developed an in-depth winter weather response plan to combat oft en harsh and unpredictable winter weather on the passes, and avalanche threats from active snow chutes adjacent to state highways. When this report was being fi nal-ized, the region was experiencing severe winter storms and all SCR crews were working around the clock to ensure safe travel for passengers and freight. Crews use high-tech weather and snowpack analysis and industry-leading snow removal and avalanche control equipment to manage the passes during the winter season.
Operations
SCR employs specially-trained maintenance staff who respond to blocking incidents on our area’s freeways and highways as part of the agency’s incident response program. Th ey clear roads and help drivers to restore the normal fl ow of traffi c as safely and quickly as possible, and provide assistance to other emergency responders during incidents and also assist motor-ists directly by relocating disabled vehicles, assisting with fl at tires or off ering other aid.
Traffi c Management Center (TMC) staff use traffi c technology, such as traffi c cameras and variable message signs to smooth traffi c fl ows and reduce situations that constrict roads, as well as help drivers adapt to changing circumstances on the road. SCR’s main TMC is located in Union Gap, with support from a winter operations center on Snoqualmie Pass. TMC staff monitor traffi c and identify problems using dozens of cameras located on routes throughout the region, coordinate with the Washington State Patrol (WSP) and emergency response crews to respond to highway incidents, and dispatch and coordinate the activities of maintenance crews in responding to incidents.
A key component of training for both PD and MO are their respective Environmental Management Programs (EMP). Each program includes regional environmental compliance plans, training and work procedures that apply to construction and maintenance activities. EMP training for appropriate staff ensures that SCR projects and operations are in compliance
with environmental laws, regulations and policies.
P.1a (2) Organizational cultureWSDOT strives to be a high-performance organization credi-ble and accountable to the Governor, Legislature, taxpayers and transportation delivery partners across the state. WSDOT aims to “keep Washington moving” by being a proactive agency, adaptive to changing technologies, government initia-tives, environmental factors, and changes in the industry. (See Figure P-)
P.1a (3) Workforce profi leSCR’s diverse programs and projects are supported by permanent employees, including planners, engineers, avalanche specialists, biologists and fi scal analysts. During the winter months, the region employs as many as non perma-nent and seasonal employees, many who assist with snow and ice removal. About percent of SCR’s staff is stationed throughout the region at strategically located work sites. Th e remaining percent work out of the region headquarters in Union Gap.
About percent of SCR’s employees work in MO. Another percent work in PD. Th e remaining employees work in support services, including information technology, human
SCR Purpose
Key elements of our purpose are outlined in RCW 47.01.011: Create
a statewide transportation development plan which identifi es present
status and sets goals for the future, promote and protect land
use programs required by law, coordinate transportation with the
economic development of the state, and administer programs relating
to the safety of the state’s transportation systems.
SCR Mission
Keep people and business moving by operating and improving the
state’s transportation systems vital to taxpayers and communities.
SCR Vision
Our employees create our success by working in partnership with
citizens, elected offi cials, contractors, and local agencies to plan,
build, maintain, and operate a safe and effi cient transportation
system.
SCR Values
• Work together in a culture of workplace excellence and diversity.
• Adhere to highest standards of courtesy, integrity and ethical
conduct.
• Encourage and recognize employees’ professionalism and career
growth.
• Strive for the effectiveness of all of our employees in meeting
WSDOT’s communications standards.
Preface:
Organizational Profi le
P.1 Organizational Description
Figure P1-2
Section One: Section P Preface WSDOT South Central Region :: WSQA Lite Assessment December 2008 | P-3
resources, communications, fi nancial services, secretarial support, and safety.
SCR actively recruits college engineering students to fi ll summer workforce vacancies; students gain valuable career related experience and are more likely to consider seeking a career with WSDOT. SCR travels to states such as Montana and Wisconsin to recruit graduating engineers. In addition to the challenging nature of the work, key benefi ts for employ-ees include health insurance, retirement benefi ts, vacation and sick leave, paid holidays, and shared leave. SCR employees may seek confi dential, professional help with personal or work-related problems through the Employee Assistance Program (EAP) of the Department of Personnel. Regional leadership emphasizes workforce and agency pride, and annually recog-nizes all permanent employees with WSDOT logo-apparel.
SCR has Washington Management Service (WMS) employ-ees. Other employees are members of two WSDOT recognized separate unions that are exclusive bargaining representa-tives for several bargaining units. Engineering employees (up through the transportation engineer level) and transporta-tion planners are represented by the International Federation of Professional and Technical Engineers (Local , AFL-CIO). Maintenance employees (up through the maintenance super-visor level) and some support services staff are represented by the Washington Federation of State Employees (WFSE).
Given the diverse organizational mission of WSDOT, a wide range of safety and health credentials are required for diff erent positions by internal, state, and federal agencies.
P.1a (4) Major facilities, technologies, and equipment
FacilitiesTh e map on page vii shows SCR’s physical boundaries, which extend on the north along I- from North Bend to Vantage, to Satus Pass on the south, and to the Idaho state line at Clark-ston on the east. Th e region’s terrain varies from the rugged Cascade Mountains to arid plateaus, from busy metropolitan settings to rural farmlands. SCR is responsible for all or part of nine counties and covers seven Legislative districts. Th e region also includes unique features such as the U.S. Military Reserva-tion Yakima Training Center, the Yakama Nation Reservation, and the U.S. Department of Energy’s Hanford site.
In addition to work sites, SCR also manages a variety of transportation facilities. Of WSDOT’s total facilities, SCR is responsible for:
, lane miles of highway, ( percent of the state’s total •
centerline miles) including percent of the state’s concrete lanes. Maintenance of about bridges–about percent of all • state bridges. Operating and maintaining six rest areas, , acres of • property, and six environmental mitigation sites.
Technologies: SCR engineers and program management staff use the Project Management and Reporting System (PMRS) to manage project scope, schedule, cost, and associated information. Th is industry-leading project management soft ware helps SCR staff deliver capital projects effi ciently, on time and within budget. Its reporting and fund managing capabilities help program management staff project future workforce needs.
In , Washington state purchased the Human Resources Management System (HRMS), a fl exible personnel/payroll soft ware application, to replace one of the state’s older mainframe systems and support signifi cant changes to the state’s civil service system. HRMS is confi gured to state require-ments for all state agency personnel and payroll soft ware applications, providing functionality that meets business process requirements, reporting requirements, and allows for future expansion into other personnel functions. Th is system calculates payroll, performs the accounting for warrants, and supports hiring processes.
Th e Automated Training Management System (ATMS) is a soft ware application used by staff who manage training, as well as employees who require and receive training throughout their career. ATMS assists human resources staff in identify training needs, scheduling courses and classes, registering employees and selected non-WSDOT employees, reporting, and confi rming classes.
SCR provides laptops, PDAs and/or cell phones to senior managers and senior maintenance staff to ensure that they are available and accessible to internal and external customers. SCR uses a Virtual Private Network (VPN) to allow manag-ers with WSDOT laptops to access internal fi les and networks from home or while traveling.
Equipment:SCR manages more than , pieces of equipment with a fl eet of over motorized vehicles, including fi ve snow blowers, dump trucks that convert from summer use to snow plows, a striping truck, mowers, and a Sno-Cat. SCR utilizes specialized equipment to keep our crews safe, such as impact attenuators to protect active work zones. SCR uses real-time data from
Preface:
Organizational Profi le
P.1 Organizational Description
P-4 | WSDOT South Central Region :: WSQA Lite Assessment December 2008 Section One: Section P Preface
remote weather stations to aid in avalanche forecasting and winter weather management. Seasonal avalanche control is accomplished with a mm recoilless rifl e, manually-placed explosive charges and a specially trained dog. All avalanche technicians wear avalanche beacons while in the fi eld.
P.1a (5) Regulatory environment Federal and state laws govern most of SCR’s operations. Projects that include federal funding are governed by the FHWA/WSDOT Stewardship Agreement. Th e agreement formalizes delegated responsibilities, ensures the effi cient and eff ective management of public funds, and ensures that the Federal-Aid Highway Program (FAHP) is delivered consistent with laws, regulations and policies. FHWA and WSDOT jointly admin-ister the FAHP through methods of oversight that include performance indicators and measures.
Th e National and State Environmental Policy Acts (NEPA/SEPA) are public disclosure regulations that are managed by SCR. For each project, SCR environmental staff uses the WSDOT Environmental Procedures Manual to navigate NEPA/SEPA requirements. Staff uses several types of studies to investigate and document all the potential impacts of a project.
Th e Legislature outlined WSDOT’s responsibilities in Title of the RCW. In addition to Title , RCW . requires all state agencies to defi ne their objectives and establish measur-able goals to achieve desirable and timely results.
SCR and WSDOT as a whole are subject to internal, state and federal audits, including audits from the Department of Revenue, the Department of Retirement Systems, the Internal Revenue Service, the Joint Legislative Audit Committee, and the State Auditor’s Offi ce. SCR values recommendations to improve its operations, and has developed comprehensive action plans to address those recommendations within its control.
P.1b Organizational Relationships
P.1b (1) Organization structure and governance systemTh e organizational chart on page vi shows the major reporting relationships within SCR and WSDOT. As a cabinet agency, the Secretary of Transportation reports directly to the gover-nor. Th e agency’s Chief Engineer oversees the seven regional offi ces, including SCR. Within SCR, the regional administra-tor (RA) is responsible for the operations of the entire region. Th e RA organizes the region’s workforce and functions to eff ectively deliver SCR’s key products and services.
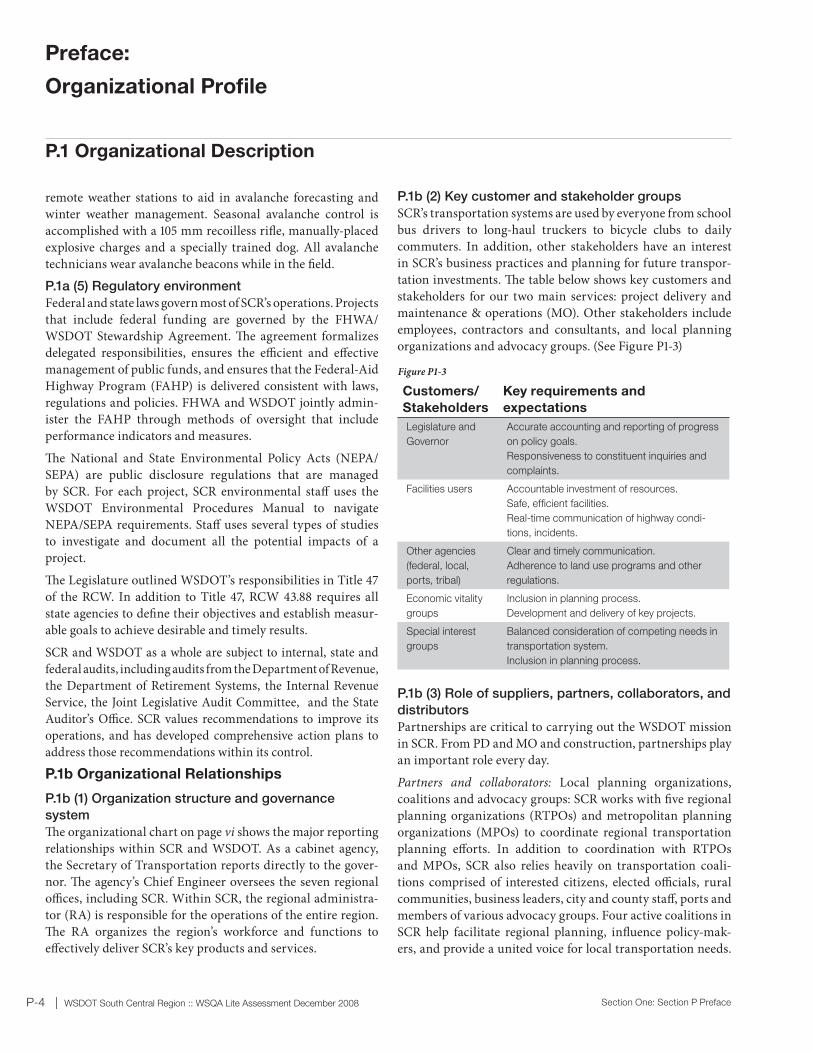
P.1b (2) Key customer and stakeholder groups SCR’s transportation systems are used by everyone from school bus drivers to long-haul truckers to bicycle clubs to daily commuters. In addition, other stakeholders have an interest in SCR’s business practices and planning for future transpor-tation investments. Th e table below shows key customers and stakeholders for our two main services: project delivery and maintenance & operations (MO). Other stakeholders include employees, contractors and consultants, and local planning organizations and advocacy groups. (See Figure P-)
P.1b (3) Role of suppliers, partners, collaborators, and distributors Partnerships are critical to carrying out the WSDOT mission in SCR. From PD and MO and construction, partnerships play an important role every day.
Partners and collaborators: Local planning organizations, coalitions and advocacy groups: SCR works with fi ve regional planning organizations (RTPOs) and metropolitan planning organizations (MPOs) to coordinate regional transportation planning eff orts. In addition to coordination with RTPOs and MPOs, SCR also relies heavily on transportation coali-tions comprised of interested citizens, elected offi cials, rural communities, business leaders, city and county staff , ports and members of various advocacy groups. Four active coalitions in SCR help facilitate regional planning, infl uence policy-mak-ers, and provide a united voice for local transportation needs.
Customers/
Stakeholders
Key requirements and
expectations
Legislature and
Governor
Accurate accounting and reporting of progress
on policy goals.
Responsiveness to constituent inquiries and
complaints.
Facilities users Accountable investment of resources.
Safe, effi cient facilities.
Real-time communication of highway condi-
tions, incidents.
Other agencies
(federal, local,
ports, tribal)
Clear and timely communication.
Adherence to land use programs and other
regulations.
Economic vitality
groups
Inclusion in planning process.
Development and delivery of key projects.
Special interest
groups
Balanced consideration of competing needs in
transportation system.
Inclusion in planning process.
Preface:
Organizational Profi le
P.1 Organizational Description
Figure P1-3
Section One: Section P Preface WSDOT South Central Region :: WSQA Lite Assessment December 2008 | P-5
RTPOs, MPOs, and coalitions provide a forum for community input and easily-accessible cross-sections of the community for giving and receiving information. During the planning process they identify and defi ne needs, identify potential solutions and support public outreach eff orts.
Distributors: Contractors and consultants: Contractors are a key “distributor” of SCR’s improvement and preservation projects. SCR staff work closely with contractors because SCR’s PD success depends on their success. From time to time, SCR also hires consultants to help deliver some of the larger projects. Th e general engineering consultant (GEC) works with SCR staff to help manage the delivery of SCR’s mega-proj-ect, the I- Snoqualmie Pass East Project. Th e GEC approach off ers SCR the advantage of top-quality staff for a limited time period and at a negotiated, fi xed price.
A key supply chain requirement for both project delivery and MO is the availability of materials such as steel, asphalt, salt, and fuel. Th is supply chain can be aff ected by market fl uctua-tions and available manufacturers. Volatile material costs, such as liquid asphalt, which has doubled in price from the summer of , aff ect our ability to deliver the paving program.
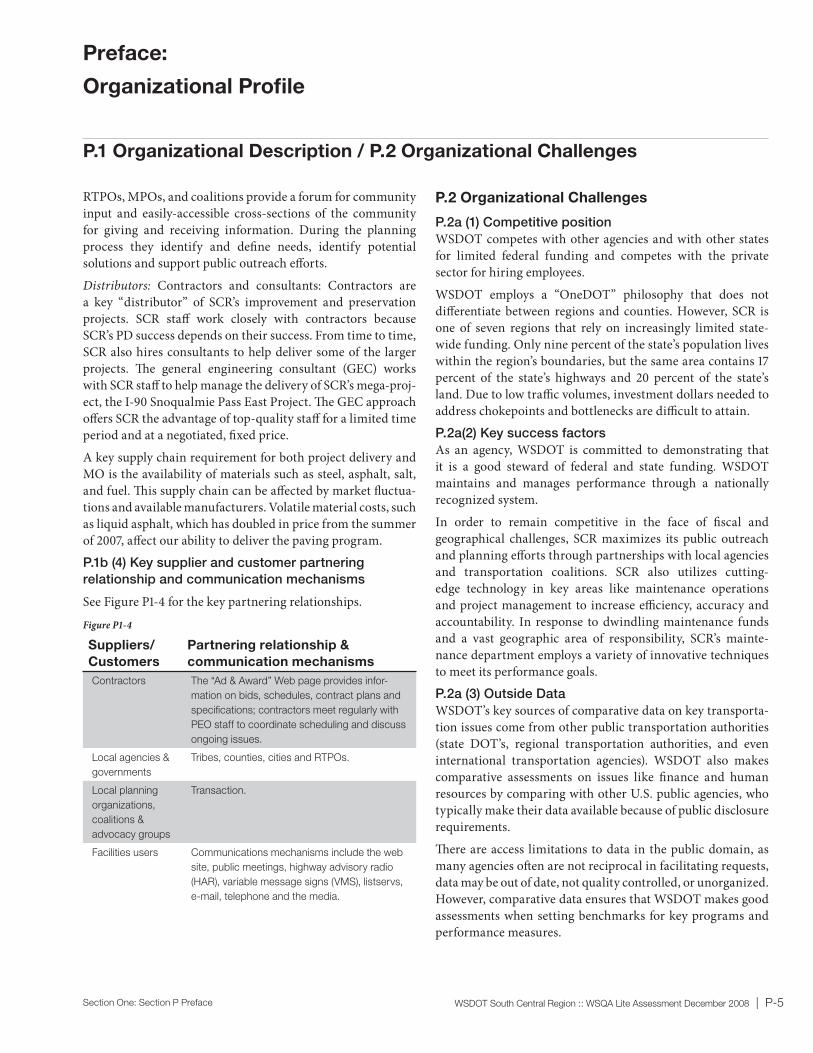
P.1b (4) Key supplier and customer partnering relationship and communication mechanisms
See Figure P- for the key partnering relationships.
Suppliers/
Customers
Partnering relationship &
communication mechanisms
Contractors The “Ad & Award” Web page provides infor-
mation on bids, schedules, contract plans and
specifi cations; contractors meet regularly with
PEO staff to coordinate scheduling and discuss
ongoing issues.
Local agencies &
governments
Tribes, counties, cities and RTPOs.
Local planning
organizations,
coalitions &
advocacy groups
Transaction.
Facilities users Communications mechanisms include the web
site, public meetings, highway advisory radio
(HAR), variable message signs (VMS), listservs,
e-mail, telephone and the media.
Preface:
Organizational Profi le
P.2 Organizational Challenges
P.2a (1) Competitive positionWSDOT competes with other agencies and with other states for limited federal funding and competes with the private sector for hiring employees.
WSDOT employs a “OneDOT” philosophy that does not diff erentiate between regions and counties. However, SCR is one of seven regions that rely on increasingly limited state-wide funding. Only nine percent of the state’s population lives within the region’s boundaries, but the same area contains percent of the state’s highways and percent of the state’s land. Due to low traffi c volumes, investment dollars needed to address chokepoints and bottlenecks are diffi cult to attain.
P.2a(2) Key success factors As an agency, WSDOT is committed to demonstrating that it is a good steward of federal and state funding. WSDOT maintains and manages performance through a nationally recognized system.
In order to remain competitive in the face of fi scal and geographical challenges, SCR maximizes its public outreach and planning eff orts through partnerships with local agencies and transportation coalitions. SCR also utilizes cutting-edge technology in key areas like maintenance operations and project management to increase effi ciency, accuracy and accountability. In response to dwindling maintenance funds and a vast geographic area of responsibility, SCR’s mainte-nance department employs a variety of innovative techniques to meet its performance goals.
P.2a (3) Outside Data WSDOT’s key sources of comparative data on key transporta-tion issues come from other public transportation authorities (state DOT’s, regional transportation authorities, and even international transportation agencies). WSDOT also makes comparative assessments on issues like fi nance and human resources by comparing with other U.S. public agencies, who typically make their data available because of public disclosure requirements.
Th ere are access limitations to data in the public domain, as many agencies oft en are not reciprocal in facilitating requests, data may be out of date, not quality controlled, or unorganized. However, comparative data ensures that WSDOT makes good assessments when setting benchmarks for key programs and performance measures.
P.1 Organizational Description / P.2 Organizational Challenges
Figure P1-4

P-6 | WSDOT South Central Region :: WSQA Lite Assessment December 2008 Section One: Section P Preface
Age of state highway concrete pavementNumber of lane miles
Data Source: WSDOT.
700600500400300200100
00-10years
11-20 21-30 31-40 41-50 51-60 61+
Original
design life
P.2b Strategic ContextBusiness Directions, WSDOT’s strategic plan for - identifi es key challenges currently facing WSDOT: increasing demands on the system, highway safety, aging infrastructure, increasing costs, diminishing revenue, workforce needs, infor-mation technology, environmental challenges, and capital project delivery. All of these challenges aff ect SCR, but fi ve are particularly felt by the region:
. Increasing demands on the system – Th e growth in Washing-ton State’s population, workforce, and economy continues to put pressure on the transportation system. In terms of size and growth, western Washington counties continue to have the largest overall populations. However, while the majority of growth since remains concentrated on the west side of the state, three counties in SCR ranked within the top ten fastest growing counties from to . Franklin County ranked fi rst with a growth rate of . percent. Kittitas County was fourth, with a rate of . percent, and Benton County was ninth, with a rate of . percent. In addition, Yakima is the th most populous city in the state. Th is growth creates choke-points for commuters, travelers and freight, and threatens the economic vitality of the region – a top priority for many SCR stakeholders.
SCR is also particularly challenged by the need to keep freight moving, as Washington’s transportation system supports the highest per capita trade in the nation. Over million tons of freight, worth more than $ billion, moves through Washington state each year, the majority by truck. Between and , freight truck trips increased by percent on the I- corridor.
. Aging infrastructure – SCR highways include lane miles of chip seal pavment, , lane miles of asphalt (HMA), and lane miles of concrete (PCCP). As pavement ages, a regular schedule of maintenance, rehabilitation, reconstruction, and replacement is needed to keep the system usable. Timing is important. If maintenance and preservation are deferred, costs increase dramatically – pay now, or pay more later. Currently, about percent of state highway pavement is in fair or better condition, and SCR’s condition rating matches the statewide average. WSDOT rehabilitates asphalt and chip seal pavements by using a lowest life-cycle cost model that identifi es the optimal time for rehabilitation. In SCR and statewide, asphalt backlogs are growing due to rising material costs.
Th e state also faces a large challenge with concrete pavement. Much of Washington’s concrete pavement, a legacy of the federal interstate system, is old and deteriorating. Existing
P.2 Organizational Challenges
PCC pavement life ranges from to years. Over lane miles, or % of the state’s concrete miles, are in SCR. Concrete pavement is typically placed on heavily traveled interstates and is very expensive to replace at an estimated $. million per lane mile. In addition to pavement, SCR faces the challenge of aging technology and equipment for highway operations. Computer systems and equipment (such as traffi c signals, variable message signs, and traffi c cameras) are used on many state highways to improve traffi c management and provide traveler information. Many of these systems are old and obsolete and will need upgrading or complete replacement in the coming years. (See Figure P-)
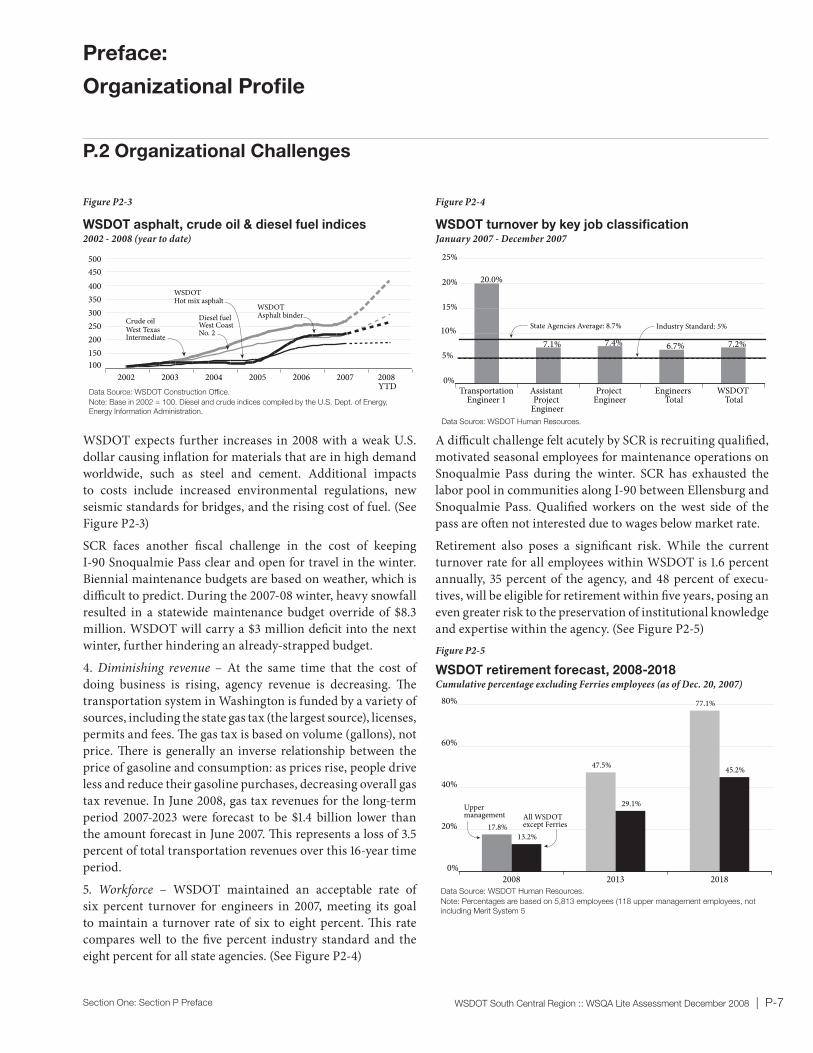
. Increasing costs – Between and , materials costs rose by an average of . percent a year. Since , costs have grown much more rapidly. Between and , materials costs increased by percent each year, but between and , costs rose percent – an increase that signifi cantly aff ects highway construction and maintenance. (See Figure P-)
Preface:
Organizational Profi le
Figure P2-1
Age of state highway concrete pavementNumber of lane miles
Construction Cost Indices Washington State, FHWA, and selected Western States
1990 - 2008 (YTD)
100
150
200
250
300
1990 1995 2000 2005 2008Data Source: WSDOT Construction Office
Note: WSDOT 2008 index is for quarters 1 and 2, The FHWA Index was discontinued in 2007,
Other states 2008 data includes California, Colorado, Oregon, South Dakota and Utah annual indices.
Note: 2003 and 2004 WSDOT CCI data points adjusted to correct for spiking bid prices on
structural steel.
End of FHWA Indexing
FHWAOther States Combined
WSDOT Base 1990 = 110FHWA and Other States Base 1987 = 100Other States: California, Colorado, Oregon,South Dakota and Utah
WSDOT
CCI
Construction Cost Indices: Washington State, FHWA,
and selected Western states1990 - 2008 (yeat to date)
Figure P2-2
Section One: Section P Preface WSDOT South Central Region :: WSQA Lite Assessment December 2008 | P-7
100150200250300350400450500
2002 2003 2004 2005 2006 2007 2008 YTD
Data Source: WSDOT Construction Office.
Note: Base in 2002 = 100. Diesel and crude indices compiled by the U.S. Dept. of Energy,
Energy Information Administration.
WSDOT asphalt, crude oil & diesel fuel indices2002-2008 (year to date)
Crude oilWest Texas Intermediate
Diesel fuelWest Coast No. 2
WSDOTHot mix asphalt
WSDOT Asphalt binder
WSDOT expects further increases in with a weak U.S. dollar causing infl ation for materials that are in high demand worldwide, such as steel and cement. Additional impacts to costs include increased environmental regulations, new seismic standards for bridges, and the rising cost of fuel. (See Figure P-)
SCR faces another fi scal challenge in the cost of keeping I- Snoqualmie Pass clear and open for travel in the winter. Biennial maintenance budgets are based on weather, which is diffi cult to predict. During the - winter, heavy snowfall resulted in a statewide maintenance budget override of $. million. WSDOT will carry a $ million defi cit into the next winter, further hindering an already-strapped budget.
. Diminishing revenue – At the same time that the cost of doing business is rising, agency revenue is decreasing. Th e transportation system in Washington is funded by a variety of sources, including the state gas tax (the largest source), licenses, permits and fees. Th e gas tax is based on volume (gallons), not price. Th ere is generally an inverse relationship between the price of gasoline and consumption: as prices rise, people drive less and reduce their gasoline purchases, decreasing overall gas tax revenue. In June , gas tax revenues for the long-term period - were forecast to be $. billion lower than the amount forecast in June . Th is represents a loss of . percent of total transportation revenues over this -year time period.
. Workforce – WSDOT maintained an acceptable rate of six percent turnover for engineers in , meeting its goal to maintain a turnover rate of six to eight percent. Th is rate compares well to the fi ve percent industry standard and the eight percent for all state agencies. (See Figure P-)
Preface:
Organizational Profi le
P.2 Organizational Challenges
WSDOT Turnover by key job classificationJanuary 2007 - December 2007
7.1% 7.4% 7.2%6.7%
20.0%
0%
5%
10%
15%
20%
25%
TransportationEngineer 1
Assistant Project
Engineer
Project Engineer
Engineers Total
WSDOT Total
State Agencies Average: 8.7% Industry Standard: 5%
Data Source: WSDOT Human Resources.
A diffi cult challenge felt acutely by SCR is recruiting qualifi ed, motivated seasonal employees for maintenance operations on Snoqualmie Pass during the winter. SCR has exhausted the labor pool in communities along I- between Ellensburg and Snoqualmie Pass. Qualifi ed workers on the west side of the pass are oft en not interested due to wages below market rate.
Retirement also poses a signifi cant risk. While the current turnover rate for all employees within WSDOT is . percent annually, percent of the agency, and percent of execu-tives, will be eligible for retirement within fi ve years, posing an even greater risk to the preservation of institutional knowledge and expertise within the agency. (See Figure P-)
Figure P2-3
WSDOT asphalt, crude oil & diesel fuel indices2002 - 2008 (year to date)
Figure P2-4
WSDOT turnover by key job classifi cationJanuary 2007 - December 2007
Figure P2-5WSDOT Retirement forecast, 2008 2018Cumulative percentage excluding Ferries employees (numbers as of Dec. 20, 2007)
17.8%
47.5%
77.1%
13.2%
29.1%
45.2%
0%
20%
40%
60%
80%
2008 2013 2018
Upper management All WSDOT
except Ferries
Data Source: WSDOT Human Resources.
Note: Percentages are based on 5,813 employees (118 upper management employees, not
including Merit System 5
WSDOT retirement forecast, 2008-2018Cumulative percentage excluding Ferries employees (as of Dec. 20, 2007)
P-8 | WSDOT South Central Region :: WSQA Lite Assessment December 2008 Section One: Section P Preface
Key Advantages Partnerships and collaborations – Internal partnerships • are critical to carrying out the WSDOT mission in SCR. From maintenance to project delivery and construction, partnerships play an important role in what we do every day. Partnerships can be developed for one project or can develop into long-lasting relationships that continue to create solutions that work best for everyone involved.Leadership – empowerment: Robust internship program, • E rotation, senior leadership developmentSeasonal staffi ng• Training matrices• Mentoring• Human resources – online HR tools• Business Planning – strategic plan•
P.2 (c) Performance Improvement SystemWSDOT’s “what gets measured, gets managed” management priority and its primary performance report, the Gray Notebook, are among the most advanced management approaches across Washington State agencies. As such, agency-wide perfor-mance reporting is a high priority at WSDOT. Data tracking, measurement, and reporting methods are continuously refi ned and evaluated. Th e reporting approach is dynamic to adapt to changing public and legislative expectations, agency needs, and to provide timely performance information.
As a state agency, WSDOT also tracks performance through the Government Management and Accountability Program (GMAP). WSDOT’s performance is also measured through the Transportation Progress Report, produced biennially by OFM.
Preface:
Organizational Profi le
P.2 Organizational Challenges
Section Two WSDOT South Central Region :: WSQA Lite Assessment December 2008 | 1
1.a. How do senior leaders set organizational
vision and values?
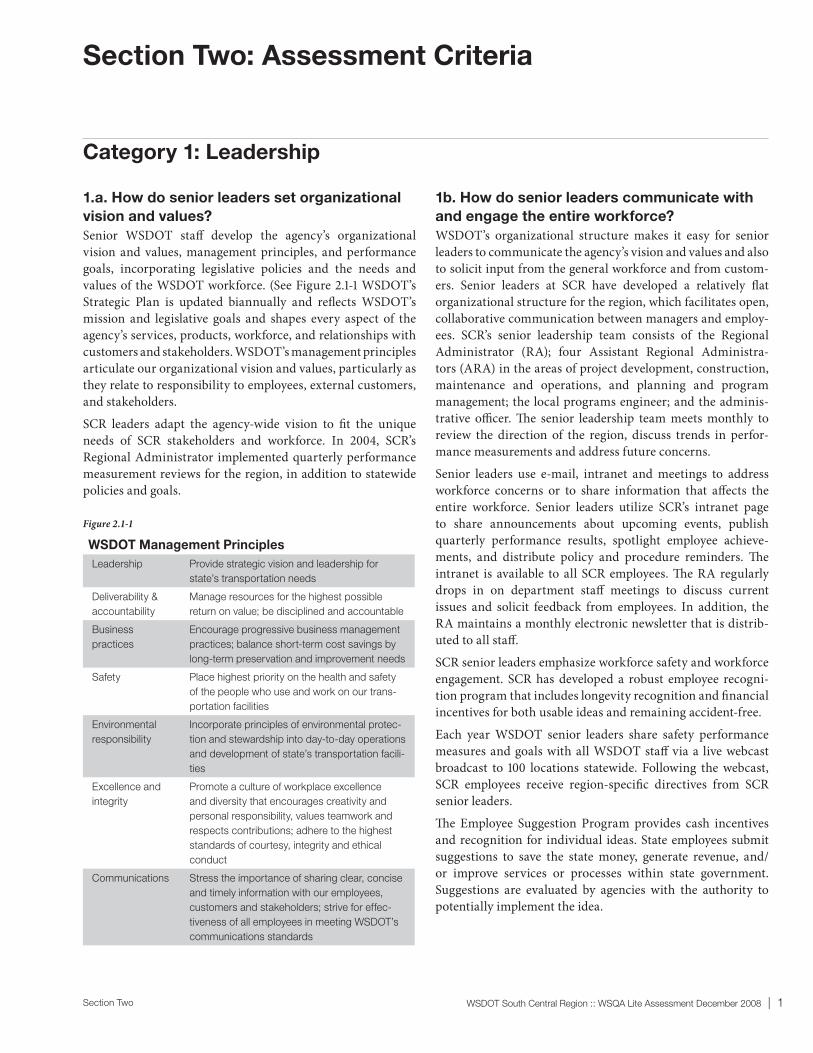
Senior WSDOT staff develop the agency’s organizational vision and values, management principles, and performance goals, incorporating legislative policies and the needs and values of the WSDOT workforce. (See Figure .- WSDOT’s Strategic Plan is updated biannually and refl ects WSDOT’s mission and legislative goals and shapes every aspect of the agency’s services, products, workforce, and relationships with customers and stakeholders. WSDOT’s management principles articulate our organizational vision and values, particularly as they relate to responsibility to employees, external customers, and stakeholders.
SCR leaders adapt the agency-wide vision to fi t the unique needs of SCR stakeholders and workforce. In , SCR’s Regional Administrator implemented quarterly performance measurement reviews for the region, in addition to statewide policies and goals.
1b. How do senior leaders communicate with
and engage the entire workforce?
WSDOT’s organizational structure makes it easy for senior leaders to communicate the agency’s vision and values and also to solicit input from the general workforce and from custom-ers. Senior leaders at SCR have developed a relatively fl at organizational structure for the region, which facilitates open, collaborative communication between managers and employ-ees. SCR’s senior leadership team consists of the Regional Administrator (RA); four Assistant Regional Administra-tors (ARA) in the areas of project development, construction, maintenance and operations, and planning and program management; the local programs engineer; and the adminis-trative offi cer. Th e senior leadership team meets monthly to review the direction of the region, discuss trends in perfor-mance measurements and address future concerns.
Senior leaders use e-mail, intranet and meetings to address workforce concerns or to share information that aff ects the entire workforce. Senior leaders utilize SCR’s intranet page to share announcements about upcoming events, publish quarterly performance results, spotlight employee achieve-ments, and distribute policy and procedure reminders. Th e intranet is available to all SCR employees. Th e RA regularly drops in on department staff meetings to discuss current issues and solicit feedback from employees. In addition, the RA maintains a monthly electronic newsletter that is distrib-uted to all staff .
SCR senior leaders emphasize workforce safety and workforce engagement. SCR has developed a robust employee recogni-tion program that includes longevity recognition and fi nancial incentives for both usable ideas and remaining accident-free.
Each year WSDOT senior leaders share safety performance measures and goals with all WSDOT staff via a live webcast broadcast to locations statewide. Following the webcast, SCR employees receive region-specifi c directives from SCR senior leaders.
Th e Employee Suggestion Program provides cash incentives and recognition for individual ideas. State employees submit suggestions to save the state money, generate revenue, and/or improve services or processes within state government. Suggestions are evaluated by agencies with the authority to potentially implement the idea.
Section Two: Assessment Criteria
Category 1: Leadership
WSDOT Management Principles
Leadership Provide strategic vision and leadership for
state’s transportation needs
Deliverability &
accountability
Manage resources for the highest possible
return on value; be disciplined and accountable
Business
practices
Encourage progressive business management
practices; balance short-term cost savings by
long-term preservation and improvement needs
Safety Place highest priority on the health and safety
of the people who use and work on our trans-
portation facilities
Environmental
responsibility
Incorporate principles of environmental protec-
tion and stewardship into day-to-day operations
and development of state’s transportation facili-
ties
Excellence and
integrity
Promote a culture of workplace excellence
and diversity that encourages creativity and
personal responsibility, values teamwork and
respects contributions; adhere to the highest
standards of courtesy, integrity and ethical
conduct
Communications Stress the importance of sharing clear, concise
and timely information with our employees,
customers and stakeholders; strive for effec-
tiveness of all employees in meeting WSDOT’s
communications standards
Figure 2.1-1
2 | WSDOT South Central Region :: WSQA Lite Assessment December 2008 Section Two
1c. Describe how your organization addresses
its responsibilities to the public and ensures
ethical behavior.
WSDOT’s accountability challenge is to be a high performance organization credible and accountable to the Governor, Legisla-ture, taxpayers, and transportation delivery partners across the state. WSDOT is responsible for providing for public involve-ment in the transportation planning and development process. In addition to public outreach and communications eff orts, SCR employs many tools to ensure that the region is accountable and accessible to its many customers and stakeholders:
Ethics training: Employees must complete WSDOT’s ethics course when they start working for our agency. Each year, super-visors review ethics policies during each employee’s annual review. During election seasons, employees are reminded of specifi c election-related ethics guidelines via the intranet, agency-wide e-mails and staff meetings. All general service employees complete an ethics refresher course every three years, and all managers complete a course every two years.
Th e WSDOT Internal Audit Offi ce: WIAO off ers a variety of services including internal audits; audits of agreements and contracts with external service providers such as consultants, railroads and utilities; management requested investigations into inappropriate governmental activity such as fraud, waste and abuse of state resources; monitoring internet and e-mail abuse by employees; and a wide range of management advisory services including responding to employee questions regard-ing the Washington State Ethics Law.
WIAO is very proactive with the Attorney General’s Offi ce, as well, in maintaining a current and relevant interpretation of changing ethics rules and new emerging fact patterns. WIAO have also established an agency culture, led by the entire agency leadership team, that places a heavy focus on training and coordination of ethics issues.
Whistleblower Program: Th e State Auditor’s Whistleblower Program allows state employees to confi dentially report assertions of improper governmental action. Every year WSDOT reminds employees of the Whistleblower program via e-mail and intranet.
Tribal Liaison Offi ce: Th e Tribal Liaison Offi ce’s responsibili-ties include providing a central contact point for tribal access to department resources, supporting legislative actions that relate to tribal matters and communicating with tribes regard-ing the same, and supporting technical training programs for tribes and the public.
Th e Offi ce of Equal Opportunity (OEO): OEO manages and monitors WSDOT’s Equal Opportunity, Affi rmative Action, Contract Compliance, and Non-Discrimination programs. OEO has two basic units: Th e External Civil Rights Branch (ECRB) is responsible for fostering equal opportunity in procurement contracting and service delivery through the administration of various equal opportunity programs. Th e ECRB is guided by the Transportation Commission’s Policy Statement on Civil Rights, various other department policies, and federal and state civil rights laws and regulations. Th e Internal Civil Rights Branch (ICRB) is charged with ensuring that the agency’s facilities, programs, services, and workplace are free from sexual harassment and discrimination on the basis of race, creed, color, national origin, sex, sexual orienta-tion, military/veteran status, or the presence of any sensory, mental, or physical disability in accordance with agency policy, state and federal law.
Plain English: WSDOT’s ongoing eff ort to use “Plain English” is receiving national attention through its Gray Notebook, and reader-friendly environmental impact statements. Th e Reader-Friendly Document Toolkit provides guidelines for WSDOT employees as they develop Environmental Impact Statements (EIS). WSDOT employees also apply easy-to-read writing throughout the agency as part of its everyday way of doing business. Using Plain English is one of WSDOT’s means of staying accountable to citizens.
Government Management, Accountability & Performance (GMAP): GMAP serves as an internal and external tool for sharing current, up-to-date performance data GMAP forums are focused on the highest priorities that each agency is respon-sible for, or charged by the Governor. Safety, Transportation, Economic Development, and the Environment are impor-tant recurring issues that are openly addressed in the GMAP forums. When the forums identify issues where performance needs to be improved, GMAP serves as a forum for developing performance measures as well as reporting on the progress to reach level of service goals that are acceptable to the Gover-nor and the state. Th e WSDOT GMAP forums to date have reported the on-time and on-budget status of project delivery.
Washington State Offi ce of Financial Management’s Attainment of Transportation Policy Goals Report (Attainment Report): Under a new state law, the Washington State Offi ce of Financial Management (OFM) is responsible for setting objectives and establishing performance measures for each of the fi ve Trans-portation Policy Goals. OFM must report on the attainment of
Section Two: Assessment Criteria
Category 1: Leadership
Section Two WSDOT South Central Region :: WSQA Lite Assessment December 2008 | 3
the goals and objectives to the Governor and Legislature each biennium. In January, , OFM published a baseline report to get feedback from the Governor and Legislature on draft objectives and performance measures. OFM relies on WSDOT to produce a majority of this report and provide detailed performance data for state owned systems
WSDOT’s Performance Dashboard: Th is dashboard, off ers readers a snapshot glance at WSDOT’s progress against the fi ve statewide policy goals and WSDOT’s strategic plan. Some results are discussed in depth within each edition of the Gray Notebook, while others are in previous editions or will be
updated in coming editions based on established reporting cycles.
Because of WSDOT’s strong performance management process and the detail narrative and data analysis provided in the quarterly Gray Notebook, all of these various performance mandates can be met using the same, consistent and high quality data and analysis that is also used to manage WSDOT’s programs and make informed investment decisions. Th e SCR, along with all other regions and programs apply this perfor-mance data and best practice information to make day to day and longer term management decisions.
Section Two: Assessment Criteria
Category 1: Leadership / Category 2: Strategic Planning
Category 2: Strategic Planning
2a. What are your key strategic objectives?
WSDOT’s mission is to keep people and business moving by operating and improving the state’s transportation systems vital to our taxpayers and communities. In order to accom-plish this mission, WSDOT works towards achieving fi ve goals: safety, preservation, mobility (congestion relief), environmen-tal quality, and system stewardship. Th ese goals are consistent with the statewide transportation policy goals established by the Legislature for all transportation agencies. Not everything WSDOT does is represented in the strategic plan. Instead the plan is focused on what we believe to be the highest priorities for Washington’s citizens, now and into the future.
Performance management and reporting is a high priority at WSDOT and refl ected in the strategic plan. Th e plan identifi es a number of measures that will be used to track performance against the plan. Th ese strategies and related activities are aligned with those within our - budget request. Th ey are also consistent with performance measures used in the Priorities of Government program (POG), the Government Management and Accountability Program (GMAP), and the Offi ce of Financial Management’s Transportation Progress Report.
SafetyGoal: To provide for and improve the safety and security of transportation customers and the transportation system.Objective: Reduce fatal and serious injury collisions by % over the next ten years, moving toward Target Zero.Action plan:
Complete safety capital projects funded by the Nickel and • TPA.Work with partners, including FHWA, WTSC, WSP, and •
local agencies, to identify and address high priority safety needs.Implement low-cost, short term projects to address risks • contributing to collisions.
Performance measures: Number of fatal and serious injury collisions; rate of fatalities per million vehicle miles traveled.
Preservation Goal: To maintain, preserve, and extend the life and utility of prior investments in transportation systems and services.Objective: Maintain highway and bridge systems to optimize their short and long-term usefulness and minimize life-cycle costs.Action plan: Identify, track and reduce maintenance backlogs and MAP performance gapsPerformance measure: Percent of target met for state highway maintenance activitiesObjective: Preserve highway pavements at the lowest life-cycle cost.Action plan:
Reduce pavement preservation backlogs• Retrofi t partially failed concrete pavements• Prioritize and reconstruct critical sections of concrete • pavement that have failed.
Performance measure: Percent of state highway pavement in fair or better condition.
Mobility Goal: To improve the predictable movement of goods and people throughout the state.Objective: Identify and implement the most critical and cost eff ective new capacity investments in highways and ferries
4 | WSDOT South Central Region :: WSQA Lite Assessment December 2008 Section Two
to reduce bottlenecks and chokepoints and improve system throughput and reliability in conjunction with corridor management plans.Action plan:
Deliver mobility projects funded by the and • funding packages. Plan and request funding for future projects, including the • South Central Region’s work with the US Coalition on widening the highway.
Performance measure: Completed mobility projects funded by and funding packagesObjective: Freight Mobility: Improve the ability of truck and freight rail systems to serve industry needs, produce healthy regional economies, and build competitive advantage for Washington State products in the global marketplaceAction plan: Complete funded freight highway and rail system improvements.Performance measure: Delay on major freight corridors** (** Limited data availability)Objective: Traffi c Management: Optimize effi ciency of the existing system by improving and expanding traffi c manage-ment to increase the operating capacity of highways and reduce the causes and severity of congestion. Action plan: Replace the operation system for Snoqualmie Pass to provide better communications and travel times.Objective: Traveler Information Provide user-focused infor-mation so the public can make informed decisions about when, where and how to travel – “all roads, all modes, all the time.”Action plan:
Improve access to traffi c fl ow and mobility information as • identifi ed in the WSDOT intelligent transportation systems and travel information (--) plans.Develop and enhance tools available to the public and • freight carriers to assist in making travel decisions.
Performance Measure: Travel and traffi c website usage
EnvironmentGoal: Enhance Washington’s quality of life through transpor-tation investments that promote energy conservation, enhance healthy communities, and protect the environment.Objective: Species and Habitat Protection: Protect and restore fi sh and wildlife habitat.Action plan:
Remove fi sh passage barriers. • Improve habitat connectivity.•
Performance Measure: Number of barriers removed; miles of habitat improved.
StewardshipGoal: To continuously improve the quality, eff ectiveness and effi ciency of the transportation system.Objective: Deliver high quality capital projects on-time, within scope, and within budget.Action plan: Employ state-of-the-art project management across all regions and projects.Performance measure: Projects completed on-time and within budget.Objective: Advocate for transportation system investments to meet priority needs.Action plan: Work with partners to understand investment outcomes and explore potential new funding sourcesPerformance measure: Quantifi cation of funding needs.Objective: Ensure that WSDOT’s performance manage-ment and communication programs continue to demonstrate agency accountability, performance, and stewardship in order to maximize the return on and value of taxpayer dollars.Action plan Communicate and publish consistent, credible, and accurate performance information through the Gray Notebook and WSDOT’s website.Objective: Workforce: Enhance workforce recruitment, perfor-mance management, and leadership throughout WSDOT.Action Plan:
Implement new recruitment processes and techniques to • meet workforce level needs. Implement training programs to maintain work force excel-• lence and address staff turnover, retirement, and technology changes.
Performance measure: Training targets met.
2b. How do your strategic objectives address your
strategic challenges and strategic advantages?
Th e strategic planning process is directly tied to regional and state needs and priorities through a series of plans designed to meet the state’s fi ve main policy goals.
WSDOT develops the Washington State Highway System Plan (HSP) to address current and forecasted state highway needs based on the investment options identifi ed in the Washington Transportation Plan. Th ese long-range planning documents assess current and future transportation needs through a collaborative planning process with local governments, regional planning agencies, tribal organizations, environmen-tal groups and private transportation providers to ensure that the state’s transportation network functions safely, effi ciently, reliably and cost eff ectively.
Section Two: Assessment Criteria
Category 2: Strategic Planning
Section Two WSDOT South Central Region :: WSQA Lite Assessment December 2008 | 5
We seek direction from these sources by soliciting feedback at key points in our planning process. Th e HSP is updated every two years, and guides WSDOT in the development and priori-tization of the Capital Improvement and Preservation Program (CIPP). Each future update of the HSP, builds upon the previ-ous plan, refi ning identifi ed needs, strategies, and solutions; and will expand to cover emergent issues and additional locations. Each update also includes a “snapshot” of the most recent fi ndings of WSDOT’s continuous system-wide analysis, performance measurement and monitoring programs.
2c. How do you deploy action plans through
out the organization to achieve your key
strategic objectives?
In order to meet the goals of the strategic plan, action plans are integrated into WSDOT and SCR operations. Th e action plans are involved in the schedule, scope and budget reviews of each capital project and a key component of monthly activity schedule meetings.
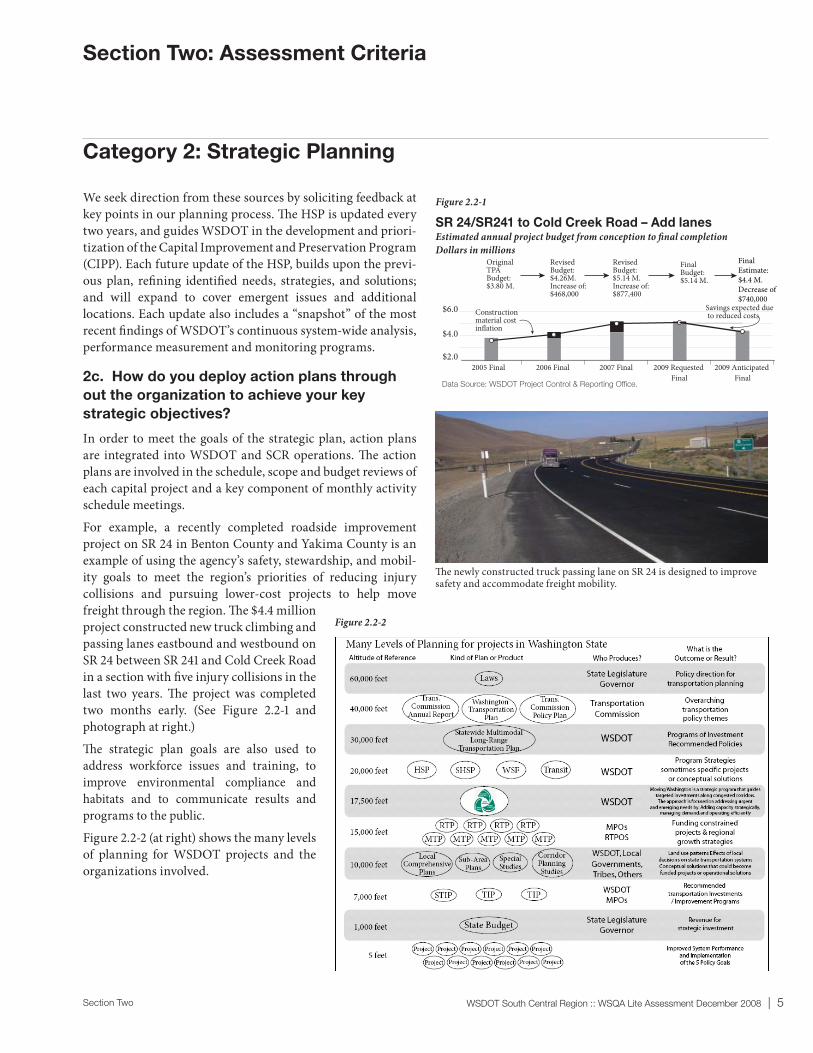
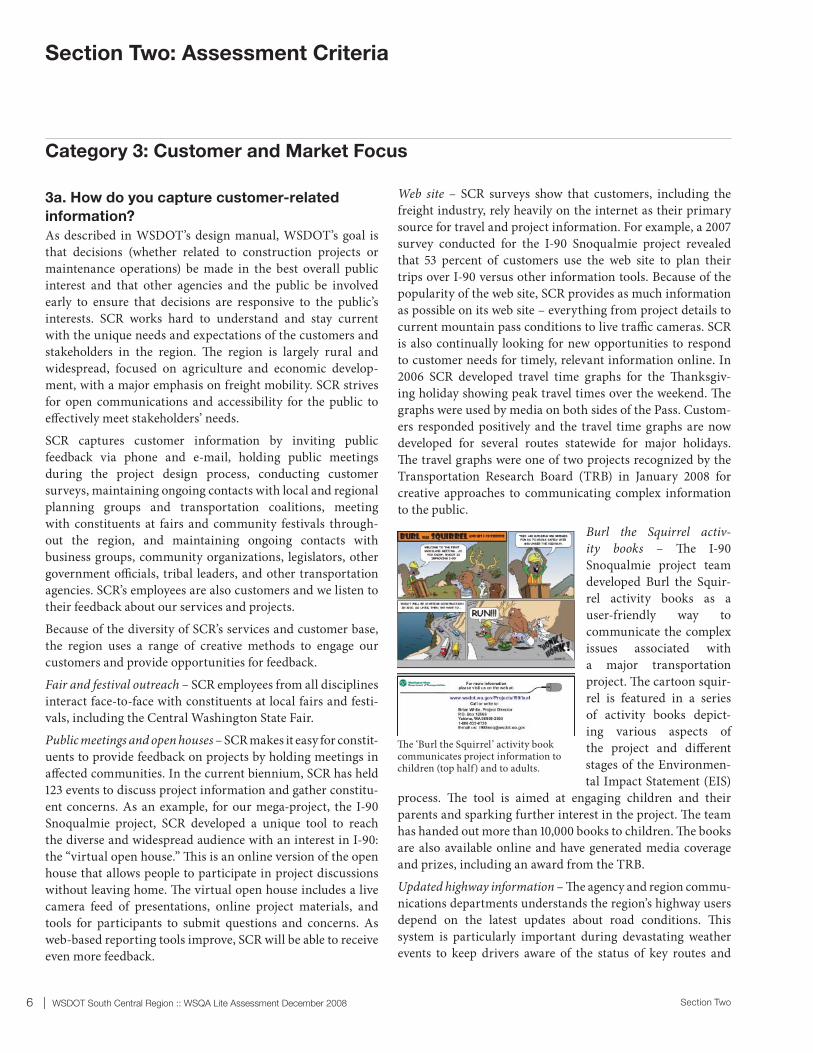
For example, a recently completed roadside improvement project on SR in Benton County and Yakima County is an example of using the agency’s safety, stewardship, and mobil-ity goals to meet the region’s priorities of reducing injury collisions and pursuing lower-cost projects to help move freight through the region. Th e $. million project constructed new truck climbing and passing lanes eastbound and westbound on SR between SR and Cold Creek Road in a section with fi ve injury collisions in the last two years. Th e project was completed two months early. (See Figure .- and photograph at right.)
Th e strategic plan goals are also used to address workforce issues and training, to improve environmental compliance and habitats and to communicate results and programs to the public.
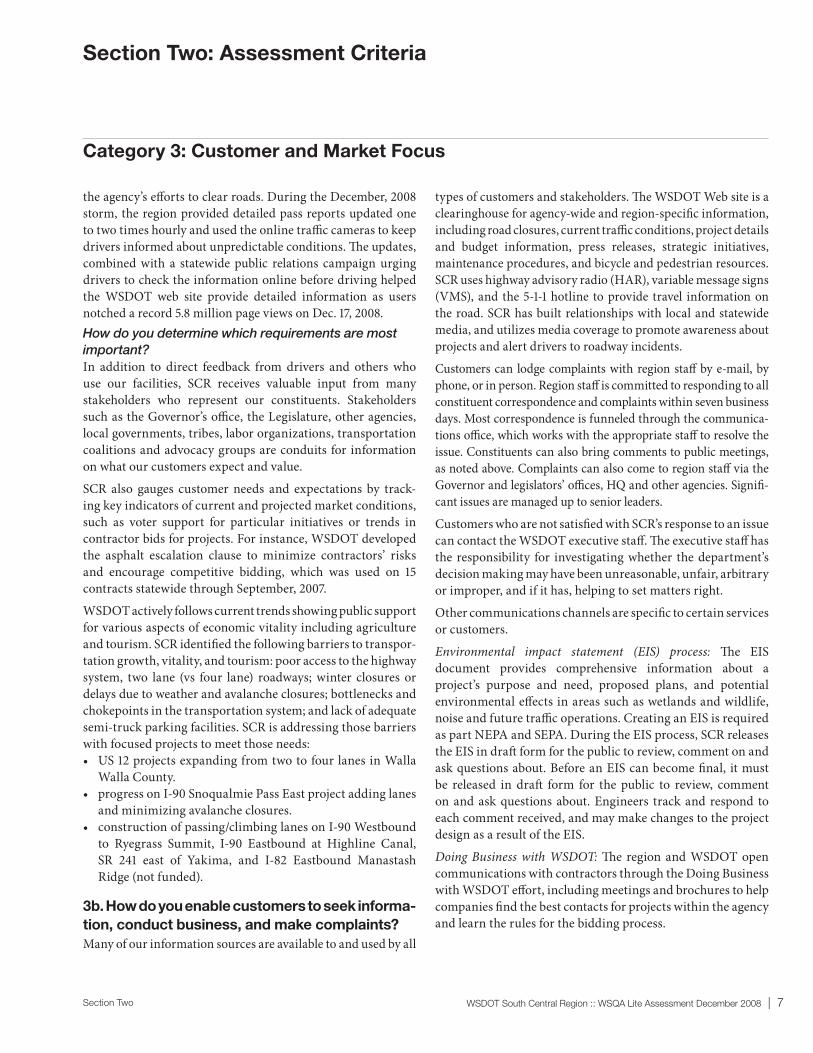
Figure .- (at right) shows the many levels of planning for WSDOT projects and the organizations involved.
Th e newly constructed truck passing lane on SR 24 is designed to improve safety and accommodate freight mobility.
SR 24/SR 241 to Cold Creek Road - Add LanesEstimated annual project budget from conception to final completionDollars in millions
$2.0
$4.0
$6.0 Construction material cost inflation
Savings expected due to reduced costs
Data Source: WSDOT Project Control & Reporting Office.
2005 Final 2006 Final 2007 Final 2009 Requested Final
2009 Anticipated Final
Original TPA Budget:$3.80 M.
Revised Budget:$4.26M.Increase of:$468,000
Revised Budget:$5.14 M.Increase of: $877,400
Final Budget:$5.14 M.
Final Estimate:$4.4 M.Decrease of $740,000
Section Two: Assessment Criteria
Category 2: Strategic Planning
Figure 2.2-2
Figure 2.2-1
SR 24/SR241 to Cold Creek Road – Add lanesEstimated annual project budget from conception to fi nal completionDollars in millions
6 | WSDOT South Central Region :: WSQA Lite Assessment December 2008 Section Two
3a. How do you capture customer-related
information?
As described in WSDOT’s design manual, WSDOT’s goal is that decisions (whether related to construction projects or maintenance operations) be made in the best overall public interest and that other agencies and the public be involved early to ensure that decisions are responsive to the public’s interests. SCR works hard to understand and stay current with the unique needs and expectations of the customers and stakeholders in the region. Th e region is largely rural and widespread, focused on agriculture and economic develop-ment, with a major emphasis on freight mobility. SCR strives for open communications and accessibility for the public to eff ectively meet stakeholders’ needs.
SCR captures customer information by inviting public feedback via phone and e-mail, holding public meetings during the project design process, conducting customer surveys, maintaining ongoing contacts with local and regional planning groups and transportation coalitions, meeting with constituents at fairs and community festivals through-out the region, and maintaining ongoing contacts with business groups, community organizations, legislators, other government offi cials, tribal leaders, and other transportation agencies. SCR’s employees are also customers and we listen to their feedback about our services and projects.
Because of the diversity of SCR’s services and customer base, the region uses a range of creative methods to engage our customers and provide opportunities for feedback.
Fair and festival outreach – SCR employees from all disciplines interact face-to-face with constituents at local fairs and festi-vals, including the Central Washington State Fair.
Public meetings and open houses – SCR makes it easy for constit-uents to provide feedback on projects by holding meetings in aff ected communities. In the current biennium, SCR has held events to discuss project information and gather constitu-ent concerns. As an example, for our mega-project, the I- Snoqualmie project, SCR developed a unique tool to reach the diverse and widespread audience with an interest in I-: the “virtual open house.” Th is is an online version of the open house that allows people to participate in project discussions without leaving home. Th e virtual open house includes a live camera feed of presentations, online project materials, and tools for participants to submit questions and concerns. As web-based reporting tools improve, SCR will be able to receive even more feedback.
Web site – SCR surveys show that customers, including the freight industry, rely heavily on the internet as their primary source for travel and project information. For example, a survey conducted for the I- Snoqualmie project revealed that percent of customers use the web site to plan their trips over I- versus other information tools. Because of the popularity of the web site, SCR provides as much information as possible on its web site – everything from project details to current mountain pass conditions to live traffi c cameras. SCR is also continually looking for new opportunities to respond to customer needs for timely, relevant information online. In SCR developed travel time graphs for the Th anksgiv-ing holiday showing peak travel times over the weekend. Th e graphs were used by media on both sides of the Pass. Custom-ers responded positively and the travel time graphs are now developed for several routes statewide for major holidays. Th e travel graphs were one of two projects recognized by the Transportation Research Board (TRB) in January for creative approaches to communicating complex information to the public.
Burl the Squirrel activ-ity books – Th e I- Snoqualmie project team developed Burl the Squir-rel activity books as a user-friendly way to communicate the complex issues associated with a major transportation project. Th e cartoon squir-rel is featured in a series of activity books depict-ing various aspects of the project and diff erent stages of the Environmen-tal Impact Statement (EIS)
process. Th e tool is aimed at engaging children and their parents and sparking further interest in the project. Th e team has handed out more than , books to children. Th e books are also available online and have generated media coverage and prizes, including an award from the TRB.
Updated highway information – Th e agency and region commu-nications departments understands the region’s highway users depend on the latest updates about road conditions. Th is system is particularly important during devastating weather events to keep drivers aware of the status of key routes and
Section Two: Assessment Criteria
Category 3: Customer and Market Focus
Th e ‘Burl the Squirrel’ activity book communicates project information to children (top half) and to adults.
Section Two WSDOT South Central Region :: WSQA Lite Assessment December 2008 | 7
the agency’s eff orts to clear roads. During the December, storm, the region provided detailed pass reports updated one to two times hourly and used the online traffi c cameras to keep drivers informed about unpredictable conditions. Th e updates, combined with a statewide public relations campaign urging drivers to check the information online before driving helped the WSDOT web site provide detailed information as users notched a record . million page views on Dec. , .How do you determine which requirements are most important? In addition to direct feedback from drivers and others who use our facilities, SCR receives valuable input from many stakeholders who represent our constituents. Stakeholders such as the Governor’s offi ce, the Legislature, other agencies, local governments, tribes, labor organizations, transportation coalitions and advocacy groups are conduits for information on what our customers expect and value.
SCR also gauges customer needs and expectations by track-ing key indicators of current and projected market conditions, such as voter support for particular initiatives or trends in contractor bids for projects. For instance, WSDOT developed the asphalt escalation clause to minimize contractors’ risks and encourage competitive bidding, which was used on contracts statewide through September, .
WSDOT actively follows current trends showing public support for various aspects of economic vitality including agriculture and tourism. SCR identifi ed the following barriers to transpor-tation growth, vitality, and tourism: poor access to the highway system, two lane (vs four lane) roadways; winter closures or delays due to weather and avalanche closures; bottlenecks and chokepoints in the transportation system; and lack of adequate semi-truck parking facilities. SCR is addressing those barriers with focused projects to meet those needs:
US projects expanding from two to four lanes in Walla • Walla County.progress on I- Snoqualmie Pass East project adding lanes • and minimizing avalanche closures.construction of passing/climbing lanes on I- Westbound • to Ryegrass Summit, I- Eastbound at Highline Canal, SR east of Yakima, and I- Eastbound Manastash Ridge (not funded).
3b. How do you enable customers to seek informa-
tion, conduct business, and make complaints?
Many of our information sources are available to and used by all
types of customers and stakeholders. Th e WSDOT Web site is a clearinghouse for agency-wide and region-specifi c information, including road closures, current traffi c conditions, project details and budget information, press releases, strategic initiatives, maintenance procedures, and bicycle and pedestrian resources. SCR uses highway advisory radio (HAR), variable message signs (VMS), and the -- hotline to provide travel information on the road. SCR has built relationships with local and statewide media, and utilizes media coverage to promote awareness about projects and alert drivers to roadway incidents.
Customers can lodge complaints with region staff by e-mail, by phone, or in person. Region staff is committed to responding to all constituent correspondence and complaints within seven business days. Most correspondence is funneled through the communica-tions offi ce, which works with the appropriate staff to resolve the issue. Constituents can also bring comments to public meetings, as noted above. Complaints can also come to region staff via the Governor and legislators’ offi ces, HQ and other agencies. Signifi -cant issues are managed up to senior leaders.
Customers who are not satisfi ed with SCR’s response to an issue can contact the WSDOT executive staff . Th e executive staff has the responsibility for investigating whether the department’s decision making may have been unreasonable, unfair, arbitrary or improper, and if it has, helping to set matters right.
Other communications channels are specifi c to certain services or customers.
Environmental impact statement (EIS) process: Th e EIS document provides comprehensive information about a project’s purpose and need, proposed plans, and potential environmental eff ects in areas such as wetlands and wildlife, noise and future traffi c operations. Creating an EIS is required as part NEPA and SEPA. During the EIS process, SCR releases the EIS in draft form for the public to review, comment on and ask questions about. Before an EIS can become fi nal, it must be released in draft form for the public to review, comment on and ask questions about. Engineers track and respond to each comment received, and may make changes to the project design as a result of the EIS.
Doing Business with WSDOT: Th e region and WSDOT open communications with contractors through the Doing Business with WSDOT eff ort, including meetings and brochures to help companies fi nd the best contacts for projects within the agency and learn the rules for the bidding process.
Section Two: Assessment Criteria
Category 3: Customer and Market Focus
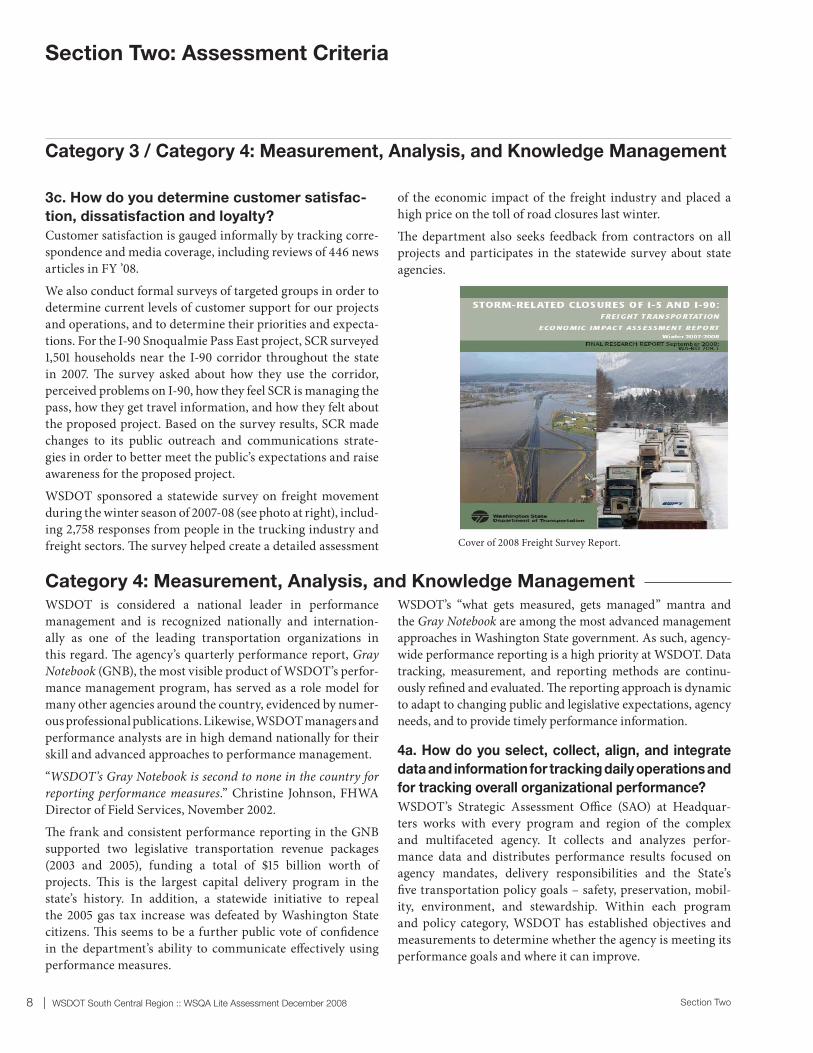
8 | WSDOT South Central Region :: WSQA Lite Assessment December 2008 Section Two
3c. How do you determine customer satisfac-
tion, dissatisfaction and loyalty?
Customer satisfaction is gauged informally by tracking corre-spondence and media coverage, including reviews of news articles in FY ’.
We also conduct formal surveys of targeted groups in order to determine current levels of customer support for our projects and operations, and to determine their priorities and expecta-tions. For the I- Snoqualmie Pass East project, SCR surveyed , households near the I- corridor throughout the state in . Th e survey asked about how they use the corridor, perceived problems on I-, how they feel SCR is managing the pass, how they get travel information, and how they felt about the proposed project. Based on the survey results, SCR made changes to its public outreach and communications strate-gies in order to better meet the public’s expectations and raise awareness for the proposed project.
WSDOT sponsored a statewide survey on freight movement during the winter season of - (see photo at right), includ-ing , responses from people in the trucking industry and freight sectors. Th e survey helped create a detailed assessment
of the economic impact of the freight industry and placed a high price on the toll of road closures last winter.
Th e department also seeks feedback from contractors on all projects and participates in the statewide survey about state agencies.
Section Two: Assessment Criteria
Category 3 / Category 4: Measurement, Analysis, and Knowledge Management
Cover of 2008 Freight Survey Report.
WSDOT is considered a national leader in performance management and is recognized nationally and internation-ally as one of the leading transportation organizations in this regard. Th e agency’s quarterly performance report, Gray Notebook (GNB), the most visible product of WSDOT’s perfor-mance management program, has served as a role model for many other agencies around the country, evidenced by numer-ous professional publications. Likewise, WSDOT managers and performance analysts are in high demand nationally for their skill and advanced approaches to performance management.
“WSDOT’s Gray Notebook is second to none in the country for reporting performance measures.” Christine Johnson, FHWA Director of Field Services, November .
Th e frank and consistent performance reporting in the GNB supported two legislative transportation revenue packages ( and ), funding a total of $ billion worth of projects. Th is is the largest capital delivery program in the state’s history. In addition, a statewide initiative to repeal the gas tax increase was defeated by Washington State citizens. Th is seems to be a further public vote of confi dence in the department’s ability to communicate eff ectively using performance measures.
WSDOT’s “what gets measured, gets managed” mantra and the Gray Notebook are among the most advanced management approaches in Washington State government. As such, agency-wide performance reporting is a high priority at WSDOT. Data tracking, measurement, and reporting methods are continu-ously refi ned and evaluated. Th e reporting approach is dynamic to adapt to changing public and legislative expectations, agency needs, and to provide timely performance information.
4a. How do you select, collect, align, and integrate
data and information for tracking daily operations and
for tracking overall organizational performance?
WSDOT’s Strategic Assessment Offi ce (SAO) at Headquar-ters works with every program and region of the complex and multifaceted agency. It collects and analyzes perfor-mance data and distributes performance results focused on agency mandates, delivery responsibilities and the State’s fi ve transportation policy goals – safety, preservation, mobil-ity, environment, and stewardship. Within each program and policy category, WSDOT has established objectives and measurements to determine whether the agency is meeting its performance goals and where it can improve.
Category 4: Measurement, Analysis, and Knowledge Management
Section Two WSDOT South Central Region :: WSQA Lite Assessment December 2008 | 9
“…Th e Gray Notebook is one of the nation’s leading examples of eff ective state-wide performance monitoring.” FHWA’s “Traffi c Congestion and Reliability” ()
Using the example of preservation, annual assessments of pavement and bridge conditions are used by agency management and policy-makers to understand and address preservation needs for tens of billions of dollars worth of highway and ferry assets. When national incidents—such as the Minneapolis bridge collapse—occur, SAO ensures that information and analysis of Washington’s facilities are readily available. Key preservation measures include:
State Highway Pavement: Percent of state highway pavement • in fair or better condition.Bridges: Percent of state bridges in fair or better condition.• State Highway Maintenance: Percent of targets met for state • highway maintenance.
In support of this eff ort, each region, including SCR, monitors and tracks the condition of every bridge, drainage feature, unstable slopes, and mile of pavement in its jurisdiction.
4b. How do you review organizational performance
and capabilities?
Th e Gray Notebook is the foundation of agency performance assessment and reporting, as well as public and legislative communication. Th e development of the GNB has infl uenced many related accountability and performance products. It also supports multiple performance measurement and reporting initiatives and requirements.
Th e GNB provides quarterly, in-depth reports on agency and transportation system performance. Th e GNB assures that WSDOT is transparent and accountable to Washington State citizens, the Governor, legislators and interest groups. It is also an important internal management and integration tool. Th e rigor and quality control involved in developing each performance report requires a hands on approach by staff and managers at all levels and across all programs.
As a state agency, WSDOT also tracks and reports performance through the Governor’s quarterly Government Management and Accountability Program (GMAP). WSDOT’s performance is also measured through the Transportation Progress Report, produced biennially by OFM.
South Central Region supports statewide performance measurement, and also tracks and analyzes other measures to assess the region’s performance.
Th ese include:the Maintenance Accountability Process (MAP)• project delivery (projects to advertisement)• employee safety• estimating accuracy• environmental compliance• communications/public outreach.•
4c. How do you make needed data and informa-
tion available? How do you make them accessible
to your workforce, suppliers, partners, collabo-
rators, and customers, as appropriate?
WSDOT created and uses a style of reporting called ‘Perfor-mance Journalism,’ which combines eff ective, detailed narrative writing with visual graphs, tables and measurements to provide a clear and accurate assessment to the widest possi-ble audience. Th e analysis is compiled into the GNB, described above, which is published quarterly.
Th e GNB is distributed in hard copy and electronically to a broad audience of , to , subscribers. Subscribers include the media, all state legislators, the Governor, the Trans-portation Commission, interest groups, cities and counties, national academic and research organizations, national partners, American Association of State Highway and Trans-portation Offi cials members, and international colleagues. In addition, each edition is archived online and an electronic subject index allows access to every performance measure ever published.
WSDOT also makes extensive use of its website for performance reporting (http://wsdot.wa.gov/Accountability/default.htm).
4d. How do you manage organizational knowl-
edge to accomplish the collection and transfer of
workforce knowledge?
Th e hands on approach by staff and managers at all levels in the performance reporting process ensures strong cross-orga-nizational knowledge exchange on all performance reporting programs and issues. In addition to providing web-based access to all its own performance reporting, WSDOT created a web-based Performance Management Library that provides agency colleagues access to other state DOT’s performance reports and relevant and updated national and international reports and research on performance topics.
Section Two: Assessment Criteria
Category 4: Measurement, Analysis, and Knowledge Management
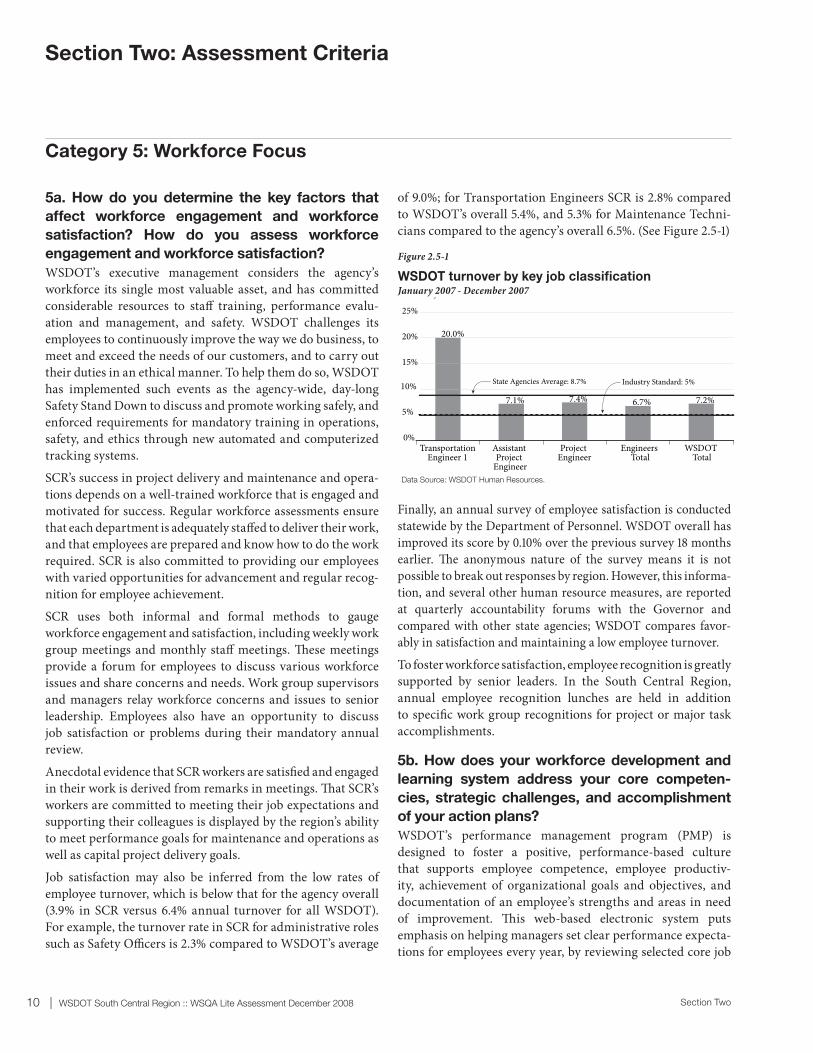
10 | WSDOT South Central Region :: WSQA Lite Assessment December 2008 Section Two
5a. How do you determine the key factors that
affect workforce engagement and workforce
satisfaction? How do you assess workforce
engagement and workforce satisfaction?
WSDOT’s executive management considers the agency’s workforce its single most valuable asset, and has committed considerable resources to staff training, performance evalu-ation and management, and safety. WSDOT challenges its employees to continuously improve the way we do business, to meet and exceed the needs of our customers, and to carry out their duties in an ethical manner. To help them do so, WSDOT has implemented such events as the agency-wide, day-long Safety Stand Down to discuss and promote working safely, and enforced requirements for mandatory training in operations, safety, and ethics through new automated and computerized tracking systems.
SCR’s success in project delivery and maintenance and opera-tions depends on a well-trained workforce that is engaged and motivated for success. Regular workforce assessments ensure that each department is adequately staff ed to deliver their work, and that employees are prepared and know how to do the work required. SCR is also committed to providing our employees with varied opportunities for advancement and regular recog-nition for employee achievement.
SCR uses both informal and formal methods to gauge workforce engagement and satisfaction, including weekly work group meetings and monthly staff meetings. Th ese meetings provide a forum for employees to discuss various workforce issues and share concerns and needs. Work group supervisors and managers relay workforce concerns and issues to senior leadership. Employees also have an opportunity to discuss job satisfaction or problems during their mandatory annual review.
Anecdotal evidence that SCR workers are satisfi ed and engaged in their work is derived from remarks in meetings. Th at SCR’s workers are committed to meeting their job expectations and supporting their colleagues is displayed by the region’s ability to meet performance goals for maintenance and operations as well as capital project delivery goals.
Job satisfaction may also be inferred from the low rates of employee turnover, which is below that for the agency overall (.% in SCR versus .% annual turnover for all WSDOT). For example, the turnover rate in SCR for administrative roles such as Safety Offi cers is .% compared to WSDOT’s average
of .%; for Transportation Engineers SCR is .% compared to WSDOT’s overall .%, and .% for Maintenance Techni-cians compared to the agency’s overall .%. (See Figure .-)
Finally, an annual survey of employee satisfaction is conducted statewide by the Department of Personnel. WSDOT overall has improved its score by .% over the previous survey months earlier. Th e anonymous nature of the survey means it is not possible to break out responses by region. However, this informa-tion, and several other human resource measures, are reported at quarterly accountability forums with the Governor and compared with other state agencies; WSDOT compares favor-ably in satisfaction and maintaining a low employee turnover.
To foster workforce satisfaction, employee recognition is greatly supported by senior leaders. In the South Central Region, annual employee recognition lunches are held in addition to specifi c work group recognitions for project or major task accomplishments.
5b. How does your workforce development and
learning system address your core competen-
cies, strategic challenges, and accomplishment
of your action plans?
WSDOT’s performance management program (PMP) is designed to foster a positive, performance-based culture that supports employee competence, employee productiv-ity, achievement of organizational goals and objectives, and documentation of an employee’s strengths and areas in need of improvement. Th is web-based electronic system puts emphasis on helping managers set clear performance expecta-tions for employees every year, by reviewing selected core job
WSDOT Turnover by key job classificationJanuary 2007 - December 2007
7.1% 7.4% 7.2%6.7%
20.0%
0%
5%
10%
15%
20%
25%
TransportationEngineer 1
Assistant Project
Engineer
Project Engineer
Engineers Total
WSDOT Total
State Agencies Average: 8.7% Industry Standard: 5%
Data Source: WSDOT Human Resources.
Section Two: Assessment Criteria
Category 5: Workforce Focus
Figure 2.5-1
WSDOT turnover by key job classifi cationJanuary 2007 - December 2007
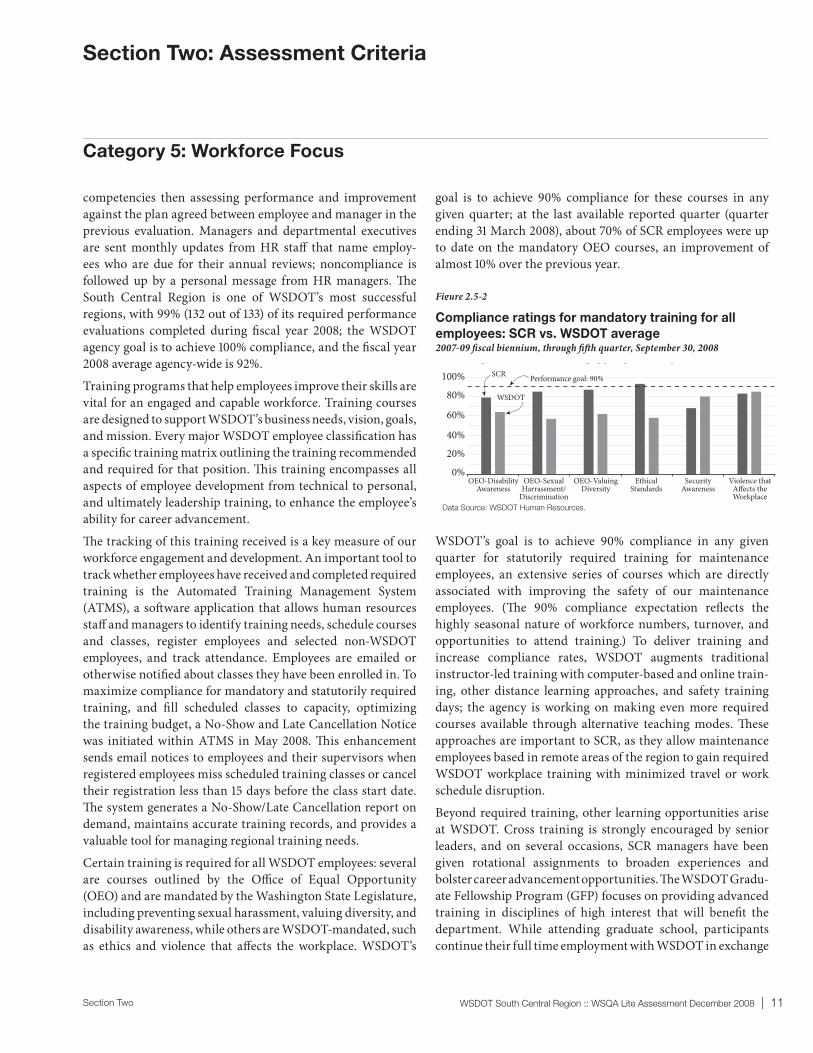
Section Two WSDOT South Central Region :: WSQA Lite Assessment December 2008 | 11
competencies then assessing performance and improvement against the plan agreed between employee and manager in the previous evaluation. Managers and departmental executives are sent monthly updates from HR staff that name employ-ees who are due for their annual reviews; noncompliance is followed up by a personal message from HR managers. Th e South Central Region is one of WSDOT’s most successful regions, with % ( out of ) of its required performance evaluations completed during fi scal year ; the WSDOT agency goal is to achieve % compliance, and the fi scal year average agency-wide is %.
Training programs that help employees improve their skills are vital for an engaged and capable workforce. Training courses are designed to support WSDOT’s business needs, vision, goals, and mission. Every major WSDOT employee classifi cation has a specifi c training matrix outlining the training recommended and required for that position. Th is training encompasses all aspects of employee development from technical to personal, and ultimately leadership training, to enhance the employee’s ability for career advancement.
Th e tracking of this training received is a key measure of our workforce engagement and development. An important tool to track whether employees have received and completed required training is the Automated Training Management System (ATMS), a soft ware application that allows human resources staff and managers to identify training needs, schedule courses and classes, register employees and selected non-WSDOT employees, and track attendance. Employees are emailed or otherwise notifi ed about classes they have been enrolled in. To maximize compliance for mandatory and statutorily required training, and fi ll scheduled classes to capacity, optimizing the training budget, a No-Show and Late Cancellation Notice was initiated within ATMS in May . Th is enhancement sends email notices to employees and their supervisors when registered employees miss scheduled training classes or cancel their registration less than days before the class start date. Th e system generates a No-Show/Late Cancellation report on demand, maintains accurate training records, and provides a valuable tool for managing regional training needs.
Certain training is required for all WSDOT employees: several are courses outlined by the Offi ce of Equal Opportunity (OEO) and are mandated by the Washington State Legislature, including preventing sexual harassment, valuing diversity, and disability awareness, while others are WSDOT-mandated, such as ethics and violence that aff ects the workplace. WSDOT’s
goal is to achieve % compliance for these courses in any given quarter; at the last available reported quarter (quarter ending March ), about % of SCR employees were up to date on the mandatory OEO courses, an improvement of almost % over the previous year.
WSDOT’s goal is to achieve % compliance in any given quarter for statutorily required training for maintenance employees, an extensive series of courses which are directly associated with improving the safety of our maintenance employees. (Th e % compliance expectation refl ects the highly seasonal nature of workforce numbers, turnover, and opportunities to attend training.) To deliver training and increase compliance rates, WSDOT augments traditional instructor-led training with computer-based and online train-ing, other distance learning approaches, and safety training days; the agency is working on making even more required courses available through alternative teaching modes. Th ese approaches are important to SCR, as they allow maintenance employees based in remote areas of the region to gain required WSDOT workplace training with minimized travel or work schedule disruption.
Beyond required training, other learning opportunities arise at WSDOT. Cross training is strongly encouraged by senior leaders, and on several occasions, SCR managers have been given rotational assignments to broaden experiences and bolster career advancement opportunities. Th e WSDOT Gradu-ate Fellowship Program (GFP) focuses on providing advanced training in disciplines of high interest that will benefi t the department. While attending graduate school, participants continue their full time employment with WSDOT in exchange
Compliance ratings for mandatory training for all employees
South Central Region vs. WSDOT average2007-09 fiscal biennium, through fifth quarter, September 30, 2008
Data Source: WSDOT Human Resources.
100%
80%
60%
40%
20%
0%OEO-Disability
AwarenessOEO-Sexual
Harrassment/Discrimination
OEO-ValuingDiversity
EthicalStandards
SecurityAwareness
Violence thatAffects theWorkplace
Performance goal: 90%SCR
WSDOT
Section Two: Assessment Criteria
Category 5: Workforce Focus
Figure 2.5-2
Compliance ratings for mandatory training for all
employees: SCR vs. WSDOT average2007-09 fi scal biennium, through fi ft h quarter, September 30, 2008

12 | WSDOT South Central Region :: WSQA Lite Assessment December 2008 Section Two
for funding for tuition and books. Participants are required to continue employment with the department for a three year period upon completion of the program, which includes a two-year utilization assignment to a position that makes direct use of the enhanced capabilities and knowledge. Th e Project Management Academy program assures that project manag-ers have the necessary skills and knowledge of best practice in project management. Staff that complete this training will be certifi ed, a required step in the career ladder to managing the agency’s largest projects. WSDOT also prepares for future succession, within both project delivery and maintenance and operations, through programs such as the Senior Leadership Succession Plan, which identifi es and prepares seniors staff members to assume positions of signifi cant responsibility within WSDOT during the next decade, and the Leadership Enhancement and Development Program, which fi lls a gap between WSDOT’s core leadership and management training and the Senior Leadership Succession Plan.
5c. How do you assess your workforce capability
and capacity needs, including skills, competen-
cies, and staffi ng levels?
Senior leaders meet monthly to assess workforce needs and progress toward project milestones, reviewing projects which will be put out for bid in coming months to ensure adequate staff will be available to manage and implement each phase. Th ese meetings also ensure that maintenance and operational needs are covered in all seasons (such as winter plowing or summer vegetation management). SCR considers customer and stakeholder expectations and needs as part of assessing workforce capability and capacity needs. For example, SCR hired additional public outreach staff to address public aware-ness expectations that accompanied an increased number of projects in the area – and the concurrent need for public awareness. Th ese skilled communicators assist project and maintenance teams with publicizing SCR’s work and respond-ing to customer feedback.
Section Two: Assessment Criteria
Category 5: Workforce Focus / Category 6: Process Management
Category 6: Process Management
6a. What are your organization’s core compe-
tencies and how do they relate to your mission,
competitive environment, and action plans?
WSDOT’s core competencies are integrally connected to the agency’s fi ve policy goals pertaining to safety, preservation and maintenance of assets, mobility of people and freight, environ-mental responsibility, and stewardship. Th ese competencies are: a) to ensure the highest regard is paid to the safety of the traveling public and of the agency’s employees, as well as to the activities and assets that support this goal; b) to maintain and operate the state’s roads, bridges, and ferries effi ciently and cost-eff ectively; c) to deliver the legislatively approved highway construction program; d) to limit the impact WSDOT’s work has on the natural environment; and e) to exercise good stewardship of fi scal resources, and to work as a “good neighbor” with federal and other state agencies, tribal governments and local jurisdictions, transportation advocacy groups and the general public.
Th ese competencies are elaborated on through the agency’s strategic plan. Th e Strategic Implementation Plan (SIP), devel-oped to support and guide the actions proposed in the agency’s plan, is a new () framework to help the agency’s leadership
hold management accountable for the timely achievement of the benchmarks or milestones the plan sets out. In addition to simple milestones, WSDOT applies an array of perfor-mance measures to its activities; these measures are constantly reviewed, analyzed, and published for the information of policy-makers and the general public, and also serve as an internal review mechanism for the agency.
Th e South Central Region is responsible for implement-ing those activities that fall within its boundaries; SCR also supports WSDOT’s strategic goals through innovations and best practices that may be applied across the agency.
6b. What are your organization’s key work
processes? How do these relate to your core
competencies?
WSDOT’s key work processes, measures, and outcomes vary greatly depending on what aspect of the agency’s work is being examined; hundreds of performance measures are reported on in the quarterly Gray Notebook performance report each year. To discuss all those conducted in SCR alone would take many pages. Examples will be off ered for each of the fi ve core compe-tencies outlined above.
a) Ensuring the safety of workforce. In addition to the train-ing requirements discussed in Category , WSDOT promotes
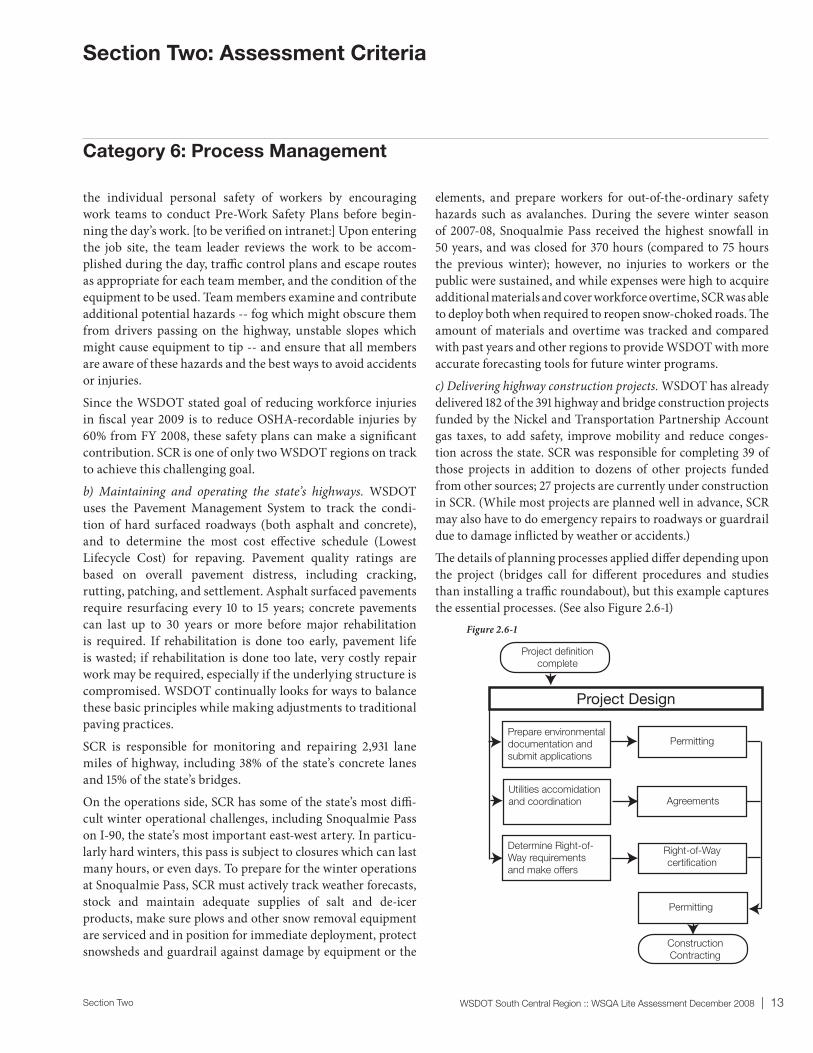
Section Two WSDOT South Central Region :: WSQA Lite Assessment December 2008 | 13
the individual personal safety of workers by encouraging work teams to conduct Pre-Work Safety Plans before begin-ning the day’s work. [to be verifi ed on intranet:] Upon entering the job site, the team leader reviews the work to be accom-plished during the day, traffi c control plans and escape routes as appropriate for each team member, and the condition of the equipment to be used. Team members examine and contribute additional potential hazards -- fog which might obscure them from drivers passing on the highway, unstable slopes which might cause equipment to tip -- and ensure that all members are aware of these hazards and the best ways to avoid accidents or injuries.
Since the WSDOT stated goal of reducing workforce injuries in fi scal year is to reduce OSHA-recordable injuries by % from FY , these safety plans can make a signifi cant contribution. SCR is one of only two WSDOT regions on track to achieve this challenging goal.
b) Maintaining and operating the state’s highways. WSDOT uses the Pavement Management System to track the condi-tion of hard surfaced roadways (both asphalt and concrete), and to determine the most cost eff ective schedule (Lowest Lifecycle Cost) for repaving. Pavement quality ratings are based on overall pavement distress, including cracking, rutting, patching, and settlement. Asphalt surfaced pavements require resurfacing every to years; concrete pavements can last up to years or more before major rehabilitation is required. If rehabilitation is done too early, pavement life is wasted; if rehabilitation is done too late, very costly repair work may be required, especially if the underlying structure is compromised. WSDOT continually looks for ways to balance these basic principles while making adjustments to traditional paving practices.
SCR is responsible for monitoring and repairing , lane miles of highway, including % of the state’s concrete lanes and % of the state’s bridges.
On the operations side, SCR has some of the state’s most diffi -cult winter operational challenges, including Snoqualmie Pass on I-, the state’s most important east-west artery. In particu-larly hard winters, this pass is subject to closures which can last many hours, or even days. To prepare for the winter operations at Snoqualmie Pass, SCR must actively track weather forecasts, stock and maintain adequate supplies of salt and de-icer products, make sure plows and other snow removal equipment are serviced and in position for immediate deployment, protect snowsheds and guardrail against damage by equipment or the
elements, and prepare workers for out-of-the-ordinary safety hazards such as avalanches. During the severe winter season of -, Snoqualmie Pass received the highest snowfall in years, and was closed for hours (compared to hours the previous winter); however, no injuries to workers or the public were sustained, and while expenses were high to acquire additional materials and cover workforce overtime, SCR was able to deploy both when required to reopen snow-choked roads. Th e amount of materials and overtime was tracked and compared with past years and other regions to provide WSDOT with more accurate forecasting tools for future winter programs.
c) Delivering highway construction projects. WSDOT has already delivered of the highway and bridge construction projects funded by the Nickel and Transportation Partnership Account gas taxes, to add safety, improve mobility and reduce conges-tion across the state. SCR was responsible for completing of those projects in addition to dozens of other projects funded from other sources; projects are currently under construction in SCR. (While most projects are planned well in advance, SCR may also have to do emergency repairs to roadways or guardrail due to damage infl icted by weather or accidents.)
Th e details of planning processes applied diff er depending upon the project (bridges call for diff erent procedures and studies than installing a traffi c roundabout), but this example captures the essential processes. (See also Figure .-)
Section Two: Assessment Criteria
Category 6: Process Management
Project Design
Prepare environmental
documentation and
submit applications
Utilities accomidation
and coordination
Determine Right-of-
Way requirements
and make offers
Permitting
Agreements
Right-of-Way
certification
Permitting
Project definition
complete
Construction
Contracting
Figure 2.6-1

14 | WSDOT South Central Region :: WSQA Lite Assessment December 2008 Section Two
First, a defi ciency or problem with a section of roadway is identifi ed: for instance, a series of sharp curves with blind corners results in frequent run-off -the-road accidents and the occasional collision with vehicles entering the road. SCR surveying crews are dispatched to make detailed observations, ensuring that designers and engineers who will subsequently plan the improvement to the road are using best possible and most recent data; they may use traditional equipment in addition to state-of-the-art GPS instruments. Designers will examine a range of alternatives which might involve diff erent levels of construction work and therefore more or less money and time: perhaps realigning and straightening the entire stretch of road is the best solution, but a cost-eff ective alterna-tive might involve installing additional guardrail alongside the roadway and mirrors for blind driveways. Right of way studies will take place, to determine if any purchases might need to be made to complete the project; geotechnical and environmental studies and permitting activities take place, which might reveal the need for new stormwater mitigation facilities or proxim-ity to a previously unmarked cultural heritage site. Th ese needs are fed back into the design process to ensure the fi nal design is comprehensive when it is placed before the estima-tors. Th e chief engineer’s estimate is prepared, and the project is scheduled for advertisement to bid by construction fi rms. Bids received are compared against the engineer’s estimate and analyzed before acceptance. Plans for mitigating storm-water or managing local traffi c fl ow during construction are prepared. Construction generally begins aft er all permitting is accomplished and project management teams assembled, but project managers must remain fl exible and constantly knowl-edgeable about the project in case construction work reveals previously unsuspected problems, such as unstable soils. Th e project is closely followed by SCR staff and managers during regular meetings, including a quarterly briefi ng to WSDOT HQ management, and is tracked for its performance against budget, stated scope, and agreed schedule.
Upon completion of the project, managers review successes and problems; their experiences are added to a WSDOT-wide ‘lessons learned’ pool of knowledge which other regions can draw upon. More formally, and to ensure the delivery of the $ billion capital construction program, WSDOT solicited the assistance of national experts to develop a strategic program for project and program delivery. Th ese experts, the Statewide Program Management Group (SPMG) are a consortium of leading consulting fi rms in the transportation industry along with WSDOT staff and are supporting WSDOT’s implementa-tion of the plan’s strategies.
WSDOT has chosen to maintain a “strong ownership role” in delivering the program to maintain WSDOT’s core exper-tise and technical capabilities. Doing so will assist WSDOT in developing future project managers and team leaders through on the job training and by working in partnership with indus-try experts on challenging projects.
Key to the SPMG success is the Project Management Academy to assure that project managers have the necessary skills and knowledge of best practices. Staff that complete this training will be certifi ed – a required step in the career ladder to manag-ing the agency’s largest projects. As part of SPMG project, WSDOT invested $ million into training, new electronic soft ware and management systems.
d) Limit impact on the environment. WSDOT works to ensure that all agency activities and projects are in compliance with relevant federal and state environmental regulations. Any activity or action which will result in an environmental eff ect is typically covered under the federal National Environmental Policy Act (NEPA), or the (Washington) State Environmen-tal Policy Act (SEPA). Both NEPA and SEPA requires that any agency proposing a major federal (or state) action, which may signifi cantly aff ect the environment, consider the environmen-tal impacts of the proposed action, any unavoidable adverse environmental impacts, and the relationship between local short term uses and long term productivity of the environ-ment. Some WSDOT highway construction projects that are federally funded or require federal approvals fall under this requirement. Th e level of analysis for transportation projects range from:
Categorical Exclusions (CE) - projects in which there are • clearly no signifi cant impacts; Environmental Assessments (EA) - projects in which the • signifi cance of impacts is not clearly known, to; Environmental Impact Statements (EIS) - projects in which • signifi cant impacts are anticipated.
Th ere are three types or categories of eff ect (or impact) that must be considered during the NEPA and SEPA processes: direct, indirect, and cumulative. Identifying direct eff ects, which are those eff ects caused directly by WSDOT activities, at the same time, and in the same place, is relatively simple and straight-forward. Identifying and analyzing indirect eff ects, which are eff ects caused by transportation project activities, that occur later in time, at some distance from the project, and are in the chain of cause-and-eff ect relationships, can be more complex and generate more disagreement. But as complex as indirect eff ects may be, the cumulative eff ects analysis generates the
Section Two: Assessment Criteria
Category 6: Process Management

Section Two WSDOT South Central Region :: WSQA Lite Assessment December 2008 | 15
most complex and contested issues and is easily the most misunderstood. Cumulative impacts are the summation of impacts on a resource resulting from the incremental impact of the action when added to other past, present, and reasonably foreseeable future actions regardless of what agency (federal or non-federal) or person undertakes those actions. Cumulative impacts can result from individually minor but collectively signifi cant actions taking place over a period of time.
Th is category of eff ects has generated numerous national legal challenges to transportation projects during the past few years. Th erefore, it is important that WSDOT conduct both indirect and cumulative eff ect analyses in an effi cient, consistent, legally defensible, and logical manner. Th e processes documented in WSDOT’s Environmental Procedures Manual help the depart-ment meet the goals for cumulative eff ects analyses.
Overall, the goal of WSDOT’s environmental analyses and documentation is to foster good decisions and enable eff ec-tive public participation. WSDOT’s written documents follow “Plain English” guidelines established by the Governor’s offi ce in order to be readily understood by our audience. Th is guidance attempts to clarify the requirements of cumulative impact analy-ses and provide a consistent framework for the analyses.
WSDOT prepares one additional form of environmental documentation for project and program activities, called Programmatic Permitting. Th ese permits, issued by two of Washington State’s natural resource monitoring authori-ties, the Washington State Department of Ecology (Ecology) and the Washington State Department of Fish and Wildlife (WDFW) allow WSDOT to carry out activities that occur with a regular frequency, but whose processes and impacts are both documented and have acceptable thresholds for impacts. In essence, rather then preparing environmental impact statements or assessments annually for ferry vessel cleaning, WSDOT has one permit on fi le that accurately documents the impacts for the activity, and is then allowed to proceed with the project on their own schedule rather then waiting for each permit to be processed and approved, saving valuable time, energy, and money in the process, creating uniform standards of practice across all regions and departments, and generat-ing an accurate account of the number of permitted activities carried out. Permits are issued for fi ve year intervals and are subject to review and modifi cation based on Ecology or WDFW input.e) Display stewardship of fi scal resources. Th e agency goal is to have every project meet three key benchmarks: keeping to
its originally planned schedule, within its original scope, and to its original budget throughout the lifetime of a highway construction project -- which may extend over many years. When achieved, this goal ensures the most cost-eff ective use of tax revenue. Within the broad structure of those three elements, WSDOT also plans project milestones, which allow closer tracking of schedule, scope, and budget; they are:
Project defi nition complete – the preliminary picture of • what a project will achieve and generally how it will do so, including defi ciencies or problems being addressed.Begin preliminary engineering – this pre-construction phase • involves design, right-of-way, and environmental activities.Environmental documentation complete – this milestone is the • date that WSDOT will have fi nished and submitted environ-mental assessments to the appropriate regulatory agencies.Right-of-way certifi cation – this date marks the point by • which any right-of-way acquisitions have been completed.Advertisement date – the date that WSDOT schedules to • publicly advertise a project for bids from contractors. When a project is advertised, it has a completed set of plans and specifi cations, along with a construction cost estimate.Operationally complete – the date when the public has free • and unobstructed use of the facility, even if minor work items (such as landscaping) remain to be fi nished.
Projects may also be subject to additional studies, such as a cost-risk assessment or value engineering review, which review problems and propose resolutions which help keep projects on schedule or on budget. Project milestones are reported in the Gray Notebook, as are reviews of projects with budget or sched-ule problems.Of the South Central Region’s completed Nickel or TPA projects, it advertised early or on time, and delivered on or under budget, on time or early, and on time and on budget.
6.1b2: What are the key requirements for these
processes?
WSDOT, and by extension the South Central Region, is required to track and report many of its processes by state and federal laws, Executive directives, legislative mandates, and its own accountability commitments. Th ese requirements include: RCW .., RCW .. () and (), RCW .., RCW .. (), Executive Order -, Initiative , RCW ...
Section Two: Assessment Criteria
Category 6: Process Management
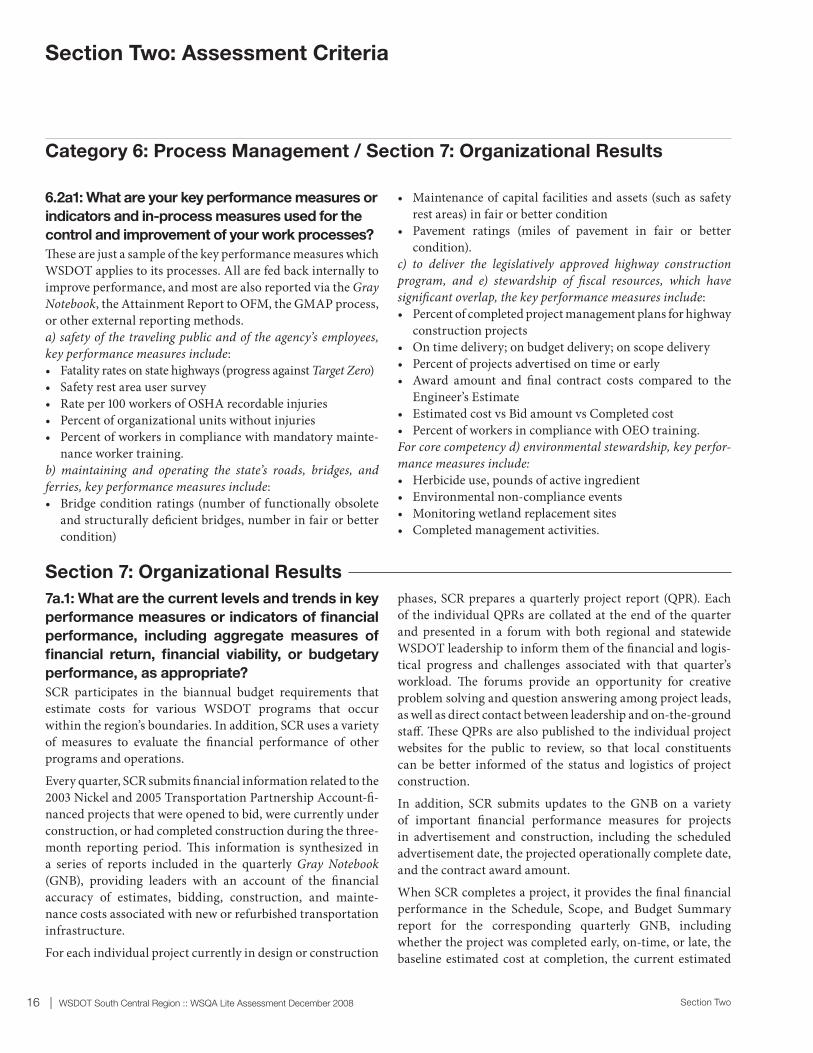
16 | WSDOT South Central Region :: WSQA Lite Assessment December 2008 Section Two
6.2a1: What are your key performance measures or
indicators and in-process measures used for the
control and improvement of your work processes?
Th ese are just a sample of the key performance measures which WSDOT applies to its processes. All are fed back internally to improve performance, and most are also reported via the Gray Notebook, the Attainment Report to OFM, the GMAP process, or other external reporting methods.a) safety of the traveling public and of the agency’s employees, key performance measures include:
Fatality rates on state highways (progress against • Target Zero) Safety rest area user survey • Rate per workers of OSHA recordable injuries • Percent of organizational units without injuries • Percent of workers in compliance with mandatory mainte-• nance worker training.
b) maintaining and operating the state’s roads, bridges, and ferries, key performance measures include:
Bridge condition ratings (number of functionally obsolete • and structurally defi cient bridges, number in fair or better condition)
Maintenance of capital facilities and assets (such as safety • rest areas) in fair or better conditionPavement ratings (miles of pavement in fair or better • condition).
c) to deliver the legislatively approved highway construction program, and e) stewardship of fi scal resources, which have signifi cant overlap, the key performance measures include:
Percent of completed project management plans for highway • construction projects On time delivery; on budget delivery; on scope delivery • Percent of projects advertised on time or early• Award amount and fi nal contract costs compared to the • Engineer’s Estimate Estimated cost vs Bid amount vs Completed cost • Percent of workers in compliance with OEO training.•
For core competency d) environmental stewardship, key perfor-mance measures include:
Herbicide use, pounds of active ingredient • Environmental non-compliance events • Monitoring wetland replacement sites• Completed management activities.•
Section Two: Assessment Criteria
Category 6: Process Management / Section 7: Organizational Results
Section 7: Organizational Results
7a.1: What are the current levels and trends in key
performance measures or indicators of fi nancial
performance, including aggregate measures of
fi nancial return, fi nancial viability, or budgetary
performance, as appropriate?
SCR participates in the biannual budget requirements that estimate costs for various WSDOT programs that occur within the region’s boundaries. In addition, SCR uses a variety of measures to evaluate the fi nancial performance of other programs and operations.
Every quarter, SCR submits fi nancial information related to the Nickel and Transportation Partnership Account-fi -nanced projects that were opened to bid, were currently under construction, or had completed construction during the three-month reporting period. Th is information is synthesized in a series of reports included in the quarterly Gray Notebook (GNB), providing leaders with an account of the fi nancial accuracy of estimates, bidding, construction, and mainte-nance costs associated with new or refurbished transportation infrastructure.
For each individual project currently in design or construction
phases, SCR prepares a quarterly project report (QPR). Each of the individual QPRs are collated at the end of the quarter and presented in a forum with both regional and statewide WSDOT leadership to inform them of the fi nancial and logis-tical progress and challenges associated with that quarter’s workload. Th e forums provide an opportunity for creative problem solving and question answering among project leads, as well as direct contact between leadership and on-the-ground staff . Th ese QPRs are also published to the individual project websites for the public to review, so that local constituents can be better informed of the status and logistics of project construction.
In addition, SCR submits updates to the GNB on a variety of important fi nancial performance measures for projects in advertisement and construction, including the scheduled advertisement date, the projected operationally complete date, and the contract award amount.
When SCR completes a project, it provides the fi nal fi nancial performance in the Schedule, Scope, and Budget Summary report for the corresponding quarterly GNB, including whether the project was completed early, on-time, or late, the baseline estimated cost at completion, the current estimated
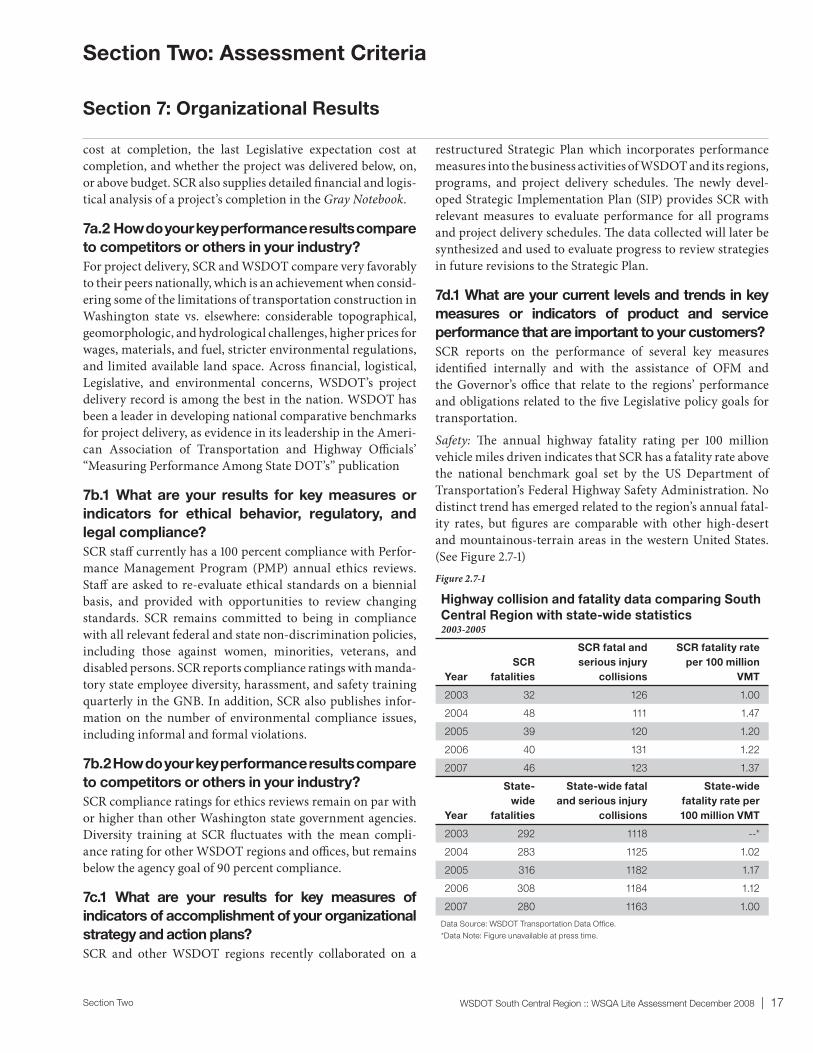
Section Two WSDOT South Central Region :: WSQA Lite Assessment December 2008 | 17
Section Two: Assessment Criteria
Section 7: Organizational Results
cost at completion, the last Legislative expectation cost at completion, and whether the project was delivered below, on, or above budget. SCR also supplies detailed fi nancial and logis-tical analysis of a project’s completion in the Gray Notebook.
7a.2 How do your key performance results compare
to competitors or others in your industry?
For project delivery, SCR and WSDOT compare very favorably to their peers nationally, which is an achievement when consid-ering some of the limitations of transportation construction in Washington state vs. elsewhere: considerable topographical, geomorphologic, and hydrological challenges, higher prices for wages, materials, and fuel, stricter environmental regulations, and limited available land space. Across fi nancial, logistical, Legislative, and environmental concerns, WSDOT’s project delivery record is among the best in the nation. WSDOT has been a leader in developing national comparative benchmarks for project delivery, as evidence in its leadership in the Ameri-can Association of Transportation and Highway Offi cials’ “Measuring Performance Among State DOT’s” publication
7b.1 What are your results for key measures or
indicators for ethical behavior, regulatory, and
legal compliance?
SCR staff currently has a percent compliance with Perfor-mance Management Program (PMP) annual ethics reviews. Staff are asked to re-evaluate ethical standards on a biennial basis, and provided with opportunities to review changing standards. SCR remains committed to being in compliance with all relevant federal and state non-discrimination policies, including those against women, minorities, veterans, and disabled persons. SCR reports compliance ratings with manda-tory state employee diversity, harassment, and safety training quarterly in the GNB. In addition, SCR also publishes infor-mation on the number of environmental compliance issues, including informal and formal violations.
7b.2 How do your key performance results compare
to competitors or others in your industry?
SCR compliance ratings for ethics reviews remain on par with or higher than other Washington state government agencies. Diversity training at SCR fl uctuates with the mean compli-ance rating for other WSDOT regions and offi ces, but remains below the agency goal of percent compliance.
7c.1 What are your results for key measures of
indicators of accomplishment of your organizational
strategy and action plans?
SCR and other WSDOT regions recently collaborated on a
restructured Strategic Plan which incorporates performance measures into the business activities of WSDOT and its regions, programs, and project delivery schedules. Th e newly devel-oped Strategic Implementation Plan (SIP) provides SCR with relevant measures to evaluate performance for all programs and project delivery schedules. Th e data collected will later be synthesized and used to evaluate progress to review strategies in future revisions to the Strategic Plan.
7d.1 What are your current levels and trends in key
measures or indicators of product and service
performance that are important to your customers?
SCR reports on the performance of several key measures identifi ed internally and with the assistance of OFM and the Governor’s offi ce that relate to the regions’ performance and obligations related to the fi ve Legislative policy goals for transportation.
Safety: Th e annual highway fatality rating per million vehicle miles driven indicates that SCR has a fatality rate above the national benchmark goal set by the US Department of Transportation’s Federal Highway Safety Administration. No distinct trend has emerged related to the region’s annual fatal-ity rates, but fi gures are comparable with other high-desert and mountainous-terrain areas in the western United States. (See Figure .-)
Highway collision and fatality data comparing South
Central Region with state-wide statistics2003-2005
Year
SCR
fatalities
SCR fatal and
serious injury
collisions
SCR fatality rate
per 100 million
VMT
2003 32 126 1.00
2004 48 111 1.47
2005 39 120 1.20
2006 40 131 1.22
2007 46 123 1.37
Year
State-
wide
fatalities
State-wide fatal
and serious injury
collisions
State-wide
fatality rate per
100 million VMT
2003 292 1118 --*
2004 283 1125 1.02
2005 316 1182 1.17
2006 308 1184 1.12
2007 280 1163 1.00
Data Source: WSDOT Transportation Data Offi ce.
*Data Note: Figure unavailable at press time.
Figure 2.7-1

18 | WSDOT South Central Region :: WSQA Lite Assessment December 2008 Section Two
Section Two: Assessment Criteria
Section 7: Organizational Results
Mobility: SCR’s key measure for mobility continues to be the operation of the I- corridor through Snoqualmie Pass in the Cascade mountain range during the winter driving season. During the - winter season, the state lost an estimated $ million in freight value by losing access to its main east-west corridor. In the last year, SCR struggled with increasing material costs for moderately severe winter condition ratings on I-. During the - winter season, I- saw a percent increase in recorded snowfall, but a % increase in interstate closures. Post-winter evaluations and conferences help to evaluate processes and performance and better-prepare for the next winter season. (See Figure .-)
Preservation: SCR remains at or above the mandated Level of Service (LOS) for highway pavement, bridge, and facili-ties maintenance for infrastructure located in the region. percent of pavements were rated in fair or good condition, equal to the statewide goal, which is percent above the expected performance level. (See Figure .-) percent of all bridges were in good or fair condition, percent above the statewide goal and current performance level. (See Figure .-) SCR has also achieved a satisfactory rating in of MAP activities, compared with for the statewide average. (See Figure .-) Environment: SCR has a very good compliance rating for infor-
mal and formal environmental violation notices. During the - fi scal biennium, SCR incurred incidents, none of which escalated to an event that incurred a formal regulatory violation. Th e goal is to incur zero formal violation notices annually. SCR has also been steadfast in improving fi sh passage barriers located along state highway right-of-ways. (See Figure .-)
Th e region has the lowest percentage of fi sh passage barri-ers to bearing waterway crossings of any of the six regions at percent, and has the fewest barriers remaining that are thought to have signifi cant habitat gain if repaired at , and
State Highway Pavement Trends, 1975-2006South Central Region vs. Statewide annual totals
Data Source: WSDOT Materials Lab.
100%
80%
60%
40%
20%
0%‘75 ‘77 ‘79 ‘81 ‘83 ‘84 ‘86 ‘88 ‘89 ‘90 ‘91 ‘92 ‘93 ‘94 ‘95 ‘96 ‘97 ‘98 ‘99 ‘00 ‘01 ‘02 ‘03 ‘04 ‘05 ‘06
Statewide Good/Fair Average
South Central Good/Fair Average
Statewide Poor Average
South Central Poor AverageLong-term trend: declining percentage of pavement in Poor Condition
Bridge structural condition ratings for FY 2007South Central Region vs. Statewide FY ratings
Condition rating & description
South
Central
Region Statewide
Good: A range from no problems to
some minor deterioration of struc-
tural elements.
92% 88%
Fair: All primary structural elements
are sound but may have defi ciencies
such as minor section loss, deterio-
ration, cracking, spalling, or scour.
6% 9%
Poor: Advanced defi ciencies
such as section loss, deteriora-
tion, cracking, spalling, scour, or
seriously affected primary structural
components. Bridges rated in poor
condition may have posted truck
weight restrictions.
2% 3%
Data Source: WSDOT Bridge Offi ce.
Maintenance Accountability Program (MAP) ratings
South Central Region vs all WSDOT regionsCalendar Year 2007
Data Source: WSDOT Maintenance Offi ce.
I-90 Snoqualmie Pass snowfall and eastbound/westbound highway closuresEastbound and westbound I-90 avalanche and collision-related closures during the winter season
0
50
100
150
200
250
Annual snowfall
Avalanche closuresCollision closures
*Does not include 2005-06 rock fall closures of 42 hours EB and 56 hours WB.
Data Source: WSDOT Maintenance Office.
0
100
200
300
400
500
600
2002-03 2003-04 2004-05 2005-06* 2006-07 2007-08
Hours closed Inches of snowfall
EB WB EB WBEB WB EB WB EB WB EB WB
526 inchesas of 4/6/08
Figure 2.7-2
Figure 2.7-3
Figure 2.7-4
Figure 2.7-5
I-90 Snoqualmie Pass snowfall and eastbound/
westbound highway closuresEsatbound and westbound I-90 avalanche and collision-related closures during the winter season, 2002-2008
State highway pavement trends, 1975-2006South Central Region vs. statewide annual totals
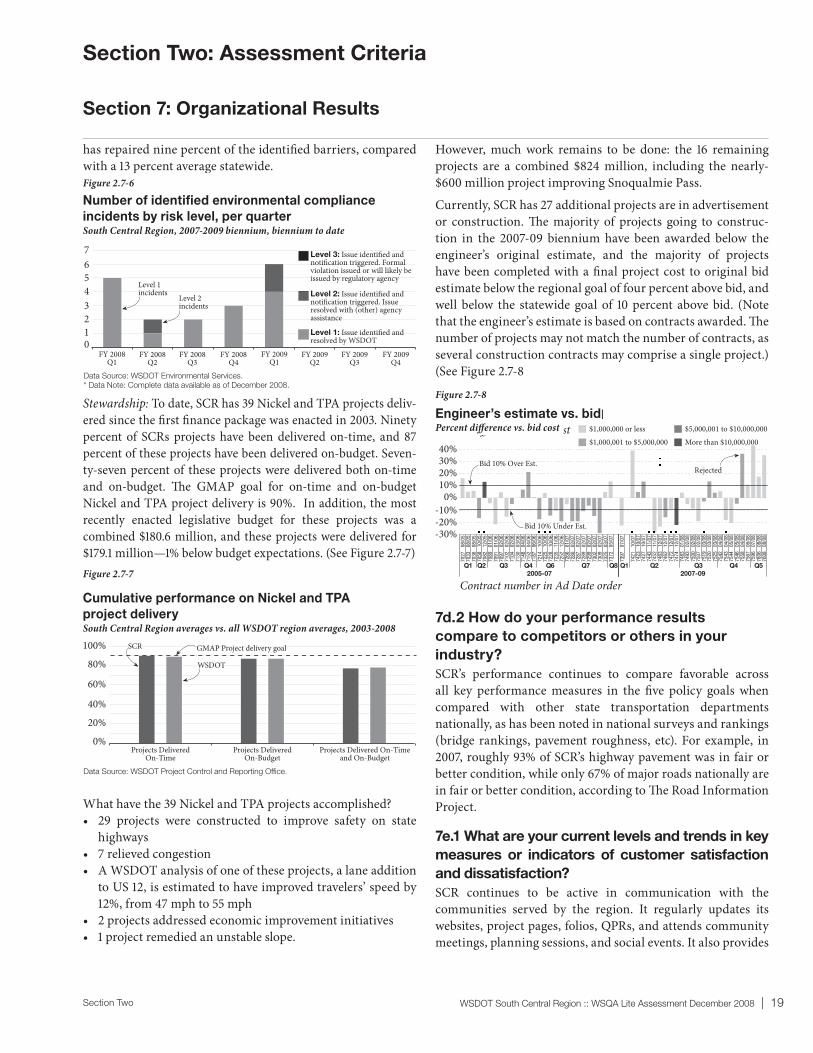
Section Two WSDOT South Central Region :: WSQA Lite Assessment December 2008 | 19
Section Two: Assessment Criteria
Section 7: Organizational Results
has repaired nine percent of the identifi ed barriers, compared with a percent average statewide.
Stewardship: To date, SCR has Nickel and TPA projects deliv-ered since the fi rst fi nance package was enacted in . Ninety percent of SCRs projects have been delivered on-time, and percent of these projects have been delivered on-budget. Seven-ty-seven percent of these projects were delivered both on-time and on-budget. Th e GMAP goal for on-time and on-budget Nickel and TPA project delivery is %. In addition, the most recently enacted legislative budget for these projects was a combined $. million, and these projects were delivered for $. million—% below budget expectations. (See Figure .-)
What have the Nickel and TPA projects accomplished? projects were constructed to improve safety on state • highways relieved congestion • A WSDOT analysis of one of these projects, a lane addition • to US , is estimated to have improved travelers’ speed by %, from mph to mph projects addressed economic improvement initiatives • project remedied an unstable slope.•
However, much work remains to be done: the remaining projects are a combined $ million, including the nearly-$ million project improving Snoqualmie Pass.
Currently, SCR has additional projects are in advertisement or construction. Th e majority of projects going to construc-tion in the - biennium have been awarded below the engineer’s original estimate, and the majority of projects have been completed with a fi nal project cost to original bid estimate below the regional goal of four percent above bid, and well below the statewide goal of percent above bid. (Note that the engineer’s estimate is based on contracts awarded. Th e number of projects may not match the number of contracts, as several construction contracts may comprise a single project.) (See Figure .-
7d.2 How do your performance results
compare to competitors or others in your
industry?
SCR’s performance continues to compare favorable across all key performance measures in the fi ve policy goals when compared with other state transportation departments nationally, as has been noted in national surveys and rankings (bridge rankings, pavement roughness, etc). For example, in , roughly % of SCR’s highway pavement was in fair or better condition, while only % of major roads nationally are in fair or better condition, according to Th e Road Information Project.
7e.1 What are your current levels and trends in key
measures or indicators of customer satisfaction
and dissatisfaction?
SCR continues to be active in communication with the communities served by the region. It regularly updates its websites, project pages, folios, QPRs, and attends community meetings, planning sessions, and social events. It also provides
Number of identified environmental compliance incidents by risk level, per quarterSouth Central Region, 2007-2009 biennium, biennium to date*
Data Source: WSDOT Environmental Services.
* Data Note: Complete data available as of December 2008.
76543210
FY 2008Q1
FY 2008Q2
FY 2008Q3
FY 2008Q4
FY 2009Q1
FY 2009Q2
FY 2009Q3
FY 2009Q4
Level 3: Issue identified and notification triggered. Formal violation issued or will likely be issued by regulatory agency
Level 2: Issue identified and notification triggered. Issue resolved with (other) agency assistance
Level 1: Issue identified and resolved by WSDOT
Level 2 incidents
Level 1 incidents
Engineer’s estimate vs. bidPercent difference vs. bid cost40%30%20%10%
-10%-20%-30%
0%
Rejected70
27
08/0
570
33
08/0
570
36
08/0
570
58
10/0
570
82
12/0
570
89
01/0
670
91
01/0
670
97
02/0
671
02
02/0
671
04
02/0
671
30
03/0
671
48
04/0
671
52
04/0
671
87
06/0
672
14
10/0
672
25
10/0
672
28
10/0
672
35
11/0
672
52
12/0
672
66
01/0
772
80
02/0
772
87
02/0
772
89
02/0
772
99
02/0
773
02
02/0
773
09
02/0
773
25
03/0
773
72
05/0
7
7397
07
/07
7421
10
/07
7423
10
/07
7427
10
/07
7443
11
/07
7452
11
/07
7463
12
/07
7462
12
/07
7472
12
/07
7474
12
/07
7483
01
/08
7493
02
/08
7500
02
/08
7507
02
/08
7519
03
/08
7520
03
/08
7525
03
/08
7542
04
/08
7543
04
/08
7544
05
/08
7546
05
/08
7558
04
/08
7567
06
/08
7596
07
/08
7606
08
/08
7608
08
/08
Q2 Q2Q1 Q1Q3 Q3Q4 Q4 Q5Q6
2005-07 2007-09
Q8Q7
Contract number in Ad Date order
$1,000,000 or less$1,000,001 to $5,000,000
$5,000,001 to $10,000,000More than $10,000,000
Bid 10% Over Est.
Bid 10% Under Est.
Figure 2.7-6
Figure 2.7-7
Figure 2.7-8
Number of identifi ed environmental compliance
incidents by risk level, per quarterSouth Central Region, 2007-2009 biennium, biennium to date
South Central Region averages vs. all WSDOT region averages2003 - 2008
Data Source: WSDOT Project Control and Reporting Office.
100%
80%
60%
40%
20%
0%Projects Delivered
On-TimeProjects Delivered
On-BudgetProjects Delivered On-Time
and On-Budget
WSDOT
SCR GMAP Project delivery goal
Cumulative performance on Nickel and TPA
project deliverySouth Central Region averages vs. all WSDOT region averages, 2003-2008
Engineer’s estimate vs. bidPercent diff erence vs. bid cost
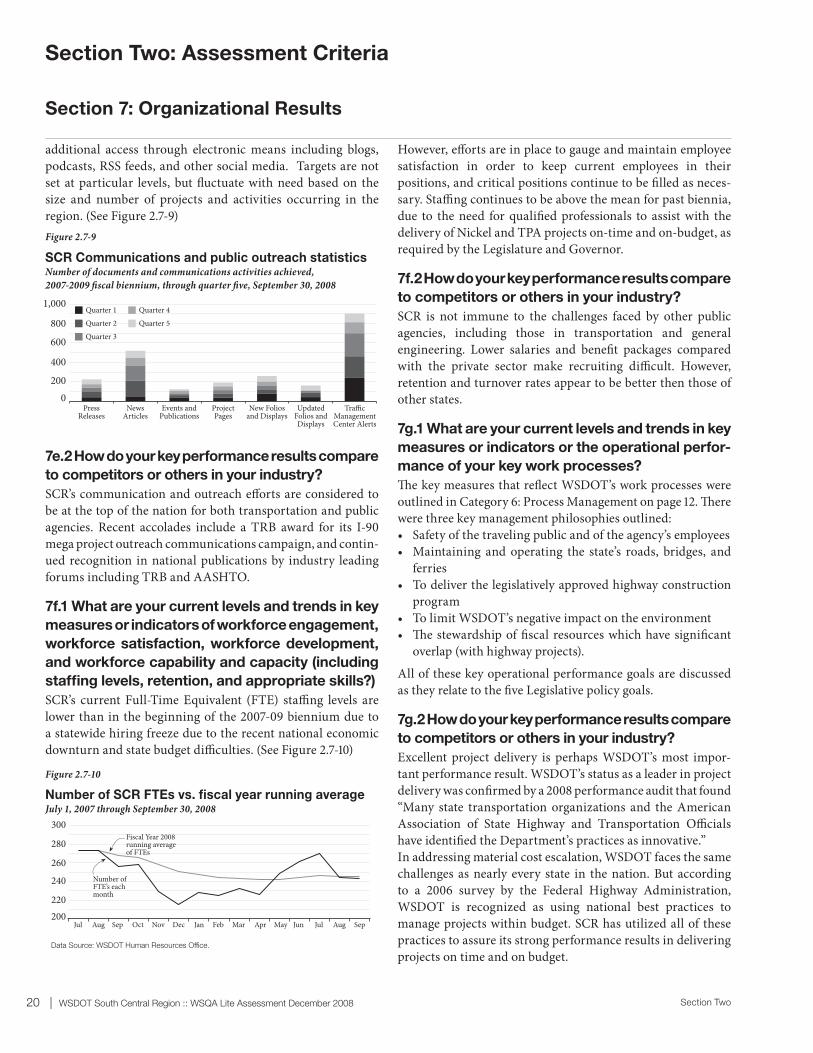
20 | WSDOT South Central Region :: WSQA Lite Assessment December 2008 Section Two
additional access through electronic means including blogs, podcasts, RSS feeds, and other social media. Targets are not set at particular levels, but fl uctuate with need based on the size and number of projects and activities occurring in the region. (See Figure .-)
7e.2 How do your key performance results compare
to competitors or others in your industry?
SCR’s communication and outreach eff orts are considered to be at the top of the nation for both transportation and public agencies. Recent accolades include a TRB award for its I- mega project outreach communications campaign, and contin-ued recognition in national publications by industry leading forums including TRB and AASHTO.
7f.1 What are your current levels and trends in key
measures or indicators of workforce engagement,
workforce satisfaction, workforce development,
and workforce capability and capacity (including
staffi ng levels, retention, and appropriate skills?)
SCR’s current Full-Time Equivalent (FTE) staffi ng levels are lower than in the beginning of the - biennium due to a statewide hiring freeze due to the recent national economic downturn and state budget diffi culties. (See Figure .-)
However, eff orts are in place to gauge and maintain employee satisfaction in order to keep current employees in their positions, and critical positions continue to be fi lled as neces-sary. Staffi ng continues to be above the mean for past biennia, due to the need for qualifi ed professionals to assist with the delivery of Nickel and TPA projects on-time and on-budget, as required by the Legislature and Governor.
7f.2 How do your key performance results compare
to competitors or others in your industry?
SCR is not immune to the challenges faced by other public agencies, including those in transportation and general engineering. Lower salaries and benefi t packages compared with the private sector make recruiting diffi cult. However, retention and turnover rates appear to be better then those of other states.
7g.1 What are your current levels and trends in key
measures or indicators or the operational perfor-
mance of your key work processes?
Th e key measures that refl ect WSDOT’s work processes were outlined in Category : Process Management on page . Th ere were three key management philosophies outlined:
Safety of the traveling public and of the agency’s employees• Maintaining and operating the state’s roads, bridges, and • ferriesTo deliver the legislatively approved highway construction • programTo limit WSDOT’s negative impact on the environment• Th e stewardship of fi scal resources which have signifi cant • overlap (with highway projects).
All of these key operational performance goals are discussed as they relate to the fi ve Legislative policy goals.
7g.2 How do your key performance results compare
to competitors or others in your industry?
Excellent project delivery is perhaps WSDOT’s most impor-tant performance result. WSDOT’s status as a leader in project delivery was confi rmed by a performance audit that found “Many state transportation organizations and the American Association of State Highway and Transportation Offi cials have identifi ed the Department’s practices as innovative.”In addressing material cost escalation, WSDOT faces the same challenges as nearly every state in the nation. But according to a survey by the Federal Highway Administration, WSDOT is recognized as using national best practices to manage projects within budget. SCR has utilized all of these practices to assure its strong performance results in delivering projects on time and on budget.
and Public Outreach StatisticsNumber of documents and communications activities achieved2007-09 fiscal biennium, through quarter five (September 30, 2008)1,000
800
600
400
2000
PressReleases
NewsArticles
Events andPublications
ProjectPages
New Foliosand Displays
UpdatedFolios andDisplays
Traffic Management Center Alerts
Quarter 1Quarter 2
Quarter 4Quarter 5
Quarter 3
running averageFiscal year (to date) 2008 (July 1. 2007 - September 30, 2008)
Data Source: WSDOT Human Resources Office.
300
280
260
240
220200
Jul Aug Sep Oct Nov Dec Jan Feb Mar Apr May Jun Jul Aug Sep
Number ofFTE’s each month
Fiscal Year 2008 running average of FTEs
Section Two: Assessment Criteria
Section 7: Organizational Results
Figure 2.7-9
Figure 2.7-10
SCR Communications and public outreach statisticsNumber of documents and communications activities achieved,2007-2009 fi scal biennium, through quarter fi ve, September 30, 2008
Number of SCR FTEs vs. fi scal year running averageJuly 1, 2007 through September 30, 2008