Embed Size (px)
Citation preview
1
WASHINGTON STATE WORKFORCE TRAINING AND EDUCATION COORDINATING BOARD
MEETING NO. 158 NOVEMBER 17, 2011
WORKFORCE BOARD AMERICAN RECOVERY AND REINVESTMENT ACT
GRANT UPDATE In early 2010, the U.S. Department of Labor awarded the Workforce Training and Education Coordinating Board two American Recovery and Reinvestment Act High Growth and Emerging Industry grants focused on training for healthcare and energy efficiency. These grants added to the Workforce Board’s portfolio of “learning laboratory” programs. At the meeting, Beth Meyer, Workforce Board Grant Manager, will provide Board members an update on the programs and what we have learned so far. Ed Phippen, Program Manager at the Health Work Force Institute (an affiliate of the Washington State Hospital Association) will share their most recent hospital workforce data. Mr. Phippen and other grant steering committee members, Mary Margaret Callahan from the SEIU Healthcare NW Training Partnership, Mary Rosenthal from the SEIU Healthcare 1199NW Multi-Employer Training and Education Fund, and Pat Ward from the State Board for Community and Technical Colleges will also talk about their organization’s healthcare workforce and education capacity building efforts The board packet includes one-page descriptions of each grant, program data, and participant success stories. Board Action Required: None. For discussion only.

WashingtonStateEnergySectorPartnershipGrant
PROJECT TITLE: Energy Efficiency Training for Washington’s Green Economy FUNDING: $5.9 million from the U.S. Department of Labor. GRANT PERIOD: January 29, 2010 – January 28, 2013 AREAS SERVED: Spokane, King and Snohomish counties, as well as statewide access through building and construction apprenticeship organizations (Joint Apprenticeship Training Committees). LEARNING GOALS: To examine and define “green jobs” in the building and construction industry. To test a state-wide coordinated approach to providing energy efficiency training through
building and construction trades’ Joint Apprenticeship Training Committees (JATCs). SYNOPSIS OF ACTIVITIES: The Workforce Training & Education Coordinating Board funds three regional Workforce Development Councils (WDCs) to provide energy efficiency training for construction and manufacturing industry incumbent workers, dislocated workers, unemployed individuals, and people needing training to become economically self-sufficient. These WDCs (Spokane Area, Snohomish, Seattle-King) each contract with Build It Smart, a labor-management, nonprofit organization, to facilitate training of building and construction trades journey-level workers and apprentices for in-demand green and energy efficiency skills. Build It Smart is also working with the state’s Helmets to Hardhats program to ensure apprenticeship placements for veterans transitioning out of military service. The participating WDCs also contract with the state’s community and technical colleges, and other training organizations, to offer energy efficiency training courses. PROJECTED TRAINING AND PLACEMENT OUTCOMES:
PARTICIPANTS TO BE SERVEDWDC of Snohomish
County WDC of Seattle-
King County Spokane Area
WDC Statewide Build It
Smart Project
124 170 176 4,295 Total of all participants to be served: 4,765
Over 4,000 are projected to be placed in and retain employment after training SAMPLE OF TRAINING AND CREDENTIALS OFFERED:
American Clay Building Operator Commercial Building Engineer Concrete Polishing Controls: Basics of Building Automation Duct Testing Certification Energy Auditing – Residential and Commercial Energy Systems for Sustainable Works
EPA and LIUNA Lead Renovator Floor Polishing Technician Green Construction for Ironworkers Healthy Homes Training for Building Professionals International Masonry Institute Green Craft Training High Performance Building Pervious Concrete Submerged Arc Welding
Contact: Beth Meyer, [email protected]
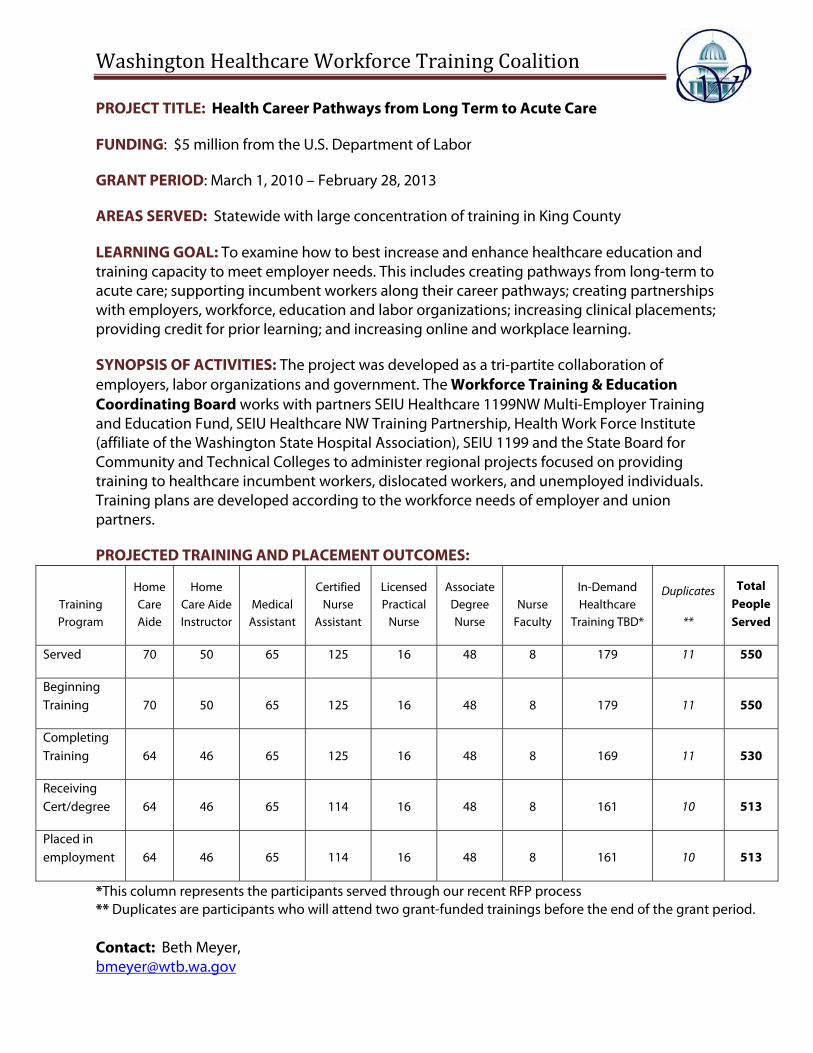
WashingtonHealthcareWorkforceTrainingCoalition
PROJECT TITLE: Health Career Pathways from Long Term to Acute Care FUNDING: $5 million from the U.S. Department of Labor GRANT PERIOD: March 1, 2010 – February 28, 2013 AREAS SERVED: Statewide with large concentration of training in King County LEARNING GOAL: To examine how to best increase and enhance healthcare education and training capacity to meet employer needs. This includes creating pathways from long-term to acute care; supporting incumbent workers along their career pathways; creating partnerships with employers, workforce, education and labor organizations; increasing clinical placements; providing credit for prior learning; and increasing online and workplace learning. SYNOPSIS OF ACTIVITIES: The project was developed as a tri-partite collaboration of employers, labor organizations and government. The Workforce Training & Education Coordinating Board works with partners SEIU Healthcare 1199NW Multi-Employer Training and Education Fund, SEIU Healthcare NW Training Partnership, Health Work Force Institute (affiliate of the Washington State Hospital Association), SEIU 1199 and the State Board for Community and Technical Colleges to administer regional projects focused on providing training to healthcare incumbent workers, dislocated workers, and unemployed individuals. Training plans are developed according to the workforce needs of employer and union partners. PROJECTED TRAINING AND PLACEMENT OUTCOMES:
*This column represents the participants served through our recent RFP process ** Duplicates are participants who will attend two grant-funded trainings before the end of the grant period. Contact: Beth Meyer, [email protected]
Training Program
Home Care Aide
Home Care Aide Instructor
Medical Assistant
Certified Nurse
Assistant
Licensed Practical
Nurse
Associate Degree Nurse
Nurse Faculty
In-Demand Healthcare
Training TBD*
Duplicates
**
Total People Served
Served 70 50 65 125 16 48 8 179 11 550
Beginning Training 70 50 65 125 16 48 8 179 11 550
Completing Training 64 46 65 125 16 48 8 169 11 530
Receiving Cert/degree 64 46 65 114 16 48 8 161 10 513
Placed in employment 64 46 65 114 16 48 8 161 10 513
Workforce TrainingAnd Education Coordinating Board
NOVEMBER 17, 2011
WORKFORCE BOARD MEETING PRESENTATION
AMERICAN RECOVERY AND REINVESTMENT ACT PROGRAMS
State Energy Sector Partnership and
Healthcare Workforce Training Coalition
Beth Meyer, ARRA Grants Project Manager
Overview
American Recovery and Reinvestment Act of 2009
USDOL High Growth Emerging Industries Grants
– State Energy Sector Partnership, $5.9 million
(January 29, 2010 – January 28, 2013)
– Healthcare Worker Training Coalition, $5 million
(March 1, 2010 – February 28, 2013)
Workforce Board’s Learning Laboratory
2
State Energy Sector Partnership (SESP)Learning Goals
Examine and define “green jobs” in building and construction industry.
Test statewide coordinated approach toenergy efficiency training through building and construction trades’ Joint Apprenticeship Training Committees (JATCs).
3
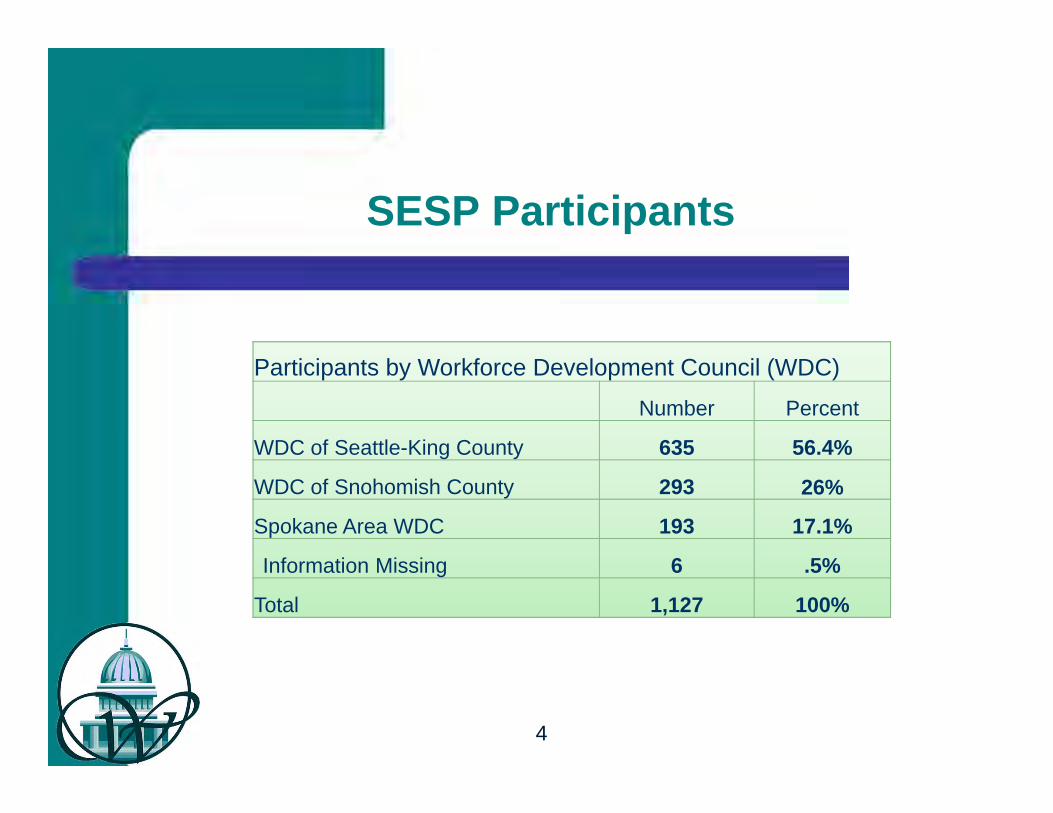
SESP Participants
Participants by Workforce Development Council (WDC)
Number Percent
WDC of Seattle-King County 635 56.4%
WDC of Snohomish County 293 26%
Spokane Area WDC 193 17.1%
Information Missing 6 .5%
Total 1,127 100%
4
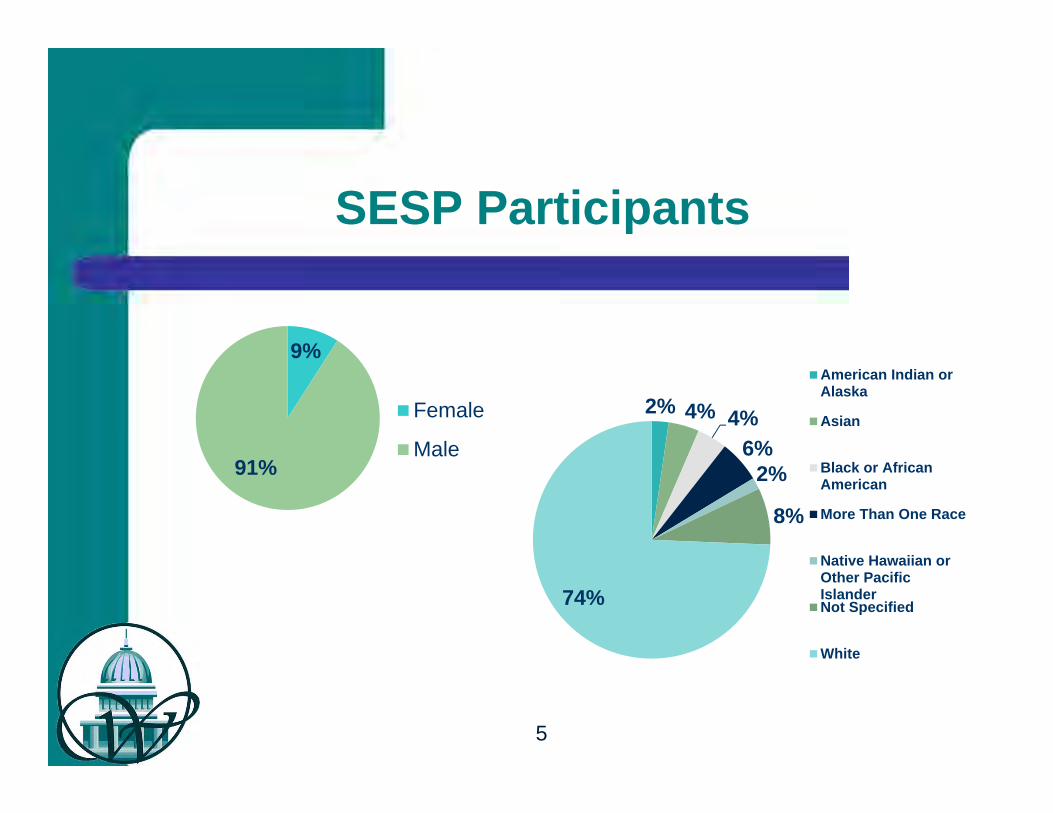
SESP Participants
9%
91%
Female
Male
2% 4% 4%6%
2%
8%
74%
American Indian orAlaska
Asian
Black or AfricanAmerican
More Than One Race
Native Hawaiian orOther PacificIslanderNot Specified
White
5
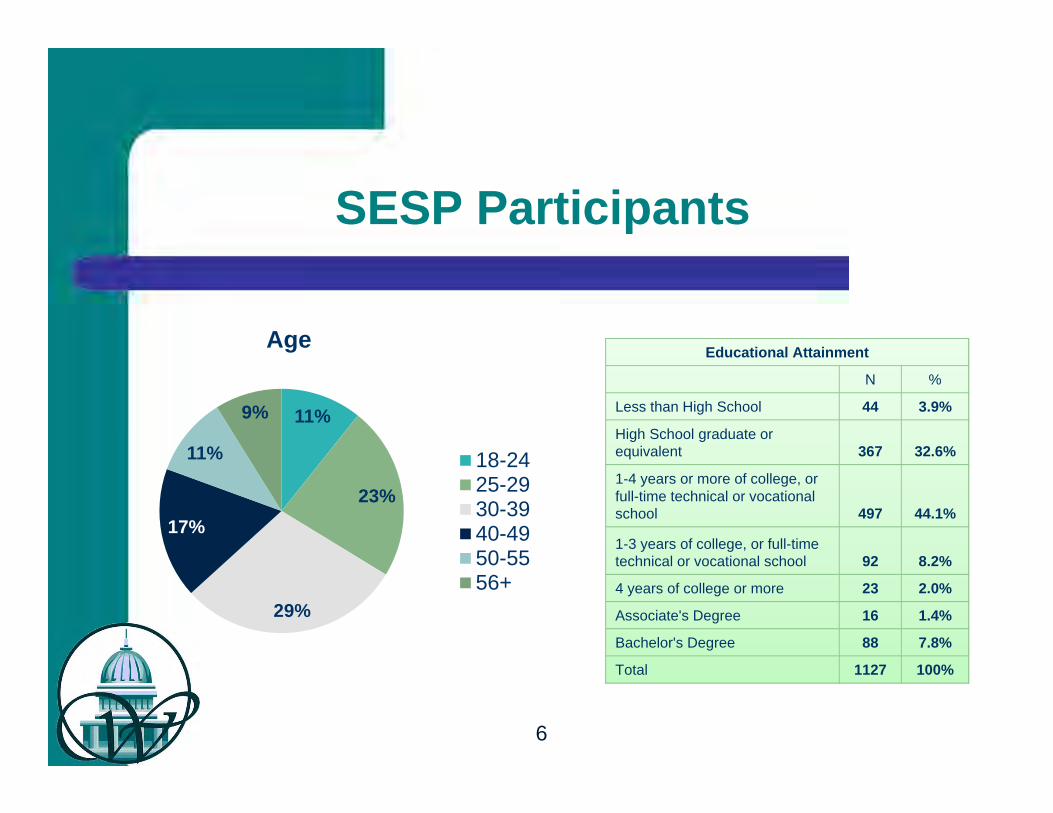
SESP Participants
11%
23%
29%
17%
11%
9%
Age
18-2425-2930-3940-4950-5556+
Educational Attainment
N %
Less than High School 44 3.9%
High School graduate or equivalent 367 32.6%
1-4 years or more of college, or full-time technical or vocational school 497 44.1%
1-3 years of college, or full-time technical or vocational school 92 8.2%
4 years of college or more 23 2.0%
Associate's Degree 16 1.4%
Bachelor's Degree 88 7.8%
Total 1127 100%
6

SESP Training
SESP Program ParticipationN Percent
Total Program Participants 1,127 -Completed Training 973 86.3%Received a Credential 801 71.1%Build It Smart Participants 835 74.1%Eligible Veterans 109 9.7%Completed more than one SESP training 47 4.2%
Completed two SESP trainings 44 3.9%Completed three SESP trainings 3 0.3%
7
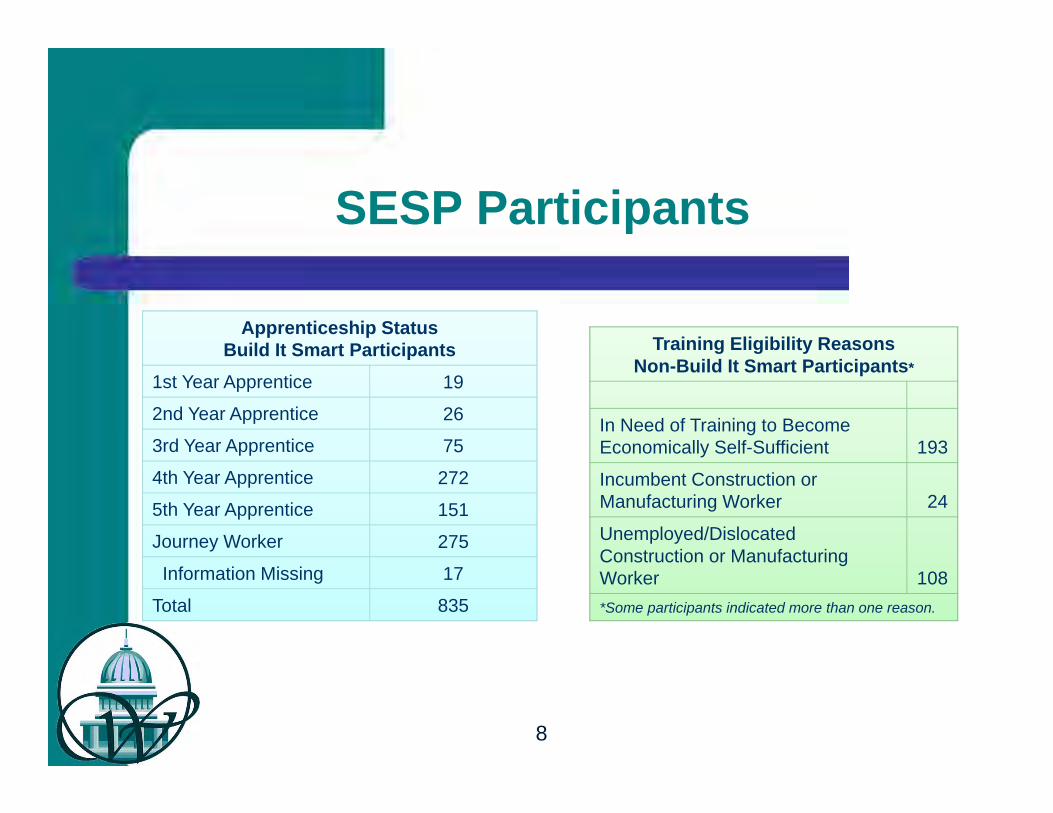
SESP Participants
Apprenticeship StatusBuild It Smart Participants
1st Year Apprentice 19
2nd Year Apprentice 26
3rd Year Apprentice 75
4th Year Apprentice 272
5th Year Apprentice 151
Journey Worker 275
Information Missing 17
Total 835
Training Eligibility Reasons Non-Build It Smart Participants*
In Need of Training to Become Economically Self-Sufficient 193
Incumbent Construction or Manufacturing Worker 24
Unemployed/Dislocated Construction or Manufacturing Worker 108
*Some participants indicated more than one reason.
8

SESP Training Programs
N %
Photovoltaics 192 17.0%
Building Automation 190 16.9%
Sustainability in the Building and Construction Trades
142 12.6%
Green Construction for Iron Workers
68 6.0%
Pervious Concrete Installation
59 5.2%
Systems Training 53 4.7%
Commercial Building Engineer
49 4.3%
Residential Energy Auditor 34 3.0%
Commercial Energy Auditing 33 2.9%
Healthy Home Training for Building Professionals
27 2.4%
N %
Submerged Arc Welding 26 2.3%
Construction Management 25 2.2%
Energy Audit Specialist 23 2.0%
Building Operator 20 1.8%
Lead Renovator 19 1.7%
American Clay 18 1.6%
Sustainable Building Advisor 18 1.6%
Concrete Polishing 1 17 1.5%
Energy Systems for Sustainable Works
16 1.4%
High Performance Buildings 16 1.4%
Controls Technician 11 1.0%
Concrete Polishing 2 10 0.9%
9

SESP Training Programs cont.…
N %
Controls 8 0.7%
Exterior Foam Insulating Systems
8 0.7%
Hydronic Balancing 7 0.6%
Energy Efficiency Technician 6 0.5%
Commercial Lighting Auditor 3 0.3%
EPA Certified Lead Renovator
2 0.2%
Concrete Polishing 3 1 0.1%
Green Building Strategies for Sheet Metal Workers
1 0.1%
No program name listed 25 2.2%
Total 1127 100%
10
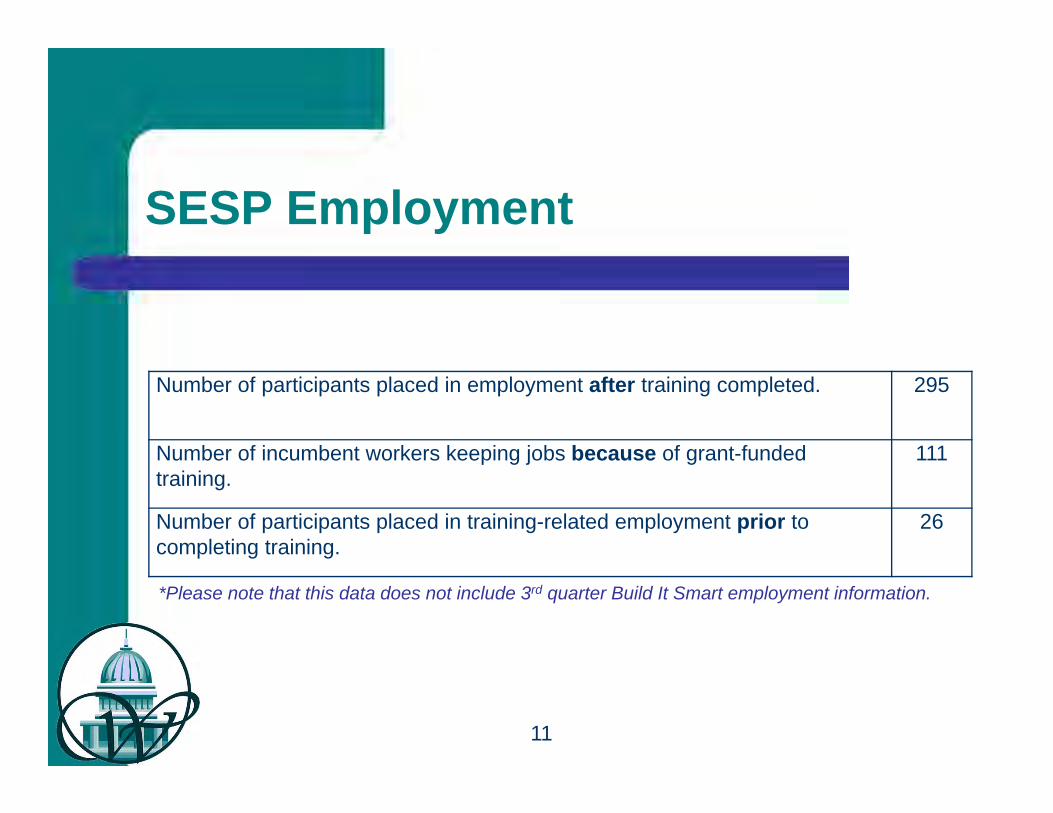
SESP Employment
Number of participants placed in employment after training completed. 295
Number of incumbent workers keeping jobs because of grant-funded training.
111
Number of participants placed in training-related employment prior to completing training.
26
11
*Please note that this data does not include 3rd quarter Build It Smart employment information.
SESP Challenges and Successes
Challenges– Extremely high unemployment.
– Administrative requirements.
Successes– Employer involvement with training.
– Engaging veterans.
12

SESP: What we have learned so far
Green jobs vs. Green skills.
Colleges and Joint Apprenticeship Training Committees are imbedding green skills in course curriculum.
Increase upfront technical assistance to partners.
13
Healthcare Worker Training CoalitionLearning Goal
To examine how to best increase and enhance healthcare education and training capacity to meet employer needs.
14

Healthcare Grant Participants
SEIU Healthcare 1199 NW Multi-Employer Training 97and Education Fund
SEIU Healthcare NW Training Partnership 21
Health Work Force Institute (affiliate of the Washington State Hospital Association) 18
Total Participants Served: 136(As of September 30, 2011)
15
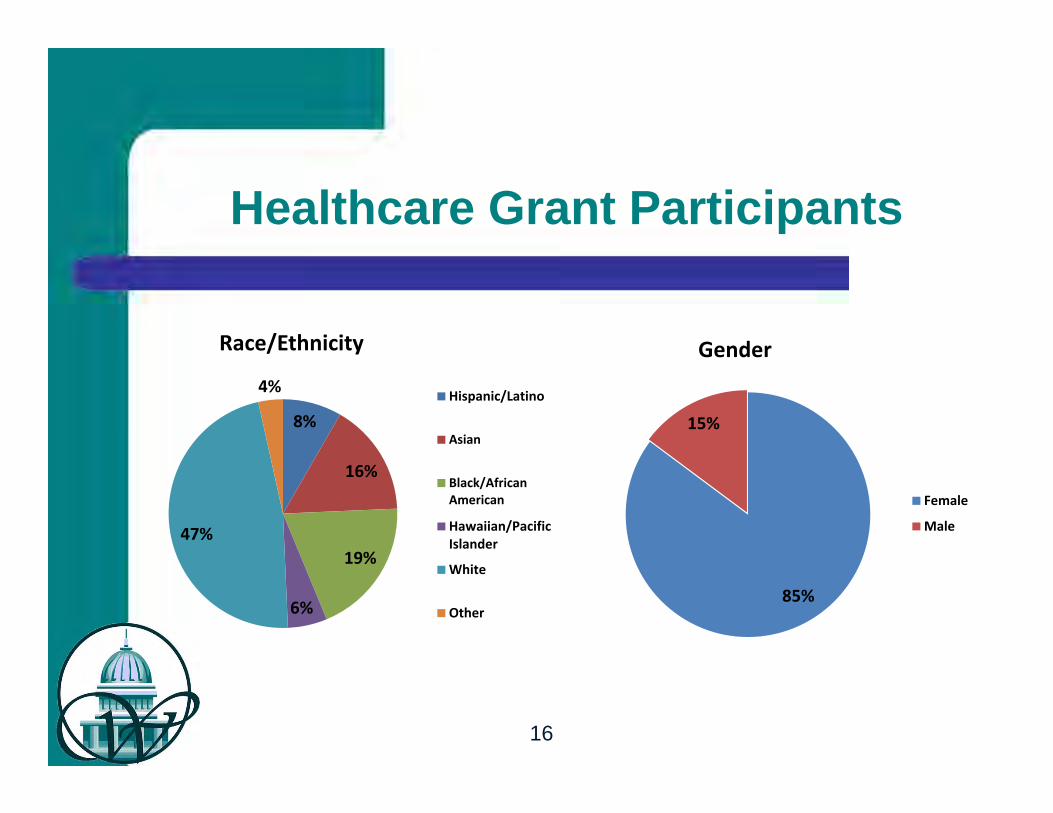
Healthcare Grant Participants
8%
16%
19%
6%
47%
4%
Race/Ethnicity
Hispanic/Latino
Asian
Black/AfricanAmerican
Hawaiian/PacificIslander
White
Other85%
15%
Gender
Female
Male
16
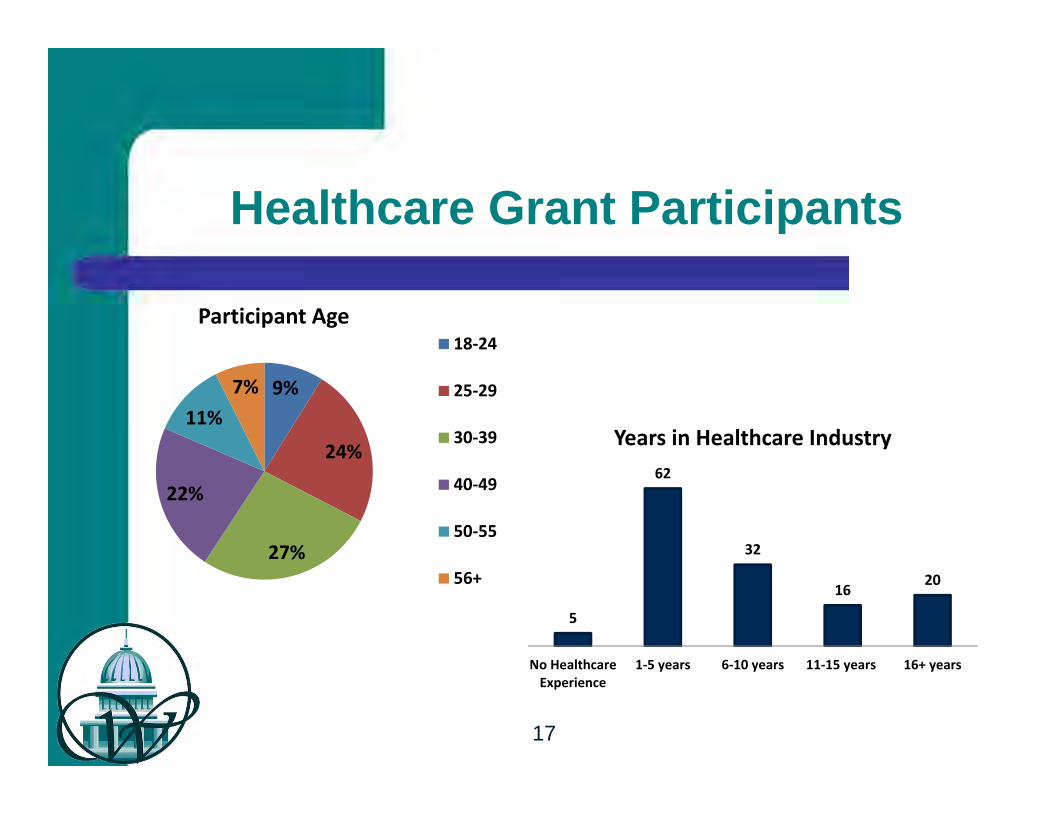
Healthcare Grant Participants
9%
24%
27%
22%
11%7%
Participant Age18‐24
25‐29
30‐39
40‐49
50‐55
56+
5
62
32
1620
No HealthcareExperience
1‐5 years 6‐10 years 11‐15 years 16+ years
Years in Healthcare Industry
17

Healthcare Grant Participants
1 4
78
2516 12
Education Prior to Enrollment
3218
53
1710 7
0
22
None HCA CNA MA LPN RN ADN Other
Medical Credential Attained Prior to Enrollment
18
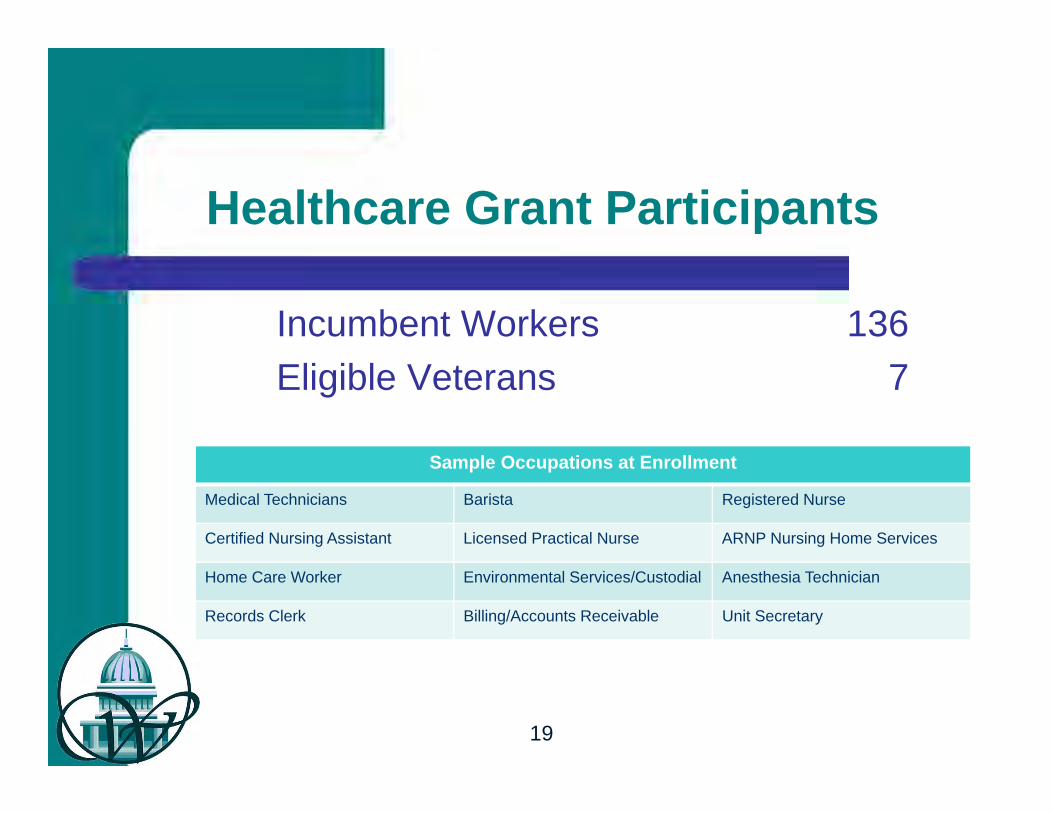
Healthcare Grant Participants
Incumbent Workers 136
Eligible Veterans 7
Sample Occupations at Enrollment
Medical Technicians Barista Registered Nurse
Certified Nursing Assistant Licensed Practical Nurse ARNP Nursing Home Services
Home Care Worker Environmental Services/Custodial Anesthesia Technician
Records Clerk Billing/Accounts Receivable Unit Secretary
19
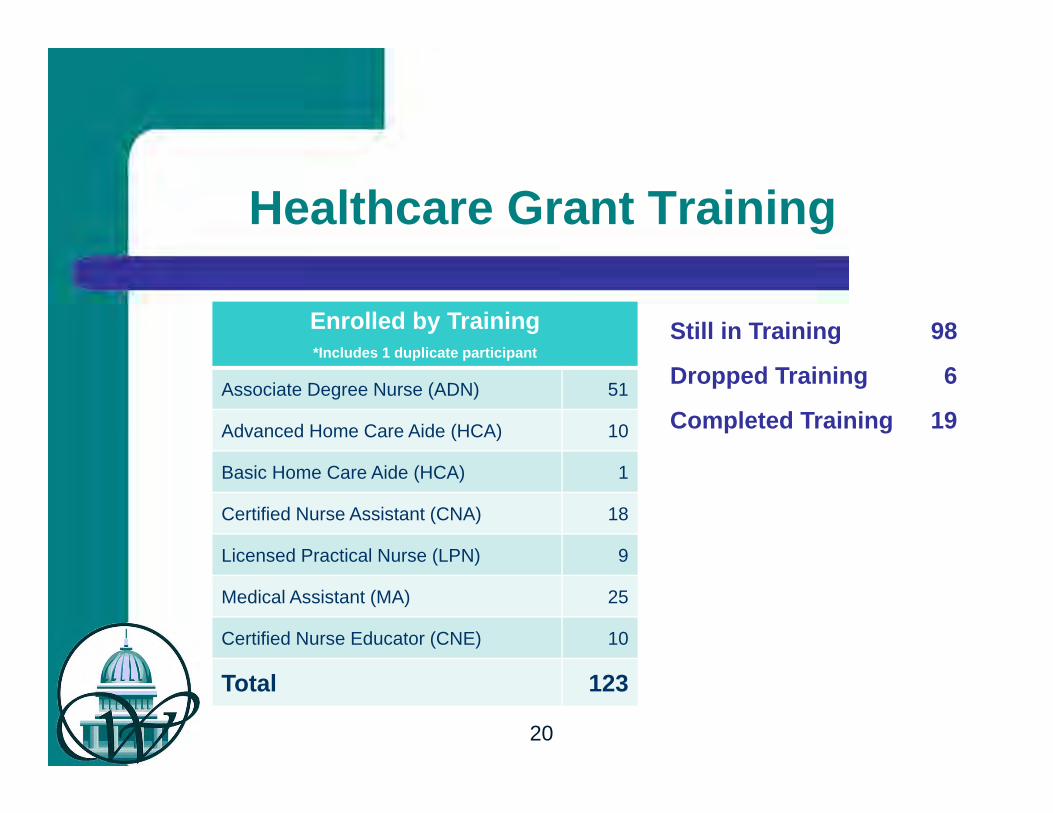
Healthcare Grant Training
Enrolled by Training *Includes 1 duplicate participant
Associate Degree Nurse (ADN) 51
Advanced Home Care Aide (HCA) 10
Basic Home Care Aide (HCA) 1
Certified Nurse Assistant (CNA) 18
Licensed Practical Nurse (LPN) 9
Medical Assistant (MA) 25
Certified Nurse Educator (CNE) 10
Total 123
Still in Training 98
Dropped Training 6
Completed Training 19
20
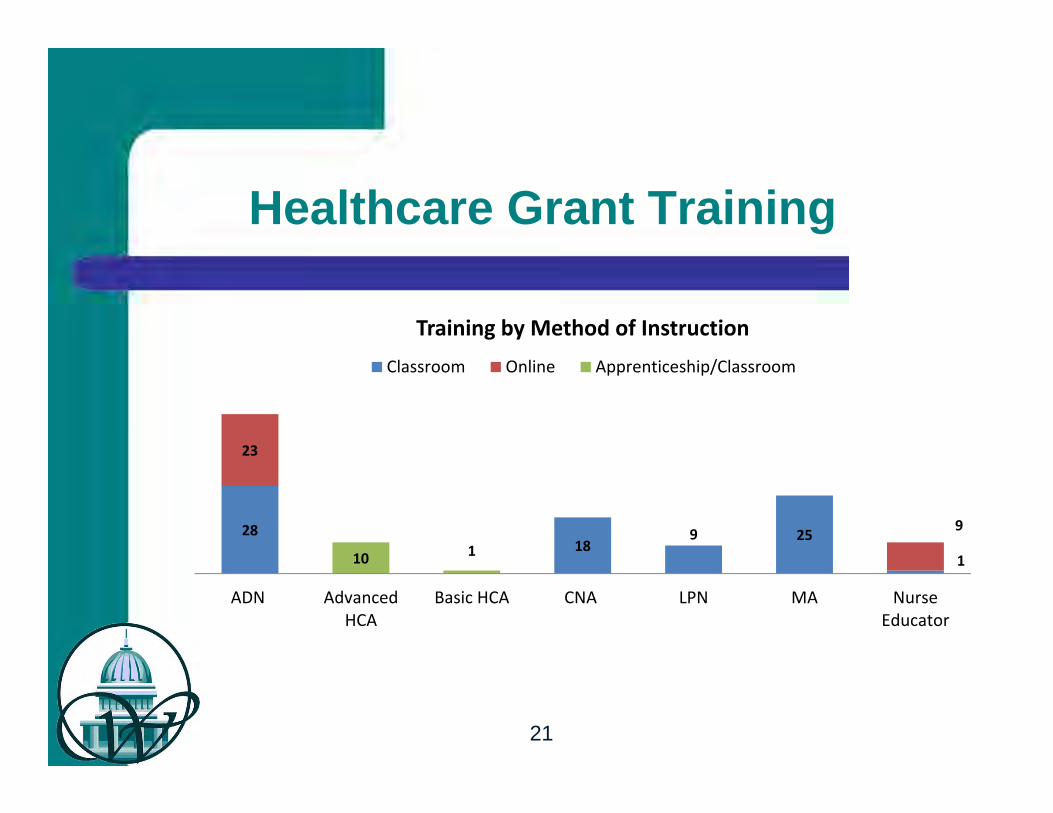
Healthcare Grant Training
2818
9 25
1
23
9
10 1
ADN AdvancedHCA
Basic HCA CNA LPN MA NurseEducator
Training by Method of InstructionClassroom Online Apprenticeship/Classroom
21

Healthcare Grant Credentials
Credentials Earned to DateCNA 12
ADN* 5
Total Credentials 17
22
*Two students who successfully completed ADNs were promoted into nursing positions.

Special Guests
Ed Phippen, Program Director, Health Work Force Institute (affiliate of Washington State Hospital Association)
Pat Ward, Workforce Education Program Administrator, State Board for Community and Technical Colleges
Mary Rosenthal, Executive Director, SEIU Healthcare 1199 NW Multi-Employer Training and Education Fund
Galen Benshoof, Strategic Initiatives Project Coordinator, SEIU Healthcare NW Training Partnership
23

Special Guests
Ed Phippen will present data from the Health Work Force Institute’s 2010 Hospital Work Force Survey
All guests will speak to:– Healthcare workforce capacity building
challenges, successes and grant takeaways.
– Recommended questions for HSHW update.
– Are investments in healthcare workforce training and education still needed?
24

25
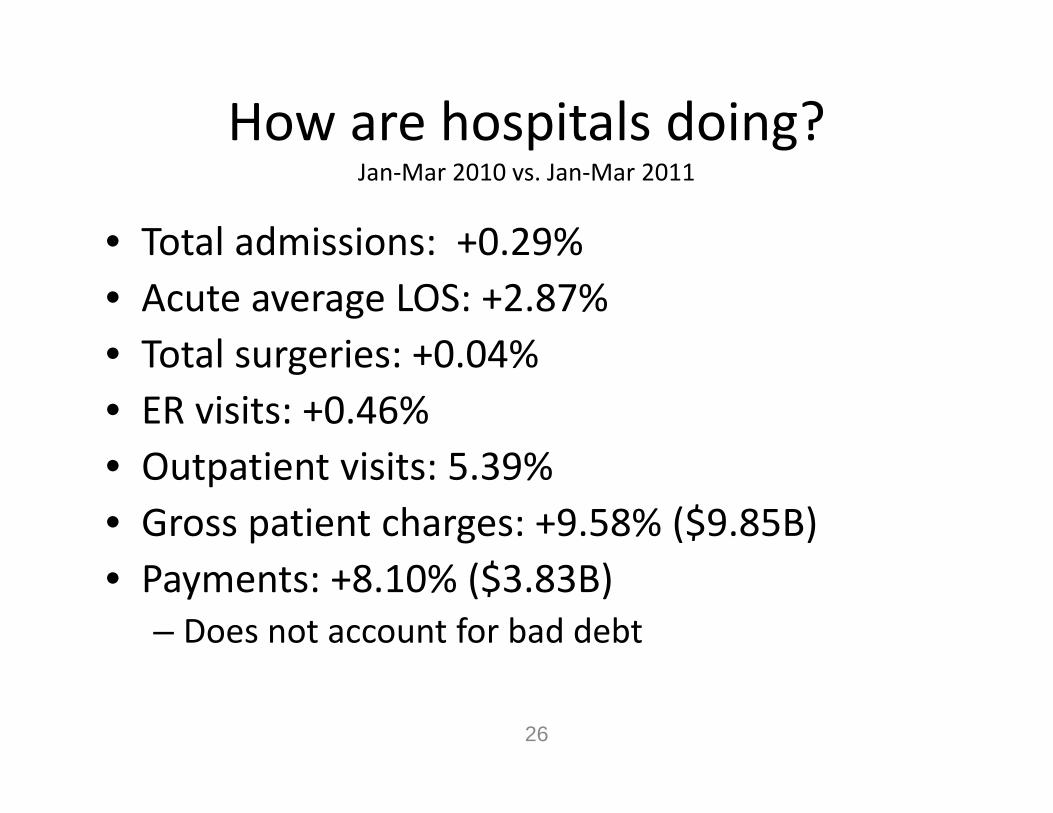
How are hospitals doing?Jan‐Mar 2010 vs. Jan‐Mar 2011
• Total admissions: +0.29%• Acute average LOS: +2.87%• Total surgeries: +0.04%• ER visits: +0.46%• Outpatient visits: 5.39%• Gross patient charges: +9.58% ($9.85B)• Payments: +8.10% ($3.83B)
– Does not account for bad debt
26
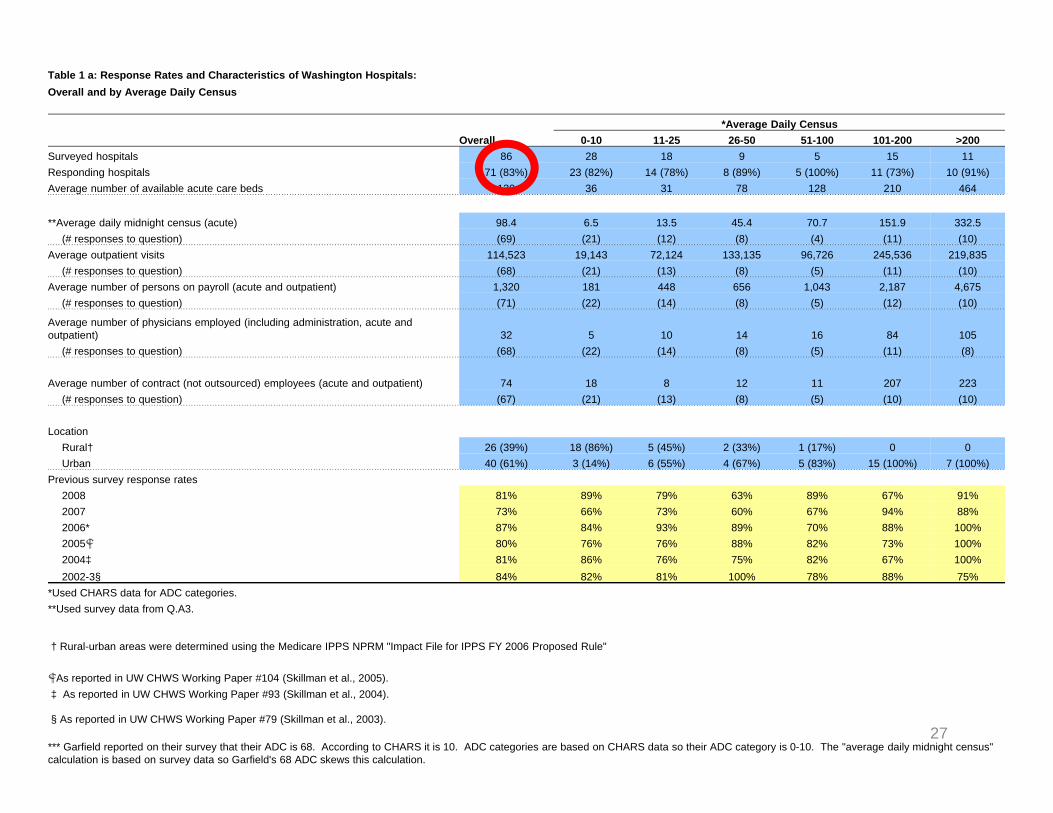
Table 1 a: Response Rates and Characteristics of Washington Hospitals:Overall and by Average Daily Census
*Average Daily CensusOverall 0-10 11-25 26-50 51-100 101-200 >200
Surveyed hospitals 86 28 18 9 5 15 11
Responding hospitals 71 (83%) 23 (82%) 14 (78%) 8 (89%) 5 (100%) 11 (73%) 10 (91%)
Average number of available acute care beds 130 36 31 78 128 210 464
**Average daily midnight census (acute) 98.4 6.5 13.5 45.4 70.7 151.9 332.5
(# responses to question) (69) (21) (12) (8) (4) (11) (10)
Average outpatient visits 114,523 19,143 72,124 133,135 96,726 245,536 219,835
(# responses to question) (68) (21) (13) (8) (5) (11) (10)
Average number of persons on payroll (acute and outpatient) 1,320 181 448 656 1,043 2,187 4,675
(# responses to question) (71) (22) (14) (8) (5) (12) (10)
Average number of physicians employed (including administration, acute and outpatient) 32 5 10 14 16 84 105
(# responses to question) (68) (22) (14) (8) (5) (11) (8)
Average number of contract (not outsourced) employees (acute and outpatient) 74 18 8 12 11 207 223
(# responses to question) (67) (21) (13) (8) (5) (10) (10)
Location
Rural† 26 (39%) 18 (86%) 5 (45%) 2 (33%) 1 (17%) 0 0
Urban 40 (61%) 3 (14%) 6 (55%) 4 (67%) 5 (83%) 15 (100%) 7 (100%)
Previous survey response rates
2008 81% 89% 79% 63% 89% 67% 91%
2007 73% 66% 73% 60% 67% 94% 88%
2006* 87% 84% 93% 89% 70% 88% 100%
2005 80% 76% 76% 88% 82% 73% 100%
2004‡ 81% 86% 76% 75% 82% 67% 100%
2002-3§ 84% 82% 81% 100% 78% 88% 75%
*Used CHARS data for ADC categories.
**Used survey data from Q.A3.
† Rural-urban areas were determined using the Medicare IPPS NPRM "Impact File for IPPS FY 2006 Proposed Rule"
As reported in UW CHWS Working Paper #104 (Skillman et al., 2005).
‡ As reported in UW CHWS Working Paper #93 (Skillman et al., 2004).
§ As reported in UW CHWS Working Paper #79 (Skillman et al., 2003).
*** Garfield reported on their survey that their ADC is 68. According to CHARS it is 10. ADC categories are based on CHARS data so their ADC category is 0-10. The "average daily midnight census" calculation is based on survey data so Garfield's 68 ADC skews this calculation.
27
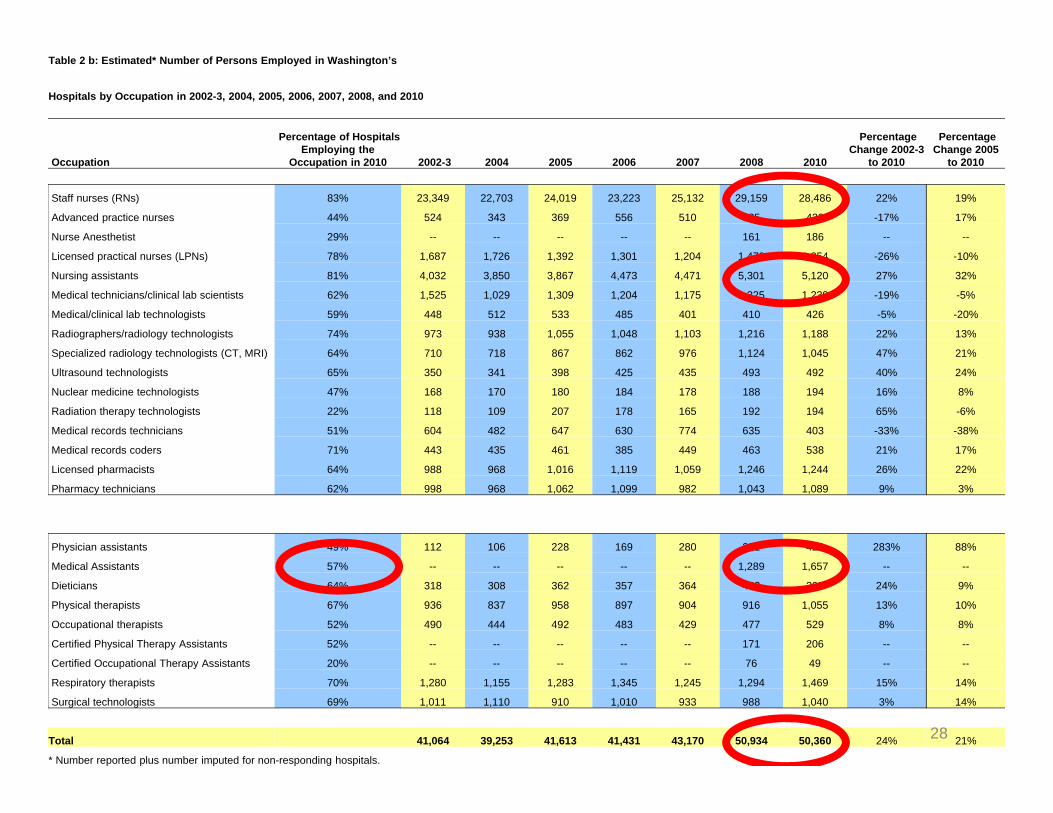
Table 2 b: Estimated* Number of Persons Employed in Washington’s
Hospitals by Occupation in 2002-3, 2004, 2005, 2006, 2007, 2008, and 2010
Occupation
Percentage of Hospitals Employing the
Occupation in 2010 2002-3 2004 2005 2006 2007 2008 2010
Percentage Change 2002-3
to 2010
Percentage Change 2005
to 2010
Staff nurses (RNs) 83% 23,349 22,703 24,019 23,223 25,132 29,159 28,486 22% 19%
Advanced practice nurses 44% 524 343 369 556 510 585 432 -17% 17%
Nurse Anesthetist 29% -- -- -- -- -- 161 186 -- --
Licensed practical nurses (LPNs) 78% 1,687 1,726 1,392 1,301 1,204 1,470 1,254 -26% -10%
Nursing assistants 81% 4,032 3,850 3,867 4,473 4,471 5,301 5,120 27% 32%
Medical technicians/clinical lab scientists 62% 1,525 1,029 1,309 1,204 1,175 1,325 1,239 -19% -5%
Medical/clinical lab technologists 59% 448 512 533 485 401 410 426 -5% -20%
Radiographers/radiology technologists 74% 973 938 1,055 1,048 1,103 1,216 1,188 22% 13%
Specialized radiology technologists (CT, MRI) 64% 710 718 867 862 976 1,124 1,045 47% 21%
Ultrasound technologists 65% 350 341 398 425 435 493 492 40% 24%
Nuclear medicine technologists 47% 168 170 180 184 178 188 194 16% 8%
Radiation therapy technologists 22% 118 109 207 178 165 192 194 65% -6%
Medical records technicians 51% 604 482 647 630 774 635 403 -33% -38%
Medical records coders 71% 443 435 461 385 449 463 538 21% 17%
Licensed pharmacists 64% 988 968 1,016 1,119 1,059 1,246 1,244 26% 22%
Pharmacy technicians 62% 998 968 1,062 1,099 982 1,043 1,089 9% 3%
Physician assistants 49% 112 106 228 169 280 281 429 283% 88%
Medical Assistants 57% -- -- -- -- -- 1,289 1,657 -- --
Dieticians 64% 318 308 362 357 364 432 395 24% 9%
Physical therapists 67% 936 837 958 897 904 916 1,055 13% 10%
Occupational therapists 52% 490 444 492 483 429 477 529 8% 8%
Certified Physical Therapy Assistants 52% -- -- -- -- -- 171 206 -- --
Certified Occupational Therapy Assistants 20% -- -- -- -- -- 76 49 -- --
Respiratory therapists 70% 1,280 1,155 1,283 1,345 1,245 1,294 1,469 15% 14%
Surgical technologists 69% 1,011 1,110 910 1,010 933 988 1,040 3% 14%
Total 41,064 39,253 41,613 41,431 43,170 50,934 50,360 24% 21%
* Number reported plus number imputed for non-responding hospitals.
28
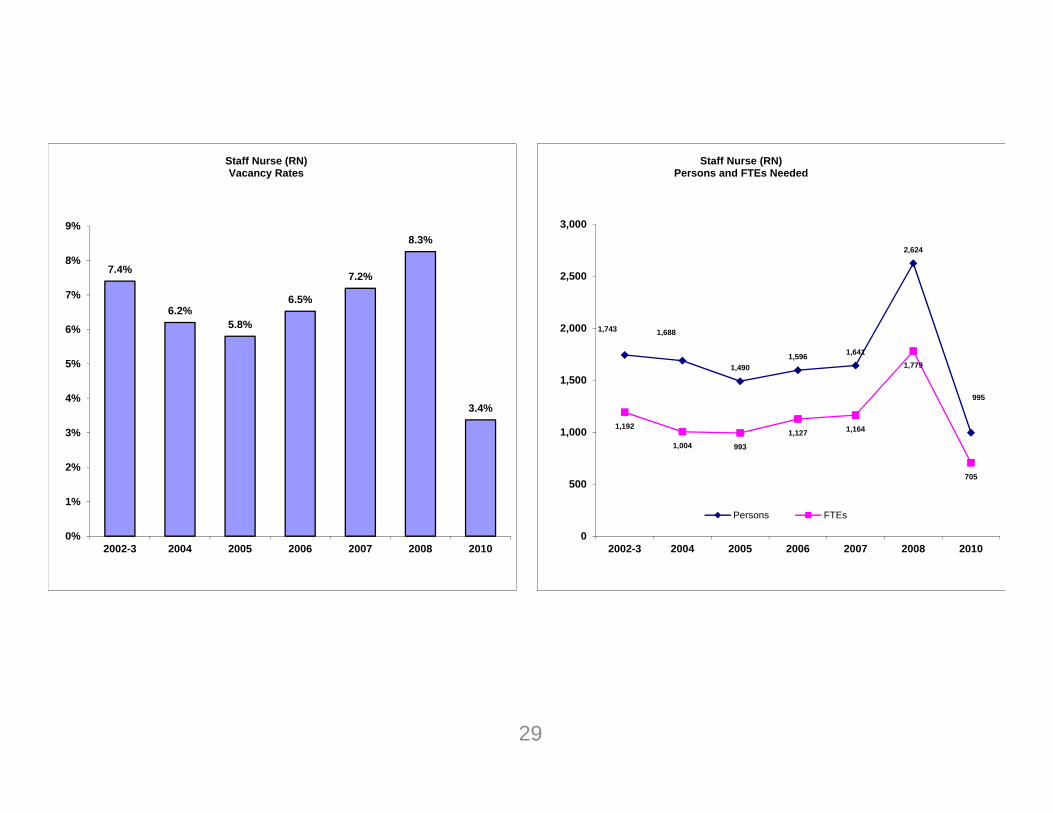
7.4%
6.2%5.8%
6.5%
7.2%
8.3%
3.4%
0%
1%
2%
3%
4%
5%
6%
7%
8%
9%
2002-3 2004 2005 2006 2007 2008 2010
Staff Nurse (RN)Vacancy Rates
1,743 1,688
1,4901,596 1,641
2,624
995
1,192
1,004 993
1,127 1,164
1,779
705
0
500
1,000
1,500
2,000
2,500
3,000
2002-3 2004 2005 2006 2007 2008 2010
Staff Nurse (RN)Persons and FTEs Needed
Persons FTEs
29
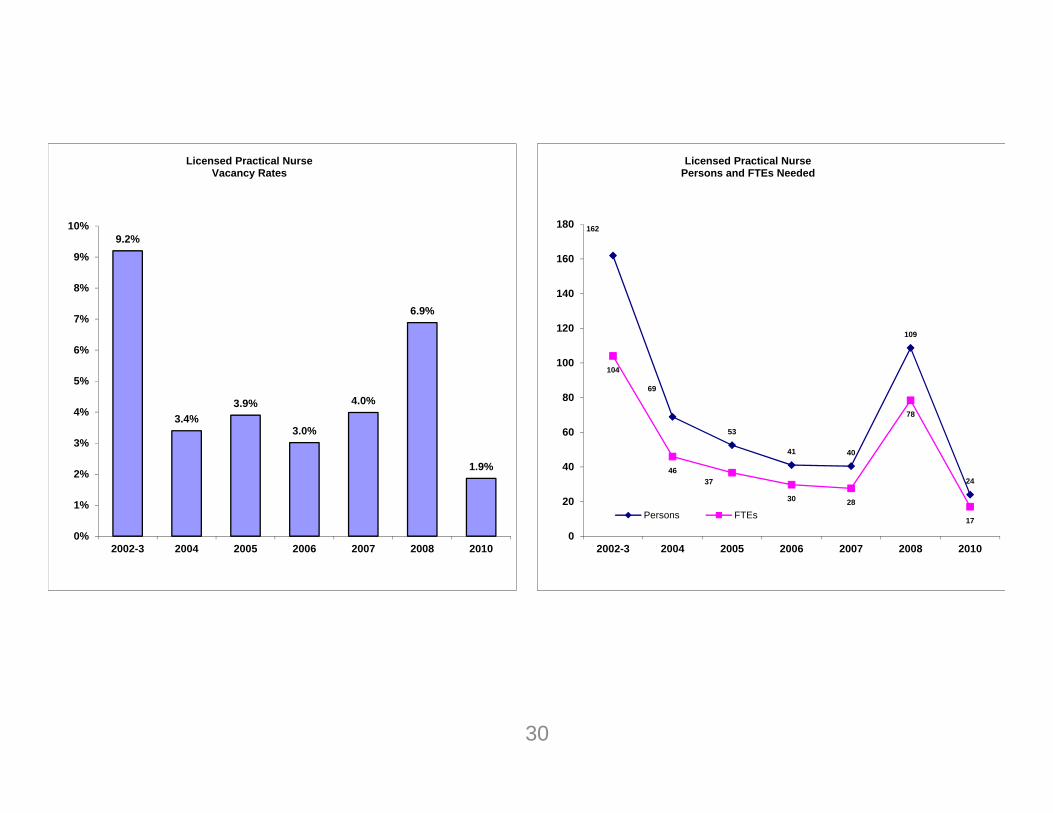
9.2%
3.4%3.9%
3.0%
4.0%
6.9%
1.9%
0%
1%
2%
3%
4%
5%
6%
7%
8%
9%
10%
2002-3 2004 2005 2006 2007 2008 2010
Licensed Practical NurseVacancy Rates
162
69
53
41 40
109
24
104
4637
30 28
78
17
0
20
40
60
80
100
120
140
160
180
2002-3 2004 2005 2006 2007 2008 2010
Licensed Practical NursePersons and FTEs Needed
Persons FTEs
30
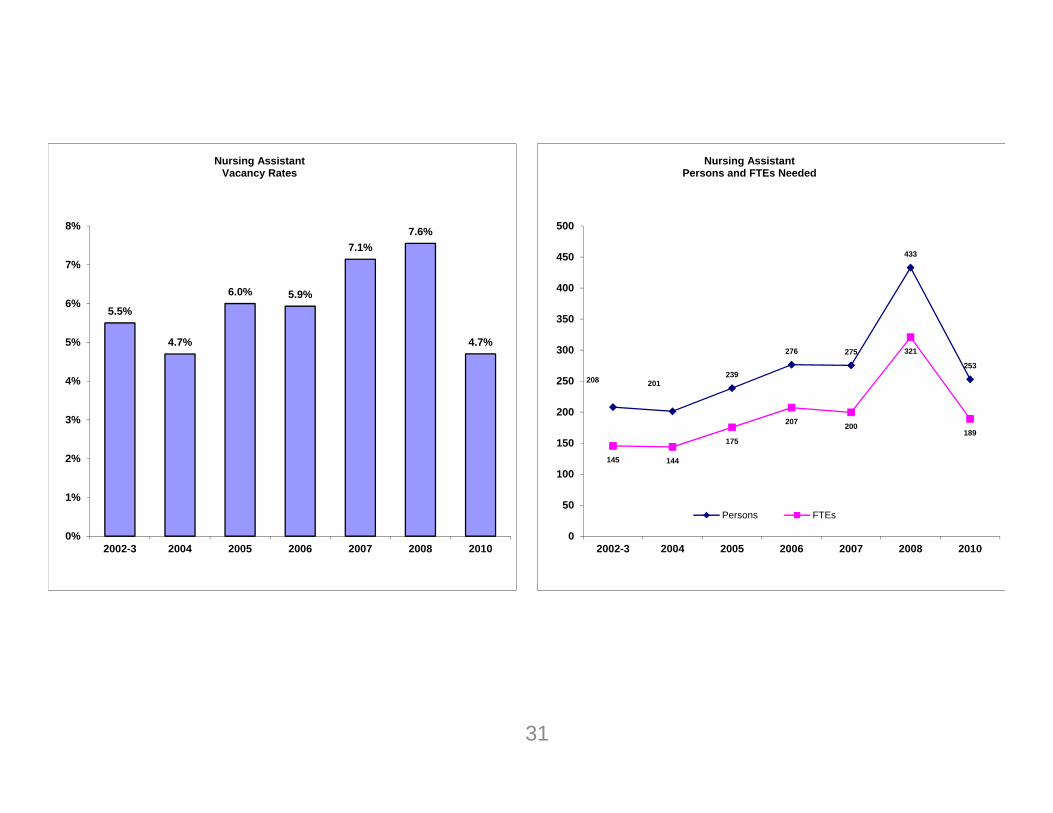
5.5%
4.7%
6.0% 5.9%
7.1%7.6%
4.7%
0%
1%
2%
3%
4%
5%
6%
7%
8%
2002-3 2004 2005 2006 2007 2008 2010
Nursing AssistantVacancy Rates
208 201239
276 275
433
253
145 144
175
207 200
321
189
0
50
100
150
200
250
300
350
400
450
500
2002-3 2004 2005 2006 2007 2008 2010
Nursing AssistantPersons and FTEs Needed
Persons FTEs
31
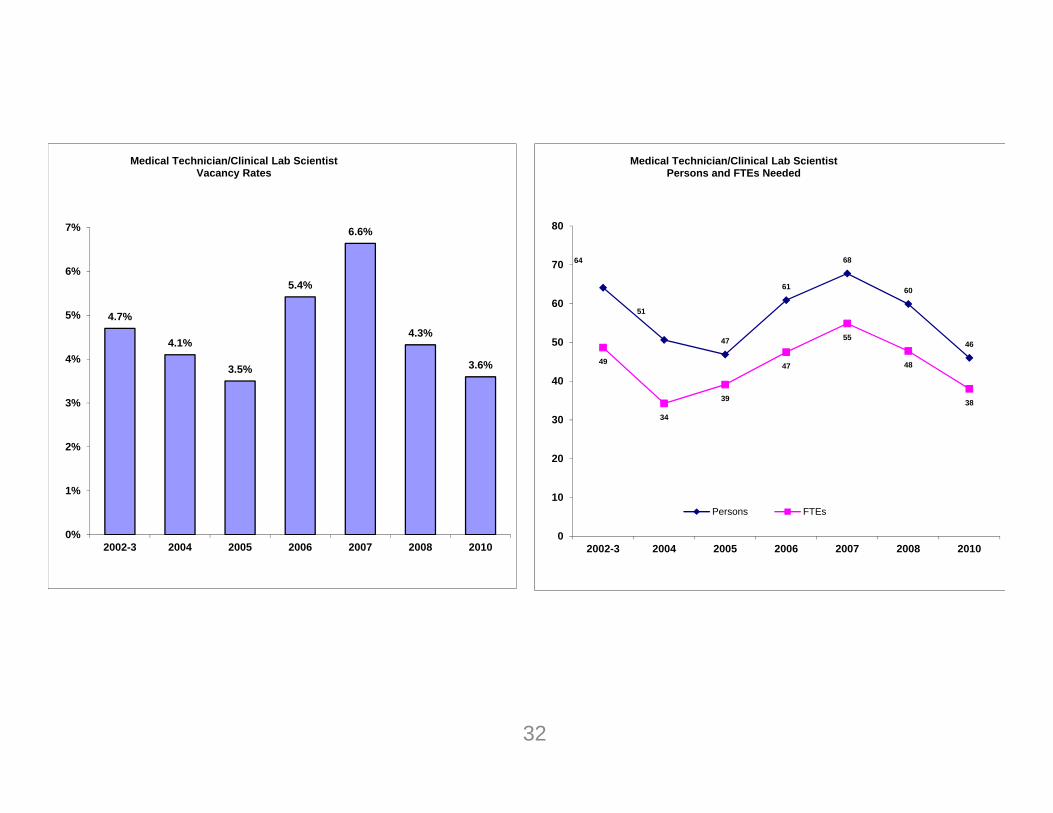
4.7%
4.1%
3.5%
5.4%
6.6%
4.3%
3.6%
0%
1%
2%
3%
4%
5%
6%
7%
2002-3 2004 2005 2006 2007 2008 2010
Medical Technician/Clinical Lab ScientistVacancy Rates
64
51
47
61
68
60
46
49
34
39
47
55
48
38
0
10
20
30
40
50
60
70
80
2002-3 2004 2005 2006 2007 2008 2010
Medical Technician/Clinical Lab ScientistPersons and FTEs Needed
Persons FTEs
32
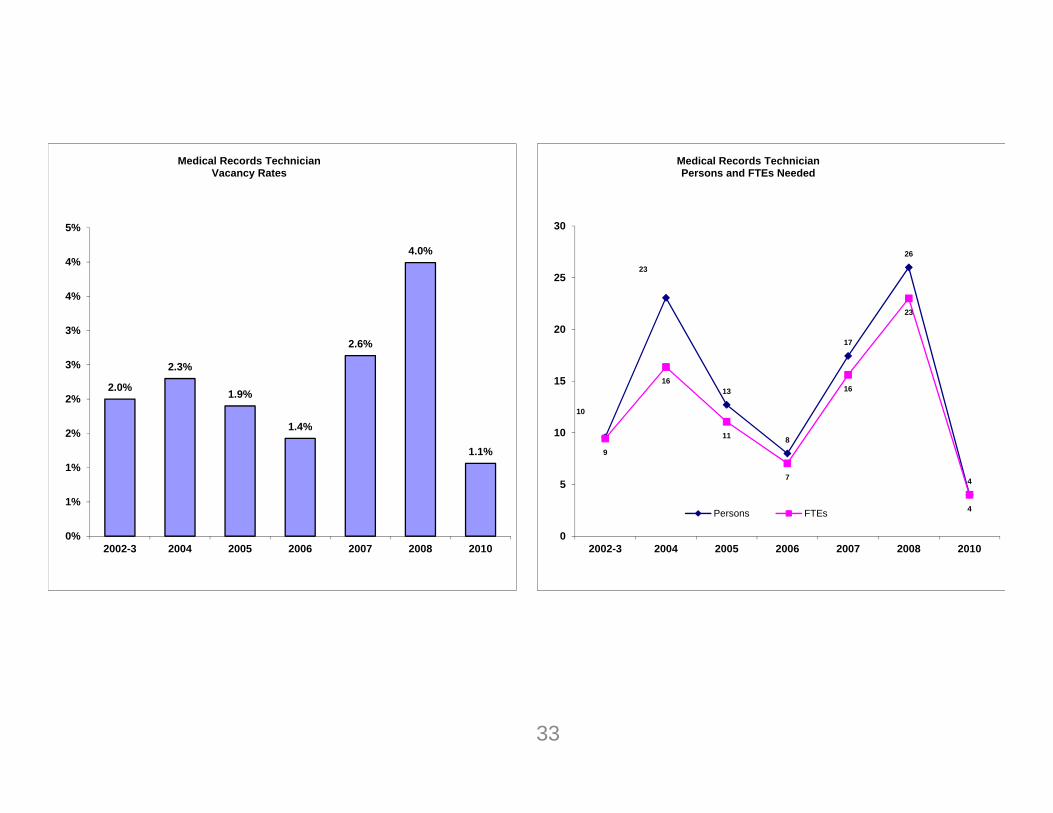
2.0%
2.3%
1.9%
1.4%
2.6%
4.0%
1.1%
0%
1%
1%
2%
2%
3%
3%
4%
4%
5%
2002-3 2004 2005 2006 2007 2008 2010
Medical Records TechnicianVacancy Rates
10
23
13
8
17
26
4
9
16
11
7
16
23
4
0
5
10
15
20
25
30
2002-3 2004 2005 2006 2007 2008 2010
Medical Records TechnicianPersons and FTEs Needed
Persons FTEs
33
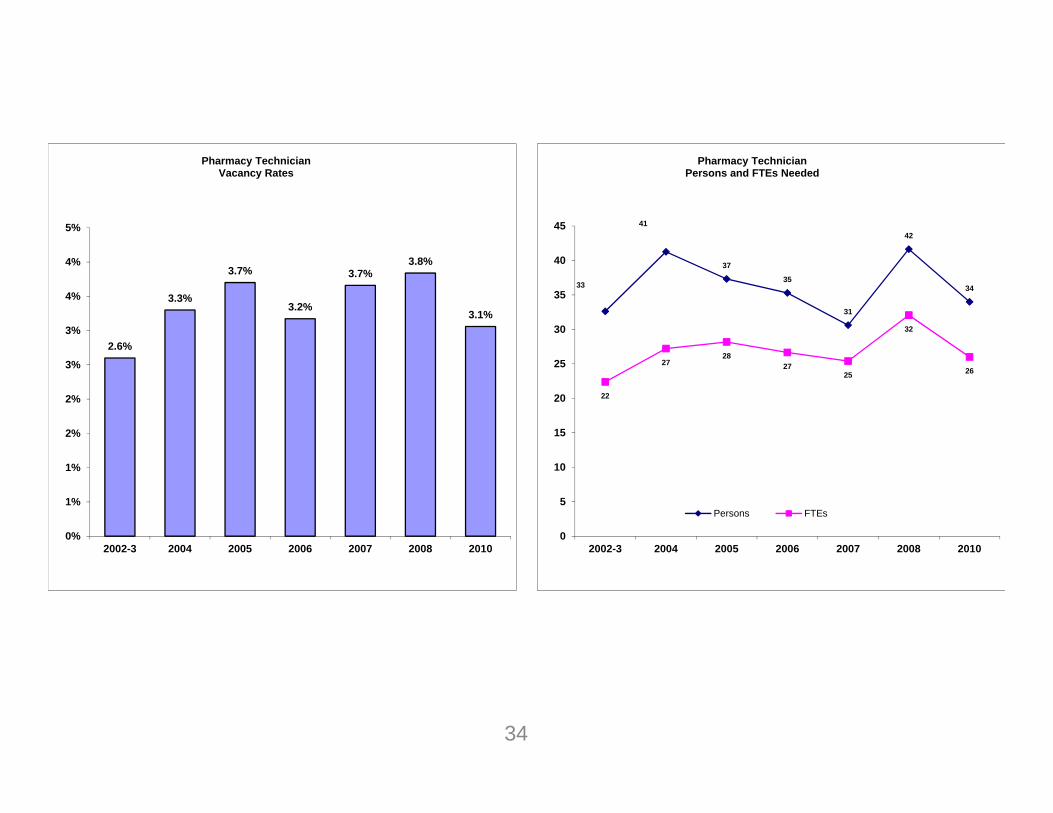
2.6%
3.3%
3.7%
3.2%
3.7%3.8%
3.1%
0%
1%
1%
2%
2%
3%
3%
4%
4%
5%
2002-3 2004 2005 2006 2007 2008 2010
Pharmacy TechnicianVacancy Rates
33
41
37
35
31
42
34
22
2728
2725
32
26
0
5
10
15
20
25
30
35
40
45
2002-3 2004 2005 2006 2007 2008 2010
Pharmacy TechnicianPersons and FTEs Needed
Persons FTEs
34
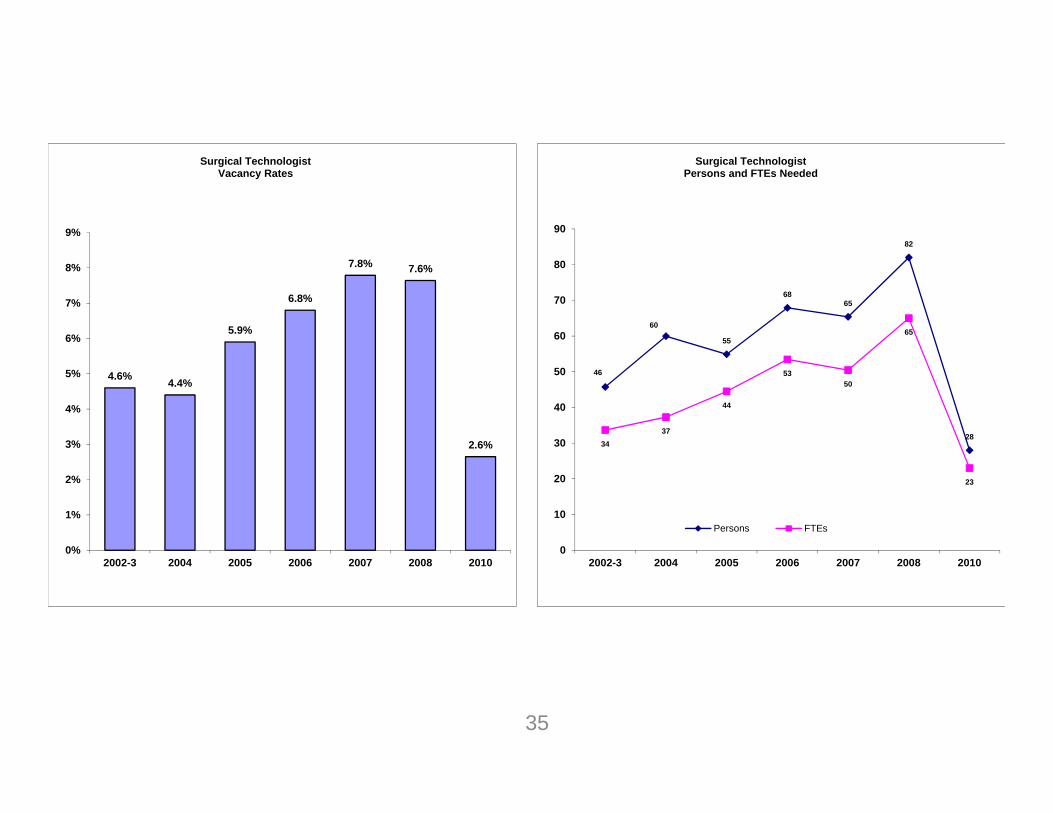
4.6% 4.4%
5.9%
6.8%
7.8% 7.6%
2.6%
0%
1%
2%
3%
4%
5%
6%
7%
8%
9%
2002-3 2004 2005 2006 2007 2008 2010
Surgical TechnologistVacancy Rates
46
60
55
6865
82
2834
37
44
5350
65
23
0
10
20
30
40
50
60
70
80
90
2002-3 2004 2005 2006 2007 2008 2010
Surgical TechnologistPersons and FTEs Needed
Persons FTEs
35
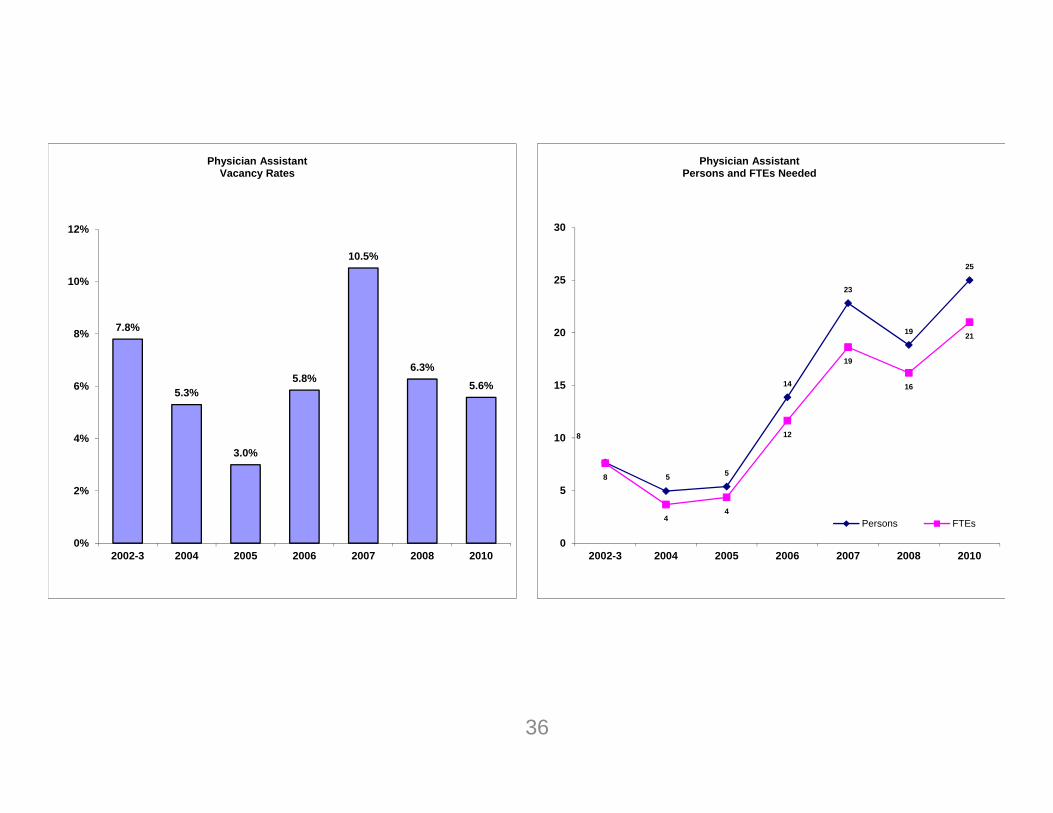
7.8%
5.3%
3.0%
5.8%
10.5%
6.3%5.6%
0%
2%
4%
6%
8%
10%
12%
2002-3 2004 2005 2006 2007 2008 2010
Physician AssistantVacancy Rates
8
5 5
14
23
19
25
8
44
12
19
16
21
0
5
10
15
20
25
30
2002-3 2004 2005 2006 2007 2008 2010
Physician AssistantPersons and FTEs Needed
Persons FTEs
36
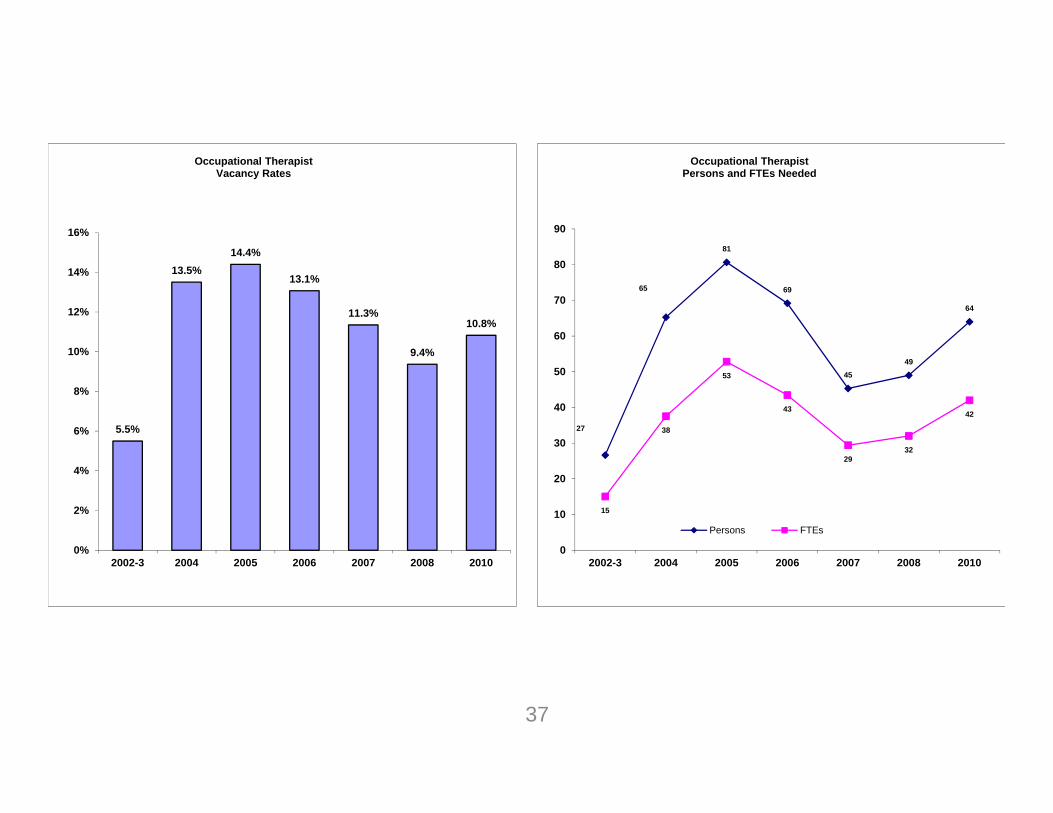
5.5%
13.5%14.4%
13.1%
11.3%
9.4%
10.8%
0%
2%
4%
6%
8%
10%
12%
14%
16%
2002-3 2004 2005 2006 2007 2008 2010
Occupational TherapistVacancy Rates
27
65
81
69
4549
64
15
38
53
43
2932
42
0
10
20
30
40
50
60
70
80
90
2002-3 2004 2005 2006 2007 2008 2010
Occupational TherapistPersons and FTEs Needed
Persons FTEs
37

8.0%
11.7%11.1%
13.0%
9.5%
12.9%
10.5%
0%
2%
4%
6%
8%
10%
12%
14%
2002-3 2004 2005 2006 2007 2008 2010
Physical TherapistVacancy Rates
81
123126
138
76
136
123
49
74
8790
51
88
79
0
20
40
60
80
100
120
140
160
2002-3 2004 2005 2006 2007 2008 2010
Physical TherapistPersons and FTEs Needed
Persons FTEs
38

0.0% 0.0% 0.0% 0.0% 0.0%
12.0%
16.8%
0%
2%
4%
6%
8%
10%
12%
14%
16%
18%
2002-3 2004 2005 2006 2007 2008 2010
Certified Occupational therapy assistantsVacancy Rates
0 0
0 0
9
10
7 7
0
2
4
6
8
10
12
2002-3 2004 2005 2006 2007 2008 2010
Certified Occupational therapy assistantsPersons and FTEs Needed
Persons FTEs
39
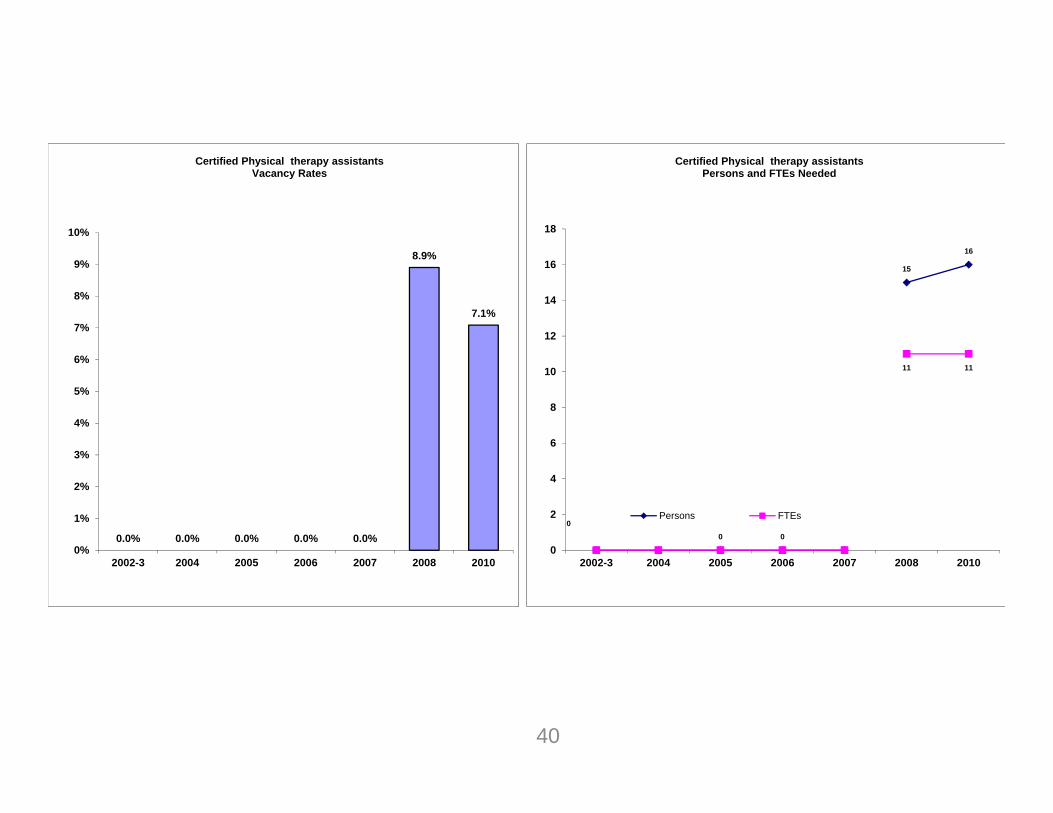
0.0% 0.0% 0.0% 0.0% 0.0%
8.9%
7.1%
0%
1%
2%
3%
4%
5%
6%
7%
8%
9%
10%
2002-3 2004 2005 2006 2007 2008 2010
Certified Physical therapy assistantsVacancy Rates
0 0
0 0
15
16
11 11
0
2
4
6
8
10
12
14
16
18
2002-3 2004 2005 2006 2007 2008 2010
Certified Physical therapy assistantsPersons and FTEs Needed
Persons FTEs
40

Questions??
Ed PhippenProgram DirectorHealth Work Force Institute(206) 216‐[email protected]
http://www.hwfi.org/page.cfm?ID=publications
41
Health Care Workforce andEducational CapacityWorkforce Training and Education Coordinating BoardNovember 14, 2011
42
Challenges
Capacity Building
• Clinical placement sites.
• Qualified faculty for nursing programs.
• Decreased funding.
43
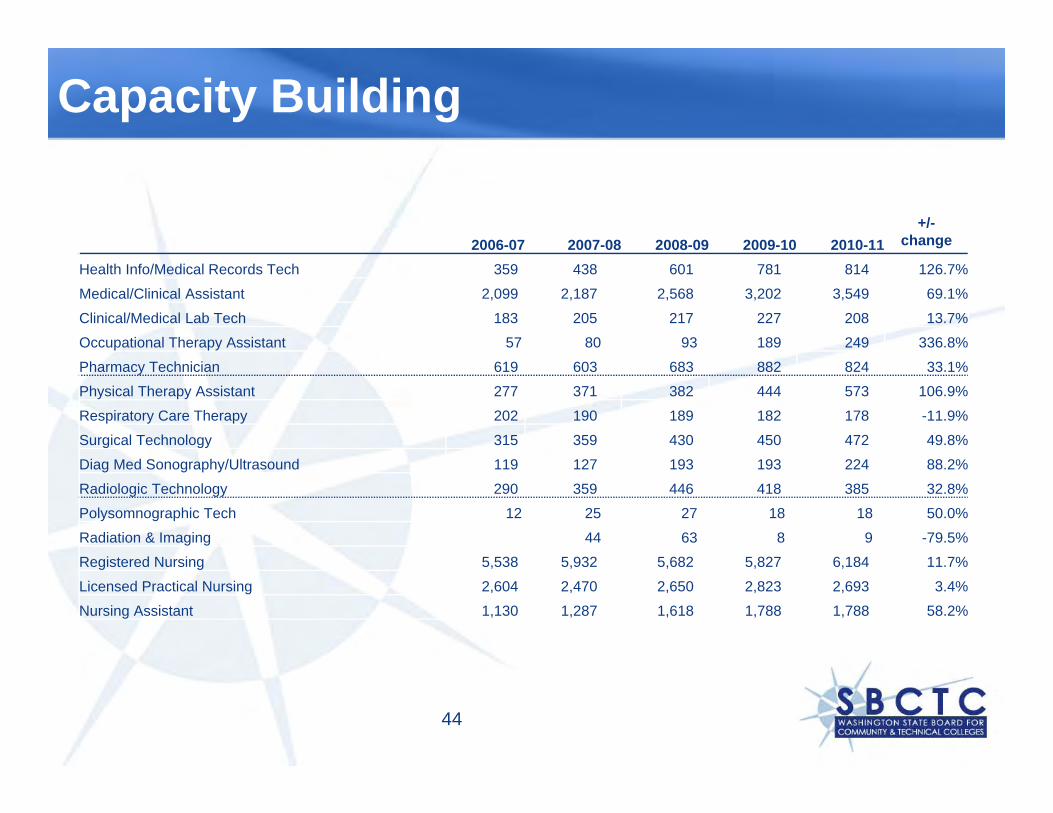
Capacity Building
2006-07 2007-08 2008-09 2009-10 2010-11+/-
change
Health Info/Medical Records Tech 359 438 601 781 814 126.7%
Medical/Clinical Assistant 2,099 2,187 2,568 3,202 3,549 69.1%
Clinical/Medical Lab Tech 183 205 217 227 208 13.7%
Occupational Therapy Assistant 57 80 93 189 249 336.8%
Pharmacy Technician 619 603 683 882 824 33.1%
Physical Therapy Assistant 277 371 382 444 573 106.9%
Respiratory Care Therapy 202 190 189 182 178 -11.9%
Surgical Technology 315 359 430 450 472 49.8%
Diag Med Sonography/Ultrasound 119 127 193 193 224 88.2%
Radiologic Technology 290 359 446 418 385 32.8%
Polysomnographic Tech 12 25 27 18 18 50.0%
Radiation & Imaging 44 63 8 9 -79.5%
Registered Nursing 5,538 5,932 5,682 5,827 6,184 11.7%
Licensed Practical Nursing 2,604 2,470 2,650 2,823 2,693 3.4%
Nursing Assistant 1,130 1,287 1,618 1,788 1,788 58.2%
44
Successes
Capacity Building
• Pathways– Common pre-requisites in nursing
programs through the AAS-T
– LPN to RN bridge programs
– Applied baccalaureate programs
45

Successes
Capacity Building
• I-BEST programs
• Online and hybrid programs
• Collaborative programs
• Successful partnerships with industry
46

Recommended questions for update
High Skills, High Wages
• With the continued economic decline in the state, how do we fund health care programs to ensure we meet the demand for trained health care workers?
47

Do we still need to invest in health care workforce education?
Investment?
ABSOLUTELY!
48
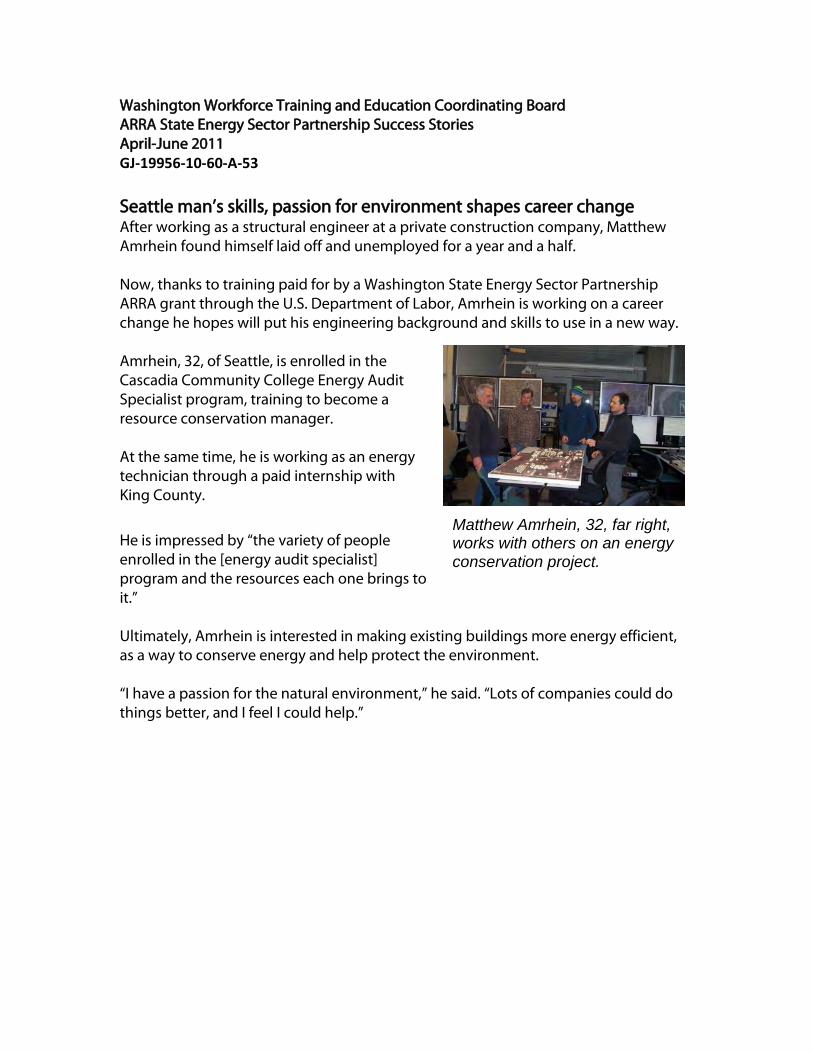
Matthew Amrhein, 32, far right, works with others on an energy conservation project.
Washington Workforce Training and Education Coordinating Board ARRA State Energy Sector Partnership Success Stories April-June 2011 GJ-19956-10-60-A-53 Seattle man’s skills, passion for environment shapes career change After working as a structural engineer at a private construction company, Matthew Amrhein found himself laid off and unemployed for a year and a half. Now, thanks to training paid for by a Washington State Energy Sector Partnership ARRA grant through the U.S. Department of Labor, Amrhein is working on a career change he hopes will put his engineering background and skills to use in a new way. Amrhein, 32, of Seattle, is enrolled in the Cascadia Community College Energy Audit Specialist program, training to become a resource conservation manager. At the same time, he is working as an energy technician through a paid internship with King County.
He is impressed by “the variety of people enrolled in the [energy audit specialist] program and the resources each one brings to it.” Ultimately, Amrhein is interested in making existing buildings more energy efficient, as a way to conserve energy and help protect the environment. “I have a passion for the natural environment,” he said. “Lots of companies could do things better, and I feel I could help.”
“I feel so lucky to have found this program.” Jeff Carter, 45, of Everett.
Everett man lands job after learning new skills When the construction industry hit the skids as part of the recent recession, Jeff Carter’s income went down with it. Carter, 45, was self-employed doing residential thermal imaging for energy-rating homes.
He needed training to update his skills in energy efficiency and renewable energy to enhance his marketability. Through a Washington State Energy Sector Partnership ARRA grant from the U.S. Department of Labor, Carter earned a Level 1 Commercial Energy Audit certificate at South Seattle Community College. This helped expand his skill set in the commercial side of the construction industry. He’s since found a job using skills he learned. “I feel so lucky to have found this program,” said the Everett, Wash., father of two. “I can’t believe all the help I’m getting besides the class.”
Carter added, “Since I’ve started this job, I have learned so much. They have me in all these meetings so that I know what direction the company is going. I really enjoy this job and I am so thankful for the help.” Recent immigrant moves from custodian to building engineer Ronald Corporal moved from the Philippines to the Seattle area in 2000, in search of a job that could help support him and his growing family. There were some lonely moments for Corporal, 47, who lived for a while in a small apartment with no furniture, while sending money he earned back home to his wife and three children.
Although he had trained for two years in the engineering field in the Philippines, he started work as a caretaker, then found a job as a custodian at a nearby community college. Soon after, he took a second job as a maintenance man at a senior center.
Three years later, in 2003, Corporal was finally able to bring his wife and children to the U.S. His wife was anxious about speaking English and didn’t drive. Eventually, she gained a driver’s license and became a nurse’s aide. The couple had to adjust their schedules to accommodate the arrival of their fourth child, who is now three years old.
In 2009, Corporal started a training program at Renton Technical College using a Washington State Energy Sector Partnership ARRA grant from the U.S. Department of Labor. He expects to graduate as a Building Engineer in the spring of 2013. In February of 2011, Corporal noticed a job posting for a utility technician job. He landed the job and now earns $15.50 an hour. “The program has really helped me a lot,” said Corporal, “because this is what I want to do for the rest of my life, to be a Building Engineer…I am very grateful for the opportunity that I have to be in this program, and for the opportunity it gives me and my family for the future.”