Embed Size (px)
Citation preview
Monthly Summary Report
Insert Project Image…to be created by Barb
Direct questions about this report to:
360.902.0802
July 2017 - July 2018
Washington State Targeted
Response to the Opioid Crisis
Hub and Spoke Monthly Summary Report
Opioid Crisis
WASHINGTON
TARGETED
RESPONSE
Get
ty Im
age
s/iS
tock
STATE
1DSHS | Research and Data Analysis Division
August 15, 2018
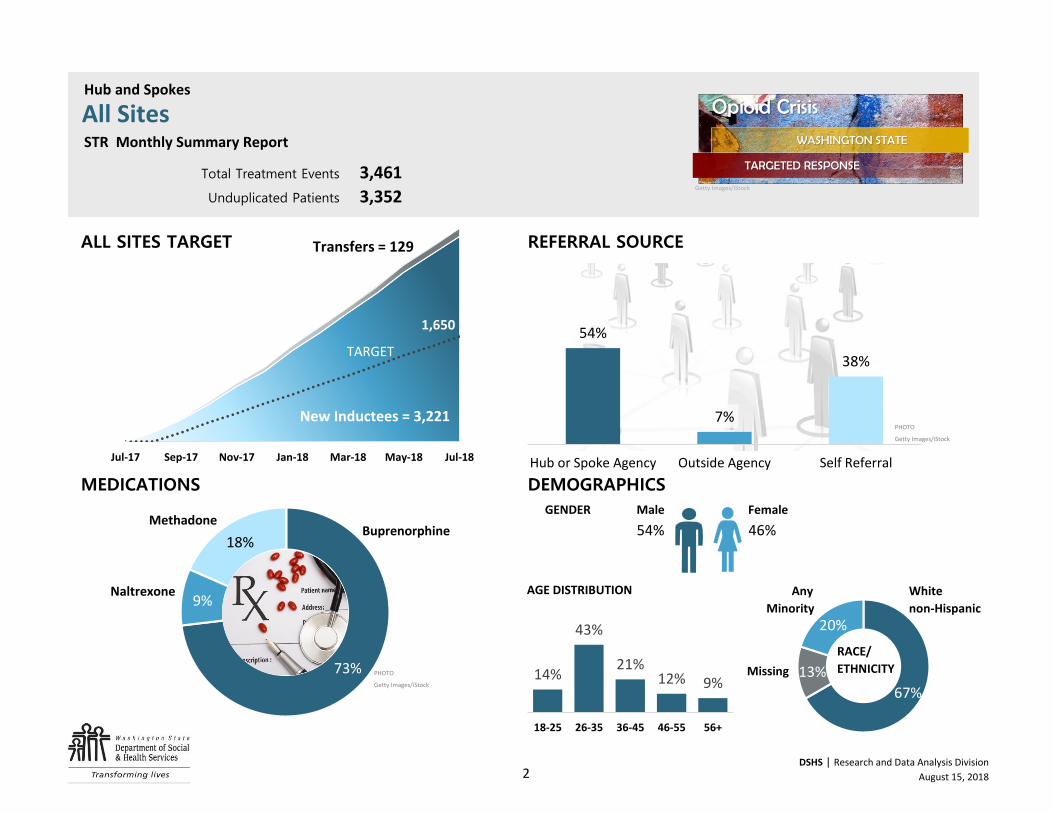
3,461
3,352
Transfers = 129
PHOTO
Getty Images/iStock
GENDER Male Female
54% 46%
PHOTO
Getty Images/iStock
Naltrexone
Hub and Spokes
All Sites STR Monthly Summary Report
Total Treatment Events
Unduplicated Patients
White
non-Hispanic
ALL SITES TARGET
MEDICATIONS
MethadoneBuprenorphine
RACE/
ETHNICITYMissing
Any
Minority
REFERRAL SOURCE
DEMOGRAPHICS
AGE DISTRIBUTION
18-25 26-35 36-45 46-55 56+
18%
73%
9%
54%
7%
38%
Hub or Spoke Agency Outside Agency Self Referral
1,650
Jul-17 Sep-17 Nov-17 Jan-18 Mar-18 May-18 Jul-18
14%
43%
21%12% 9%
18-25 26-35 36-45 46-55 56+
67%
13%
20%
Opioid Crisis
WASHINGTON STATE
TARGETED RESPONSE
Getty Images/iStock
New Inductees = 3,221
TARGET
Transfers = 129
2DSHS | Research and Data Analysis Division
August 15, 2018
NUMBER PERCENT NUMBER PERCENT NUMBER PERCENT NUMBER PERCENT NUMBER PERCENT NUMBER PERCENT NUMBER PERCENT
3,461 100% 831 100% 393 100% 307 100% 862 100% 529 100% 539 100%
3,352 100% 790 100% 373 100% 301 100% 831 100% 528 100% 529 100%
3,221 96% 751 95% 371 99% 293 97% 772 93% 509 96% 525 100%
129 4% 39 5% 2 1% 8 3% 59 7% 19 4% 2 0%
486 14% 130 16% 39 10% 41 14% 115 14% 95 18% 66 12%
1,450 43% 353 45% 117 31% 132 44% 358 43% 259 49% 231 44%
705 21% 158 20% 94 25% 72 24% 176 21% 96 18% 109 21%
394 12% 86 11% 62 17% 29 10% 109 13% 48 9% 60 11%
302 9% 62 8% 61 16% 23 8% 67 8% 29 5% 60 11%
11 0% 0 0% 0 0% 2 1% 6 1% 0 0% 3 1%
1,811 54% 438 55% 228 61% 146 49% 425 51% 271 51% 303 57%
1,527 46% 351 44% 141 38% 154 51% 405 49% 253 48% 223 42%
5 0% 0 0% 3 1% 1 0% 0 0% 1 0% 0 0%
2 0% 1 0% 1 0% 0 0% 0 0% 0 0% 0 0%
5 0% 0 0% 0 0% 0 0% 0 0% 2 0% 3 0%
2,245 67% 528 67% 259 69% 260 86% 516 62% 312 59% 370 70%
678 20% 154 19% 110 29% 28 9% 158 19% 99 19% 129 24%
429 13% 108 14% 4 1% 13 4% 157 19% 117 22% 30 6%
620 18% 137 17% 0 0% 155 51% 328 39% 0 0% 0 0%
2,435 73% 616 78% 369 99% 126 42% 368 44% 448 85% 508 96%
292 9% 37 5% 4 1% 20 7% 135 16% 80 15% 16 3%
1,813 54% 735 93% 275 74% 111 37% 157 20% 72 14% 463 88%
229 7% 11 1% 12 3% 10 3% 134 17% 46 9% 16 3%
1,277 38% 44 6% 86 23% 180 60% 510 64% 410 78% 47 9%
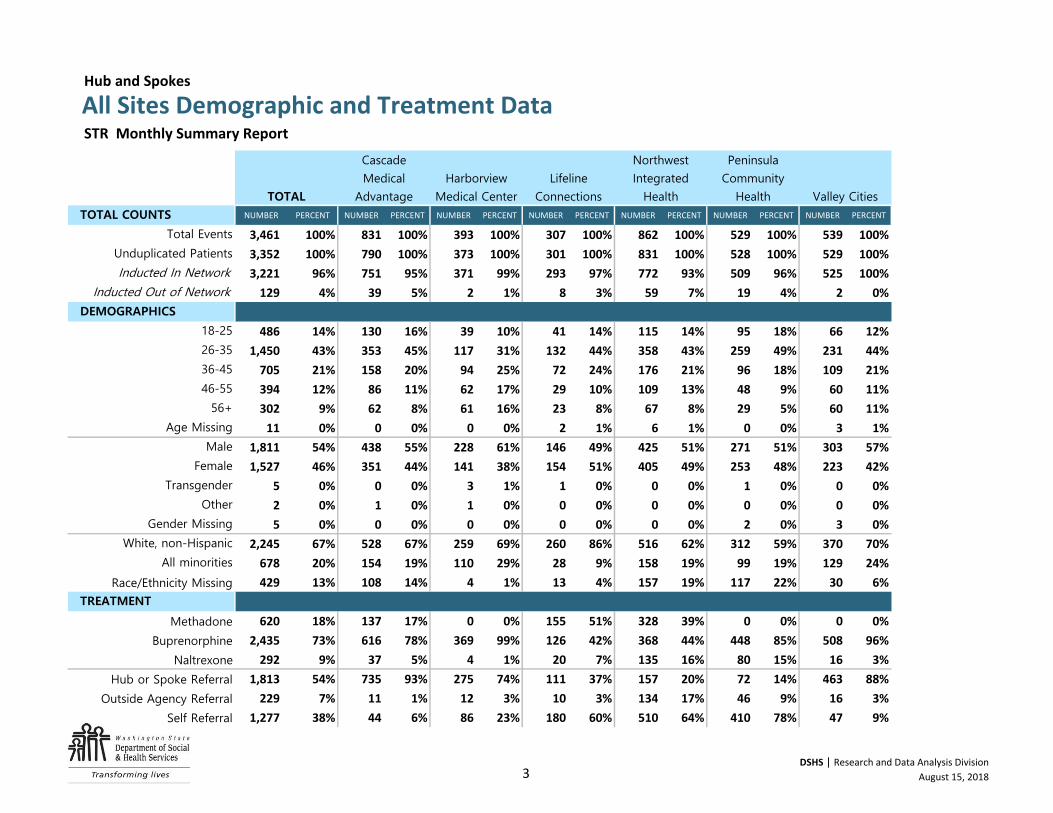
All minorities
Race/Ethnicity Missing
TREATMENT
Methadone
Buprenorphine
Naltrexone
Hub or Spoke Referral
Outside Agency Referral
Self Referral
46-55
56+
Age Missing
Male
Female
Transgender
Other
Gender Missing
White, non-Hispanic
TOTAL COUNTS
Total Events
Unduplicated Patients
Inducted In Network
Inducted Out of Network
DEMOGRAPHICS
18-25
26-35
36-45
Hub and Spokes
STR Monthly Summary Report
TOTAL
Cascade
Medical
Advantage
Harborview
Medical Center
Lifeline
Connections
Northwest
Integrated
Health
Peninsula
Community
Health Valley Cities
All Sites Demographic and Treatment Data
3DSHS | Research and Data Analysis Division
August 15, 2018
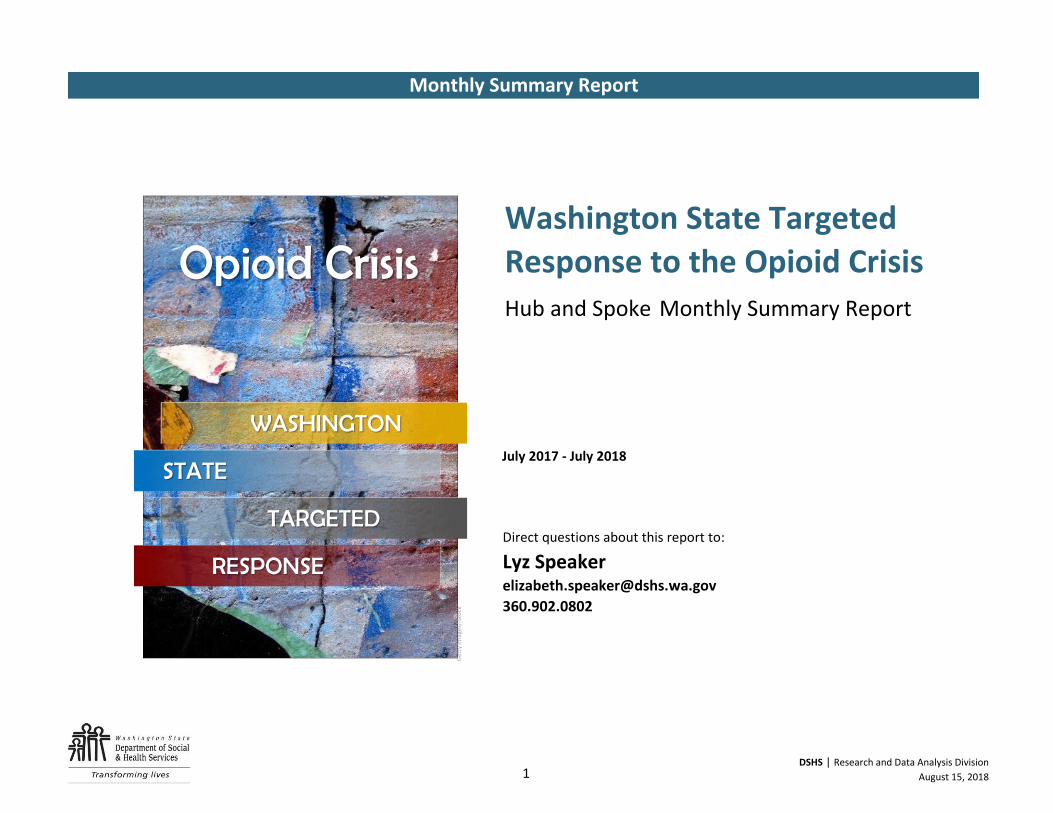
MONTHLY CUMUL MONTHLY CUMUL MONTHLY CUMUL MONTHLY CUMUL MONTHLY CUMUL MONTHLY CUMUL MONTHLY CUMUL
7 7 0 0 1 1 3 3 0 0 3 3 0 0
142 149 33 33 10 11 17 20 39 39 37 40 6 6
206 355 36 69 18 29 11 31 47 86 43 83 51 57
237 592 47 116 21 50 16 47 45 131 43 126 65 122
271 863 31 147 32 82 17 64 69 200 45 171 77 199
242 1105 37 184 34 116 20 84 49 249 38 209 64 263
329 1,434 73 257 44 160 19 103 59 308 57 266 77 340
291 1,725 89 346 41 201 29 132 56 364 41 307 35 375
300 2,025 75 421 36 237 31 163 85 449 30 337 43 418
309 2,334 77 498 30 267 28 191 84 533 46 383 44 462
334 2,668 93 591 45 312 37 228 89 622 47 430 23 485
272 2,940 77 668 29 341 25 253 79 701 48 478 14 499
281 3,221 83 751 30 371 40 293 71 772 31 509 26 525
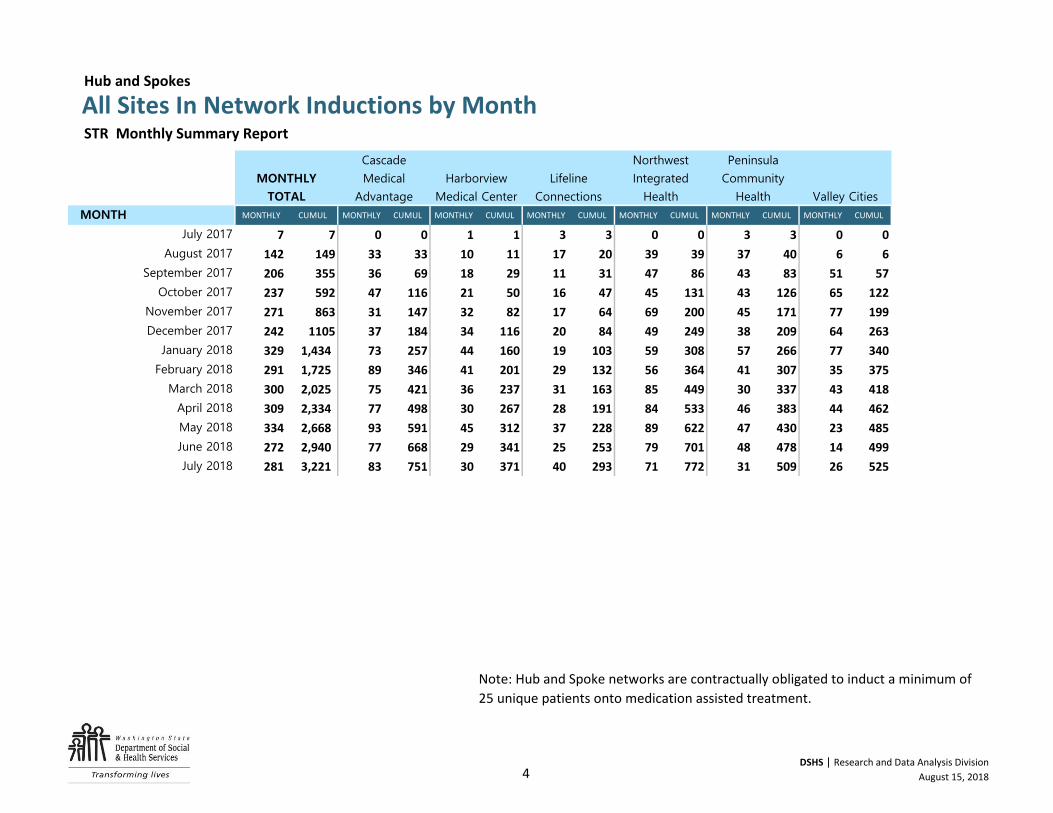
Note: Hub and Spoke networks are contractually obligated to induct a minimum of
25 unique patients onto medication assisted treatment.
MONTH
July 2017
August 2017
September 2017
October 2017
November 2017
December 2017
January 2018
Hub and Spokes
All Sites In Network Inductions by Month
February 2018
March 2018
April 2018
May 2018
June 2018
July 2018
STR Monthly Summary Report
MONTHLY
TOTAL
Cascade
Medical
Advantage
Harborview
Medical Center
Lifeline
Connections
Northwest
Integrated
Health
Peninsula
Community
Health Valley Cities
4DSHS | Research and Data Analysis Division
August 15, 2018
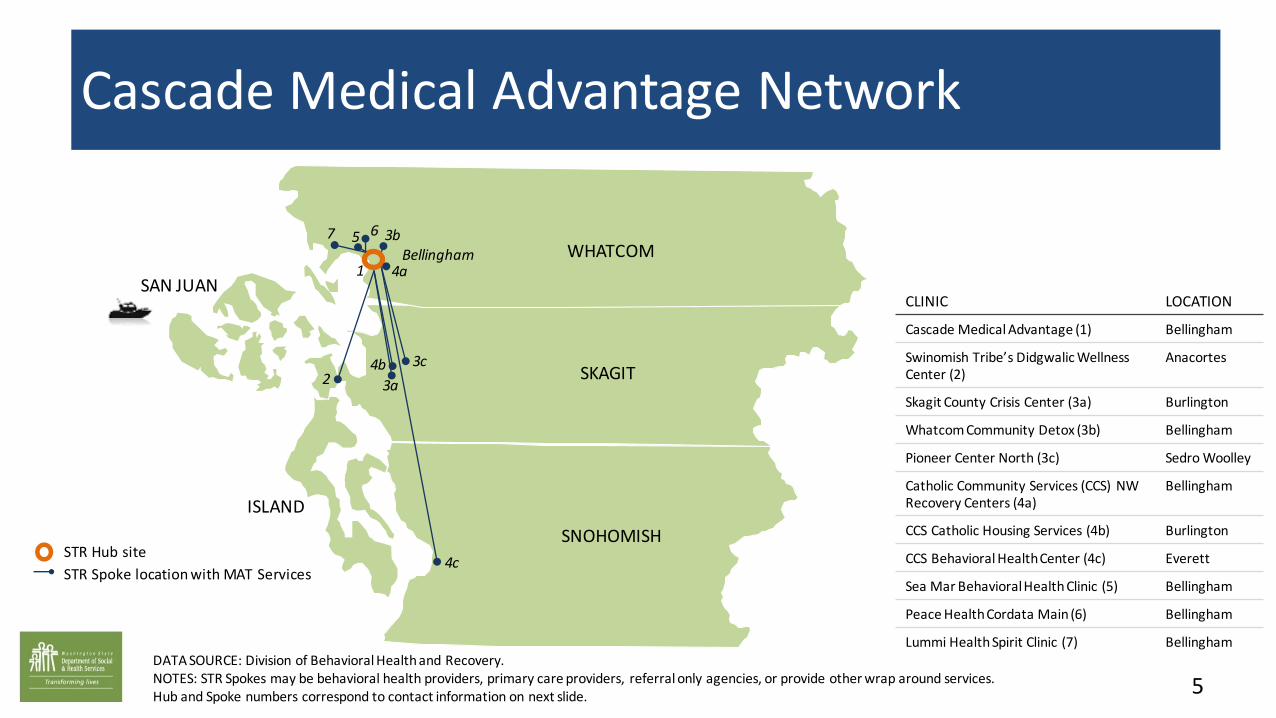
STR Hub site
STR Spoke location with MAT Services
DATA SOURCE: Division of Behavioral Health and Recovery.NOTES: STR Spokes may be behavioral health providers, primary care providers, referral only agencies, or provide other wrap around services. Hub and Spoke numbers correspond to contact information on next slide.
Cascade Medical Advantage Network
WHATCOM
SAN JUAN
ISLAND
SKAGIT
SNOHOMISH
Bellingham1
2 3a
3b
3c
4c
4b
4a
65
5
CLINIC LOCATION
Cascade Medical Advantage (1) Bellingham
Swinomish Tribe’s Didgwalic Wellness Center (2)
Anacortes
Skagit County Crisis Center (3a) Burlington
Whatcom Community Detox (3b) Bellingham
Pioneer Center North (3c) Sedro Woolley
Catholic Community Services (CCS) NW Recovery Centers (4a)
Bellingham
CCS Catholic Housing Services (4b) Burlington
CCS Behavioral HealthCenter (4c) Everett
Sea Mar BehavioralHealth Clinic (5) Bellingham
Peace Health Cordata Main (6) Bellingham
Lummi Health Spirit Clinic (7) Bellingham
7
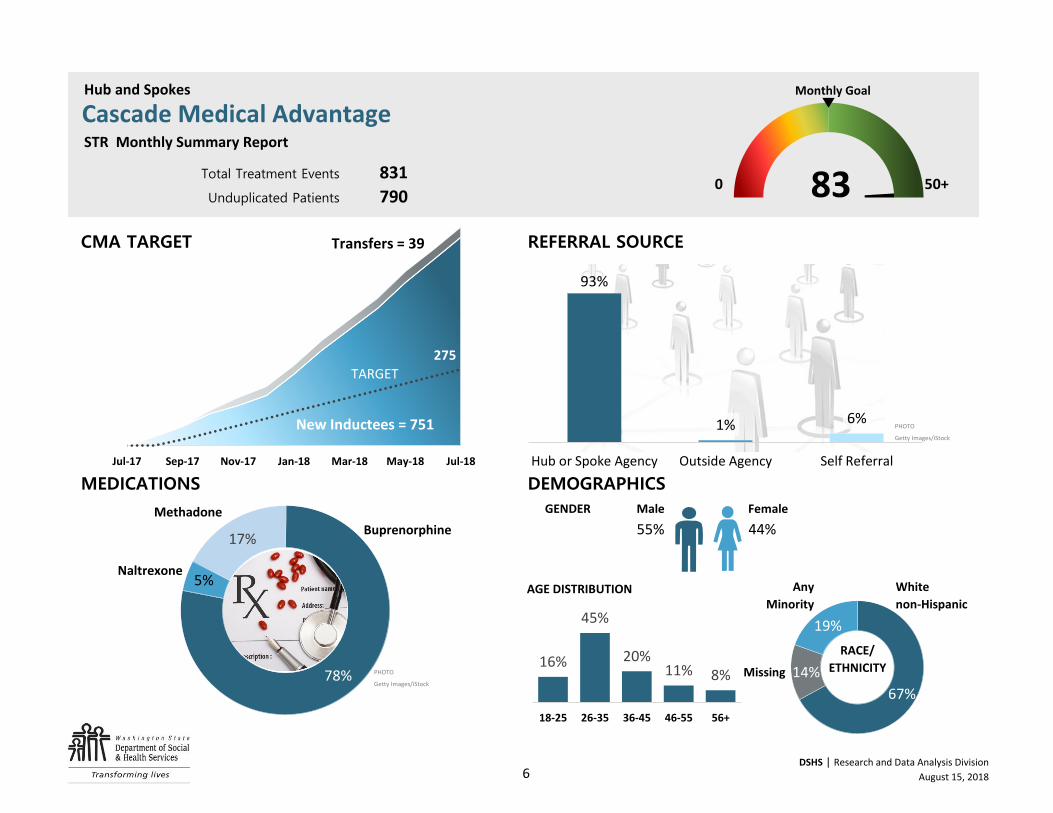
831
790
Transfers = 39
Transfers = 39
New Inductees = 751
PHOTO
Getty Images/iStock
GENDER Male Female
55% 44%
PHOTO
Getty Images/iStock
Any
Minority
Monthly Goal
50+830
Hub and Spokes
Cascade Medical Advantage
MEDICATIONS
Buprenorphine
CMA TARGET
STR Monthly Summary Report
Total Treatment Events
Unduplicated Patients
RACE/
ETHNICITY
DEMOGRAPHICS
REFERRAL SOURCE
AGE DISTRIBUTION
Naltrexone
Methadone
White
non-Hispanic
275
Jul-17 Sep-17 Nov-17 Jan-18 Mar-18 May-18 Jul-18
17%
78%
5%
93%
1% 6%
Hub or Spoke Agency Outside Agency Self Referral
16%
45%
20%11% 8%
18-25 26-35 36-45 46-55 56+
67%
14%
19%
New Inductees = 751
TARGET
Transfers = 39
6DSHS | Research and Data Analysis Division
August 15, 2018
Missing
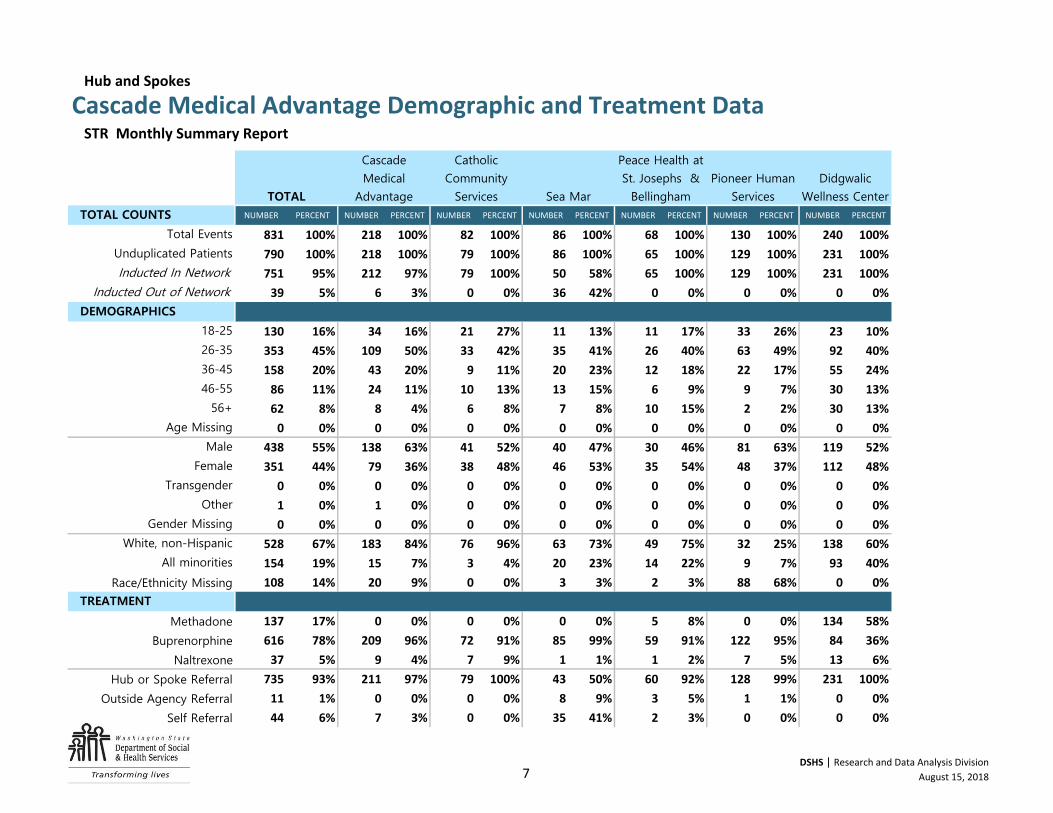
NUMBER PERCENT NUMBER PERCENT NUMBER PERCENT NUMBER PERCENT NUMBER PERCENT NUMBER PERCENT NUMBER PERCENT
831 100% 218 100% 82 100% 86 100% 68 100% 130 100% 240 100%
790 100% 218 100% 79 100% 86 100% 65 100% 129 100% 231 100%
751 95% 212 97% 79 100% 50 58% 65 100% 129 100% 231 100%
39 5% 6 3% 0 0% 36 42% 0 0% 0 0% 0 0%
130 16% 34 16% 21 27% 11 13% 11 17% 33 26% 23 10%
353 45% 109 50% 33 42% 35 41% 26 40% 63 49% 92 40%
158 20% 43 20% 9 11% 20 23% 12 18% 22 17% 55 24%
86 11% 24 11% 10 13% 13 15% 6 9% 9 7% 30 13%
62 8% 8 4% 6 8% 7 8% 10 15% 2 2% 30 13%
0 0% 0 0% 0 0% 0 0% 0 0% 0 0% 0 0%
438 55% 138 63% 41 52% 40 47% 30 46% 81 63% 119 52%
351 44% 79 36% 38 48% 46 53% 35 54% 48 37% 112 48%
0 0% 0 0% 0 0% 0 0% 0 0% 0 0% 0 0%
1 0% 1 0% 0 0% 0 0% 0 0% 0 0% 0 0%
0 0% 0 0% 0 0% 0 0% 0 0% 0 0% 0 0%
528 67% 183 84% 76 96% 63 73% 49 75% 32 25% 138 60%
154 19% 15 7% 3 4% 20 23% 14 22% 9 7% 93 40%
108 14% 20 9% 0 0% 3 3% 2 3% 88 68% 0 0%
137 17% 0 0% 0 0% 0 0% 5 8% 0 0% 134 58%
616 78% 209 96% 72 91% 85 99% 59 91% 122 95% 84 36%
37 5% 9 4% 7 9% 1 1% 1 2% 7 5% 13 6%
735 93% 211 97% 79 100% 43 50% 60 92% 128 99% 231 100%
11 1% 0 0% 0 0% 8 9% 3 5% 1 1% 0 0%
44 6% 7 3% 0 0% 35 41% 2 3% 0 0% 0 0%
Didgwalic
Wellness Center
Hub or Spoke Referral
Unduplicated Patients
Inducted In Network
Inducted Out of Network
26-35
36-45
46-55
56+
18-25
Total Events
TOTAL
Cascade
Medical
Advantage
Hub and Spokes
STR Monthly Summary Report
Cascade Medical Advantage Demographic and Treatment Data
TOTAL COUNTS
DEMOGRAPHICS
Catholic
Community
Services Sea Mar
Peace Health at
St. Josephs &
Bellingham
Self Referral
Age Missing
Female
Transgender
Other
Gender Missing
White, non-Hispanic
Outside Agency Referral
All minorities
Male
Race/Ethnicity Missing
Methadone
Buprenorphine
Naltrexone
TREATMENT
Pioneer Human
Services
7DSHS | Research and Data Analysis Division
August 15, 2018
STR Hub site
STR Spoke location with MAT services
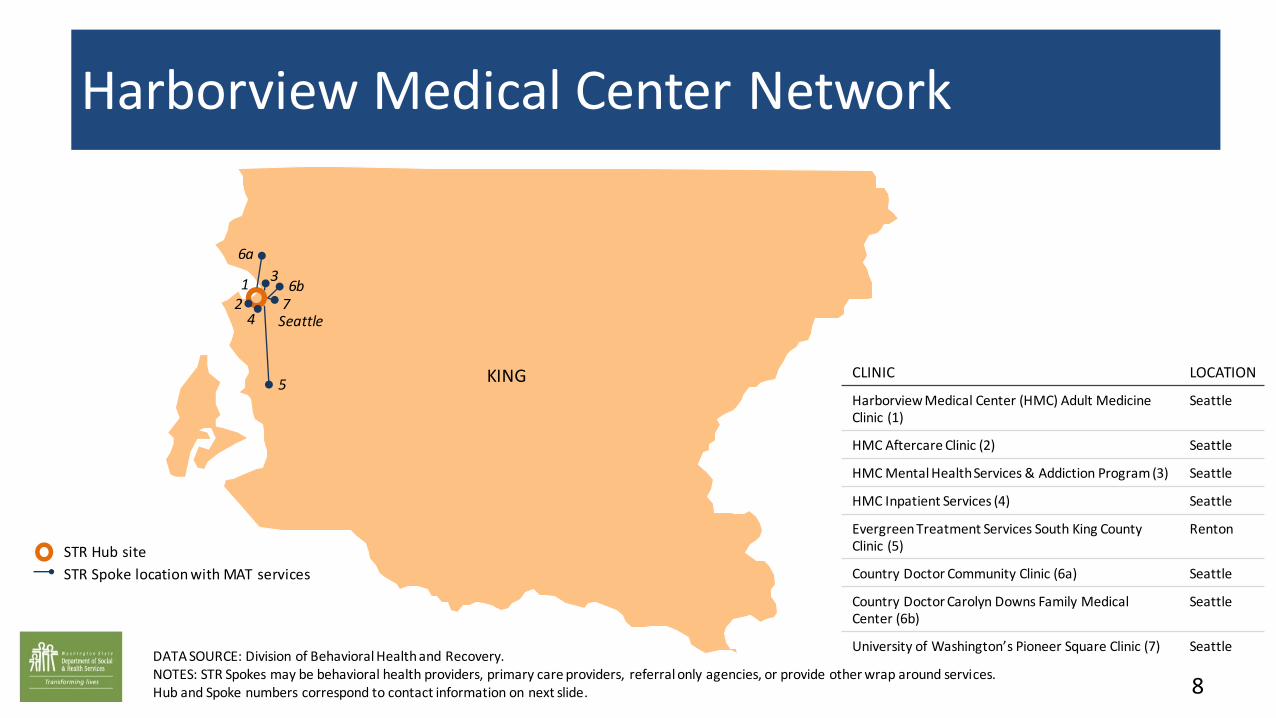
DATA SOURCE: Division of Behavioral Health and Recovery.NOTES: STR Spokes may be behavioral health providers, primary care providers, referral only agencies, or provide other wrap around services. Hub and Spoke numbers correspond to contact information on next slide.
Harborview Medical Center Network
KING
Seattle
1
42
3
5
6a
6b7
8
CLINIC LOCATION
Harborview Medical Center (HMC) Adult Medicine Clinic (1)
Seattle
HMC Aftercare Clinic (2) Seattle
HMC Mental HealthServices & Addiction Program (3) Seattle
HMC Inpatient Services (4) Seattle
Evergreen Treatment Services South King County Clinic (5)
Renton
Country Doctor Community Clinic (6a) Seattle
Country Doctor Carolyn Downs Family Medical Center (6b)
Seattle
University of Washington’s Pioneer Square Clinic (7) Seattle
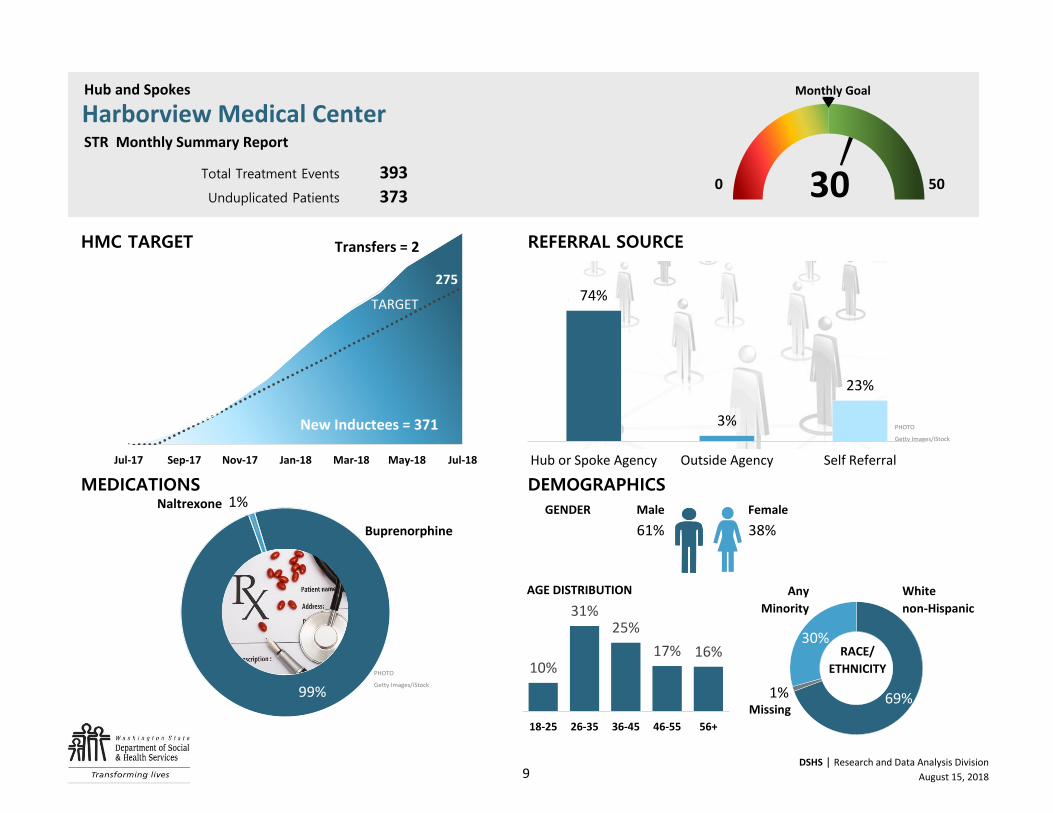
393
373
Transfers = 22
Transfers = 2
New Inductees = 371
PHOTO
Getty Images/iStock
GENDER Male Female
61% 38%
PHOTO
Getty Images/iStock
Missing
RACE/
ETHNICITY
White
non-Hispanic
Unduplicated Patients
HMC TARGET REFERRAL SOURCE
Total Treatment Events
Hub and Spokes Monthly Goal
Harborview Medical Center STR Monthly Summary Report
300 50
MEDICATIONS DEMOGRAPHICS
Buprenorphine
AGE DISTRIBUTION Any
MinorityMethadone
Naltrexone
99%
1%
74%
3%
23%
Hub or Spoke Agency Outside Agency Self Referral
275
Jul-17 Sep-17 Nov-17 Jan-18 Mar-18 May-18 Jul-18
10%
31%25%
17% 16%
18-25 26-35 36-45 46-55 56+
69%1%
30%
New Inductees = 371
TARGET
Transfers = 2
9DSHS | Research and Data Analysis Division
August 15, 2018
NUMBER PERCENT NUMBER PERCENT NUMBER PERCENT NUMBER PERCENT NUMBER PERCENT NUMBER PERCENT NUMBER PERCENT
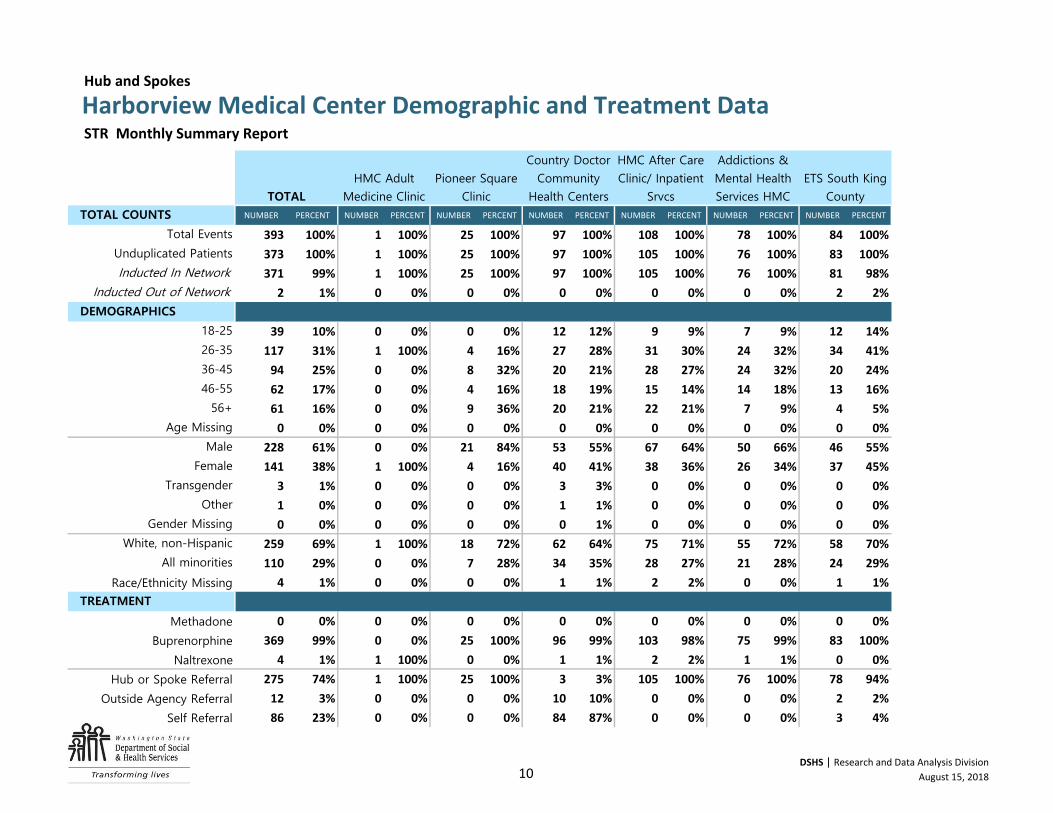
393 100% 1 100% 25 100% 97 100% 108 100% 78 100% 84 100%
373 100% 1 100% 25 100% 97 100% 105 100% 76 100% 83 100%
371 99% 1 100% 25 100% 97 100% 105 100% 76 100% 81 98%
2 1% 0 0% 0 0% 0 0% 0 0% 0 0% 2 2%
39 10% 0 0% 0 0% 12 12% 9 9% 7 9% 12 14%
117 31% 1 100% 4 16% 27 28% 31 30% 24 32% 34 41%
94 25% 0 0% 8 32% 20 21% 28 27% 24 32% 20 24%
62 17% 0 0% 4 16% 18 19% 15 14% 14 18% 13 16%
61 16% 0 0% 9 36% 20 21% 22 21% 7 9% 4 5%
0 0% 0 0% 0 0% 0 0% 0 0% 0 0% 0 0%
228 61% 0 0% 21 84% 53 55% 67 64% 50 66% 46 55%
141 38% 1 100% 4 16% 40 41% 38 36% 26 34% 37 45%
3 1% 0 0% 0 0% 3 3% 0 0% 0 0% 0 0%
1 0% 0 0% 0 0% 1 1% 0 0% 0 0% 0 0%
0 0% 0 0% 0 0% 0 1% 0 0% 0 0% 0 0%
259 69% 1 100% 18 72% 62 64% 75 71% 55 72% 58 70%
110 29% 0 0% 7 28% 34 35% 28 27% 21 28% 24 29%
4 1% 0 0% 0 0% 1 1% 2 2% 0 0% 1 1%
0 0% 0 0% 0 0% 0 0% 0 0% 0 0% 0 0%
369 99% 0 0% 25 100% 96 99% 103 98% 75 99% 83 100%
4 1% 1 100% 0 0% 1 1% 2 2% 1 1% 0 0%
275 74% 1 100% 25 100% 3 3% 105 100% 76 100% 78 94%
12 3% 0 0% 0 0% 10 10% 0 0% 0 0% 2 2%
86 23% 0 0% 0 0% 84 87% 0 0% 0 0% 3 4%
Harborview Medical Center Demographic and Treatment Data Hub and Spokes
HMC After Care
Clinic/ Inpatient
Srvcs
Addictions &
Mental Health
Services HMC
ETS South King
County
TOTAL COUNTS
STR Monthly Summary Report
TOTAL
HMC Adult
Medicine Clinic
Pioneer Square
Clinic
Country Doctor
Community
Health Centers
18-25
26-35
36-45
46-55
56+
Total Events
Unduplicated Patients
Inducted In Network
Inducted Out of Network
DEMOGRAPHICS
Gender Missing
White, non-Hispanic
All minorities
Race/Ethnicity Missing
TREATMENT
Age Missing
Male
Female
Transgender
Other
Self Referral
Methadone
Buprenorphine
Naltrexone
Hub or Spoke Referral
Outside Agency Referral
10DSHS | Research and Data Analysis Division
August 15, 2018
DATA SOURCE: Division of Behavioral Health and Recovery.NOTES: STR Spokes may be behavioral health providers, primary care providers, referral only agencies, or provide other wrap around services. Hub and Spoke numbers correspond to contact information on next slide.
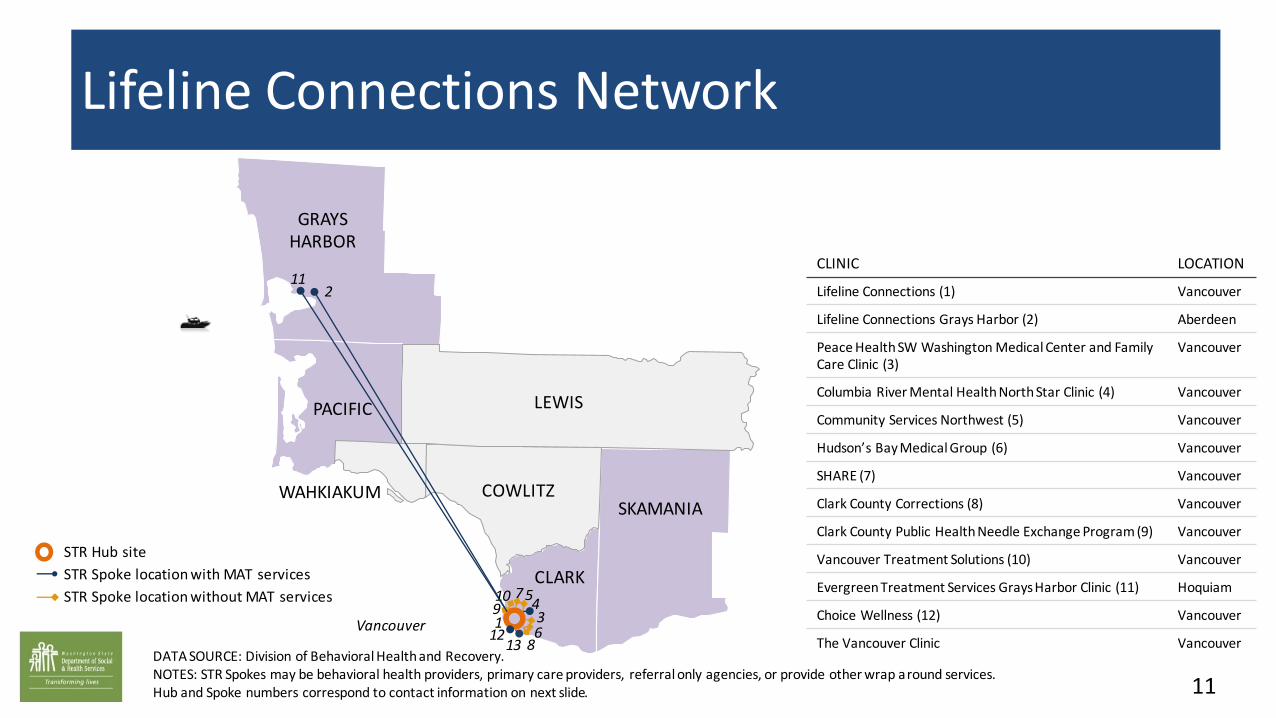
Lifeline Connections Network
11
STR Hub site
STR Spoke location with MAT services
STR Spoke location without MAT services
WAHKIAKUM
GRAYS HARBOR
LEWISPACIFIC
COWLITZ
CLARK
SKAMANIA
Vancouver 1 34
5
6
7
2
8
910
11CLINIC LOCATION
Lifeline Connections (1) Vancouver
Lifeline Connections Grays Harbor (2) Aberdeen
Peace Health SW Washington Medical Center and Family Care Clinic (3)
Vancouver
Columbia River Mental Health North Star Clinic (4) Vancouver
Community Services Northwest (5) Vancouver
Hudson’s Bay Medical Group (6) Vancouver
SHARE (7) Vancouver
Clark County Corrections (8) Vancouver
Clark County Public Health Needle Exchange Program (9) Vancouver
Vancouver Treatment Solutions (10) Vancouver
Evergreen Treatment Services Grays Harbor Clinic (11) Hoquiam
Choice Wellness (12) Vancouver
The Vancouver Clinic Vancouver12
13
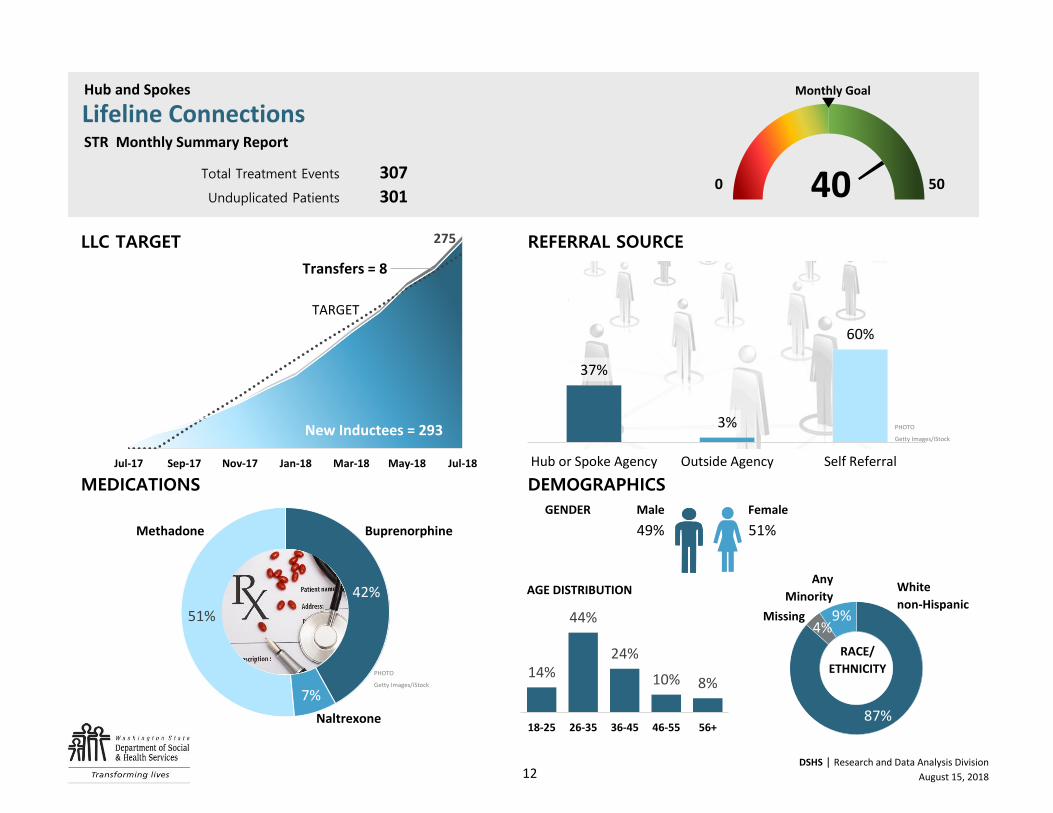
307
301
Transfers = 498
Transfers = 8
New Inductees = 293 PHOTO
Getty Images/iStock
GENDER Male Female
49% 51%
Missing
PHOTO
Getty Images/iStock
50Unduplicated Patients
LLC TARGET REFERRAL SOURCE
White
non-Hispanic
Hub and Spokes Monthly Goal
Lifeline Connections STR Monthly Summary Report
40Total Treatment Events0
RACE/
ETHNICITYNaltrexone
Naltrexone
MEDICATIONS DEMOGRAPHICS
Methadone Buprenorphine
AGE DISTRIBUTIONAny
Minority
18-25 26-35 36-45 46-55 56+
51%
42%
7%
37%
3%
60%
Hub or Spoke Agency Outside Agency Self Referral
275
Jul-17 Sep-17 Nov-17 Jan-18 Mar-18 May-18 Jul-18
14%
44%
24%
10% 8%
18-25 26-35 36-45 46-55 56+87%
4%9%
New Inductees = 293
TARGET
Transfers = 8
12DSHS | Research and Data Analysis Division
August 15, 2018
NUMBER PERCENT NUMBER PERCENT NUMBER PERCENT NUMBER PERCENT NUMBER PERCENT NUMBER PERCENT NUMBER PERCENT
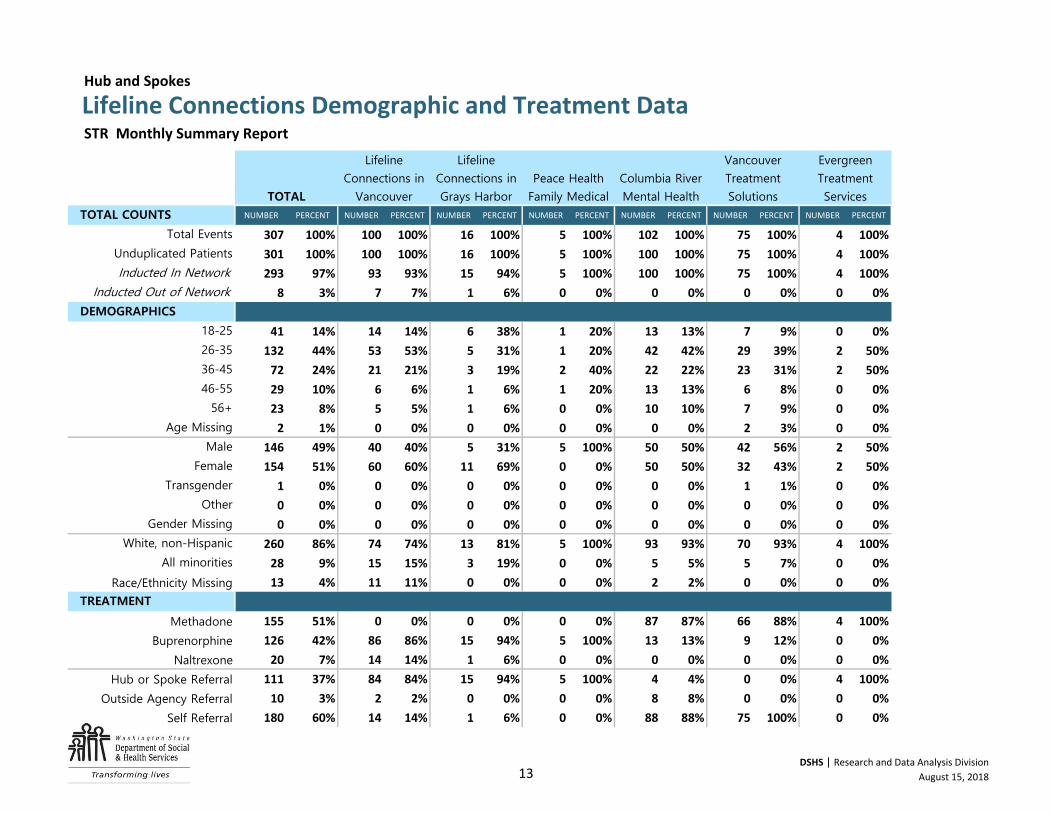
307 100% 100 100% 16 100% 5 100% 102 100% 75 100% 4 100%
301 100% 100 100% 16 100% 5 100% 100 100% 75 100% 4 100%
293 97% 93 93% 15 94% 5 100% 100 100% 75 100% 4 100%
8 3% 7 7% 1 6% 0 0% 0 0% 0 0% 0 0%
41 14% 14 14% 6 38% 1 20% 13 13% 7 9% 0 0%
132 44% 53 53% 5 31% 1 20% 42 42% 29 39% 2 50%
72 24% 21 21% 3 19% 2 40% 22 22% 23 31% 2 50%
29 10% 6 6% 1 6% 1 20% 13 13% 6 8% 0 0%
23 8% 5 5% 1 6% 0 0% 10 10% 7 9% 0 0%
2 1% 0 0% 0 0% 0 0% 0 0% 2 3% 0 0%
146 49% 40 40% 5 31% 5 100% 50 50% 42 56% 2 50%
154 51% 60 60% 11 69% 0 0% 50 50% 32 43% 2 50%
1 0% 0 0% 0 0% 0 0% 0 0% 1 1% 0 0%
0 0% 0 0% 0 0% 0 0% 0 0% 0 0% 0 0%
0 0% 0 0% 0 0% 0 0% 0 0% 0 0% 0 0%
260 86% 74 74% 13 81% 5 100% 93 93% 70 93% 4 100%
28 9% 15 15% 3 19% 0 0% 5 5% 5 7% 0 0%
13 4% 11 11% 0 0% 0 0% 2 2% 0 0% 0 0%
155 51% 0 0% 0 0% 0 0% 87 87% 66 88% 4 100%
126 42% 86 86% 15 94% 5 100% 13 13% 9 12% 0 0%
20 7% 14 14% 1 6% 0 0% 0 0% 0 0% 0 0%
111 37% 84 84% 15 94% 5 100% 4 4% 0 0% 4 100%
10 3% 2 2% 0 0% 0 0% 8 8% 0 0% 0 0%
180 60% 14 14% 1 6% 0 0% 88 88% 75 100% 0 0%
Lifeline Connections Demographic and Treatment Data Hub and Spokes
Columbia River
Mental Health
Vancouver
Treatment
Solutions
Evergreen
Treatment
Services
TOTAL COUNTS
STR Monthly Summary Report
TOTAL
Lifeline
Connections in
Vancouver
Lifeline
Connections in
Grays Harbor
Peace Health
Family Medical
18-25
26-35
36-45
46-55
56+
Total Events
Unduplicated Patients
Inducted In Network
Inducted Out of Network
DEMOGRAPHICS
Gender Missing
White, non-Hispanic
All minorities
Race/Ethnicity Missing
TREATMENT
Age Missing
Male
Female
Transgender
Other
Self Referral
Methadone
Buprenorphine
Naltrexone
Hub or Spoke Referral
Outside Agency Referral
13DSHS | Research and Data Analysis Division
August 15, 2018
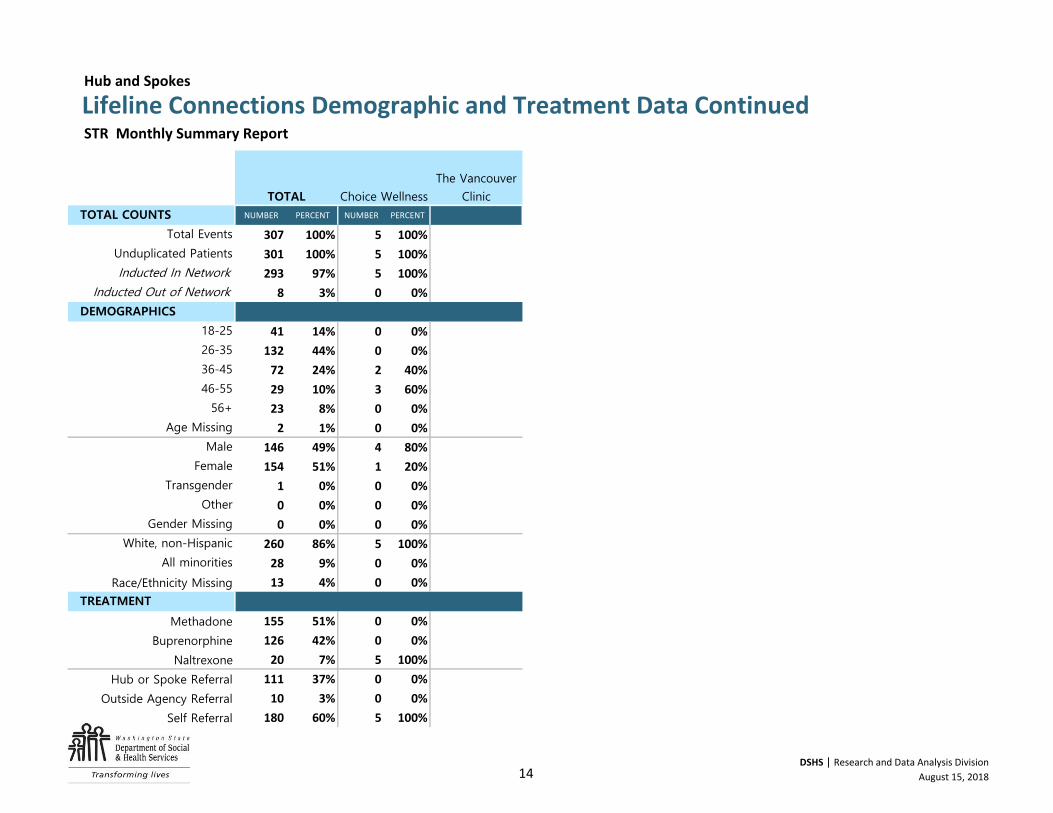
NUMBER PERCENT NUMBER PERCENT
307 100% 5 100% . .
301 100% 5 100% . .
293 97% 5 100% . .
8 3% 0 0% . .
41 14% 0 0% . .
132 44% 0 0% . .
72 24% 2 40% . .
29 10% 3 60% . .
23 8% 0 0% . .
2 1% 0 0% . .
146 49% 4 80% . .
154 51% 1 20% . .
1 0% 0 0% ###### ######
0 0% 0 0% . .
0 0% 0 0% . .
260 86% 5 100% . .
28 9% 0 0% . .
13 4% 0 0% . .
155 51% 0 0% . .
126 42% 0 0% ###### ######
20 7% 5 100% ###### ######
111 37% 0 0% . .
10 3% 0 0% . .
180 60% 5 100% . .
The Vancouver
Clinic
Lifeline Connections Demographic and Treatment Data Continued Hub and Spokes
STR Monthly Summary Report
TOTAL Choice Wellness
TOTAL COUNTS
Total Events
Unduplicated Patients
Inducted In Network
Inducted Out of Network
DEMOGRAPHICS
18-25
26-35
36-45
46-55
56+
Age Missing
Male
Female
Transgender
Other
Gender Missing
White, non-Hispanic
All minorities
Race/Ethnicity Missing
TREATMENT
Methadone
Buprenorphine
Naltrexone
Hub or Spoke Referral
Outside Agency Referral
Self Referral
14DSHS | Research and Data Analysis Division
August 15, 2018
DATA SOURCE: Division of Behavioral Health and Recovery.NOTES: STR Spokes may be behavioral health providers, primary care providers, referral only agencies, or provide other wrap around services. Hub and Spoke numbers correspond to contact information on next slide. Kitsap County is primarily served by the Peninsula Community Health Services
Hub and so is shaded blue.
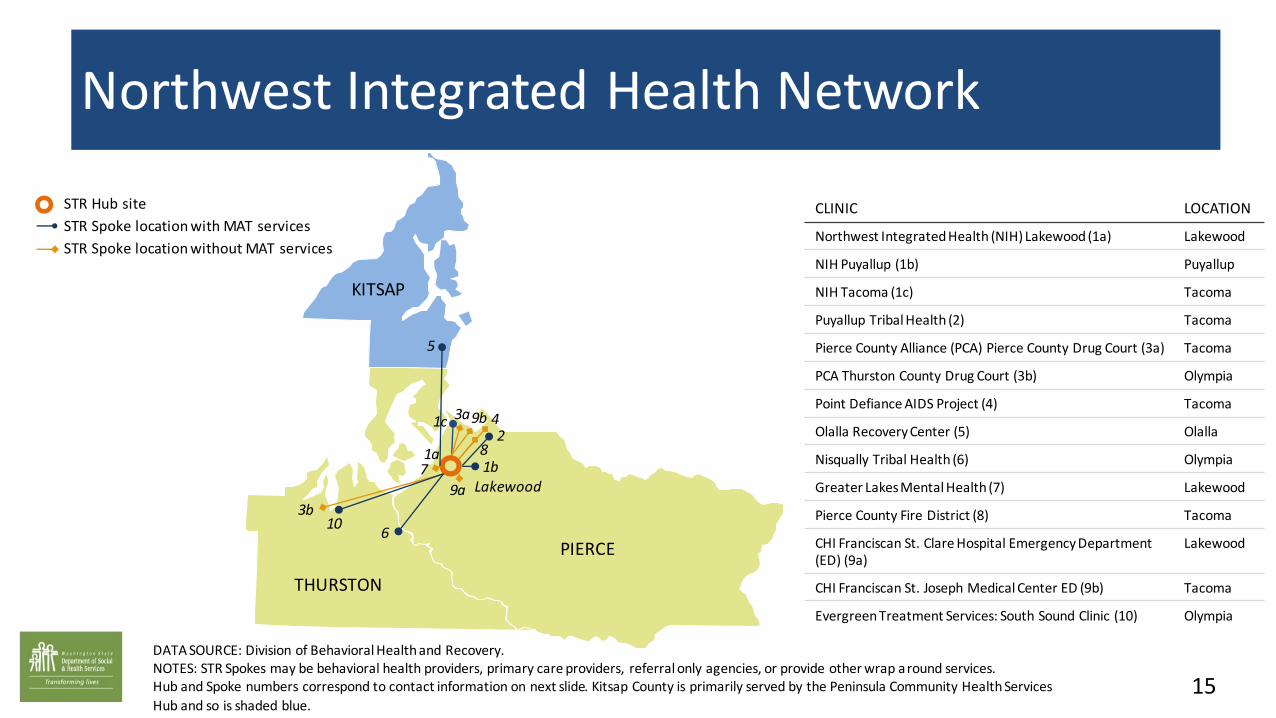
Northwest Integrated Health Network
THURSTON
PIERCE
KITSAP
Lakewood
1a1b
1c2
3a
3b
4
5
6
78
9a
9b
15
STR Hub site
STR Spoke location with MAT services
STR Spoke location without MAT services
CLINIC LOCATION
Northwest Integrated Health (NIH) Lakewood (1a) Lakewood
NIH Puyallup (1b) Puyallup
NIH Tacoma (1c) Tacoma
Puyallup Tribal Health (2) Tacoma
Pierce County Alliance (PCA) Pierce County Drug Court (3a) Tacoma
PCA Thurston County Drug Court (3b) Olympia
Point Defiance AIDS Project (4) Tacoma
Olalla Recovery Center (5) Olalla
Nisqually Tribal Health (6) Olympia
Greater Lakes Mental Health (7) Lakewood
Pierce County Fire District (8) Tacoma
CHI Franciscan St. Clare Hospital Emergency Department (ED) (9a)
Lakewood
CHI Franciscan St. Joseph Medical Center ED (9b) Tacoma
Evergreen Treatment Services: South Sound Clinic (10) Olympia
10
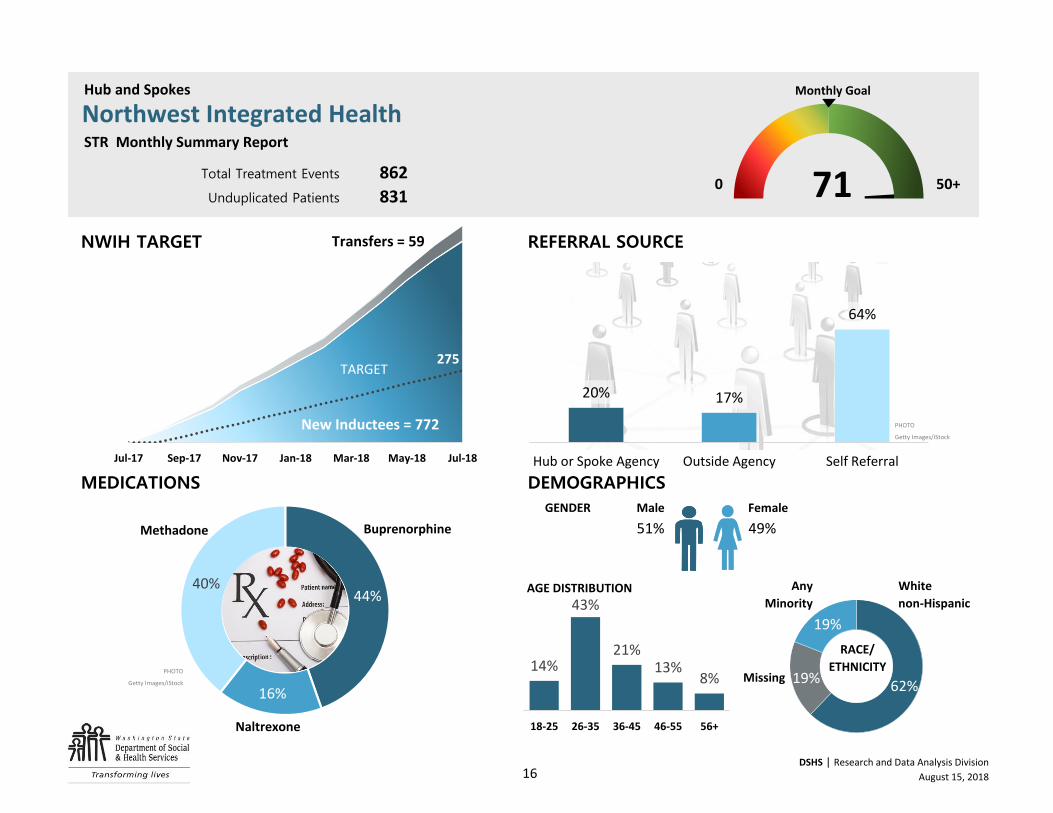
862
831
Transfers =
Transfers = 59
New Inductees = 772
PHOTO
Getty Images/iStock
GENDER Male Female
51% 49%
PHOTO
Getty Images/iStockMissing
DEMOGRAPHICS
Buprenorphine
AGE DISTRIBUTION White
non-Hispanic
RACE/
ETHNICITY
MEDICATIONS
Any
Minority
50+Unduplicated Patients
NWIH TARGET REFERRAL SOURCE
Hub and Spokes Monthly Goal
Northwest Integrated Health STR Monthly Summary Report
71Total Treatment Events0
18-25 26-35 36-45 46-55 56+
40%44%
16%
20% 17%
64%
Hub or Spoke Agency Outside Agency Self Referral
275
Jul-17 Sep-17 Nov-17 Jan-18 Mar-18 May-18 Jul-18
14%
43%
21%13%
8%
18-25 26-35 36-45 46-55 56+
62%19%
19%
New Inductees = 772
TARGET
Transfers = 59
16DSHS | Research and Data Analysis Division
August 15, 2018
Naltrexone
Methadone
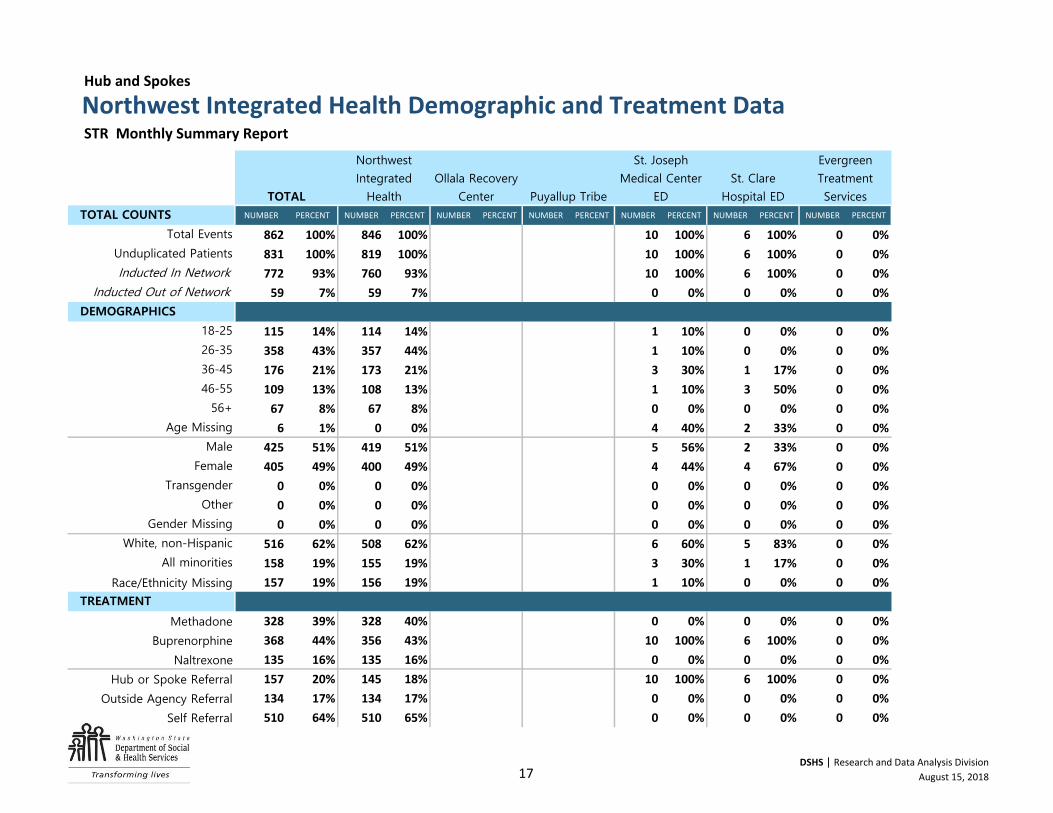
NUMBER PERCENT NUMBER PERCENT NUMBER PERCENT NUMBER PERCENT NUMBER PERCENT NUMBER PERCENT NUMBER PERCENT
862 100% 846 100% . . . . 10 100% 6 100% 0 0%
831 100% 819 100% . . . . 10 100% 6 100% 0 0%
772 93% 760 93% . . . . 10 100% 6 100% 0 0%
59 7% 59 7% . . . . 0 0% 0 0% 0 0%
115 14% 114 14% . . . . 1 10% 0 0% 0 0%
358 43% 357 44% . . . . 1 10% 0 0% 0 0%
176 21% 173 21% . . . . 3 30% 1 17% 0 0%
109 13% 108 13% . . . . 1 10% 3 50% 0 0%
67 8% 67 8% . . . . 0 0% 0 0% 0 0%
6 1% 0 0% . . . . 4 40% 2 33% 0 0%
425 51% 419 51% . . . . 5 56% 2 33% 0 0%
405 49% 400 49% . . . . 4 44% 4 67% 0 0%
0 0% 0 0% ###### ###### ###### ###### 0 0% 0 0% 0 0%
0 0% 0 0% . . . . 0 0% 0 0% 0 0%
0 0% 0 0% . . . . 0 0% 0 0% 0 0%
516 62% 508 62% . . . . 6 60% 5 83% 0 0%
158 19% 155 19% . . . . 3 30% 1 17% 0 0%
157 19% 156 19% . . . . 1 10% 0 0% 0 0%
328 39% 328 40% . . . . 0 0% 0 0% 0 0%
368 44% 356 43% ###### ###### ###### ###### 10 100% 6 100% 0 0%
135 16% 135 16% ###### ###### ###### ###### 0 0% 0 0% 0 0%
157 20% 145 18% . . . . 10 100% 6 100% 0 0%
134 17% 134 17% . . . . 0 0% 0 0% 0 0%
510 64% 510 65% . . . . 0 0% 0 0% 0 0%
Evergreen
Treatment
Services
Northwest Integrated Health Demographic and Treatment Data Hub and Spokes
Ollala Recovery
Center Puyallup Tribe
St. Joseph
Medical Center
ED
St. Clare
Hospital ED
TOTAL COUNTS
STR Monthly Summary Report
TOTAL
Northwest
Integrated
Health
18-25
26-35
36-45
46-55
56+
Total Events
Unduplicated Patients
Inducted In Network
Inducted Out of Network
DEMOGRAPHICS
Gender Missing
White, non-Hispanic
All minorities
Race/Ethnicity Missing
TREATMENT
Age Missing
Male
Female
Transgender
Other
Self Referral
Methadone
Buprenorphine
Naltrexone
Hub or Spoke Referral
Outside Agency Referral
17DSHS | Research and Data Analysis Division
August 15, 2018
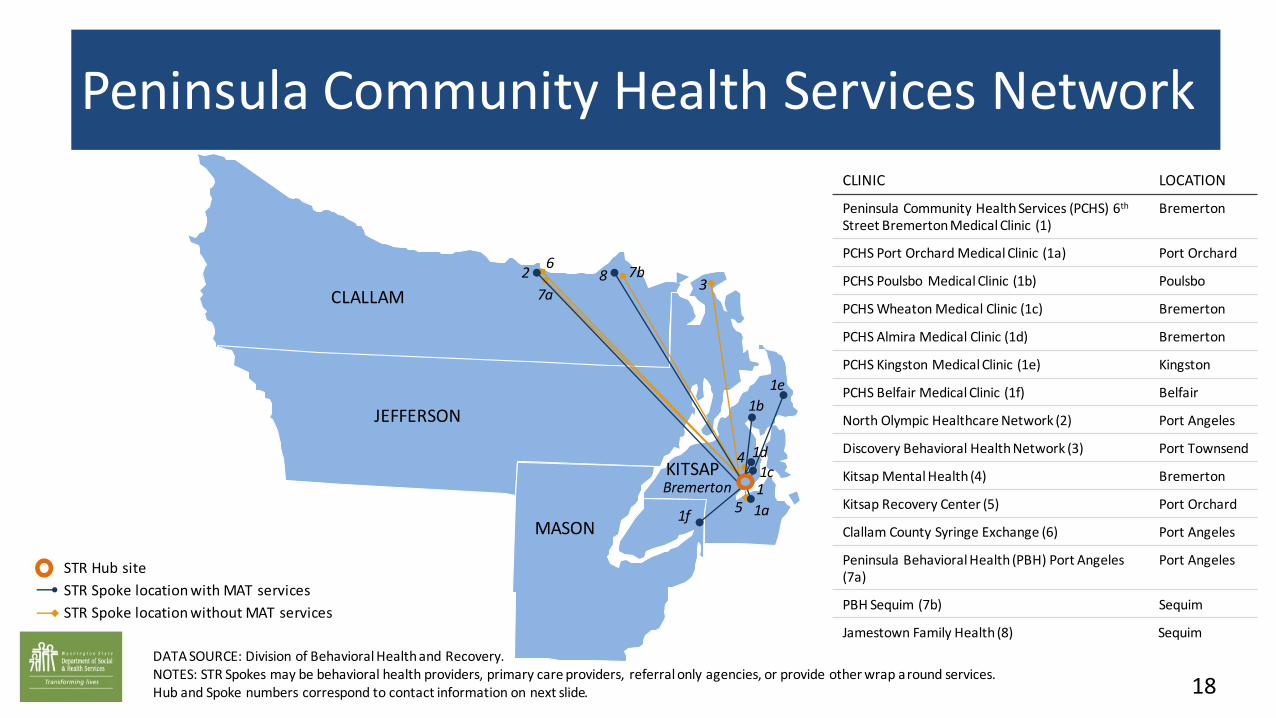
DATA SOURCE: Division of Behavioral Health and Recovery.NOTES: STR Spokes may be behavioral health providers, primary care providers, referral only agencies, or provide other wrap around services. Hub and Spoke numbers correspond to contact information on next slide.
Peninsula Community Health Services Network
18
STR Hub site
STR Spoke location with MAT services
STR Spoke location without MAT services
CLINIC LOCATION
Peninsula Community Health Services (PCHS) 6th
Street Bremerton Medical Clinic (1)Bremerton
PCHS Port Orchard Medical Clinic (1a) Port Orchard
PCHS Poulsbo Medical Clinic (1b) Poulsbo
PCHS Wheaton Medical Clinic (1c) Bremerton
PCHS Almira Medical Clinic (1d) Bremerton
PCHS Kingston Medical Clinic (1e) Kingston
PCHS Belfair Medical Clinic (1f) Belfair
North Olympic Healthcare Network (2) Port Angeles
Discovery Behavioral Health Network (3) Port Townsend
Kitsap Mental Health (4) Bremerton
Kitsap Recovery Center (5) Port Orchard
Clallam County Syringe Exchange (6) Port Angeles
Peninsula Behavioral Health (PBH) Port Angeles (7a)
Port Angeles
PBH Sequim (7b) Sequim
Jamestown Family Health (8) Sequim
JEFFERSON
CLALLAM
KITSAPBremerton 1
23
5
6
4
7a8 7b
1a
1b
1c1d
1e
1fMASON
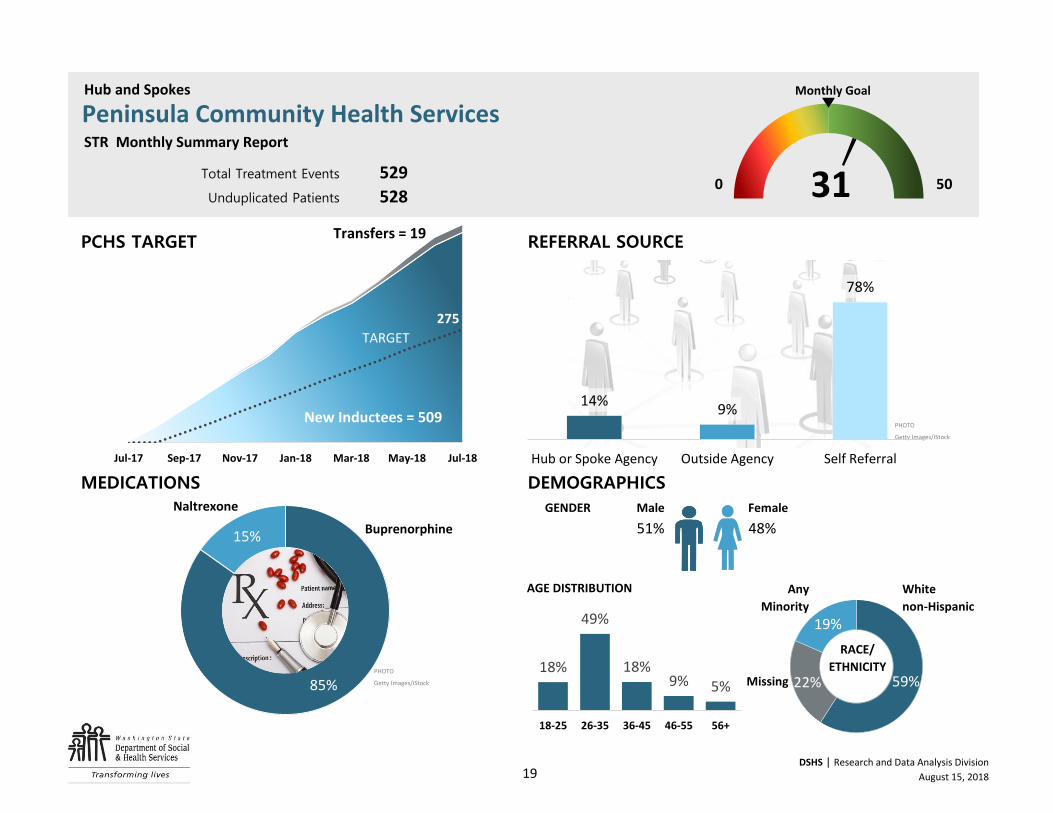
529
528
Transfers =
Transfers = 19
New Inductees = 509
PHOTO
Getty Images/iStock
GENDER Male Female
51% 48%
PHOTO
Getty Images/iStock Missing
Buprenorphine
Total Treatment Events
Unduplicated Patients
DEMOGRAPHICS
White
non-Hispanic
Monthly Goal
310 50
REFERRAL SOURCE
Any
Minority
Methadone
Naltrexone
PCHS TARGET
MEDICATIONS
Hub and Spokes
Peninsula Community Health Services STR Monthly Summary Report
RACE/
ETHNICITY
AGE DISTRIBUTION
18-25 26-35 36-45 46-55 56+
85%
15%
14%9%
78%
Hub or Spoke Agency Outside Agency Self Referral
275
Jul-17 Sep-17 Nov-17 Jan-18 Mar-18 May-18 Jul-18
18%
49%
18%9% 5%
18-25 26-35 36-45 46-55 56+
59%22%
19%
New Inductees = 509
TARGET
Transfers = 19
19DSHS | Research and Data Analysis Division
August 15, 2018
NUMBER PERCENT NUMBER PERCENT NUMBER PERCENT NUMBER PERCENT NUMBER PERCENT
529 100% 293 100% 236 100% . . . .
528 100% 292 100% 236 100% . . . .
509 96% 291 100% 218 92% . . . .
19 4% 1 0% 18 8% . . . .
95 18% 49 17% 46 19% . . . .
259 49% 150 51% 109 46% . . . .
96 18% 55 19% 41 17% . . . .
48 9% 24 8% 24 10% . . . .
29 5% 14 5% 15 6% . . . .
0 0% 0 0% 0 0% . . . .
271 51% 166 57% 105 45% . . . .
253 48% 124 42% 129 55% . . . .
1 0% 0 0% 1 0% ###### ###### ###### ######
0 0% 0 0% 0 0% . . . .
2 0% 2 0% 0 0% . . . .
312 59% 223 76% 89 38% . . . .
99 19% 40 14% 59 25% . . . .
117 22% 29 10% 88 37% . . . .
0 0% 0 0% 0 0% . . . .
448 85% 225 77% 223 94% ###### ###### ###### ######
80 15% 67 23% 13 6% ###### ###### ###### ######
72 14% 8 3% 64 27% . . . .
46 9% 11 4% 35 15% . . . .
410 78% 273 93% 137 58% . . . .
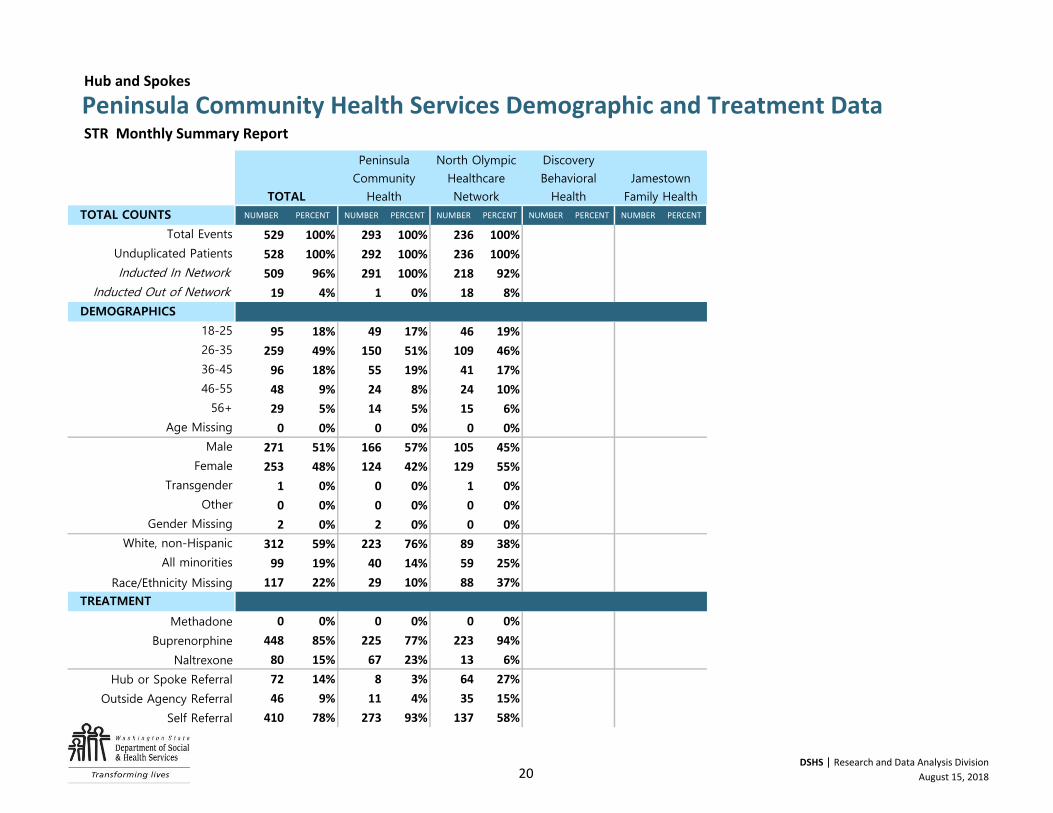
Peninsula Community Health Services Demographic and Treatment Data Hub and Spokes
Discovery
Behavioral
Health
Jamestown
Family Health
TOTAL COUNTS
STR Monthly Summary Report
TOTAL
Peninsula
Community
Health
North Olympic
Healthcare
Network
18-25
26-35
36-45
46-55
56+
Total Events
Unduplicated Patients
Inducted In Network
Inducted Out of Network
DEMOGRAPHICS
Gender Missing
White, non-Hispanic
All minorities
Race/Ethnicity Missing
TREATMENT
Age Missing
Male
Female
Transgender
Other
Self Referral
Methadone
Buprenorphine
Naltrexone
Hub or Spoke Referral
Outside Agency Referral
20DSHS | Research and Data Analysis Division
August 15, 2018
KING
KING
Seattle 1a
3d
2a
5 4
2b
2c
2d
1b
1c
1d
1e
1f
1g, 3g
1h
3b
3c
3f
3e
3a
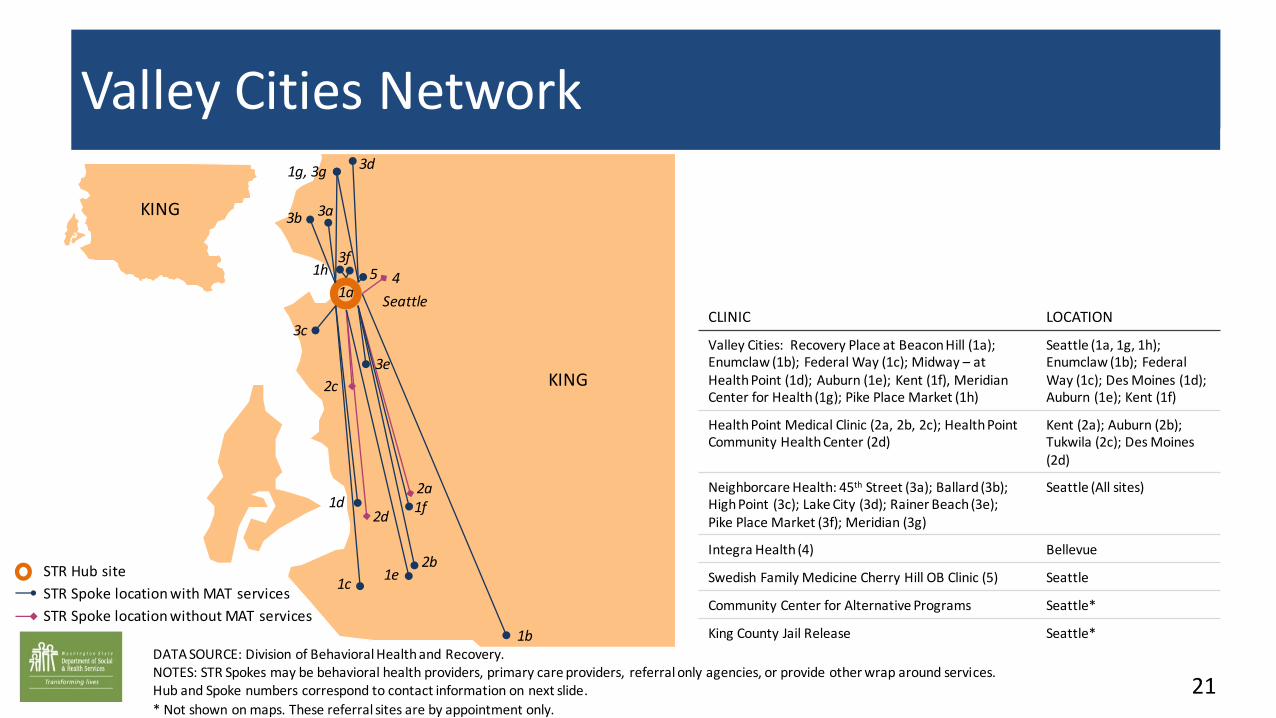
DATA SOURCE: Division of Behavioral Health and Recovery.NOTES: STR Spokes may be behavioral health providers, primary care providers, referral only agencies, or provide other wrap around services. Hub and Spoke numbers correspond to contact information on next slide.
* Not shown on maps. These referral sites are by appointment only.
Valley Cities Network
21
STR Hub site
STR Spoke location with MAT services
STR Spoke location without MAT services
CLINIC LOCATION
Valley Cities: Recovery Place at Beacon Hill (1a); Enumclaw (1b); Federal Way (1c); Midway – at Health Point (1d); Auburn (1e); Kent (1f), Meridian Center for Health (1g); Pike Place Market (1h)
Seattle (1a, 1g, 1h); Enumclaw (1b); Federal Way (1c); Des Moines (1d); Auburn (1e); Kent (1f)
Health Point Medical Clinic (2a, 2b, 2c); Health Point Community Health Center (2d)
Kent (2a); Auburn (2b); Tukwila (2c); Des Moines (2d)
Neighborcare Health: 45th Street (3a); Ballard (3b); High Point (3c); Lake City (3d); Rainer Beach (3e); Pike Place Market (3f); Meridian (3g)
Seattle (All sites)
Integra Health (4) Bellevue
Swedish Family Medicine Cherry Hill OB Clinic (5) Seattle
Community Center for Alternative Programs Seattle*
King County Jail Release Seattle*
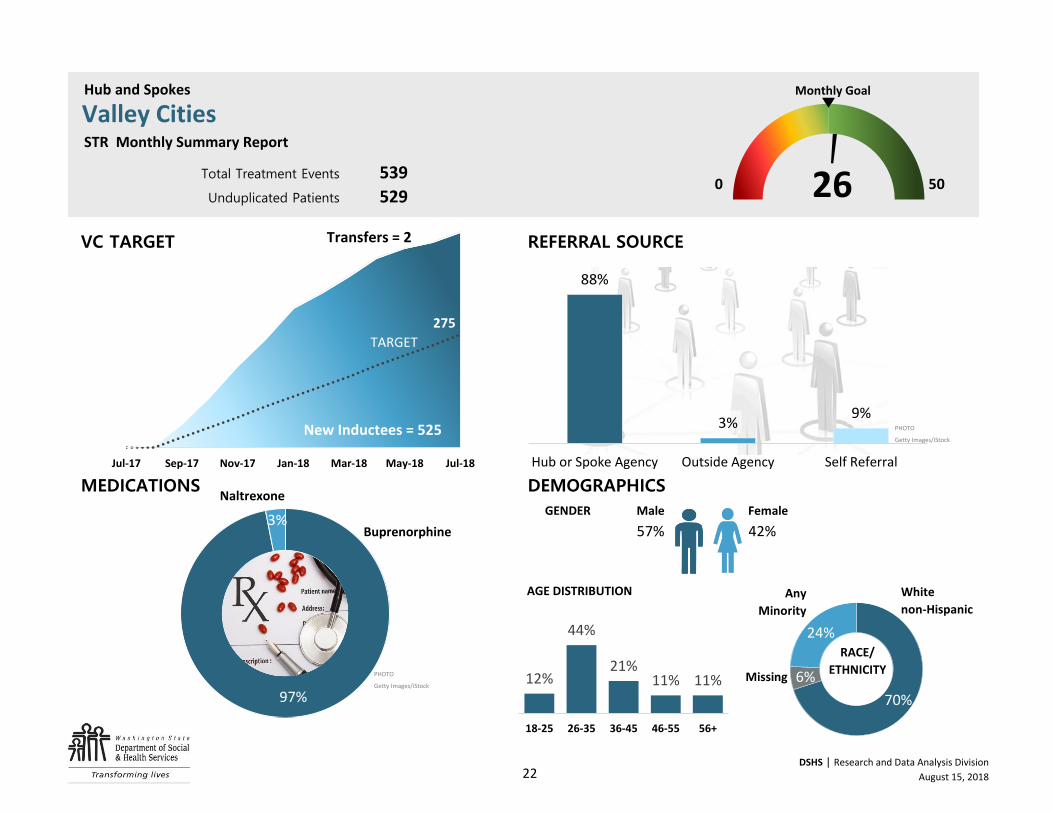
539
529
Transfers =
Transfers = 2
New Inductees = 525
PHOTO
Getty Images/iStock
GENDER Male Female
57% 42%
Methadone PHOTO
Getty Images/iStockMissing
Unduplicated Patients
VC TARGET
Valley Cities
MEDICATIONS
Buprenorphine
STR Monthly Summary Report
Total Treatment Events
Monthly Goal
Naltrexone
Hub and Spokes
RACE/
ETHNICITY
DEMOGRAPHICS
50
AGE DISTRIBUTION Any
Minority
260
REFERRAL SOURCE
White
non-Hispanic
18-25 26-35 36-45 46-55 56+
97%
3%
88%
3%9%
Hub or Spoke Agency Outside Agency Self Referral
275
Jul-17 Sep-17 Nov-17 Jan-18 Mar-18 May-18 Jul-18
12%
44%
21%11% 11%
18-25 26-35 36-45 46-55 56+
70%
6%
24%
New Inductees = 525
TARGET
Transfers = 2
22DSHS | Research and Data Analysis Division
August 15, 2018
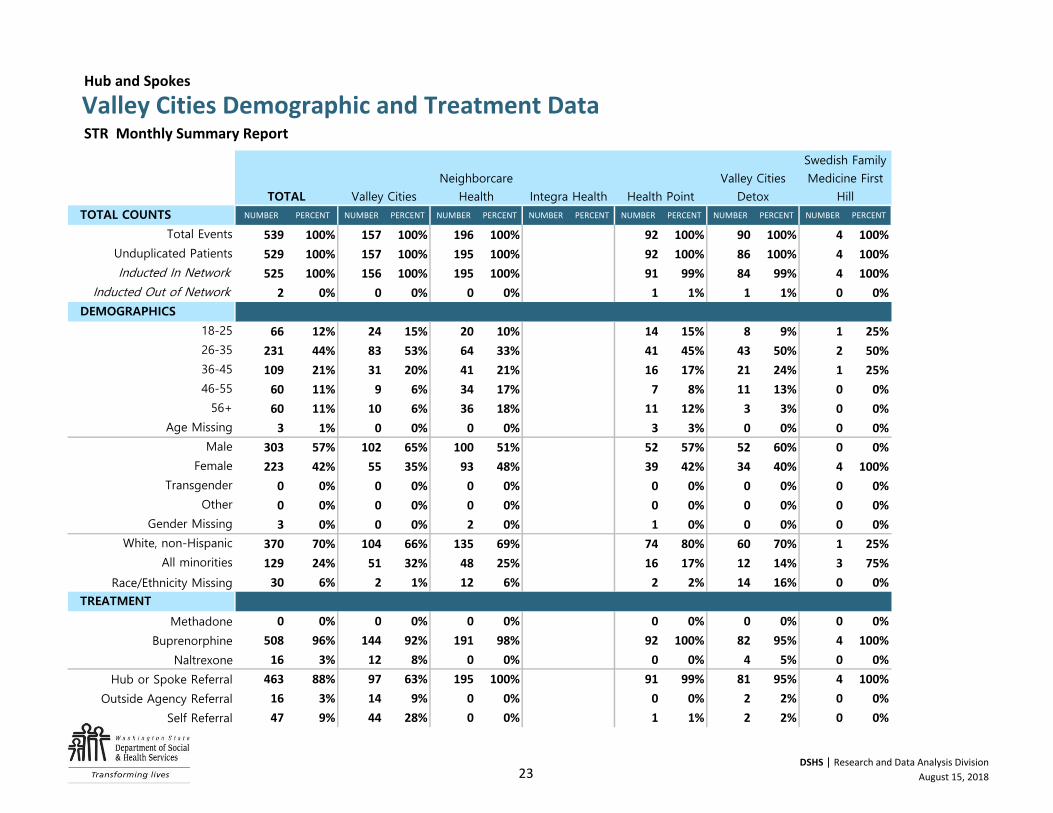
NUMBER PERCENT NUMBER PERCENT NUMBER PERCENT NUMBER PERCENT NUMBER PERCENT NUMBER PERCENT NUMBER PERCENT
539 100% 157 100% 196 100% . . 92 100% 90 100% 4 100%
529 100% 157 100% 195 100% . . 92 100% 86 100% 4 100%
525 100% 156 100% 195 100% . . 91 99% 84 99% 4 100%
2 0% 0 0% 0 0% . . 1 1% 1 1% 0 0%
66 12% 24 15% 20 10% . . 14 15% 8 9% 1 25%
231 44% 83 53% 64 33% . . 41 45% 43 50% 2 50%
109 21% 31 20% 41 21% . . 16 17% 21 24% 1 25%
60 11% 9 6% 34 17% . . 7 8% 11 13% 0 0%
60 11% 10 6% 36 18% . . 11 12% 3 3% 0 0%
3 1% 0 0% 0 0% . . 3 3% 0 0% 0 0%
303 57% 102 65% 100 51% . . 52 57% 52 60% 0 0%
223 42% 55 35% 93 48% . . 39 42% 34 40% 4 100%
0 0% 0 0% 0 0% ###### ###### 0 0% 0 0% 0 0%
0 0% 0 0% 0 0% . . 0 0% 0 0% 0 0%
3 0% 0 0% 2 0% . . 1 0% 0 0% 0 0%
370 70% 104 66% 135 69% . . 74 80% 60 70% 1 25%
129 24% 51 32% 48 25% . . 16 17% 12 14% 3 75%
30 6% 2 1% 12 6% . . 2 2% 14 16% 0 0%
0 0% 0 0% 0 0% . . 0 0% 0 0% 0 0%
508 96% 144 92% 191 98% ###### ###### 92 100% 82 95% 4 100%
16 3% 12 8% 0 0% ###### ###### 0 0% 4 5% 0 0%
463 88% 97 63% 195 100% . . 91 99% 81 95% 4 100%
16 3% 14 9% 0 0% . . 0 0% 2 2% 0 0%
47 9% 44 28% 0 0% . . 1 1% 2 2% 0 0%
Valley Cities Demographic and Treatment Data Hub and Spokes
Inducted In Network
Inducted Out of Network
DEMOGRAPHICS
Health Point
Valley Cities
Detox
Swedish Family
Medicine First
Hill
TOTAL COUNTS
STR Monthly Summary Report
TOTAL Valley Cities
Neighborcare
Health Integra Health
Total Events
Unduplicated Patients
Self Referral
Methadone
Buprenorphine
Naltrexone
Hub or Spoke Referral
Outside Agency Referral
Gender Missing
White, non-Hispanic
All minorities
Race/Ethnicity Missing
TREATMENT
Age Missing
Male
Female
Transgender
Other
18-25
26-35
36-45
46-55
56+
23DSHS | Research and Data Analysis Division
August 15, 2018