Embed Size (px)
Citation preview
Results from the 2017 Washington State Syringe Exchange Health Survey
January 2018
Washington State Syringe Exchange Health Survey: 2017 Results
Caleb Banta-Green, Alison Newman, Susan Kingston Key Findings
• Methamphetamine use among people who inject drugs appears to be increasing. Eighty-two percent (82%) reported using methamphetamine in the last three months compared to 69% in 2015.
• About half of people who used methamphetamine as their main drug were interested in reducing or stopping their stimulant use (47%).
• Most people who used heroin as their main drug were interested in reducing or stopping their opioid use (78%).
• The proportion of people who used opioids who had a naloxone kit more than doubled from 24% in 2015 to 59% in 2017 among those outside of King County. The increase was from 47% to 66% in King County.
• Syringe exchange participants have a wide and complex range of health concerns beyond substance use and face multiple hurdles and stigma when accessing health care.
Background Currently in Washington State there are at least 25 syringe exchange programs (SEPs) operating in 18 counties through local health departments, community-based organizations, or tribal entities. While syringe exchange is fully legal in WA State, some of these programs operate discreetly due to local political or cultural sensitivities. Syringe exchange programs vary widely in terms of operating hours, budget and staffing capacity, the number of syringes exchanged annually, and auxiliary services provided.1 Operating at fixed sites and/or through mobile outreach, SEPs:
• Exchange new syringes for used ones to prevent the spread of infectious disease (e.g., HIV, hepatitis C) through syringe sharing.
• Distribute clean injection equipment (e.g., cookers, cottons2, alcohol wipes) to prevent bacterial and viral infections from non-sterile injection practices.
• Provide overdose prevention education and naloxone, the opioid overdose antidote.
• Offer other health services such as HIV and hepatitis C testing, wound care, and health insurance enrollment.
• Provide referrals and linkage to drug treatment.
1 Overview of Syringe Exchange Operations in Washington State, 2015. http://adai.uw.edu/pubs. 2 These are materials typically needed to prepare drugs for injection, any of which can transmit HIV or hepatitis C when shared or cause bacterial infections when re-used or shared. Using new syringes and equipment for each injection can help avoid these infections.
Washington State Syringe Exchange Health Survey: 2017 Results 2 | P a g e
A conservative estimate of the number of people who inject illicit drugs (PWID) in Washington State is 33,318.3 While the prevalence of HIV has generally remained low among PWID in WA State (approximately 2%-4%),4 the most recent National HIV Behavioral Surveillance study estimated the prevalence of hepatitis C within this population to be 66% in King County.5 Deaths from methamphetamine have also been steadily increasing since 2010; there were 364 methamphetamine-related deaths in 2016, a substantial increase from 2010 when there 120. Forty-three percent (43%) of these deaths also involved an opioid in 2016.6
In 2015, the University of Washington’s Alcohol & Drug Abuse Institute (ADAI) collaborated with 18 WA State SEPs to conduct the first ever statewide survey of syringe exchange participants to profile health behaviors and health care needs and preferences of PWID in WA State.7 The survey was updated and conducted again in the summer of 2017 among these same SEPs, minus one SEP that opted out and one SEP joining. Collectively, these participating SEPs account for approximately 80% of syringes exchanged annually in the state. Methods ADAI developed the survey in consultation with staff from several SEPs and from the Public Health-Seattle & King County (PHSKC) HIV/STD Program. PHSKC used a modified version of the survey at their syringe exchange sites to accommodate data needs particular to King County. Therefore, some data presented in this report do not include responses from King County. No direct, personal identifiers were collected, and the Washington State Institutional Review Board determined that the project was not human subjects research. SEP staff and volunteers administered the voluntary, face-to-face questionnaire to individuals as they came in for syringe exchange services. Survey questions explored:
• Client demographics.
• Drug use and injection practices.
• Utilization of syringe exchange and other health care services.
• Prevalence of opioid overdose, overdose risks, and naloxone.
• Prevalence of stimulant overdose.
• Primary health concerns and health care access barriers.
• Interest in reducing or stopping drug use.
• Interest in specific services to help reduce or stop drug use. PHSKC collected data electronically at its sites, while the other SEPs collected data using a paper survey that were then entered into a database by ADAI staff.
3 This estimate is based upon injection patterns and syringe usage reported by clients in the 2017 survey, which indicated an average of 567 syringes used per year per person and an estimate of 18,908,685 syringes distributed in WA State. The estimate is a substantial underestimate because 1) more syringes were distributed at SEPs than estimated here, and 2) many PWID also get some or all of their syringes at pharmacies or other SEPs not tallied here. Using a different method Public Health- Seattle & King County estimated 25,000 people who inject drugs in King County in 2017. 4 WA State HIV Surveillance Semiannual Report, 2016. WA State Department of Health. 5 HIV/AIDS Epidemiology Report 2016, Volume 85. HIV/AIDS Epidemiology Unit, Public Health – Seattle & King County and the Infectious Disease Assessment Unit, WA State Department of Health. 6 http://adai.washington.edu/WAdata/methamphetamine.htm. 7 Results from the 2015 WA State Drug Injector Health Survey. University of WA Alcohol & Drug Abuse Institute.
Washington State Syringe Exchange Health Survey: 2017 Results 3 | P a g e
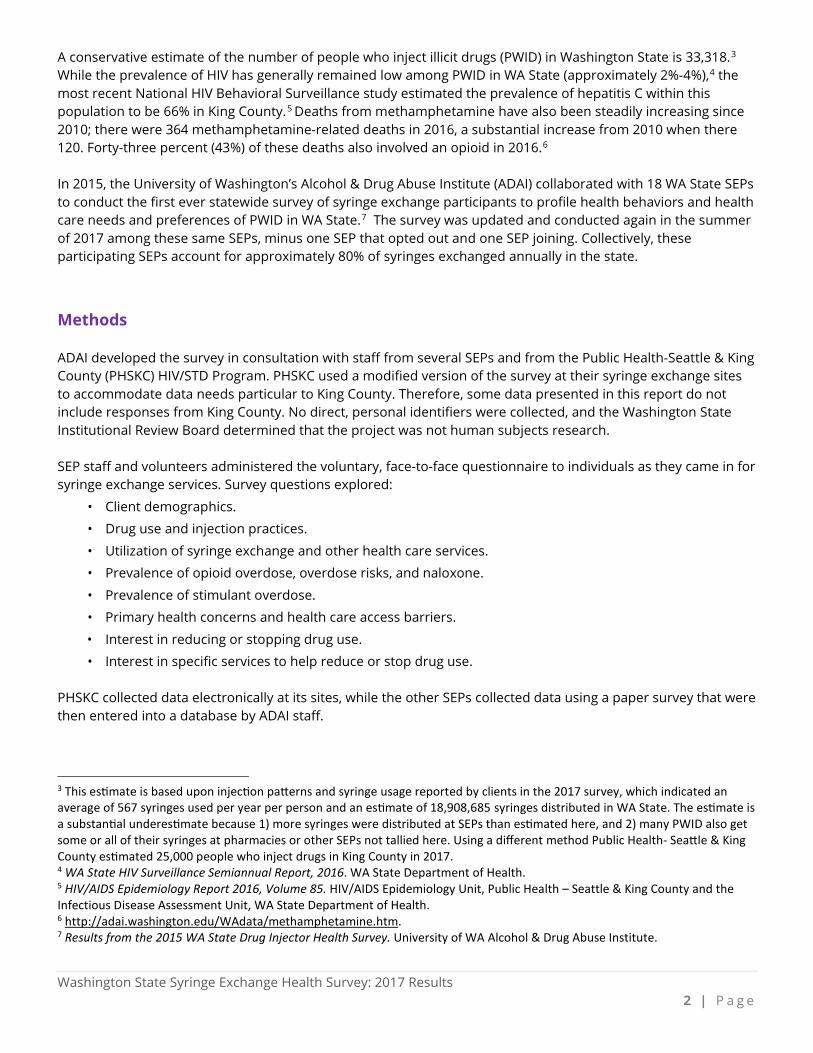
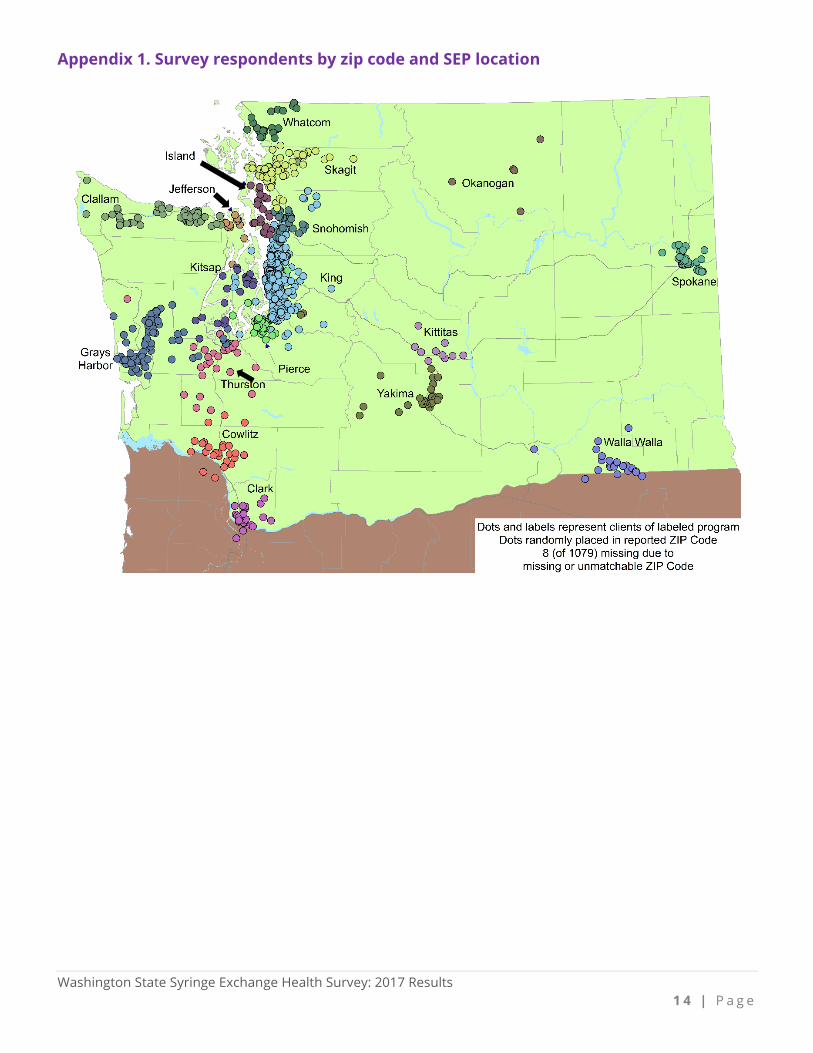
Results Eighteen SEPs in 18 counties agreed to participate and together collected 1,079 valid surveys (Table 1). Figure 1 shows the zip codes where participants lived (or had slept the previous night), color coded by the SEP at which they were surveyed. A more detailed map can be seen in Appendix 1.
Demographics
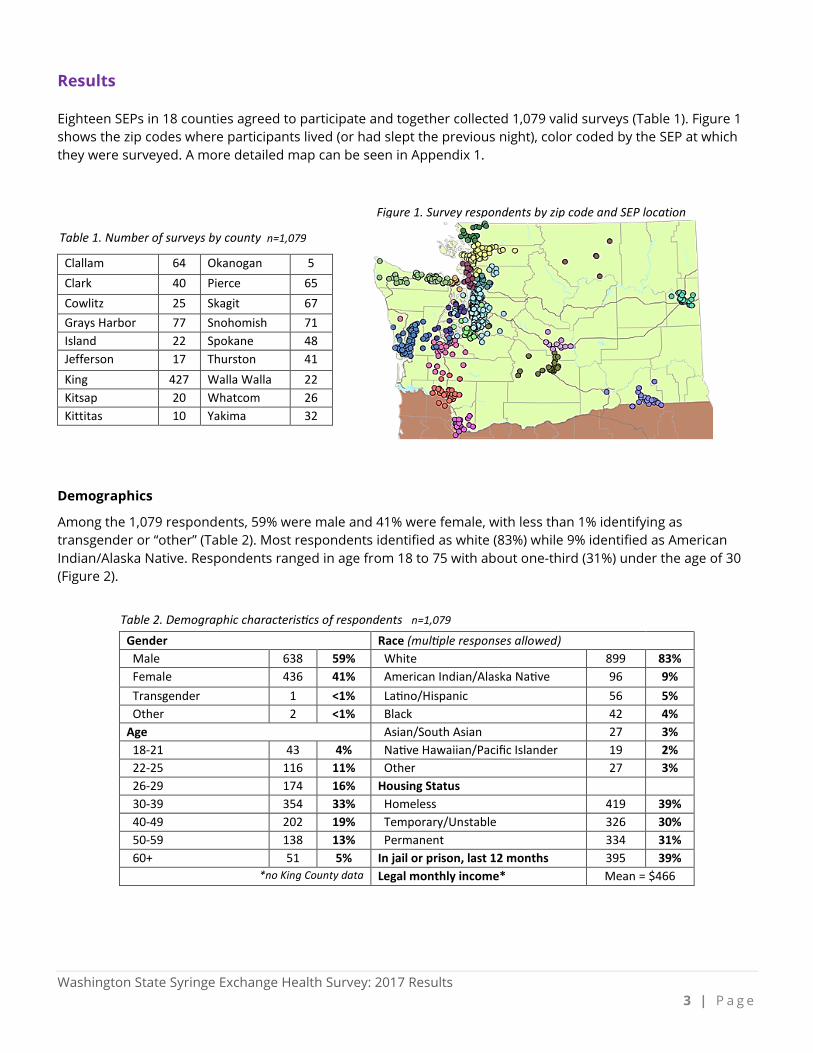
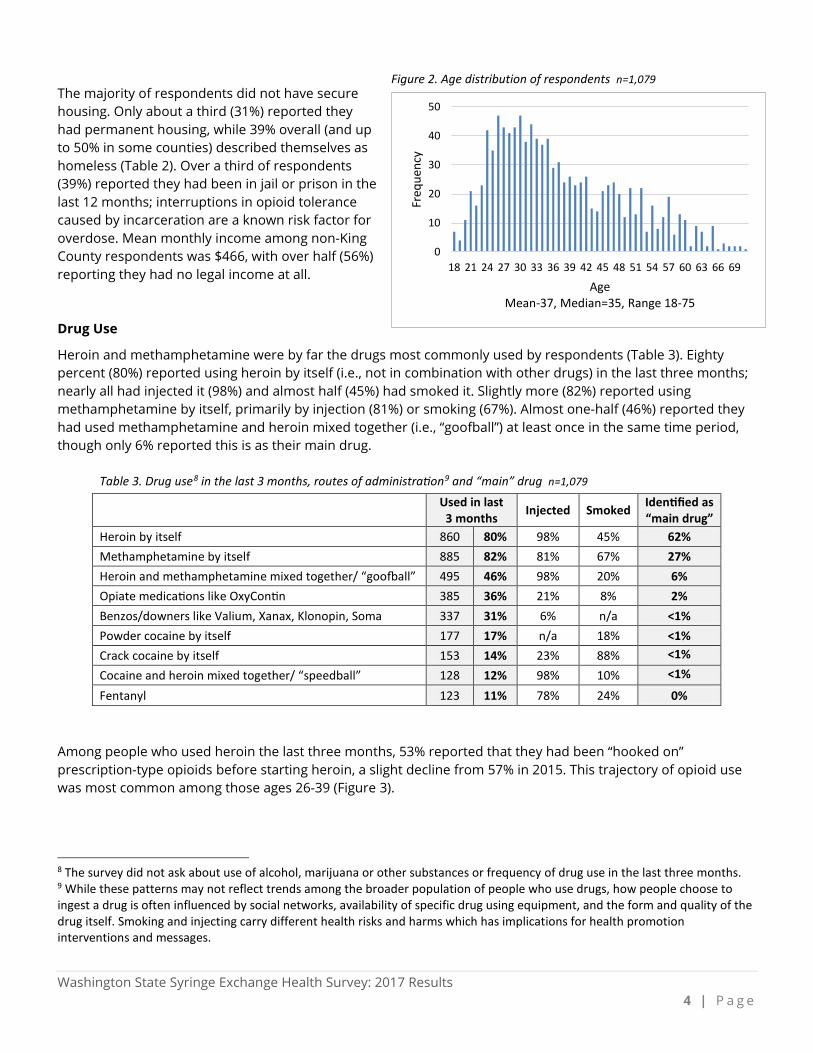
Among the 1,079 respondents, 59% were male and 41% were female, with less than 1% identifying as transgender or “other” (Table 2). Most respondents identified as white (83%) while 9% identified as American Indian/Alaska Native. Respondents ranged in age from 18 to 75 with about one-third (31%) under the age of 30 (Figure 2).
Table 1. Number of surveys by county n=1,079
Clallam 64 Okanogan 5 Clark 40 Pierce 65 Cowlitz 25 Skagit 67 Grays Harbor 77 Snohomish 71 Island 22 Spokane 48 Jefferson 17 Thurston 41 King 427 Walla Walla 22 Kitsap 20 Whatcom 26 Kittitas 10 Yakima 32
Table 2. Demographic characteristics of respondents n=1,079 Gender Race (multiple responses allowed) Male 638 59% White 899 83% Female 436 41% American Indian/Alaska Native 96 9% Transgender 1 <1% Latino/Hispanic 56 5% Other 2 <1% Black 42 4% Age Asian/South Asian 27 3% 18-21 43 4% Native Hawaiian/Pacific Islander 19 2% 22-25 116 11% Other 27 3% 26-29 174 16% Housing Status 30-39 354 33% Homeless 419 39% 40-49 202 19% Temporary/Unstable 326 30% 50-59 138 13% Permanent 334 31% 60+ 51 5% In jail or prison, last 12 months 395 39%
*no King County data Legal monthly income* Mean = $466
Figure 1. Survey respondents by zip code and SEP location
Washington State Syringe Exchange Health Survey: 2017 Results 4 | P a g e
The majority of respondents did not have secure housing. Only about a third (31%) reported they had permanent housing, while 39% overall (and up to 50% in some counties) described themselves as homeless (Table 2). Over a third of respondents (39%) reported they had been in jail or prison in the last 12 months; interruptions in opioid tolerance caused by incarceration are a known risk factor for overdose. Mean monthly income among non-King County respondents was $466, with over half (56%) reporting they had no legal income at all. Drug Use
Heroin and methamphetamine were by far the drugs most commonly used by respondents (Table 3). Eighty percent (80%) reported using heroin by itself (i.e., not in combination with other drugs) in the last three months; nearly all had injected it (98%) and almost half (45%) had smoked it. Slightly more (82%) reported using methamphetamine by itself, primarily by injection (81%) or smoking (67%). Almost one-half (46%) reported they had used methamphetamine and heroin mixed together (i.e., “goofball”) at least once in the same time period, though only 6% reported this is as their main drug.
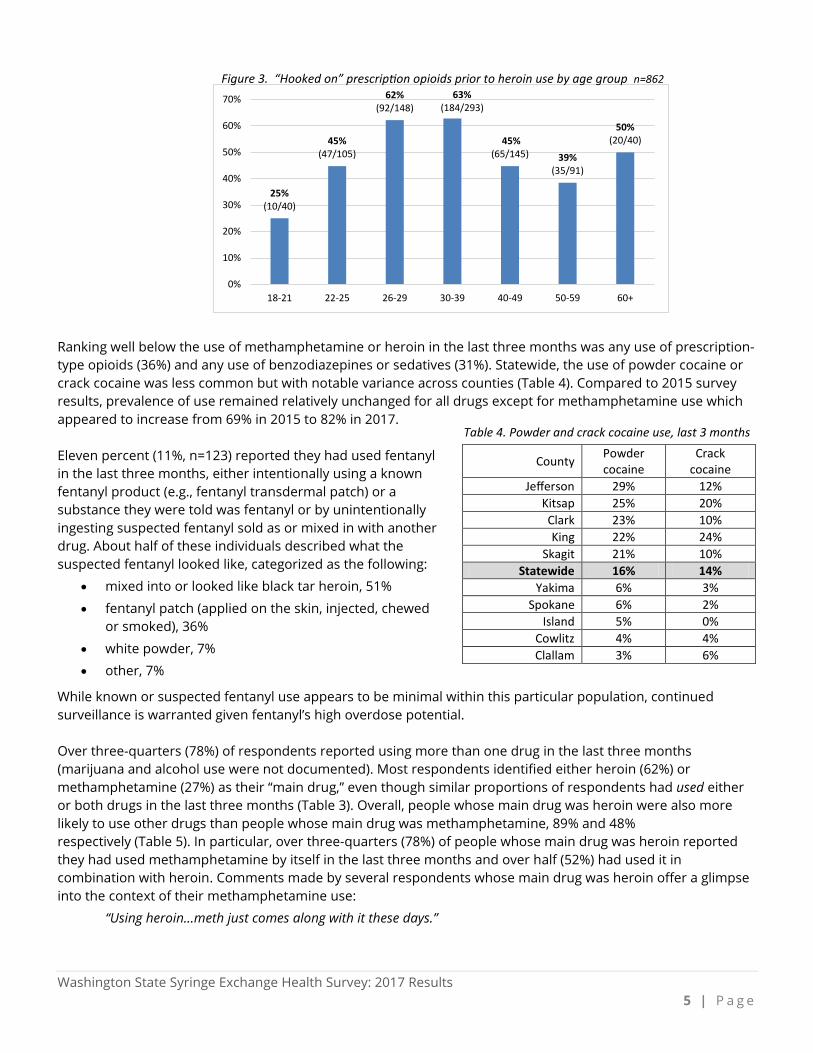
Among people who used heroin the last three months, 53% reported that they had been “hooked on” prescription-type opioids before starting heroin, a slight decline from 57% in 2015. This trajectory of opioid use was most common among those ages 26-39 (Figure 3). 8 The survey did not ask about use of alcohol, marijuana or other substances or frequency of drug use in the last three months. 9 While these patterns may not reflect trends among the broader population of people who use drugs, how people choose to ingest a drug is often influenced by social networks, availability of specific drug using equipment, and the form and quality of the drug itself. Smoking and injecting carry different health risks and harms which has implications for health promotion interventions and messages.
Table 3. Drug use8 in the last 3 months, routes of administration9 and “main” drug n=1,079
Used in last 3 months Injected Smoked Identified as
“main drug” Heroin by itself 860 80% 98% 45% 62% Methamphetamine by itself 885 82% 81% 67% 27% Heroin and methamphetamine mixed together/ “goofball” 495 46% 98% 20% 6% Opiate medications like OxyContin 385 36% 21% 8% 2% Benzos/downers like Valium, Xanax, Klonopin, Soma 337 31% 6% n/a <1% Powder cocaine by itself 177 17% n/a 18% <1% Crack cocaine by itself 153 14% 23% 88% <1%
Cocaine and heroin mixed together/ “speedball” 128 12% 98% 10% <1%
Fentanyl 123 11% 78% 24% 0%
Figure 2. Age distribution of respondents n=1,079
0
10
20
30
40
50
18 21 24 27 30 33 36 39 42 45 48 51 54 57 60 63 66 69
Freq
uenc
y
AgeMean-37, Median=35, Range 18-75
Washington State Syringe Exchange Health Survey: 2017 Results 5 | P a g e
Ranking well below the use of methamphetamine or heroin in the last three months was any use of prescription-type opioids (36%) and any use of benzodiazepines or sedatives (31%). Statewide, the use of powder cocaine or crack cocaine was less common but with notable variance across counties (Table 4). Compared to 2015 survey results, prevalence of use remained relatively unchanged for all drugs except for methamphetamine use which appeared to increase from 69% in 2015 to 82% in 2017. Eleven percent (11%, n=123) reported they had used fentanyl in the last three months, either intentionally using a known fentanyl product (e.g., fentanyl transdermal patch) or a substance they were told was fentanyl or by unintentionally ingesting suspected fentanyl sold as or mixed in with another drug. About half of these individuals described what the suspected fentanyl looked like, categorized as the following:
• mixed into or looked like black tar heroin, 51%
• fentanyl patch (applied on the skin, injected, chewed or smoked), 36%
• white powder, 7%
• other, 7%
While known or suspected fentanyl use appears to be minimal within this particular population, continued surveillance is warranted given fentanyl’s high overdose potential. Over three-quarters (78%) of respondents reported using more than one drug in the last three months (marijuana and alcohol use were not documented). Most respondents identified either heroin (62%) or methamphetamine (27%) as their “main drug,” even though similar proportions of respondents had used either or both drugs in the last three months (Table 3). Overall, people whose main drug was heroin were also more likely to use other drugs than people whose main drug was methamphetamine, 89% and 48% respectively (Table 5). In particular, over three-quarters (78%) of people whose main drug was heroin reported they had used methamphetamine by itself in the last three months and over half (52%) had used it in combination with heroin. Comments made by several respondents whose main drug was heroin offer a glimpse into the context of their methamphetamine use:
“Using heroin…meth just comes along with it these days.”
Table 4. Powder and crack cocaine use, last 3 months
County Powder cocaine
Crack cocaine
Jefferson 29% 12% Kitsap 25% 20% Clark 23% 10% King 22% 24%
Skagit 21% 10% Statewide 16% 14%
Yakima 6% 3% Spokane 6% 2%
Island 5% 0% Cowlitz 4% 4% Clallam 3% 6%
25%(10/40)
45%(47/105)
62%(92/148)
63%(184/293)
45%(65/145) 39%
(35/91)
50%(20/40)
0%
10%
20%
30%
40%
50%
60%
70%
18-21 22-25 26-29 30-39 40-49 50-59 60+
Figure 3. “Hooked on” prescription opioids prior to heroin use by age group n=862
Washington State Syringe Exchange Health Survey: 2017 Results 6 | P a g e
“I rarely buy meth to use it exclusively. It just comes with the heroin sometimes.”
“I used meth to come off heroin.”
“Quitting heroin would probably take care of my meth use too…get me out of the social network.” Drug Injection and Related Health Issues
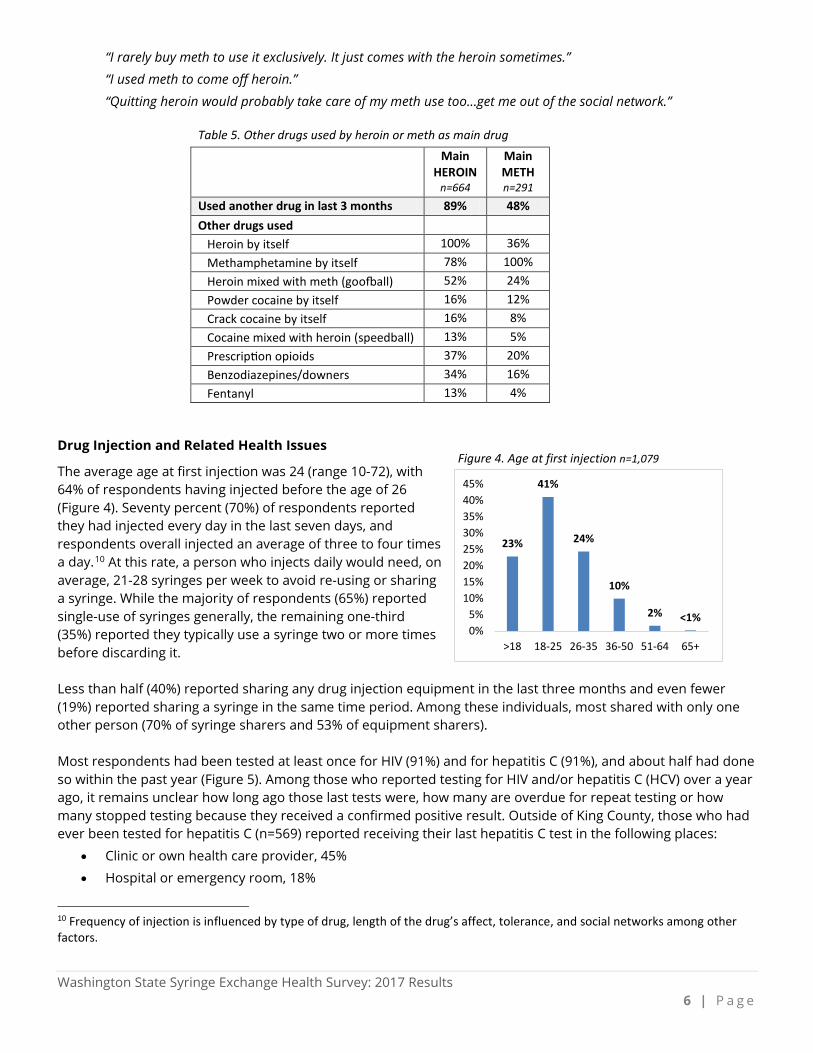
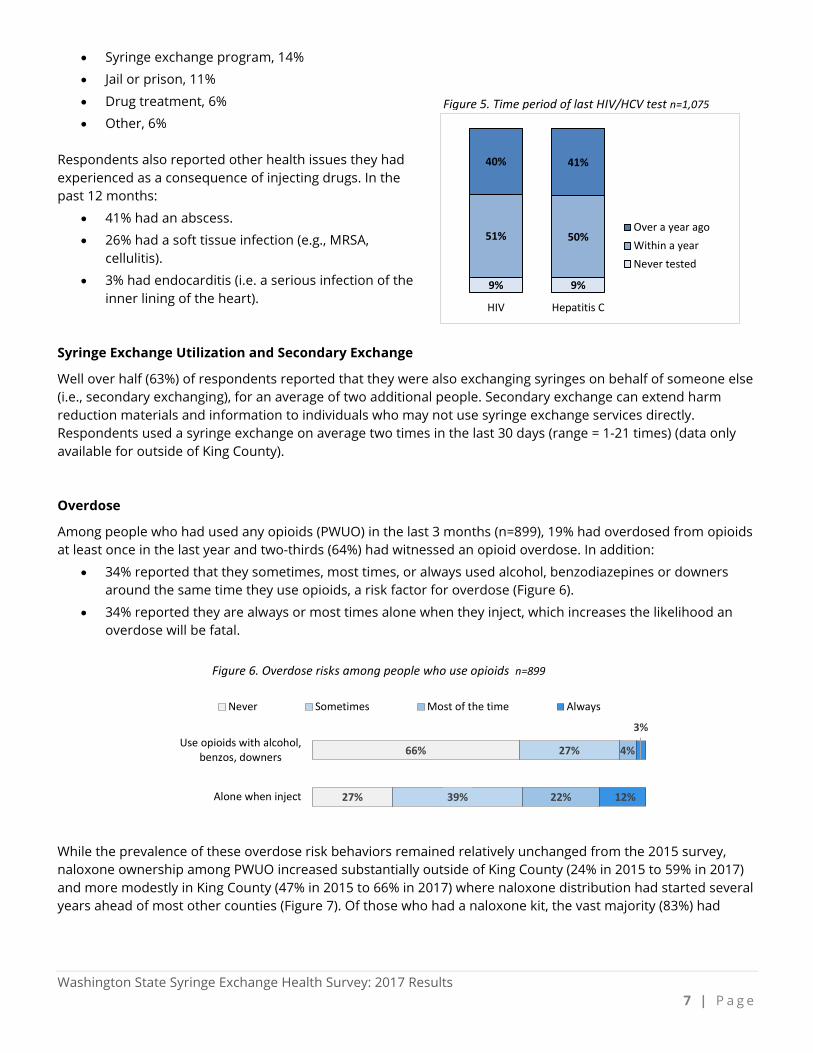
The average age at first injection was 24 (range 10-72), with 64% of respondents having injected before the age of 26 (Figure 4). Seventy percent (70%) of respondents reported they had injected every day in the last seven days, and respondents overall injected an average of three to four times a day.10 At this rate, a person who injects daily would need, on average, 21-28 syringes per week to avoid re-using or sharing a syringe. While the majority of respondents (65%) reported single-use of syringes generally, the remaining one-third (35%) reported they typically use a syringe two or more times before discarding it. Less than half (40%) reported sharing any drug injection equipment in the last three months and even fewer (19%) reported sharing a syringe in the same time period. Among these individuals, most shared with only one other person (70% of syringe sharers and 53% of equipment sharers). Most respondents had been tested at least once for HIV (91%) and for hepatitis C (91%), and about half had done so within the past year (Figure 5). Among those who reported testing for HIV and/or hepatitis C (HCV) over a year ago, it remains unclear how long ago those last tests were, how many are overdue for repeat testing or how many stopped testing because they received a confirmed positive result. Outside of King County, those who had ever been tested for hepatitis C (n=569) reported receiving their last hepatitis C test in the following places:
• Clinic or own health care provider, 45%
• Hospital or emergency room, 18%
10 Frequency of injection is influenced by type of drug, length of the drug’s affect, tolerance, and social networks among other factors.
Table 5. Other drugs used by heroin or meth as main drug Main
HEROIN n=664
Main METH n=291
Used another drug in last 3 months 89% 48% Other drugs used Heroin by itself 100% 36% Methamphetamine by itself 78% 100% Heroin mixed with meth (goofball) 52% 24% Powder cocaine by itself 16% 12% Crack cocaine by itself 16% 8% Cocaine mixed with heroin (speedball) 13% 5% Prescription opioids 37% 20% Benzodiazepines/downers 34% 16% Fentanyl 13% 4%
23%
41%
24%
10%
2% <1%0%5%
10%15%20%25%30%35%40%45%
>18 18-25 26-35 36-50 51-64 65+
Figure 4. Age at first injection n=1,079
Washington State Syringe Exchange Health Survey: 2017 Results 7 | P a g e
• Syringe exchange program, 14%
• Jail or prison, 11%
• Drug treatment, 6%
• Other, 6% Respondents also reported other health issues they had experienced as a consequence of injecting drugs. In the past 12 months:
• 41% had an abscess.
• 26% had a soft tissue infection (e.g., MRSA, cellulitis).
• 3% had endocarditis (i.e. a serious infection of the inner lining of the heart).
Syringe Exchange Utilization and Secondary Exchange
Well over half (63%) of respondents reported that they were also exchanging syringes on behalf of someone else (i.e., secondary exchanging), for an average of two additional people. Secondary exchange can extend harm reduction materials and information to individuals who may not use syringe exchange services directly. Respondents used a syringe exchange on average two times in the last 30 days (range = 1-21 times) (data only available for outside of King County). Overdose
Among people who had used any opioids (PWUO) in the last 3 months (n=899), 19% had overdosed from opioids at least once in the last year and two-thirds (64%) had witnessed an opioid overdose. In addition:
• 34% reported that they sometimes, most times, or always used alcohol, benzodiazepines or downers around the same time they use opioids, a risk factor for overdose (Figure 6).
• 34% reported they are always or most times alone when they inject, which increases the likelihood an overdose will be fatal.
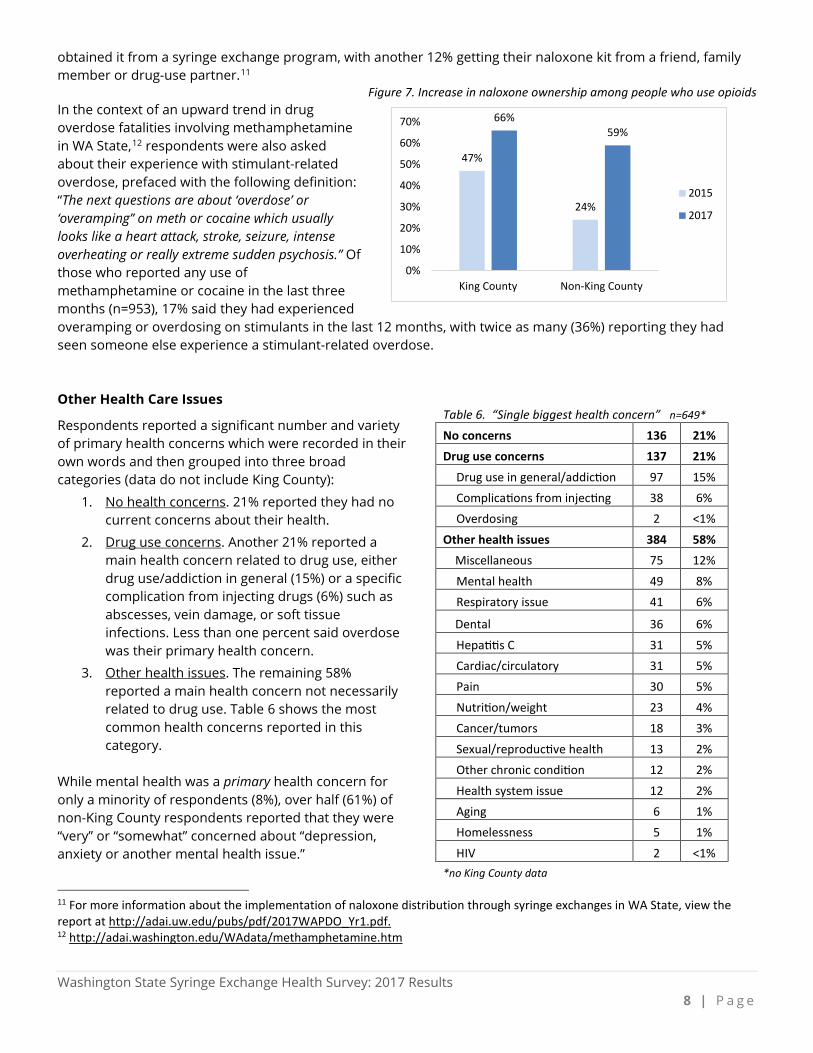
While the prevalence of these overdose risk behaviors remained relatively unchanged from the 2015 survey, naloxone ownership among PWUO increased substantially outside of King County (24% in 2015 to 59% in 2017) and more modestly in King County (47% in 2015 to 66% in 2017) where naloxone distribution had started several years ahead of most other counties (Figure 7). Of those who had a naloxone kit, the vast majority (83%) had
9% 9%
51% 50%
40% 41%
HIV Hepatitis C
Over a year agoWithin a yearNever tested
Figure 5. Time period of last HIV/HCV test n=1,075
66%
27%
27%
39%
4%
22%
3%
12%
Use opioids with alcohol,benzos, downers
Alone when inject
Never Sometimes Most of the time Always
Figure 6. Overdose risks among people who use opioids n=899
Washington State Syringe Exchange Health Survey: 2017 Results 8 | P a g e
obtained it from a syringe exchange program, with another 12% getting their naloxone kit from a friend, family member or drug-use partner.11
Figure 7. Increase in naloxone ownership among people who use opioids In the context of an upward trend in drug overdose fatalities involving methamphetamine in WA State,12 respondents were also asked about their experience with stimulant-related overdose, prefaced with the following definition: “The next questions are about ‘overdose’ or ‘overamping’’ on meth or cocaine which usually looks like a heart attack, stroke, seizure, intense overheating or really extreme sudden psychosis.” Of those who reported any use of methamphetamine or cocaine in the last three months (n=953), 17% said they had experienced overamping or overdosing on stimulants in the last 12 months, with twice as many (36%) reporting they had seen someone else experience a stimulant-related overdose. Other Health Care Issues
Respondents reported a significant number and variety of primary health concerns which were recorded in their own words and then grouped into three broad categories (data do not include King County):
1. No health concerns. 21% reported they had no current concerns about their health.
2. Drug use concerns. Another 21% reported a main health concern related to drug use, either drug use/addiction in general (15%) or a specific complication from injecting drugs (6%) such as abscesses, vein damage, or soft tissue infections. Less than one percent said overdose was their primary health concern.
3. Other health issues. The remaining 58% reported a main health concern not necessarily related to drug use. Table 6 shows the most common health concerns reported in this category.
While mental health was a primary health concern for only a minority of respondents (8%), over half (61%) of non-King County respondents reported that they were “very” or “somewhat” concerned about “depression, anxiety or another mental health issue.” 11 For more information about the implementation of naloxone distribution through syringe exchanges in WA State, view the report at http://adai.uw.edu/pubs/pdf/2017WAPDO_Yr1.pdf. 12 http://adai.washington.edu/WAdata/methamphetamine.htm
Table 6. “Single biggest health concern” n=649* No concerns 136 21% Drug use concerns 137 21%
Drug use in general/addiction 97 15% Complications from injecting 38 6% Overdosing 2 <1%
Other health issues 384 58% Miscellaneous 75 12%
Mental health 49 8% Respiratory issue 41 6%
Dental 36 6% Hepatitis C 31 5% Cardiac/circulatory 31 5% Pain 30 5% Nutrition/weight 23 4% Cancer/tumors 18 3% Sexual/reproductive health 13 2% Other chronic condition 12 2% Health system issue 12 2% Aging 6 1% Homelessness 5 1% HIV 2 <1%
*no King County data
47%
24%
66%59%
0%
10%
20%
30%
40%
50%
60%
70%
King County Non-King County
2015
2017
Washington State Syringe Exchange Health Survey: 2017 Results 9 | P a g e
Seven percent (7%, n=28) of female respondents under age 50 had been pregnant in the last 12 months. Six percent (6%) of non-King County respondents had a sexually transmitted disease in the last 12 months. Health Care Utilization
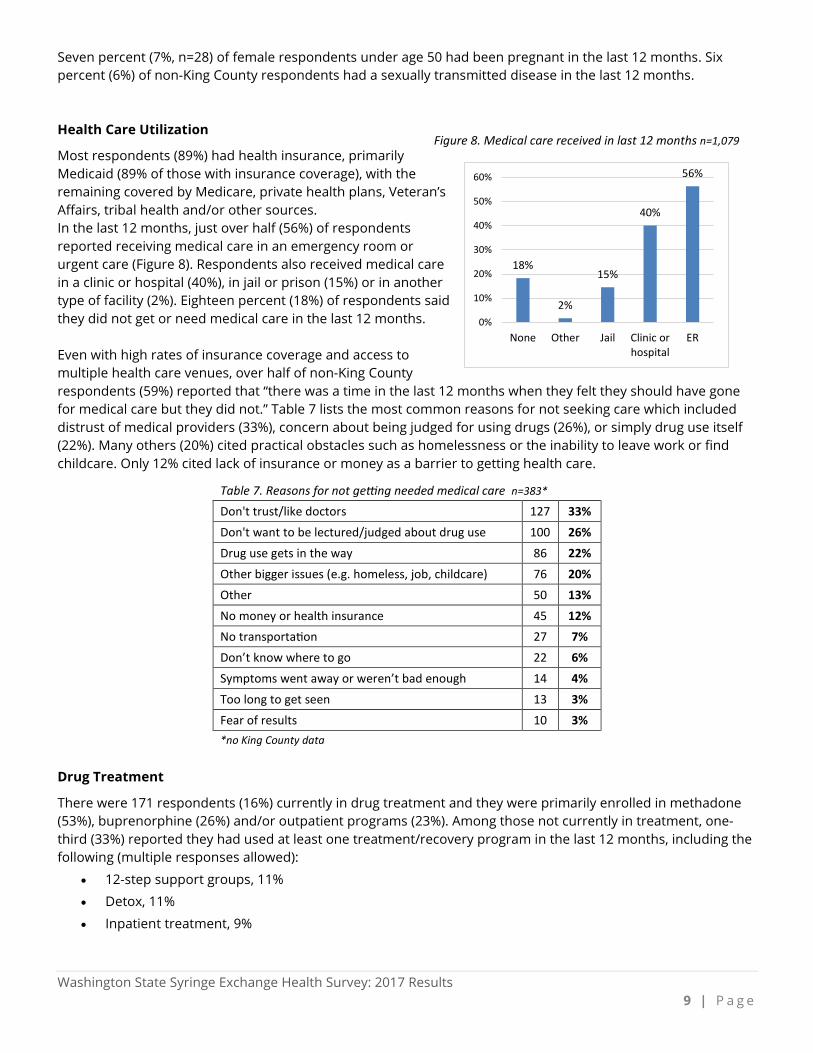
Most respondents (89%) had health insurance, primarily Medicaid (89% of those with insurance coverage), with the remaining covered by Medicare, private health plans, Veteran’s Affairs, tribal health and/or other sources. In the last 12 months, just over half (56%) of respondents reported receiving medical care in an emergency room or urgent care (Figure 8). Respondents also received medical care in a clinic or hospital (40%), in jail or prison (15%) or in another type of facility (2%). Eighteen percent (18%) of respondents said they did not get or need medical care in the last 12 months. Even with high rates of insurance coverage and access to multiple health care venues, over half of non-King County respondents (59%) reported that “there was a time in the last 12 months when they felt they should have gone for medical care but they did not.” Table 7 lists the most common reasons for not seeking care which included distrust of medical providers (33%), concern about being judged for using drugs (26%), or simply drug use itself (22%). Many others (20%) cited practical obstacles such as homelessness or the inability to leave work or find childcare. Only 12% cited lack of insurance or money as a barrier to getting health care.
Table 7. Reasons for not getting needed medical care n=383* Don't trust/like doctors 127 33% Don't want to be lectured/judged about drug use 100 26% Drug use gets in the way 86 22% Other bigger issues (e.g. homeless, job, childcare) 76 20% Other 50 13% No money or health insurance 45 12% No transportation 27 7% Don’t know where to go 22 6% Symptoms went away or weren’t bad enough 14 4% Too long to get seen 13 3% Fear of results 10 3% *no King County data
Drug Treatment
There were 171 respondents (16%) currently in drug treatment and they were primarily enrolled in methadone (53%), buprenorphine (26%) and/or outpatient programs (23%). Among those not currently in treatment, one-third (33%) reported they had used at least one treatment/recovery program in the last 12 months, including the following (multiple responses allowed):
• 12-step support groups, 11%
• Detox, 11%
• Inpatient treatment, 9%
18%
2%
15%
40%
56%
0%
10%
20%
30%
40%
50%
60%
None Other Jail Clinic orhospital
ER
Figure 8. Medical care received in last 12 months n=1,079
Washington State Syringe Exchange Health Survey: 2017 Results 1 0 | P a g e
• Buprenorphine, 9%
• Methadone, 8%
• Outpatient treatment, 7%
• Other, 1%
• Naltrexone, <1% Interest in Reducing or Stopping Drug Use
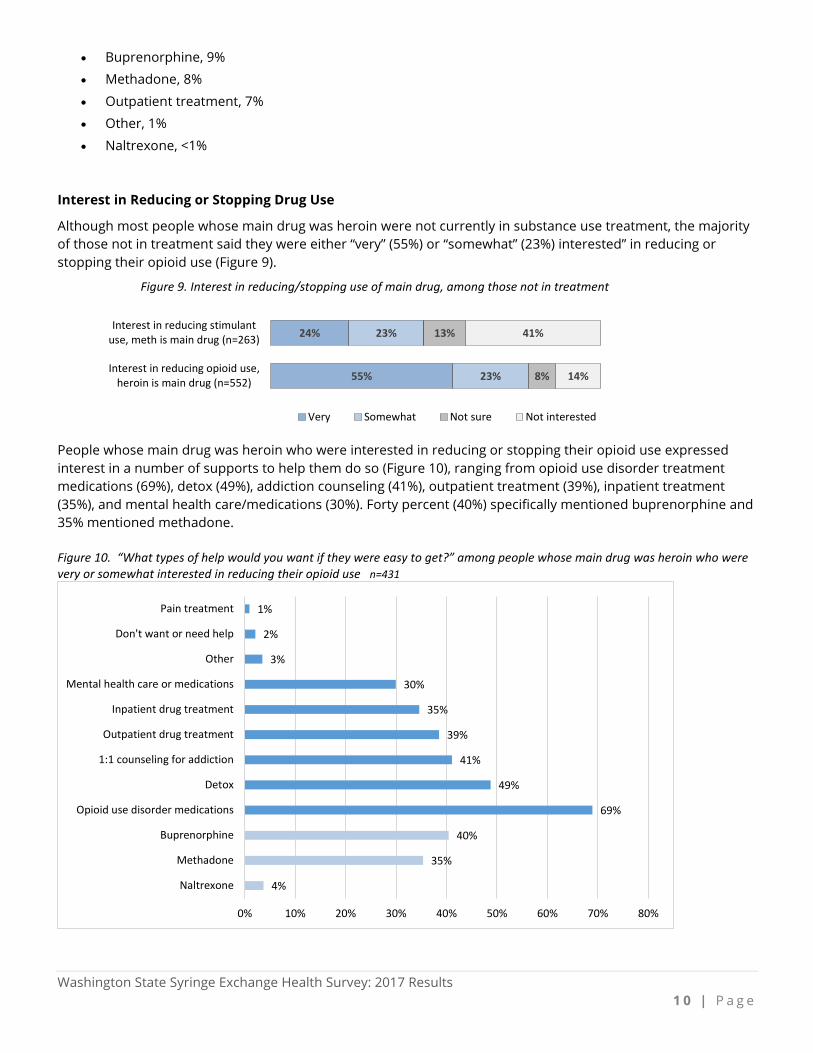
Although most people whose main drug was heroin were not currently in substance use treatment, the majority of those not in treatment said they were either “very” (55%) or “somewhat” (23%) interested” in reducing or stopping their opioid use (Figure 9).
People whose main drug was heroin who were interested in reducing or stopping their opioid use expressed interest in a number of supports to help them do so (Figure 10), ranging from opioid use disorder treatment medications (69%), detox (49%), addiction counseling (41%), outpatient treatment (39%), inpatient treatment (35%), and mental health care/medications (30%). Forty percent (40%) specifically mentioned buprenorphine and 35% mentioned methadone. Figure 10. “What types of help would you want if they were easy to get?” among people whose main drug was heroin who were very or somewhat interested in reducing their opioid use n=431
55%
24%
23%
23%
8%
13%
14%
41%
Interest in reducing opioid use,heroin is main drug (n=552)
Interest in reducing stimulantuse, meth is main drug (n=263)
Figure 9. Interest in reducing/stopping use of main drug, among those not in treatment
Very Somewhat Not sure Not interested
4%
35%
40%
69%
49%
41%
39%
35%
30%
3%
2%
1%
0% 10% 20% 30% 40% 50% 60% 70% 80%
Naltrexone
Methadone
Buprenorphine
Opioid use disorder medications
Detox
1:1 counseling for addiction
Outpatient drug treatment
Inpatient drug treatment
Mental health care or medications
Other
Don't want or need help
Pain treatment
Washington State Syringe Exchange Health Survey: 2017 Results 1 1 | P a g e
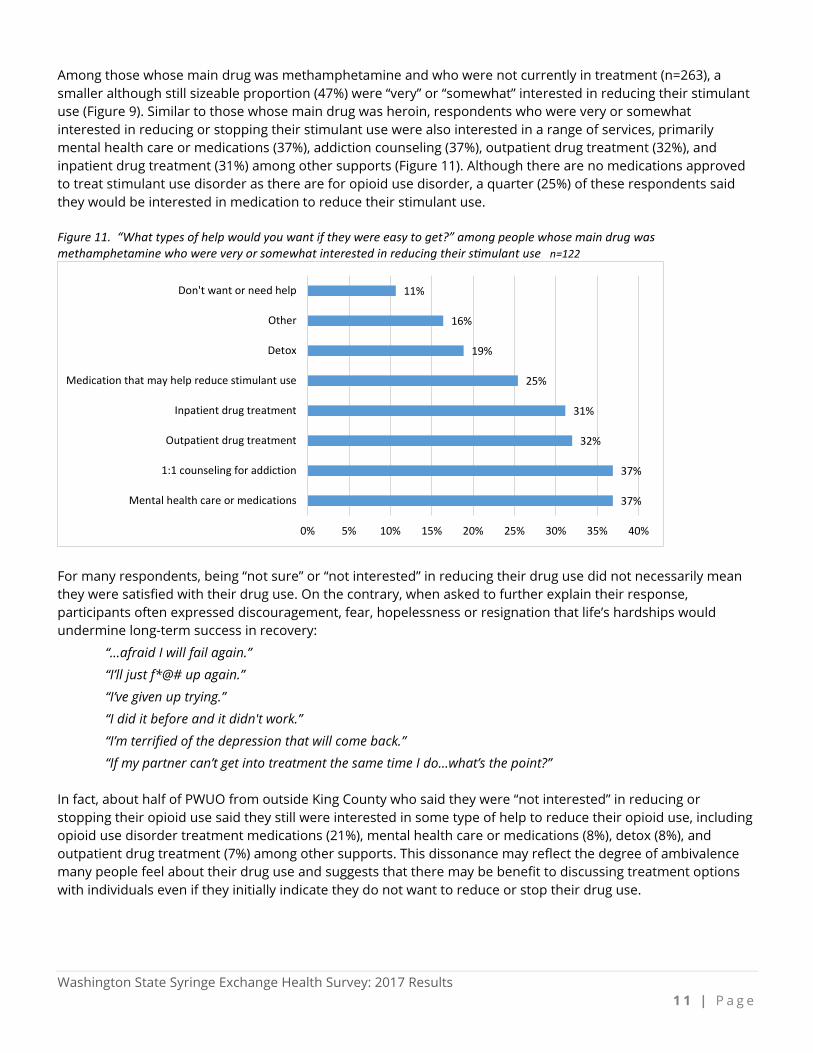
Among those whose main drug was methamphetamine and who were not currently in treatment (n=263), a smaller although still sizeable proportion (47%) were “very” or “somewhat” interested in reducing their stimulant use (Figure 9). Similar to those whose main drug was heroin, respondents who were very or somewhat interested in reducing or stopping their stimulant use were also interested in a range of services, primarily mental health care or medications (37%), addiction counseling (37%), outpatient drug treatment (32%), and inpatient drug treatment (31%) among other supports (Figure 11). Although there are no medications approved to treat stimulant use disorder as there are for opioid use disorder, a quarter (25%) of these respondents said they would be interested in medication to reduce their stimulant use. Figure 11. “What types of help would you want if they were easy to get?” among people whose main drug was methamphetamine who were very or somewhat interested in reducing their stimulant use n=122
For many respondents, being “not sure” or “not interested” in reducing their drug use did not necessarily mean they were satisfied with their drug use. On the contrary, when asked to further explain their response, participants often expressed discouragement, fear, hopelessness or resignation that life’s hardships would undermine long-term success in recovery:
“…afraid I will fail again.”
“I’ll just f*@# up again.”
“I’ve given up trying.”
“I did it before and it didn't work.”
“I’m terrified of the depression that will come back.”
“If my partner can’t get into treatment the same time I do…what’s the point?”
In fact, about half of PWUO from outside King County who said they were “not interested” in reducing or stopping their opioid use said they still were interested in some type of help to reduce their opioid use, including opioid use disorder treatment medications (21%), mental health care or medications (8%), detox (8%), and outpatient drug treatment (7%) among other supports. This dissonance may reflect the degree of ambivalence many people feel about their drug use and suggests that there may be benefit to discussing treatment options with individuals even if they initially indicate they do not want to reduce or stop their drug use.
37%
37%
32%
31%
25%
19%
16%
11%
0% 5% 10% 15% 20% 25% 30% 35% 40%
Mental health care or medications
1:1 counseling for addiction
Outpatient drug treatment
Inpatient drug treatment
Medication that may help reduce stimulant use
Detox
Other
Don't want or need help
Washington State Syringe Exchange Health Survey: 2017 Results 1 2 | P a g e
Discussion Across all SEPs, respondents shared a significant level of socioeconomic disadvantage and instability, with high rates of homelessness and incarceration, illustrating the complexity of needs many clients bring into syringe exchange programs. Lack of housing emerged as an underlying theme in several questions, cited by many respondents as either their primary health concern, a driving force behind their drug use, or an obstacle to getting needed medical care or sustaining recovery.
“Being homeless, meth[amphetamine] means I can walk around all night and not need to sleep.”
“I’m most concerned about all of the health problems I have caused by being homeless.”
“What am I going to do with all of my stuff while I’m in the hospital?”
“I’m not sure I could [quit drugs]. I’m homeless and any place I go people are using.” Sharing of syringes and other injection equipment was relatively low and testing rates for both HIV and hepatitis C were high. Respondents also appeared receptive to getting hepatitis C tests in a variety of venues. In this new era of shorter and highly effective treatment for hepatitis C, rigorous efforts to screen and link individuals to these treatments could also have preventative impact as well by reducing the prevalence of HCV in the community and reducing the risk of future infections. Nearly two-thirds (64%) of people who used opioids had witnessed an overdose in the last year, indicating that naloxone distribution through SEPs directly reaches a population highly likely to witness and quickly intervene in an overdose. Increases in methamphetamine-related deaths that also involve an opioid and the significant percentage of syringe exchange participants reporting both heroin and methamphetamine use are concerning. Naloxone distribution programs may want to consider broadening overdose prevention outreach to include individuals who use methamphetamine and/or have connections within these drug use networks. In addition, as this survey targeted people who primarily inject drugs, it remains unclear just how many individuals in these communities primarily smoke heroin and thus do not utilize syringe exchange services and have access to naloxone. Given that almost half of respondents who injected heroin reported they had also smoked heroin, there may be opportunities to extend the reach of naloxone to those who primarily smoke opioids via those who primarily inject. To do so, it will be important to learn how and to what extent these social networks intersect. Results showed that survey respondents, on the whole, have health care coverage, have multiple and diverse medical care needs and know where and how to get that needed care. Even so, 59% reported that there was a time they should have gone for health care but did not, largely due to perceptions of how poorly they would be treated or judged by healthcare providers. As a result, many may delay care until problems become more acute and costly to treat or avoid getting needed care altogether. More respondents reported getting medical care at an emergency room or urgent care in the last 12 months than from any other type of health care setting. Overall, respondents showed high levels of interest in stopping or decreasing their opioid and/or stimulant use, and the 2017 survey included several new questions to explore this interest. Over three-quarters (78%) of people whose main drug was heroin were interested in stopping or reducing their opioid use and with substantial interest in using opioid use disorder treatment medications, counseling, and social supports to do so. These findings are important as Washington State scales up access to treatment medications along with new models of care that emphasize faster initiation of these medications and longer retention in treatment over immediate and complete abstinence as an expectation of treatment. Medical practices, in particular, will need to address the perception of stigma as they increase their own capacity to provide opioid use disorder medications. Newly implemented buprenorphine treatment programs aimed at engaging high needs individuals (e.g., high rates of homelessness, poly substance use and concurrent high-acuity medical and mental health conditions) report difficulty finding treatment providers who will accept these complex patients for ongoing maintenance. Primary
Washington State Syringe Exchange Health Survey: 2017 Results 1 3 | P a g e
care buprenorphine maintenance prescribers urgently need clinical and technical support to retain patients in treatment, support their long-term recovery, and have a significant impact on opioid overdose and public health. Underappreciated until recently is the scale of methamphetamine use and associated mortality. For the first time a question was asked about “overamping” as an analog to overdose on opioids; this terminology is newer and still in development. Seventeen percent (17%) of people who used methamphetamine reported overamping in the prior year and 36% witnessed such an event. Overamping is important to understand as the number of fatal methamphetamine-involved overdoses has increased dramatically over the past five years across Washington State with 364 deaths in 2016, more than double the number and rate in 2011.13 Nearly half (47%) of people whose main drug was methamphetamine reported they were very or somewhat interested in reducing or stopping their stimulant use and with the help of a variety of services and support. Over a third (37%) indicated they were specifically interested in mental health care and/or medications to help reduce methamphetamine use. There is evidence that opioid use disorder treatment medications may be associated with decreased methamphetamine use as well as decreased opioid use.14 Primary care, mental health, and drug treatment providers should, therefore, engage people who use methamphetamine in conversations about their drug use and available supportive services. Although specific and effective models of treatment for stimulant use disorder, including the use of medications, are still being researched, existing substance use treatment services can be beneficial.15 The findings of this survey will help guide forthcoming work to better understand how to connect and retain people who use methamphetamine in life-saving care. Syringe exchanges have established trusting relationships with people who inject drugs and increasingly with diverse community stakeholders as well. SEPs are the experts on working with PWID and, via an array of federal and state funded projects, are increasingly providing valuable resources, including overdose education and naloxone to other services providers, first responders, and the broader community. SEPs are also becoming part of opioid treatment networks by directly providing treatment education, referrals and, in one instance, onsite treatment medications. Staff at SEPs are uniquely poised to provide onsite linkage for HIV, hepatitis C and substance use treatment; help clients navigate social service entry points; and facilitate the use of primary health care over more costly emergency department care. Public health and safety can be substantially improved by the services SEPs provide and by community agencies collaborating with SEPs and recognizing their vital role in community health. Acknowledgements The authors wish to thank the many syringe exchange staff, volunteers, and clients who participated in this survey. We also gratefully acknowledge Sara Glick, Joe Tinsley, and Kate Klein from Pubic Health – Seattle & King County and Anthony Floyd and Jason Williams from the University of Washington Alcohol & Drug Abuse Institute for their valuable contributions. This report was produced with support from the Washington State Department of Social and Health Services, Division of Behavioral Health and Recovery. Citation: Banta-Green CJ, Newman A, Kingston S. Washington State Syringe Exchange Health Survey: 2017 Results. Alcohol & Drug Abuse Institute, University of Washington, January 2018. http://adai.uw.edu/pubs/pdf/2017syringeexchangehealthsurvey.pdf
13 http://adai.washington.edu/WAdata/methamphetamine.htm. 14 The Effect of Buprenorphine on Methamphetamine Cravings. Salehi M, Emadossadat A, Kheirabadi GR, etal. Journal of Clinical Psychopharmacology. 35(6):724–727, Dec 2015. 15 https://www.drugabuse.gov/publications/research-reports/methamphetamine/what-treatments-are-effective-methamphetamine-abusers.
Washington State Syringe Exchange Health Survey: 2017 Results 1 4 | P a g e
Appendix 1. Survey respondents by zip code and SEP location


![Hypodermic syringe model[1]](https://img.pdfslide.us/doc/110x75/54061f2a8d7f729b768b51c7/hypodermic-syringe-model1.jpg)