Embed Size (px)
Citation preview

Washington State Department of Health Wastewater Management Program R U L E D E V E L O P M E N T C O M M I T T E E I S S U E R E S E A R C H R E P O R T
D R A F T - R E S I D E N T I A L F L O W R A T E S -
DOH Staff Researcher(s): Laura A. Benefield
Date Assigned: May 7, 2002
Date Completed: May 31, 2002
Research Requested by: : RDC TRC Other:
Issue Subject: TechnicalAdministrative
Regulatory Definitions
Issue ID: Technical Issue #7b
Specific WAC Section Reference, if WAC related: Section 246-272-11501
Topic & Issues:
Technical Issue 7b – Residential Flow Rates
1. Estimating Residential Flow Rates 2. Average Flow Rates vs. Peak Flow Rates 3. Infiltration and Inflow
Technical Review Committee Questions
1. Should daily flows for residential structures still be determined by number of
bedrooms? 2. Is the quantity used for gallons per day per bedroom currently used appropriate? 3. Should the “minimum” gpd design flow (240 gpd) be changed? 4. Has there been any attempt to equate other factors other than bedrooms for flows
– lifestyles, bedrooms, flows, square footage, etc.? 5. Should there be a link between design flows and actual flows? 6. Does daily design flow equal peak flow, peak-peak, or what? 7. Should inflow and infiltration be considered? 8. Should there be a link between square footage and daily design flows? 9. Should we consider a minimum square footage for a residential structure? 10. Should the information required for a permit be revised to include more information
on flows? 11. Should there be a description of non-residential flows?
Page 1 of 18

Washington State Department of Health Wastewater Management Program R U L E D E V E L O P M E N T C O M M I T T E E I S S U E R E S E A R C H R E P O R T – D R A F T
- R E S I D E N T I A L F L O W R A T E S - Summary: This report summarizes the literature on the topic of residential flow rates of on-site sewage systems. The purpose of the report is to perform a review of the literature available on the topic of residential flow rates and ways of quantifying those rates. On-site sewage system designs are based on potential flows and the ability of the soils to treat and dispose of the wastewater. Methods of estimating residential flow rates vary throughout the U.S. Estimated flows have been based on the number of persons, the number of bedrooms, and/or the size or square footage of the home. In Washington State, residential flow rates are based on 120 gallons per bedroom per day with a minimum design flow of 240 gallons per day. Estimated residential flow rates need to account for not only averages, but peak flows. Peak flows of short duration may or may not have a deleterious affect, however peak flows that continue for days (i.e. weekend guests) can induce hydraulic failure. Accounting for these events will extend the life of the on-site sewage system. Researchers agree that peak flows must be accounted for and that a safety factor should be included when estimating design flows. Keywords: Flow, gallons per day, bedroom, design, peak, residence, surge
Introduction: Estimating potential flow rates (gallons per day) is a significant design consideration. Potential flow rates are used in combination with the hydraulic capacity of the soil profile in order to avoid hydraulic overloading of the on-site sewage system. Currently Chapter 246-272 WAC requires use of 120 gallons per bedroom per day for single family residences with a minimum of 240 gallons per day unless technical justification is provided to support calculations using a lower design flow. Some counties within Washington State have adopted the use of 150 gallons per day per bedroom. Non-residential sources are required to estimate flow rates using the “Design Manual: On-site Wastewater Treatment and Disposal Systems”, United States Environmental Protection Agency, October, 1980; the Design Standards for Large On-site Sewage Systems”, 1993, Washington State Department of Health, or the “Criteria for Sewage Works Design”, October 1985, Washington State Department of Ecology. The purpose of this review is to synthesize the literature available on the topic of residential flow rates so that the Technical Review Committee can make appropriate recommendations about residential flow rate requirements to the Rule Development Committee. 9 publications were reviewed, which include peer reviewed journal articles, conference proceedings, and government reports as well as 50 state on-site sewage regulations. Even though the conference proceedings are typically not peer reviewed, they provided useful information regarding studies of average residential and non-residential flow rates.
Page 2 of 18
Washington State Department of Health Wastewater Management Program R U L E D E V E L O P M E N T C O M M I T T E E I S S U E R E S E A R C H R E P O R T – D R A F T
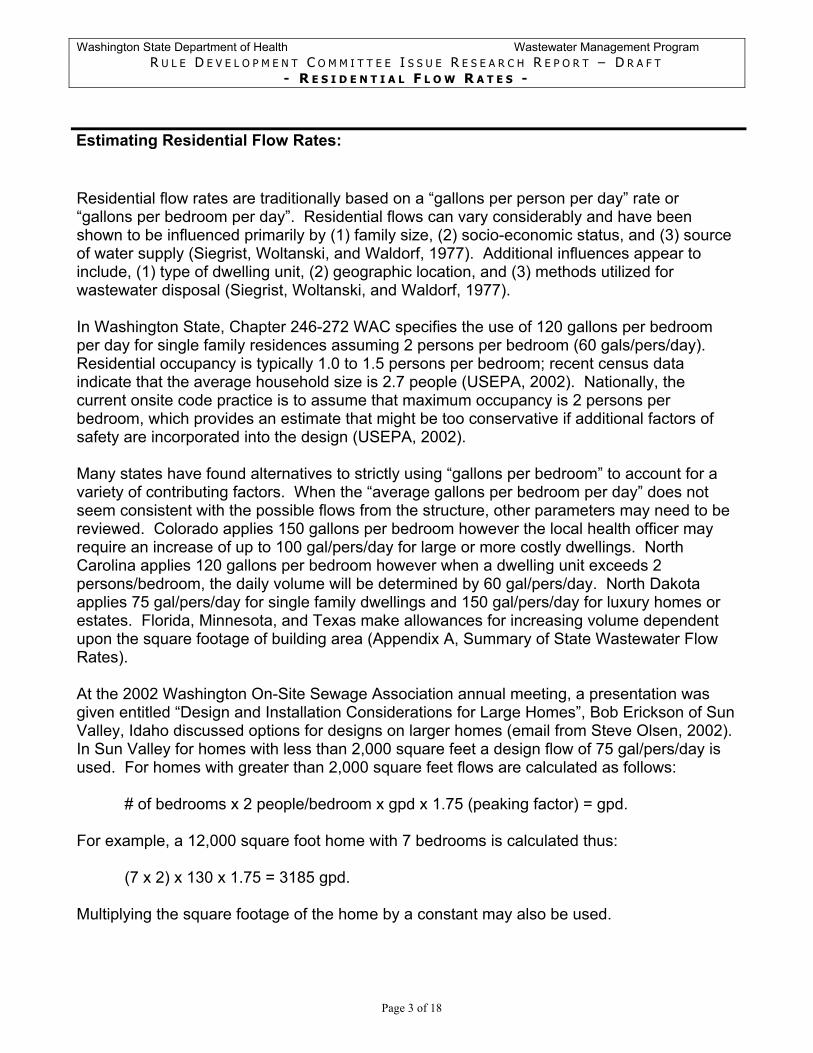
- R E S I D E N T I A L F L O W R A T E S - Estimating Residential Flow Rates: Residential flow rates are traditionally based on a “gallons per person per day” rate or “gallons per bedroom per day”. Residential flows can vary considerably and have been shown to be influenced primarily by (1) family size, (2) socio-economic status, and (3) source of water supply (Siegrist, Woltanski, and Waldorf, 1977). Additional influences appear to include, (1) type of dwelling unit, (2) geographic location, and (3) methods utilized for wastewater disposal (Siegrist, Woltanski, and Waldorf, 1977). In Washington State, Chapter 246-272 WAC specifies the use of 120 gallons per bedroom per day for single family residences assuming 2 persons per bedroom (60 gals/pers/day). Residential occupancy is typically 1.0 to 1.5 persons per bedroom; recent census data indicate that the average household size is 2.7 people (USEPA, 2002). Nationally, the current onsite code practice is to assume that maximum occupancy is 2 persons per bedroom, which provides an estimate that might be too conservative if additional factors of safety are incorporated into the design (USEPA, 2002). Many states have found alternatives to strictly using “gallons per bedroom” to account for a variety of contributing factors. When the “average gallons per bedroom per day” does not seem consistent with the possible flows from the structure, other parameters may need to be reviewed. Colorado applies 150 gallons per bedroom however the local health officer may require an increase of up to 100 gal/pers/day for large or more costly dwellings. North Carolina applies 120 gallons per bedroom however when a dwelling unit exceeds 2 persons/bedroom, the daily volume will be determined by 60 gal/pers/day. North Dakota applies 75 gal/pers/day for single family dwellings and 150 gal/pers/day for luxury homes or estates. Florida, Minnesota, and Texas make allowances for increasing volume dependent upon the square footage of building area (Appendix A, Summary of State Wastewater Flow Rates). At the 2002 Washington On-Site Sewage Association annual meeting, a presentation was given entitled “Design and Installation Considerations for Large Homes”, Bob Erickson of Sun Valley, Idaho discussed options for designs on larger homes (email from Steve Olsen, 2002). In Sun Valley for homes with less than 2,000 square feet a design flow of 75 gal/pers/day is used. For homes with greater than 2,000 square feet flows are calculated as follows:
# of bedrooms x 2 people/bedroom x gpd x 1.75 (peaking factor) = gpd. For example, a 12,000 square foot home with 7 bedrooms is calculated thus: (7 x 2) x 130 x 1.75 = 3185 gpd. Multiplying the square footage of the home by a constant may also be used.
Page 3 of 18

Washington State Department of Health Wastewater Management Program R U L E D E V E L O P M E N T C O M M I T T E E I S S U E R E S E A R C H R E P O R T – D R A F T
- R E S I D E N T I A L F L O W R A T E S -
Example: 1200 square foot home x 0.20 gallons/square foot/day = 240 gpd
The USEPA estimates average daily wastewater flows of approximately 50 to 70 gallons per person per day being typical of residential dwellings built before 1994 (USEPA, 2002). This average is based on a number of recent studies summarized in Table 1. The U.S. Energy Policy Act (EPACT) standards went into effect to improve water use efficiency nationwide reducing the “typical” average daily wastewater flows to the 40 to 60 gallons/person/day range (USEPA, 2002). Table 1 – Summary of average daily residential wastewater flowsa Study Number of Study duration Study average Study range residences (months) (gal/pers/day)b (gal/pers/day)b
Brown & Caldwell (1984)
210 66.2 (250.6) 57.3-73.0 (216.9-276.0)
Anderson & Siegrist (1989)
90 3 70.8 (268.0) 65.9-76.6 (249.4-289.9)
Anderson et al (1993) 25 3 50.7 (191.9) 26.1-85.2 (98.9-322.5)
Mayer et al. (1999) 1188 1c 69.3 (262.3) 57.1-83.5 (216.1-316.1)
Weighted Average 153 68.6 (259.7)
a Based on indoor water use monitoring and not wastewater flow monitoring. b Liters/person/day in parentheses. c Based on 2 weeks of continuous flow monitoring in each of two seasons at each home.
Identified in the USEPA Onsite Wastewater Treatment Systems Manual, the Residential End Uses of Water Study (REUWS) was the largest number of residential water users ever characterized and provided an evaluation of annual water use at 1,188 homes in 12 metropolitan areas in North America derived from some 1 million residential wastewater activities. The mean daily per capita indoor use (gal/pers/day) of all 12 study sites was 69.3 with the median daily per capita indoor use (gal/pers/day) as 60.5. The mean per capita flow ranged from 54 to 67 gallons/person/day and probably provides a better estimate of average daily flow for most homes given the distribution of mean per capita flows (USEPA, 2002). Unlike the USEPA’s calculations that extrapolate a decrease in flows due to the water conserving devices implemented under the U.S. Energy Policy Act, estimates of average daily wastewater flows within the remainder of the research appear to have increased over time. Research reports from the 1960’s to 1970’s use estimates of 40-50 gpcd (Bennett, et al 1974; Jones, 1974; Witt, et al 1974; Siegrist, 1974; Siegrist, et al 1977; Siegrist, 1977). Beginning in the 1980’s researchers found that average daily wastewater flows were higher and were also dependent on the types of dwellings. Rein Laak, in 1986, placed dwellings in
Page 4 of 18
Washington State Department of Health Wastewater Management Program R U L E D E V E L O P M E N T C O M M I T T E E I S S U E R E S E A R C H R E P O R T – D R A F T
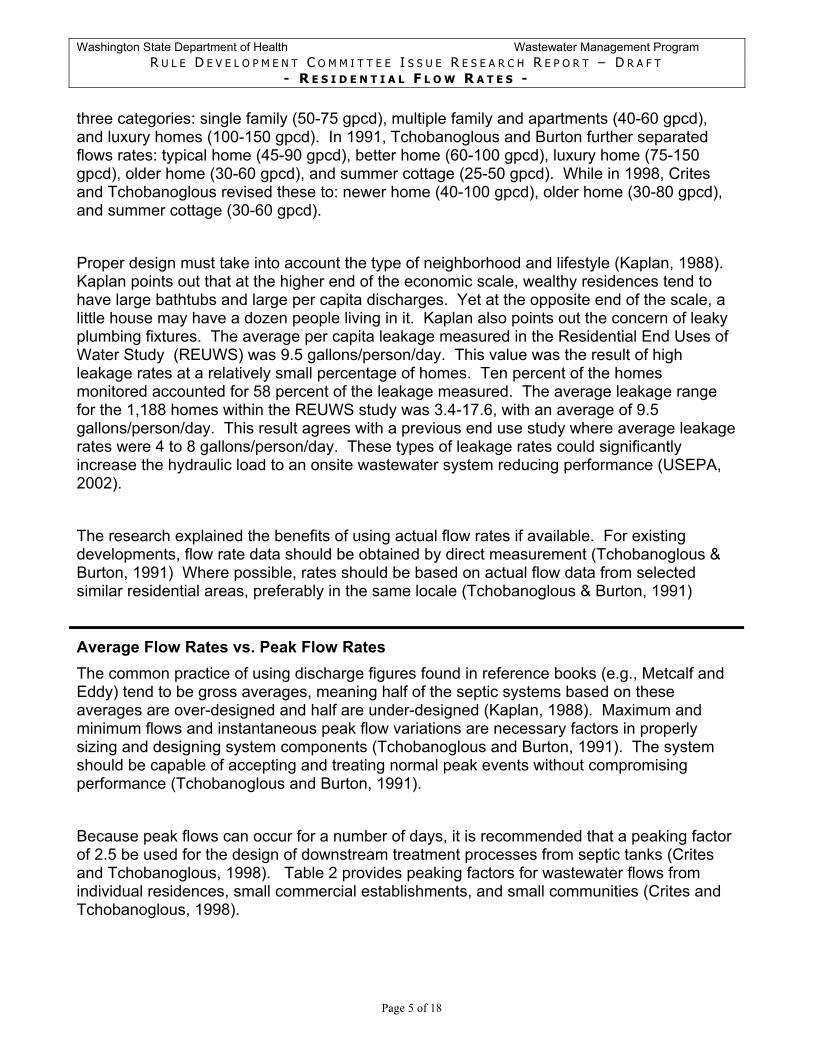
- R E S I D E N T I A L F L O W R A T E S - three categories: single family (50-75 gpcd), multiple family and apartments (40-60 gpcd), and luxury homes (100-150 gpcd). In 1991, Tchobanoglous and Burton further separated flows rates: typical home (45-90 gpcd), better home (60-100 gpcd), luxury home (75-150 gpcd), older home (30-60 gpcd), and summer cottage (25-50 gpcd). While in 1998, Crites and Tchobanoglous revised these to: newer home (40-100 gpcd), older home (30-80 gpcd), and summer cottage (30-60 gpcd). Proper design must take into account the type of neighborhood and lifestyle (Kaplan, 1988). Kaplan points out that at the higher end of the economic scale, wealthy residences tend to have large bathtubs and large per capita discharges. Yet at the opposite end of the scale, a little house may have a dozen people living in it. Kaplan also points out the concern of leaky plumbing fixtures. The average per capita leakage measured in the Residential End Uses of Water Study (REUWS) was 9.5 gallons/person/day. This value was the result of high leakage rates at a relatively small percentage of homes. Ten percent of the homes monitored accounted for 58 percent of the leakage measured. The average leakage range for the 1,188 homes within the REUWS study was 3.4-17.6, with an average of 9.5 gallons/person/day. This result agrees with a previous end use study where average leakage rates were 4 to 8 gallons/person/day. These types of leakage rates could significantly increase the hydraulic load to an onsite wastewater system reducing performance (USEPA, 2002). The research explained the benefits of using actual flow rates if available. For existing developments, flow rate data should be obtained by direct measurement (Tchobanoglous & Burton, 1991) Where possible, rates should be based on actual flow data from selected similar residential areas, preferably in the same locale (Tchobanoglous & Burton, 1991)
Average Flow Rates vs. Peak Flow Rates The common practice of using discharge figures found in reference books (e.g., Metcalf and Eddy) tend to be gross averages, meaning half of the septic systems based on these averages are over-designed and half are under-designed (Kaplan, 1988). Maximum and minimum flows and instantaneous peak flow variations are necessary factors in properly sizing and designing system components (Tchobanoglous and Burton, 1991). The system should be capable of accepting and treating normal peak events without compromising performance (Tchobanoglous and Burton, 1991). Because peak flows can occur for a number of days, it is recommended that a peaking factor of 2.5 be used for the design of downstream treatment processes from septic tanks (Crites and Tchobanoglous, 1998). Table 2 provides peaking factors for wastewater flows from individual residences, small commercial establishments, and small communities (Crites and Tchobanoglous, 1998).
Page 5 of 18

Washington State Department of Health Wastewater Management Program R U L E D E V E L O P M E N T C O M M I T T E E I S S U E R E S E A R C H R E P O R T – D R A F T
- R E S I D E N T I A L F L O W R A T E S - Table 2 Peaking factors for wastewater flows from individual residences, small commercial establishments, and small communities
Small Peaking Individual commercial Small factor* residence establishment community
Range Typical† Range Typical Range Typical
Peak hour 4-10 4 6-10 4 3-6 4
Peak day 2-5 2.5 2-6 3.0 2-4 2.5
Peak week 1.25-4 2.0 2-6 2.5 1.5-3 1.75
Peak month 1.15-3 1.5 1.25-4 1.5 1.2-2 1.25
* Ratio of peak flow to average flow
† Higher values are often reported, but the given values are suitable for sizing onsite wastewater management facilities.
In many states it is quite common to use a flow allowance for design of 150 gpd per bedroom, which in theory accounts for peak flow (Crites and Tchobanoglous, 1998). These same authors recommend that a per capita design allowance, based on peak flow, be used for design. Table 3 provides a comparison of design flows based on a per capita allowance times a peaking factor versus design flows based on a per bedroom allowance (Crites and Tchobanoglous, 1998). Table 3 Comparison of design flows based on a per capita allowance times a peaking factor versus design flow based on a per bedroom allowance
Number of bedrooms
Number of persons
Flowrate, * gal/capita . d
Peaking factor
Design flow based on peak per capita flow, gal/d
Design flow based on per bedroom allowance, gal/d
1 2 55 2.5 275 150 2 3 48 2.5 360 300 3 4 45 2.5 450 450 4 5 42 2.5 525 600
* Computed using Flow, gal/home.d = gal/home.d + gal/person.d x (number of persons/home)
Page 6 of 18
Washington State Department of Health Wastewater Management Program R U L E D E V E L O P M E N T C O M M I T T E E I S S U E R E S E A R C H R E P O R T – D R A F T
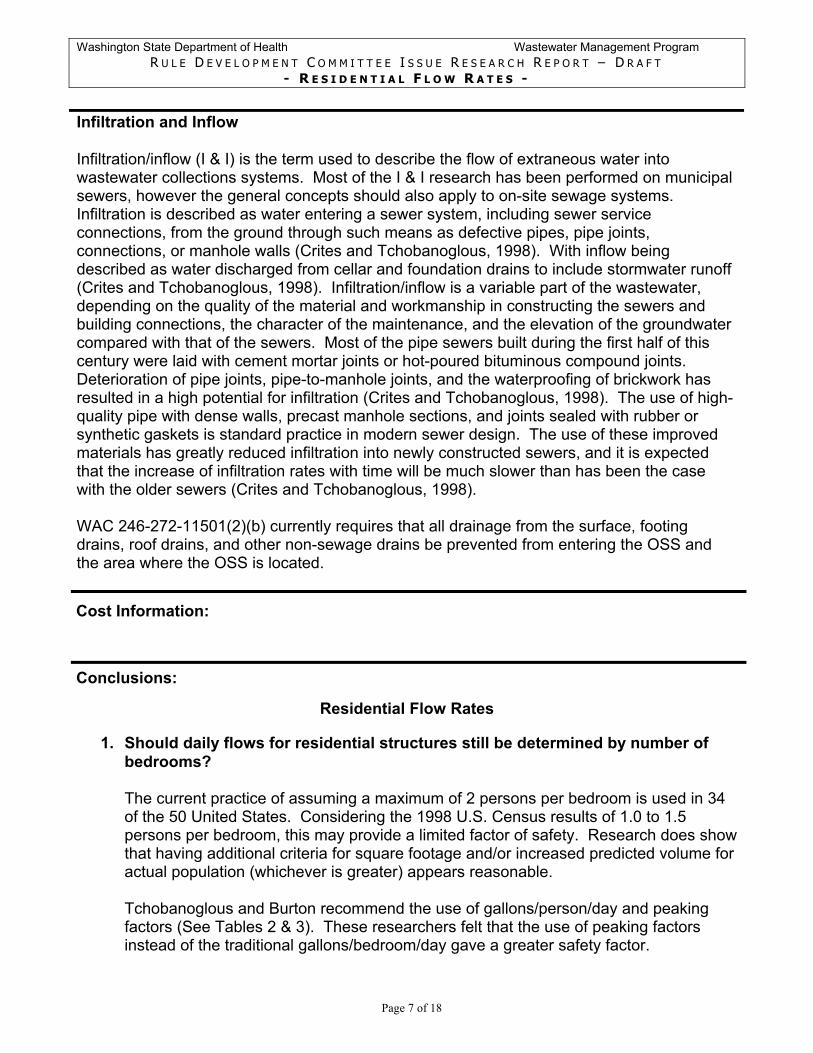
- R E S I D E N T I A L F L O W R A T E S - Infiltration and Inflow Infiltration/inflow (I & I) is the term used to describe the flow of extraneous water into wastewater collections systems. Most of the I & I research has been performed on municipal sewers, however the general concepts should also apply to on-site sewage systems. Infiltration is described as water entering a sewer system, including sewer service connections, from the ground through such means as defective pipes, pipe joints, connections, or manhole walls (Crites and Tchobanoglous, 1998). With inflow being described as water discharged from cellar and foundation drains to include stormwater runoff (Crites and Tchobanoglous, 1998). Infiltration/inflow is a variable part of the wastewater, depending on the quality of the material and workmanship in constructing the sewers and building connections, the character of the maintenance, and the elevation of the groundwater compared with that of the sewers. Most of the pipe sewers built during the first half of this century were laid with cement mortar joints or hot-poured bituminous compound joints. Deterioration of pipe joints, pipe-to-manhole joints, and the waterproofing of brickwork has resulted in a high potential for infiltration (Crites and Tchobanoglous, 1998). The use of high-quality pipe with dense walls, precast manhole sections, and joints sealed with rubber or synthetic gaskets is standard practice in modern sewer design. The use of these improved materials has greatly reduced infiltration into newly constructed sewers, and it is expected that the increase of infiltration rates with time will be much slower than has been the case with the older sewers (Crites and Tchobanoglous, 1998). WAC 246-272-11501(2)(b) currently requires that all drainage from the surface, footing drains, roof drains, and other non-sewage drains be prevented from entering the OSS and the area where the OSS is located.
Cost Information: Conclusions:
Residential Flow Rates
1. Should daily flows for residential structures still be determined by number of bedrooms?
The current practice of assuming a maximum of 2 persons per bedroom is used in 34 of the 50 United States. Considering the 1998 U.S. Census results of 1.0 to 1.5 persons per bedroom, this may provide a limited factor of safety. Research does show that having additional criteria for square footage and/or increased predicted volume for actual population (whichever is greater) appears reasonable. Tchobanoglous and Burton recommend the use of gallons/person/day and peaking factors (See Tables 2 & 3). These researchers felt that the use of peaking factors instead of the traditional gallons/bedroom/day gave a greater safety factor.
Page 7 of 18

Washington State Department of Health Wastewater Management Program R U L E D E V E L O P M E N T C O M M I T T E E I S S U E R E S E A R C H R E P O R T – D R A F T
- R E S I D E N T I A L F L O W R A T E S -
2. Is the quantity used for gallons per day per bedroom currently used appropriate?
The USEPA provided estimates from research using actual flows from residential dwelling units built prior to 1994 averaged daily flows of 50-70 gal/pers/day. The range given for dwelling units built after 1994 was calculated based on the EPACT standards implementation and assumed average daily flows of 40-60 gal/pers/day. Utilizing the practice of 2 persons per bedroom, new construction average daily flows would range from 80-120 gal/bedroom/day. The remainder of the research found average daily flows for typical single family dwellings to range from 40-100 gal/pers/day. Utilizing the practice of 2 persons per bedroom, new construction average daily flows would range from 80-200 gal/bedroom/day. One researcher found that in many states it is common to use a flow allowance for design of 150 gallons per day, which in theory accounts for peak flow. Some counties within Washington State currently use this practice.
3. Should the “minimum” gpd design flow (240 gpd) be changed?
The scientific literature does not address this issue. The summary of state wastewater flow rates shows a range of minimum design flows of 75-400 gallons per day.
4. Has there been any attempt to equate other factors other than bedrooms for flows – lifestyles, bedrooms, flows, square footage, etc.?
Researchers have divided flows by terms such as newer homes, older homes, summer cottage, typical home, better home, and luxury home however they do not provide definitions of these terms. States that have addressed other factors have commonly applied square footage limitations, additional gallons/pers/day in excess of 2 persons/bedroom, reductions for low-flow fixtures, and deed restrictions for senior citizen communities (See Appendix A).
5. Should there be a link between design flows and actual flows?
Researchers agree that the use of actual flows is preferable to estimated flow rates and that design flows should be based on actual peak day flows not average flows. A number of states have included an allowance for the use of actual flows within their codes.
6. Does daily design flow equal peak flow, peak-peak, or what?
Considering the USEPA average gal/capita/day flow of 40-60 gallons, it does not appear that the current use of 120 gallons per bedroom accounts for peak flow, leakage, or safety factors. Other researchers typically using 40-100 gallons per person per day which, at the upper end, does appear to include a safety margin.
Page 8 of 18
Washington State Department of Health Wastewater Management Program R U L E D E V E L O P M E N T C O M M I T T E E I S S U E R E S E A R C H R E P O R T – D R A F T
- R E S I D E N T I A L F L O W R A T E S -
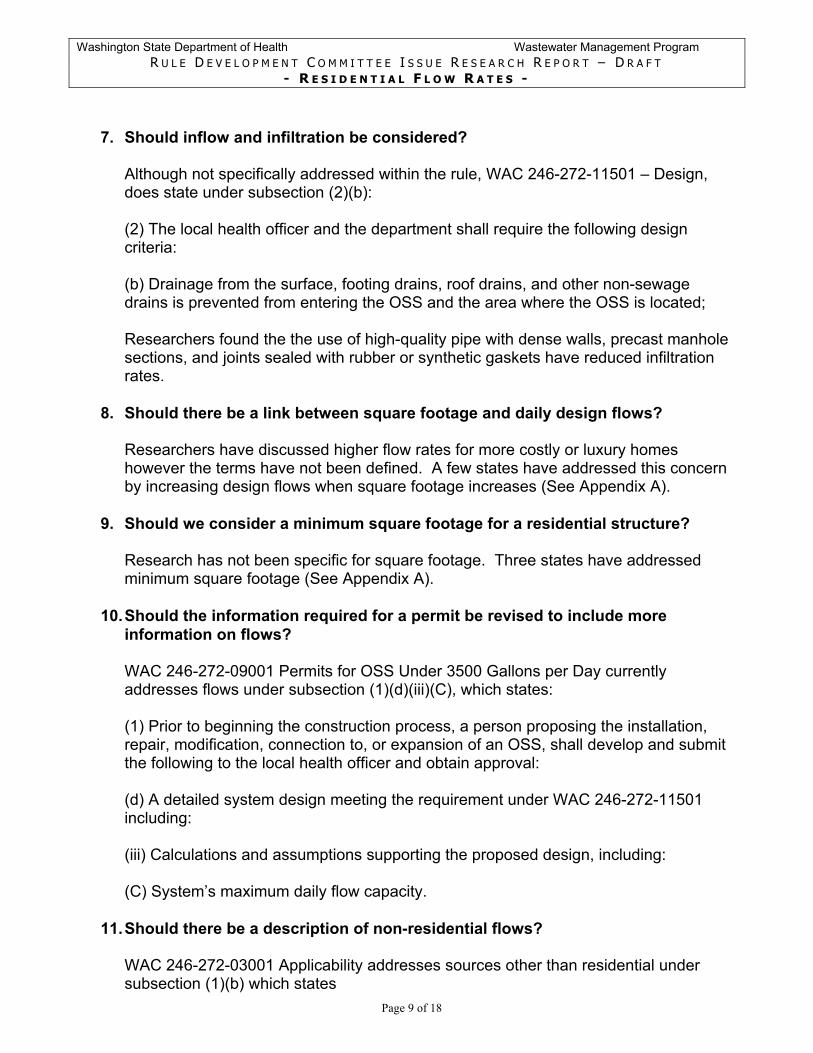
7. Should inflow and infiltration be considered?
Although not specifically addressed within the rule, WAC 246-272-11501 – Design, does state under subsection (2)(b): (2) The local health officer and the department shall require the following design criteria: (b) Drainage from the surface, footing drains, roof drains, and other non-sewage drains is prevented from entering the OSS and the area where the OSS is located; Researchers found the the use of high-quality pipe with dense walls, precast manhole sections, and joints sealed with rubber or synthetic gaskets have reduced infiltration rates.
8. Should there be a link between square footage and daily design flows?
Researchers have discussed higher flow rates for more costly or luxury homes however the terms have not been defined. A few states have addressed this concern by increasing design flows when square footage increases (See Appendix A).
9. Should we consider a minimum square footage for a residential structure?
Research has not been specific for square footage. Three states have addressed minimum square footage (See Appendix A).
10. Should the information required for a permit be revised to include more
information on flows?
WAC 246-272-09001 Permits for OSS Under 3500 Gallons per Day currently addresses flows under subsection (1)(d)(iii)(C), which states: (1) Prior to beginning the construction process, a person proposing the installation, repair, modification, connection to, or expansion of an OSS, shall develop and submit the following to the local health officer and obtain approval: (d) A detailed system design meeting the requirement under WAC 246-272-11501 including: (iii) Calculations and assumptions supporting the proposed design, including: (C) System’s maximum daily flow capacity.
11. Should there be a description of non-residential flows?
WAC 246-272-03001 Applicability addresses sources other than residential under subsection (1)(b) which states
Page 9 of 18

Washington State Department of Health Wastewater Management Program R U L E D E V E L O P M E N T C O M M I T T E E I S S U E R E S E A R C H R E P O R T – D R A F T
- R E S I D E N T I A L F L O W R A T E S -
(1) The local health officer and the department:
(b) May apply this chapter to OSS for sources other than residential sewage, excluding industrial wastewater, if pretreatment, siting, design, installation, and operation and maintenance measures provide treatment and effluent disposal equal to that required of residential sewage.
WAC 246-272-11501 Design addresses non-residential sewage in subsection (3) by stating:
When proposing the use of OSS for non-residential sewage, the designer shall provide to the local health officer:
(a) Information to show the sewage is not industrial wastewater; (b) Information to establish the sewage’s strength and identify chemicals found in the sewage that are not found in residential sewage; and (c) A design providing treatment equal to that required of residential sewage.
References:
Bennett, E, Linstedt, K, Felton, J, 1974. Rural Home Wastewater Characteristics, Home Sewage Disposal, Proceedings of the National Home Sewage Disposal Symposium, American Society of Agricultural Engineers, Pages 74-78, 1974.
In order to understand potential septic tank problems, and to develop meaningful design criteria for alternative engineered systems, knowledge of the characteristics of home wastewater flow is imperative. For these reasons, studies have been initiated at the University of Colorado to evaluate the flow patterns and surge peaks of individual home sewage systems, and to define home waste strength characteristics by monitoring many of the sanitary engineering water quality parameters. A statistical evaluation of short time surge flow was also made. It was found that the maximum surge flow was 60 gallons and this flow could occur in as short a period as seven minutes.
Crites, R, Tchobanoglous, G, 1998. Small and Decentralized Wastewater Management Systems, McGraw-Hill Series in Water Resources and Environmental Engineering, Chapter 4, Pages 169-239, 1998.
The sources of wastewater and the corresponding average flow rates in wastewater collection systems, and the flow rates from individual residences, are considered in this section.
Page 10 of 18

Washington State Department of Health Wastewater Management Program R U L E D E V E L O P M E N T C O M M I T T E E I S S U E R E S E A R C H R E P O R T – D R A F T
- R E S I D E N T I A L F L O W R A T E S - Jones, E, 1974. Domestic Water Use in Individual Homes and Hydraulic Loading Of and Discharge from Septic Tanks, Home Sewage Disposal, Proceedings of the National Home Sewage Disposal Symposium, American Society of Agricultural Engineers, Pages 89-103, 1974.
Domestic wastewater production is closely related to domestic water use. Thus, information from domestic water use studies can provide valuable information on the hydraulic loading of septic tank systems. From 1961 to 1968, the author’s primary research activities were determination of farmstead and rural home water requirements and development of improved design recommendations.
Kaplan, O, 1988. Septic Systems Handbook, Chapter 8. Factors Affecting Failure of Leachlines, Lewis Publishers, Inc., Chelsea, Michigan, Pages 93-106, 1988.
This chapter explains the factors affecting failure of leachlines. The author contends that average sewage flows may vary by a factor of (almost) 3 between different regions and that designers should never follow the common practice of using discharge figures found in reference books. Rather a designer should obtain information about residential sewage discharges from local water and/or sewer districts from actual meter reading at existing similar projects. Immigrants of various nationalities and also the natives’ new ways of life have added variety and spice to sewage flows. Therefore, one should be wary of published flow data.
Laak, R, 1986., Wastewater engineering design for unsewered areas, Chapter 3, Characteristics and Quantity of Wastewater, Technomic Publishing, Inc., Lancaster, Pennsylvania, Pages 19-32, 1986.
This chapter explains the importance of estimating both wastewater quality and quantity. The sizing of onsite wastewater systems is based on two parameters – the pollutant characteristics and the wastewater flow rate. The pollutant characteristics should be known for the design of the pretreatment system, such as a septic tank. For other than domestic wastes (laundry, restaurant, etc.) and for sizing the sludge storage space in the septic tank, the treatability characteristics should be considered, as should the solids concentrations of the raw wastewater. Under certain circumstances it is important to evaluate the potential fluctuation in the wastewater characteristics to avoid biochemical oxygen demand (BOD) overloads on pretreatment units, along with pH and temperature shifts. Ignorance of peak loads can lead to treatment failure. Similarly the hydraulic loads or wastewater flow fluctuations should be known so that designs can be prepared to avoid washout of pretreatment tank solids, flooding of the system and reduction of the necessary biological and physical retention times. Understanding the causes of flow fluctuations and considering the particular design loads (pollutant characteristics and flow rates) will assure good design practice.
Page 11 of 18

Washington State Department of Health Wastewater Management Program R U L E D E V E L O P M E N T C O M M I T T E E I S S U E R E S E A R C H R E P O R T – D R A F T
- R E S I D E N T I A L F L O W R A T E S - Siegrist, R, Woltanski, T, Waldorf, L. Water Conservation and Wastewater Disposal, Home Sewage Treatment, Proceedings of the Second National Home Sewage Treatment Symposium, American Society of Agricultural Engineers, Pages 121-136, 1977.
In this paper, one aspect of the broad and complex subject of water conservation and wastewater disposal is considered, that being residential water conservation and onsite wastewater disposal. A discussion of residential water conservation practices has been given and the impact of these practices on waste loads and various onsite wastewater treatment and disposal methods has been assessed.
Tchobanoglous, G, Burton, F, 1991. Wastewater Engineering Treatment, Disposal, and Reuse, Third Edition, Metcalf & Eddy, Incorporated, Pages 15-46, Chapter 2.
The purpose of this chapter is to develop a basis for properly assessing wastewater flowrates for a community. The subjects considered include (1) definition of the various components that make up the wastewater from a community, (2) water supply data and its relationship to wastewater flowrates, (3) wastewater sources and flowrates, (4) analysis of flowrate data, and (5) methods of reducing wastewater flowrates.
USEPA, 2002. USEPA Onsite Wastewater Treatment Systems Manual, Chapter 3, 2002.
Chapter 3 specifically addresses “Establishing Treatment Systems Performance Requirements” including estimating wastewater flows. The average daily wastewater flow from typical residential dwelling can be estimated from indoor water use in the home. Several study results were shown using indoor water use (not wastewater flow monitoring). A summary of averages (gal/pers/day) ranged from 50.7 – 70.8 for residential dwellings built before 1994. The Residential End Uses of Water Study (REUWS) was the largest number of residential water users ever characterized and provided an evaluation of annual water use at 1,188 homes in 12 metropolitan areas in North America derived from some 1 million residential wastewater activities. The mean daily per capita indoor use (gal/pers/day) of all 12 study sites was 69.0 with the median daily per capita indoor use (gal/pers/day) as 60.5.
The average per capita leakage measured in the REUWS was 9.5 gallons/person/day. This value was the result of high leakage rates at a relatively small percentage of homes. Ten percent of the homes monitored accounted for 58 percent of the leakage measured. The average leakage range for the 1,188 homes within the REUWS study
Page 12 of 18

Washington State Department of Health Wastewater Management Program R U L E D E V E L O P M E N T C O M M I T T E E I S S U E R E S E A R C H R E P O R T – D R A F T
- R E S I D E N T I A L F L O W R A T E S -
was 3.4-17.6, with an average of 9.5. This result agrees with a previous end use study where average leakage rates of 4 to 8 gallons/person/day. The intermittent occurrence of individual wastewater-generating activities can create large variations in wastewater flows from residential or nonresidential establishments. This variability can affect gravity-fed onsite systems by potentially causing hydraulic overloads of the systems during peak flow conditions. Wastewater flow can vary significantly from day to day. Minimum hourly flows of zero are typical for residential dwelling. Maximum hourly flows as high as 100 gallons are not unusual given the variability of typical fixture and appliance usage characteristics and residential water use demands. Hourly flows exceeding this rate can occur in cases of plumbing fixture failure and appliance misuse (e.g., broken pipe or fixture, faucets left running). The peak discharge rate from a given fixture or appliance is typically around 5 gallons/minute, with the exception of the tank-type toilet and possibly hot tubs and bathtubs. Although field data are limited, peak discharge rates from a single-family dwelling of 5 to 10 gallons/minute can be expected.
Witt, M, Siegrist, R, Boyle, W, 1974, Rural Household Wastewater Characterization, Home Sewage Disposal, Proceedings of the National Home Sewage Disposal Symposium, Pages 79-88, 1974.
This report provides a summary of field studies conducted at the University of Wisconsin to enhance a data base in order to characterize waste contributions from selected events within a home. Eleven sites were selected for the water use monitoring phase with a variety of family types and sizes. Data was collected for a total of 434 days. The water use monitoring yielded an average flow of 42.6 gpcd with a 90% confidence interval of 40.8 to 44.4 gpcd. As would be expected, the patterns for any given household were more extreme than the attenuated eleven site average patterns. For example, a flow pattern was shown as gallons/capita/hour with peaks as high as 3 g/c/h (72 g/c/d).
Page 13 of 18

Washington State Department of Health Wastewater Management Program R U L E D E V E L O P M E N T C O M M I T T E E I S S U E R E S E A R C H R E P O R T – D R A F T
- R E S I D E N T I A L F L O W R A T E S -
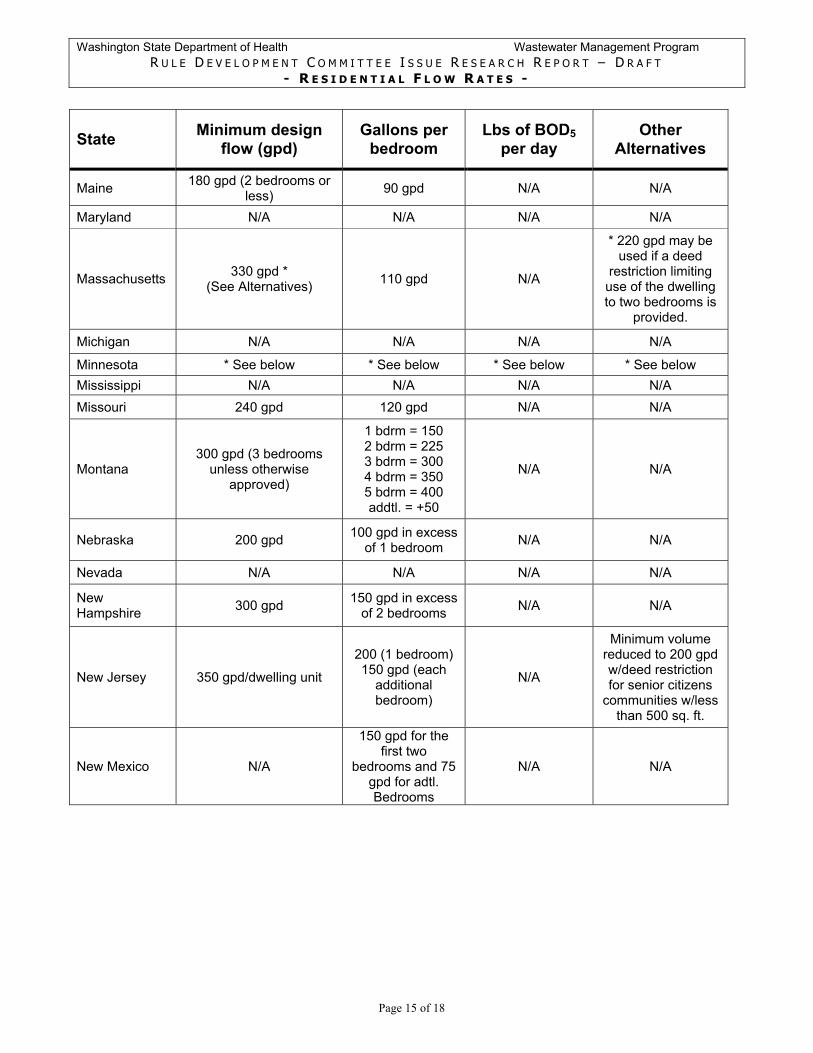
Appendix A Summary of State Wastewater Flow Rates
This summary was compiled by review of all 50 state regulations via the Small Flows Clearinghouse link at http://www.nesc.wvu.edu/nsfc/nsfc_index.htm
State Minimum design flow (gpd)
Gallons per bedroom
Lbs of BOD5 per day
Other Alternatives
Alabama 300 gpd (2 bedroom or less)
150 gpd (3 bedrooms or
more) N/A N/A
Alaska N/A N/A N/A N/A
Arizona 100 gpd/resident (2 residents/bedroom) 200 gpd N/A
150 gal/bedroom/day for
aerobic units
Arkansas 75 - 100 g/pers/day N/A N/A N/A California N/A N/A N/A N/A
Colorado
150 gpd (2 residents/bedroom)
75 gal/person/day
150 gpd .20 BOD5/person/day
The local Health Officer or
designated agent may require an
increase of average daily flow of up to
100 gal/person/day for large of more costly dwellings
Connecticut N/A 150 gpd N/A N/A Delaware 240 gpd 120 gpd N/A N/A Florida * See below * See below N/A * See below
Georgia N/A N/A N/A N/A
Hawaii 200 gpd (2
persons/bedroom/day@ 100 g/pers/day)
200 0.17 lbs./person/day
N/A
Idaho N/A * (See Alternatives)
* (See Alternatives)
* 250/unit (3 bedroom)
add/subtract 50 g/bedroom
Illinois N/A 200 gpd N/A N/A Indiana N/A N/A N/A N/A Iowa N/A N/A N/A N/A Kansas N/A 150 gpd N/A N/A
Kentucky N/A 120 gpd N/A Reductions for low-flow fixtures allowed
Louisiana 250 gpd (1 bedroom) 300 gpd (2 bedroom) 400 gpd (3 bedroom)
Each additional bedroom, add 100
gpd
.425 (1 bedroom) .51 (2 bedroom) .68 (3 bedroom) BOD5 lbs./day
Homes in Subdivisions 400 gpd per dwelling
Page 14 of 18
Washington State Department of Health Wastewater Management Program R U L E D E V E L O P M E N T C O M M I T T E E I S S U E R E S E A R C H R E P O R T – D R A F T
- R E S I D E N T I A L F L O W R A T E S -
State Minimum design flow (gpd)
Gallons per bedroom
Lbs of BOD5 per day
Other Alternatives
Maine 180 gpd (2 bedrooms or less) 90 gpd N/A N/A
Maryland N/A N/A N/A N/A
Massachusetts 330 gpd * (See Alternatives) 110 gpd N/A
* 220 gpd may be used if a deed
restriction limiting use of the dwelling to two bedrooms is
provided.
Michigan N/A N/A N/A N/A
Minnesota * See below * See below * See below * See below Mississippi N/A N/A N/A N/A Missouri 240 gpd 120 gpd N/A N/A
Montana 300 gpd (3 bedrooms
unless otherwise approved)
1 bdrm = 150 2 bdrm = 225 3 bdrm = 300 4 bdrm = 350 5 bdrm = 400 addtl. = +50
N/A N/A
Nebraska 200 gpd 100 gpd in excess of 1 bedroom N/A N/A
Nevada N/A N/A N/A N/A
New Hampshire 300 gpd 150 gpd in excess
of 2 bedrooms N/A N/A
New Jersey 350 gpd/dwelling unit
200 (1 bedroom) 150 gpd (each
additional bedroom)
N/A
Minimum volume reduced to 200 gpd w/deed restriction for senior citizens
communities w/less than 500 sq. ft.
New Mexico N/A
150 gpd for the first two
bedrooms and 75 gpd for adtl. Bedrooms
N/A N/A
Page 15 of 18

Washington State Department of Health Wastewater Management Program R U L E D E V E L O P M E N T C O M M I T T E E I S S U E R E S E A R C H R E P O R T – D R A F T
- R E S I D E N T I A L F L O W R A T E S -
State Minimum design flow (gpd)
Gallons per bedroom
Lbs of BOD5 per day
Other Alternatives
New York
N/A * See Alternatives N/A
gpd/bedroom dependent on
fixtures Pre-1979 fixtures 150 gpd/bedroom
New standard fixtures 130
gpd/bedroom Water-saving toilets
90 gpd/bedroom Waterless toilets 75
gpd/bedroom (greywaster only)
North Carolina 240 gpd 120 gpd N/A
When dwelling unit exceeds 2
persons/bedroom, maximum volume will be determined
by 60 gallons/person/day
North Dakota 75 gallons/person/day N/A N/A Luxury houses and
estates 150 gal/person/day
Ohio N/A N/A N/A N/A
Oklahoma 6,000 gal/month for 2 bedrooms or less 2,000 gal/month N/A N/A
Oregon 300 gpd
75 gpd for each bedroom in excess of 2 bedrooms
N/A N/A
Pennsylvania 400 gpd (3 bedrooms or less)
100 gpd per bedroom in excess of 3
.90 lbs. BOD5/dwelling/day N/A
Rhode Island 75 gal/person/day 150 gpd N/A N/A South Carolina N/A N/A N/A N/A
South Dakota 262.5 gpd * See Alternatives
120 gal/bedroom/day N/A
* minimum of 3.5 person @ 75
gal/person/day, or 120
gallons/bedroom, whichever is greater
Tennessee N/A 150 gpd N/A N/A
Page 16 of 18

Washington State Department of Health Wastewater Management Program R U L E D E V E L O P M E N T C O M M I T T E E I S S U E R E S E A R C H R E P O R T – D R A F T
- R E S I D E N T I A L F L O W R A T E S -
State Minimum design flow (gpd)
Gallons per bedroom
Lbs of BOD5 per day
Other Alternatives
Texas 225
2 persons/bedroom
@ 60 g/person/day
N/A * See below
Utah N/A N/A N/A N/A
Vermont N/A 150 gpd N/A N/A
Virginia 150 gpd 150 gpd 0.2 lbs. BOD5/person/day N/A
Washington 240 gpd 120 gpd N/A N/A
West Virginia N/A N/A N/A N/A
Wisconsin N/A 100 gpd N/A N/A
Wyoming N/A 150 gpd N/A N/A * Florida : Where the number of bedrooms indicated on the floor plan and the
corresponding building area of a dwelling unit do not coincide, the criteria which will result in the greatest estimated sewage flow shall apply.
1 bedroom with 750 sq. ft. or less of building area 100 gpd
2 bedrooms with 751-1200 sq. ft. of building area 200 gpd 3 bedrooms with 1201-2250 sq. ft. of building area 300 gpd 4 bedrooms with 2251 – 3300 sq. ft. of building area 400 gpd
For each additional bedroom or each additional 750 square feet of building area, system sizing shall be increased by 100 gallons per dwelling unit. Other per occupant 50 gpd * Minnesota:
Average Design Flow (gallons per day) Classification of Dwelling
Number of Bedrooms I II III
2 or less 300 225 180 3 450 300 218 4 600 375 256 5 750 450 294 6 900 525 332
Page 17 of 18

Washington State Department of Health Wastewater Management Program R U L E D E V E L O P M E N T C O M M I T T E E I S S U E R E S E A R C H R E P O R T – D R A F T
- R E S I D E N T I A L F L O W R A T E S - * Minnesota: (Cont’d)
Classification I: The average design flow for classification I dwelling is determined by multiplying 150 by the number of bedrooms. Classification I dwelling are defined as having a total floor area of the dwelling divided by the number of bedrooms of more than 800 square feet per bedroom, or more than two of the following water-use appliances are installed or anticipated: automatic washer, dishwasher, water conditioning unit, whirlpool bath, garbage disposal, or self-cleaning humidifier in furnace. Classification II: The average design flow for classification II dwelling is determined by multiplying 75 by the number of bedrooms plus one. Classification II dwelling are defined as having more than 500 square feet of total dwelling floor area per bedroom and no more than two of the water-use appliances listed in Classification I. Classification III: The average design flow for classification III dwellings is determined by adding 66 to the product of 38 times the number of bedrooms plus one. Classification III dwellings are defined as having less than 500 square feet of total dwelling floor area per bedroom and no more than two of the water—use appliances listed in Classification I.
* Texas: Sizing formulas are based on residential strength BOD5. Commercial/institutional facility must pretreat their wastewater to 140 BOD5. Type of facility
Usage rate (gpd) (Without water saving devices)
Usage rate (gpd) (With water saving devices)
(one or two bedrooms) – less than 1,500 square feet 225 180
(three bedrooms) – less than 2,500 square feet 300 240
(four bedrooms) – less than 3,500 square feet 375 300
(five bedrooms) – less than 4,500 square feet 450 360
Single family dwelling
(six bedrooms) – less than 5,500 square feet 525 420
Greater than 5,500 square feet, each additional 1,500 square feet or increment thereof 75 60
Page 18 of 18