Embed Size (px)
Citation preview
Washington State
Bridge to College Mathematics Course
Adapted from Math Ready A Southern Regional Education Board Transition Course
Except where otherwise noted, Bridge to College Mathematics is licensed under a Creative Commons Attribution-NonCommercial License. This is a derivative work by the Washington Office of Superintendent of Public Instruction and State Board for Community and Technical Colleges adapted from the Southern Regional Education Board Math Ready course. Funded by College Spark Washington.
Alternate material licenses with different levels of user permission are clearly indicated next to the specific content in the unit and in the overview chart provided with this document.
Prior to making this course publicly available, we have reviewed its contents extensively to determine the correct ownership of the material and make sure the appropriate open licenses or copyright permission is in place. We will promptly remove any material that is determined to be violating the rights of others. If you believe that a portion of this book infringes another's copyright, contact the Office of Superintendent of Public Instruction in Washington at [email protected].
This book is adapted primarily from the excellent Math Ready materials created by the Southern Regional Education Board (SREB) which are licensed under the Creative Commons Attribution-NonCommercial License. We express our gratitude to SREB for their work on the transitioning to college and career readiness courses, without which the current book would not be possible.
We also thank the wonderful contributions from the following sources: Dan Meyer Three Acts of a Mathematical Story varied Creative Commons licenses
Illustrative Mathematics Creative Commons Attribution-NonCommercial-ShareAlike license
Mathematics Assessment Project Creative Commons Attribution-NonCommercial-NoDerivs license
Cover images are licensed under the Creative Commons Attribution: NonCommercial License Pi: The Transcendental Number by Tom Blackwell https://www.flickr.com/photos/tjblackwell/ Vegetable meets Mathematics by anroir https://www.flickr.com/photos/anroir/ Conic section ellipse by Electric Eye https://www.flickr.com/photos/sightrays/ Fractal Spiral 1 by Rosemarie s.w. https://www.flickr.com/photos/rosemariesw/
The initial course design work was supported by a grant from Rockefeller Philanthropy Advisors (https://www.rockpa.org). Course development and implementation is being supported by a grant from College Spark Washington (http://www.collegespark.org). June 2016
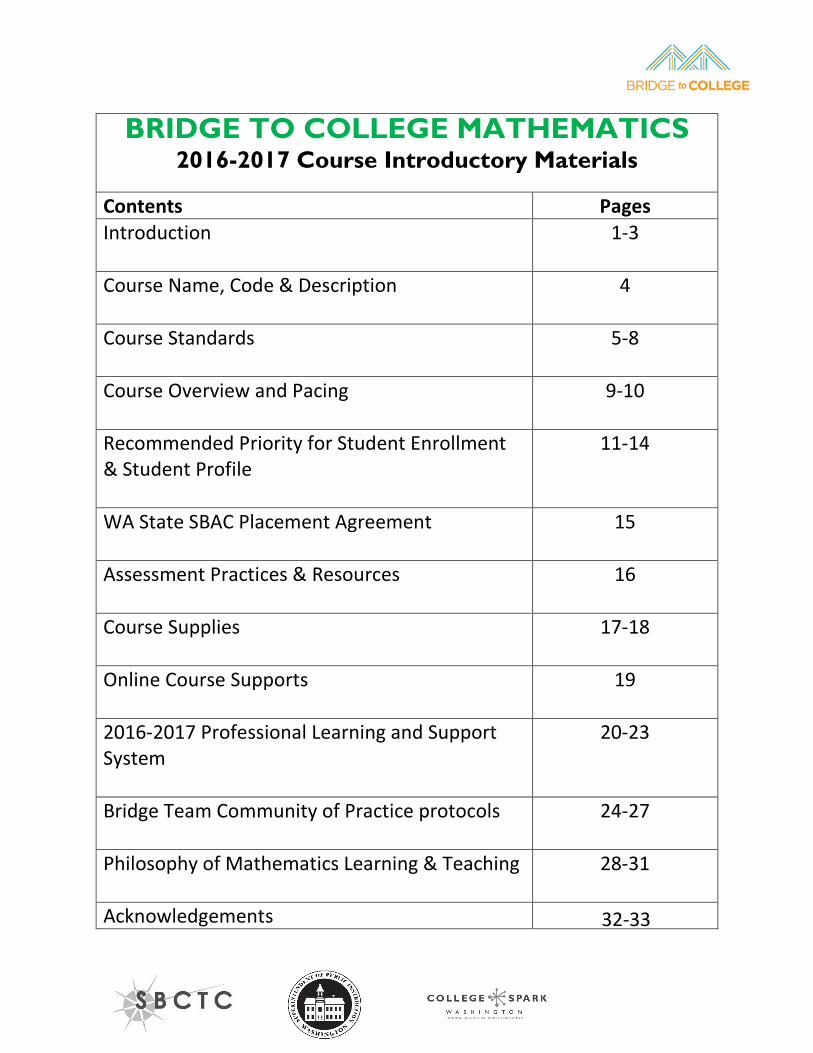
BRIDGE TO COLLEGE MATHEMATICS 2016-2017 Course Introductory Materials
Contents Pages Introduction 1-3
Course Name, Code & Description 4
Course Standards 5-8
Course Overview and Pacing 9-10
Recommended Priority for Student Enrollment & Student Profile
11-14
WA State SBAC Placement Agreement 15
Assessment Practices & Resources 16
Course Supplies 17-18
Online Course Supports 19
2016-2017 Professional Learning and Support System
20-23
Bridge Team Community of Practice protocols 24-27
Philosophy of Mathematics Learning & Teaching 28-31
Acknowledgements 32-33
1
Washington Bridge to College Mathematics
Course Introduction
During the 2010-11 academic year, 20,575 Washington state high school graduates from 2009-2010 enrolled in the state’s community and technical colleges (SBCTC). Among those, 51% were required to take at least one pre-college course in mathematics (SBCTC). Students of color, especially Hispanics and African-Americans, were “substantially more likely than all other students to be enrolled” in these pre-college courses (SBCTC). These courses are costly and time-consuming. In addition, each pre-college course a student is required to take significantly reduces their likelihood of earning a degree (Martorell and McFarlin, Jr.). By the time students appear on the community or technical college campus, it is too late for the public K-12 system to assist them in developing the skills and abilities they need to succeed in college level mathematics and other courses. As a result, they must take costly pre-college courses and delay their engagement with many other discipline area courses.
With the advent of the Smarter Balanced assessment system in 2014-15, however, students will now receive clearer information regarding their college readiness skills before their senior year. This assessment information will inform students and parents of students’ relative readiness for college and career. Many students will enter their senior year with the awareness that they are not yet college ready in mathematics. In fact, results from the spring 2015 Smarter Balanced assessments released by the Office of the Superintendent of Public Instruction in July 2015, while encouraging overall, indicate that only 29% of high school juniors scored above the college readiness achievement level in mathematics. However, now that this information will be available after the junior year, it is possible to serve these students before they attend a two or four year college or university. This begs several questions, though. What do these students need? What are the crucial skills and abilities they need to develop in their senior year to be prepared for non-calculus pathway college level mathematics courses and the challenges they will face in their first year of higher education?
In Fall 2013, high school and higher education faculty from Washington state began meeting to answer these questions. They started by identifying what it means to be college ready in mathematics for non-calculus pathway courses. Using previously developed college readiness outcomes, the Common Core State Standards (CCSS), and newly generated student profiles of college readiness, faculty from across the K-16 system developed the Bridge to College Mathematics Transition Course Standards which include both content standards and the Standards for Mathematical Practices from the CCSS. Through multiple conversations with a wide range of participants, these course standards were finalized by Spring 2014.
Having settled on course standards, faculty and curriculum designers from K-12 and higher education started the process of developing the Bridge to College Mathematics curriculum. Participants considered the possibility of building all new curriculum, but since other states and regions have already
2
developed a great deal of successful curriculum, they decided instead to examine the available models. Numerous open resource courses from the Southern Regional Education Board, University of Texas Dana Center, Kentucky Department of Education, Tennessee Board of Regents, Virginia Department of Education and West Virginia Department of Education and the Higher Education Policy Commission were examined, evaluated, and reviewed. The SREB Math Ready curriculum was selected by K-16 educators through a rigorous vetting process involving a rubric based on the course standards, the Common Core State Standards and the NCTM Mathematics Teaching Practices. (NCTM, 2014).
In the summer of 2014, interested high school teachers and college faculty met to develop a deep understanding of the course and its alignment to the BTCM course standards and NCTM Mathematics Teaching Practices. Project leadership also participated in five days of SREB Math Ready teacher training at the High Schools that Work conference to gain insight into the course as well as the challenges of implementing a college readiness course statewide.
During the 2014-2015 school year, sixteen high school teachers across the state piloted the course in their high school classrooms. In addition, two community college faculty used units from the curriculum in their pre-college mathematics courses. Pilot teachers and students provided extensive feedback on the modules via online forums, face to face regional meetings, and telephone interviews with researchers. In the spring of 2015, a team of pilot teachers, community college faculty and instructional experts reviewed all feedback and revised lessons and units to improve alignment to the BTCM course standards and the NCTM Mathematics Teaching Practices. Additional resources such as curriculum guides, practice sets and assessment banks were also developed to support teachers in implementing the course.
After being piloted and refined, both Bridge to College courses were finalized and offered in full during the 2015-16 school year. In this first full year of implementation for the courses there were 74 districts, 114 high schools, and 210 teachers total (106 math) offering the courses, serving almost 4000 students (based on fall enrollment numbers from OSPI). As of June 2016, 93 districts, 155 high schools and a total of 323 teachers are planning to offer the courses in 2016-17. We will have 172 new teachers (73 English, 99 math) and 151 returning teachers (74 English, 77 math). 35 of the participating districts (and 64 of the high schools) will be new to the Bridge to College project in 2016-17.
While a great deal of work has been done to develop this course and its supporting documents, there is no question that the most important work of this project begins and ends with teachers and students in the classroom. Students who earn a grade of “B” or better will be granted automatic placement into non-calculus pathway college level math courses at all 34 of Washington state’s community and technical colleges. Students may then use their transcript to gain entrance into college-level courses across the state without the need to take a placement test or provide other test scores or documentation. In doing so, the Washington state K-16 system is placing great trust in Bridge to College Mathematics teachers and students.
Teachers will not be alone in their work with this course, however. The Bridge to College project contains the structure for a powerful learning community support system. The BTCM Communities of Practice will connect high school teachers, college faculty, and instructional experts in an ongoing, regional partnership to foster authentic learning for all participants. Bridge Course Trainers, Bridge Team Leaders, and teachers will meet in regional teams on a regular basis to facilitate learning and provide
3
support for all participants. These communities will provide ongoing support for teachers to improve their craft and increase student achievement of the course outcomes. While the outcomes, principles, and curriculum are powerful, there is no question that the Communities of Practice are the key element in the evolution of the course and the students it serves. The materials contained in this binder provide the foundation for teachers in these Communities of Practice, and their students, to engage in complex, meaningful learning that will prepare all students for the college and career challenges they face immediately after high school.
Martorell, Paco and Isaac McFarlin, Jr. “Help or Hindrance? The Effects of College Remediation on Academic and Labor Market Outcomes.” University of Texas, Dallas, Research Center. April 2010. <www.utdallas.edu/research>
Washington State Board for Community and Technical College. “Role of Pre-College (Developmental and Remedial) Education: 2009-2010 Public High School Graduates Who Enroll in Washington Community and Technical Colleges in 2010-11.” December 2012. <sbctc.edu>
National Council of Teachers of Mathematics. (2014a). Principles to actions: Ensuring mathematical success for all. Reston, VA: National Council of Teachers of Mathematics.
4
BRIDGE TO COLLEGE MATHEMATICS Course Name, Code and Description Bridge to College Mathematics is a year-long course focusing on the key mathematics readiness standards from Washington State’s K-12 Learning Standards for Mathematics (the Common Core State Standards, CCSS-M) as well as the eight Standards for Mathematical Practices. The course is designed to prepare students for entrance into non-calculus pathway introductory college level mathematics courses. The course addresses key learning standards for high school including Algebra I, statistics, geometry, and Algebra II standards essential for college- and career-readiness. Course Name and Code: Bridge to College Mathematics - #02099 Course Description: The course curriculum emphasizes modeling with mathematics and the Standards for Mathematical Practice found within Washington K-12 Mathematics Learning Standards (the Common Core State Standards, CCSS-M). Topics include building and interpreting functions (linear, quadratic & exponential), writing, solving and reasoning with equations and inequalities, and summarizing, representing, and interpreting data. The course is designed to focus on building conceptual understanding, reasoning and mathematical skills and provides students engaging mathematics that builds flexible thinking and a growth mindset. For seniors who score in Level 2 on the Smarter Balanced 11th grade assessment and are successful in this course (B or better), the Bridge to College Mathematics course offers an opportunity to place into a college-level course when entering college directly after high school.
This course must be taught using the Bridge to College Mathematics curricular materials and the appropriate course name, and course code. All teachers teaching the course in 2016-2017 must participate in the year-long professional learning program described later in this document.
5
BRIDGE TO COLLEGE MATHEMATICS Transition Course Standards
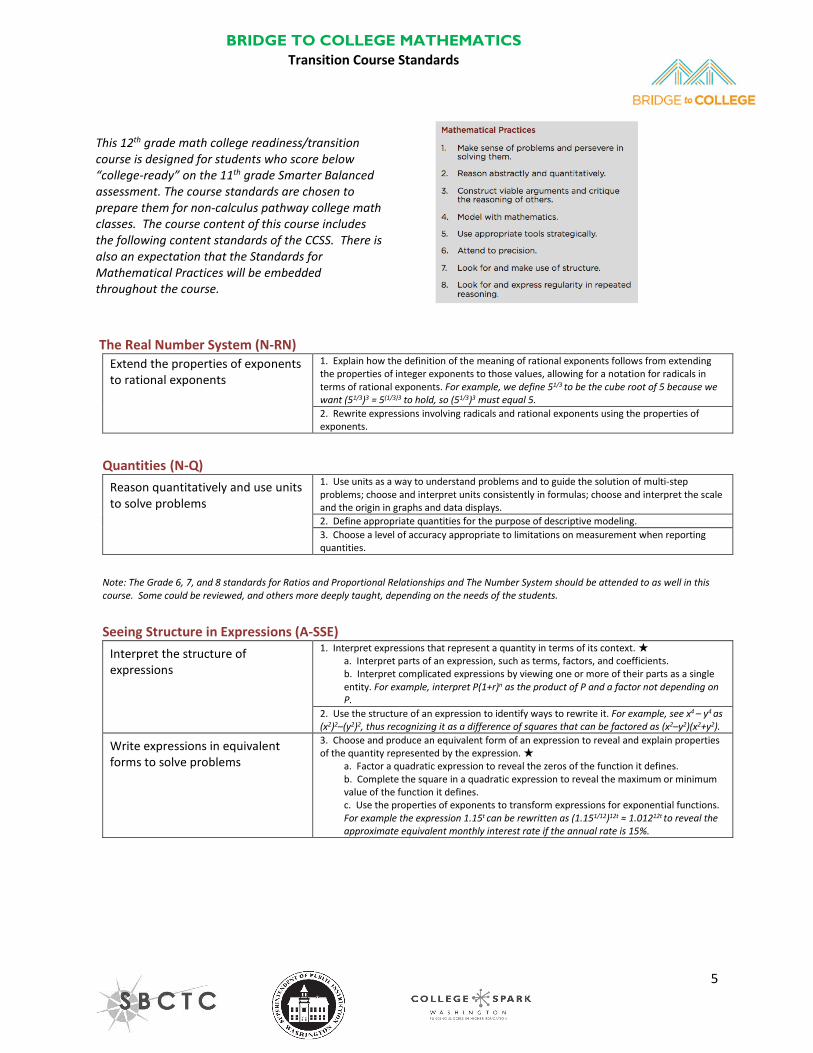
This 12th grade math college readiness/transition course is designed for students who score below “college-ready” on the 11th grade Smarter Balanced assessment. The course standards are chosen to prepare them for non-calculus pathway college math classes. The course content of this course includes the following content standards of the CCSS. There is also an expectation that the Standards for Mathematical Practices will be embedded throughout the course. The Real Number System (N-RN)
Extend the properties of exponents to rational exponents
1. Explain how the definition of the meaning of rational exponents follows from extending the properties of integer exponents to those values, allowing for a notation for radicals in terms of rational exponents. For example, we define 51/3 to be the cube root of 5 because we want (51/3)3 = 5(1/3)3 to hold, so (51/3)3 must equal 5. 2. Rewrite expressions involving radicals and rational exponents using the properties of exponents.
Quantities (N-Q)
Reason quantitatively and use units to solve problems
1. Use units as a way to understand problems and to guide the solution of multi-step problems; choose and interpret units consistently in formulas; choose and interpret the scale and the origin in graphs and data displays. 2. Define appropriate quantities for the purpose of descriptive modeling. 3. Choose a level of accuracy appropriate to limitations on measurement when reporting quantities.
Note: The Grade 6, 7, and 8 standards for Ratios and Proportional Relationships and The Number System should be attended to as well in this course. Some could be reviewed, and others more deeply taught, depending on the needs of the students.
Seeing Structure in Expressions (A-SSE) Interpret the structure of expressions
1. Interpret expressions that represent a quantity in terms of its context. ★ a. Interpret parts of an expression, such as terms, factors, and coefficients. b. Interpret complicated expressions by viewing one or more of their parts as a single entity. For example, interpret P(1+r)n as the product of P and a factor not depending on P.
2. Use the structure of an expression to identify ways to rewrite it. For example, see x4 – y4 as (x2)2–(y2)2, thus recognizing it as a difference of squares that can be factored as (x2–y2)(x2+y2).
Write expressions in equivalent forms to solve problems
3. Choose and produce an equivalent form of an expression to reveal and explain properties of the quantity represented by the expression. ★
a. Factor a quadratic expression to reveal the zeros of the function it defines. b. Complete the square in a quadratic expression to reveal the maximum or minimum value of the function it defines. c. Use the properties of exponents to transform expressions for exponential functions. For example the expression 1.15t can be rewritten as (1.151/12)12t ≈ 1.01212t to reveal the approximate equivalent monthly interest rate if the annual rate is 15%.
6
BRIDGE TO COLLEGE MATHEMATICS Transition Course Standards
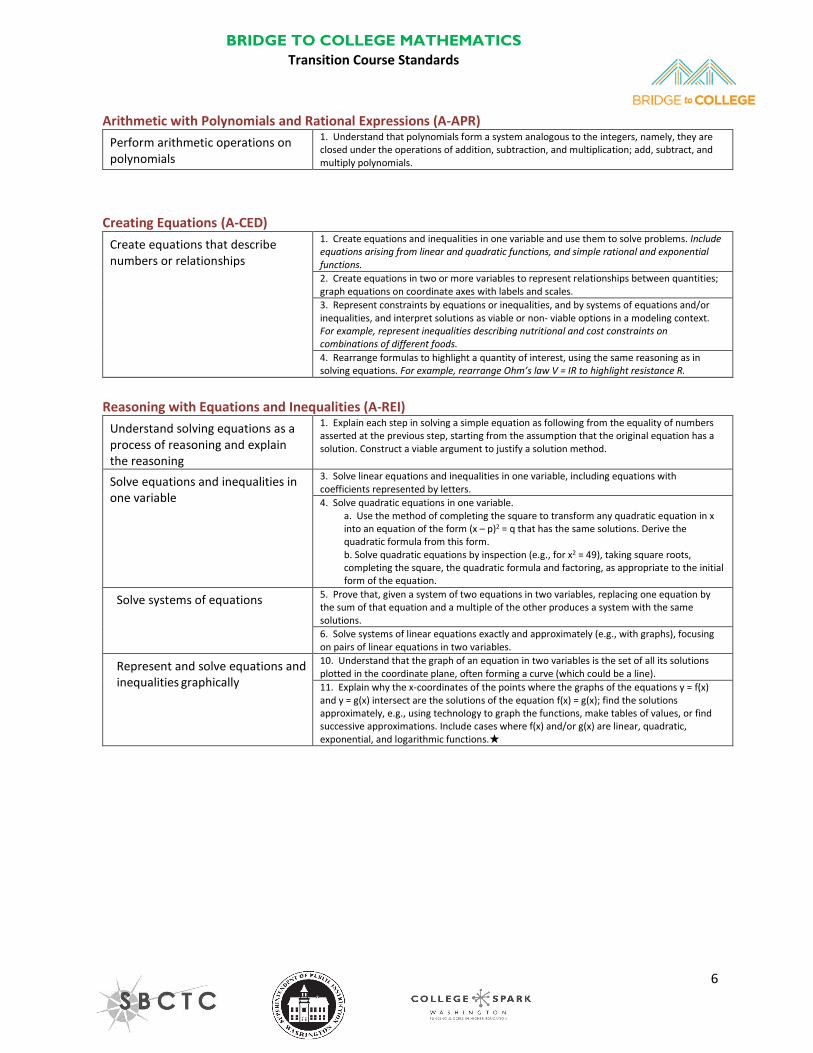
Arithmetic with Polynomials and Rational Expressions (A-APR) Perform arithmetic operations on polynomials
1. Understand that polynomials form a system analogous to the integers, namely, they are closed under the operations of addition, subtraction, and multiplication; add, subtract, and multiply polynomials.
Creating Equations (A-CED)
Create equations that describe numbers or relationships
1. Create equations and inequalities in one variable and use them to solve problems. Include equations arising from linear and quadratic functions, and simple rational and exponential functions. 2. Create equations in two or more variables to represent relationships between quantities; graph equations on coordinate axes with labels and scales. 3. Represent constraints by equations or inequalities, and by systems of equations and/or inequalities, and interpret solutions as viable or non- viable options in a modeling context. For example, represent inequalities describing nutritional and cost constraints on combinations of different foods. 4. Rearrange formulas to highlight a quantity of interest, using the same reasoning as in solving equations. For example, rearrange Ohm’s law V = IR to highlight resistance R.
Reasoning with Equations and Inequalities (A-REI) Understand solving equations as a process of reasoning and explain the reasoning
1. Explain each step in solving a simple equation as following from the equality of numbers asserted at the previous step, starting from the assumption that the original equation has a solution. Construct a viable argument to justify a solution method.
Solve equations and inequalities in one variable
3. Solve linear equations and inequalities in one variable, including equations with coefficients represented by letters. 4. Solve quadratic equations in one variable.
a. Use the method of completing the square to transform any quadratic equation in x into an equation of the form (x – p)2 = q that has the same solutions. Derive the quadratic formula from this form. b. Solve quadratic equations by inspection (e.g., for x2 = 49), taking square roots, completing the square, the quadratic formula and factoring, as appropriate to the initial form of the equation.
Solve systems of equations
5. Prove that, given a system of two equations in two variables, replacing one equation by the sum of that equation and a multiple of the other produces a system with the same solutions. 6. Solve systems of linear equations exactly and approximately (e.g., with graphs), focusing on pairs of linear equations in two variables.
Represent and solve equations and inequalities graphically
10. Understand that the graph of an equation in two variables is the set of all its solutions plotted in the coordinate plane, often forming a curve (which could be a line). 11. Explain why the x-coordinates of the points where the graphs of the equations y = f(x) and y = g(x) intersect are the solutions of the equation f(x) = g(x); find the solutions approximately, e.g., using technology to graph the functions, make tables of values, or find successive approximations. Include cases where f(x) and/or g(x) are linear, quadratic, exponential, and logarithmic functions.★
7
BRIDGE TO COLLEGE MATHEMATICS Transition Course Standards
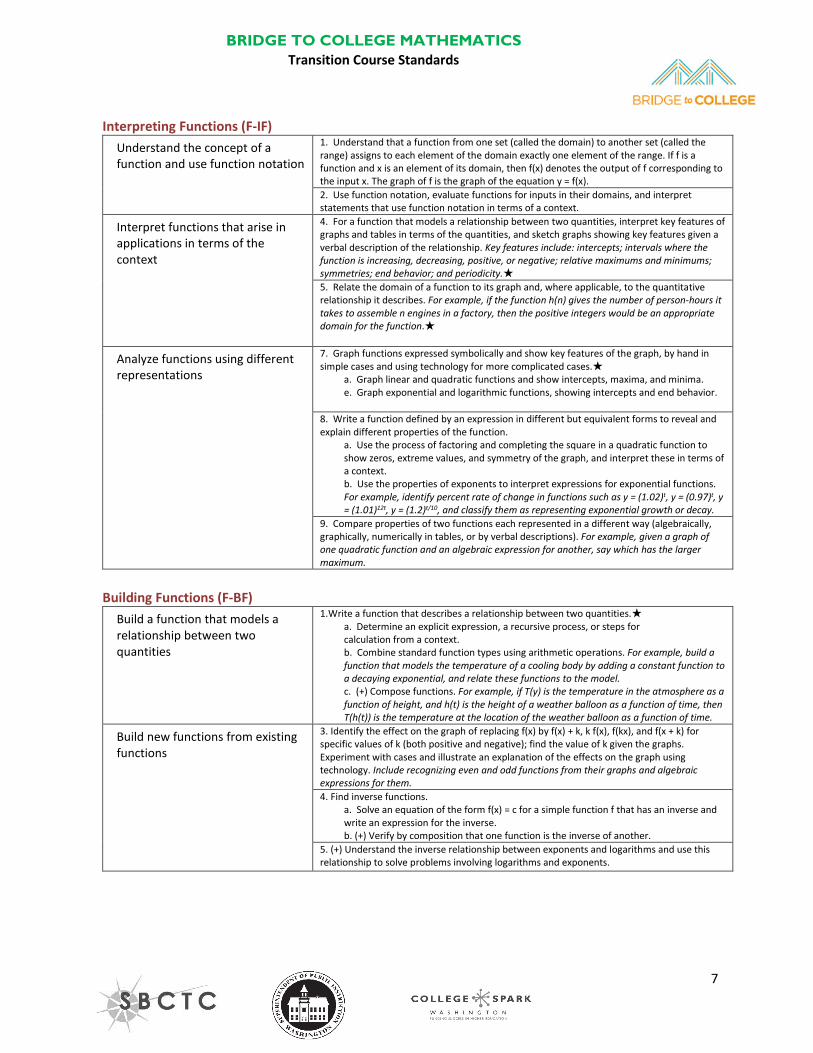
Interpreting Functions (F-IF)
Understand the concept of a function and use function notation
1. Understand that a function from one set (called the domain) to another set (called the range) assigns to each element of the domain exactly one element of the range. If f is a function and x is an element of its domain, then f(x) denotes the output of f corresponding to the input x. The graph of f is the graph of the equation y = f(x). 2. Use function notation, evaluate functions for inputs in their domains, and interpret statements that use function notation in terms of a context.
Interpret functions that arise in applications in terms of the context
4. For a function that models a relationship between two quantities, interpret key features of graphs and tables in terms of the quantities, and sketch graphs showing key features given a verbal description of the relationship. Key features include: intercepts; intervals where the function is increasing, decreasing, positive, or negative; relative maximums and minimums; symmetries; end behavior; and periodicity.★ 5. Relate the domain of a function to its graph and, where applicable, to the quantitative relationship it describes. For example, if the function h(n) gives the number of person-hours it takes to assemble n engines in a factory, then the positive integers would be an appropriate domain for the function.★
Analyze functions using different representations
7. Graph functions expressed symbolically and show key features of the graph, by hand in simple cases and using technology for more complicated cases.★
a. Graph linear and quadratic functions and show intercepts, maxima, and minima. e. Graph exponential and logarithmic functions, showing intercepts and end behavior.
8. Write a function defined by an expression in different but equivalent forms to reveal and explain different properties of the function.
a. Use the process of factoring and completing the square in a quadratic function to show zeros, extreme values, and symmetry of the graph, and interpret these in terms of a context. b. Use the properties of exponents to interpret expressions for exponential functions. For example, identify percent rate of change in functions such as y = (1.02)t, y = (0.97)t, y = (1.01)12t, y = (1.2)t/10, and classify them as representing exponential growth or decay.
9. Compare properties of two functions each represented in a different way (algebraically, graphically, numerically in tables, or by verbal descriptions). For example, given a graph of one quadratic function and an algebraic expression for another, say which has the larger maximum.
Building Functions (F-BF) Build a function that models a relationship between two quantities
1.Write a function that describes a relationship between two quantities.★ a. Determine an explicit expression, a recursive process, or steps for calculation from a context. b. Combine standard function types using arithmetic operations. For example, build a function that models the temperature of a cooling body by adding a constant function to a decaying exponential, and relate these functions to the model. c. (+) Compose functions. For example, if T(y) is the temperature in the atmosphere as a function of height, and h(t) is the height of a weather balloon as a function of time, then T(h(t)) is the temperature at the location of the weather balloon as a function of time.
Build new functions from existing functions
3. Identify the effect on the graph of replacing f(x) by f(x) + k, k f(x), f(kx), and f(x + k) for specific values of k (both positive and negative); find the value of k given the graphs. Experiment with cases and illustrate an explanation of the effects on the graph using technology. Include recognizing even and odd functions from their graphs and algebraic expressions for them. 4. Find inverse functions.
a. Solve an equation of the form f(x) = c for a simple function f that has an inverse and write an expression for the inverse. b. (+) Verify by composition that one function is the inverse of another.
5. (+) Understand the inverse relationship between exponents and logarithms and use this relationship to solve problems involving logarithms and exponents.
8
BRIDGE TO COLLEGE MATHEMATICS Transition Course Standards
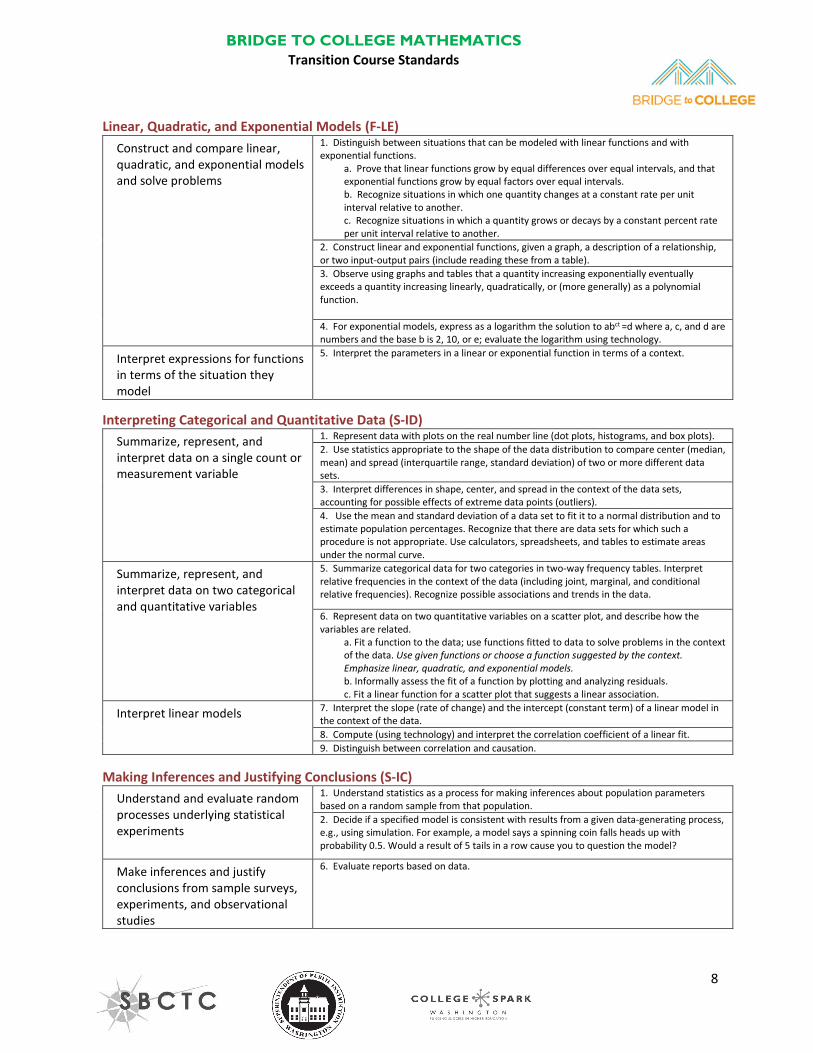
Linear, Quadratic, and Exponential Models (F-LE)
Construct and compare linear, quadratic, and exponential models and solve problems
1. Distinguish between situations that can be modeled with linear functions and with exponential functions.
a. Prove that linear functions grow by equal differences over equal intervals, and that exponential functions grow by equal factors over equal intervals. b. Recognize situations in which one quantity changes at a constant rate per unit interval relative to another. c. Recognize situations in which a quantity grows or decays by a constant percent rate per unit interval relative to another.
2. Construct linear and exponential functions, given a graph, a description of a relationship, or two input-output pairs (include reading these from a table). 3. Observe using graphs and tables that a quantity increasing exponentially eventually exceeds a quantity increasing linearly, quadratically, or (more generally) as a polynomial function. 4. For exponential models, express as a logarithm the solution to abct =d where a, c, and d are numbers and the base b is 2, 10, or e; evaluate the logarithm using technology.
Interpret expressions for functions in terms of the situation they model
5. Interpret the parameters in a linear or exponential function in terms of a context.
Interpreting Categorical and Quantitative Data (S-ID) Summarize, represent, and interpret data on a single count or measurement variable
1. Represent data with plots on the real number line (dot plots, histograms, and box plots). 2. Use statistics appropriate to the shape of the data distribution to compare center (median, mean) and spread (interquartile range, standard deviation) of two or more different data sets. 3. Interpret differences in shape, center, and spread in the context of the data sets, accounting for possible effects of extreme data points (outliers). 4. Use the mean and standard deviation of a data set to fit it to a normal distribution and to estimate population percentages. Recognize that there are data sets for which such a procedure is not appropriate. Use calculators, spreadsheets, and tables to estimate areas under the normal curve.
Summarize, represent, and interpret data on two categorical and quantitative variables
5. Summarize categorical data for two categories in two-way frequency tables. Interpret relative frequencies in the context of the data (including joint, marginal, and conditional relative frequencies). Recognize possible associations and trends in the data.
6. Represent data on two quantitative variables on a scatter plot, and describe how the variables are related.
a. Fit a function to the data; use functions fitted to data to solve problems in the context of the data. Use given functions or choose a function suggested by the context. Emphasize linear, quadratic, and exponential models. b. Informally assess the fit of a function by plotting and analyzing residuals. c. Fit a linear function for a scatter plot that suggests a linear association.
Interpret linear models
7. Interpret the slope (rate of change) and the intercept (constant term) of a linear model in the context of the data. 8. Compute (using technology) and interpret the correlation coefficient of a linear fit. 9. Distinguish between correlation and causation.
Making Inferences and Justifying Conclusions (S-IC) Understand and evaluate random processes underlying statistical experiments
1. Understand statistics as a process for making inferences about population parameters based on a random sample from that population. 2. Decide if a specified model is consistent with results from a given data-generating process, e.g., using simulation. For example, a model says a spinning coin falls heads up with probability 0.5. Would a result of 5 tails in a row cause you to question the model?
Make inferences and justify conclusions from sample surveys, experiments, and observational studies
6. Evaluate reports based on data.
9
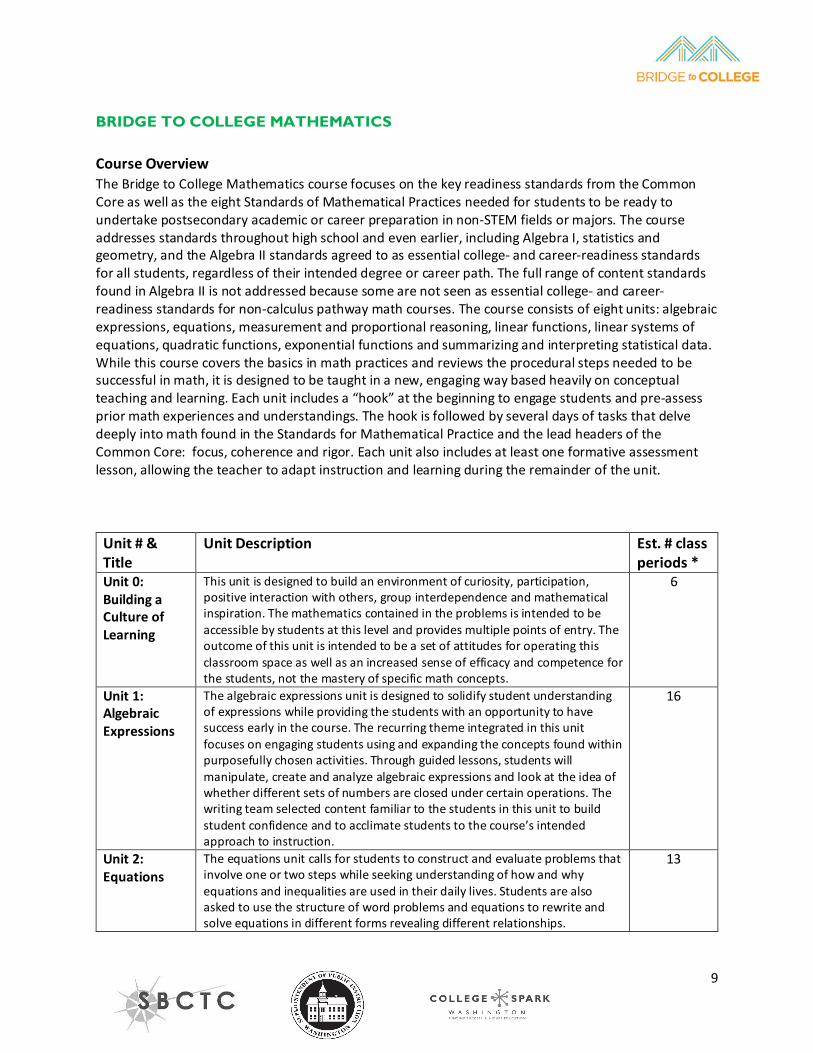
BRIDGE TO COLLEGE MATHEMATICS Course Overview The Bridge to College Mathematics course focuses on the key readiness standards from the Common Core as well as the eight Standards of Mathematical Practices needed for students to be ready to undertake postsecondary academic or career preparation in non-STEM fields or majors. The course addresses standards throughout high school and even earlier, including Algebra I, statistics and geometry, and the Algebra II standards agreed to as essential college- and career-readiness standards for all students, regardless of their intended degree or career path. The full range of content standards found in Algebra II is not addressed because some are not seen as essential college- and career-readiness standards for non-calculus pathway math courses. The course consists of eight units: algebraic expressions, equations, measurement and proportional reasoning, linear functions, linear systems of equations, quadratic functions, exponential functions and summarizing and interpreting statistical data. While this course covers the basics in math practices and reviews the procedural steps needed to be successful in math, it is designed to be taught in a new, engaging way based heavily on conceptual teaching and learning. Each unit includes a “hook” at the beginning to engage students and pre-assess prior math experiences and understandings. The hook is followed by several days of tasks that delve deeply into math found in the Standards for Mathematical Practice and the lead headers of the Common Core: focus, coherence and rigor. Each unit also includes at least one formative assessment lesson, allowing the teacher to adapt instruction and learning during the remainder of the unit.
Unit # & Title
Unit Description Est. # class periods *
Unit 0: Building a Culture of Learning
This unit is designed to build an environment of curiosity, participation, positive interaction with others, group interdependence and mathematical inspiration. The mathematics contained in the problems is intended to be accessible by students at this level and provides multiple points of entry. The outcome of this unit is intended to be a set of attitudes for operating this classroom space as well as an increased sense of efficacy and competence for the students, not the mastery of specific math concepts.
6
Unit 1: Algebraic Expressions
The algebraic expressions unit is designed to solidify student understanding of expressions while providing the students with an opportunity to have success early in the course. The recurring theme integrated in this unit focuses on engaging students using and expanding the concepts found within purposefully chosen activities. Through guided lessons, students will manipulate, create and analyze algebraic expressions and look at the idea of whether different sets of numbers are closed under certain operations. The writing team selected content familiar to the students in this unit to build student confidence and to acclimate students to the course’s intended approach to instruction.
16
Unit 2: Equations
The equations unit calls for students to construct and evaluate problems that involve one or two steps while seeking understanding of how and why equations and inequalities are used in their daily lives. Students are also asked to use the structure of word problems and equations to rewrite and solve equations in different forms revealing different relationships.
13
10
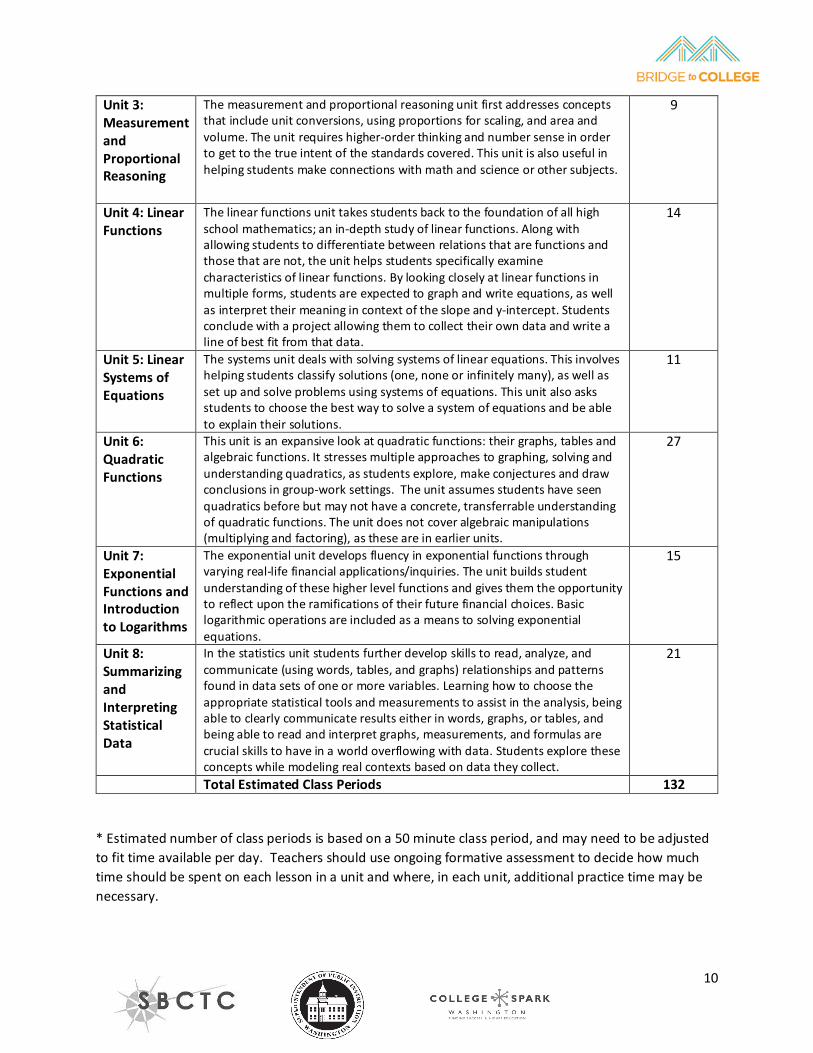
Unit 3: Measurement and Proportional Reasoning
The measurement and proportional reasoning unit first addresses concepts that include unit conversions, using proportions for scaling, and area and volume. The unit requires higher-order thinking and number sense in order to get to the true intent of the standards covered. This unit is also useful in helping students make connections with math and science or other subjects.
9
Unit 4: Linear Functions
The linear functions unit takes students back to the foundation of all high school mathematics; an in-depth study of linear functions. Along with allowing students to differentiate between relations that are functions and those that are not, the unit helps students specifically examine characteristics of linear functions. By looking closely at linear functions in multiple forms, students are expected to graph and write equations, as well as interpret their meaning in context of the slope and y-intercept. Students conclude with a project allowing them to collect their own data and write a line of best fit from that data.
14
Unit 5: Linear Systems of Equations
The systems unit deals with solving systems of linear equations. This involves helping students classify solutions (one, none or infinitely many), as well as set up and solve problems using systems of equations. This unit also asks students to choose the best way to solve a system of equations and be able to explain their solutions.
11
Unit 6: Quadratic Functions
This unit is an expansive look at quadratic functions: their graphs, tables and algebraic functions. It stresses multiple approaches to graphing, solving and understanding quadratics, as students explore, make conjectures and draw conclusions in group-work settings. The unit assumes students have seen quadratics before but may not have a concrete, transferrable understanding of quadratic functions. The unit does not cover algebraic manipulations (multiplying and factoring), as these are in earlier units.
27
Unit 7: Exponential Functions and Introduction to Logarithms
The exponential unit develops fluency in exponential functions through varying real-life financial applications/inquiries. The unit builds student understanding of these higher level functions and gives them the opportunity to reflect upon the ramifications of their future financial choices. Basic logarithmic operations are included as a means to solving exponential equations.
15
Unit 8: Summarizing and Interpreting Statistical Data
In the statistics unit students further develop skills to read, analyze, and communicate (using words, tables, and graphs) relationships and patterns found in data sets of one or more variables. Learning how to choose the appropriate statistical tools and measurements to assist in the analysis, being able to clearly communicate results either in words, graphs, or tables, and being able to read and interpret graphs, measurements, and formulas are crucial skills to have in a world overflowing with data. Students explore these concepts while modeling real contexts based on data they collect.
21
Total Estimated Class Periods 132 * Estimated number of class periods is based on a 50 minute class period, and may need to be adjusted to fit time available per day. Teachers should use ongoing formative assessment to decide how much time should be spent on each lesson in a unit and where, in each unit, additional practice time may be necessary.
11
BRIDGE TO COLLEGE MATHEMATICS
Recommended Priority for Student Enrollment
The Bridge to College Mathematics Course is a math course designed for seniors who scored at Level 2 on the Smarter Balanced high school assessment and for:
• Seniors who have taken Algebra 2 and would benefit from additional math intervention.• Seniors who are recommended by high school instructors based on other factors such as
readiness and their high school and beyond plans. Seniors who are recommended by high schoolinstructors based on other factors such as readiness and their high school and beyond plans.
Important Notes: 1. The Bridge to College Mathematics course can qualify as a 3rd credit of math if the student has
already attempted Algebra 2 or is credit-deficient.2. Currently, the Bridge to College Mathematics Course does not qualify for NCAA or for a COE
course.3. Baccalaureate Requirements: To meet the minimum admissions requirements for state
baccalaureate institutions, students need to pass Algebra 2 for their 3rd credit of math. The Bridge to College Mathematics Course does meet the baccalaureate senior year requirement for a quantitative reasoning course as determined by the Washington Student Achievement Council (College Academic Distribution Requirements (CADR), 2016).
Student Profile
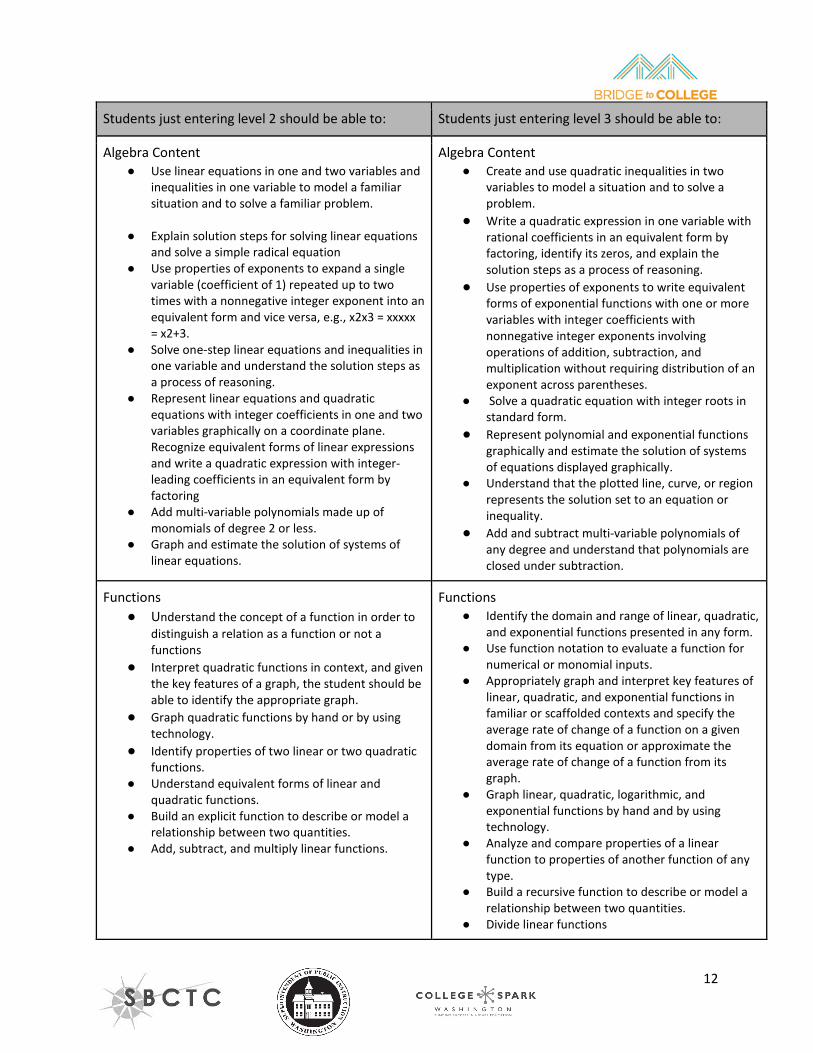
The table on the following page provides specific descriptors of what college-ready (Level 3) and not-quite college ready (Level 2) would look like in each domain of the Washington State High School Mathematics Learning Standards.
Note: these descriptions are from the Smarter Balanced Assessment Consortium “threshold” Achievement Level Descriptors—see http://www.smarterbalanced.org/achievement-levels/ for details.
Level 3: The student has met the achievement standard and demonstrates progress toward mastery of the knowledge and skills in mathematics needed for likely success in entry-level credit-bearing college coursework after completing high school coursework.
Level 2: The student has nearly met the achievement standard and may require further development to demonstrate the knowledge and skills in mathematics needed for likely success in entry-level credit-bearing college coursework after high school.
12
Students just entering level 2 should be able to: Students just entering level 3 should be able to:
Algebra Content ● Use linear equations in one and two variables and
inequalities in one variable to model a familiarsituation and to solve a familiar problem.
● Explain solution steps for solving linear equationsand solve a simple radical equation
● Use properties of exponents to expand a singlevariable (coefficient of 1) repeated up to twotimes with a nonnegative integer exponent into anequivalent form and vice versa, e.g., x2x3 = xxxxx= x2+3.
● Solve one-step linear equations and inequalities inone variable and understand the solution steps asa process of reasoning.
● Represent linear equations and quadraticequations with integer coefficients in one and twovariables graphically on a coordinate plane.Recognize equivalent forms of linear expressionsand write a quadratic expression with integer- leading coefficients in an equivalent form byfactoring
● Add multi-variable polynomials made up ofmonomials of degree 2 or less.
● Graph and estimate the solution of systems oflinear equations.
Algebra Content ● Create and use quadratic inequalities in two
variables to model a situation and to solve aproblem.
● Write a quadratic expression in one variable withrational coefficients in an equivalent form byfactoring, identify its zeros, and explain thesolution steps as a process of reasoning.
● Use properties of exponents to write equivalentforms of exponential functions with one or morevariables with integer coefficients withnonnegative integer exponents involvingoperations of addition, subtraction, andmultiplication without requiring distribution of anexponent across parentheses.
● Solve a quadratic equation with integer roots instandard form.
● Represent polynomial and exponential functionsgraphically and estimate the solution of systemsof equations displayed graphically.
● Understand that the plotted line, curve, or regionrepresents the solution set to an equation orinequality.
● Add and subtract multi-variable polynomials ofany degree and understand that polynomials areclosed under subtraction.
Functions ● Understand the concept of a function in order to
distinguish a relation as a function or not afunctions
● Interpret quadratic functions in context, and giventhe key features of a graph, the student should beable to identify the appropriate graph.
● Graph quadratic functions by hand or by usingtechnology.
● Identify properties of two linear or two quadraticfunctions.
● Understand equivalent forms of linear andquadratic functions.
● Build an explicit function to describe or model arelationship between two quantities.
● Add, subtract, and multiply linear functions.
Functions ● Identify the domain and range of linear, quadratic,
and exponential functions presented in any form.● Use function notation to evaluate a function for
numerical or monomial inputs.● Appropriately graph and interpret key features of
linear, quadratic, and exponential functions infamiliar or scaffolded contexts and specify theaverage rate of change of a function on a givendomain from its equation or approximate theaverage rate of change of a function from itsgraph.
● Graph linear, quadratic, logarithmic, andexponential functions by hand and by usingtechnology.
● Analyze and compare properties of a linearfunction to properties of another function of anytype.
● Build a recursive function to describe or model arelationship between two quantities.
● Divide linear functions
13
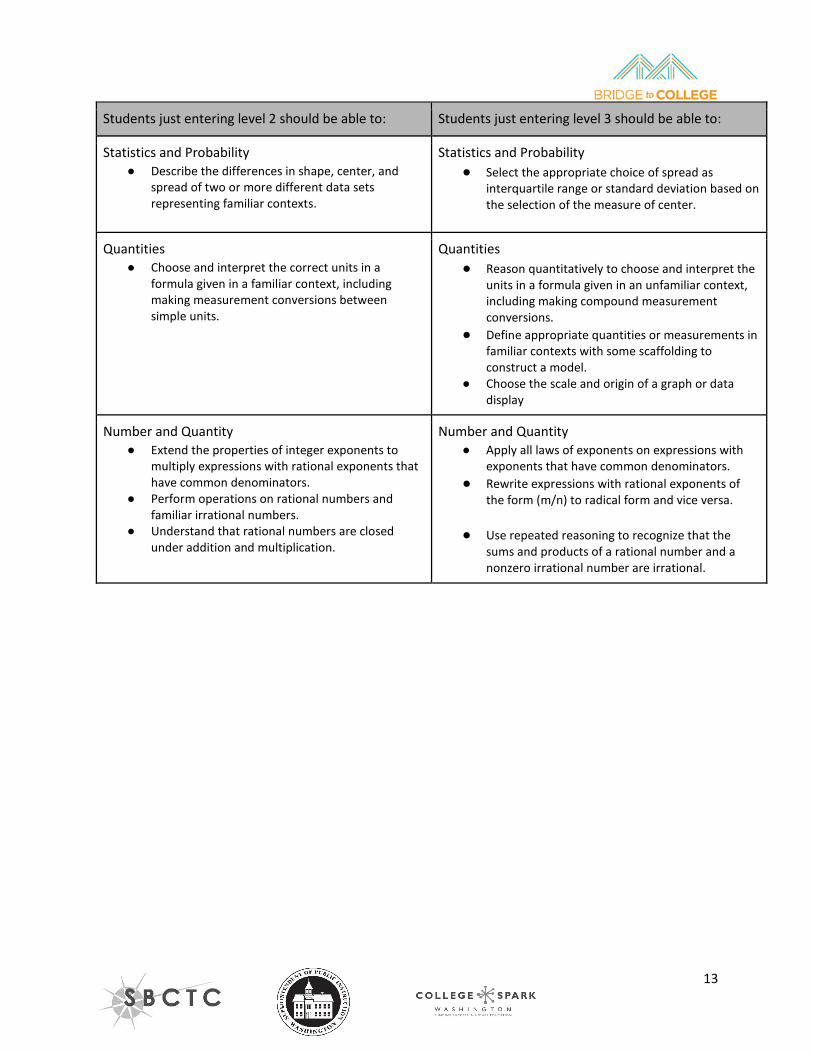
Students just entering level 2 should be able to: Students just entering level 3 should be able to:
Statistics and Probability ● Describe the differences in shape, center, and
spread of two or more different data sets representing familiar contexts.
Statistics and Probability ● Select the appropriate choice of spread as
interquartile range or standard deviation based on the selection of the measure of center.
Quantities ● Choose and interpret the correct units in a
formula given in a familiar context, including making measurement conversions between simple units.
Quantities ● Reason quantitatively to choose and interpret the
units in a formula given in an unfamiliar context, including making compound measurement conversions.
● Define appropriate quantities or measurements in familiar contexts with some scaffolding to construct a model.
● Choose the scale and origin of a graph or data display
Number and Quantity ● Extend the properties of integer exponents to
multiply expressions with rational exponents that have common denominators.
● Perform operations on rational numbers and familiar irrational numbers.
● Understand that rational numbers are closed under addition and multiplication.
Number and Quantity ● Apply all laws of exponents on expressions with
exponents that have common denominators. ● Rewrite expressions with rational exponents of
the form (m/n) to radical form and vice versa.
● Use repeated reasoning to recognize that the sums and products of a rational number and a nonzero irrational number are irrational.
14
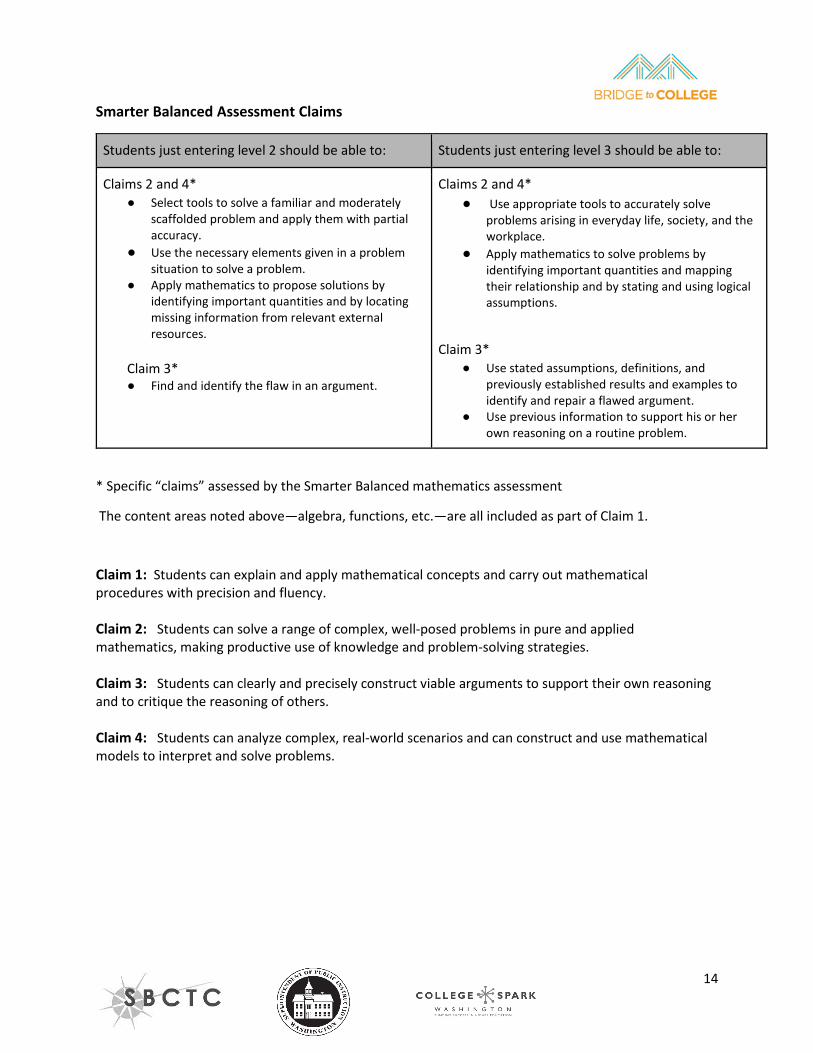
Smarter Balanced Assessment Claims
Students just entering level 2 should be able to: Students just entering level 3 should be able to:
Claims 2 and 4* ● Select tools to solve a familiar and moderately
scaffolded problem and apply them with partial accuracy.
● Use the necessary elements given in a problem situation to solve a problem.
● Apply mathematics to propose solutions by identifying important quantities and by locating missing information from relevant external resources.
Claim 3* ● Find and identify the flaw in an argument.
Claims 2 and 4* ● Use appropriate tools to accurately solve
problems arising in everyday life, society, and the workplace.
● Apply mathematics to solve problems by identifying important quantities and mapping their relationship and by stating and using logical assumptions.
Claim 3* ● Use stated assumptions, definitions, and
previously established results and examples to identify and repair a flawed argument.
● Use previous information to support his or her own reasoning on a routine problem.
* Specific “claims” assessed by the Smarter Balanced mathematics assessment
The content areas noted above—algebra, functions, etc.—are all included as part of Claim 1.
Claim 1: Students can explain and apply mathematical concepts and carry out mathematical procedures with precision and fluency. Claim 2: Students can solve a range of complex, well-posed problems in pure and applied mathematics, making productive use of knowledge and problem-solving strategies. Claim 3: Students can clearly and precisely construct viable arguments to support their own reasoning and to critique the reasoning of others. Claim 4: Students can analyze complex, real-world scenarios and can construct and use mathematical models to interpret and solve problems.
15
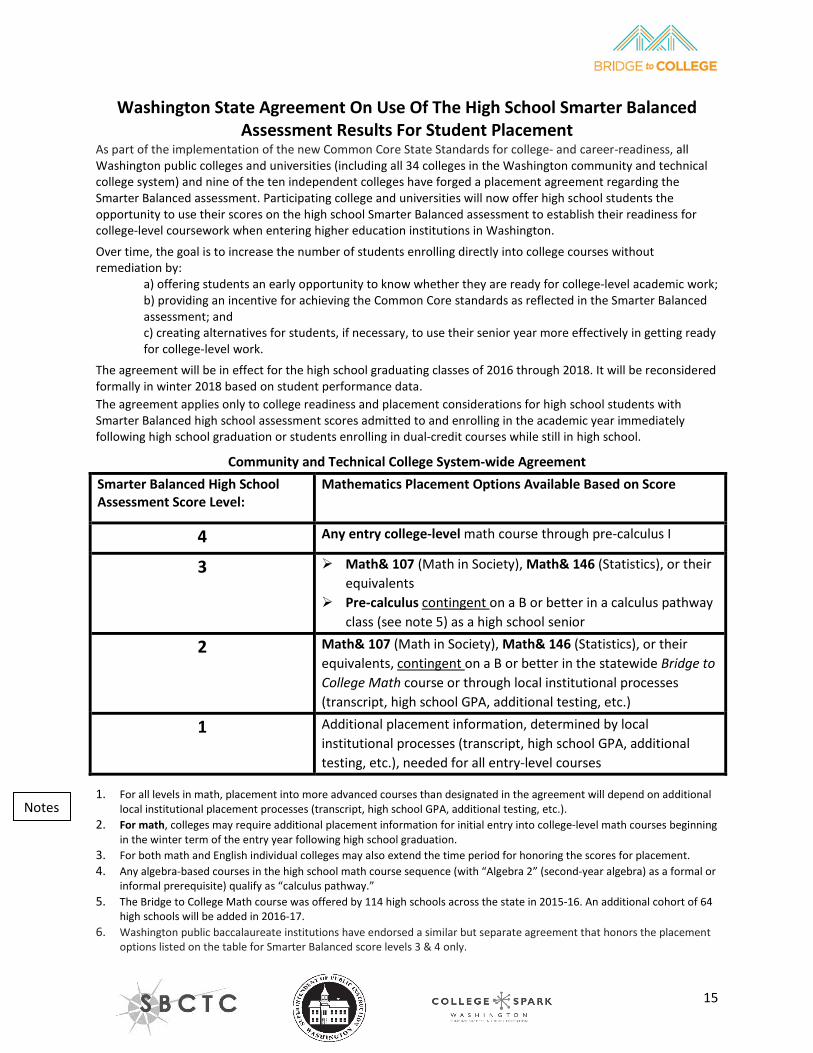
Washington State Agreement On Use Of The High School Smarter Balanced Assessment Results For Student Placement
As part of the implementation of the new Common Core State Standards for college- and career-readiness, all Washington public colleges and universities (including all 34 colleges in the Washington community and technical college system) and nine of the ten independent colleges have forged a placement agreement regarding the Smarter Balanced assessment. Participating college and universities will now offer high school students the opportunity to use their scores on the high school Smarter Balanced assessment to establish their readiness for college-level coursework when entering higher education institutions in Washington.
Over time, the goal is to increase the number of students enrolling directly into college courses without remediation by:
a) offering students an early opportunity to know whether they are ready for college-level academic work; b) providing an incentive for achieving the Common Core standards as reflected in the Smarter Balanced assessment; and c) creating alternatives for students, if necessary, to use their senior year more effectively in getting ready for college-level work.
The agreement will be in effect for the high school graduating classes of 2016 through 2018. It will be reconsidered formally in winter 2018 based on student performance data.
The agreement applies only to college readiness and placement considerations for high school students with Smarter Balanced high school assessment scores admitted to and enrolling in the academic year immediately following high school graduation or students enrolling in dual-credit courses while still in high school.
Community and Technical College System-wide Agreement
Smarter Balanced High School Assessment Score Level:
Mathematics Placement Options Available Based on Score
4 Any entry college-level math course through pre-calculus I
3 Math& 107 (Math in Society), Math& 146 (Statistics), or their equivalents
Pre-calculus contingent on a B or better in a calculus pathway class (see note 5) as a high school senior
2 Math& 107 (Math in Society), Math& 146 (Statistics), or their equivalents, contingent on a B or better in the statewide Bridge to College Math course or through local institutional processes (transcript, high school GPA, additional testing, etc.)
1 Additional placement information, determined by local institutional processes (transcript, high school GPA, additional testing, etc.), needed for all entry-level courses
1. For all levels in math, placement into more advanced courses than designated in the agreement will depend on additional local institutional placement processes (transcript, high school GPA, additional testing, etc.).
2. For math, colleges may require additional placement information for initial entry into college-level math courses beginning in the winter term of the entry year following high school graduation.
3. For both math and English individual colleges may also extend the time period for honoring the scores for placement. 4. Any algebra-based courses in the high school math course sequence (with “Algebra 2” (second-year algebra) as a formal or
informal prerequisite) qualify as “calculus pathway.” 5. The Bridge to College Math course was offered by 114 high schools across the state in 2015-16. An additional cohort of 64
high schools will be added in 2016-17. 6. Washington public baccalaureate institutions have endorsed a similar but separate agreement that honors the placement
options listed on the table for Smarter Balanced score levels 3 & 4 only.
Notes
16
BRIDGE TO COLLEGE MATHEMATICS Assessment Practices and Resources
As part of a placement agreement with the community and technical colleges in the state of Washington, a student who earns a 2 on the SBAC in spring of their junior year of high school and then receives a B or higher in the Bridge to College Math transition course in their senior year of high school will be entitled to placement into entry level college math courses that are not on the calculus pathway (such as MATH&107 Math in Society and MATH&146 Statistics). This agreement only applies if they enroll at a community or technical college in the state of Washington in the fall quarter immediately following graduation from high school. In order to qualify for the placement, the student must complete both semesters of the course and must earn a B or higher in the second semester of Bridge to College Mathematics. A “B” in this course should represent a student’s understanding of the mathematics of the course as identified by the standards, including the Standards for Mathematical Practices. Overall grades in the course can be determined by many components (homework, participation, group exercises, writing, online practice, etc.), but a significant portion of the overall grade should come from assessments (such as quizzes and tests) which are aligned to these standards. Bridge to College Mathematics instructors are expected to give summative in-class assessments taken by individual students for each unit of the course as well as comprehensive semester exams. A bank of assessment items for each unit is provided which instructors are welcome to use in creating these assessments. Each teacher is assigned to a Regional Bridge Team with other instructors who are teaching the course. They will have three days to meet as a “Community of Practice” (CoP) throughout the school year, and each time will collaboratively choose at least one common assessment item to give their students prior to coming together. Each CoP meeting will include a time where teachers work through a protocol of looking at student work from this problem and discussing which examples represent B level students and which do not. Results of these CoP meetings will be shared with the Bridge to College Mathematics community, which includes Higher Education Partners and Contacts.
Grading is a complex and difficult endeavor, and practices vary dramatically between classrooms, schools, and districts. There is not a required specific assessment for all students in the course across the state, but teachers are expected to assess their students appropriately throughout the year on the course standards. Students who earn a grade of B or higher in the course should be prepared for the previously mentioned non-calculus pathway college level math courses. Higher Education Partners and Contacts across the state are available to serve as consultants in this process in order to increase the chance that a student is successful in this transition.
17
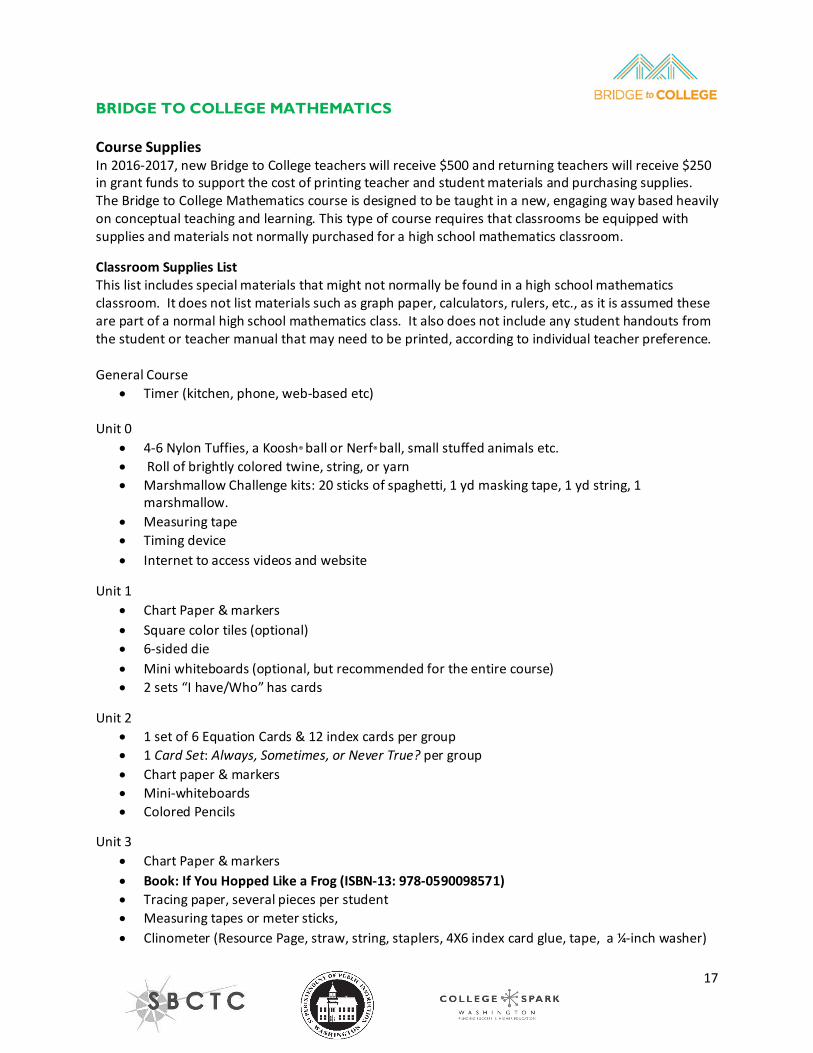
BRIDGE TO COLLEGE MATHEMATICS Course Supplies In 2016-2017, new Bridge to College teachers will receive $500 and returning teachers will receive $250 in grant funds to support the cost of printing teacher and student materials and purchasing supplies. The Bridge to College Mathematics course is designed to be taught in a new, engaging way based heavily on conceptual teaching and learning. This type of course requires that classrooms be equipped with supplies and materials not normally purchased for a high school mathematics classroom. Classroom Supplies List This list includes special materials that might not normally be found in a high school mathematics classroom. It does not list materials such as graph paper, calculators, rulers, etc., as it is assumed these are part of a normal high school mathematics class. It also does not include any student handouts from the student or teacher manual that may need to be printed, according to individual teacher preference. General Course
• Timer (kitchen, phone, web-based etc) Unit 0
• 4-6 Nylon Tuffies, a Koosh® ball or Nerf® ball, small stuffed animals etc. • Roll of brightly colored twine, string, or yarn • Marshmallow Challenge kits: 20 sticks of spaghetti, 1 yd masking tape, 1 yd string, 1
marshmallow. • Measuring tape • Timing device • Internet to access videos and website
Unit 1
• Chart Paper & markers • Square color tiles (optional) • 6-sided die • Mini whiteboards (optional, but recommended for the entire course) • 2 sets “I have/Who” has cards
Unit 2
• 1 set of 6 Equation Cards & 12 index cards per group • 1 Card Set: Always, Sometimes, or Never True? per group • Chart paper & markers • Mini-whiteboards • Colored Pencils
Unit 3
• Chart Paper & markers • Book: If You Hopped Like a Frog (ISBN-13: 978-0590098571) • Tracing paper, several pieces per student • Measuring tapes or meter sticks, • Clinometer (Resource Page, straw, string, staplers, 4X6 index card glue, tape, a ¼-inch washer)
18
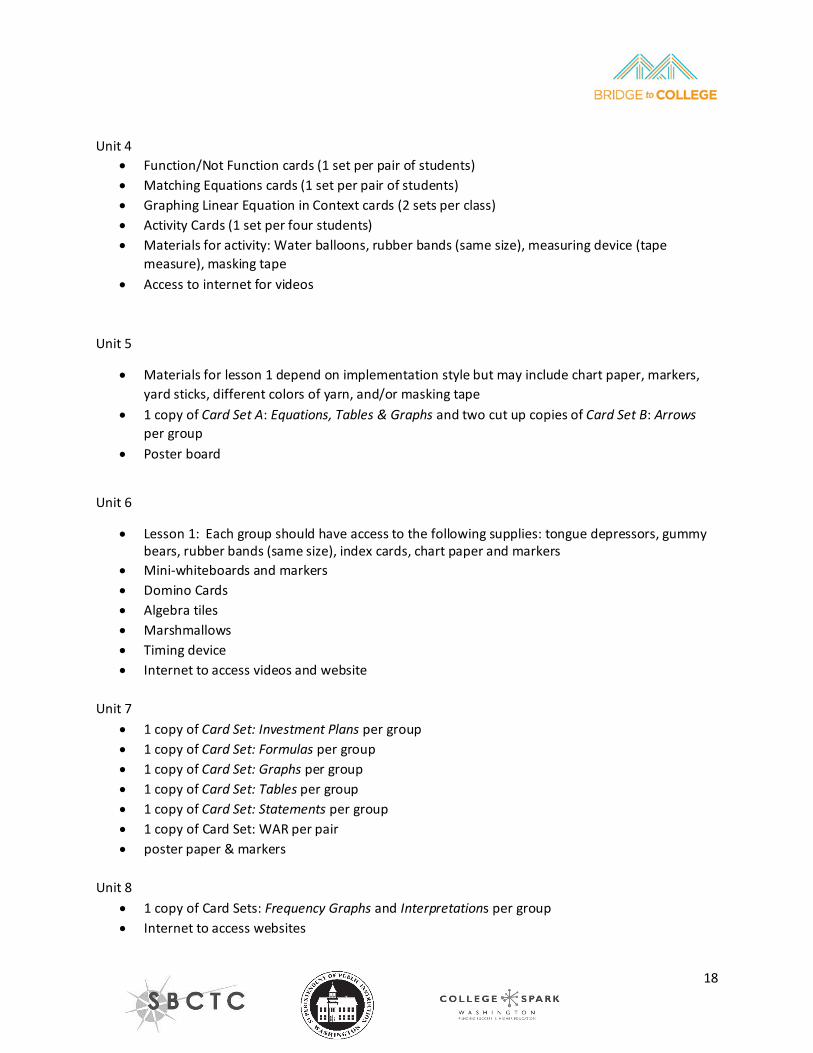
Unit 4
• Function/Not Function cards (1 set per pair of students) • Matching Equations cards (1 set per pair of students) • Graphing Linear Equation in Context cards (2 sets per class) • Activity Cards (1 set per four students) • Materials for activity: Water balloons, rubber bands (same size), measuring device (tape
measure), masking tape • Access to internet for videos
Unit 5
• Materials for lesson 1 depend on implementation style but may include chart paper, markers, yard sticks, different colors of yarn, and/or masking tape
• 1 copy of Card Set A: Equations, Tables & Graphs and two cut up copies of Card Set B: Arrows per group
• Poster board
Unit 6
• Lesson 1: Each group should have access to the following supplies: tongue depressors, gummy bears, rubber bands (same size), index cards, chart paper and markers
• Mini-whiteboards and markers • Domino Cards • Algebra tiles • Marshmallows • Timing device • Internet to access videos and website
Unit 7
• 1 copy of Card Set: Investment Plans per group • 1 copy of Card Set: Formulas per group • 1 copy of Card Set: Graphs per group • 1 copy of Card Set: Tables per group • 1 copy of Card Set: Statements per group • 1 copy of Card Set: WAR per pair • poster paper & markers
Unit 8
• 1 copy of Card Sets: Frequency Graphs and Interpretations per group • Internet to access websites
19
BRIDGE TO COLLEGE MATHEMATICS Online Course Resources and Support The Bridge to College Mathematics course uses CANVAS as a platform for distributing course materials and building a network of virtual support for teachers, team leaders, and course trainers. All teachers of the course will be invited to enroll in the course in early August 2016. Course Materials Printable copies of all course materials updated for 2016-2017 will be posted into CANVAS for teachers to download and use to create student workbooks, handouts, Power Points, etc. Unit level instructional materials include:
o Curriculum Guide o Teacher Manual o Student Manual o Assessment Bank o Assessment Bank Answer Key
In addition, the introductory materials contained within the binder provided to all teachers in August 2016 will be available on CANVAS. Virtual Network To facilitate the development of a network of virtual support for course teachers, team leaders, and course trainers, you will find discussion forums on CANVAS. In addition, the Bridge Course Leadership Team is investigating various methods of virtual collaboration for BTC teachers throughout the state. Other Resources Folder As a grant funded participant, each Bridge Course teacher is entitled to download a copy of the pdf of NCTM’s Principles to Actions: Ensuring Mathematical Success for All which is posted in CANVAS. Please note that while the e-books remain the property of the participants to whom they are distributed, they are not to be shared further as a matter of both copyright and common courtesy. Additional documents from the summer institute and related links and articles will also be added to this section on CANVAS as the virtual network begins to form in 2016-2017.
20
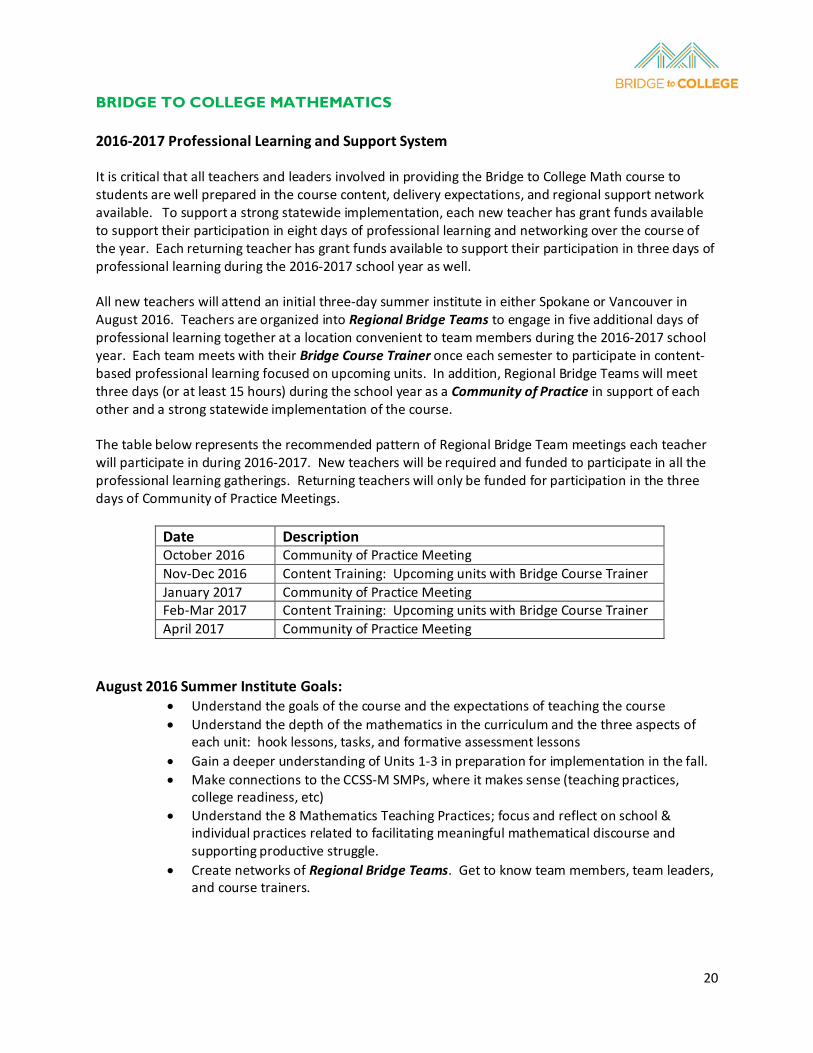
BRIDGE TO COLLEGE MATHEMATICS 2016-2017 Professional Learning and Support System It is critical that all teachers and leaders involved in providing the Bridge to College Math course to students are well prepared in the course content, delivery expectations, and regional support network available. To support a strong statewide implementation, each new teacher has grant funds available to support their participation in eight days of professional learning and networking over the course of the year. Each returning teacher has grant funds available to support their participation in three days of professional learning during the 2016-2017 school year as well. All new teachers will attend an initial three-day summer institute in either Spokane or Vancouver in August 2016. Teachers are organized into Regional Bridge Teams to engage in five additional days of professional learning together at a location convenient to team members during the 2016-2017 school year. Each team meets with their Bridge Course Trainer once each semester to participate in content-based professional learning focused on upcoming units. In addition, Regional Bridge Teams will meet three days (or at least 15 hours) during the school year as a Community of Practice in support of each other and a strong statewide implementation of the course. The table below represents the recommended pattern of Regional Bridge Team meetings each teacher will participate in during 2016-2017. New teachers will be required and funded to participate in all the professional learning gatherings. Returning teachers will only be funded for participation in the three days of Community of Practice Meetings.
Date Description October 2016 Community of Practice Meeting Nov-Dec 2016 Content Training: Upcoming units with Bridge Course Trainer January 2017 Community of Practice Meeting Feb-Mar 2017 Content Training: Upcoming units with Bridge Course Trainer April 2017 Community of Practice Meeting
August 2016 Summer Institute Goals:
• Understand the goals of the course and the expectations of teaching the course • Understand the depth of the mathematics in the curriculum and the three aspects of
each unit: hook lessons, tasks, and formative assessment lessons • Gain a deeper understanding of Units 1-3 in preparation for implementation in the fall. • Make connections to the CCSS-M SMPs, where it makes sense (teaching practices,
college readiness, etc) • Understand the 8 Mathematics Teaching Practices; focus and reflect on school &
individual practices related to facilitating meaningful mathematical discourse and supporting productive struggle.
• Create networks of Regional Bridge Teams. Get to know team members, team leaders, and course trainers.
21
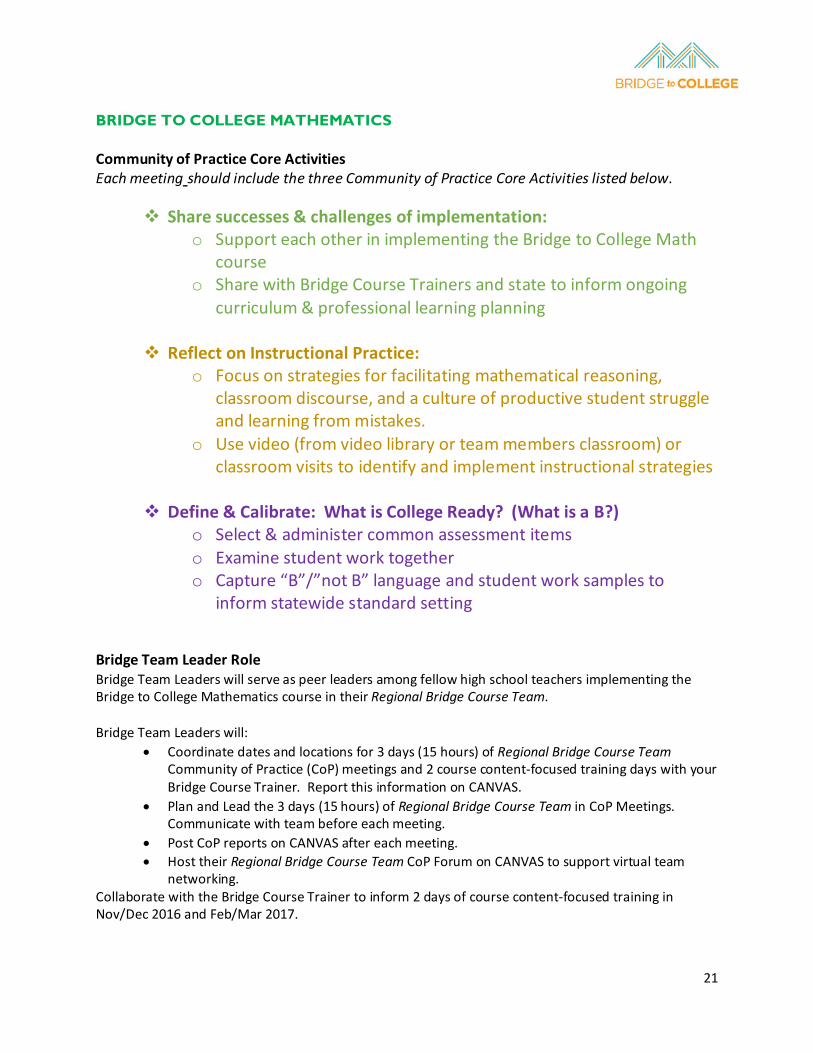
BRIDGE TO COLLEGE MATHEMATICS Community of Practice Core Activities Each meeting should include the three Community of Practice Core Activities listed below.
Share successes & challenges of implementation: o Support each other in implementing the Bridge to College Math
course o Share with Bridge Course Trainers and state to inform ongoing
curriculum & professional learning planning
Reflect on Instructional Practice: o Focus on strategies for facilitating mathematical reasoning,
classroom discourse, and a culture of productive student struggle and learning from mistakes.
o Use video (from video library or team members classroom) or classroom visits to identify and implement instructional strategies
Define & Calibrate: What is College Ready? (What is a B?) o Select & administer common assessment items o Examine student work together o Capture “B”/”not B” language and student work samples to
inform statewide standard setting
Bridge Team Leader Role Bridge Team Leaders will serve as peer leaders among fellow high school teachers implementing the Bridge to College Mathematics course in their Regional Bridge Course Team. Bridge Team Leaders will:
• Coordinate dates and locations for 3 days (15 hours) of Regional Bridge Course Team Community of Practice (CoP) meetings and 2 course content-focused training days with your Bridge Course Trainer. Report this information on CANVAS.
• Plan and Lead the 3 days (15 hours) of Regional Bridge Course Team in CoP Meetings. Communicate with team before each meeting.
• Post CoP reports on CANVAS after each meeting. • Host their Regional Bridge Course Team CoP Forum on CANVAS to support virtual team
networking. Collaborate with the Bridge Course Trainer to inform 2 days of course content-focused training in Nov/Dec 2016 and Feb/Mar 2017.
22
BRIDGE TO COLLEGE MATHEMATICS
2016-2017 Community of Practice Meetings
Regional Bridge Course Teams are funded for three full-day Community of Practice meetings in October 2016, January 2017, and April 2017. Regional Bridge Course Teams may elect to meet more frequently, for fewer hours, but should plan within the following parameters:
• Meet at least 15 hours over the course of the school year, with a final meeting no earlier thanApril 2017.
• Engage in each of the three Community of Practice Core Activities (Share Successes &Challenges, Reflect on Instructional Practice, Define & Calibrate) at least three times during thecourse of the year.
• Post reports on CANVAS as requested in the protocols.
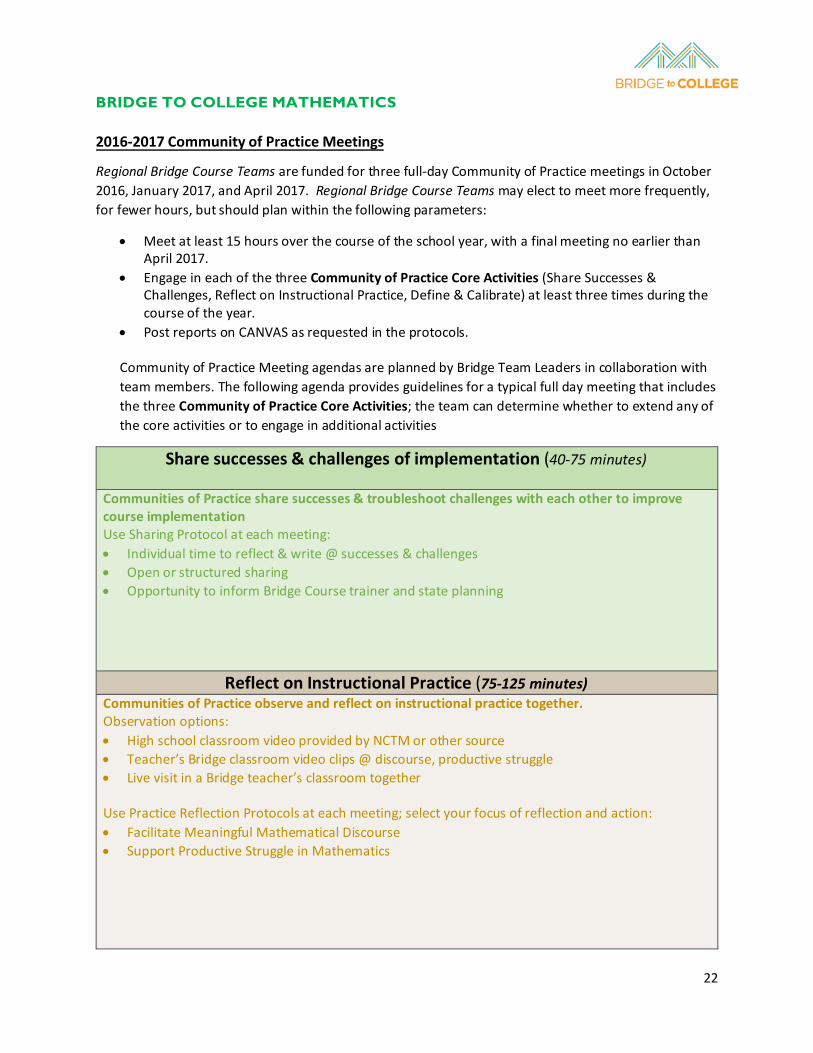
Community of Practice Meeting agendas are planned by Bridge Team Leaders in collaboration with team members. The following agenda provides guidelines for a typical full day meeting that includes the three Community of Practice Core Activities; the team can determine whether to extend any of the core activities or to engage in additional activities
Share successes & challenges of implementation (40-75 minutes)
Communities of Practice share successes & troubleshoot challenges with each other to improve course implementation Use Sharing Protocol at each meeting: • Individual time to reflect & write @ successes & challenges• Open or structured sharing • Opportunity to inform Bridge Course trainer and state planning
Reflect on Instructional Practice (75-125 minutes) Communities of Practice observe and reflect on instructional practice together. Observation options: • High school classroom video provided by NCTM or other source• Teacher’s Bridge classroom video clips @ discourse, productive struggle• Live visit in a Bridge teacher’s classroom together
Use Practice Reflection Protocols at each meeting; select your focus of reflection and action: • Facilitate Meaningful Mathematical Discourse• Support Productive Struggle in Mathematics
23
Define & Calibrate: What is College Ready?(What is a B?) (60-100 minutes) Communities of Practice use common assessment items to calibrate team thinking about college readiness.
• OSPI/SBCTC provides assessment banks for each unit with 4-5 starred tasks • CoP selects at least 1 starred task per unit that all teachers will include in a unit assessment • OSPI/SBCTC collects “B” language & samples to provide resources to inform calibration with
Community College. Use Student Work Protocol at each meeting • All teachers bring common student work to each meeting & use the protocol to refine college
ready expectations. • Share task specific language for level 3 (ready/B) and level 2 (not ready/not B). Post 1 student
work sample for each level.
24
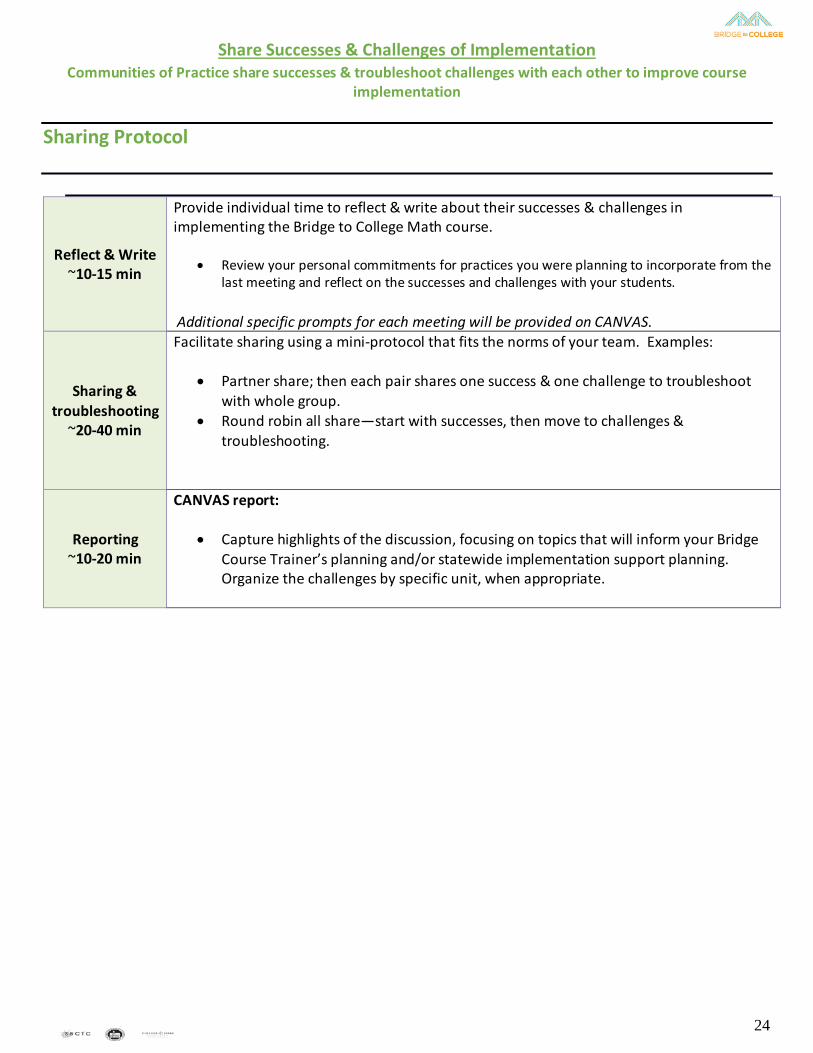
Share Successes & Challenges of Implementation Communities of Practice share successes & troubleshoot challenges with each other to improve course
implementation
Sharing Protocol
Reflect & Write ~10-15 min
Provide individual time to reflect & write about their successes & challenges in implementing the Bridge to College Math course.
• Review your personal commitments for practices you were planning to incorporate from the last meeting and reflect on the successes and challenges with your students.
Additional specific prompts for each meeting will be provided on CANVAS.
Sharing & troubleshooting
~20-40 min
Facilitate sharing using a mini-protocol that fits the norms of your team. Examples:
• Partner share; then each pair shares one success & one challenge to troubleshoot with whole group.
• Round robin all share—start with successes, then move to challenges & troubleshooting.
Reporting ~10-20 min
CANVAS report:
• Capture highlights of the discussion, focusing on topics that will inform your Bridge Course Trainer’s planning and/or statewide implementation support planning. Organize the challenges by specific unit, when appropriate.
25
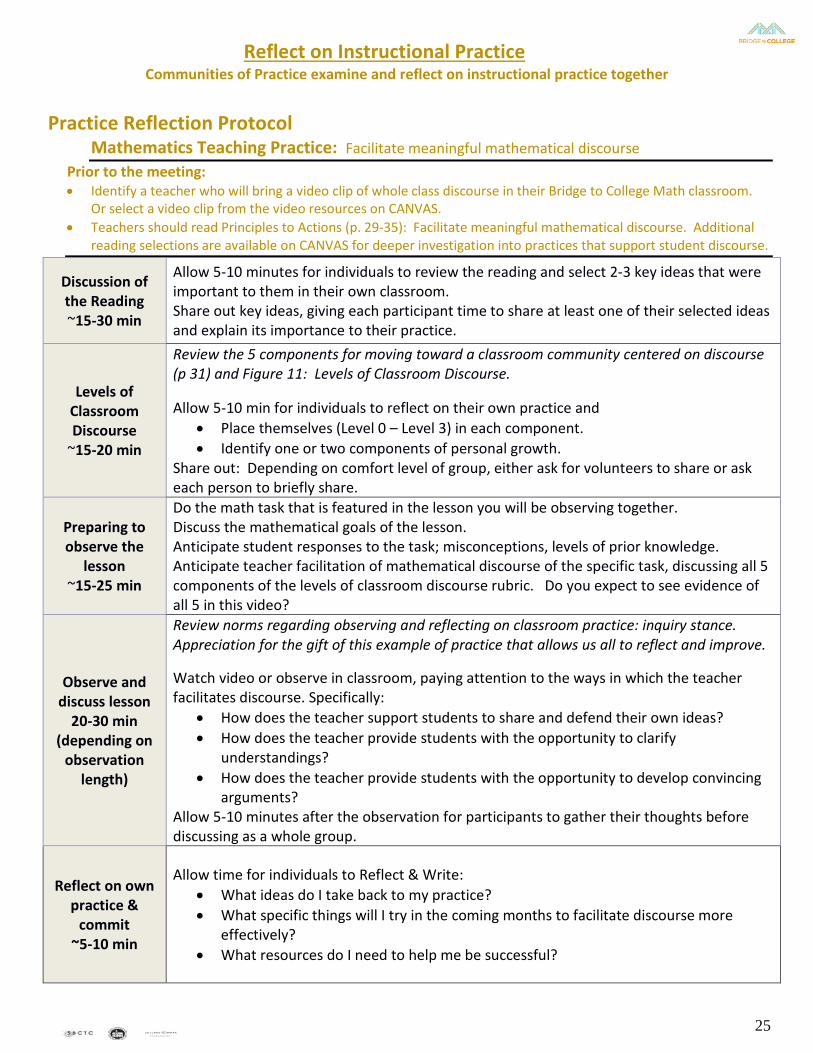
Reflect on Instructional Practice Communities of Practice examine and reflect on instructional practice together
Practice Reflection Protocol
Mathematics Teaching Practice: Facilitate meaningful mathematical discourse Prior to the meeting: • Identify a teacher who will bring a video clip of whole class discourse in their Bridge to College Math classroom.
Or select a video clip from the video resources on CANVAS. • Teachers should read Principles to Actions (p. 29-35): Facilitate meaningful mathematical discourse. Additional
reading selections are available on CANVAS for deeper investigation into practices that support student discourse.
Discussion of the Reading ~15-30 min
Allow 5-10 minutes for individuals to review the reading and select 2-3 key ideas that were important to them in their own classroom. Share out key ideas, giving each participant time to share at least one of their selected ideas and explain its importance to their practice.
Levels of Classroom Discourse
~15-20 min
Review the 5 components for moving toward a classroom community centered on discourse (p 31) and Figure 11: Levels of Classroom Discourse. Allow 5-10 min for individuals to reflect on their own practice and
• Place themselves (Level 0 – Level 3) in each component. • Identify one or two components of personal growth.
Share out: Depending on comfort level of group, either ask for volunteers to share or ask each person to briefly share.
Preparing to observe the
lesson ~15-25 min
Do the math task that is featured in the lesson you will be observing together. Discuss the mathematical goals of the lesson. Anticipate student responses to the task; misconceptions, levels of prior knowledge. Anticipate teacher facilitation of mathematical discourse of the specific task, discussing all 5 components of the levels of classroom discourse rubric. Do you expect to see evidence of all 5 in this video?
Observe and discuss lesson
20-30 min (depending on
observation length)
Review norms regarding observing and reflecting on classroom practice: inquiry stance. Appreciation for the gift of this example of practice that allows us all to reflect and improve. Watch video or observe in classroom, paying attention to the ways in which the teacher facilitates discourse. Specifically:
• How does the teacher support students to share and defend their own ideas? • How does the teacher provide students with the opportunity to clarify
understandings? • How does the teacher provide students with the opportunity to develop convincing
arguments? Allow 5-10 minutes after the observation for participants to gather their thoughts before discussing as a whole group.
Reflect on own
practice & commit
~5-10 min
Allow time for individuals to Reflect & Write: • What ideas do I take back to my practice? • What specific things will I try in the coming months to facilitate discourse more
effectively? • What resources do I need to help me be successful?
26
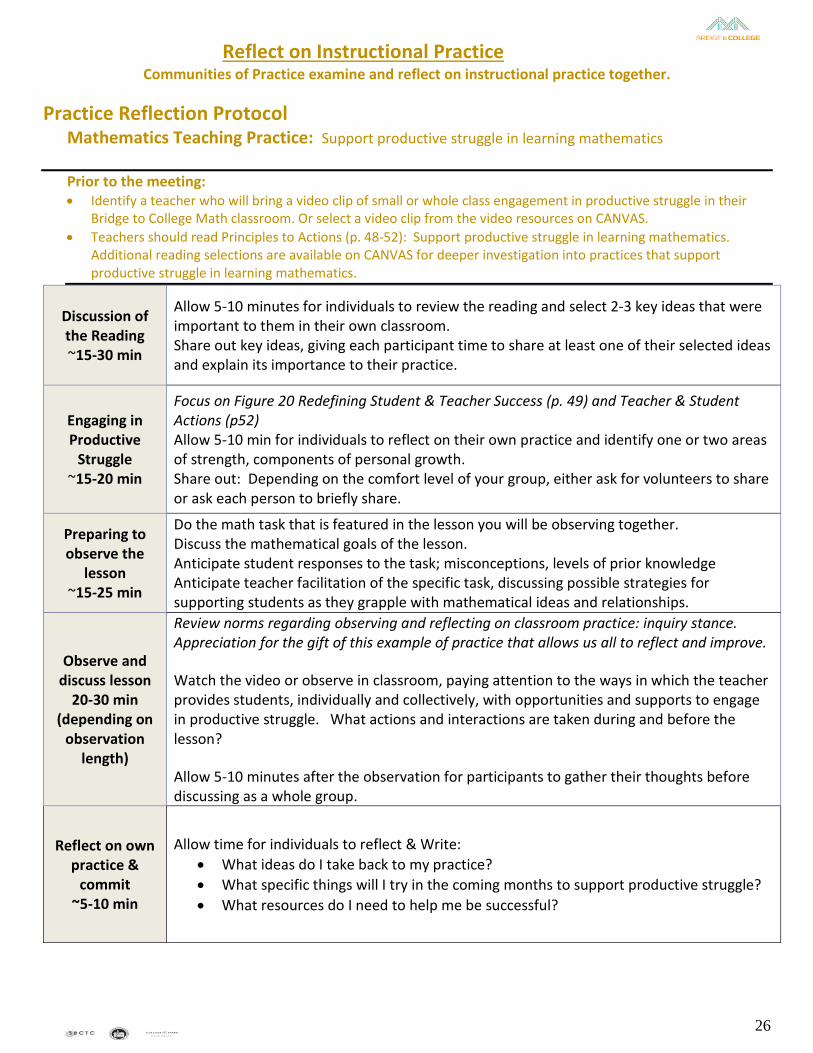
Reflect on Instructional Practice Communities of Practice examine and reflect on instructional practice together.
Practice Reflection Protocol
Mathematics Teaching Practice: Support productive struggle in learning mathematics
Prior to the meeting: • Identify a teacher who will bring a video clip of small or whole class engagement in productive struggle in their
Bridge to College Math classroom. Or select a video clip from the video resources on CANVAS. • Teachers should read Principles to Actions (p. 48-52): Support productive struggle in learning mathematics.
Additional reading selections are available on CANVAS for deeper investigation into practices that support productive struggle in learning mathematics.
Discussion of the Reading ~15-30 min
Allow 5-10 minutes for individuals to review the reading and select 2-3 key ideas that were important to them in their own classroom. Share out key ideas, giving each participant time to share at least one of their selected ideas and explain its importance to their practice.
Engaging in Productive
Struggle ~15-20 min
Focus on Figure 20 Redefining Student & Teacher Success (p. 49) and Teacher & Student Actions (p52) Allow 5-10 min for individuals to reflect on their own practice and identify one or two areas of strength, components of personal growth. Share out: Depending on the comfort level of your group, either ask for volunteers to share or ask each person to briefly share.
Preparing to observe the
lesson ~15-25 min
Do the math task that is featured in the lesson you will be observing together. Discuss the mathematical goals of the lesson. Anticipate student responses to the task; misconceptions, levels of prior knowledge Anticipate teacher facilitation of the specific task, discussing possible strategies for supporting students as they grapple with mathematical ideas and relationships.
Observe and discuss lesson
20-30 min (depending on
observation length)
Review norms regarding observing and reflecting on classroom practice: inquiry stance. Appreciation for the gift of this example of practice that allows us all to reflect and improve. Watch the video or observe in classroom, paying attention to the ways in which the teacher provides students, individually and collectively, with opportunities and supports to engage in productive struggle. What actions and interactions are taken during and before the lesson? Allow 5-10 minutes after the observation for participants to gather their thoughts before discussing as a whole group.
Reflect on own
practice & commit
~5-10 min
Allow time for individuals to reflect & Write: • What ideas do I take back to my practice? • What specific things will I try in the coming months to support productive struggle? • What resources do I need to help me be successful?
27
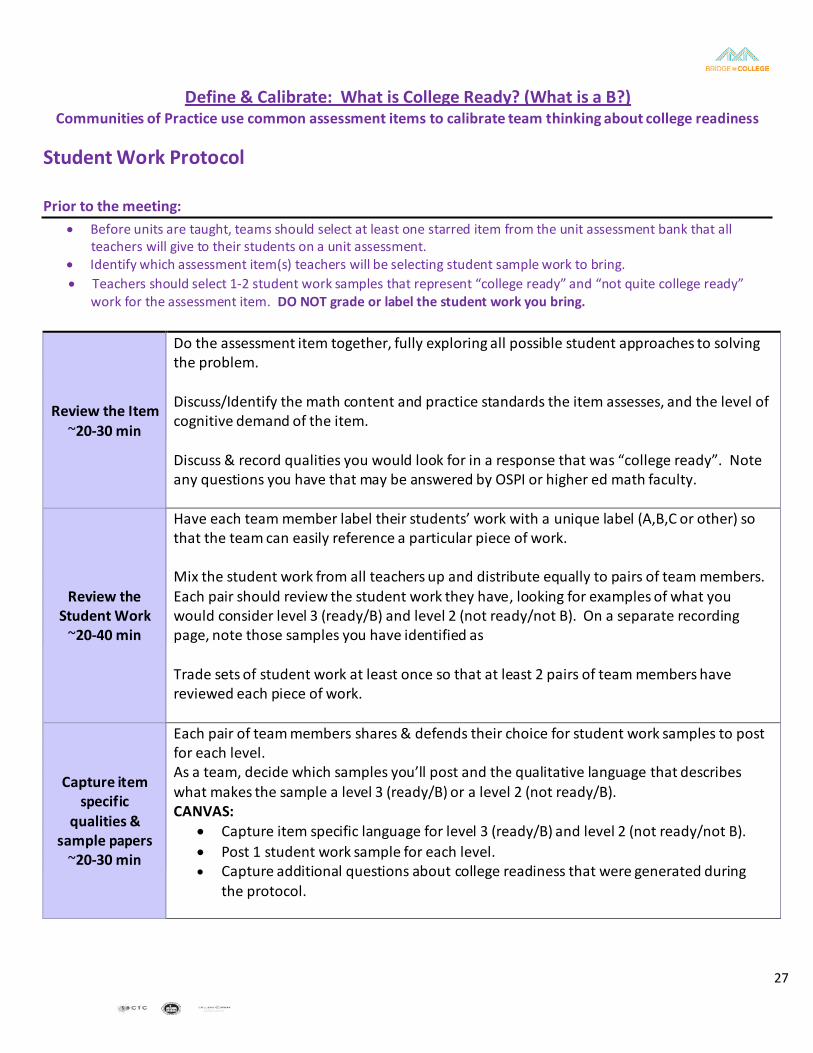
Define & Calibrate: What is College Ready? (What is a B?) Communities of Practice use common assessment items to calibrate team thinking about college readiness
Student Work Protocol
Prior to the meeting: • Before units are taught, teams should select at least one starred item from the unit assessment bank that all
teachers will give to their students on a unit assessment. • Identify which assessment item(s) teachers will be selecting student sample work to bring. • Teachers should select 1-2 student work samples that represent “college ready” and “not quite college ready”
work for the assessment item. DO NOT grade or label the student work you bring.
Review the Item ~20-30 min
Do the assessment item together, fully exploring all possible student approaches to solving the problem.
Discuss/Identify the math content and practice standards the item assesses, and the level of cognitive demand of the item.
Discuss & record qualities you would look for in a response that was “college ready”. Note any questions you have that may be answered by OSPI or higher ed math faculty.
Review the Student Work
~20-40 min
Have each team member label their students’ work with a unique label (A,B,C or other) so that the team can easily reference a particular piece of work.
Mix the student work from all teachers up and distribute equally to pairs of team members. Each pair should review the student work they have, looking for examples of what you would consider level 3 (ready/B) and level 2 (not ready/not B). On a separate recording page, note those samples you have identified as
Trade sets of student work at least once so that at least 2 pairs of team members have reviewed each piece of work.
Capture item specific
qualities & sample papers
~20-30 min
Each pair of team members shares & defends their choice for student work samples to post for each level. As a team, decide which samples you’ll post and the qualitative language that describes what makes the sample a level 3 (ready/B) or a level 2 (not ready/B). CANVAS:
• Capture item specific language for level 3 (ready/B) and level 2 (not ready/not B). • Post 1 student work sample for each level. • Capture additional questions about college readiness that were generated during
the protocol.
28
PHILOSOPHY OF MATHEMATICS LEARNING AND TEACHING Vision of Mathematics Education In July 2011, Washington adopted the Common Core State Standards for Mathematics (CCSS-M) (National Governors Association Center for Best Practices & Council of Chief State School Officers, 2010) as the new Washington State K–12 Learning Standards for Mathematics. These standards replaced the state’s 2008 Mathematics Learning Standards. The Washington State K–12 Learning Standards for Mathematics are built on an intentional progression of the skills and knowledge necessary for all students to be ready for career, college, and life when they exit high school. The progressions of learning provide specific focus for each grade level. The standards lay the groundwork for this vision of mathematics that better fits the skills students need to be productive members of society. Building on the work of the National Council of Teachers of Mathematics (NCTM), the vision of mathematics education requires students to be problem solvers, to reason quantitatively and to understand and analyze data. Previously, mathematics programs emphasized computation and memorization. Today, students not only need to be fluent and flexible with numbers and operations, students need the capacity to apply concepts and skills to novel situations, to approach real-world problems with stamina, and to understand that there may be multiple viable solution paths and solutions, depending on the context of the problem and the assumptions of the problem-solver. Success in mathematics is not reserved for an elite few A key component of the Washington State K–12 Learning Standards for Mathematics (WA State Standards) are the Standards for Mathematical Practice. These standards reflect a key shift in mathematics education and describe the expertise that mathematics educators at all levels should seek to develop in their students. The Standards for Mathematical Practice are:
1. Make sense of problems and persevere in solving them 2. Reason abstractly and quantitatively 3. Construct viable arguments and critique the reasoning of others 4. Model with mathematics 5. Use appropriate tools strategically 6. Attend to precision 7. Look for and make use of structure 8. Look for and express regularity in repeated reasoning Mathematics instruction, then, should use the mathematical practices to engage students in the mathematics content and develop students as “practitioners of the discipline of mathematics.” For more information on the Standards for Mathematical Practice, see http://www.corestandards.org/Math/Practice/ Additionally, the mindset that success in mathematics is reserved for an elite few contradicts mathematics educational research. Many adults assume that differences in mathematics performance reflect differences in innate ability, rather than differences in individual effort or opportunities to learn. These expectations profoundly underestimate what students can do. The basic principles, concepts, and skills of mathematics are within reach of all students. When parents and teachers alike believe that hard work pays off, and when mathematics is taught and learned by using the knowledge, skills, abilities, and beliefs that constitute mathematical proficiency, mathematics performance improves for all students. Research has demonstrated that mathematical proficiency is an obtainable goal. (The National
29
Academies, p. 30) It is our duty, therefore, to authentically engage all students in the discipline of mathematics as a foundation for reasoning quantitatively, solving rich problems, and analyzing data to make meaning of information and gain proficiency in analyzing and solving problems.
Focus, Coherence, and Rigor The Washington State K–12 Learning Standards call for shifts in the way we approach mathematics education. The shifts are:
• Greater focus on fewer topics • Coherence: Linking content and thinking across grades • Rigor: Pursue conceptual understanding, procedural skills and fluency, and application with
equal intensity “Focus” means deep engagement with the major work within each high school course. Rather than racing to cover many topics superficially, the standards ask mathematics teachers to deepen the way time and energy are spent on fewer, key math concepts. “Coherence” requires that content be carefully connected across high school courses, intentionally building on prior knowledge. “Rigor” refers to deep understanding of mathematics concepts. Students must have the opportunity to access concepts from multiple entry points and perspectives. Students must also be fluent with calculations and procedures so they can access more complex concepts and procedures. Finally, students must have the opportunity to apply concepts and procedures to novel situations (Common Core State Standards Initiative, 2015).
Mathematical Representations and Manipulatives Instruction at all grade levels should incorporate the progressive use of concrete manipulatives, representational models, and abstract symbols (Forbinger & Fuchs, 2014). Much of traditional mathematics instruction focuses on computation and students’ ability to apply procedures quickly and accurately. According to the National Council of Teachers of Mathematics (NCTM), procedural fluency, however, includes “the ability to apply procedures accurately, efficiently, and flexibly; to transfer procedures to different problems and contexts; to build or modify procedures from other procedures; and to recognize when one strategy or procedure is more appropriate to apply than another” (NCTM, 2014b, p.1). This definition of procedural fluency pushes the bounds of traditional mathematics instruction, as it requires foundational knowledge of concepts, reasoning strategies, properties of numbers and operations, and problem-solving methods (NCTM, 2014b). The rigor of the state standards includes balancing conceptual understanding, procedural fluency, and problem solving. Instruction, then, must be balanced to address the mathematics content and practice standards through a variety of approaches. The use of models or representations to manipulate and communicate about mathematical ideas supports students in making connections among mathematical ideas, understanding computations and procedures, and solving problems. The more ways that students have to think about and test ideas, the better their ability to integrate them into their current conceptual understanding to develop a deep relational understanding. “Strengthening the ability to move between and among representations improves students’ understanding and retention of ideas” (Van de Walle, 2013, p. 22). Mathematical representations can include words, manipulatives, pictures, models, diagrams, equations, and tables and graphs of functions and relationships. Mathematics Teaching Practices In 2014, NCTM published a book, Principles to Actions: Ensuring Mathematical Success for All. The principles in this text represent “strongly recommended, research-informed actions for all teachers,
30
coaches, and specialists in mathematics” (NCTM, 2014a, p. 4) including any interventionists who will be working to assist children in their mathematics study. These eight mathematics teaching practices reflect the range of instructional strategies and approaches necessary to promote deep learning of mathematics.
1. Establish mathematics goals to focus learning. “Effective teaching of mathematics establishes clear goals for the mathematics that students are learning, situates goals within learning progressions, and uses the goals to guide instructional decisions” (NCTM, 2014a, p. 12).
2. Implement tasks that promote reasoning and problem solving. “Effective teaching of mathematics engages students in solving and discussing tasks that promote mathematical reasoning and problem solving and allow multiple entry points and varied solution strategies” (NCTM, 2014a, p. 17).
3. Use and connect mathematical representations.
“Effective teaching of mathematics engages students in making connections among mathematical representations to deepen understanding of mathematics concepts and procedures and as tools for problem solving” (NCTM, 2014a, p. 24).
4. Facilitate meaningful mathematical discourse.
“Effective teaching of mathematics facilitates discourse among students to build shared understanding of mathematical ideas by analyzing and comparing student approaches and arguments” (NCTM, 2014a, p. 29).
5. Pose purposeful questions. “Effective teaching of mathematics uses purposeful questions to assess and advance students’ reasoning and sense making about important mathematical ideas and relationships” (NCTM, 2014a, p. 35).
6. Build procedural fluency from conceptual understanding.
“Effective teaching of mathematics builds fluency with procedures on a foundation of conceptual understanding so that students, over time, become skillful in using procedures flexibly as they solve contextual and mathematical problems” (NCTM,2014a, p. 42).
7. Support productive struggle in learning mathematics. “Effective teaching of mathematics consistently provides students, individually and collectively, with opportunities and supports to engage in productive struggle as they grapple with mathematical ideas and relationships” (NCTM, 2014a, p. 48).
8. Elicit and use evidence of student thinking. “Effective teaching of mathematics uses evidence of student thinking to assess progress toward mathematical understanding and to adjust instruction continually in ways that support and extend learning” (NCTM, 201a4, p. 53).
31
References Common Core State Standards Initiative. (2015). Key shifts in mathematics. Retrieved from http://www.corestandards.org/other-resources/key-shifts-in-mathematics/ Forbinger, L. L., & Fuchs, W. W. (2014). RtI in Math: Evidence-based interventions for struggling students. New York, NY: Routledge. National Council of Teachers of Mathematics. (2014a). Principles to actions: Ensuring mathematical success for all. Reston, VA: National Council of Teachers of Mathematics. National Council of Teachers of Mathematics. (2014b). Procedural fluency in mathematics: A position of the National Council of Teachers of Mathematics. Retrieved from http://www.nctm.org/Standards-and-Positions/Position-Statements/Procedural-Fluency-in-Mathematics/ The National Academies. (2002). Helping Children Learn Mathematics. Washington, D.C.: National Academy Press. Van de Walle, J. A., Lovin, L. A. H., Karp, K. S., & Bay-Williams, J. M. (2013). Teaching student-centered mathematics (Second ed.). Washington, D.C.: Pearson Boaler, Jo (2016). Mathematical Mindsets. San Francisco, CA: Jossey-Bass.
Washington Bridge to College Mathematics
Acknowledgements
This course is the result of an extensive and ongoing collaboration among staff and key personnel from state agencies, school districts and high schools, and colleges and universities. In particular we appreciate deeply the time investment and substantive contributions from individual high school teachers and higher education faculty in the design, pilot‐testing, and refinement of these courses and would like to acknowledge those individuals below. We hope we haven’t missed anyone but apologize in advance if we have, or if we somehow managed to get a name wrong; we also recognize individuals may have moved or changed jobs, so what’s listed shows their affiliation when they were connected to this work. If you see corrections or additions let us know and we’ll update the list as soon as we can!
Bill Moore, State Board for Community and Technical Colleges Kathe Taylor, Office of Superintendent of Public Instruction
Project Co‐Leads
Thanks to former OSPI staff Jessica Vavrus and Amy Vaughn for their work in helping getting the initial course off the ground.
Project Leadership Team (Mathematics)
Anne Gallagher, OSPI Katy Absten, OSPI Megan Luce, Cascadia College (higher education discipline lead) Jackie Coomes, Eastern Washington University (professional learning design consultant)
Pilot Teachers
Jennifer Bressert South Kitsap SD Amy Hancock Mead SD
Jeff Cimaomo Franklin HS Coretta Hoffman Mead HS
Michael Coffin Prairie HS Kristianna Johnsen Shorewood HS
Ryan Cornell Central Valley SD Carolyn Johnson Rochester HS
Madelyn Erickson Olympic HS Julie O'Brien Franklin HS
Chris Fugleberg Kelso HS Linda Richard Shoreline SD
Bruce Graham Grandview SD Erin Schoenlein Clark College
David Groat Battle Ground HS Mary Wallace Mead SD
33
Course Design/Development Participants
Barbara Alvin EWU
Patrick Kjack Wenatchee SD
Deann Anguiano Marysville‐Pilchuck HS Jeremy Koziol Spokane CC
Emily Asher Bates TC Meredith LaFlesh Tacoma
Pat Averbeck Edmonds CC Jennifer Laveglia Bellevue College Carol Avery Tacoma CC Diana Lee Highline
Rick Biggerstaff EWU Kris Lindeblad WSU Sue Bluestein ESD 112 Michael Lundin CWU Greta Bornemann PSESD Kelly Lynn EWU
Helen Burn Highline CC Mausumi Maulik Bellevue College Chris Carlson Centralia College Carlea McAvoy South Puget Sound CC
Linda Carney Shadle Park HS Teresa McComber North Mason HS Kelly Casto Richland SD Sherry McLean Lake Washington Chris Chelin Kennewick SD Terry Meerdink Highline CC Sandy Christie Consultant Laura Moore‐ Mueller Green River CC
Sellie Clark Tacoma Andrea Motyka Peninsula CC
Catherine Conway North Seattle Lynn Neal Bates TC Sandy Cooper WSU Michael Nevins Everett CC
Curtis Crawford Columbia Basin College Ron Noble WA Applied Math Mike Dodge Olympic College Troy Oelschlager Klahowya Secondary Ryan Dorman South Seattle CC De Pham Franklin HS Ryan Downing Grandview SD Emile Pulido Bates Dawn Draus Lower Columbia College Roxane Ronca WWU
Nicole Duvernay Spokane CC Richard Sander Everett SD Alex Eklund Seattle PS Lauren Sandven Shoreline Elissa Farmer Seattle PS Amy Scheller Kelso HS
Kendra Feinstein Tacoma Debra Schneider Evergreen PS Frank Fisher Shoreline SD Laura Schueller Walla Walla Wes
Fitz Central Kitsap HS
Mike Selle Bridgeport HS Vauhn Foster‐ Grahler TESC Lee
Singleton
Whatcom CC
Jana Freese Columbia Basin College Terrie Skeie Lower Columbia College Nancy Goodisman Shoreline CC Tamara Smith ESD 114
Melissa Graham EWU Darlene Snider Walla Walla Deb Gribskov Kelso HS Rosalie Tepper Shoreline CC
Michelle Gruber Northshore SD Trung Tran Tacoma CC Carol Hattan Vancouver SD Dana Updegrove Bellevue College MaryKe Haynes Battle Ground PS Mary Ward Bates Technical College Shereen Henry Shoreline SD Nicole Wethall Seattle PS Jenny Hughes Columbia Basin Sharon Wiest Wenatchee Valley CC