Embed Size (px)
Citation preview

WASHINGTON MONUMENT
CASE HISTORY
Jean-Louis BRIAUD
Texas A&M University
2
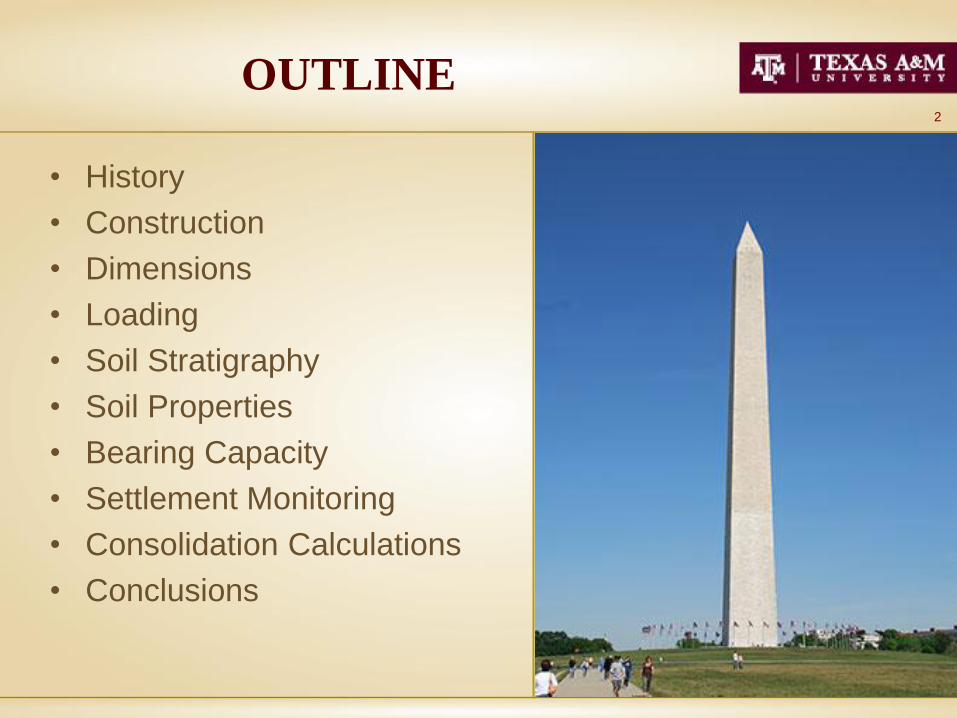
OUTLINE
• History
• Construction
• Dimensions
• Loading
• Soil Stratigraphy
• Soil Properties
• Bearing Capacity
• Settlement Monitoring
• Consolidation Calculations
• Conclusions
3
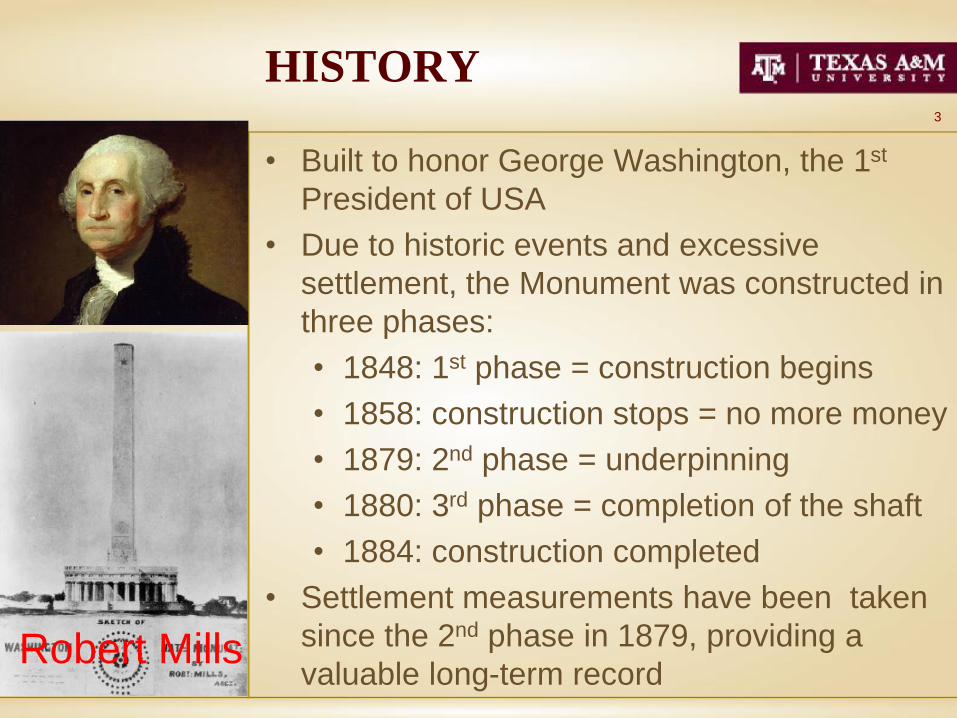
HISTORY
• Built to honor George Washington, the 1st
President of USA
• Due to historic events and excessive
settlement, the Monument was constructed in
three phases:
• 1848: 1st phase = construction begins
• 1858: construction stops = no more money
• 1879: 2nd phase = underpinning
• 1880: 3rd phase = completion of the shaft
• 1884: construction completed
• Settlement measurements have been taken
since the 2nd phase in 1879, providing a
valuable long-term recordRobert Mills
4
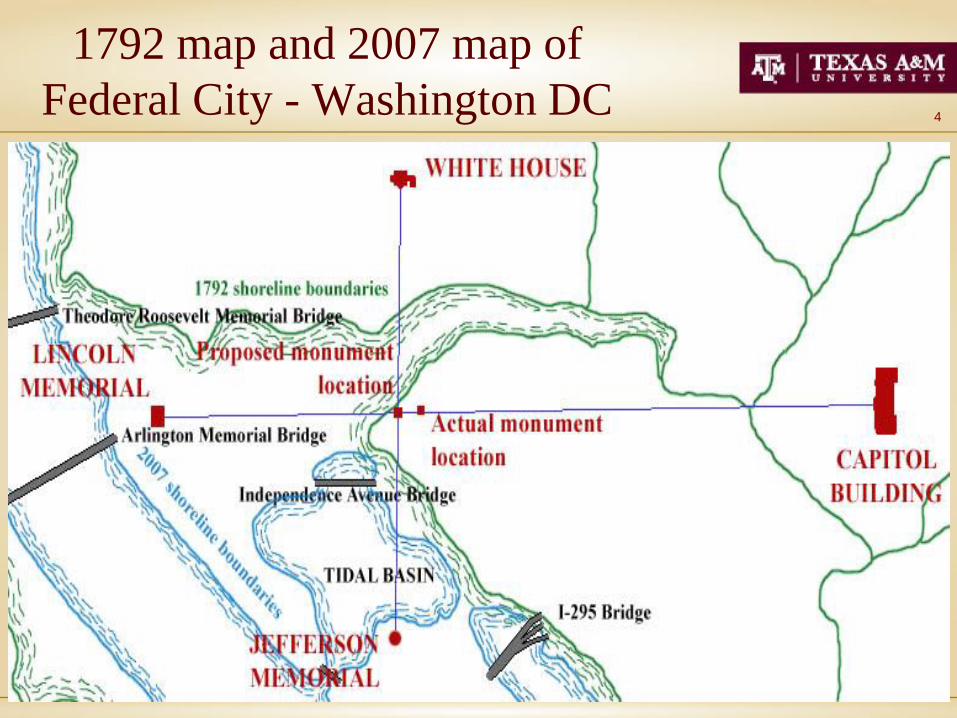
1792 map and 2007 map of
Federal City - Washington DC
5
GEOLOGY
• Recent alluviums deposited by Potomac River (tidal fluctuations
and floods)
• Pleistocene terrace deposits
• At that time, sea level varies greatly with abrupt climate changes,
resulting in the presence of highly variable medium-plastic and
slightly-to-moderately organic clay, sand, gravel, and sometimes
boulders.
• Cretaceous soils missing
• Crystalline bedrock = decomposed Wissahickon Schist.
metamorphic rock dating from the Ediacaran to the Cambrian
age.
6
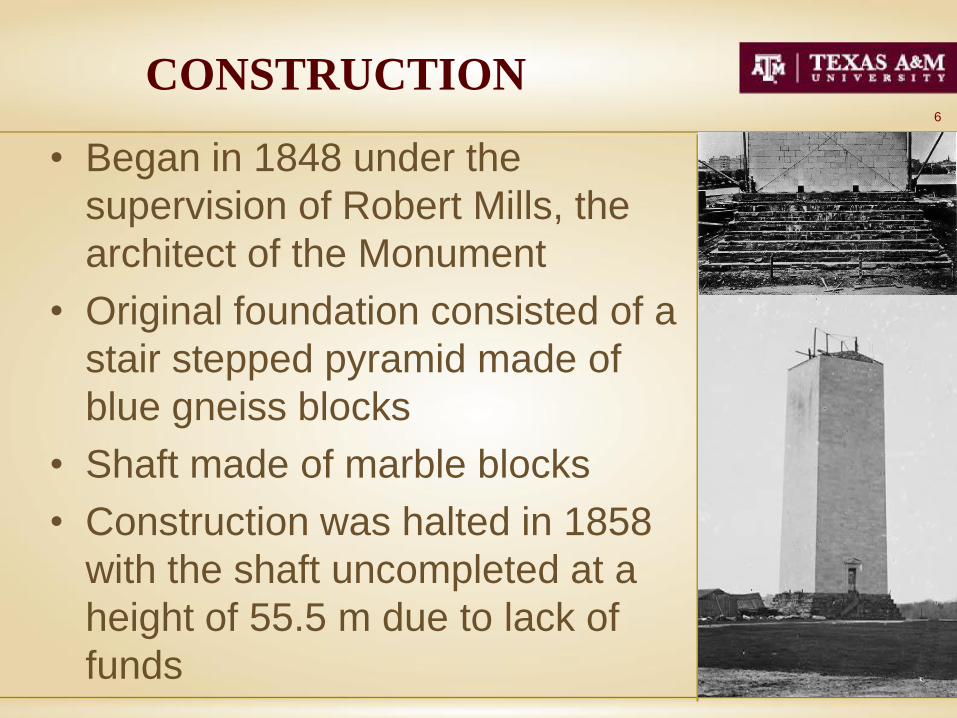
CONSTRUCTION
• Began in 1848 under the
supervision of Robert Mills, the
architect of the Monument
• Original foundation consisted of a
stair stepped pyramid made of
blue gneiss blocks
• Shaft made of marble blocks
• Construction was halted in 1858
with the shaft uncompleted at a
height of 55.5 m due to lack of
funds
7
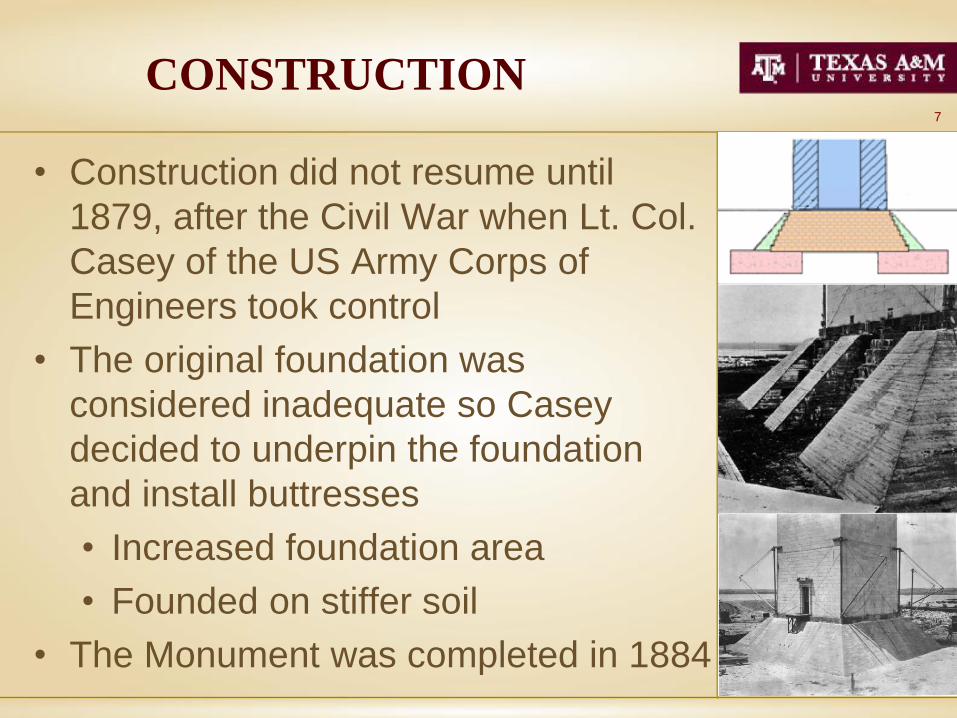
• Construction did not resume until
1879, after the Civil War when Lt. Col.
Casey of the US Army Corps of
Engineers took control
• The original foundation was
considered inadequate so Casey
decided to underpin the foundation
and install buttresses
• Increased foundation area
• Founded on stiffer soil
• The Monument was completed in 1884
CONSTRUCTION
8
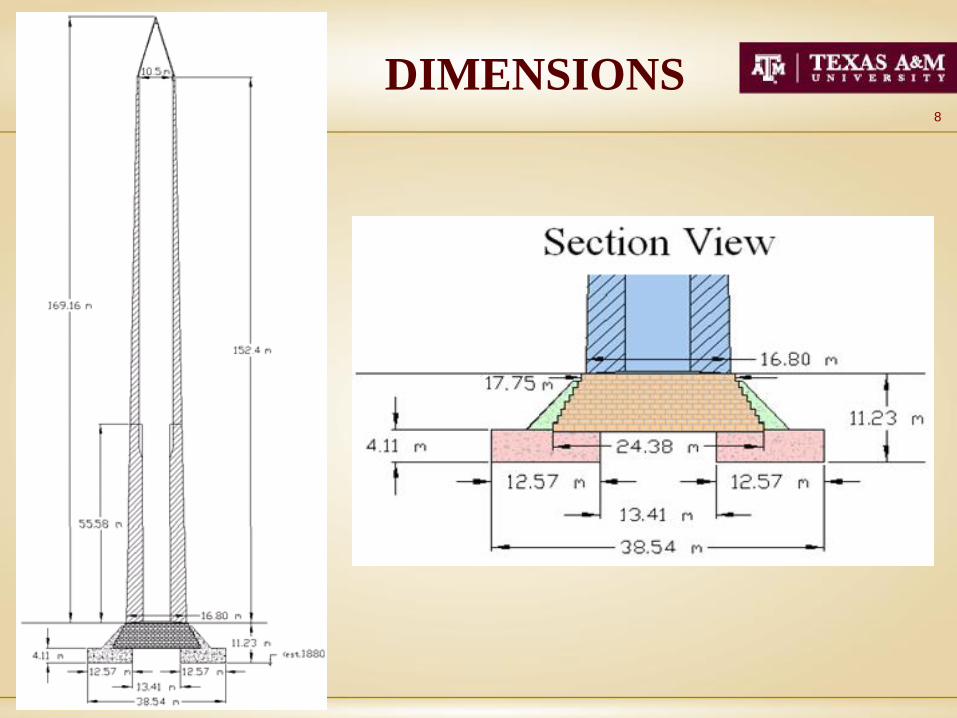
DIMENSIONS
9
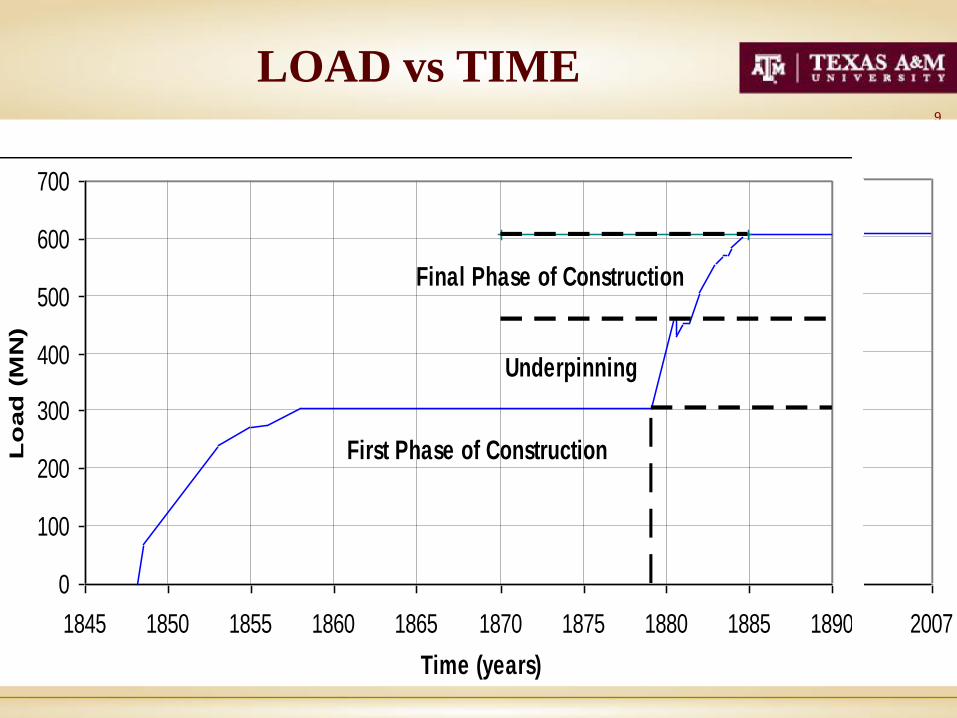
LOAD vs TIME
First Phase of Construction
Underpinning
Final Phase of Construction
0
100
200
300
400
500
600
700
1845 1850 1855 1860 1865 1870 1875 1880 1885 1890
Time (years)
Lo
ad
(M
N)
0
100
200
300
400
500
600
700
1997 2007
10
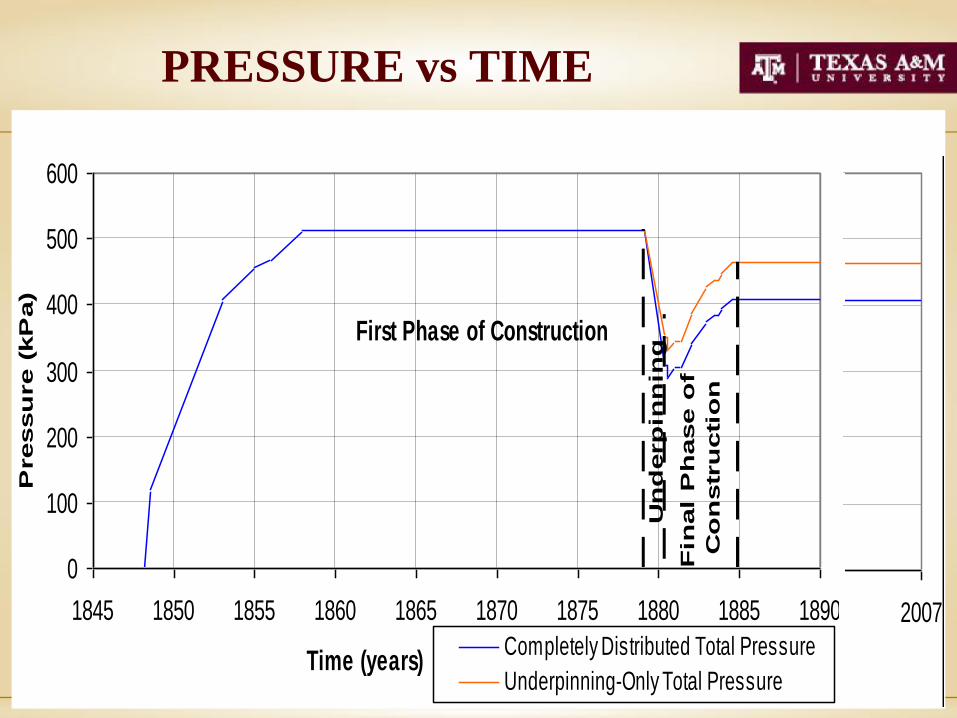
PRESSURE vs TIME
First Phase of Construction
Un
derp
inn
ing
Fin
al
Ph
ase o
f
Co
nstr
ucti
on
0
100
200
300
400
500
600
1845 1850 1855 1860 1865 1870 1875 1880 1885 1890
Time (years)
Pressu
re (
kP
a)
Completely Distributed Total Pressure
Underpinning-Only Total Pressure
0
100
200
300
400
500
600
1997 2007
11
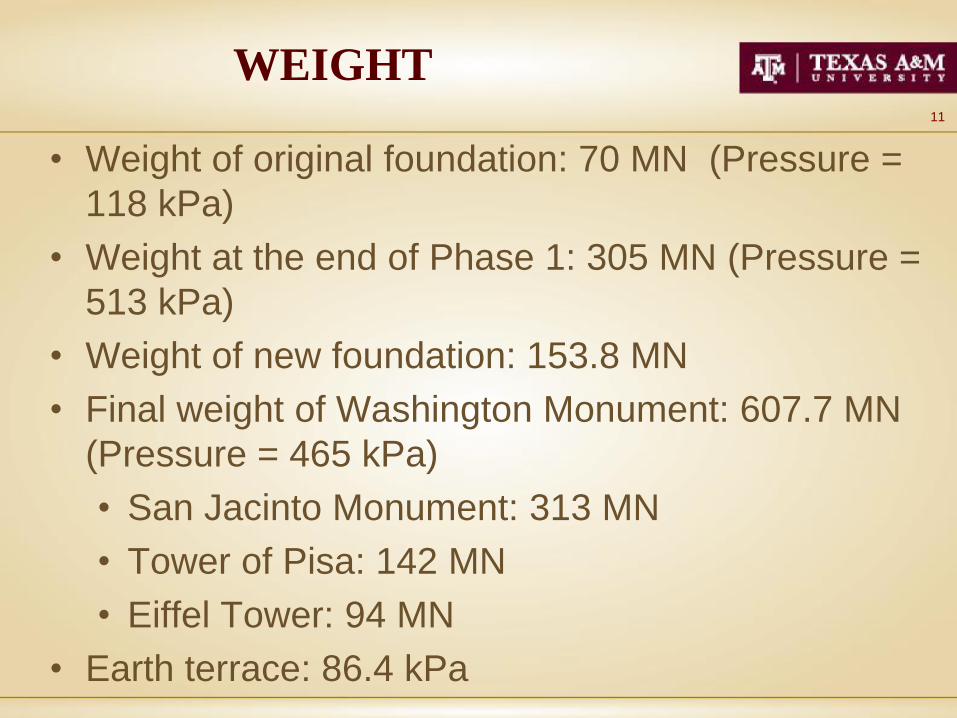
WEIGHT
• Weight of original foundation: 70 MN (Pressure =
118 kPa)
• Weight at the end of Phase 1: 305 MN (Pressure =
513 kPa)
• Weight of new foundation: 153.8 MN
• Final weight of Washington Monument: 607.7 MN
(Pressure = 465 kPa)
• San Jacinto Monument: 313 MN
• Tower of Pisa: 142 MN
• Eiffel Tower: 94 MN
• Earth terrace: 86.4 kPa
12
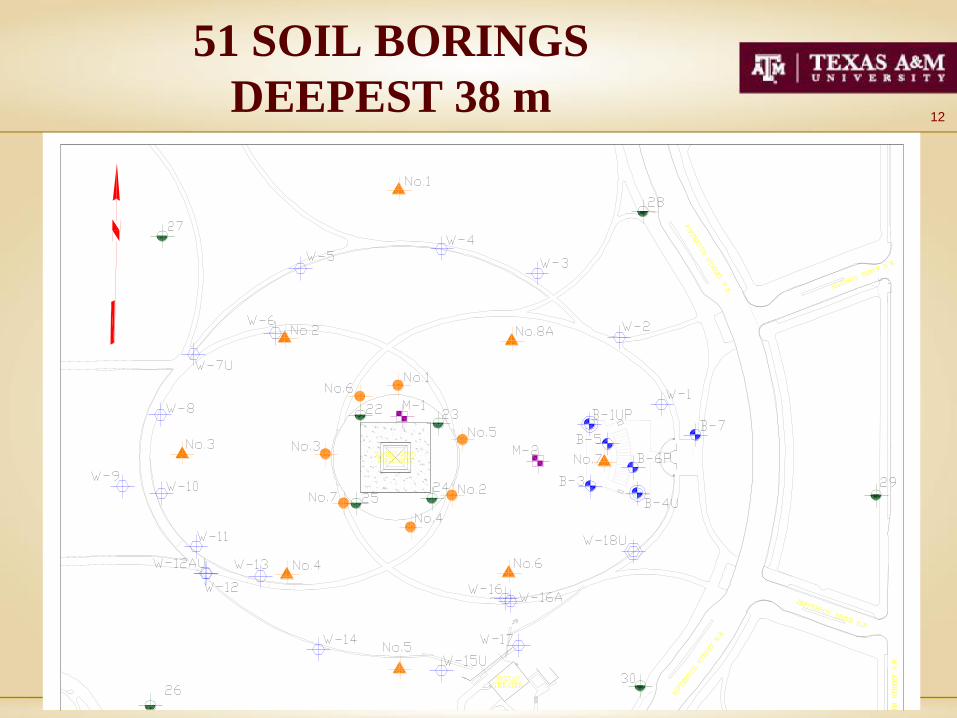
51 SOIL BORINGS
DEEPEST 38 m
13
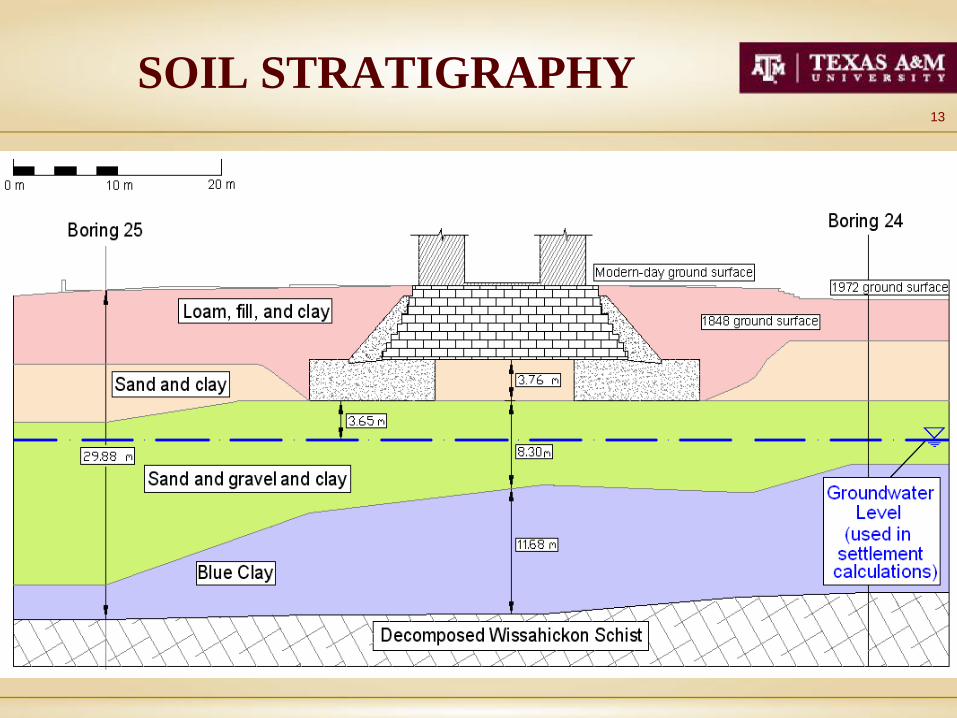
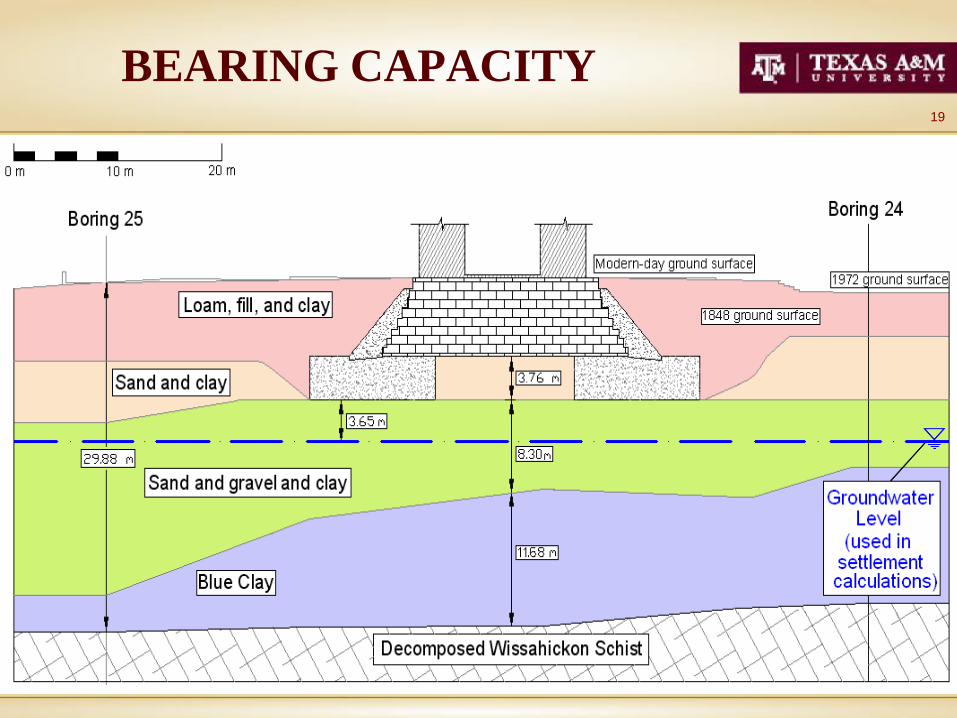
SOIL STRATIGRAPHY
14
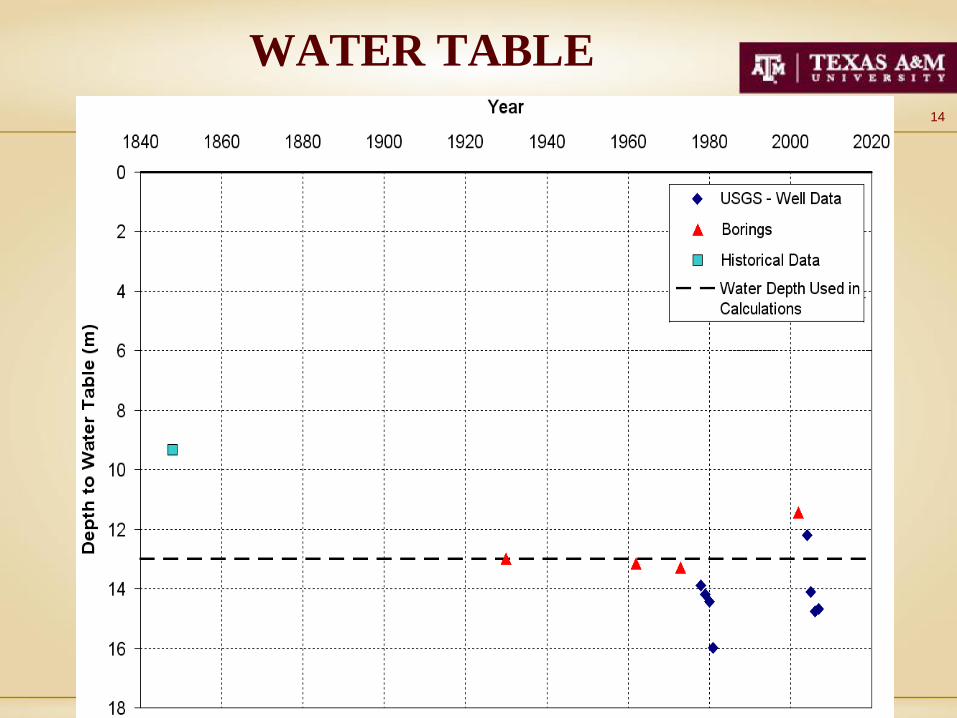
WATER TABLE
15
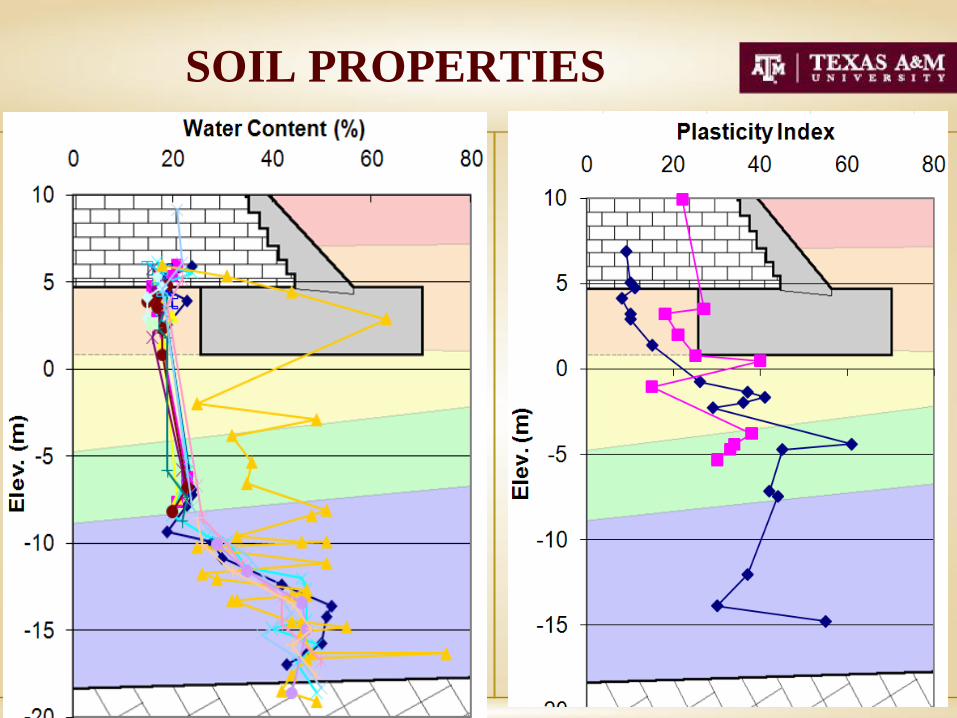
SOIL PROPERTIES
16
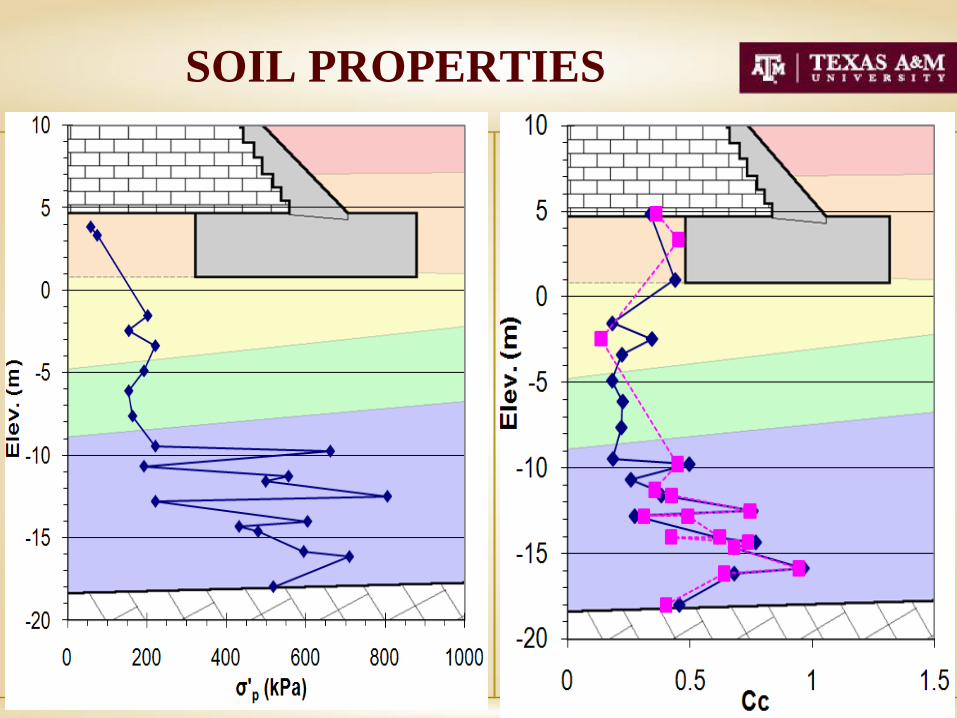
SOIL PROPERTIES
17
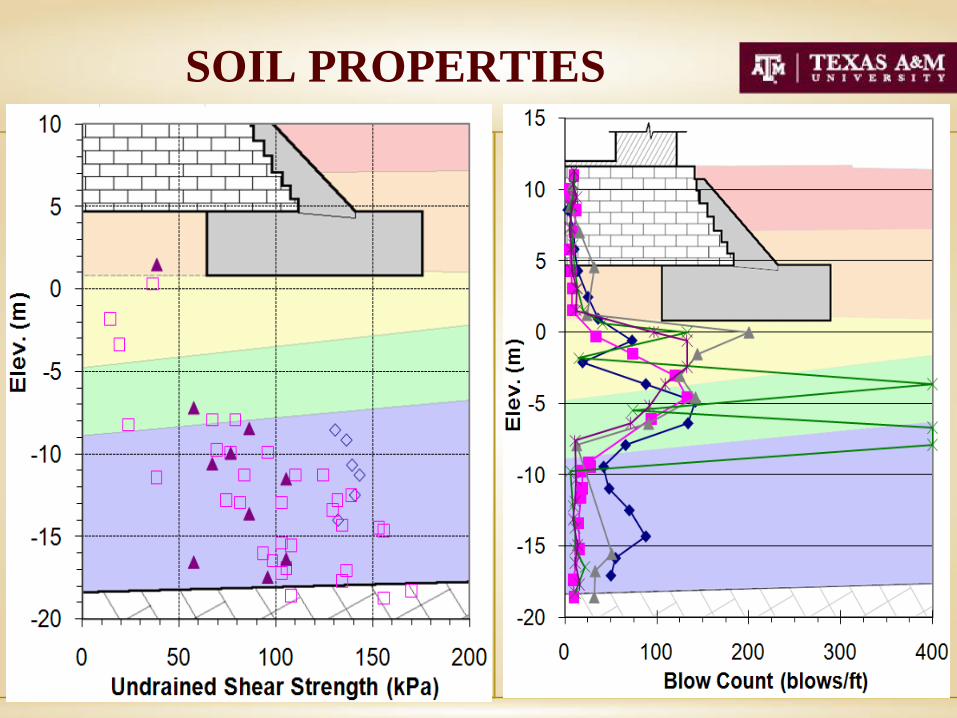
SOIL PROPERTIES
18
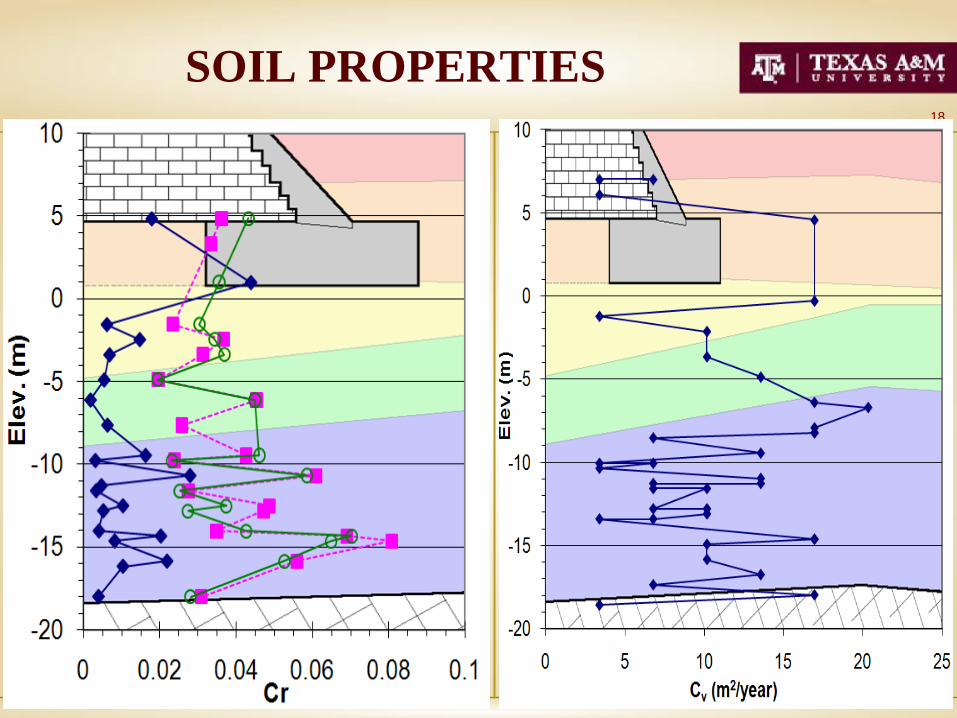
SOIL PROPERTIES
19
BEARING CAPACITY
20
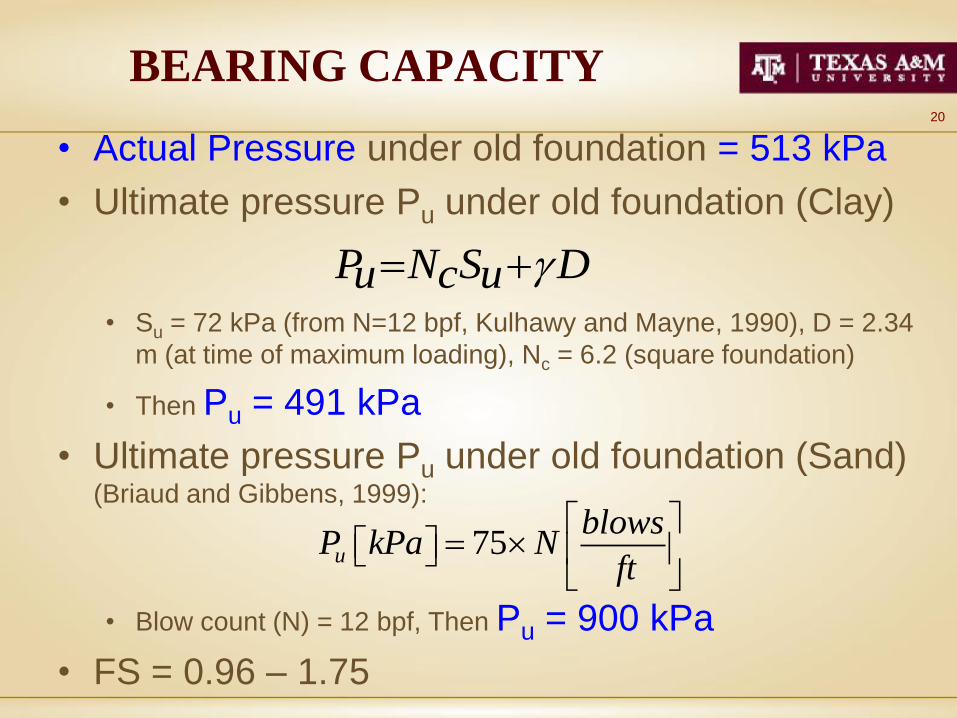
BEARING CAPACITY
• Actual Pressure under old foundation = 513 kPa
• Ultimate pressure Pu under old foundation (Clay)
• Su = 72 kPa (from N=12 bpf, Kulhawy and Mayne, 1990), D = 2.34
m (at time of maximum loading), Nc = 6.2 (square foundation)
• Then Pu = 491 kPa
• Ultimate pressure Pu under old foundation (Sand) (Briaud and Gibbens, 1999):
• Blow count (N) = 12 bpf, Then Pu = 900 kPa
• FS = 0.96 – 1.75
P N S Du c u
75u
blowsP kPa N
ft

21
BEARING CAPACITY
22
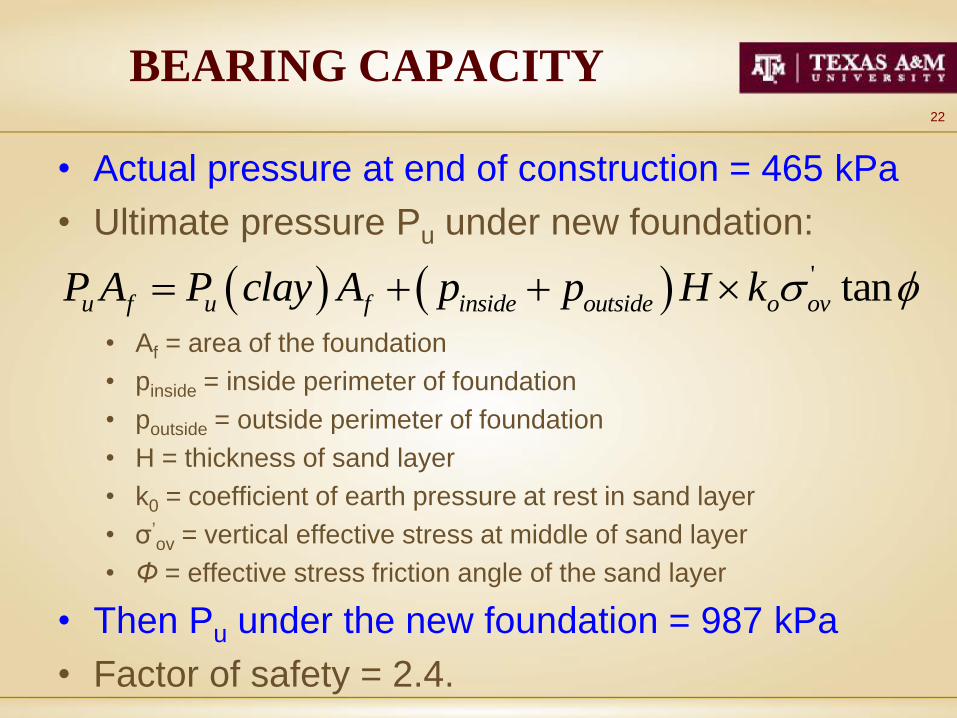
• Actual pressure at end of construction = 465 kPa
• Ultimate pressure Pu under new foundation:
• Af = area of the foundation
• pinside = inside perimeter of foundation
• poutside = outside perimeter of foundation
• H = thickness of sand layer
• k0 = coefficient of earth pressure at rest in sand layer
• σ’ov = vertical effective stress at middle of sand layer
• Φ = effective stress friction angle of the sand layer
• Then Pu under the new foundation = 987 kPa
• Factor of safety = 2.4.
' tanu f u f inside outside o ovP A P clay A p p H k
BEARING CAPACITY
23
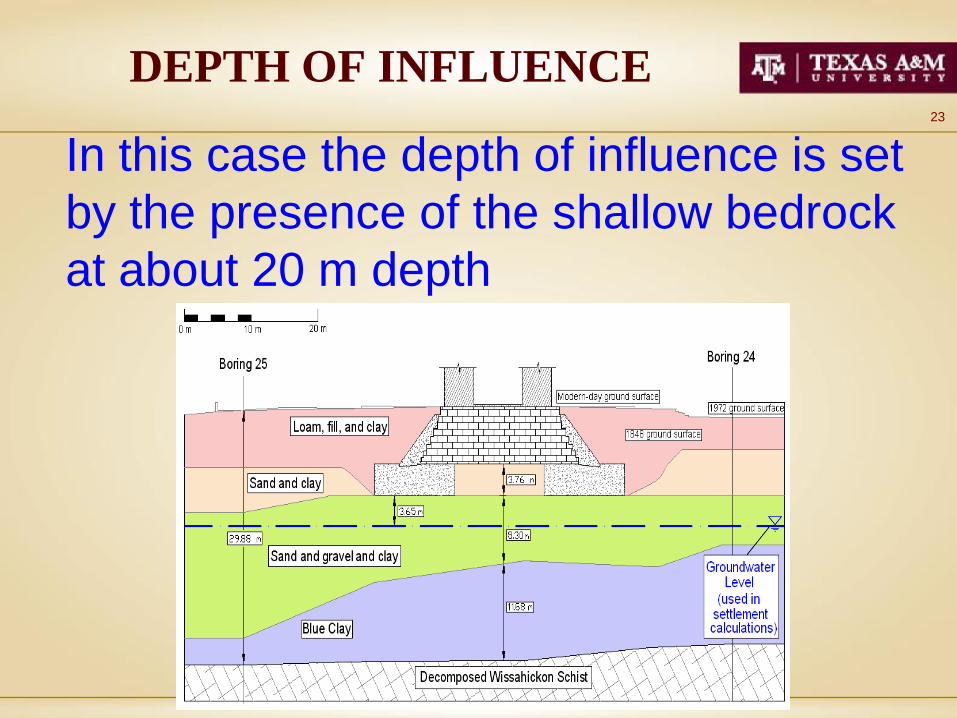
DEPTH OF INFLUENCE
In this case the depth of influence is set
by the presence of the shallow bedrock
at about 20 m depth
24
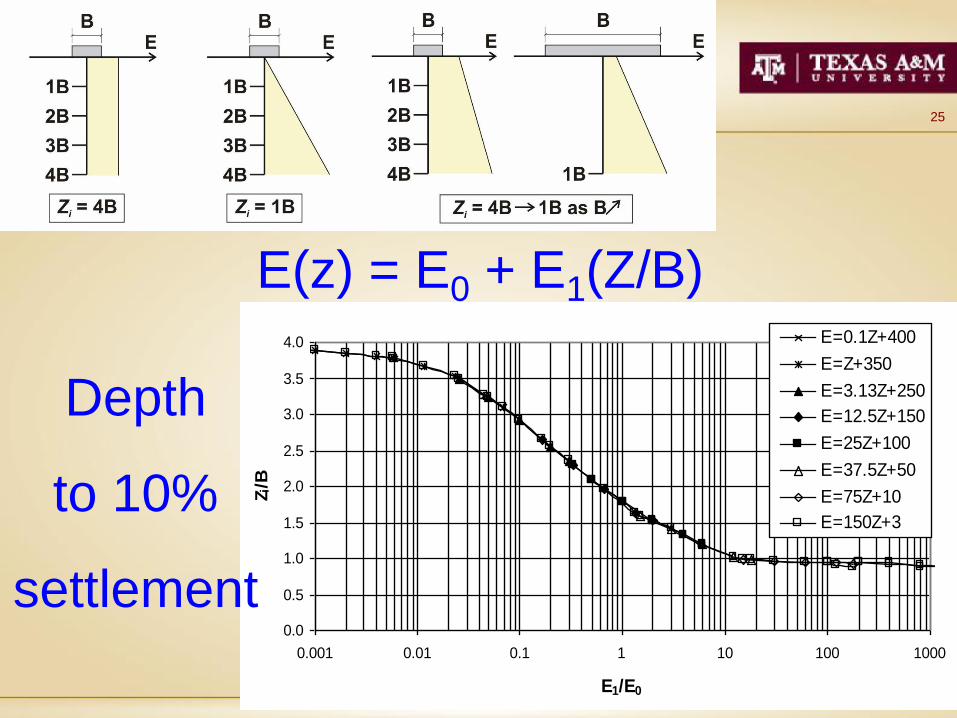
DEPTH OF INFLUENCE
The depth of influence is defined as
the depth where:
• the stress has decreased to 10% of
the applied stress
• the settlement has decreased to10%
of the foundation settlement
25
Zi/B vs E1/E0
0.0
0.5
1.0
1.5
2.0
2.5
3.0
3.5
4.0
0.001 0.01 0.1 1 10 100 1000
E1/E0
Zi/B
E=0.1Z+400
E=Z+350
E=3.13Z+250
E=12.5Z+150
E=25Z+100
E=37.5Z+50
E=75Z+10
E=150Z+3
E(z) = E0 + E1(Z/B)
Depth
to 10%
settlement
26
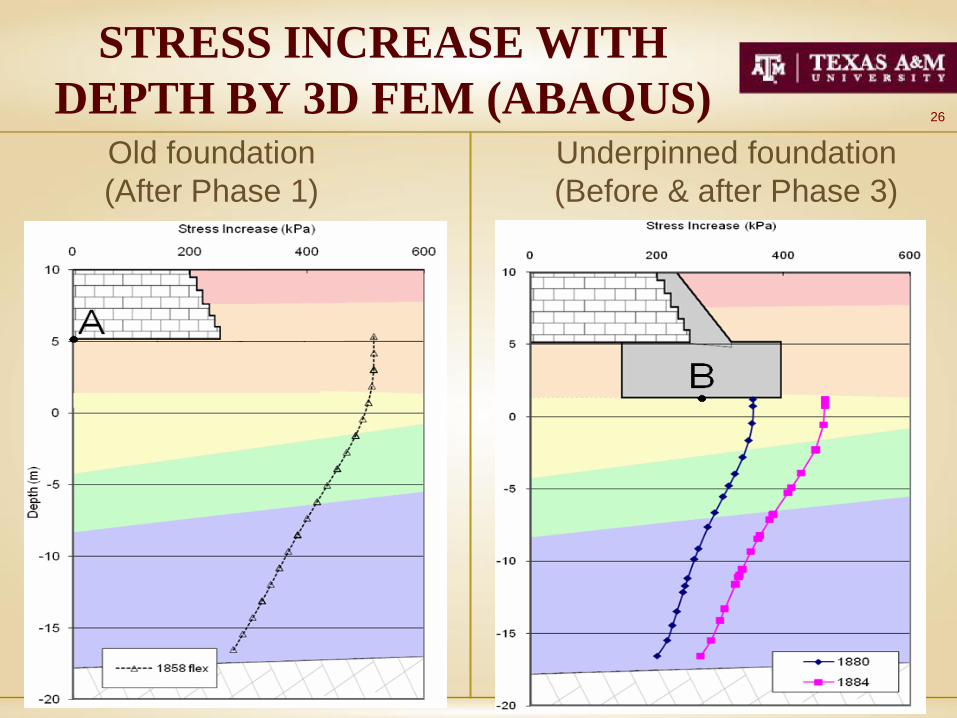
STRESS INCREASE WITH
DEPTH BY 3D FEM (ABAQUS)Old foundation
(After Phase 1)
Underpinned foundation
(Before & after Phase 3)
27
CONSOLIDATION
CALCULATIONS
• Calculated settlement for:
• Phase 1 (From 1948 to 1958)
• Phase 2 (Underpinning of Monument)
• Phase 3 (Completion of Monument)
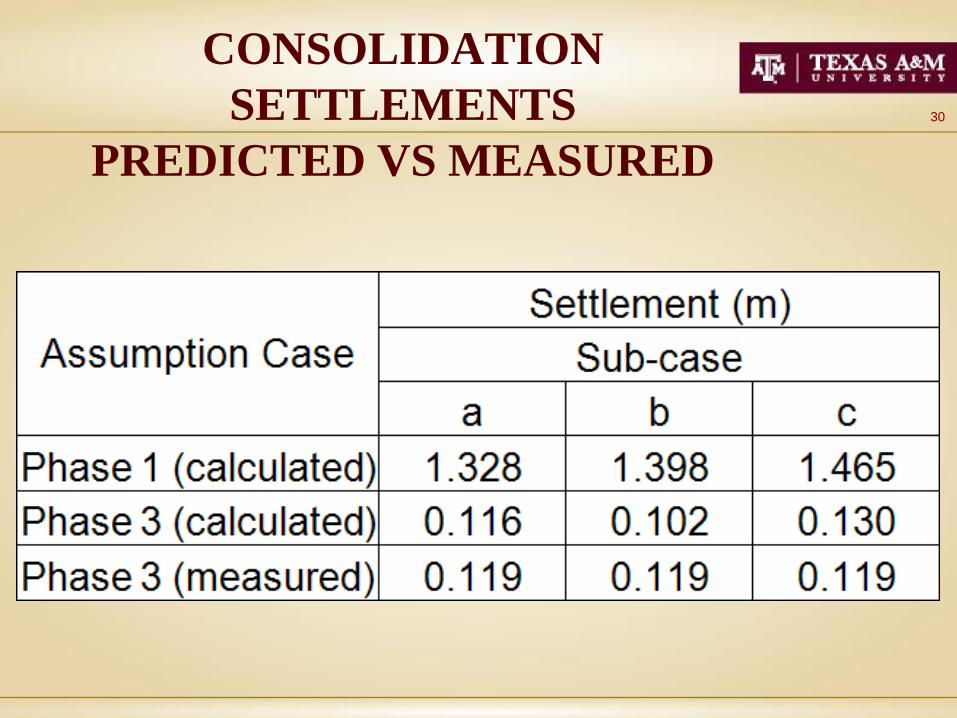
• Three methods:
• Curve method (Method a)
• Equation method With Cr measured on initial
loading curve (Method b)
• Equation method With Cr measured on
unload/reload curve (Method c)
28
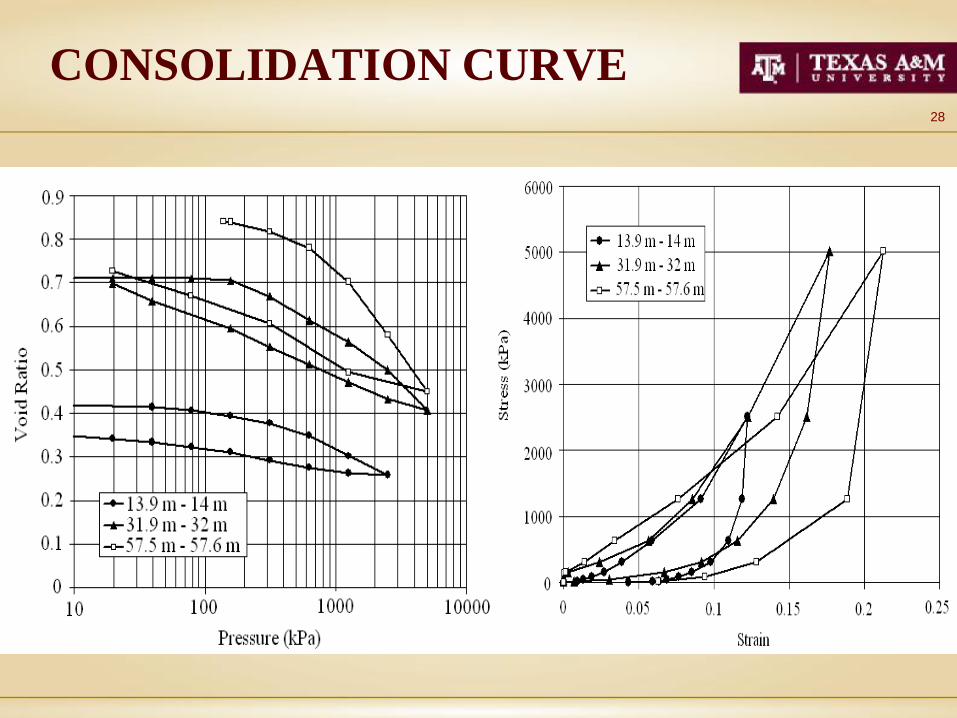
CONSOLIDATION CURVE
29
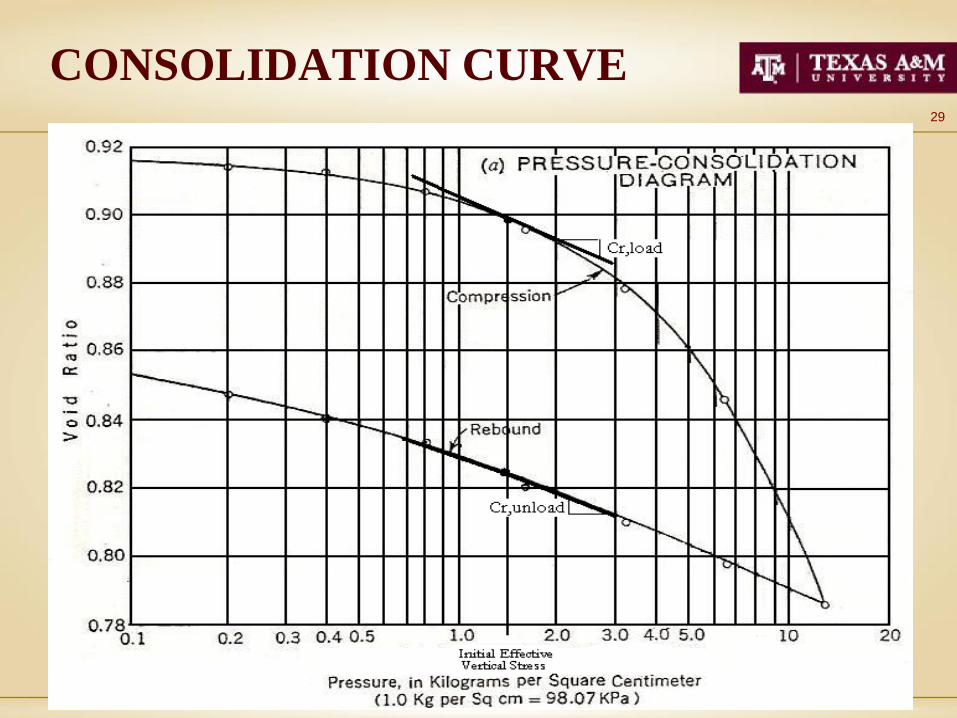
CONSOLIDATION CURVE
30
CONSOLIDATION
SETTLEMENTS
PREDICTED VS MEASURED
31
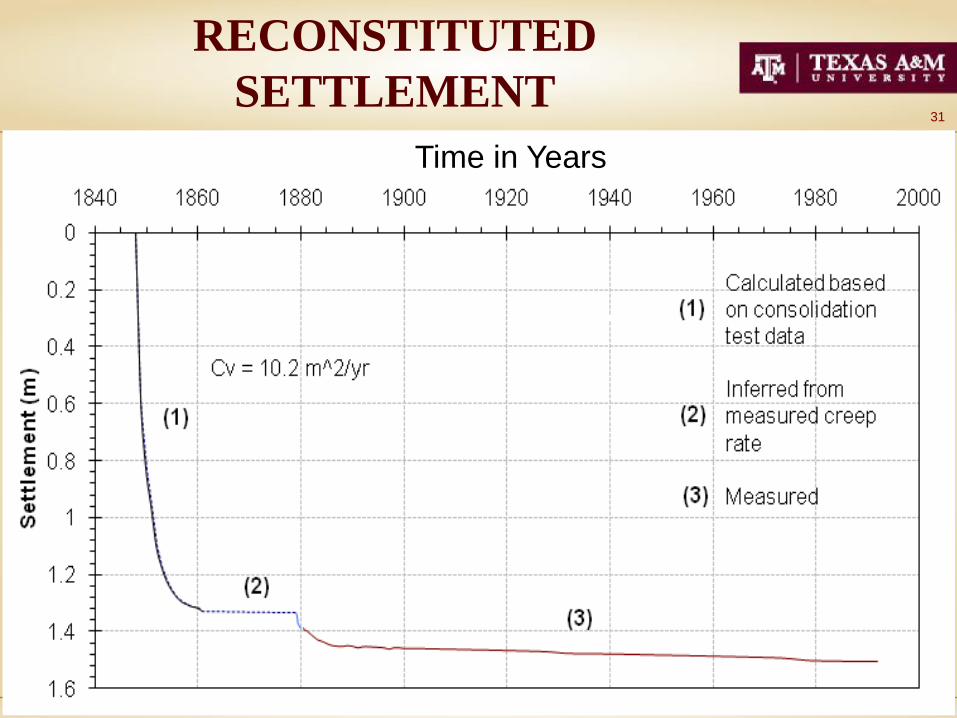
RECONSTITUTED
SETTLEMENT
Time in Years
32
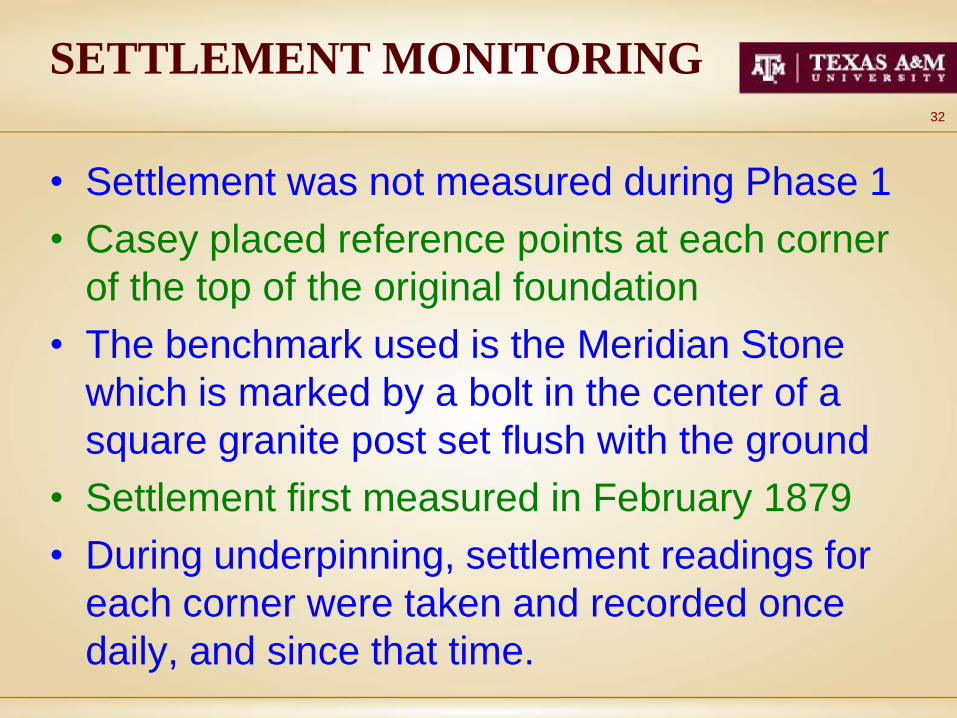
SETTLEMENT MONITORING
• Settlement was not measured during Phase 1
• Casey placed reference points at each corner
of the top of the original foundation
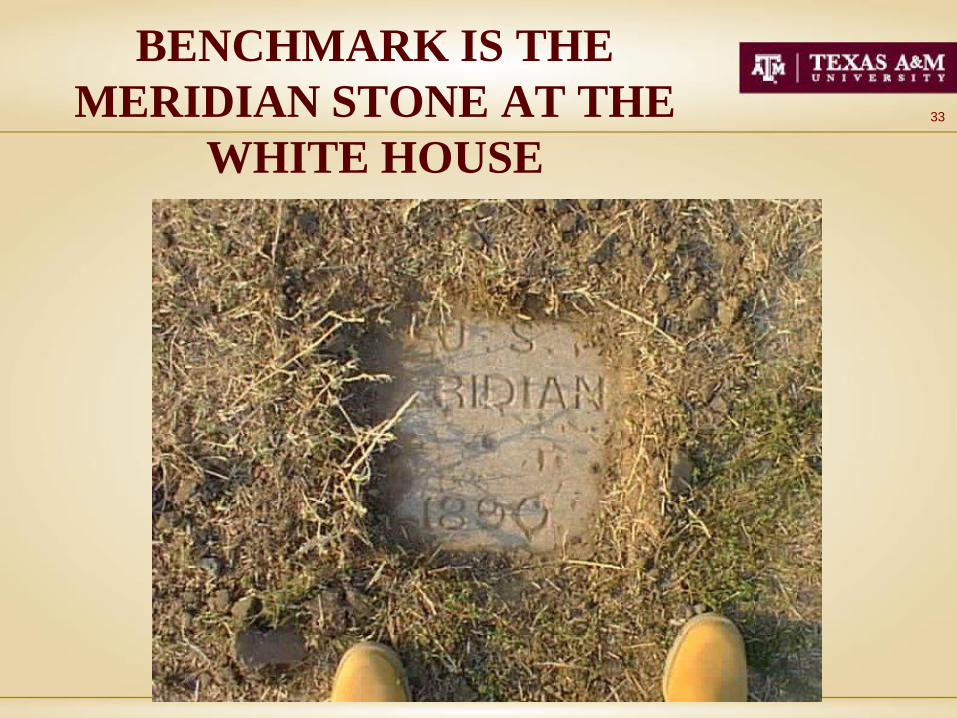
• The benchmark used is the Meridian Stone
which is marked by a bolt in the center of a
square granite post set flush with the ground
• Settlement first measured in February 1879
• During underpinning, settlement readings for
each corner were taken and recorded once
daily, and since that time.
33
BENCHMARK IS THE
MERIDIAN STONE AT THE
WHITE HOUSE
34
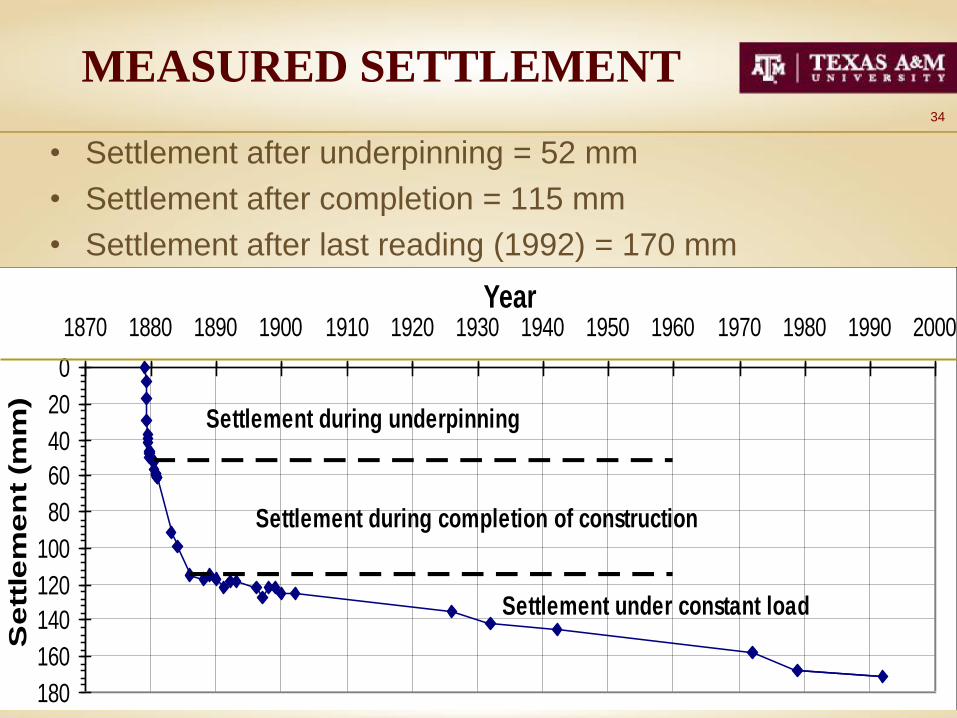
MEASURED SETTLEMENT
• Settlement after underpinning = 52 mm
• Settlement after completion = 115 mm
• Settlement after last reading (1992) = 170 mm
Settlement during underpinning
Settlement during completion of construction
Settlement under constant load
0
20
40
60
80
100
120
140
160
180
1870 1880 1890 1900 1910 1920 1930 1940 1950 1960 1970 1980 1990 2000Year
Se
ttle
me
nt
(mm
)
35
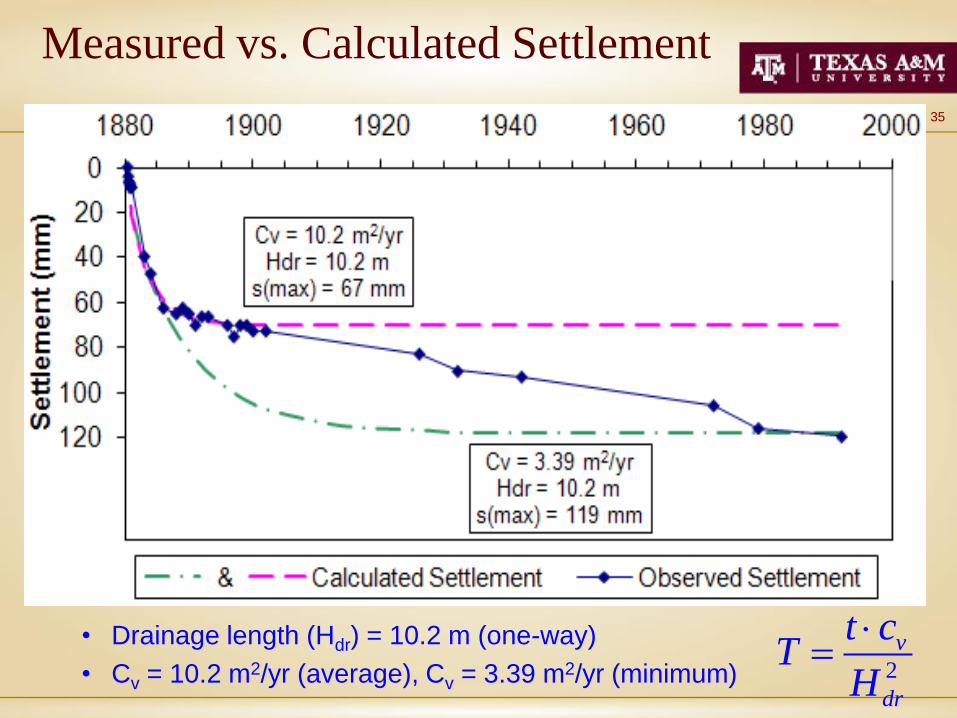
Measured vs. Calculated Settlement
2
v
dr
t cT
H
• Drainage length (Hdr) = 10.2 m (one-way)
• Cv = 10.2 m2/yr (average), Cv = 3.39 m2/yr (minimum)
36CONCLUSIONS
• After Phase 1, the pressure was close to the
ultimate pressure and the settlement was 1.3 m
• Underpinning saved the monument by reducing
the net pressure on the soil and increasing the
ultimate bearing capacity (FS = 2.4)
• The calculated settlement for Phase 2 and 3
matched well the measured settlement (?!)
• Creep settlement has been consistent at less
than 1mm/year for 120 years.
• The role played by subsidence continues to be
studied.
37
CONCLUSIONS
• Depth of influence to 10% settlement depends on
modulus profile (1B for linear increase and 4B for
constant with depth)
• Read the consolidation curve directly for
settlement calculation
• Plot the consolidation curve as a stress strain
curve.
• Beware of the unload-reload loop as the slope
depends on the stress release amplitude

38
ACKNOWLEDGEMENTS
• Mueser Rutledge Consulting Engineers (MRCE)
for sharing their knowledge and data on the
Washington Monument (Hugh Lacy, Doug
Christie)
• Phil King (Synchropile)
• Jay Padgett Jr. of GeoServices Corporation for
his insight and background on the Monument
• Brad Smith and Jennifer Nicks of Texas A&M
University
• Funding provided by the Spencer J. Buchanan
Chair at Texas A&M University