Embed Size (px)
Citation preview

EXECUTIVE OFFICE OF THE PRESIDENT PRESIDENT’S COUNCIL OF ADVISORS ON SCIENCE AND TECHNOLOGY
WASHINGTON, D.C. 20502
June 25, 2004
President George W. Bush The White House Washington, D.C. 20502 Dear Mr. President: We are pleased to transmit to you a copy of the report, Sustaining the Nation’s Innovation Ecosystem: Maintaining the Strength of Our Science and Engineering Capabilities, prepared by your Council of Advisors on Science and Technology (PCAST). You may recall that PCAST members noted they were developing this report during your meeting with them on December 3, 2003.
PCAST began an effort in 2003 to explore the standing of U.S. innovation leadership, including the challenges confronting the Nation’s “innovation ecosystem.” This ecosystem consists of the complex web of research, business, and people that leads to new ideas, new products and new jobs -- as well as the improvement and sustenance of existing ones. This report examines the status of the Nation’s science and engineering capabilities and the education pipeline that supports them.
The report states that scientific and engineering talent lies at the core of the Nation’s
innovation ecosystem. Technical skills are required at all points within the ecosystem from the research labs to the basic workforce. Noting that global inroads are occurring at all education levels, the report calls for action at each stage of the science and engineering workforce pipeline.
PCAST expresses the belief that your policies have been highly consistent with its
findings and recommendations. The members hope this report will help maintain attention on these important areas as well as highlight some specific actions that could further your goals.
PCAST explored this issue over the course of several public meetings culminating in a
final discussion at its March 30, 2004, meeting. Please let us know if you have any questions regarding the activities of PCAST or this report.
Sincerely,
John H. Marburger, III E. Floyd Kvamme Co-Chair Co-Chair
Enclosure

EXECUTIVE OFFICE OF THE PRESIDENT PRESIDENT’S COUNCIL OF ADVISORS ON SCIENCE AND TECHNOLOGY
WASHINGTON, D. C. 20502
June 7, 2004 The Honorable John H. Marburger, III Director, Office of Science and Technology Policy Executive Office of the President Washington, DC 20502 Mr. E. Floyd Kvamme Co-Chair President’s Council of Advisors on Science and Technology (PCAST) Washington, DC 20502 Dear Jack and Floyd: On behalf of the PCAST Workforce/Education Subcommittee, it is my pleasure to transmit to you the final report, Sustaining the Nation’s Innovation Ecosystem: Maintaining the Strength of Our Science & Engineering Capabilities. In March 2003, the PCAST established this Subcommittee and asked it to examine a number of issues concerning the future of the Nation’s science and technology workforce. Our report was developed on the basis of a series of meetings; discussions between the subcommittee members and experts in education and training and in workforce projections; and background research involving the many existing studies of various aspects of this important issue. As you will recall, the draft report was extensively discussed at the PCAST meeting of March 30, 2004, and has now been revised based on that discussion. The report emphasizes the strong correlation between mathematics and science education and workforce preparation and the ultimate health of our Nation’s innovation ecosystem. This system is rooted in excellence and consists of inventors, technologists, and entrepreneurs; a motivated workforce; world class research universities; highly productive research and development (R&D) centers (both industrially and federally funded); a vibrant venture capital industry; and government funded basic research focused on areas of high potential. We recognize that one of the core drivers of this innovation ecosystem is the strength of the country with respect to science, technology, engineering and math (STEM) skills, and we conclude that the U.S. system is threatened by significant changes in the global technical talent pool and the loss of global market share in technical talent. Our Subcommittee concluded that challenges exist at all points in the STEM workforce supply chain, and that they put our entire national innovation ecosystem at risk. Recommendations are focused in the report around three major areas that must be addressed on multiple fronts, using short- and long-term strategies, in order to strengthen and preserve our nation’s innovation ecosystem. These areas of focus are: improving the K-12 educational system, improving K-12 teacher preparation, and improving undergraduate and graduate STEM training and retention.

U.S. students exhibit alarmingly low science and mathematics capabilities, both in the absolute and in comparison with their counterparts in other countries. Assessment and accountability are essential for improving performance. We urge the Administration to be vigilant in implementing the No Child Left Behind Act of 2001, which addresses these issues. Additionally, we advocate the position that three years of math and two of science should be the minimum standard for high school graduation in the U.S. This poor student performance is unquestionably related to the fact that the pool of fully-qualified teachers in K-12 mathematics and science in the U.S. is woefully inadequate. We recommend alternative mechanisms for teacher certification and urge that steps be taken to increase the attractiveness of teaching as a profession, including performance incentives and real consequences for failure to perform. In addition to better salaries and working conditions, we argue that schools can do more to reduce bureaucracy and waste, freeing funds for teacher salaries and instructional purposes. At the undergraduate and graduate level, we find that the government and universities should focus on recruitment and retention issues. Too many students enter college with an interest in STEM areas but drop out or change majors midway through their academic career. Reducing the time to a PhD, which has increased significantly in recent decades, could significantly improve recruitment and retention. Expanding the number of institutions that offer the Professional Masters Degree in STEM fields could attract students who do not plan to follow the traditional, academic career path. We must also seek to facilitate the entry, and investigate ways to retain the talents, of non-citizens educated in STEM fields in U.S. universities. We believe the President’s policies have been highly consistent with our findings and recommendations, and hope that this report will serve to maintain the attention on these important areas as well as highlight some specific actions that could further the President’s goals. If you have any questions about the report, please feel free to contact me or any member of the Subcommittee. I commend the members for their diligence and hard work, and thank the Office of Science and Technology Policy for considerable assistance. Sincerely,
Robert J. Herbold Chairman Workforce/Education Subcommittee Enclosure

PRESIDENT’S COUNCIL OF ADVISORS ON SCIENCE AND TECHNOLOGY
WORKFORCE/EDUCATION SUBCOMMITTEE
Sustaining
the Nation’s Innovation Ecosystem
Report on
Maintaining the Strength of Our Science & Engineering Capabilities
June, 2004

About the President's Council of Advisors on Science and Technology: President Bush established the President's Council of Advisors on Science and Technology (PCAST) by Executive Order 13226 in September 2001. Under this Executive Order, PCAST “shall advise the President … on matters involving science and technology policy,” and “shall assist the National Science and Technology Council (NSTC) in securing private sector involvement in its activities.” The NSTC is a cabinet-level council that coordinates interagency research and development activities and science and technology policy making processes across federal departments and agencies. PCAST enables the President to receive advice from the private sector, including the academic community, on important issues relative to technology, scientific research, math and science education, and other topics of national concern. The PCAST-NSTC link provides a mechanism to enable the public-private exchange of ideas that inform the federal science and technology policy making processes. PCAST follows a tradition of Presidential advisory panels on science and technology dating back to Presidents Eisenhower and Truman. The Council’s 23 members, appointed by the President, are drawn from industry, education, and research institutions, and other nongovernmental organizations. In addition, the Director of the Office of Science and Technology Policy serves as PCAST’s Co-Chair.
Members of the Workforce/Education Subcommittee:
Robert J. Herbold (chair)
Carol Bartz Erich Bloch Raul J. Fernandez Marye Anne Fox
Martha Gilliland Ralph Gomory Walter E. Massey E. Kenneth Nwabueze
Office of Science & Technology Policy Advisors:
Ann B. Carlson Amy Flatten Kathie L. Olsen Stanley S. Sokul

Sustaining the Nation’s Innovation Ecosystem
Report on Maintaining the Strength of Our
Science & Engineering Capabilities
Table of Contents
1. Introduction................................................................................................................. 1
2. Our Innovation Ecosystem.......................................................................................... 2
3. A Clarion Call ............................................................................................................. 3
4. Key Recommendations ............................................................................................... 9
5. Conclusion ................................................................................................................ 10
References......................................................................................................................... 12
Appendix A: K-12 Educational Preparation in Mathematics and Science ....................... 15
Appendix B: K-12 Teacher Preparation in Mathematics and Science ............................. 20
Appendix C: The STEM Workforce and Undergraduate and Graduate Education.......... 26
Members of the President's Council of Advisors on Science and Technology ................. 40

Sustaining the Nation’s Innovation Ecosystem
Report on Maintaining the Strength of Our
Science & Engineering Capabilities
List of Figures
Figure 1: U.S. student math and science proficiency in 2000 ............................................ 4
Figure 2: U.S. student math and science proficiency vs. other countries ........................... 5
Figure 3: Students lose interest in mathematics and science as they progress through the
system ......................................................................................................................... 6
Figure 4: Ph.D. Programs have lengthened substantially .................................................. 7
Figure 5: Comparison of B.S. engineering degrees in select countries .............................. 7
Figure 6: Natural science and engineering Ph.D. degrees in U.S. vs. Asia. ....................... 8
Figure 7: 1999 U.S. 8th grade math/science ranking against other major countries ........ 16
Figure 8: Weak math/science graduation requirements in public schools........................ 18
Figure 9: Opportunity costs for teachers with Bachelors and Masters Degrees vs. other
career choices............................................................................................................ 22
Figure 10: Instruction vs. non-instruction expenditures for U.S. school systems ............ 24
Figure 11: Degrees granted and job openings projections for scientists and engineers. .. 27
Figure 12: Engineering degrees granted and job openings projections ............................ 28
Figure 13: Physical sciences degrees granted and job openings projections.................... 28
Figure 14: Salary growth for scientists and engineers 1995-2000.................................... 29
Figure 15: 1995-2000 salary increases for various occupations....................................... 30
Figure 16: Projected growth for jobs requiring technical skills 1998 - 2008 ................... 30
Figure 17: Comparison of annual wages in U.S. and India for technical jobs ................. 34

Sustaining the Nation’s Innovation Ecosystem
Report on Maintaining the Strength of Our
Science & Engineering Capabilities 1. Introduction Our Nation’s bright future rests today, as in the past, on the combination of exceptional, creative brain power and our unique free enterprise system. Throughout the 20th Century, the industries that were born here and have become the engines of our prosperity have been the result of an interwoven U.S. innovation ecosystem. This system is rooted in excellence and consists of inventors, technologists, and entrepreneurs; a motivated workforce; world class research universities; highly productive research and development (R&D) centers (both industrially and federally funded); a vibrant venture capital industry; and government funded basic research focused on areas of high potential. The human talent spawning industrial growth has largely been drawn from those having advanced science (specifically physical, biological, and biomedical sciences) and engineering capabilities, with a significant dependency on Ph.D. level specialists. Supporting the specialists, individuals who are competent in a variety of science/technology/engineering/math (STEM) capabilities play key roles in the success of these industries and in the vibrant U.S. economy they have produced. Innovation and entrepreneurship will continue to enable this U.S. global economic leadership, but only to the degree that we maintain the core capabilities driving our innovation ecosystem, particularly the scientific and engineering talent at its core. Our innovation ecosystem is the best in the world. Yet without immediate steps to preserve and strengthen it, our system is threatened by significant changes in the global technical talent pool and shifts in the share of global R&D effort by region (U.S., Europe, and Asia). U.S. students are weak in math and science skills and lag behind most of the world in these capabilities. Top U.S. students pursue STEM careers at significantly lower rates than their international counterparts. Other countries have substantially increased their number of STEM graduates and are attracting significant numbers of jobs from global corporations, which has the effect of attracting large investments in R&D with particular focus on the high tech sector. This global shift in talent (dominance in scientific and technical talent appears to be shifting from the U.S. to Asia) and R&D infrastructure is dramatic. We must aggressively maintain the U.S. innovation ecosystem if we do not wish to see ourselves surpassed in global economic leadership. This report contains PCAST’s recommendations to the President for important actions that will sustain the Nation’s innovation ecosystem. We began this study by asking ourselves if the U.S. was facing a shortage or a surplus in STEM workforce relative to

2
job growth projections, but we quickly discovered that this narrow focus misses the point: it is the entire U.S. innovation ecosystem that is at risk. The loss of global market share in STEM talent could have dramatic future impacts. This concern shaped the subsequent work of the PCAST and is the reason we focus our analysis, findings, and recommendations around the overarching priority to maintain the strength of U.S. science and engineering capabilities. 2. Our Innovation Ecosystem During the 20th Century, the U.S. has been the clear global leader in innovation and entrepreneurship. Entire industries—automobiles, steel, chemicals and materials, pharmaceuticals, computers and information technologies, emerging biotechnologies, and the internet—were born out of American ingenuity and have become incredible engines of prosperity. These industries, and the many others that emerged in our country over the same decades, were founded on an interwoven innovation ecosystem consisting of several parts:
1) Human scientific and technical (S&T) talent—as inventors, innovators, entrepreneurs, and a skilled workforce;
2) Research universities that are clearly the best in the world; 3) Productive R&D centers (some corporate based, others funded by independent
not-for-profits, others funded by the government); 4) A venture capital industry that helped launch the entrepreneurs and innovators
who developed great marketplace ideas; 5) Economic, political, and social environments where small businesses can be
successful and large businesses continue to prosper; and 6) Government funded basic research focused on areas of high potential for
discoveries.
This innovation ecosystem—the above elements working together in complex synergy—has produced the global economic leadership and high standard of living our country enjoys. One of the core drivers of all this innovation has been the strength of the country with respect to STEM skills. Our economy relies on a workforce that is adaptable, motivated and flexible; educated at our schools, colleges, and universities in STEM areas to prepare for highly skilled and productive jobs. For producing blockbuster, industry-generating ideas, we look to our exceptional science and engineering talent at the Ph.D. level residing in universities, industry, and the government. We also see the penetration of STEM capabilities in virtually all aspects of American work and life. We need only to look at the CEO’s of the Fortune 100 companies, 55% of whom have STEM backgrounds, to understand how much our current success depends on technical talent and training. Hanushek and Kimko (2000) also provide evidence of the correlation between long-term economic health and STEM education. Analyzing more than four decades of data, they demonstrated a strong statistical relationship between K-12 math and science test scores and a country’s GDP growth rates.
3
While the building blocks of our innovation ecosystem have passed the test of time, the global environment in which they are woven together is changing rapidly. We are in a period of significant structural and cyclical transformation – world-wide changes familiar from history but occurring on compressed timelines and with shorter transitions. Globalization, access to capital, changing dependences on natural resources, dynamic world labor markets, and varying social and political climates all exert major influences on industries and provide both opportunities and challenges for our economy in a global marketplace. If any of the elements of our innovation system is neglected or fails to appropriately adapt to the current environment, we risk undermining the whole. These global changes present risks but will also create new opportunities and will spawn new markets and new industries for those who are awake to the possibilities. We must continually question how to maintain and optimize our innovation ecosystem: Is the venture capital available appropriate for the business opportunities of the moment? Are the R&D centers focused on the most promising opportunities? Is the federal government funding the broad base of fundamental research that will lead to growth in all fields and provide tomorrow’s breakthrough discoveries? Are tax incentives encouraging the desired investments? Will the available labor market meet the needs of the economy now and in the future? And, are we preparing the top talent to make the discoveries and lead the innovations that will fuel our future success? There will be no “magic bullets” in maintaining the excellence of this complex system, but together we have the ability to find the right combination of short- and long-term strategies on multiple fronts to keep our system alive and growing. Leadership is not ours by right, but by diligence and choice. If we continually choose excellence, our innovation ecosystem will remain the best in the world. 3. A Clarion Call The U.S. continues to have the strongest venture capital and free enterprise systems in the world, and our innovation ecosystem provides us with a wealth of competitive advantages. However, we face complex changes in the increasingly globalized economy that put significant stress on this system. Perhaps the most troubling stressor is the evidence of a decline in the science and engineering capabilities and interests in the developing U.S. workforce. Writing in February 2001, the U.S. Commission on National Security/21st Century (Hart & Rudman, 2001) expressed deep concerns about the state of our Nation’s innovation ecosystem:
Americans are living off the economic and security benefits of the last three generations’ investment in science and education, but we are now consuming capital. Our systems of basic scientific research and education are in serious crisis, while other countries are redoubling their efforts. In the next quarter century, we will likely see ourselves surpassed, and in relative decline, unless we make a conscious national commitment to maintain our edge. (Executive Summary, p. ix)

4
U.S. students exhibit alarmingly low science and math capabilities. The National Assessment of Education Progress (NAEP), often referred to as the “Nation’s Report Card” periodically assesses student achievement in mathematics and science using four categories: advanced, proficient (solid academic performance for grade level), partial proficient (acceptable in some areas, lacking in others), and below partial proficient. We would like to see, and believe our educational system should produce, a majority of American students who are at or above the proficient level for their grade in both mathematics and science. Unfortunately, less than 1/3 of all U.S. students in grades 4, 8, and 12 performed at or above the proficient level in mathematics and science in the 2000 assessment (Figure 1). Only 16% of U.S. 12th graders could be considered proficient or advanced in Math, and only 18% in Science, while 47% were below partial-proficiency in science and 35% below partial-proficiency in math.
Figure 1: U.S. student math and science proficiency in 2000
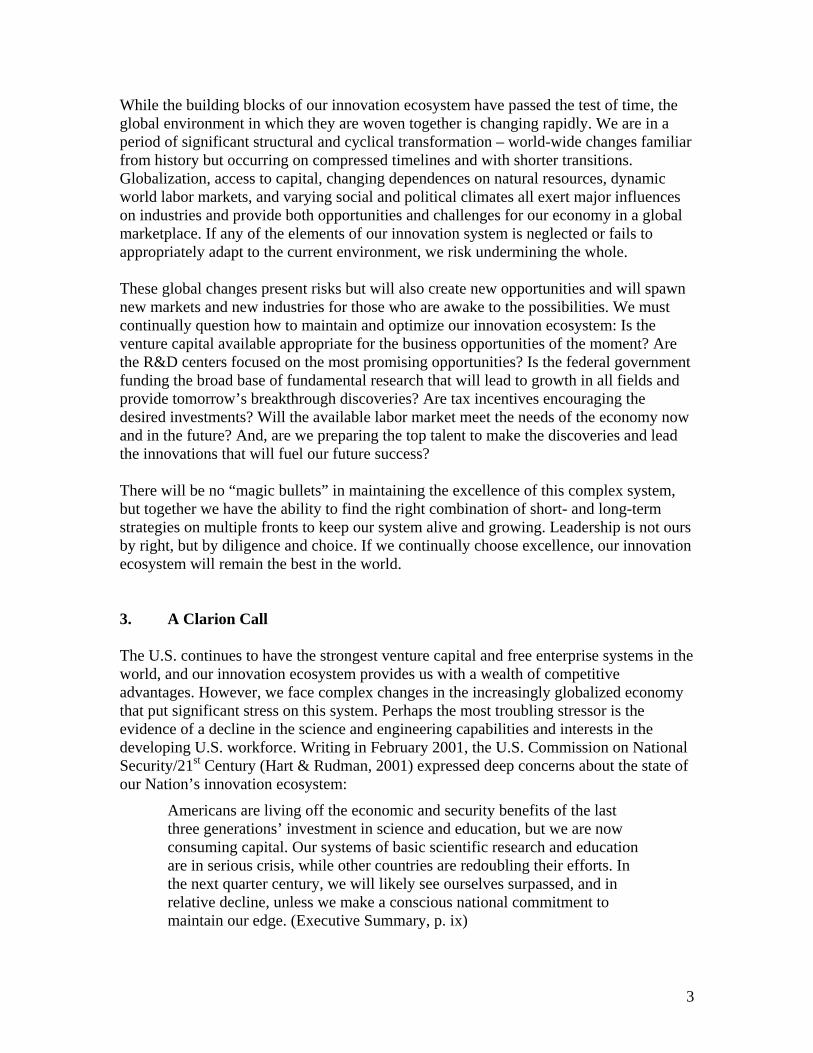
U.S. students also lag behind their counterparts in other countries. Figure 2 shows the U.S. performance results from the 1995 International Math and Science Study (TIMSS), which assessed the performance of students from up to 41 countries at the 4th, 8th, and 12th grade levels. While American students performed better than the country averages in both mathematics and science at the 4th grade level, their scores had declined at the 8th and were considerably lower at the 12th grade level. The U.S. was at or near the bottom when comparing 12th grade advanced-placement groups. A repeat of the TIMSS study in 1999 (NCES, 2000) among 8th graders found that “between 1995 and 1999, there was no change in mathematics or science achievement in the U.S.” (p. 4), even after the U.S. had invested effort in attempting to learn from and remedy the situation.
U.S. Students – National Assessment of Educational Progress (NAEP)
Year 2000 Math and Science Proficiency
4th Grade 8th Grade 12th Grade Science Math Science Math Science Math Advanced 4% 3% 4% 5% 2% 2% Proficient* 26% 23% 28% 22% 16% 14% Partial Proficient 37% 43% 29% 38% 34% 48% Below Partial 34% 31% 39% 34% 47% 35%
Proficient
* Proficient = solid academic performance for grade assessed
Source: Committee for Economic Development (2003). Learning for the Future

5
Figure 2: U.S. student math and science proficiency vs. other countries
The problems of poor student performance are exacerbated by poor expectations and poor curriculum. Less than half of fourth grade teachers teach fourth grade level content. The American Association for the Advancement of Science rated less than 10% of middle school math books as acceptable and found no science books acceptable (Committee on Economic Development, 2003). Clearly, the U.S. has a critical issue with respect to K-12 math and science education. (For additional details, see Appendix A: K-12 Educational Preparation in Mathematics and Science.) Poor student performance in mathematics and science is unquestionably related to the fact that the pool of fully-qualified teachers in K-12 mathematics and science is woefully inadequate. The National Commission on Mathematics and Science Teaching for the 21st Century (Glenn, 2000) found that 56% of high school students taking physical science and 27% of high school students taking mathematics are taught by out-of-field teachers. The numbers are even worse in the lower grades; 93% of middle school science and 70% of middle school math students are taught by out-of-field teachers (Committee on Economic Development, 2003). With so few qualified teachers, our K-12 system seems to discourage—or at least not encourage—many of the students from pursuing coursework that can open up careers in STEM areas. Recruiting and retaining qualified teachers is difficult. There are significant opportunity costs to choosing teaching as a profession and attrition for beginning teachers is high—33% during the first three years and 46% during the first five years (Committee on Economic Development, 2003). The huge turnover rates create a major burden on school systems to be constantly recruiting new teachers. These problems are not new and have been widely acknowledged. 20 years ago, the National Commission on Excellence in Education detailed the same problems in their report, A Nation at Risk (Bell, 1983), which awakened millions of Americans to the crisis
Global Student Achievement in Math and Science Scores and Ranking of the U.S. versus Other Countries
Math Science U.S. Score U.S. Rank U.S. Score U.S. Rank Avg. Score # of Nations Avg. Score # of Nations
4th Grade 545 / 529 12 / 26 565 / 524 3 / 26
8th Grade 500 / 513 28 / 41 534 / 516 17 / 41
12th Grade 461 / 500 19 / 21 480 / 500 16 / 21
12th Grade Advanced 442 / 501 15 / 16 423 / 501 16 / 16 Math & Physics
Source: National Center for Education Statistics (1999). Highlights from TIMSS

6
in our primary and secondary educational systems. Yet, a 2003 study (Koret Task Force) finds that virtually no change has occurred in the educational system’s results. We must not again spend 20 years tweaking a broken system only to have a future task force discover that no progress has been made. (For additional details, see Appendix B: K-12 Teacher Preparation in Mathematics and Science.) Another important issue is the declining interest of students in STEM careers as they progress to the entry level in college and beyond (see Figure 3). Despite K-12 deficiencies, the numbers of U.S. students who go to college intending to major in science or engineering would be adequate if they were to remain devoted to those careers. However, other factors act to sharply decrease the numbers.
Figure 3: Students lose interest in mathematics and science as they progress through the system
Not only is the total U.S. interest in STEM careers declining, the U.S. is failing to attract the full diversity of its population to STEM careers. Women, underrepresented minorities, and persons with disabilities comprise more than two-thirds of the U.S. workforce, but hold only about one-quarter of the science, engineering, and technology jobs that underpin U.S. economic strength. Because of cultural and systemic disincentives for women and minority students to stick with math and science, we are not attracting or retaining these students in STEM fields in numbers adequate to address this imbalance. One significant factor in the declining interest in STEM careers is the sheer length of time required to get an advanced degree in these fields, which has increased steadily in recent decades (Figure 4). This lengthens the time before a student can become an independent researcher, lowers his/her lifetime earnings expectations, and adds uncertainty because the job market for these highly-degreed people has a history of volatility. The addition of postdoctoral training requirements in most STEM fields has further exacerbated these considerations. For those seeking academic positions, the additional stressful years before tenure make balancing family decisions with career difficult, further decreasing the attractiveness of these careers. Americans who are considering the S&T career path weigh their decision against alternatives such as pursuing an M.D. or law degree. The length of training to enter these alternative fields has not similarly increased and their earnings relative to the S&T
The Pipeline to the PhD in Science
Percent of all U.S. 9th Graders Men Women In Grade 9, Enrolls in Science Track 14 % 11 % As College Freshman, Plans to Major in Science 7 % 2 % Achieves a Bachelors in Science 2 % 1 % Source: J.S. Long (Ed.) (2001). From Scarcity to Visibility: Gender Differences in the Careers of Doctoral Scientists and Engineers, National Research Council.

7
advanced degree are attractive. At most U.S. universities, alternative career directions within STEM fields to the Ph.D. and the academic research track are not emphasized.
Figure 4: Ph.D. Programs have lengthened substantially
While U.S. students’ interest in STEM careers is declining, foreign countries are significantly increasing the number of STEM graduates coming out of their universities, enabling them for the first time to attract technology-based jobs in very large numbers. The extent to which China, South Korea, Taiwan, and Japan are educating engineers is truly eye-opening. Figure 5 shows that, among citizens age 24 in 2001, China has over three times as many engineers as the U.S. A full 39% of their BS/BA degrees were in engineering, while in the U.S. it was only 5%.
Figure 5: Comparison of B.S. engineering degrees in select countries
The world-wide number of Ph.D. degrees in science and engineering is significantly increasing. Immigration of the best and brightest from abroad for graduate study in the U.S., and to work in the U.S., helps high-tech performance if these scientists and engineers are able to remain in the U.S. However, a greater percentage of these STEM degrees are being obtained outside the U.S. (see Figure 6), and those foreign students who do obtain advanced degrees in U.S. universities are finding it increasingly difficult to remain in the U.S. upon completion. Security concerns, driven by the disastrous events
B.S. Engineering Degrees in Select Countries Of Citizens Age 24 in 2001
Total BS/BA BS Engineering % Degrees (000) Degrees (000) Engineering United States 1,253.1 59.5 5 %
China 567.8 219.5 39 % South Korea 209.7 56.5 27 % Taiwan 117.4 26.6 23 % Japan 542.3 104.6 19 %
Source: National Science Foundation (2002). Science and Engineering Indicators
Time from Bachelor Degree to PhD in Biomedical Life Science Years
1971 6.0 1976 6.3 1981 6.6 1986 7.2 1991 7.7 1996 7.8
Source: Butz, Bloom, Gross, Kelly, Kofner, & Rippin (2003).

8
of September 11, 2001, have led to some foreign students enrolled in U.S. universities being denied reentry and to significantly more difficult and time consuming processes for visa applications and security checks. The U.S. has traditionally attracted the world’s best minds in science, engineering, and technology, and we have depended on the influx of non-U.S. talent in STEM fields to add vitality to our national innovation ecosystem. Data now show that the Asian population is becoming the dominant global factor with respect to top skills in STEM fields.
Figure 6: Natural science and engineering Ph.D. degrees in U.S. vs. Asia.
Asian countries are beginning to act aggressively with respect to attracting R&D investment and participating in high-tech industries. Companies are attracted by the low wages in these skilled labor markets. For example, from 1994 to 2000 U.S. companies increased their R&D spending in China from $7 million to $506 million (Moris, 2004). Asian countries are also becoming significant holders of U.S. patents. The percentage of U.S. patents held by Asian based companies (not including Japan) has increased from 1.7% of total U.S. patents in 1988 to 12.3% in 2001 (U.S. Patent and Trademark Office, special tabulation). The danger is not only the loss of potential new jobs, but that expertise in key disciplines could be moving overseas and that further innovation in these fields will not occur here but elsewhere. (For further analysis of the global STEM workforce and job market, please see Appendix C: The STEM Workforce and Undergraduate and Graduate Education.) PCAST has concluded that challenges exist at all points in the STEM workforce supply chain, and that they put our entire national innovation ecosystem at risk. It would be difficult to overstate the importance of this issue. We derive our competitive advantage from discovery and innovation, and while each new discovery is, by nature, unpredictable and surprising; the process of discovery is predicated on careful preparation. Consider what the experts tell us: U.S. Nobel Prizewinning biochemist Albert von Szent-Gyorgyi, himself paraphrasing Louis Pasteur, said, “A discovery is said to be an accident meeting a
Natural Sciencea and Engineering PhD Degrees
U.S. Citizens in U.S. non-U.S. Citizens in U.S. Total in Asian Universities 1987 8238 4324 6828 1989 8944 5073 8117
1991 9741 7165 8678 1993 10,033 7912 9847 1995 10,527 8662 12,303 1997 10,996 8109 15,632 1999 10,586 7284 18,000b 2001 10,206 7617 20,000b
Source: National Science Foundation (2004). Science and Engineering Indicators a. “Natural science” includes physical, biological, earth systems, mathematics & computer, and medical
science. b. Estimates. Data for India in 1999 and 2001 and for South Korea in 2001 were not available.

9
prepared mind.” We are, as a Nation, failing to prepare the minds we depend upon to lead our innovation ecosystem into the future. The call is clear; we must protect and enhance the U.S. innovation ecosystem that has put our Nation in the global economic leadership position it currently enjoys. Without top science and engineering leadership and a strong base of STEM talent coming from our schools, colleges, and universities on a consistent basis, the very foundation of the American innovation ecosystem is threatened. 4. Key Recommendations The challenges we have outlined reflect a complex system which must be addressed on multiple fronts, using short- and long-term strategies. As a first step, PCAST identified a number of top-level recommendations that we believe must be implemented before we can expect to see significant results. Improving the K-12 Educational System (For details, see Appendix A: K-12 Educational Preparation in Mathematics and Science):
• Assessment is essential. The No Child Left Behind Act of 2001 calls for accountability in achieving academic results and establishes standards for ensuring that there are teachers in the classroom who are knowledgeable and experienced in the subjects they teach. The Administration should be vigilant in making sure the elements in the Act that require accountability and tough standards are executed properly.
• There is a need for more math and science instruction in schools. The National Commission on Excellence in Education calls for a minimum three years of mathematics and two years of science for all students before high school graduation. We urge the Administration to back that position.
Improving K-12 Teacher Preparation (For details, see Appendix B: K-12 Teacher Preparation in Mathematics and Science:
• Alternative mechanisms in educational systems create a flexible, competitive environment that helps to maintain high standards. Programs that generate new routes for teacher certification are excellent ways to enhance the ranks of highly qualified teachers. Vouchers and charter schools set up forms of competition that tend to increase the overall quality of education in a community. We urge the Administration to be a strong and vocal advocate of these programs.
• The K-12 teaching profession must be made more attractive to talented individuals. Improved management systems, better performance appraisal mechanisms, incentives to pursue teaching, and salary structures that are competitive and tied to performance must all be implemented. Poorly performing teachers must be identified and charged to improve, or they should experience real consequences of failure to improve. Schools should work to reduce bureaucracy and waste, and to invest the savings in high quality teachers and instruction. The Administration should advocate for these systemic changes.

10
Improving undergraduate and graduate STEM training and retention (For details, see Appendix C: The STEM Workforce and Undergraduate and Graduate Education):
• Government agencies and universities should focus together on increasing the overall number and the retention rate of students pursuing STEM careers. Too many students enter college with an interest in STEM areas but change majors midway in their academic career. The Administration should assess and propagate best practices for recruitment and retention. Emphasis should be place on addressing the various needs, interests, and motivations of the full complement of an increasingly diverse U.S. population.
• The professional science Masters Degree concept provides an alternative for students interested in STEM areas but not interested in the lengthy time it takes to obtain a Ph.D.. The concept was launched in 1997 through the help of the Sloan Foundation and the Council on Competitiveness. Today, this type of degree is available at 45 universities. The Administration should strongly advocate these programs.
• The average time to obtain a STEM Ph.D. is simply too large and should be reduced. The average time from a Bachelors Degree to completion of the Ph.D. has increased significantly in the last few decades and is now over 7 years. Even the brightest and best students are starting to balk at the increase in personal investment this represents. Universities need to take this issue seriously and develop alternatives to the present mode of operation. The Administration must be aggressively committed to helping reduce the time to degree.
• We must attract more U.S. students to graduate study in fields of science and engineering and also seek to retain the talents of non-citizens educated in U.S. universities. We urge the Administration to initiate a major program of fellowships to attract and support U.S. citizens, including women and underrepresented minorities, in advanced STEM degrees. We also urge the Administration to investigate ways to retain non-U.S. citizens in the U.S. upon receiving their Ph.D. in STEM areas. Foreign born scientists and engineers have in the past driven an important share of this country’s innovation. Retaining a greater number could partially offset the decline in U.S. citizens going into these areas.
PCAST believes that implementing these recommendations will result in significant progress toward maintaining our innovation ecosystem and preserving our Nation’s industrial and economic strength. 5. Conclusion The members of the PCAST have identified the elements of the national innovation ecosystem that we believe are responsible for the global economic leadership the U.S. has enjoyed during the past century. We have also heard a clarion call—unless we take action to maintain our global advantages in training the top technical talent and in developing a skilled science and technology workforce, we run the risk of losing our competitive

11
advantage. We therefore recommend several high-priority actions that respond to this challenge. We urge the President to make this issue a visible priority, focusing attention on it through major policy speeches and in the next State of the Union address. This issue is of the utmost importance and failure is not an option. Our vibrant national future rests on the combination of creative mind power and the U.S. free enterprise system. Science and technology are critical components, and in these areas we are losing our historical dominance. The Administration must do everything within its power to reverse this trend. At the same time, we have seen that this is an issue for all Americans. Many of the factors are outside the direct control of the Federal government. As Presidential advisors, leaders in industry and academia, concerned citizens, and as parents with a stake the enduring future of our country’s prosperity, we commit ourselves to addressing the issues we have identified. We will extend the challenge to our colleagues, communities, and families. The clear objective, protecting our national innovation ecosystem, will require the best efforts us all.

12
References Bell, T. H. (Chair). (1983). A Nation at Risk. National Commission on Excellence in
Education. Available for download at: http://www.ed.gov/pubs/NatAtRisk/index.html
Butz, W. P., Bloom, G. A., Gross, M. E., Kelly, T. K., Kofner, A., & Rippen, H. E.
(2003). Is there a shortage of scientists and engineers? How would we know? RAND Corporation. Available for download at: http://www.rand.org/publications/IP/IP241/
BEST (2004). A bridge for all: higher education design principles to broaden
participation in science, technology, engineering and mathematics. Building Engineering and Science Talent (BEST). Available for download at: http://www.bestworkforce.org/PDFdocs/BEST_High_Ed_Rep_48pg_02_25.pdf
CAWMSET (2000). Land of plenty: diversity as America’s competitive edge in science,
engineering and technology. Report of the Congressional Commission on the Advancement of Women and Minorities in Science, Engineering and Technology Development. Available for download at: http://www.nsf.gov/od/cawmset/report/cawmset_report.pdf
CEOSE (2003). 2002 biennial report to Congress. Committee on Equal Opportunities in
Science and Engineering. Available for download at: http://www.nsf.gov/pubs/2003/ceose/ceose.pdf
Committee for Economic Development (2003). Learning for the future: changing the
culture of math & science education to ensure a competitive workforce: A statement on national policy. Research and Policy Committee. New York: Committee for Economic Development. Available for download at: http://www.ced.org/docs/report/report_scientists.pdf
Engardio, P., Bernstein, A. & Kripalani, M. (2003, February 3). The new global job shift.
Business Week, 50. Epstein, M. (2003). Security detail. Education Next—A Journal of Opinion and Research,
3(3), 28-33. Available for download at: http://www.educationnext.org/20033/28.html
Glenn, J. (Chair). (2000). Before it’s too late: a report to the Nation from the National
Commission on Mathematics and Science Teaching for the 21st Century. Available for download at: http://www.ed.gov/inits/Math/glenn/toc.html
Global Insight (2003). World Industry Service Database. Global Insight, Inc. Company
Website at: http://www.globalinsight.com/

13
Hanushek, E. A. (1992). The trade-off between child quantity and quality. Journal of Political Economy, 100(1), 84-117.
Hanushek, E. A., & Kimko, D. D. (2000). Schooling, labor force quality, and the growth
of nations. American Economic Review, 90(5), 1184-1208. Hart, G. & Rudman, W. B. (Co-Chairs). (2001). Road map for national security:
imperative for change. The Phase III report of the U.S. Commission on National Security/21st Century. Available for download at: http://www.nssg.gov/PhaseIIIFR.pdf
Koret Task Force (2003). Our schools and our future; are we still at risk? Education Next
– A Journal of Opinion and Research, 3(2), 9-15. Available for download at: http://www.educationnext.org/20032/10.html
Long, J. S. (Ed.). (2001). From scarcity to visibility: gender differences in the careers of
doctoral scientists and engineers. Washington, DC: National Research Council. Available for download at: http://books.nap.edu/catalog/5363.html
Moris, F. (2004). U.S.-China R&D linkages: direct investment and industrial alliances in
the 1990s. National Science Foundation Science Resources Statistics Infobrief, NSF 04-306. Available for download at http://www.nsf.gov/sbe/srs/infbrief/nsf04306/start.htm
NCES (2002a). Digest of Education Statistics-2002. National Center for Education
Statistics, U.S. Department of Education. NCES 2003-060. Available for download at: http://nces.ed.gov/programs/digest/d02/
NCES (2002b). Academic background of college graduates who enter and leave teaching.
The Condition of Education. NCES website. Available for download at: http://nces.ed.gov/programs/coe/2002/section4/indicator31.asp
NCES (2000). Highlights from the third international mathematics and science study-
repeat (TIMSS-R). National Center for Education Statistics, U.S. Department of Education. NCES 2001-027. Available for download at: http://nces.ed.gov/pubs2001/2001027.pdf
NCES (1999). Highlights from TIMSS: overview and key findings across grade levels.
National Center for Education Statistics, U.S. Department of Education. NCES 1999-081. Available for download at: http://nces.ed.gov/pubs99/1999081.pdf
NSF (2004). Science and engineering indicators–2004. National Science Foundation,
Division of Science Resources Statistics. NSB 04-07. Arlington, VA: NSB. Available for download at: http://www.nsf.gov/sbe/srs/seind04/start.htm

14
NSF (2003). Women, minorities, and persons with disabilities in science and engineering–2002. National Science Foundation, Division of Science Resources Statistics. NSB 03-312. Arlington, VA: NSB. Available for download at: http://www.nsf.gov/sbe/srs/nsf03312/toc.htm
NSF (2002a). Science and engineering indicators–2002. National Science Foundation,
Division of Science Resources Statistics. NSB 02-01. Arlington, VA: NSB. Available for download at: http://www.nsf.gov/sbe/srs/seind02/start.htm
NSF (2002b). Science and engineering doctorate awards–2001. National Science
Foundation, Division of Science Resources Statistics. NSB 03-300. Arlington, VA: NSB. Available for download at: http://www.nsf.gov/sbe/srs/nsf03300/start.htm
OECD (2003). Education at a glance-2003. Education Statistics and Indicators,
Organization for Economic Cooperation and Development. Website. Available for retrieval at: http://www.oecd.org/document/52/
0,2340,en_2649_34515_13634484_1_1_1_1,00.html PCAST (2002). Assessing the U.S. R&D investment. President’s Council of Advisors on
Science and Technology (PCAST). Available for download at: http://www.ostp.gov/pcast/FINAL%20R&D%20REPORT%20WITH%20LETTERS.pdf
Porter, M. E. & van Opstal, D. (2001). U.S. competitiveness 2001: Strengths,
vulnerabilities and long-term priorities. Council on Competitiveness. Available for download at: http://www.compete.org/pdf/Highlights.pdf
Seymour, E. & Hewitt, N. (1997). Talking About Leaving: Why Undergraduates Leave
the Sciences. Boulder, CO: Westview Press. Thottam, J. (2003, August 4). Where the good jobs are going. Time Magazine, 36. Teitelbaum, M. S. (2003). The U.S. science and engineering workforce: an
unconventional portrait. Prepared for GUIRR Summit. New York: Alfred P. Sloan Foundation. Available for download at: http://www.phds.org/reading/guirr2002/teitelbaum.php

15
Appendix A: K-12 Educational Preparation in Mathematics and Science While other countries become more globally competitive through their increasing strength of STEM talent, students in the U.S. continue to perform poorly and lag behind most of the world in math and science capabilities. PCAST looked at U.S. student performance both against our own national standards and as determined through international comparison tests and had the following key finding: Finding: America’s K-12 science and math scores are quite weak in the absolute and weak versus other countries, creating a long term risk to our innovation ecosystem. A core issue is the need for strong math and science curriculum requirements. While the poor U.S. performance in international student comparisons may be the most frequently cited, some professional educators will argue that the international tests are not designed with the precision that they should be. Explaining disappointing results, educators sometimes claim that some of these countries have weeded out poorly performing students in the earlier grades, and consequently that our higher grade students are being tested against a different type of student population in the other countries. Yet, when we look at the math and science proficiency ratings our students obtain when they are evaluated here in the United States, against our own national standards for educational proficiency, the results are grim. Probably the best known U.S. mechanism for student testing is the National Assessment of Education Progress (NAEP), often referred to as the “Nations Report Card”. NAEP periodically reports student achievement in science and mathematics using four categories: advanced, proficient, basic, and below basic. On the 2000 NAEP, less than 1/3 of all U.S. students in grades 4, 8, and 12 performed at or above the proficient achievement level in mathematics and science, where proficient represents “solid academic performance for each grade assessed.” The results of this National Assessment of Educational Progress from the year 2000 are tabulated in Figure 1 (on page 4). Consider mathematics proficiency for 12th graders: Only 2% of those taking the test had advanced skills. 14% were judged to be proficient, which means, as mentioned earlier, solid academic performance for the grade assessed. 48% of 12th graders were judged to be partially proficient, which means that they had mastered some, but not all of the basic academic performance categories for the subject of mathematics for 12th graders. 35% of the 12th graders were judged to be below partial proficiency in math, defined as not achieving even a basic competence in the pre-requisite knowledge areas that are fundamental for work at the 12th grade level. These scores in the NAEP test in the year 2000 were very similar to prior years. In fact, the National Commission on Mathematics and Science Teaching for the 21st Century, often called the “Glenn Commission” (Glenn, 2000), looked at this subject in detail. In their summary report, this prestigious commission made the following assessment of the NAEP data from several years:
While U.S. students do, indeed, learn more each year they are in school, they are performing less well in the 12th grade than in the 4th and 8th grades, compared to

16
the standards of proficiency for those grade levels. Despite some improvements in NAEP mathematic scores since the 1970’s, our students’ performance in science and mathematics has remained at disappointing levels for nearly thirty years. (p. 11).
For international comparisons, undoubtedly the most often cited measure of America’s math and science skills for K-12 students versus other countries is the International Math and Science Study (TIMSS), which assessed the performance of students from up to 41 countries in 1995 (NCES, 1999). Four groups of students were tested: 4th graders, 8th graders, 12th graders and 12th graders taking advanced placement mathematics and physics. TIMSS test results (See Figure 2, page 5) show America’s 4th graders were about average internationally in mathematics. In science, America’s 4th graders scored significantly better than the international average. For American 8th graders, the results were a lot weaker. Specifically, American students were 28th out of 41 countries in mathematics and 17th out of 41 in science. By the 12th grade, the results were weaker still. In math, America’s 12th graders were outperformed by 18 of 21 countries and by 15 of 21 countries in science. The worst news of all was in the 12th grade advanced placement group. American students outperformed only one country in mathematics and had the lowest scores in science of all the 16 countries participating in the achievement of advanced students tests. There was a limited repeat (eighth grade only) of the TIMSS executed in 1999. Figure 7 shows the results of the United States versus the other key countries participating in the test.
Figure 7: 1999 U.S. 8th grade math/science ranking against other major countries
Unfortunately, the results were not much better for America’s 8th graders in 1999 than in the original 1995 TIMSS study. Although the U.S. moved up slightly against the
Global Student Achievement in Math & Science Eighth Grade Student Scores; US versus Other Major Countries
Math Science Singapore 604 Taiwan 569 South Korea 587 Singapore 568 Taiwan 585 Japan 550 Hong Kong 582 South Korea 549 Japan 579 Australia 540 Belgium 558 U.K. 538 Canada 531 Belgium 535 Russia 526 Canada 533 Australia 525 Hong Kong 530 United States 502 Russia 529 U.K. 496 United States 515
Source: National Center for Education Statistics (2001). Highlights from TIMSS-R

17
international average scores in 1999, in analyzing the results from the 23 nations that participated at the 8th grade level in both studies, the National Center for Education Statistics (2000) concluded that “between 1995 and 1999, there was no change in 8th grade mathematics or science achievement in the U.S.” (p. 4). These 1999 results were very disappointing in that a fair amount of effort had been put into trying to learn from the TIMSS study of 1995.
Females and underrepresented minorities (African-American, Hispanic, and Native American) in the U.S. fare even less well in K-12 mathematics and science achievement than do their male White and Asian counterparts. Several studies have looked in detail at the achievement of females and/or minorities in mathematics and science (BEST, 2004; CAWMSET, 2000; NSF, 2003). These studies conclude that, although gains have been made in recent years, there are persistent gaps in achievement and course-taking that can become a basis for unequal technological, mathematics, and science literacy as well as unequal participation in further mathematics and science education and subsequent S&E employment.
The Committee on Economic Development is another group that has recently tackled the topic of math and science education. Their report (2003) identifies key issues that are considered critical in answering the question, “Why are math and science scores so low in the U.S.?” Two issues are particularly related to an inadequate K-12 curriculum:
1. Low Expectations – less than half of fourth grade teachers teach fourth grade level content.
2. Poor Quality Texts – The American Association for the Advancement of Science rated less than 10% of middle school math books as acceptable and found no science books acceptable.
Adding to unsatisfactory math and science skills in K-12 is the fact that the majority of public schools have weak minimum graduation requirements. As seen in Figure 8, only 45% of the K-12 school systems require the minimum of three years of mathematics recommended by the National Commission on Excellence in Education for high school graduation, and only 24% of our school systems meet the minimum two years of science that is recommended. In a world increasingly touched by technology, every student should leave the K-12 years with a fuller understanding of technology and its impact on virtually all jobs of the future. This can best be accomplished with a more complete study of the mathematics and science that drive technological change.

18
Figure 8: Weak math/science graduation requirements in public schools
In summary, students are not being challenged with high quality math and science curricula at the K-12 level and are not achieving proficiency in these important topics. It is very clear from the data presented here, as well as a wealth of other data which basically shows the same results, that the United States is losing ground with respect to science and math education in the K-12 grades. PCAST developed two key recommendations focusing on K-12 educational preparation in mathematics and science. These recommendations are elaborated below. Recommendation: Execute with excellence the “No Child Left Behind” legislation. We applaud the Administration for getting this bill passed and we are particularly excited about two important aspects of it:
º This bill requires states to measure student progress in mathematics annually in grades 3 to 8 beginning in 2005. Also, it requires the measurement of student progress in science at least once in three grade spans (grades 3-5, grades 6-9, and grades 10-12) each year beginning in 2007. We would strongly recommend that the Administration closely monitor the implementation in the various state and county public school systems to make sure the real intent of accountability and tough standards is achieved.
º The No Child Left Behind legislation requires states to fill classrooms with teachers who are knowledgeable and experienced in mathematics and science by 2005. All new teachers will have to be certified by the state, hold at least a Bachelors Degree, and pass a rigorous state test on subject knowledge and teaching skills.
Recommendation: The Administration should become an advocate for the recommendation of the National Commission on Excellence in Education that calls for a minimum three years of math and two years of science study for all students before high school graduation.
The Majority of Public Schools Have Weak Minimum Graduation Requirements
% of Public Schools Meeting National Commission on Excellence in Education
Recommended Requirements *
Math Science 45% 24%
* Math – 3 years of math; Science – 2 years of science Source: National Commission on Excellence in Education via D. van Opstal (Council on Competitiveness) – private communication; May 2003

19
Technology through the use of the computer, communications devices, medical devices and other everyday products has changed the way Americans live and work. Virtually every job function now is touched by products that did not exist even thirty years ago. This change calls for a reassessment of the study of technical subjects for all students. Just as all students were not required to study auto mechanics but were required to study driver education in years gone by, a basic understanding of the tools of today’s job market—be it a computer, a computerized instrument, an internet based communications device or some other new system—is required to function in today’s world. An increased emphasis on the products of today’s world is needed by the time of high school graduation so that young people are better prepared for their life work even if that does not entail a college level education. One of the years of math study could be dedicated to the study of the principles of business so that students are better prepared to understand the basis on which the American form of capitalism works and is measured. PCAST talked with several K-12 public school administrators who believe the key to improved science and math skills is to standardize the curriculum at challenging levels to make it clear to teachers what they need to teach. There are school districts doing this and seeing significant results. One very positive example is the Bellevue, Washington school system where superintendent Mike Riley reported their standardized science curriculum more than doubled the number of their high school graduates that took 3 years of science (to 76% of the graduating class). Their experience is that without a standardized curriculum, the many out-of-field teachers may develop weak curricula, given their lack of familiarity with the area. And students may be less likely to be encouraged by teachers to take science courses.

20
Appendix B: K-12 Teacher Preparation in Mathematics and Science When the data from the 1999 TIMSS study was released, the U.S. Secretary of Education Richard W. Riley made the following statement, “we cannot expect to lead the world in mathematics and science if our geometry students are being taught by history teachers and our chemistry students are being taught by physical education teachers.” Secretary Riley was focusing on a key issue also identified by PCAST. Finding: Most studies that have focused on the need for improved K-12 math and science skills and interest levels conclude that a core issue is the need for better teachers. Given that efforts of the last 20 years to improve have had minimal impact, it is clear that bold, dramatic changes need to be considered. Too many students are taught by out-of-field teachers because our fully-qualified teaching pool in K-12 mathematics and science is simply inadequate. The previously cited Glenn Commission (Glenn, 2000) final report noted that 56% of high school students taking physical science are taught by out-of-field teachers. It also stated that out-of-field teachers teach 27% of high school students taking mathematics. The commission’s final report made the following statement:
After an extensive, in-depth review of what is happening in our classrooms, the commission has concluded that the most powerful instrument for change, and therefore the place to begin, lies at the very core of education—with teaching itself. The teaching pool in mathematics and science is inadequate to meet our current needs; many classes in these subjects are taught by unqualified and under-qualified teachers. Our inability to attract and keep good teachers grows. ... We are of one mind in our belief that the way to interest children in mathematics and science is through teachers who are not only enthusiastic about their subjects, but who are also steeped in their disciplines and who have the professional training – as teachers—to teach those subjects well. (p. 5).
The Committee for Economic Development (2003) pointed out that 93% of middle school science students are taught by out-of-field teachers. Out-of-field teachers teach 70% of middle school mathematics students. Note that these figures for out-of-field teachers for middle schools are even higher than those cited by the Glenn Commission for high schools. Thus, these middle school students are even less likely to have an enthusiastic and well qualified math or science teacher. The Committee of Economic Development (2003) further identified retention of qualified teachers as a significant issue. Attrition for beginning teachers is 33% during the first three years and 46% during the first five years. These are atrocious turnover rates and obviously create a huge burden on school systems to constantly be finding new teachers. Perhaps this explains why school standards have dropped so significantly in areas such as mathematics and science where recruiting properly qualified individuals is so difficult.

21
Professor Eric Hanushek (Hanushek, 1992; Hanushek, & Kimko, 2000) of the Hoover Institution at Stanford University, with several of his colleagues, has been working on the subject of teacher quality for a number of years. His thorough research has focused the issue of the impact of teacher quality. The following is a statement that Professor Hanushek provided PCAST that summarizes the research on this topic of teacher impact:
The magnitude of estimated differences in teacher quality is impressive. Hanushek (1992) shows that teachers near the top of the quality distribution can get an entire year’s worth of additional learning out of their students compared to those near the bottom. That is, a good teacher will get a gain of 1.5 grade level equivalents while a bad teacher will get 0.5 year for a single academic year. The comparisons given compare teachers at the 5th percentile with those at the 95th percentile.
These estimates were obtained from analyzing differences in elementary school grades of reading and vocabulary achievement within the Gary, Indiana school district. The sample includes only low income minority students, whose average achievement in primary school is below the national average. The estimates come from statistical models that compare the gains in achievement across classrooms of different teachers, allowing for not only differences in family backgrounds but also the entering achievement of the students in a class. (Student background factors include parental income, parental education, mother’s work behavior, and family size). (Hanushek, 2003, private communication).
Most would agree instinctively about the power of a great teacher but to see it quantified in such concrete terms by this research is impressive. Another important issue related to teachers is that during the course of moving from K-12 to college, students who were originally interested in science tend to lose that interest. This factor has been quantified in Long (2001), which summarizes how ninth grade students interested in science will lose that interest as they progress to the entry level in college and then the Bachelors Degree level in college. Specifically, looking at Figure 3 (on page 6), 14% of male students in the ninth grade have an interest in a science tract. That interest drops to 7% having such an interest as they enter college. The number drops further to 2% for those actually receiving a Bachelors Degree in science as they conclude their undergraduate work. The drop in science interest is even more precipitous for females who expressed an interest in science at the 9th grade level. Study after study points out that such a decline is primarily due to teachers not being supportive of math and science career directions. As pointed out previously, a large percentage of teachers of mathematics and science are out-of-field and typically incapable of generating the enthusiasm for the subject matter. One reason why we are not attracting the strongest talent to the teaching profession is salary. As seen in Figure 9, for 22-28 year olds with only a Bachelors Degree, the average earnings differential between a teacher and a non-teacher is about $8,000 per year. For 44-50 year olds with a Masters Degree, the differential is over $22,000. These

22
are big differences and, consequently, it is difficult to attract math or science professionals into the teaching profession.
Figure 9: Opportunity costs for teachers with Bachelors and Masters Degrees vs. other career choices
It is clear that the strongest students are not attracted into the teaching profession. The National Center for Educational Statistics has generated some compelling data that confirms this assertion (NCES, 2002b). 1993 college graduates were ranked by quartile based on SAT or ACT score results; in 2000, these students were contacted again. It was found that in the highest quartile of students, only 4% were full-time K-12 teachers while in the bottom quartile performers, 10% were full time K-12 teachers. This significant difference indicates that America is not attracting its best and brightest into K-12 teaching. PCAST developed two key recommendations focusing on teacher preparation for K-12 mathematics and science. These recommendations are elaborated below: Recommendation: The Administration should be a strong and vocal advocate for new routes for teacher certification and for vouchers and charter schools. Teacher Certification - The No Child Left Behind Act of 2001 requires that each student have a highly qualified teacher. In the past, this meant someone who had graduated from a school of education. But Education Secretary Rod Paige has opted to define highly qualified to include knowing something about what one is teaching. We agree with Secretary Paige. Traditional certification, as championed by classical educators, emphasizes the “how” of teaching as much as, or even more than, the “what”. The reality is this system is simply not generating enough highly qualified math and science teachers for our schools. Our recommendation is that the Administration as well as organizations such as the American Association of Colleges for Teacher Education, realize they must go to
Earnings of Teachers and Non-Teachers: Bachelors and Masters Degree
Average Annual Earnings (1998) Teachers Non-Teachers
22-28 Year-Olds with $21,792 $29,984 only a Bachelors Degree 44-50 Year-Olds with $43,313 $75,824 a Masters Degree Source: Duncan Moore, White House Office of Science and Technology Policy (private communication)

23
alternate routes in order to meet this objective of having a highly qualified teacher in every classroom, particularly for mathematics and science. Organizations such as American Board for Certification of Teacher Excellence are emerging. This group is composed of education reformers, and their goal is to develop a method of certification that rewards subject area expertise more than mastery of pedagogical methods. At the same time, it would create a uniform standard that is more rigorous than current certification tests. The goal of efforts such as the American Board is to begin to see more and more teachers coming to the profession of teaching in unorthodox ways. Some will be professionals who opt to teach after building careers in other fields. Some will be engineers or ex-military officers who decide to teach high school science. Others may catch the teaching bug fresh out of college but haven’t taken a formal education course. While such talented and enthusiastic instructors may strike parents as a godsend, these “late comers” may threaten the existing educational profession. Reluctance to using efforts such as those of the American Board have already surfaced; thus, it is important that the Administration support these efforts so that teacher quality issues as noted in this report can be alleviated. Vouchers and Charter Schools - There is a long history of debate in regard to vouchers and charter schools. This is primarily because they provide an alternative to public education and often times that is viewed negatively by the current educators in the public school systems. However, parents who are provided with choice with respect to how they get their children educated typically view these alternatives very positively. Vouchers and charter schools were discussed in the context of No Child Left Behind but, in the end, were not included as the bill worked its way through the House and Senate. In communities such as Milwaukee, which has extensive experience with vouchers and charter schools, the results would suggest that other communities should be pursuing these alternatives. In Milwaukee, publicly funded choice schools now serve more than one in ten students in that community. Their experience suggests that parents do want the choice and will take advantage of it if they believe their children have a better alternative with respect to quality education. We strongly urge the Administration to assertively support vouchers and charter schools and encourage the states to allow them to exist and flourish. Recommendation: The Administration should seek to improve the standing of K-12 teachers and the attractiveness of the K-12 teaching profession by encouraging good human resource management practices and entrepreneurship while improving the environment within K-12 public school systems. While the Administration doesn’t have authority over individual public school districts, it needs to take a strong point-of-view on making the K-12 teaching profession far more

24
attractive by encouraging school systems to adopt good practices for the management of their human resources. At the core of any good set of management practices is a disciplined performance appraisal system that clearly isolates the strong performers as well as the weak performers. Those strong performers should get significant salary increases. Great teachers are scarce. When strong teachers—those who excite students and bring an entrepreneurial spirit to the curriculum—are identified, we must actively reward them. This treatment would also send a great message to our students about the teaching profession. Weakly performing teachers should be put on probation and, if things don’t significantly improve, should be removed from the classroom. Significant salary increases for the strong performers requires a review of school funding. The U.S. Department of Education (see Figure 10) has documented that only 52.8% of all K-12 public school funding is for instruction. We are not aware of any business entity where only about 50% of funding is spent on the product and the delivery of it to its customers. Further, international studies (OECD, 2003) show that most other countries spend over 70% of their funding directly on classroom instruction.
Figure 10: Instruction vs. non-instruction expenditures for U.S. school systems
Consequently, school systems should be urged to tackle non-instruction costs and to push-back strongly in regard to any activities that are not directly related to improving student educational excellence. For perspective: if 47.2% of all public schools funding is unrelated to instruction, it should be possible to find three to five percentage points of savings out of those 47 percentage points to do things like financially rewarding top teachers. Squeezing budgets and reallocating funds are done all the time in industry when priorities change.
Summary of Expenditures for U.S. Public Elementary and Secondary Education (1999)
Billions of $’s Percent
Instruction 186.8 52.5 % Non-Instruction 169.1 47.5 % Administration & 92.0 25.8 % Other services Plant Operation 29.4 8.3 % Capital Outlay 39.5 11.1 % Interest on Debt 8.2 2.3 % Total 355.9 100 % Source: National Center for Education Statistics (2002). Digest of Education Statistics. U.S. Department of Education.

25
We note, however, that tackling the budget and squeezing out unproductive spending may involve confronting states or the national government to cut back on their requirements in regard to forms that get filled out and reports that get generated. Maintaining discipline and safety in our K-12 schools is another important measure that will help attract and keep high quality teachers while also benefiting students. Epstein (2003) cites the following fact: Across New York City’s 150 high schools, 12% of the students report that on a frequent or daily basis, they have observed that a teacher or another adult at the school has been injured or threatened by a student. 29% report that on a frequent or daily basis, a student has been injured or threatened by another student. Epstein’s assessment of the safety in the city’s schools is:
State and federal court decisions intended to protect the rights of students, and the schools attempts to comply with the mindless bureaucratic directives used to implement these rulings, have made it all but impossible to expel a student unless a flagrant felony is committed that results in the student’s incarceration. As a result, our halls are filled with students who cut nearly all their classes on a daily basis, whose only contribution to the educational process is to harass other students and make it necessary to maintain a phalanx of security officers at the school.
Finally, in the area of good management practices we would strongly urge the Administration to address the issue of recruiting strong performers into teaching careers. In addition to competitive salaries and better working conditions, financial incentives to pursue teaching—such as loan forgiveness programs—could be implemented.

26
Appendix C: The STEM Workforce and Undergraduate and Graduate Education PCAST thoroughly reviewed the issues of the current state of STEM talent in the U.S., whether there is a shortage or surplus, what other countries are doing, the quality of our STEM training, and what it will take to keep the U.S. in a strong overall leadership position. Our key findings are: Finding: America’s historical position of being the global leader with respect to entrepreneurship and innovation is dependent on a strong STEM talent base that helps drive innovation. Hence, our STEM capabilities need to be aggressively maintained and, given the trends discussed in this report, continuously improving. Key innovations that lead to entire industries are typically very dependent on strong physical science and engineering capabilities. There are many examples. The chemistry behind some of the major drugs that the pharmaceutical industry has generated over the past twenty years is impressive. Their invention is totally dependent on world-class chemists and biologists understanding the new discoveries in the biological and genetic sciences. More generally, the significant new medications that have emerged from the bio-tech industry have caused it to move from presenting a set of hopes and aspirations to a world of numerous billion-dollar-a-year bio-tech drugs. This work is totally dependent upon highly talented bio-tech scientists. Another example is the information technology and communications industry. The development of the microprocessor and the incredible explosion in its capabilities is clearly one of America’s treasures. These are only two examples where engineering and physical sciences advances have produced inventions that have become marketplace successes and often emerge as entire new industries representing significant portions of the American economy. Significant work has been done recently in the area of studying the correlation between the basic math and science skills of the K-12 students of a country and its long term economic health. An example is the work led by Eric Hanushek, a senior fellow at the Hoover Institution at Stanford University. In Hanushek and Kimko (2000) there is an impressive analysis of the long term importance of the technical capabilities of a country. They studied four decades of data and demonstrated a strong statistical relationship between the K-12 math and science test scores of a country and its GDP growth rates. This research, plus common sense, suggests that it is imperative that America be vigilant in maintaining its basic STEM capabilities not only in the highly specialized workforce focused on innovation and entrepreneurship but in its population in general. We know that often it’s not the technical experts that come up with the creative ideas that drive the strong growth of entire industries. It is the entire innovation ecosystem including developers, manufacturers and users that needs a strong STEM base.

27
Finding: While it is difficult to ascertain at any given moment whether there is a shortage or a surplus with respect to STEM talent in the U.S., concern about America’s global share of STEM expertise at the Bachelors Degree level as well as at the Ph.D. level seems warranted. STEM Talent Shortage/Surplus - In PCAST’s efforts to understand whether the U.S. is facing either a shortage or a surplus of STEM talent, we reviewed a significant amount of existing work in this area. Data from the Department of Commerce are the most relevant (Figure 11). They show that projected annual average job openings for persons with engineering and physical sciences skills, as well as biological/agricultural sciences skills, are far exceeded by the number of Bachelors Degree students graduating in those fields.
Figure 11: Degrees granted and job openings projections for scientists and engineers. The projections are based upon data from the period before the “burst” of the Internet bubble and before the emergence of India as a major software center. Consequently, the demand for mathematical/computer science talent is probably higher than it would be if the data were taken today. In Figure 12, the field of engineering is divided into various engineering disciplines, and in all cases except aeronautical the supply of engineers significantly outpaces the projected job openings. In Figure 13, the same kind of breakout is provided for the physical sciences with the demand for physics/astronomy and chemistry talent being far lower than the projected number of degrees being generated each year. On the other hand, with respect to the earth, atmospheric, and oceanographic fields, a fairly good balance between job openings and degrees generated is shown.
Degree Production Exceeds Job Openings in Engineering, Physical Sciences, and Biological Sciences, but Not Math/Computer Sciences
Dept. of Commerce 2000-2010 Projections Annual Degrees and Job Openings
PhD Masters Bachelors Job Openings
Engineering 5,500 25,800 57,900 41,000 Physical Sciences 5,000 5,100 17,900 13,700 Biological/Agricultural 6,600 10,500 84,200 10,300 Sciences Computer Sciences/ 2,600 16,800 49,500 225,000 Math Source: John F. Sargent (2003). U.S. Dept. of Commerce, Office of Technology Policy. Unpublished analysis of Bureau of Labor Statistics 2000-2010 occupational projections.

28
Figure 12: Engineering degrees granted and job openings projections
Figure 13: Physical sciences degrees granted and job openings projections
Obviously, one could conclude from this Department of Commerce analysis that concern over any kind of shortage with respect to STEM talent is uncalled for. Another way to think about this question of whether there is a shortage or an over-supply of STEM talent is to look at average salary increases for these various disciplines and
Engineering: Degrees and Projected Job Openings Dept. of Commerce 2000-2010 Projections
Annual Degrees and Job Openings Engineering Specialty PhD Masters Bachelors Job Openings Aeronautical 220 580 1,300 2,300 Chemical 730 1,400 6,200 720 Civil 550 4,100 9,600 6,000 Electrical 1,500 8,300 17,800 10,700 Industrial 200 3,000 3,900 3,300 Mechanical 800 3,500 13,200 9,400 Metallurgy 400 700 900 800 Source: John F. Sargent (2003). U.S. Dept. of Commerce, Office of Technology Policy. Unpublished analysis of Bureau of Labor Statistics 2000-2010 occupational projections.
Physical Sciences: Degrees and Projected Job Openings
Dept. of Commerce 2000-2010 Projections Annual Degrees and Job Openings
Physical Science Specialty PhD Masters Bachelors Job Openings Physics and 1,400 1,300 3,400 400 Astronomy Chemistry 2,000 1,800 10,400 4,200 Earth, Atmospheric & Oceanographic 700 1,400 4,100 5,200 Source: John F. Sargent (2003). U.S. Dept. of Commerce, Office of Technology Policy. Unpublished analysis of Bureau of Labor Statistics 2000-2010 occupational projections.

29
compare them to other disciplines. Figure 14 presents data from the U.S. Department of Labor showing annual average salary increases during the period of 1995 to the year 2000. Compared to the average salary increase of all workers, 3.75%, most engineering salary increases are at about the same level or below. The exception here is aerospace engineers who saw more significant increases and reflects the data in Figure 12 where the supply of aeronautical engineers is projected to be less than the job opportunities.
Figure 14: Salary growth for scientists and engineers 1995-2000
Concerning science, the increases are about equal to all workers or slightly below. Increases for computer programmers were significantly higher than all workers but again, this reflects the environment before the burst of the Internet bubble and the India phenomenon. Figure 15 provides a chart comparing salary progress for engineers to that for several low-tech occupations. The service occupations shown far outpace the average increase of 3.75% for all workers, but not the engineers. A natural conclusion from the totality of this data is that during the last five years, there certainly has not been a shortage of STEM talent. If there were a shortage, we would have most likely seen increases in salaries that outpaced the average for all workers. This conclusion is supported by Butz et al. (2003). Their conclusion after working this subject is that “neither earnings patterns nor unemployment patterns indicate a science and engineering shortage in the data we are able to find.”
No Rapid Wage Growth for Scientists and Engineers 1995-2000 Average Annual Salary Increases
Average Salary Increase
All Workers 3.75 % Engineers Aerospace 5.40 % Mechanical 4.00 % Civil 3.90 % Electrical 3.70 % Chemical 2.60 % Industrial 2.20 % Scientists Chemists 3.70 % Biologists 2.30 % Computer Systems Analyst 2.90 % Computer Programmer 4.90 %
Source: John F. Sargent (2003). U.S. Dept. of Commerce, Office of Technology Policy. Unpublished analysis of U.S. Dept. of Labor Current Population Survey data.

30
There are organizations that are more optimistic about the future demand with respect to STEM careers. Data in Figure 16 from the Council of Competitiveness suggests that over the period from 1998 to 2008 jobs requiring technical skills are projected to grow by 51%. Figure 16 shows a break out of various disciplines and provides projections for job growth. Again, these data were published prior to the burst of the internet bubble and the emergence of India as a major software center and hence, their highest growth area of “computer, mathematical and operations research” is most probably over-stated versus what that projection would be today.
Figure 15: 1995-2000 salary increases for various occupations
Figure 16: Projected growth for jobs requiring technical skills 1998 - 2008
Various Low-Tech Occupations Have Enjoyed Faster Salary Growth than Engineers
1995-2000 Average Annual Salary Increases Average Salary Increase
Engineers 3.9 % Clergy 7.2 % Carpet Installers 7.7 % Painter/Sculptors 8.2 % Photographers 8.4 % Hairstylists/Cosmetologists 11.8 %
Source: John F. Sargent (2003). U.S. Dept. of Commerce, Office of Technology Policy. Unpublished analysis of U.S. Dept. of Labor Current Population Survey data.
Jobs Requiring Technical Skills are Projected to Grow by 51% Projected New Job Growth 1998 to 2008
Percent of Job Growth
Computer/Math/Operations Research 92 % Engineering & Science Managers 43 % Medical & Health Service Managers 33 % Life Scientists 26 % Health Technicians 25 % Medical Professionals 22 % Engineers 20 % Physical Scientists 13 % Engineering & Science Technicians 12 %
Source: Council on Competitiveness, “U.S. Competitiveness 2001”
31
Michael Teitelbaum (2003), a program director at the Alfred P. Sloan Foundation, provides a good overall summary of this broad topic. After studying the STEM shortage/surplus issue thoroughly, Teitelbaum concludes, “suffice it to say that there’s no credible quantitative evidence of such shortages. All available evidence suggests that overall labor markets for scientists and engineers are relatively slack, with considerable variation by field and over time.” Probably Teitelbaum’s most important conclusion is as follows: “labor market projections that go very far into the future are notoriously problematic: no one can know what the U.S. economy and its science and technology sector will look like in 2012. Certainly there are no credible projections of future “shortages” on which sensible policy responses might be based.” In summary, modest changes in basic assumptions about the economy and the workforce can enable prognosticators to craft either a scenario that shows an over-supply or a projection that shows a shortage. Hence, PCAST believes that this subject of whether there is a shortage or surplus is not worthy of additional extensive analysis or debate. We do note that a background in STEM studies seems to prepare graduates for a wide variety of jobs and, thus, suggest that any study of this subject has flaws similar to those one would encounter if trying to suggest that all history majors were planning to be directly employed as historians or history teachers. Consequently, PCAST believes it is far more important to look at the basic skill levels in the STEM areas within the U.S. as a whole and to look at the basic industrial structure that uses those talents, and try to pull together a factually based set of recommendations in regard to improving the overall competitiveness of the country. As noted earlier, over half of the Fortune 100 CEOs have STEM backgrounds; we believe that a STEM background can be of great value in many professions from our small business leaders to employees of the Fortune 100. STEM Talent Outside the U.S. - The extent to which China, South Korea, Taiwan and Japan are educating engineers is truly eye-opening. As seen in Figure 5 (on page 7), among citizens age 24 in 2001, China has over three times as many engineers as the United States. Importantly, 39% of their BS/BA degrees in that country were in engineering. In the U.S., only 5 % of our BS/BA degrees were in engineering. We also know that similar trends exist in India, with particular emphasis on computer science, but were unable to obtain specific data. Figure 6 (on page 8) shows a recent decline in the generation of Ph.D. degrees in natural science and engineering among U.S. citizens. The peak occurred in 1997 when nearly 11,000 such degrees were granted; by 2001, it had declined to 10,206. On the other hand, the number of Asian citizens obtaining Ph.D. degrees in natural science and engineering is significantly increasing. The data in Figure 6 show a three-fold increase between 1987 and 2001 in these degrees granted to Asian citizens in Asian universities alone. Additionally, approximately 2/3 of the non-U.S. citizens who obtain their doctoral degrees in U.S. universities are Asian citizens.

32
NSF’s survey of earned doctorates (NSF, 2002b) points out that the total number of Ph.D. degrees awarded to non-U.S. citizens by U.S. universities in all science and engineering fields has dropped approximately 15% since 1996 (10,795 students in 1996 versus 9,176 students in 2001). For non-U.S. citizens from Asia, the total Ph.D. degrees awarded by U.S. universities in all science and engineering fields have dropped 25% since 1996 (6,885 students in 1996 versus 5,129 students in 2001). These data clearly demonstrate that the Asian population is becoming the dominant factor with respect to skills in the fields of physical science and engineering. Importantly, they are becoming less and less dependent on U.S. universities for their training. One expert who studies this subject closely, Dr. R.E. Smalley of Rice University, claims that his analysis shows that by 2010, if current trends continue, over 90% of all Ph.D. physical scientists and engineers in the world will be Asians working in Asia. This would represent a tremendous transition that could only be viewed as a large risk to U.S preeminence in science and technology. Concerning the pursuit of a STEM Ph.D. at a U.S. university, Figure 4 (on page 7) points to a sobering situation. The average time from Bachelors Degree to a Ph.D. in the life sciences has increased by almost two full years since 1970. Professional associations in several other scientific fields informally confirm similar data. If, as is likely, the variance in time to degree has increased along with the mean, then prospective life scientists face not only more years out of the labor market but also more uncertainty about the number of years to obtain their degree. All this might not matter so much if the brightest young people lacked alternative training and career paths. But, consider the path to the MD, DD, DVM, JD, and MBA. The number of years to degree has stayed absolutely constant in these programs for decades, and the prospects for successful completion, once begun, remain high. Has the amount and complexity of material to be mastered expanded so much more in biology or physics than in medicine, law, or finance? That would seem hard to argue. Bright young women and underrepresented minorities (African American, Hispanic, and Native American) are also not being attracted into STEM fields and careers. “Women, underrepresented minorities, and persons with disabilities comprise more than two-thirds of the U.S. workforce, but hold only about one-quarter of the science, engineering and technology jobs that underpin U.S. economic strength. This narrow base has left America with an ‘underrepresented majority’ in the very fields upon which the country’s prosperity, security and quality of life hinge” (BEST, 2004, p. 3). Women and underrepresented minorities are not being attracted into STEM fields in numbers adequate to address this imbalance. Women have similar high school graduation rates to men, but remain far less likely to major in science or engineering disciplines in college (CAWMSET, 2000). Although underrepresented minority students are nearly 25% of the population, they are only 5 to 10% of advanced placement (AP) test-takers in computer science, calculus, physics, chemistry, and biology (CAWMSET, 2000).

33
African-Americans, Hispanics, and Native Americans are as likely as whites to major in S&E at the Bachelors Degree level, but they remain less likely to graduate from high school, enroll in college, and graduate with a Bachelors Degree. While the proportion of women earning Bachelors Degrees in S&E doubled from 1966 to 2000, the proportion remains significantly lower than that of women earning Bachelors Degrees in non-scientific areas. Women also remain underrepresented in the total S&E workforce. Minorities earn only one-tenth as many S&E doctoral degrees as their white counterparts, a shortfall that remains a concern (CEOSE, 2002). The reason for the emphasis on the Ph.D. in the physical sciences and engineering is that the foundation for entire new industries often has its basis in the physical sciences or engineering. Consequently, in thinking about the long term viability of America from the standpoint of innovation, knowledge of which countries have access to the dominant share of key (i.e., Ph.D.) science and engineering talent is very important. Finding: Foreign countries producing large numbers of STEM graduates from their own colleges/universities typically have low wages that are attracting commerce and creating large numbers of STEM related jobs. These countries are also attracting large investments in R&D, especially in the high-tech sector. The engineering degree data discussed earlier from Figure 5 (page 7) becomes very significant when considered in combination with the very low wages of some Asian countries coupled with their large and growing production of STEM talent. It enables technology based companies to shift their operations to these countries and take advantage of the efficient talent pool. Concerning wages, as seen in Figure 17, in a country such as India the direct cost of STEM talent is 1/8 to 1/10 of that in the United States. Because of these trends, Forrester Research, a company that does a fair amount of analysis of key demographic trends in the technology sector, forecasts that 3,300,000 jobs will move overseas in the 12 year period from 2003 to 2014. The Forrester Research forecast was summarized in Thottam (2003). In the same article, U.S. financial services firms were cited as forecasting the movement of 500,000 jobs overseas in the period from 2003 to 2007, primarily to India.

34
Outsourcing to India Lowers Cost Annual Wages U.S. India
Software Programmer $66,100 $5,900 Mechanical Engineer $56,600 $5,900 IT Manger $55,000 $8,500 Accountant $41,000 $5,000
Source: Thottam, J. (2003, August 4) Where the Good Jobs are Going. Time Magazine.
Figure 17: Comparison of annual wages in U.S. and India for technical jobs
Articles have appeared in numerous weekly periodicals citing developments such as Massachusetts General Hospital outsourcing its radiology work to Wipro Limited in Bangalore, India (Engardio, Bernstein, & Kripalani, 2003). Other periodicals cite JP Morgan Chase outsourcing stock research analysis activities to a firm in Bombay (Thottam, 2003). These U.S. firms are simply taking advantage of the incredibly low costs of these technical capabilities. The big change here is that now these countries are developing significant quantities of technical specialists which, in combination with the low salaries, make it imperative that global companies move activities to these countries in order to keep their costs competitive. Asian countries are also beginning to get aggressive with respect to attracting R&D investment and participating in the high-tech industry. For example, from 1994 to 2000 U.S. companies increased their R&D spending in China from $7 million to $506 million (Moris, 2004). Concerning the global high technology market, China had a 1% share of that market in 1980 and today has an 8.7% share. South Korea moved from a 1% global share in 1980 to a share of 7.1% in 2001 (Global Insight, 2003). In global high technology exports; from 1980 to 2001, the U.S. share of these exports decreased from 29.9% of total exports in 1980 to 17.3% in 2001. Asia’s share (without Japan) increased from 7.4% in 1980 to 27.4% in 2001 (Global Insight, 2003). Asian countries are also becoming a larger holder of U.S. patents. While the percentage of foreign owned U.S. patents has remained relatively constant from 1988 to 2001 (44 % to 48%), the percentage of U.S. patents held by Asian based companies (not including Japan) has increased from 1.7% of total U.S. patents in 1988 to 12.3% in 2001. (U.S. Patent and Trademark Office, special tabulation).

35
These data and anecdotes show the globalization of technology and commitments of foreign governments to play a major role in the technology economy. New markets and new innovations present both opportunities and risks for America. While gross job losses gain media attention and economists can point to net overall benefits, focusing on the job flows that will result from these developments misses the point of this report. Our concern is leadership. America has been the innovation leader; but is confronting increased and highly effective competition on multiple fronts. We must look at how we maintain that leadership and create the jobs that come with that leadership. If key disciplines develop overseas and future technology innovation occurs elsewhere, America’s ability to generate the next set of new industries that will create high paying jobs and economic successes for American companies globally will be under severe stress if not decline. Foreign competition is here to stay but so are foreign markets for American suppliers if we have the innovation ecosystem to take advantage of the opportunities presented by the global market expansion for technology products. Competition in many fields is rising – semiconductor development, software, a number of service professions, biotechnology, the fruits of nanotechnology to name a few. Innovation opportunities exist in each of these and many other areas, but our ecosystem must be attended to if we are to continue our global leadership. And as the foundational element, maintaining and indeed improving America’s STEM skills is a national imperative. PCAST developed four key recommendations focusing on undergraduate and graduate education and the STEM workforce. These recommendations are elaborated below: Recommendation: Government agencies and universities should focus together on increasing the overall number and the retention rate of students pursuing STEM careers. The Administration should assess and propagate best practices for recruitment and retention. Emphasis should be place on addressing the various needs, interests, and motivations of the full complement of an increasingly diverse U.S. population. Figure 3 (page 6) showed the drop off in interest on the part of college students between the time they enter college with an interest in science to the point where they are actually getting a bachelors degree. Stephen Merrill, the Executive Director of Science, Technology, and Economic Policy at the National Academies told PCAST that his data show that about one half of students intending to major in science and engineering drop out of the science and engineering pipeline after their freshman year of college. In other words, the number of graduating scientists and engineers would double if this singular problem were corrected. In a similar study, Seymour and Hewitt (1997) have shown that the reason for freshman dropout is not student quality (students who stayed and left had equal ability) but instruction quality. Their research shows that the vast majority of students leaving science and engineering in the freshman year left because of adverse reaction to the poor quality of the introductory

36
courses they were required to take. Correcting this problem requires changing not only what is taught in the freshman year (curriculum), but also how it is taught (pedagogy). Increasing the retention of U.S. women and minorities in STEM studies would also significantly improve the situation. The Congressional Commission on the Advancement of Women and Minorities in Science (CAWMSET, 2000) concluded that “if women, underrepresented minorities, and persons with disabilities were represented in the U.S. science, engineering, and technology (SET) workforce in parity with their percentages in the total workforce population, this shortage could largely be ameliorated” (p. 1). Government agencies should urge universities to focus on these issues, become knowledgeable about best practices and demand improvement in this particular parameter. Specifically, the goal is to dramatically increase the percentage of freshman undergraduates who show interest in STEM areas that eventually graduate with STEM degrees. Universities could increase their batting average in these areas by involving undergraduates in projects funded by government grants, by encouraging professors to make freshman and sophomores aware of the possibilities and to involve juniors and seniors on their research projects, and by following the recommendations of the panels looking specifically at ways to increase the involvement of women and minorities in STEM fields. Those departments of the government that are providing STEM related funding to universities should develop a process whereby these expectations can be built into the review process as universities apply for the continuation of the funding. The government departments need to develop this process in a way that minimizes possible “gaming” and is viewed positively by the universities. Educating professors who teach introductory courses as well as upper level courses about what science and engineering students actually do in industry would be very beneficial. One idea that we encountered during our study was to encourage professional societies that are focused on science and engineering to come forward with materials that can be useful to professors in increasing their knowledge of real world post-graduation job situations. Also, it would be valuable for these professional associations to publish data on colleges and universities in regard to their retention rates for students who show initial interest in science and engineering. As one of our sub-committee members stated, “We need to eliminate the mentality of weeding out students and replace it with the mentality of retaining students who have some STEM interest.” Hopefully, “keeping score” and providing materials on what these students can do when they graduate would be a step in that direction. Recommendation: The Administration should be an advocate for the professional science Masters Degree concept as an alternative for students interested in STEM areas but not interested in the lengthy time it takes to get a Ph.D..

37
Figure 4 (page 7) showed that getting a Ph.D. degree in areas of science today can take over seven years from the completion of a Bachelors Degree. Importantly, those fresh Ph.D.’s then face 2-5 years of post doctoral status, which has become a virtual requirement for career initiation in a majority of technical areas. In career terms, this implies that most young scientists are now unable to initiate their careers as full fledged professionals until they are in their early 30’s. A student who is an undergraduate and looking at these time commitments is often discouraged. We would strongly urge the Administration to begin to encourage universities to offer professional science Masters Degrees. This degree integrates science and mathematics with training in business, law, and other professional domains. It embeds scientific knowledge in business management, high technology services, and law. It significantly expands career opportunities for science and math students. There is evidence for the need for such a degree. The concept of professional science Masters Degree was launched in 1997 through the help of the Sloan Foundation and the Council on Competitiveness. Today, because of the concept’s popularity, such a degree is available at 45 universities. Offering this type of Masters Degree could mean the difference between an undergraduate student leaving the study of science or staying with it, realizing that spending four years as an undergraduate then two years to get a Masters Degree in this new professional science area could be of high interest. Today, at most universities, when undergraduates look at career paths for a professional scientist they see the lengthy time requirement for a Ph.D. and are discouraged from having any involvement with STEM study. Recommendation: Universities should reduce the time to a Ph.D. degree and come up with alternatives to the present mode of operation. The Administration must be aggressively committed to helping reduce the time to degree. Several times in this report we referenced Figure 4 (page 7), which shows the unattractively long time to get a Ph.D. in a scientific field. We would urge the Administration to ask government departments that provide science and engineering funding to key universities to begin to measure the average time it takes to get a Ph.D. at our universities and to begin to work that measure into the issue of continuing government support at those universities. One way to pursue improvement in this area is to have the government funding organizations come up with positive financial incentives for universities to shorten the time to achieve a Ph.D.. Recommendation: We strongly support the recommendation in “Assessing the U.S. R&D Investment” (PCAST, 2002) which calls for the establishment of a major program of fellowships to attract and support the advanced graduate studies of U.S. citizens in fields of science and engineering that support critical national needs. Also, the Administration needs to investigate how best to retain non-U.S. citizens in the U.S. upon receiving their Ph.D. degree in STEM areas from a U.S. university.

38
Fellowships for U.S. Citizens - Over the past 20 years, cited data show a decline of U.S. graduate students in STEM areas, but this decrease has been neutralized by the increased influx of foreign students into these areas. Currently, we are faced with an over-dependence on this non-U.S. citizen talent pool and we are now seeing that these foreign born STEM PhD graduates are facing a more and more attractive environment “back home.” This puts America in a seriously vulnerable situation. We recommend an intensive effort to increase the number of U.S. citizens, including women and underrepresented minorities, interested in the STEM fields and to motivate them to achieve a PhD in STEM areas. Increased government support via a very large number of fellowships beginning with the bachelor’s level of study in STEM areas for U.S. students should be pursued. The promise of a fellowship (opening the promise of a college degree) if pursuing a STEM course of study will change the motivation of students at the high school level, encourage parents to motivate students toward STEM and produce incentives for high schools to provide effective preparation for college admission so their students can gain such fellowships. Non-U.S. Citizens – Today, our universities are the primary source of basic research. America’s universities are also responsible for educating the next generation of scientists, engineers, managers, entrepreneurs, doctors, and leaders. For many decades, our U.S. universities have attracted the world’s best minds in science, engineering, and technology. America is now utterly dependent on the continued enthusiasm of non-U.S. citizens coming to the U.S. for education, research opportunities and professional careers. Clearly stated, foreign students and scholars are critical to our national vitality. Considering this importance of non-U.S. citizens to our innovation ecosystem, there are two significant changes that are quite worrisome and led to this final recommendation:
1. Figure 6 (page 8) showed data which led Professor Smalley of Rice University to forecast that by the year 2010, over 90% of all physical scientists and engineers in the world would be Asians working in Asia. Even if he is only half right, that is an alarming statement. The United States badly needs to retain as many STEM doctorate holders as is possible and recent data from the 2000 U.S. Census shows that 38 % of doctorate holders residing in the U.S. are foreign born.
2. There are clear signs that security concerns, driven by the disastrous events of September 11, 2001, may lead to unworkable and counterproductive policies and controls. The number of foreign scholars denied access to the U.S. is growing. Some foreign students who are enrolled in U.S. universities and travel abroad are being denied reentry. There are reports of foreign students being afraid to attend international scientific meetings, and of foreign scholars being unable to obtain visas in a timely manner to attend classes or meetings in the U.S.
The two key policy changes that are creating complications for students and scholars are as follows: First, there is a dramatic increase in the number of applicants whose materials are sent by embassies and consulates to the FBI for special security checks. Second, there is a new congressionally mandated requirement that over 90 % of all applicants must be personally interviewed. The results are that major universities are reporting a 40%

39
increase in visa delays for new students compared to last year, with most of these being for graduate students. We urge the Administration to establish a policy of retaining non-U.S. citizens in the U.S. upon receiving their Ph.D. degree in STEM areas from a U.S. university. This policy must lead to both a secure and open environment in our universities. The openness of our campuses to students, scholars, and faculty from all over the world is one of our greatest strengths, and is at the heart of the phenomenal success of the American research university. Indeed, scientific progress itself depends on open, international dialogue, publication of data, and repetition and verification of research results. But, having made this recommendation, we also surely understand that the Administration also has a responsibility to apply its talents and expertise to keep the Nation and the world secure.

40
Members of the President's Council of Advisors on Science and Technology John H. Marburger, III – Co-Chair
Director Office of Science Technology Policy
Charles J. Arntzen Director, Arizona Biomedical Institute &
The Florence Ely Nelson Presidential Chair, Department of Plant Biology
Arizona State University
Norman R. Augustine Former Chairman and CEO
Lockheed Martin Corporation
Carol Bartz Chairman of the Board, President, and CEO
Autodesk, Inc.
M. Kathleen Behrens Managing Director
RS Investments
Erich Bloch Corporate R&D Management Consultant
The Washington Advisory Group
Stephen B. Burke President
Comcast Cable Communications
G. Wayne Clough President
Georgia Institute of Technology
Michael S. Dell Chairman and CEO
Dell Computer Corporation
Raul J. Fernandez CEO
Dimension Data of North America
Marye Anne Fox Chancellor
North Carolina State University
Martha Gilliland Chancellor
University of Missouri-Kansas City
E. Floyd Kvamme – Co-Chair Partner
Kleiner Perkins Caufield & Byers
Ralph Gomory President
Alfred P. Sloan Foundation
Bernadine Healy Medical Senior Writer & Columnist
US News and World Report Retired President and CEO, American Red
Cross
Robert J. Herbold Retired Chief Operating Officer
Microsoft Corporation
Bobbie Kilberg President
Northern Virginia Technology Council
Walter E. Massey President
Morehouse College
Gordon E. Moore Chairman Emeritus Intel Corporation
E. Kenneth Nwabueze CEO
SageMetrics
Steven G. Papermaster Chairman
Powershift Ventures
Luis M. Proenza President
University of Akron
George Scalise President
Semiconductor Industry Association
Charles M. Vest President
Massachusetts Institute of Technology