Embed Size (px)
DESCRIPTION
Washington Coalition on Medicaid Outreach (WCOMO ) Meeting September 2014. Don Albright Associate Director of Call Center Operations. Call Center Operational Overview. Preparing for Enrollment Capacity Planning Assumptions Staffing Planning Facilities Planning What actually happened - PowerPoint PPT Presentation
Citation preview
Washington Health Benefit Exchange
Washington Coalition on Medicaid Outreach (WCOMO) Meeting
September 2014
Don AlbrightAssociate Director of Call Center Operations
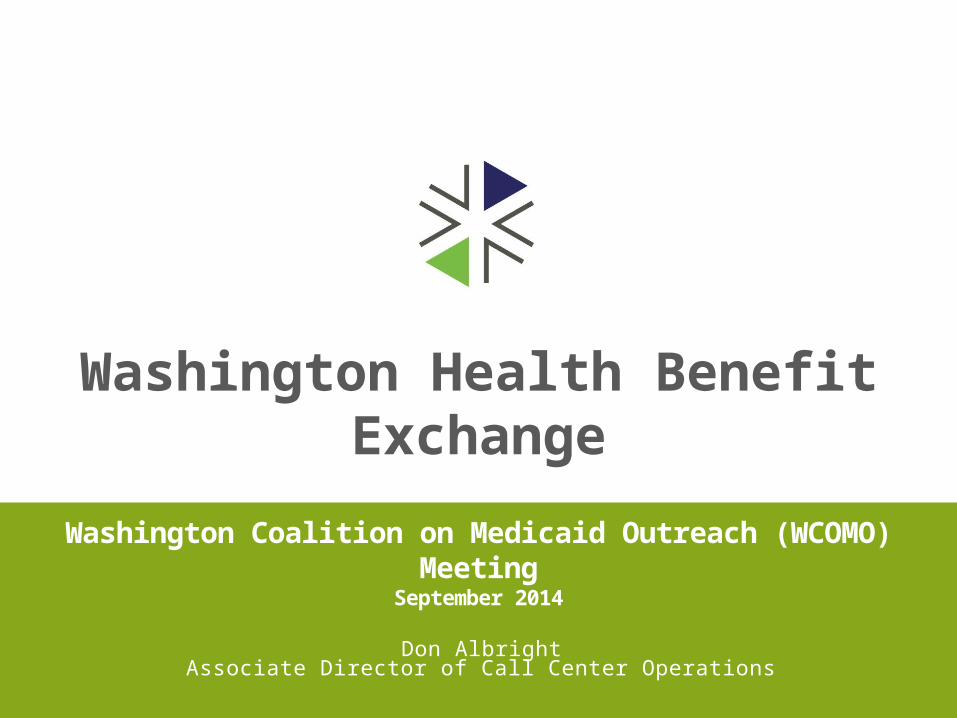
Call Center Operational Overview
Preparing for Enrollment
• Capacity Planning Assumptions
• Staffing Planning
• Facilities Planning
• What actually happened
• Lessons learned
• Differences to expect in November
2
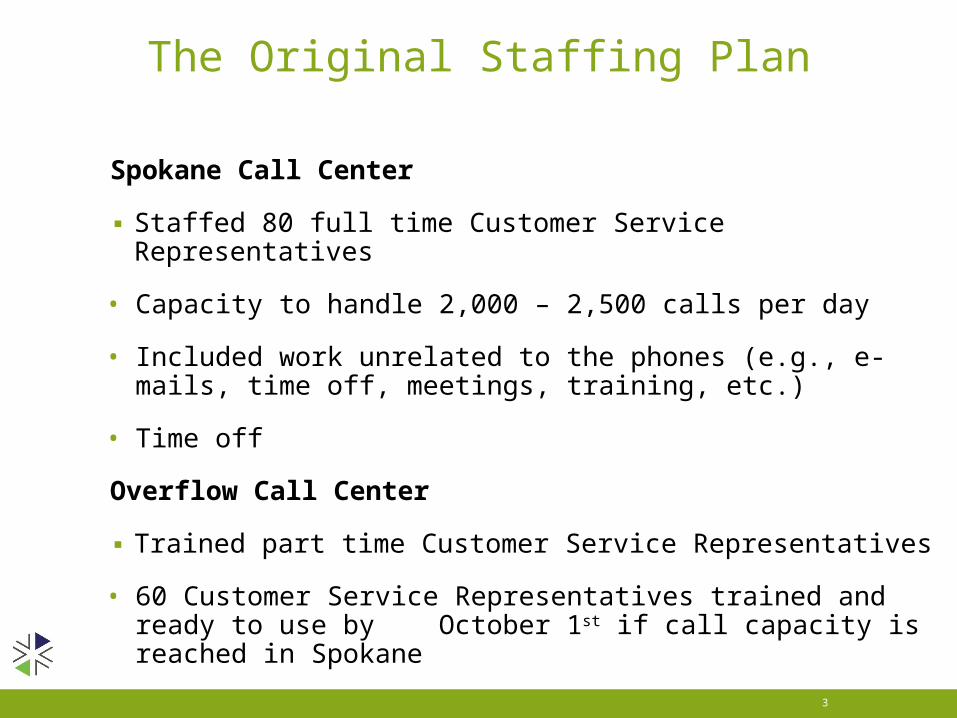
Spokane Call Center
▪ Staffed 80 full time Customer Service Representatives
• Capacity to handle 2,000 – 2,500 calls per day
• Included work unrelated to the phones (e.g., e-mails, time off, meetings, training, etc.)
• Time off
Overflow Call Center
▪ Trained part time Customer Service Representatives
• 60 Customer Service Representatives trained and ready to use by October 1st if call capacity is reached in Spokane
3
The Original Staffing Plan
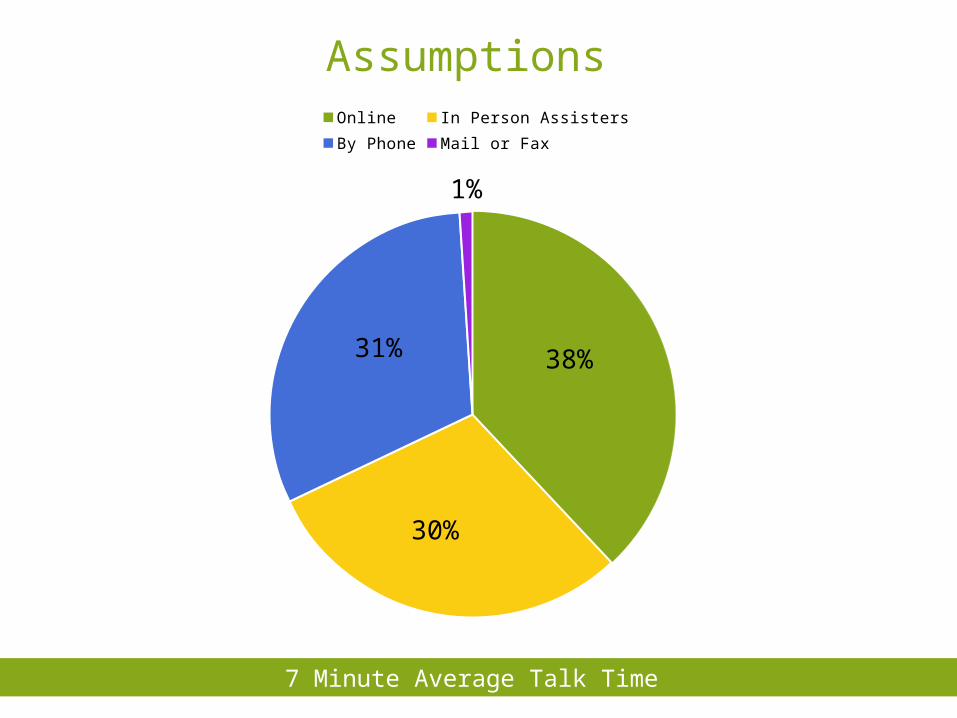
Assumptions
38%
30%
31%
1%Online In Person Assisters By Phone Mail or Fax
7 minute average talk time7 Minute Average Talk Time
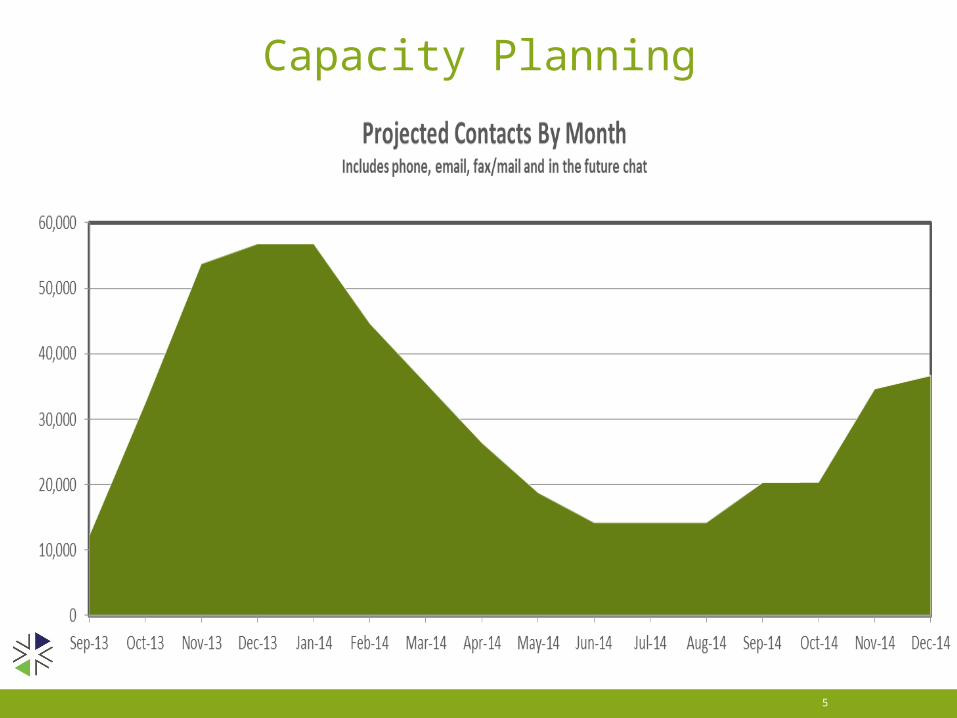
Capacity Planning
5
• Design of the Interactive Voice Response (IVR) allows us to separate the less complex calls from the rest.
• Allows training to be broken down to train new staff focused only on the less complex calls.
• Have the ability to rapidly deploy new staff if there was an immediate need.
6
Contingency Plans
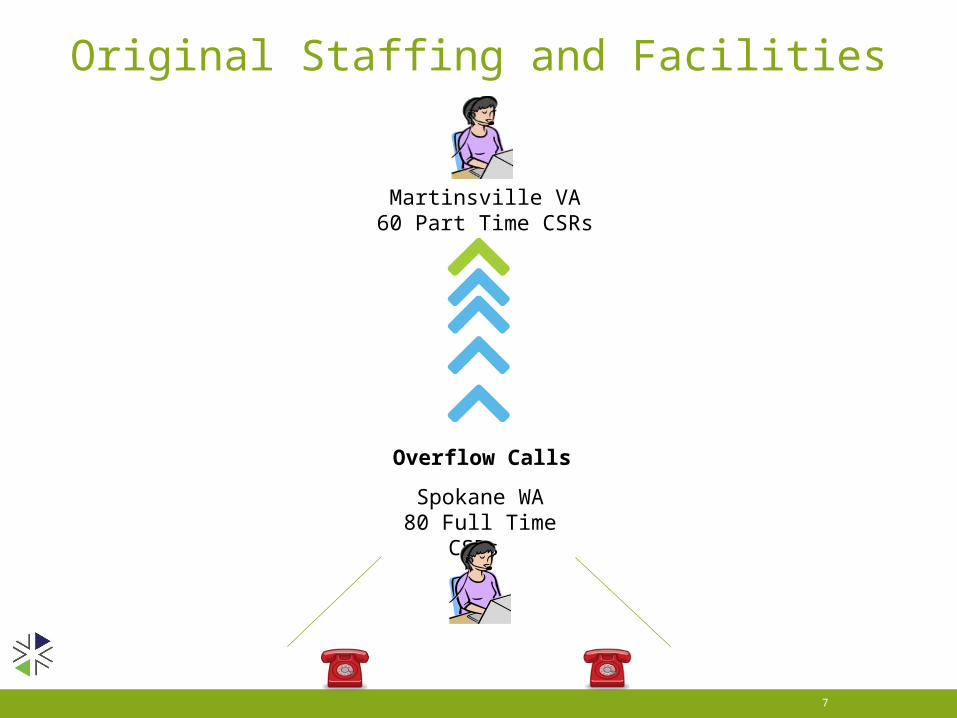
Original Staffing and Facilities
7
Spokane WA80 Full Time CSRs
Martinsville VA60 Part Time CSRs
Overflow Calls
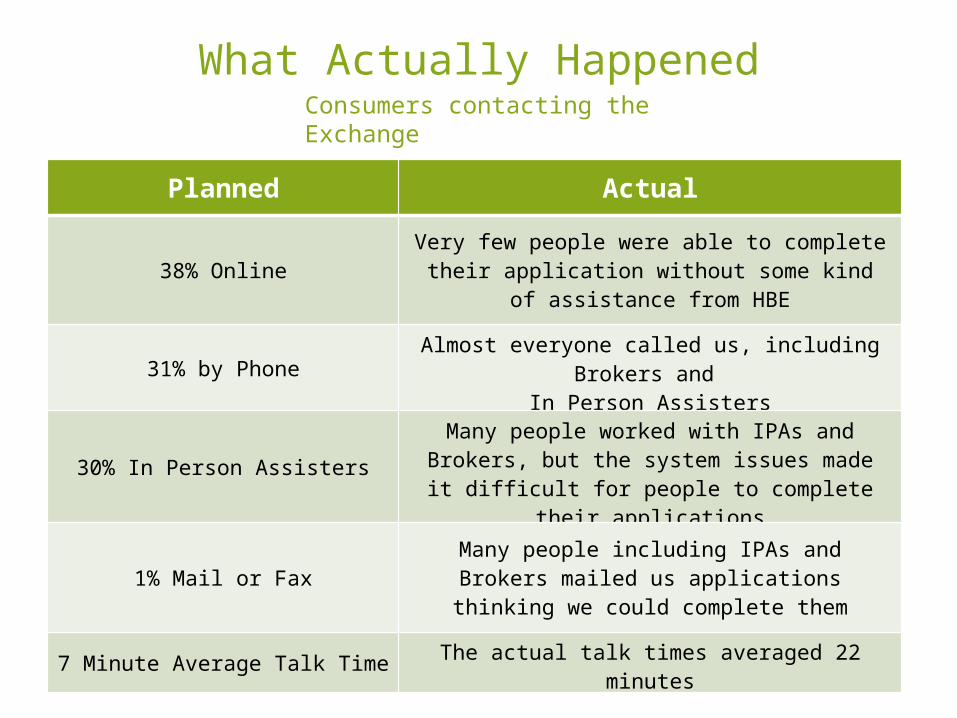
Consumers contacting the Exchange
Planned Actual
38% Online Very few people were able to complete their application without some kind of assistance from HBE
31% by Phone Almost everyone called us, including Brokers and In Person Assisters
30% In Person AssistersMany people worked with IPAs and Brokers, but the
system issues made it difficult for people to complete their applications
1% Mail or Fax Many people including IPAs and Brokers mailed us applications thinking we could complete them
7 Minute Average Talk Time The actual talk times averaged 22 minutes
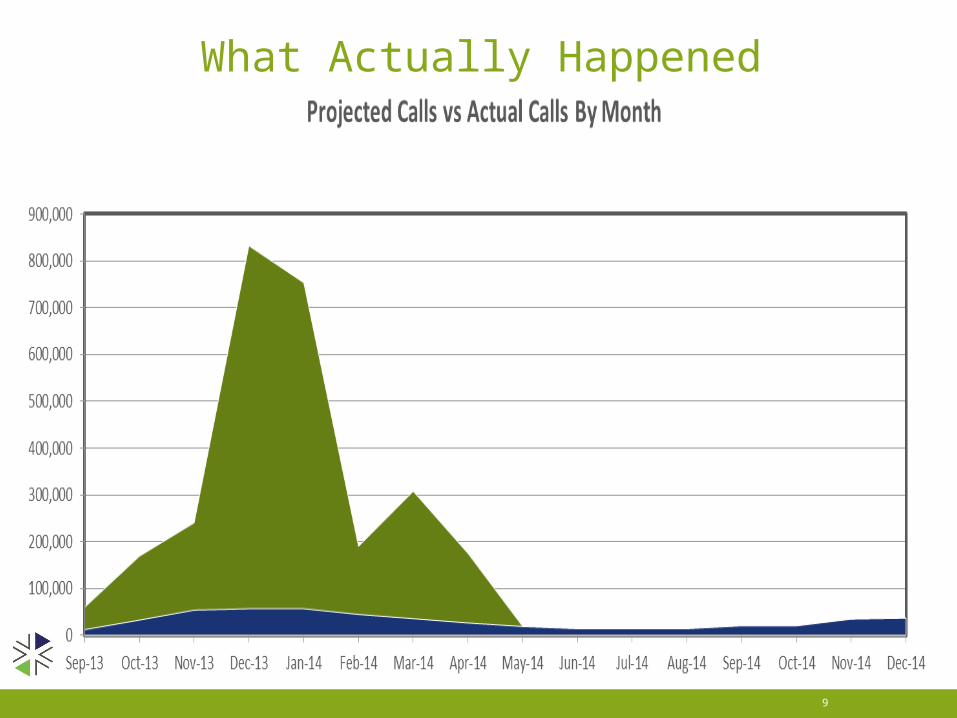
What Actually Happened
9
What Actually Happened
10
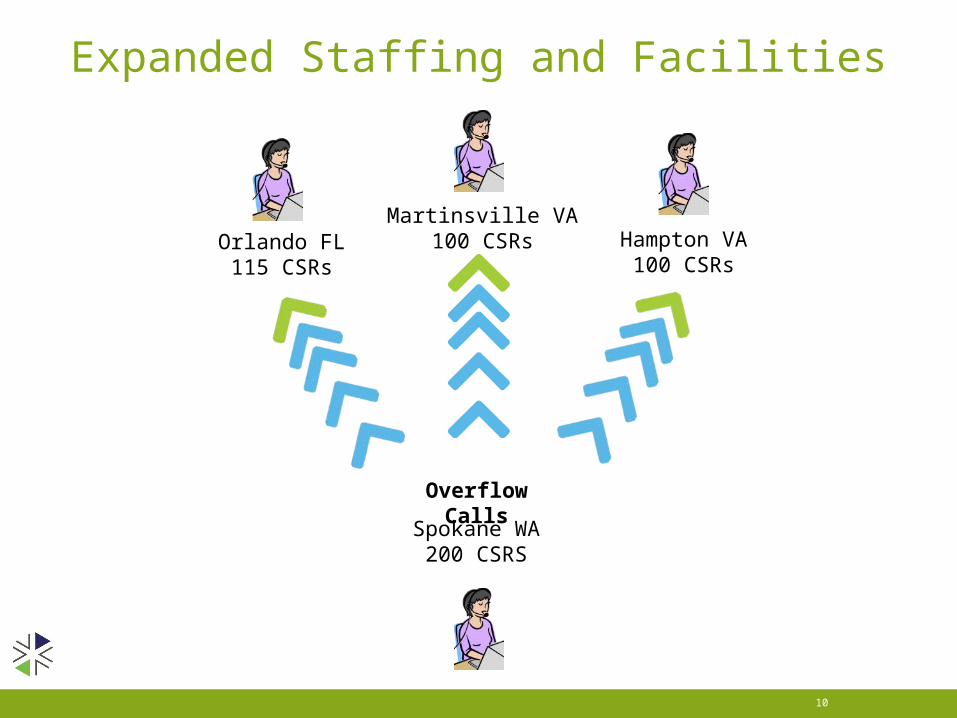
Expanded Staffing and Facilities
Orlando FL115 CSRs
Martinsville VA100 CSRs Hampton VA
100 CSRs
Spokane WA 200 CSRS
Overflow Calls
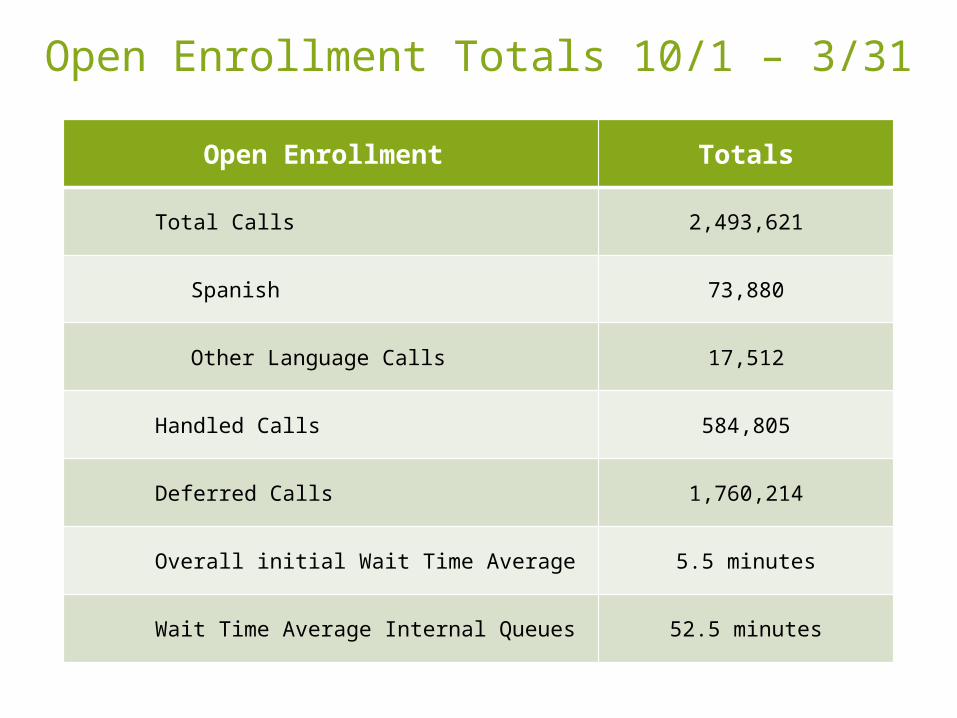
Open Enrollment Totals
Total Calls 2,493,621
Spanish 73,880
Other Language Calls 17,512
Handled Calls 584,805
Deferred Calls 1,760,214
Overall initial Wait Time Average 5.5 minutes
Wait Time Average Internal Queues 52.5 minutes
Open Enrollment Totals 10/1 – 3/31
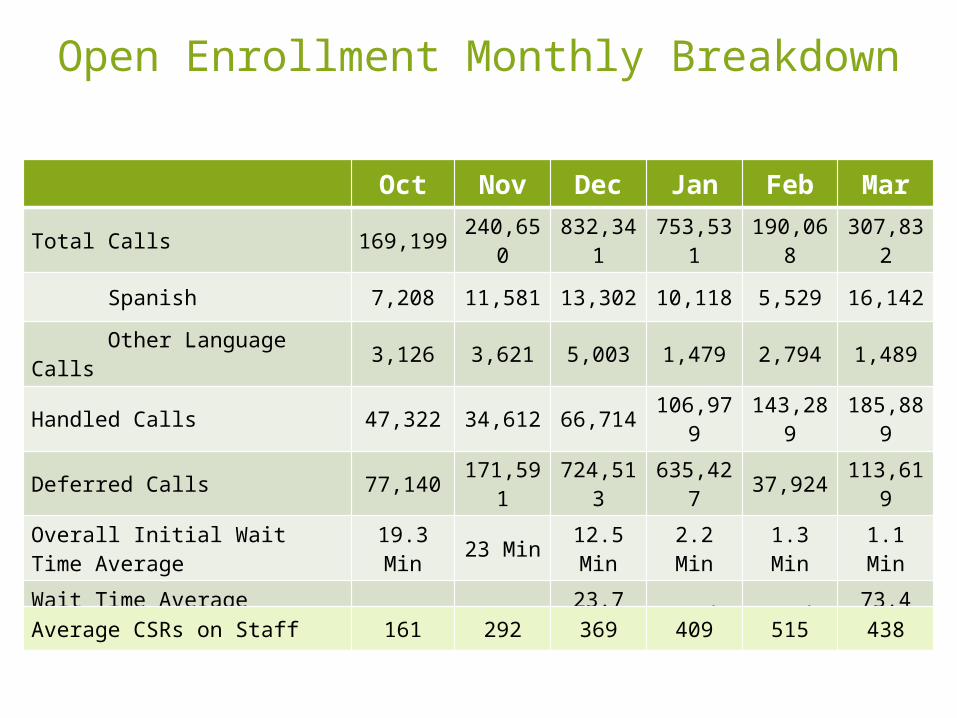
Oct Nov Dec Jan Feb Mar
Total Calls 169,199 240,650 832,341 753,531 190,068 307,832
Spanish 7,208 11,581 13,302 10,118 5,529 16,142
Other Language Calls 3,126 3,621 5,003 1,479 2,794 1,489
Handled Calls 47,322 34,612 66,714 106,979 143,289 185,889
Deferred Calls 77,140 171,591 724,513 635,427 37,924 113,619
Overall Initial Wait Time Average 19.3 Min 23 Min 12.5 Min 2.2 Min 1.3 Min 1.1 Min
Wait Time Average Internal Queues N/A N/A 23.7 Min 40 Min 49 Min 73.4 Min
Average CSRs on Staff 161 292 369 409 515 438
Open Enrollment Monthly Breakdown
Consider possibility of system issues that would drive more people to the call center
Create contingency plans to include extra high volume scenarios
Consider a larger facility with growth space
Over estimate the amount of question calls
▪ Build out network
13
Lessons Learned
▪ Reduce talk times
▪ Ensure there are enough circuits
▪ Offer call back on all calls
▪ Train ramp up staff on all work queues
14
Differences to Expect in November

Questions?