Embed Size (px)
Citation preview

April 11, 2018
Washington Area Economy: Performance and Outlook
Mark C. White, Ph.D.Deputy Director
Center for Regional AnalysisSchar School of Policy and Government
George Mason University
Presentation to:
Greater Washington Association of Financial Professionals
1

Agenda
• Broad economic trends
• The Washington regional economy
• Emerging trends in federal employment
• Ongoing challenges
2

U.S. Gross Domestic Product
Source: Bureau of Economic Analysis (Seasonally Adjusted, Chained 2009 Dollars )
2010 2011 2012 2013 2014 2015 2016 2017
$13,000
$13,500
$14,000
$14,500
$15,000
$15,500
$16,000
$16,500
$17,000
$17,500
-2.0
-1.0
0.0
1.0
2.0
3.0
4.0
5.0
6.0Quarterly Change Real GDP (Billions)
%
2017 +2.3%

125
130
135
140
145
150
0
50
100
150
200
250
300
350
400
2012 2013 2014 2015 2016 2017 2018
Month-to-Month Change (000s) Total (Millions)
US Payroll Jobs
Source: Bureau of Labor Statistics (Seasonally Adjusted), GMU Center for Regional Analysis
2016-2017
2.17 M
Mar+103K
Since 2010 +18M

The Washington Regional Economy
5

GDP Trends since 2001
6
90
95
100
105
110
115
120
125
130
135
140
2001 2002 2003 2004 2005 2006 2007 2008 2009 2010 2011 2012 2013 2014 2015 2016
20
01
GD
P*=
10
0
Washington-Arlington-Alexandria, DC-VA-MD-WV MSA
United States
Source: US Bureau of Economic Analysis, *2009 Chained Dollars

0
2
4
6
8
10
12
5.7 – DC4.1 – U.S.4.0– SMD
3.6– MSA2.7 – NVA
Unemployment Rates in the WMSABy Sub-State Area
Source: Bureau of Labor Statistics (Region - Not Seasonally Adjusted, US – Seasonally Adjusted)

Annual Job Change - Washington MSA
2,800
2,850
2,900
2,950
3,000
3,050
3,100
3,150
3,200
3,250
3,300
3,350
-10
10
30
50
70
90
110
2012 2013 2014 2015 2016 2017 2018
MOTYC Non-Farm Jobs
Source: Bureau of Labor Statistics (Not Seasonally Adjusted), GMU Center for Regional Analysis
February-18 Total: 3,278 K
000’s 000’s
Feb 17-Feb 18
+44.8 K

15 Largest Job MarketsJob Change: Feb 2017 – Feb 2018
0.0%
0.5%
1.0%
1.5%
2.0%
2.5%
3.0%
3.5%
Washington +1.4%
Source: Bureau of Labor Statistics (Not Seasonally Adjusted), GMU Center for Regional AnalysisSource: Bureau of Labor Statistics (Not Seasonally Adjusted), GMU Center for Regional Analysis

10
Professional & Business Services drive the regional economy
Source: US Bureau of Labor Statistics, Current Employment Statistics
1.7%
1.9%
2.1%
2.3%
4.8%
4.8%
6.4%
8.3%
9.8%
10.4%
11.1%
13.6%
23.0%
0% 5% 10% 15% 20% 25%
Manufacturing
Wholesale Trade
Transportation & Utilities
Information
Financial Activites
Construction
Other Services
Retail Trade
Leisure & Hospitality
State & Local Government
Federal Government
Education & Health Services
Professional & Business Services
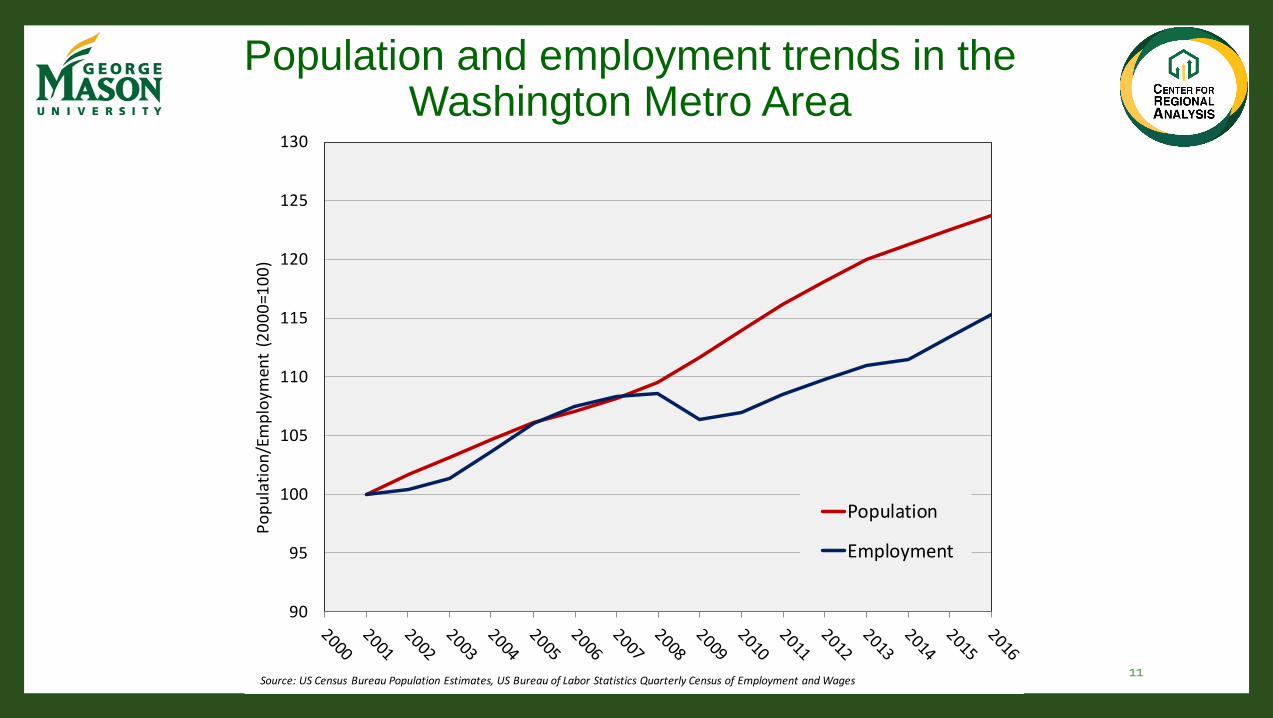
Population and employment trends in the Washington Metro Area
Source: Bureau of Labor Statistics (Not Seasonally Adjusted), GMU Center for Regional Analysis11
90
95
100
105
110
115
120
125
130
Po
pu
lati
on
/Em
plo
ymen
t (2
00
0=1
00
)
Population
Employment
Source: US Census Bureau Population Estimates, US Bureau of Labor Statistics Quarterly Census of Employment and Wages

Job Change by SectorFeb 2017 – Feb 2018
Washington MSA
-0.2
-0.7
3.4
0.1
2.7
4.1
4.7
0.1
9.7
3.3
-6.6
7.6
16.6
-10 -5 0 5 10 15 20
Manufacturing
Wholesale Trade
Transp. & Util.
Information
Financial
Construction
Other Services
Retail Trade
Leisure & Hosp.
State & Local Govt
Federal Govt.
Educ & Health Svcs
Prof. & Bus. Svcs
(000s) Total = 44,800
Source: Bureau of Labor Statistics (Not Seasonally Adjusted), GMU Center for Regional Analysis
(Ranked by Size in 2017)

The DC Metro is a leader in Cyber-security
13
1,740
1,970
2,170
2,270
2,360
2,360
2,430
2,460
3,030
3,110
3,200
3,400
3,560
7,380
13,520
0 2,000 4,000 6,000 8,000 10,000 12,000 14,000
DenverSt. Louis
BaltimoreSF-Oakland
PhoenixCharlotte
AtlantaPhiladelphiaLos Angeles
BostonMinneapolis
ChicagoDallas
New YorkWashington
Information Security Analysts (SOC 15-1122) by metro area, 2017
Source: U.S BLS Occupational Employment Statistics (May 2017) and GMU Center for Regional Analysis

The Economic Influence of the Federal Government
14

Federal GovernmentWashington MSA
345
350
355
360
365
370
375
380
385
390
-20
-15
-10
-5
0
5
10
15
20
25
30
2010 2011 2012 2013 2014 2015 2016 2017 2018
MOTYC
TotalJobs
(000s)
Source: Bureau of Labor Statistics (Not Seasonally Adjusted), GMU Center for Regional Analysis February-18 Total: 362K
(000s)
Feb 17-Feb 18
-6,600

Federal Procurement in the Washington MSA1980-2017 (Fiscal Years)
0
10
20
30
40
50
60
70
80
90
75.0
$ Billions
TOTAL = $1,388.5 Billion 79.976.3
69.1 71.1
Source: US Census, Consolidated Federal Funds Report and USAspending.gov
71.2
82.477.6

Professional & Business ServicesWashington MSA
620
640
660
680
700
720
740
760
780
-15
-10
-5
0
5
10
15
20
25
2010 2011 2012 2013 2014 2015 2016 2017 2018
MOTYC
Total Jobs
(000s)
Source: Bureau of Labor Statistics (Not Seasonally Adjusted), GMU Center for Regional Analysis
February-17Total: 752.4K
Feb 16-Feb 17
+16.6K

Professional and Business Services Employment and Federal Employment in Washington, DC Metro Area Compared to the
Previous Year, 2012-2018
18
-20.0
-15.0
-10.0
-5.0
0.0
5.0
10.0
15.0
20.0
25.0
2012 2013 2014 2015 2016 2017 2018
Mo
nth
ove
r th
e Y
ea
r E
mp
loy
me
nt
Ch
an
ge
(0
00
s)
Prof. & Business Services Federal
Source: US Bureau of Labor Statistics, Current Employment Statistics

Additional ongoing challenges
19

Long commutes diminish quality of life
20
Source: US Census Bureau, 2016 American Community Survey, Table S08025.5%
7.2%
7.6%
9.1%
9.3%
10.7%
11.2%
11.6%
12.2%
13.3%
13.8%
14.1%
14.5%
17.2%
17.8%
21.8%
0% 5% 10% 15% 20% 25%
Minneapolis
Detroit
Phoenix
United States
Dallas
Miami
Houston
Philadelphia
Seattle
Los Angeles
Boston
Chicago
Atlanta
SF-Oakland
Washington
New York
Proportion of workers with travel time to work of 60 or more minutes

100
150
200
250
300
350
400
450
500
Median House Sales PriceWashington MSA
$400 KFeb 2018
Source: Metropolitan Regional Information Systems (MRIS), GMU Center for Regional Analysis
(000s)(000s)

The region has experienced net domestic out-migration since 2013
22
• This trend started sooner in places like Arlington-Alexandria and suburban Maryland.
• People move here for jobs, then choose a place to live in the region.• Many factors cause them to
consider other metro areas
• Note the continued importance of Int’l migration to the region’s continued growth
49,016 49,169 47,790 48,651 47,832 44,882 42,616
37,183 39,715 39,358
41,048
45,41045,606
44,760
23,8646,843
3,143
-23,209-31,483 -31,492
-21,543
-40,000
-20,000
0
20,000
40,000
60,000
80,000
100,000
120,000
-40,000
-20,000
0
20,000
40,000
60,000
80,000
100,000
120,000
2010-2011 2011-2012 2012-2013 2013-2014 2014-2015 2015-2016 2016-2017
Total P
op
ulatio
n C
han
ge
Po
pu
lati
on
Ch
ange
Elements of population change in the Washington, DC Metro Area
Net Domestic Migration
Net Int'l Migration
Natural Increase
Total Change
Source: US Census Bureau, Population Estimates Program, V2017

The DC Metro Area’s Immigrant Workforce
23
0%
5%
10%
15%
20%
25%
30%
35%
Less than HighSchool
High schooldiploma/GED
Associates degree orSome College
Bachelors Degree Graduate orProfessional Degree
Per
cen
tag
e o
f P
op
ula
tio
n
Educational Attainment, Non Citizen, Foreign Born Workers MWCOG Region
Non Citizen Foreign Born Workers MWCOG Workforce
Source: US Census Bureau ACS 2016, GMU Center for Regional Analysis

The DC Metro Area’s Immigrant Workforce
24

Majority of immigrants have been here 10 years or more
25
0.2% 0.5% 1.5%
8.4%
22.2%
48.3%
17.2%
1.8%0%
10%
20%
30%
40%
50%
60%
before 1960 1960-1969 1970-1979 1980-1989 1990-1999 2000-2009 2010-2014 2015 or later
Year of Entry, Non Citizen Foreign Born WorkersMWCOG Region
Source: US Census Bureau ACS 2016, GMU Center for Regional Analysis